Memphis, FL Map & Demographics
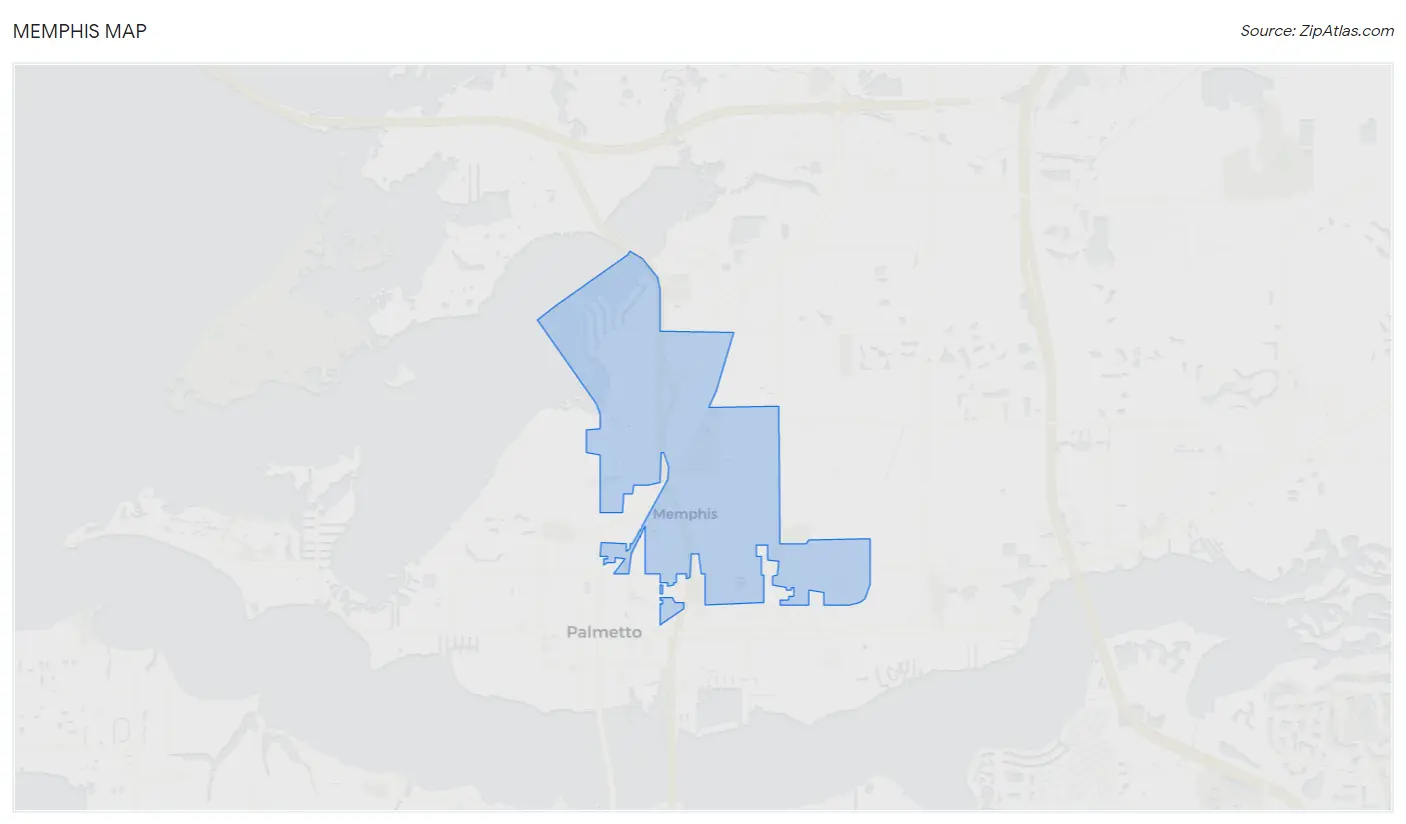
Memphis Map
Memphis Overview
$29,382
PER CAPITA INCOME
$74,604
AVG FAMILY INCOME
$70,049
AVG HOUSEHOLD INCOME
40.6%
WAGE / INCOME GAP [ % ]
59.4¢/ $1
WAGE / INCOME GAP [ $ ]
$16,308
FAMILY INCOME DEFICIT
0.47
INEQUALITY / GINI INDEX
10,923
TOTAL POPULATION
5,779
MALE POPULATION
5,144
FEMALE POPULATION
112.34
MALES / 100 FEMALES
89.01
FEMALES / 100 MALES
35.7
MEDIAN AGE
3.5
AVG FAMILY SIZE
3.2
AVG HOUSEHOLD SIZE
5,461
LABOR FORCE [ PEOPLE ]
65.3%
PERCENT IN LABOR FORCE
8.1%
UNEMPLOYMENT RATE
Income in Memphis
Income Overview in Memphis
Per Capita Income in Memphis is $29,382, while median incomes of families and households are $74,604 and $70,049 respectively.
| Characteristic | Number | Measure |
| Per Capita Income | 10,923 | $29,382 |
| Median Family Income | 2,881 | $74,604 |
| Mean Family Income | 2,881 | $99,863 |
| Median Household Income | 3,376 | $70,049 |
| Mean Household Income | 3,376 | $93,119 |
| Income Deficit | 2,881 | $16,308 |
| Wage / Income Gap (%) | 10,923 | 40.56% |
| Wage / Income Gap ($) | 10,923 | 59.44¢ per $1 |
| Gini / Inequality Index | 10,923 | 0.47 |
Earnings by Sex in Memphis
Average Earnings in Memphis are $32,481, $24,652 for men and $41,472 for women, a difference of 40.6%.
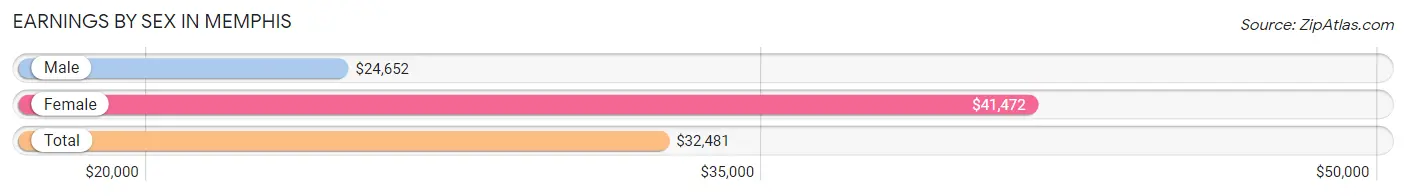
| Sex | Number | Average Earnings |
| Male | 2,980 (53.3%) | $24,652 |
| Female | 2,614 (46.7%) | $41,472 |
| Total | 5,594 (100.0%) | $32,481 |
Earnings by Sex by Income Bracket in Memphis
The most common earnings brackets in Memphis are $22,500 to $24,999 for men (489 | 16.4%) and $40,000 to $44,999 for women (320 | 12.2%).
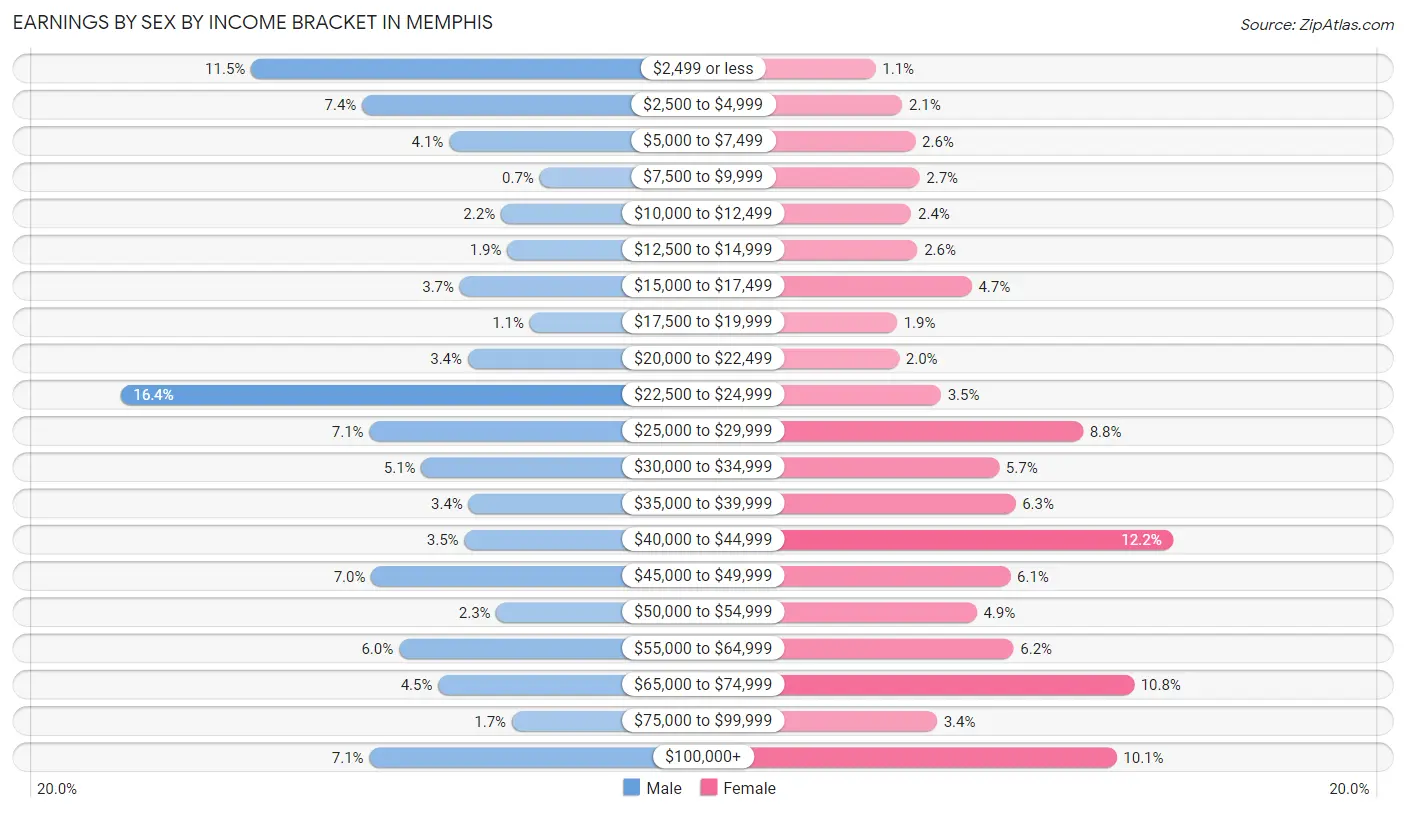
| Income | Male | Female |
| $2,499 or less | 343 (11.5%) | 28 (1.1%) |
| $2,500 to $4,999 | 219 (7.3%) | 54 (2.1%) |
| $5,000 to $7,499 | 122 (4.1%) | 67 (2.6%) |
| $7,500 to $9,999 | 21 (0.7%) | 71 (2.7%) |
| $10,000 to $12,499 | 64 (2.1%) | 63 (2.4%) |
| $12,500 to $14,999 | 57 (1.9%) | 69 (2.6%) |
| $15,000 to $17,499 | 110 (3.7%) | 122 (4.7%) |
| $17,500 to $19,999 | 32 (1.1%) | 49 (1.9%) |
| $20,000 to $22,499 | 101 (3.4%) | 51 (1.9%) |
| $22,500 to $24,999 | 489 (16.4%) | 92 (3.5%) |
| $25,000 to $29,999 | 211 (7.1%) | 231 (8.8%) |
| $30,000 to $34,999 | 153 (5.1%) | 149 (5.7%) |
| $35,000 to $39,999 | 100 (3.4%) | 165 (6.3%) |
| $40,000 to $44,999 | 105 (3.5%) | 320 (12.2%) |
| $45,000 to $49,999 | 209 (7.0%) | 160 (6.1%) |
| $50,000 to $54,999 | 69 (2.3%) | 127 (4.9%) |
| $55,000 to $64,999 | 178 (6.0%) | 163 (6.2%) |
| $65,000 to $74,999 | 134 (4.5%) | 281 (10.7%) |
| $75,000 to $99,999 | 52 (1.7%) | 88 (3.4%) |
| $100,000+ | 211 (7.1%) | 264 (10.1%) |
| Total | 2,980 (100.0%) | 2,614 (100.0%) |
Earnings by Sex by Educational Attainment in Memphis
Average earnings in Memphis are $27,146 for men and $43,328 for women, a difference of 37.3%. Men with an educational attainment of college or associate's degree enjoy the highest average annual earnings of $38,285, while those with less than high school education earn the least with $19,258. Women with an educational attainment of bachelor's degree earn the most with the average annual earnings of $54,044, while those with less than high school education have the smallest earnings of $28,180.
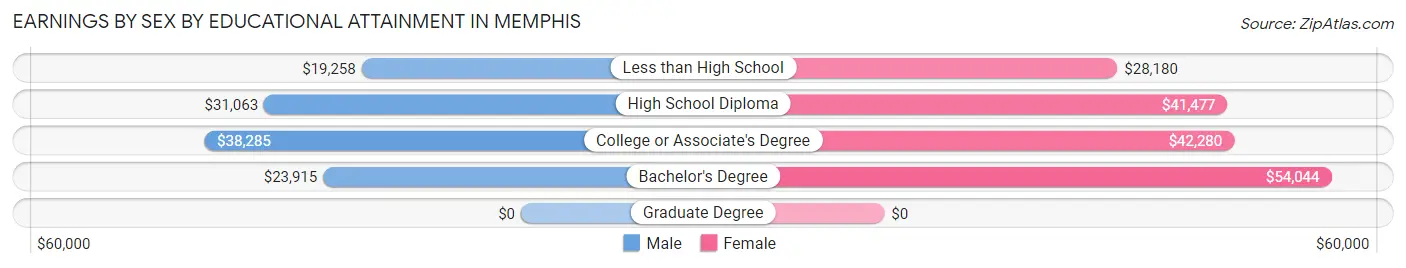
| Educational Attainment | Male Income | Female Income |
| Less than High School | $19,258 | $28,180 |
| High School Diploma | $31,063 | $41,477 |
| College or Associate's Degree | $38,285 | $42,280 |
| Bachelor's Degree | $23,915 | $54,044 |
| Graduate Degree | - | - |
| Total | $27,146 | $43,328 |
Family Income in Memphis
Family Income Brackets in Memphis
According to the Memphis family income data, there are 516 families falling into the $50,000 to $74,999 income range, which is the most common income bracket and makes up 17.9% of all families. Conversely, the $25,000 to $34,999 income bracket is the least frequent group with only 75 families (2.6%) belonging to this category.
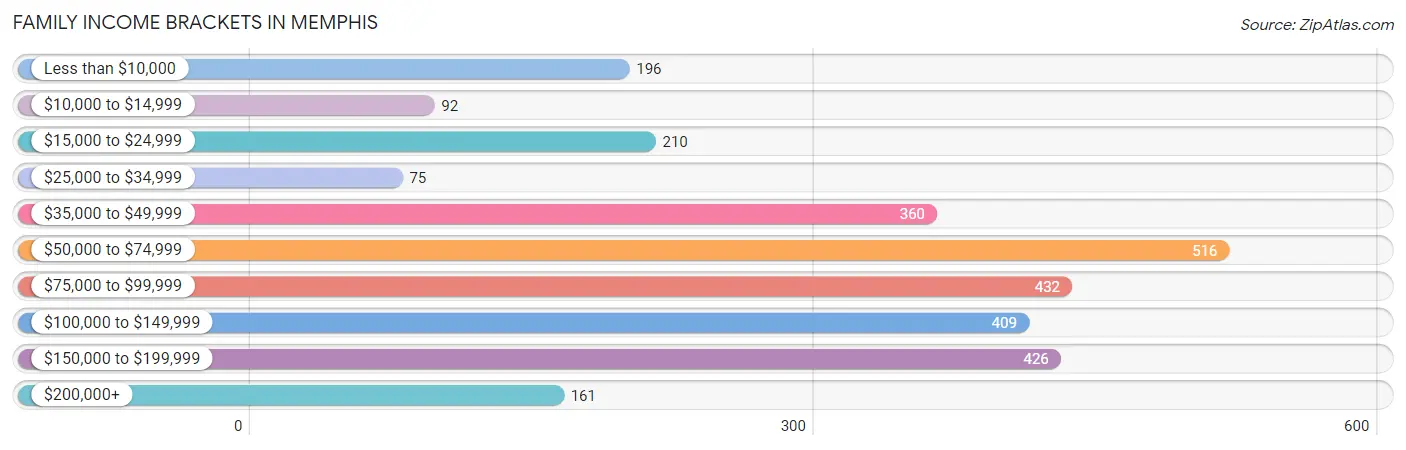
| Income Bracket | # Families | % Families |
| Less than $10,000 | 196 | 6.8% |
| $10,000 to $14,999 | 92 | 3.2% |
| $15,000 to $24,999 | 210 | 7.3% |
| $25,000 to $34,999 | 75 | 2.6% |
| $35,000 to $49,999 | 360 | 12.5% |
| $50,000 to $74,999 | 516 | 17.9% |
| $75,000 to $99,999 | 432 | 15.0% |
| $100,000 to $149,999 | 409 | 14.2% |
| $150,000 to $199,999 | 426 | 14.8% |
| $200,000+ | 161 | 5.6% |
Family Income by Famaliy Size in Memphis
5-person families (267 | 9.3%) account for the highest median family income in Memphis with $93,513 per family, while 2-person families (1,344 | 46.7%) have the highest median income of $41,755 per family member.
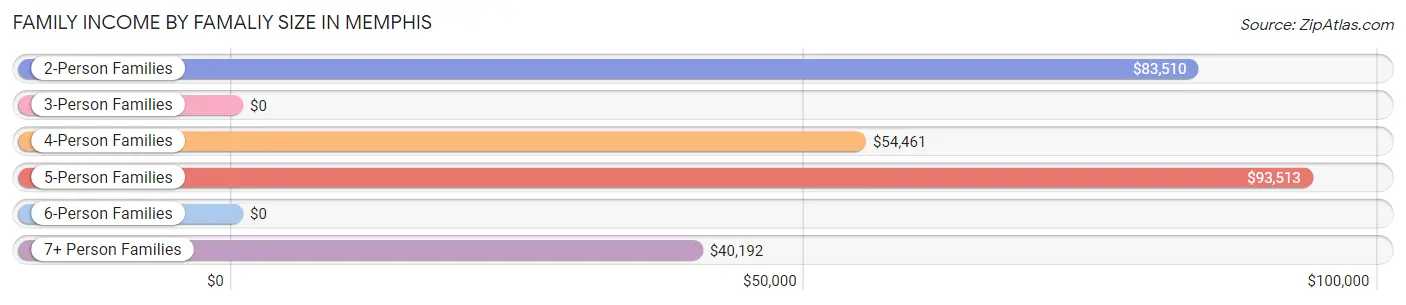
| Income Bracket | # Families | Median Income |
| 2-Person Families | 1,344 (46.7%) | $83,510 |
| 3-Person Families | 623 (21.6%) | $0 |
| 4-Person Families | 481 (16.7%) | $54,461 |
| 5-Person Families | 267 (9.3%) | $93,513 |
| 6-Person Families | 118 (4.1%) | $0 |
| 7+ Person Families | 48 (1.7%) | $40,192 |
| Total | 2,881 (100.0%) | $74,604 |
Family Income by Number of Earners in Memphis
The median family income in Memphis is $74,604, with families comprising 3+ earners (331) having the highest median family income of $116,992, while families with no earners (488) have the lowest median family income of $30,750, accounting for 11.5% and 16.9% of families, respectively.
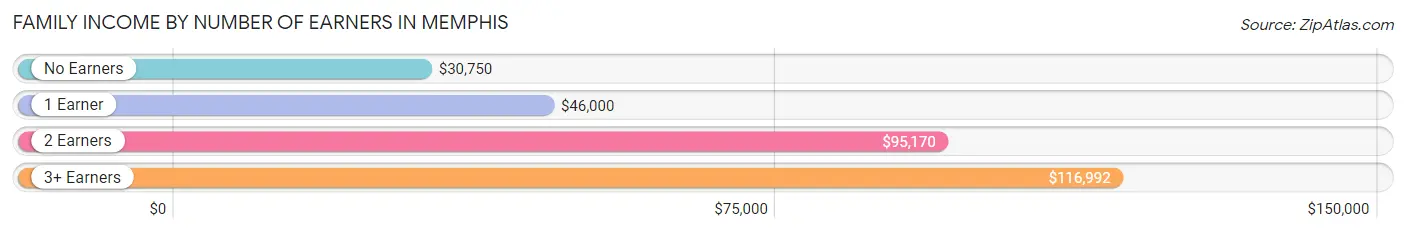
| Number of Earners | # Families | Median Income |
| No Earners | 488 (16.9%) | $30,750 |
| 1 Earner | 644 (22.4%) | $46,000 |
| 2 Earners | 1,418 (49.2%) | $95,170 |
| 3+ Earners | 331 (11.5%) | $116,992 |
| Total | 2,881 (100.0%) | $74,604 |
Household Income in Memphis
Household Income Brackets in Memphis
With 675 households falling in the category, the $50,000 to $74,999 income range is the most frequent in Memphis, accounting for 20.0% of all households. In contrast, only 152 households (4.5%) fall into the $10,000 to $14,999 income bracket, making it the least populous group.
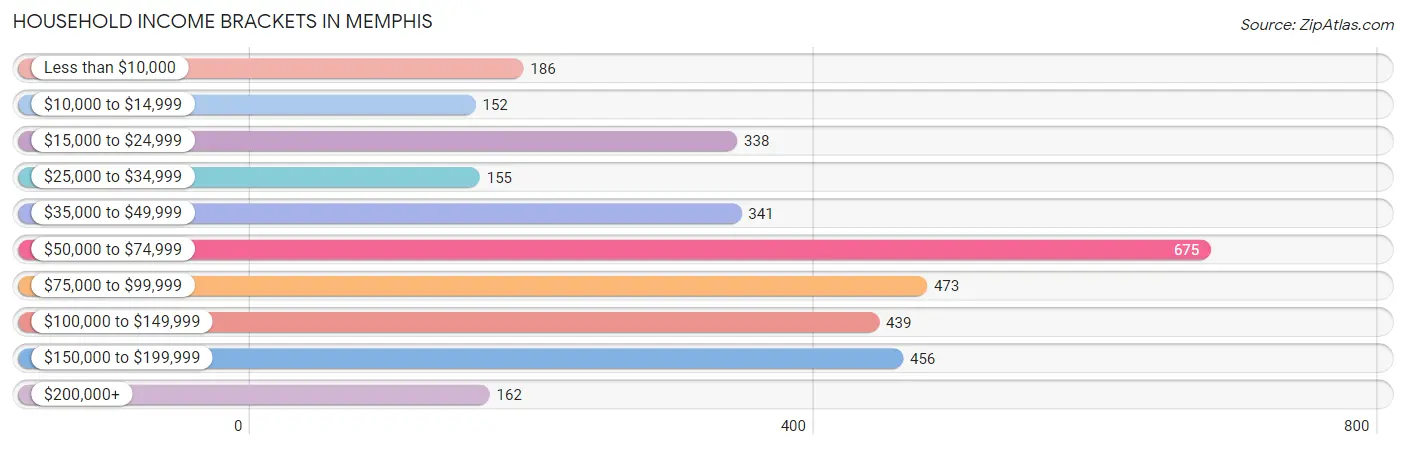
| Income Bracket | # Households | % Households |
| Less than $10,000 | 186 | 5.5% |
| $10,000 to $14,999 | 152 | 4.5% |
| $15,000 to $24,999 | 338 | 10.0% |
| $25,000 to $34,999 | 155 | 4.6% |
| $35,000 to $49,999 | 341 | 10.1% |
| $50,000 to $74,999 | 675 | 20.0% |
| $75,000 to $99,999 | 473 | 14.0% |
| $100,000 to $149,999 | 439 | 13.0% |
| $150,000 to $199,999 | 456 | 13.5% |
| $200,000+ | 162 | 4.8% |
Household Income by Householder Age in Memphis
The median household income in Memphis is $70,049, with the highest median household income of $89,954 found in the 45 to 64 years age bracket for the primary householder. A total of 965 households (28.6%) fall into this category. Meanwhile, the 15 to 24 years age bracket for the primary householder has the lowest median household income of $0, with 8 households (0.2%) in this group.
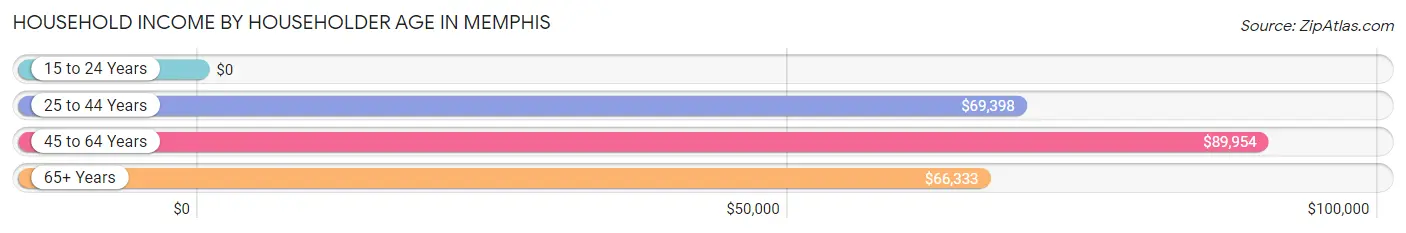
| Income Bracket | # Households | Median Income |
| 15 to 24 Years | 8 (0.2%) | $0 |
| 25 to 44 Years | 1,701 (50.4%) | $69,398 |
| 45 to 64 Years | 965 (28.6%) | $89,954 |
| 65+ Years | 702 (20.8%) | $66,333 |
| Total | 3,376 (100.0%) | $70,049 |
Poverty in Memphis
Income Below Poverty by Sex and Age in Memphis
With 21.5% poverty level for males and 21.2% for females among the residents of Memphis, 15 year old males and under 5 year old females are the most vulnerable to poverty, with 62 males (74.7%) and 98 females (65.3%) in their respective age groups living below the poverty level.
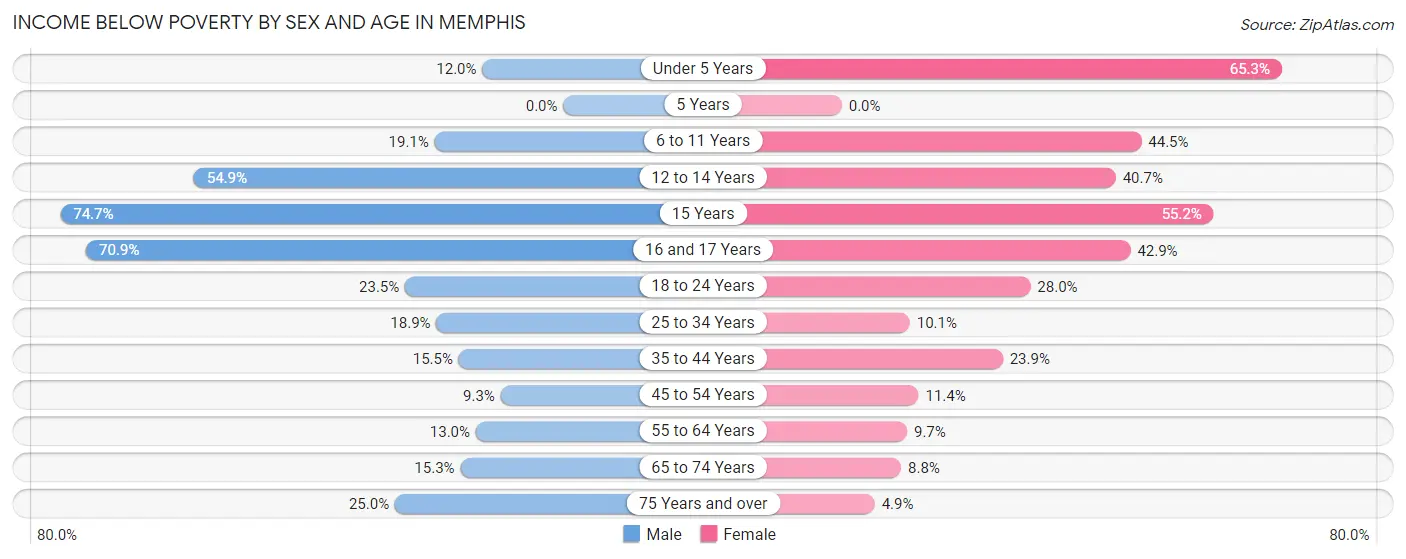
| Age Bracket | Male | Female |
| Under 5 Years | 35 (12.0%) | 98 (65.3%) |
| 5 Years | 0 (0.0%) | 0 (0.0%) |
| 6 to 11 Years | 96 (19.1%) | 270 (44.5%) |
| 12 to 14 Years | 259 (54.9%) | 72 (40.7%) |
| 15 Years | 62 (74.7%) | 37 (55.2%) |
| 16 and 17 Years | 73 (70.9%) | 42 (42.9%) |
| 18 to 24 Years | 121 (23.5%) | 86 (28.0%) |
| 25 to 34 Years | 148 (18.9%) | 70 (10.1%) |
| 35 to 44 Years | 202 (15.5%) | 239 (23.9%) |
| 45 to 54 Years | 43 (9.3%) | 40 (11.4%) |
| 55 to 64 Years | 89 (13.0%) | 68 (9.7%) |
| 65 to 74 Years | 52 (15.3%) | 40 (8.8%) |
| 75 Years and over | 60 (25.0%) | 16 (4.9%) |
| Total | 1,240 (21.5%) | 1,078 (21.2%) |
Income Above Poverty by Sex and Age in Memphis
According to the poverty statistics in Memphis, males aged 45 to 54 years and females aged 5 years are the age groups that are most secure financially, with 90.7% of males and 100.0% of females in these age groups living above the poverty line.
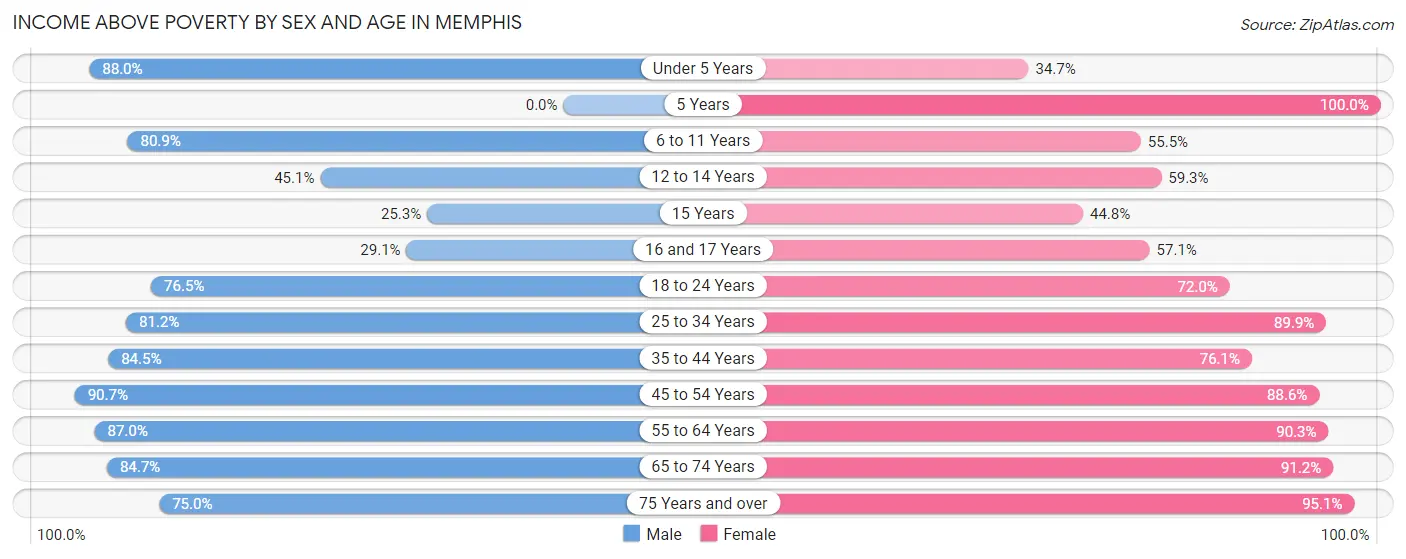
| Age Bracket | Male | Female |
| Under 5 Years | 256 (88.0%) | 52 (34.7%) |
| 5 Years | 0 (0.0%) | 144 (100.0%) |
| 6 to 11 Years | 406 (80.9%) | 337 (55.5%) |
| 12 to 14 Years | 213 (45.1%) | 105 (59.3%) |
| 15 Years | 21 (25.3%) | 30 (44.8%) |
| 16 and 17 Years | 30 (29.1%) | 56 (57.1%) |
| 18 to 24 Years | 394 (76.5%) | 221 (72.0%) |
| 25 to 34 Years | 637 (81.1%) | 623 (89.9%) |
| 35 to 44 Years | 1,099 (84.5%) | 761 (76.1%) |
| 45 to 54 Years | 419 (90.7%) | 311 (88.6%) |
| 55 to 64 Years | 596 (87.0%) | 634 (90.3%) |
| 65 to 74 Years | 288 (84.7%) | 414 (91.2%) |
| 75 Years and over | 180 (75.0%) | 311 (95.1%) |
| Total | 4,539 (78.5%) | 3,999 (78.8%) |
Income Below Poverty Among Married-Couple Families in Memphis
The poverty statistics for married-couple families in Memphis show that 7.4% or 138 of the total 1,866 families live below the poverty line. Families with 3 or 4 children have the highest poverty rate of 44.4%, comprising of 59 families. On the other hand, families with no children have the lowest poverty rate of 4.5%, which includes 55 families.
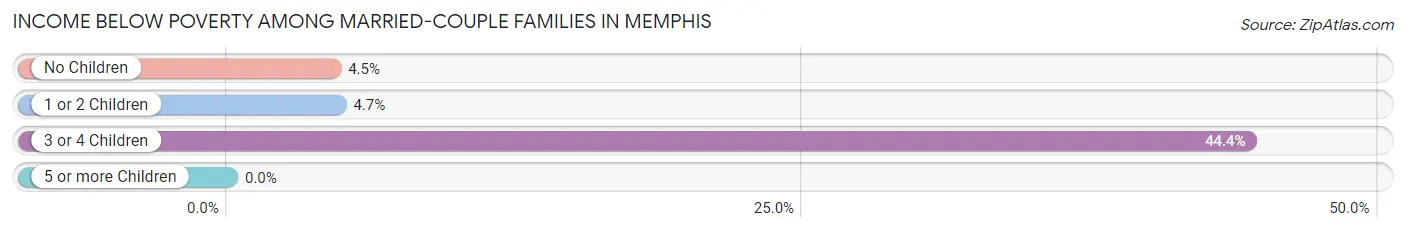
| Children | Above Poverty | Below Poverty |
| No Children | 1,169 (95.5%) | 55 (4.5%) |
| 1 or 2 Children | 485 (95.3%) | 24 (4.7%) |
| 3 or 4 Children | 74 (55.6%) | 59 (44.4%) |
| 5 or more Children | 0 (0.0%) | 0 (0.0%) |
| Total | 1,728 (92.6%) | 138 (7.4%) |
Income Below Poverty Among Single-Parent Households in Memphis
According to the poverty data in Memphis, 48.7% or 202 single-father households and 22.3% or 134 single-mother households are living below the poverty line. Among single-father households, those with 3 or 4 children have the highest poverty rate, with 13 households (100.0%) experiencing poverty. Likewise, among single-mother households, those with 1 or 2 children have the highest poverty rate, with 87 households (56.1%) falling below the poverty line.
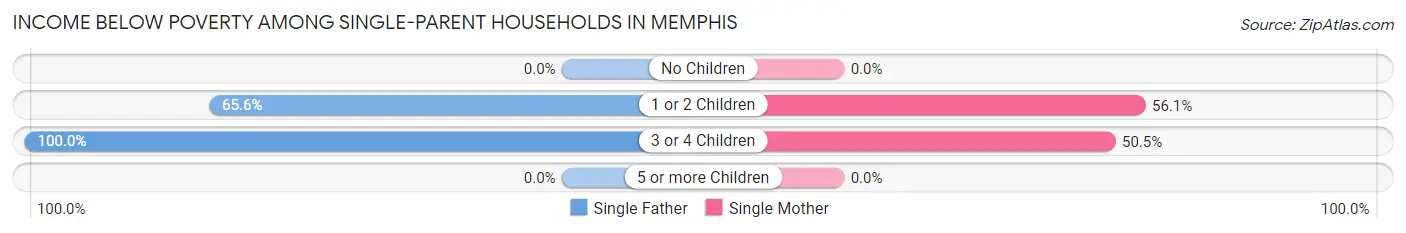
| Children | Single Father | Single Mother |
| No Children | 0 (0.0%) | 0 (0.0%) |
| 1 or 2 Children | 189 (65.6%) | 87 (56.1%) |
| 3 or 4 Children | 13 (100.0%) | 47 (50.5%) |
| 5 or more Children | 0 (0.0%) | 0 (0.0%) |
| Total | 202 (48.7%) | 134 (22.3%) |
Income Below Poverty Among Married-Couple vs Single-Parent Households in Memphis
The poverty data for Memphis shows that 138 of the married-couple family households (7.4%) and 336 of the single-parent households (33.1%) are living below the poverty level. Within the married-couple family households, those with 3 or 4 children have the highest poverty rate, with 59 households (44.4%) falling below the poverty line. Among the single-parent households, those with 1 or 2 children have the highest poverty rate, with 276 household (62.3%) living below poverty.
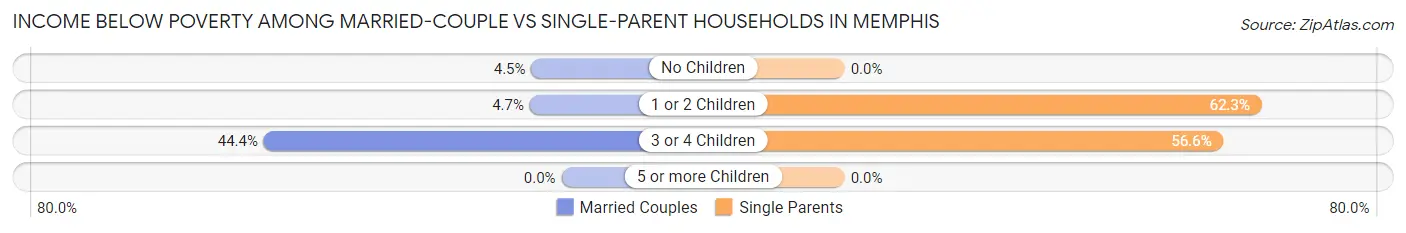
| Children | Married-Couple Families | Single-Parent Households |
| No Children | 55 (4.5%) | 0 (0.0%) |
| 1 or 2 Children | 24 (4.7%) | 276 (62.3%) |
| 3 or 4 Children | 59 (44.4%) | 60 (56.6%) |
| 5 or more Children | 0 (0.0%) | 0 (0.0%) |
| Total | 138 (7.4%) | 336 (33.1%) |
Race in Memphis
The most populous races in Memphis are White / Caucasian (5,223 | 47.8%), Black / African American (3,666 | 33.6%), and Hispanic or Latino (3,174 | 29.1%).
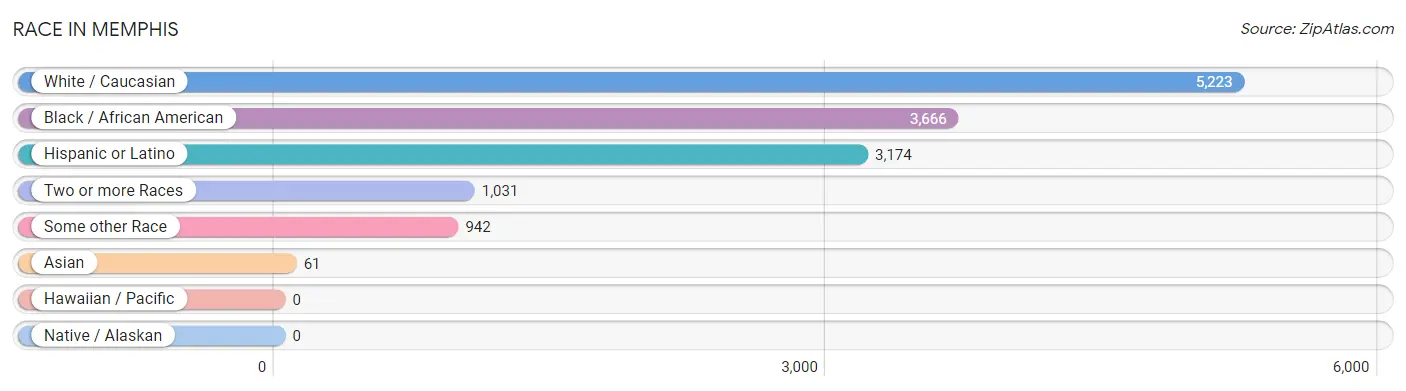
| Race | # Population | % Population |
| Asian | 61 | 0.6% |
| Black / African American | 3,666 | 33.6% |
| Hawaiian / Pacific | 0 | 0.0% |
| Hispanic or Latino | 3,174 | 29.1% |
| Native / Alaskan | 0 | 0.0% |
| White / Caucasian | 5,223 | 47.8% |
| Two or more Races | 1,031 | 9.4% |
| Some other Race | 942 | 8.6% |
| Total | 10,923 | 100.0% |
Ancestry in Memphis
The most populous ancestries reported in Memphis are Mexican (2,671 | 24.4%), Irish (811 | 7.4%), German (785 | 7.2%), English (697 | 6.4%), and West Indian (359 | 3.3%), together accounting for 48.7% of all Memphis residents.
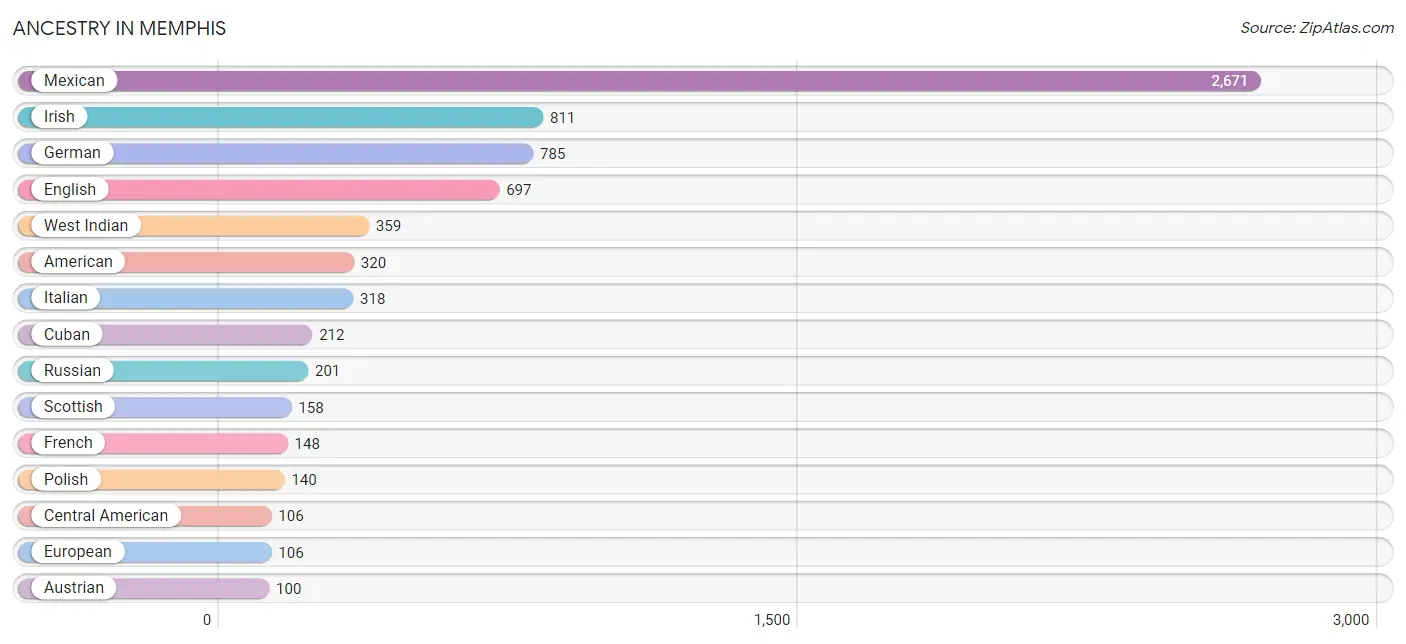
| Ancestry | # Population | % Population |
| American | 320 | 2.9% |
| Austrian | 100 | 0.9% |
| Burmese | 41 | 0.4% |
| Canadian | 10 | 0.1% |
| Central American | 106 | 1.0% |
| Colombian | 72 | 0.7% |
| Croatian | 19 | 0.2% |
| Cuban | 212 | 1.9% |
| Czech | 24 | 0.2% |
| Dominican | 11 | 0.1% |
| Dutch | 50 | 0.5% |
| Eastern European | 9 | 0.1% |
| English | 697 | 6.4% |
| European | 106 | 1.0% |
| Finnish | 22 | 0.2% |
| French | 148 | 1.3% |
| German | 785 | 7.2% |
| Haitian | 28 | 0.3% |
| Honduran | 91 | 0.8% |
| Indian (Asian) | 3 | 0.0% |
| Irish | 811 | 7.4% |
| Italian | 318 | 2.9% |
| Jamaican | 59 | 0.5% |
| Korean | 20 | 0.2% |
| Lithuanian | 14 | 0.1% |
| Mexican | 2,671 | 24.4% |
| Mexican American Indian | 23 | 0.2% |
| Native Hawaiian | 49 | 0.4% |
| Norwegian | 19 | 0.2% |
| Panamanian | 15 | 0.1% |
| Peruvian | 12 | 0.1% |
| Polish | 140 | 1.3% |
| Portuguese | 17 | 0.2% |
| Puerto Rican | 90 | 0.8% |
| Russian | 201 | 1.8% |
| Scandinavian | 12 | 0.1% |
| Scotch-Irish | 66 | 0.6% |
| Scottish | 158 | 1.5% |
| South American | 84 | 0.8% |
| Sri Lankan | 51 | 0.5% |
| Subsaharan African | 28 | 0.3% |
| Swedish | 29 | 0.3% |
| Ukrainian | 56 | 0.5% |
| West Indian | 359 | 3.3% | View All 44 Rows |
Immigrants in Memphis
The most numerous immigrant groups reported in Memphis came from Latin America (1,302 | 11.9%), Central America (951 | 8.7%), Mexico (897 | 8.2%), Caribbean (328 | 3.0%), and Trinidad and Tobago (160 | 1.5%), together accounting for 33.3% of all Memphis residents.
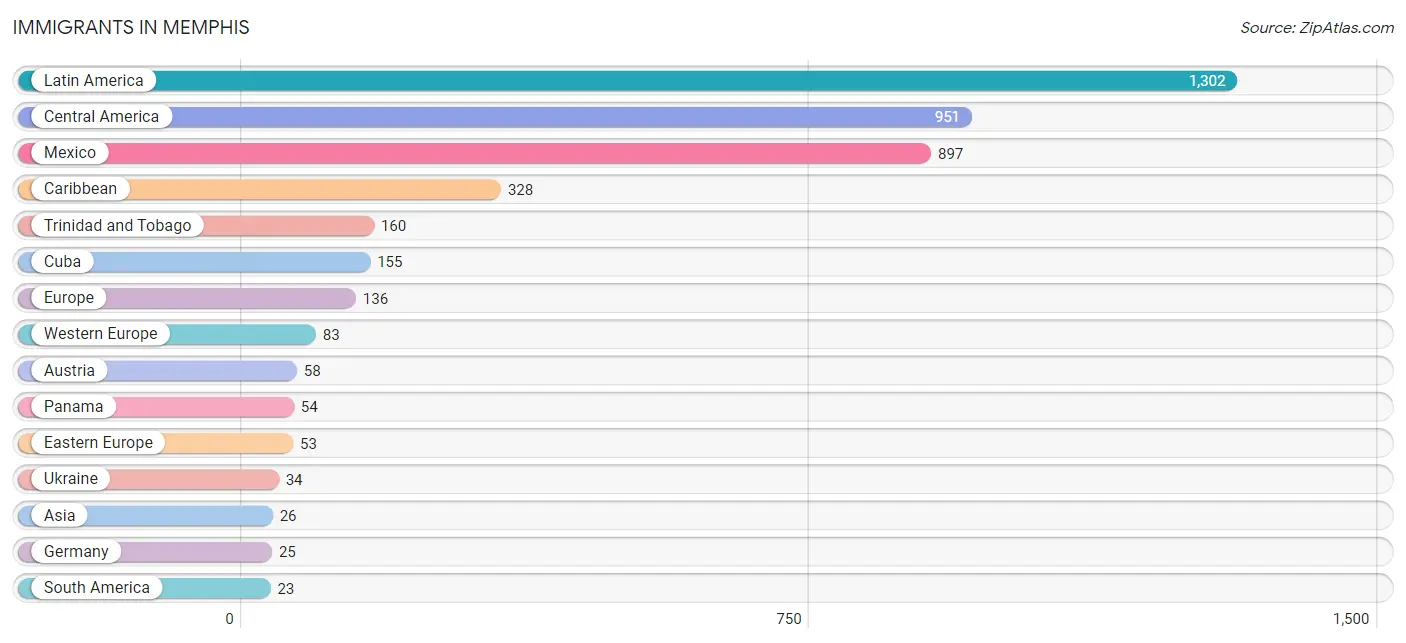
| Immigration Origin | # Population | % Population |
| Asia | 26 | 0.2% |
| Austria | 58 | 0.5% |
| Caribbean | 328 | 3.0% |
| Central America | 951 | 8.7% |
| China | 3 | 0.0% |
| Colombia | 11 | 0.1% |
| Croatia | 19 | 0.2% |
| Cuba | 155 | 1.4% |
| Eastern Asia | 3 | 0.0% |
| Eastern Europe | 53 | 0.5% |
| Europe | 136 | 1.3% |
| Germany | 25 | 0.2% |
| Jamaica | 13 | 0.1% |
| Latin America | 1,302 | 11.9% |
| Mexico | 897 | 8.2% |
| Panama | 54 | 0.5% |
| Peru | 12 | 0.1% |
| Philippines | 7 | 0.1% |
| South America | 23 | 0.2% |
| South Eastern Asia | 23 | 0.2% |
| Trinidad and Tobago | 160 | 1.5% |
| Ukraine | 34 | 0.3% |
| Vietnam | 16 | 0.2% |
| Western Europe | 83 | 0.8% | View All 24 Rows |
Sex and Age in Memphis
Sex and Age in Memphis
The most populous age groups in Memphis are 35 to 39 Years (879 | 15.2%) for men and 35 to 39 Years (586 | 11.4%) for women.
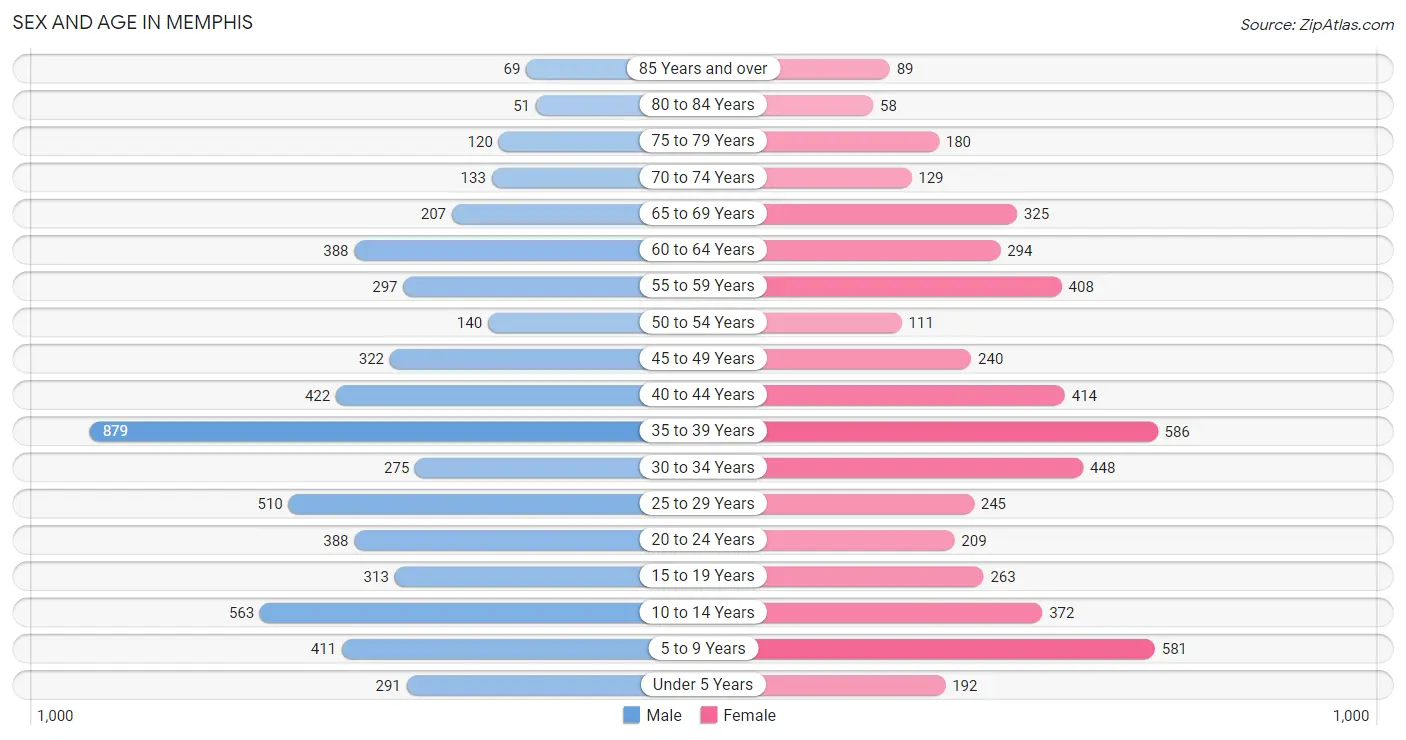
| Age Bracket | Male | Female |
| Under 5 Years | 291 (5.0%) | 192 (3.7%) |
| 5 to 9 Years | 411 (7.1%) | 581 (11.3%) |
| 10 to 14 Years | 563 (9.7%) | 372 (7.2%) |
| 15 to 19 Years | 313 (5.4%) | 263 (5.1%) |
| 20 to 24 Years | 388 (6.7%) | 209 (4.1%) |
| 25 to 29 Years | 510 (8.8%) | 245 (4.8%) |
| 30 to 34 Years | 275 (4.8%) | 448 (8.7%) |
| 35 to 39 Years | 879 (15.2%) | 586 (11.4%) |
| 40 to 44 Years | 422 (7.3%) | 414 (8.1%) |
| 45 to 49 Years | 322 (5.6%) | 240 (4.7%) |
| 50 to 54 Years | 140 (2.4%) | 111 (2.2%) |
| 55 to 59 Years | 297 (5.1%) | 408 (7.9%) |
| 60 to 64 Years | 388 (6.7%) | 294 (5.7%) |
| 65 to 69 Years | 207 (3.6%) | 325 (6.3%) |
| 70 to 74 Years | 133 (2.3%) | 129 (2.5%) |
| 75 to 79 Years | 120 (2.1%) | 180 (3.5%) |
| 80 to 84 Years | 51 (0.9%) | 58 (1.1%) |
| 85 Years and over | 69 (1.2%) | 89 (1.7%) |
| Total | 5,779 (100.0%) | 5,144 (100.0%) |
Families and Households in Memphis
Median Family Size in Memphis
The median family size in Memphis is 3.45 persons per family, with single male/father families (415 | 14.4%) accounting for the largest median family size of 4.03 persons per family. On the other hand, married-couple families (1,866 | 64.8%) represent the smallest median family size with 3.33 persons per family.
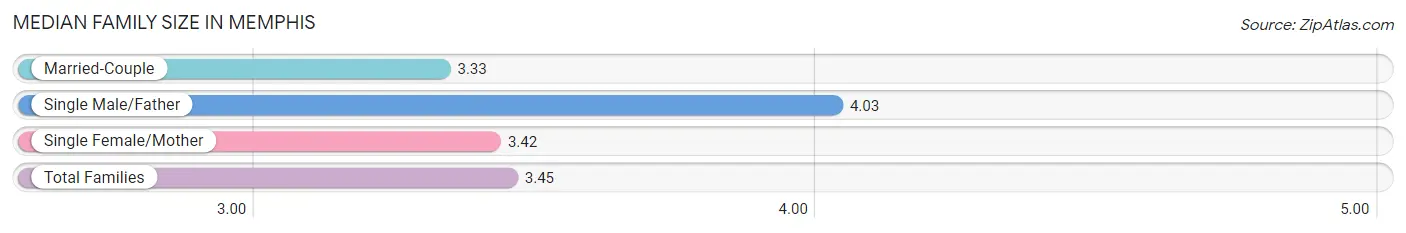
| Family Type | # Families | Family Size |
| Married-Couple | 1,866 (64.8%) | 3.33 |
| Single Male/Father | 415 (14.4%) | 4.03 |
| Single Female/Mother | 600 (20.8%) | 3.42 |
| Total Families | 2,881 (100.0%) | 3.45 |
Median Household Size in Memphis
The median household size in Memphis is 3.24 persons per household, with single male/father households (415 | 12.3%) accounting for the largest median household size of 4.56 persons per household. non-family households (495 | 14.7%) represent the smallest median household size with 1.23 persons per household.
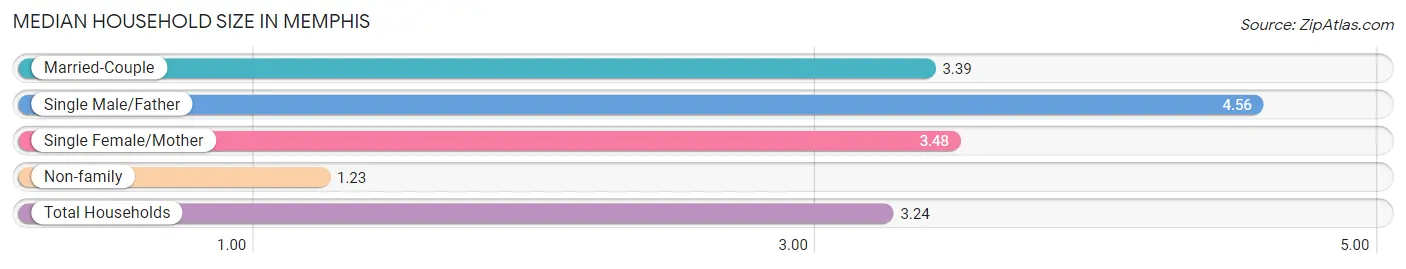
| Household Type | # Households | Household Size |
| Married-Couple | 1,866 (55.3%) | 3.39 |
| Single Male/Father | 415 (12.3%) | 4.56 |
| Single Female/Mother | 600 (17.8%) | 3.48 |
| Non-family | 495 (14.7%) | 1.23 |
| Total Households | 3,376 (100.0%) | 3.24 |
Household Size by Marriage Status in Memphis
Out of a total of 3,376 households in Memphis, 2,881 (85.3%) are family households, while 495 (14.7%) are nonfamily households. The most numerous type of family households are 2-person households, comprising 1,244, and the most common type of nonfamily households are 1-person households, comprising 407.
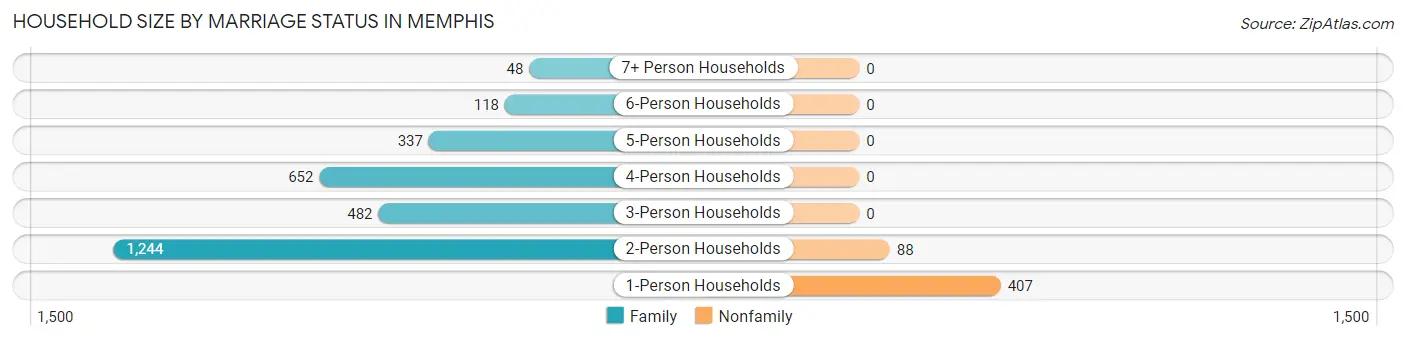
| Household Size | Family Households | Nonfamily Households |
| 1-Person Households | - | 407 (12.1%) |
| 2-Person Households | 1,244 (36.8%) | 88 (2.6%) |
| 3-Person Households | 482 (14.3%) | 0 (0.0%) |
| 4-Person Households | 652 (19.3%) | 0 (0.0%) |
| 5-Person Households | 337 (10.0%) | 0 (0.0%) |
| 6-Person Households | 118 (3.5%) | 0 (0.0%) |
| 7+ Person Households | 48 (1.4%) | 0 (0.0%) |
| Total | 2,881 (85.3%) | 495 (14.7%) |
Female Fertility in Memphis
Fertility by Age in Memphis
Average fertility rate in Memphis is 61.0 births per 1,000 women. Women in the age bracket of 20 to 34 years have the highest fertility rate with 105.0 births per 1,000 women. Women in the age bracket of 20 to 34 years acount for 63.8% of all women with births.
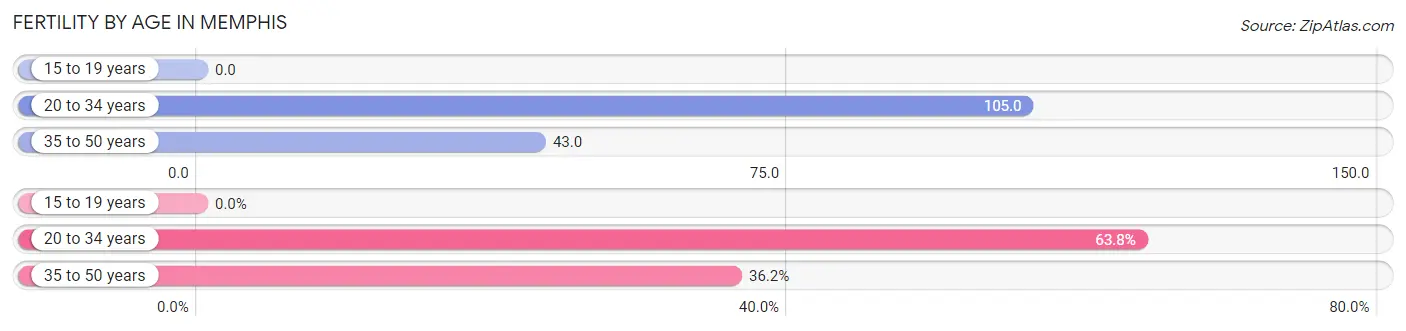
| Age Bracket | Women with Births | Births / 1,000 Women |
| 15 to 19 years | 0 (0.0%) | 0.0 |
| 20 to 34 years | 95 (63.8%) | 105.0 |
| 35 to 50 years | 54 (36.2%) | 43.0 |
| Total | 149 (100.0%) | 61.0 |
Fertility by Age by Marriage Status in Memphis
74.5% of women with births (149) in Memphis are married. The highest percentage of unmarried women with births falls into 20 to 34 years age bracket with 40.0% of them unmarried at the time of birth, while the lowest percentage of unmarried women with births belong to 35 to 50 years age bracket with 0.0% of them unmarried.
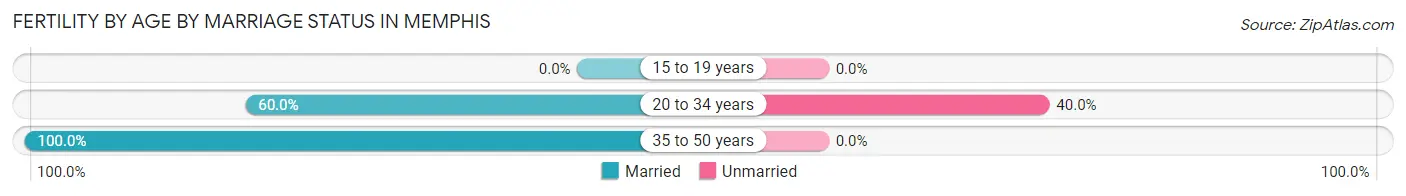
| Age Bracket | Married | Unmarried |
| 15 to 19 years | 0 (0.0%) | 0 (0.0%) |
| 20 to 34 years | 57 (60.0%) | 38 (40.0%) |
| 35 to 50 years | 54 (100.0%) | 0 (0.0%) |
| Total | 111 (74.5%) | 38 (25.5%) |
Fertility by Education in Memphis
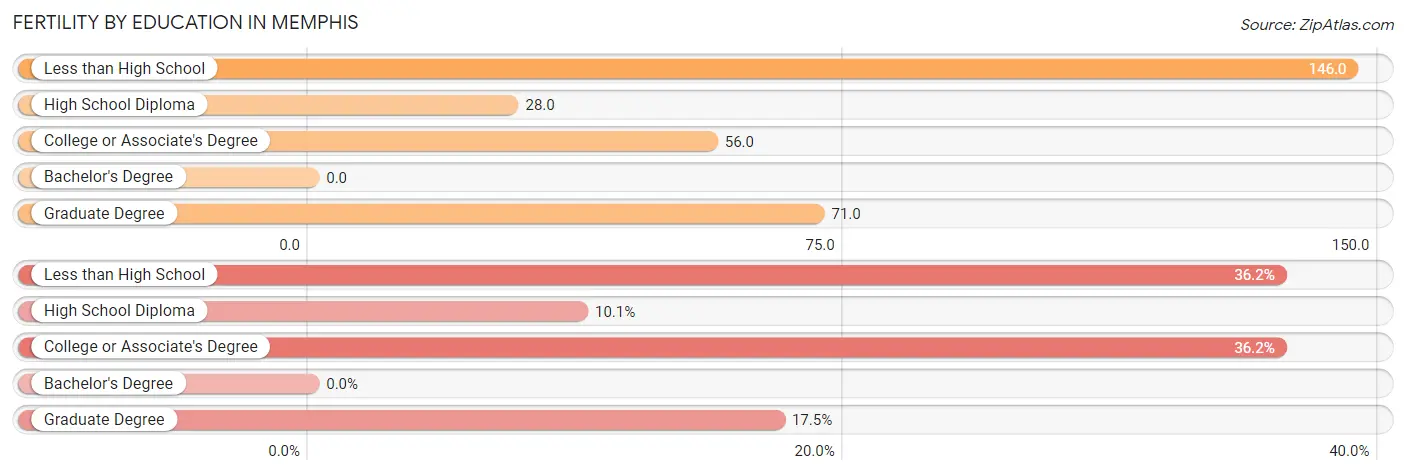
| Educational Attainment | Women with Births | Births / 1,000 Women |
| Less than High School | 54 (36.2%) | 146.0 |
| High School Diploma | 15 (10.1%) | 28.0 |
| College or Associate's Degree | 54 (36.2%) | 56.0 |
| Bachelor's Degree | 0 (0.0%) | 0.0 |
| Graduate Degree | 26 (17.4%) | 71.0 |
| Total | 149 (100.0%) | 61.0 |
Fertility by Education by Marriage Status in Memphis
25.5% of women with births in Memphis are unmarried. Women with the educational attainment of less than high school are most likely to be married with 100.0% of them married at childbirth, while women with the educational attainment of graduate degree are least likely to be married with 50.0% of them unmarried at childbirth.
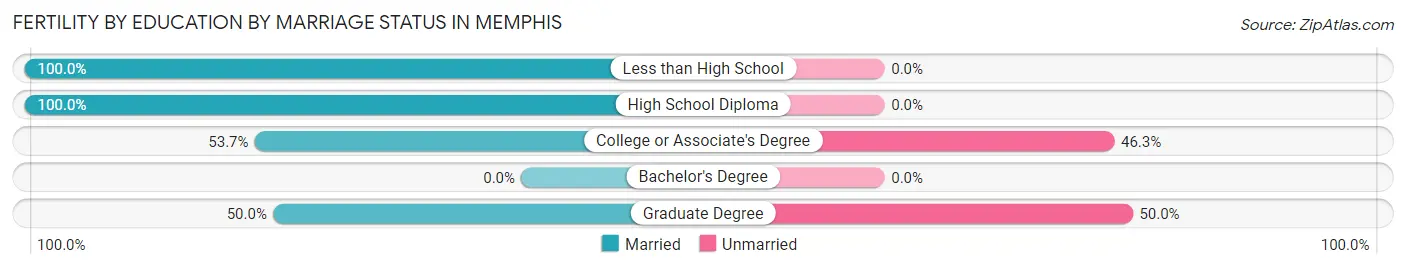
| Educational Attainment | Married | Unmarried |
| Less than High School | 54 (100.0%) | 0 (0.0%) |
| High School Diploma | 15 (100.0%) | 0 (0.0%) |
| College or Associate's Degree | 29 (53.7%) | 25 (46.3%) |
| Bachelor's Degree | 0 (0.0%) | 0 (0.0%) |
| Graduate Degree | 13 (50.0%) | 13 (50.0%) |
| Total | 111 (74.5%) | 38 (25.5%) |
Employment Characteristics in Memphis
Employment by Class of Employer in Memphis
Among the 4,726 employed individuals in Memphis, private company employees (2,784 | 58.9%), local government employees (513 | 10.8%), and state government employees (291 | 6.2%) make up the most common classes of employment.
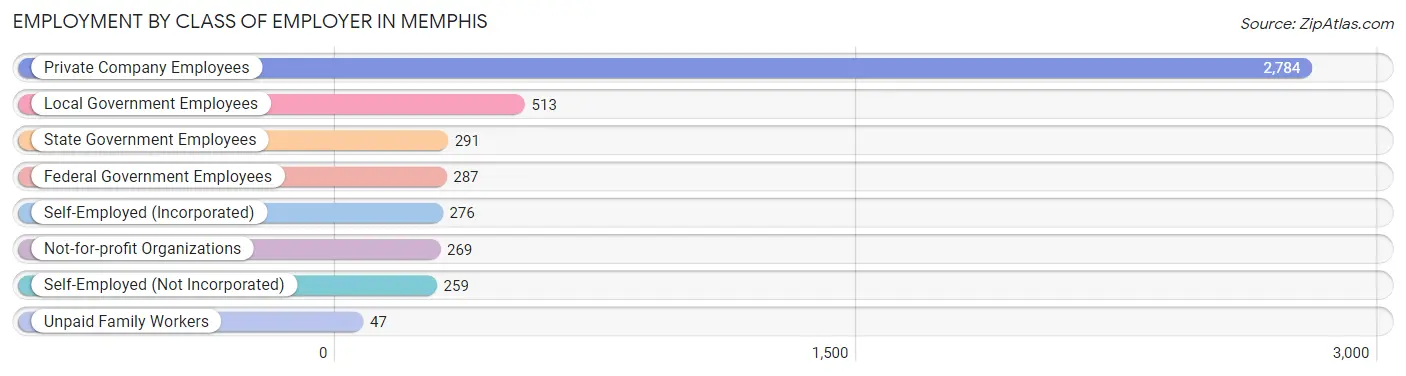
| Employer Class | # Employees | % Employees |
| Private Company Employees | 2,784 | 58.9% |
| Self-Employed (Incorporated) | 276 | 5.8% |
| Self-Employed (Not Incorporated) | 259 | 5.5% |
| Not-for-profit Organizations | 269 | 5.7% |
| Local Government Employees | 513 | 10.8% |
| State Government Employees | 291 | 6.2% |
| Federal Government Employees | 287 | 6.1% |
| Unpaid Family Workers | 47 | 1.0% |
| Total | 4,726 | 100.0% |
Employment Status by Age in Memphis
According to the labor force statistics for Memphis, out of the total population over 16 years of age (8,363), 65.3% or 5,461 individuals are in the labor force, with 8.1% or 442 of them unemployed. The age group with the highest labor force participation rate is 20 to 24 years, with 89.3% or 533 individuals in the labor force. Within the labor force, the 20 to 24 years age range has the highest percentage of unemployed individuals, with 44.5% or 237 of them being unemployed.
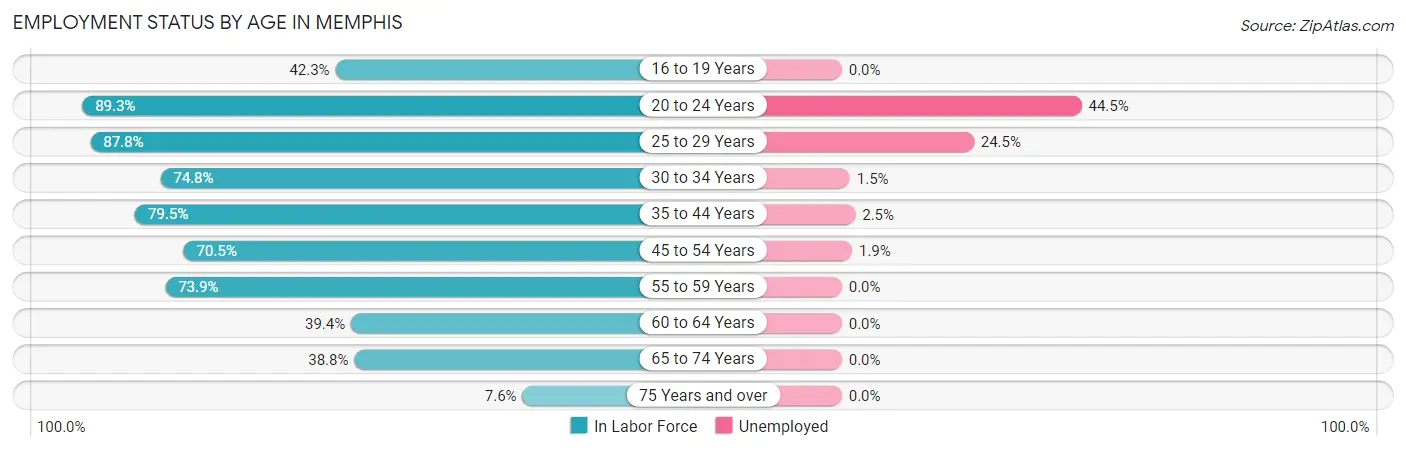
| Age Bracket | In Labor Force | Unemployed |
| 16 to 19 Years | 180 (42.3%) | 0 (0.0%) |
| 20 to 24 Years | 533 (89.3%) | 237 (44.5%) |
| 25 to 29 Years | 663 (87.8%) | 162 (24.5%) |
| 30 to 34 Years | 541 (74.8%) | 8 (1.5%) |
| 35 to 44 Years | 1,829 (79.5%) | 46 (2.5%) |
| 45 to 54 Years | 573 (70.5%) | 11 (1.9%) |
| 55 to 59 Years | 521 (73.9%) | 0 (0.0%) |
| 60 to 64 Years | 269 (39.4%) | 0 (0.0%) |
| 65 to 74 Years | 308 (38.8%) | 0 (0.0%) |
| 75 Years and over | 43 (7.6%) | 0 (0.0%) |
| Total | 5,461 (65.3%) | 442 (8.1%) |
Employment Status by Educational Attainment in Memphis
According to labor force statistics for Memphis, 73.5% of individuals (4,395) out of the total population between 25 and 64 years of age (5,979) are in the labor force, with 4.5% or 198 of them being unemployed. The group with the highest labor force participation rate are those with the educational attainment of bachelor's degree or higher, with 95.4% or 1,233 individuals in the labor force. Within the labor force, individuals with high school diploma education have the highest percentage of unemployment, with 12.3% or 176 of them being unemployed.
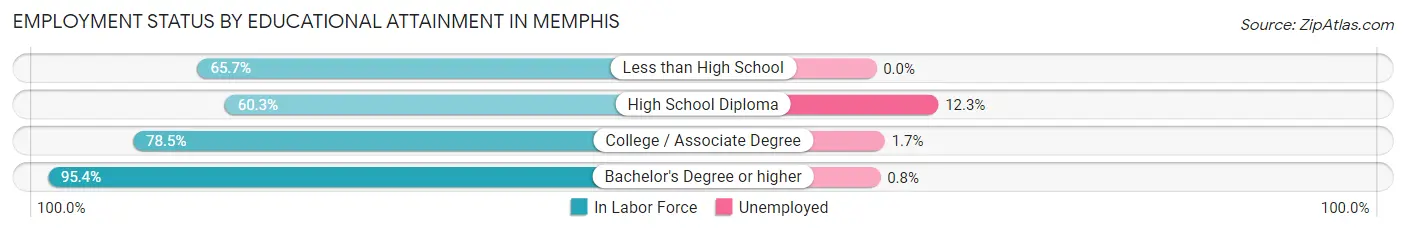
| Educational Attainment | In Labor Force | Unemployed |
| Less than High School | 420 (65.7%) | 0 (0.0%) |
| High School Diploma | 1,434 (60.3%) | 292 (12.3%) |
| College / Associate Degree | 1,311 (78.5%) | 28 (1.7%) |
| Bachelor's Degree or higher | 1,233 (95.4%) | 10 (0.8%) |
| Total | 4,395 (73.5%) | 269 (4.5%) |
Employment Occupations by Sex in Memphis
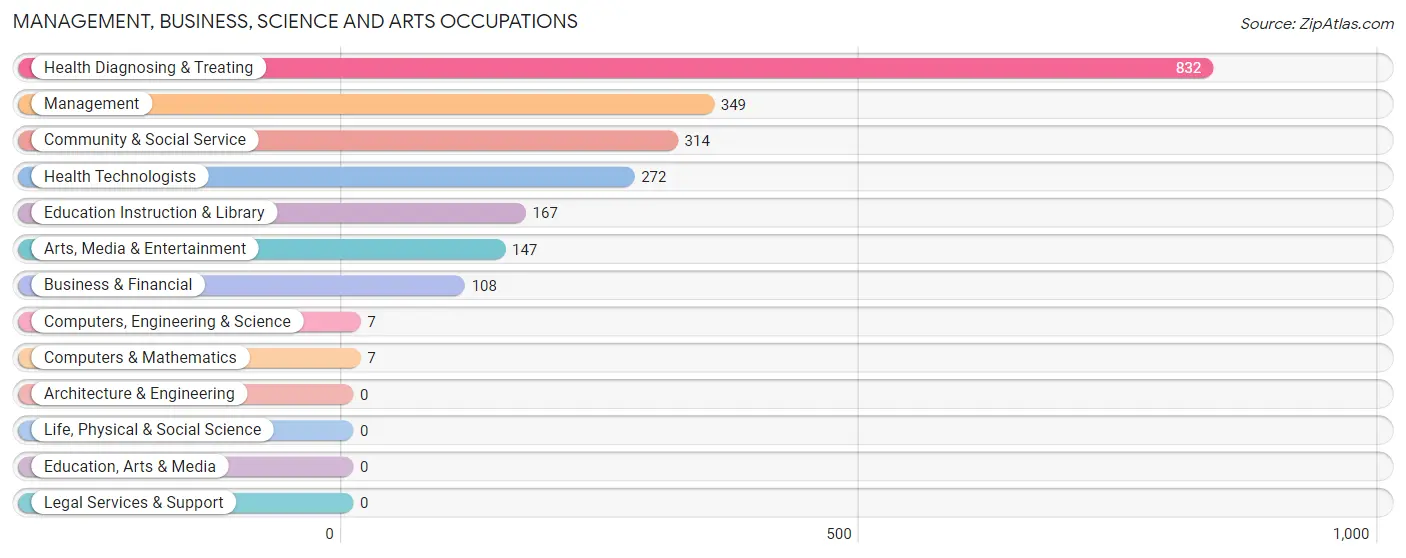
Management, Business, Science and Arts Occupations
The most common Management, Business, Science and Arts occupations in Memphis are Health Diagnosing & Treating (832 | 17.2%), Management (349 | 7.2%), Community & Social Service (314 | 6.5%), Health Technologists (272 | 5.6%), and Education Instruction & Library (167 | 3.5%).
Management, Business, Science and Arts Occupations by Sex
Within the Management, Business, Science and Arts occupations in Memphis, the most male-oriented occupations are Computers, Engineering & Science (100.0%), Computers & Mathematics (100.0%), and Arts, Media & Entertainment (74.2%), while the most female-oriented occupations are Business & Financial (90.7%), Health Technologists (84.6%), and Education Instruction & Library (60.5%).
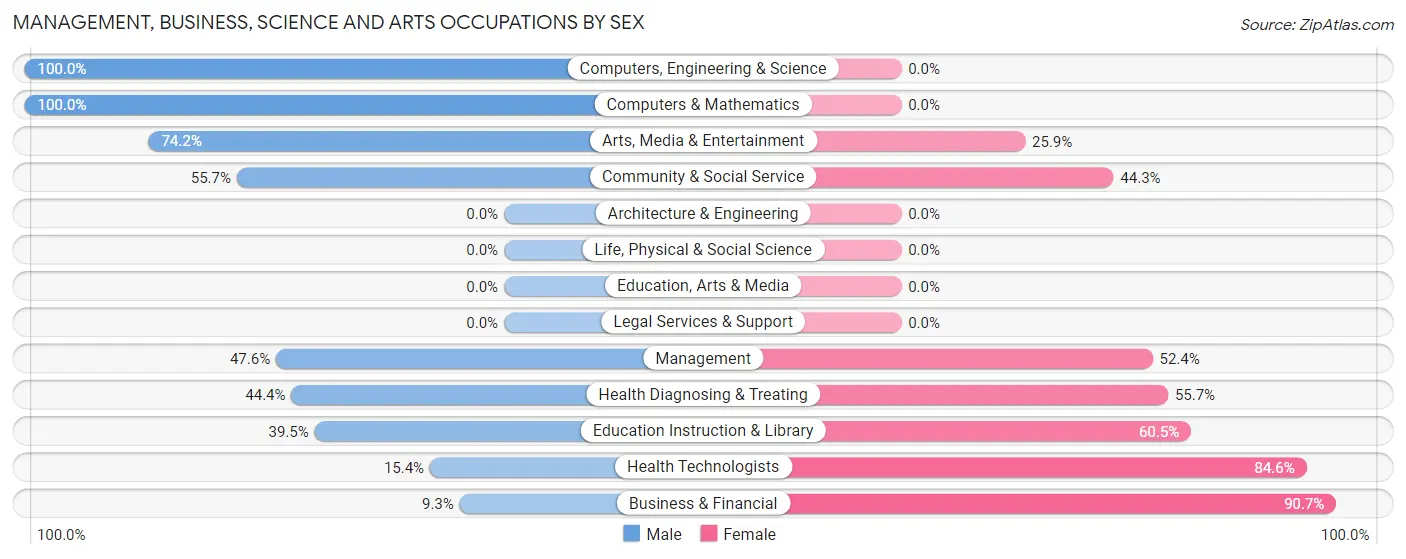
| Occupation | Male | Female |
| Management | 166 (47.6%) | 183 (52.4%) |
| Business & Financial | 10 (9.3%) | 98 (90.7%) |
| Computers, Engineering & Science | 7 (100.0%) | 0 (0.0%) |
| Computers & Mathematics | 7 (100.0%) | 0 (0.0%) |
| Architecture & Engineering | 0 (0.0%) | 0 (0.0%) |
| Life, Physical & Social Science | 0 (0.0%) | 0 (0.0%) |
| Community & Social Service | 175 (55.7%) | 139 (44.3%) |
| Education, Arts & Media | 0 (0.0%) | 0 (0.0%) |
| Legal Services & Support | 0 (0.0%) | 0 (0.0%) |
| Education Instruction & Library | 66 (39.5%) | 101 (60.5%) |
| Arts, Media & Entertainment | 109 (74.2%) | 38 (25.9%) |
| Health Diagnosing & Treating | 369 (44.4%) | 463 (55.6%) |
| Health Technologists | 42 (15.4%) | 230 (84.6%) |
| Total (Category) | 727 (45.2%) | 883 (54.8%) |
| Total (Overall) | 2,255 (46.6%) | 2,588 (53.4%) |
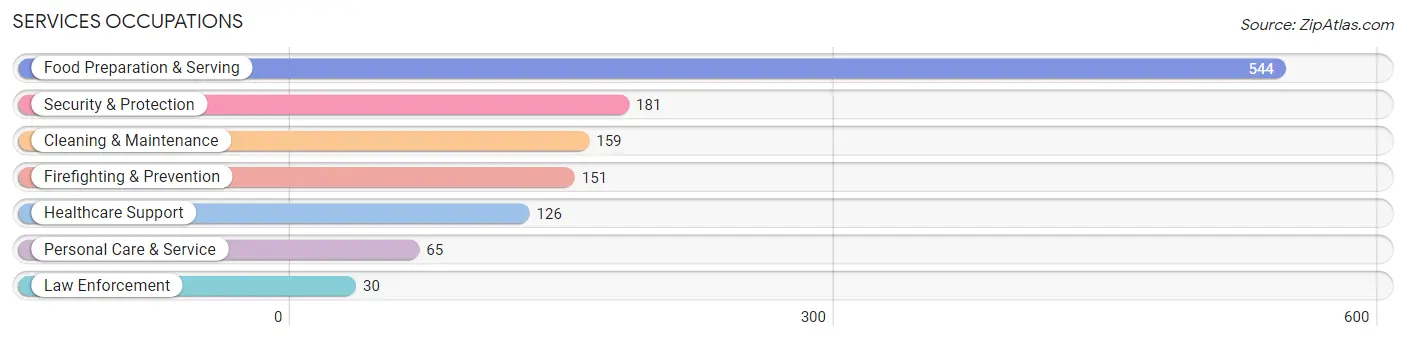
Services Occupations
The most common Services occupations in Memphis are Food Preparation & Serving (544 | 11.2%), Security & Protection (181 | 3.7%), Cleaning & Maintenance (159 | 3.3%), Firefighting & Prevention (151 | 3.1%), and Healthcare Support (126 | 2.6%).
Services Occupations by Sex
Within the Services occupations in Memphis, the most male-oriented occupations are Cleaning & Maintenance (64.1%), Food Preparation & Serving (41.5%), and Healthcare Support (17.5%), while the most female-oriented occupations are Law Enforcement (100.0%), Security & Protection (87.3%), and Personal Care & Service (86.2%).
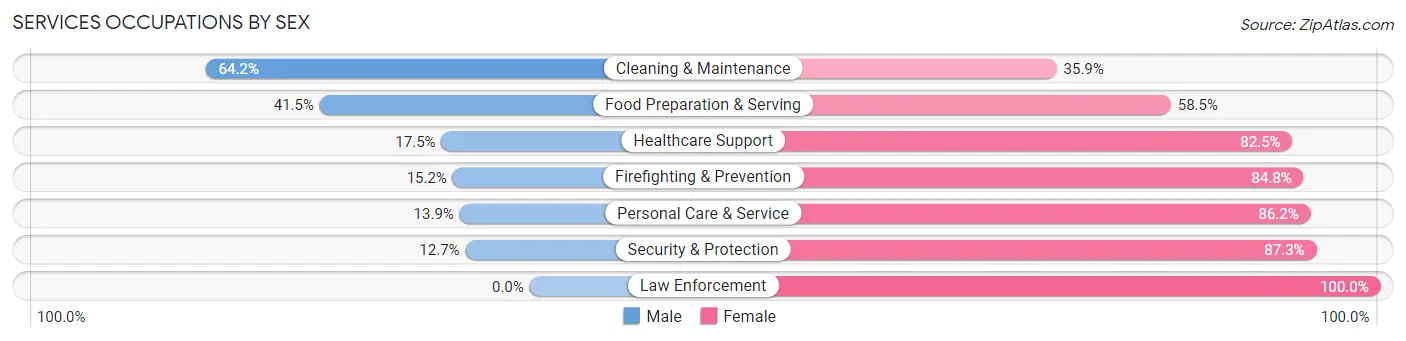
| Occupation | Male | Female |
| Healthcare Support | 22 (17.5%) | 104 (82.5%) |
| Security & Protection | 23 (12.7%) | 158 (87.3%) |
| Firefighting & Prevention | 23 (15.2%) | 128 (84.8%) |
| Law Enforcement | 0 (0.0%) | 30 (100.0%) |
| Food Preparation & Serving | 226 (41.5%) | 318 (58.5%) |
| Cleaning & Maintenance | 102 (64.1%) | 57 (35.8%) |
| Personal Care & Service | 9 (13.9%) | 56 (86.2%) |
| Total (Category) | 382 (35.5%) | 693 (64.5%) |
| Total (Overall) | 2,255 (46.6%) | 2,588 (53.4%) |
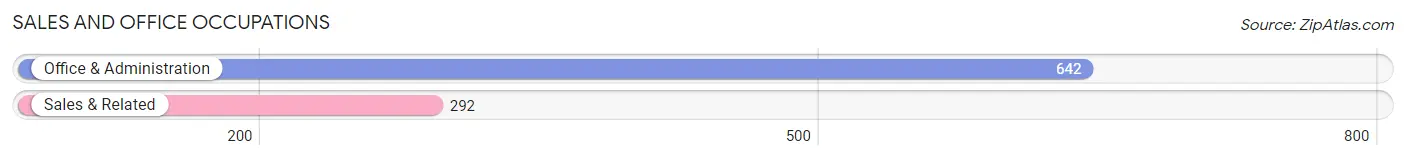
Sales and Office Occupations
The most common Sales and Office occupations in Memphis are Office & Administration (642 | 13.3%), and Sales & Related (292 | 6.0%).
Sales and Office Occupations by Sex
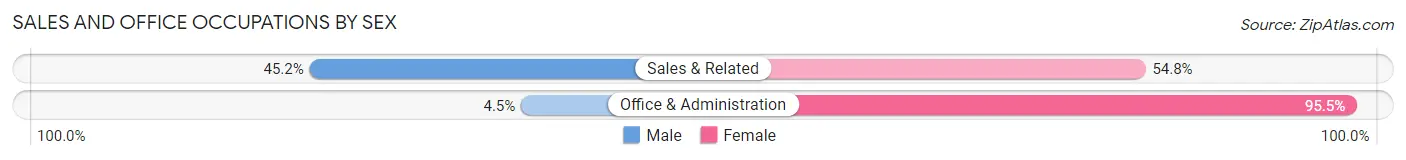
| Occupation | Male | Female |
| Sales & Related | 132 (45.2%) | 160 (54.8%) |
| Office & Administration | 29 (4.5%) | 613 (95.5%) |
| Total (Category) | 161 (17.2%) | 773 (82.8%) |
| Total (Overall) | 2,255 (46.6%) | 2,588 (53.4%) |
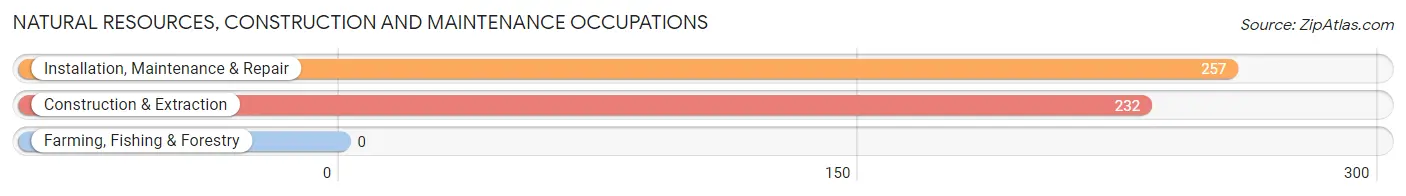
Natural Resources, Construction and Maintenance Occupations
The most common Natural Resources, Construction and Maintenance occupations in Memphis are Installation, Maintenance & Repair (257 | 5.3%), and Construction & Extraction (232 | 4.8%).
Natural Resources, Construction and Maintenance Occupations by Sex
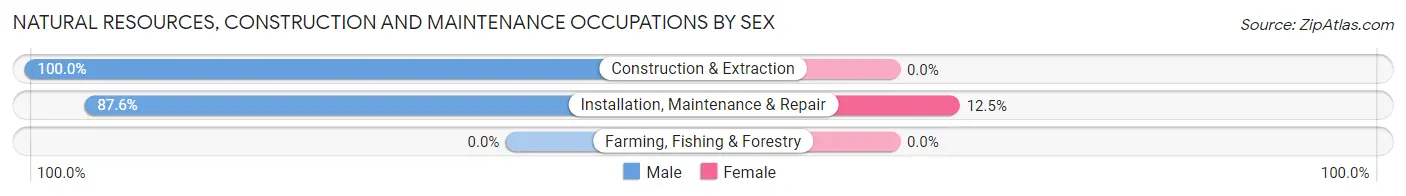
| Occupation | Male | Female |
| Farming, Fishing & Forestry | 0 (0.0%) | 0 (0.0%) |
| Construction & Extraction | 232 (100.0%) | 0 (0.0%) |
| Installation, Maintenance & Repair | 225 (87.5%) | 32 (12.4%) |
| Total (Category) | 457 (93.5%) | 32 (6.5%) |
| Total (Overall) | 2,255 (46.6%) | 2,588 (53.4%) |
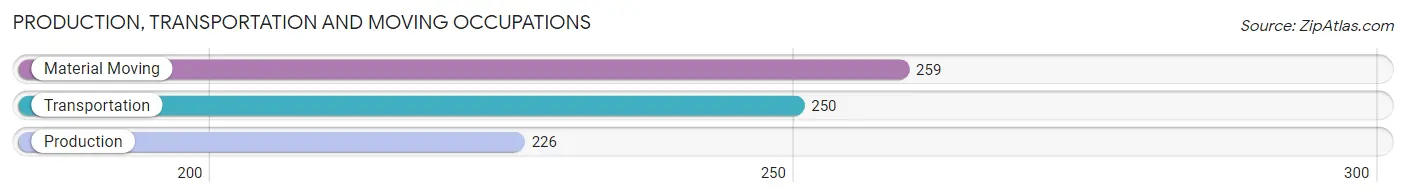
Production, Transportation and Moving Occupations
The most common Production, Transportation and Moving occupations in Memphis are Material Moving (259 | 5.3%), Transportation (250 | 5.2%), and Production (226 | 4.7%).
Production, Transportation and Moving Occupations by Sex
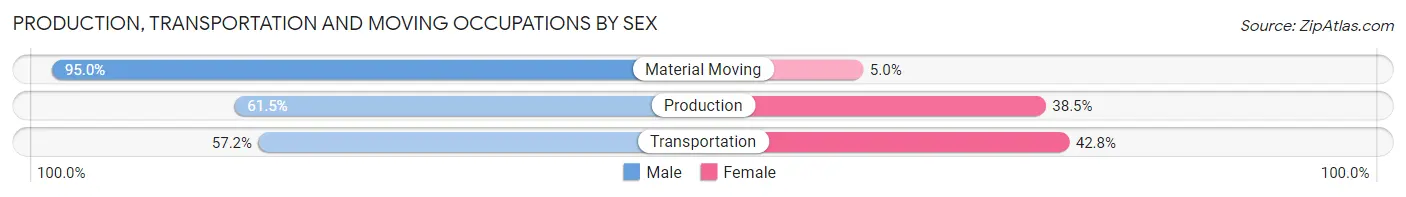
| Occupation | Male | Female |
| Production | 139 (61.5%) | 87 (38.5%) |
| Transportation | 143 (57.2%) | 107 (42.8%) |
| Material Moving | 246 (95.0%) | 13 (5.0%) |
| Total (Category) | 528 (71.8%) | 207 (28.2%) |
| Total (Overall) | 2,255 (46.6%) | 2,588 (53.4%) |
Employment Industries by Sex in Memphis
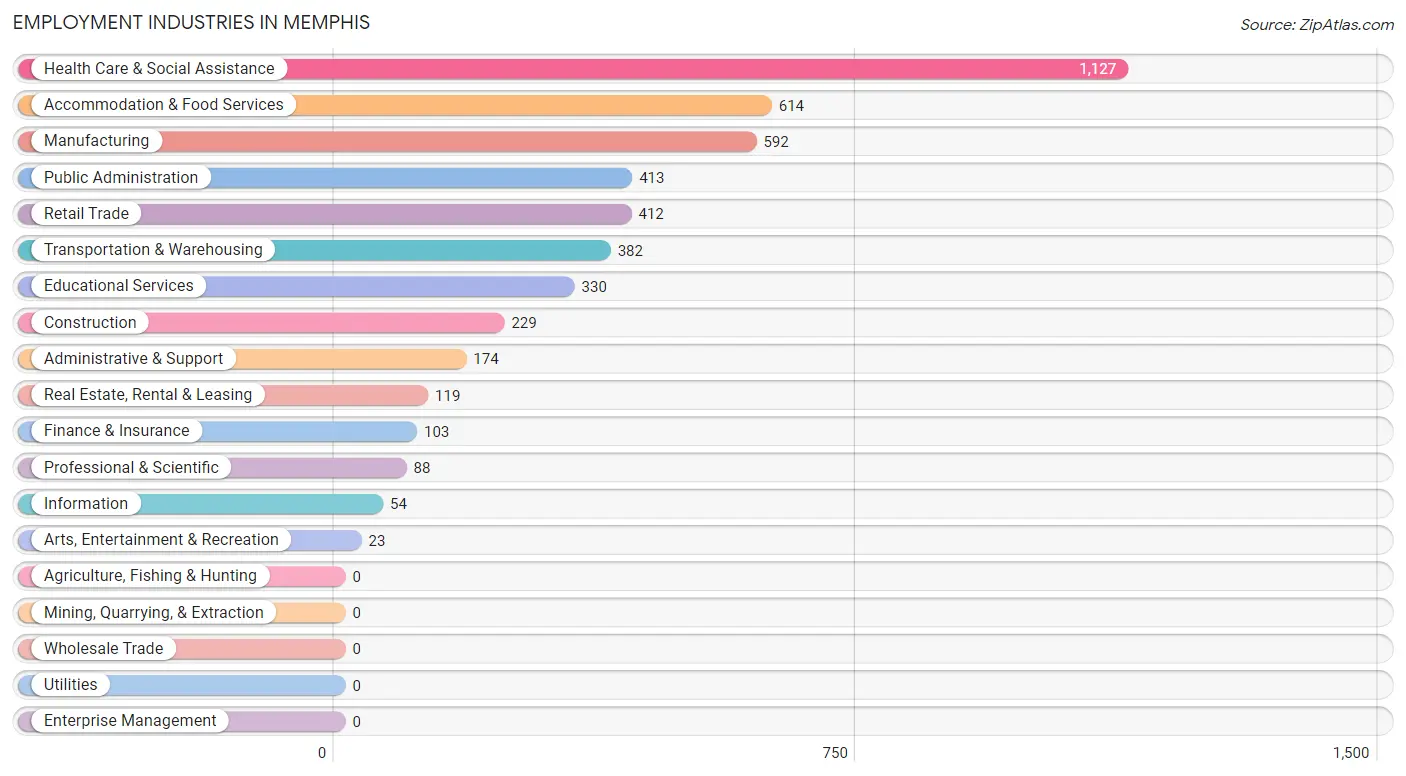
Employment Industries in Memphis
The major employment industries in Memphis include Health Care & Social Assistance (1,127 | 23.3%), Accommodation & Food Services (614 | 12.7%), Manufacturing (592 | 12.2%), Public Administration (413 | 8.5%), and Retail Trade (412 | 8.5%).
Employment Industries by Sex in Memphis
The Memphis industries that see more men than women are Construction (100.0%), Information (100.0%), and Administrative & Support (100.0%), whereas the industries that tend to have a higher number of women are Finance & Insurance (92.2%), Transportation & Warehousing (80.4%), and Educational Services (80.0%).
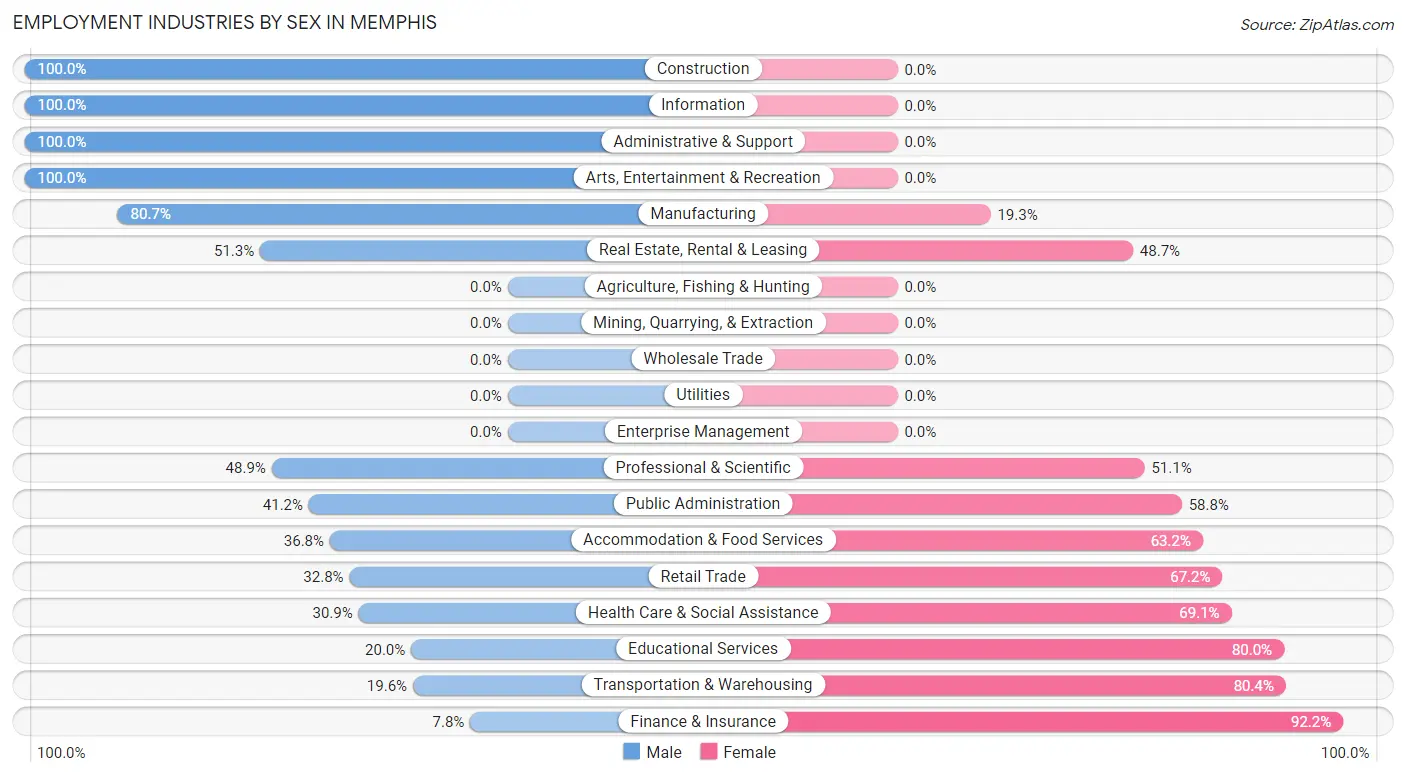
| Industry | Male | Female |
| Agriculture, Fishing & Hunting | 0 (0.0%) | 0 (0.0%) |
| Mining, Quarrying, & Extraction | 0 (0.0%) | 0 (0.0%) |
| Construction | 229 (100.0%) | 0 (0.0%) |
| Manufacturing | 478 (80.7%) | 114 (19.3%) |
| Wholesale Trade | 0 (0.0%) | 0 (0.0%) |
| Retail Trade | 135 (32.8%) | 277 (67.2%) |
| Transportation & Warehousing | 75 (19.6%) | 307 (80.4%) |
| Utilities | 0 (0.0%) | 0 (0.0%) |
| Information | 54 (100.0%) | 0 (0.0%) |
| Finance & Insurance | 8 (7.8%) | 95 (92.2%) |
| Real Estate, Rental & Leasing | 61 (51.3%) | 58 (48.7%) |
| Professional & Scientific | 43 (48.9%) | 45 (51.1%) |
| Enterprise Management | 0 (0.0%) | 0 (0.0%) |
| Administrative & Support | 174 (100.0%) | 0 (0.0%) |
| Educational Services | 66 (20.0%) | 264 (80.0%) |
| Health Care & Social Assistance | 348 (30.9%) | 779 (69.1%) |
| Arts, Entertainment & Recreation | 23 (100.0%) | 0 (0.0%) |
| Accommodation & Food Services | 226 (36.8%) | 388 (63.2%) |
| Public Administration | 170 (41.2%) | 243 (58.8%) |
| Total | 2,255 (46.6%) | 2,588 (53.4%) |
Education in Memphis
School Enrollment in Memphis
The most common levels of schooling among the 2,619 students in Memphis are middle school (830 | 31.7%), elementary school (761 | 29.1%), and high school (544 | 20.8%).
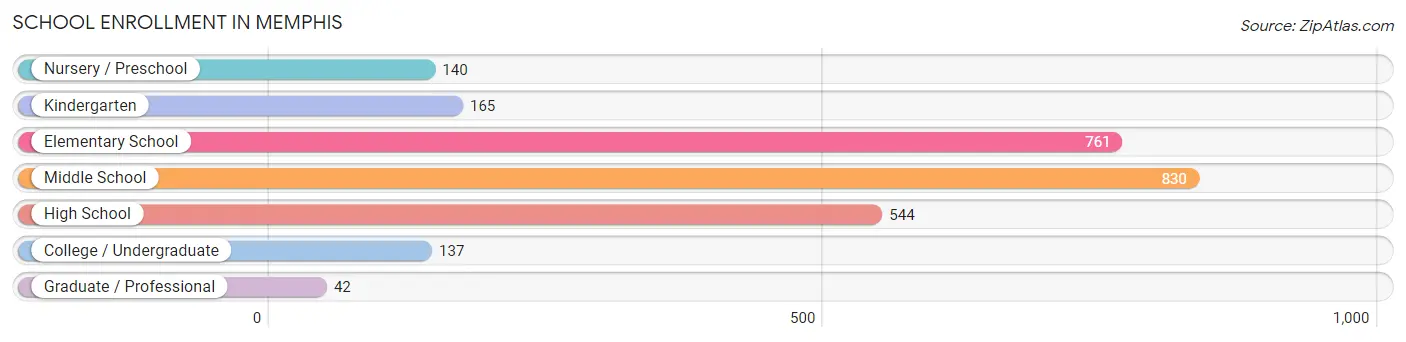
| School Level | # Students | % Students |
| Nursery / Preschool | 140 | 5.3% |
| Kindergarten | 165 | 6.3% |
| Elementary School | 761 | 29.1% |
| Middle School | 830 | 31.7% |
| High School | 544 | 20.8% |
| College / Undergraduate | 137 | 5.2% |
| Graduate / Professional | 42 | 1.6% |
| Total | 2,619 | 100.0% |
School Enrollment by Age by Funding Source in Memphis
Out of a total of 2,619 students who are enrolled in schools in Memphis, 202 (7.7%) attend a private institution, while the remaining 2,417 (92.3%) are enrolled in public schools. The age group of 25 to 34 year olds has the highest likelihood of being enrolled in private schools, with 10 (100.0% in the age bracket) enrolled. Conversely, the age group of 3 to 4 year olds has the lowest likelihood of being enrolled in a private school, with 88 (100.0% in the age bracket) attending a public institution.
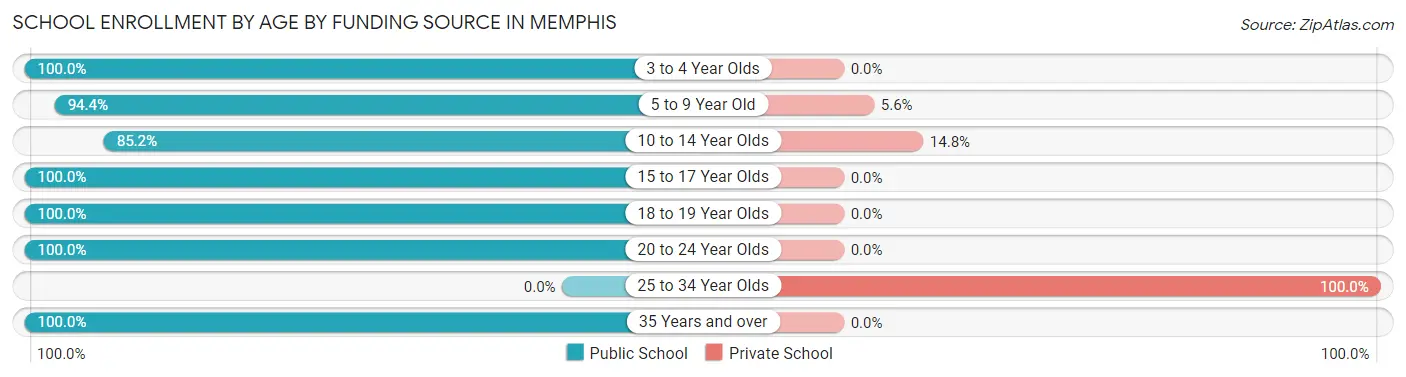
| Age Bracket | Public School | Private School |
| 3 to 4 Year Olds | 88 (100.0%) | 0 (0.0%) |
| 5 to 9 Year Old | 906 (94.4%) | 54 (5.6%) |
| 10 to 14 Year Olds | 797 (85.2%) | 138 (14.8%) |
| 15 to 17 Year Olds | 351 (100.0%) | 0 (0.0%) |
| 18 to 19 Year Olds | 122 (100.0%) | 0 (0.0%) |
| 20 to 24 Year Olds | 78 (100.0%) | 0 (0.0%) |
| 25 to 34 Year Olds | 0 (0.0%) | 10 (100.0%) |
| 35 Years and over | 75 (100.0%) | 0 (0.0%) |
| Total | 2,417 (92.3%) | 202 (7.7%) |
Educational Attainment by Field of Study in Memphis
Social sciences (334 | 21.3%), education (313 | 20.0%), bio, nature & agricultural (260 | 16.6%), science & technology (137 | 8.7%), and arts & humanities (135 | 8.6%) are the most common fields of study among 1,565 individuals in Memphis who have obtained a bachelor's degree or higher.
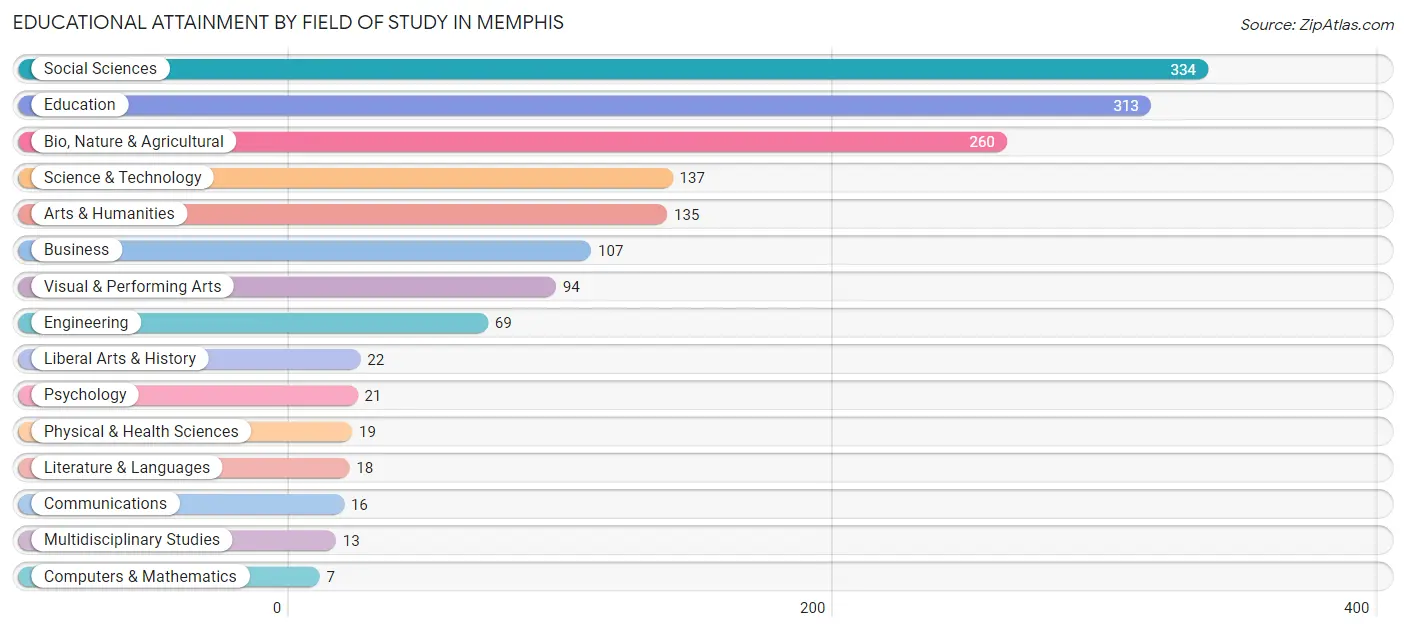
| Field of Study | # Graduates | % Graduates |
| Computers & Mathematics | 7 | 0.4% |
| Bio, Nature & Agricultural | 260 | 16.6% |
| Physical & Health Sciences | 19 | 1.2% |
| Psychology | 21 | 1.3% |
| Social Sciences | 334 | 21.3% |
| Engineering | 69 | 4.4% |
| Multidisciplinary Studies | 13 | 0.8% |
| Science & Technology | 137 | 8.7% |
| Business | 107 | 6.8% |
| Education | 313 | 20.0% |
| Literature & Languages | 18 | 1.1% |
| Liberal Arts & History | 22 | 1.4% |
| Visual & Performing Arts | 94 | 6.0% |
| Communications | 16 | 1.0% |
| Arts & Humanities | 135 | 8.6% |
| Total | 1,565 | 100.0% |
Transportation & Commute in Memphis
Vehicle Availability by Sex in Memphis
The most prevalent vehicle ownership categories in Memphis are males with 2 vehicles (809, accounting for 37.6%) and females with 2 vehicles (1,276, making up 31.4%).
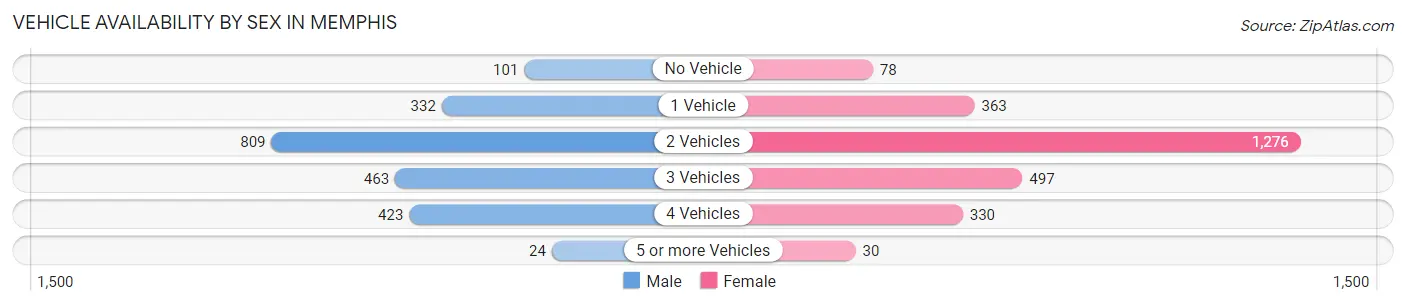
| Vehicles Available | Male | Female |
| No Vehicle | 101 (4.7%) | 78 (3.0%) |
| 1 Vehicle | 332 (15.4%) | 363 (14.1%) |
| 2 Vehicles | 809 (37.6%) | 1,276 (49.6%) |
| 3 Vehicles | 463 (21.5%) | 497 (19.3%) |
| 4 Vehicles | 423 (19.7%) | 330 (12.8%) |
| 5 or more Vehicles | 24 (1.1%) | 30 (1.2%) |
| Total | 2,152 (100.0%) | 2,574 (100.0%) |
Commute Time in Memphis
The most frequently occuring commute durations in Memphis are 20 to 24 minutes (768 commuters, 16.9%), 10 to 14 minutes (711 commuters, 15.6%), and 15 to 19 minutes (612 commuters, 13.5%).
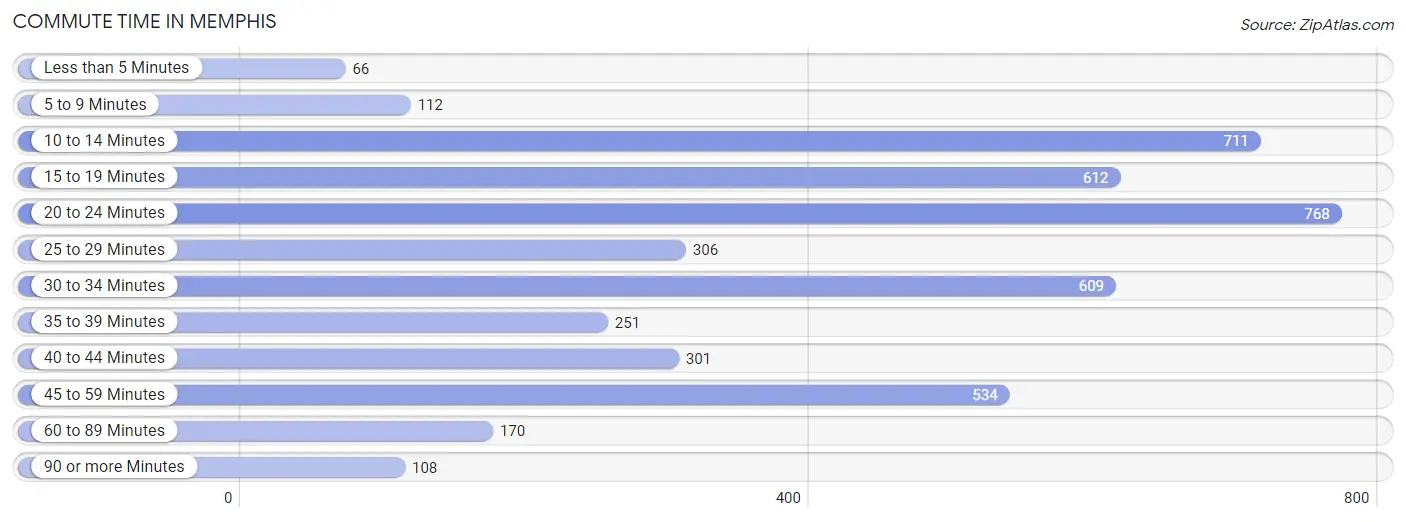
| Commute Time | # Commuters | % Commuters |
| Less than 5 Minutes | 66 | 1.5% |
| 5 to 9 Minutes | 112 | 2.5% |
| 10 to 14 Minutes | 711 | 15.6% |
| 15 to 19 Minutes | 612 | 13.5% |
| 20 to 24 Minutes | 768 | 16.9% |
| 25 to 29 Minutes | 306 | 6.7% |
| 30 to 34 Minutes | 609 | 13.4% |
| 35 to 39 Minutes | 251 | 5.5% |
| 40 to 44 Minutes | 301 | 6.6% |
| 45 to 59 Minutes | 534 | 11.7% |
| 60 to 89 Minutes | 170 | 3.7% |
| 90 or more Minutes | 108 | 2.4% |
Commute Time by Sex in Memphis
The most common commute times in Memphis are 20 to 24 minutes (484 commuters, 23.2%) for males and 15 to 19 minutes (419 commuters, 17.0%) for females.
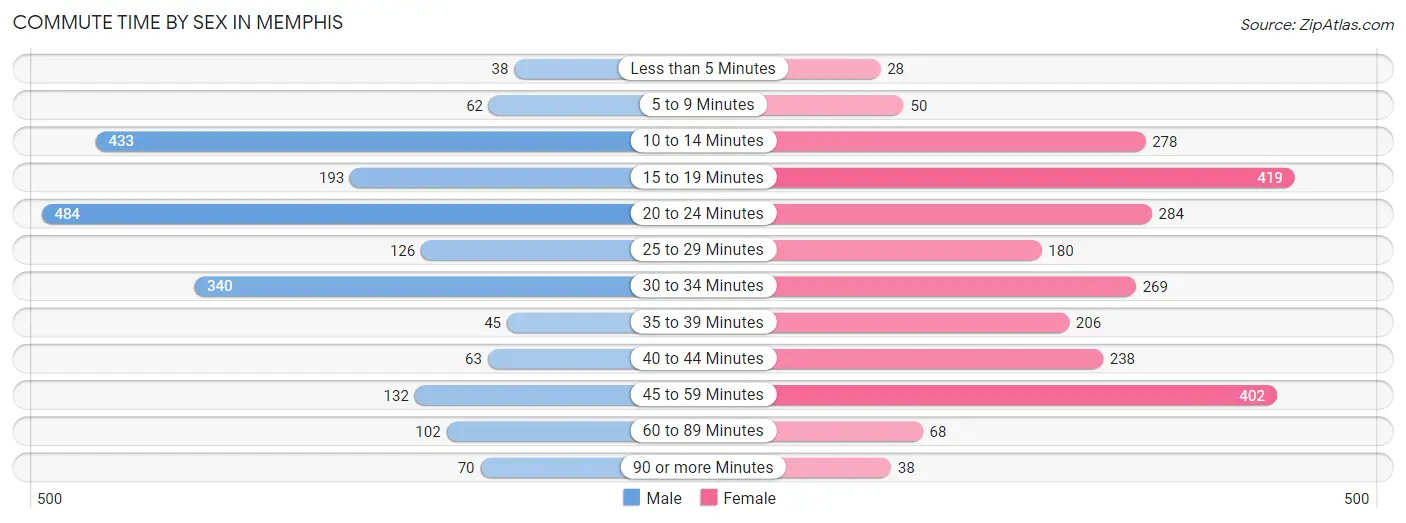
| Commute Time | Male | Female |
| Less than 5 Minutes | 38 (1.8%) | 28 (1.1%) |
| 5 to 9 Minutes | 62 (3.0%) | 50 (2.0%) |
| 10 to 14 Minutes | 433 (20.7%) | 278 (11.3%) |
| 15 to 19 Minutes | 193 (9.2%) | 419 (17.0%) |
| 20 to 24 Minutes | 484 (23.2%) | 284 (11.5%) |
| 25 to 29 Minutes | 126 (6.0%) | 180 (7.3%) |
| 30 to 34 Minutes | 340 (16.3%) | 269 (10.9%) |
| 35 to 39 Minutes | 45 (2.2%) | 206 (8.4%) |
| 40 to 44 Minutes | 63 (3.0%) | 238 (9.7%) |
| 45 to 59 Minutes | 132 (6.3%) | 402 (16.3%) |
| 60 to 89 Minutes | 102 (4.9%) | 68 (2.8%) |
| 90 or more Minutes | 70 (3.4%) | 38 (1.5%) |
Time of Departure to Work by Sex in Memphis
The most frequent times of departure to work in Memphis are 7:00 AM to 7:29 AM (386, 18.5%) for males and 7:00 AM to 7:29 AM (515, 20.9%) for females.
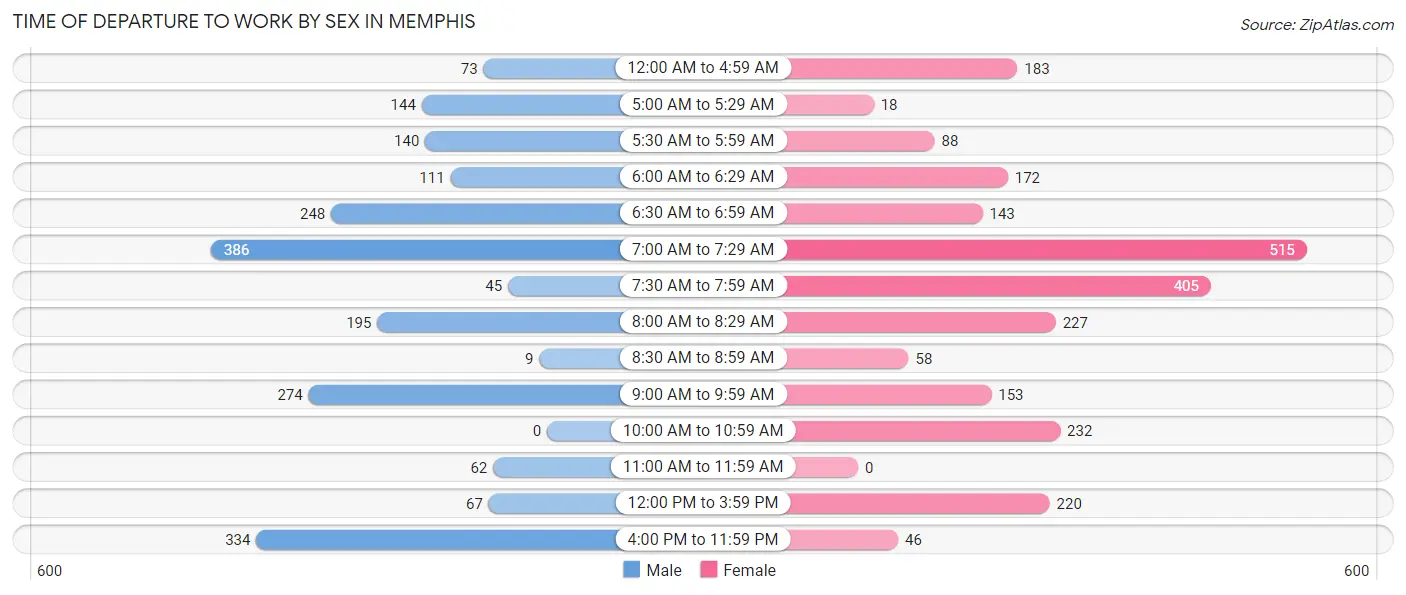
| Time of Departure | Male | Female |
| 12:00 AM to 4:59 AM | 73 (3.5%) | 183 (7.4%) |
| 5:00 AM to 5:29 AM | 144 (6.9%) | 18 (0.7%) |
| 5:30 AM to 5:59 AM | 140 (6.7%) | 88 (3.6%) |
| 6:00 AM to 6:29 AM | 111 (5.3%) | 172 (7.0%) |
| 6:30 AM to 6:59 AM | 248 (11.9%) | 143 (5.8%) |
| 7:00 AM to 7:29 AM | 386 (18.5%) | 515 (20.9%) |
| 7:30 AM to 7:59 AM | 45 (2.2%) | 405 (16.5%) |
| 8:00 AM to 8:29 AM | 195 (9.3%) | 227 (9.2%) |
| 8:30 AM to 8:59 AM | 9 (0.4%) | 58 (2.4%) |
| 9:00 AM to 9:59 AM | 274 (13.1%) | 153 (6.2%) |
| 10:00 AM to 10:59 AM | 0 (0.0%) | 232 (9.4%) |
| 11:00 AM to 11:59 AM | 62 (3.0%) | 0 (0.0%) |
| 12:00 PM to 3:59 PM | 67 (3.2%) | 220 (8.9%) |
| 4:00 PM to 11:59 PM | 334 (16.0%) | 46 (1.9%) |
| Total | 2,088 (100.0%) | 2,460 (100.0%) |
Housing Occupancy in Memphis
Occupancy by Ownership in Memphis
Of the total 3,376 dwellings in Memphis, owner-occupied units account for 2,411 (71.4%), while renter-occupied units make up 965 (28.6%).
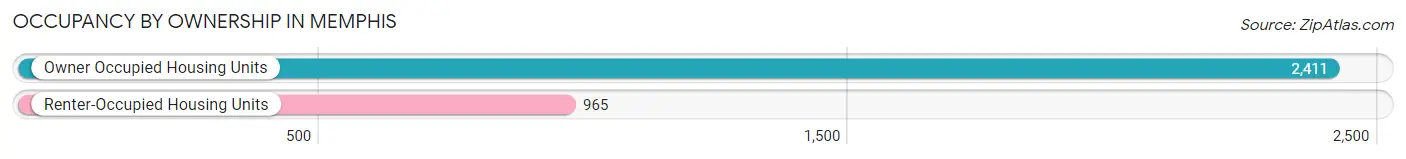
| Occupancy | # Housing Units | % Housing Units |
| Owner Occupied Housing Units | 2,411 | 71.4% |
| Renter-Occupied Housing Units | 965 | 28.6% |
| Total Occupied Housing Units | 3,376 | 100.0% |
Occupancy by Household Size in Memphis
| Household Size | # Housing Units | % Housing Units |
| 1-Person Household | 407 | 12.1% |
| 2-Person Household | 1,332 | 39.5% |
| 3-Person Household | 482 | 14.3% |
| 4+ Person Household | 1,155 | 34.2% |
| Total Housing Units | 3,376 | 100.0% |
Occupancy by Ownership by Household Size in Memphis
| Household Size | Owner-occupied | Renter-occupied |
| 1-Person Household | 268 (65.8%) | 139 (34.2%) |
| 2-Person Household | 1,172 (88.0%) | 160 (12.0%) |
| 3-Person Household | 314 (65.1%) | 168 (34.8%) |
| 4+ Person Household | 657 (56.9%) | 498 (43.1%) |
| Total Housing Units | 2,411 (71.4%) | 965 (28.6%) |
Occupancy by Educational Attainment in Memphis
| Household Size | Owner-occupied | Renter-occupied |
| Less than High School | 152 (35.5%) | 276 (64.5%) |
| High School Diploma | 628 (62.4%) | 378 (37.6%) |
| College/Associate Degree | 968 (84.2%) | 182 (15.8%) |
| Bachelor's Degree or higher | 663 (83.7%) | 129 (16.3%) |
Occupancy by Age of Householder in Memphis
| Age Bracket | # Households | % Households |
| Under 35 Years | 457 | 13.5% |
| 35 to 44 Years | 1,252 | 37.1% |
| 45 to 54 Years | 380 | 11.3% |
| 55 to 64 Years | 585 | 17.3% |
| 65 to 74 Years | 430 | 12.7% |
| 75 to 84 Years | 232 | 6.9% |
| 85 Years and Over | 40 | 1.2% |
| Total | 3,376 | 100.0% |
Housing Finances in Memphis
Median Income by Occupancy in Memphis
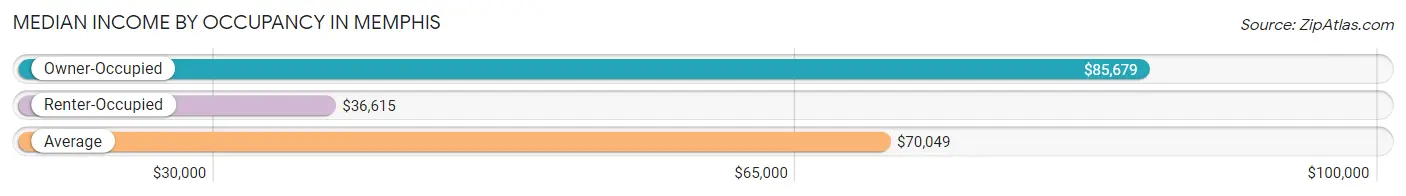
| Occupancy Type | # Households | Median Income |
| Owner-Occupied | 2,411 (71.4%) | $85,679 |
| Renter-Occupied | 965 (28.6%) | $36,615 |
| Average | 3,376 (100.0%) | $70,049 |
Occupancy by Householder Income Bracket in Memphis
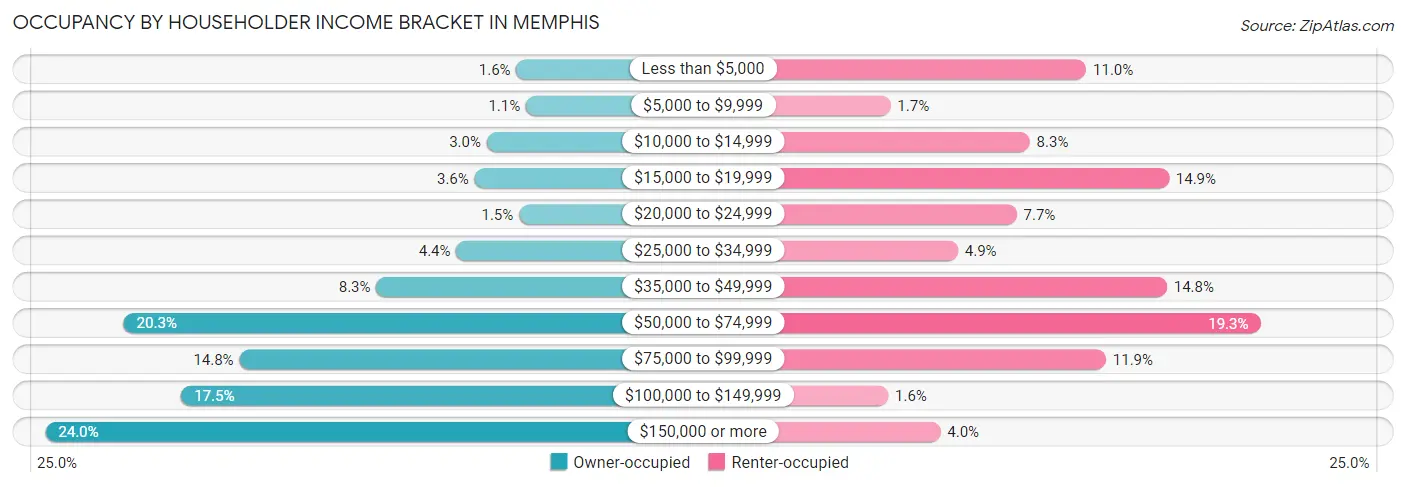
| Income Bracket | Owner-occupied | Renter-occupied |
| Less than $5,000 | 38 (1.6%) | 106 (11.0%) |
| $5,000 to $9,999 | 27 (1.1%) | 16 (1.7%) |
| $10,000 to $14,999 | 72 (3.0%) | 80 (8.3%) |
| $15,000 to $19,999 | 86 (3.6%) | 144 (14.9%) |
| $20,000 to $24,999 | 35 (1.5%) | 74 (7.7%) |
| $25,000 to $34,999 | 107 (4.4%) | 47 (4.9%) |
| $35,000 to $49,999 | 199 (8.3%) | 143 (14.8%) |
| $50,000 to $74,999 | 489 (20.3%) | 186 (19.3%) |
| $75,000 to $99,999 | 356 (14.8%) | 115 (11.9%) |
| $100,000 to $149,999 | 423 (17.5%) | 15 (1.5%) |
| $150,000 or more | 579 (24.0%) | 39 (4.0%) |
| Total | 2,411 (100.0%) | 965 (100.0%) |
Monthly Housing Cost Tiers in Memphis
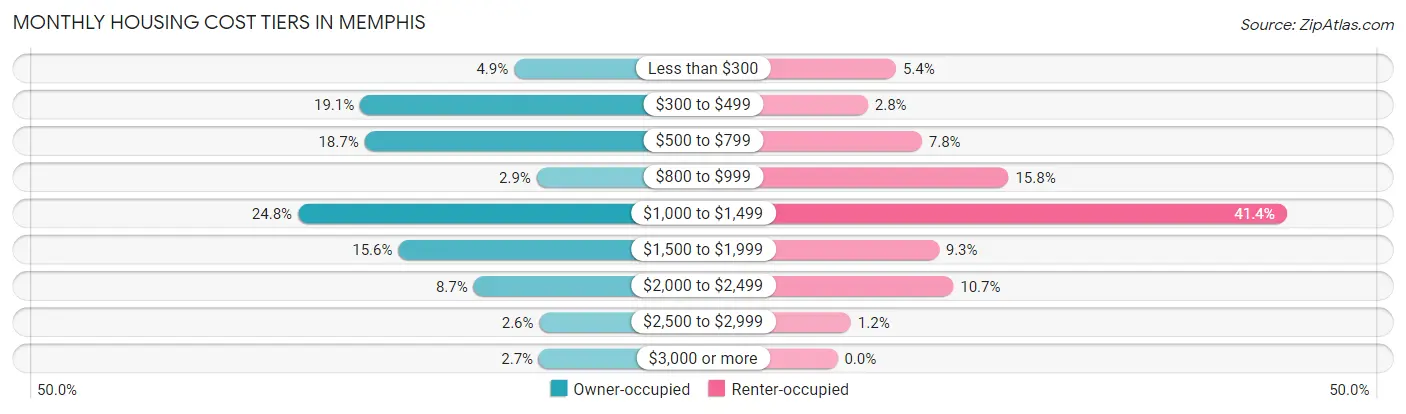
| Monthly Cost | Owner-occupied | Renter-occupied |
| Less than $300 | 119 (4.9%) | 52 (5.4%) |
| $300 to $499 | 461 (19.1%) | 27 (2.8%) |
| $500 to $799 | 451 (18.7%) | 75 (7.8%) |
| $800 to $999 | 69 (2.9%) | 152 (15.8%) |
| $1,000 to $1,499 | 599 (24.8%) | 399 (41.3%) |
| $1,500 to $1,999 | 376 (15.6%) | 90 (9.3%) |
| $2,000 to $2,499 | 209 (8.7%) | 103 (10.7%) |
| $2,500 to $2,999 | 63 (2.6%) | 12 (1.2%) |
| $3,000 or more | 64 (2.6%) | 0 (0.0%) |
| Total | 2,411 (100.0%) | 965 (100.0%) |
Physical Housing Characteristics in Memphis
Housing Structures in Memphis
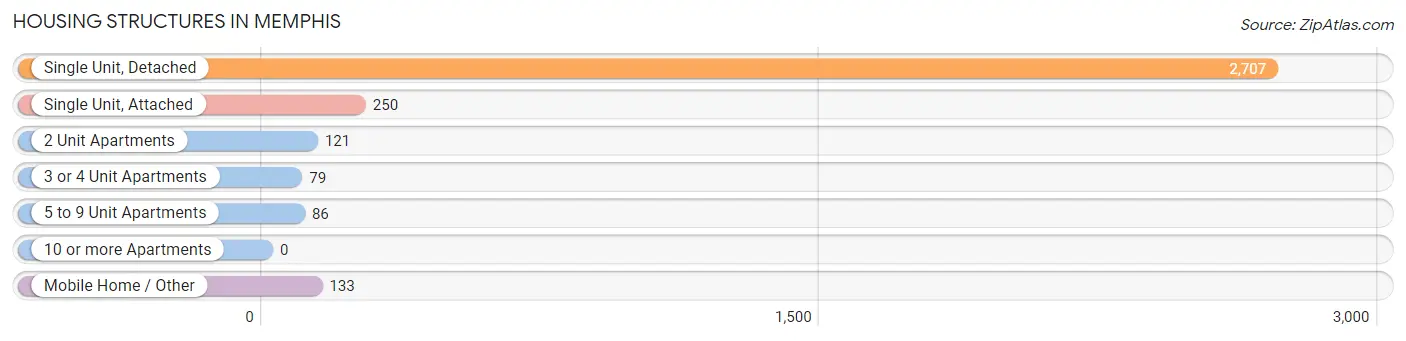
| Structure Type | # Housing Units | % Housing Units |
| Single Unit, Detached | 2,707 | 80.2% |
| Single Unit, Attached | 250 | 7.4% |
| 2 Unit Apartments | 121 | 3.6% |
| 3 or 4 Unit Apartments | 79 | 2.3% |
| 5 to 9 Unit Apartments | 86 | 2.5% |
| 10 or more Apartments | 0 | 0.0% |
| Mobile Home / Other | 133 | 3.9% |
| Total | 3,376 | 100.0% |
Housing Structures by Occupancy in Memphis
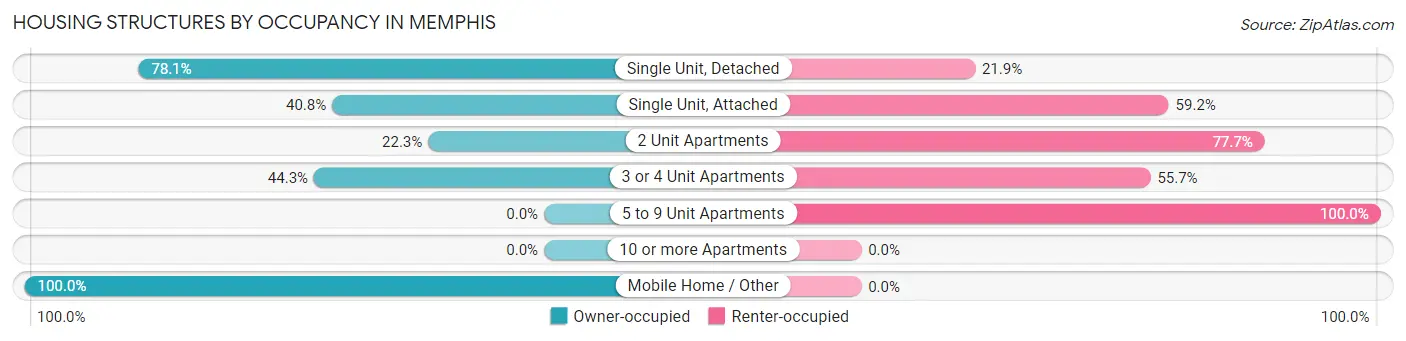
| Structure Type | Owner-occupied | Renter-occupied |
| Single Unit, Detached | 2,114 (78.1%) | 593 (21.9%) |
| Single Unit, Attached | 102 (40.8%) | 148 (59.2%) |
| 2 Unit Apartments | 27 (22.3%) | 94 (77.7%) |
| 3 or 4 Unit Apartments | 35 (44.3%) | 44 (55.7%) |
| 5 to 9 Unit Apartments | 0 (0.0%) | 86 (100.0%) |
| 10 or more Apartments | 0 (0.0%) | 0 (0.0%) |
| Mobile Home / Other | 133 (100.0%) | 0 (0.0%) |
| Total | 2,411 (71.4%) | 965 (28.6%) |
Housing Structures by Number of Rooms in Memphis
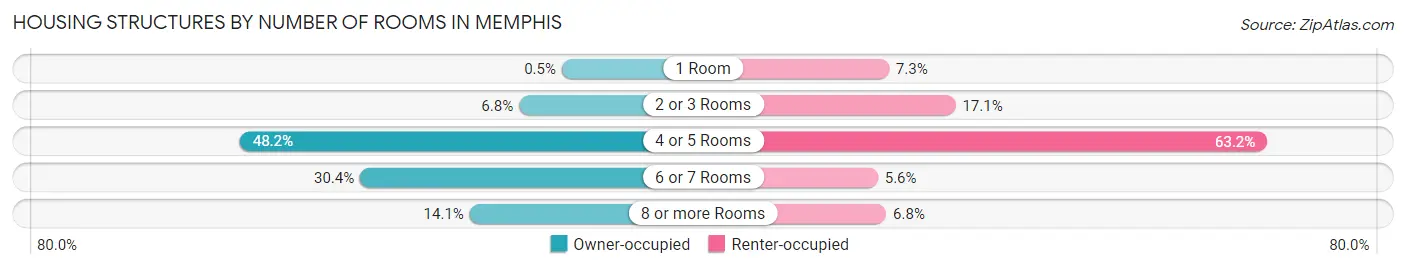
| Number of Rooms | Owner-occupied | Renter-occupied |
| 1 Room | 12 (0.5%) | 70 (7.2%) |
| 2 or 3 Rooms | 165 (6.8%) | 165 (17.1%) |
| 4 or 5 Rooms | 1,161 (48.1%) | 610 (63.2%) |
| 6 or 7 Rooms | 732 (30.4%) | 54 (5.6%) |
| 8 or more Rooms | 341 (14.1%) | 66 (6.8%) |
| Total | 2,411 (100.0%) | 965 (100.0%) |
Housing Structure by Heating Type in Memphis
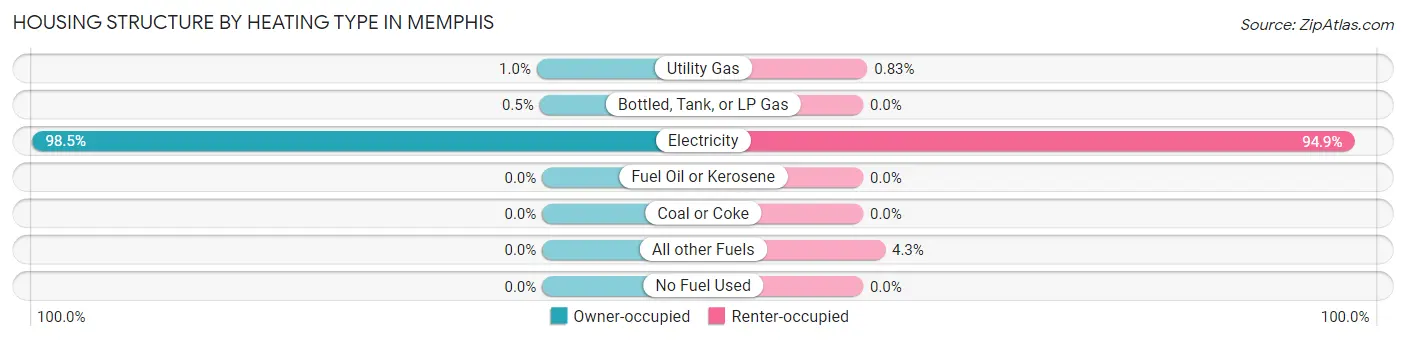
| Heating Type | Owner-occupied | Renter-occupied |
| Utility Gas | 25 (1.0%) | 8 (0.8%) |
| Bottled, Tank, or LP Gas | 12 (0.5%) | 0 (0.0%) |
| Electricity | 2,374 (98.5%) | 916 (94.9%) |
| Fuel Oil or Kerosene | 0 (0.0%) | 0 (0.0%) |
| Coal or Coke | 0 (0.0%) | 0 (0.0%) |
| All other Fuels | 0 (0.0%) | 41 (4.3%) |
| No Fuel Used | 0 (0.0%) | 0 (0.0%) |
| Total | 2,411 (100.0%) | 965 (100.0%) |
Household Vehicle Usage in Memphis
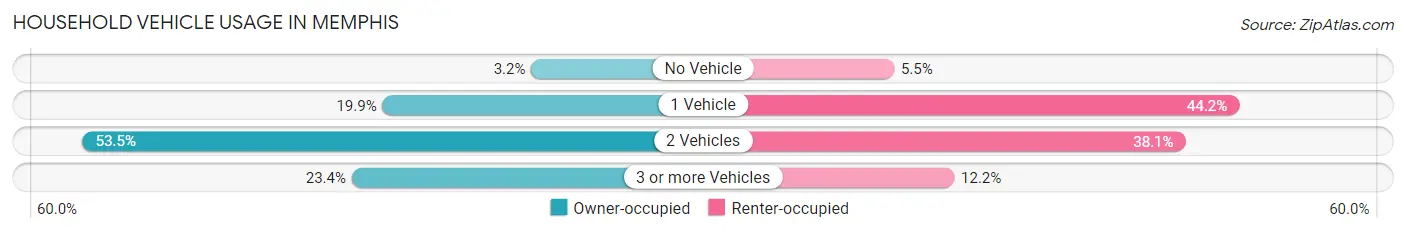
| Vehicles per Household | Owner-occupied | Renter-occupied |
| No Vehicle | 78 (3.2%) | 53 (5.5%) |
| 1 Vehicle | 480 (19.9%) | 426 (44.2%) |
| 2 Vehicles | 1,290 (53.5%) | 368 (38.1%) |
| 3 or more Vehicles | 563 (23.4%) | 118 (12.2%) |
| Total | 2,411 (100.0%) | 965 (100.0%) |
Real Estate & Mortgages in Memphis
Real Estate and Mortgage Overview in Memphis
| Characteristic | Without Mortgage | With Mortgage |
| Housing Units | 1,079 | 1,332 |
| Median Property Value | $292,100 | $260,200 |
| Median Household Income | $80,536 | $237 |
| Monthly Housing Costs | $489 | $64 |
| Real Estate Taxes | $1,565 | $64 |
Property Value by Mortgage Status in Memphis
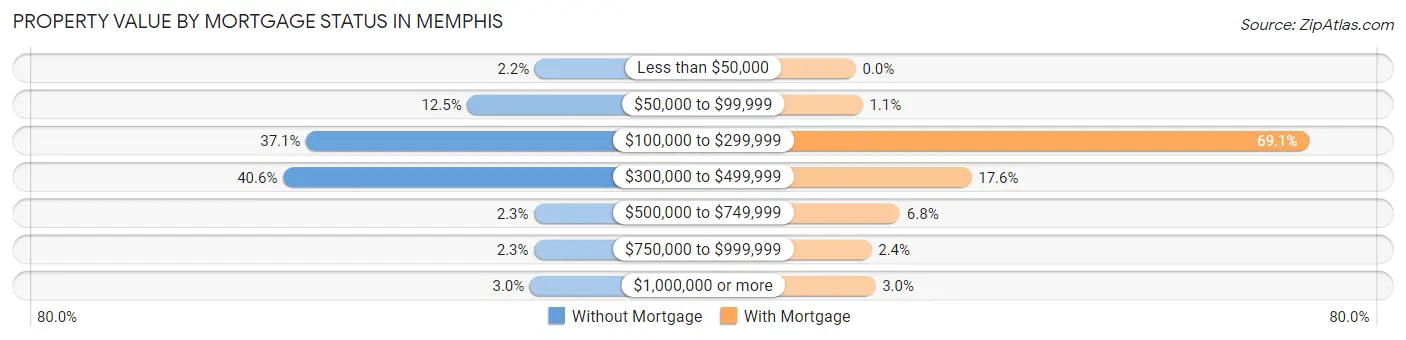
| Property Value | Without Mortgage | With Mortgage |
| Less than $50,000 | 24 (2.2%) | 0 (0.0%) |
| $50,000 to $99,999 | 135 (12.5%) | 14 (1.1%) |
| $100,000 to $299,999 | 400 (37.1%) | 921 (69.1%) |
| $300,000 to $499,999 | 438 (40.6%) | 235 (17.6%) |
| $500,000 to $749,999 | 25 (2.3%) | 90 (6.8%) |
| $750,000 to $999,999 | 25 (2.3%) | 32 (2.4%) |
| $1,000,000 or more | 32 (3.0%) | 40 (3.0%) |
| Total | 1,079 (100.0%) | 1,332 (100.0%) |
Household Income by Mortgage Status in Memphis
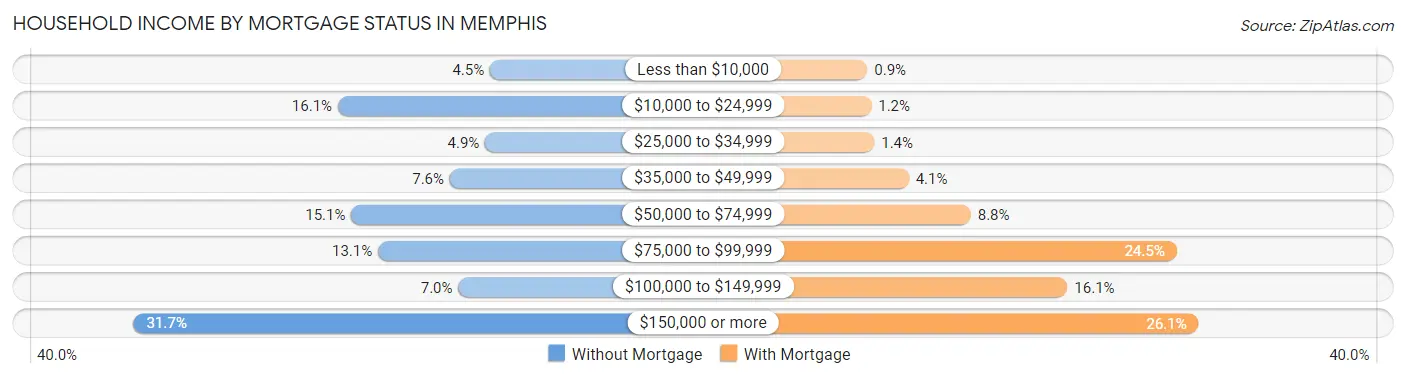
| Household Income | Without Mortgage | With Mortgage |
| Less than $10,000 | 49 (4.5%) | 12 (0.9%) |
| $10,000 to $24,999 | 174 (16.1%) | 16 (1.2%) |
| $25,000 to $34,999 | 53 (4.9%) | 19 (1.4%) |
| $35,000 to $49,999 | 82 (7.6%) | 54 (4.1%) |
| $50,000 to $74,999 | 163 (15.1%) | 117 (8.8%) |
| $75,000 to $99,999 | 141 (13.1%) | 326 (24.5%) |
| $100,000 to $149,999 | 75 (7.0%) | 215 (16.1%) |
| $150,000 or more | 342 (31.7%) | 348 (26.1%) |
| Total | 1,079 (100.0%) | 1,332 (100.0%) |
Property Value to Household Income Ratio in Memphis
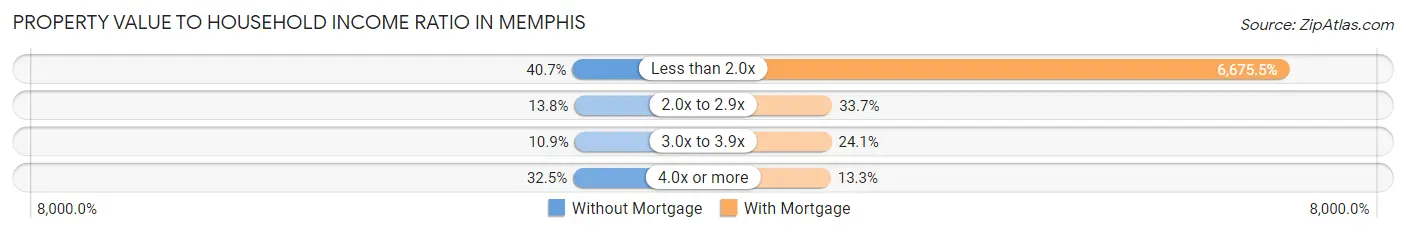
| Value-to-Income Ratio | Without Mortgage | With Mortgage |
| Less than 2.0x | 439 (40.7%) | 88,917 (6,675.4%) |
| 2.0x to 2.9x | 149 (13.8%) | 449 (33.7%) |
| 3.0x to 3.9x | 118 (10.9%) | 321 (24.1%) |
| 4.0x or more | 351 (32.5%) | 177 (13.3%) |
| Total | 1,079 (100.0%) | 1,332 (100.0%) |
Real Estate Taxes by Mortgage Status in Memphis
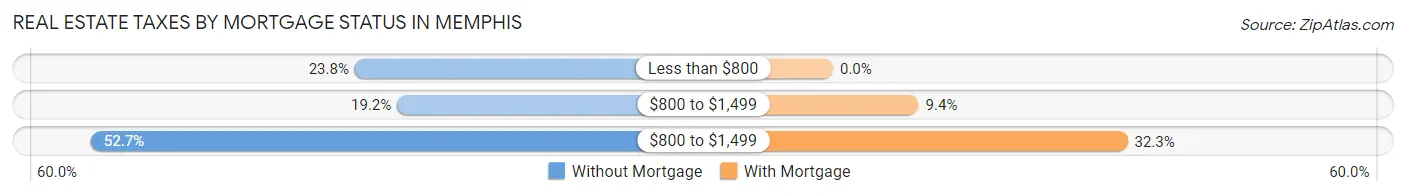
| Property Taxes | Without Mortgage | With Mortgage |
| Less than $800 | 257 (23.8%) | 0 (0.0%) |
| $800 to $1,499 | 207 (19.2%) | 125 (9.4%) |
| $800 to $1,499 | 569 (52.7%) | 430 (32.3%) |
| Total | 1,079 (100.0%) | 1,332 (100.0%) |
Health & Disability in Memphis
Health Insurance Coverage by Age in Memphis
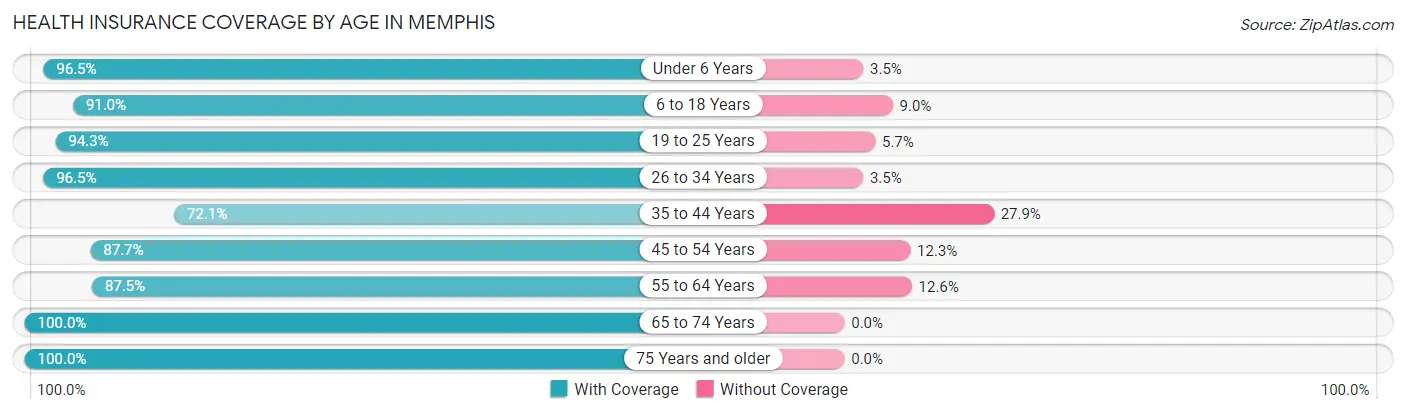
| Age Bracket | With Coverage | Without Coverage |
| Under 6 Years | 605 (96.5%) | 22 (3.5%) |
| 6 to 18 Years | 2,083 (91.0%) | 206 (9.0%) |
| 19 to 25 Years | 658 (94.3%) | 40 (5.7%) |
| 26 to 34 Years | 1,249 (96.5%) | 45 (3.5%) |
| 35 to 44 Years | 1,660 (72.1%) | 641 (27.9%) |
| 45 to 54 Years | 679 (87.7%) | 95 (12.3%) |
| 55 to 64 Years | 1,213 (87.5%) | 174 (12.6%) |
| 65 to 74 Years | 794 (100.0%) | 0 (0.0%) |
| 75 Years and older | 567 (100.0%) | 0 (0.0%) |
| Total | 9,508 (88.6%) | 1,223 (11.4%) |
Health Insurance Coverage by Citizenship Status in Memphis
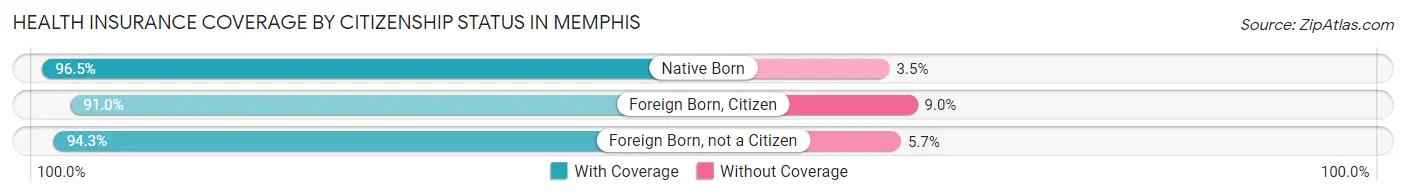
| Citizenship Status | With Coverage | Without Coverage |
| Native Born | 605 (96.5%) | 22 (3.5%) |
| Foreign Born, Citizen | 2,083 (91.0%) | 206 (9.0%) |
| Foreign Born, not a Citizen | 658 (94.3%) | 40 (5.7%) |
Health Insurance Coverage by Household Income in Memphis
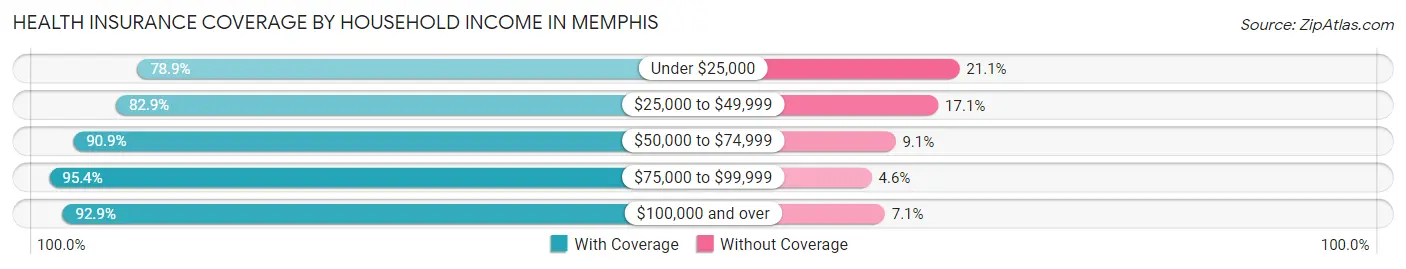
| Household Income | With Coverage | Without Coverage |
| Under $25,000 | 1,604 (78.9%) | 429 (21.1%) |
| $25,000 to $49,999 | 1,423 (82.9%) | 294 (17.1%) |
| $50,000 to $74,999 | 1,804 (90.9%) | 181 (9.1%) |
| $75,000 to $99,999 | 1,418 (95.4%) | 69 (4.6%) |
| $100,000 and over | 3,259 (92.9%) | 250 (7.1%) |
Public vs Private Health Insurance Coverage by Age in Memphis
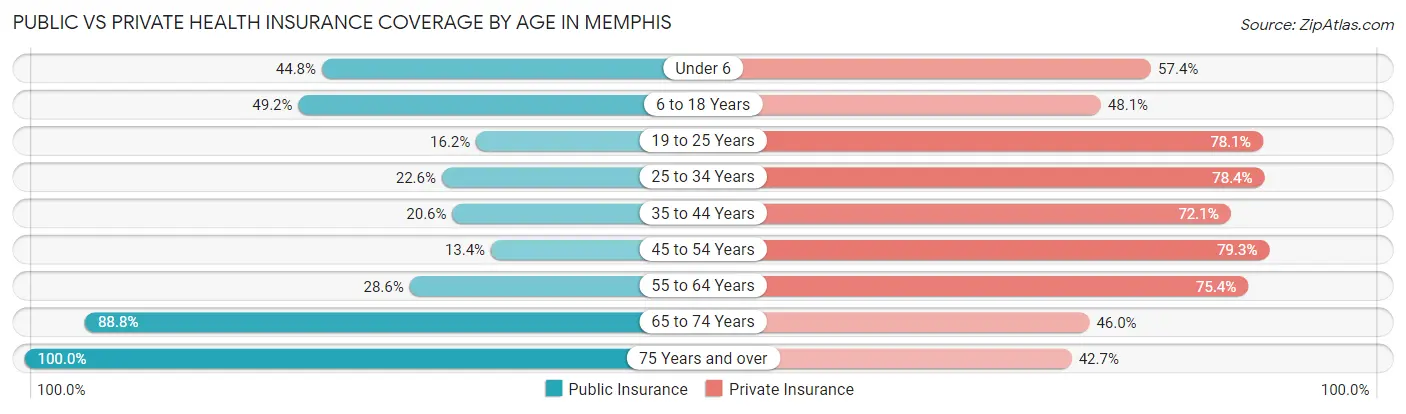
| Age Bracket | Public Insurance | Private Insurance |
| Under 6 | 281 (44.8%) | 360 (57.4%) |
| 6 to 18 Years | 1,126 (49.2%) | 1,101 (48.1%) |
| 19 to 25 Years | 113 (16.2%) | 545 (78.1%) |
| 25 to 34 Years | 292 (22.6%) | 1,015 (78.4%) |
| 35 to 44 Years | 474 (20.6%) | 1,660 (72.1%) |
| 45 to 54 Years | 104 (13.4%) | 614 (79.3%) |
| 55 to 64 Years | 396 (28.5%) | 1,046 (75.4%) |
| 65 to 74 Years | 705 (88.8%) | 365 (46.0%) |
| 75 Years and over | 567 (100.0%) | 242 (42.7%) |
| Total | 4,058 (37.8%) | 6,948 (64.7%) |
Disability Status by Sex by Age in Memphis
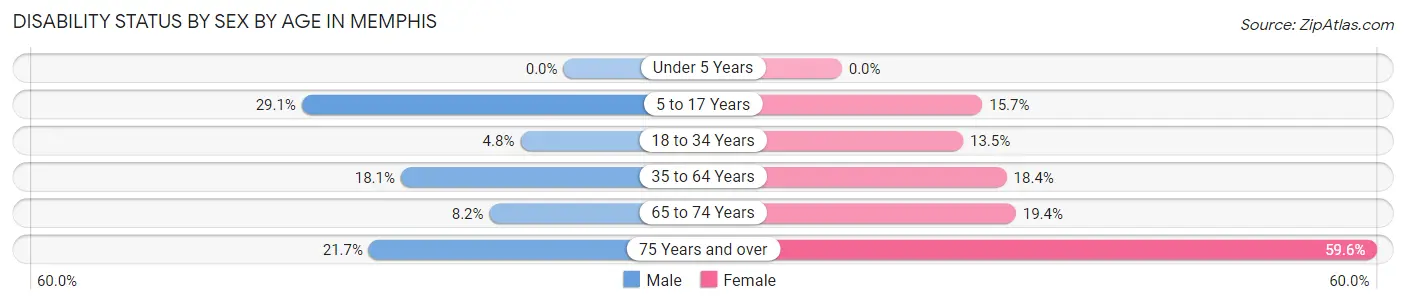
| Age Bracket | Male | Female |
| Under 5 Years | 0 (0.0%) | 0 (0.0%) |
| 5 to 17 Years | 338 (29.1%) | 175 (15.7%) |
| 18 to 34 Years | 55 (4.8%) | 135 (13.5%) |
| 35 to 64 Years | 436 (18.1%) | 377 (18.4%) |
| 65 to 74 Years | 28 (8.2%) | 88 (19.4%) |
| 75 Years and over | 52 (21.7%) | 195 (59.6%) |
Disability Class by Sex by Age in Memphis
Disability Class: Hearing Difficulty
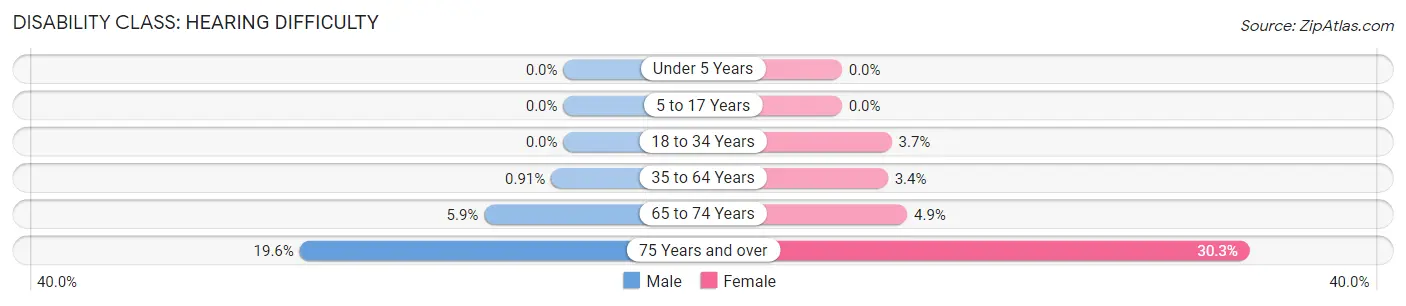
| Age Bracket | Male | Female |
| Under 5 Years | 0 (0.0%) | 0 (0.0%) |
| 5 to 17 Years | 0 (0.0%) | 0 (0.0%) |
| 18 to 34 Years | 0 (0.0%) | 37 (3.7%) |
| 35 to 64 Years | 22 (0.9%) | 70 (3.4%) |
| 65 to 74 Years | 20 (5.9%) | 22 (4.9%) |
| 75 Years and over | 47 (19.6%) | 99 (30.3%) |
Disability Class: Vision Difficulty
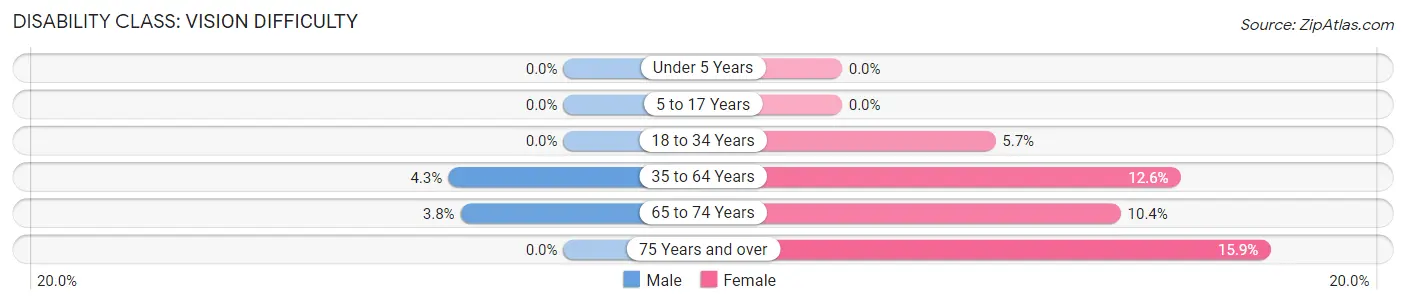
| Age Bracket | Male | Female |
| Under 5 Years | 0 (0.0%) | 0 (0.0%) |
| 5 to 17 Years | 0 (0.0%) | 0 (0.0%) |
| 18 to 34 Years | 0 (0.0%) | 57 (5.7%) |
| 35 to 64 Years | 103 (4.3%) | 258 (12.6%) |
| 65 to 74 Years | 13 (3.8%) | 47 (10.3%) |
| 75 Years and over | 0 (0.0%) | 52 (15.9%) |
Disability Class: Cognitive Difficulty
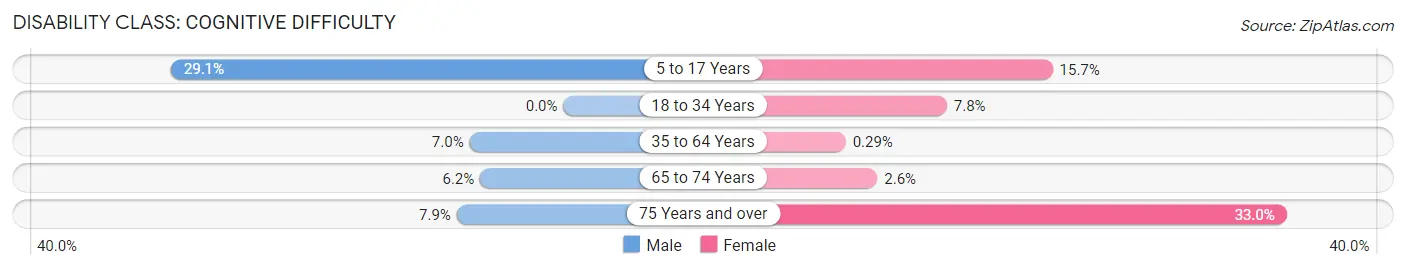
| Age Bracket | Male | Female |
| 5 to 17 Years | 338 (29.1%) | 175 (15.7%) |
| 18 to 34 Years | 0 (0.0%) | 78 (7.8%) |
| 35 to 64 Years | 168 (7.0%) | 6 (0.3%) |
| 65 to 74 Years | 21 (6.2%) | 12 (2.6%) |
| 75 Years and over | 19 (7.9%) | 108 (33.0%) |
Disability Class: Ambulatory Difficulty
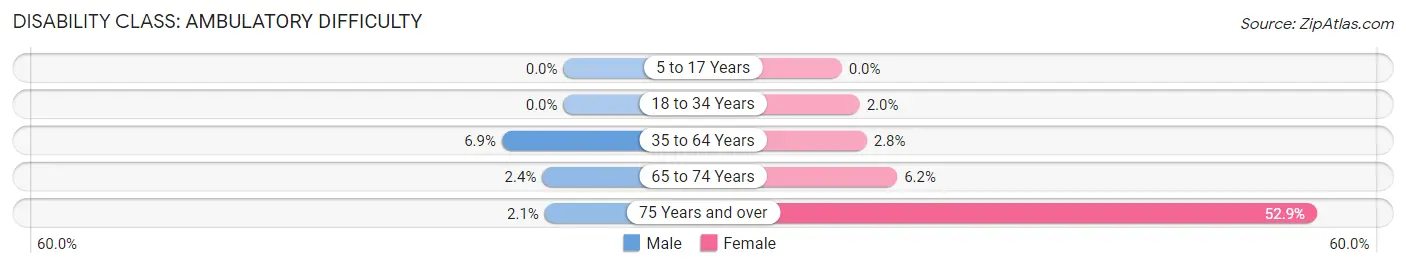
| Age Bracket | Male | Female |
| 5 to 17 Years | 0 (0.0%) | 0 (0.0%) |
| 18 to 34 Years | 0 (0.0%) | 20 (2.0%) |
| 35 to 64 Years | 165 (6.9%) | 57 (2.8%) |
| 65 to 74 Years | 8 (2.4%) | 28 (6.2%) |
| 75 Years and over | 5 (2.1%) | 173 (52.9%) |
Disability Class: Self-Care Difficulty
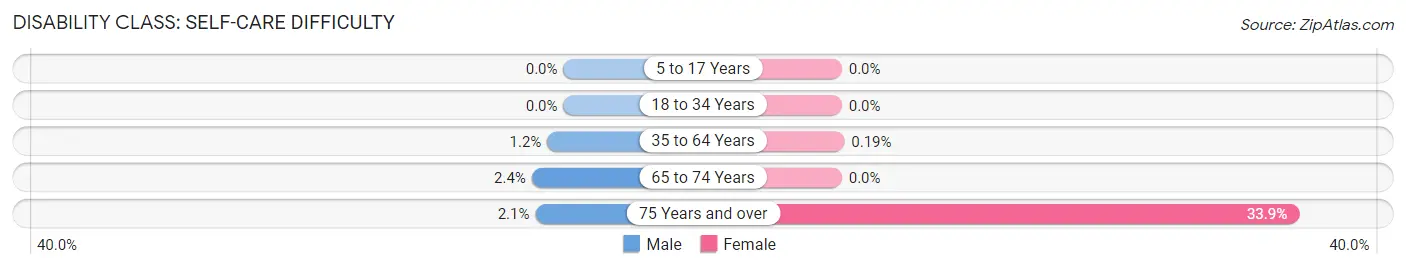
| Age Bracket | Male | Female |
| 5 to 17 Years | 0 (0.0%) | 0 (0.0%) |
| 18 to 34 Years | 0 (0.0%) | 0 (0.0%) |
| 35 to 64 Years | 29 (1.2%) | 4 (0.2%) |
| 65 to 74 Years | 8 (2.4%) | 0 (0.0%) |
| 75 Years and over | 5 (2.1%) | 111 (33.9%) |
Technology Access in Memphis
Computing Device Access in Memphis
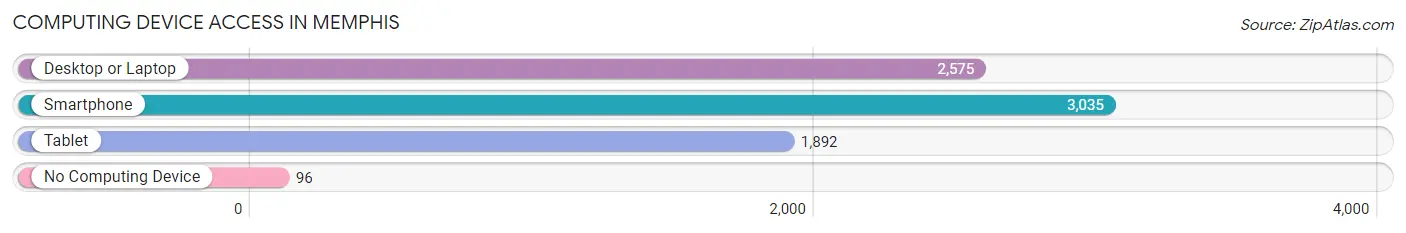
| Device Type | # Households | % Households |
| Desktop or Laptop | 2,575 | 76.3% |
| Smartphone | 3,035 | 89.9% |
| Tablet | 1,892 | 56.0% |
| No Computing Device | 96 | 2.8% |
| Total | 3,376 | 100.0% |
Internet Access in Memphis
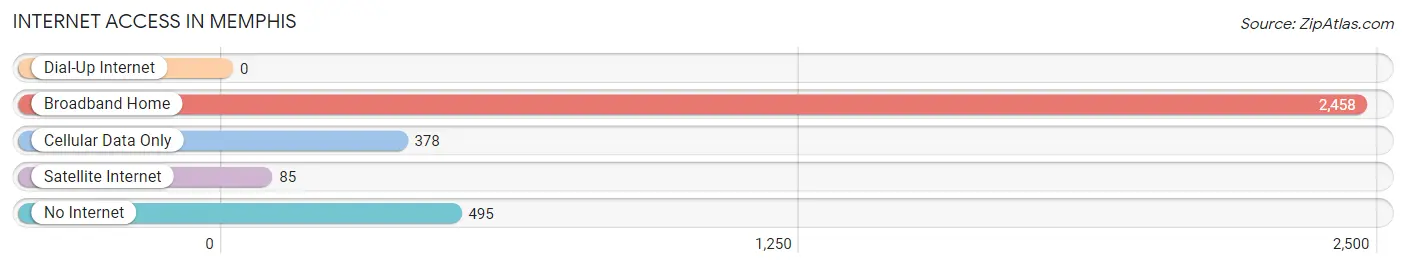
| Internet Type | # Households | % Households |
| Dial-Up Internet | 0 | 0.0% |
| Broadband Home | 2,458 | 72.8% |
| Cellular Data Only | 378 | 11.2% |
| Satellite Internet | 85 | 2.5% |
| No Internet | 495 | 14.7% |
| Total | 3,376 | 100.0% |
Memphis Summary
Memphis is a small town located in Madison County, Florida. It is situated on the banks of the Withlacoochee River, approximately 20 miles east of the state capital, Tallahassee. The town was founded in 1827 and is named after the ancient city of Memphis, Egypt. The population of Memphis was estimated to be 1,093 in 2019.
Geography
Memphis is located in the panhandle of Florida, in the northwest corner of Madison County. It is situated on the banks of the Withlacoochee River, approximately 20 miles east of the state capital, Tallahassee. The town is surrounded by rolling hills and is located in a rural area. The climate in Memphis is humid subtropical, with hot summers and mild winters.
Economy
The economy of Memphis is largely based on agriculture and forestry. The town is home to several farms, including cattle, poultry, and vegetable farms. The town is also home to several timber companies, which harvest and process timber for use in construction and other industries. Additionally, Memphis is home to several small businesses, including restaurants, retail stores, and service providers.
Demographics
As of the 2019 census, the population of Memphis was estimated to be 1,093. The racial makeup of the town was 79.2% White, 17.2% African American, 0.7% Native American, 0.3% Asian, 0.1% Pacific Islander, and 2.5% from other races. The median household income in Memphis was $37,917, and the median age was 41.
History
Memphis was founded in 1827 by settlers from Georgia and South Carolina. The town was named after the ancient city of Memphis, Egypt. The town was originally a trading post and was home to several stores and businesses. In the late 19th century, Memphis became a center for the timber industry, and several timber companies were established in the area. In the early 20th century, the town was home to several cotton mills, which provided employment for many of the town’s residents.
In the late 20th century, Memphis began to experience a decline in population as many of its residents moved away in search of better economic opportunities. However, in recent years, the town has seen a resurgence in population as people have moved back to the area in search of a more rural lifestyle. Today, Memphis is a small but vibrant town, with a strong sense of community and a commitment to preserving its history and culture.
Common Questions
What is Per Capita Income in Memphis?
Per Capita income in Memphis is $29,382.
What is the Median Family Income in Memphis?
Median Family Income in Memphis is $74,604.
What is the Median Household income in Memphis?
Median Household Income in Memphis is $70,049.
What is Income or Wage Gap in Memphis?
Income or Wage Gap in Memphis is 40.6%.
Women in Memphis earn 59.4 cents for every dollar earned by a man.
What is Family Income Deficit in Memphis?
Family Income Deficit in Memphis is $16,308.
Families that are below poverty line in Memphis earn $16,308 less on average than the poverty threshold level.
What is Inequality or Gini Index in Memphis?
Inequality or Gini Index in Memphis is 0.47.
What is the Total Population of Memphis?
Total Population of Memphis is 10,923.
What is the Total Male Population of Memphis?
Total Male Population of Memphis is 5,779.
What is the Total Female Population of Memphis?
Total Female Population of Memphis is 5,144.
What is the Ratio of Males per 100 Females in Memphis?
There are 112.34 Males per 100 Females in Memphis.
What is the Ratio of Females per 100 Males in Memphis?
There are 89.01 Females per 100 Males in Memphis.
What is the Median Population Age in Memphis?
Median Population Age in Memphis is 35.7 Years.
What is the Average Family Size in Memphis
Average Family Size in Memphis is 3.5 People.
What is the Average Household Size in Memphis
Average Household Size in Memphis is 3.2 People.
How Large is the Labor Force in Memphis?
There are 5,461 People in the Labor Forcein in Memphis.
What is the Percentage of People in the Labor Force in Memphis?
65.3% of People are in the Labor Force in Memphis.
What is the Unemployment Rate in Memphis?
Unemployment Rate in Memphis is 8.1%.