Huntsville, TX Map & Demographics
Huntsville Map
Huntsville Overview
$19,277
PER CAPITA INCOME
$64,177
AVG FAMILY INCOME
$37,419
AVG HOUSEHOLD INCOME
16.0%
WAGE / INCOME GAP [ % ]
84.0¢/ $1
WAGE / INCOME GAP [ $ ]
$12,659
FAMILY INCOME DEFICIT
0.48
INEQUALITY / GINI INDEX
46,202
TOTAL POPULATION
26,615
MALE POPULATION
19,587
FEMALE POPULATION
135.88
MALES / 100 FEMALES
73.59
FEMALES / 100 MALES
31.0
MEDIAN AGE
3.3
AVG FAMILY SIZE
2.4
AVG HOUSEHOLD SIZE
19,150
LABOR FORCE [ PEOPLE ]
46.6%
PERCENT IN LABOR FORCE
8.9%
UNEMPLOYMENT RATE
Huntsville Area Codes
Income in Huntsville
Income Overview in Huntsville
Per Capita Income in Huntsville is $19,277, while median incomes of families and households are $64,177 and $37,419 respectively.
| Characteristic | Number | Measure |
| Per Capita Income | 46,202 | $19,277 |
| Median Family Income | 6,553 | $64,177 |
| Mean Family Income | 6,553 | $75,546 |
| Median Household Income | 14,680 | $37,419 |
| Mean Household Income | 14,680 | $52,627 |
| Income Deficit | 6,553 | $12,659 |
| Wage / Income Gap (%) | 46,202 | 15.97% |
| Wage / Income Gap ($) | 46,202 | 84.03¢ per $1 |
| Gini / Inequality Index | 46,202 | 0.48 |
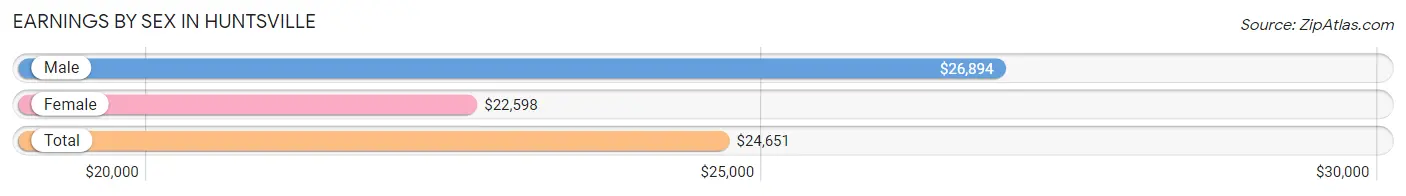
Earnings by Sex in Huntsville
Average Earnings in Huntsville are $24,651, $26,894 for men and $22,598 for women, a difference of 16.0%.
| Sex | Number | Average Earnings |
| Male | 11,641 (55.3%) | $26,894 |
| Female | 9,410 (44.7%) | $22,598 |
| Total | 21,051 (100.0%) | $24,651 |
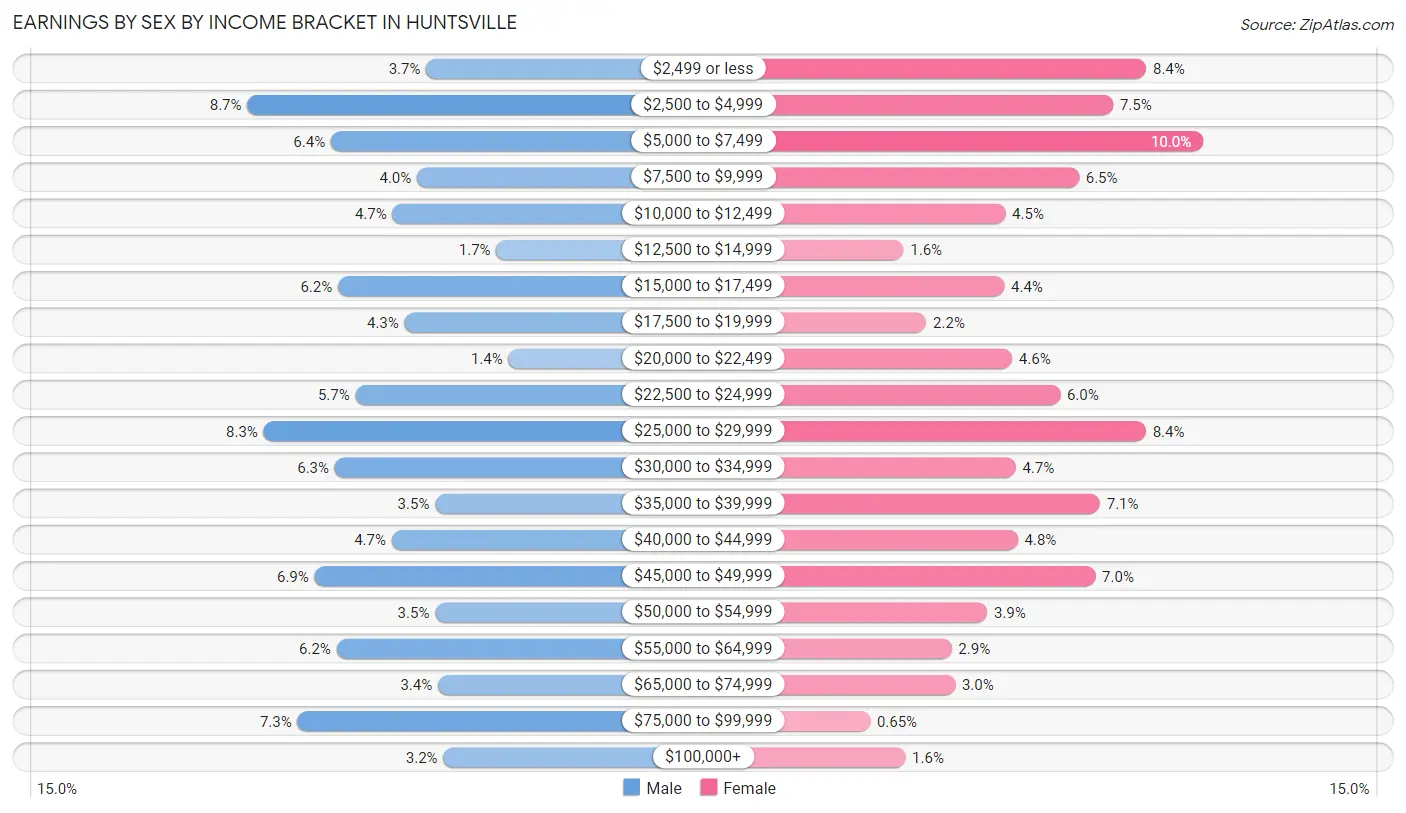
Earnings by Sex by Income Bracket in Huntsville
The most common earnings brackets in Huntsville are $2,500 to $4,999 for men (1,018 | 8.7%) and $5,000 to $7,499 for women (942 | 10.0%).
| Income | Male | Female |
| $2,499 or less | 432 (3.7%) | 791 (8.4%) |
| $2,500 to $4,999 | 1,018 (8.7%) | 704 (7.5%) |
| $5,000 to $7,499 | 744 (6.4%) | 942 (10.0%) |
| $7,500 to $9,999 | 462 (4.0%) | 614 (6.5%) |
| $10,000 to $12,499 | 543 (4.7%) | 419 (4.4%) |
| $12,500 to $14,999 | 202 (1.7%) | 150 (1.6%) |
| $15,000 to $17,499 | 720 (6.2%) | 416 (4.4%) |
| $17,500 to $19,999 | 503 (4.3%) | 210 (2.2%) |
| $20,000 to $22,499 | 163 (1.4%) | 437 (4.6%) |
| $22,500 to $24,999 | 663 (5.7%) | 564 (6.0%) |
| $25,000 to $29,999 | 964 (8.3%) | 790 (8.4%) |
| $30,000 to $34,999 | 731 (6.3%) | 446 (4.7%) |
| $35,000 to $39,999 | 403 (3.5%) | 669 (7.1%) |
| $40,000 to $44,999 | 545 (4.7%) | 452 (4.8%) |
| $45,000 to $49,999 | 797 (6.9%) | 657 (7.0%) |
| $50,000 to $54,999 | 403 (3.5%) | 371 (3.9%) |
| $55,000 to $64,999 | 725 (6.2%) | 277 (2.9%) |
| $65,000 to $74,999 | 394 (3.4%) | 286 (3.0%) |
| $75,000 to $99,999 | 853 (7.3%) | 61 (0.6%) |
| $100,000+ | 376 (3.2%) | 154 (1.6%) |
| Total | 11,641 (100.0%) | 9,410 (100.0%) |
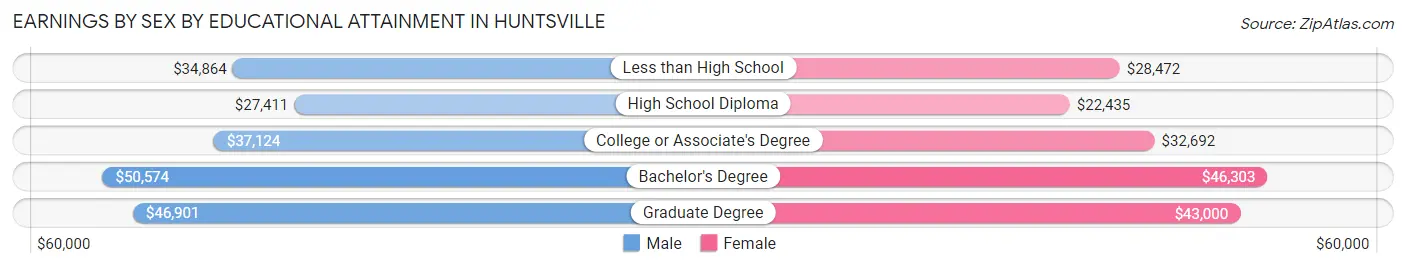
Earnings by Sex by Educational Attainment in Huntsville
Average earnings in Huntsville are $36,949 for men and $34,469 for women, a difference of 6.7%. Men with an educational attainment of bachelor's degree enjoy the highest average annual earnings of $50,574, while those with high school diploma education earn the least with $27,411. Women with an educational attainment of bachelor's degree earn the most with the average annual earnings of $46,303, while those with high school diploma education have the smallest earnings of $22,435.
| Educational Attainment | Male Income | Female Income |
| Less than High School | $34,864 | $28,472 |
| High School Diploma | $27,411 | $22,435 |
| College or Associate's Degree | $37,124 | $32,692 |
| Bachelor's Degree | $50,574 | $46,303 |
| Graduate Degree | $46,901 | $43,000 |
| Total | $36,949 | $34,469 |
Family Income in Huntsville
Family Income Brackets in Huntsville
According to the Huntsville family income data, there are 1,553 families falling into the $50,000 to $74,999 income range, which is the most common income bracket and makes up 23.7% of all families. Conversely, the $200,000+ income bracket is the least frequent group with only 197 families (3.0%) belonging to this category.
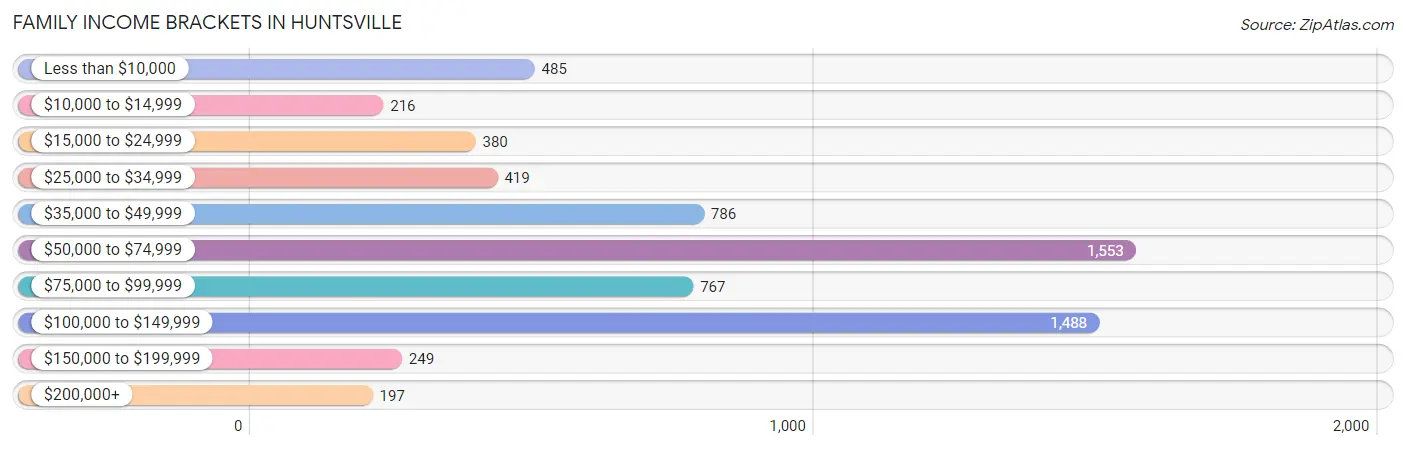
| Income Bracket | # Families | % Families |
| Less than $10,000 | 485 | 7.4% |
| $10,000 to $14,999 | 216 | 3.3% |
| $15,000 to $24,999 | 380 | 5.8% |
| $25,000 to $34,999 | 419 | 6.4% |
| $35,000 to $49,999 | 786 | 12.0% |
| $50,000 to $74,999 | 1,553 | 23.7% |
| $75,000 to $99,999 | 767 | 11.7% |
| $100,000 to $149,999 | 1,488 | 22.7% |
| $150,000 to $199,999 | 249 | 3.8% |
| $200,000+ | 197 | 3.0% |
Family Income by Famaliy Size in Huntsville
4-person families (1,299 | 19.8%) account for the highest median family income in Huntsville with $76,201 per family, while 2-person families (3,219 | 49.1%) have the highest median income of $32,049 per family member.
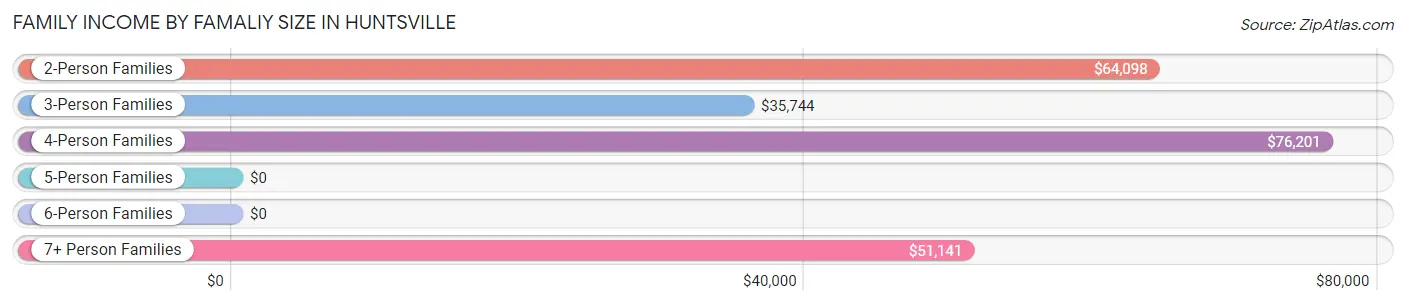
| Income Bracket | # Families | Median Income |
| 2-Person Families | 3,219 (49.1%) | $64,098 |
| 3-Person Families | 1,191 (18.2%) | $35,744 |
| 4-Person Families | 1,299 (19.8%) | $76,201 |
| 5-Person Families | 684 (10.4%) | $0 |
| 6-Person Families | 70 (1.1%) | $0 |
| 7+ Person Families | 90 (1.4%) | $51,141 |
| Total | 6,553 (100.0%) | $64,177 |
Family Income by Number of Earners in Huntsville
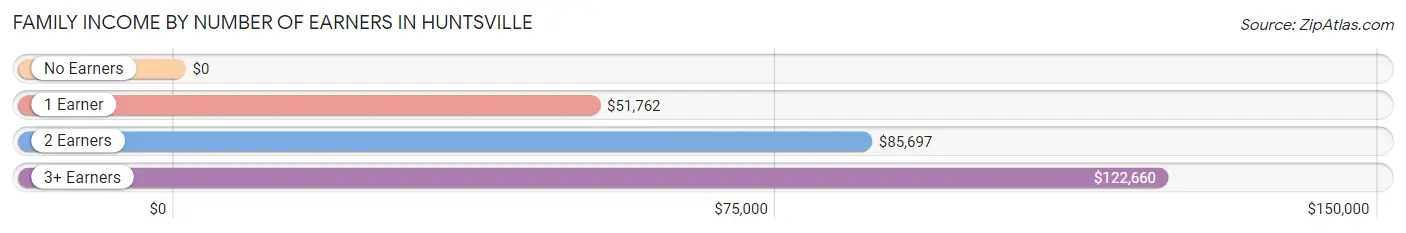
| Number of Earners | # Families | Median Income |
| No Earners | 1,143 (17.4%) | $0 |
| 1 Earner | 2,779 (42.4%) | $51,762 |
| 2 Earners | 2,432 (37.1%) | $85,697 |
| 3+ Earners | 199 (3.0%) | $122,660 |
| Total | 6,553 (100.0%) | $64,177 |
Household Income in Huntsville
Household Income Brackets in Huntsville
With 2,275 households falling in the category, the less than $10,000 income range is the most frequent in Huntsville, accounting for 15.5% of all households. In contrast, only 220 households (1.5%) fall into the $200,000+ income bracket, making it the least populous group.
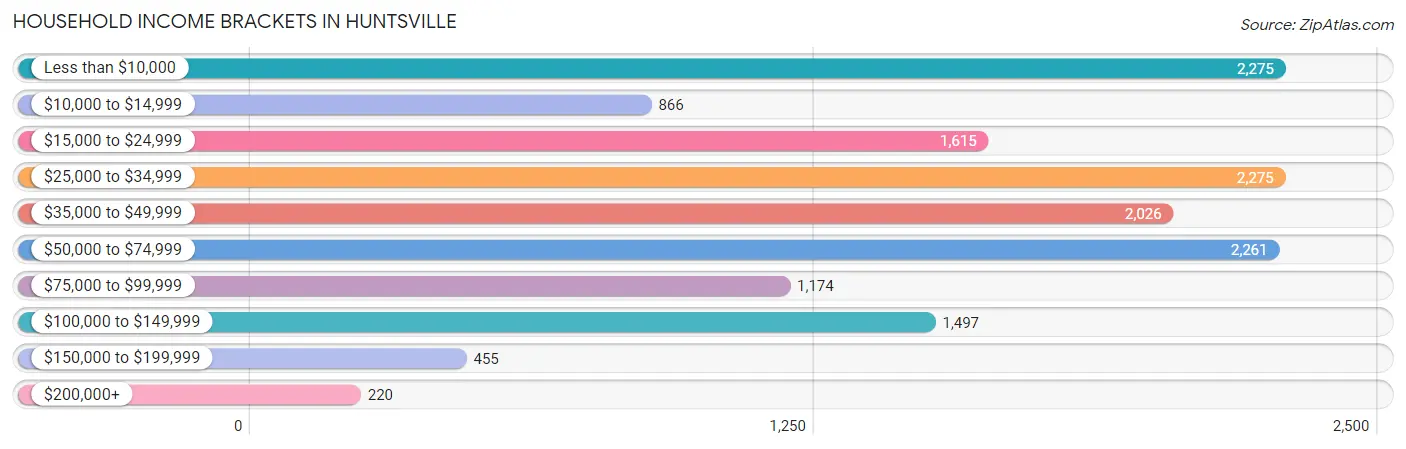
| Income Bracket | # Households | % Households |
| Less than $10,000 | 2,275 | 15.5% |
| $10,000 to $14,999 | 866 | 5.9% |
| $15,000 to $24,999 | 1,615 | 11.0% |
| $25,000 to $34,999 | 2,275 | 15.5% |
| $35,000 to $49,999 | 2,026 | 13.8% |
| $50,000 to $74,999 | 2,261 | 15.4% |
| $75,000 to $99,999 | 1,174 | 8.0% |
| $100,000 to $149,999 | 1,497 | 10.2% |
| $150,000 to $199,999 | 455 | 3.1% |
| $200,000+ | 220 | 1.5% |
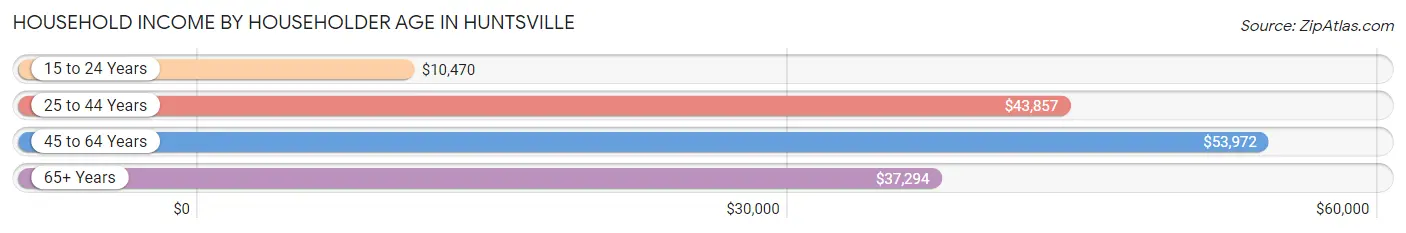
Household Income by Householder Age in Huntsville
The median household income in Huntsville is $37,419, with the highest median household income of $53,972 found in the 45 to 64 years age bracket for the primary householder. A total of 3,519 households (24.0%) fall into this category. Meanwhile, the 15 to 24 years age bracket for the primary householder has the lowest median household income of $10,470, with 3,397 households (23.1%) in this group.
| Income Bracket | # Households | Median Income |
| 15 to 24 Years | 3,397 (23.1%) | $10,470 |
| 25 to 44 Years | 4,305 (29.3%) | $43,857 |
| 45 to 64 Years | 3,519 (24.0%) | $53,972 |
| 65+ Years | 3,459 (23.6%) | $37,294 |
| Total | 14,680 (100.0%) | $37,419 |
Poverty in Huntsville
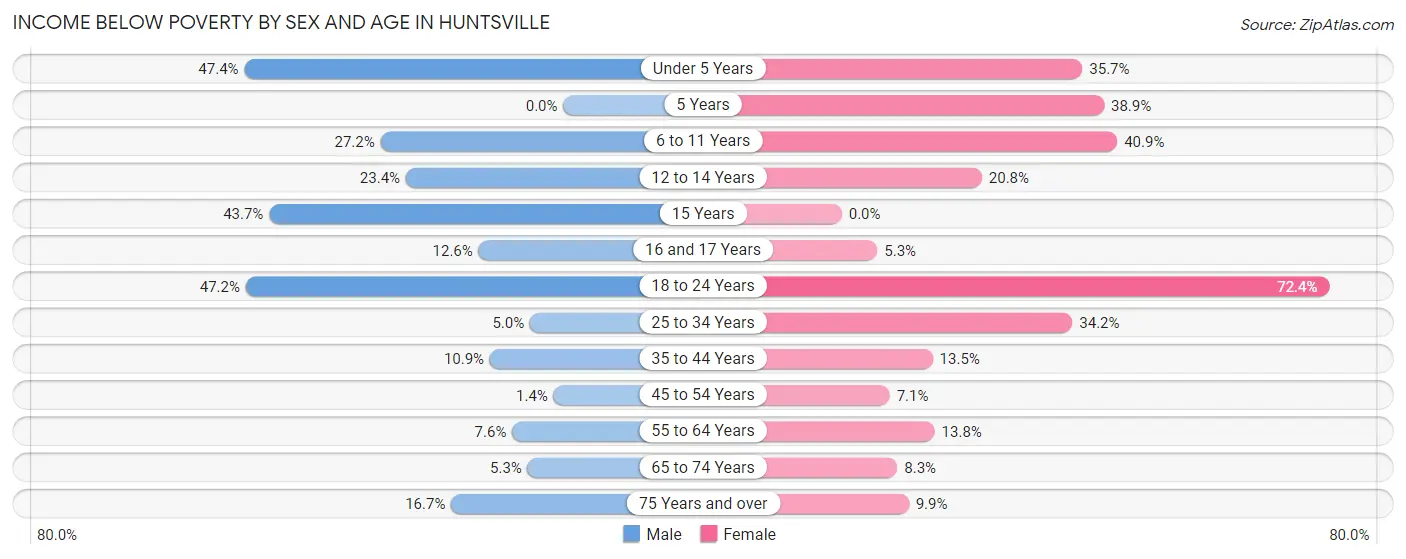
Income Below Poverty by Sex and Age in Huntsville
With 20.7% poverty level for males and 33.6% for females among the residents of Huntsville, under 5 year old males and 18 to 24 year old females are the most vulnerable to poverty, with 503 males (47.4%) and 3,296 females (72.4%) in their respective age groups living below the poverty level.
| Age Bracket | Male | Female |
| Under 5 Years | 503 (47.4%) | 264 (35.7%) |
| 5 Years | 0 (0.0%) | 44 (38.9%) |
| 6 to 11 Years | 256 (27.2%) | 380 (40.9%) |
| 12 to 14 Years | 108 (23.4%) | 83 (20.8%) |
| 15 Years | 83 (43.7%) | 0 (0.0%) |
| 16 and 17 Years | 40 (12.6%) | 14 (5.3%) |
| 18 to 24 Years | 1,941 (47.1%) | 3,296 (72.4%) |
| 25 to 34 Years | 153 (5.0%) | 866 (34.2%) |
| 35 to 44 Years | 217 (10.9%) | 234 (13.5%) |
| 45 to 54 Years | 26 (1.4%) | 98 (7.1%) |
| 55 to 64 Years | 92 (7.6%) | 269 (13.8%) |
| 65 to 74 Years | 70 (5.3%) | 114 (8.3%) |
| 75 Years and over | 136 (16.7%) | 115 (9.9%) |
| Total | 3,625 (20.7%) | 5,777 (33.6%) |
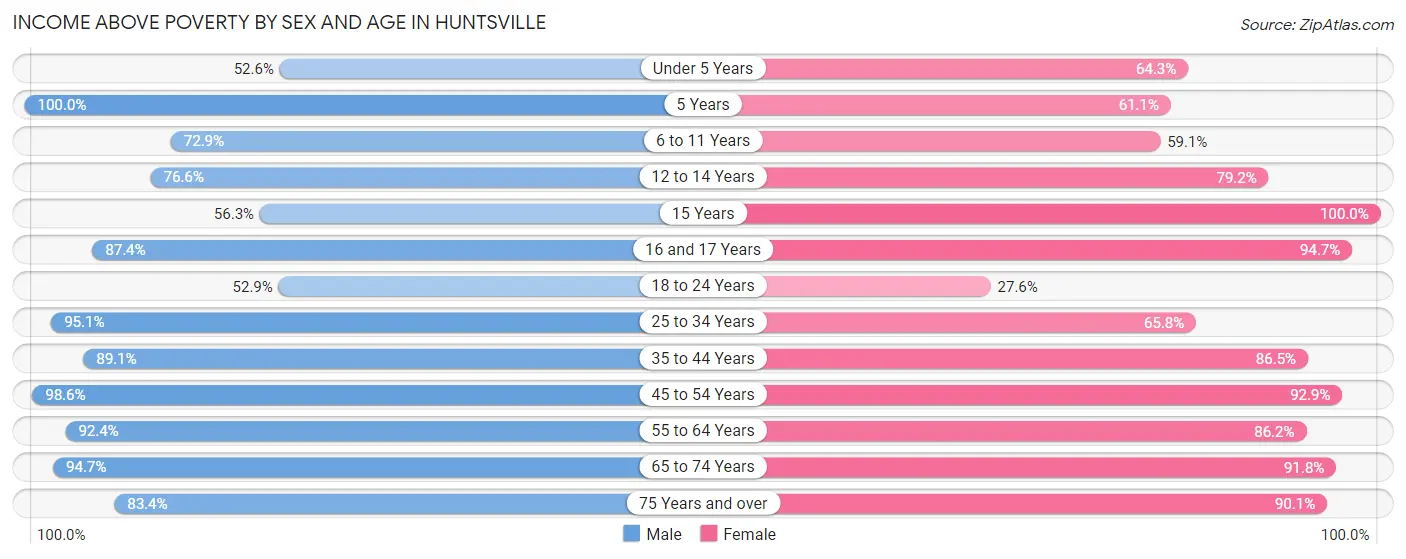
Income Above Poverty by Sex and Age in Huntsville
According to the poverty statistics in Huntsville, males aged 5 years and females aged 15 years are the age groups that are most secure financially, with 100.0% of males and 100.0% of females in these age groups living above the poverty line.
| Age Bracket | Male | Female |
| Under 5 Years | 559 (52.6%) | 475 (64.3%) |
| 5 Years | 158 (100.0%) | 69 (61.1%) |
| 6 to 11 Years | 687 (72.9%) | 549 (59.1%) |
| 12 to 14 Years | 354 (76.6%) | 316 (79.2%) |
| 15 Years | 107 (56.3%) | 85 (100.0%) |
| 16 and 17 Years | 278 (87.4%) | 251 (94.7%) |
| 18 to 24 Years | 2,176 (52.8%) | 1,258 (27.6%) |
| 25 to 34 Years | 2,940 (95.1%) | 1,663 (65.8%) |
| 35 to 44 Years | 1,773 (89.1%) | 1,500 (86.5%) |
| 45 to 54 Years | 1,787 (98.6%) | 1,279 (92.9%) |
| 55 to 64 Years | 1,120 (92.4%) | 1,681 (86.2%) |
| 65 to 74 Years | 1,250 (94.7%) | 1,267 (91.7%) |
| 75 Years and over | 681 (83.4%) | 1,042 (90.1%) |
| Total | 13,870 (79.3%) | 11,435 (66.4%) |
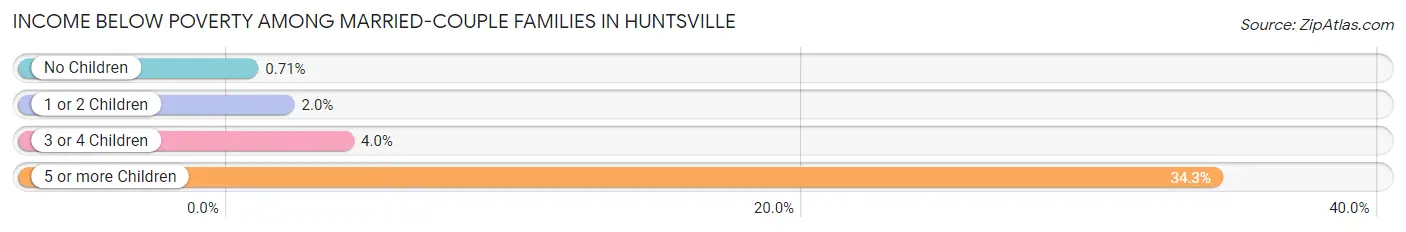
Income Below Poverty Among Married-Couple Families in Huntsville
The poverty statistics for married-couple families in Huntsville show that 2.0% or 79 of the total 3,891 families live below the poverty line. Families with 5 or more children have the highest poverty rate of 34.3%, comprising of 24 families. On the other hand, families with no children have the lowest poverty rate of 0.7%, which includes 15 families.
| Children | Above Poverty | Below Poverty |
| No Children | 2,110 (99.3%) | 15 (0.7%) |
| 1 or 2 Children | 1,347 (98.0%) | 27 (2.0%) |
| 3 or 4 Children | 309 (96.0%) | 13 (4.0%) |
| 5 or more Children | 46 (65.7%) | 24 (34.3%) |
| Total | 3,812 (98.0%) | 79 (2.0%) |
Income Below Poverty Among Single-Parent Households in Huntsville
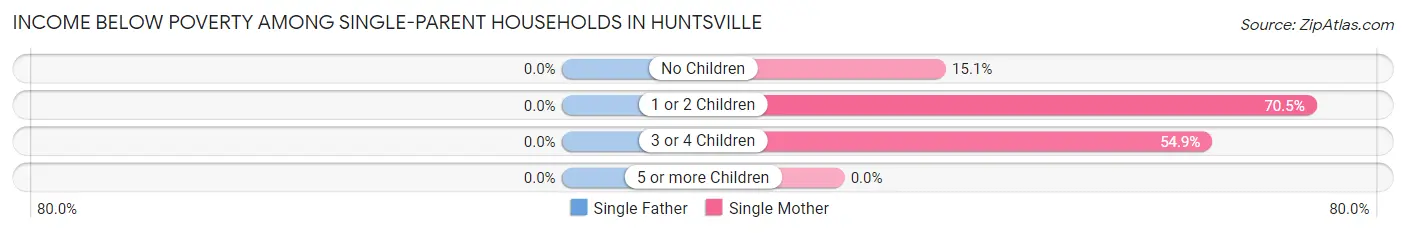
| Children | Single Father | Single Mother |
| No Children | 0 (0.0%) | 150 (15.1%) |
| 1 or 2 Children | 0 (0.0%) | 496 (70.5%) |
| 3 or 4 Children | 0 (0.0%) | 218 (54.9%) |
| 5 or more Children | 0 (0.0%) | 0 (0.0%) |
| Total | 0 (0.0%) | 864 (41.3%) |
Income Below Poverty Among Married-Couple vs Single-Parent Households in Huntsville
The poverty data for Huntsville shows that 79 of the married-couple family households (2.0%) and 864 of the single-parent households (32.5%) are living below the poverty level. Within the married-couple family households, those with 5 or more children have the highest poverty rate, with 24 households (34.3%) falling below the poverty line. Among the single-parent households, those with 1 or 2 children have the highest poverty rate, with 496 household (56.0%) living below poverty.
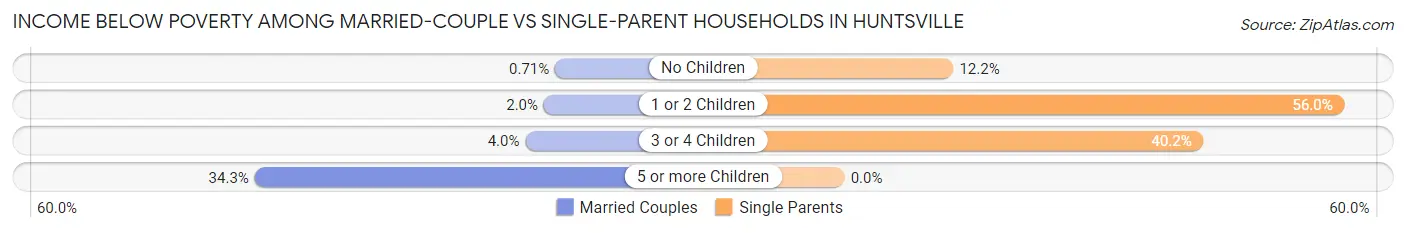
| Children | Married-Couple Families | Single-Parent Households |
| No Children | 15 (0.7%) | 150 (12.2%) |
| 1 or 2 Children | 27 (2.0%) | 496 (56.0%) |
| 3 or 4 Children | 13 (4.0%) | 218 (40.2%) |
| 5 or more Children | 24 (34.3%) | 0 (0.0%) |
| Total | 79 (2.0%) | 864 (32.5%) |
Race in Huntsville
The most populous races in Huntsville are White / Caucasian (27,643 | 59.8%), Black / African American (11,452 | 24.8%), and Hispanic or Latino (9,458 | 20.5%).
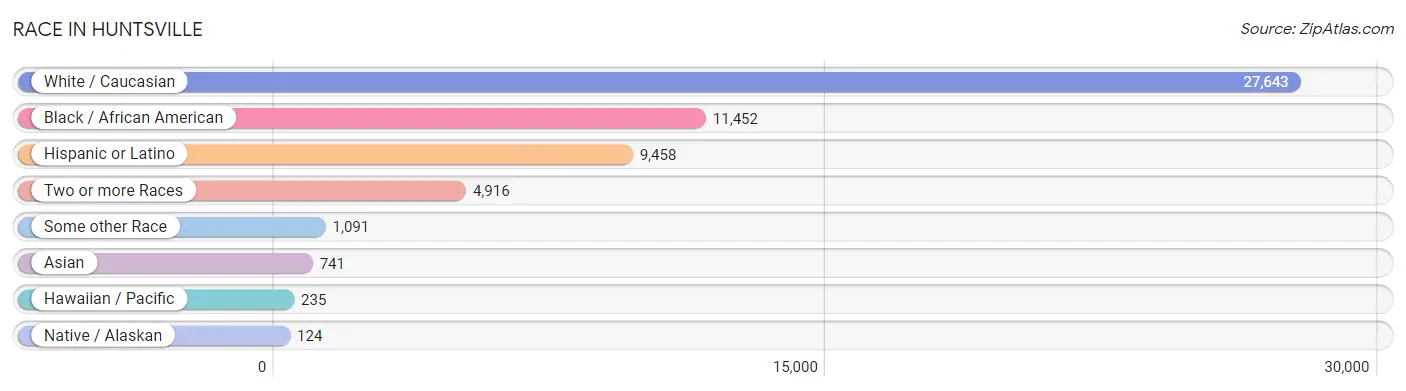
| Race | # Population | % Population |
| Asian | 741 | 1.6% |
| Black / African American | 11,452 | 24.8% |
| Hawaiian / Pacific | 235 | 0.5% |
| Hispanic or Latino | 9,458 | 20.5% |
| Native / Alaskan | 124 | 0.3% |
| White / Caucasian | 27,643 | 59.8% |
| Two or more Races | 4,916 | 10.6% |
| Some other Race | 1,091 | 2.4% |
| Total | 46,202 | 100.0% |
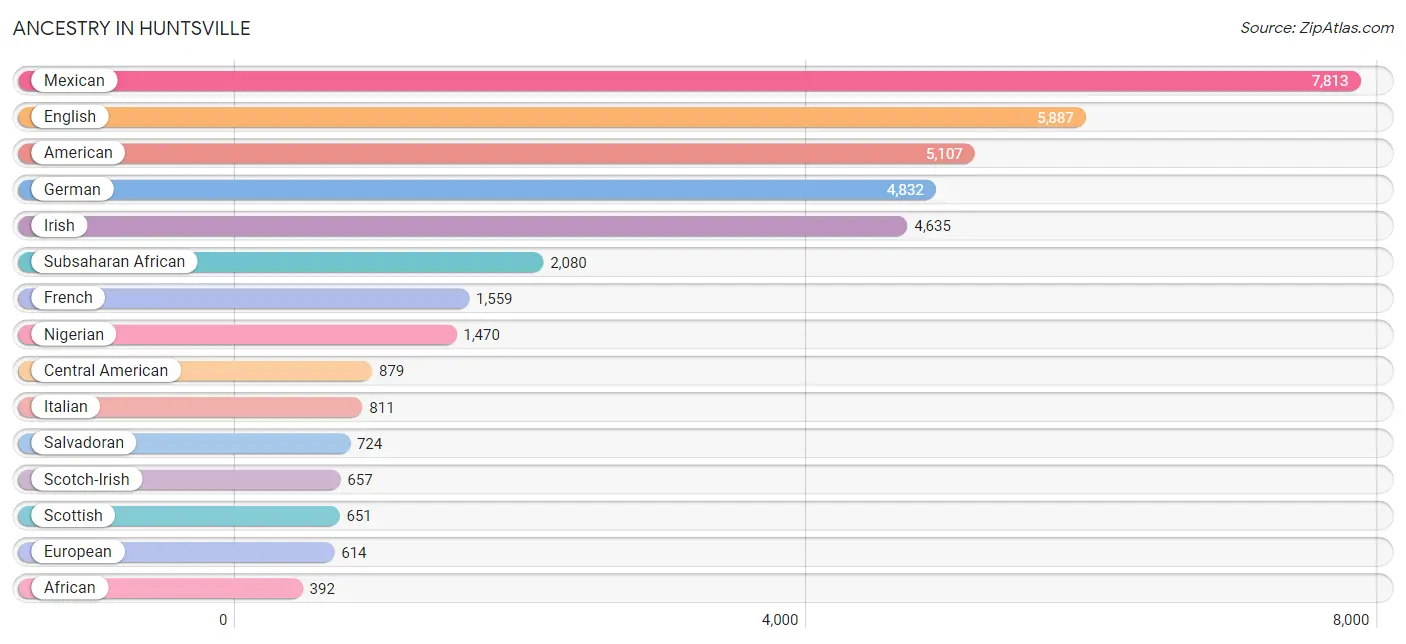
Ancestry in Huntsville
The most populous ancestries reported in Huntsville are Mexican (7,813 | 16.9%), English (5,887 | 12.7%), American (5,107 | 11.1%), German (4,832 | 10.5%), and Irish (4,635 | 10.0%), together accounting for 61.2% of all Huntsville residents.
| Ancestry | # Population | % Population |
| African | 392 | 0.9% |
| American | 5,107 | 11.1% |
| Apache | 14 | 0.0% |
| Arab | 41 | 0.1% |
| Argentinean | 22 | 0.1% |
| Belgian | 32 | 0.1% |
| Belizean | 20 | 0.0% |
| Bhutanese | 36 | 0.1% |
| Blackfeet | 16 | 0.0% |
| British | 118 | 0.3% |
| Burmese | 11 | 0.0% |
| Cajun | 14 | 0.0% |
| Cambodian | 23 | 0.1% |
| Canadian | 17 | 0.0% |
| Central American | 879 | 1.9% |
| Central American Indian | 17 | 0.0% |
| Cherokee | 276 | 0.6% |
| Choctaw | 40 | 0.1% |
| Colombian | 5 | 0.0% |
| Comanche | 3 | 0.0% |
| Cree | 8 | 0.0% |
| Cuban | 12 | 0.0% |
| Czech | 299 | 0.6% |
| Czechoslovakian | 9 | 0.0% |
| Danish | 57 | 0.1% |
| Dominican | 5 | 0.0% |
| Dutch | 83 | 0.2% |
| Eastern European | 26 | 0.1% |
| Ecuadorian | 53 | 0.1% |
| English | 5,887 | 12.7% |
| European | 614 | 1.3% |
| Finnish | 23 | 0.1% |
| French | 1,559 | 3.4% |
| French Canadian | 195 | 0.4% |
| German | 4,832 | 10.5% |
| Ghanaian | 22 | 0.1% |
| Greek | 79 | 0.2% |
| Guatemalan | 59 | 0.1% |
| Haitian | 45 | 0.1% |
| Honduran | 86 | 0.2% |
| Hungarian | 103 | 0.2% |
| Indian (Asian) | 174 | 0.4% |
| Irish | 4,635 | 10.0% |
| Italian | 811 | 1.8% |
| Jamaican | 7 | 0.0% |
| Japanese | 39 | 0.1% |
| Kenyan | 196 | 0.4% |
| Korean | 204 | 0.4% |
| Lebanese | 8 | 0.0% |
| Mexican | 7,813 | 16.9% |
| Mexican American Indian | 8 | 0.0% |
| Moroccan | 17 | 0.0% |
| Navajo | 33 | 0.1% |
| Nicaraguan | 10 | 0.0% |
| Nigerian | 1,470 | 3.2% |
| Northern European | 15 | 0.0% |
| Norwegian | 85 | 0.2% |
| Polish | 332 | 0.7% |
| Portuguese | 26 | 0.1% |
| Puerto Rican | 123 | 0.3% |
| Russian | 146 | 0.3% |
| Salvadoran | 724 | 1.6% |
| Samoan | 225 | 0.5% |
| Scandinavian | 79 | 0.2% |
| Scotch-Irish | 657 | 1.4% |
| Scottish | 651 | 1.4% |
| Serbian | 31 | 0.1% |
| Slovene | 19 | 0.0% |
| South American | 80 | 0.2% |
| South American Indian | 1 | 0.0% |
| Spaniard | 116 | 0.3% |
| Spanish | 62 | 0.1% |
| Sri Lankan | 163 | 0.4% |
| Subsaharan African | 2,080 | 4.5% |
| Swedish | 104 | 0.2% |
| Syrian | 16 | 0.0% |
| Thai | 118 | 0.3% |
| Tongan | 10 | 0.0% |
| Welsh | 264 | 0.6% | View All 79 Rows |
Immigrants in Huntsville
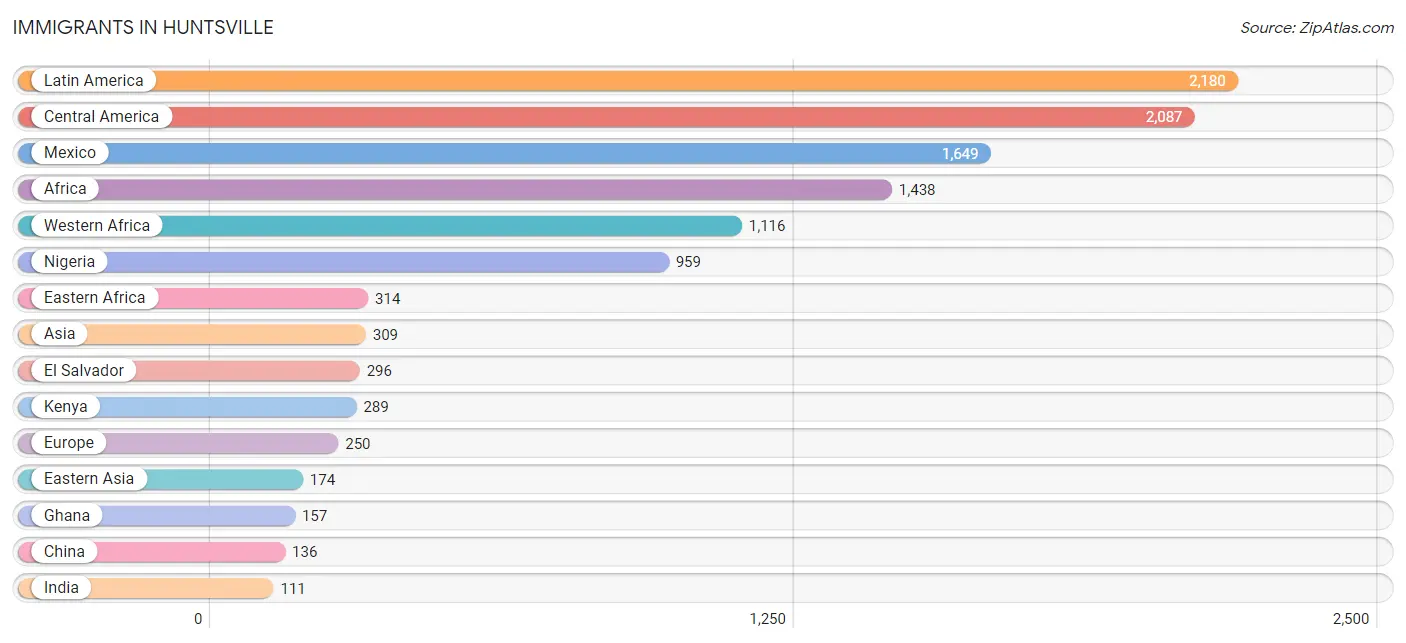
The most numerous immigrant groups reported in Huntsville came from Latin America (2,180 | 4.7%), Central America (2,087 | 4.5%), Mexico (1,649 | 3.6%), Africa (1,438 | 3.1%), and Western Africa (1,116 | 2.4%), together accounting for 18.3% of all Huntsville residents.
| Immigration Origin | # Population | % Population |
| Africa | 1,438 | 3.1% |
| Argentina | 20 | 0.0% |
| Asia | 309 | 0.7% |
| Belize | 20 | 0.0% |
| Cambodia | 20 | 0.0% |
| Canada | 13 | 0.0% |
| Caribbean | 62 | 0.1% |
| Central America | 2,087 | 4.5% |
| China | 136 | 0.3% |
| Colombia | 5 | 0.0% |
| Cuba | 8 | 0.0% |
| Dominican Republic | 5 | 0.0% |
| Eastern Africa | 314 | 0.7% |
| Eastern Asia | 174 | 0.4% |
| Eastern Europe | 82 | 0.2% |
| Ecuador | 6 | 0.0% |
| El Salvador | 296 | 0.6% |
| England | 10 | 0.0% |
| Europe | 250 | 0.5% |
| Germany | 51 | 0.1% |
| Ghana | 157 | 0.3% |
| Guatemala | 16 | 0.0% |
| Honduras | 24 | 0.1% |
| India | 111 | 0.2% |
| Ireland | 43 | 0.1% |
| Jamaica | 49 | 0.1% |
| Japan | 15 | 0.0% |
| Kenya | 289 | 0.6% |
| Latin America | 2,180 | 4.7% |
| Mexico | 1,649 | 3.6% |
| Morocco | 8 | 0.0% |
| Nicaragua | 82 | 0.2% |
| Nigeria | 959 | 2.1% |
| Northern Africa | 8 | 0.0% |
| Northern Europe | 87 | 0.2% |
| Oceania | 84 | 0.2% |
| Philippines | 4 | 0.0% |
| Russia | 66 | 0.1% |
| Serbia | 16 | 0.0% |
| South America | 31 | 0.1% |
| South Central Asia | 111 | 0.2% |
| South Eastern Asia | 24 | 0.1% |
| Southern Europe | 30 | 0.1% |
| Spain | 30 | 0.1% |
| Taiwan | 15 | 0.0% |
| Western Africa | 1,116 | 2.4% |
| Western Europe | 51 | 0.1% | View All 47 Rows |
Sex and Age in Huntsville
Sex and Age in Huntsville
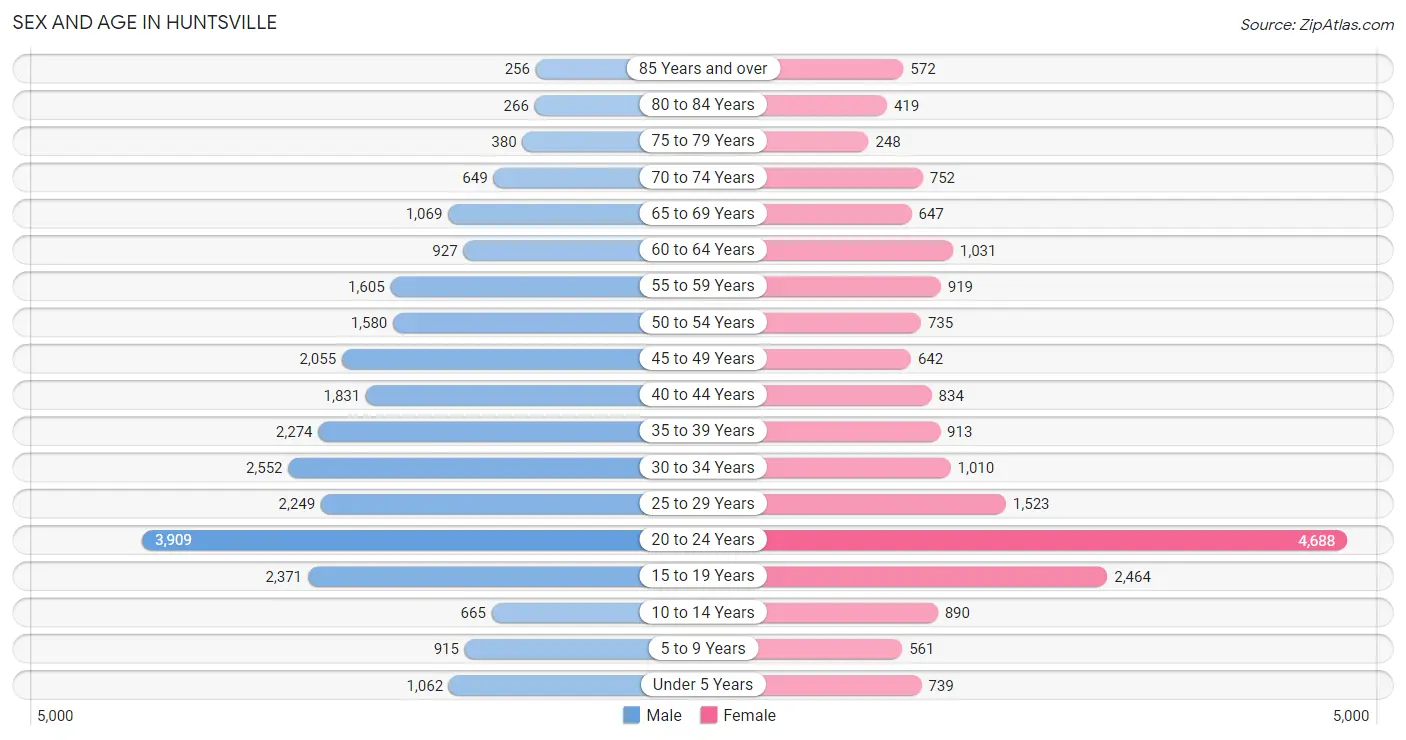
The most populous age groups in Huntsville are 20 to 24 Years (3,909 | 14.7%) for men and 20 to 24 Years (4,688 | 23.9%) for women.
| Age Bracket | Male | Female |
| Under 5 Years | 1,062 (4.0%) | 739 (3.8%) |
| 5 to 9 Years | 915 (3.4%) | 561 (2.9%) |
| 10 to 14 Years | 665 (2.5%) | 890 (4.5%) |
| 15 to 19 Years | 2,371 (8.9%) | 2,464 (12.6%) |
| 20 to 24 Years | 3,909 (14.7%) | 4,688 (23.9%) |
| 25 to 29 Years | 2,249 (8.5%) | 1,523 (7.8%) |
| 30 to 34 Years | 2,552 (9.6%) | 1,010 (5.2%) |
| 35 to 39 Years | 2,274 (8.5%) | 913 (4.7%) |
| 40 to 44 Years | 1,831 (6.9%) | 834 (4.3%) |
| 45 to 49 Years | 2,055 (7.7%) | 642 (3.3%) |
| 50 to 54 Years | 1,580 (5.9%) | 735 (3.7%) |
| 55 to 59 Years | 1,605 (6.0%) | 919 (4.7%) |
| 60 to 64 Years | 927 (3.5%) | 1,031 (5.3%) |
| 65 to 69 Years | 1,069 (4.0%) | 647 (3.3%) |
| 70 to 74 Years | 649 (2.4%) | 752 (3.8%) |
| 75 to 79 Years | 380 (1.4%) | 248 (1.3%) |
| 80 to 84 Years | 266 (1.0%) | 419 (2.1%) |
| 85 Years and over | 256 (1.0%) | 572 (2.9%) |
| Total | 26,615 (100.0%) | 19,587 (100.0%) |
Families and Households in Huntsville
Median Family Size in Huntsville
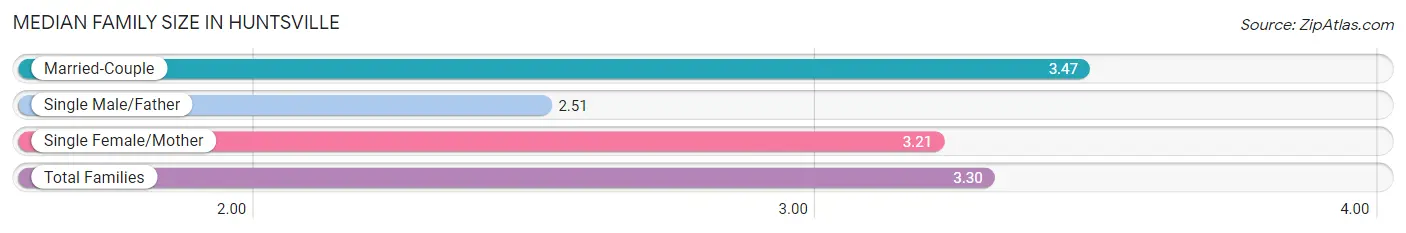
The median family size in Huntsville is 3.30 persons per family, with married-couple families (3,891 | 59.4%) accounting for the largest median family size of 3.47 persons per family. On the other hand, single male/father families (569 | 8.7%) represent the smallest median family size with 2.51 persons per family.
| Family Type | # Families | Family Size |
| Married-Couple | 3,891 (59.4%) | 3.47 |
| Single Male/Father | 569 (8.7%) | 2.51 |
| Single Female/Mother | 2,093 (31.9%) | 3.21 |
| Total Families | 6,553 (100.0%) | 3.30 |
Median Household Size in Huntsville
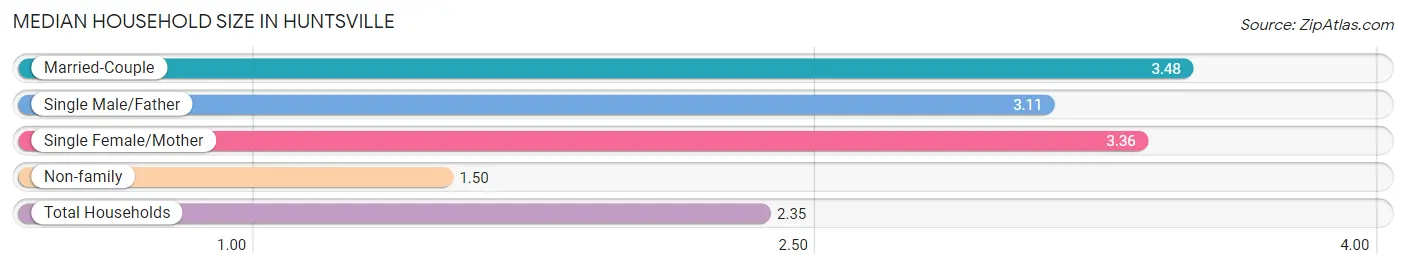
The median household size in Huntsville is 2.35 persons per household, with married-couple households (3,891 | 26.5%) accounting for the largest median household size of 3.48 persons per household. non-family households (8,127 | 55.4%) represent the smallest median household size with 1.50 persons per household.
| Household Type | # Households | Household Size |
| Married-Couple | 3,891 (26.5%) | 3.48 |
| Single Male/Father | 569 (3.9%) | 3.11 |
| Single Female/Mother | 2,093 (14.3%) | 3.36 |
| Non-family | 8,127 (55.4%) | 1.50 |
| Total Households | 14,680 (100.0%) | 2.35 |
Household Size by Marriage Status in Huntsville
Out of a total of 14,680 households in Huntsville, 6,553 (44.6%) are family households, while 8,127 (55.4%) are nonfamily households. The most numerous type of family households are 2-person households, comprising 3,126, and the most common type of nonfamily households are 1-person households, comprising 6,056.
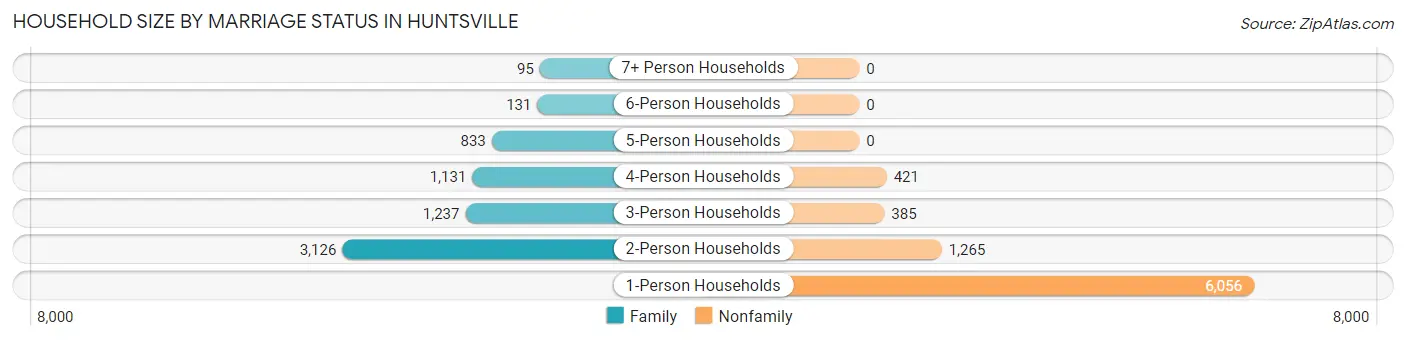
| Household Size | Family Households | Nonfamily Households |
| 1-Person Households | - | 6,056 (41.2%) |
| 2-Person Households | 3,126 (21.3%) | 1,265 (8.6%) |
| 3-Person Households | 1,237 (8.4%) | 385 (2.6%) |
| 4-Person Households | 1,131 (7.7%) | 421 (2.9%) |
| 5-Person Households | 833 (5.7%) | 0 (0.0%) |
| 6-Person Households | 131 (0.9%) | 0 (0.0%) |
| 7+ Person Households | 95 (0.6%) | 0 (0.0%) |
| Total | 6,553 (44.6%) | 8,127 (55.4%) |
Female Fertility in Huntsville
Fertility by Age in Huntsville
Average fertility rate in Huntsville is 48.0 births per 1,000 women. Women in the age bracket of 20 to 34 years have the highest fertility rate with 65.0 births per 1,000 women. Women in the age bracket of 20 to 34 years acount for 79.0% of all women with births.
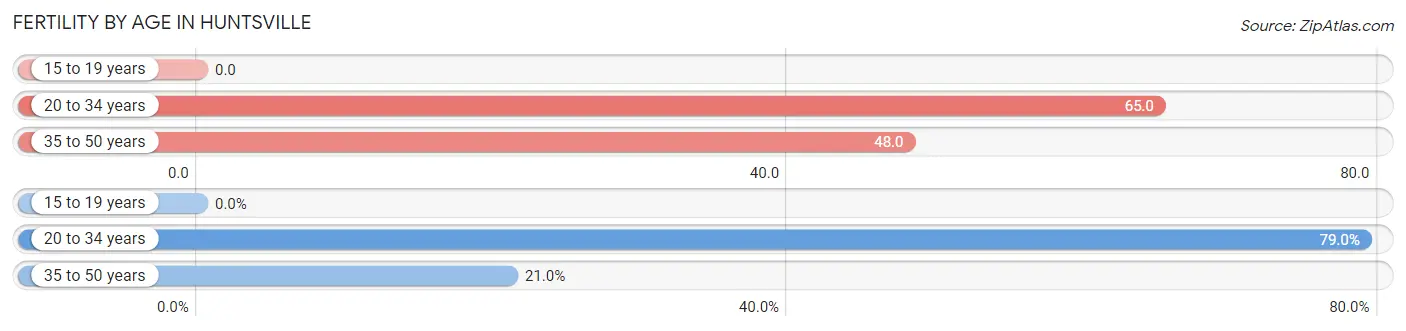
| Age Bracket | Women with Births | Births / 1,000 Women |
| 15 to 19 years | 0 (0.0%) | 0.0 |
| 20 to 34 years | 469 (79.0%) | 65.0 |
| 35 to 50 years | 125 (21.0%) | 48.0 |
| Total | 594 (100.0%) | 48.0 |
Fertility by Age by Marriage Status in Huntsville
65.7% of women with births (594) in Huntsville are married. The highest percentage of unmarried women with births falls into 20 to 34 years age bracket with 37.5% of them unmarried at the time of birth, while the lowest percentage of unmarried women with births belong to 35 to 50 years age bracket with 22.4% of them unmarried.
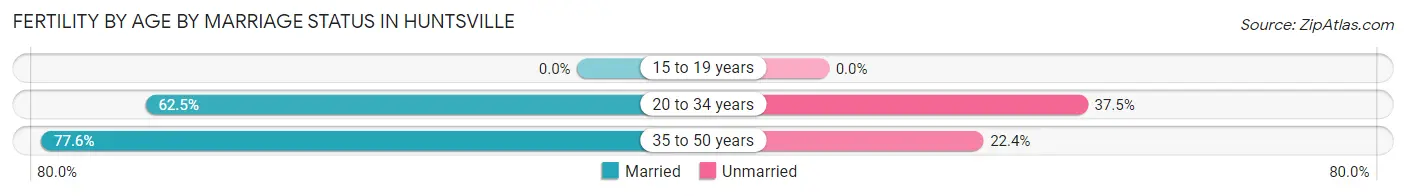
| Age Bracket | Married | Unmarried |
| 15 to 19 years | 0 (0.0%) | 0 (0.0%) |
| 20 to 34 years | 293 (62.5%) | 176 (37.5%) |
| 35 to 50 years | 97 (77.6%) | 28 (22.4%) |
| Total | 390 (65.7%) | 204 (34.3%) |
Fertility by Education in Huntsville
Average fertility rate in Huntsville is 48.0 births per 1,000 women. Women with the education attainment of graduate degree have the highest fertility rate of 150.0 births per 1,000 women, while women with the education attainment of bachelor's degree have the lowest fertility at 28.0 births per 1,000 women. Women with the education attainment of college or associate's degree represent 52.5% of all women with births.
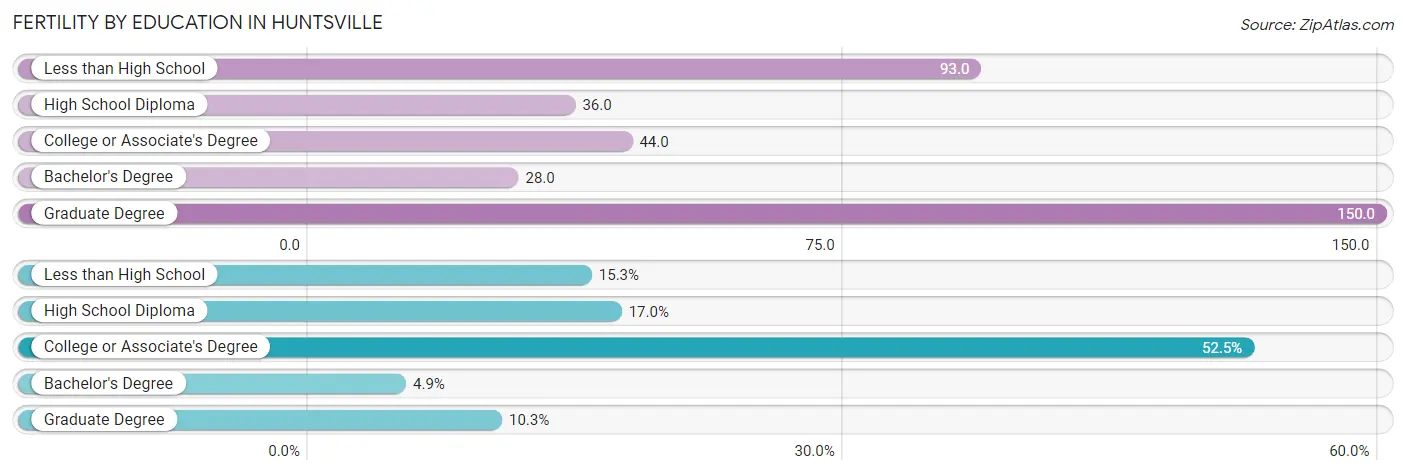
| Educational Attainment | Women with Births | Births / 1,000 Women |
| Less than High School | 91 (15.3%) | 93.0 |
| High School Diploma | 101 (17.0%) | 36.0 |
| College or Associate's Degree | 312 (52.5%) | 44.0 |
| Bachelor's Degree | 29 (4.9%) | 28.0 |
| Graduate Degree | 61 (10.3%) | 150.0 |
| Total | 594 (100.0%) | 48.0 |
Fertility by Education by Marriage Status in Huntsville
34.3% of women with births in Huntsville are unmarried. Women with the educational attainment of bachelor's degree are most likely to be married with 100.0% of them married at childbirth, while women with the educational attainment of high school diploma are least likely to be married with 100.0% of them unmarried at childbirth.
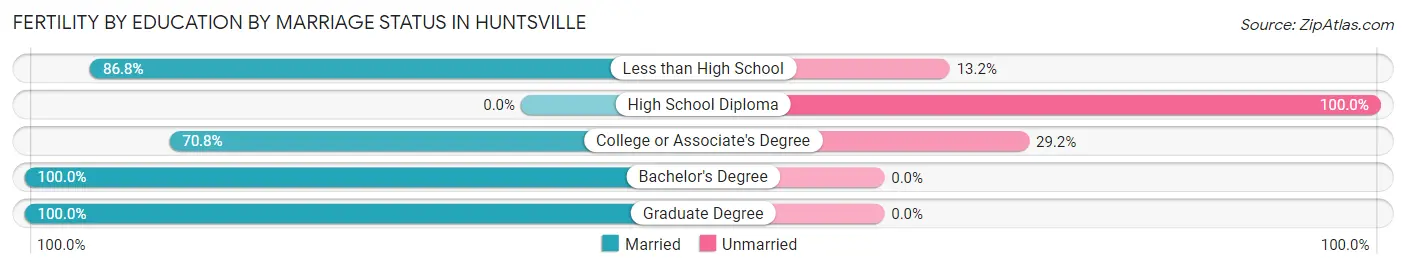
| Educational Attainment | Married | Unmarried |
| Less than High School | 79 (86.8%) | 12 (13.2%) |
| High School Diploma | 0 (0.0%) | 101 (100.0%) |
| College or Associate's Degree | 221 (70.8%) | 91 (29.2%) |
| Bachelor's Degree | 29 (100.0%) | 0 (0.0%) |
| Graduate Degree | 61 (100.0%) | 0 (0.0%) |
| Total | 390 (65.7%) | 204 (34.3%) |
Employment Characteristics in Huntsville
Employment by Class of Employer in Huntsville
Among the 16,842 employed individuals in Huntsville, private company employees (9,335 | 55.4%), state government employees (4,952 | 29.4%), and not-for-profit organizations (740 | 4.4%) make up the most common classes of employment.
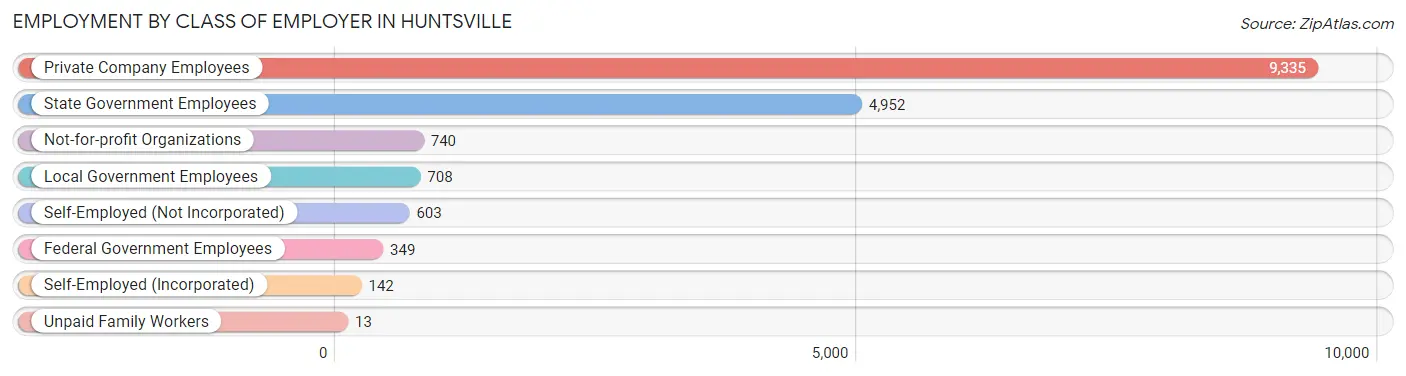
| Employer Class | # Employees | % Employees |
| Private Company Employees | 9,335 | 55.4% |
| Self-Employed (Incorporated) | 142 | 0.8% |
| Self-Employed (Not Incorporated) | 603 | 3.6% |
| Not-for-profit Organizations | 740 | 4.4% |
| Local Government Employees | 708 | 4.2% |
| State Government Employees | 4,952 | 29.4% |
| Federal Government Employees | 349 | 2.1% |
| Unpaid Family Workers | 13 | 0.1% |
| Total | 16,842 | 100.0% |
Employment Status by Age in Huntsville
According to the labor force statistics for Huntsville, out of the total population over 16 years of age (41,095), 46.6% or 19,150 individuals are in the labor force, with 8.9% or 1,704 of them unemployed. The age group with the highest labor force participation rate is 25 to 29 years, with 69.3% or 2,614 individuals in the labor force. Within the labor force, the 30 to 34 years age range has the highest percentage of unemployed individuals, with 27.8% or 511 of them being unemployed.
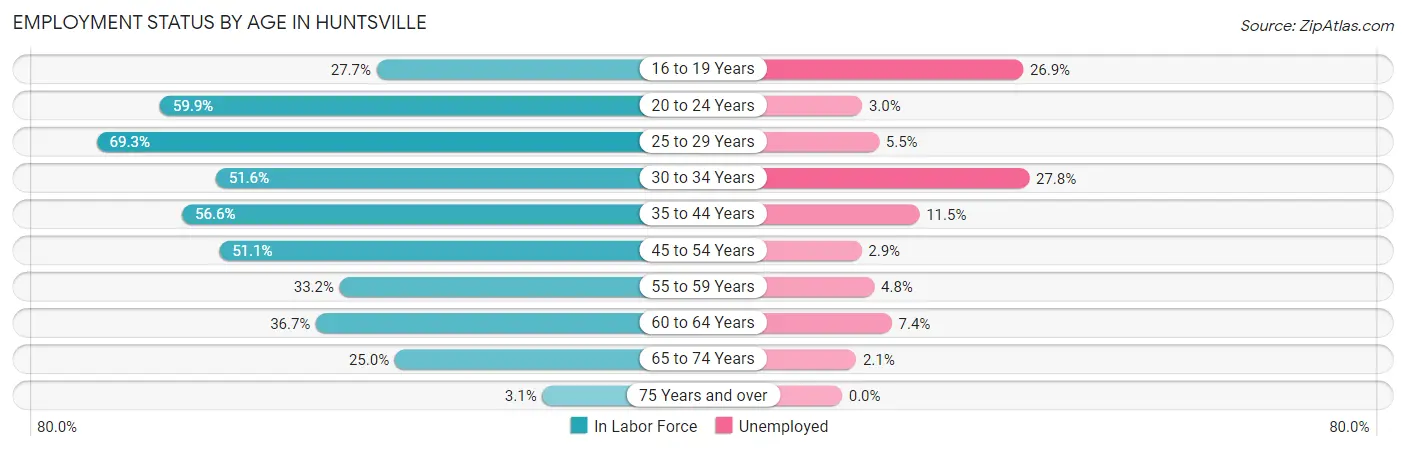
| Age Bracket | In Labor Force | Unemployed |
| 16 to 19 Years | 1,263 (27.7%) | 340 (26.9%) |
| 20 to 24 Years | 5,150 (59.9%) | 154 (3.0%) |
| 25 to 29 Years | 2,614 (69.3%) | 144 (5.5%) |
| 30 to 34 Years | 1,838 (51.6%) | 511 (27.8%) |
| 35 to 44 Years | 3,312 (56.6%) | 381 (11.5%) |
| 45 to 54 Years | 2,561 (51.1%) | 74 (2.9%) |
| 55 to 59 Years | 838 (33.2%) | 40 (4.8%) |
| 60 to 64 Years | 719 (36.7%) | 53 (7.4%) |
| 65 to 74 Years | 779 (25.0%) | 16 (2.1%) |
| 75 Years and over | 66 (3.1%) | 0 (0.0%) |
| Total | 19,150 (46.6%) | 1,704 (8.9%) |
Employment Status by Educational Attainment in Huntsville
According to labor force statistics for Huntsville, 52.4% of individuals (11,884) out of the total population between 25 and 64 years of age (22,680) are in the labor force, with 10.1% or 1,200 of them being unemployed. The group with the highest labor force participation rate are those with the educational attainment of bachelor's degree or higher, with 89.7% or 3,574 individuals in the labor force. Within the labor force, individuals with high school diploma education have the highest percentage of unemployment, with 27.4% or 991 of them being unemployed.
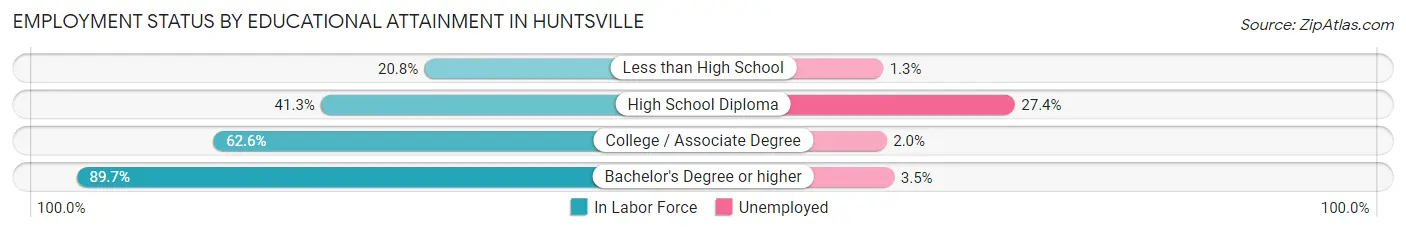
| Educational Attainment | In Labor Force | Unemployed |
| Less than High School | 760 (20.8%) | 47 (1.3%) |
| High School Diploma | 3,617 (41.3%) | 2,400 (27.4%) |
| College / Associate Degree | 3,934 (62.6%) | 126 (2.0%) |
| Bachelor's Degree or higher | 3,574 (89.7%) | 139 (3.5%) |
| Total | 11,884 (52.4%) | 2,291 (10.1%) |
Employment Occupations by Sex in Huntsville
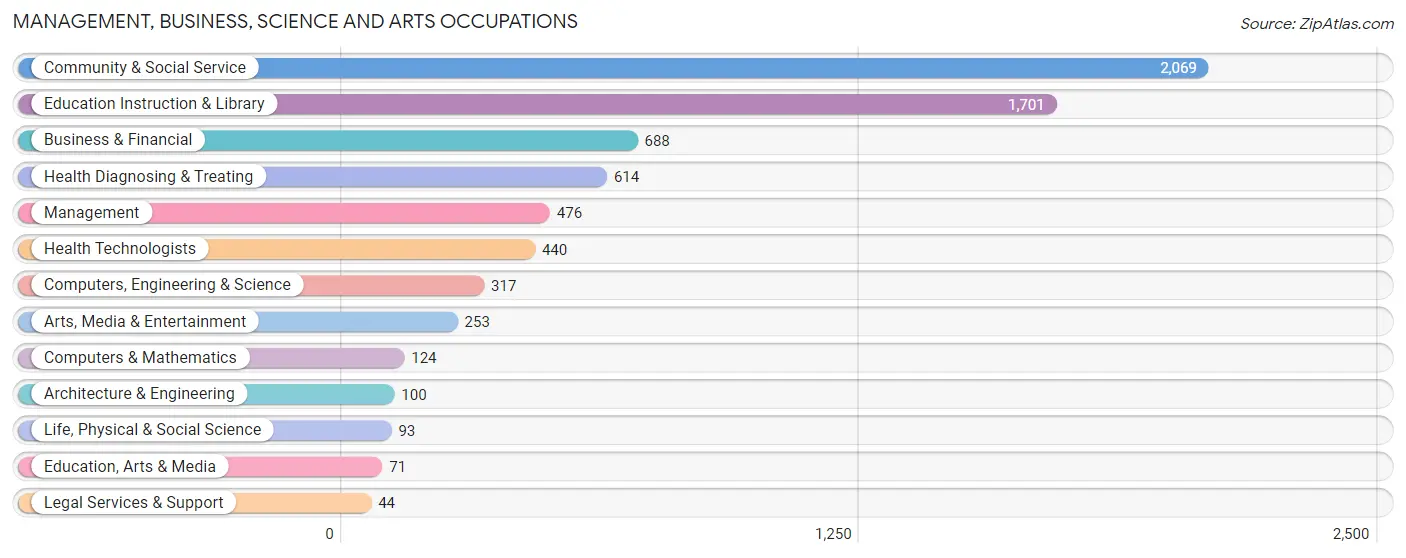
Management, Business, Science and Arts Occupations
The most common Management, Business, Science and Arts occupations in Huntsville are Community & Social Service (2,069 | 11.9%), Education Instruction & Library (1,701 | 9.8%), Business & Financial (688 | 4.0%), Health Diagnosing & Treating (614 | 3.5%), and Management (476 | 2.7%).
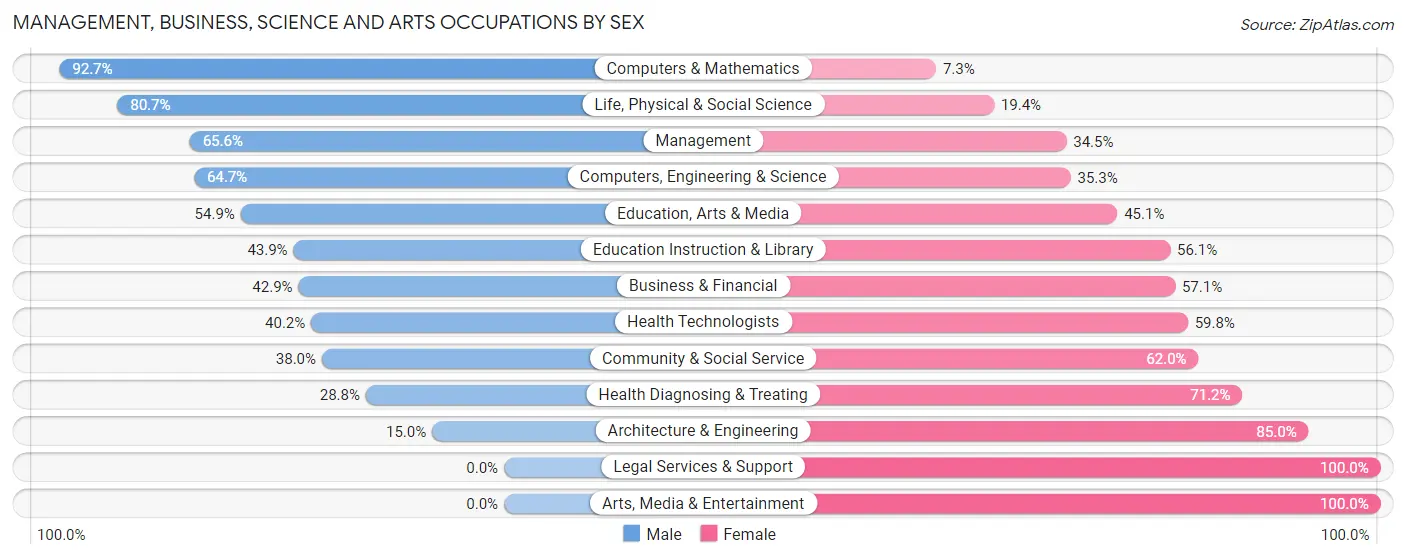
Management, Business, Science and Arts Occupations by Sex
Within the Management, Business, Science and Arts occupations in Huntsville, the most male-oriented occupations are Computers & Mathematics (92.7%), Life, Physical & Social Science (80.6%), and Management (65.5%), while the most female-oriented occupations are Legal Services & Support (100.0%), Arts, Media & Entertainment (100.0%), and Architecture & Engineering (85.0%).
| Occupation | Male | Female |
| Management | 312 (65.5%) | 164 (34.4%) |
| Business & Financial | 295 (42.9%) | 393 (57.1%) |
| Computers, Engineering & Science | 205 (64.7%) | 112 (35.3%) |
| Computers & Mathematics | 115 (92.7%) | 9 (7.3%) |
| Architecture & Engineering | 15 (15.0%) | 85 (85.0%) |
| Life, Physical & Social Science | 75 (80.6%) | 18 (19.4%) |
| Community & Social Service | 786 (38.0%) | 1,283 (62.0%) |
| Education, Arts & Media | 39 (54.9%) | 32 (45.1%) |
| Legal Services & Support | 0 (0.0%) | 44 (100.0%) |
| Education Instruction & Library | 747 (43.9%) | 954 (56.1%) |
| Arts, Media & Entertainment | 0 (0.0%) | 253 (100.0%) |
| Health Diagnosing & Treating | 177 (28.8%) | 437 (71.2%) |
| Health Technologists | 177 (40.2%) | 263 (59.8%) |
| Total (Category) | 1,775 (42.6%) | 2,389 (57.4%) |
| Total (Overall) | 9,357 (53.7%) | 8,073 (46.3%) |
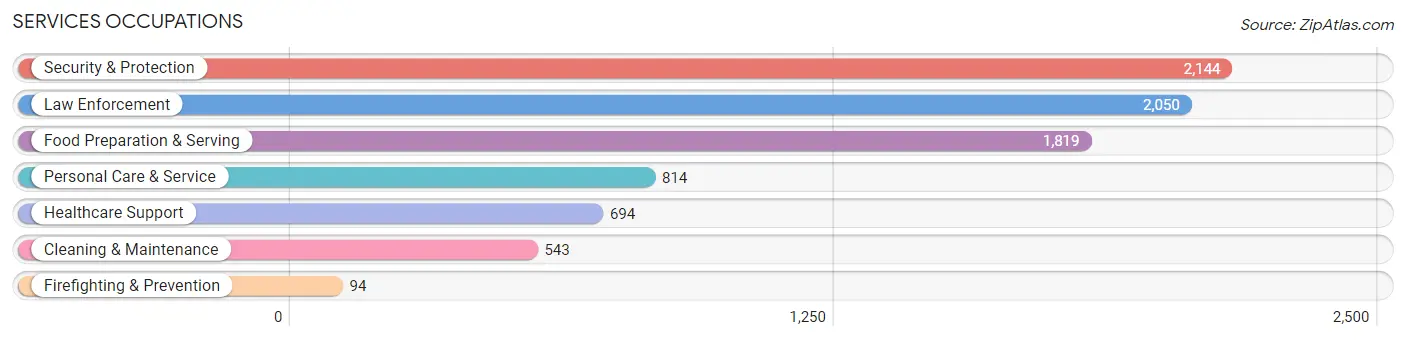
Services Occupations
The most common Services occupations in Huntsville are Security & Protection (2,144 | 12.3%), Law Enforcement (2,050 | 11.8%), Food Preparation & Serving (1,819 | 10.4%), Personal Care & Service (814 | 4.7%), and Healthcare Support (694 | 4.0%).
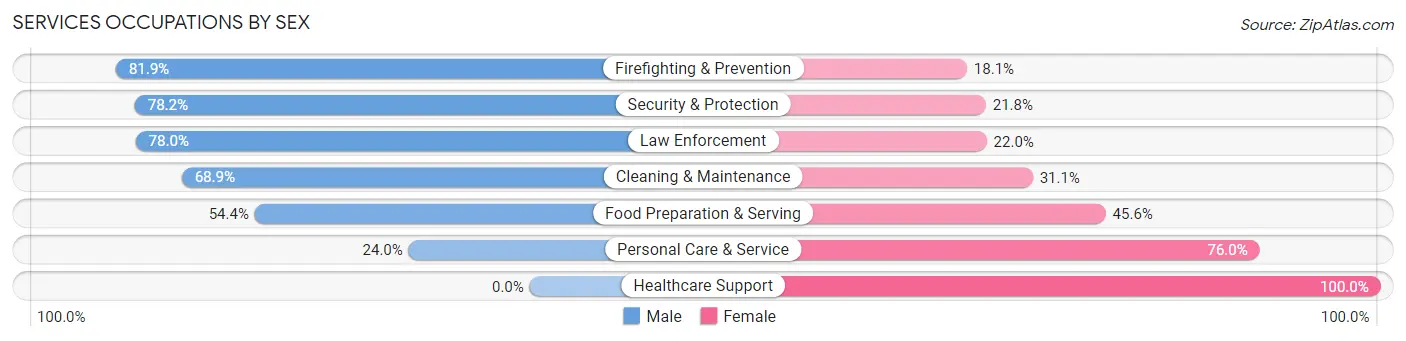
Services Occupations by Sex
Within the Services occupations in Huntsville, the most male-oriented occupations are Firefighting & Prevention (81.9%), Security & Protection (78.2%), and Law Enforcement (78.0%), while the most female-oriented occupations are Healthcare Support (100.0%), Personal Care & Service (76.0%), and Food Preparation & Serving (45.6%).
| Occupation | Male | Female |
| Healthcare Support | 0 (0.0%) | 694 (100.0%) |
| Security & Protection | 1,676 (78.2%) | 468 (21.8%) |
| Firefighting & Prevention | 77 (81.9%) | 17 (18.1%) |
| Law Enforcement | 1,599 (78.0%) | 451 (22.0%) |
| Food Preparation & Serving | 990 (54.4%) | 829 (45.6%) |
| Cleaning & Maintenance | 374 (68.9%) | 169 (31.1%) |
| Personal Care & Service | 195 (24.0%) | 619 (76.0%) |
| Total (Category) | 3,235 (53.8%) | 2,779 (46.2%) |
| Total (Overall) | 9,357 (53.7%) | 8,073 (46.3%) |
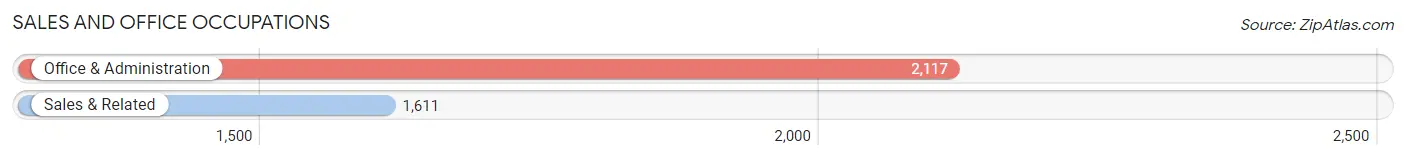
Sales and Office Occupations
The most common Sales and Office occupations in Huntsville are Office & Administration (2,117 | 12.1%), and Sales & Related (1,611 | 9.2%).
Sales and Office Occupations by Sex
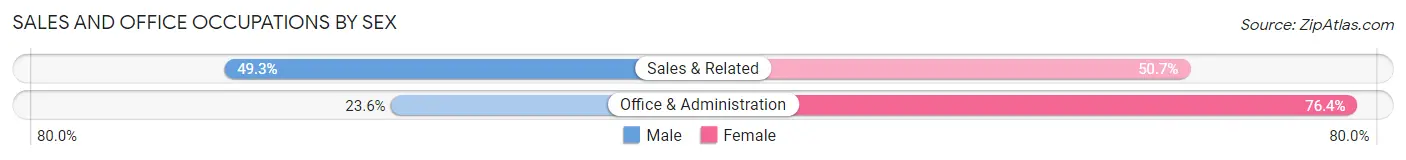
| Occupation | Male | Female |
| Sales & Related | 794 (49.3%) | 817 (50.7%) |
| Office & Administration | 499 (23.6%) | 1,618 (76.4%) |
| Total (Category) | 1,293 (34.7%) | 2,435 (65.3%) |
| Total (Overall) | 9,357 (53.7%) | 8,073 (46.3%) |
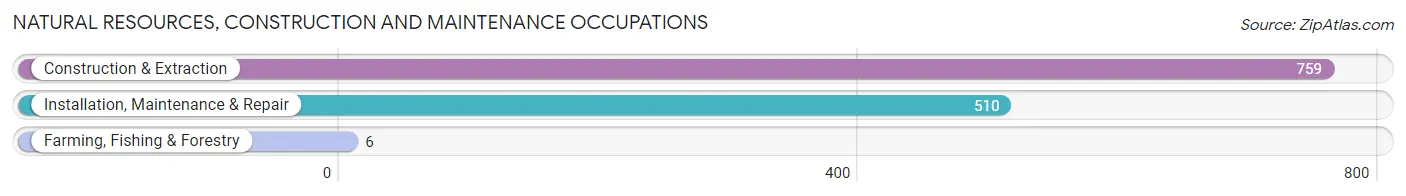
Natural Resources, Construction and Maintenance Occupations
The most common Natural Resources, Construction and Maintenance occupations in Huntsville are Construction & Extraction (759 | 4.3%), Installation, Maintenance & Repair (510 | 2.9%), and Farming, Fishing & Forestry (6 | 0.0%).
Natural Resources, Construction and Maintenance Occupations by Sex
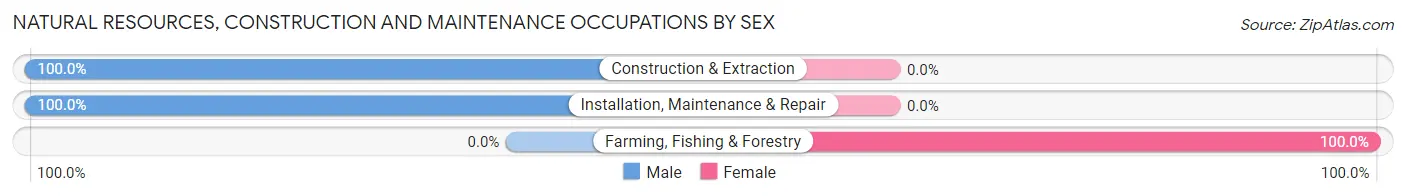
| Occupation | Male | Female |
| Farming, Fishing & Forestry | 0 (0.0%) | 6 (100.0%) |
| Construction & Extraction | 759 (100.0%) | 0 (0.0%) |
| Installation, Maintenance & Repair | 510 (100.0%) | 0 (0.0%) |
| Total (Category) | 1,269 (99.5%) | 6 (0.5%) |
| Total (Overall) | 9,357 (53.7%) | 8,073 (46.3%) |
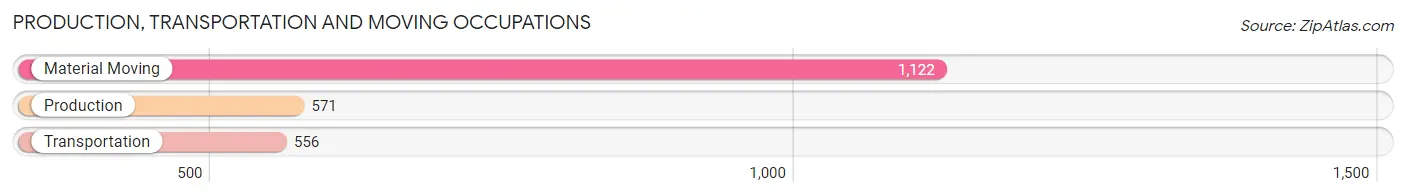
Production, Transportation and Moving Occupations
The most common Production, Transportation and Moving occupations in Huntsville are Material Moving (1,122 | 6.4%), Production (571 | 3.3%), and Transportation (556 | 3.2%).
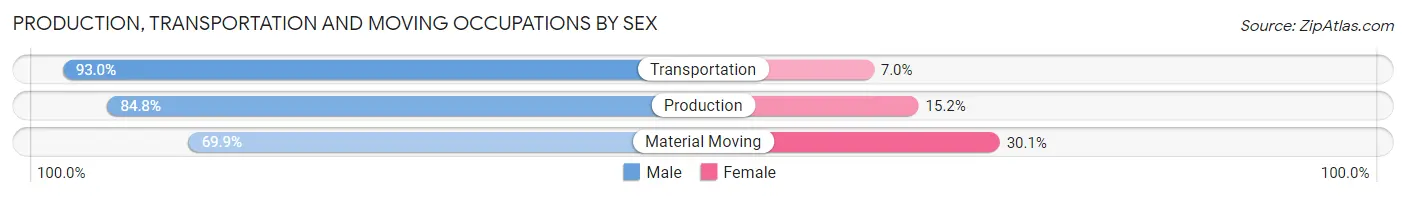
Production, Transportation and Moving Occupations by Sex
| Occupation | Male | Female |
| Production | 484 (84.8%) | 87 (15.2%) |
| Transportation | 517 (93.0%) | 39 (7.0%) |
| Material Moving | 784 (69.9%) | 338 (30.1%) |
| Total (Category) | 1,785 (79.4%) | 464 (20.6%) |
| Total (Overall) | 9,357 (53.7%) | 8,073 (46.3%) |
Employment Industries by Sex in Huntsville
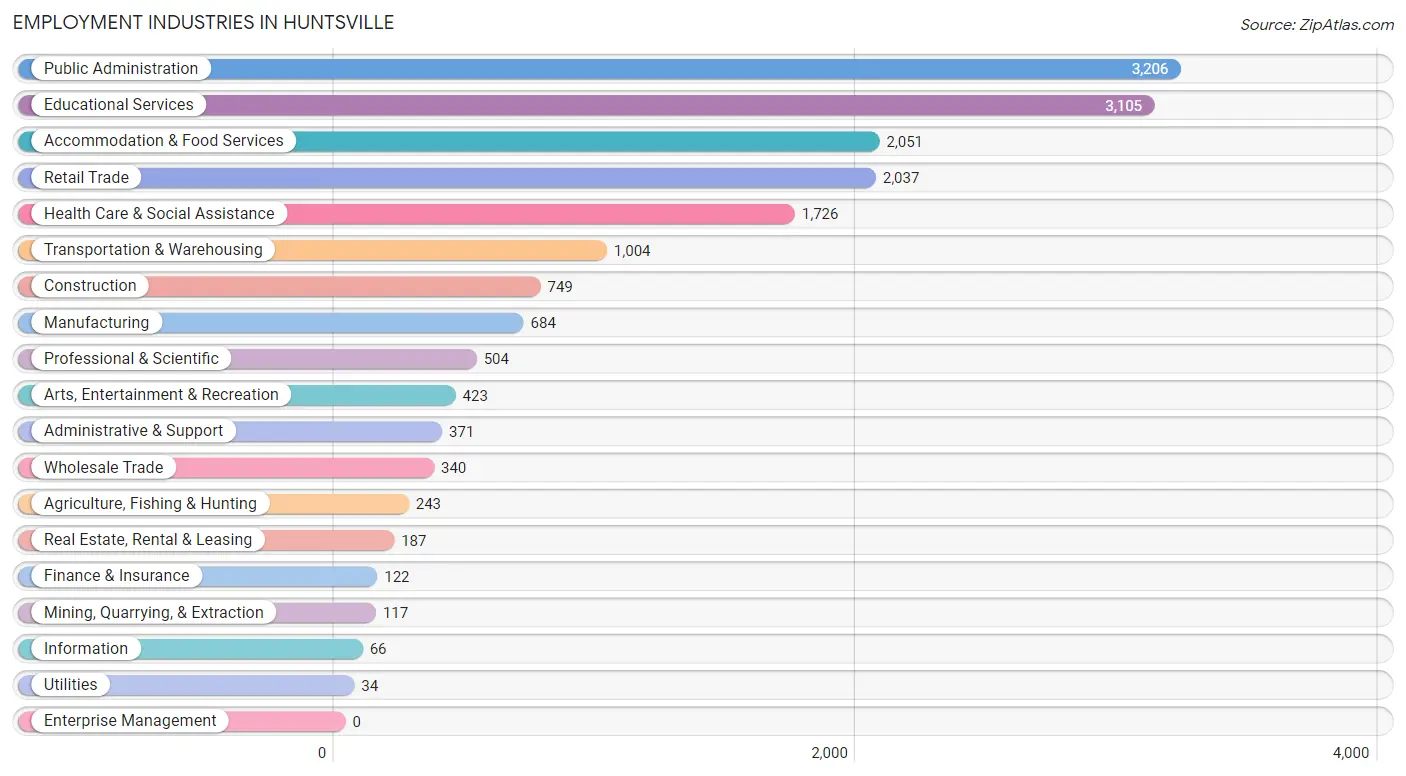
Employment Industries in Huntsville
The major employment industries in Huntsville include Public Administration (3,206 | 18.4%), Educational Services (3,105 | 17.8%), Accommodation & Food Services (2,051 | 11.8%), Retail Trade (2,037 | 11.7%), and Health Care & Social Assistance (1,726 | 9.9%).
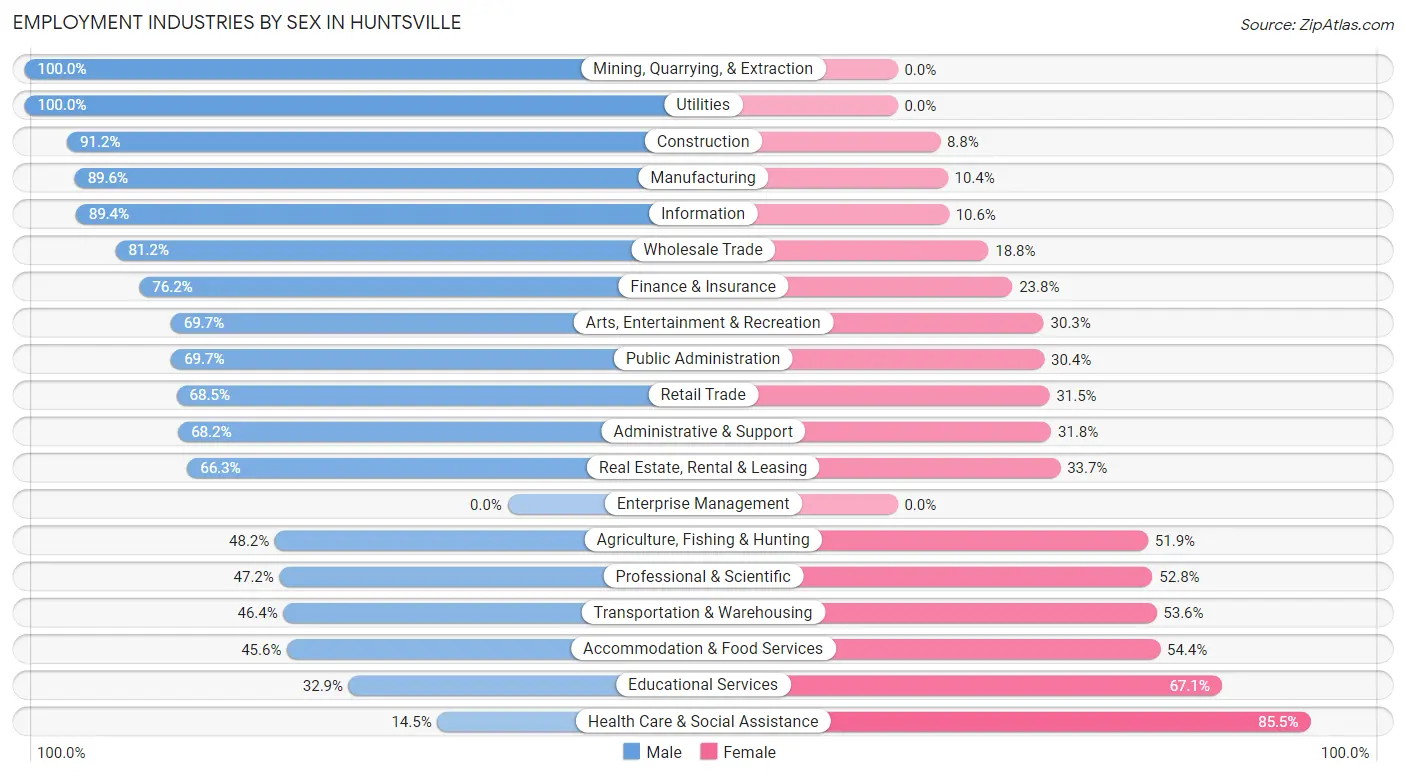
Employment Industries by Sex in Huntsville
The Huntsville industries that see more men than women are Mining, Quarrying, & Extraction (100.0%), Utilities (100.0%), and Construction (91.2%), whereas the industries that tend to have a higher number of women are Health Care & Social Assistance (85.5%), Educational Services (67.1%), and Accommodation & Food Services (54.4%).
| Industry | Male | Female |
| Agriculture, Fishing & Hunting | 117 (48.1%) | 126 (51.8%) |
| Mining, Quarrying, & Extraction | 117 (100.0%) | 0 (0.0%) |
| Construction | 683 (91.2%) | 66 (8.8%) |
| Manufacturing | 613 (89.6%) | 71 (10.4%) |
| Wholesale Trade | 276 (81.2%) | 64 (18.8%) |
| Retail Trade | 1,396 (68.5%) | 641 (31.5%) |
| Transportation & Warehousing | 466 (46.4%) | 538 (53.6%) |
| Utilities | 34 (100.0%) | 0 (0.0%) |
| Information | 59 (89.4%) | 7 (10.6%) |
| Finance & Insurance | 93 (76.2%) | 29 (23.8%) |
| Real Estate, Rental & Leasing | 124 (66.3%) | 63 (33.7%) |
| Professional & Scientific | 238 (47.2%) | 266 (52.8%) |
| Enterprise Management | 0 (0.0%) | 0 (0.0%) |
| Administrative & Support | 253 (68.2%) | 118 (31.8%) |
| Educational Services | 1,021 (32.9%) | 2,084 (67.1%) |
| Health Care & Social Assistance | 251 (14.5%) | 1,475 (85.5%) |
| Arts, Entertainment & Recreation | 295 (69.7%) | 128 (30.3%) |
| Accommodation & Food Services | 936 (45.6%) | 1,115 (54.4%) |
| Public Administration | 2,233 (69.7%) | 973 (30.3%) |
| Total | 9,357 (53.7%) | 8,073 (46.3%) |
Education in Huntsville
School Enrollment in Huntsville
The most common levels of schooling among the 14,791 students in Huntsville are college / undergraduate (9,668 | 65.4%), elementary school (1,421 | 9.6%), and middle school (1,077 | 7.3%).
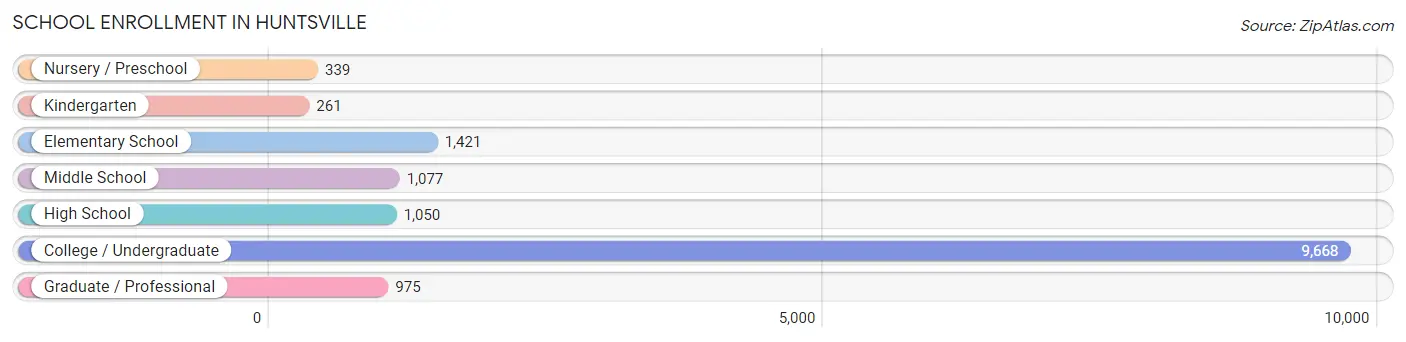
| School Level | # Students | % Students |
| Nursery / Preschool | 339 | 2.3% |
| Kindergarten | 261 | 1.8% |
| Elementary School | 1,421 | 9.6% |
| Middle School | 1,077 | 7.3% |
| High School | 1,050 | 7.1% |
| College / Undergraduate | 9,668 | 65.4% |
| Graduate / Professional | 975 | 6.6% |
| Total | 14,791 | 100.0% |
School Enrollment by Age by Funding Source in Huntsville
Out of a total of 14,791 students who are enrolled in schools in Huntsville, 1,050 (7.1%) attend a private institution, while the remaining 13,741 (92.9%) are enrolled in public schools. The age group of 3 to 4 year olds has the highest likelihood of being enrolled in private schools, with 72 (21.2% in the age bracket) enrolled. Conversely, the age group of 18 to 19 year olds has the lowest likelihood of being enrolled in a private school, with 3,176 (97.5% in the age bracket) attending a public institution.
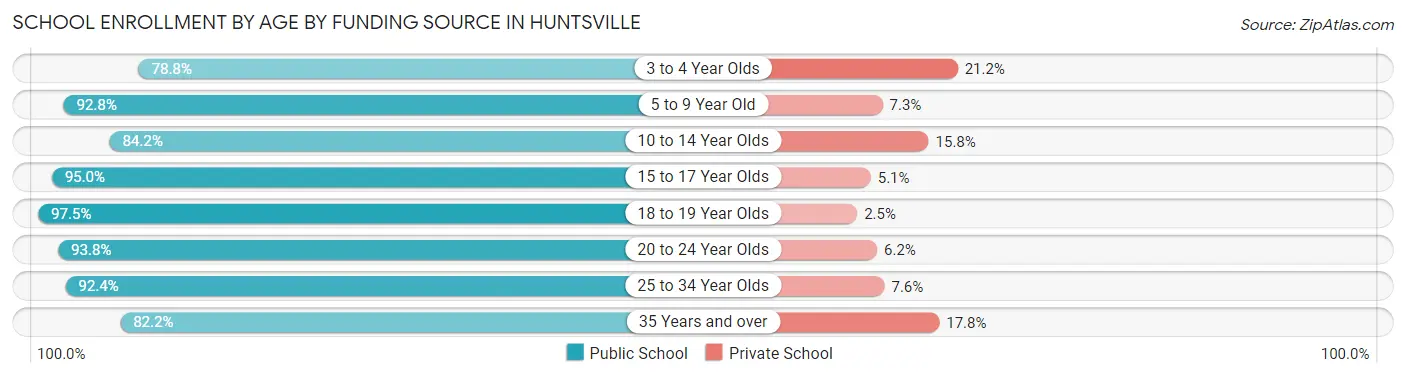
| Age Bracket | Public School | Private School |
| 3 to 4 Year Olds | 267 (78.8%) | 72 (21.2%) |
| 5 to 9 Year Old | 1,241 (92.7%) | 97 (7.2%) |
| 10 to 14 Year Olds | 1,261 (84.2%) | 237 (15.8%) |
| 15 to 17 Year Olds | 865 (95.0%) | 46 (5.1%) |
| 18 to 19 Year Olds | 3,176 (97.5%) | 82 (2.5%) |
| 20 to 24 Year Olds | 5,778 (93.8%) | 384 (6.2%) |
| 25 to 34 Year Olds | 850 (92.4%) | 70 (7.6%) |
| 35 Years and over | 300 (82.2%) | 65 (17.8%) |
| Total | 13,741 (92.9%) | 1,050 (7.1%) |
Educational Attainment by Field of Study in Huntsville
Education (1,310 | 20.8%), business (1,197 | 19.0%), arts & humanities (578 | 9.2%), science & technology (478 | 7.6%), and social sciences (466 | 7.4%) are the most common fields of study among 6,301 individuals in Huntsville who have obtained a bachelor's degree or higher.
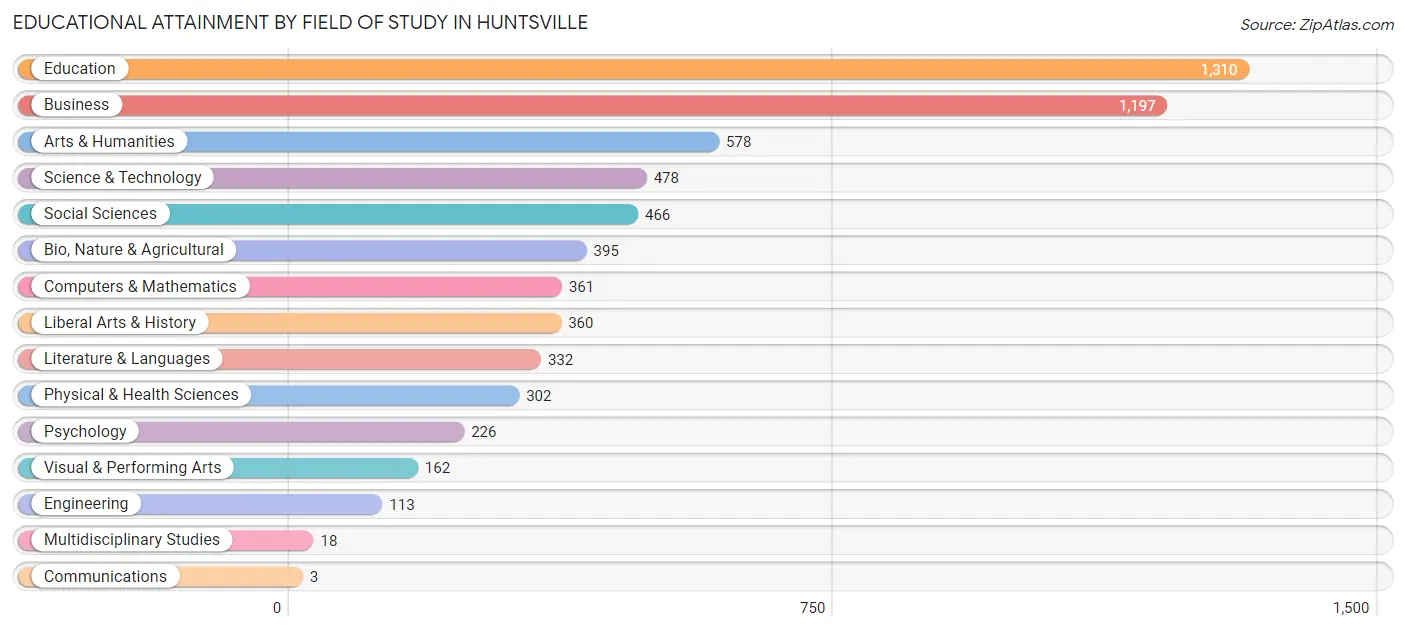
| Field of Study | # Graduates | % Graduates |
| Computers & Mathematics | 361 | 5.7% |
| Bio, Nature & Agricultural | 395 | 6.3% |
| Physical & Health Sciences | 302 | 4.8% |
| Psychology | 226 | 3.6% |
| Social Sciences | 466 | 7.4% |
| Engineering | 113 | 1.8% |
| Multidisciplinary Studies | 18 | 0.3% |
| Science & Technology | 478 | 7.6% |
| Business | 1,197 | 19.0% |
| Education | 1,310 | 20.8% |
| Literature & Languages | 332 | 5.3% |
| Liberal Arts & History | 360 | 5.7% |
| Visual & Performing Arts | 162 | 2.6% |
| Communications | 3 | 0.1% |
| Arts & Humanities | 578 | 9.2% |
| Total | 6,301 | 100.0% |
Transportation & Commute in Huntsville
Vehicle Availability by Sex in Huntsville
The most prevalent vehicle ownership categories in Huntsville are males with 2 vehicles (4,012, accounting for 45.8%) and females with 2 vehicles (3,217, making up 56.9%).
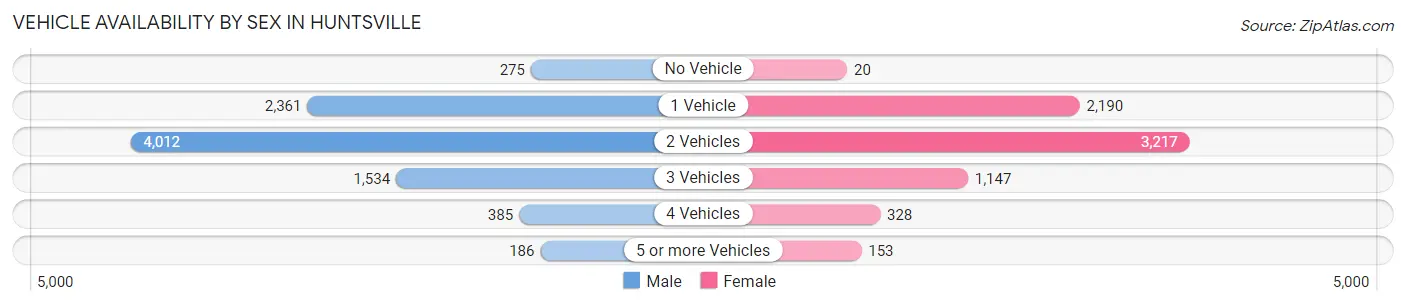
| Vehicles Available | Male | Female |
| No Vehicle | 275 (3.1%) | 20 (0.3%) |
| 1 Vehicle | 2,361 (27.0%) | 2,190 (31.0%) |
| 2 Vehicles | 4,012 (45.8%) | 3,217 (45.6%) |
| 3 Vehicles | 1,534 (17.5%) | 1,147 (16.3%) |
| 4 Vehicles | 385 (4.4%) | 328 (4.6%) |
| 5 or more Vehicles | 186 (2.1%) | 153 (2.2%) |
| Total | 8,753 (100.0%) | 7,055 (100.0%) |
Commute Time in Huntsville
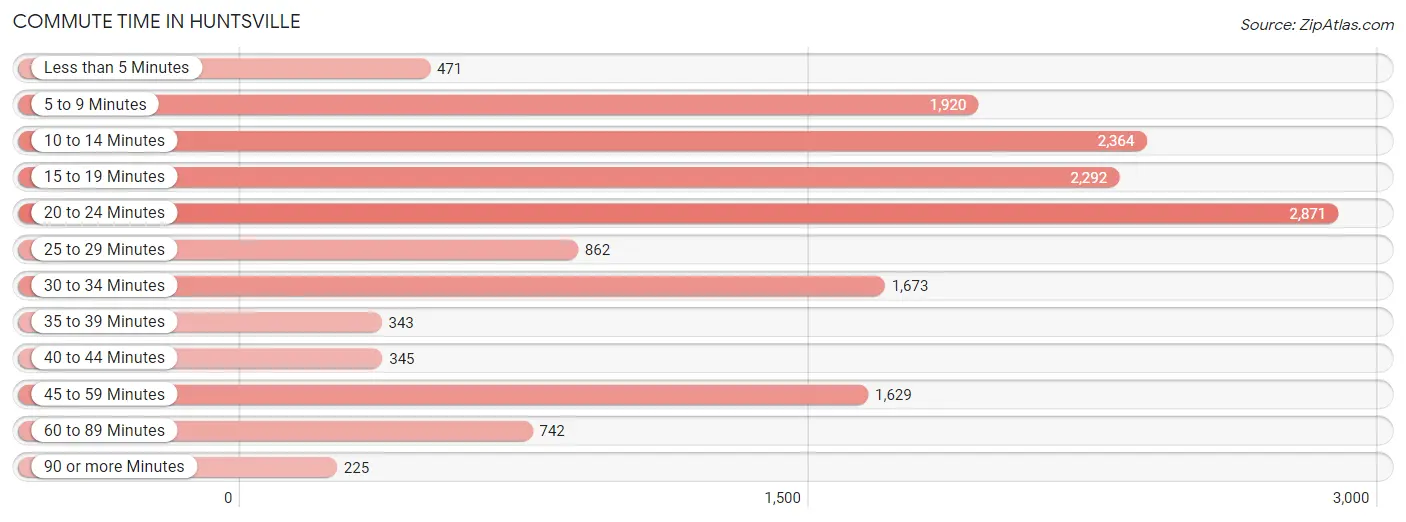
The most frequently occuring commute durations in Huntsville are 20 to 24 minutes (2,871 commuters, 18.2%), 10 to 14 minutes (2,364 commuters, 15.0%), and 15 to 19 minutes (2,292 commuters, 14.6%).
| Commute Time | # Commuters | % Commuters |
| Less than 5 Minutes | 471 | 3.0% |
| 5 to 9 Minutes | 1,920 | 12.2% |
| 10 to 14 Minutes | 2,364 | 15.0% |
| 15 to 19 Minutes | 2,292 | 14.6% |
| 20 to 24 Minutes | 2,871 | 18.2% |
| 25 to 29 Minutes | 862 | 5.5% |
| 30 to 34 Minutes | 1,673 | 10.6% |
| 35 to 39 Minutes | 343 | 2.2% |
| 40 to 44 Minutes | 345 | 2.2% |
| 45 to 59 Minutes | 1,629 | 10.3% |
| 60 to 89 Minutes | 742 | 4.7% |
| 90 or more Minutes | 225 | 1.4% |
Commute Time by Sex in Huntsville
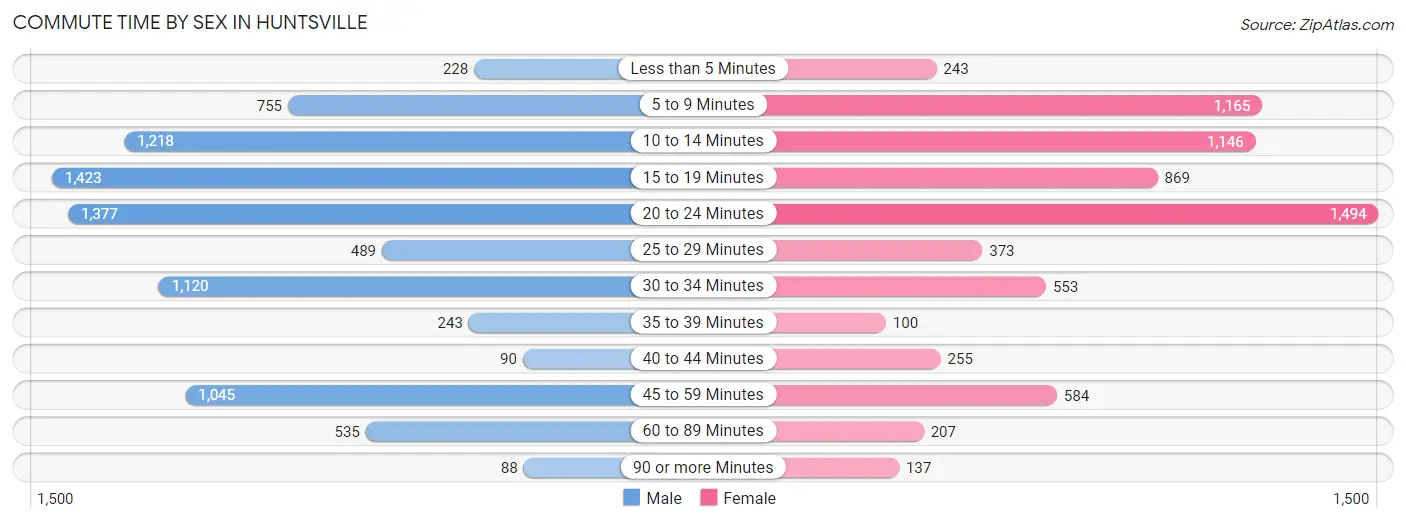
The most common commute times in Huntsville are 15 to 19 minutes (1,423 commuters, 16.5%) for males and 20 to 24 minutes (1,494 commuters, 21.0%) for females.
| Commute Time | Male | Female |
| Less than 5 Minutes | 228 (2.6%) | 243 (3.4%) |
| 5 to 9 Minutes | 755 (8.8%) | 1,165 (16.4%) |
| 10 to 14 Minutes | 1,218 (14.1%) | 1,146 (16.1%) |
| 15 to 19 Minutes | 1,423 (16.5%) | 869 (12.2%) |
| 20 to 24 Minutes | 1,377 (16.0%) | 1,494 (21.0%) |
| 25 to 29 Minutes | 489 (5.7%) | 373 (5.2%) |
| 30 to 34 Minutes | 1,120 (13.0%) | 553 (7.8%) |
| 35 to 39 Minutes | 243 (2.8%) | 100 (1.4%) |
| 40 to 44 Minutes | 90 (1.1%) | 255 (3.6%) |
| 45 to 59 Minutes | 1,045 (12.1%) | 584 (8.2%) |
| 60 to 89 Minutes | 535 (6.2%) | 207 (2.9%) |
| 90 or more Minutes | 88 (1.0%) | 137 (1.9%) |
Time of Departure to Work by Sex in Huntsville
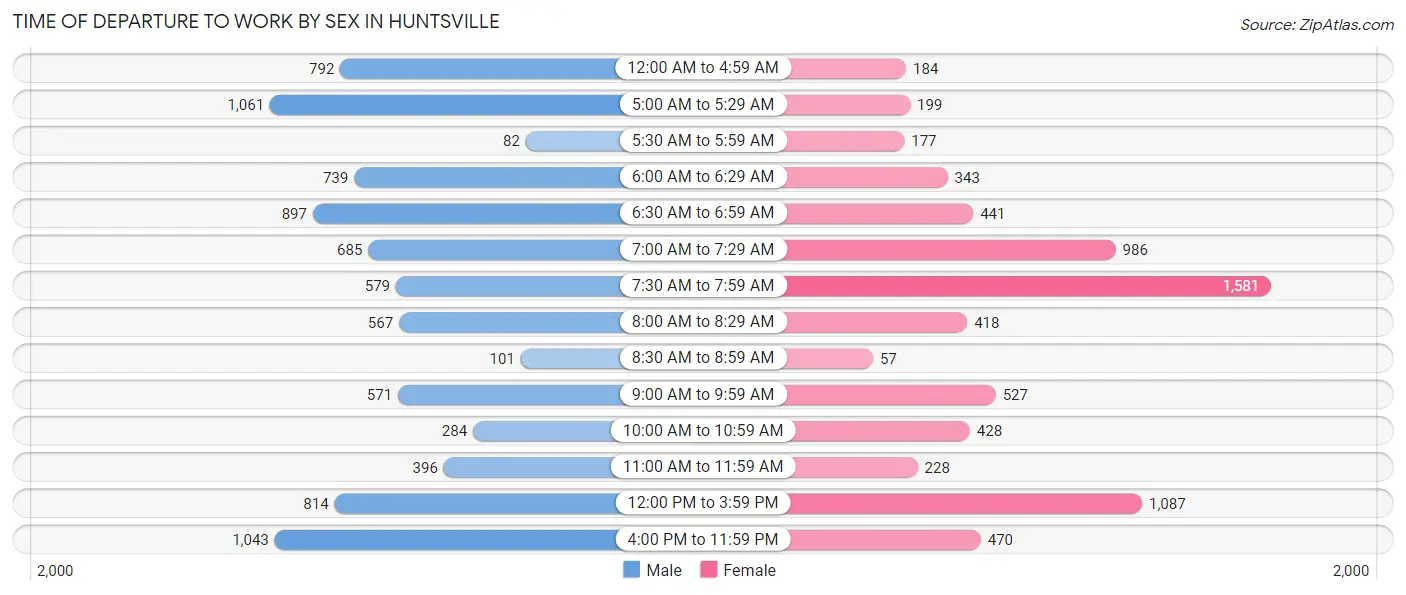
The most frequent times of departure to work in Huntsville are 5:00 AM to 5:29 AM (1,061, 12.3%) for males and 7:30 AM to 7:59 AM (1,581, 22.2%) for females.
| Time of Departure | Male | Female |
| 12:00 AM to 4:59 AM | 792 (9.2%) | 184 (2.6%) |
| 5:00 AM to 5:29 AM | 1,061 (12.3%) | 199 (2.8%) |
| 5:30 AM to 5:59 AM | 82 (0.9%) | 177 (2.5%) |
| 6:00 AM to 6:29 AM | 739 (8.6%) | 343 (4.8%) |
| 6:30 AM to 6:59 AM | 897 (10.4%) | 441 (6.2%) |
| 7:00 AM to 7:29 AM | 685 (8.0%) | 986 (13.8%) |
| 7:30 AM to 7:59 AM | 579 (6.7%) | 1,581 (22.2%) |
| 8:00 AM to 8:29 AM | 567 (6.6%) | 418 (5.9%) |
| 8:30 AM to 8:59 AM | 101 (1.2%) | 57 (0.8%) |
| 9:00 AM to 9:59 AM | 571 (6.6%) | 527 (7.4%) |
| 10:00 AM to 10:59 AM | 284 (3.3%) | 428 (6.0%) |
| 11:00 AM to 11:59 AM | 396 (4.6%) | 228 (3.2%) |
| 12:00 PM to 3:59 PM | 814 (9.5%) | 1,087 (15.2%) |
| 4:00 PM to 11:59 PM | 1,043 (12.1%) | 470 (6.6%) |
| Total | 8,611 (100.0%) | 7,126 (100.0%) |
Housing Occupancy in Huntsville
Occupancy by Ownership in Huntsville
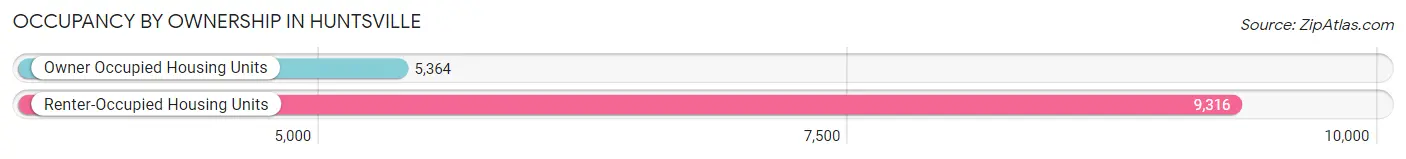
Of the total 14,680 dwellings in Huntsville, owner-occupied units account for 5,364 (36.5%), while renter-occupied units make up 9,316 (63.5%).
| Occupancy | # Housing Units | % Housing Units |
| Owner Occupied Housing Units | 5,364 | 36.5% |
| Renter-Occupied Housing Units | 9,316 | 63.5% |
| Total Occupied Housing Units | 14,680 | 100.0% |
Occupancy by Household Size in Huntsville
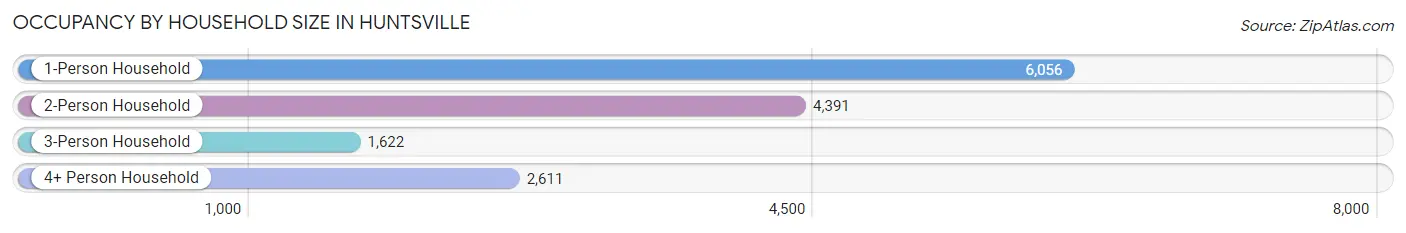
| Household Size | # Housing Units | % Housing Units |
| 1-Person Household | 6,056 | 41.2% |
| 2-Person Household | 4,391 | 29.9% |
| 3-Person Household | 1,622 | 11.1% |
| 4+ Person Household | 2,611 | 17.8% |
| Total Housing Units | 14,680 | 100.0% |
Occupancy by Ownership by Household Size in Huntsville
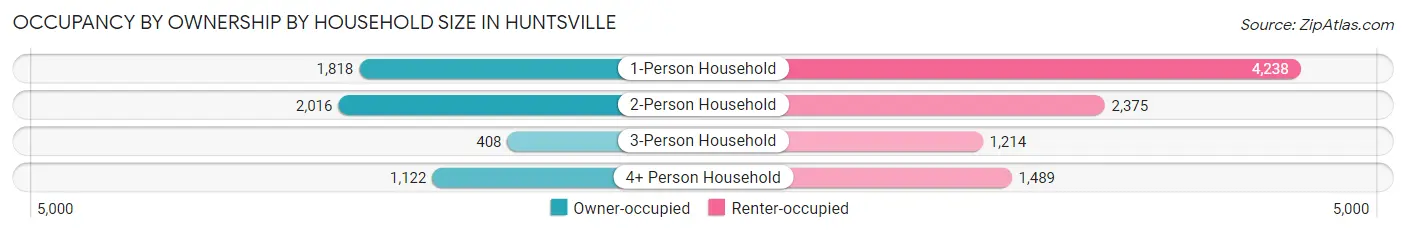
| Household Size | Owner-occupied | Renter-occupied |
| 1-Person Household | 1,818 (30.0%) | 4,238 (70.0%) |
| 2-Person Household | 2,016 (45.9%) | 2,375 (54.1%) |
| 3-Person Household | 408 (25.2%) | 1,214 (74.9%) |
| 4+ Person Household | 1,122 (43.0%) | 1,489 (57.0%) |
| Total Housing Units | 5,364 (36.5%) | 9,316 (63.5%) |
Occupancy by Educational Attainment in Huntsville
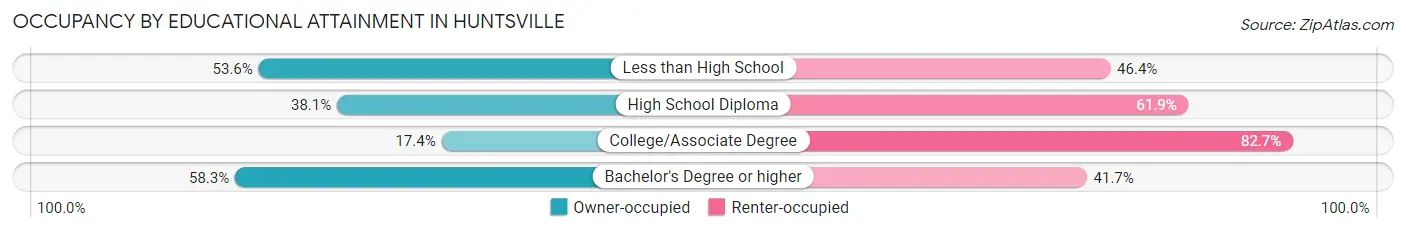
| Household Size | Owner-occupied | Renter-occupied |
| Less than High School | 423 (53.6%) | 366 (46.4%) |
| High School Diploma | 1,366 (38.1%) | 2,223 (61.9%) |
| College/Associate Degree | 1,030 (17.3%) | 4,905 (82.7%) |
| Bachelor's Degree or higher | 2,545 (58.3%) | 1,822 (41.7%) |
Occupancy by Age of Householder in Huntsville
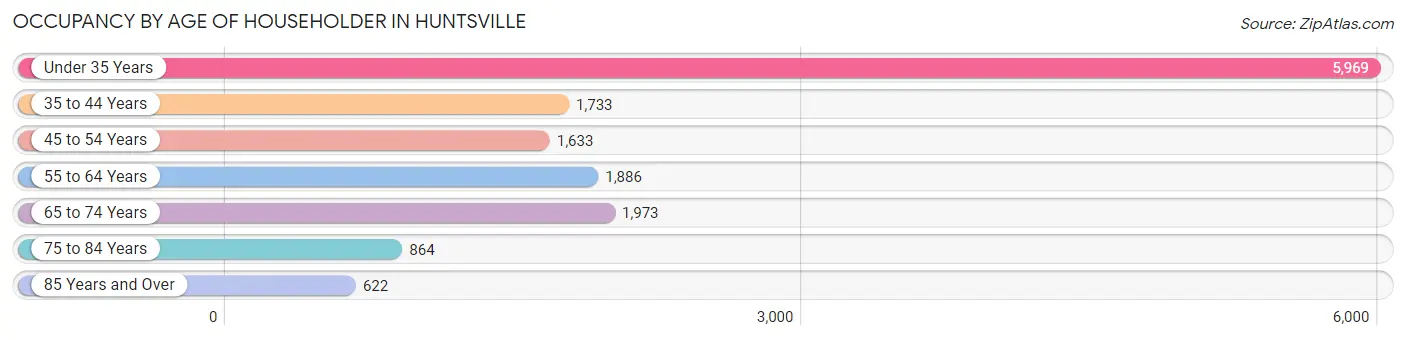
| Age Bracket | # Households | % Households |
| Under 35 Years | 5,969 | 40.7% |
| 35 to 44 Years | 1,733 | 11.8% |
| 45 to 54 Years | 1,633 | 11.1% |
| 55 to 64 Years | 1,886 | 12.9% |
| 65 to 74 Years | 1,973 | 13.4% |
| 75 to 84 Years | 864 | 5.9% |
| 85 Years and Over | 622 | 4.2% |
| Total | 14,680 | 100.0% |
Housing Finances in Huntsville
Median Income by Occupancy in Huntsville
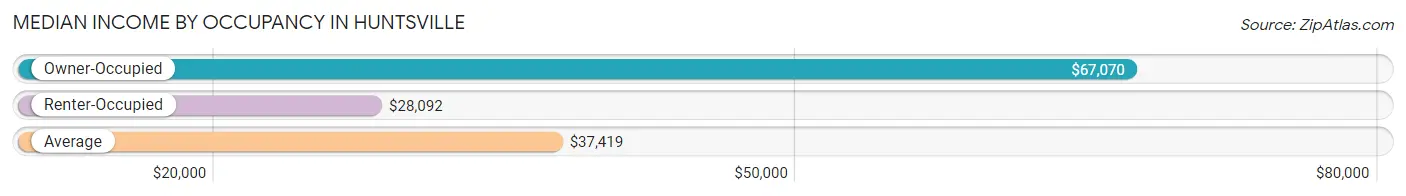
| Occupancy Type | # Households | Median Income |
| Owner-Occupied | 5,364 (36.5%) | $67,070 |
| Renter-Occupied | 9,316 (63.5%) | $28,092 |
| Average | 14,680 (100.0%) | $37,419 |
Occupancy by Householder Income Bracket in Huntsville
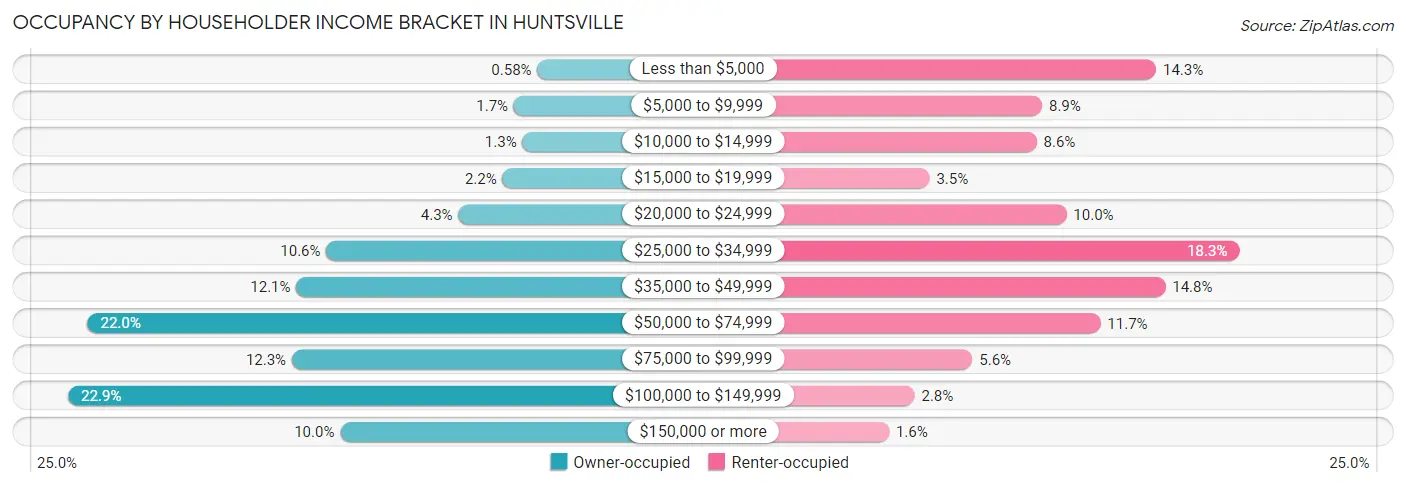
| Income Bracket | Owner-occupied | Renter-occupied |
| Less than $5,000 | 31 (0.6%) | 1,333 (14.3%) |
| $5,000 to $9,999 | 91 (1.7%) | 827 (8.9%) |
| $10,000 to $14,999 | 69 (1.3%) | 803 (8.6%) |
| $15,000 to $19,999 | 120 (2.2%) | 328 (3.5%) |
| $20,000 to $24,999 | 233 (4.3%) | 935 (10.0%) |
| $25,000 to $34,999 | 570 (10.6%) | 1,702 (18.3%) |
| $35,000 to $49,999 | 647 (12.1%) | 1,374 (14.7%) |
| $50,000 to $74,999 | 1,180 (22.0%) | 1,086 (11.7%) |
| $75,000 to $99,999 | 658 (12.3%) | 518 (5.6%) |
| $100,000 to $149,999 | 1,230 (22.9%) | 262 (2.8%) |
| $150,000 or more | 535 (10.0%) | 148 (1.6%) |
| Total | 5,364 (100.0%) | 9,316 (100.0%) |
Monthly Housing Cost Tiers in Huntsville
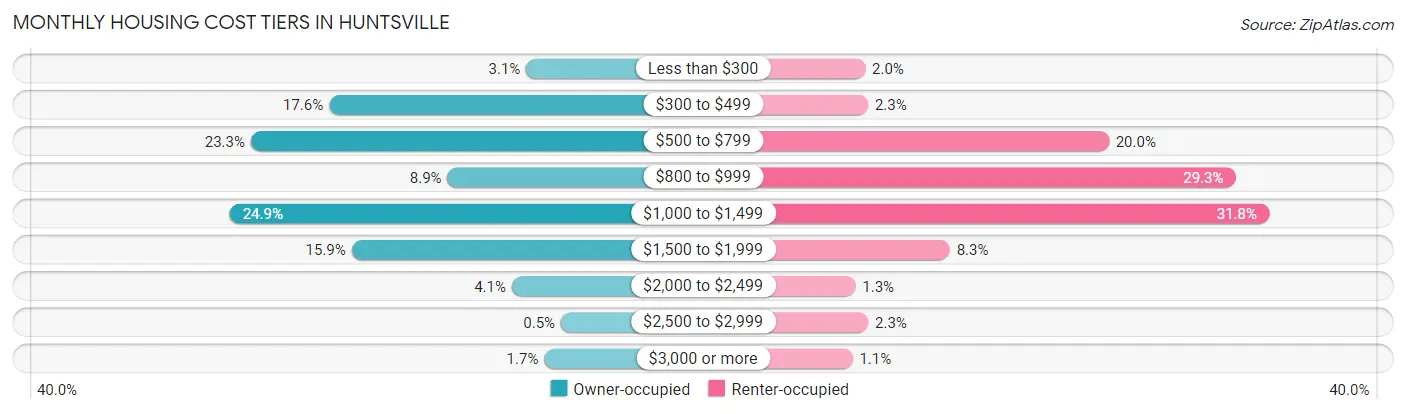
| Monthly Cost | Owner-occupied | Renter-occupied |
| Less than $300 | 164 (3.1%) | 190 (2.0%) |
| $300 to $499 | 943 (17.6%) | 210 (2.2%) |
| $500 to $799 | 1,252 (23.3%) | 1,861 (20.0%) |
| $800 to $999 | 475 (8.9%) | 2,730 (29.3%) |
| $1,000 to $1,499 | 1,335 (24.9%) | 2,960 (31.8%) |
| $1,500 to $1,999 | 854 (15.9%) | 770 (8.3%) |
| $2,000 to $2,499 | 221 (4.1%) | 123 (1.3%) |
| $2,500 to $2,999 | 27 (0.5%) | 211 (2.3%) |
| $3,000 or more | 93 (1.7%) | 103 (1.1%) |
| Total | 5,364 (100.0%) | 9,316 (100.0%) |
Physical Housing Characteristics in Huntsville
Housing Structures in Huntsville
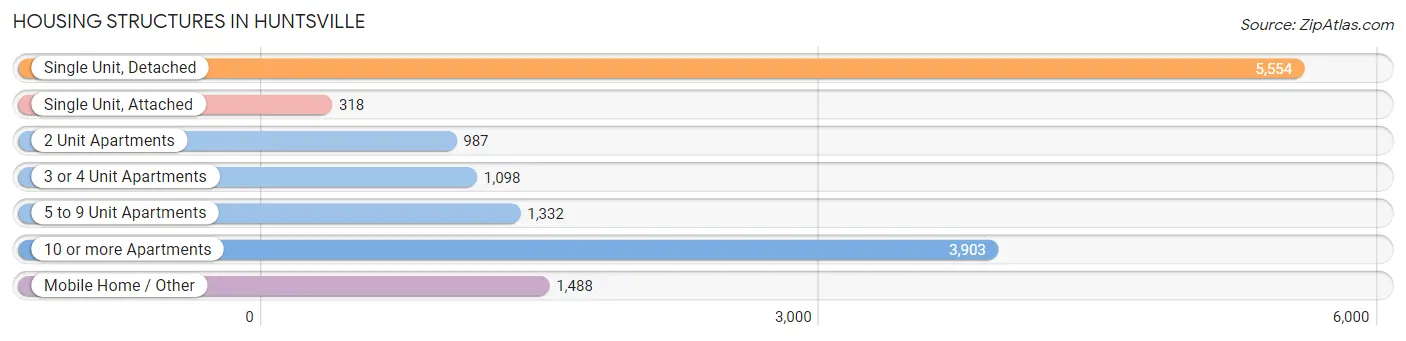
| Structure Type | # Housing Units | % Housing Units |
| Single Unit, Detached | 5,554 | 37.8% |
| Single Unit, Attached | 318 | 2.2% |
| 2 Unit Apartments | 987 | 6.7% |
| 3 or 4 Unit Apartments | 1,098 | 7.5% |
| 5 to 9 Unit Apartments | 1,332 | 9.1% |
| 10 or more Apartments | 3,903 | 26.6% |
| Mobile Home / Other | 1,488 | 10.1% |
| Total | 14,680 | 100.0% |
Housing Structures by Occupancy in Huntsville
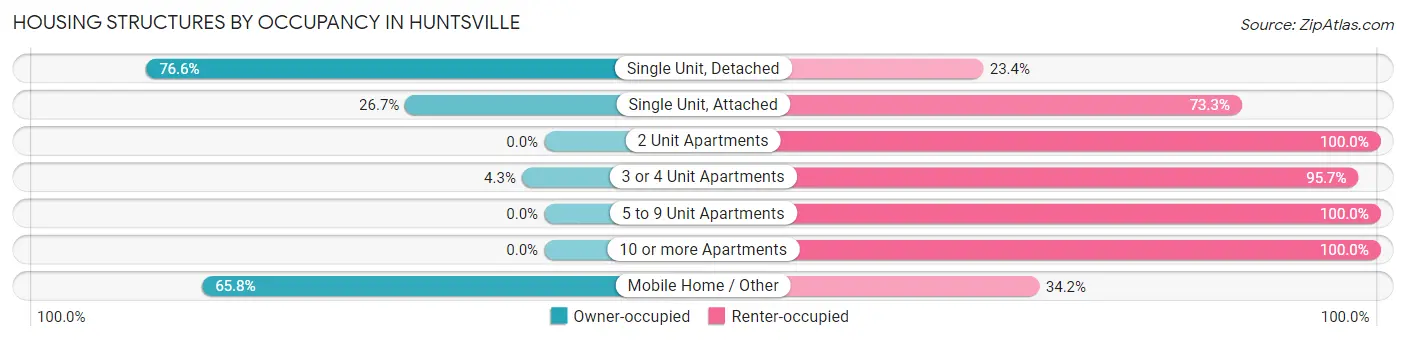
| Structure Type | Owner-occupied | Renter-occupied |
| Single Unit, Detached | 4,253 (76.6%) | 1,301 (23.4%) |
| Single Unit, Attached | 85 (26.7%) | 233 (73.3%) |
| 2 Unit Apartments | 0 (0.0%) | 987 (100.0%) |
| 3 or 4 Unit Apartments | 47 (4.3%) | 1,051 (95.7%) |
| 5 to 9 Unit Apartments | 0 (0.0%) | 1,332 (100.0%) |
| 10 or more Apartments | 0 (0.0%) | 3,903 (100.0%) |
| Mobile Home / Other | 979 (65.8%) | 509 (34.2%) |
| Total | 5,364 (36.5%) | 9,316 (63.5%) |
Housing Structures by Number of Rooms in Huntsville
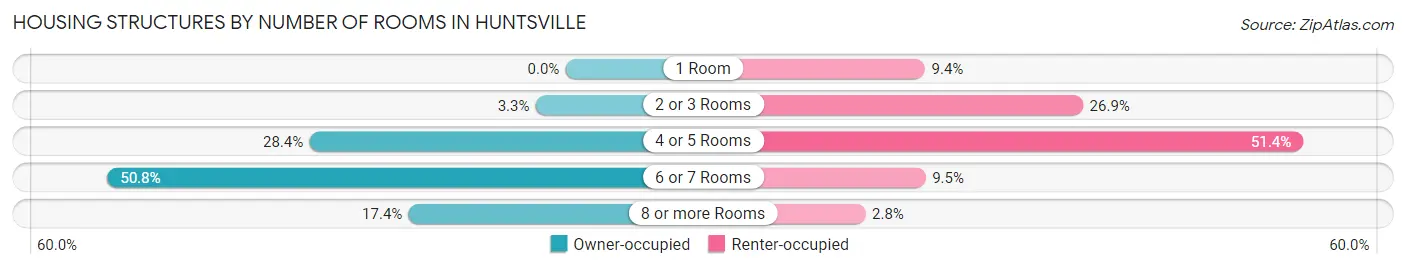
| Number of Rooms | Owner-occupied | Renter-occupied |
| 1 Room | 0 (0.0%) | 876 (9.4%) |
| 2 or 3 Rooms | 178 (3.3%) | 2,510 (26.9%) |
| 4 or 5 Rooms | 1,525 (28.4%) | 4,788 (51.4%) |
| 6 or 7 Rooms | 2,726 (50.8%) | 882 (9.5%) |
| 8 or more Rooms | 935 (17.4%) | 260 (2.8%) |
| Total | 5,364 (100.0%) | 9,316 (100.0%) |
Housing Structure by Heating Type in Huntsville
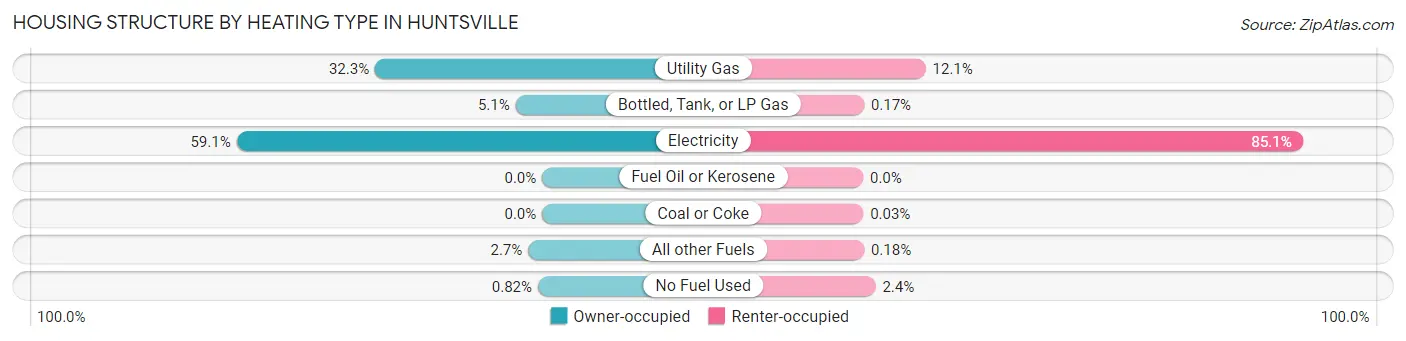
| Heating Type | Owner-occupied | Renter-occupied |
| Utility Gas | 1,732 (32.3%) | 1,126 (12.1%) |
| Bottled, Tank, or LP Gas | 275 (5.1%) | 16 (0.2%) |
| Electricity | 3,168 (59.1%) | 7,930 (85.1%) |
| Fuel Oil or Kerosene | 0 (0.0%) | 0 (0.0%) |
| Coal or Coke | 0 (0.0%) | 3 (0.0%) |
| All other Fuels | 145 (2.7%) | 17 (0.2%) |
| No Fuel Used | 44 (0.8%) | 224 (2.4%) |
| Total | 5,364 (100.0%) | 9,316 (100.0%) |
Household Vehicle Usage in Huntsville
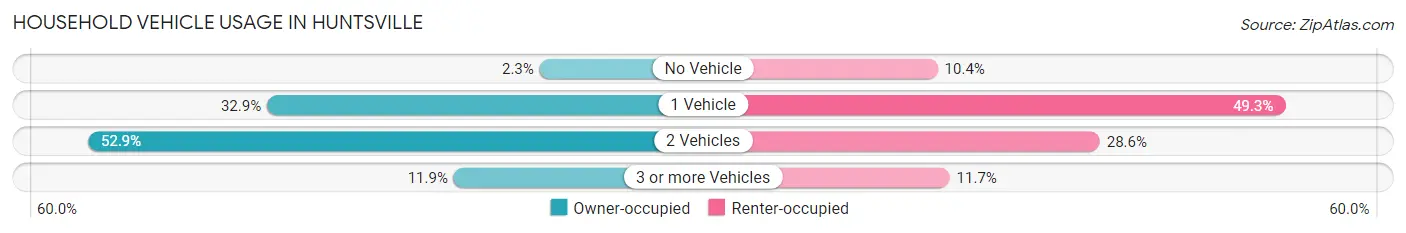
| Vehicles per Household | Owner-occupied | Renter-occupied |
| No Vehicle | 124 (2.3%) | 968 (10.4%) |
| 1 Vehicle | 1,762 (32.9%) | 4,595 (49.3%) |
| 2 Vehicles | 2,838 (52.9%) | 2,660 (28.5%) |
| 3 or more Vehicles | 640 (11.9%) | 1,093 (11.7%) |
| Total | 5,364 (100.0%) | 9,316 (100.0%) |
Real Estate & Mortgages in Huntsville
Real Estate and Mortgage Overview in Huntsville
| Characteristic | Without Mortgage | With Mortgage |
| Housing Units | 2,630 | 2,734 |
| Median Property Value | $207,300 | $207,400 |
| Median Household Income | $57,778 | $285 |
| Monthly Housing Costs | $566 | $93 |
| Real Estate Taxes | $2,289 | $40 |
Property Value by Mortgage Status in Huntsville
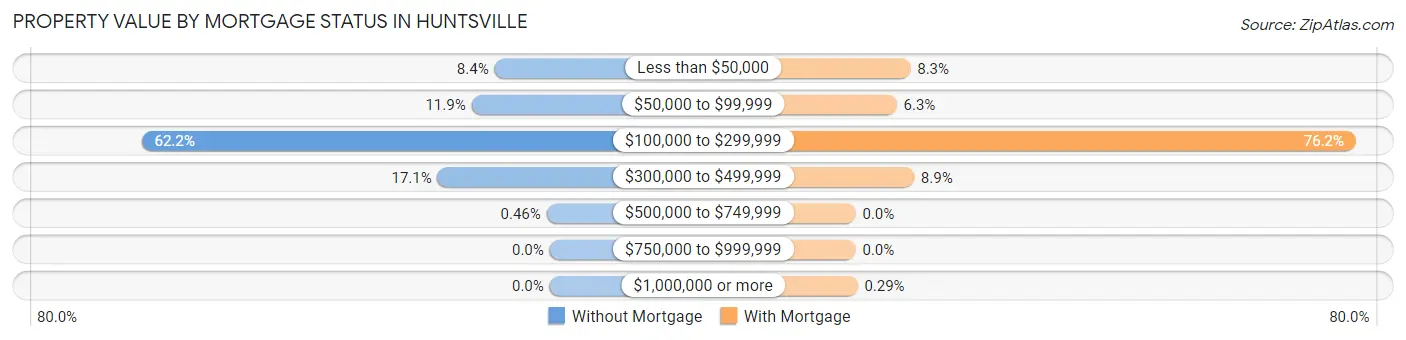
| Property Value | Without Mortgage | With Mortgage |
| Less than $50,000 | 221 (8.4%) | 228 (8.3%) |
| $50,000 to $99,999 | 313 (11.9%) | 171 (6.2%) |
| $100,000 to $299,999 | 1,635 (62.2%) | 2,084 (76.2%) |
| $300,000 to $499,999 | 449 (17.1%) | 243 (8.9%) |
| $500,000 to $749,999 | 12 (0.5%) | 0 (0.0%) |
| $750,000 to $999,999 | 0 (0.0%) | 0 (0.0%) |
| $1,000,000 or more | 0 (0.0%) | 8 (0.3%) |
| Total | 2,630 (100.0%) | 2,734 (100.0%) |
Household Income by Mortgage Status in Huntsville
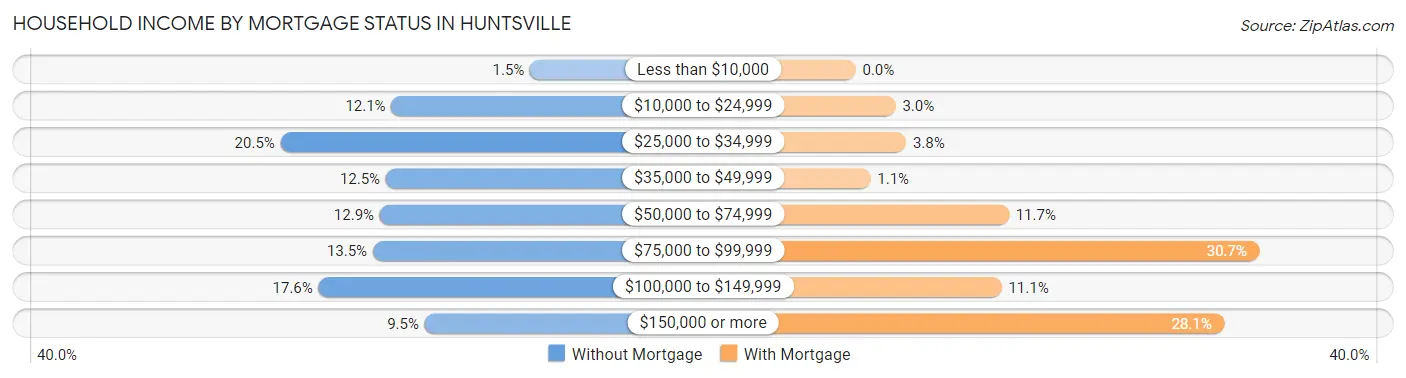
| Household Income | Without Mortgage | With Mortgage |
| Less than $10,000 | 39 (1.5%) | 0 (0.0%) |
| $10,000 to $24,999 | 317 (12.0%) | 83 (3.0%) |
| $25,000 to $34,999 | 539 (20.5%) | 105 (3.8%) |
| $35,000 to $49,999 | 328 (12.5%) | 31 (1.1%) |
| $50,000 to $74,999 | 340 (12.9%) | 319 (11.7%) |
| $75,000 to $99,999 | 354 (13.5%) | 840 (30.7%) |
| $100,000 to $149,999 | 463 (17.6%) | 304 (11.1%) |
| $150,000 or more | 250 (9.5%) | 767 (28.1%) |
| Total | 2,630 (100.0%) | 2,734 (100.0%) |
Property Value to Household Income Ratio in Huntsville
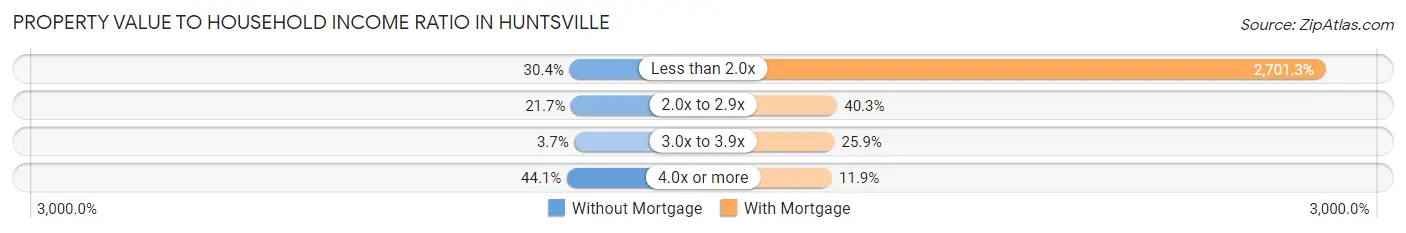
| Value-to-Income Ratio | Without Mortgage | With Mortgage |
| Less than 2.0x | 799 (30.4%) | 73,854 (2,701.3%) |
| 2.0x to 2.9x | 571 (21.7%) | 1,102 (40.3%) |
| 3.0x to 3.9x | 96 (3.6%) | 709 (25.9%) |
| 4.0x or more | 1,159 (44.1%) | 324 (11.8%) |
| Total | 2,630 (100.0%) | 2,734 (100.0%) |
Real Estate Taxes by Mortgage Status in Huntsville
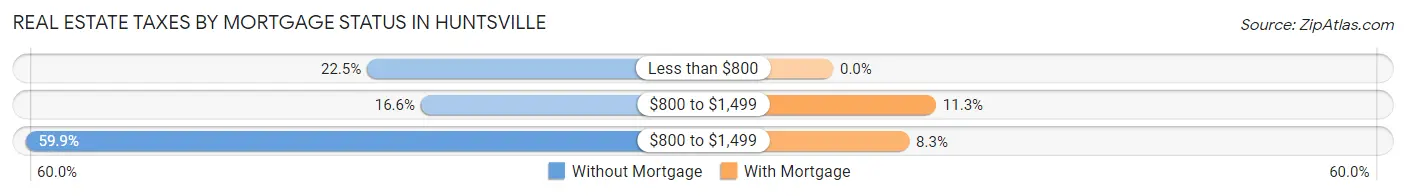
| Property Taxes | Without Mortgage | With Mortgage |
| Less than $800 | 591 (22.5%) | 0 (0.0%) |
| $800 to $1,499 | 436 (16.6%) | 308 (11.3%) |
| $800 to $1,499 | 1,575 (59.9%) | 228 (8.3%) |
| Total | 2,630 (100.0%) | 2,734 (100.0%) |
Health & Disability in Huntsville
Health Insurance Coverage by Age in Huntsville
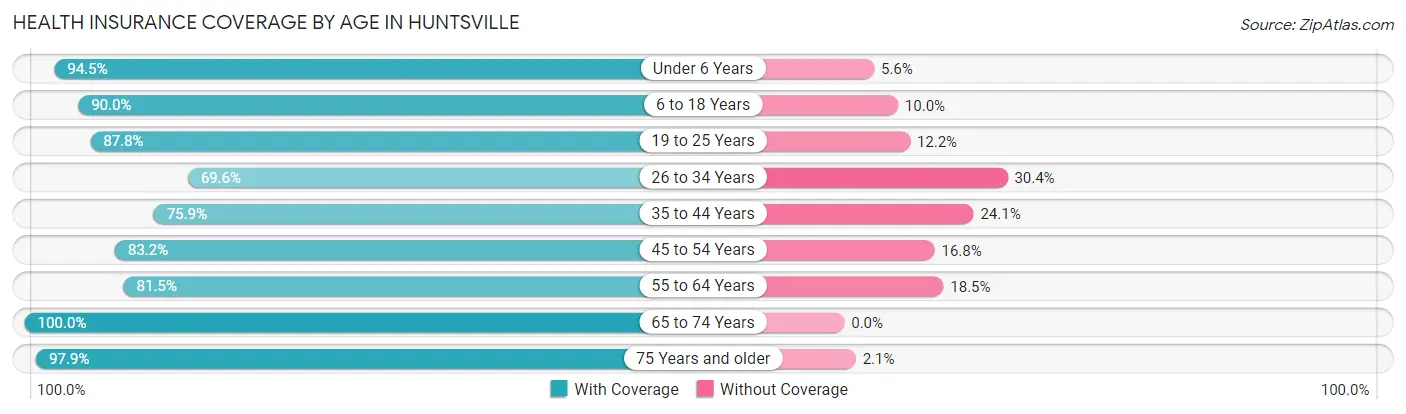
| Age Bracket | With Coverage | Without Coverage |
| Under 6 Years | 1,957 (94.5%) | 115 (5.6%) |
| 6 to 18 Years | 4,498 (90.0%) | 500 (10.0%) |
| 19 to 25 Years | 10,184 (87.8%) | 1,420 (12.2%) |
| 26 to 34 Years | 3,389 (69.6%) | 1,482 (30.4%) |
| 35 to 44 Years | 2,827 (75.9%) | 897 (24.1%) |
| 45 to 54 Years | 2,653 (83.2%) | 537 (16.8%) |
| 55 to 64 Years | 2,578 (81.5%) | 584 (18.5%) |
| 65 to 74 Years | 2,701 (100.0%) | 0 (0.0%) |
| 75 Years and older | 1,932 (97.9%) | 42 (2.1%) |
| Total | 32,719 (85.4%) | 5,577 (14.6%) |
Health Insurance Coverage by Citizenship Status in Huntsville
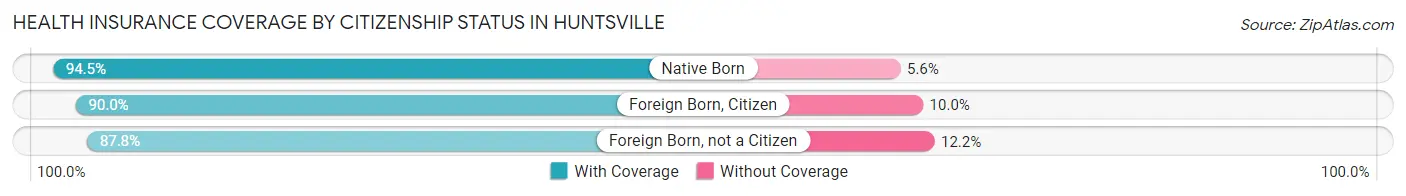
| Citizenship Status | With Coverage | Without Coverage |
| Native Born | 1,957 (94.5%) | 115 (5.6%) |
| Foreign Born, Citizen | 4,498 (90.0%) | 500 (10.0%) |
| Foreign Born, not a Citizen | 10,184 (87.8%) | 1,420 (12.2%) |
Health Insurance Coverage by Household Income in Huntsville
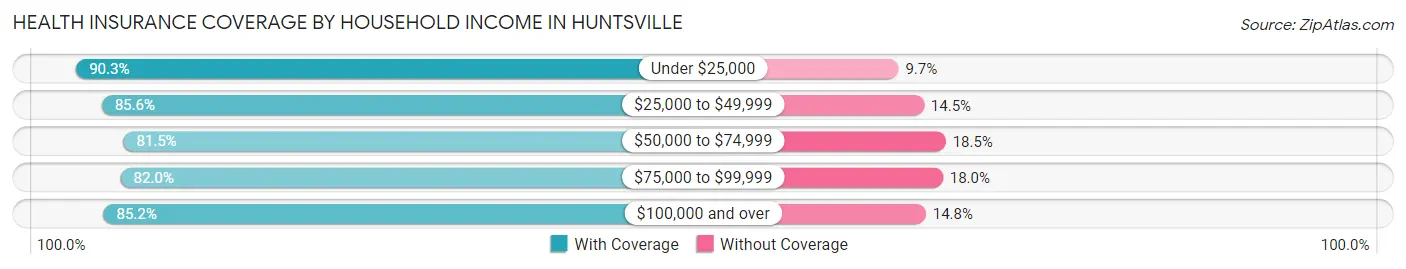
| Household Income | With Coverage | Without Coverage |
| Under $25,000 | 8,251 (90.3%) | 884 (9.7%) |
| $25,000 to $49,999 | 7,313 (85.6%) | 1,235 (14.4%) |
| $50,000 to $74,999 | 4,732 (81.5%) | 1,076 (18.5%) |
| $75,000 to $99,999 | 2,993 (82.0%) | 656 (18.0%) |
| $100,000 and over | 6,286 (85.2%) | 1,092 (14.8%) |
Public vs Private Health Insurance Coverage by Age in Huntsville
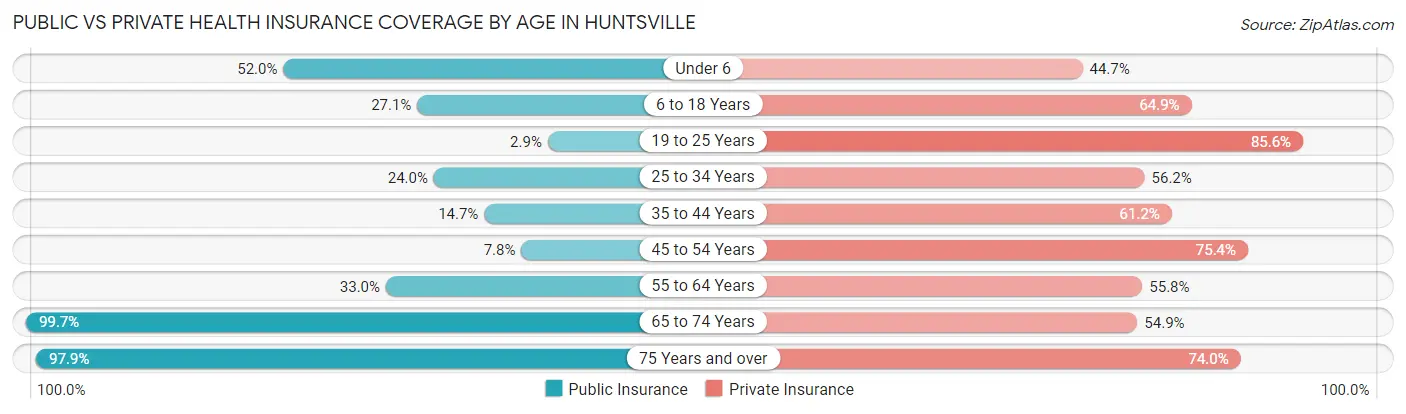
| Age Bracket | Public Insurance | Private Insurance |
| Under 6 | 1,077 (52.0%) | 926 (44.7%) |
| 6 to 18 Years | 1,356 (27.1%) | 3,243 (64.9%) |
| 19 to 25 Years | 337 (2.9%) | 9,932 (85.6%) |
| 25 to 34 Years | 1,171 (24.0%) | 2,738 (56.2%) |
| 35 to 44 Years | 547 (14.7%) | 2,280 (61.2%) |
| 45 to 54 Years | 249 (7.8%) | 2,404 (75.4%) |
| 55 to 64 Years | 1,042 (33.0%) | 1,764 (55.8%) |
| 65 to 74 Years | 2,694 (99.7%) | 1,482 (54.9%) |
| 75 Years and over | 1,932 (97.9%) | 1,461 (74.0%) |
| Total | 10,405 (27.2%) | 26,230 (68.5%) |
Disability Status by Sex by Age in Huntsville
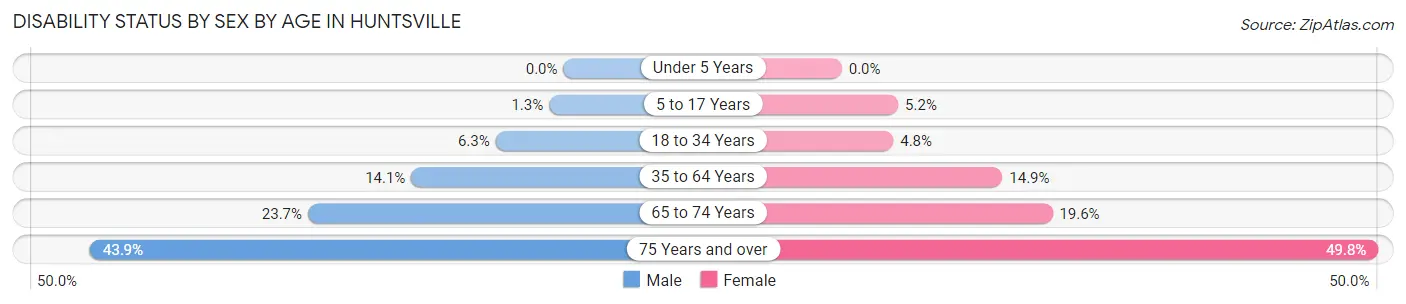
| Age Bracket | Male | Female |
| Under 5 Years | 0 (0.0%) | 0 (0.0%) |
| 5 to 17 Years | 28 (1.3%) | 96 (5.2%) |
| 18 to 34 Years | 535 (6.3%) | 444 (4.8%) |
| 35 to 64 Years | 708 (14.1%) | 754 (14.9%) |
| 65 to 74 Years | 313 (23.7%) | 270 (19.6%) |
| 75 Years and over | 359 (43.9%) | 576 (49.8%) |
Disability Class by Sex by Age in Huntsville
Disability Class: Hearing Difficulty
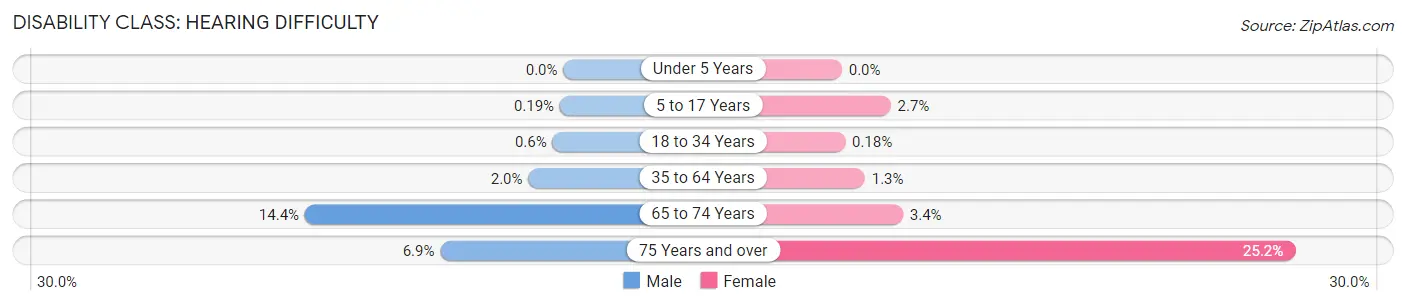
| Age Bracket | Male | Female |
| Under 5 Years | 0 (0.0%) | 0 (0.0%) |
| 5 to 17 Years | 4 (0.2%) | 50 (2.7%) |
| 18 to 34 Years | 51 (0.6%) | 17 (0.2%) |
| 35 to 64 Years | 98 (1.9%) | 65 (1.3%) |
| 65 to 74 Years | 190 (14.4%) | 47 (3.4%) |
| 75 Years and over | 56 (6.9%) | 292 (25.2%) |
Disability Class: Vision Difficulty
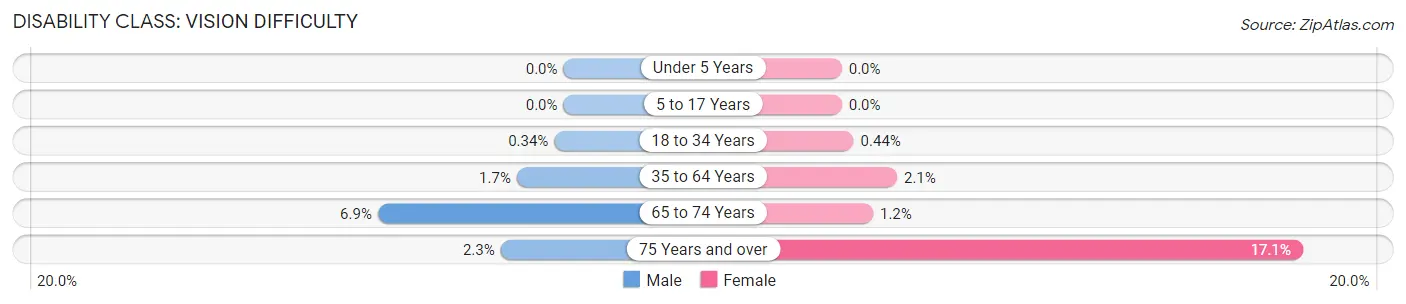
| Age Bracket | Male | Female |
| Under 5 Years | 0 (0.0%) | 0 (0.0%) |
| 5 to 17 Years | 0 (0.0%) | 0 (0.0%) |
| 18 to 34 Years | 29 (0.3%) | 41 (0.4%) |
| 35 to 64 Years | 87 (1.7%) | 104 (2.1%) |
| 65 to 74 Years | 91 (6.9%) | 16 (1.2%) |
| 75 Years and over | 19 (2.3%) | 198 (17.1%) |
Disability Class: Cognitive Difficulty
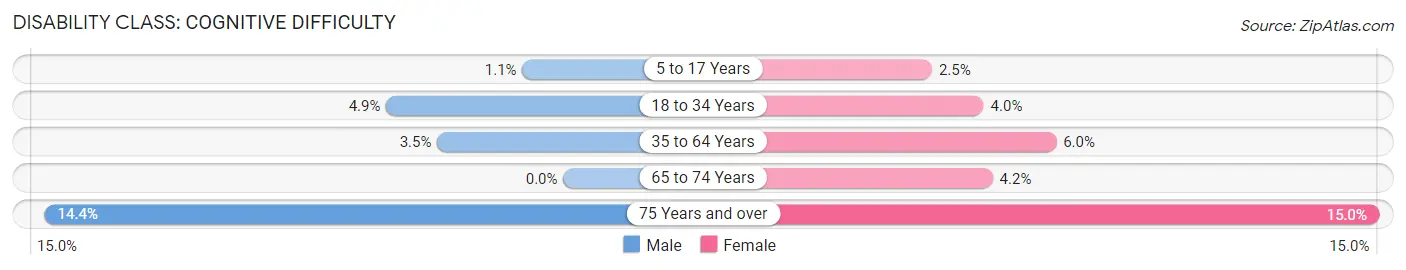
| Age Bracket | Male | Female |
| 5 to 17 Years | 24 (1.1%) | 46 (2.5%) |
| 18 to 34 Years | 419 (4.9%) | 367 (4.0%) |
| 35 to 64 Years | 176 (3.5%) | 302 (6.0%) |
| 65 to 74 Years | 0 (0.0%) | 58 (4.2%) |
| 75 Years and over | 118 (14.4%) | 173 (14.9%) |
Disability Class: Ambulatory Difficulty
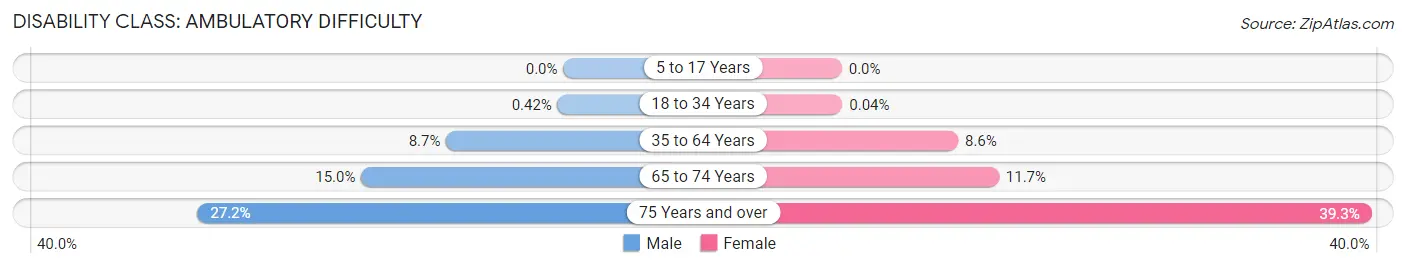
| Age Bracket | Male | Female |
| 5 to 17 Years | 0 (0.0%) | 0 (0.0%) |
| 18 to 34 Years | 36 (0.4%) | 4 (0.0%) |
| 35 to 64 Years | 436 (8.7%) | 437 (8.6%) |
| 65 to 74 Years | 198 (15.0%) | 161 (11.7%) |
| 75 Years and over | 222 (27.2%) | 455 (39.3%) |
Disability Class: Self-Care Difficulty
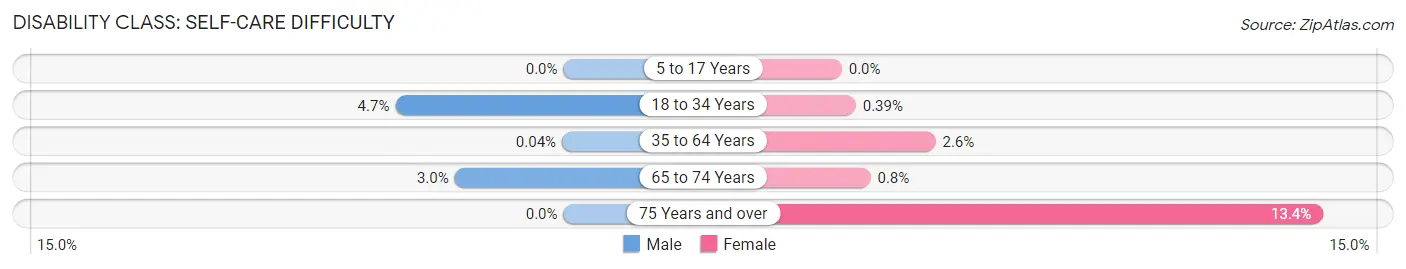
| Age Bracket | Male | Female |
| 5 to 17 Years | 0 (0.0%) | 0 (0.0%) |
| 18 to 34 Years | 398 (4.7%) | 36 (0.4%) |
| 35 to 64 Years | 2 (0.0%) | 132 (2.6%) |
| 65 to 74 Years | 40 (3.0%) | 11 (0.8%) |
| 75 Years and over | 0 (0.0%) | 155 (13.4%) |
Technology Access in Huntsville
Computing Device Access in Huntsville
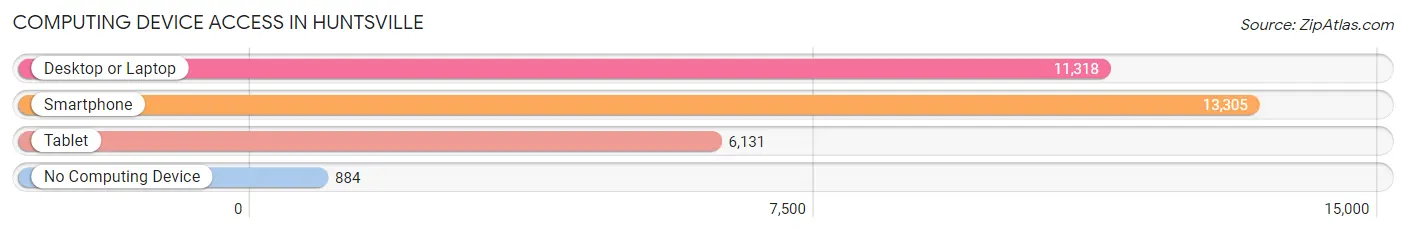
| Device Type | # Households | % Households |
| Desktop or Laptop | 11,318 | 77.1% |
| Smartphone | 13,305 | 90.6% |
| Tablet | 6,131 | 41.8% |
| No Computing Device | 884 | 6.0% |
| Total | 14,680 | 100.0% |
Internet Access in Huntsville
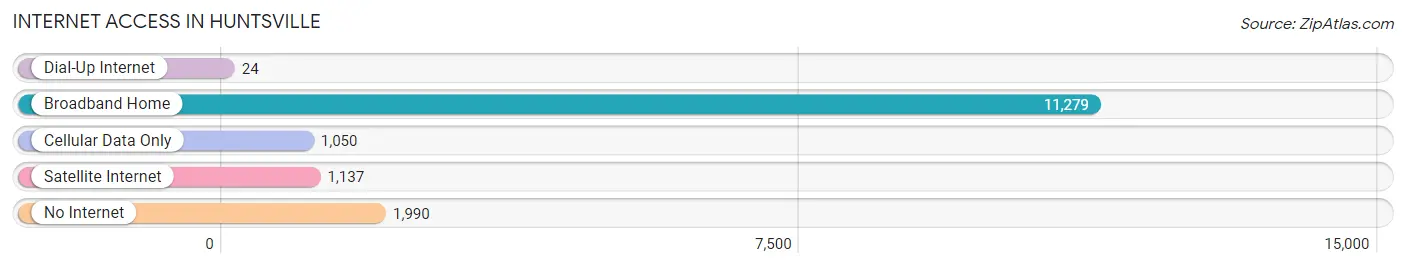
| Internet Type | # Households | % Households |
| Dial-Up Internet | 24 | 0.2% |
| Broadband Home | 11,279 | 76.8% |
| Cellular Data Only | 1,050 | 7.1% |
| Satellite Internet | 1,137 | 7.7% |
| No Internet | 1,990 | 13.6% |
| Total | 14,680 | 100.0% |
Huntsville Summary
Huntsville, Texas is a city located in Walker County, Texas, United States. The city is the county seat of Walker County and is located in East Texas, approximately seventy miles north of Houston. As of the 2010 census, the city had a population of 38,548.
History
The area that is now Huntsville was first settled in 1835 by Pleasant and Ephraim Gray. The city was named after Pleasant Gray’s hometown of Huntsville, Alabama. The city was officially incorporated in 1846 and was designated as the county seat of Walker County in 1848.
During the Civil War, Huntsville served as a major supply depot for the Confederate Army. The city was also the site of the infamous Camp Ford, a Confederate prisoner of war camp. After the war, the city experienced a period of growth and prosperity, becoming a major center for cotton production and trade.
In the late 19th century, Huntsville became a major educational center, with the establishment of Sam Houston State University in 1879. The university has since become one of the largest in the state and is a major employer in the city.
Geography
Huntsville is located in East Texas, approximately seventy miles north of Houston. The city is situated on the banks of the Trinity River and is surrounded by rolling hills and pine forests. The city has a total area of 24.3 square miles, of which 24.2 square miles is land and 0.1 square miles is water.
Economy
Huntsville’s economy is largely based on education, healthcare, and government services. The city is home to Sam Houston State University, which is the third-largest university in the state and a major employer in the city. The city is also home to Huntsville Memorial Hospital, which is a major healthcare provider in the region.
The city is also home to several government agencies, including the Texas Department of Criminal Justice, the Texas Department of Transportation, and the Texas Department of Public Safety.
Demographics
As of the 2010 census, the city had a population of 38,548. The racial makeup of the city was 73.3% White, 17.3% African American, 0.7% Native American, 1.2% Asian, 0.1% Pacific Islander, 5.2% from other races, and 2.2% from two or more races. Hispanic or Latino of any race were 13.3% of the population.
The median income for a household in the city was $35,945, and the median income for a family was $45,919. The per capita income for the city was $19,945. About 17.3% of families and 22.2% of the population were below the poverty line, including 33.3% of those under age 18 and 11.2% of those age 65 or over.
Common Questions
What is Per Capita Income in Huntsville?
Per Capita income in Huntsville is $19,277.
What is the Median Family Income in Huntsville?
Median Family Income in Huntsville is $64,177.
What is the Median Household income in Huntsville?
Median Household Income in Huntsville is $37,419.
What is Income or Wage Gap in Huntsville?
Income or Wage Gap in Huntsville is 16.0%.
Women in Huntsville earn 84.0 cents for every dollar earned by a man.
What is Family Income Deficit in Huntsville?
Family Income Deficit in Huntsville is $12,659.
Families that are below poverty line in Huntsville earn $12,659 less on average than the poverty threshold level.
What is Inequality or Gini Index in Huntsville?
Inequality or Gini Index in Huntsville is 0.48.
What is the Total Population of Huntsville?
Total Population of Huntsville is 46,202.
What is the Total Male Population of Huntsville?
Total Male Population of Huntsville is 26,615.
What is the Total Female Population of Huntsville?
Total Female Population of Huntsville is 19,587.
What is the Ratio of Males per 100 Females in Huntsville?
There are 135.88 Males per 100 Females in Huntsville.
What is the Ratio of Females per 100 Males in Huntsville?
There are 73.59 Females per 100 Males in Huntsville.
What is the Median Population Age in Huntsville?
Median Population Age in Huntsville is 31.0 Years.
What is the Average Family Size in Huntsville
Average Family Size in Huntsville is 3.3 People.
What is the Average Household Size in Huntsville
Average Household Size in Huntsville is 2.4 People.
How Large is the Labor Force in Huntsville?
There are 19,150 People in the Labor Forcein in Huntsville.
What is the Percentage of People in the Labor Force in Huntsville?
46.6% of People are in the Labor Force in Huntsville.
What is the Unemployment Rate in Huntsville?
Unemployment Rate in Huntsville is 8.9%.