Mission Bend, TX Map & Demographics
Mission Bend Map
Mission Bend Overview
$28,102
PER CAPITA INCOME
$70,292
AVG FAMILY INCOME
$66,422
AVG HOUSEHOLD INCOME
20.4%
WAGE / INCOME GAP [ % ]
79.6¢/ $1
WAGE / INCOME GAP [ $ ]
$11,982
FAMILY INCOME DEFICIT
0.46
INEQUALITY / GINI INDEX
37,853
TOTAL POPULATION
17,794
MALE POPULATION
20,059
FEMALE POPULATION
88.71
MALES / 100 FEMALES
112.73
FEMALES / 100 MALES
36.1
MEDIAN AGE
3.8
AVG FAMILY SIZE
3.4
AVG HOUSEHOLD SIZE
19,342
LABOR FORCE [ PEOPLE ]
64.5%
PERCENT IN LABOR FORCE
10.2%
UNEMPLOYMENT RATE
Income in Mission Bend
Income Overview in Mission Bend
Per Capita Income in Mission Bend is $28,102, while median incomes of families and households are $70,292 and $66,422 respectively.
| Characteristic | Number | Measure |
| Per Capita Income | 37,853 | $28,102 |
| Median Family Income | 9,383 | $70,292 |
| Mean Family Income | 9,383 | $98,984 |
| Median Household Income | 11,116 | $66,422 |
| Mean Household Income | 11,116 | $95,611 |
| Income Deficit | 9,383 | $11,982 |
| Wage / Income Gap (%) | 37,853 | 20.37% |
| Wage / Income Gap ($) | 37,853 | 79.63¢ per $1 |
| Gini / Inequality Index | 37,853 | 0.46 |
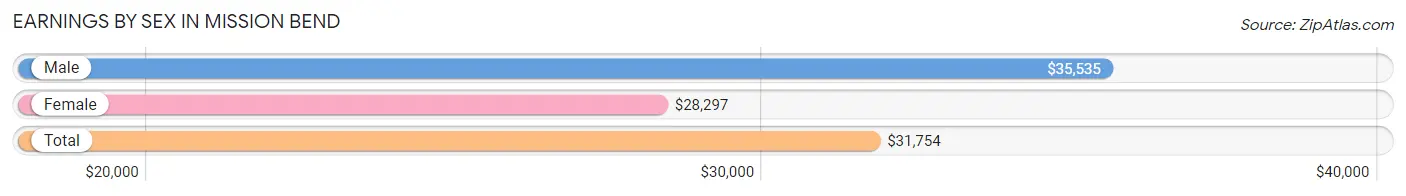
Earnings by Sex in Mission Bend
Average Earnings in Mission Bend are $31,754, $35,535 for men and $28,297 for women, a difference of 20.4%.
| Sex | Number | Average Earnings |
| Male | 10,107 (51.4%) | $35,535 |
| Female | 9,540 (48.6%) | $28,297 |
| Total | 19,647 (100.0%) | $31,754 |
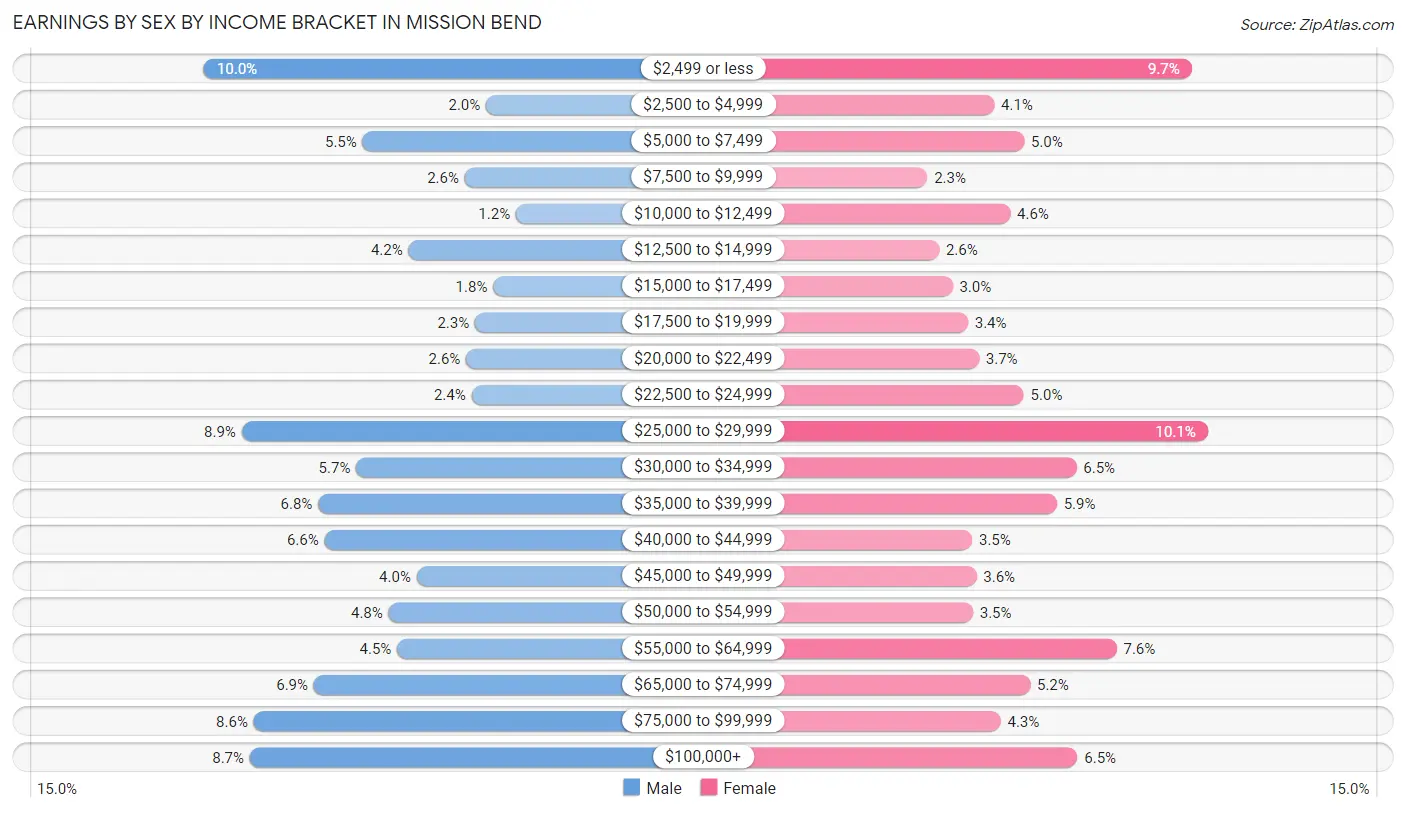
Earnings by Sex by Income Bracket in Mission Bend
The most common earnings brackets in Mission Bend are $2,499 or less for men (1,007 | 10.0%) and $25,000 to $29,999 for women (967 | 10.1%).
| Income | Male | Female |
| $2,499 or less | 1,007 (10.0%) | 924 (9.7%) |
| $2,500 to $4,999 | 205 (2.0%) | 395 (4.1%) |
| $5,000 to $7,499 | 556 (5.5%) | 475 (5.0%) |
| $7,500 to $9,999 | 266 (2.6%) | 216 (2.3%) |
| $10,000 to $12,499 | 120 (1.2%) | 438 (4.6%) |
| $12,500 to $14,999 | 425 (4.2%) | 247 (2.6%) |
| $15,000 to $17,499 | 185 (1.8%) | 283 (3.0%) |
| $17,500 to $19,999 | 237 (2.3%) | 324 (3.4%) |
| $20,000 to $22,499 | 262 (2.6%) | 354 (3.7%) |
| $22,500 to $24,999 | 247 (2.4%) | 474 (5.0%) |
| $25,000 to $29,999 | 900 (8.9%) | 967 (10.1%) |
| $30,000 to $34,999 | 574 (5.7%) | 615 (6.5%) |
| $35,000 to $39,999 | 682 (6.8%) | 563 (5.9%) |
| $40,000 to $44,999 | 664 (6.6%) | 336 (3.5%) |
| $45,000 to $49,999 | 402 (4.0%) | 347 (3.6%) |
| $50,000 to $54,999 | 482 (4.8%) | 338 (3.5%) |
| $55,000 to $64,999 | 458 (4.5%) | 723 (7.6%) |
| $65,000 to $74,999 | 694 (6.9%) | 491 (5.1%) |
| $75,000 to $99,999 | 865 (8.6%) | 412 (4.3%) |
| $100,000+ | 876 (8.7%) | 618 (6.5%) |
| Total | 10,107 (100.0%) | 9,540 (100.0%) |
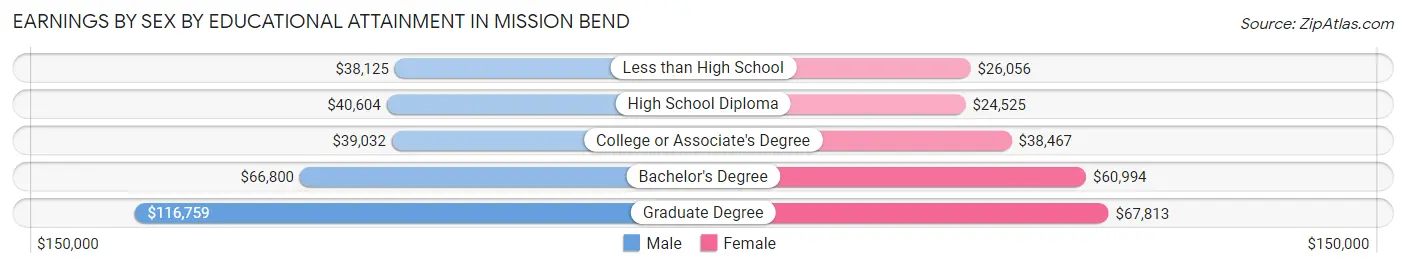
Earnings by Sex by Educational Attainment in Mission Bend
Average earnings in Mission Bend are $42,041 for men and $33,701 for women, a difference of 19.8%. Men with an educational attainment of graduate degree enjoy the highest average annual earnings of $116,759, while those with less than high school education earn the least with $38,125. Women with an educational attainment of graduate degree earn the most with the average annual earnings of $67,813, while those with high school diploma education have the smallest earnings of $24,525.
| Educational Attainment | Male Income | Female Income |
| Less than High School | $38,125 | $26,056 |
| High School Diploma | $40,604 | $24,525 |
| College or Associate's Degree | $39,032 | $38,467 |
| Bachelor's Degree | $66,800 | $60,994 |
| Graduate Degree | $116,759 | $67,813 |
| Total | $42,041 | $33,701 |
Family Income in Mission Bend
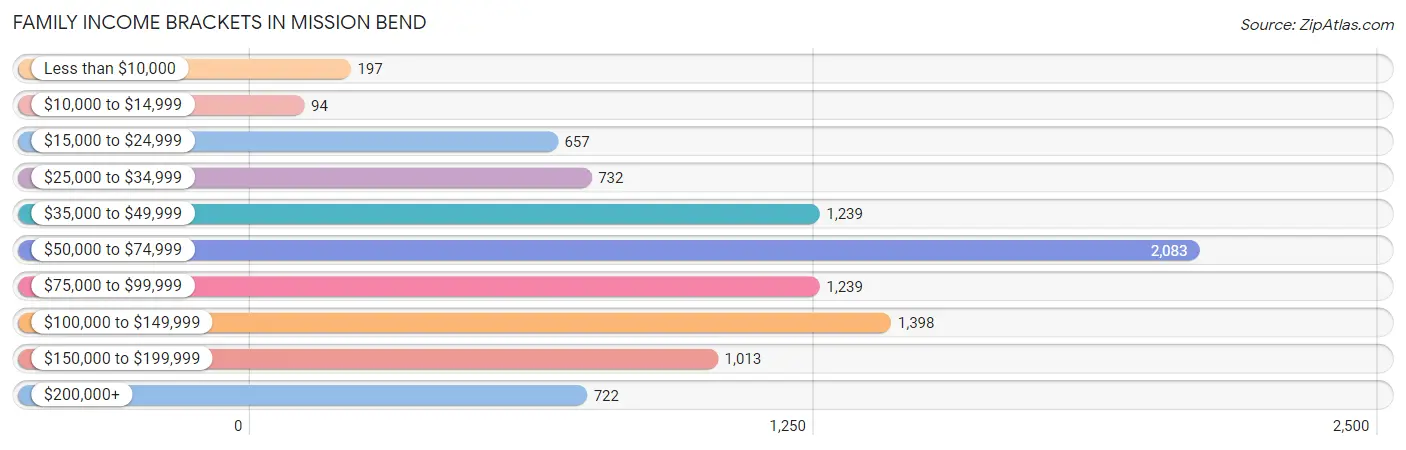
Family Income Brackets in Mission Bend
According to the Mission Bend family income data, there are 2,083 families falling into the $50,000 to $74,999 income range, which is the most common income bracket and makes up 22.2% of all families. Conversely, the $10,000 to $14,999 income bracket is the least frequent group with only 94 families (1.0%) belonging to this category.
| Income Bracket | # Families | % Families |
| Less than $10,000 | 197 | 2.1% |
| $10,000 to $14,999 | 94 | 1.0% |
| $15,000 to $24,999 | 657 | 7.0% |
| $25,000 to $34,999 | 732 | 7.8% |
| $35,000 to $49,999 | 1,239 | 13.2% |
| $50,000 to $74,999 | 2,083 | 22.2% |
| $75,000 to $99,999 | 1,239 | 13.2% |
| $100,000 to $149,999 | 1,398 | 14.9% |
| $150,000 to $199,999 | 1,013 | 10.8% |
| $200,000+ | 722 | 7.7% |
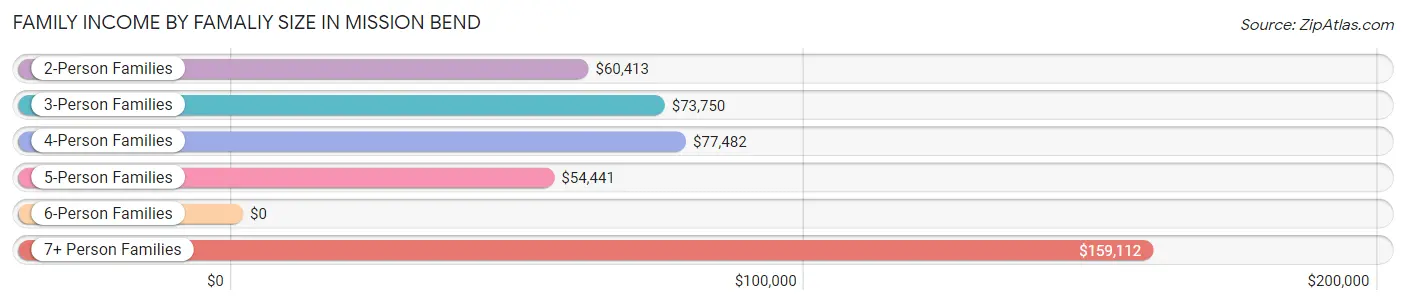
Family Income by Famaliy Size in Mission Bend
7+ person families (733 | 7.8%) account for the highest median family income in Mission Bend with $159,112 per family, while 2-person families (3,145 | 33.5%) have the highest median income of $30,206 per family member.
| Income Bracket | # Families | Median Income |
| 2-Person Families | 3,145 (33.5%) | $60,413 |
| 3-Person Families | 2,100 (22.4%) | $73,750 |
| 4-Person Families | 1,989 (21.2%) | $77,482 |
| 5-Person Families | 998 (10.6%) | $54,441 |
| 6-Person Families | 418 (4.4%) | $0 |
| 7+ Person Families | 733 (7.8%) | $159,112 |
| Total | 9,383 (100.0%) | $70,292 |
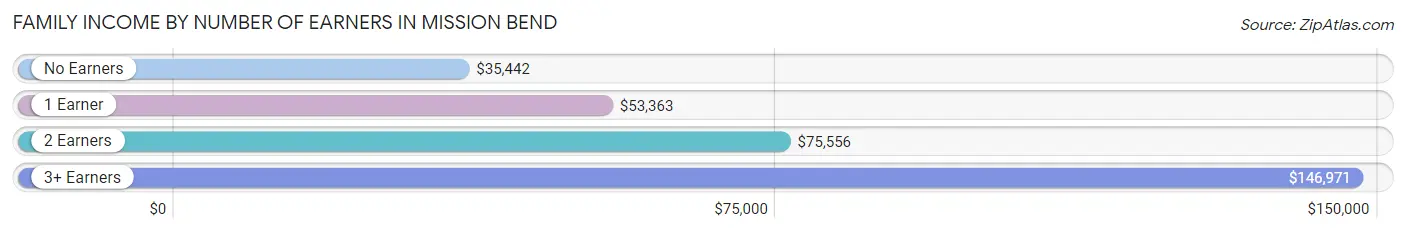
Family Income by Number of Earners in Mission Bend
The median family income in Mission Bend is $70,292, with families comprising 3+ earners (1,908) having the highest median family income of $146,971, while families with no earners (861) have the lowest median family income of $35,442, accounting for 20.3% and 9.2% of families, respectively.
| Number of Earners | # Families | Median Income |
| No Earners | 861 (9.2%) | $35,442 |
| 1 Earner | 3,366 (35.9%) | $53,363 |
| 2 Earners | 3,248 (34.6%) | $75,556 |
| 3+ Earners | 1,908 (20.3%) | $146,971 |
| Total | 9,383 (100.0%) | $70,292 |
Household Income in Mission Bend
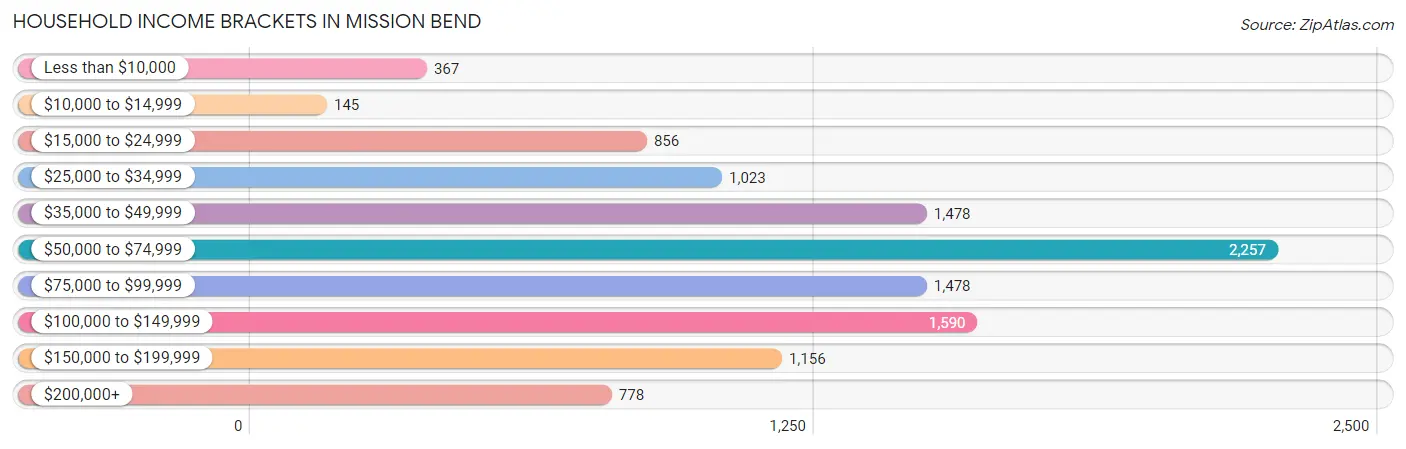
Household Income Brackets in Mission Bend
With 2,257 households falling in the category, the $50,000 to $74,999 income range is the most frequent in Mission Bend, accounting for 20.3% of all households. In contrast, only 145 households (1.3%) fall into the $10,000 to $14,999 income bracket, making it the least populous group.
| Income Bracket | # Households | % Households |
| Less than $10,000 | 367 | 3.3% |
| $10,000 to $14,999 | 145 | 1.3% |
| $15,000 to $24,999 | 856 | 7.7% |
| $25,000 to $34,999 | 1,023 | 9.2% |
| $35,000 to $49,999 | 1,478 | 13.3% |
| $50,000 to $74,999 | 2,257 | 20.3% |
| $75,000 to $99,999 | 1,478 | 13.3% |
| $100,000 to $149,999 | 1,590 | 14.3% |
| $150,000 to $199,999 | 1,156 | 10.4% |
| $200,000+ | 778 | 7.0% |
Household Income by Householder Age in Mission Bend
The median household income in Mission Bend is $66,422, with the highest median household income of $75,440 found in the 45 to 64 years age bracket for the primary householder. A total of 4,893 households (44.0%) fall into this category. Meanwhile, the 15 to 24 years age bracket for the primary householder has the lowest median household income of $42,009, with 234 households (2.1%) in this group.
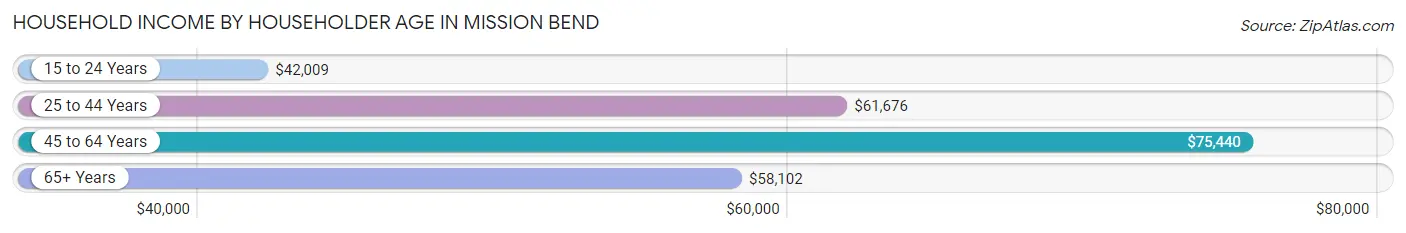
| Income Bracket | # Households | Median Income |
| 15 to 24 Years | 234 (2.1%) | $42,009 |
| 25 to 44 Years | 2,693 (24.2%) | $61,676 |
| 45 to 64 Years | 4,893 (44.0%) | $75,440 |
| 65+ Years | 3,296 (29.6%) | $58,102 |
| Total | 11,116 (100.0%) | $66,422 |
Poverty in Mission Bend
Income Below Poverty by Sex and Age in Mission Bend
With 11.7% poverty level for males and 13.3% for females among the residents of Mission Bend, 5 year old males and under 5 year old females are the most vulnerable to poverty, with 154 males (60.2%) and 332 females (33.3%) in their respective age groups living below the poverty level.
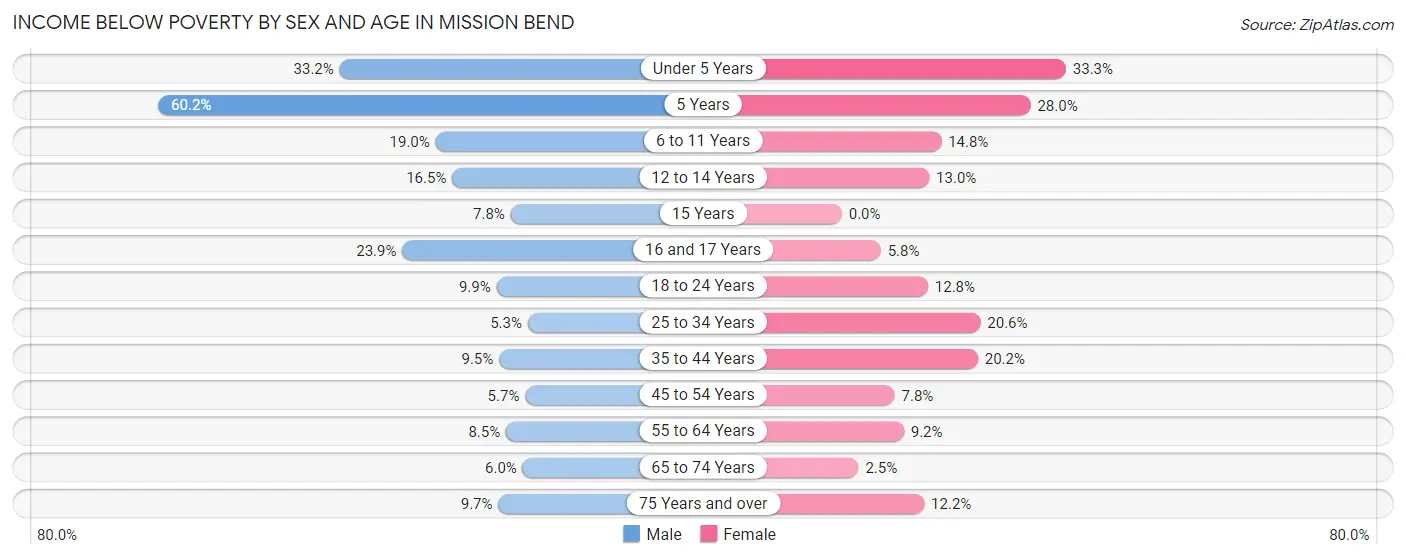
| Age Bracket | Male | Female |
| Under 5 Years | 401 (33.2%) | 332 (33.3%) |
| 5 Years | 154 (60.2%) | 72 (28.0%) |
| 6 to 11 Years | 229 (19.0%) | 284 (14.8%) |
| 12 to 14 Years | 113 (16.5%) | 90 (13.0%) |
| 15 Years | 38 (7.8%) | 0 (0.0%) |
| 16 and 17 Years | 116 (23.9%) | 39 (5.8%) |
| 18 to 24 Years | 242 (9.9%) | 331 (12.8%) |
| 25 to 34 Years | 120 (5.3%) | 421 (20.6%) |
| 35 to 44 Years | 162 (9.5%) | 496 (20.2%) |
| 45 to 54 Years | 114 (5.7%) | 201 (7.8%) |
| 55 to 64 Years | 176 (8.5%) | 265 (9.2%) |
| 65 to 74 Years | 130 (6.0%) | 54 (2.5%) |
| 75 Years and over | 74 (9.7%) | 79 (12.2%) |
| Total | 2,069 (11.7%) | 2,664 (13.3%) |
Income Above Poverty by Sex and Age in Mission Bend
According to the poverty statistics in Mission Bend, males aged 25 to 34 years and females aged 15 years are the age groups that are most secure financially, with 94.7% of males and 100.0% of females in these age groups living above the poverty line.
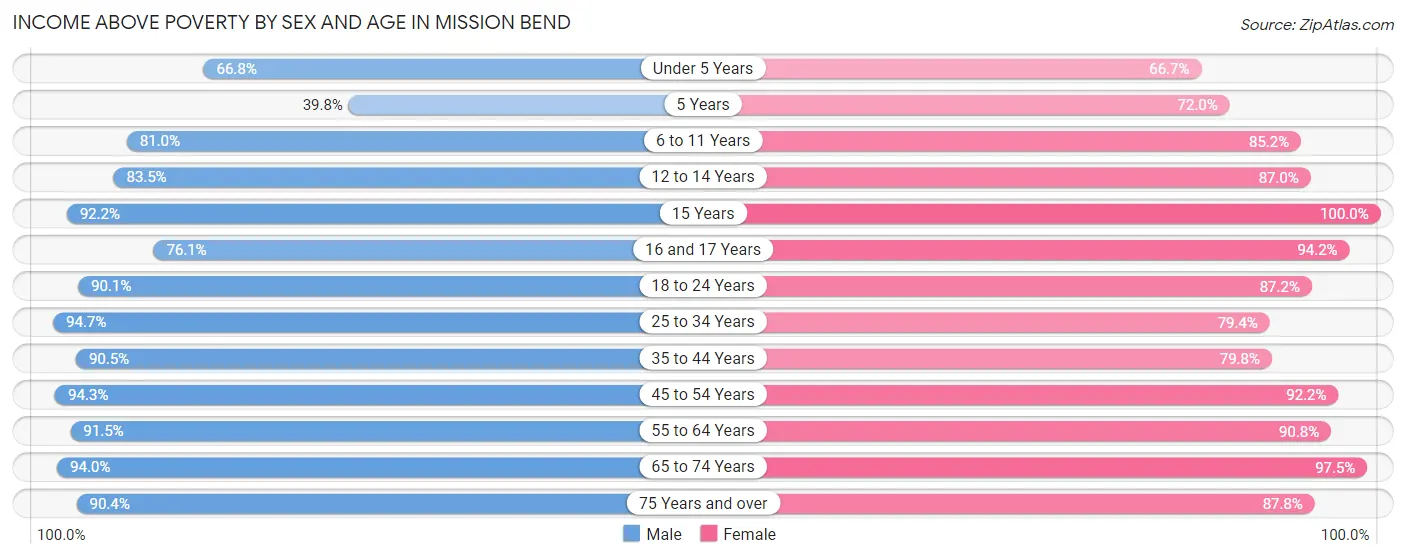
| Age Bracket | Male | Female |
| Under 5 Years | 806 (66.8%) | 666 (66.7%) |
| 5 Years | 102 (39.8%) | 185 (72.0%) |
| 6 to 11 Years | 978 (81.0%) | 1,640 (85.2%) |
| 12 to 14 Years | 572 (83.5%) | 604 (87.0%) |
| 15 Years | 448 (92.2%) | 115 (100.0%) |
| 16 and 17 Years | 369 (76.1%) | 636 (94.2%) |
| 18 to 24 Years | 2,198 (90.1%) | 2,259 (87.2%) |
| 25 to 34 Years | 2,154 (94.7%) | 1,625 (79.4%) |
| 35 to 44 Years | 1,537 (90.5%) | 1,959 (79.8%) |
| 45 to 54 Years | 1,900 (94.3%) | 2,362 (92.2%) |
| 55 to 64 Years | 1,893 (91.5%) | 2,615 (90.8%) |
| 65 to 74 Years | 2,022 (94.0%) | 2,120 (97.5%) |
| 75 Years and over | 693 (90.3%) | 567 (87.8%) |
| Total | 15,672 (88.3%) | 17,353 (86.7%) |
Income Below Poverty Among Married-Couple Families in Mission Bend
The poverty statistics for married-couple families in Mission Bend show that 6.5% or 434 of the total 6,720 families live below the poverty line. Families with 3 or 4 children have the highest poverty rate of 17.5%, comprising of 166 families. On the other hand, families with no children have the lowest poverty rate of 3.5%, which includes 134 families.
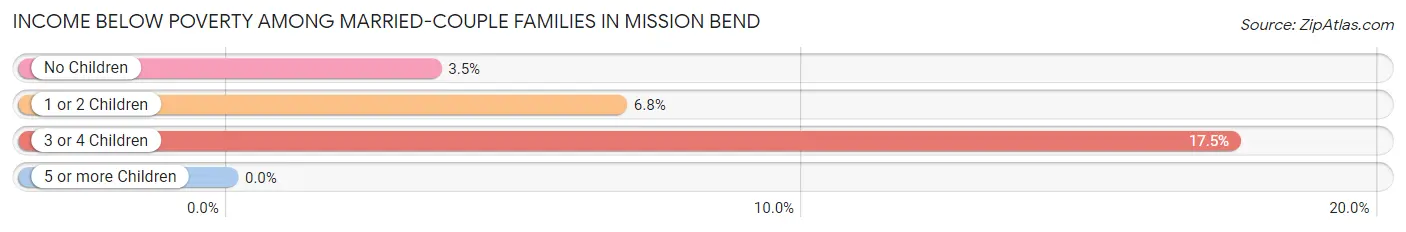
| Children | Above Poverty | Below Poverty |
| No Children | 3,656 (96.5%) | 134 (3.5%) |
| 1 or 2 Children | 1,845 (93.2%) | 134 (6.8%) |
| 3 or 4 Children | 785 (82.5%) | 166 (17.5%) |
| 5 or more Children | 0 (0.0%) | 0 (0.0%) |
| Total | 6,286 (93.5%) | 434 (6.5%) |
Income Below Poverty Among Single-Parent Households in Mission Bend
According to the poverty data in Mission Bend, 18.2% or 120 single-father households and 16.4% or 328 single-mother households are living below the poverty line. Among single-father households, those with 3 or 4 children have the highest poverty rate, with 43 households (84.3%) experiencing poverty. Likewise, among single-mother households, those with 3 or 4 children have the highest poverty rate, with 204 households (61.6%) falling below the poverty line.
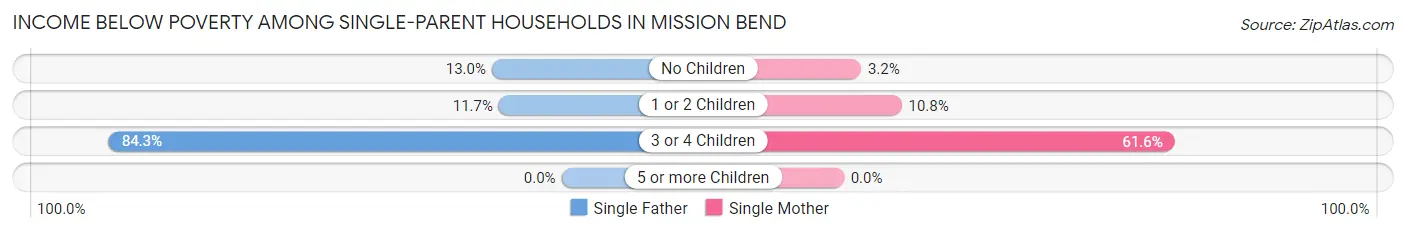
| Children | Single Father | Single Mother |
| No Children | 61 (13.0%) | 24 (3.2%) |
| 1 or 2 Children | 16 (11.7%) | 100 (10.8%) |
| 3 or 4 Children | 43 (84.3%) | 204 (61.6%) |
| 5 or more Children | 0 (0.0%) | 0 (0.0%) |
| Total | 120 (18.2%) | 328 (16.4%) |
Income Below Poverty Among Married-Couple vs Single-Parent Households in Mission Bend
The poverty data for Mission Bend shows that 434 of the married-couple family households (6.5%) and 448 of the single-parent households (16.8%) are living below the poverty level. Within the married-couple family households, those with 3 or 4 children have the highest poverty rate, with 166 households (17.5%) falling below the poverty line. Among the single-parent households, those with 3 or 4 children have the highest poverty rate, with 247 household (64.7%) living below poverty.
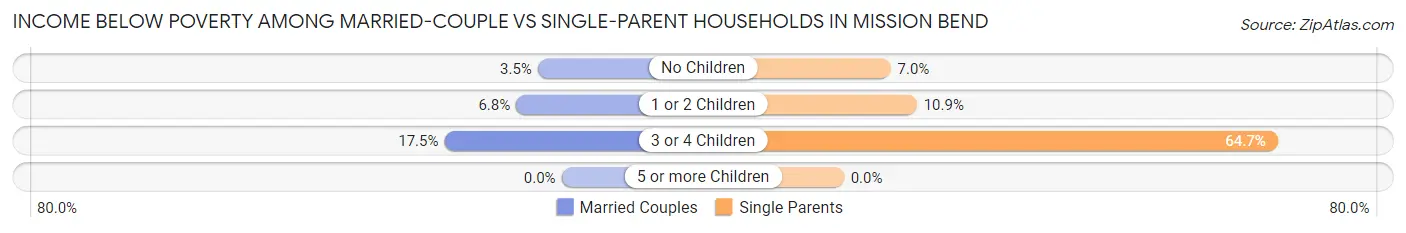
| Children | Married-Couple Families | Single-Parent Households |
| No Children | 134 (3.5%) | 85 (7.0%) |
| 1 or 2 Children | 134 (6.8%) | 116 (10.9%) |
| 3 or 4 Children | 166 (17.5%) | 247 (64.7%) |
| 5 or more Children | 0 (0.0%) | 0 (0.0%) |
| Total | 434 (6.5%) | 448 (16.8%) |
Race in Mission Bend
The most populous races in Mission Bend are Hispanic or Latino (16,005 | 42.3%), Black / African American (11,945 | 31.6%), and White / Caucasian (11,216 | 29.6%).
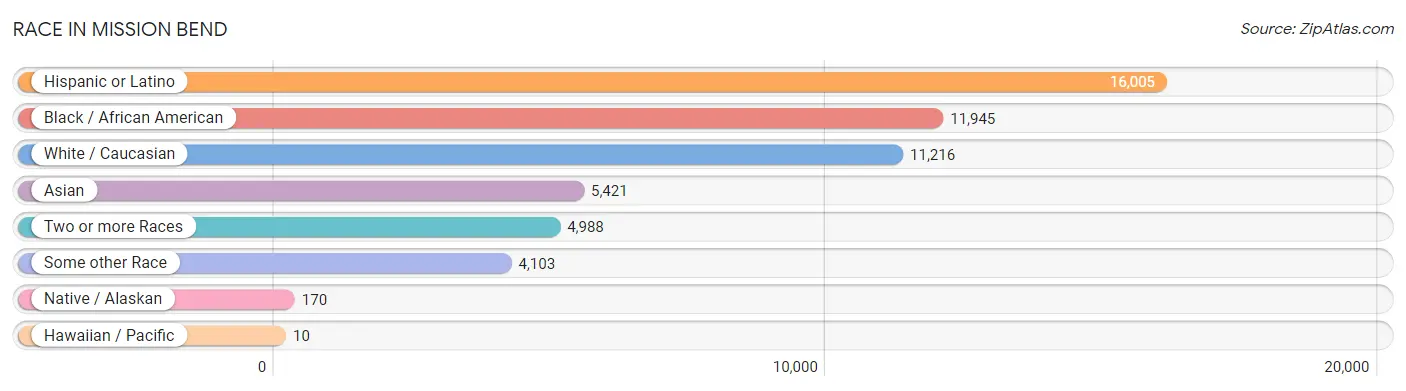
| Race | # Population | % Population |
| Asian | 5,421 | 14.3% |
| Black / African American | 11,945 | 31.6% |
| Hawaiian / Pacific | 10 | 0.0% |
| Hispanic or Latino | 16,005 | 42.3% |
| Native / Alaskan | 170 | 0.4% |
| White / Caucasian | 11,216 | 29.6% |
| Two or more Races | 4,988 | 13.2% |
| Some other Race | 4,103 | 10.8% |
| Total | 37,853 | 100.0% |
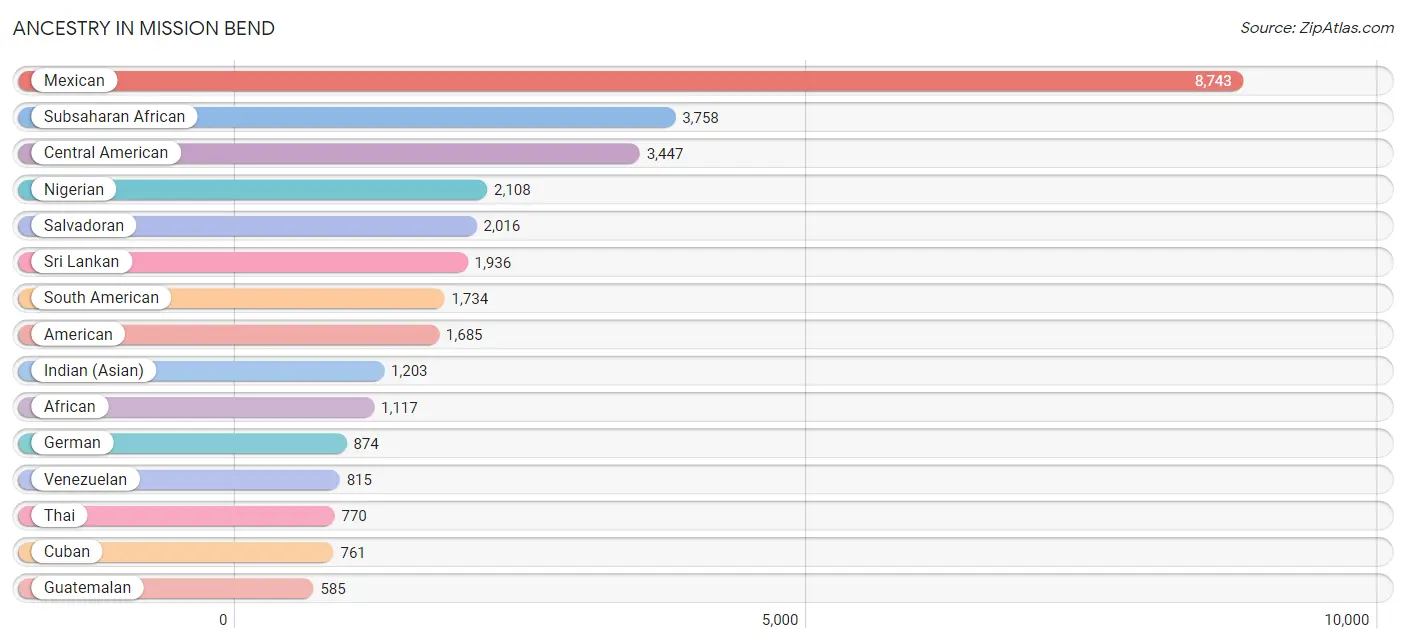
Ancestry in Mission Bend
The most populous ancestries reported in Mission Bend are Mexican (8,743 | 23.1%), Subsaharan African (3,758 | 9.9%), Central American (3,447 | 9.1%), Nigerian (2,108 | 5.6%), and Salvadoran (2,016 | 5.3%), together accounting for 53.0% of all Mission Bend residents.
| Ancestry | # Population | % Population |
| African | 1,117 | 2.9% |
| American | 1,685 | 4.4% |
| Apache | 16 | 0.0% |
| Arab | 220 | 0.6% |
| Argentinean | 178 | 0.5% |
| Barbadian | 68 | 0.2% |
| Belgian | 80 | 0.2% |
| Bhutanese | 164 | 0.4% |
| Central American | 3,447 | 9.1% |
| Central American Indian | 245 | 0.6% |
| Cherokee | 329 | 0.9% |
| Chilean | 107 | 0.3% |
| Choctaw | 342 | 0.9% |
| Colombian | 381 | 1.0% |
| Comanche | 99 | 0.3% |
| Costa Rican | 14 | 0.0% |
| Cuban | 761 | 2.0% |
| Czech | 56 | 0.2% |
| Czechoslovakian | 15 | 0.0% |
| Dominican | 76 | 0.2% |
| Dutch | 191 | 0.5% |
| English | 413 | 1.1% |
| Ethiopian | 47 | 0.1% |
| European | 7 | 0.0% |
| French | 141 | 0.4% |
| French Canadian | 18 | 0.1% |
| German | 874 | 2.3% |
| Greek | 46 | 0.1% |
| Guatemalan | 585 | 1.5% |
| Guyanese | 4 | 0.0% |
| Haitian | 140 | 0.4% |
| Honduran | 504 | 1.3% |
| Hungarian | 24 | 0.1% |
| Indian (Asian) | 1,203 | 3.2% |
| Iranian | 33 | 0.1% |
| Irish | 378 | 1.0% |
| Italian | 272 | 0.7% |
| Jamaican | 240 | 0.6% |
| Japanese | 126 | 0.3% |
| Korean | 572 | 1.5% |
| Lebanese | 74 | 0.2% |
| Liberian | 12 | 0.0% |
| Lithuanian | 9 | 0.0% |
| Malaysian | 18 | 0.1% |
| Mexican | 8,743 | 23.1% |
| Mexican American Indian | 12 | 0.0% |
| Moroccan | 40 | 0.1% |
| Native Hawaiian | 188 | 0.5% |
| Nicaraguan | 251 | 0.7% |
| Nigerian | 2,108 | 5.6% |
| Northern European | 14 | 0.0% |
| Norwegian | 22 | 0.1% |
| Pakistani | 35 | 0.1% |
| Panamanian | 77 | 0.2% |
| Peruvian | 177 | 0.5% |
| Polish | 150 | 0.4% |
| Pueblo | 104 | 0.3% |
| Puerto Rican | 540 | 1.4% |
| Russian | 70 | 0.2% |
| Salvadoran | 2,016 | 5.3% |
| Samoan | 12 | 0.0% |
| Scandinavian | 13 | 0.0% |
| Scotch-Irish | 278 | 0.7% |
| Scottish | 68 | 0.2% |
| Sierra Leonean | 162 | 0.4% |
| South African | 103 | 0.3% |
| South American | 1,734 | 4.6% |
| Spaniard | 95 | 0.3% |
| Spanish | 35 | 0.1% |
| Sri Lankan | 1,936 | 5.1% |
| Subsaharan African | 3,758 | 9.9% |
| Swedish | 13 | 0.0% |
| Swiss | 9 | 0.0% |
| Thai | 770 | 2.0% |
| Trinidadian and Tobagonian | 86 | 0.2% |
| Ukrainian | 9 | 0.0% |
| Uruguayan | 76 | 0.2% |
| Venezuelan | 815 | 2.1% |
| Vietnamese | 143 | 0.4% |
| West Indian | 56 | 0.2% | View All 80 Rows |
Immigrants in Mission Bend
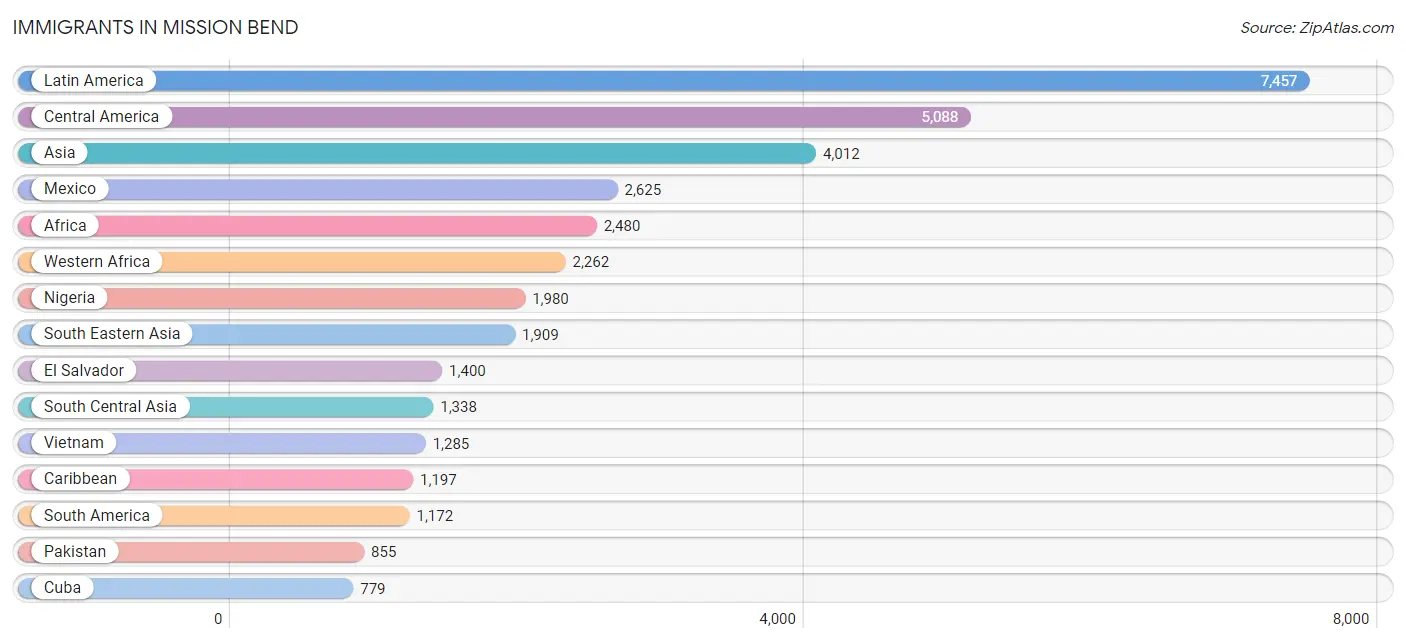
The most numerous immigrant groups reported in Mission Bend came from Latin America (7,457 | 19.7%), Central America (5,088 | 13.4%), Asia (4,012 | 10.6%), Mexico (2,625 | 6.9%), and Africa (2,480 | 6.6%), together accounting for 57.2% of all Mission Bend residents.
| Immigration Origin | # Population | % Population |
| Africa | 2,480 | 6.6% |
| Argentina | 178 | 0.5% |
| Asia | 4,012 | 10.6% |
| Bangladesh | 132 | 0.4% |
| Brazil | 6 | 0.0% |
| Cambodia | 58 | 0.2% |
| Canada | 30 | 0.1% |
| Caribbean | 1,197 | 3.2% |
| Central America | 5,088 | 13.4% |
| Chile | 199 | 0.5% |
| China | 475 | 1.3% |
| Colombia | 262 | 0.7% |
| Costa Rica | 161 | 0.4% |
| Cuba | 779 | 2.1% |
| Dominican Republic | 54 | 0.1% |
| Eastern Africa | 71 | 0.2% |
| Eastern Asia | 488 | 1.3% |
| Eastern Europe | 43 | 0.1% |
| El Salvador | 1,400 | 3.7% |
| Eritrea | 47 | 0.1% |
| Europe | 306 | 0.8% |
| Germany | 77 | 0.2% |
| Guatemala | 281 | 0.7% |
| Guyana | 57 | 0.2% |
| Haiti | 89 | 0.2% |
| Honduras | 360 | 0.9% |
| Hong Kong | 11 | 0.0% |
| India | 323 | 0.9% |
| Iran | 28 | 0.1% |
| Iraq | 27 | 0.1% |
| Italy | 113 | 0.3% |
| Jamaica | 213 | 0.6% |
| Kenya | 24 | 0.1% |
| Korea | 13 | 0.0% |
| Latin America | 7,457 | 19.7% |
| Lebanon | 31 | 0.1% |
| Liberia | 12 | 0.0% |
| Mexico | 2,625 | 6.9% |
| Netherlands | 50 | 0.1% |
| Nicaragua | 195 | 0.5% |
| Nigeria | 1,980 | 5.2% |
| Northern Africa | 70 | 0.2% |
| Northern Europe | 23 | 0.1% |
| Pakistan | 855 | 2.3% |
| Panama | 66 | 0.2% |
| Peru | 105 | 0.3% |
| Philippines | 518 | 1.4% |
| Poland | 43 | 0.1% |
| Saudi Arabia | 172 | 0.4% |
| Scotland | 7 | 0.0% |
| Senegal | 43 | 0.1% |
| Sierra Leone | 147 | 0.4% |
| South Africa | 77 | 0.2% |
| South America | 1,172 | 3.1% |
| South Central Asia | 1,338 | 3.5% |
| South Eastern Asia | 1,909 | 5.0% |
| Southern Europe | 113 | 0.3% |
| Thailand | 48 | 0.1% |
| Trinidad and Tobago | 43 | 0.1% |
| Uruguay | 9 | 0.0% |
| Venezuela | 320 | 0.9% |
| Vietnam | 1,285 | 3.4% |
| Western Africa | 2,262 | 6.0% |
| Western Asia | 277 | 0.7% |
| Western Europe | 127 | 0.3% | View All 65 Rows |
Sex and Age in Mission Bend
Sex and Age in Mission Bend
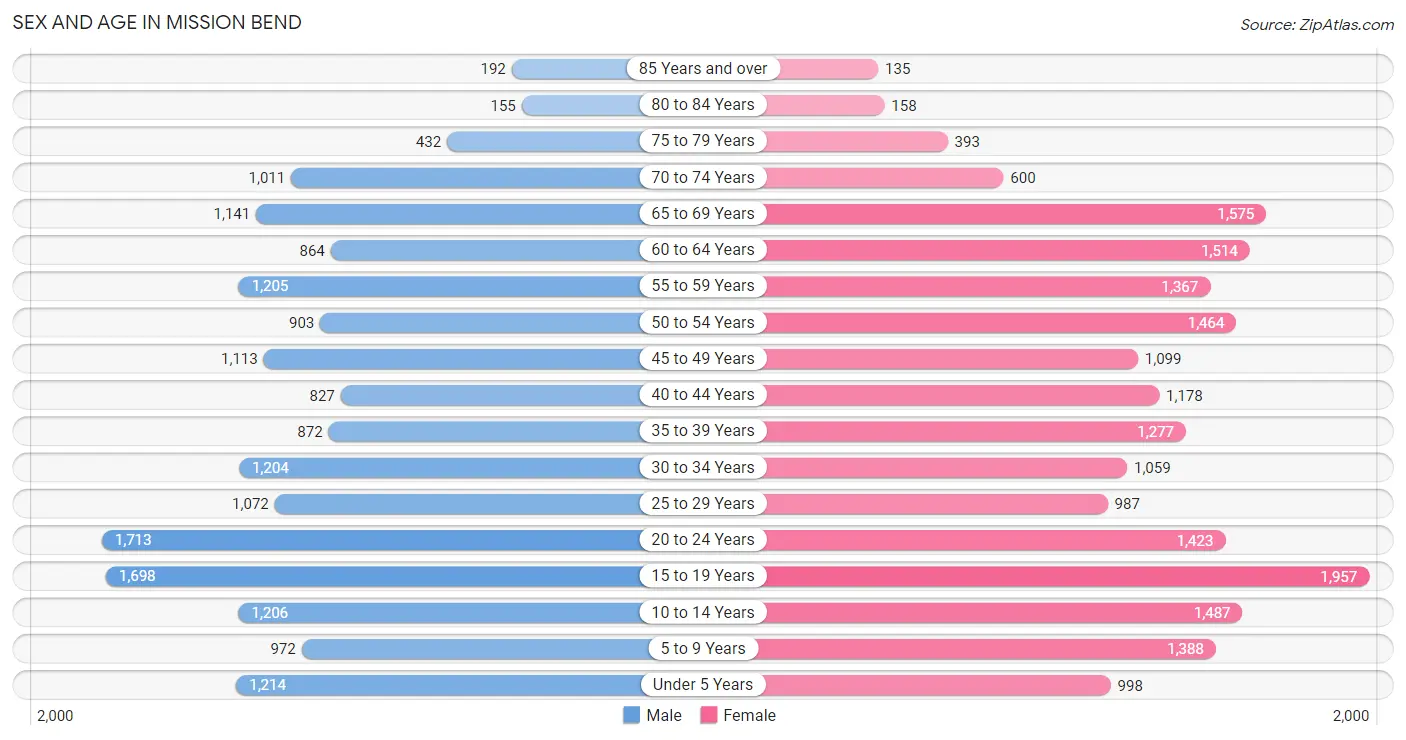
The most populous age groups in Mission Bend are 20 to 24 Years (1,713 | 9.6%) for men and 15 to 19 Years (1,957 | 9.8%) for women.
| Age Bracket | Male | Female |
| Under 5 Years | 1,214 (6.8%) | 998 (5.0%) |
| 5 to 9 Years | 972 (5.5%) | 1,388 (6.9%) |
| 10 to 14 Years | 1,206 (6.8%) | 1,487 (7.4%) |
| 15 to 19 Years | 1,698 (9.5%) | 1,957 (9.8%) |
| 20 to 24 Years | 1,713 (9.6%) | 1,423 (7.1%) |
| 25 to 29 Years | 1,072 (6.0%) | 987 (4.9%) |
| 30 to 34 Years | 1,204 (6.8%) | 1,059 (5.3%) |
| 35 to 39 Years | 872 (4.9%) | 1,277 (6.4%) |
| 40 to 44 Years | 827 (4.6%) | 1,178 (5.9%) |
| 45 to 49 Years | 1,113 (6.2%) | 1,099 (5.5%) |
| 50 to 54 Years | 903 (5.1%) | 1,464 (7.3%) |
| 55 to 59 Years | 1,205 (6.8%) | 1,367 (6.8%) |
| 60 to 64 Years | 864 (4.9%) | 1,514 (7.5%) |
| 65 to 69 Years | 1,141 (6.4%) | 1,575 (7.9%) |
| 70 to 74 Years | 1,011 (5.7%) | 600 (3.0%) |
| 75 to 79 Years | 432 (2.4%) | 393 (2.0%) |
| 80 to 84 Years | 155 (0.9%) | 158 (0.8%) |
| 85 Years and over | 192 (1.1%) | 135 (0.7%) |
| Total | 17,794 (100.0%) | 20,059 (100.0%) |
Families and Households in Mission Bend
Median Family Size in Mission Bend
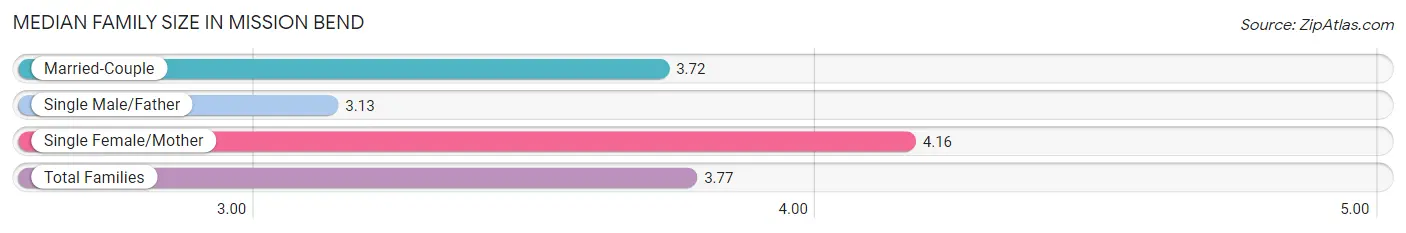
The median family size in Mission Bend is 3.77 persons per family, with single female/mother families (2,005 | 21.4%) accounting for the largest median family size of 4.16 persons per family. On the other hand, single male/father families (658 | 7.0%) represent the smallest median family size with 3.13 persons per family.
| Family Type | # Families | Family Size |
| Married-Couple | 6,720 (71.6%) | 3.72 |
| Single Male/Father | 658 (7.0%) | 3.13 |
| Single Female/Mother | 2,005 (21.4%) | 4.16 |
| Total Families | 9,383 (100.0%) | 3.77 |
Median Household Size in Mission Bend
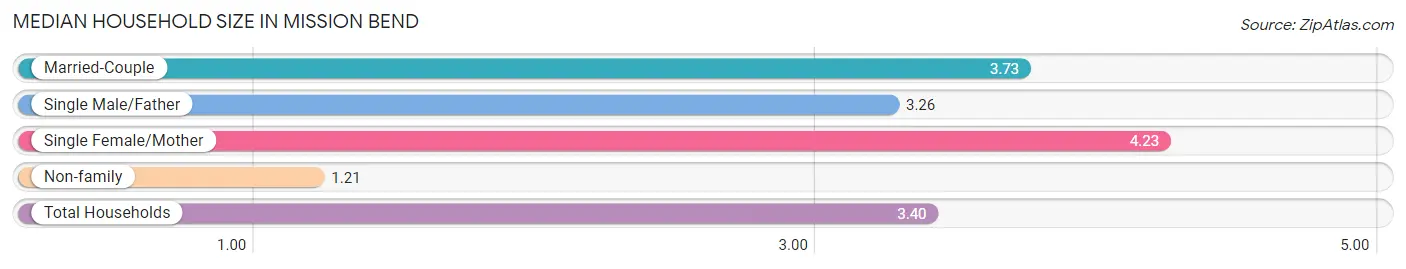
The median household size in Mission Bend is 3.40 persons per household, with single female/mother households (2,005 | 18.0%) accounting for the largest median household size of 4.23 persons per household. non-family households (1,733 | 15.6%) represent the smallest median household size with 1.21 persons per household.
| Household Type | # Households | Household Size |
| Married-Couple | 6,720 (60.5%) | 3.73 |
| Single Male/Father | 658 (5.9%) | 3.26 |
| Single Female/Mother | 2,005 (18.0%) | 4.23 |
| Non-family | 1,733 (15.6%) | 1.21 |
| Total Households | 11,116 (100.0%) | 3.40 |
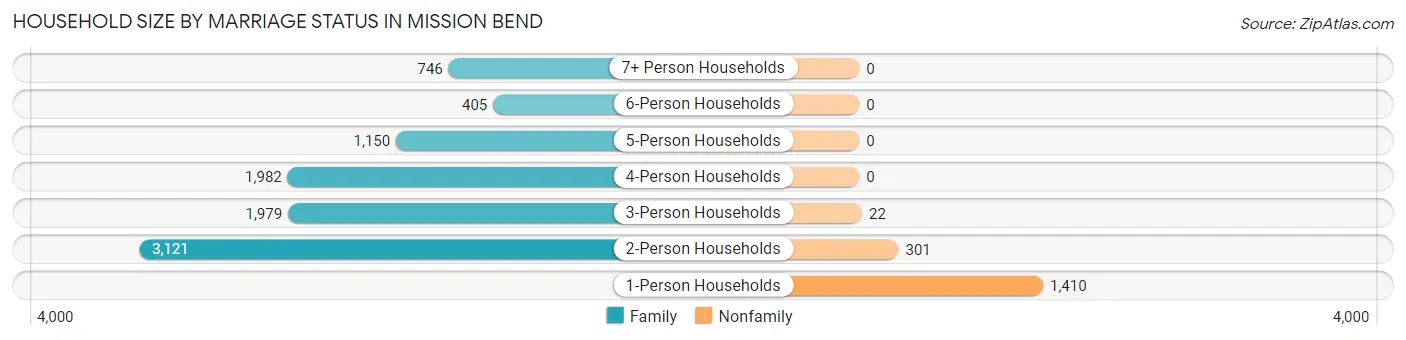
Household Size by Marriage Status in Mission Bend
Out of a total of 11,116 households in Mission Bend, 9,383 (84.4%) are family households, while 1,733 (15.6%) are nonfamily households. The most numerous type of family households are 2-person households, comprising 3,121, and the most common type of nonfamily households are 1-person households, comprising 1,410.
| Household Size | Family Households | Nonfamily Households |
| 1-Person Households | - | 1,410 (12.7%) |
| 2-Person Households | 3,121 (28.1%) | 301 (2.7%) |
| 3-Person Households | 1,979 (17.8%) | 22 (0.2%) |
| 4-Person Households | 1,982 (17.8%) | 0 (0.0%) |
| 5-Person Households | 1,150 (10.3%) | 0 (0.0%) |
| 6-Person Households | 405 (3.6%) | 0 (0.0%) |
| 7+ Person Households | 746 (6.7%) | 0 (0.0%) |
| Total | 9,383 (84.4%) | 1,733 (15.6%) |
Female Fertility in Mission Bend
Fertility by Age in Mission Bend
Average fertility rate in Mission Bend is 41.0 births per 1,000 women. Women in the age bracket of 20 to 34 years have the highest fertility rate with 66.0 births per 1,000 women. Women in the age bracket of 20 to 34 years acount for 59.8% of all women with births.
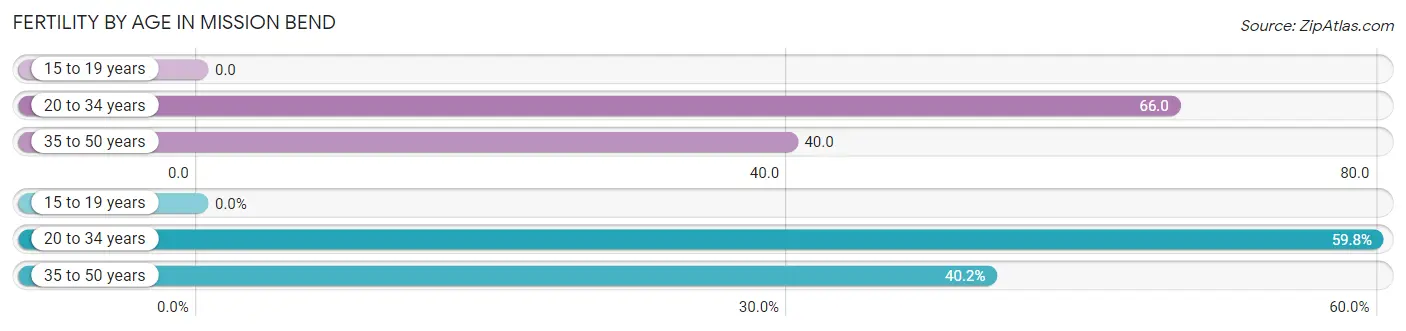
| Age Bracket | Women with Births | Births / 1,000 Women |
| 15 to 19 years | 0 (0.0%) | 0.0 |
| 20 to 34 years | 228 (59.8%) | 66.0 |
| 35 to 50 years | 153 (40.2%) | 40.0 |
| Total | 381 (100.0%) | 41.0 |
Fertility by Age by Marriage Status in Mission Bend
84.5% of women with births (381) in Mission Bend are married. The highest percentage of unmarried women with births falls into 20 to 34 years age bracket with 17.5% of them unmarried at the time of birth, while the lowest percentage of unmarried women with births belong to 35 to 50 years age bracket with 12.4% of them unmarried.
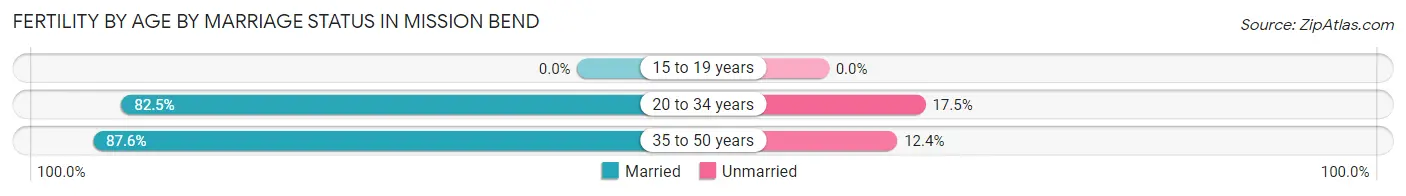
| Age Bracket | Married | Unmarried |
| 15 to 19 years | 0 (0.0%) | 0 (0.0%) |
| 20 to 34 years | 188 (82.5%) | 40 (17.5%) |
| 35 to 50 years | 134 (87.6%) | 19 (12.4%) |
| Total | 322 (84.5%) | 59 (15.5%) |
Fertility by Education in Mission Bend
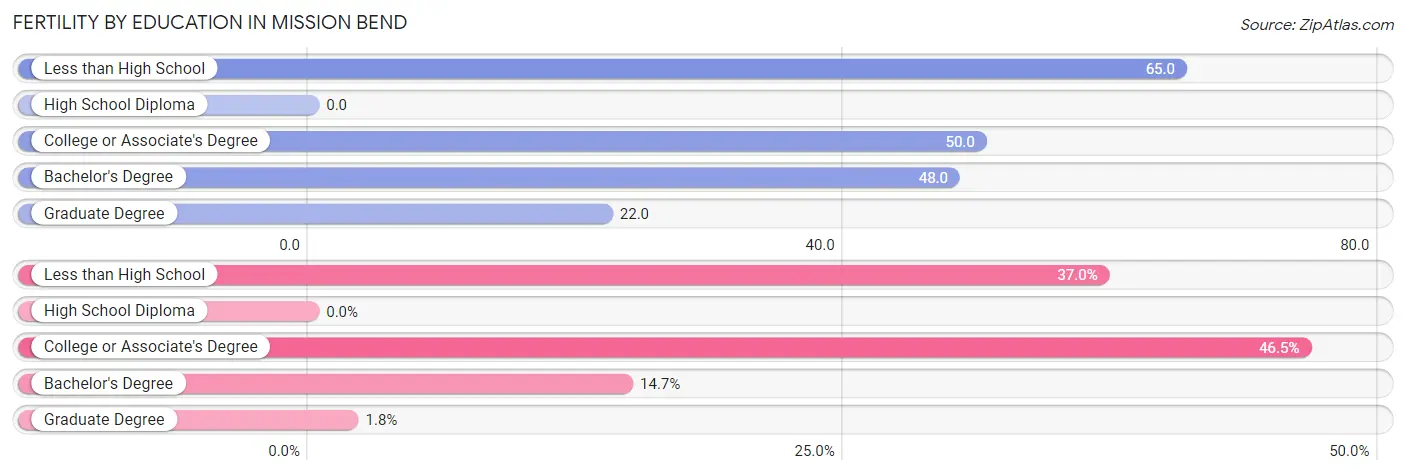
| Educational Attainment | Women with Births | Births / 1,000 Women |
| Less than High School | 141 (37.0%) | 65.0 |
| High School Diploma | 0 (0.0%) | 0.0 |
| College or Associate's Degree | 177 (46.5%) | 50.0 |
| Bachelor's Degree | 56 (14.7%) | 48.0 |
| Graduate Degree | 7 (1.8%) | 22.0 |
| Total | 381 (100.0%) | 41.0 |
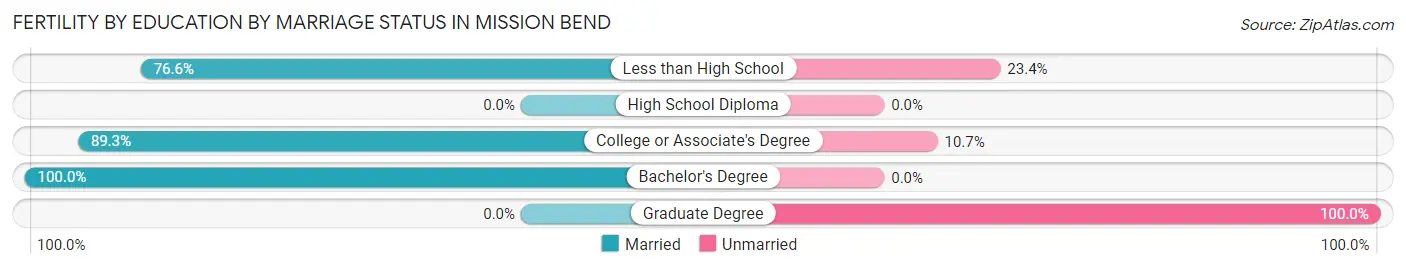
Fertility by Education by Marriage Status in Mission Bend
15.5% of women with births in Mission Bend are unmarried. Women with the educational attainment of bachelor's degree are most likely to be married with 100.0% of them married at childbirth, while women with the educational attainment of graduate degree are least likely to be married with 100.0% of them unmarried at childbirth.
| Educational Attainment | Married | Unmarried |
| Less than High School | 108 (76.6%) | 33 (23.4%) |
| High School Diploma | 0 (0.0%) | 0 (0.0%) |
| College or Associate's Degree | 158 (89.3%) | 19 (10.7%) |
| Bachelor's Degree | 56 (100.0%) | 0 (0.0%) |
| Graduate Degree | 0 (0.0%) | 7 (100.0%) |
| Total | 322 (84.5%) | 59 (15.5%) |
Employment Characteristics in Mission Bend
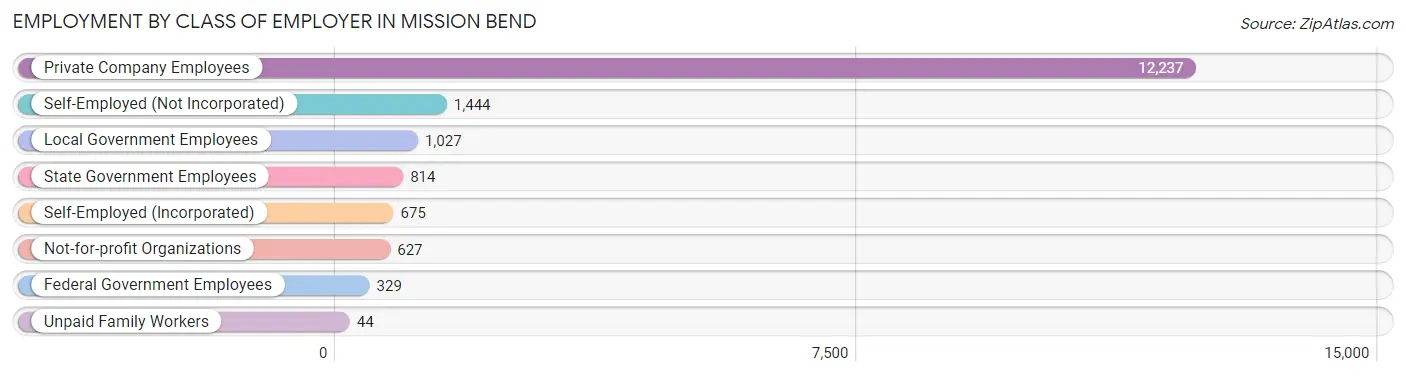
Employment by Class of Employer in Mission Bend
Among the 17,197 employed individuals in Mission Bend, private company employees (12,237 | 71.2%), self-employed (not incorporated) (1,444 | 8.4%), and local government employees (1,027 | 6.0%) make up the most common classes of employment.
| Employer Class | # Employees | % Employees |
| Private Company Employees | 12,237 | 71.2% |
| Self-Employed (Incorporated) | 675 | 3.9% |
| Self-Employed (Not Incorporated) | 1,444 | 8.4% |
| Not-for-profit Organizations | 627 | 3.6% |
| Local Government Employees | 1,027 | 6.0% |
| State Government Employees | 814 | 4.7% |
| Federal Government Employees | 329 | 1.9% |
| Unpaid Family Workers | 44 | 0.3% |
| Total | 17,197 | 100.0% |
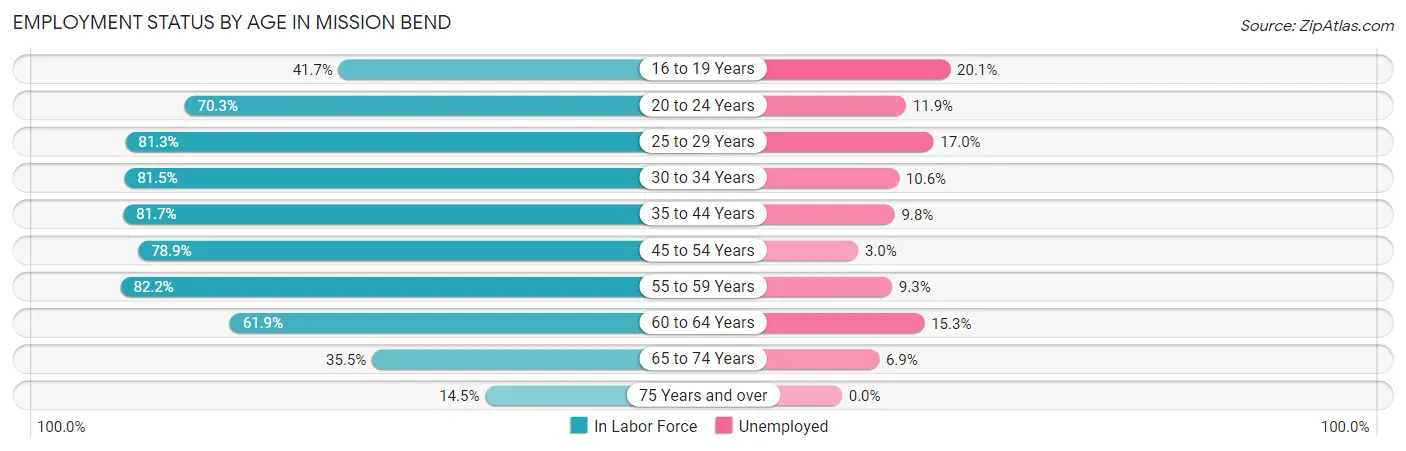
Employment Status by Age in Mission Bend
According to the labor force statistics for Mission Bend, out of the total population over 16 years of age (29,987), 64.5% or 19,342 individuals are in the labor force, with 10.2% or 1,973 of them unemployed. The age group with the highest labor force participation rate is 55 to 59 years, with 82.2% or 2,114 individuals in the labor force. Within the labor force, the 16 to 19 years age range has the highest percentage of unemployed individuals, with 20.1% or 256 of them being unemployed.
| Age Bracket | In Labor Force | Unemployed |
| 16 to 19 Years | 1,274 (41.7%) | 256 (20.1%) |
| 20 to 24 Years | 2,205 (70.3%) | 262 (11.9%) |
| 25 to 29 Years | 1,674 (81.3%) | 285 (17.0%) |
| 30 to 34 Years | 1,844 (81.5%) | 195 (10.6%) |
| 35 to 44 Years | 3,394 (81.7%) | 333 (9.8%) |
| 45 to 54 Years | 3,613 (78.9%) | 108 (3.0%) |
| 55 to 59 Years | 2,114 (82.2%) | 197 (9.3%) |
| 60 to 64 Years | 1,472 (61.9%) | 225 (15.3%) |
| 65 to 74 Years | 1,536 (35.5%) | 106 (6.9%) |
| 75 Years and over | 212 (14.5%) | 0 (0.0%) |
| Total | 19,342 (64.5%) | 1,973 (10.2%) |
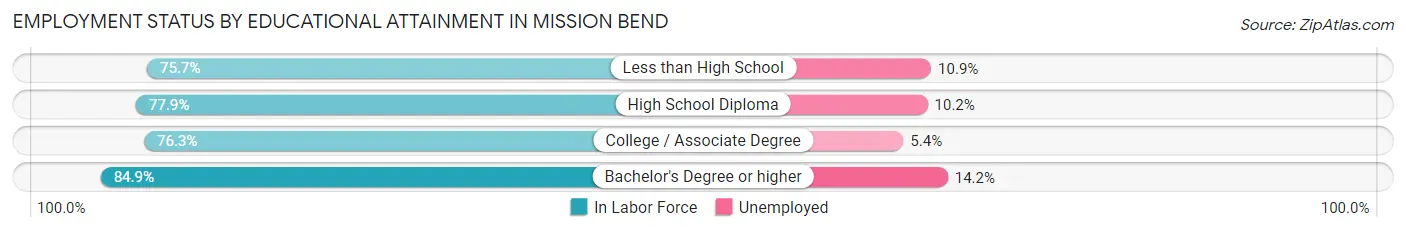
Employment Status by Educational Attainment in Mission Bend
According to labor force statistics for Mission Bend, 78.4% of individuals (14,116) out of the total population between 25 and 64 years of age (18,005) are in the labor force, with 9.5% or 1,341 of them being unemployed. The group with the highest labor force participation rate are those with the educational attainment of bachelor's degree or higher, with 84.9% or 3,094 individuals in the labor force. Within the labor force, individuals with bachelor's degree or higher education have the highest percentage of unemployment, with 14.2% or 439 of them being unemployed.
| Educational Attainment | In Labor Force | Unemployed |
| Less than High School | 2,350 (75.7%) | 338 (10.9%) |
| High School Diploma | 3,769 (77.9%) | 493 (10.2%) |
| College / Associate Degree | 4,897 (76.3%) | 347 (5.4%) |
| Bachelor's Degree or higher | 3,094 (84.9%) | 517 (14.2%) |
| Total | 14,116 (78.4%) | 1,710 (9.5%) |
Employment Occupations by Sex in Mission Bend
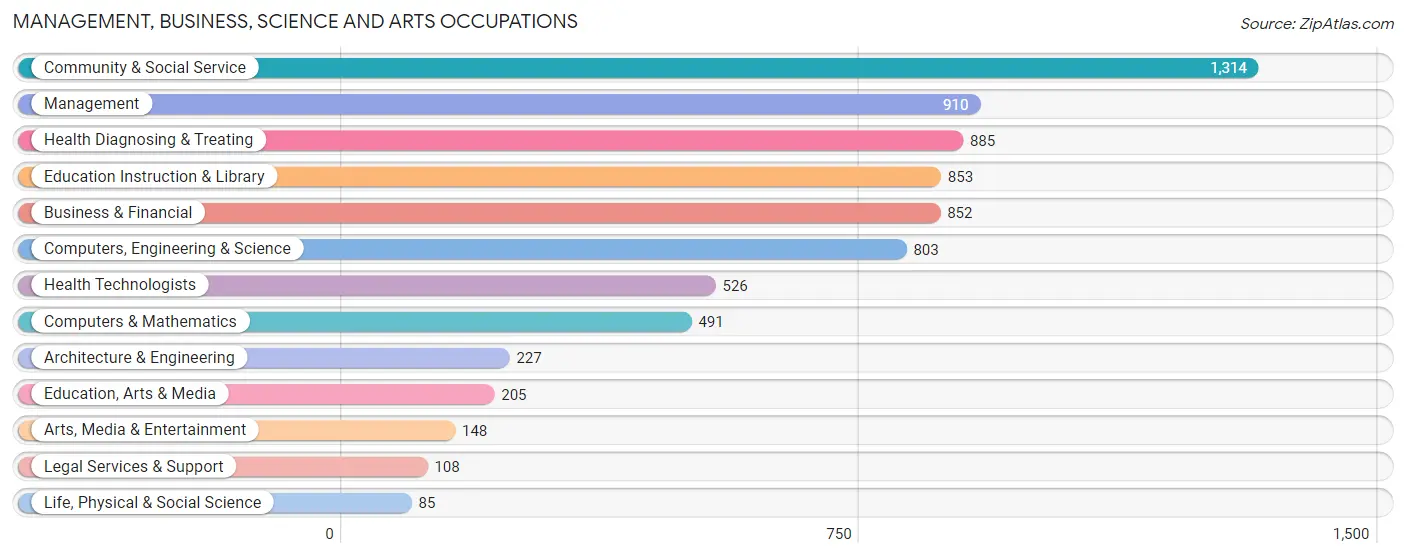
Management, Business, Science and Arts Occupations
The most common Management, Business, Science and Arts occupations in Mission Bend are Community & Social Service (1,314 | 7.6%), Management (910 | 5.2%), Health Diagnosing & Treating (885 | 5.1%), Education Instruction & Library (853 | 4.9%), and Business & Financial (852 | 4.9%).
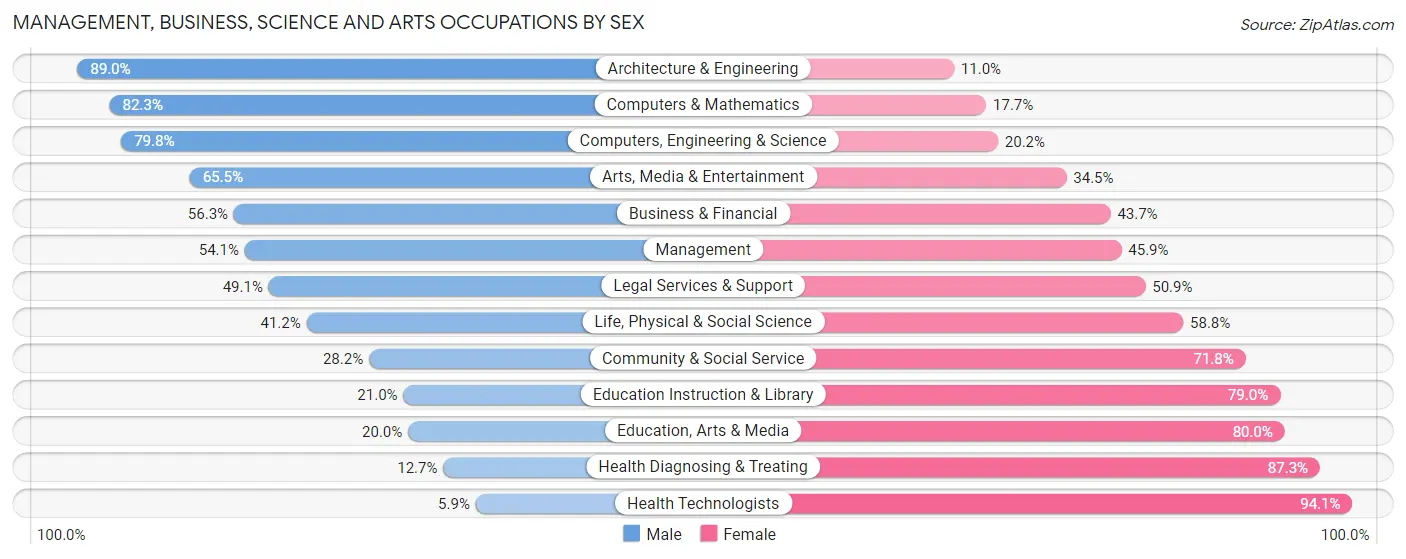
Management, Business, Science and Arts Occupations by Sex
Within the Management, Business, Science and Arts occupations in Mission Bend, the most male-oriented occupations are Architecture & Engineering (89.0%), Computers & Mathematics (82.3%), and Computers, Engineering & Science (79.8%), while the most female-oriented occupations are Health Technologists (94.1%), Health Diagnosing & Treating (87.3%), and Education, Arts & Media (80.0%).
| Occupation | Male | Female |
| Management | 492 (54.1%) | 418 (45.9%) |
| Business & Financial | 480 (56.3%) | 372 (43.7%) |
| Computers, Engineering & Science | 641 (79.8%) | 162 (20.2%) |
| Computers & Mathematics | 404 (82.3%) | 87 (17.7%) |
| Architecture & Engineering | 202 (89.0%) | 25 (11.0%) |
| Life, Physical & Social Science | 35 (41.2%) | 50 (58.8%) |
| Community & Social Service | 370 (28.2%) | 944 (71.8%) |
| Education, Arts & Media | 41 (20.0%) | 164 (80.0%) |
| Legal Services & Support | 53 (49.1%) | 55 (50.9%) |
| Education Instruction & Library | 179 (21.0%) | 674 (79.0%) |
| Arts, Media & Entertainment | 97 (65.5%) | 51 (34.5%) |
| Health Diagnosing & Treating | 112 (12.7%) | 773 (87.3%) |
| Health Technologists | 31 (5.9%) | 495 (94.1%) |
| Total (Category) | 2,095 (44.0%) | 2,669 (56.0%) |
| Total (Overall) | 8,935 (51.4%) | 8,434 (48.6%) |
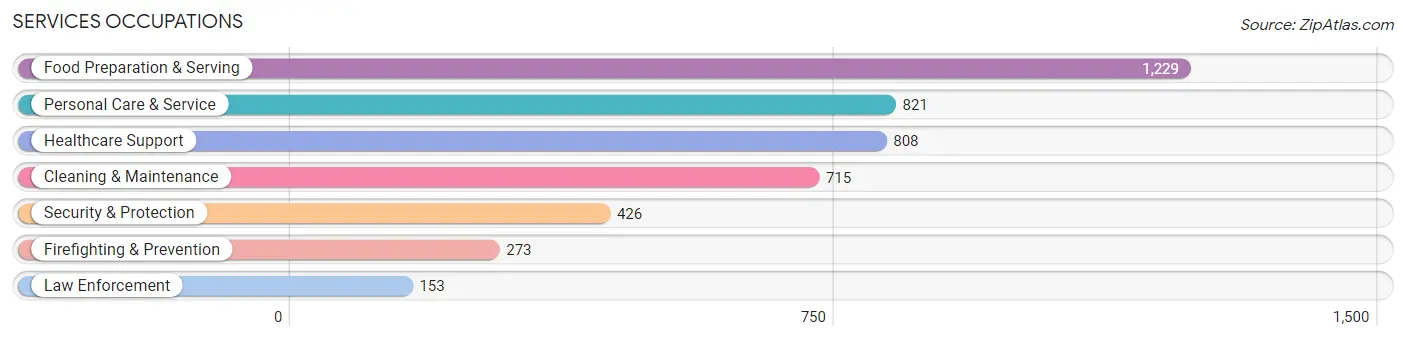
Services Occupations
The most common Services occupations in Mission Bend are Food Preparation & Serving (1,229 | 7.1%), Personal Care & Service (821 | 4.7%), Healthcare Support (808 | 4.6%), Cleaning & Maintenance (715 | 4.1%), and Security & Protection (426 | 2.5%).
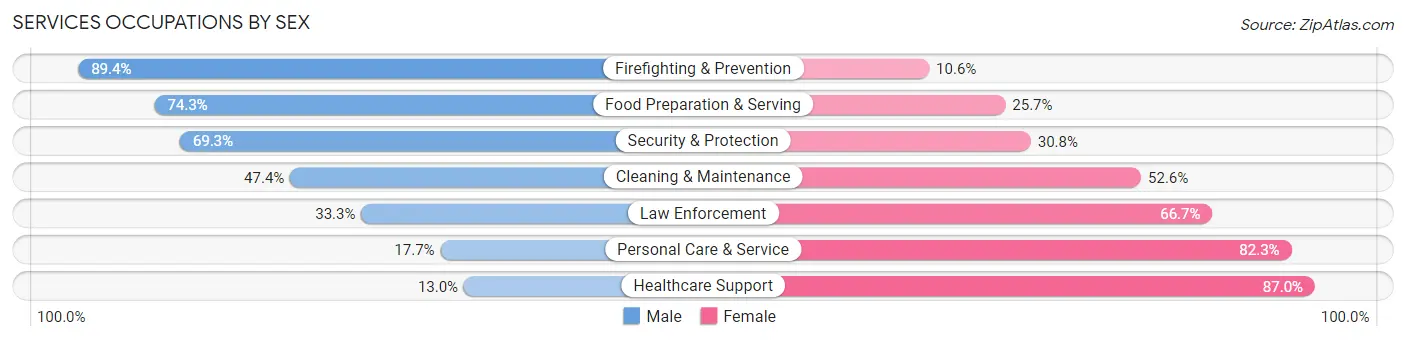
Services Occupations by Sex
Within the Services occupations in Mission Bend, the most male-oriented occupations are Firefighting & Prevention (89.4%), Food Preparation & Serving (74.3%), and Security & Protection (69.3%), while the most female-oriented occupations are Healthcare Support (87.0%), Personal Care & Service (82.3%), and Law Enforcement (66.7%).
| Occupation | Male | Female |
| Healthcare Support | 105 (13.0%) | 703 (87.0%) |
| Security & Protection | 295 (69.3%) | 131 (30.7%) |
| Firefighting & Prevention | 244 (89.4%) | 29 (10.6%) |
| Law Enforcement | 51 (33.3%) | 102 (66.7%) |
| Food Preparation & Serving | 913 (74.3%) | 316 (25.7%) |
| Cleaning & Maintenance | 339 (47.4%) | 376 (52.6%) |
| Personal Care & Service | 145 (17.7%) | 676 (82.3%) |
| Total (Category) | 1,797 (44.9%) | 2,202 (55.1%) |
| Total (Overall) | 8,935 (51.4%) | 8,434 (48.6%) |
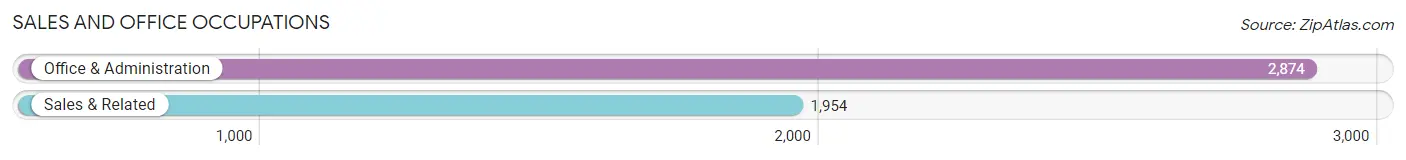
Sales and Office Occupations
The most common Sales and Office occupations in Mission Bend are Office & Administration (2,874 | 16.6%), and Sales & Related (1,954 | 11.3%).
Sales and Office Occupations by Sex
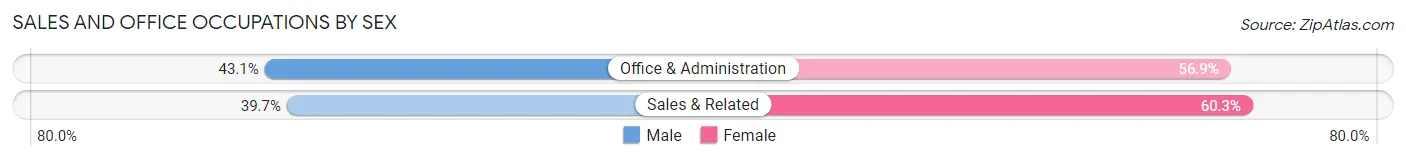
| Occupation | Male | Female |
| Sales & Related | 775 (39.7%) | 1,179 (60.3%) |
| Office & Administration | 1,238 (43.1%) | 1,636 (56.9%) |
| Total (Category) | 2,013 (41.7%) | 2,815 (58.3%) |
| Total (Overall) | 8,935 (51.4%) | 8,434 (48.6%) |
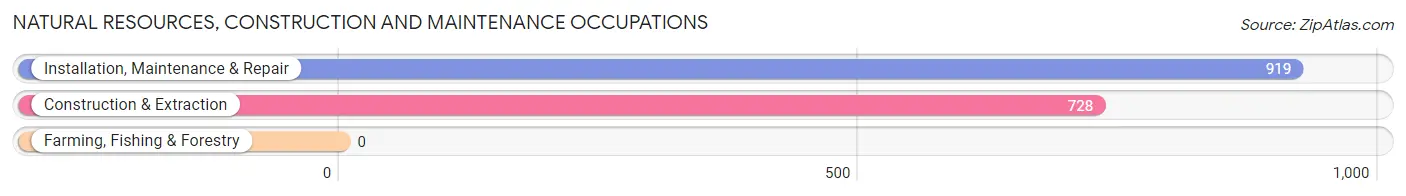
Natural Resources, Construction and Maintenance Occupations
The most common Natural Resources, Construction and Maintenance occupations in Mission Bend are Installation, Maintenance & Repair (919 | 5.3%), and Construction & Extraction (728 | 4.2%).
Natural Resources, Construction and Maintenance Occupations by Sex
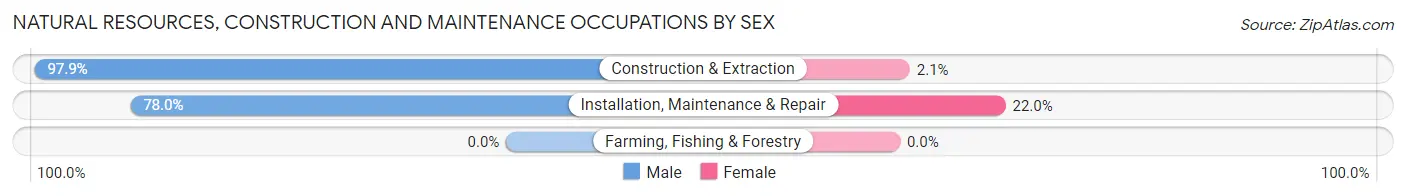
| Occupation | Male | Female |
| Farming, Fishing & Forestry | 0 (0.0%) | 0 (0.0%) |
| Construction & Extraction | 713 (97.9%) | 15 (2.1%) |
| Installation, Maintenance & Repair | 717 (78.0%) | 202 (22.0%) |
| Total (Category) | 1,430 (86.8%) | 217 (13.2%) |
| Total (Overall) | 8,935 (51.4%) | 8,434 (48.6%) |
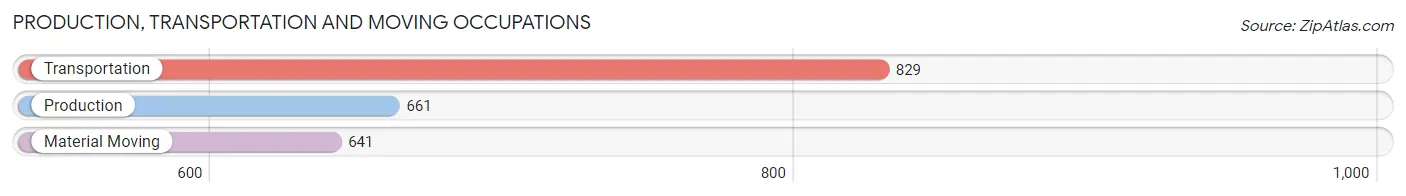
Production, Transportation and Moving Occupations
The most common Production, Transportation and Moving occupations in Mission Bend are Transportation (829 | 4.8%), Production (661 | 3.8%), and Material Moving (641 | 3.7%).
Production, Transportation and Moving Occupations by Sex
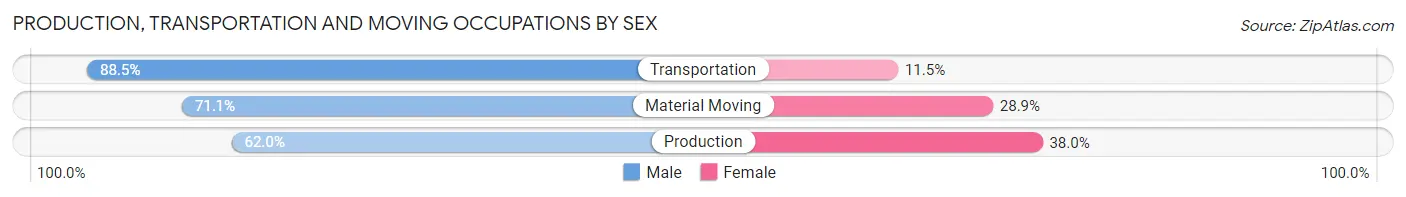
| Occupation | Male | Female |
| Production | 410 (62.0%) | 251 (38.0%) |
| Transportation | 734 (88.5%) | 95 (11.5%) |
| Material Moving | 456 (71.1%) | 185 (28.9%) |
| Total (Category) | 1,600 (75.1%) | 531 (24.9%) |
| Total (Overall) | 8,935 (51.4%) | 8,434 (48.6%) |
Employment Industries by Sex in Mission Bend
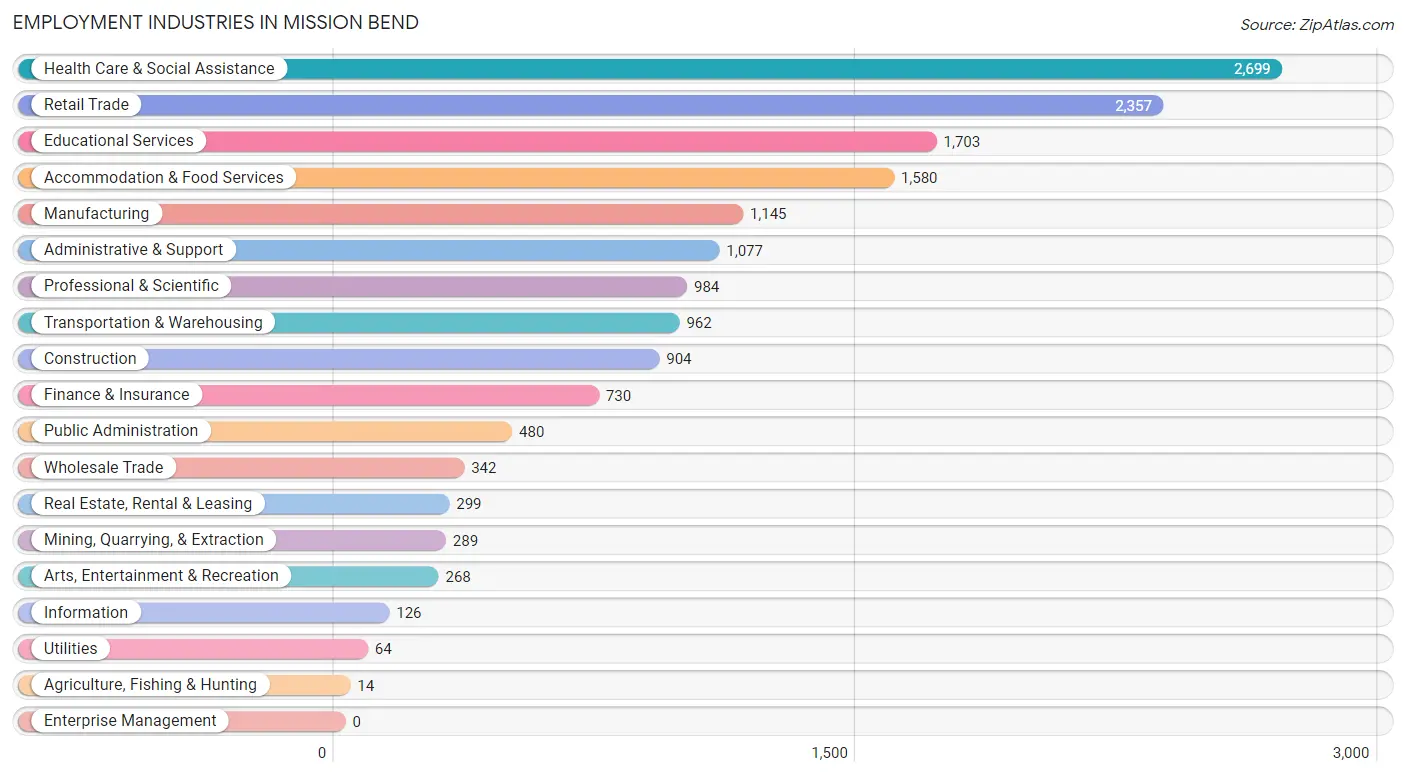
Employment Industries in Mission Bend
The major employment industries in Mission Bend include Health Care & Social Assistance (2,699 | 15.5%), Retail Trade (2,357 | 13.6%), Educational Services (1,703 | 9.8%), Accommodation & Food Services (1,580 | 9.1%), and Manufacturing (1,145 | 6.6%).
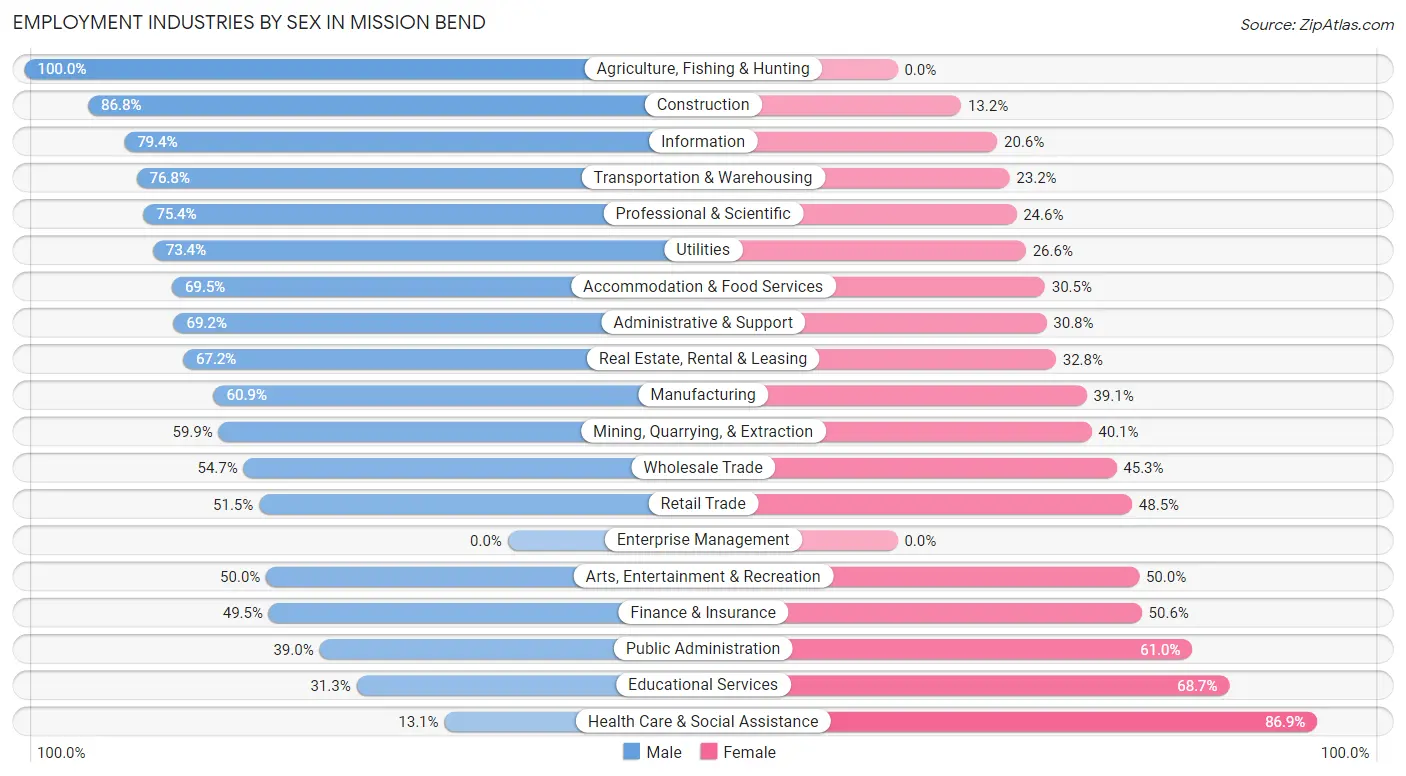
Employment Industries by Sex in Mission Bend
The Mission Bend industries that see more men than women are Agriculture, Fishing & Hunting (100.0%), Construction (86.8%), and Information (79.4%), whereas the industries that tend to have a higher number of women are Health Care & Social Assistance (86.9%), Educational Services (68.7%), and Public Administration (61.0%).
| Industry | Male | Female |
| Agriculture, Fishing & Hunting | 14 (100.0%) | 0 (0.0%) |
| Mining, Quarrying, & Extraction | 173 (59.9%) | 116 (40.1%) |
| Construction | 785 (86.8%) | 119 (13.2%) |
| Manufacturing | 697 (60.9%) | 448 (39.1%) |
| Wholesale Trade | 187 (54.7%) | 155 (45.3%) |
| Retail Trade | 1,213 (51.5%) | 1,144 (48.5%) |
| Transportation & Warehousing | 739 (76.8%) | 223 (23.2%) |
| Utilities | 47 (73.4%) | 17 (26.6%) |
| Information | 100 (79.4%) | 26 (20.6%) |
| Finance & Insurance | 361 (49.4%) | 369 (50.5%) |
| Real Estate, Rental & Leasing | 201 (67.2%) | 98 (32.8%) |
| Professional & Scientific | 742 (75.4%) | 242 (24.6%) |
| Enterprise Management | 0 (0.0%) | 0 (0.0%) |
| Administrative & Support | 745 (69.2%) | 332 (30.8%) |
| Educational Services | 533 (31.3%) | 1,170 (68.7%) |
| Health Care & Social Assistance | 354 (13.1%) | 2,345 (86.9%) |
| Arts, Entertainment & Recreation | 134 (50.0%) | 134 (50.0%) |
| Accommodation & Food Services | 1,098 (69.5%) | 482 (30.5%) |
| Public Administration | 187 (39.0%) | 293 (61.0%) |
| Total | 8,935 (51.4%) | 8,434 (48.6%) |
Education in Mission Bend
School Enrollment in Mission Bend
The most common levels of schooling among the 11,579 students in Mission Bend are college / undergraduate (3,644 | 31.5%), high school (2,768 | 23.9%), and middle school (2,327 | 20.1%).
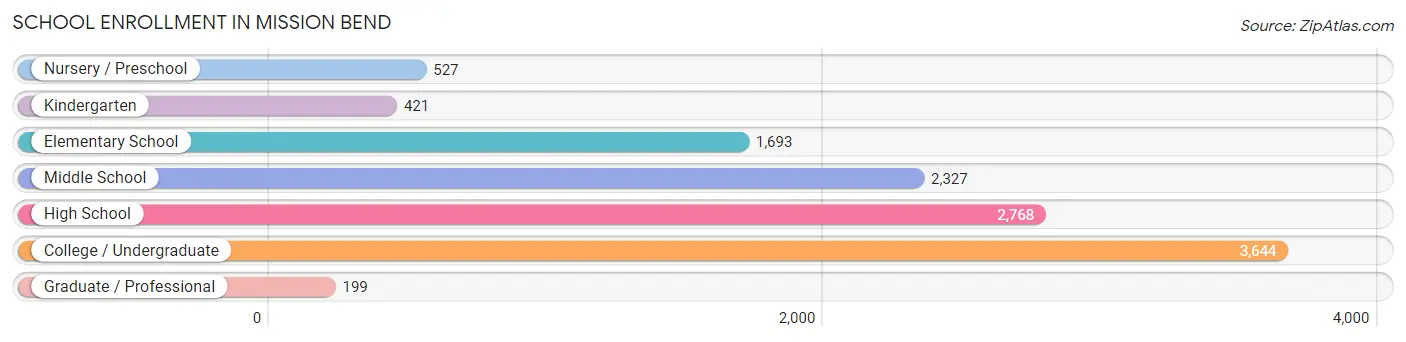
| School Level | # Students | % Students |
| Nursery / Preschool | 527 | 4.5% |
| Kindergarten | 421 | 3.6% |
| Elementary School | 1,693 | 14.6% |
| Middle School | 2,327 | 20.1% |
| High School | 2,768 | 23.9% |
| College / Undergraduate | 3,644 | 31.5% |
| Graduate / Professional | 199 | 1.7% |
| Total | 11,579 | 100.0% |
School Enrollment by Age by Funding Source in Mission Bend
Out of a total of 11,579 students who are enrolled in schools in Mission Bend, 926 (8.0%) attend a private institution, while the remaining 10,653 (92.0%) are enrolled in public schools. The age group of 35 years and over has the highest likelihood of being enrolled in private schools, with 182 (29.2% in the age bracket) enrolled. Conversely, the age group of 3 to 4 year olds has the lowest likelihood of being enrolled in a private school, with 323 (97.6% in the age bracket) attending a public institution.
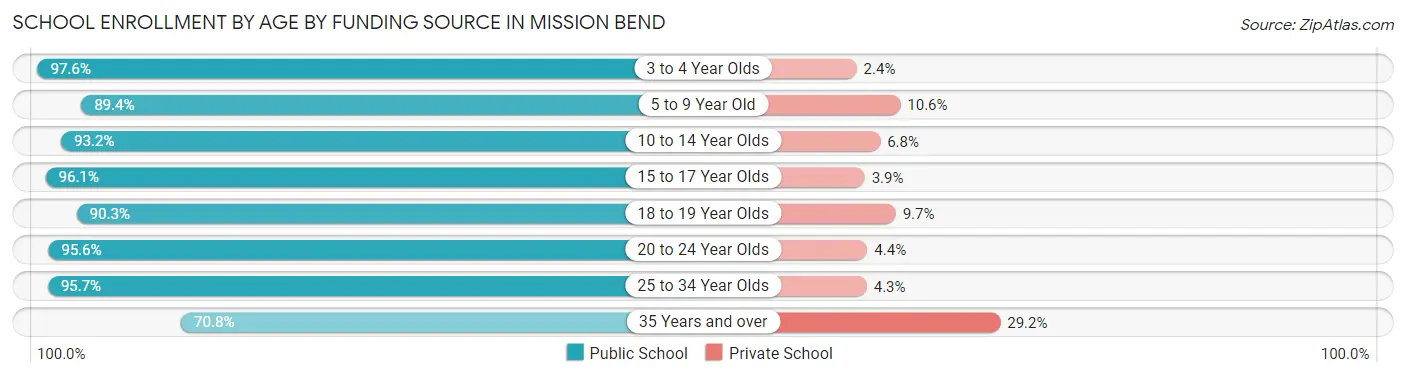
| Age Bracket | Public School | Private School |
| 3 to 4 Year Olds | 323 (97.6%) | 8 (2.4%) |
| 5 to 9 Year Old | 2,024 (89.4%) | 239 (10.6%) |
| 10 to 14 Year Olds | 2,482 (93.2%) | 181 (6.8%) |
| 15 to 17 Year Olds | 1,692 (96.1%) | 69 (3.9%) |
| 18 to 19 Year Olds | 1,294 (90.3%) | 139 (9.7%) |
| 20 to 24 Year Olds | 1,750 (95.6%) | 81 (4.4%) |
| 25 to 34 Year Olds | 644 (95.7%) | 29 (4.3%) |
| 35 Years and over | 442 (70.8%) | 182 (29.2%) |
| Total | 10,653 (92.0%) | 926 (8.0%) |
Educational Attainment by Field of Study in Mission Bend
Business (1,484 | 26.8%), science & technology (742 | 13.4%), liberal arts & history (453 | 8.2%), computers & mathematics (399 | 7.2%), and engineering (389 | 7.0%) are the most common fields of study among 5,547 individuals in Mission Bend who have obtained a bachelor's degree or higher.
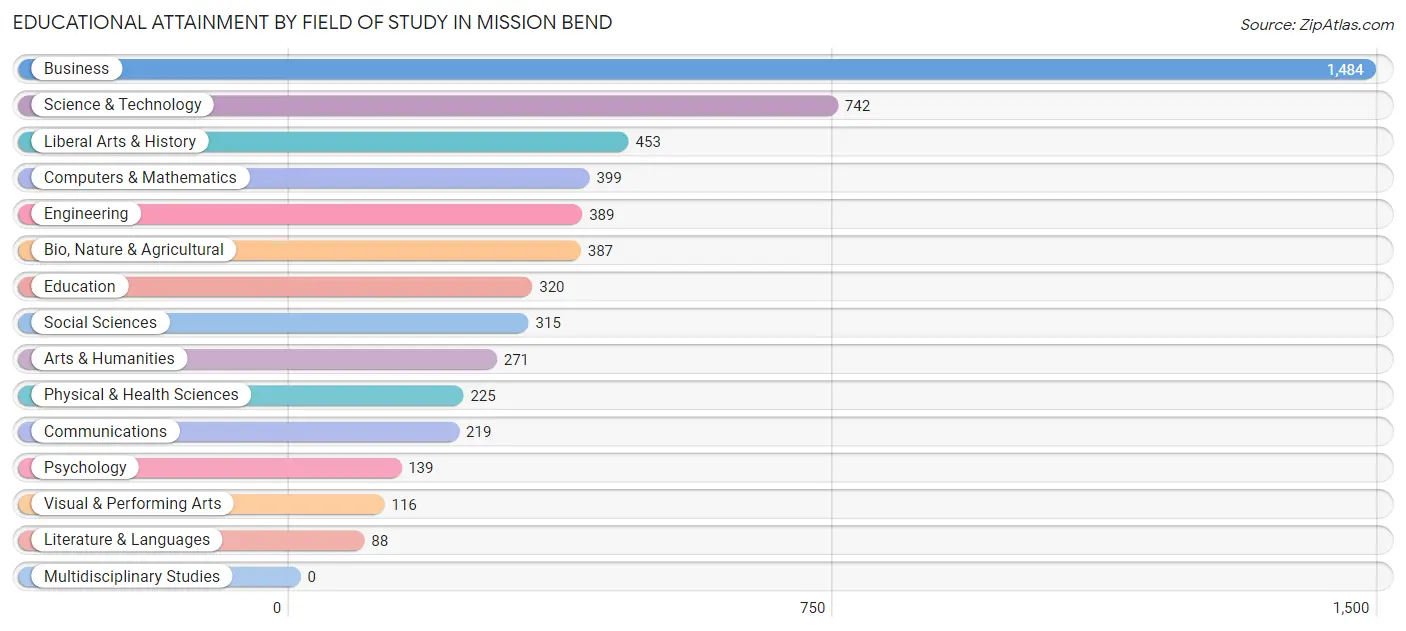
| Field of Study | # Graduates | % Graduates |
| Computers & Mathematics | 399 | 7.2% |
| Bio, Nature & Agricultural | 387 | 7.0% |
| Physical & Health Sciences | 225 | 4.1% |
| Psychology | 139 | 2.5% |
| Social Sciences | 315 | 5.7% |
| Engineering | 389 | 7.0% |
| Multidisciplinary Studies | 0 | 0.0% |
| Science & Technology | 742 | 13.4% |
| Business | 1,484 | 26.8% |
| Education | 320 | 5.8% |
| Literature & Languages | 88 | 1.6% |
| Liberal Arts & History | 453 | 8.2% |
| Visual & Performing Arts | 116 | 2.1% |
| Communications | 219 | 4.0% |
| Arts & Humanities | 271 | 4.9% |
| Total | 5,547 | 100.0% |
Transportation & Commute in Mission Bend
Vehicle Availability by Sex in Mission Bend
The most prevalent vehicle ownership categories in Mission Bend are males with 2 vehicles (3,572, accounting for 40.2%) and females with 2 vehicles (2,791, making up 43.0%).
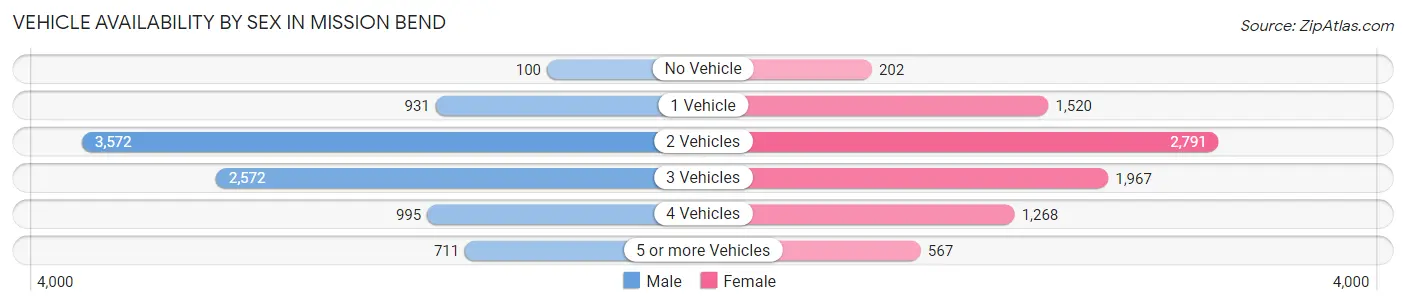
| Vehicles Available | Male | Female |
| No Vehicle | 100 (1.1%) | 202 (2.4%) |
| 1 Vehicle | 931 (10.5%) | 1,520 (18.3%) |
| 2 Vehicles | 3,572 (40.2%) | 2,791 (33.6%) |
| 3 Vehicles | 2,572 (29.0%) | 1,967 (23.7%) |
| 4 Vehicles | 995 (11.2%) | 1,268 (15.2%) |
| 5 or more Vehicles | 711 (8.0%) | 567 (6.8%) |
| Total | 8,881 (100.0%) | 8,315 (100.0%) |
Commute Time in Mission Bend
The most frequently occuring commute durations in Mission Bend are 30 to 34 minutes (2,572 commuters, 16.3%), 45 to 59 minutes (2,172 commuters, 13.8%), and 15 to 19 minutes (2,117 commuters, 13.4%).
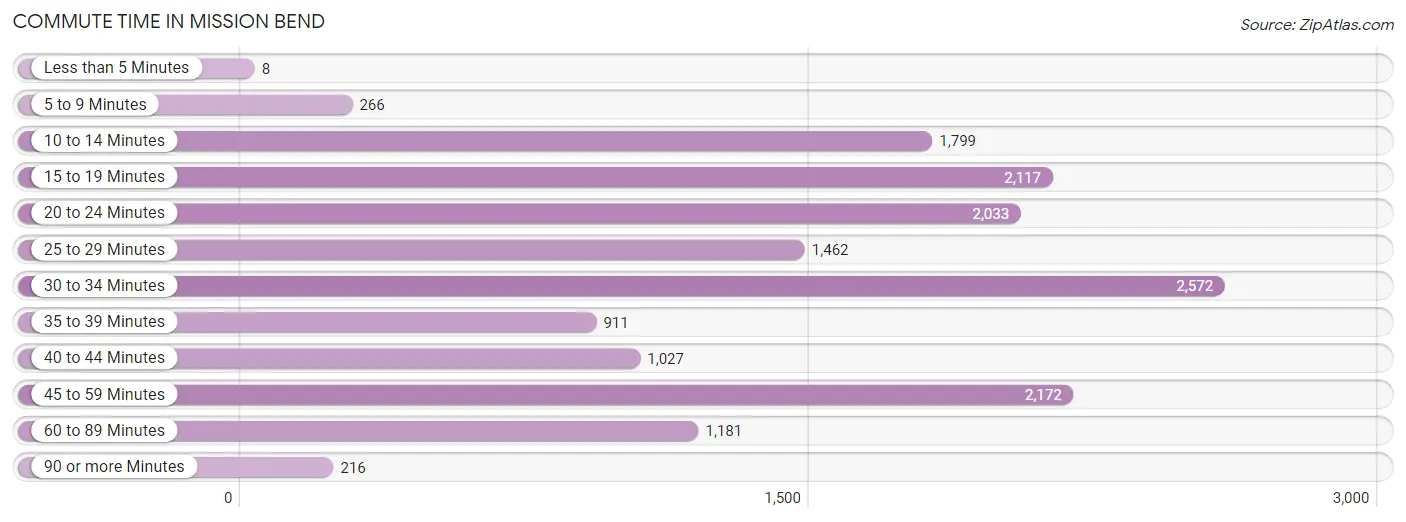
| Commute Time | # Commuters | % Commuters |
| Less than 5 Minutes | 8 | 0.1% |
| 5 to 9 Minutes | 266 | 1.7% |
| 10 to 14 Minutes | 1,799 | 11.4% |
| 15 to 19 Minutes | 2,117 | 13.4% |
| 20 to 24 Minutes | 2,033 | 12.9% |
| 25 to 29 Minutes | 1,462 | 9.3% |
| 30 to 34 Minutes | 2,572 | 16.3% |
| 35 to 39 Minutes | 911 | 5.8% |
| 40 to 44 Minutes | 1,027 | 6.5% |
| 45 to 59 Minutes | 2,172 | 13.8% |
| 60 to 89 Minutes | 1,181 | 7.5% |
| 90 or more Minutes | 216 | 1.4% |
Commute Time by Sex in Mission Bend
The most common commute times in Mission Bend are 30 to 34 minutes (1,255 commuters, 15.1%) for males and 30 to 34 minutes (1,317 commuters, 17.6%) for females.
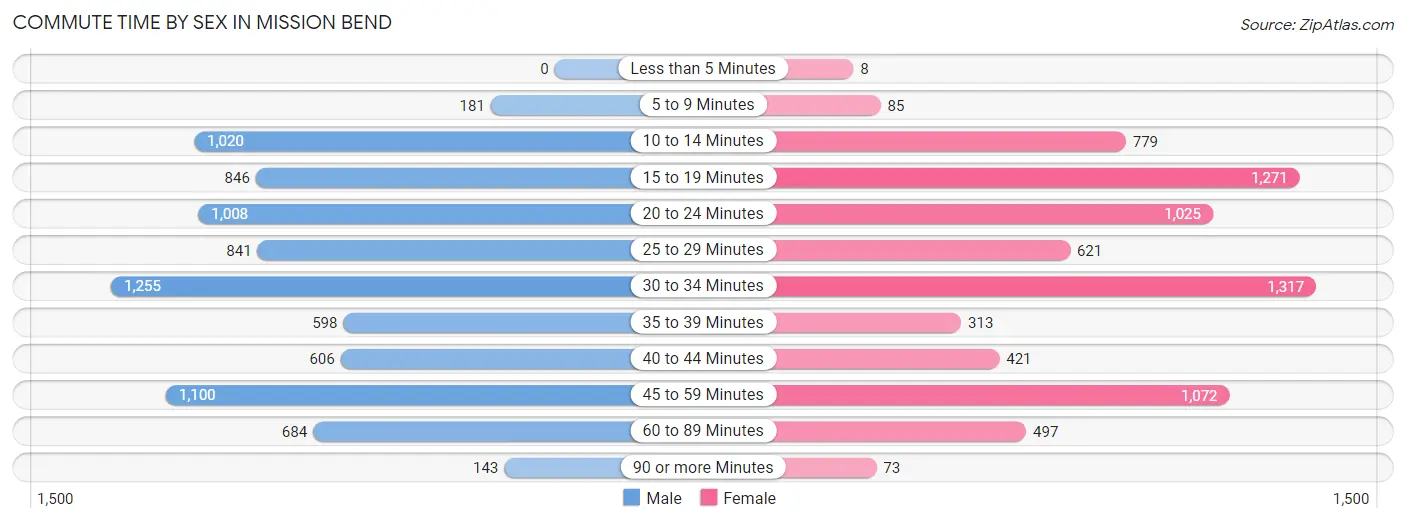
| Commute Time | Male | Female |
| Less than 5 Minutes | 0 (0.0%) | 8 (0.1%) |
| 5 to 9 Minutes | 181 (2.2%) | 85 (1.1%) |
| 10 to 14 Minutes | 1,020 (12.3%) | 779 (10.4%) |
| 15 to 19 Minutes | 846 (10.2%) | 1,271 (17.0%) |
| 20 to 24 Minutes | 1,008 (12.2%) | 1,025 (13.7%) |
| 25 to 29 Minutes | 841 (10.2%) | 621 (8.3%) |
| 30 to 34 Minutes | 1,255 (15.1%) | 1,317 (17.6%) |
| 35 to 39 Minutes | 598 (7.2%) | 313 (4.2%) |
| 40 to 44 Minutes | 606 (7.3%) | 421 (5.6%) |
| 45 to 59 Minutes | 1,100 (13.3%) | 1,072 (14.3%) |
| 60 to 89 Minutes | 684 (8.3%) | 497 (6.6%) |
| 90 or more Minutes | 143 (1.7%) | 73 (1.0%) |
Time of Departure to Work by Sex in Mission Bend
The most frequent times of departure to work in Mission Bend are 8:00 AM to 8:29 AM (1,221, 14.7%) for males and 8:00 AM to 8:29 AM (1,005, 13.4%) for females.
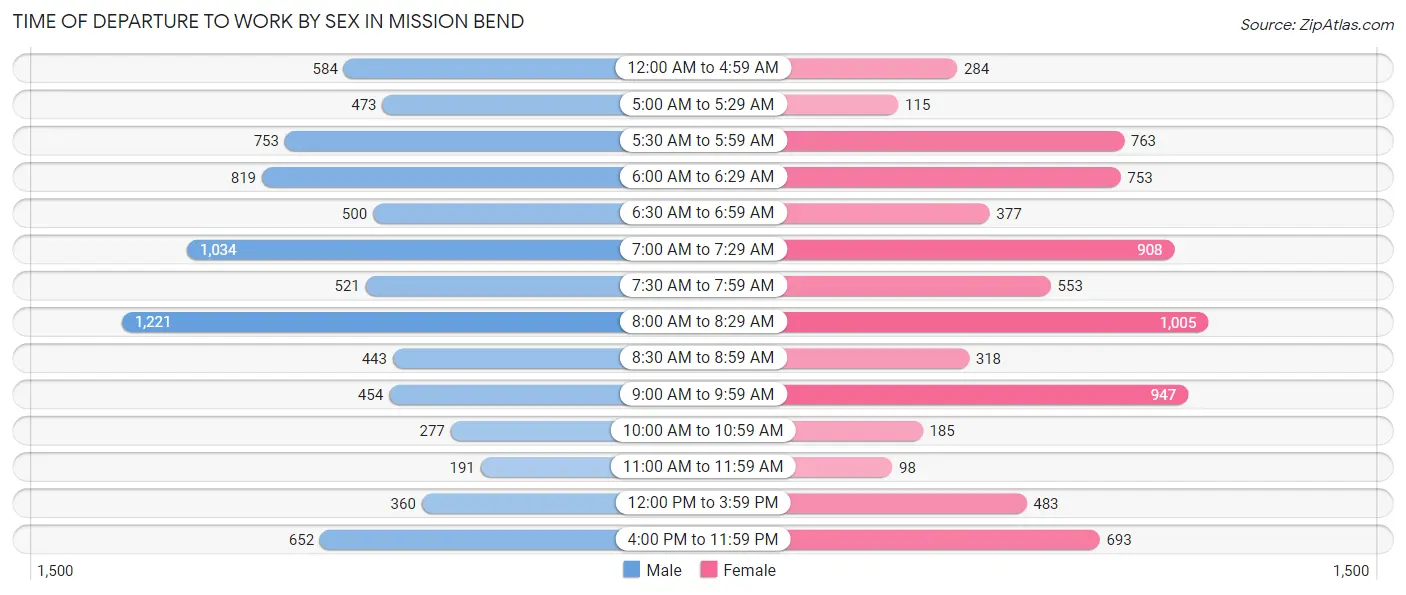
| Time of Departure | Male | Female |
| 12:00 AM to 4:59 AM | 584 (7.0%) | 284 (3.8%) |
| 5:00 AM to 5:29 AM | 473 (5.7%) | 115 (1.5%) |
| 5:30 AM to 5:59 AM | 753 (9.1%) | 763 (10.2%) |
| 6:00 AM to 6:29 AM | 819 (9.9%) | 753 (10.1%) |
| 6:30 AM to 6:59 AM | 500 (6.0%) | 377 (5.0%) |
| 7:00 AM to 7:29 AM | 1,034 (12.5%) | 908 (12.1%) |
| 7:30 AM to 7:59 AM | 521 (6.3%) | 553 (7.4%) |
| 8:00 AM to 8:29 AM | 1,221 (14.7%) | 1,005 (13.4%) |
| 8:30 AM to 8:59 AM | 443 (5.3%) | 318 (4.3%) |
| 9:00 AM to 9:59 AM | 454 (5.5%) | 947 (12.7%) |
| 10:00 AM to 10:59 AM | 277 (3.3%) | 185 (2.5%) |
| 11:00 AM to 11:59 AM | 191 (2.3%) | 98 (1.3%) |
| 12:00 PM to 3:59 PM | 360 (4.3%) | 483 (6.5%) |
| 4:00 PM to 11:59 PM | 652 (7.9%) | 693 (9.3%) |
| Total | 8,282 (100.0%) | 7,482 (100.0%) |
Housing Occupancy in Mission Bend
Occupancy by Ownership in Mission Bend
Of the total 11,116 dwellings in Mission Bend, owner-occupied units account for 8,819 (79.3%), while renter-occupied units make up 2,297 (20.7%).
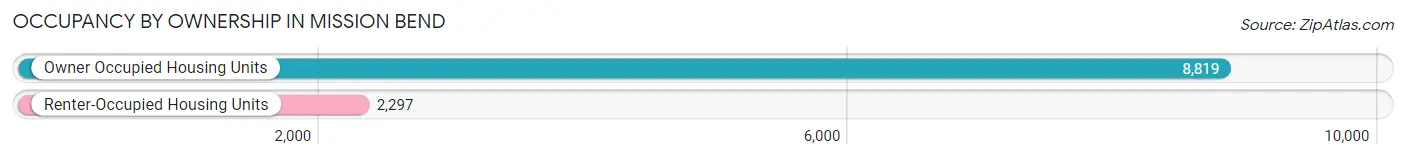
| Occupancy | # Housing Units | % Housing Units |
| Owner Occupied Housing Units | 8,819 | 79.3% |
| Renter-Occupied Housing Units | 2,297 | 20.7% |
| Total Occupied Housing Units | 11,116 | 100.0% |
Occupancy by Household Size in Mission Bend
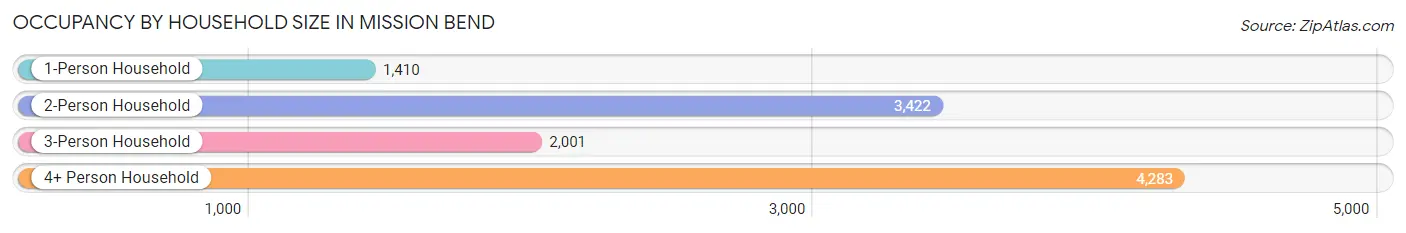
| Household Size | # Housing Units | % Housing Units |
| 1-Person Household | 1,410 | 12.7% |
| 2-Person Household | 3,422 | 30.8% |
| 3-Person Household | 2,001 | 18.0% |
| 4+ Person Household | 4,283 | 38.5% |
| Total Housing Units | 11,116 | 100.0% |
Occupancy by Ownership by Household Size in Mission Bend
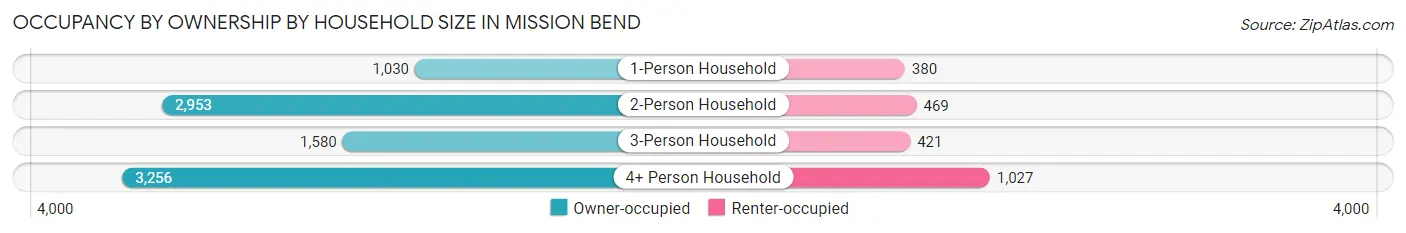
| Household Size | Owner-occupied | Renter-occupied |
| 1-Person Household | 1,030 (73.1%) | 380 (27.0%) |
| 2-Person Household | 2,953 (86.3%) | 469 (13.7%) |
| 3-Person Household | 1,580 (79.0%) | 421 (21.0%) |
| 4+ Person Household | 3,256 (76.0%) | 1,027 (24.0%) |
| Total Housing Units | 8,819 (79.3%) | 2,297 (20.7%) |
Occupancy by Educational Attainment in Mission Bend
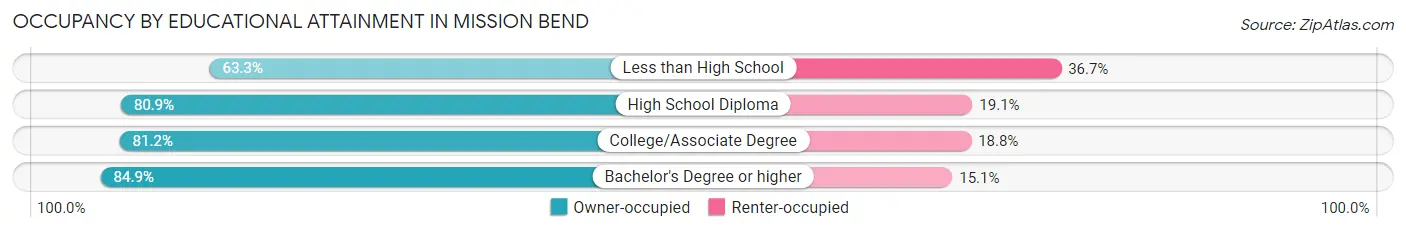
| Household Size | Owner-occupied | Renter-occupied |
| Less than High School | 1,115 (63.3%) | 646 (36.7%) |
| High School Diploma | 2,137 (80.9%) | 504 (19.1%) |
| College/Associate Degree | 2,895 (81.2%) | 672 (18.8%) |
| Bachelor's Degree or higher | 2,672 (84.9%) | 475 (15.1%) |
Occupancy by Age of Householder in Mission Bend
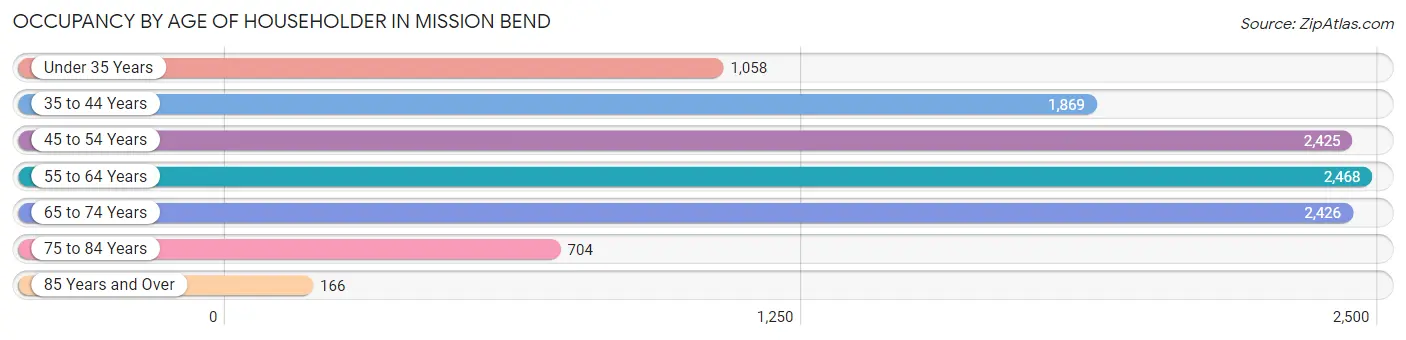
| Age Bracket | # Households | % Households |
| Under 35 Years | 1,058 | 9.5% |
| 35 to 44 Years | 1,869 | 16.8% |
| 45 to 54 Years | 2,425 | 21.8% |
| 55 to 64 Years | 2,468 | 22.2% |
| 65 to 74 Years | 2,426 | 21.8% |
| 75 to 84 Years | 704 | 6.3% |
| 85 Years and Over | 166 | 1.5% |
| Total | 11,116 | 100.0% |
Housing Finances in Mission Bend
Median Income by Occupancy in Mission Bend
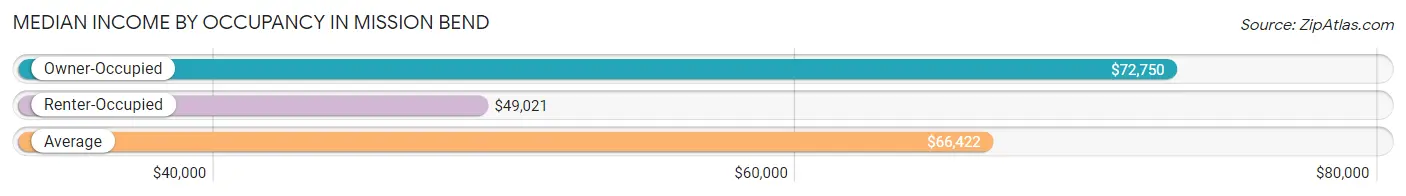
| Occupancy Type | # Households | Median Income |
| Owner-Occupied | 8,819 (79.3%) | $72,750 |
| Renter-Occupied | 2,297 (20.7%) | $49,021 |
| Average | 11,116 (100.0%) | $66,422 |
Occupancy by Householder Income Bracket in Mission Bend
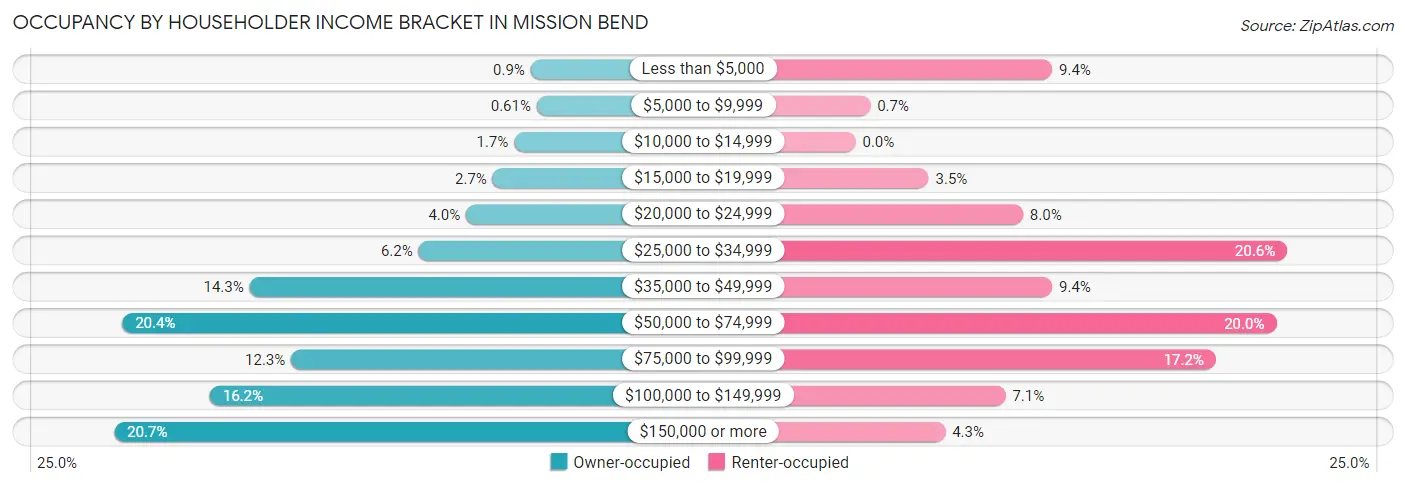
| Income Bracket | Owner-occupied | Renter-occupied |
| Less than $5,000 | 79 (0.9%) | 215 (9.4%) |
| $5,000 to $9,999 | 54 (0.6%) | 16 (0.7%) |
| $10,000 to $14,999 | 149 (1.7%) | 0 (0.0%) |
| $15,000 to $19,999 | 239 (2.7%) | 80 (3.5%) |
| $20,000 to $24,999 | 351 (4.0%) | 183 (8.0%) |
| $25,000 to $34,999 | 550 (6.2%) | 472 (20.5%) |
| $35,000 to $49,999 | 1,260 (14.3%) | 215 (9.4%) |
| $50,000 to $74,999 | 1,795 (20.3%) | 460 (20.0%) |
| $75,000 to $99,999 | 1,086 (12.3%) | 394 (17.2%) |
| $100,000 to $149,999 | 1,427 (16.2%) | 164 (7.1%) |
| $150,000 or more | 1,829 (20.7%) | 98 (4.3%) |
| Total | 8,819 (100.0%) | 2,297 (100.0%) |
Monthly Housing Cost Tiers in Mission Bend
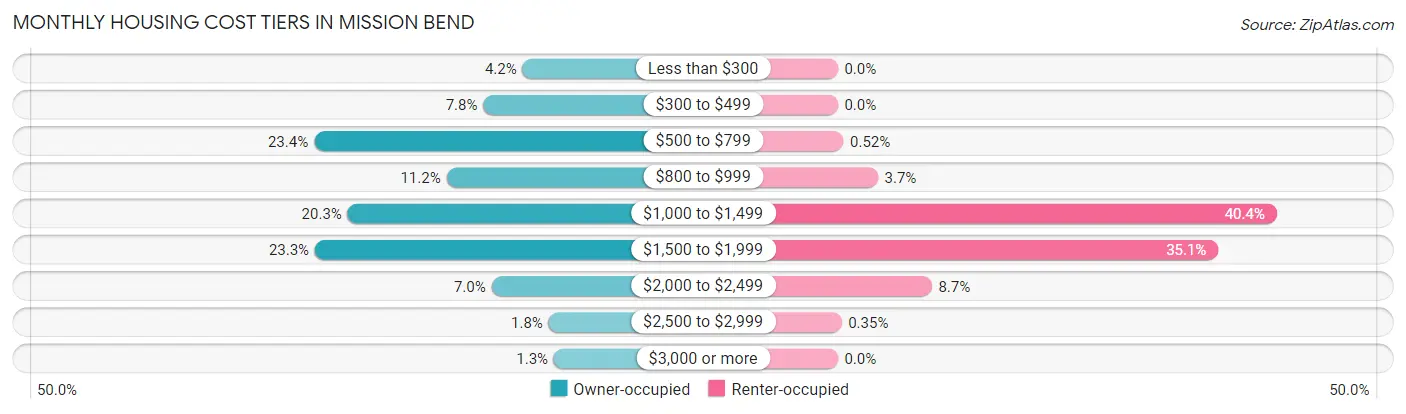
| Monthly Cost | Owner-occupied | Renter-occupied |
| Less than $300 | 367 (4.2%) | 0 (0.0%) |
| $300 to $499 | 685 (7.8%) | 0 (0.0%) |
| $500 to $799 | 2,060 (23.4%) | 12 (0.5%) |
| $800 to $999 | 984 (11.2%) | 85 (3.7%) |
| $1,000 to $1,499 | 1,787 (20.3%) | 929 (40.4%) |
| $1,500 to $1,999 | 2,052 (23.3%) | 805 (35.0%) |
| $2,000 to $2,499 | 618 (7.0%) | 199 (8.7%) |
| $2,500 to $2,999 | 154 (1.8%) | 8 (0.4%) |
| $3,000 or more | 112 (1.3%) | 0 (0.0%) |
| Total | 8,819 (100.0%) | 2,297 (100.0%) |
Physical Housing Characteristics in Mission Bend
Housing Structures in Mission Bend
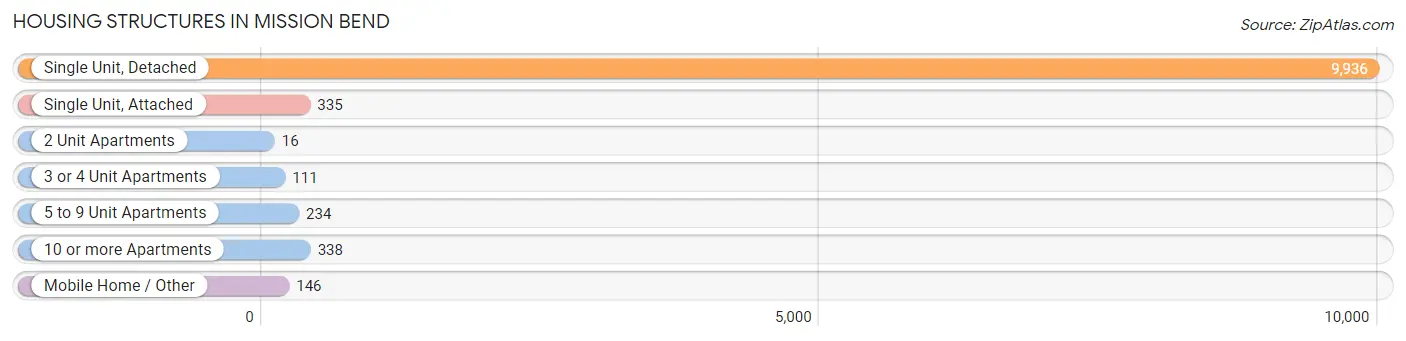
| Structure Type | # Housing Units | % Housing Units |
| Single Unit, Detached | 9,936 | 89.4% |
| Single Unit, Attached | 335 | 3.0% |
| 2 Unit Apartments | 16 | 0.1% |
| 3 or 4 Unit Apartments | 111 | 1.0% |
| 5 to 9 Unit Apartments | 234 | 2.1% |
| 10 or more Apartments | 338 | 3.0% |
| Mobile Home / Other | 146 | 1.3% |
| Total | 11,116 | 100.0% |
Housing Structures by Occupancy in Mission Bend
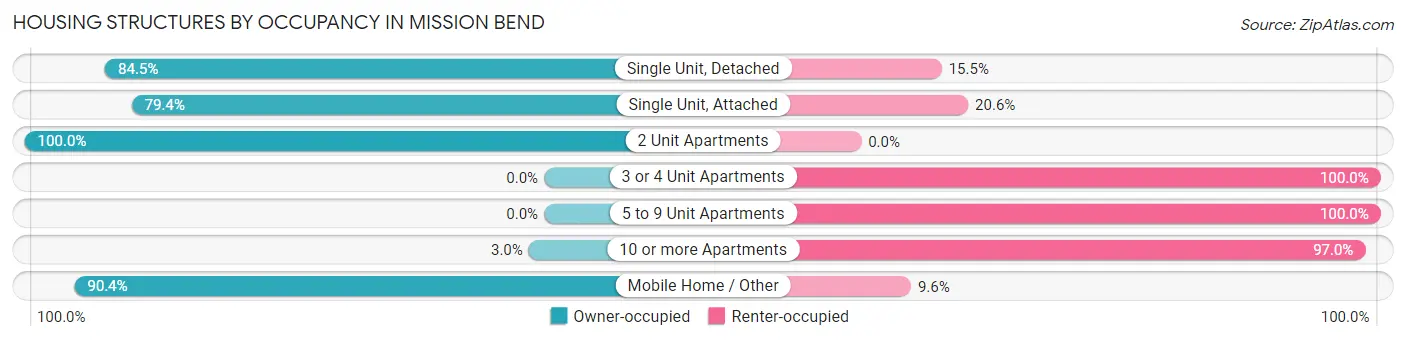
| Structure Type | Owner-occupied | Renter-occupied |
| Single Unit, Detached | 8,395 (84.5%) | 1,541 (15.5%) |
| Single Unit, Attached | 266 (79.4%) | 69 (20.6%) |
| 2 Unit Apartments | 16 (100.0%) | 0 (0.0%) |
| 3 or 4 Unit Apartments | 0 (0.0%) | 111 (100.0%) |
| 5 to 9 Unit Apartments | 0 (0.0%) | 234 (100.0%) |
| 10 or more Apartments | 10 (3.0%) | 328 (97.0%) |
| Mobile Home / Other | 132 (90.4%) | 14 (9.6%) |
| Total | 8,819 (79.3%) | 2,297 (20.7%) |
Housing Structures by Number of Rooms in Mission Bend
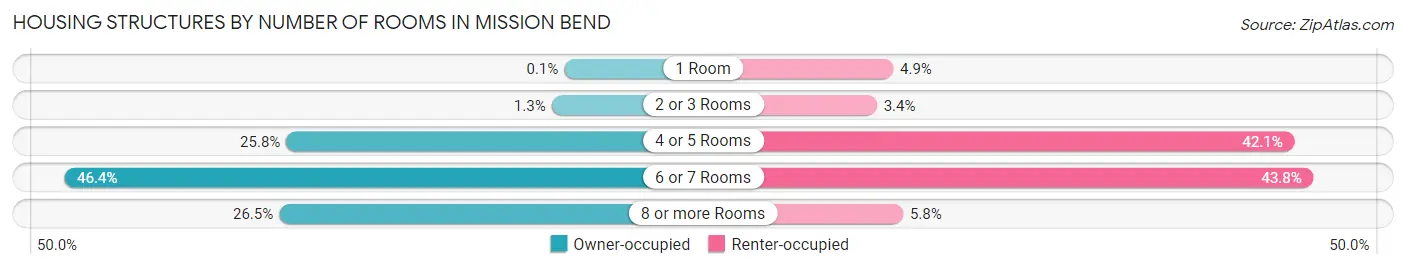
| Number of Rooms | Owner-occupied | Renter-occupied |
| 1 Room | 9 (0.1%) | 113 (4.9%) |
| 2 or 3 Rooms | 112 (1.3%) | 78 (3.4%) |
| 4 or 5 Rooms | 2,276 (25.8%) | 966 (42.0%) |
| 6 or 7 Rooms | 4,088 (46.4%) | 1,006 (43.8%) |
| 8 or more Rooms | 2,334 (26.5%) | 134 (5.8%) |
| Total | 8,819 (100.0%) | 2,297 (100.0%) |
Housing Structure by Heating Type in Mission Bend
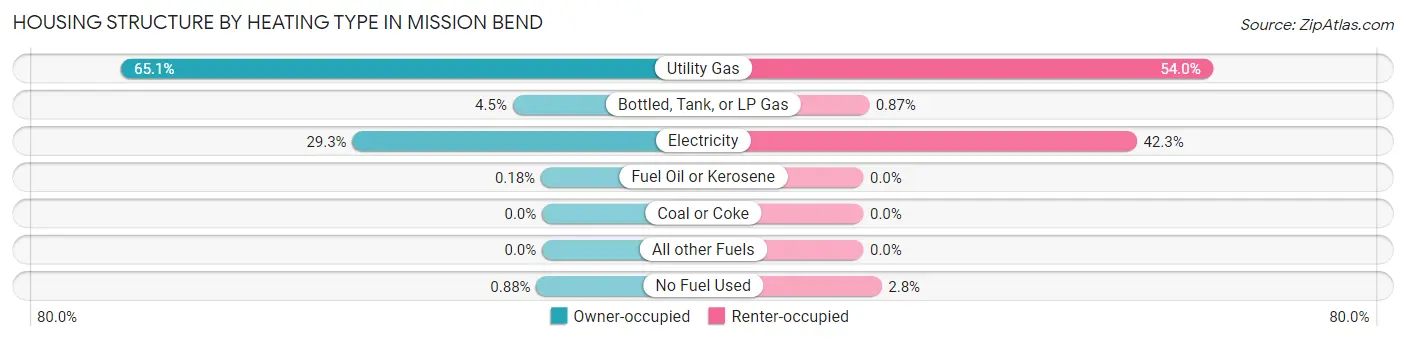
| Heating Type | Owner-occupied | Renter-occupied |
| Utility Gas | 5,739 (65.1%) | 1,241 (54.0%) |
| Bottled, Tank, or LP Gas | 400 (4.5%) | 20 (0.9%) |
| Electricity | 2,586 (29.3%) | 971 (42.3%) |
| Fuel Oil or Kerosene | 16 (0.2%) | 0 (0.0%) |
| Coal or Coke | 0 (0.0%) | 0 (0.0%) |
| All other Fuels | 0 (0.0%) | 0 (0.0%) |
| No Fuel Used | 78 (0.9%) | 65 (2.8%) |
| Total | 8,819 (100.0%) | 2,297 (100.0%) |
Household Vehicle Usage in Mission Bend
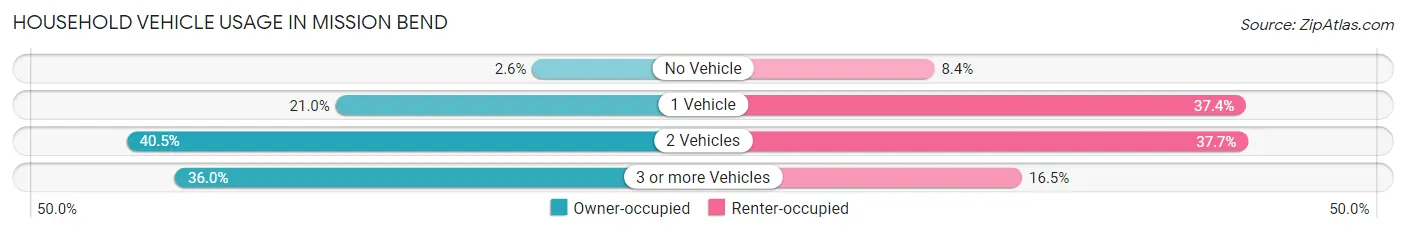
| Vehicles per Household | Owner-occupied | Renter-occupied |
| No Vehicle | 229 (2.6%) | 192 (8.4%) |
| 1 Vehicle | 1,849 (21.0%) | 860 (37.4%) |
| 2 Vehicles | 3,571 (40.5%) | 865 (37.7%) |
| 3 or more Vehicles | 3,170 (35.9%) | 380 (16.5%) |
| Total | 8,819 (100.0%) | 2,297 (100.0%) |
Real Estate & Mortgages in Mission Bend
Real Estate and Mortgage Overview in Mission Bend
| Characteristic | Without Mortgage | With Mortgage |
| Housing Units | 4,124 | 4,695 |
| Median Property Value | $202,800 | $194,300 |
| Median Household Income | $58,475 | $1,214 |
| Monthly Housing Costs | $638 | $112 |
| Real Estate Taxes | $3,118 | $358 |
Property Value by Mortgage Status in Mission Bend
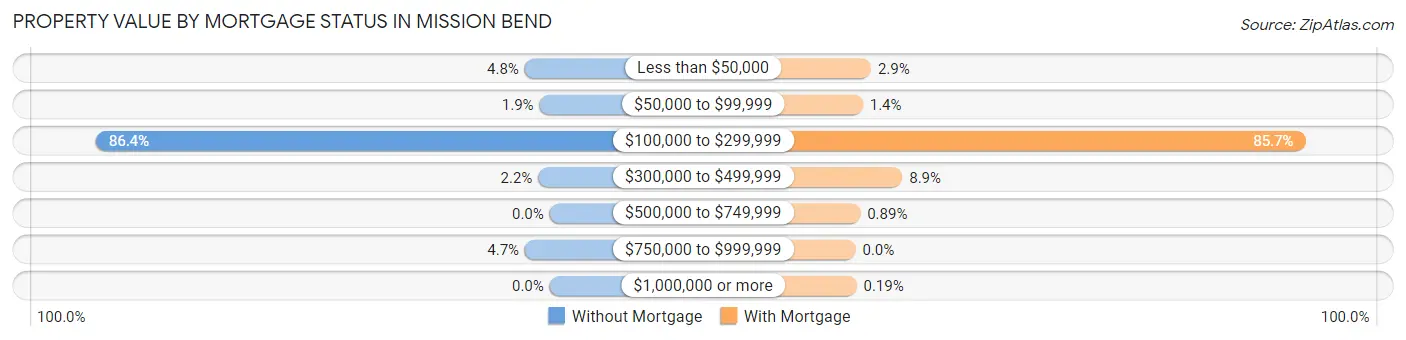
| Property Value | Without Mortgage | With Mortgage |
| Less than $50,000 | 196 (4.8%) | 138 (2.9%) |
| $50,000 to $99,999 | 80 (1.9%) | 65 (1.4%) |
| $100,000 to $299,999 | 3,564 (86.4%) | 4,023 (85.7%) |
| $300,000 to $499,999 | 90 (2.2%) | 418 (8.9%) |
| $500,000 to $749,999 | 0 (0.0%) | 42 (0.9%) |
| $750,000 to $999,999 | 194 (4.7%) | 0 (0.0%) |
| $1,000,000 or more | 0 (0.0%) | 9 (0.2%) |
| Total | 4,124 (100.0%) | 4,695 (100.0%) |
Household Income by Mortgage Status in Mission Bend
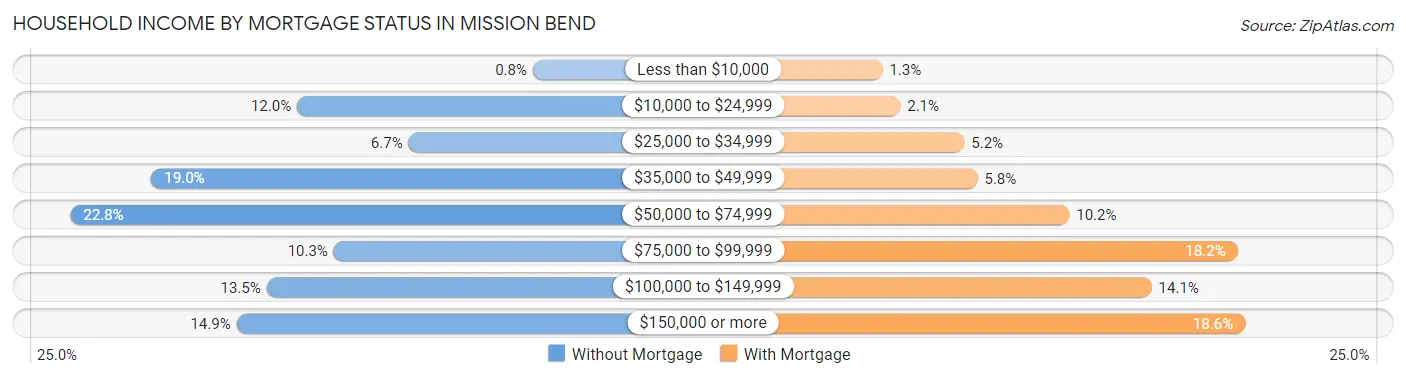
| Household Income | Without Mortgage | With Mortgage |
| Less than $10,000 | 33 (0.8%) | 60 (1.3%) |
| $10,000 to $24,999 | 496 (12.0%) | 100 (2.1%) |
| $25,000 to $34,999 | 277 (6.7%) | 243 (5.2%) |
| $35,000 to $49,999 | 782 (19.0%) | 273 (5.8%) |
| $50,000 to $74,999 | 941 (22.8%) | 478 (10.2%) |
| $75,000 to $99,999 | 424 (10.3%) | 854 (18.2%) |
| $100,000 to $149,999 | 556 (13.5%) | 662 (14.1%) |
| $150,000 or more | 615 (14.9%) | 871 (18.5%) |
| Total | 4,124 (100.0%) | 4,695 (100.0%) |
Property Value to Household Income Ratio in Mission Bend
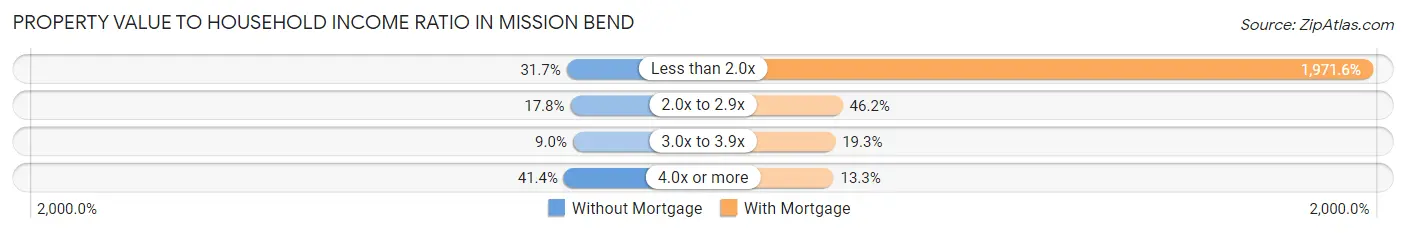
| Value-to-Income Ratio | Without Mortgage | With Mortgage |
| Less than 2.0x | 1,306 (31.7%) | 92,565 (1,971.6%) |
| 2.0x to 2.9x | 734 (17.8%) | 2,169 (46.2%) |
| 3.0x to 3.9x | 371 (9.0%) | 905 (19.3%) |
| 4.0x or more | 1,709 (41.4%) | 625 (13.3%) |
| Total | 4,124 (100.0%) | 4,695 (100.0%) |
Real Estate Taxes by Mortgage Status in Mission Bend
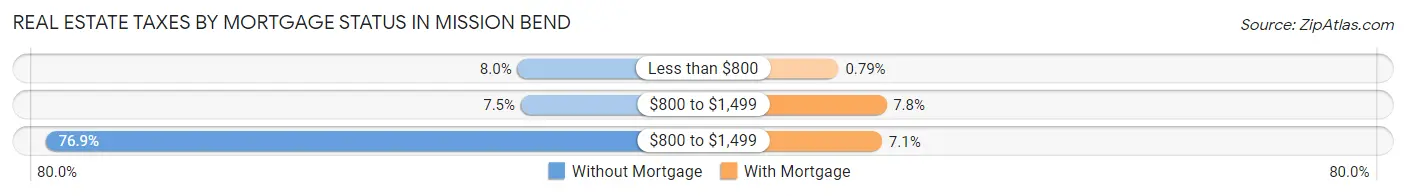
| Property Taxes | Without Mortgage | With Mortgage |
| Less than $800 | 329 (8.0%) | 37 (0.8%) |
| $800 to $1,499 | 309 (7.5%) | 365 (7.8%) |
| $800 to $1,499 | 3,172 (76.9%) | 335 (7.1%) |
| Total | 4,124 (100.0%) | 4,695 (100.0%) |
Health & Disability in Mission Bend
Health Insurance Coverage by Age in Mission Bend
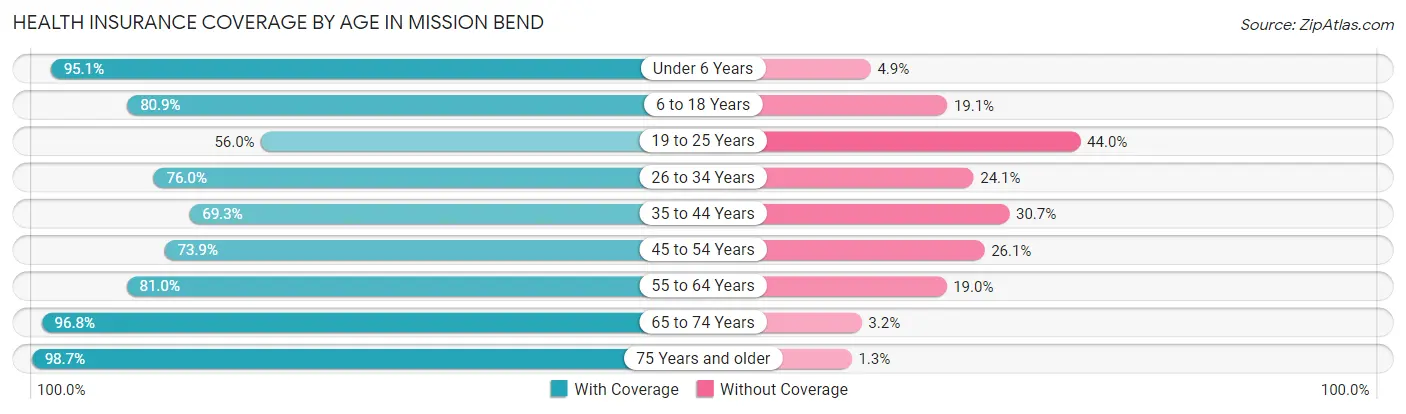
| Age Bracket | With Coverage | Without Coverage |
| Under 6 Years | 2,592 (95.1%) | 133 (4.9%) |
| 6 to 18 Years | 5,830 (80.9%) | 1,380 (19.1%) |
| 19 to 25 Years | 2,555 (56.0%) | 2,006 (44.0%) |
| 26 to 34 Years | 2,947 (75.9%) | 933 (24.0%) |
| 35 to 44 Years | 2,878 (69.3%) | 1,276 (30.7%) |
| 45 to 54 Years | 3,383 (73.9%) | 1,194 (26.1%) |
| 55 to 64 Years | 4,008 (81.0%) | 941 (19.0%) |
| 65 to 74 Years | 4,188 (96.8%) | 138 (3.2%) |
| 75 Years and older | 1,394 (98.7%) | 19 (1.3%) |
| Total | 29,775 (78.8%) | 8,020 (21.2%) |
Health Insurance Coverage by Citizenship Status in Mission Bend
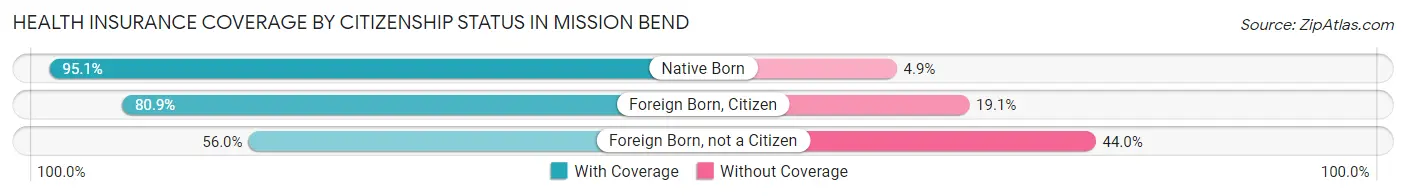
| Citizenship Status | With Coverage | Without Coverage |
| Native Born | 2,592 (95.1%) | 133 (4.9%) |
| Foreign Born, Citizen | 5,830 (80.9%) | 1,380 (19.1%) |
| Foreign Born, not a Citizen | 2,555 (56.0%) | 2,006 (44.0%) |
Health Insurance Coverage by Household Income in Mission Bend
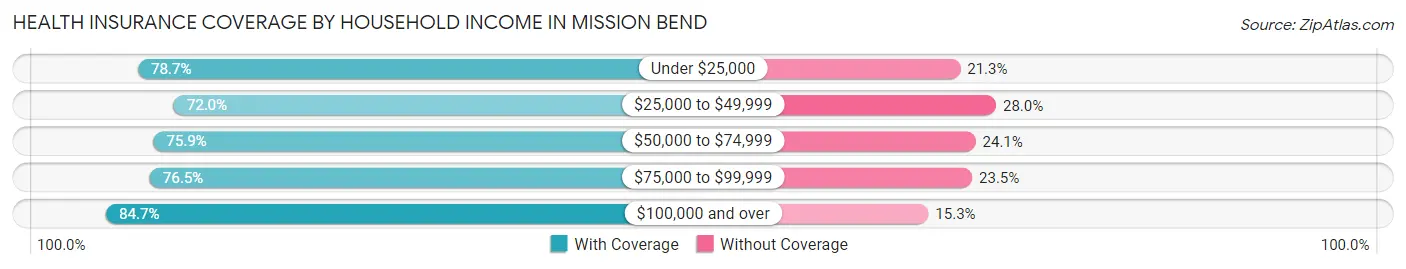
| Household Income | With Coverage | Without Coverage |
| Under $25,000 | 2,845 (78.7%) | 768 (21.3%) |
| $25,000 to $49,999 | 5,532 (72.0%) | 2,148 (28.0%) |
| $50,000 to $74,999 | 5,540 (75.9%) | 1,763 (24.1%) |
| $75,000 to $99,999 | 3,754 (76.5%) | 1,152 (23.5%) |
| $100,000 and over | 12,102 (84.7%) | 2,185 (15.3%) |
Public vs Private Health Insurance Coverage by Age in Mission Bend
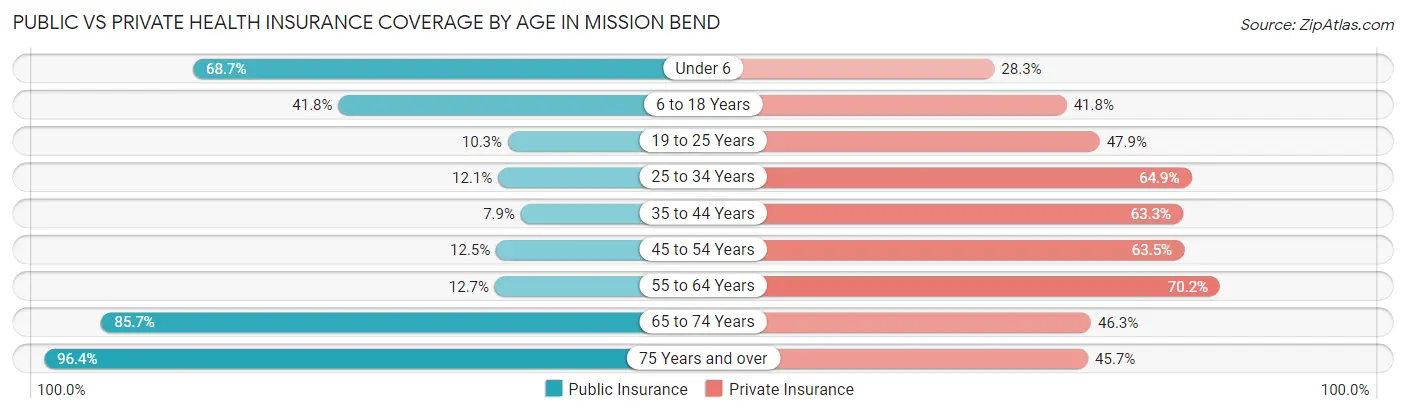
| Age Bracket | Public Insurance | Private Insurance |
| Under 6 | 1,873 (68.7%) | 772 (28.3%) |
| 6 to 18 Years | 3,011 (41.8%) | 3,010 (41.7%) |
| 19 to 25 Years | 470 (10.3%) | 2,184 (47.9%) |
| 25 to 34 Years | 470 (12.1%) | 2,517 (64.9%) |
| 35 to 44 Years | 328 (7.9%) | 2,630 (63.3%) |
| 45 to 54 Years | 571 (12.5%) | 2,906 (63.5%) |
| 55 to 64 Years | 629 (12.7%) | 3,473 (70.2%) |
| 65 to 74 Years | 3,709 (85.7%) | 2,002 (46.3%) |
| 75 Years and over | 1,362 (96.4%) | 646 (45.7%) |
| Total | 12,423 (32.9%) | 20,140 (53.3%) |
Disability Status by Sex by Age in Mission Bend
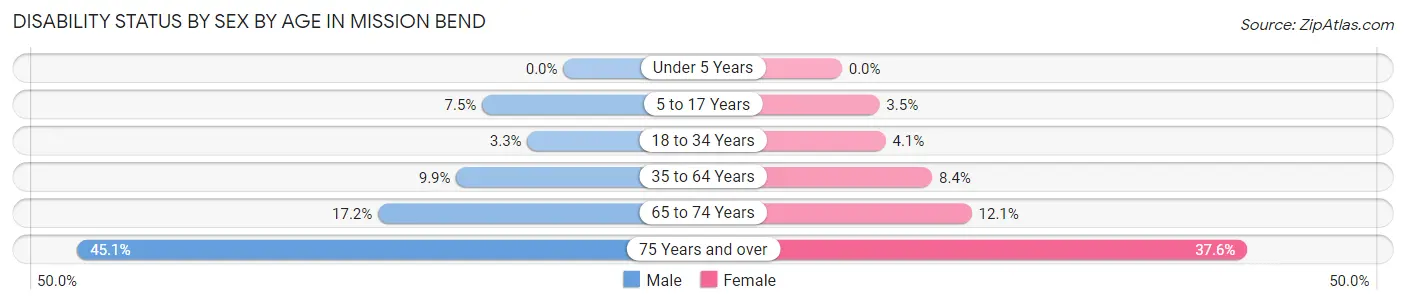
| Age Bracket | Male | Female |
| Under 5 Years | 0 (0.0%) | 0 (0.0%) |
| 5 to 17 Years | 237 (7.5%) | 128 (3.5%) |
| 18 to 34 Years | 157 (3.3%) | 188 (4.1%) |
| 35 to 64 Years | 574 (9.9%) | 662 (8.4%) |
| 65 to 74 Years | 370 (17.2%) | 262 (12.0%) |
| 75 Years and over | 346 (45.1%) | 243 (37.6%) |
Disability Class by Sex by Age in Mission Bend
Disability Class: Hearing Difficulty
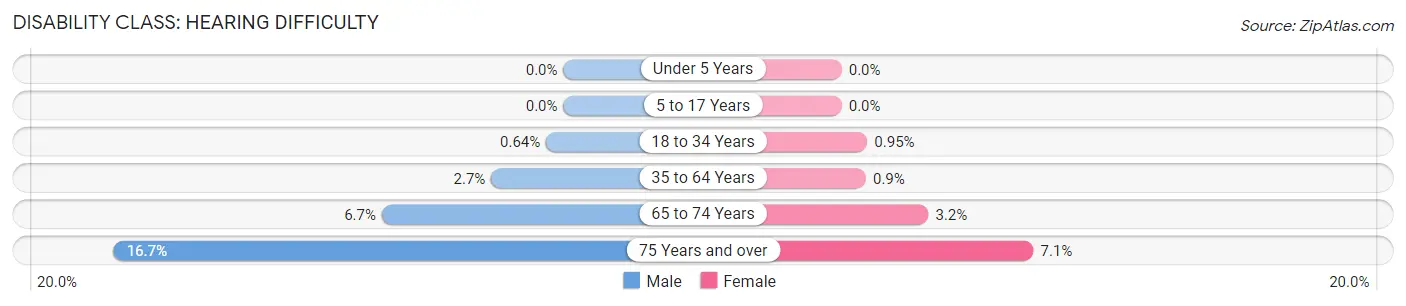
| Age Bracket | Male | Female |
| Under 5 Years | 0 (0.0%) | 0 (0.0%) |
| 5 to 17 Years | 0 (0.0%) | 0 (0.0%) |
| 18 to 34 Years | 30 (0.6%) | 44 (0.9%) |
| 35 to 64 Years | 155 (2.7%) | 71 (0.9%) |
| 65 to 74 Years | 145 (6.7%) | 70 (3.2%) |
| 75 Years and over | 128 (16.7%) | 46 (7.1%) |
Disability Class: Vision Difficulty
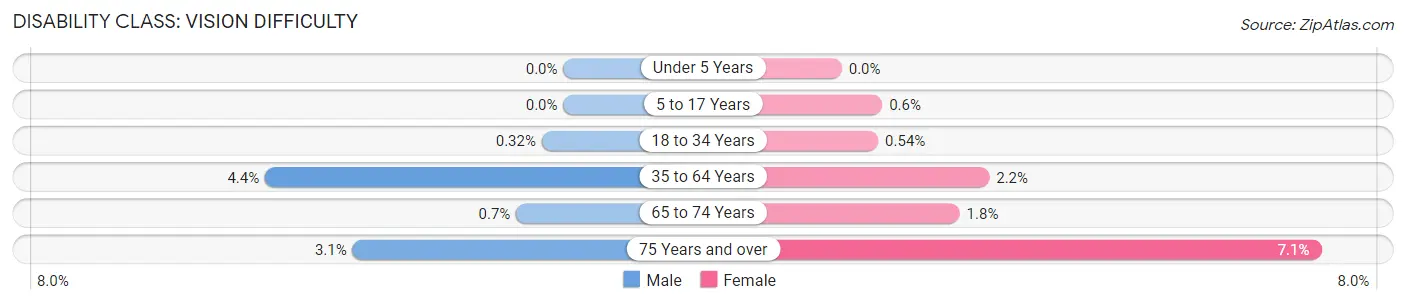
| Age Bracket | Male | Female |
| Under 5 Years | 0 (0.0%) | 0 (0.0%) |
| 5 to 17 Years | 0 (0.0%) | 22 (0.6%) |
| 18 to 34 Years | 15 (0.3%) | 25 (0.5%) |
| 35 to 64 Years | 256 (4.4%) | 173 (2.2%) |
| 65 to 74 Years | 15 (0.7%) | 38 (1.8%) |
| 75 Years and over | 24 (3.1%) | 46 (7.1%) |
Disability Class: Cognitive Difficulty
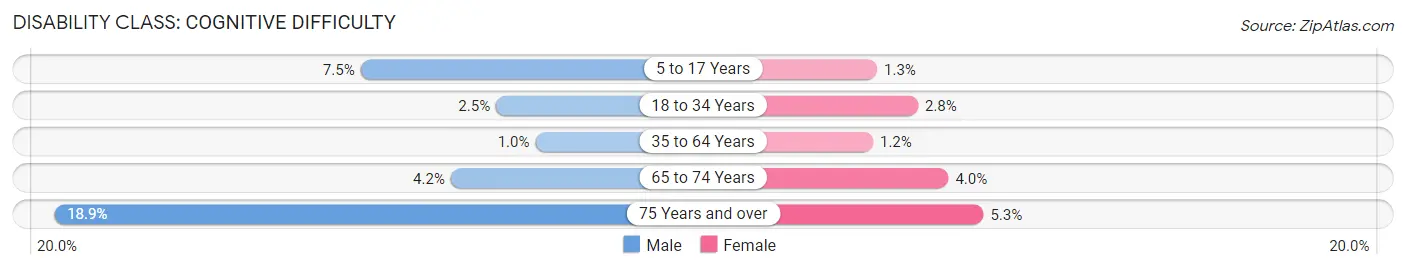
| Age Bracket | Male | Female |
| 5 to 17 Years | 237 (7.5%) | 48 (1.3%) |
| 18 to 34 Years | 118 (2.5%) | 131 (2.8%) |
| 35 to 64 Years | 60 (1.0%) | 92 (1.2%) |
| 65 to 74 Years | 90 (4.2%) | 86 (4.0%) |
| 75 Years and over | 145 (18.9%) | 34 (5.3%) |
Disability Class: Ambulatory Difficulty
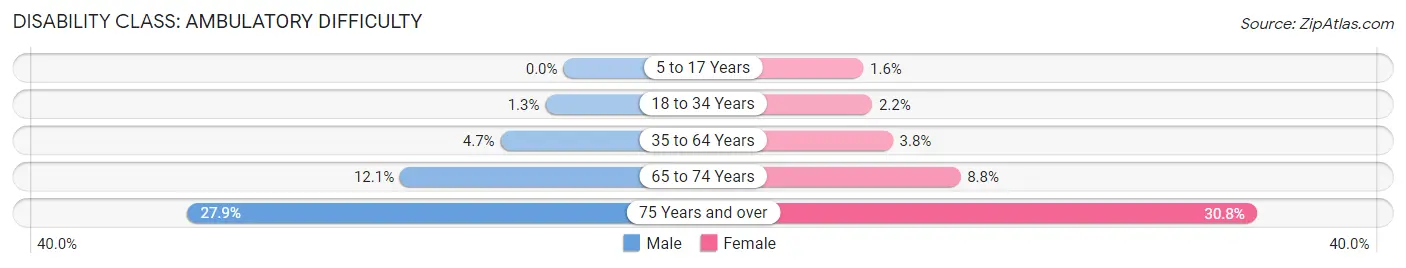
| Age Bracket | Male | Female |
| 5 to 17 Years | 0 (0.0%) | 58 (1.6%) |
| 18 to 34 Years | 63 (1.3%) | 104 (2.2%) |
| 35 to 64 Years | 270 (4.7%) | 298 (3.8%) |
| 65 to 74 Years | 261 (12.1%) | 191 (8.8%) |
| 75 Years and over | 214 (27.9%) | 199 (30.8%) |
Disability Class: Self-Care Difficulty
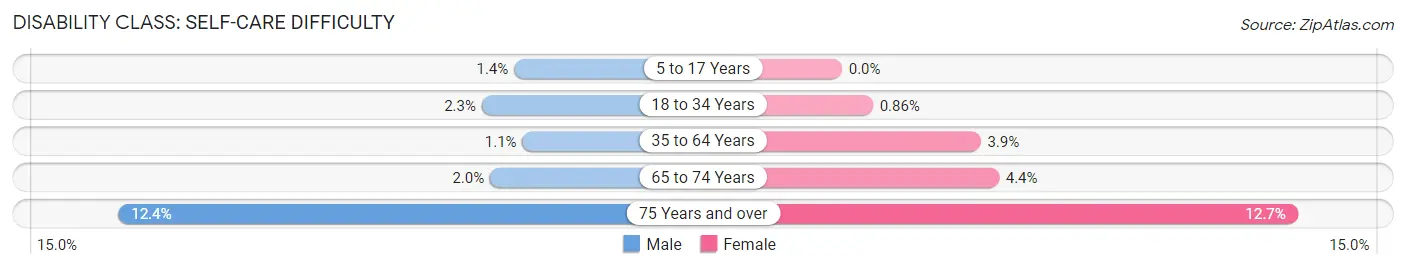
| Age Bracket | Male | Female |
| 5 to 17 Years | 43 (1.4%) | 0 (0.0%) |
| 18 to 34 Years | 107 (2.3%) | 40 (0.9%) |
| 35 to 64 Years | 66 (1.1%) | 305 (3.9%) |
| 65 to 74 Years | 44 (2.0%) | 95 (4.4%) |
| 75 Years and over | 95 (12.4%) | 82 (12.7%) |
Technology Access in Mission Bend
Computing Device Access in Mission Bend
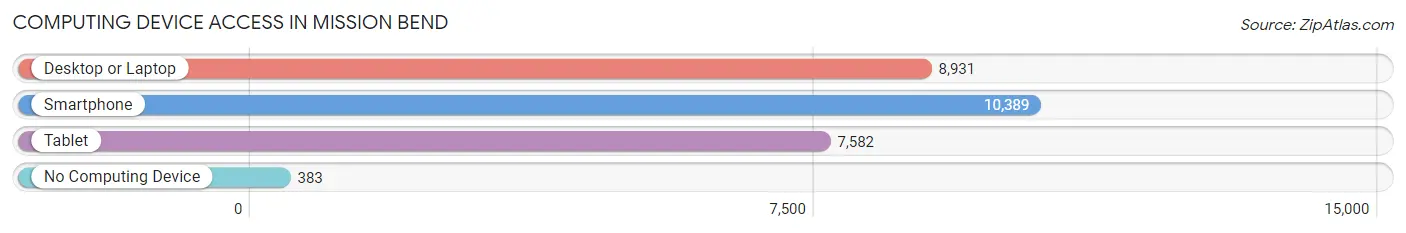
| Device Type | # Households | % Households |
| Desktop or Laptop | 8,931 | 80.3% |
| Smartphone | 10,389 | 93.5% |
| Tablet | 7,582 | 68.2% |
| No Computing Device | 383 | 3.5% |
| Total | 11,116 | 100.0% |
Internet Access in Mission Bend
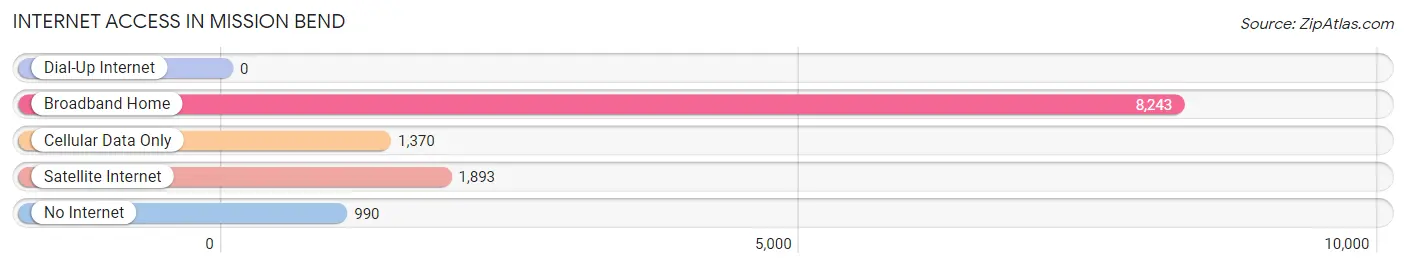
| Internet Type | # Households | % Households |
| Dial-Up Internet | 0 | 0.0% |
| Broadband Home | 8,243 | 74.2% |
| Cellular Data Only | 1,370 | 12.3% |
| Satellite Internet | 1,893 | 17.0% |
| No Internet | 990 | 8.9% |
| Total | 11,116 | 100.0% |
Mission Bend Summary
Bend, Texas is a small unincorporated community located in Fort Bend County, Texas. It is situated about 25 miles southwest of Houston and is part of the Houston–The Woodlands–Sugar Land metropolitan area. The population of Mission Bend was estimated to be around 20,000 in 2020.
History
Mission Bend was originally part of the Stephen F. Austin Colony, which was established in 1823. The area was first settled by German immigrants in the 1840s. The town was originally known as “Mission Bend” because of its proximity to the San Antonio de Valero Mission, which was located nearby. The town was officially incorporated in 1891.
In the early 1900s, Mission Bend was a thriving agricultural community. The town was home to several cotton gins, a cottonseed oil mill, and a number of other businesses. The town also had a school, a post office, and a number of churches.
In the 1950s, the town began to experience rapid growth due to the development of the Houston Ship Channel and the construction of the Houston Intercontinental Airport. This growth led to the development of several subdivisions in the area, which attracted many new residents.
Geography
Mission Bend is located in Fort Bend County, Texas. It is situated about 25 miles southwest of Houston and is part of the Houston–The Woodlands–Sugar Land metropolitan area. The town is located on the banks of the Brazos River and is surrounded by rolling hills and prairies.
The climate in Mission Bend is humid subtropical, with hot summers and mild winters. The average annual temperature is around 70 degrees Fahrenheit. The average annual precipitation is around 40 inches.
Economy
Mission Bend’s economy is largely based on the oil and gas industry. The town is home to several oil and gas companies, including Chevron, ExxonMobil, and Shell. The town is also home to several manufacturing companies, including a steel mill and a plastics plant.
The town is also home to several retail stores, restaurants, and other businesses. The town is served by the Fort Bend County Transit Authority, which provides public transportation to the surrounding area.
Demographics
As of the 2020 census, the population of Mission Bend was estimated to be around 20,000. The racial makeup of the town was 57.3% White, 24.2% Hispanic or Latino, 15.2% African American, and 3.3% Asian. The median household income was $60,000, and the median home value was $170,000.
Conclusion
Mission Bend is a small unincorporated community located in Fort Bend County, Texas. It is situated about 25 miles southwest of Houston and is part of the Houston–The Woodlands–Sugar Land metropolitan area. The town has a long history, dating back to the 1840s when it was first settled by German immigrants. The town’s economy is largely based on the oil and gas industry, and it is home to several retail stores, restaurants, and other businesses. The population of Mission Bend was estimated to be around 20,000 in 2020.
Common Questions
What is Per Capita Income in Mission Bend?
Per Capita income in Mission Bend is $28,102.
What is the Median Family Income in Mission Bend?
Median Family Income in Mission Bend is $70,292.
What is the Median Household income in Mission Bend?
Median Household Income in Mission Bend is $66,422.
What is Income or Wage Gap in Mission Bend?
Income or Wage Gap in Mission Bend is 20.4%.
Women in Mission Bend earn 79.6 cents for every dollar earned by a man.
What is Family Income Deficit in Mission Bend?
Family Income Deficit in Mission Bend is $11,982.
Families that are below poverty line in Mission Bend earn $11,982 less on average than the poverty threshold level.
What is Inequality or Gini Index in Mission Bend?
Inequality or Gini Index in Mission Bend is 0.46.
What is the Total Population of Mission Bend?
Total Population of Mission Bend is 37,853.
What is the Total Male Population of Mission Bend?
Total Male Population of Mission Bend is 17,794.
What is the Total Female Population of Mission Bend?
Total Female Population of Mission Bend is 20,059.
What is the Ratio of Males per 100 Females in Mission Bend?
There are 88.71 Males per 100 Females in Mission Bend.
What is the Ratio of Females per 100 Males in Mission Bend?
There are 112.73 Females per 100 Males in Mission Bend.
What is the Median Population Age in Mission Bend?
Median Population Age in Mission Bend is 36.1 Years.
What is the Average Family Size in Mission Bend
Average Family Size in Mission Bend is 3.8 People.
What is the Average Household Size in Mission Bend
Average Household Size in Mission Bend is 3.4 People.
How Large is the Labor Force in Mission Bend?
There are 19,342 People in the Labor Forcein in Mission Bend.
What is the Percentage of People in the Labor Force in Mission Bend?
64.5% of People are in the Labor Force in Mission Bend.
What is the Unemployment Rate in Mission Bend?
Unemployment Rate in Mission Bend is 10.2%.