Tyler, TX Map & Demographics
Tyler Map
Tyler Overview
$34,062
PER CAPITA INCOME
$79,286
AVG FAMILY INCOME
$63,056
AVG HOUSEHOLD INCOME
21.0%
WAGE / INCOME GAP [ % ]
79.0¢/ $1
WAGE / INCOME GAP [ $ ]
$11,696
FAMILY INCOME DEFICIT
0.49
INEQUALITY / GINI INDEX
106,440
TOTAL POPULATION
51,161
MALE POPULATION
55,279
FEMALE POPULATION
92.55
MALES / 100 FEMALES
108.05
FEMALES / 100 MALES
34.9
MEDIAN AGE
3.4
AVG FAMILY SIZE
2.7
AVG HOUSEHOLD SIZE
53,737
LABOR FORCE [ PEOPLE ]
63.3%
PERCENT IN LABOR FORCE
5.3%
UNEMPLOYMENT RATE
Income in Tyler
Income Overview in Tyler
Per Capita Income in Tyler is $34,062, while median incomes of families and households are $79,286 and $63,056 respectively.
| Characteristic | Number | Measure |
| Per Capita Income | 106,440 | $34,062 |
| Median Family Income | 23,868 | $79,286 |
| Mean Family Income | 23,868 | $113,000 |
| Median Household Income | 37,747 | $63,056 |
| Mean Household Income | 37,747 | $90,135 |
| Income Deficit | 23,868 | $11,696 |
| Wage / Income Gap (%) | 106,440 | 20.96% |
| Wage / Income Gap ($) | 106,440 | 79.04¢ per $1 |
| Gini / Inequality Index | 106,440 | 0.49 |
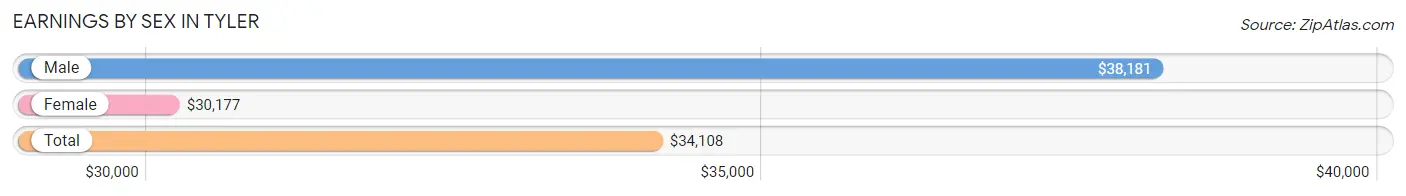
Earnings by Sex in Tyler
Average Earnings in Tyler are $34,108, $38,181 for men and $30,177 for women, a difference of 21.0%.
| Sex | Number | Average Earnings |
| Male | 28,430 (50.8%) | $38,181 |
| Female | 27,528 (49.2%) | $30,177 |
| Total | 55,958 (100.0%) | $34,108 |
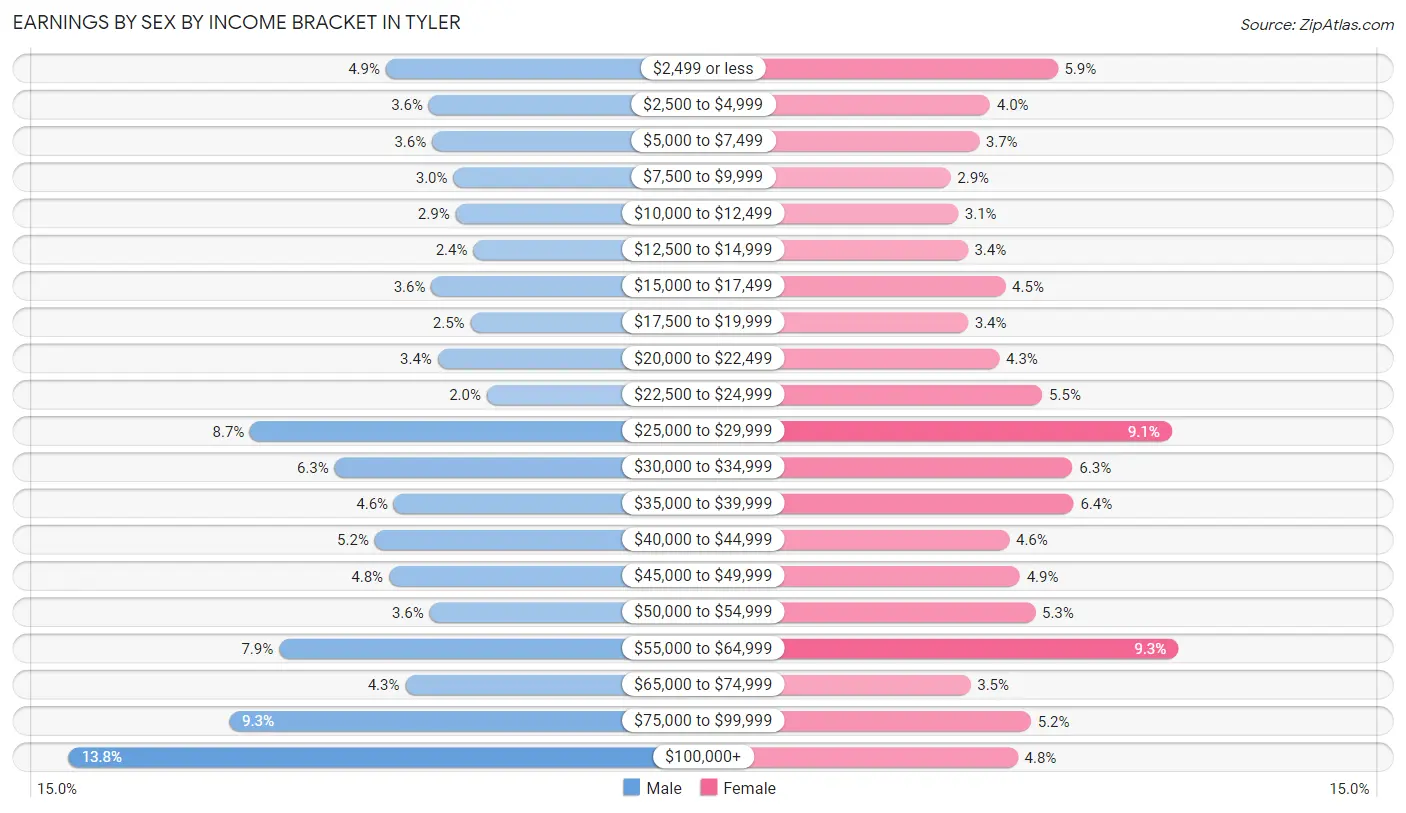
Earnings by Sex by Income Bracket in Tyler
The most common earnings brackets in Tyler are $100,000+ for men (3,913 | 13.8%) and $55,000 to $64,999 for women (2,562 | 9.3%).
| Income | Male | Female |
| $2,499 or less | 1,379 (4.9%) | 1,631 (5.9%) |
| $2,500 to $4,999 | 1,034 (3.6%) | 1,107 (4.0%) |
| $5,000 to $7,499 | 1,009 (3.5%) | 1,020 (3.7%) |
| $7,500 to $9,999 | 839 (2.9%) | 802 (2.9%) |
| $10,000 to $12,499 | 822 (2.9%) | 860 (3.1%) |
| $12,500 to $14,999 | 679 (2.4%) | 934 (3.4%) |
| $15,000 to $17,499 | 1,016 (3.6%) | 1,226 (4.4%) |
| $17,500 to $19,999 | 703 (2.5%) | 936 (3.4%) |
| $20,000 to $22,499 | 964 (3.4%) | 1,179 (4.3%) |
| $22,500 to $24,999 | 572 (2.0%) | 1,510 (5.5%) |
| $25,000 to $29,999 | 2,462 (8.7%) | 2,513 (9.1%) |
| $30,000 to $34,999 | 1,789 (6.3%) | 1,746 (6.3%) |
| $35,000 to $39,999 | 1,313 (4.6%) | 1,753 (6.4%) |
| $40,000 to $44,999 | 1,466 (5.2%) | 1,255 (4.6%) |
| $45,000 to $49,999 | 1,354 (4.8%) | 1,338 (4.9%) |
| $50,000 to $54,999 | 1,030 (3.6%) | 1,456 (5.3%) |
| $55,000 to $64,999 | 2,232 (7.9%) | 2,562 (9.3%) |
| $65,000 to $74,999 | 1,223 (4.3%) | 955 (3.5%) |
| $75,000 to $99,999 | 2,631 (9.2%) | 1,424 (5.2%) |
| $100,000+ | 3,913 (13.8%) | 1,321 (4.8%) |
| Total | 28,430 (100.0%) | 27,528 (100.0%) |
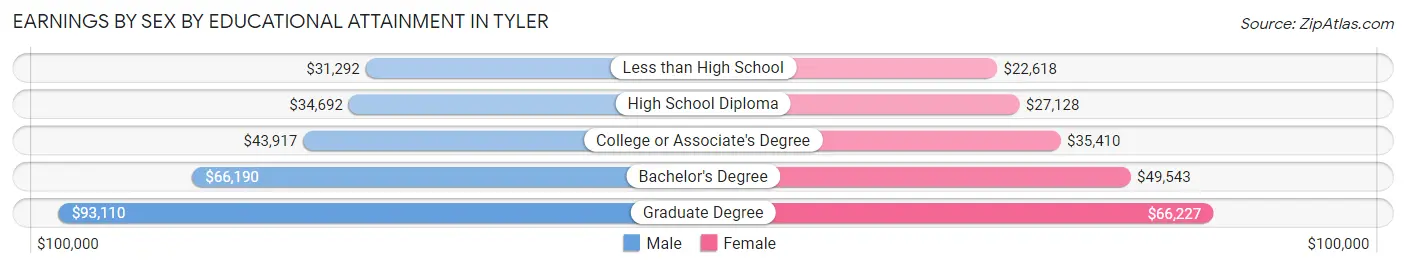
Earnings by Sex by Educational Attainment in Tyler
Average earnings in Tyler are $47,002 for men and $36,136 for women, a difference of 23.1%. Men with an educational attainment of graduate degree enjoy the highest average annual earnings of $93,110, while those with less than high school education earn the least with $31,292. Women with an educational attainment of graduate degree earn the most with the average annual earnings of $66,227, while those with less than high school education have the smallest earnings of $22,618.
| Educational Attainment | Male Income | Female Income |
| Less than High School | $31,292 | $22,618 |
| High School Diploma | $34,692 | $27,128 |
| College or Associate's Degree | $43,917 | $35,410 |
| Bachelor's Degree | $66,190 | $49,543 |
| Graduate Degree | $93,110 | $66,227 |
| Total | $47,002 | $36,136 |
Family Income in Tyler
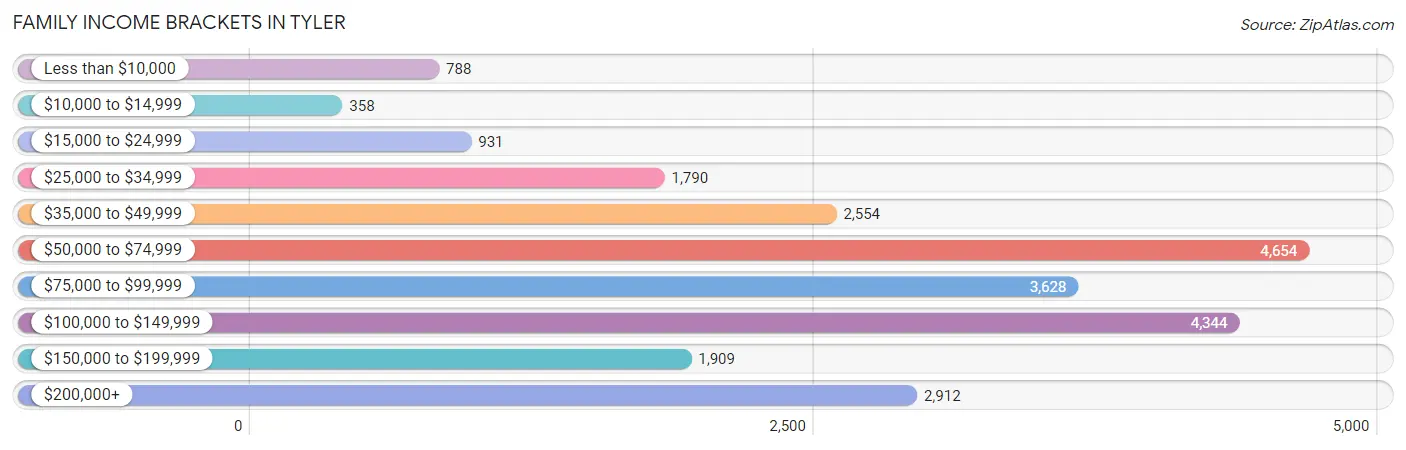
Family Income Brackets in Tyler
According to the Tyler family income data, there are 4,654 families falling into the $50,000 to $74,999 income range, which is the most common income bracket and makes up 19.5% of all families. Conversely, the $10,000 to $14,999 income bracket is the least frequent group with only 358 families (1.5%) belonging to this category.
| Income Bracket | # Families | % Families |
| Less than $10,000 | 788 | 3.3% |
| $10,000 to $14,999 | 358 | 1.5% |
| $15,000 to $24,999 | 931 | 3.9% |
| $25,000 to $34,999 | 1,790 | 7.5% |
| $35,000 to $49,999 | 2,554 | 10.7% |
| $50,000 to $74,999 | 4,654 | 19.5% |
| $75,000 to $99,999 | 3,628 | 15.2% |
| $100,000 to $149,999 | 4,344 | 18.2% |
| $150,000 to $199,999 | 1,909 | 8.0% |
| $200,000+ | 2,912 | 12.2% |
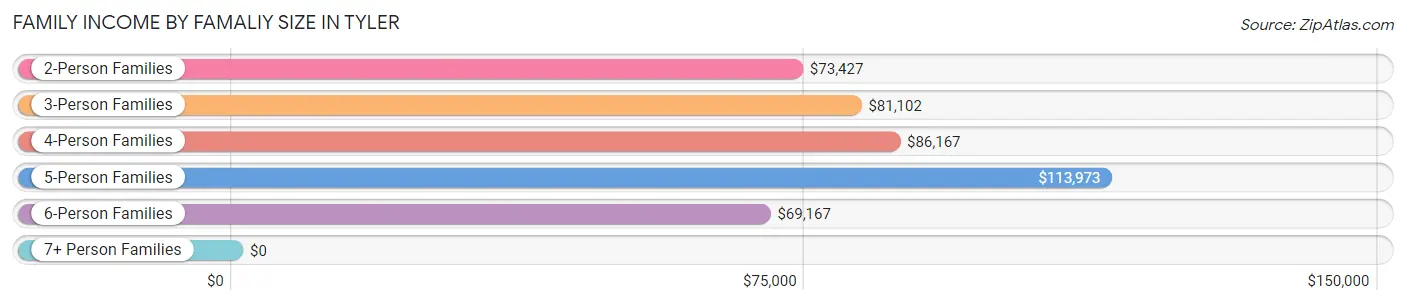
Family Income by Famaliy Size in Tyler
5-person families (2,060 | 8.6%) account for the highest median family income in Tyler with $113,973 per family, while 2-person families (11,263 | 47.2%) have the highest median income of $36,714 per family member.
| Income Bracket | # Families | Median Income |
| 2-Person Families | 11,263 (47.2%) | $73,427 |
| 3-Person Families | 4,850 (20.3%) | $81,102 |
| 4-Person Families | 4,330 (18.1%) | $86,167 |
| 5-Person Families | 2,060 (8.6%) | $113,973 |
| 6-Person Families | 906 (3.8%) | $69,167 |
| 7+ Person Families | 459 (1.9%) | $0 |
| Total | 23,868 (100.0%) | $79,286 |
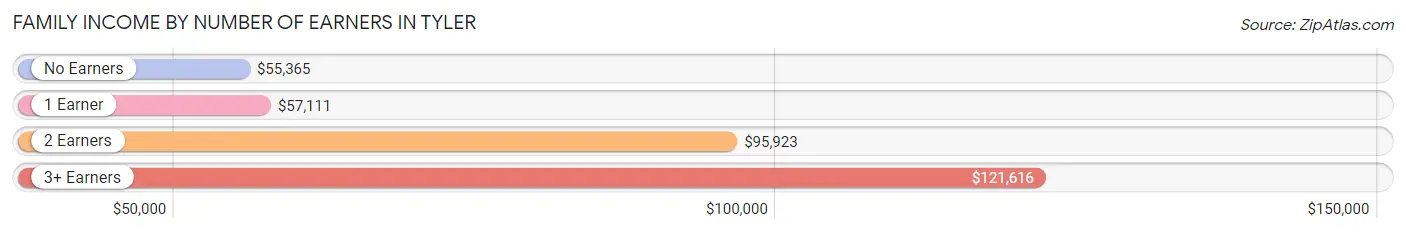
Family Income by Number of Earners in Tyler
The median family income in Tyler is $79,286, with families comprising 3+ earners (2,750) having the highest median family income of $121,616, while families with no earners (3,370) have the lowest median family income of $55,365, accounting for 11.5% and 14.1% of families, respectively.
| Number of Earners | # Families | Median Income |
| No Earners | 3,370 (14.1%) | $55,365 |
| 1 Earner | 7,729 (32.4%) | $57,111 |
| 2 Earners | 10,019 (42.0%) | $95,923 |
| 3+ Earners | 2,750 (11.5%) | $121,616 |
| Total | 23,868 (100.0%) | $79,286 |
Household Income in Tyler
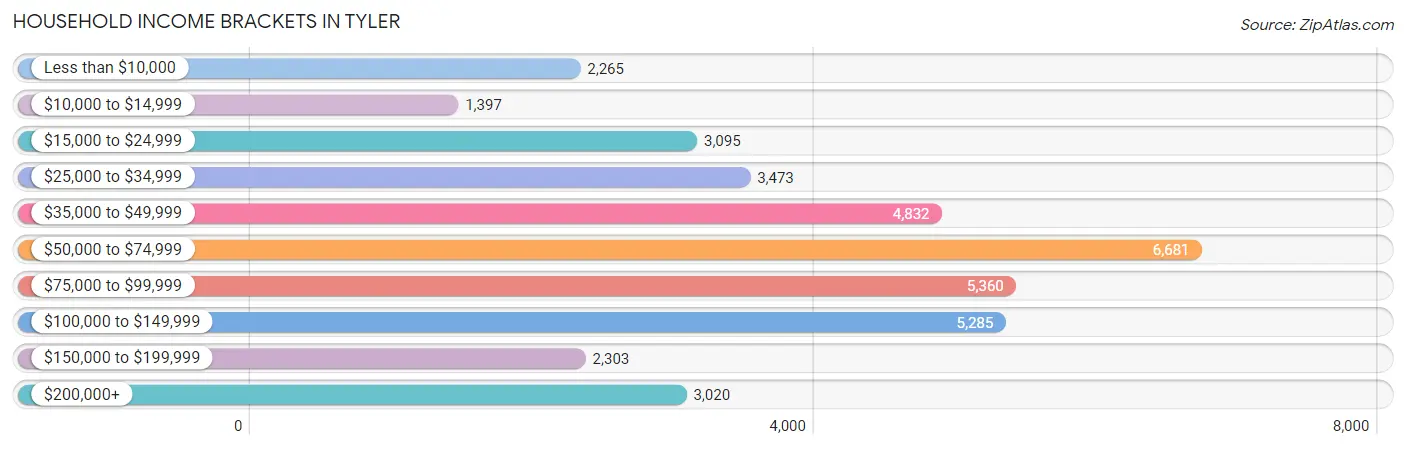
Household Income Brackets in Tyler
With 6,681 households falling in the category, the $50,000 to $74,999 income range is the most frequent in Tyler, accounting for 17.7% of all households. In contrast, only 1,397 households (3.7%) fall into the $10,000 to $14,999 income bracket, making it the least populous group.
| Income Bracket | # Households | % Households |
| Less than $10,000 | 2,265 | 6.0% |
| $10,000 to $14,999 | 1,397 | 3.7% |
| $15,000 to $24,999 | 3,095 | 8.2% |
| $25,000 to $34,999 | 3,473 | 9.2% |
| $35,000 to $49,999 | 4,832 | 12.8% |
| $50,000 to $74,999 | 6,681 | 17.7% |
| $75,000 to $99,999 | 5,360 | 14.2% |
| $100,000 to $149,999 | 5,285 | 14.0% |
| $150,000 to $199,999 | 2,303 | 6.1% |
| $200,000+ | 3,020 | 8.0% |
Household Income by Householder Age in Tyler
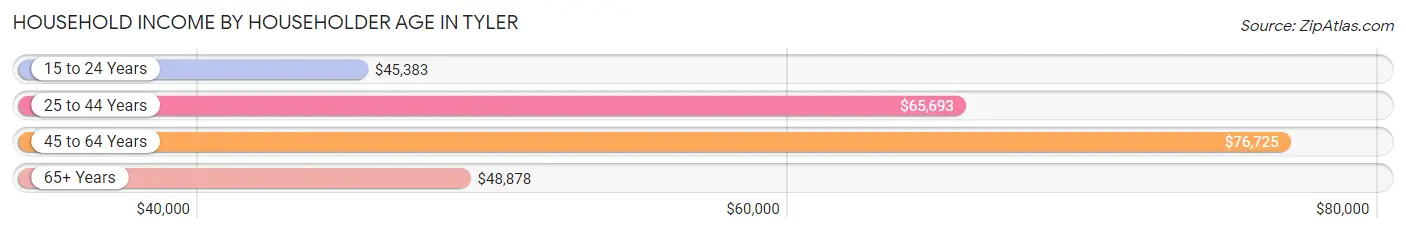
The median household income in Tyler is $63,056, with the highest median household income of $76,725 found in the 45 to 64 years age bracket for the primary householder. A total of 12,120 households (32.1%) fall into this category. Meanwhile, the 15 to 24 years age bracket for the primary householder has the lowest median household income of $45,383, with 2,793 households (7.4%) in this group.
| Income Bracket | # Households | Median Income |
| 15 to 24 Years | 2,793 (7.4%) | $45,383 |
| 25 to 44 Years | 12,582 (33.3%) | $65,693 |
| 45 to 64 Years | 12,120 (32.1%) | $76,725 |
| 65+ Years | 10,252 (27.2%) | $48,878 |
| Total | 37,747 (100.0%) | $63,056 |
Poverty in Tyler
Income Below Poverty by Sex and Age in Tyler
With 13.5% poverty level for males and 13.4% for females among the residents of Tyler, 6 to 11 year old males and under 5 year old females are the most vulnerable to poverty, with 973 males (24.8%) and 827 females (26.1%) in their respective age groups living below the poverty level.
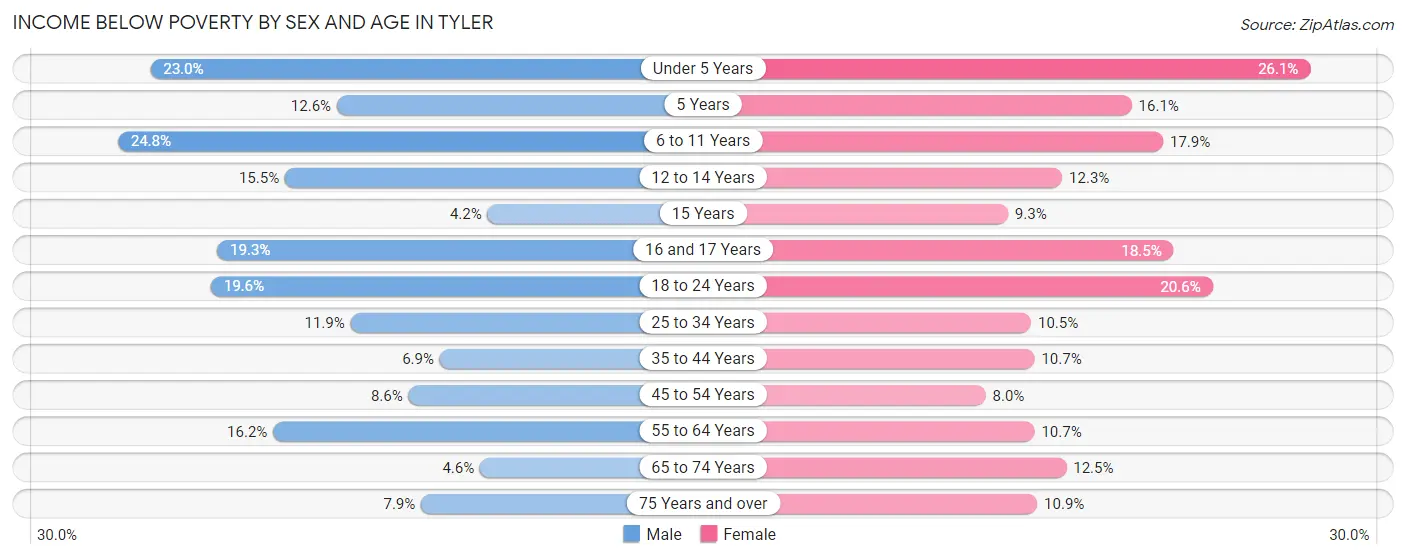
| Age Bracket | Male | Female |
| Under 5 Years | 787 (23.0%) | 827 (26.1%) |
| 5 Years | 87 (12.6%) | 112 (16.1%) |
| 6 to 11 Years | 973 (24.8%) | 698 (17.9%) |
| 12 to 14 Years | 344 (15.5%) | 209 (12.3%) |
| 15 Years | 31 (4.2%) | 47 (9.2%) |
| 16 and 17 Years | 251 (19.3%) | 270 (18.5%) |
| 18 to 24 Years | 1,165 (19.6%) | 1,155 (20.6%) |
| 25 to 34 Years | 830 (11.8%) | 805 (10.5%) |
| 35 to 44 Years | 398 (6.9%) | 649 (10.7%) |
| 45 to 54 Years | 498 (8.6%) | 507 (8.0%) |
| 55 to 64 Years | 801 (16.2%) | 642 (10.7%) |
| 65 to 74 Years | 193 (4.6%) | 652 (12.5%) |
| 75 Years and over | 216 (7.9%) | 487 (10.9%) |
| Total | 6,574 (13.5%) | 7,060 (13.4%) |
Income Above Poverty by Sex and Age in Tyler
According to the poverty statistics in Tyler, males aged 15 years and females aged 45 to 54 years are the age groups that are most secure financially, with 95.8% of males and 92.0% of females in these age groups living above the poverty line.
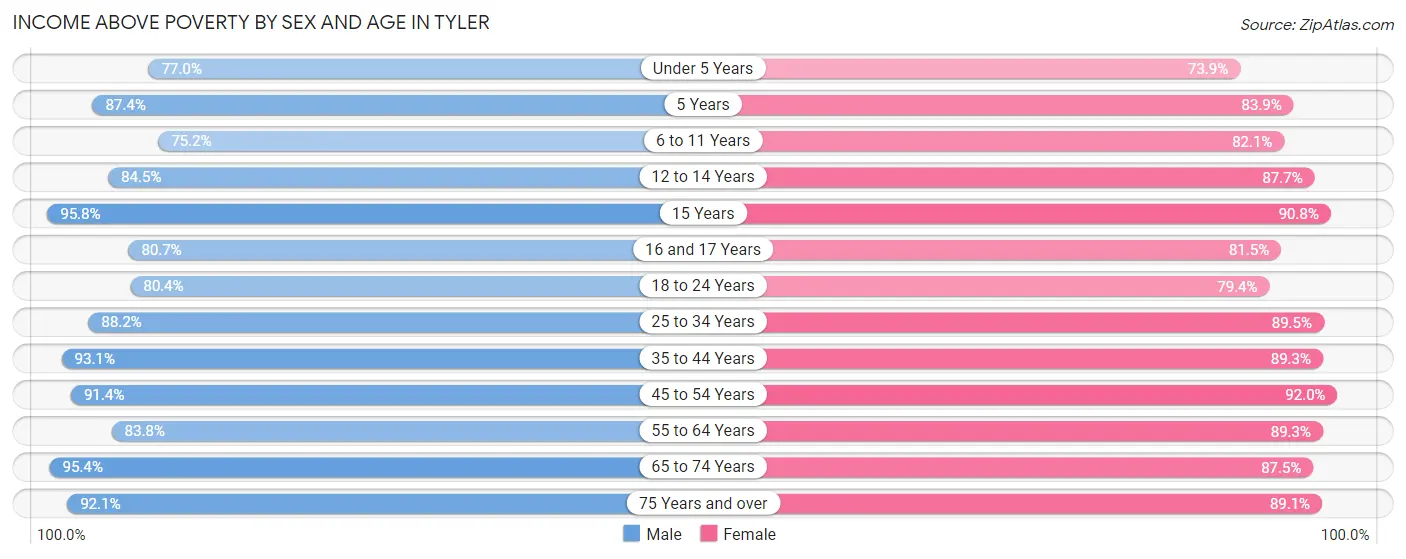
| Age Bracket | Male | Female |
| Under 5 Years | 2,635 (77.0%) | 2,344 (73.9%) |
| 5 Years | 603 (87.4%) | 582 (83.9%) |
| 6 to 11 Years | 2,949 (75.2%) | 3,203 (82.1%) |
| 12 to 14 Years | 1,876 (84.5%) | 1,495 (87.7%) |
| 15 Years | 703 (95.8%) | 461 (90.7%) |
| 16 and 17 Years | 1,051 (80.7%) | 1,192 (81.5%) |
| 18 to 24 Years | 4,771 (80.4%) | 4,442 (79.4%) |
| 25 to 34 Years | 6,177 (88.1%) | 6,835 (89.5%) |
| 35 to 44 Years | 5,384 (93.1%) | 5,397 (89.3%) |
| 45 to 54 Years | 5,280 (91.4%) | 5,819 (92.0%) |
| 55 to 64 Years | 4,157 (83.8%) | 5,341 (89.3%) |
| 65 to 74 Years | 3,969 (95.4%) | 4,563 (87.5%) |
| 75 Years and over | 2,510 (92.1%) | 3,991 (89.1%) |
| Total | 42,065 (86.5%) | 45,665 (86.6%) |
Income Below Poverty Among Married-Couple Families in Tyler
The poverty statistics for married-couple families in Tyler show that 4.5% or 759 of the total 16,996 families live below the poverty line. Families with 5 or more children have the highest poverty rate of 25.8%, comprising of 56 families. On the other hand, families with no children have the lowest poverty rate of 2.9%, which includes 270 families.
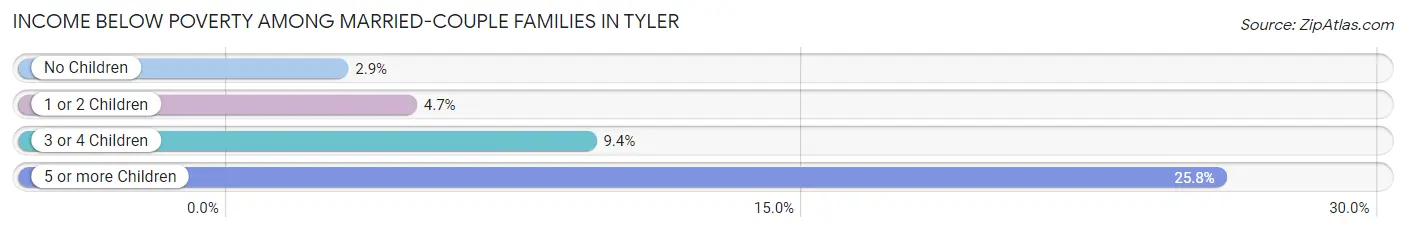
| Children | Above Poverty | Below Poverty |
| No Children | 9,113 (97.1%) | 270 (2.9%) |
| 1 or 2 Children | 5,268 (95.3%) | 258 (4.7%) |
| 3 or 4 Children | 1,695 (90.6%) | 175 (9.4%) |
| 5 or more Children | 161 (74.2%) | 56 (25.8%) |
| Total | 16,237 (95.5%) | 759 (4.5%) |
Income Below Poverty Among Single-Parent Households in Tyler
According to the poverty data in Tyler, 9.8% or 148 single-father households and 21.1% or 1,131 single-mother households are living below the poverty line. Among single-father households, those with 5 or more children have the highest poverty rate, with 15 households (100.0%) experiencing poverty. Likewise, among single-mother households, those with 3 or 4 children have the highest poverty rate, with 211 households (45.6%) falling below the poverty line.
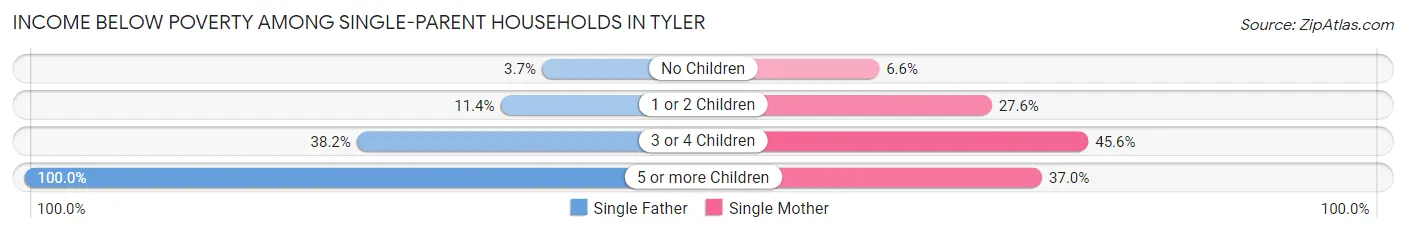
| Children | Single Father | Single Mother |
| No Children | 28 (3.7%) | 138 (6.6%) |
| 1 or 2 Children | 76 (11.4%) | 748 (27.6%) |
| 3 or 4 Children | 29 (38.2%) | 211 (45.6%) |
| 5 or more Children | 15 (100.0%) | 34 (37.0%) |
| Total | 148 (9.8%) | 1,131 (21.1%) |
Income Below Poverty Among Married-Couple vs Single-Parent Households in Tyler
The poverty data for Tyler shows that 759 of the married-couple family households (4.5%) and 1,279 of the single-parent households (18.6%) are living below the poverty level. Within the married-couple family households, those with 5 or more children have the highest poverty rate, with 56 households (25.8%) falling below the poverty line. Among the single-parent households, those with 5 or more children have the highest poverty rate, with 49 household (45.8%) living below poverty.
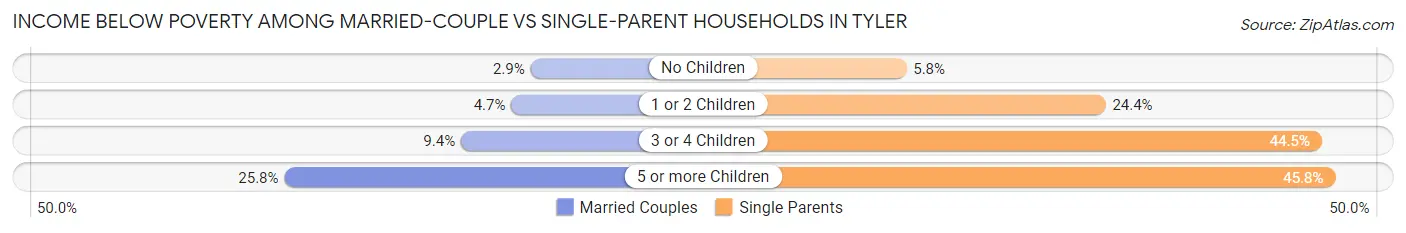
| Children | Married-Couple Families | Single-Parent Households |
| No Children | 270 (2.9%) | 166 (5.8%) |
| 1 or 2 Children | 258 (4.7%) | 824 (24.4%) |
| 3 or 4 Children | 175 (9.4%) | 240 (44.5%) |
| 5 or more Children | 56 (25.8%) | 49 (45.8%) |
| Total | 759 (4.5%) | 1,279 (18.6%) |
Race in Tyler
The most populous races in Tyler are White / Caucasian (66,941 | 62.9%), Black / African American (25,663 | 24.1%), and Hispanic or Latino (23,070 | 21.7%).
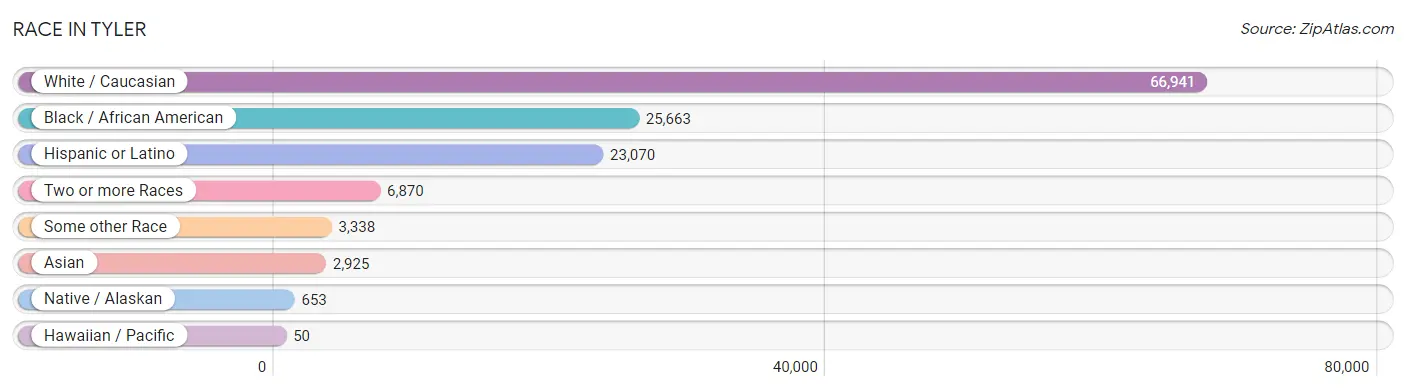
| Race | # Population | % Population |
| Asian | 2,925 | 2.8% |
| Black / African American | 25,663 | 24.1% |
| Hawaiian / Pacific | 50 | 0.1% |
| Hispanic or Latino | 23,070 | 21.7% |
| Native / Alaskan | 653 | 0.6% |
| White / Caucasian | 66,941 | 62.9% |
| Two or more Races | 6,870 | 6.5% |
| Some other Race | 3,338 | 3.1% |
| Total | 106,440 | 100.0% |
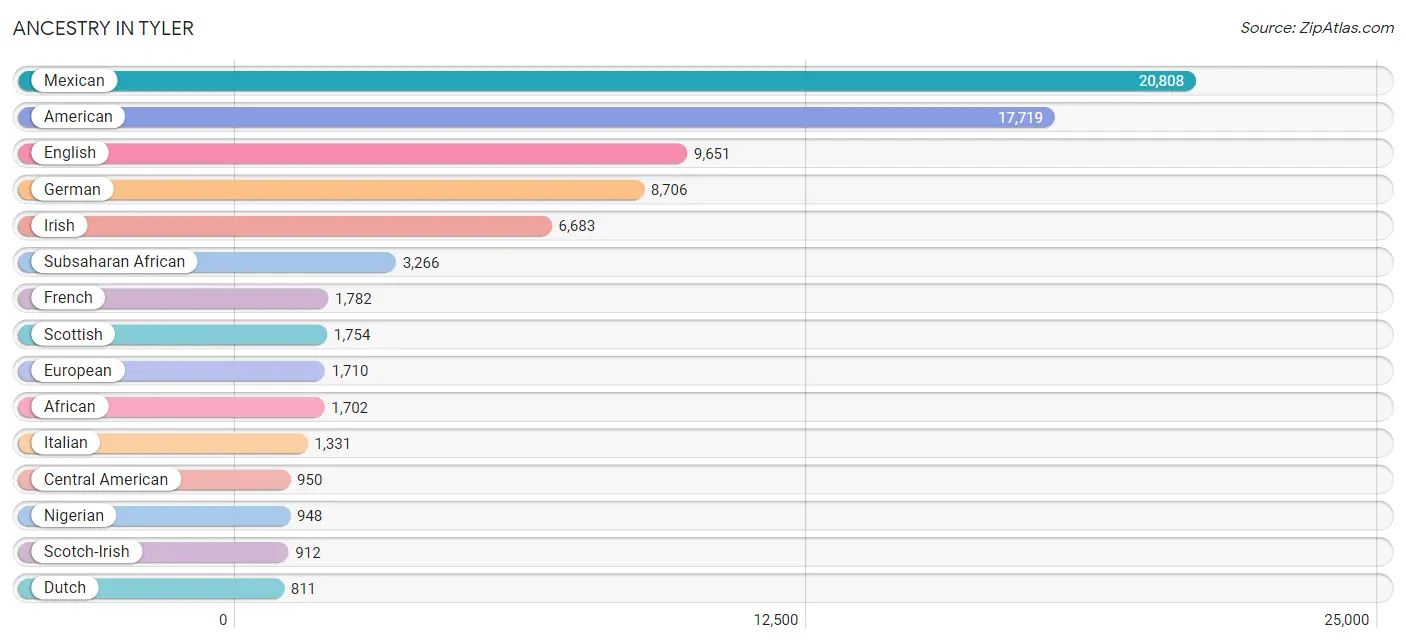
Ancestry in Tyler
The most populous ancestries reported in Tyler are Mexican (20,808 | 19.6%), American (17,719 | 16.7%), English (9,651 | 9.1%), German (8,706 | 8.2%), and Irish (6,683 | 6.3%), together accounting for 59.7% of all Tyler residents.
| Ancestry | # Population | % Population |
| African | 1,702 | 1.6% |
| American | 17,719 | 16.7% |
| Apache | 20 | 0.0% |
| Arab | 391 | 0.4% |
| Argentinean | 26 | 0.0% |
| Australian | 231 | 0.2% |
| Austrian | 18 | 0.0% |
| Bangladeshi | 74 | 0.1% |
| Basque | 25 | 0.0% |
| Belgian | 50 | 0.1% |
| Belizean | 6 | 0.0% |
| Bhutanese | 196 | 0.2% |
| Blackfeet | 169 | 0.2% |
| Brazilian | 138 | 0.1% |
| British | 621 | 0.6% |
| Burmese | 278 | 0.3% |
| Cajun | 73 | 0.1% |
| Canadian | 71 | 0.1% |
| Celtic | 15 | 0.0% |
| Central American | 950 | 0.9% |
| Central American Indian | 196 | 0.2% |
| Cherokee | 135 | 0.1% |
| Chilean | 17 | 0.0% |
| Choctaw | 58 | 0.1% |
| Colombian | 55 | 0.1% |
| Comanche | 10 | 0.0% |
| Creek | 7 | 0.0% |
| Croatian | 6 | 0.0% |
| Cuban | 57 | 0.1% |
| Cypriot | 16 | 0.0% |
| Czech | 307 | 0.3% |
| Czechoslovakian | 11 | 0.0% |
| Danish | 76 | 0.1% |
| Dominican | 3 | 0.0% |
| Dutch | 811 | 0.8% |
| Dutch West Indian | 21 | 0.0% |
| Eastern European | 234 | 0.2% |
| Ecuadorian | 81 | 0.1% |
| English | 9,651 | 9.1% |
| Ethiopian | 12 | 0.0% |
| European | 1,710 | 1.6% |
| Filipino | 7 | 0.0% |
| Finnish | 46 | 0.0% |
| French | 1,782 | 1.7% |
| French Canadian | 76 | 0.1% |
| German | 8,706 | 8.2% |
| Ghanaian | 51 | 0.1% |
| Greek | 87 | 0.1% |
| Guatemalan | 213 | 0.2% |
| Honduran | 402 | 0.4% |
| Hungarian | 81 | 0.1% |
| Indian (Asian) | 580 | 0.5% |
| Iranian | 74 | 0.1% |
| Iraqi | 13 | 0.0% |
| Irish | 6,683 | 6.3% |
| Italian | 1,331 | 1.3% |
| Jamaican | 2 | 0.0% |
| Japanese | 10 | 0.0% |
| Jordanian | 38 | 0.0% |
| Kenyan | 110 | 0.1% |
| Korean | 649 | 0.6% |
| Laotian | 81 | 0.1% |
| Lebanese | 207 | 0.2% |
| Lithuanian | 21 | 0.0% |
| Mexican | 20,808 | 19.6% |
| Mexican American Indian | 261 | 0.3% |
| Native Hawaiian | 89 | 0.1% |
| Navajo | 39 | 0.0% |
| Nigerian | 948 | 0.9% |
| Northern European | 134 | 0.1% |
| Norwegian | 596 | 0.6% |
| Pakistani | 10 | 0.0% |
| Palestinian | 60 | 0.1% |
| Peruvian | 11 | 0.0% |
| Polish | 556 | 0.5% |
| Portuguese | 67 | 0.1% |
| Puerto Rican | 448 | 0.4% |
| Romanian | 60 | 0.1% |
| Russian | 281 | 0.3% |
| Salvadoran | 301 | 0.3% |
| Scandinavian | 224 | 0.2% |
| Scotch-Irish | 912 | 0.9% |
| Scottish | 1,754 | 1.7% |
| Serbian | 23 | 0.0% |
| Sioux | 33 | 0.0% |
| Slavic | 22 | 0.0% |
| South African | 39 | 0.0% |
| South American | 393 | 0.4% |
| Spaniard | 93 | 0.1% |
| Spanish | 66 | 0.1% |
| Spanish American | 18 | 0.0% |
| Sri Lankan | 770 | 0.7% |
| Subsaharan African | 3,266 | 3.1% |
| Swedish | 713 | 0.7% |
| Swiss | 113 | 0.1% |
| Syrian | 5 | 0.0% |
| Thai | 389 | 0.4% |
| Trinidadian and Tobagonian | 12 | 0.0% |
| Turkish | 90 | 0.1% |
| Ukrainian | 9 | 0.0% |
| Venezuelan | 203 | 0.2% |
| Vietnamese | 15 | 0.0% |
| Welsh | 565 | 0.5% |
| Yugoslavian | 5 | 0.0% | View All 104 Rows |
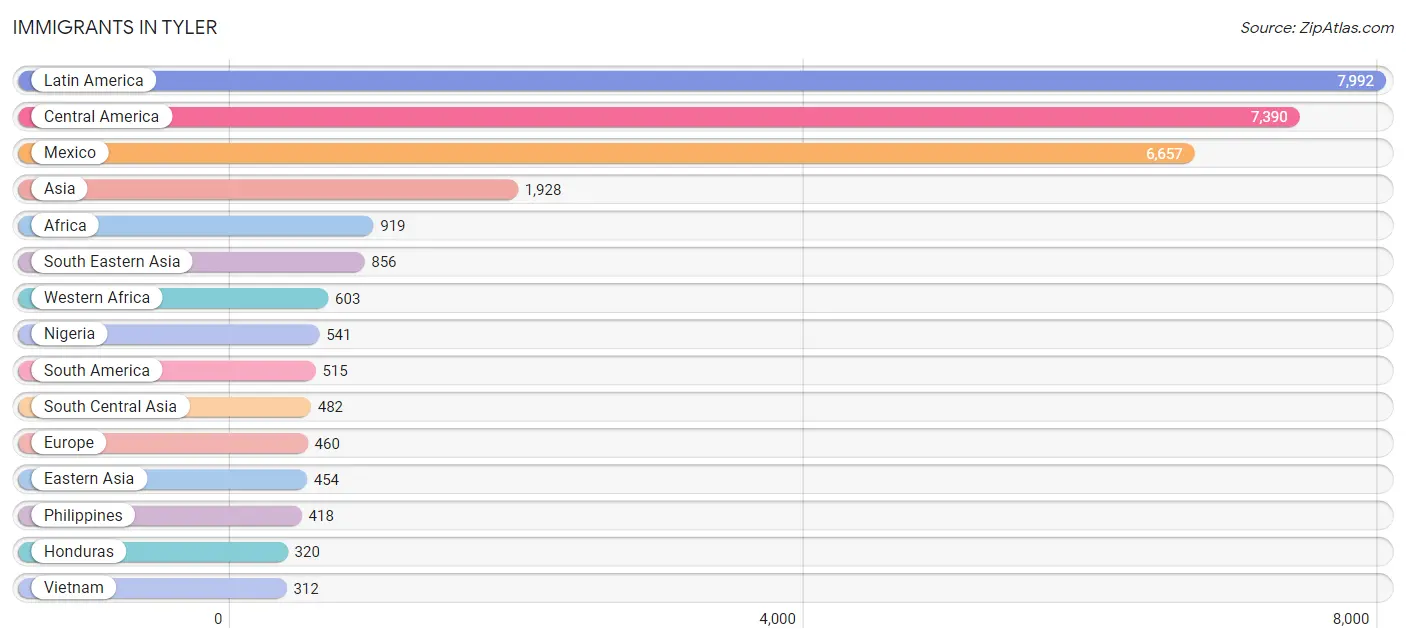
Immigrants in Tyler
The most numerous immigrant groups reported in Tyler came from Latin America (7,992 | 7.5%), Central America (7,390 | 6.9%), Mexico (6,657 | 6.2%), Asia (1,928 | 1.8%), and Africa (919 | 0.9%), together accounting for 23.4% of all Tyler residents.
| Immigration Origin | # Population | % Population |
| Africa | 919 | 0.9% |
| Argentina | 55 | 0.1% |
| Asia | 1,928 | 1.8% |
| Australia | 14 | 0.0% |
| Bangladesh | 15 | 0.0% |
| Brazil | 149 | 0.1% |
| Cambodia | 10 | 0.0% |
| Cameroon | 15 | 0.0% |
| Canada | 93 | 0.1% |
| Caribbean | 87 | 0.1% |
| Central America | 7,390 | 6.9% |
| Chile | 10 | 0.0% |
| China | 248 | 0.2% |
| Colombia | 20 | 0.0% |
| Cuba | 57 | 0.1% |
| Czechoslovakia | 10 | 0.0% |
| Denmark | 17 | 0.0% |
| Dominican Republic | 3 | 0.0% |
| Eastern Africa | 184 | 0.2% |
| Eastern Asia | 454 | 0.4% |
| Eastern Europe | 126 | 0.1% |
| Ecuador | 81 | 0.1% |
| El Salvador | 289 | 0.3% |
| England | 62 | 0.1% |
| Ethiopia | 12 | 0.0% |
| Europe | 460 | 0.4% |
| France | 12 | 0.0% |
| Germany | 49 | 0.1% |
| Ghana | 51 | 0.1% |
| Greece | 6 | 0.0% |
| Guatemala | 106 | 0.1% |
| Honduras | 320 | 0.3% |
| India | 201 | 0.2% |
| Indonesia | 81 | 0.1% |
| Iran | 38 | 0.0% |
| Jordan | 19 | 0.0% |
| Kenya | 70 | 0.1% |
| Korea | 206 | 0.2% |
| Laos | 14 | 0.0% |
| Latin America | 7,992 | 7.5% |
| Latvia | 28 | 0.0% |
| Mexico | 6,657 | 6.2% |
| Middle Africa | 15 | 0.0% |
| Nepal | 20 | 0.0% |
| Nigeria | 541 | 0.5% |
| Northern Africa | 52 | 0.1% |
| Northern Europe | 261 | 0.3% |
| Oceania | 14 | 0.0% |
| Pakistan | 133 | 0.1% |
| Peru | 6 | 0.0% |
| Philippines | 418 | 0.4% |
| Romania | 36 | 0.0% |
| Russia | 29 | 0.0% |
| Saudi Arabia | 9 | 0.0% |
| Serbia | 8 | 0.0% |
| South Africa | 10 | 0.0% |
| South America | 515 | 0.5% |
| South Central Asia | 482 | 0.4% |
| South Eastern Asia | 856 | 0.8% |
| Southern Europe | 12 | 0.0% |
| Spain | 6 | 0.0% |
| Sri Lanka | 65 | 0.1% |
| Thailand | 21 | 0.0% |
| Trinidad and Tobago | 12 | 0.0% |
| Turkey | 31 | 0.0% |
| Uzbekistan | 10 | 0.0% |
| Venezuela | 194 | 0.2% |
| Vietnam | 312 | 0.3% |
| Western Africa | 603 | 0.6% |
| Western Asia | 108 | 0.1% |
| Western Europe | 61 | 0.1% | View All 71 Rows |
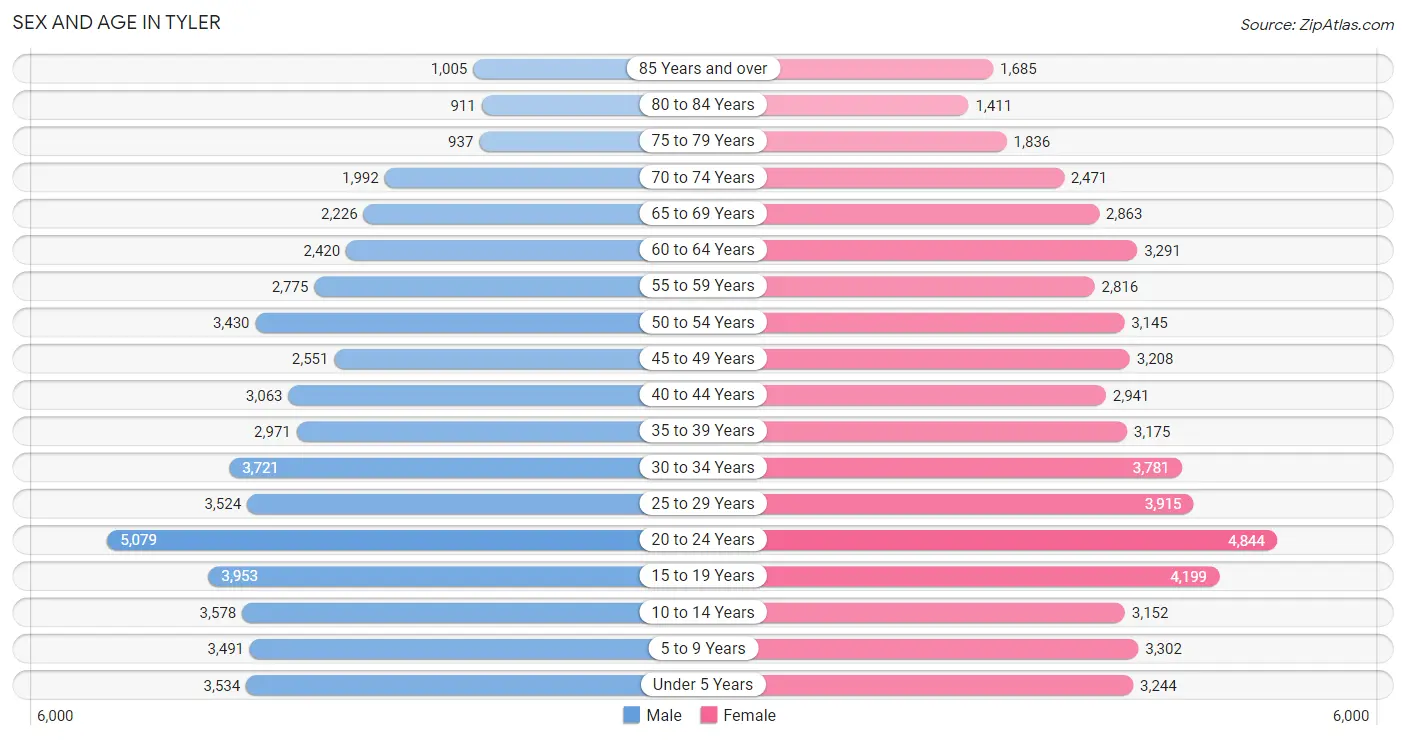
Sex and Age in Tyler
Sex and Age in Tyler
The most populous age groups in Tyler are 20 to 24 Years (5,079 | 9.9%) for men and 20 to 24 Years (4,844 | 8.8%) for women.
| Age Bracket | Male | Female |
| Under 5 Years | 3,534 (6.9%) | 3,244 (5.9%) |
| 5 to 9 Years | 3,491 (6.8%) | 3,302 (6.0%) |
| 10 to 14 Years | 3,578 (7.0%) | 3,152 (5.7%) |
| 15 to 19 Years | 3,953 (7.7%) | 4,199 (7.6%) |
| 20 to 24 Years | 5,079 (9.9%) | 4,844 (8.8%) |
| 25 to 29 Years | 3,524 (6.9%) | 3,915 (7.1%) |
| 30 to 34 Years | 3,721 (7.3%) | 3,781 (6.8%) |
| 35 to 39 Years | 2,971 (5.8%) | 3,175 (5.7%) |
| 40 to 44 Years | 3,063 (6.0%) | 2,941 (5.3%) |
| 45 to 49 Years | 2,551 (5.0%) | 3,208 (5.8%) |
| 50 to 54 Years | 3,430 (6.7%) | 3,145 (5.7%) |
| 55 to 59 Years | 2,775 (5.4%) | 2,816 (5.1%) |
| 60 to 64 Years | 2,420 (4.7%) | 3,291 (5.9%) |
| 65 to 69 Years | 2,226 (4.3%) | 2,863 (5.2%) |
| 70 to 74 Years | 1,992 (3.9%) | 2,471 (4.5%) |
| 75 to 79 Years | 937 (1.8%) | 1,836 (3.3%) |
| 80 to 84 Years | 911 (1.8%) | 1,411 (2.5%) |
| 85 Years and over | 1,005 (2.0%) | 1,685 (3.0%) |
| Total | 51,161 (100.0%) | 55,279 (100.0%) |
Families and Households in Tyler
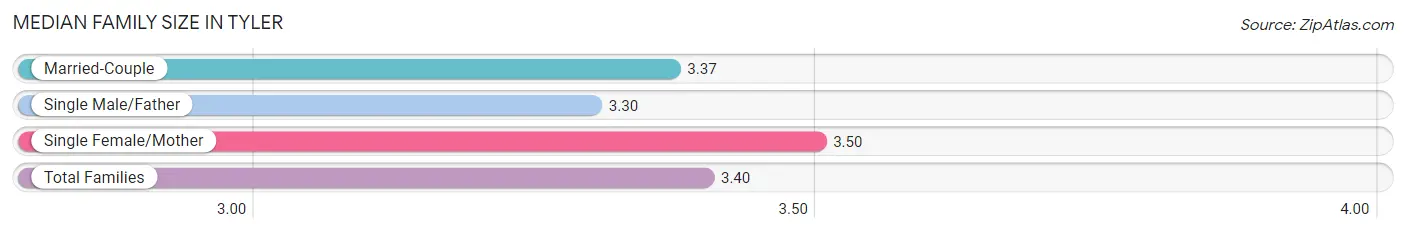
Median Family Size in Tyler
The median family size in Tyler is 3.40 persons per family, with single female/mother families (5,354 | 22.4%) accounting for the largest median family size of 3.5 persons per family. On the other hand, single male/father families (1,518 | 6.4%) represent the smallest median family size with 3.30 persons per family.
| Family Type | # Families | Family Size |
| Married-Couple | 16,996 (71.2%) | 3.37 |
| Single Male/Father | 1,518 (6.4%) | 3.30 |
| Single Female/Mother | 5,354 (22.4%) | 3.50 |
| Total Families | 23,868 (100.0%) | 3.40 |
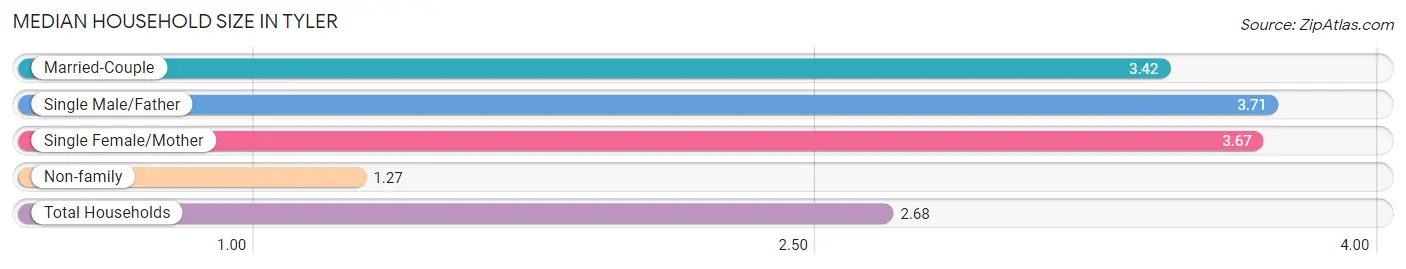
Median Household Size in Tyler
The median household size in Tyler is 2.68 persons per household, with single male/father households (1,518 | 4.0%) accounting for the largest median household size of 3.71 persons per household. non-family households (13,879 | 36.8%) represent the smallest median household size with 1.27 persons per household.
| Household Type | # Households | Household Size |
| Married-Couple | 16,996 (45.0%) | 3.42 |
| Single Male/Father | 1,518 (4.0%) | 3.71 |
| Single Female/Mother | 5,354 (14.2%) | 3.67 |
| Non-family | 13,879 (36.8%) | 1.27 |
| Total Households | 37,747 (100.0%) | 2.68 |
Household Size by Marriage Status in Tyler
Out of a total of 37,747 households in Tyler, 23,868 (63.2%) are family households, while 13,879 (36.8%) are nonfamily households. The most numerous type of family households are 2-person households, comprising 10,769, and the most common type of nonfamily households are 1-person households, comprising 11,302.
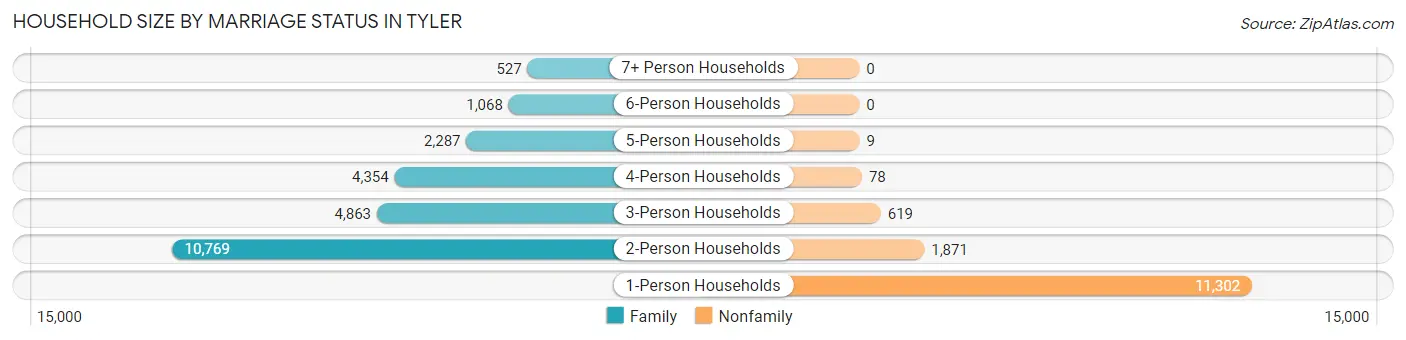
| Household Size | Family Households | Nonfamily Households |
| 1-Person Households | - | 11,302 (29.9%) |
| 2-Person Households | 10,769 (28.5%) | 1,871 (5.0%) |
| 3-Person Households | 4,863 (12.9%) | 619 (1.6%) |
| 4-Person Households | 4,354 (11.5%) | 78 (0.2%) |
| 5-Person Households | 2,287 (6.1%) | 9 (0.0%) |
| 6-Person Households | 1,068 (2.8%) | 0 (0.0%) |
| 7+ Person Households | 527 (1.4%) | 0 (0.0%) |
| Total | 23,868 (63.2%) | 13,879 (36.8%) |
Female Fertility in Tyler
Fertility by Age in Tyler
Average fertility rate in Tyler is 51.0 births per 1,000 women. Women in the age bracket of 20 to 34 years have the highest fertility rate with 88.0 births per 1,000 women. Women in the age bracket of 20 to 34 years acount for 81.4% of all women with births.
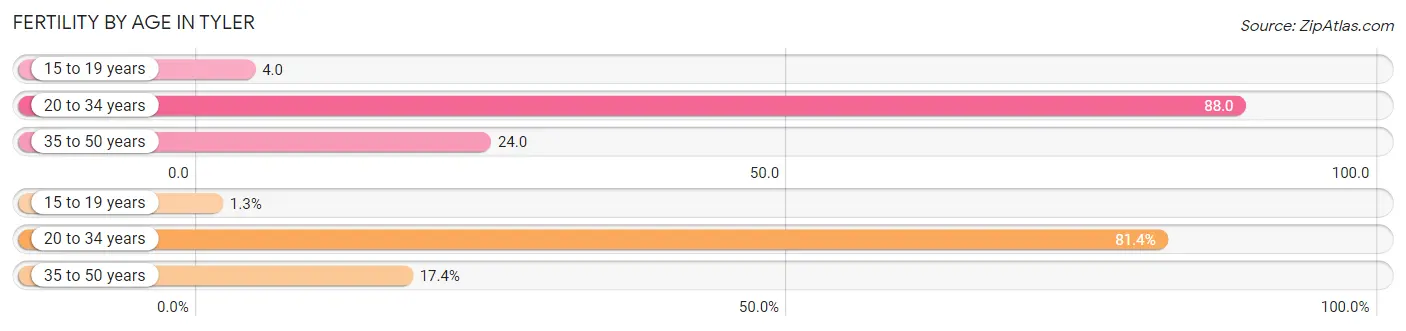
| Age Bracket | Women with Births | Births / 1,000 Women |
| 15 to 19 years | 17 (1.3%) | 4.0 |
| 20 to 34 years | 1,102 (81.4%) | 88.0 |
| 35 to 50 years | 235 (17.4%) | 24.0 |
| Total | 1,354 (100.0%) | 51.0 |
Fertility by Age by Marriage Status in Tyler
66.6% of women with births (1,354) in Tyler are married. The highest percentage of unmarried women with births falls into 15 to 19 years age bracket with 100.0% of them unmarried at the time of birth, while the lowest percentage of unmarried women with births belong to 35 to 50 years age bracket with 17.4% of them unmarried.
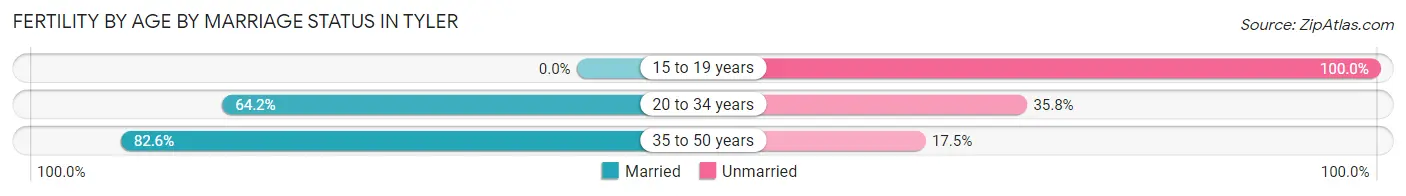
| Age Bracket | Married | Unmarried |
| 15 to 19 years | 0 (0.0%) | 17 (100.0%) |
| 20 to 34 years | 707 (64.2%) | 395 (35.8%) |
| 35 to 50 years | 194 (82.6%) | 41 (17.4%) |
| Total | 902 (66.6%) | 452 (33.4%) |
Fertility by Education in Tyler
Average fertility rate in Tyler is 51.0 births per 1,000 women. Women with the education attainment of high school diploma have the highest fertility rate of 83.0 births per 1,000 women, while women with the education attainment of college or associate's degree have the lowest fertility at 35.0 births per 1,000 women. Women with the education attainment of high school diploma represent 33.2% of all women with births.
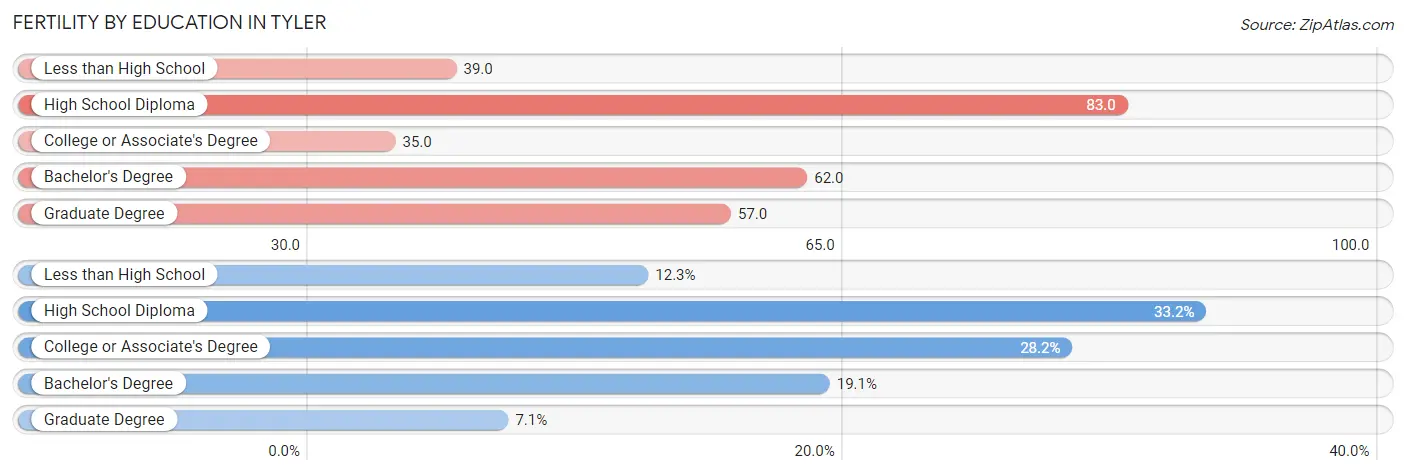
| Educational Attainment | Women with Births | Births / 1,000 Women |
| Less than High School | 167 (12.3%) | 39.0 |
| High School Diploma | 450 (33.2%) | 83.0 |
| College or Associate's Degree | 382 (28.2%) | 35.0 |
| Bachelor's Degree | 259 (19.1%) | 62.0 |
| Graduate Degree | 96 (7.1%) | 57.0 |
| Total | 1,354 (100.0%) | 51.0 |
Fertility by Education by Marriage Status in Tyler
33.4% of women with births in Tyler are unmarried. Women with the educational attainment of graduate degree are most likely to be married with 100.0% of them married at childbirth, while women with the educational attainment of less than high school are least likely to be married with 62.9% of them unmarried at childbirth.
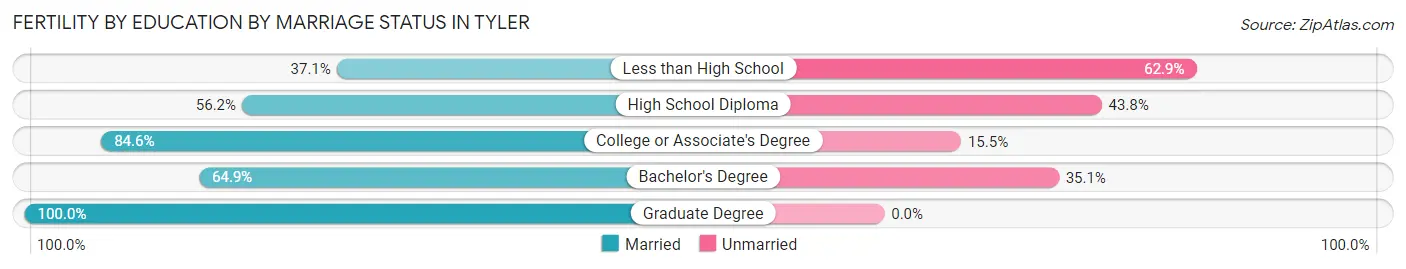
| Educational Attainment | Married | Unmarried |
| Less than High School | 62 (37.1%) | 105 (62.9%) |
| High School Diploma | 253 (56.2%) | 197 (43.8%) |
| College or Associate's Degree | 323 (84.6%) | 59 (15.4%) |
| Bachelor's Degree | 168 (64.9%) | 91 (35.1%) |
| Graduate Degree | 96 (100.0%) | 0 (0.0%) |
| Total | 902 (66.6%) | 452 (33.4%) |
Employment Characteristics in Tyler
Employment by Class of Employer in Tyler
Among the 50,244 employed individuals in Tyler, private company employees (35,388 | 70.4%), not-for-profit organizations (4,002 | 8.0%), and self-employed (not incorporated) (3,407 | 6.8%) make up the most common classes of employment.
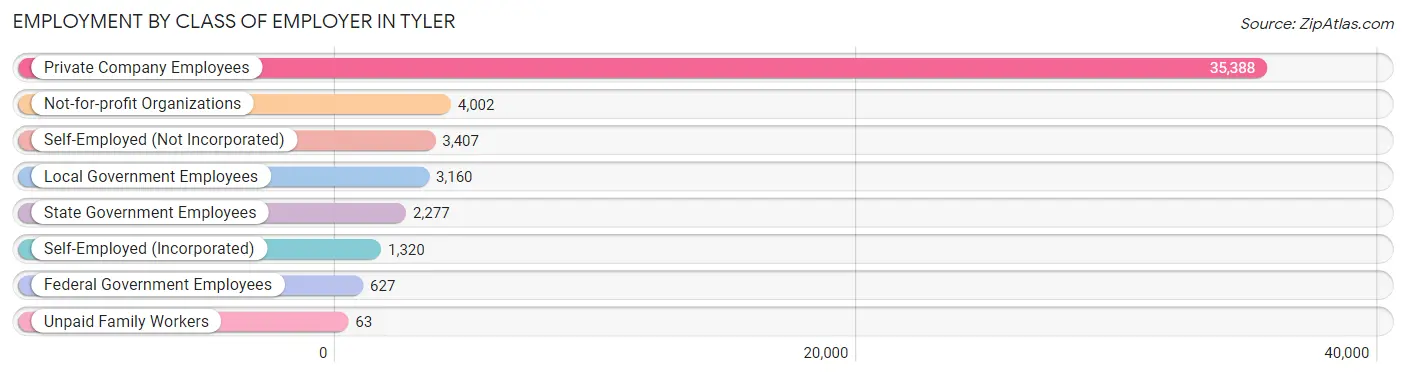
| Employer Class | # Employees | % Employees |
| Private Company Employees | 35,388 | 70.4% |
| Self-Employed (Incorporated) | 1,320 | 2.6% |
| Self-Employed (Not Incorporated) | 3,407 | 6.8% |
| Not-for-profit Organizations | 4,002 | 8.0% |
| Local Government Employees | 3,160 | 6.3% |
| State Government Employees | 2,277 | 4.5% |
| Federal Government Employees | 627 | 1.3% |
| Unpaid Family Workers | 63 | 0.1% |
| Total | 50,244 | 100.0% |
Employment Status by Age in Tyler
According to the labor force statistics for Tyler, out of the total population over 16 years of age (84,892), 63.3% or 53,737 individuals are in the labor force, with 5.3% or 2,848 of them unemployed. The age group with the highest labor force participation rate is 30 to 34 years, with 85.9% or 6,444 individuals in the labor force. Within the labor force, the 16 to 19 years age range has the highest percentage of unemployed individuals, with 15.3% or 437 of them being unemployed.
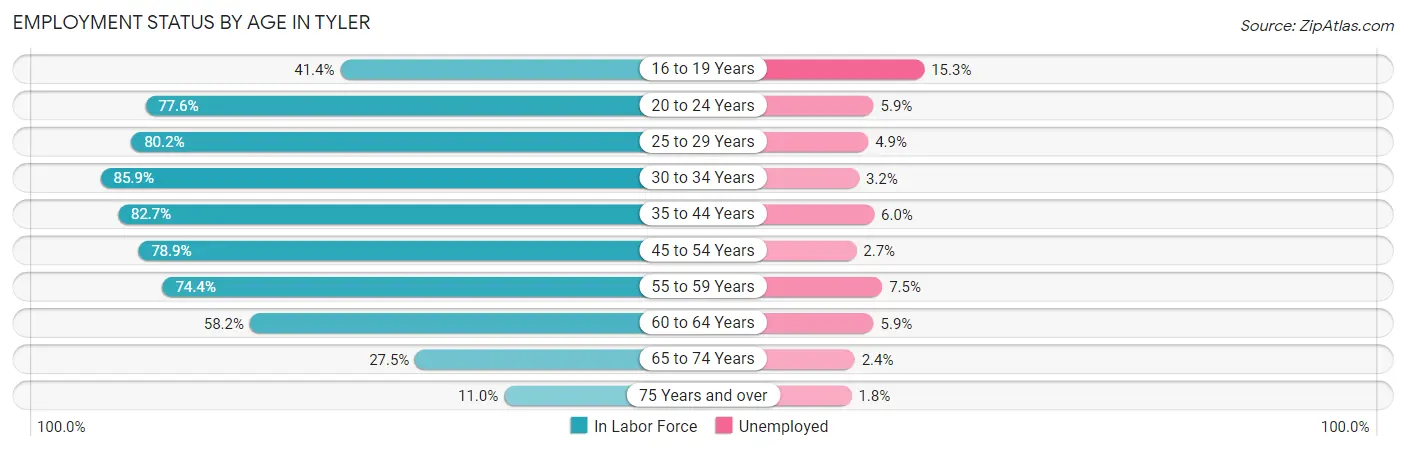
| Age Bracket | In Labor Force | Unemployed |
| 16 to 19 Years | 2,859 (41.4%) | 437 (15.3%) |
| 20 to 24 Years | 7,700 (77.6%) | 454 (5.9%) |
| 25 to 29 Years | 5,966 (80.2%) | 292 (4.9%) |
| 30 to 34 Years | 6,444 (85.9%) | 206 (3.2%) |
| 35 to 44 Years | 10,048 (82.7%) | 603 (6.0%) |
| 45 to 54 Years | 9,732 (78.9%) | 263 (2.7%) |
| 55 to 59 Years | 4,160 (74.4%) | 312 (7.5%) |
| 60 to 64 Years | 3,324 (58.2%) | 196 (5.9%) |
| 65 to 74 Years | 2,627 (27.5%) | 63 (2.4%) |
| 75 Years and over | 856 (11.0%) | 15 (1.8%) |
| Total | 53,737 (63.3%) | 2,848 (5.3%) |
Employment Status by Educational Attainment in Tyler
According to labor force statistics for Tyler, 78.2% of individuals (39,669) out of the total population between 25 and 64 years of age (50,727) are in the labor force, with 4.7% or 1,864 of them being unemployed. The group with the highest labor force participation rate are those with the educational attainment of bachelor's degree or higher, with 84.8% or 13,119 individuals in the labor force. Within the labor force, individuals with high school diploma education have the highest percentage of unemployment, with 7.7% or 603 of them being unemployed.
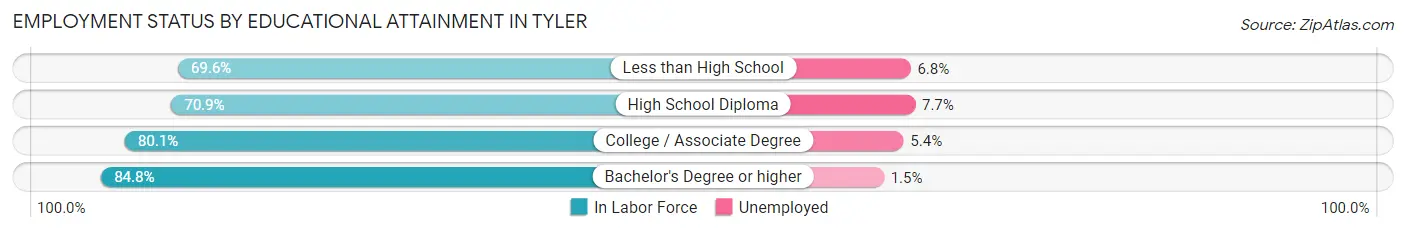
| Educational Attainment | In Labor Force | Unemployed |
| Less than High School | 4,421 (69.6%) | 432 (6.8%) |
| High School Diploma | 7,834 (70.9%) | 851 (7.7%) |
| College / Associate Degree | 14,301 (80.1%) | 964 (5.4%) |
| Bachelor's Degree or higher | 13,119 (84.8%) | 232 (1.5%) |
| Total | 39,669 (78.2%) | 2,384 (4.7%) |
Employment Occupations by Sex in Tyler
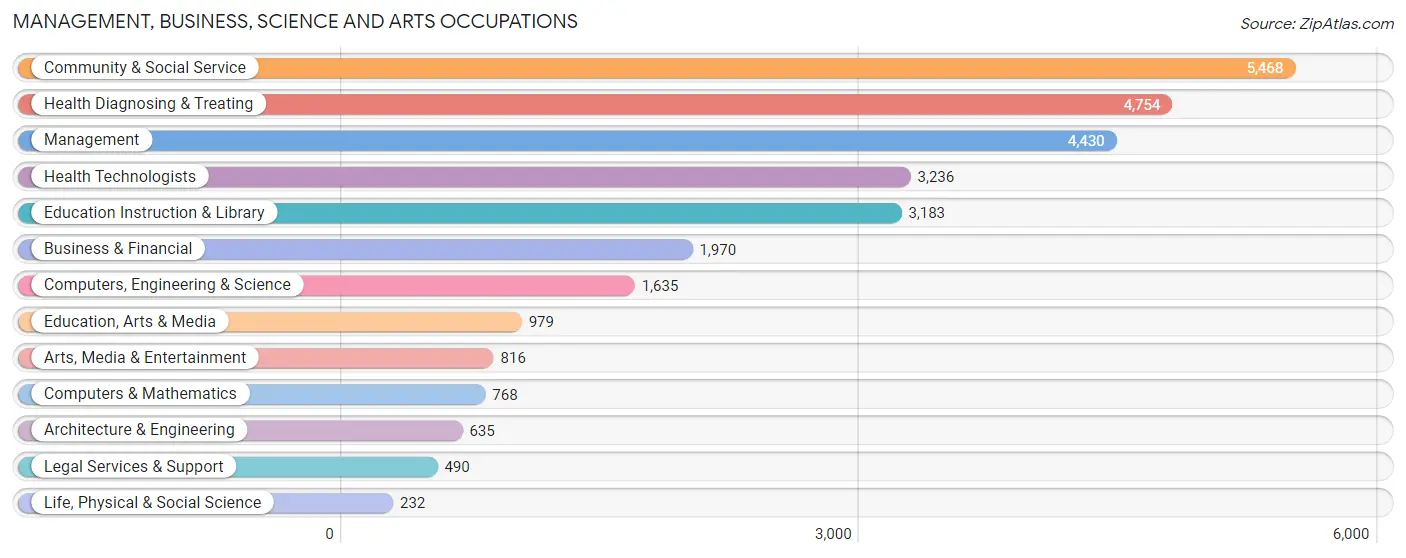
Management, Business, Science and Arts Occupations
The most common Management, Business, Science and Arts occupations in Tyler are Community & Social Service (5,468 | 10.8%), Health Diagnosing & Treating (4,754 | 9.4%), Management (4,430 | 8.7%), Health Technologists (3,236 | 6.4%), and Education Instruction & Library (3,183 | 6.3%).
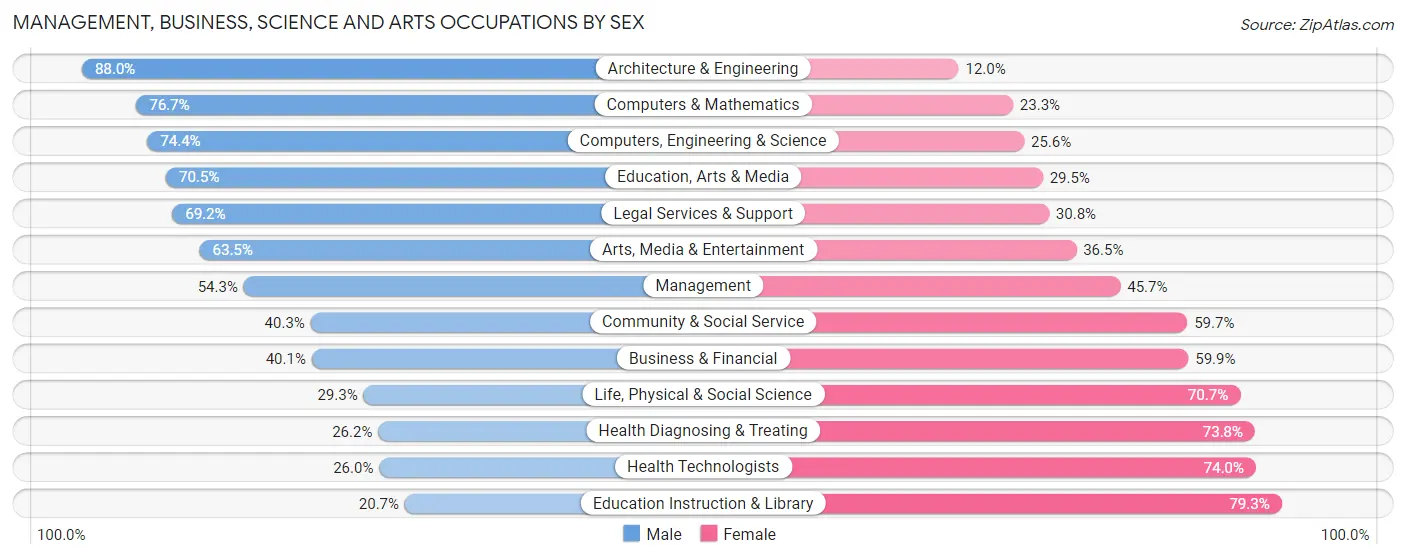
Management, Business, Science and Arts Occupations by Sex
Within the Management, Business, Science and Arts occupations in Tyler, the most male-oriented occupations are Architecture & Engineering (88.0%), Computers & Mathematics (76.7%), and Computers, Engineering & Science (74.4%), while the most female-oriented occupations are Education Instruction & Library (79.3%), Health Technologists (74.0%), and Health Diagnosing & Treating (73.8%).
| Occupation | Male | Female |
| Management | 2,405 (54.3%) | 2,025 (45.7%) |
| Business & Financial | 790 (40.1%) | 1,180 (59.9%) |
| Computers, Engineering & Science | 1,216 (74.4%) | 419 (25.6%) |
| Computers & Mathematics | 589 (76.7%) | 179 (23.3%) |
| Architecture & Engineering | 559 (88.0%) | 76 (12.0%) |
| Life, Physical & Social Science | 68 (29.3%) | 164 (70.7%) |
| Community & Social Service | 2,205 (40.3%) | 3,263 (59.7%) |
| Education, Arts & Media | 690 (70.5%) | 289 (29.5%) |
| Legal Services & Support | 339 (69.2%) | 151 (30.8%) |
| Education Instruction & Library | 658 (20.7%) | 2,525 (79.3%) |
| Arts, Media & Entertainment | 518 (63.5%) | 298 (36.5%) |
| Health Diagnosing & Treating | 1,247 (26.2%) | 3,507 (73.8%) |
| Health Technologists | 842 (26.0%) | 2,394 (74.0%) |
| Total (Category) | 7,863 (43.1%) | 10,394 (56.9%) |
| Total (Overall) | 25,760 (50.7%) | 25,048 (49.3%) |
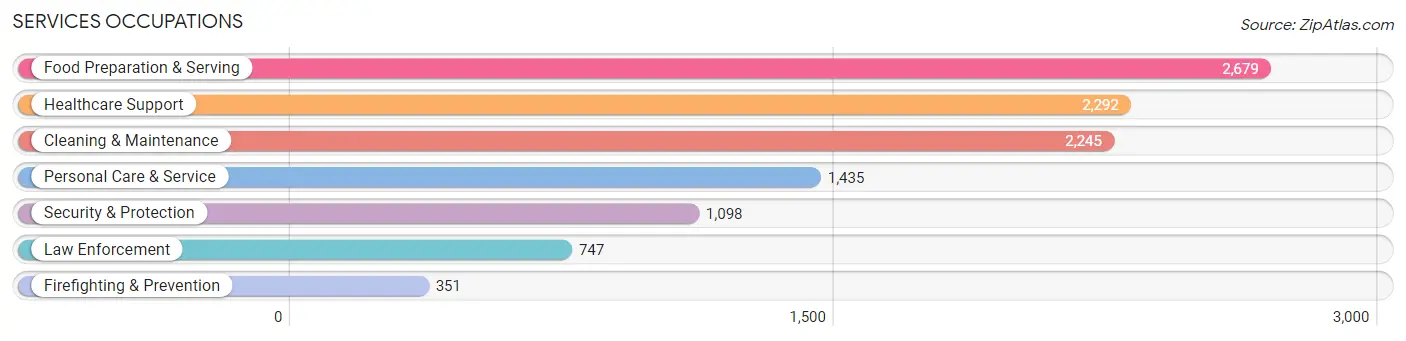
Services Occupations
The most common Services occupations in Tyler are Food Preparation & Serving (2,679 | 5.3%), Healthcare Support (2,292 | 4.5%), Cleaning & Maintenance (2,245 | 4.4%), Personal Care & Service (1,435 | 2.8%), and Security & Protection (1,098 | 2.2%).
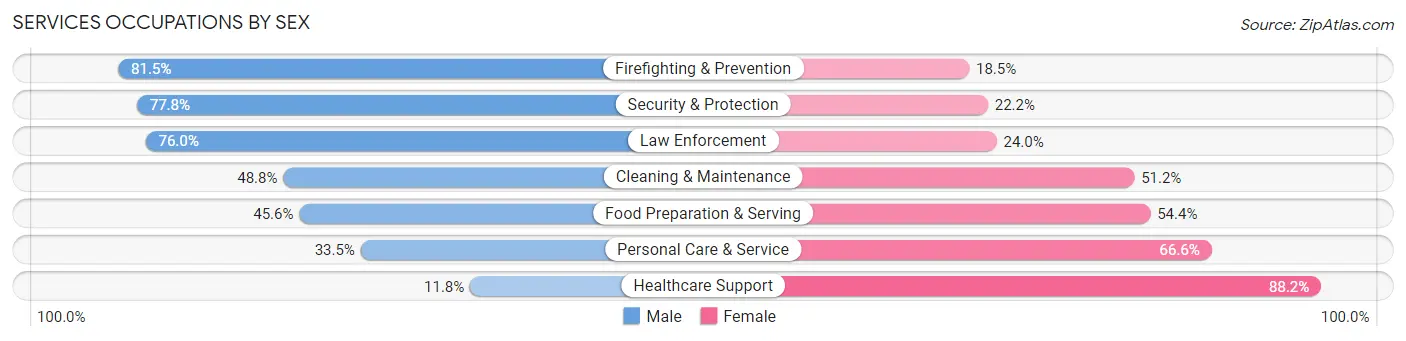
Services Occupations by Sex
Within the Services occupations in Tyler, the most male-oriented occupations are Firefighting & Prevention (81.5%), Security & Protection (77.8%), and Law Enforcement (76.0%), while the most female-oriented occupations are Healthcare Support (88.2%), Personal Care & Service (66.5%), and Food Preparation & Serving (54.4%).
| Occupation | Male | Female |
| Healthcare Support | 270 (11.8%) | 2,022 (88.2%) |
| Security & Protection | 854 (77.8%) | 244 (22.2%) |
| Firefighting & Prevention | 286 (81.5%) | 65 (18.5%) |
| Law Enforcement | 568 (76.0%) | 179 (24.0%) |
| Food Preparation & Serving | 1,222 (45.6%) | 1,457 (54.4%) |
| Cleaning & Maintenance | 1,095 (48.8%) | 1,150 (51.2%) |
| Personal Care & Service | 480 (33.5%) | 955 (66.5%) |
| Total (Category) | 3,921 (40.2%) | 5,828 (59.8%) |
| Total (Overall) | 25,760 (50.7%) | 25,048 (49.3%) |
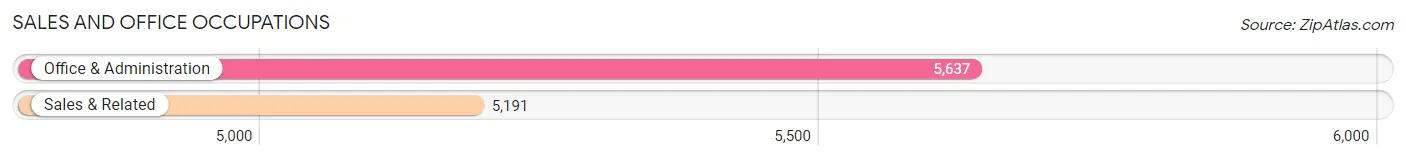
Sales and Office Occupations
The most common Sales and Office occupations in Tyler are Office & Administration (5,637 | 11.1%), and Sales & Related (5,191 | 10.2%).
Sales and Office Occupations by Sex
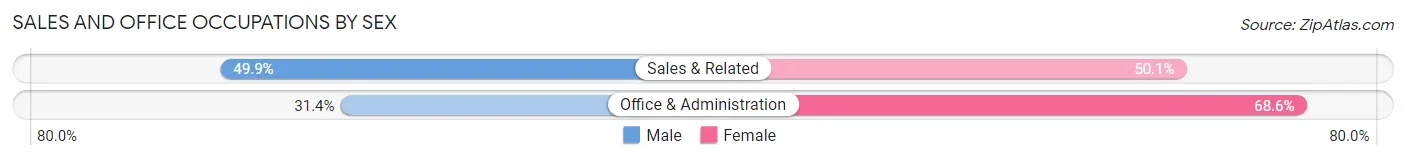
| Occupation | Male | Female |
| Sales & Related | 2,589 (49.9%) | 2,602 (50.1%) |
| Office & Administration | 1,771 (31.4%) | 3,866 (68.6%) |
| Total (Category) | 4,360 (40.3%) | 6,468 (59.7%) |
| Total (Overall) | 25,760 (50.7%) | 25,048 (49.3%) |
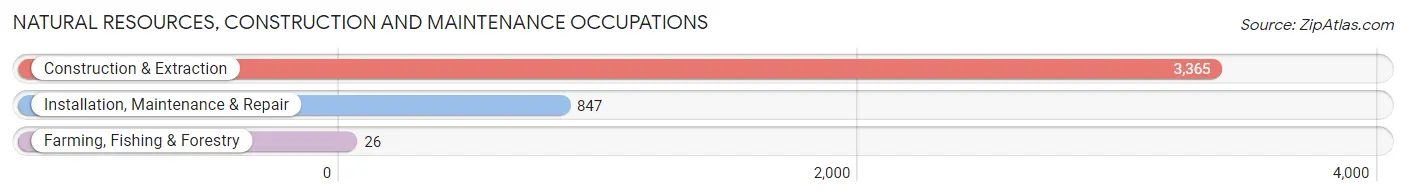
Natural Resources, Construction and Maintenance Occupations
The most common Natural Resources, Construction and Maintenance occupations in Tyler are Construction & Extraction (3,365 | 6.6%), Installation, Maintenance & Repair (847 | 1.7%), and Farming, Fishing & Forestry (26 | 0.1%).
Natural Resources, Construction and Maintenance Occupations by Sex
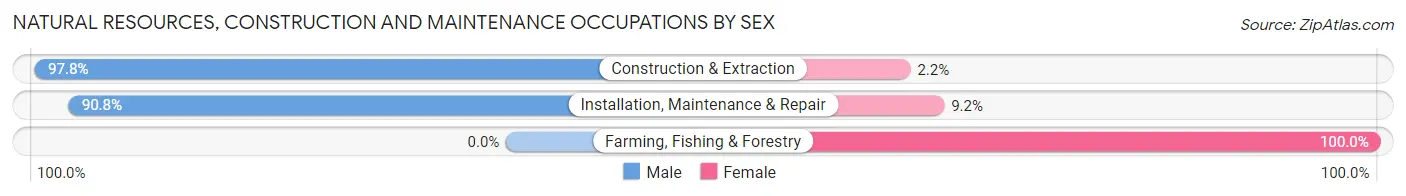
| Occupation | Male | Female |
| Farming, Fishing & Forestry | 0 (0.0%) | 26 (100.0%) |
| Construction & Extraction | 3,291 (97.8%) | 74 (2.2%) |
| Installation, Maintenance & Repair | 769 (90.8%) | 78 (9.2%) |
| Total (Category) | 4,060 (95.8%) | 178 (4.2%) |
| Total (Overall) | 25,760 (50.7%) | 25,048 (49.3%) |
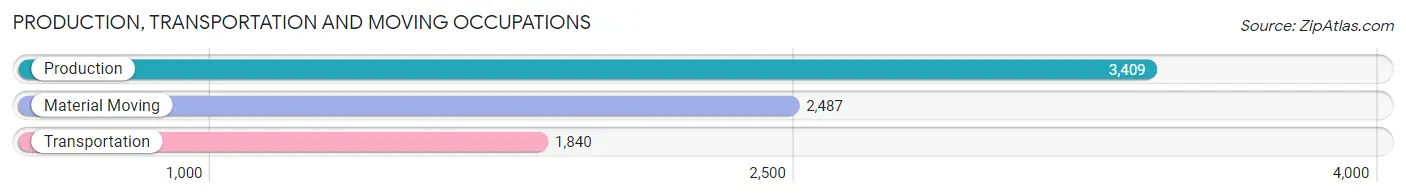
Production, Transportation and Moving Occupations
The most common Production, Transportation and Moving occupations in Tyler are Production (3,409 | 6.7%), Material Moving (2,487 | 4.9%), and Transportation (1,840 | 3.6%).
Production, Transportation and Moving Occupations by Sex
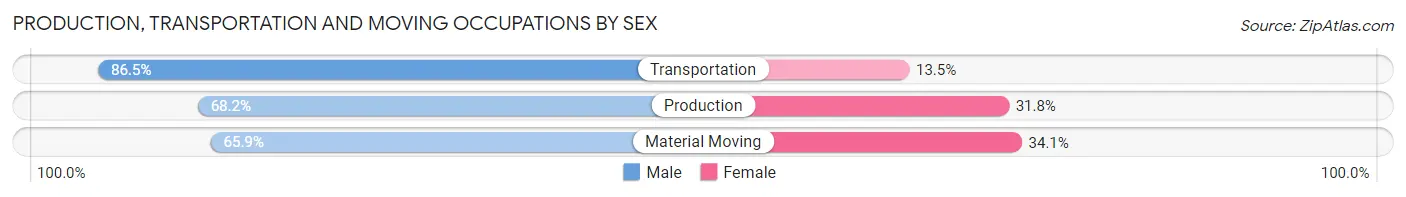
| Occupation | Male | Female |
| Production | 2,326 (68.2%) | 1,083 (31.8%) |
| Transportation | 1,592 (86.5%) | 248 (13.5%) |
| Material Moving | 1,638 (65.9%) | 849 (34.1%) |
| Total (Category) | 5,556 (71.8%) | 2,180 (28.2%) |
| Total (Overall) | 25,760 (50.7%) | 25,048 (49.3%) |
Employment Industries by Sex in Tyler
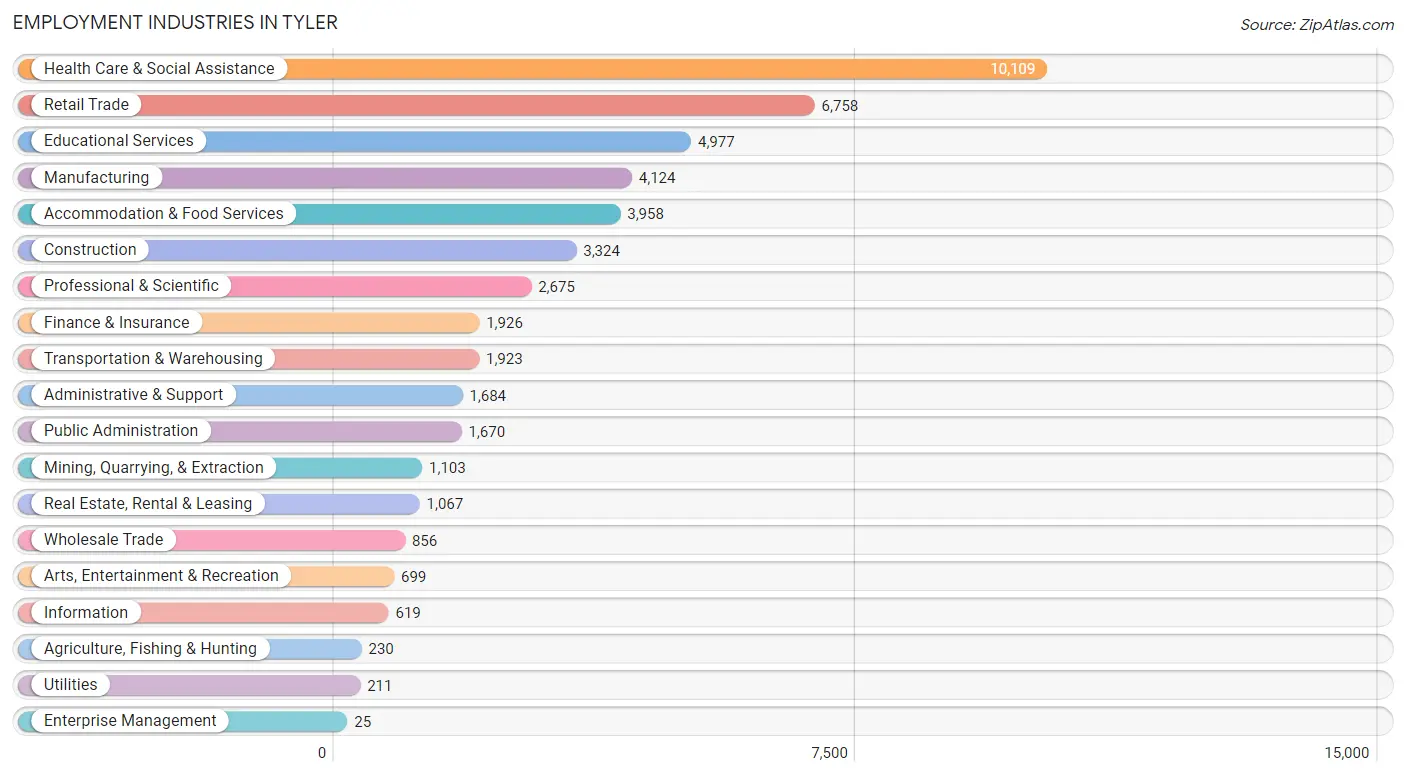
Employment Industries in Tyler
The major employment industries in Tyler include Health Care & Social Assistance (10,109 | 19.9%), Retail Trade (6,758 | 13.3%), Educational Services (4,977 | 9.8%), Manufacturing (4,124 | 8.1%), and Accommodation & Food Services (3,958 | 7.8%).
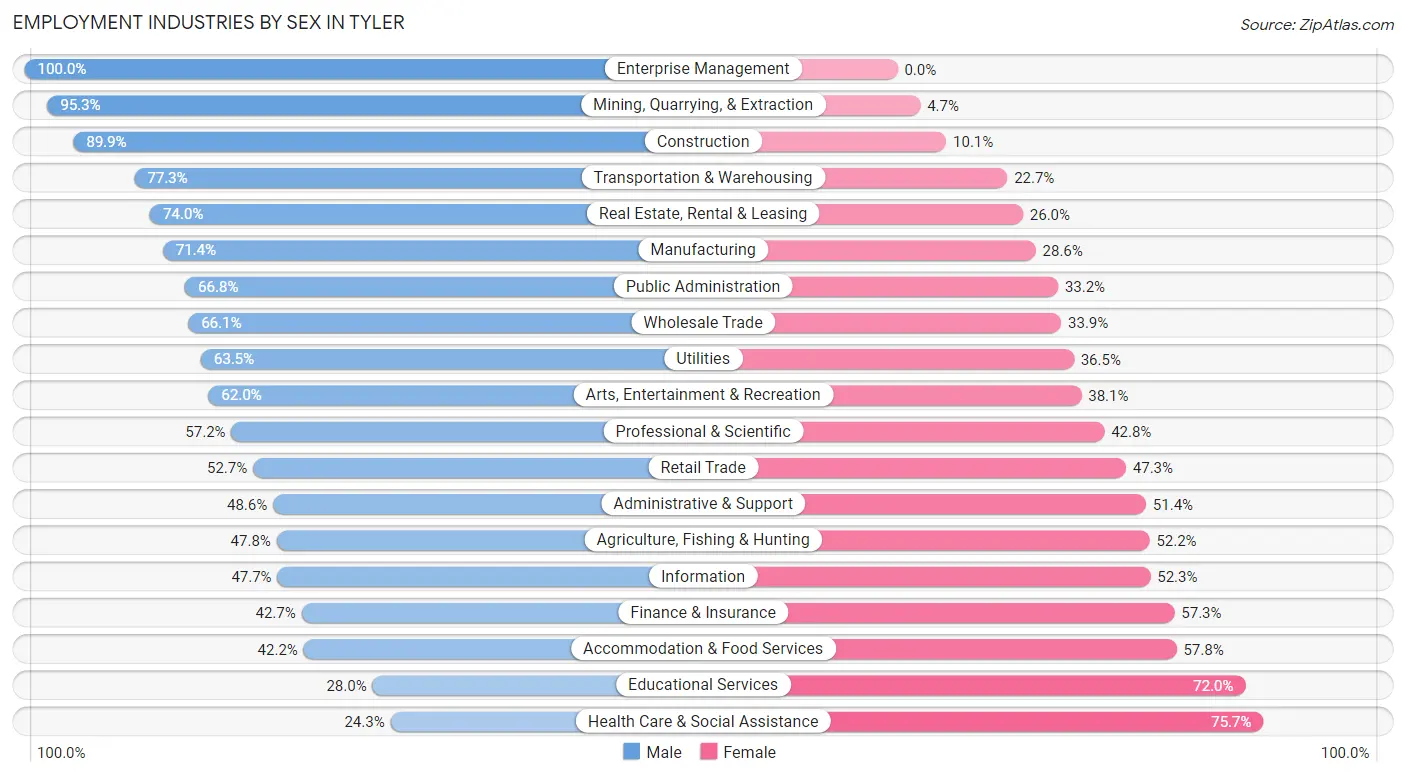
Employment Industries by Sex in Tyler
The Tyler industries that see more men than women are Enterprise Management (100.0%), Mining, Quarrying, & Extraction (95.3%), and Construction (89.9%), whereas the industries that tend to have a higher number of women are Health Care & Social Assistance (75.7%), Educational Services (72.0%), and Accommodation & Food Services (57.8%).
| Industry | Male | Female |
| Agriculture, Fishing & Hunting | 110 (47.8%) | 120 (52.2%) |
| Mining, Quarrying, & Extraction | 1,051 (95.3%) | 52 (4.7%) |
| Construction | 2,989 (89.9%) | 335 (10.1%) |
| Manufacturing | 2,944 (71.4%) | 1,180 (28.6%) |
| Wholesale Trade | 566 (66.1%) | 290 (33.9%) |
| Retail Trade | 3,563 (52.7%) | 3,195 (47.3%) |
| Transportation & Warehousing | 1,486 (77.3%) | 437 (22.7%) |
| Utilities | 134 (63.5%) | 77 (36.5%) |
| Information | 295 (47.7%) | 324 (52.3%) |
| Finance & Insurance | 822 (42.7%) | 1,104 (57.3%) |
| Real Estate, Rental & Leasing | 790 (74.0%) | 277 (26.0%) |
| Professional & Scientific | 1,530 (57.2%) | 1,145 (42.8%) |
| Enterprise Management | 25 (100.0%) | 0 (0.0%) |
| Administrative & Support | 818 (48.6%) | 866 (51.4%) |
| Educational Services | 1,393 (28.0%) | 3,584 (72.0%) |
| Health Care & Social Assistance | 2,453 (24.3%) | 7,656 (75.7%) |
| Arts, Entertainment & Recreation | 433 (62.0%) | 266 (38.1%) |
| Accommodation & Food Services | 1,672 (42.2%) | 2,286 (57.8%) |
| Public Administration | 1,115 (66.8%) | 555 (33.2%) |
| Total | 25,760 (50.7%) | 25,048 (49.3%) |
Education in Tyler
School Enrollment in Tyler
The most common levels of schooling among the 27,704 students in Tyler are college / undergraduate (7,909 | 28.5%), middle school (5,438 | 19.6%), and elementary school (5,237 | 18.9%).
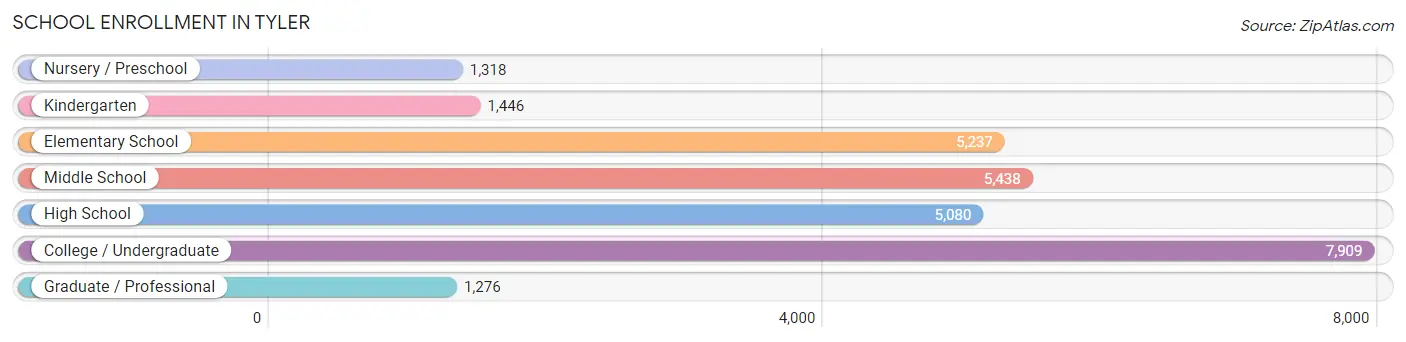
| School Level | # Students | % Students |
| Nursery / Preschool | 1,318 | 4.8% |
| Kindergarten | 1,446 | 5.2% |
| Elementary School | 5,237 | 18.9% |
| Middle School | 5,438 | 19.6% |
| High School | 5,080 | 18.3% |
| College / Undergraduate | 7,909 | 28.5% |
| Graduate / Professional | 1,276 | 4.6% |
| Total | 27,704 | 100.0% |
School Enrollment by Age by Funding Source in Tyler
Out of a total of 27,704 students who are enrolled in schools in Tyler, 3,657 (13.2%) attend a private institution, while the remaining 24,047 (86.8%) are enrolled in public schools. The age group of 3 to 4 year olds has the highest likelihood of being enrolled in private schools, with 428 (34.8% in the age bracket) enrolled. Conversely, the age group of 20 to 24 year olds has the lowest likelihood of being enrolled in a private school, with 3,573 (93.2% in the age bracket) attending a public institution.
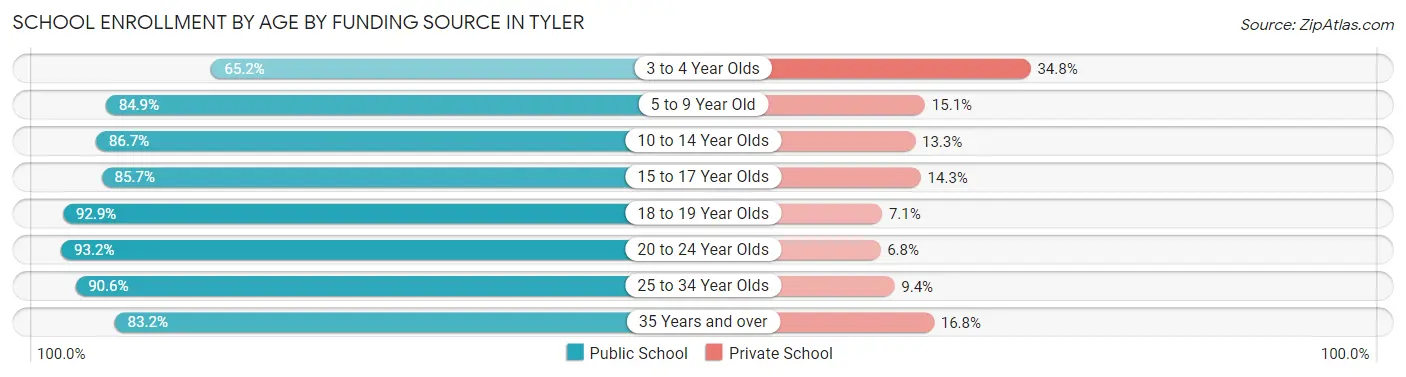
| Age Bracket | Public School | Private School |
| 3 to 4 Year Olds | 802 (65.2%) | 428 (34.8%) |
| 5 to 9 Year Old | 5,257 (84.9%) | 937 (15.1%) |
| 10 to 14 Year Olds | 5,708 (86.7%) | 875 (13.3%) |
| 15 to 17 Year Olds | 3,351 (85.7%) | 561 (14.3%) |
| 18 to 19 Year Olds | 2,745 (92.9%) | 211 (7.1%) |
| 20 to 24 Year Olds | 3,573 (93.2%) | 261 (6.8%) |
| 25 to 34 Year Olds | 1,401 (90.6%) | 146 (9.4%) |
| 35 Years and over | 1,205 (83.2%) | 243 (16.8%) |
| Total | 24,047 (86.8%) | 3,657 (13.2%) |
Educational Attainment by Field of Study in Tyler
Business (5,086 | 22.4%), education (3,341 | 14.7%), science & technology (2,791 | 12.3%), bio, nature & agricultural (1,631 | 7.2%), and arts & humanities (1,513 | 6.7%) are the most common fields of study among 22,679 individuals in Tyler who have obtained a bachelor's degree or higher.
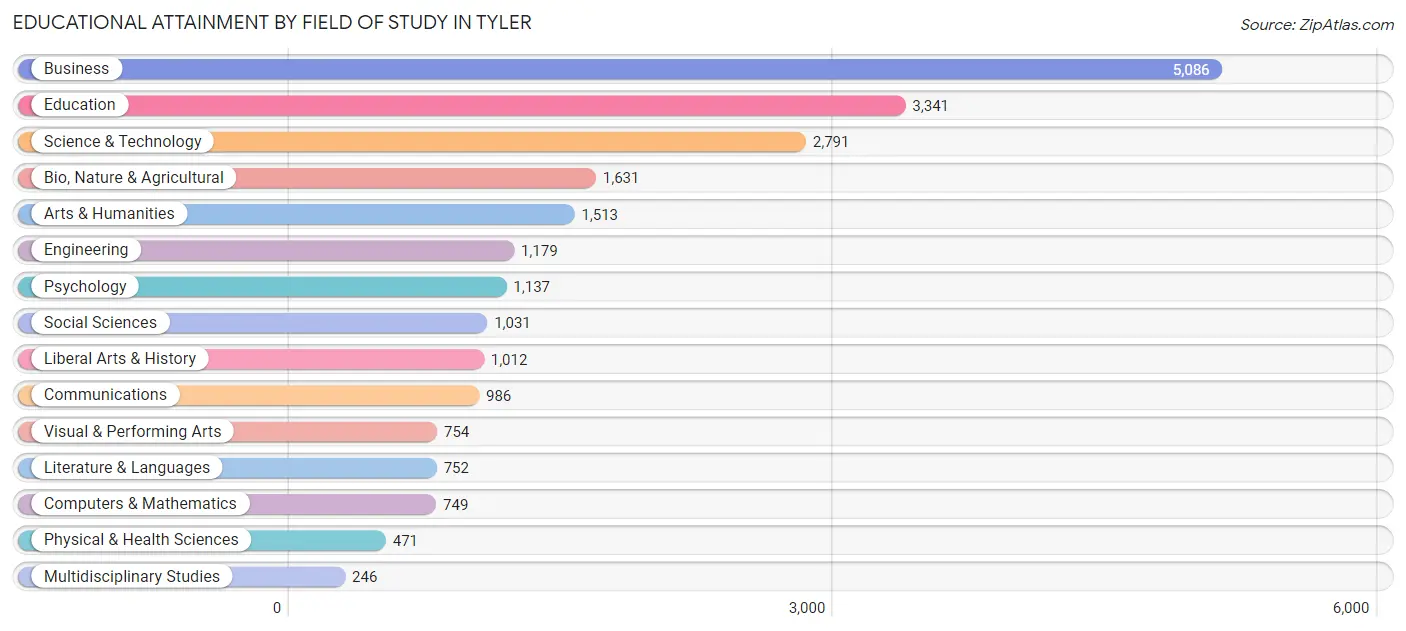
| Field of Study | # Graduates | % Graduates |
| Computers & Mathematics | 749 | 3.3% |
| Bio, Nature & Agricultural | 1,631 | 7.2% |
| Physical & Health Sciences | 471 | 2.1% |
| Psychology | 1,137 | 5.0% |
| Social Sciences | 1,031 | 4.5% |
| Engineering | 1,179 | 5.2% |
| Multidisciplinary Studies | 246 | 1.1% |
| Science & Technology | 2,791 | 12.3% |
| Business | 5,086 | 22.4% |
| Education | 3,341 | 14.7% |
| Literature & Languages | 752 | 3.3% |
| Liberal Arts & History | 1,012 | 4.5% |
| Visual & Performing Arts | 754 | 3.3% |
| Communications | 986 | 4.3% |
| Arts & Humanities | 1,513 | 6.7% |
| Total | 22,679 | 100.0% |
Transportation & Commute in Tyler
Vehicle Availability by Sex in Tyler
The most prevalent vehicle ownership categories in Tyler are males with 2 vehicles (11,364, accounting for 44.9%) and females with 2 vehicles (10,186, making up 47.0%).
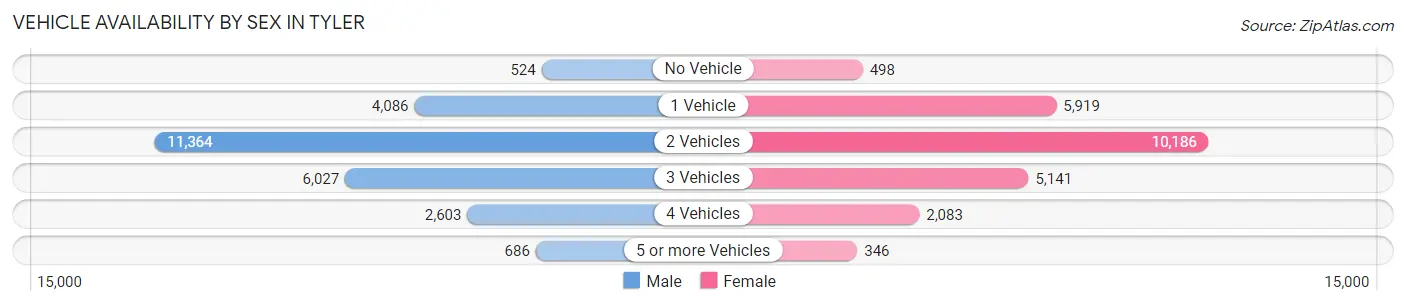
| Vehicles Available | Male | Female |
| No Vehicle | 524 (2.1%) | 498 (2.1%) |
| 1 Vehicle | 4,086 (16.2%) | 5,919 (24.5%) |
| 2 Vehicles | 11,364 (44.9%) | 10,186 (42.1%) |
| 3 Vehicles | 6,027 (23.8%) | 5,141 (21.3%) |
| 4 Vehicles | 2,603 (10.3%) | 2,083 (8.6%) |
| 5 or more Vehicles | 686 (2.7%) | 346 (1.4%) |
| Total | 25,290 (100.0%) | 24,173 (100.0%) |
Commute Time in Tyler
The most frequently occuring commute durations in Tyler are 15 to 19 minutes (10,521 commuters, 22.3%), 10 to 14 minutes (9,437 commuters, 20.0%), and 20 to 24 minutes (8,034 commuters, 17.0%).
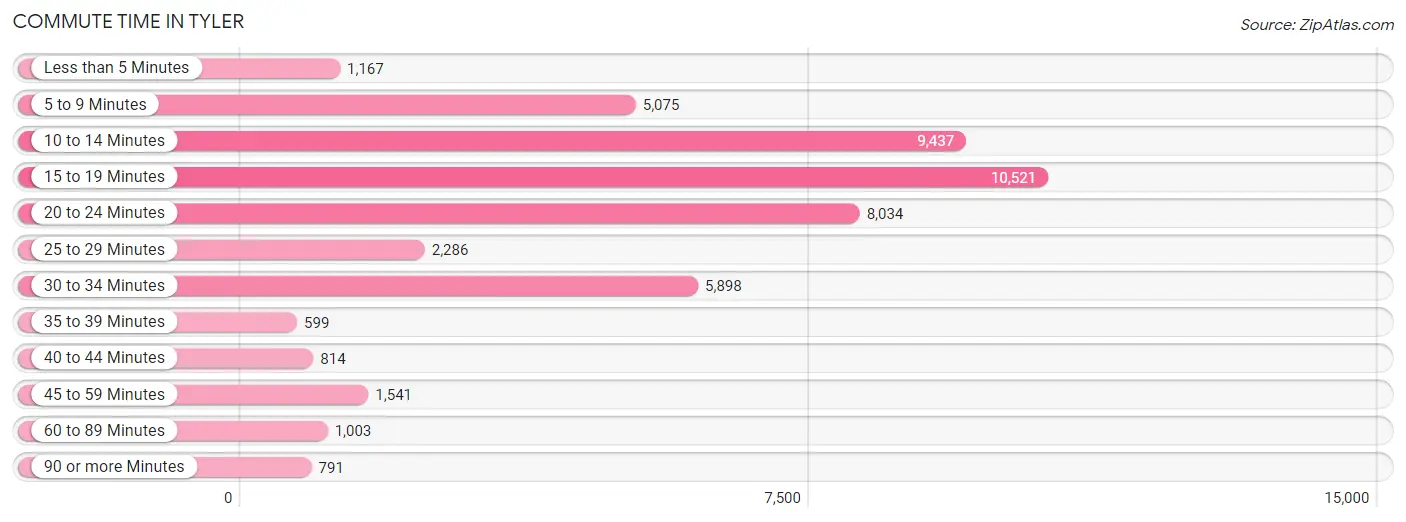
| Commute Time | # Commuters | % Commuters |
| Less than 5 Minutes | 1,167 | 2.5% |
| 5 to 9 Minutes | 5,075 | 10.8% |
| 10 to 14 Minutes | 9,437 | 20.0% |
| 15 to 19 Minutes | 10,521 | 22.3% |
| 20 to 24 Minutes | 8,034 | 17.0% |
| 25 to 29 Minutes | 2,286 | 4.9% |
| 30 to 34 Minutes | 5,898 | 12.5% |
| 35 to 39 Minutes | 599 | 1.3% |
| 40 to 44 Minutes | 814 | 1.7% |
| 45 to 59 Minutes | 1,541 | 3.3% |
| 60 to 89 Minutes | 1,003 | 2.1% |
| 90 or more Minutes | 791 | 1.7% |
Commute Time by Sex in Tyler
The most common commute times in Tyler are 10 to 14 minutes (5,094 commuters, 21.1%) for males and 15 to 19 minutes (5,564 commuters, 24.1%) for females.
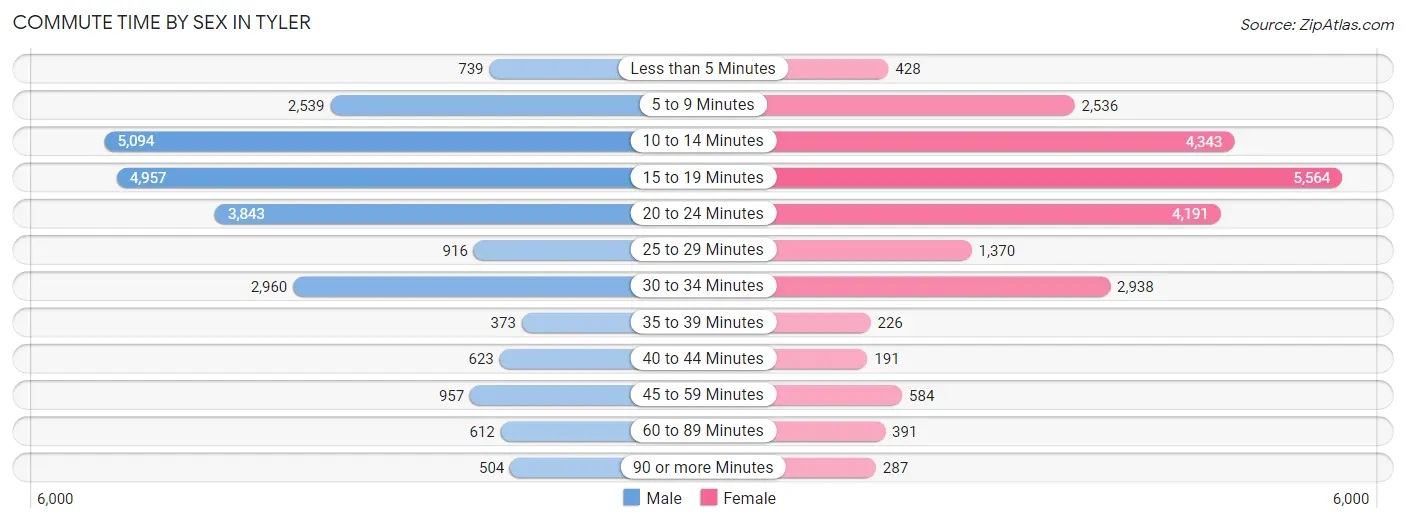
| Commute Time | Male | Female |
| Less than 5 Minutes | 739 (3.1%) | 428 (1.9%) |
| 5 to 9 Minutes | 2,539 (10.5%) | 2,536 (11.0%) |
| 10 to 14 Minutes | 5,094 (21.1%) | 4,343 (18.8%) |
| 15 to 19 Minutes | 4,957 (20.5%) | 5,564 (24.1%) |
| 20 to 24 Minutes | 3,843 (15.9%) | 4,191 (18.2%) |
| 25 to 29 Minutes | 916 (3.8%) | 1,370 (5.9%) |
| 30 to 34 Minutes | 2,960 (12.3%) | 2,938 (12.8%) |
| 35 to 39 Minutes | 373 (1.5%) | 226 (1.0%) |
| 40 to 44 Minutes | 623 (2.6%) | 191 (0.8%) |
| 45 to 59 Minutes | 957 (4.0%) | 584 (2.5%) |
| 60 to 89 Minutes | 612 (2.5%) | 391 (1.7%) |
| 90 or more Minutes | 504 (2.1%) | 287 (1.3%) |
Time of Departure to Work by Sex in Tyler
The most frequent times of departure to work in Tyler are 7:00 AM to 7:29 AM (3,578, 14.8%) for males and 7:30 AM to 7:59 AM (3,942, 17.1%) for females.
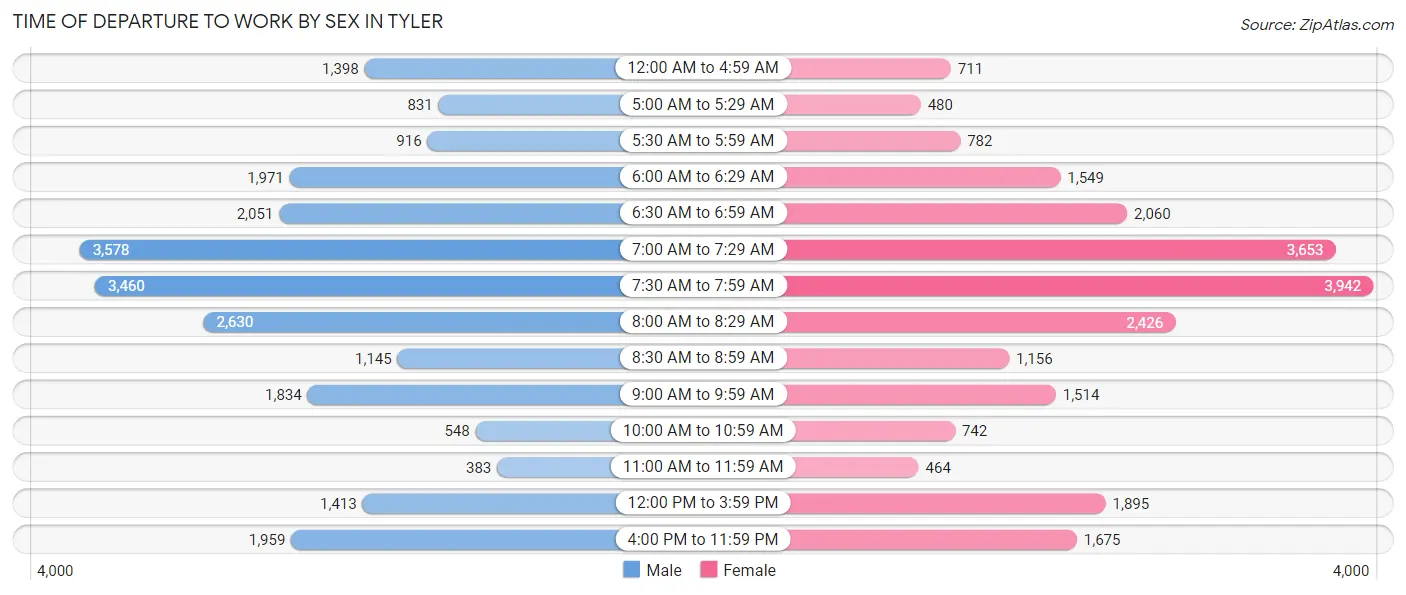
| Time of Departure | Male | Female |
| 12:00 AM to 4:59 AM | 1,398 (5.8%) | 711 (3.1%) |
| 5:00 AM to 5:29 AM | 831 (3.5%) | 480 (2.1%) |
| 5:30 AM to 5:59 AM | 916 (3.8%) | 782 (3.4%) |
| 6:00 AM to 6:29 AM | 1,971 (8.2%) | 1,549 (6.7%) |
| 6:30 AM to 6:59 AM | 2,051 (8.5%) | 2,060 (8.9%) |
| 7:00 AM to 7:29 AM | 3,578 (14.8%) | 3,653 (15.9%) |
| 7:30 AM to 7:59 AM | 3,460 (14.3%) | 3,942 (17.1%) |
| 8:00 AM to 8:29 AM | 2,630 (10.9%) | 2,426 (10.5%) |
| 8:30 AM to 8:59 AM | 1,145 (4.8%) | 1,156 (5.0%) |
| 9:00 AM to 9:59 AM | 1,834 (7.6%) | 1,514 (6.6%) |
| 10:00 AM to 10:59 AM | 548 (2.3%) | 742 (3.2%) |
| 11:00 AM to 11:59 AM | 383 (1.6%) | 464 (2.0%) |
| 12:00 PM to 3:59 PM | 1,413 (5.9%) | 1,895 (8.2%) |
| 4:00 PM to 11:59 PM | 1,959 (8.1%) | 1,675 (7.3%) |
| Total | 24,117 (100.0%) | 23,049 (100.0%) |
Housing Occupancy in Tyler
Occupancy by Ownership in Tyler
Of the total 37,747 dwellings in Tyler, owner-occupied units account for 20,722 (54.9%), while renter-occupied units make up 17,025 (45.1%).
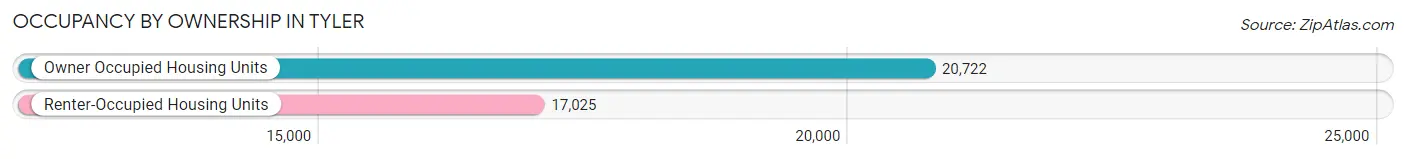
| Occupancy | # Housing Units | % Housing Units |
| Owner Occupied Housing Units | 20,722 | 54.9% |
| Renter-Occupied Housing Units | 17,025 | 45.1% |
| Total Occupied Housing Units | 37,747 | 100.0% |
Occupancy by Household Size in Tyler
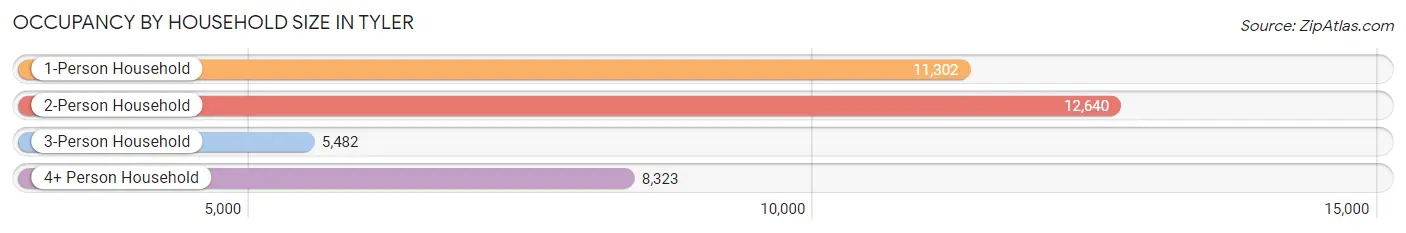
| Household Size | # Housing Units | % Housing Units |
| 1-Person Household | 11,302 | 29.9% |
| 2-Person Household | 12,640 | 33.5% |
| 3-Person Household | 5,482 | 14.5% |
| 4+ Person Household | 8,323 | 22.1% |
| Total Housing Units | 37,747 | 100.0% |
Occupancy by Ownership by Household Size in Tyler
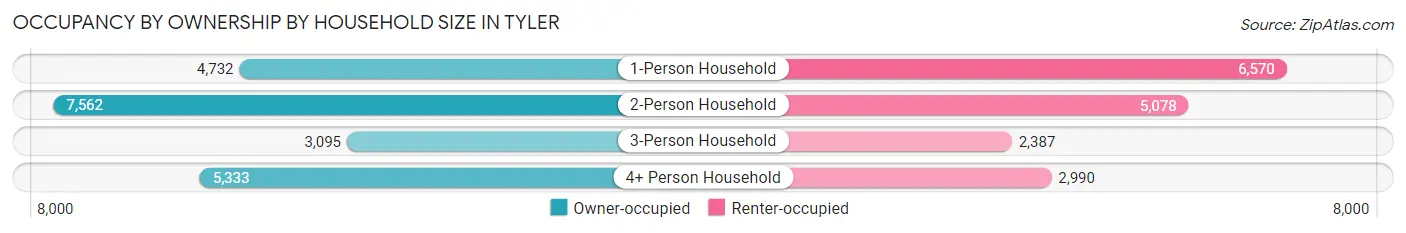
| Household Size | Owner-occupied | Renter-occupied |
| 1-Person Household | 4,732 (41.9%) | 6,570 (58.1%) |
| 2-Person Household | 7,562 (59.8%) | 5,078 (40.2%) |
| 3-Person Household | 3,095 (56.5%) | 2,387 (43.5%) |
| 4+ Person Household | 5,333 (64.1%) | 2,990 (35.9%) |
| Total Housing Units | 20,722 (54.9%) | 17,025 (45.1%) |
Occupancy by Educational Attainment in Tyler
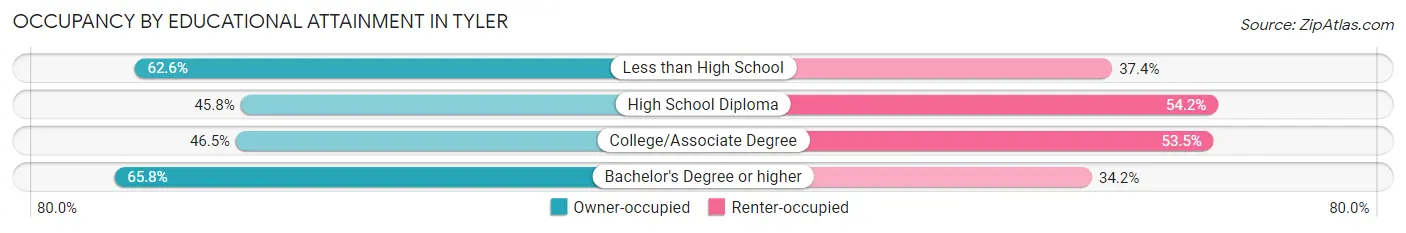
| Household Size | Owner-occupied | Renter-occupied |
| Less than High School | 2,425 (62.6%) | 1,451 (37.4%) |
| High School Diploma | 3,099 (45.8%) | 3,673 (54.2%) |
| College/Associate Degree | 6,320 (46.5%) | 7,278 (53.5%) |
| Bachelor's Degree or higher | 8,878 (65.8%) | 4,623 (34.2%) |
Occupancy by Age of Householder in Tyler
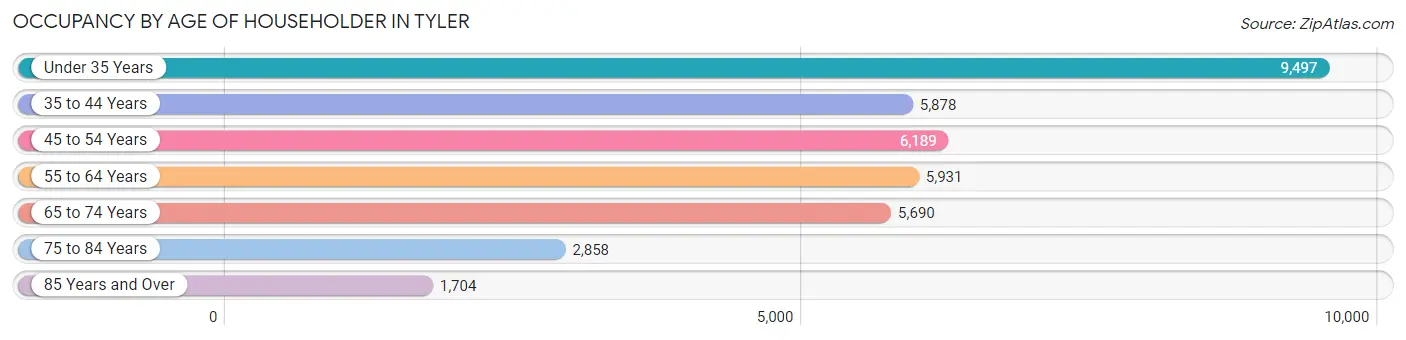
| Age Bracket | # Households | % Households |
| Under 35 Years | 9,497 | 25.2% |
| 35 to 44 Years | 5,878 | 15.6% |
| 45 to 54 Years | 6,189 | 16.4% |
| 55 to 64 Years | 5,931 | 15.7% |
| 65 to 74 Years | 5,690 | 15.1% |
| 75 to 84 Years | 2,858 | 7.6% |
| 85 Years and Over | 1,704 | 4.5% |
| Total | 37,747 | 100.0% |
Housing Finances in Tyler
Median Income by Occupancy in Tyler
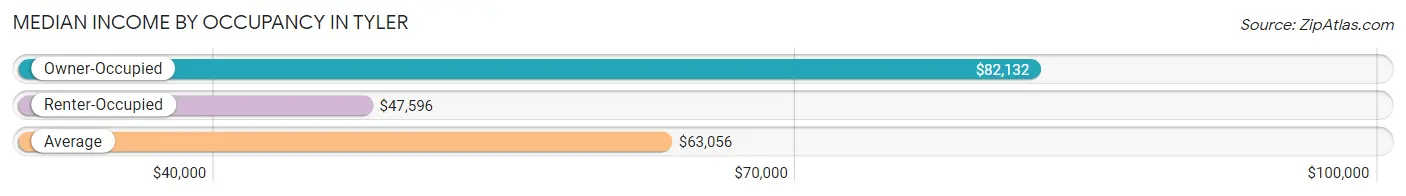
| Occupancy Type | # Households | Median Income |
| Owner-Occupied | 20,722 (54.9%) | $82,132 |
| Renter-Occupied | 17,025 (45.1%) | $47,596 |
| Average | 37,747 (100.0%) | $63,056 |
Occupancy by Householder Income Bracket in Tyler
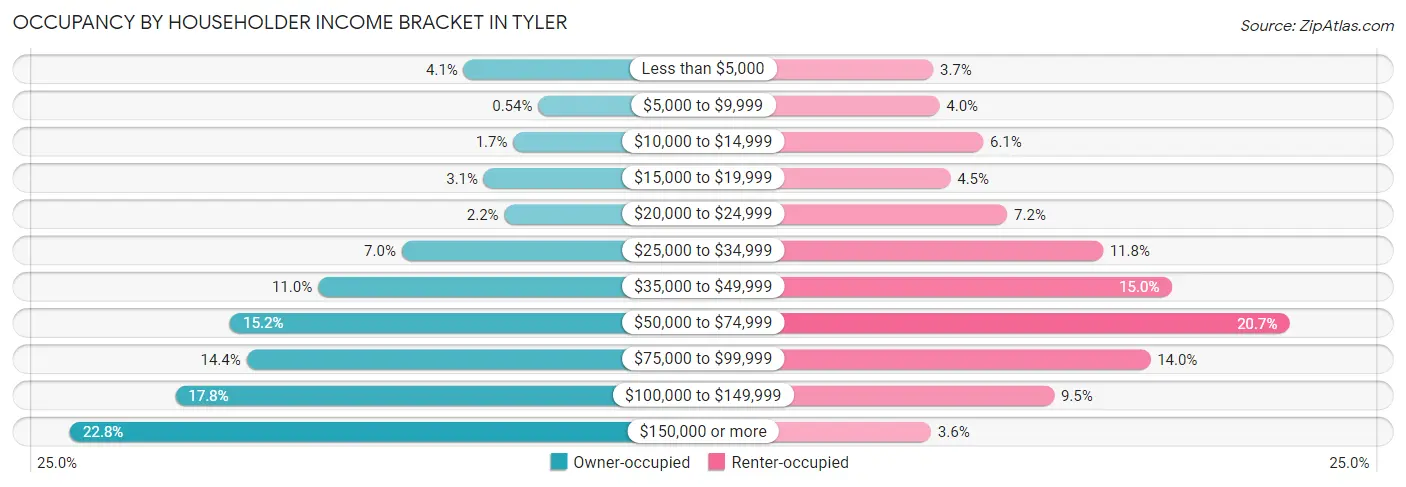
| Income Bracket | Owner-occupied | Renter-occupied |
| Less than $5,000 | 847 (4.1%) | 628 (3.7%) |
| $5,000 to $9,999 | 111 (0.5%) | 680 (4.0%) |
| $10,000 to $14,999 | 359 (1.7%) | 1,033 (6.1%) |
| $15,000 to $19,999 | 648 (3.1%) | 768 (4.5%) |
| $20,000 to $24,999 | 446 (2.1%) | 1,229 (7.2%) |
| $25,000 to $34,999 | 1,458 (7.0%) | 2,003 (11.8%) |
| $35,000 to $49,999 | 2,286 (11.0%) | 2,559 (15.0%) |
| $50,000 to $74,999 | 3,152 (15.2%) | 3,516 (20.6%) |
| $75,000 to $99,999 | 2,990 (14.4%) | 2,388 (14.0%) |
| $100,000 to $149,999 | 3,692 (17.8%) | 1,609 (9.5%) |
| $150,000 or more | 4,733 (22.8%) | 612 (3.6%) |
| Total | 20,722 (100.0%) | 17,025 (100.0%) |
Monthly Housing Cost Tiers in Tyler
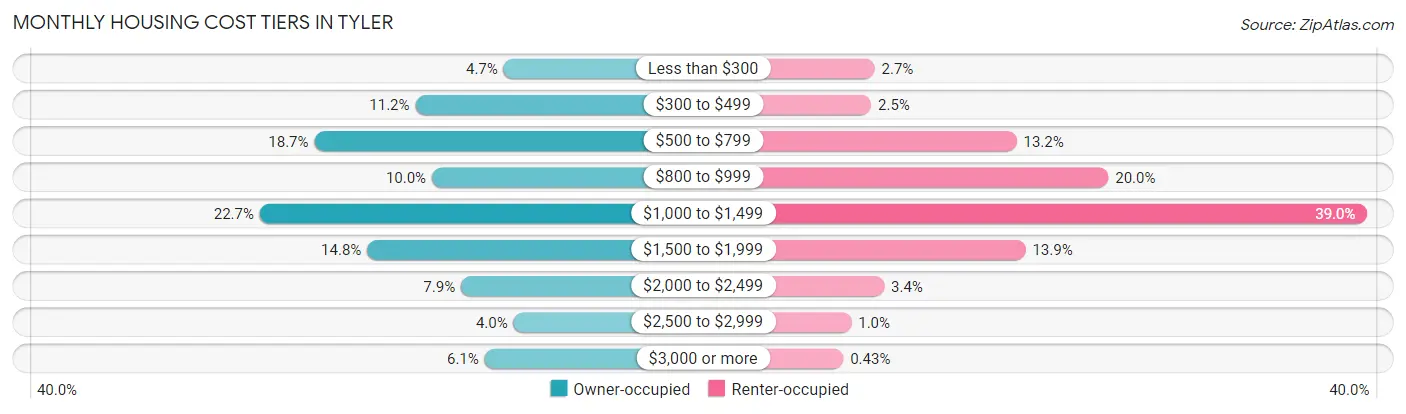
| Monthly Cost | Owner-occupied | Renter-occupied |
| Less than $300 | 978 (4.7%) | 467 (2.7%) |
| $300 to $499 | 2,325 (11.2%) | 422 (2.5%) |
| $500 to $799 | 3,866 (18.7%) | 2,245 (13.2%) |
| $800 to $999 | 2,072 (10.0%) | 3,396 (20.0%) |
| $1,000 to $1,499 | 4,699 (22.7%) | 6,643 (39.0%) |
| $1,500 to $1,999 | 3,060 (14.8%) | 2,358 (13.9%) |
| $2,000 to $2,499 | 1,628 (7.9%) | 586 (3.4%) |
| $2,500 to $2,999 | 826 (4.0%) | 173 (1.0%) |
| $3,000 or more | 1,268 (6.1%) | 73 (0.4%) |
| Total | 20,722 (100.0%) | 17,025 (100.0%) |
Physical Housing Characteristics in Tyler
Housing Structures in Tyler
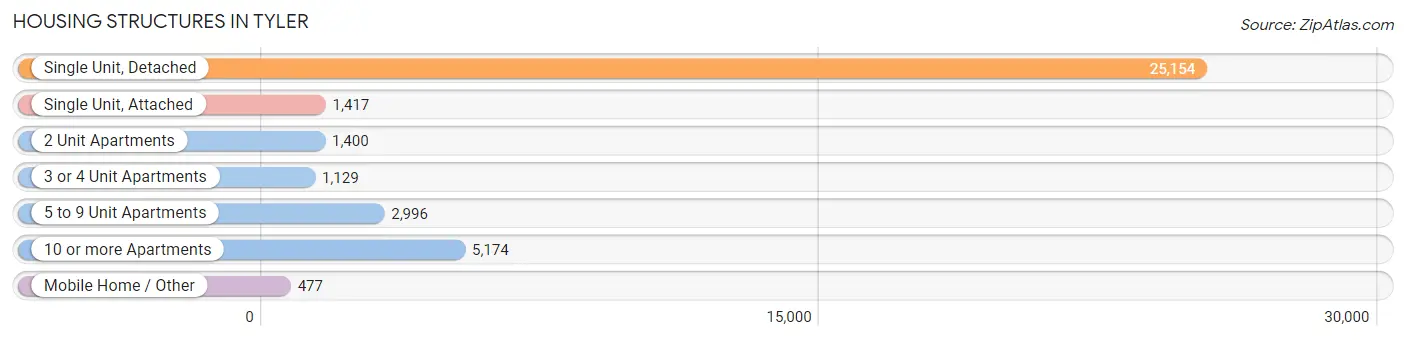
| Structure Type | # Housing Units | % Housing Units |
| Single Unit, Detached | 25,154 | 66.6% |
| Single Unit, Attached | 1,417 | 3.7% |
| 2 Unit Apartments | 1,400 | 3.7% |
| 3 or 4 Unit Apartments | 1,129 | 3.0% |
| 5 to 9 Unit Apartments | 2,996 | 7.9% |
| 10 or more Apartments | 5,174 | 13.7% |
| Mobile Home / Other | 477 | 1.3% |
| Total | 37,747 | 100.0% |
Housing Structures by Occupancy in Tyler
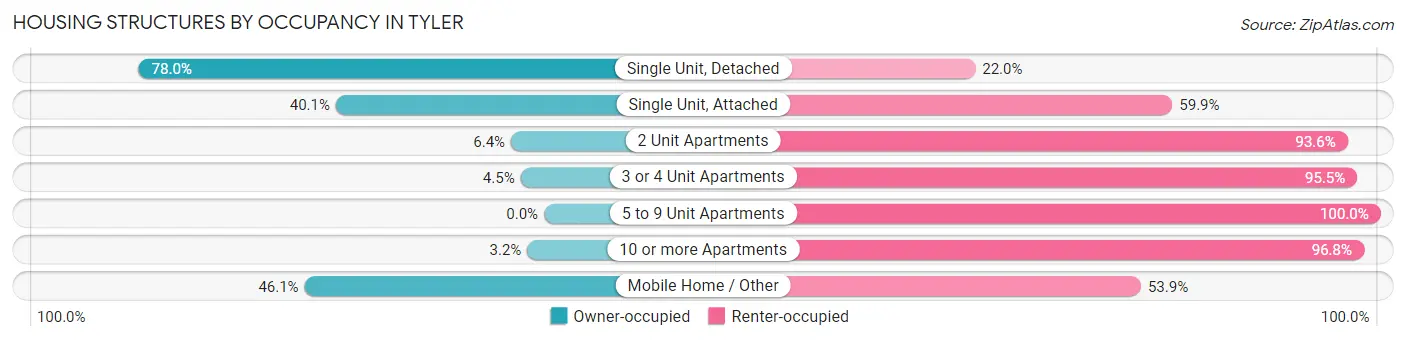
| Structure Type | Owner-occupied | Renter-occupied |
| Single Unit, Detached | 19,627 (78.0%) | 5,527 (22.0%) |
| Single Unit, Attached | 568 (40.1%) | 849 (59.9%) |
| 2 Unit Apartments | 89 (6.4%) | 1,311 (93.6%) |
| 3 or 4 Unit Apartments | 51 (4.5%) | 1,078 (95.5%) |
| 5 to 9 Unit Apartments | 0 (0.0%) | 2,996 (100.0%) |
| 10 or more Apartments | 167 (3.2%) | 5,007 (96.8%) |
| Mobile Home / Other | 220 (46.1%) | 257 (53.9%) |
| Total | 20,722 (54.9%) | 17,025 (45.1%) |
Housing Structures by Number of Rooms in Tyler
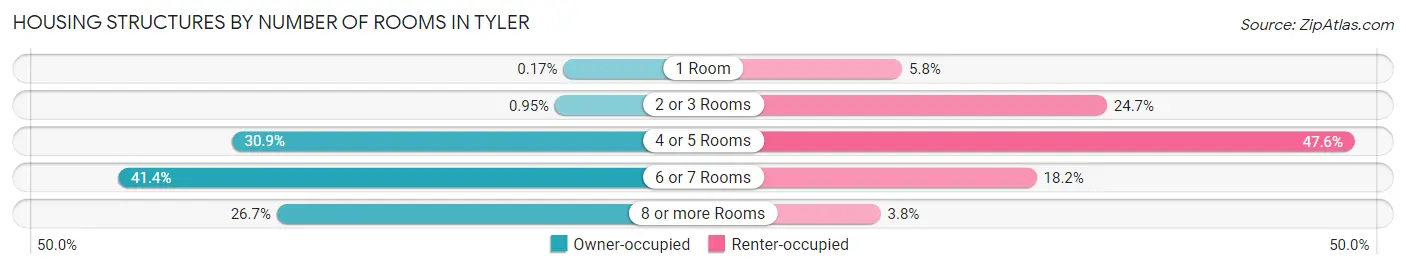
| Number of Rooms | Owner-occupied | Renter-occupied |
| 1 Room | 35 (0.2%) | 979 (5.8%) |
| 2 or 3 Rooms | 196 (0.9%) | 4,203 (24.7%) |
| 4 or 5 Rooms | 6,395 (30.9%) | 8,107 (47.6%) |
| 6 or 7 Rooms | 8,568 (41.3%) | 3,096 (18.2%) |
| 8 or more Rooms | 5,528 (26.7%) | 640 (3.8%) |
| Total | 20,722 (100.0%) | 17,025 (100.0%) |
Housing Structure by Heating Type in Tyler
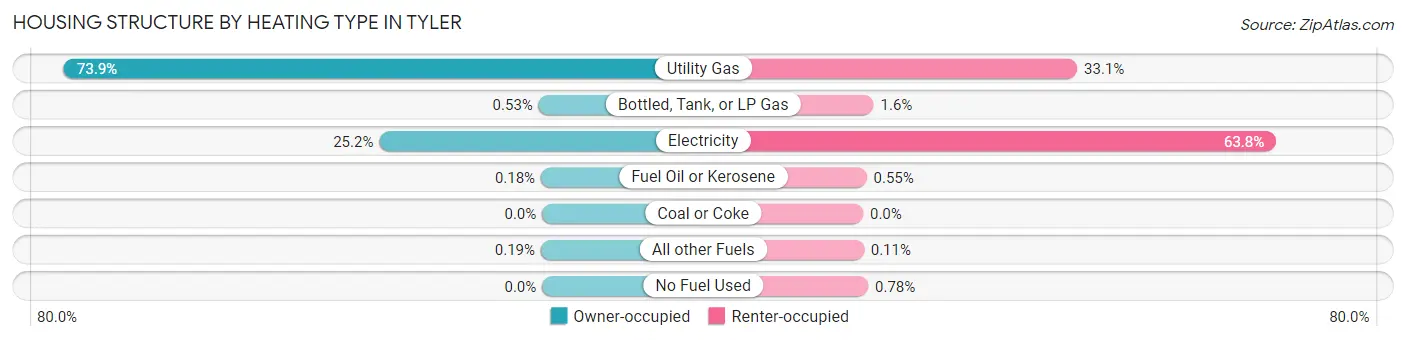
| Heating Type | Owner-occupied | Renter-occupied |
| Utility Gas | 15,317 (73.9%) | 5,636 (33.1%) |
| Bottled, Tank, or LP Gas | 110 (0.5%) | 277 (1.6%) |
| Electricity | 5,218 (25.2%) | 10,868 (63.8%) |
| Fuel Oil or Kerosene | 37 (0.2%) | 93 (0.5%) |
| Coal or Coke | 0 (0.0%) | 0 (0.0%) |
| All other Fuels | 40 (0.2%) | 19 (0.1%) |
| No Fuel Used | 0 (0.0%) | 132 (0.8%) |
| Total | 20,722 (100.0%) | 17,025 (100.0%) |
Household Vehicle Usage in Tyler
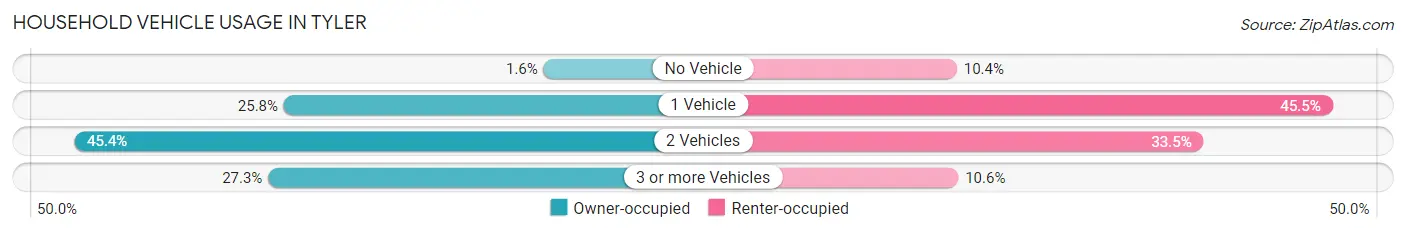
| Vehicles per Household | Owner-occupied | Renter-occupied |
| No Vehicle | 322 (1.5%) | 1,777 (10.4%) |
| 1 Vehicle | 5,346 (25.8%) | 7,749 (45.5%) |
| 2 Vehicles | 9,405 (45.4%) | 5,698 (33.5%) |
| 3 or more Vehicles | 5,649 (27.3%) | 1,801 (10.6%) |
| Total | 20,722 (100.0%) | 17,025 (100.0%) |
Real Estate & Mortgages in Tyler
Real Estate and Mortgage Overview in Tyler
| Characteristic | Without Mortgage | With Mortgage |
| Housing Units | 9,469 | 11,253 |
| Median Property Value | $190,500 | $218,000 |
| Median Household Income | $64,994 | $2,931 |
| Monthly Housing Costs | $615 | $1,248 |
| Real Estate Taxes | $2,311 | $353 |
Property Value by Mortgage Status in Tyler
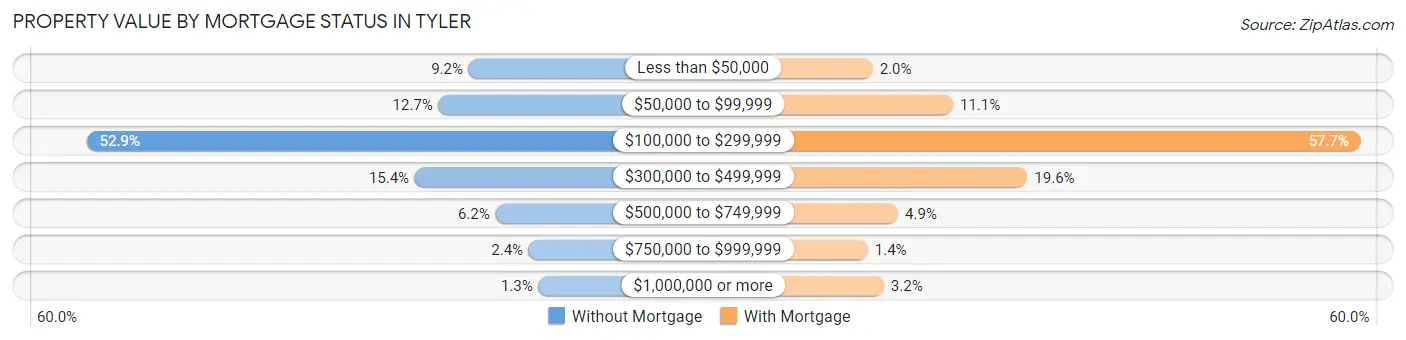
| Property Value | Without Mortgage | With Mortgage |
| Less than $50,000 | 874 (9.2%) | 221 (2.0%) |
| $50,000 to $99,999 | 1,201 (12.7%) | 1,254 (11.1%) |
| $100,000 to $299,999 | 5,010 (52.9%) | 6,496 (57.7%) |
| $300,000 to $499,999 | 1,457 (15.4%) | 2,210 (19.6%) |
| $500,000 to $749,999 | 585 (6.2%) | 548 (4.9%) |
| $750,000 to $999,999 | 223 (2.4%) | 159 (1.4%) |
| $1,000,000 or more | 119 (1.3%) | 365 (3.2%) |
| Total | 9,469 (100.0%) | 11,253 (100.0%) |
Household Income by Mortgage Status in Tyler
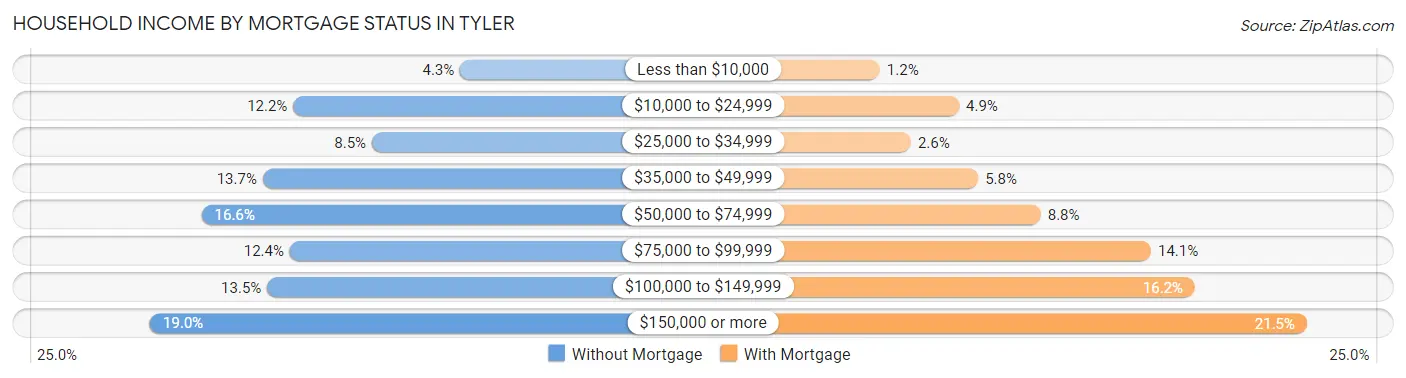
| Household Income | Without Mortgage | With Mortgage |
| Less than $10,000 | 403 (4.3%) | 131 (1.2%) |
| $10,000 to $24,999 | 1,156 (12.2%) | 555 (4.9%) |
| $25,000 to $34,999 | 801 (8.5%) | 297 (2.6%) |
| $35,000 to $49,999 | 1,293 (13.7%) | 657 (5.8%) |
| $50,000 to $74,999 | 1,569 (16.6%) | 993 (8.8%) |
| $75,000 to $99,999 | 1,171 (12.4%) | 1,583 (14.1%) |
| $100,000 to $149,999 | 1,274 (13.5%) | 1,819 (16.2%) |
| $150,000 or more | 1,802 (19.0%) | 2,418 (21.5%) |
| Total | 9,469 (100.0%) | 11,253 (100.0%) |
Property Value to Household Income Ratio in Tyler
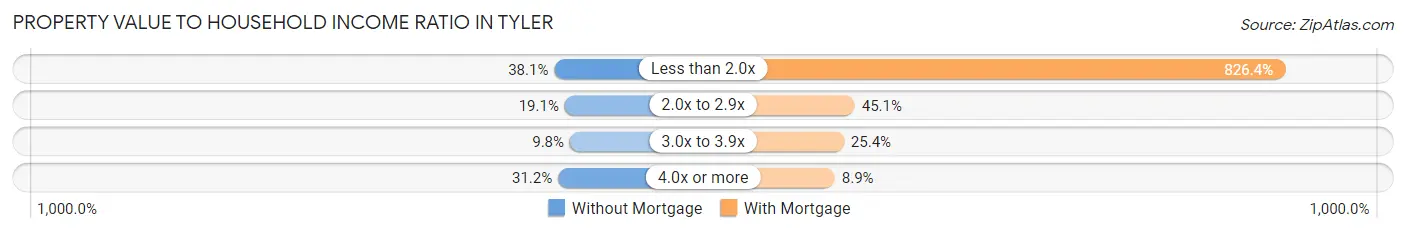
| Value-to-Income Ratio | Without Mortgage | With Mortgage |
| Less than 2.0x | 3,610 (38.1%) | 92,990 (826.4%) |
| 2.0x to 2.9x | 1,804 (19.1%) | 5,078 (45.1%) |
| 3.0x to 3.9x | 925 (9.8%) | 2,860 (25.4%) |
| 4.0x or more | 2,951 (31.2%) | 1,003 (8.9%) |
| Total | 9,469 (100.0%) | 11,253 (100.0%) |
Real Estate Taxes by Mortgage Status in Tyler
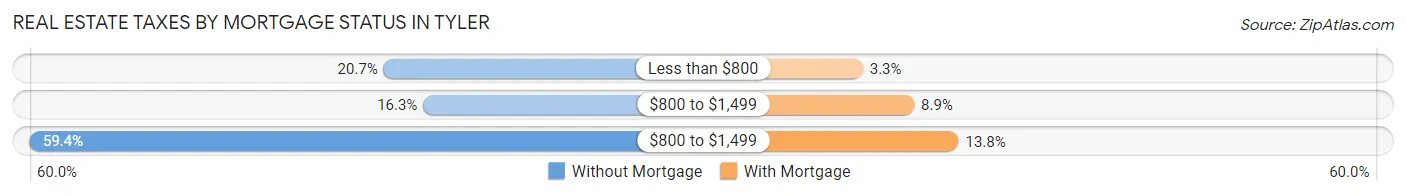
| Property Taxes | Without Mortgage | With Mortgage |
| Less than $800 | 1,955 (20.6%) | 367 (3.3%) |
| $800 to $1,499 | 1,545 (16.3%) | 999 (8.9%) |
| $800 to $1,499 | 5,627 (59.4%) | 1,547 (13.8%) |
| Total | 9,469 (100.0%) | 11,253 (100.0%) |
Health & Disability in Tyler
Health Insurance Coverage by Age in Tyler
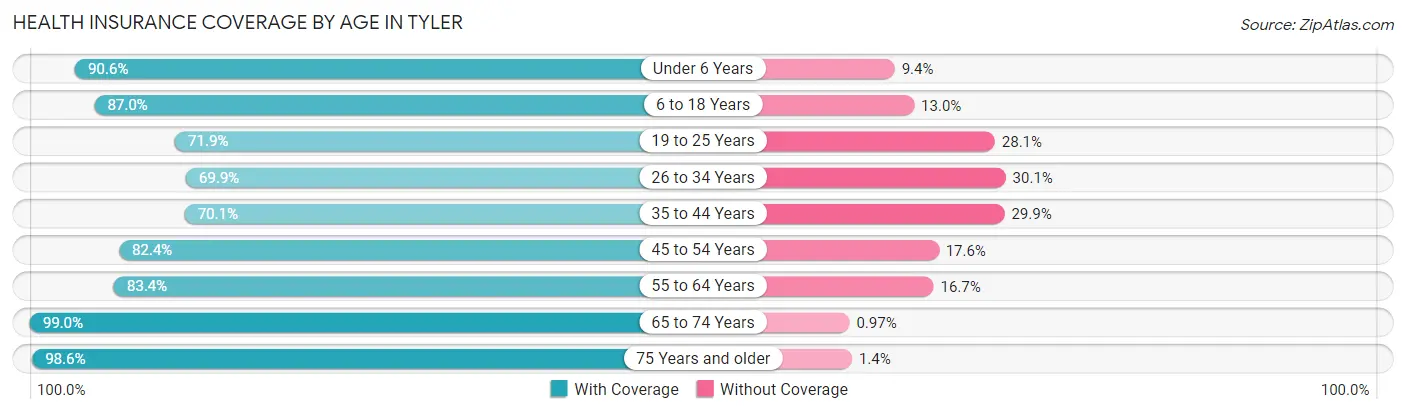
| Age Bracket | With Coverage | Without Coverage |
| Under 6 Years | 7,406 (90.6%) | 768 (9.4%) |
| 6 to 18 Years | 15,853 (87.0%) | 2,376 (13.0%) |
| 19 to 25 Years | 9,734 (71.9%) | 3,801 (28.1%) |
| 26 to 34 Years | 8,980 (69.9%) | 3,865 (30.1%) |
| 35 to 44 Years | 8,295 (70.1%) | 3,533 (29.9%) |
| 45 to 54 Years | 9,997 (82.4%) | 2,135 (17.6%) |
| 55 to 64 Years | 9,119 (83.4%) | 1,822 (16.7%) |
| 65 to 74 Years | 9,286 (99.0%) | 91 (1.0%) |
| 75 Years and older | 7,101 (98.6%) | 103 (1.4%) |
| Total | 85,771 (82.3%) | 18,494 (17.7%) |
Health Insurance Coverage by Citizenship Status in Tyler
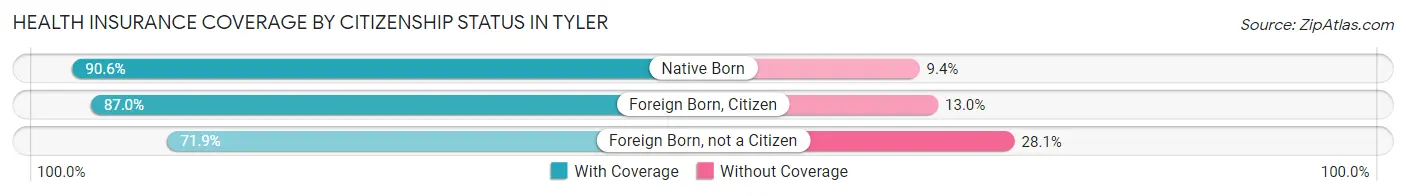
| Citizenship Status | With Coverage | Without Coverage |
| Native Born | 7,406 (90.6%) | 768 (9.4%) |
| Foreign Born, Citizen | 15,853 (87.0%) | 2,376 (13.0%) |
| Foreign Born, not a Citizen | 9,734 (71.9%) | 3,801 (28.1%) |
Health Insurance Coverage by Household Income in Tyler
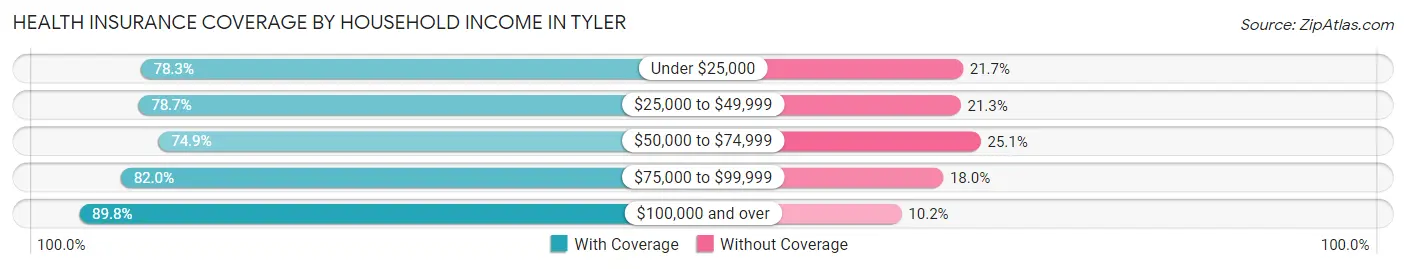
| Household Income | With Coverage | Without Coverage |
| Under $25,000 | 9,132 (78.3%) | 2,536 (21.7%) |
| $25,000 to $49,999 | 15,210 (78.7%) | 4,118 (21.3%) |
| $50,000 to $74,999 | 14,063 (74.9%) | 4,702 (25.1%) |
| $75,000 to $99,999 | 13,098 (82.0%) | 2,880 (18.0%) |
| $100,000 and over | 31,592 (89.8%) | 3,602 (10.2%) |
Public vs Private Health Insurance Coverage by Age in Tyler
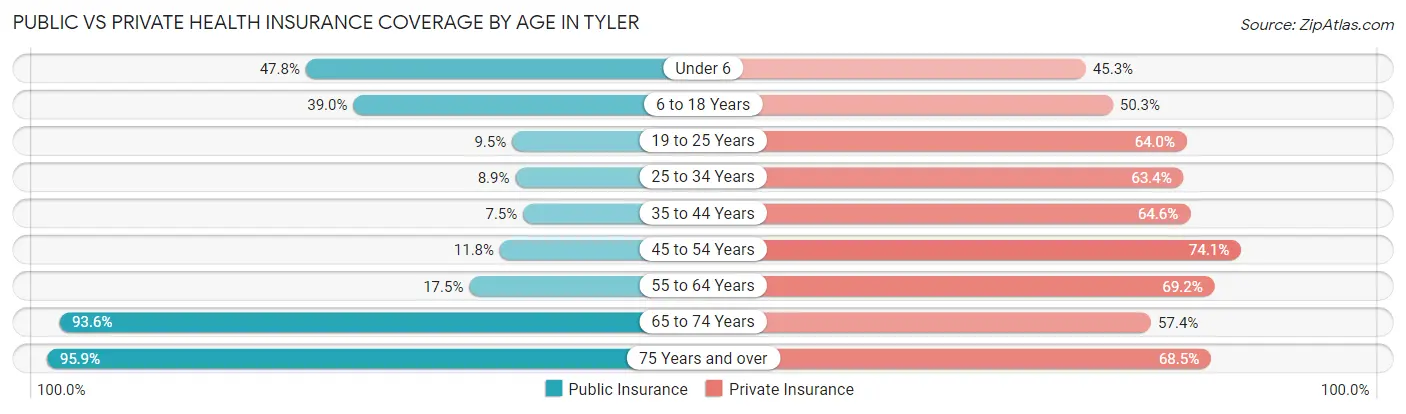
| Age Bracket | Public Insurance | Private Insurance |
| Under 6 | 3,909 (47.8%) | 3,704 (45.3%) |
| 6 to 18 Years | 7,107 (39.0%) | 9,169 (50.3%) |
| 19 to 25 Years | 1,290 (9.5%) | 8,666 (64.0%) |
| 25 to 34 Years | 1,146 (8.9%) | 8,148 (63.4%) |
| 35 to 44 Years | 884 (7.5%) | 7,645 (64.6%) |
| 45 to 54 Years | 1,429 (11.8%) | 8,991 (74.1%) |
| 55 to 64 Years | 1,911 (17.5%) | 7,569 (69.2%) |
| 65 to 74 Years | 8,778 (93.6%) | 5,384 (57.4%) |
| 75 Years and over | 6,907 (95.9%) | 4,936 (68.5%) |
| Total | 33,361 (32.0%) | 64,212 (61.6%) |
Disability Status by Sex by Age in Tyler

| Age Bracket | Male | Female |
| Under 5 Years | 109 (3.1%) | 131 (4.0%) |
| 5 to 17 Years | 803 (8.8%) | 303 (3.6%) |
| 18 to 34 Years | 830 (6.0%) | 969 (6.6%) |
| 35 to 64 Years | 2,176 (13.2%) | 2,390 (13.0%) |
| 65 to 74 Years | 1,011 (24.3%) | 934 (17.9%) |
| 75 Years and over | 1,243 (45.6%) | 1,871 (41.8%) |
Disability Class by Sex by Age in Tyler
Disability Class: Hearing Difficulty
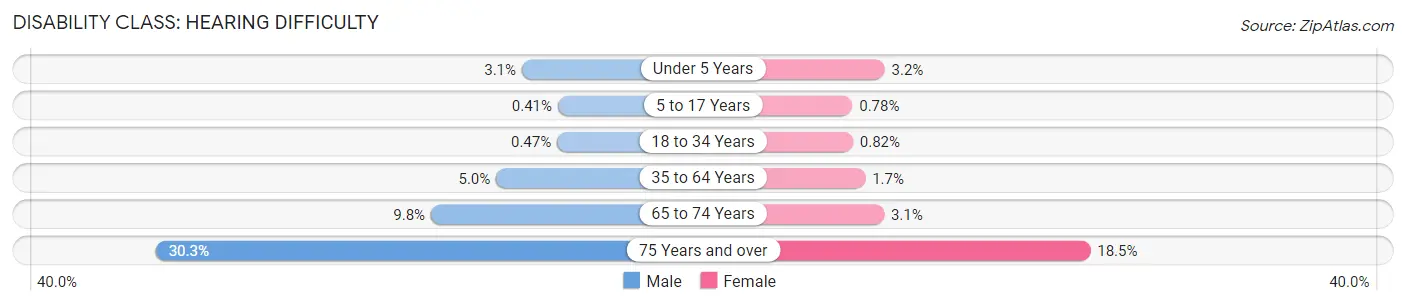
| Age Bracket | Male | Female |
| Under 5 Years | 109 (3.1%) | 103 (3.2%) |
| 5 to 17 Years | 37 (0.4%) | 66 (0.8%) |
| 18 to 34 Years | 65 (0.5%) | 121 (0.8%) |
| 35 to 64 Years | 826 (5.0%) | 320 (1.7%) |
| 65 to 74 Years | 409 (9.8%) | 163 (3.1%) |
| 75 Years and over | 825 (30.3%) | 826 (18.4%) |
Disability Class: Vision Difficulty
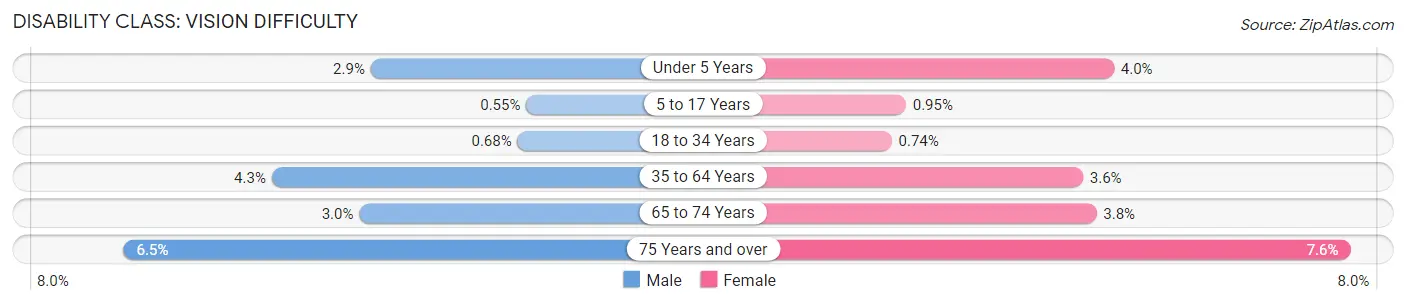
| Age Bracket | Male | Female |
| Under 5 Years | 101 (2.9%) | 131 (4.0%) |
| 5 to 17 Years | 50 (0.5%) | 80 (0.9%) |
| 18 to 34 Years | 94 (0.7%) | 108 (0.7%) |
| 35 to 64 Years | 716 (4.3%) | 658 (3.6%) |
| 65 to 74 Years | 126 (3.0%) | 197 (3.8%) |
| 75 Years and over | 178 (6.5%) | 338 (7.5%) |
Disability Class: Cognitive Difficulty
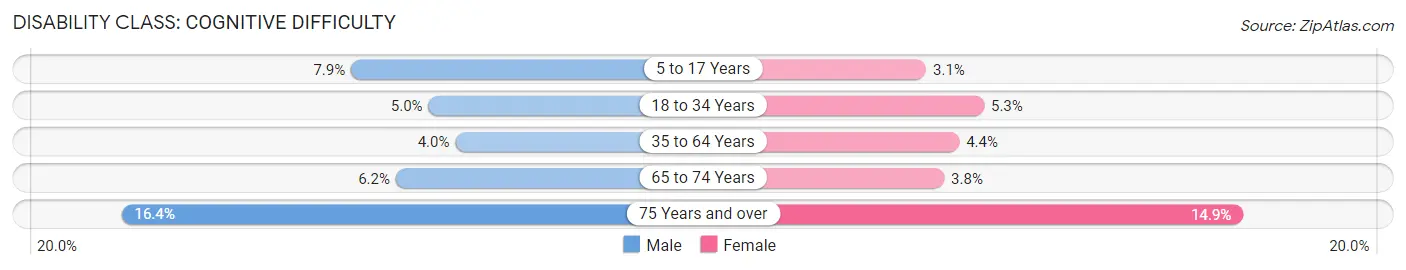
| Age Bracket | Male | Female |
| 5 to 17 Years | 717 (7.9%) | 264 (3.1%) |
| 18 to 34 Years | 691 (5.0%) | 775 (5.3%) |
| 35 to 64 Years | 664 (4.0%) | 800 (4.4%) |
| 65 to 74 Years | 259 (6.2%) | 198 (3.8%) |
| 75 Years and over | 447 (16.4%) | 667 (14.9%) |
Disability Class: Ambulatory Difficulty
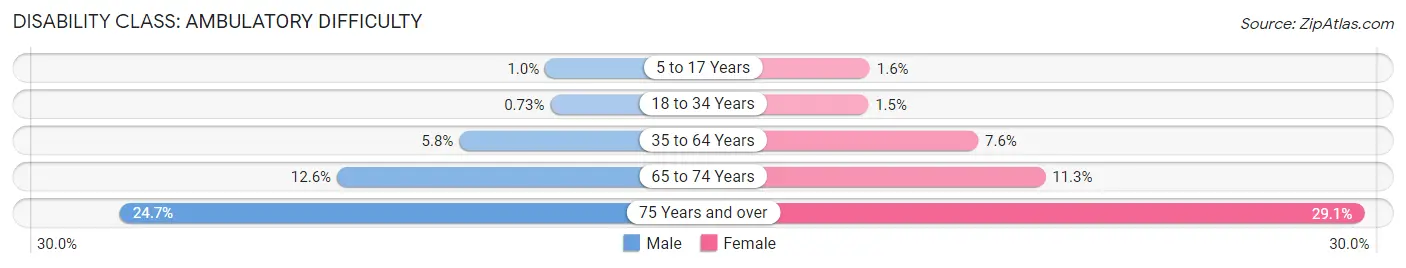
| Age Bracket | Male | Female |
| 5 to 17 Years | 93 (1.0%) | 132 (1.6%) |
| 18 to 34 Years | 101 (0.7%) | 216 (1.5%) |
| 35 to 64 Years | 960 (5.8%) | 1,394 (7.6%) |
| 65 to 74 Years | 525 (12.6%) | 591 (11.3%) |
| 75 Years and over | 673 (24.7%) | 1,302 (29.1%) |
Disability Class: Self-Care Difficulty
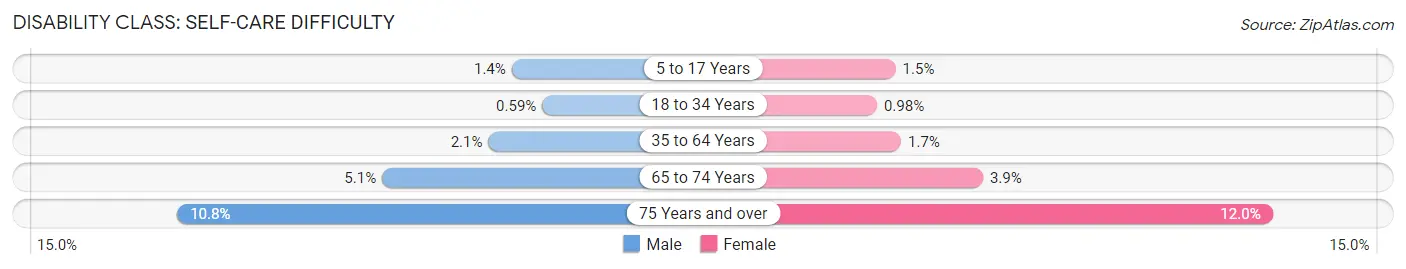
| Age Bracket | Male | Female |
| 5 to 17 Years | 131 (1.4%) | 127 (1.5%) |
| 18 to 34 Years | 82 (0.6%) | 144 (1.0%) |
| 35 to 64 Years | 346 (2.1%) | 302 (1.7%) |
| 65 to 74 Years | 210 (5.1%) | 205 (3.9%) |
| 75 Years and over | 293 (10.7%) | 537 (12.0%) |
Technology Access in Tyler
Computing Device Access in Tyler
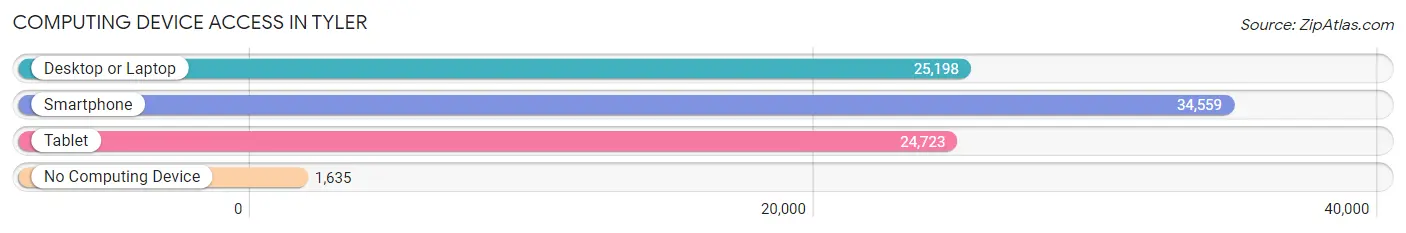
| Device Type | # Households | % Households |
| Desktop or Laptop | 25,198 | 66.7% |
| Smartphone | 34,559 | 91.5% |
| Tablet | 24,723 | 65.5% |
| No Computing Device | 1,635 | 4.3% |
| Total | 37,747 | 100.0% |
Internet Access in Tyler
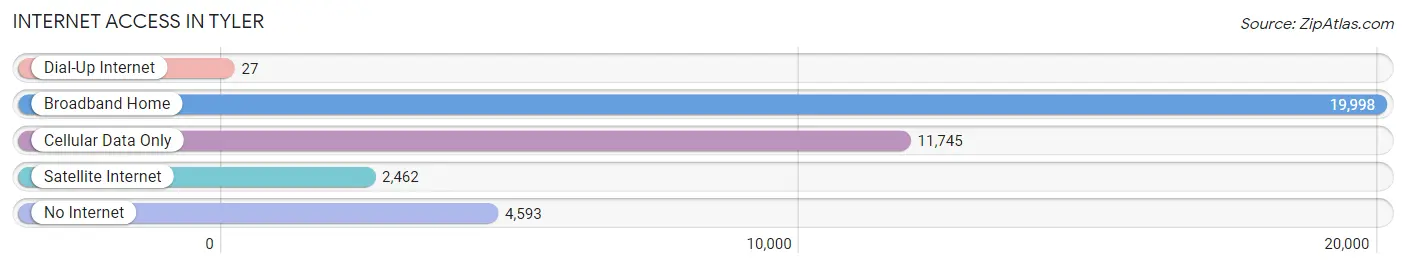
| Internet Type | # Households | % Households |
| Dial-Up Internet | 27 | 0.1% |
| Broadband Home | 19,998 | 53.0% |
| Cellular Data Only | 11,745 | 31.1% |
| Satellite Internet | 2,462 | 6.5% |
| No Internet | 4,593 | 12.2% |
| Total | 37,747 | 100.0% |
Tyler Summary
Tyler, Texas is a city located in Smith County, in the northeastern part of the state. It is the county seat and the largest city in Smith County. The city is located about 100 miles east of Dallas and is part of the Tyler-Jacksonville metropolitan area. The city was founded in 1846 and was named after President John Tyler.
Geography
Tyler is located in the Piney Woods region of East Texas. The city is situated on the western edge of the East Texas Timberlands, an area of rolling hills and dense forests. The city is located on the banks of the Neches River, which flows through the city and is a major source of water for the area. The city is located at an elevation of 545 feet above sea level.
The city has a total area of 54.3 square miles, of which 54.2 square miles is land and 0.1 square miles is water. The climate in Tyler is humid subtropical, with hot summers and mild winters. The average annual temperature is 68 degrees Fahrenheit.
Economy
Tyler is a major economic center in East Texas. The city is home to several large employers, including the University of Texas at Tyler, Trinity Mother Frances Hospital, and the Tyler Independent School District. The city is also home to several large manufacturing companies, including Tyler Pipe and Foundry, Tyler Technologies, and Tyler Refrigeration.
The city's economy is also supported by a strong tourism industry. Tyler is home to several attractions, including the Caldwell Zoo, the Tyler Rose Garden, and the Tyler State Park. The city is also home to several annual festivals, including the Texas Rose Festival and the East Texas State Fair.
Demographics
As of the 2010 census, Tyler had a population of 96,900. The racial makeup of the city was 68.2% White, 20.3% African American, 0.7% Native American, 2.3% Asian, 0.1% Pacific Islander, 6.2% from other races, and 2.3% from two or more races. Hispanic or Latino of any race were 13.2% of the population.
The median income for a household in Tyler was $41,919, and the median income for a family was $50,919. The per capita income for the city was $21,919. About 17.2% of families and 21.3% of the population were below the poverty line, including 28.3% of those under age 18 and 11.2% of those age 65 or over.
Tyler is served by the Tyler Independent School District, which consists of 24 elementary schools, 8 middle schools, and 5 high schools. The city is also home to the University of Texas at Tyler, a public university with an enrollment of over 8,000 students.
Tyler is served by several major highways, including Interstate 20, U.S. Route 69, and U.S. Route 271. The city is served by the Tyler Pounds Regional Airport, which offers daily flights to Dallas/Fort Worth International Airport. The city is also served by the Tyler Transit System, which provides bus service throughout the city.
Common Questions
What is Per Capita Income in Tyler?
Per Capita income in Tyler is $34,062.
What is the Median Family Income in Tyler?
Median Family Income in Tyler is $79,286.
What is the Median Household income in Tyler?
Median Household Income in Tyler is $63,056.
What is Income or Wage Gap in Tyler?
Income or Wage Gap in Tyler is 21.0%.
Women in Tyler earn 79.0 cents for every dollar earned by a man.
What is Family Income Deficit in Tyler?
Family Income Deficit in Tyler is $11,696.
Families that are below poverty line in Tyler earn $11,696 less on average than the poverty threshold level.
What is Inequality or Gini Index in Tyler?
Inequality or Gini Index in Tyler is 0.49.
What is the Total Population of Tyler?
Total Population of Tyler is 106,440.
What is the Total Male Population of Tyler?
Total Male Population of Tyler is 51,161.
What is the Total Female Population of Tyler?
Total Female Population of Tyler is 55,279.
What is the Ratio of Males per 100 Females in Tyler?
There are 92.55 Males per 100 Females in Tyler.
What is the Ratio of Females per 100 Males in Tyler?
There are 108.05 Females per 100 Males in Tyler.
What is the Median Population Age in Tyler?
Median Population Age in Tyler is 34.9 Years.
What is the Average Family Size in Tyler
Average Family Size in Tyler is 3.4 People.
What is the Average Household Size in Tyler
Average Household Size in Tyler is 2.7 People.
How Large is the Labor Force in Tyler?
There are 53,737 People in the Labor Forcein in Tyler.
What is the Percentage of People in the Labor Force in Tyler?
63.3% of People are in the Labor Force in Tyler.
What is the Unemployment Rate in Tyler?
Unemployment Rate in Tyler is 5.3%.