Mckinney, TX Map & Demographics
Mckinney Map
Mckinney Overview
$49,773
PER CAPITA INCOME
$130,641
AVG FAMILY INCOME
$113,286
AVG HOUSEHOLD INCOME
42.0%
WAGE / INCOME GAP [ % ]
58.0¢/ $1
WAGE / INCOME GAP [ $ ]
$10,763
FAMILY INCOME DEFICIT
0.42
INEQUALITY / GINI INDEX
196,160
TOTAL POPULATION
98,395
MALE POPULATION
97,765
FEMALE POPULATION
100.64
MALES / 100 FEMALES
99.36
FEMALES / 100 MALES
36.9
MEDIAN AGE
3.3
AVG FAMILY SIZE
2.9
AVG HOUSEHOLD SIZE
104,652
LABOR FORCE [ PEOPLE ]
70.8%
PERCENT IN LABOR FORCE
3.7%
UNEMPLOYMENT RATE
Income in Mckinney
Income Overview in Mckinney
Per Capita Income in Mckinney is $49,773, while median incomes of families and households are $130,641 and $113,286 respectively.
| Characteristic | Number | Measure |
| Per Capita Income | 196,160 | $49,773 |
| Median Family Income | 51,702 | $130,641 |
| Mean Family Income | 51,702 | $155,636 |
| Median Household Income | 68,224 | $113,286 |
| Mean Household Income | 68,224 | $138,742 |
| Income Deficit | 51,702 | $10,763 |
| Wage / Income Gap (%) | 196,160 | 41.96% |
| Wage / Income Gap ($) | 196,160 | 58.04¢ per $1 |
| Gini / Inequality Index | 196,160 | 0.42 |
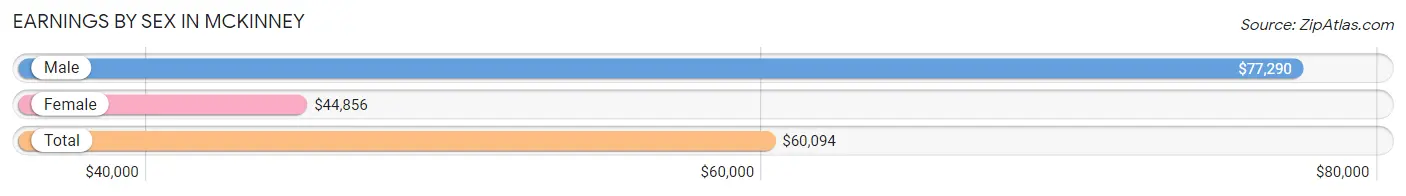
Earnings by Sex in Mckinney
Average Earnings in Mckinney are $60,094, $77,290 for men and $44,856 for women, a difference of 42.0%.
| Sex | Number | Average Earnings |
| Male | 59,234 (54.8%) | $77,290 |
| Female | 48,888 (45.2%) | $44,856 |
| Total | 108,122 (100.0%) | $60,094 |
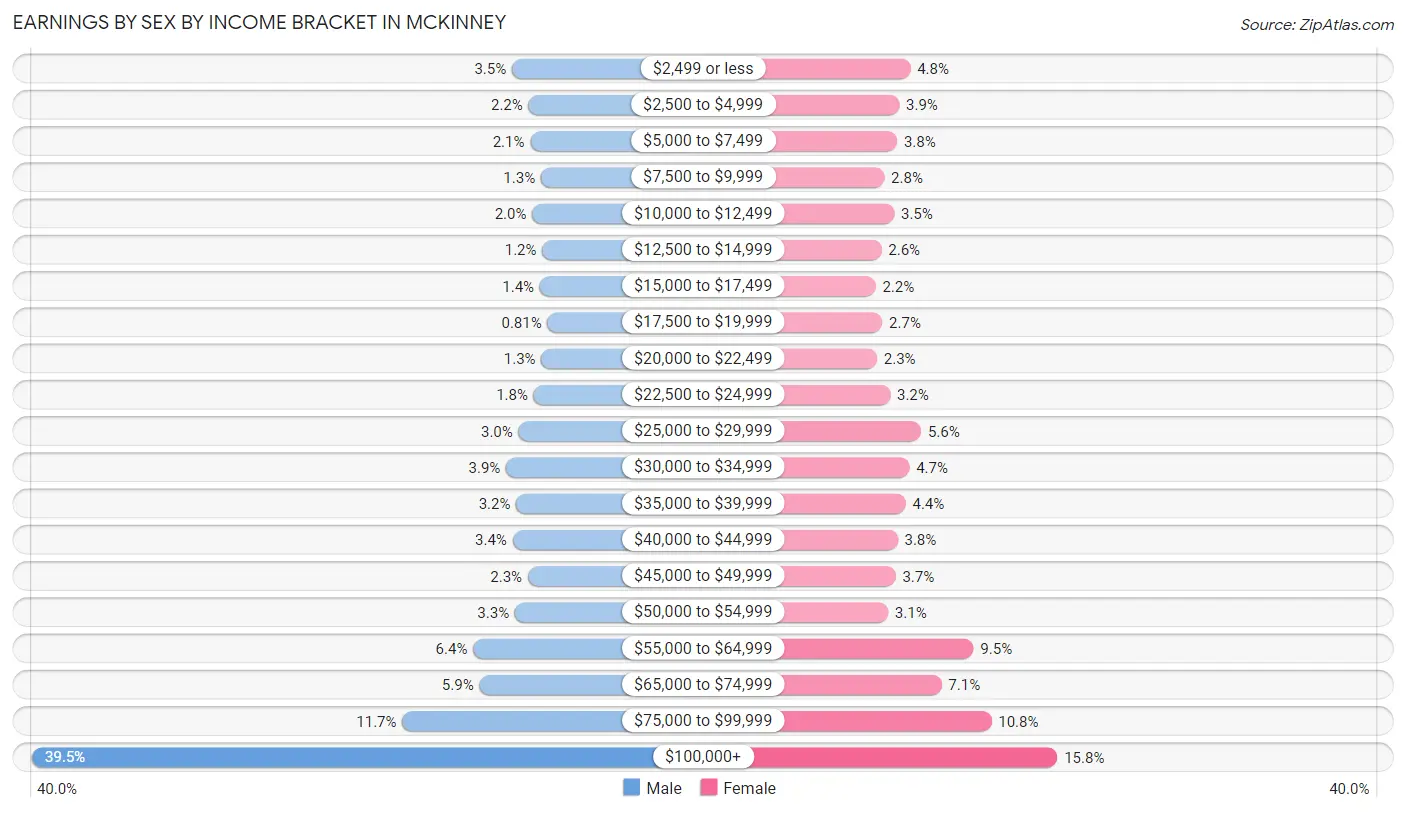
Earnings by Sex by Income Bracket in Mckinney
The most common earnings brackets in Mckinney are $100,000+ for men (23,370 | 39.5%) and $100,000+ for women (7,708 | 15.8%).
| Income | Male | Female |
| $2,499 or less | 2,057 (3.5%) | 2,322 (4.8%) |
| $2,500 to $4,999 | 1,323 (2.2%) | 1,917 (3.9%) |
| $5,000 to $7,499 | 1,246 (2.1%) | 1,840 (3.8%) |
| $7,500 to $9,999 | 772 (1.3%) | 1,369 (2.8%) |
| $10,000 to $12,499 | 1,158 (1.9%) | 1,731 (3.5%) |
| $12,500 to $14,999 | 711 (1.2%) | 1,265 (2.6%) |
| $15,000 to $17,499 | 815 (1.4%) | 1,050 (2.1%) |
| $17,500 to $19,999 | 477 (0.8%) | 1,296 (2.6%) |
| $20,000 to $22,499 | 754 (1.3%) | 1,099 (2.2%) |
| $22,500 to $24,999 | 1,088 (1.8%) | 1,583 (3.2%) |
| $25,000 to $29,999 | 1,767 (3.0%) | 2,716 (5.6%) |
| $30,000 to $34,999 | 2,316 (3.9%) | 2,289 (4.7%) |
| $35,000 to $39,999 | 1,868 (3.2%) | 2,153 (4.4%) |
| $40,000 to $44,999 | 2,028 (3.4%) | 1,859 (3.8%) |
| $45,000 to $49,999 | 1,353 (2.3%) | 1,784 (3.6%) |
| $50,000 to $54,999 | 1,925 (3.3%) | 1,508 (3.1%) |
| $55,000 to $64,999 | 3,781 (6.4%) | 4,640 (9.5%) |
| $65,000 to $74,999 | 3,503 (5.9%) | 3,465 (7.1%) |
| $75,000 to $99,999 | 6,922 (11.7%) | 5,294 (10.8%) |
| $100,000+ | 23,370 (39.5%) | 7,708 (15.8%) |
| Total | 59,234 (100.0%) | 48,888 (100.0%) |
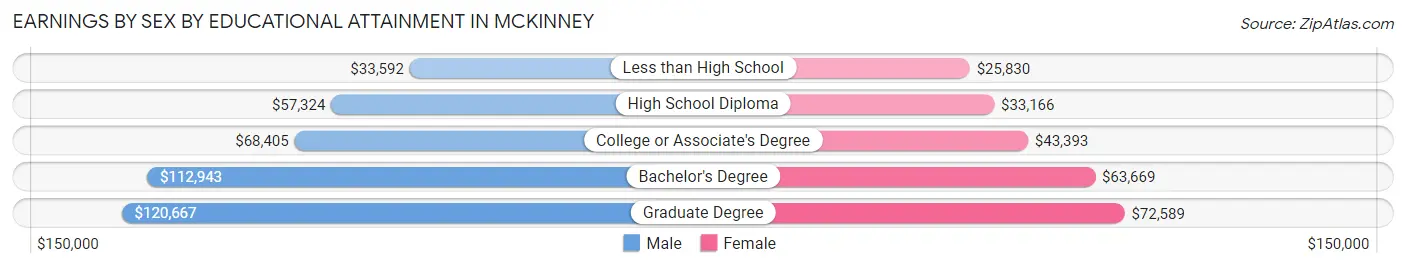
Earnings by Sex by Educational Attainment in Mckinney
Average earnings in Mckinney are $91,480 for men and $54,980 for women, a difference of 39.9%. Men with an educational attainment of graduate degree enjoy the highest average annual earnings of $120,667, while those with less than high school education earn the least with $33,592. Women with an educational attainment of graduate degree earn the most with the average annual earnings of $72,589, while those with less than high school education have the smallest earnings of $25,830.
| Educational Attainment | Male Income | Female Income |
| Less than High School | $33,592 | $25,830 |
| High School Diploma | $57,324 | $33,166 |
| College or Associate's Degree | $68,405 | $43,393 |
| Bachelor's Degree | $112,943 | $63,669 |
| Graduate Degree | $120,667 | $72,589 |
| Total | $91,480 | $54,980 |
Family Income in Mckinney
Family Income Brackets in Mckinney
According to the Mckinney family income data, there are 13,339 families falling into the $200,000+ income range, which is the most common income bracket and makes up 25.8% of all families. Conversely, the $10,000 to $14,999 income bracket is the least frequent group with only 517 families (1.0%) belonging to this category.
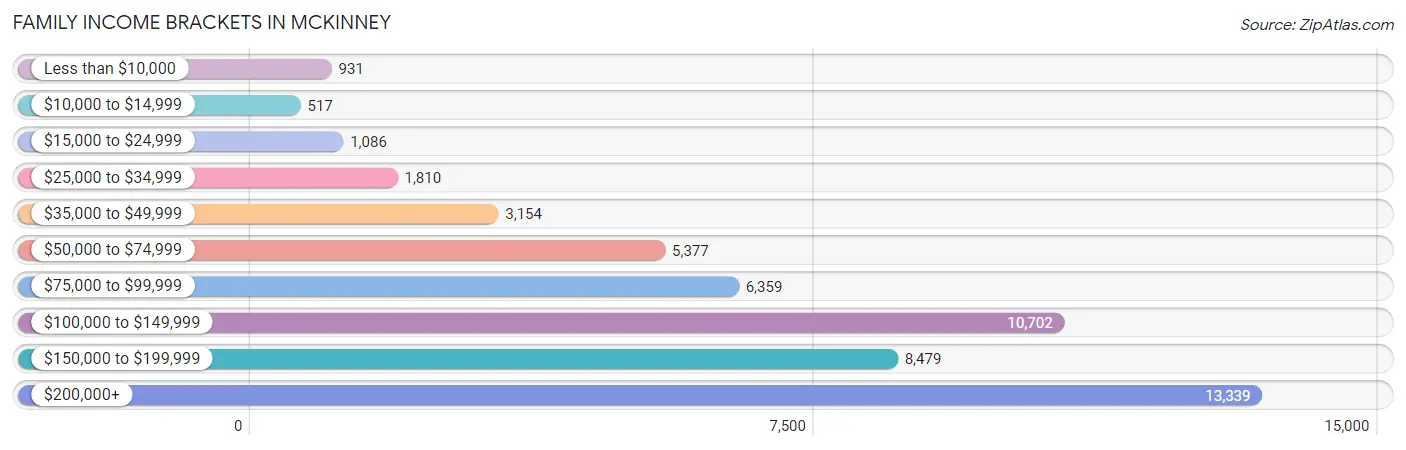
| Income Bracket | # Families | % Families |
| Less than $10,000 | 931 | 1.8% |
| $10,000 to $14,999 | 517 | 1.0% |
| $15,000 to $24,999 | 1,086 | 2.1% |
| $25,000 to $34,999 | 1,810 | 3.5% |
| $35,000 to $49,999 | 3,154 | 6.1% |
| $50,000 to $74,999 | 5,377 | 10.4% |
| $75,000 to $99,999 | 6,359 | 12.3% |
| $100,000 to $149,999 | 10,702 | 20.7% |
| $150,000 to $199,999 | 8,479 | 16.4% |
| $200,000+ | 13,339 | 25.8% |
Family Income by Famaliy Size in Mckinney
4-person families (12,947 | 25.0%) account for the highest median family income in Mckinney with $159,837 per family, while 2-person families (19,540 | 37.8%) have the highest median income of $51,086 per family member.
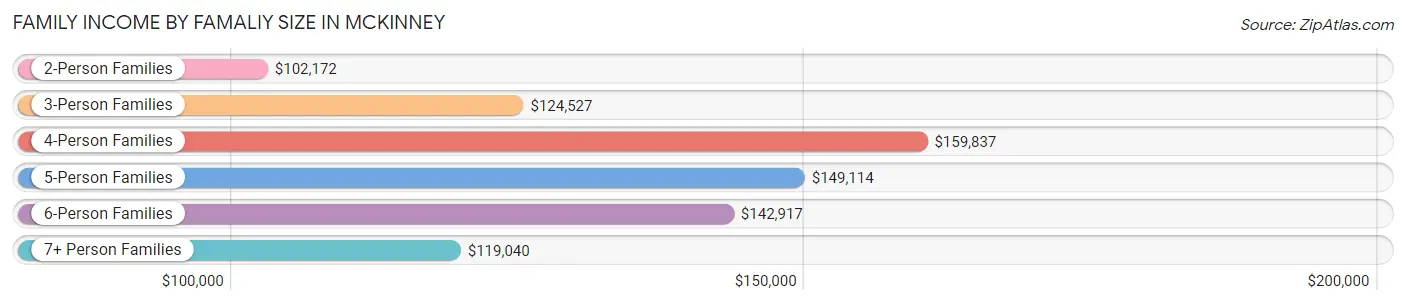
| Income Bracket | # Families | Median Income |
| 2-Person Families | 19,540 (37.8%) | $102,172 |
| 3-Person Families | 11,779 (22.8%) | $124,527 |
| 4-Person Families | 12,947 (25.0%) | $159,837 |
| 5-Person Families | 4,825 (9.3%) | $149,114 |
| 6-Person Families | 1,532 (3.0%) | $142,917 |
| 7+ Person Families | 1,079 (2.1%) | $119,040 |
| Total | 51,702 (100.0%) | $130,641 |
Family Income by Number of Earners in Mckinney
The median family income in Mckinney is $130,641, with families comprising 3+ earners (6,156) having the highest median family income of $165,125, while families with no earners (4,041) have the lowest median family income of $47,402, accounting for 11.9% and 7.8% of families, respectively.
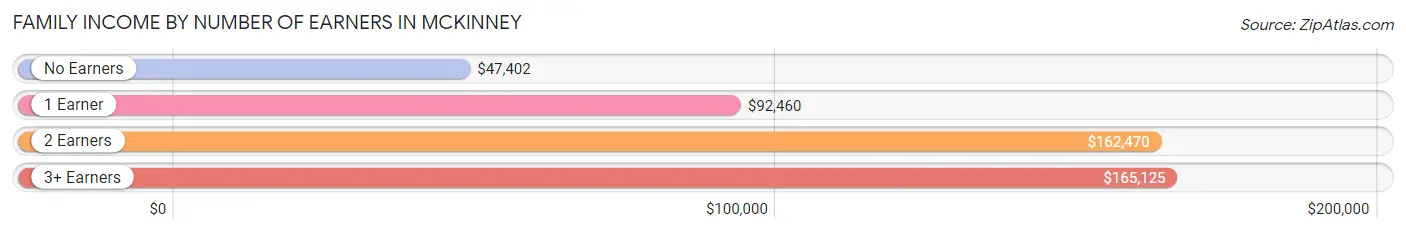
| Number of Earners | # Families | Median Income |
| No Earners | 4,041 (7.8%) | $47,402 |
| 1 Earner | 16,966 (32.8%) | $92,460 |
| 2 Earners | 24,539 (47.5%) | $162,470 |
| 3+ Earners | 6,156 (11.9%) | $165,125 |
| Total | 51,702 (100.0%) | $130,641 |
Household Income in Mckinney
Household Income Brackets in Mckinney
With 14,327 households falling in the category, the $200,000+ income range is the most frequent in Mckinney, accounting for 21.0% of all households. In contrast, only 887 households (1.3%) fall into the $10,000 to $14,999 income bracket, making it the least populous group.
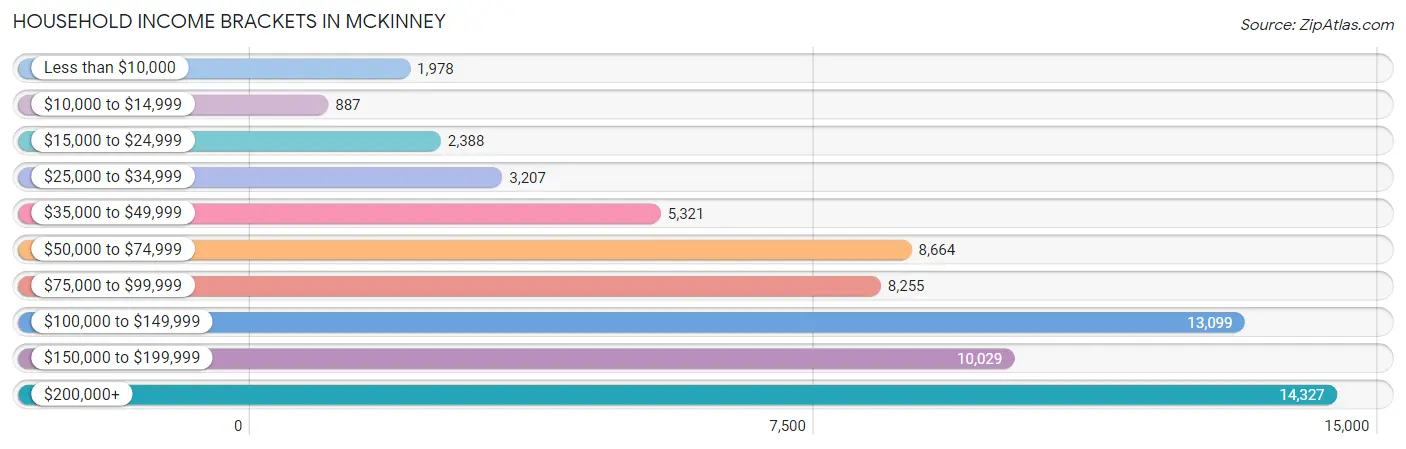
| Income Bracket | # Households | % Households |
| Less than $10,000 | 1,978 | 2.9% |
| $10,000 to $14,999 | 887 | 1.3% |
| $15,000 to $24,999 | 2,388 | 3.5% |
| $25,000 to $34,999 | 3,207 | 4.7% |
| $35,000 to $49,999 | 5,321 | 7.8% |
| $50,000 to $74,999 | 8,664 | 12.7% |
| $75,000 to $99,999 | 8,255 | 12.1% |
| $100,000 to $149,999 | 13,099 | 19.2% |
| $150,000 to $199,999 | 10,029 | 14.7% |
| $200,000+ | 14,327 | 21.0% |
Household Income by Householder Age in Mckinney
The median household income in Mckinney is $113,286, with the highest median household income of $140,836 found in the 45 to 64 years age bracket for the primary householder. A total of 26,486 households (38.8%) fall into this category. Meanwhile, the 15 to 24 years age bracket for the primary householder has the lowest median household income of $46,554, with 2,406 households (3.5%) in this group.
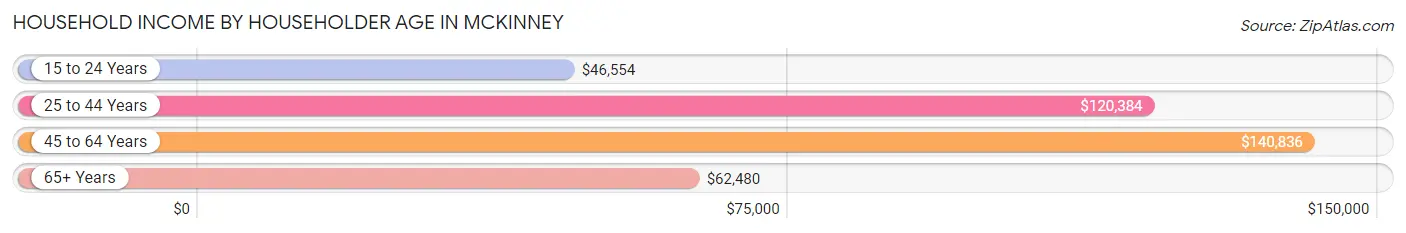
| Income Bracket | # Households | Median Income |
| 15 to 24 Years | 2,406 (3.5%) | $46,554 |
| 25 to 44 Years | 28,134 (41.2%) | $120,384 |
| 45 to 64 Years | 26,486 (38.8%) | $140,836 |
| 65+ Years | 11,198 (16.4%) | $62,480 |
| Total | 68,224 (100.0%) | $113,286 |
Poverty in Mckinney
Income Below Poverty by Sex and Age in Mckinney
With 5.6% poverty level for males and 6.7% for females among the residents of Mckinney, 16 and 17 year old males and 5 year old females are the most vulnerable to poverty, with 506 males (16.7%) and 140 females (14.4%) in their respective age groups living below the poverty level.
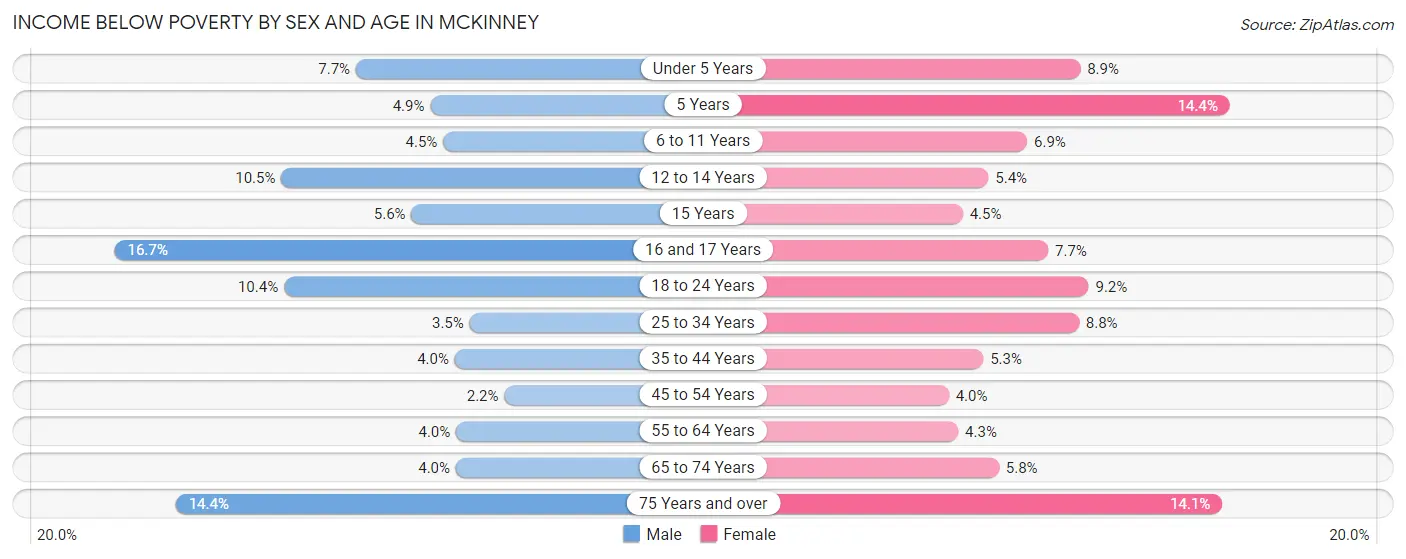
| Age Bracket | Male | Female |
| Under 5 Years | 465 (7.7%) | 507 (8.8%) |
| 5 Years | 84 (4.9%) | 140 (14.4%) |
| 6 to 11 Years | 462 (4.5%) | 681 (6.9%) |
| 12 to 14 Years | 494 (10.5%) | 257 (5.4%) |
| 15 Years | 105 (5.6%) | 80 (4.5%) |
| 16 and 17 Years | 506 (16.7%) | 199 (7.7%) |
| 18 to 24 Years | 866 (10.4%) | 732 (9.2%) |
| 25 to 34 Years | 351 (3.5%) | 999 (8.8%) |
| 35 to 44 Years | 716 (4.0%) | 908 (5.2%) |
| 45 to 54 Years | 320 (2.2%) | 541 (4.0%) |
| 55 to 64 Years | 387 (4.0%) | 415 (4.3%) |
| 65 to 74 Years | 218 (4.0%) | 377 (5.8%) |
| 75 Years and over | 485 (14.4%) | 683 (14.1%) |
| Total | 5,459 (5.6%) | 6,519 (6.7%) |
Income Above Poverty by Sex and Age in Mckinney
According to the poverty statistics in Mckinney, males aged 45 to 54 years and females aged 45 to 54 years are the age groups that are most secure financially, with 97.8% of males and 96.0% of females in these age groups living above the poverty line.
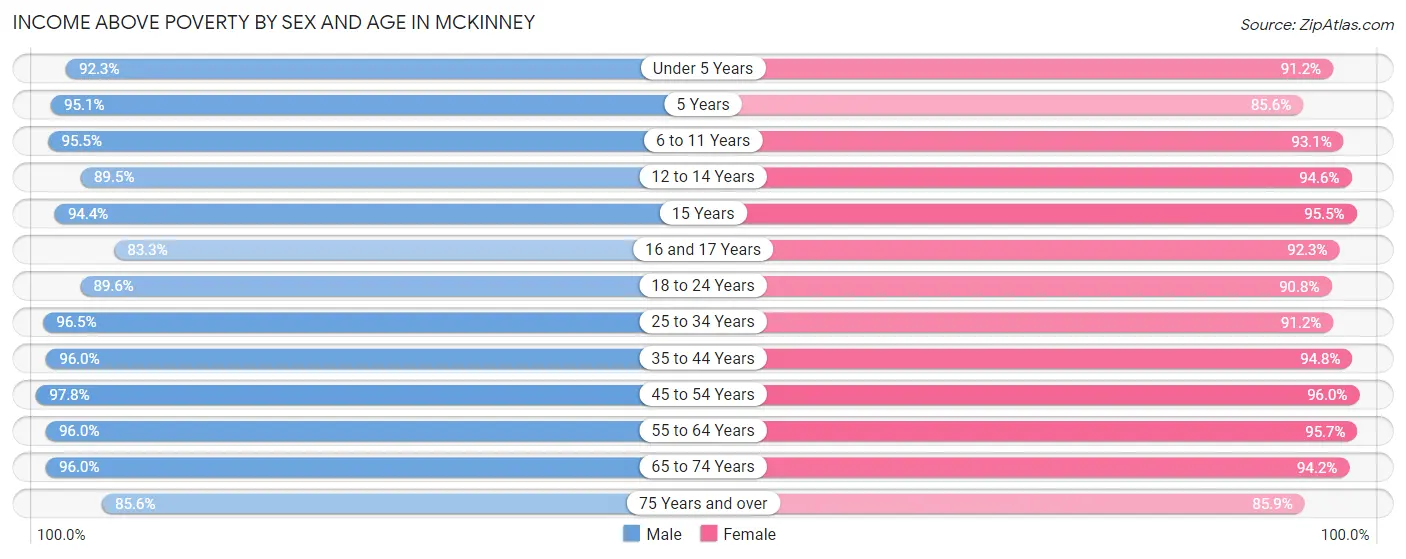
| Age Bracket | Male | Female |
| Under 5 Years | 5,573 (92.3%) | 5,222 (91.1%) |
| 5 Years | 1,616 (95.1%) | 832 (85.6%) |
| 6 to 11 Years | 9,894 (95.5%) | 9,224 (93.1%) |
| 12 to 14 Years | 4,226 (89.5%) | 4,471 (94.6%) |
| 15 Years | 1,757 (94.4%) | 1,701 (95.5%) |
| 16 and 17 Years | 2,532 (83.3%) | 2,398 (92.3%) |
| 18 to 24 Years | 7,488 (89.6%) | 7,258 (90.8%) |
| 25 to 34 Years | 9,734 (96.5%) | 10,352 (91.2%) |
| 35 to 44 Years | 17,069 (96.0%) | 16,390 (94.8%) |
| 45 to 54 Years | 14,314 (97.8%) | 13,090 (96.0%) |
| 55 to 64 Years | 9,348 (96.0%) | 9,199 (95.7%) |
| 65 to 74 Years | 5,239 (96.0%) | 6,087 (94.2%) |
| 75 Years and over | 2,885 (85.6%) | 4,153 (85.9%) |
| Total | 91,675 (94.4%) | 90,377 (93.3%) |
Income Below Poverty Among Married-Couple Families in Mckinney
The poverty statistics for married-couple families in Mckinney show that 3.0% or 1,268 of the total 42,338 families live below the poverty line. Families with 5 or more children have the highest poverty rate of 24.2%, comprising of 99 families. On the other hand, families with no children have the lowest poverty rate of 2.5%, which includes 472 families.
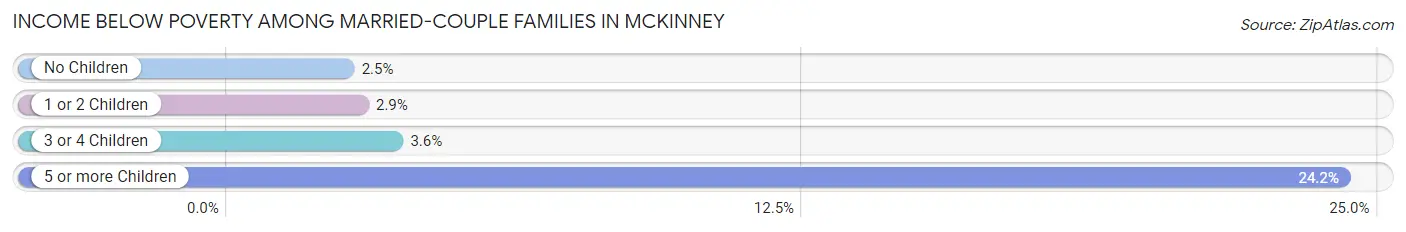
| Children | Above Poverty | Below Poverty |
| No Children | 18,118 (97.5%) | 472 (2.5%) |
| 1 or 2 Children | 18,681 (97.2%) | 549 (2.9%) |
| 3 or 4 Children | 3,961 (96.4%) | 148 (3.6%) |
| 5 or more Children | 310 (75.8%) | 99 (24.2%) |
| Total | 41,070 (97.0%) | 1,268 (3.0%) |
Income Below Poverty Among Single-Parent Households in Mckinney
According to the poverty data in Mckinney, 3.7% or 101 single-father households and 15.7% or 1,038 single-mother households are living below the poverty line. Among single-father households, those with 3 or 4 children have the highest poverty rate, with 22 households (12.1%) experiencing poverty. Likewise, among single-mother households, those with 5 or more children have the highest poverty rate, with 23 households (100.0%) falling below the poverty line.
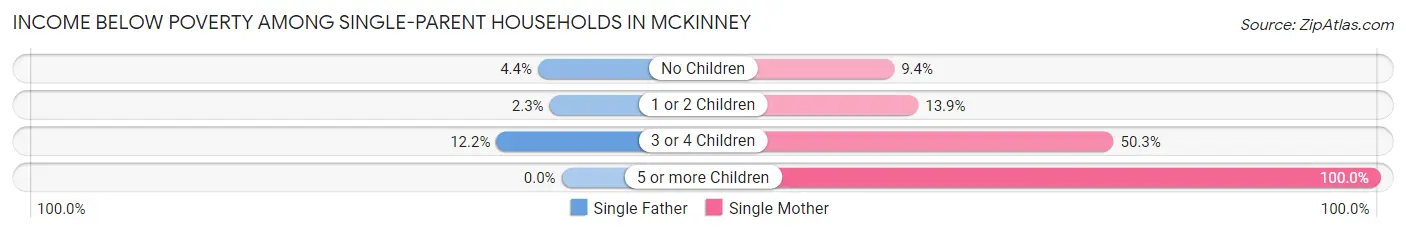
| Children | Single Father | Single Mother |
| No Children | 43 (4.4%) | 223 (9.4%) |
| 1 or 2 Children | 36 (2.2%) | 508 (13.9%) |
| 3 or 4 Children | 22 (12.1%) | 284 (50.3%) |
| 5 or more Children | 0 (0.0%) | 23 (100.0%) |
| Total | 101 (3.7%) | 1,038 (15.7%) |
Income Below Poverty Among Married-Couple vs Single-Parent Households in Mckinney
The poverty data for Mckinney shows that 1,268 of the married-couple family households (3.0%) and 1,139 of the single-parent households (12.2%) are living below the poverty level. Within the married-couple family households, those with 5 or more children have the highest poverty rate, with 99 households (24.2%) falling below the poverty line. Among the single-parent households, those with 5 or more children have the highest poverty rate, with 23 household (100.0%) living below poverty.
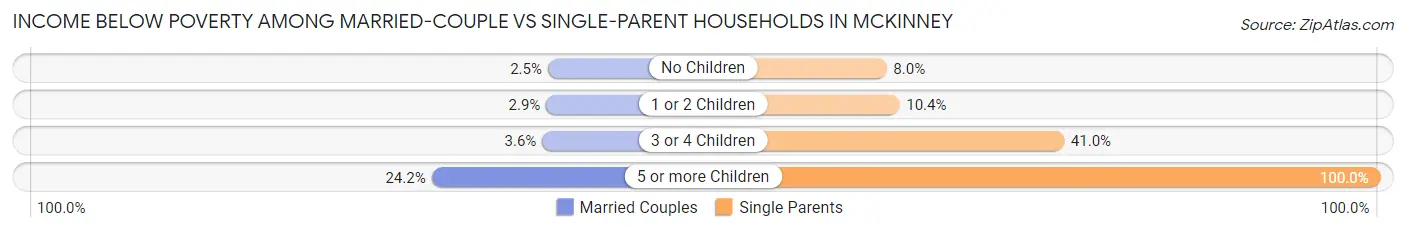
| Children | Married-Couple Families | Single-Parent Households |
| No Children | 472 (2.5%) | 266 (8.0%) |
| 1 or 2 Children | 549 (2.9%) | 544 (10.4%) |
| 3 or 4 Children | 148 (3.6%) | 306 (41.0%) |
| 5 or more Children | 99 (24.2%) | 23 (100.0%) |
| Total | 1,268 (3.0%) | 1,139 (12.2%) |
Race in Mckinney
The most populous races in Mckinney are White / Caucasian (126,396 | 64.4%), Hispanic or Latino (33,759 | 17.2%), and Asian (23,461 | 12.0%).
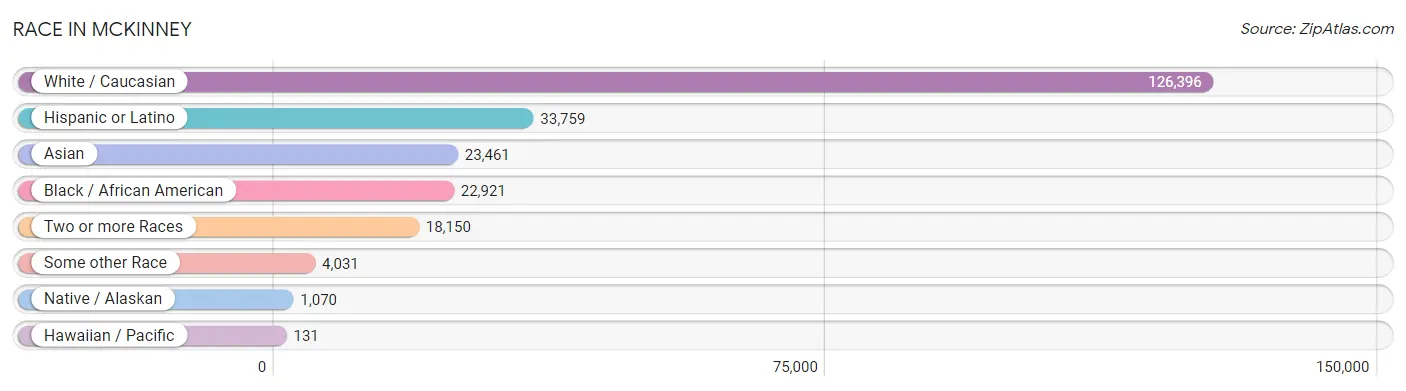
| Race | # Population | % Population |
| Asian | 23,461 | 12.0% |
| Black / African American | 22,921 | 11.7% |
| Hawaiian / Pacific | 131 | 0.1% |
| Hispanic or Latino | 33,759 | 17.2% |
| Native / Alaskan | 1,070 | 0.5% |
| White / Caucasian | 126,396 | 64.4% |
| Two or more Races | 18,150 | 9.2% |
| Some other Race | 4,031 | 2.1% |
| Total | 196,160 | 100.0% |
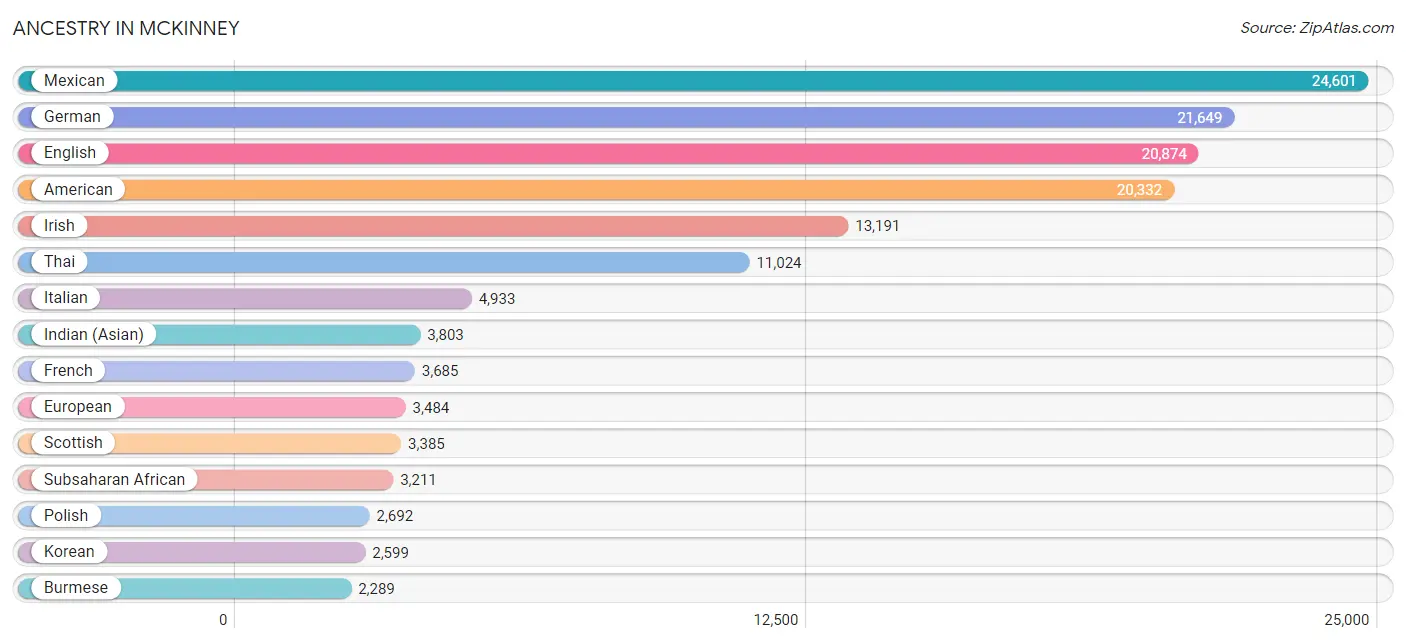
Ancestry in Mckinney
The most populous ancestries reported in Mckinney are Mexican (24,601 | 12.5%), German (21,649 | 11.0%), English (20,874 | 10.6%), American (20,332 | 10.4%), and Irish (13,191 | 6.7%), together accounting for 51.3% of all Mckinney residents.
| Ancestry | # Population | % Population |
| Afghan | 41 | 0.0% |
| African | 1,544 | 0.8% |
| Albanian | 60 | 0.0% |
| American | 20,332 | 10.4% |
| Apache | 14 | 0.0% |
| Arab | 1,484 | 0.8% |
| Argentinean | 97 | 0.1% |
| Armenian | 35 | 0.0% |
| Australian | 6 | 0.0% |
| Austrian | 350 | 0.2% |
| Barbadian | 55 | 0.0% |
| Basque | 35 | 0.0% |
| Belgian | 81 | 0.0% |
| Belizean | 57 | 0.0% |
| Bhutanese | 924 | 0.5% |
| Blackfeet | 78 | 0.0% |
| Bolivian | 148 | 0.1% |
| Brazilian | 335 | 0.2% |
| British | 1,491 | 0.8% |
| Bulgarian | 31 | 0.0% |
| Burmese | 2,289 | 1.2% |
| Cajun | 96 | 0.1% |
| Canadian | 779 | 0.4% |
| Celtic | 56 | 0.0% |
| Central American | 1,711 | 0.9% |
| Central American Indian | 55 | 0.0% |
| Cherokee | 311 | 0.2% |
| Cheyenne | 10 | 0.0% |
| Chickasaw | 101 | 0.1% |
| Choctaw | 203 | 0.1% |
| Colombian | 701 | 0.4% |
| Comanche | 28 | 0.0% |
| Creek | 9 | 0.0% |
| Croatian | 335 | 0.2% |
| Cuban | 1,124 | 0.6% |
| Czech | 621 | 0.3% |
| Czechoslovakian | 120 | 0.1% |
| Danish | 444 | 0.2% |
| Dominican | 426 | 0.2% |
| Dutch | 1,441 | 0.7% |
| Dutch West Indian | 9 | 0.0% |
| Eastern European | 322 | 0.2% |
| Ecuadorian | 129 | 0.1% |
| Egyptian | 271 | 0.1% |
| English | 20,874 | 10.6% |
| Ethiopian | 31 | 0.0% |
| European | 3,484 | 1.8% |
| Filipino | 192 | 0.1% |
| Finnish | 218 | 0.1% |
| French | 3,685 | 1.9% |
| French Canadian | 562 | 0.3% |
| German | 21,649 | 11.0% |
| Ghanaian | 249 | 0.1% |
| Greek | 341 | 0.2% |
| Guamanian / Chamorro | 118 | 0.1% |
| Guatemalan | 198 | 0.1% |
| Guyanese | 112 | 0.1% |
| Haitian | 74 | 0.0% |
| Honduran | 363 | 0.2% |
| Hungarian | 853 | 0.4% |
| Icelander | 15 | 0.0% |
| Indian (Asian) | 3,803 | 1.9% |
| Iranian | 817 | 0.4% |
| Iraqi | 18 | 0.0% |
| Irish | 13,191 | 6.7% |
| Israeli | 93 | 0.1% |
| Italian | 4,933 | 2.5% |
| Jamaican | 136 | 0.1% |
| Japanese | 259 | 0.1% |
| Jordanian | 292 | 0.2% |
| Kenyan | 133 | 0.1% |
| Kiowa | 16 | 0.0% |
| Korean | 2,599 | 1.3% |
| Laotian | 236 | 0.1% |
| Latvian | 24 | 0.0% |
| Lebanese | 293 | 0.2% |
| Lithuanian | 126 | 0.1% |
| Lumbee | 13 | 0.0% |
| Luxembourger | 19 | 0.0% |
| Macedonian | 10 | 0.0% |
| Malaysian | 133 | 0.1% |
| Mexican | 24,601 | 12.5% |
| Mexican American Indian | 484 | 0.3% |
| Moroccan | 37 | 0.0% |
| Native Hawaiian | 151 | 0.1% |
| Navajo | 52 | 0.0% |
| New Zealander | 6 | 0.0% |
| Nicaraguan | 214 | 0.1% |
| Nigerian | 887 | 0.4% |
| Northern European | 289 | 0.2% |
| Norwegian | 1,963 | 1.0% |
| Okinawan | 35 | 0.0% |
| Osage | 35 | 0.0% |
| Pakistani | 145 | 0.1% |
| Palestinian | 243 | 0.1% |
| Panamanian | 109 | 0.1% |
| Pennsylvania German | 27 | 0.0% |
| Peruvian | 135 | 0.1% |
| Polish | 2,692 | 1.4% |
| Portuguese | 792 | 0.4% |
| Potawatomi | 14 | 0.0% |
| Puerto Rican | 1,099 | 0.6% |
| Romanian | 468 | 0.2% |
| Russian | 797 | 0.4% |
| Salvadoran | 827 | 0.4% |
| Scandinavian | 415 | 0.2% |
| Scotch-Irish | 1,888 | 1.0% |
| Scottish | 3,385 | 1.7% |
| Seminole | 10 | 0.0% |
| Serbian | 129 | 0.1% |
| Sioux | 56 | 0.0% |
| Slavic | 6 | 0.0% |
| Slovak | 262 | 0.1% |
| Slovene | 37 | 0.0% |
| South African | 124 | 0.1% |
| South American | 1,793 | 0.9% |
| South American Indian | 48 | 0.0% |
| Spaniard | 1,659 | 0.9% |
| Spanish | 589 | 0.3% |
| Sri Lankan | 1,656 | 0.8% |
| Subsaharan African | 3,211 | 1.6% |
| Swedish | 1,539 | 0.8% |
| Swiss | 217 | 0.1% |
| Syrian | 63 | 0.0% |
| Thai | 11,024 | 5.6% |
| Trinidadian and Tobagonian | 9 | 0.0% |
| Turkish | 35 | 0.0% |
| Ukrainian | 330 | 0.2% |
| Venezuelan | 583 | 0.3% |
| Vietnamese | 682 | 0.4% |
| Welsh | 1,046 | 0.5% |
| West Indian | 113 | 0.1% |
| Yaqui | 41 | 0.0% |
| Yugoslavian | 197 | 0.1% |
| Zimbabwean | 88 | 0.0% | View All 135 Rows |
Immigrants in Mckinney
The most numerous immigrant groups reported in Mckinney came from Asia (17,400 | 8.9%), Latin America (10,539 | 5.4%), South Central Asia (9,920 | 5.1%), Central America (8,316 | 4.2%), and India (7,291 | 3.7%), together accounting for 27.3% of all Mckinney residents.
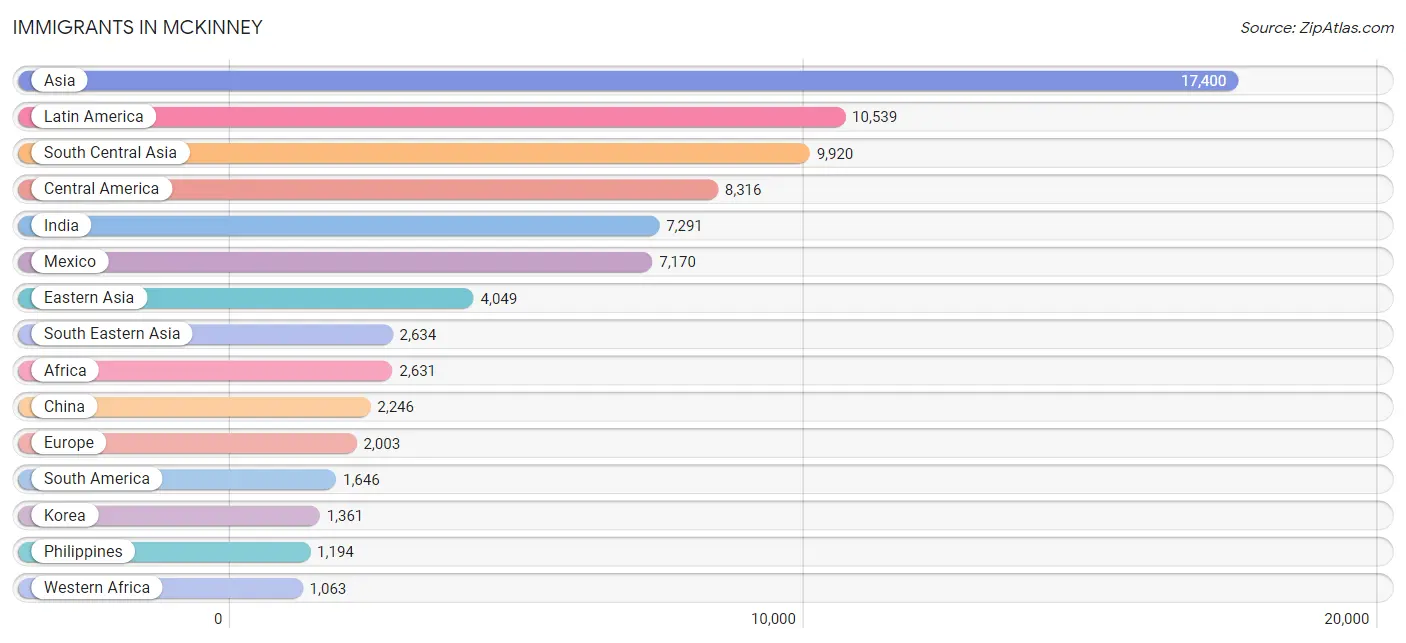
| Immigration Origin | # Population | % Population |
| Afghanistan | 27 | 0.0% |
| Africa | 2,631 | 1.3% |
| Argentina | 45 | 0.0% |
| Asia | 17,400 | 8.9% |
| Australia | 51 | 0.0% |
| Bangladesh | 699 | 0.4% |
| Barbados | 55 | 0.0% |
| Belarus | 11 | 0.0% |
| Belgium | 11 | 0.0% |
| Bolivia | 108 | 0.1% |
| Brazil | 284 | 0.1% |
| Bulgaria | 15 | 0.0% |
| Cambodia | 52 | 0.0% |
| Cameroon | 394 | 0.2% |
| Canada | 1,034 | 0.5% |
| Caribbean | 577 | 0.3% |
| Central America | 8,316 | 4.2% |
| China | 2,246 | 1.1% |
| Colombia | 363 | 0.2% |
| Congo | 71 | 0.0% |
| Cuba | 252 | 0.1% |
| Dominica | 61 | 0.0% |
| Dominican Republic | 33 | 0.0% |
| Eastern Africa | 635 | 0.3% |
| Eastern Asia | 4,049 | 2.1% |
| Eastern Europe | 1,022 | 0.5% |
| Ecuador | 9 | 0.0% |
| Egypt | 87 | 0.0% |
| El Salvador | 537 | 0.3% |
| England | 174 | 0.1% |
| Ethiopia | 214 | 0.1% |
| Europe | 2,003 | 1.0% |
| France | 67 | 0.0% |
| Germany | 161 | 0.1% |
| Ghana | 249 | 0.1% |
| Greece | 28 | 0.0% |
| Guatemala | 142 | 0.1% |
| Guyana | 164 | 0.1% |
| Haiti | 74 | 0.0% |
| Honduras | 324 | 0.2% |
| Hong Kong | 158 | 0.1% |
| Hungary | 25 | 0.0% |
| India | 7,291 | 3.7% |
| Indonesia | 169 | 0.1% |
| Iran | 641 | 0.3% |
| Iraq | 16 | 0.0% |
| Ireland | 14 | 0.0% |
| Israel | 160 | 0.1% |
| Italy | 112 | 0.1% |
| Jamaica | 85 | 0.0% |
| Japan | 442 | 0.2% |
| Jordan | 151 | 0.1% |
| Kenya | 333 | 0.2% |
| Korea | 1,361 | 0.7% |
| Kuwait | 10 | 0.0% |
| Laos | 36 | 0.0% |
| Latin America | 10,539 | 5.4% |
| Lebanon | 46 | 0.0% |
| Liberia | 20 | 0.0% |
| Lithuania | 26 | 0.0% |
| Malaysia | 87 | 0.0% |
| Mexico | 7,170 | 3.7% |
| Middle Africa | 513 | 0.3% |
| Morocco | 54 | 0.0% |
| Nepal | 363 | 0.2% |
| Netherlands | 34 | 0.0% |
| Nicaragua | 131 | 0.1% |
| Nigeria | 735 | 0.4% |
| North Macedonia | 10 | 0.0% |
| Northern Africa | 150 | 0.1% |
| Northern Europe | 499 | 0.3% |
| Oceania | 59 | 0.0% |
| Pakistan | 747 | 0.4% |
| Panama | 12 | 0.0% |
| Peru | 100 | 0.1% |
| Philippines | 1,194 | 0.6% |
| Poland | 41 | 0.0% |
| Portugal | 49 | 0.0% |
| Romania | 350 | 0.2% |
| Russia | 184 | 0.1% |
| Saudi Arabia | 43 | 0.0% |
| Scotland | 18 | 0.0% |
| Serbia | 96 | 0.1% |
| Singapore | 109 | 0.1% |
| South Africa | 109 | 0.1% |
| South America | 1,646 | 0.8% |
| South Central Asia | 9,920 | 5.1% |
| South Eastern Asia | 2,634 | 1.3% |
| Southern Europe | 209 | 0.1% |
| Spain | 20 | 0.0% |
| Sri Lanka | 65 | 0.0% |
| Sweden | 8 | 0.0% |
| Syria | 13 | 0.0% |
| Taiwan | 306 | 0.2% |
| Thailand | 47 | 0.0% |
| Trinidad and Tobago | 17 | 0.0% |
| Turkey | 29 | 0.0% |
| Ukraine | 154 | 0.1% |
| Uzbekistan | 59 | 0.0% |
| Venezuela | 573 | 0.3% |
| Vietnam | 940 | 0.5% |
| Western Africa | 1,063 | 0.5% |
| Western Asia | 688 | 0.4% |
| Western Europe | 273 | 0.1% |
| Zimbabwe | 31 | 0.0% | View All 105 Rows |
Sex and Age in Mckinney
Sex and Age in Mckinney
The most populous age groups in Mckinney are 40 to 44 Years (9,622 | 9.8%) for men and 40 to 44 Years (9,159 | 9.4%) for women.
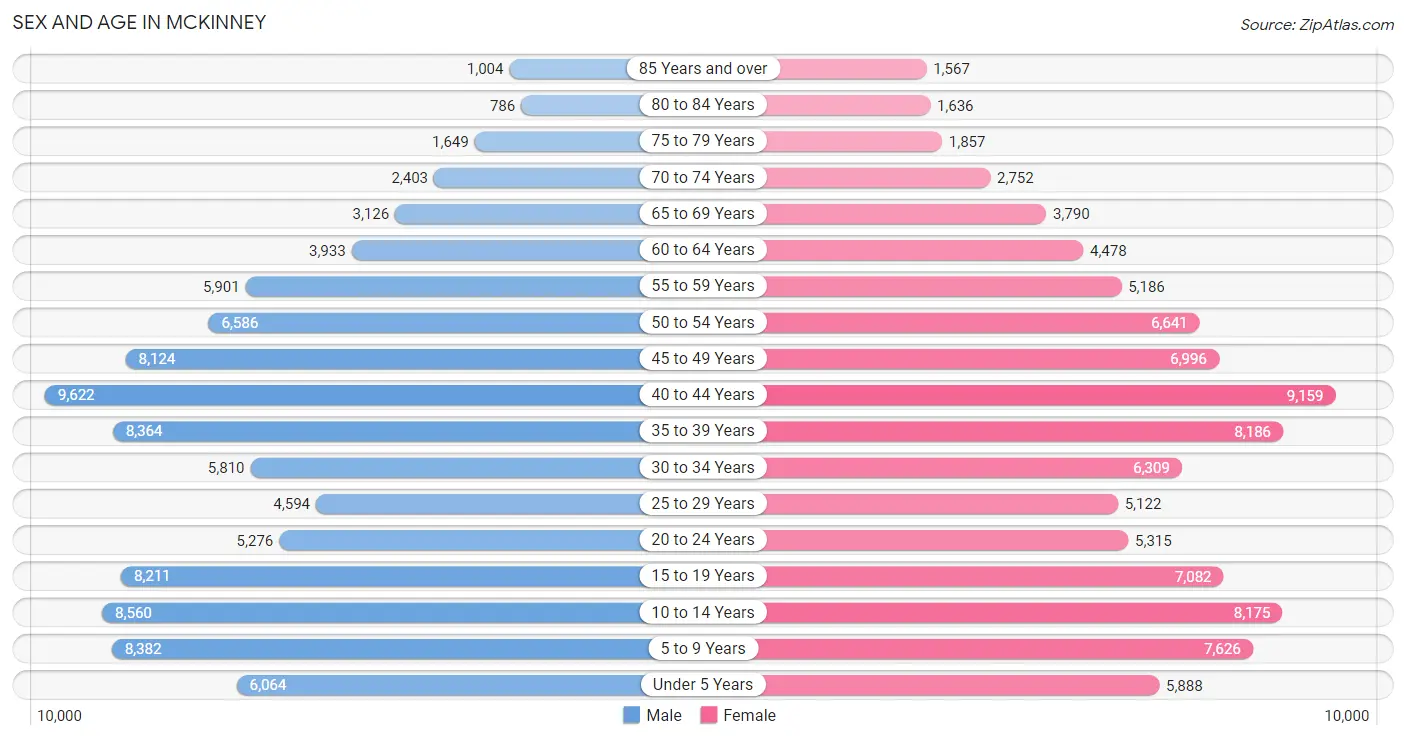
| Age Bracket | Male | Female |
| Under 5 Years | 6,064 (6.2%) | 5,888 (6.0%) |
| 5 to 9 Years | 8,382 (8.5%) | 7,626 (7.8%) |
| 10 to 14 Years | 8,560 (8.7%) | 8,175 (8.4%) |
| 15 to 19 Years | 8,211 (8.3%) | 7,082 (7.2%) |
| 20 to 24 Years | 5,276 (5.4%) | 5,315 (5.4%) |
| 25 to 29 Years | 4,594 (4.7%) | 5,122 (5.2%) |
| 30 to 34 Years | 5,810 (5.9%) | 6,309 (6.5%) |
| 35 to 39 Years | 8,364 (8.5%) | 8,186 (8.4%) |
| 40 to 44 Years | 9,622 (9.8%) | 9,159 (9.4%) |
| 45 to 49 Years | 8,124 (8.3%) | 6,996 (7.2%) |
| 50 to 54 Years | 6,586 (6.7%) | 6,641 (6.8%) |
| 55 to 59 Years | 5,901 (6.0%) | 5,186 (5.3%) |
| 60 to 64 Years | 3,933 (4.0%) | 4,478 (4.6%) |
| 65 to 69 Years | 3,126 (3.2%) | 3,790 (3.9%) |
| 70 to 74 Years | 2,403 (2.4%) | 2,752 (2.8%) |
| 75 to 79 Years | 1,649 (1.7%) | 1,857 (1.9%) |
| 80 to 84 Years | 786 (0.8%) | 1,636 (1.7%) |
| 85 Years and over | 1,004 (1.0%) | 1,567 (1.6%) |
| Total | 98,395 (100.0%) | 97,765 (100.0%) |
Families and Households in Mckinney
Median Family Size in Mckinney
The median family size in Mckinney is 3.30 persons per family, with married-couple families (42,338 | 81.9%) accounting for the largest median family size of 3.39 persons per family. On the other hand, single male/father families (2,753 | 5.3%) represent the smallest median family size with 2.66 persons per family.
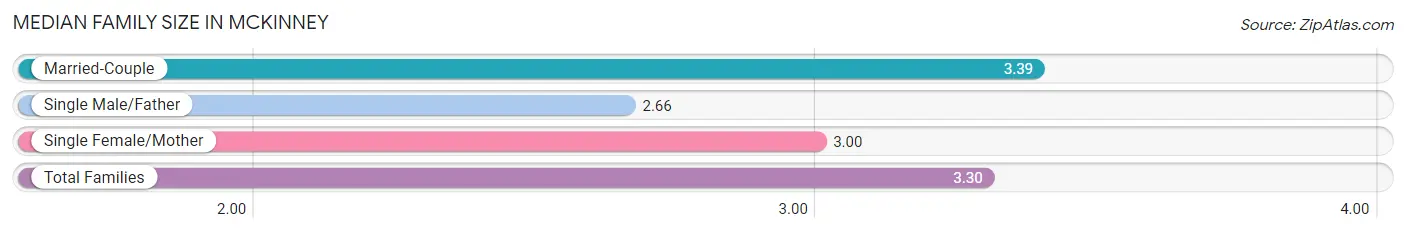
| Family Type | # Families | Family Size |
| Married-Couple | 42,338 (81.9%) | 3.39 |
| Single Male/Father | 2,753 (5.3%) | 2.66 |
| Single Female/Mother | 6,611 (12.8%) | 3.00 |
| Total Families | 51,702 (100.0%) | 3.30 |
Median Household Size in Mckinney
The median household size in Mckinney is 2.85 persons per household, with married-couple households (42,338 | 62.1%) accounting for the largest median household size of 3.41 persons per household. non-family households (16,522 | 24.2%) represent the smallest median household size with 1.27 persons per household.
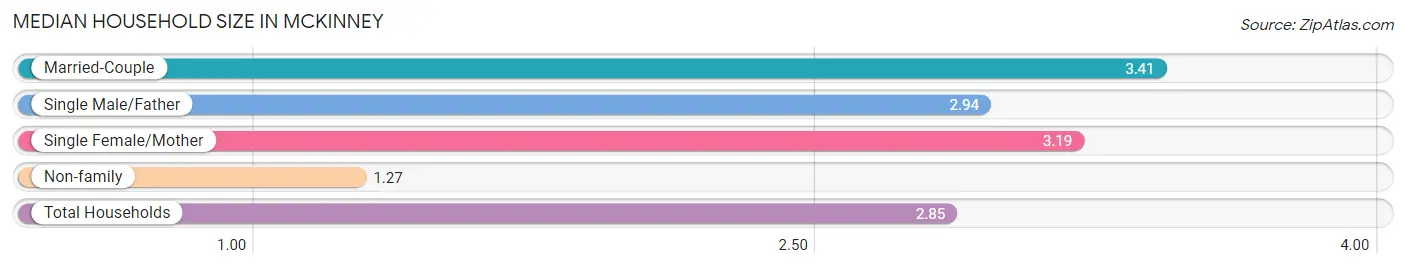
| Household Type | # Households | Household Size |
| Married-Couple | 42,338 (62.1%) | 3.41 |
| Single Male/Father | 2,753 (4.0%) | 2.94 |
| Single Female/Mother | 6,611 (9.7%) | 3.19 |
| Non-family | 16,522 (24.2%) | 1.27 |
| Total Households | 68,224 (100.0%) | 2.85 |
Household Size by Marriage Status in Mckinney
Out of a total of 68,224 households in Mckinney, 51,702 (75.8%) are family households, while 16,522 (24.2%) are nonfamily households. The most numerous type of family households are 2-person households, comprising 18,709, and the most common type of nonfamily households are 1-person households, comprising 13,587.
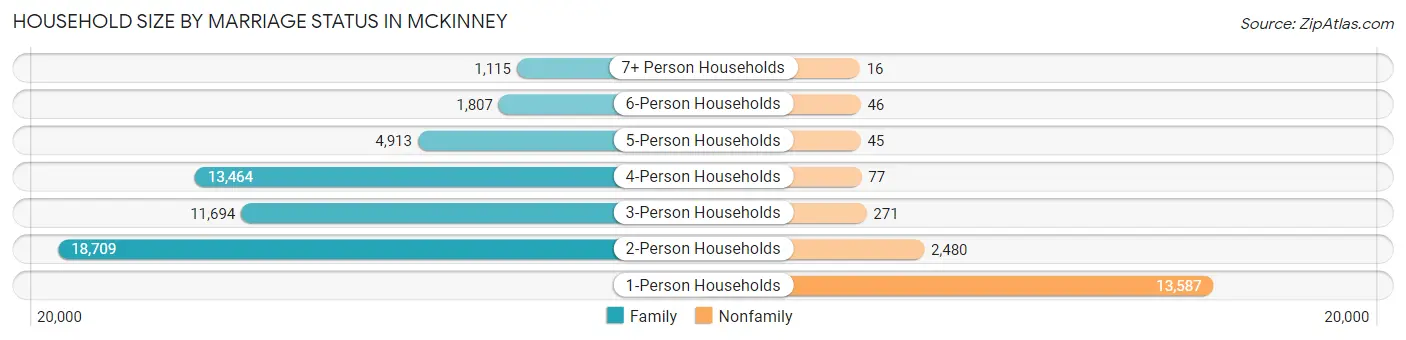
| Household Size | Family Households | Nonfamily Households |
| 1-Person Households | - | 13,587 (19.9%) |
| 2-Person Households | 18,709 (27.4%) | 2,480 (3.6%) |
| 3-Person Households | 11,694 (17.1%) | 271 (0.4%) |
| 4-Person Households | 13,464 (19.7%) | 77 (0.1%) |
| 5-Person Households | 4,913 (7.2%) | 45 (0.1%) |
| 6-Person Households | 1,807 (2.6%) | 46 (0.1%) |
| 7+ Person Households | 1,115 (1.6%) | 16 (0.0%) |
| Total | 51,702 (75.8%) | 16,522 (24.2%) |
Female Fertility in Mckinney
Fertility by Age in Mckinney
Average fertility rate in Mckinney is 46.0 births per 1,000 women. Women in the age bracket of 20 to 34 years have the highest fertility rate with 83.0 births per 1,000 women. Women in the age bracket of 20 to 34 years acount for 61.0% of all women with births.
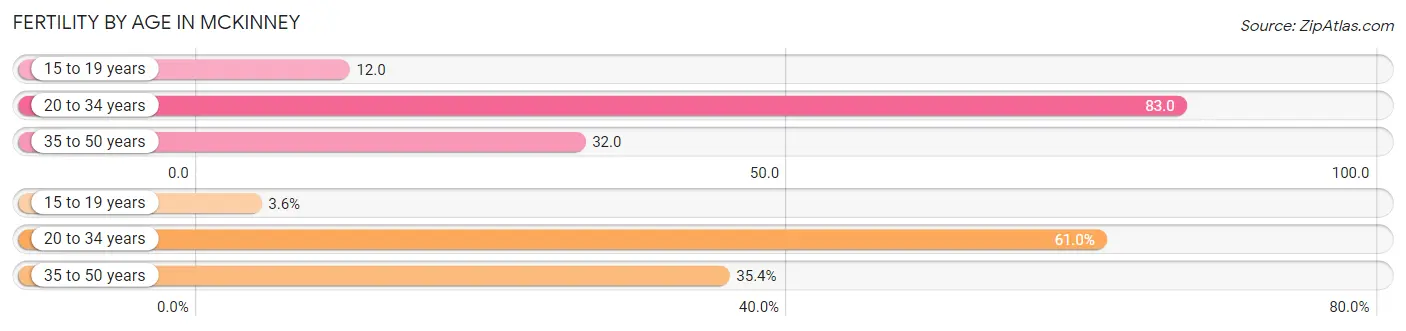
| Age Bracket | Women with Births | Births / 1,000 Women |
| 15 to 19 years | 83 (3.6%) | 12.0 |
| 20 to 34 years | 1,398 (61.0%) | 83.0 |
| 35 to 50 years | 811 (35.4%) | 32.0 |
| Total | 2,292 (100.0%) | 46.0 |
Fertility by Age by Marriage Status in Mckinney
88.6% of women with births (2,292) in Mckinney are married. The highest percentage of unmarried women with births falls into 15 to 19 years age bracket with 100.0% of them unmarried at the time of birth, while the lowest percentage of unmarried women with births belong to 35 to 50 years age bracket with 0.0% of them unmarried.
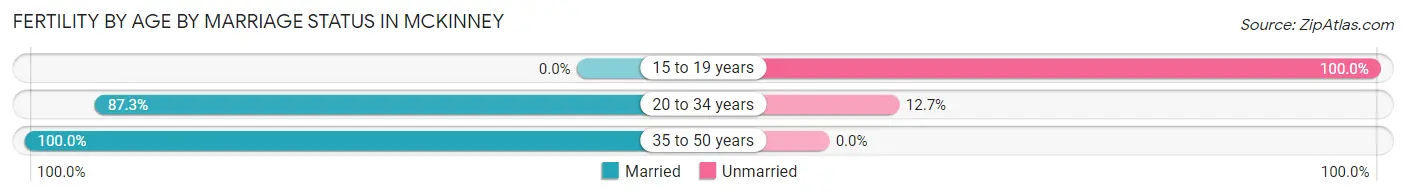
| Age Bracket | Married | Unmarried |
| 15 to 19 years | 0 (0.0%) | 83 (100.0%) |
| 20 to 34 years | 1,220 (87.3%) | 178 (12.7%) |
| 35 to 50 years | 811 (100.0%) | 0 (0.0%) |
| Total | 2,031 (88.6%) | 261 (11.4%) |
Fertility by Education in Mckinney
Average fertility rate in Mckinney is 46.0 births per 1,000 women. Women with the education attainment of bachelor's degree have the highest fertility rate of 68.0 births per 1,000 women, while women with the education attainment of less than high school have the lowest fertility at 13.0 births per 1,000 women. Women with the education attainment of bachelor's degree represent 45.9% of all women with births.
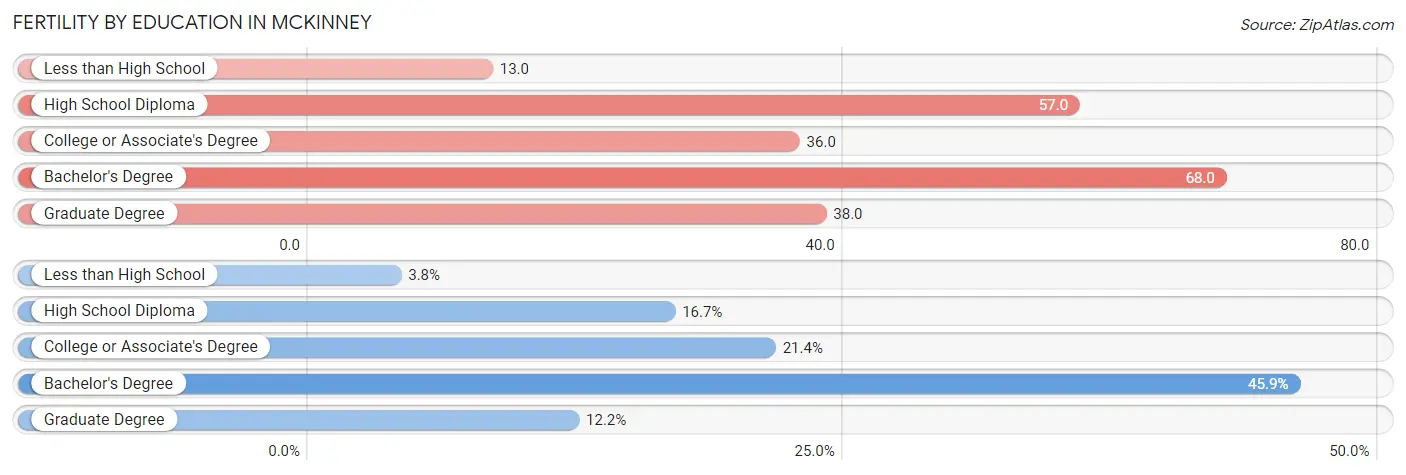
| Educational Attainment | Women with Births | Births / 1,000 Women |
| Less than High School | 88 (3.8%) | 13.0 |
| High School Diploma | 382 (16.7%) | 57.0 |
| College or Associate's Degree | 490 (21.4%) | 36.0 |
| Bachelor's Degree | 1,053 (45.9%) | 68.0 |
| Graduate Degree | 279 (12.2%) | 38.0 |
| Total | 2,292 (100.0%) | 46.0 |
Fertility by Education by Marriage Status in Mckinney
11.4% of women with births in Mckinney are unmarried. Women with the educational attainment of graduate degree are most likely to be married with 100.0% of them married at childbirth, while women with the educational attainment of high school diploma are least likely to be married with 46.6% of them unmarried at childbirth.
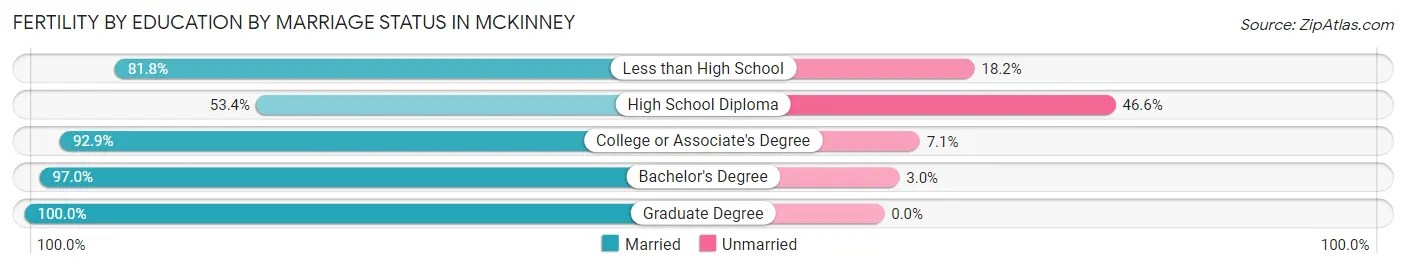
| Educational Attainment | Married | Unmarried |
| Less than High School | 72 (81.8%) | 16 (18.2%) |
| High School Diploma | 204 (53.4%) | 178 (46.6%) |
| College or Associate's Degree | 455 (92.9%) | 35 (7.1%) |
| Bachelor's Degree | 1,021 (97.0%) | 32 (3.0%) |
| Graduate Degree | 279 (100.0%) | 0 (0.0%) |
| Total | 2,031 (88.6%) | 261 (11.4%) |
Employment Characteristics in Mckinney
Employment by Class of Employer in Mckinney
Among the 99,918 employed individuals in Mckinney, private company employees (75,980 | 76.0%), local government employees (6,951 | 7.0%), and self-employed (not incorporated) (5,732 | 5.7%) make up the most common classes of employment.
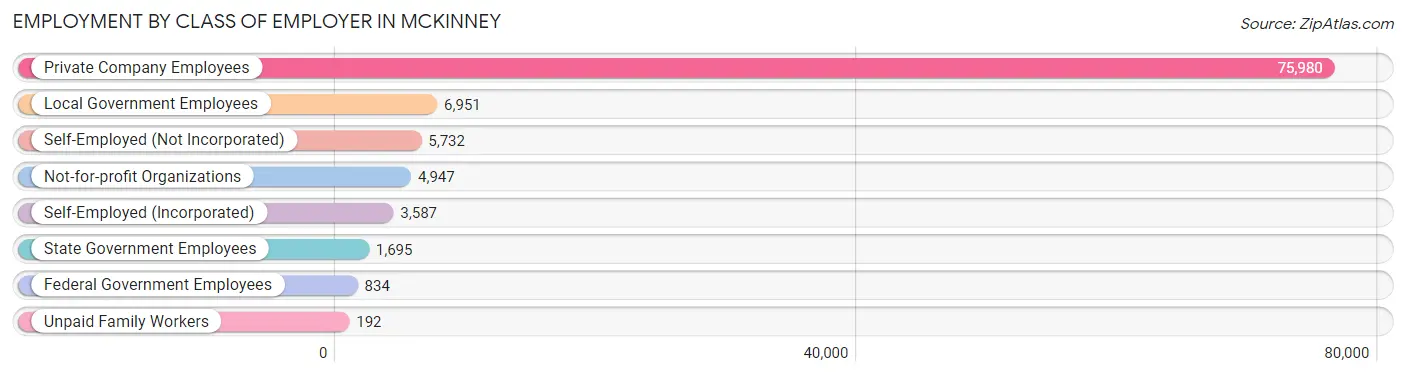
| Employer Class | # Employees | % Employees |
| Private Company Employees | 75,980 | 76.0% |
| Self-Employed (Incorporated) | 3,587 | 3.6% |
| Self-Employed (Not Incorporated) | 5,732 | 5.7% |
| Not-for-profit Organizations | 4,947 | 5.0% |
| Local Government Employees | 6,951 | 7.0% |
| State Government Employees | 1,695 | 1.7% |
| Federal Government Employees | 834 | 0.8% |
| Unpaid Family Workers | 192 | 0.2% |
| Total | 99,918 | 100.0% |
Employment Status by Age in Mckinney
According to the labor force statistics for Mckinney, out of the total population over 16 years of age (147,813), 70.8% or 104,652 individuals are in the labor force, with 3.7% or 3,872 of them unemployed. The age group with the highest labor force participation rate is 35 to 44 years, with 86.3% or 30,491 individuals in the labor force. Within the labor force, the 16 to 19 years age range has the highest percentage of unemployed individuals, with 13.3% or 684 of them being unemployed.
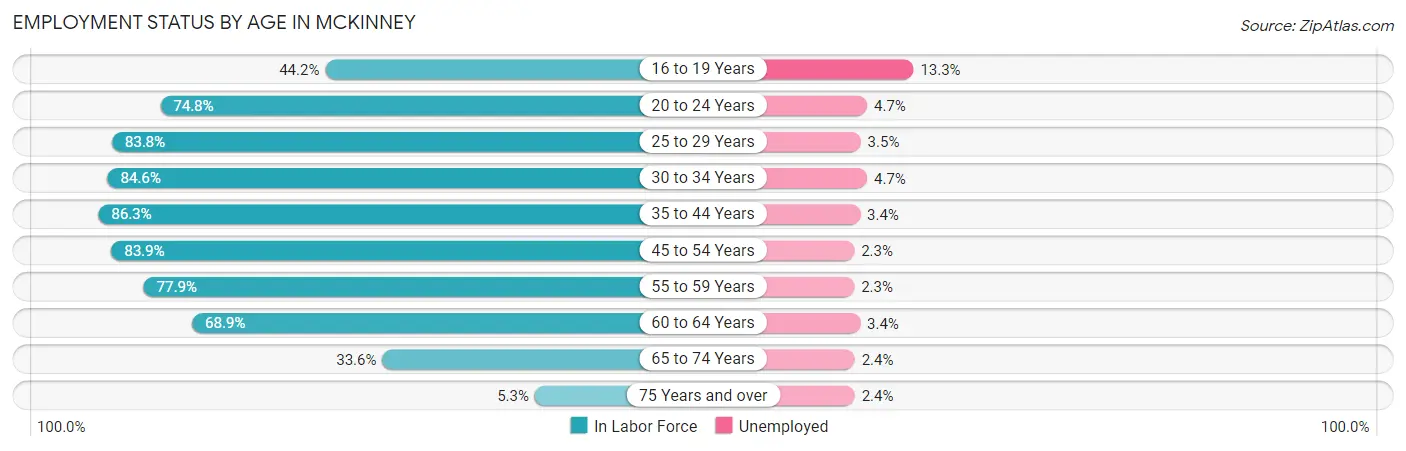
| Age Bracket | In Labor Force | Unemployed |
| 16 to 19 Years | 5,145 (44.2%) | 684 (13.3%) |
| 20 to 24 Years | 7,922 (74.8%) | 372 (4.7%) |
| 25 to 29 Years | 8,142 (83.8%) | 285 (3.5%) |
| 30 to 34 Years | 10,253 (84.6%) | 482 (4.7%) |
| 35 to 44 Years | 30,491 (86.3%) | 1,037 (3.4%) |
| 45 to 54 Years | 23,783 (83.9%) | 547 (2.3%) |
| 55 to 59 Years | 8,637 (77.9%) | 199 (2.3%) |
| 60 to 64 Years | 5,795 (68.9%) | 197 (3.4%) |
| 65 to 74 Years | 4,056 (33.6%) | 97 (2.4%) |
| 75 Years and over | 450 (5.3%) | 11 (2.4%) |
| Total | 104,652 (70.8%) | 3,872 (3.7%) |
Employment Status by Educational Attainment in Mckinney
According to labor force statistics for Mckinney, 82.9% of individuals (87,054) out of the total population between 25 and 64 years of age (105,011) are in the labor force, with 3.2% or 2,786 of them being unemployed. The group with the highest labor force participation rate are those with the educational attainment of bachelor's degree or higher, with 86.8% or 49,887 individuals in the labor force. Within the labor force, individuals with college / associate degree education have the highest percentage of unemployment, with 3.3% or 760 of them being unemployed.
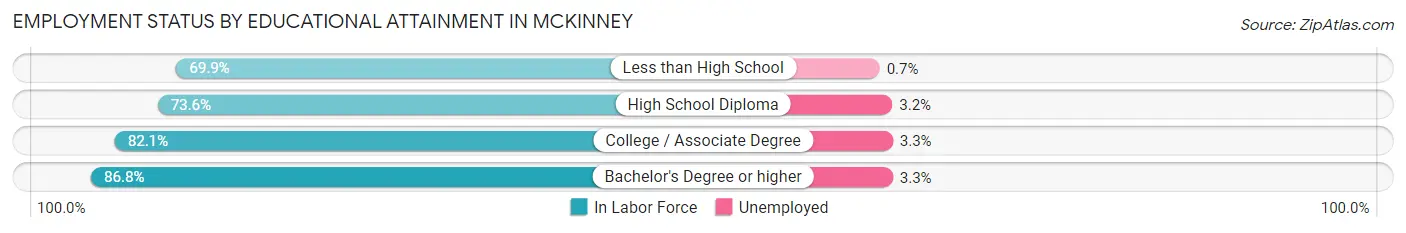
| Educational Attainment | In Labor Force | Unemployed |
| Less than High School | 3,494 (69.9%) | 35 (0.7%) |
| High School Diploma | 10,667 (73.6%) | 464 (3.2%) |
| College / Associate Degree | 23,025 (82.1%) | 925 (3.3%) |
| Bachelor's Degree or higher | 49,887 (86.8%) | 1,897 (3.3%) |
| Total | 87,054 (82.9%) | 3,360 (3.2%) |
Employment Occupations by Sex in Mckinney
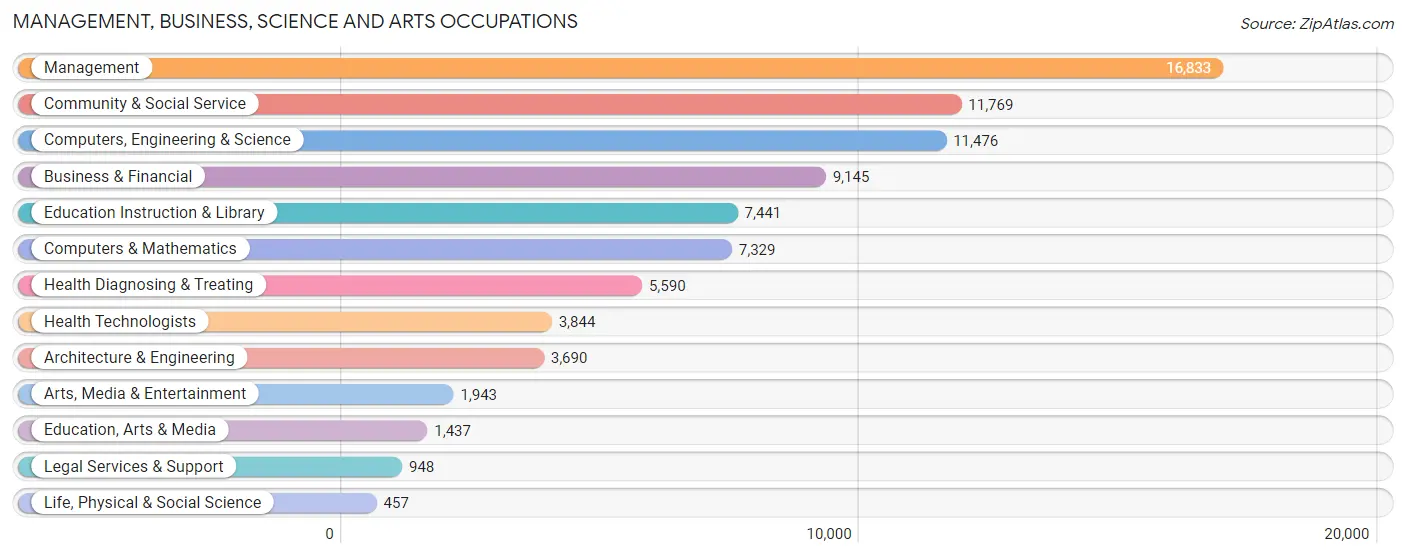
Management, Business, Science and Arts Occupations
The most common Management, Business, Science and Arts occupations in Mckinney are Management (16,833 | 16.7%), Community & Social Service (11,769 | 11.7%), Computers, Engineering & Science (11,476 | 11.4%), Business & Financial (9,145 | 9.1%), and Education Instruction & Library (7,441 | 7.4%).
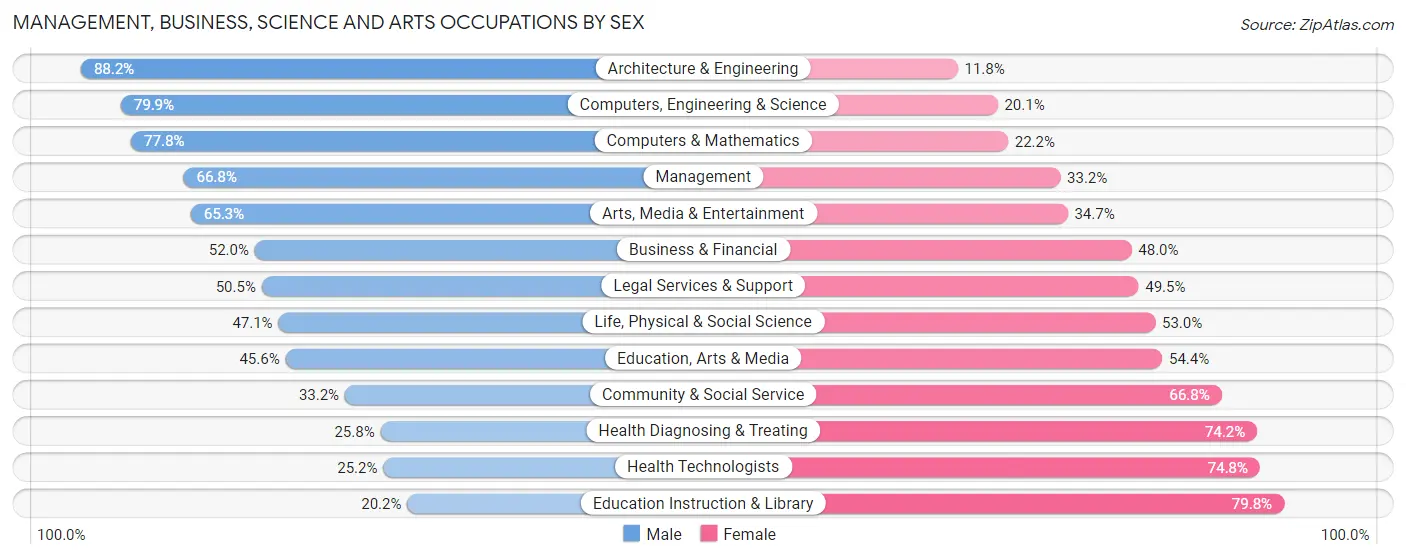
Management, Business, Science and Arts Occupations by Sex
Within the Management, Business, Science and Arts occupations in Mckinney, the most male-oriented occupations are Architecture & Engineering (88.2%), Computers, Engineering & Science (79.9%), and Computers & Mathematics (77.8%), while the most female-oriented occupations are Education Instruction & Library (79.8%), Health Technologists (74.8%), and Health Diagnosing & Treating (74.2%).
| Occupation | Male | Female |
| Management | 11,251 (66.8%) | 5,582 (33.2%) |
| Business & Financial | 4,754 (52.0%) | 4,391 (48.0%) |
| Computers, Engineering & Science | 9,170 (79.9%) | 2,306 (20.1%) |
| Computers & Mathematics | 5,699 (77.8%) | 1,630 (22.2%) |
| Architecture & Engineering | 3,256 (88.2%) | 434 (11.8%) |
| Life, Physical & Social Science | 215 (47.0%) | 242 (52.9%) |
| Community & Social Service | 3,904 (33.2%) | 7,865 (66.8%) |
| Education, Arts & Media | 655 (45.6%) | 782 (54.4%) |
| Legal Services & Support | 479 (50.5%) | 469 (49.5%) |
| Education Instruction & Library | 1,501 (20.2%) | 5,940 (79.8%) |
| Arts, Media & Entertainment | 1,269 (65.3%) | 674 (34.7%) |
| Health Diagnosing & Treating | 1,440 (25.8%) | 4,150 (74.2%) |
| Health Technologists | 968 (25.2%) | 2,876 (74.8%) |
| Total (Category) | 30,519 (55.7%) | 24,294 (44.3%) |
| Total (Overall) | 55,962 (55.6%) | 44,763 (44.4%) |
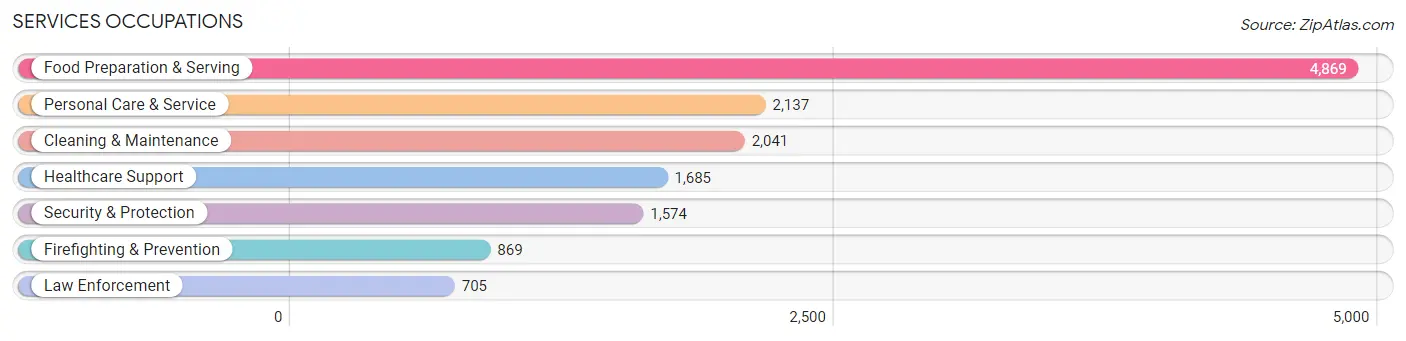
Services Occupations
The most common Services occupations in Mckinney are Food Preparation & Serving (4,869 | 4.8%), Personal Care & Service (2,137 | 2.1%), Cleaning & Maintenance (2,041 | 2.0%), Healthcare Support (1,685 | 1.7%), and Security & Protection (1,574 | 1.6%).
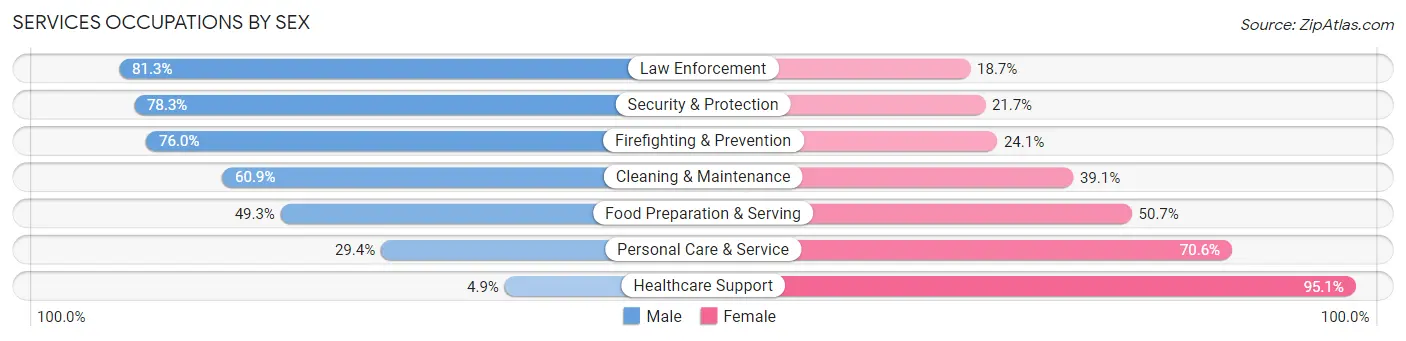
Services Occupations by Sex
Within the Services occupations in Mckinney, the most male-oriented occupations are Law Enforcement (81.3%), Security & Protection (78.3%), and Firefighting & Prevention (75.9%), while the most female-oriented occupations are Healthcare Support (95.1%), Personal Care & Service (70.6%), and Food Preparation & Serving (50.7%).
| Occupation | Male | Female |
| Healthcare Support | 83 (4.9%) | 1,602 (95.1%) |
| Security & Protection | 1,233 (78.3%) | 341 (21.7%) |
| Firefighting & Prevention | 660 (75.9%) | 209 (24.0%) |
| Law Enforcement | 573 (81.3%) | 132 (18.7%) |
| Food Preparation & Serving | 2,400 (49.3%) | 2,469 (50.7%) |
| Cleaning & Maintenance | 1,243 (60.9%) | 798 (39.1%) |
| Personal Care & Service | 629 (29.4%) | 1,508 (70.6%) |
| Total (Category) | 5,588 (45.4%) | 6,718 (54.6%) |
| Total (Overall) | 55,962 (55.6%) | 44,763 (44.4%) |
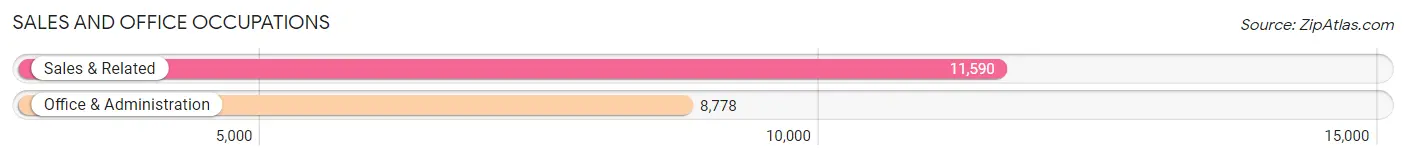
Sales and Office Occupations
The most common Sales and Office occupations in Mckinney are Sales & Related (11,590 | 11.5%), and Office & Administration (8,778 | 8.7%).
Sales and Office Occupations by Sex
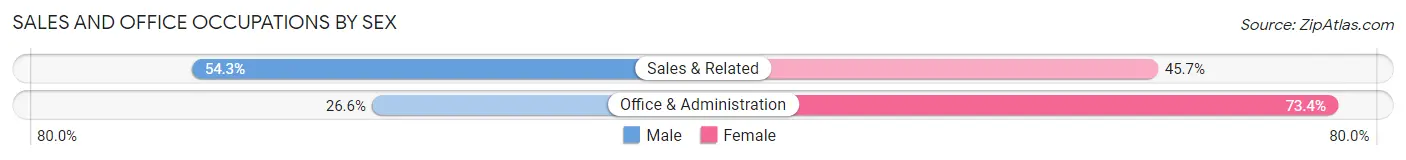
| Occupation | Male | Female |
| Sales & Related | 6,290 (54.3%) | 5,300 (45.7%) |
| Office & Administration | 2,334 (26.6%) | 6,444 (73.4%) |
| Total (Category) | 8,624 (42.3%) | 11,744 (57.7%) |
| Total (Overall) | 55,962 (55.6%) | 44,763 (44.4%) |
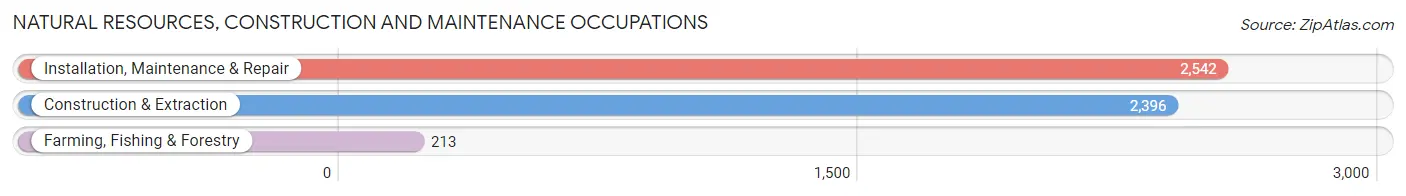
Natural Resources, Construction and Maintenance Occupations
The most common Natural Resources, Construction and Maintenance occupations in Mckinney are Installation, Maintenance & Repair (2,542 | 2.5%), Construction & Extraction (2,396 | 2.4%), and Farming, Fishing & Forestry (213 | 0.2%).
Natural Resources, Construction and Maintenance Occupations by Sex
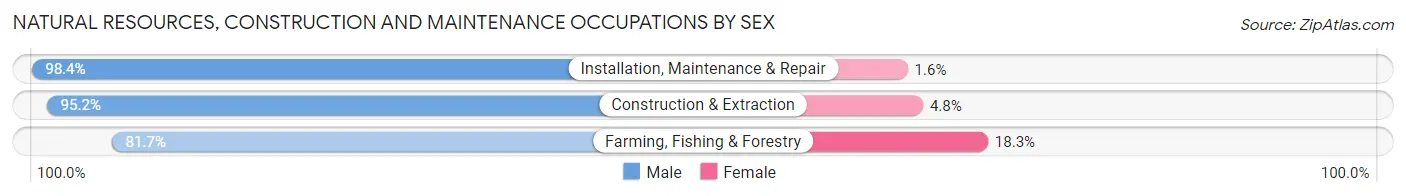
| Occupation | Male | Female |
| Farming, Fishing & Forestry | 174 (81.7%) | 39 (18.3%) |
| Construction & Extraction | 2,281 (95.2%) | 115 (4.8%) |
| Installation, Maintenance & Repair | 2,501 (98.4%) | 41 (1.6%) |
| Total (Category) | 4,956 (96.2%) | 195 (3.8%) |
| Total (Overall) | 55,962 (55.6%) | 44,763 (44.4%) |
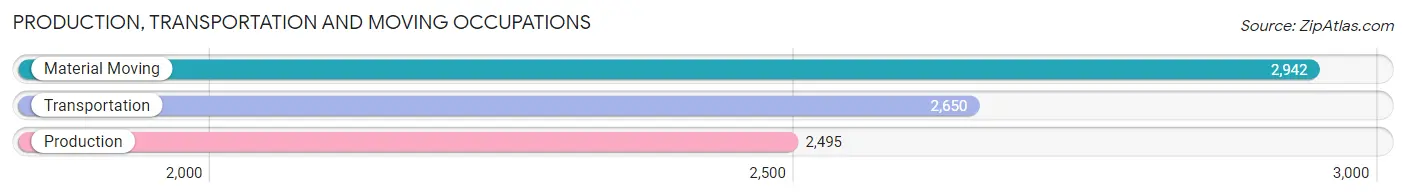
Production, Transportation and Moving Occupations
The most common Production, Transportation and Moving occupations in Mckinney are Material Moving (2,942 | 2.9%), Transportation (2,650 | 2.6%), and Production (2,495 | 2.5%).
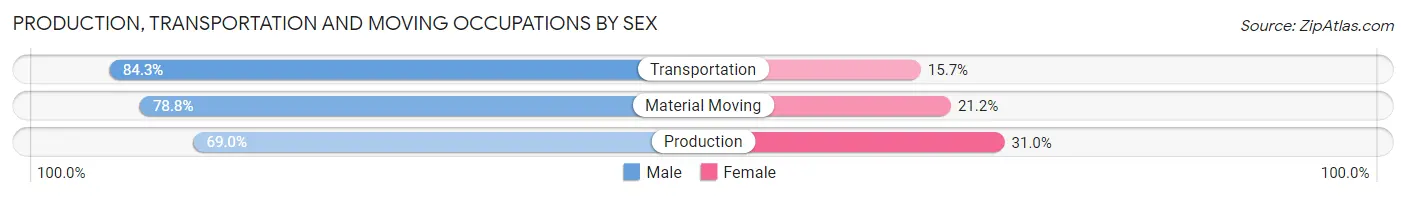
Production, Transportation and Moving Occupations by Sex
| Occupation | Male | Female |
| Production | 1,721 (69.0%) | 774 (31.0%) |
| Transportation | 2,235 (84.3%) | 415 (15.7%) |
| Material Moving | 2,319 (78.8%) | 623 (21.2%) |
| Total (Category) | 6,275 (77.6%) | 1,812 (22.4%) |
| Total (Overall) | 55,962 (55.6%) | 44,763 (44.4%) |
Employment Industries by Sex in Mckinney
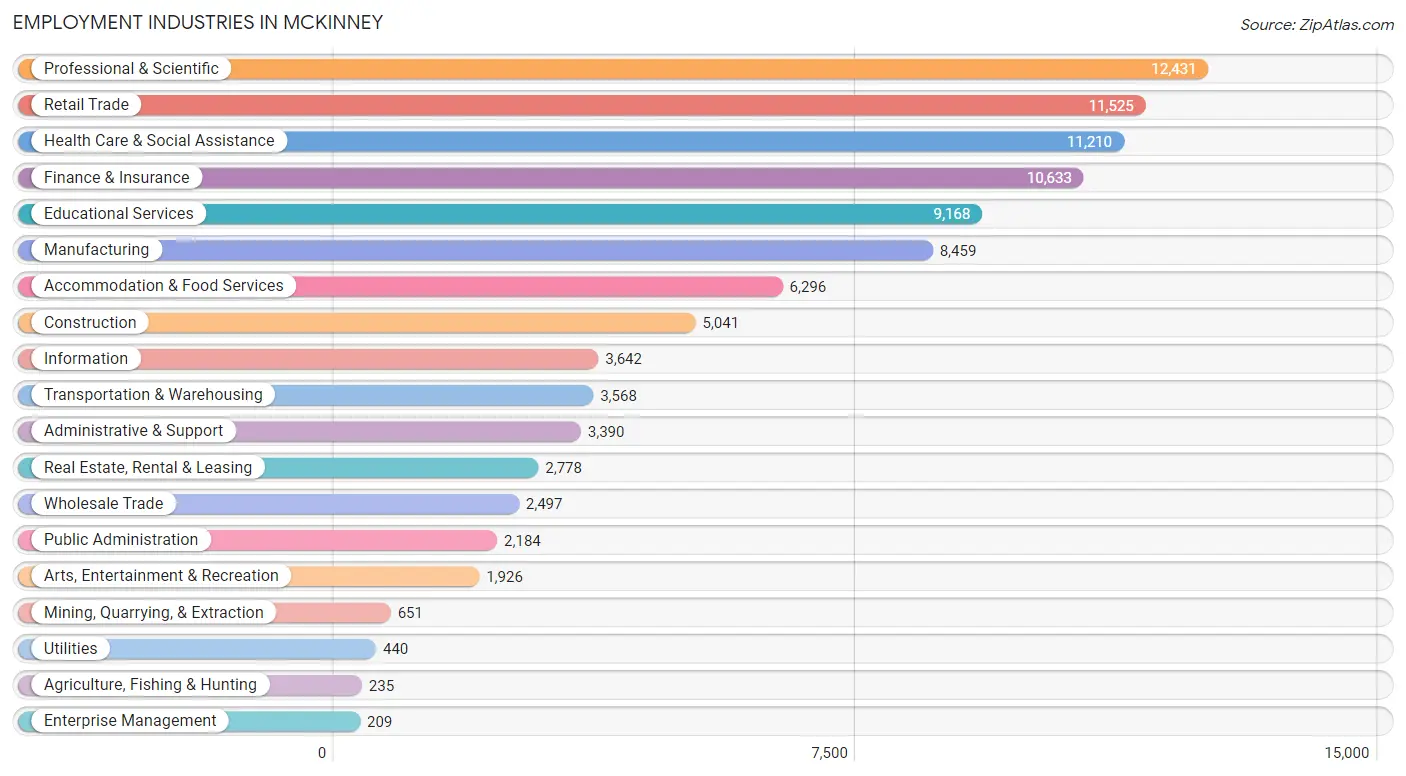
Employment Industries in Mckinney
The major employment industries in Mckinney include Professional & Scientific (12,431 | 12.3%), Retail Trade (11,525 | 11.4%), Health Care & Social Assistance (11,210 | 11.1%), Finance & Insurance (10,633 | 10.6%), and Educational Services (9,168 | 9.1%).
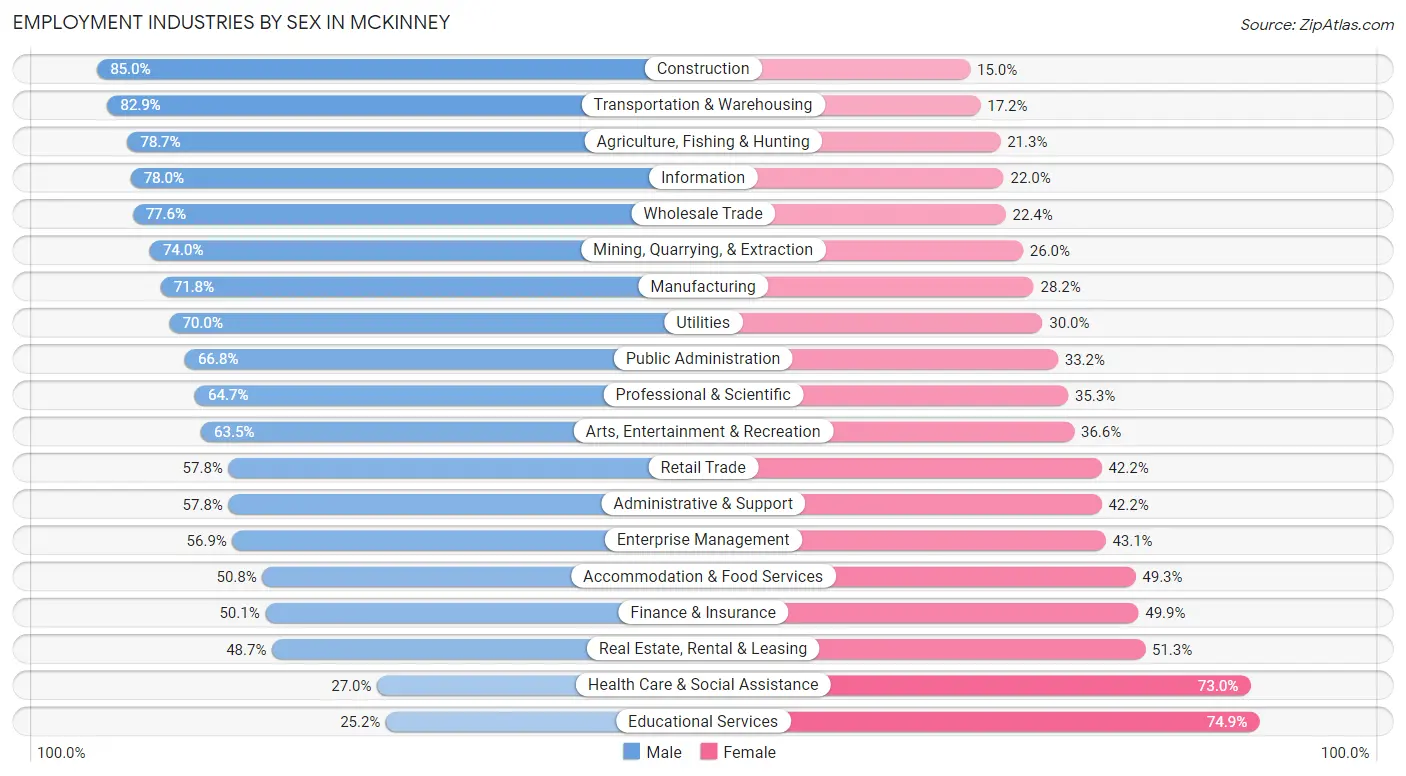
Employment Industries by Sex in Mckinney
The Mckinney industries that see more men than women are Construction (85.0%), Transportation & Warehousing (82.9%), and Agriculture, Fishing & Hunting (78.7%), whereas the industries that tend to have a higher number of women are Educational Services (74.9%), Health Care & Social Assistance (73.0%), and Real Estate, Rental & Leasing (51.3%).
| Industry | Male | Female |
| Agriculture, Fishing & Hunting | 185 (78.7%) | 50 (21.3%) |
| Mining, Quarrying, & Extraction | 482 (74.0%) | 169 (26.0%) |
| Construction | 4,283 (85.0%) | 758 (15.0%) |
| Manufacturing | 6,074 (71.8%) | 2,385 (28.2%) |
| Wholesale Trade | 1,938 (77.6%) | 559 (22.4%) |
| Retail Trade | 6,657 (57.8%) | 4,868 (42.2%) |
| Transportation & Warehousing | 2,956 (82.9%) | 612 (17.2%) |
| Utilities | 308 (70.0%) | 132 (30.0%) |
| Information | 2,842 (78.0%) | 800 (22.0%) |
| Finance & Insurance | 5,331 (50.1%) | 5,302 (49.9%) |
| Real Estate, Rental & Leasing | 1,354 (48.7%) | 1,424 (51.3%) |
| Professional & Scientific | 8,042 (64.7%) | 4,389 (35.3%) |
| Enterprise Management | 119 (56.9%) | 90 (43.1%) |
| Administrative & Support | 1,958 (57.8%) | 1,432 (42.2%) |
| Educational Services | 2,306 (25.2%) | 6,862 (74.9%) |
| Health Care & Social Assistance | 3,027 (27.0%) | 8,183 (73.0%) |
| Arts, Entertainment & Recreation | 1,222 (63.4%) | 704 (36.5%) |
| Accommodation & Food Services | 3,195 (50.7%) | 3,101 (49.2%) |
| Public Administration | 1,459 (66.8%) | 725 (33.2%) |
| Total | 55,962 (55.6%) | 44,763 (44.4%) |
Education in Mckinney
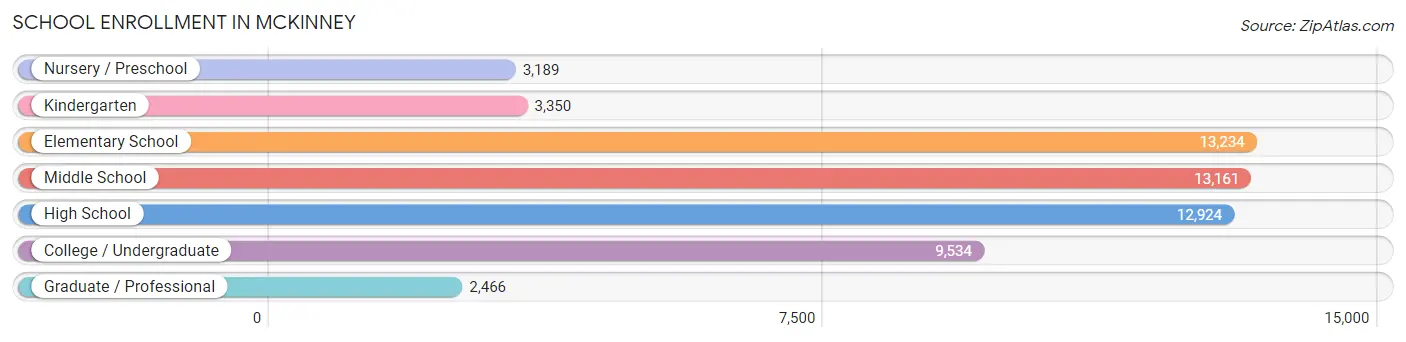
School Enrollment in Mckinney
The most common levels of schooling among the 57,858 students in Mckinney are elementary school (13,234 | 22.9%), middle school (13,161 | 22.8%), and high school (12,924 | 22.3%).
| School Level | # Students | % Students |
| Nursery / Preschool | 3,189 | 5.5% |
| Kindergarten | 3,350 | 5.8% |
| Elementary School | 13,234 | 22.9% |
| Middle School | 13,161 | 22.8% |
| High School | 12,924 | 22.3% |
| College / Undergraduate | 9,534 | 16.5% |
| Graduate / Professional | 2,466 | 4.3% |
| Total | 57,858 | 100.0% |
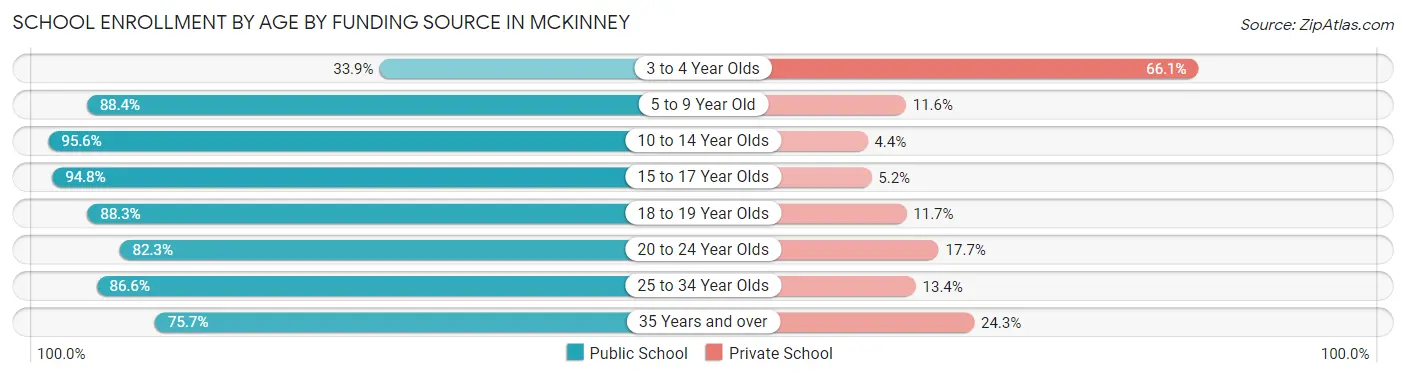
School Enrollment by Age by Funding Source in Mckinney
Out of a total of 57,858 students who are enrolled in schools in Mckinney, 7,290 (12.6%) attend a private institution, while the remaining 50,568 (87.4%) are enrolled in public schools. The age group of 3 to 4 year olds has the highest likelihood of being enrolled in private schools, with 1,995 (66.1% in the age bracket) enrolled. Conversely, the age group of 10 to 14 year olds has the lowest likelihood of being enrolled in a private school, with 15,667 (95.6% in the age bracket) attending a public institution.
| Age Bracket | Public School | Private School |
| 3 to 4 Year Olds | 1,025 (33.9%) | 1,995 (66.1%) |
| 5 to 9 Year Old | 13,395 (88.4%) | 1,752 (11.6%) |
| 10 to 14 Year Olds | 15,667 (95.6%) | 727 (4.4%) |
| 15 to 17 Year Olds | 8,673 (94.8%) | 472 (5.2%) |
| 18 to 19 Year Olds | 3,772 (88.3%) | 499 (11.7%) |
| 20 to 24 Year Olds | 4,066 (82.3%) | 874 (17.7%) |
| 25 to 34 Year Olds | 1,887 (86.6%) | 292 (13.4%) |
| 35 Years and over | 2,091 (75.7%) | 671 (24.3%) |
| Total | 50,568 (87.4%) | 7,290 (12.6%) |
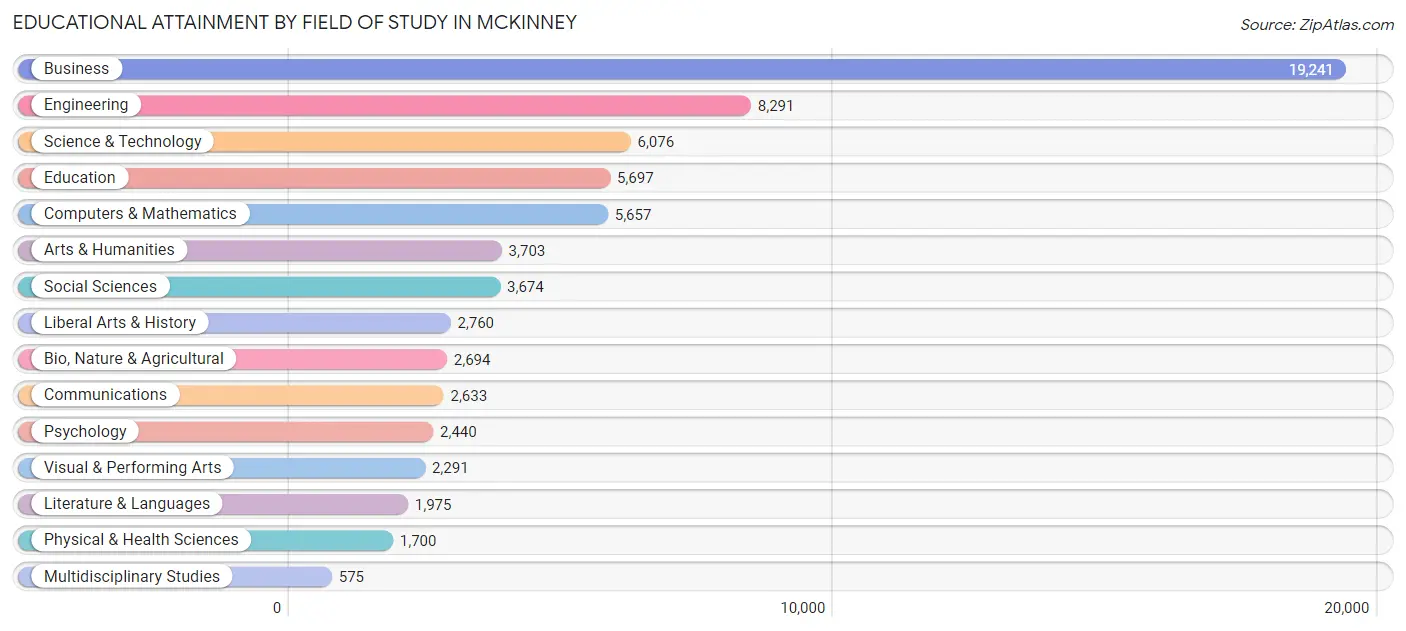
Educational Attainment by Field of Study in Mckinney
Business (19,241 | 27.7%), engineering (8,291 | 11.9%), science & technology (6,076 | 8.7%), education (5,697 | 8.2%), and computers & mathematics (5,657 | 8.2%) are the most common fields of study among 69,407 individuals in Mckinney who have obtained a bachelor's degree or higher.
| Field of Study | # Graduates | % Graduates |
| Computers & Mathematics | 5,657 | 8.2% |
| Bio, Nature & Agricultural | 2,694 | 3.9% |
| Physical & Health Sciences | 1,700 | 2.5% |
| Psychology | 2,440 | 3.5% |
| Social Sciences | 3,674 | 5.3% |
| Engineering | 8,291 | 11.9% |
| Multidisciplinary Studies | 575 | 0.8% |
| Science & Technology | 6,076 | 8.7% |
| Business | 19,241 | 27.7% |
| Education | 5,697 | 8.2% |
| Literature & Languages | 1,975 | 2.9% |
| Liberal Arts & History | 2,760 | 4.0% |
| Visual & Performing Arts | 2,291 | 3.3% |
| Communications | 2,633 | 3.8% |
| Arts & Humanities | 3,703 | 5.3% |
| Total | 69,407 | 100.0% |
Transportation & Commute in Mckinney
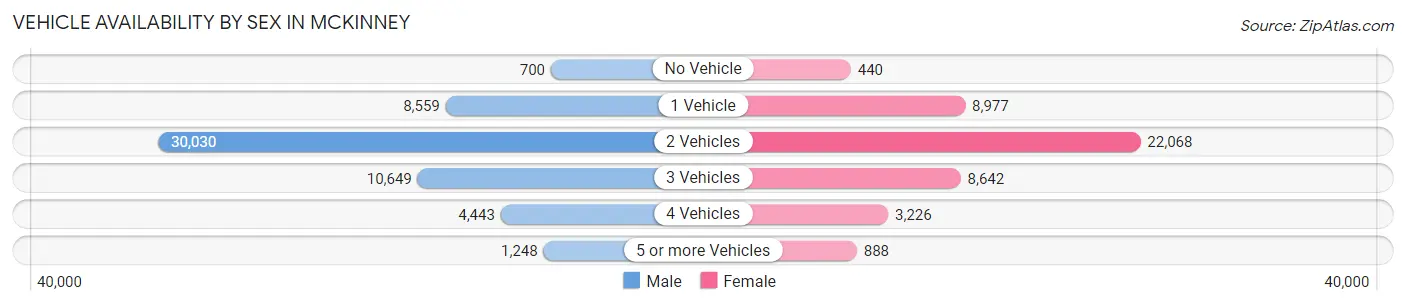
Vehicle Availability by Sex in Mckinney
The most prevalent vehicle ownership categories in Mckinney are males with 2 vehicles (30,030, accounting for 54.0%) and females with 2 vehicles (22,068, making up 67.9%).
| Vehicles Available | Male | Female |
| No Vehicle | 700 (1.3%) | 440 (1.0%) |
| 1 Vehicle | 8,559 (15.4%) | 8,977 (20.3%) |
| 2 Vehicles | 30,030 (54.0%) | 22,068 (49.9%) |
| 3 Vehicles | 10,649 (19.1%) | 8,642 (19.5%) |
| 4 Vehicles | 4,443 (8.0%) | 3,226 (7.3%) |
| 5 or more Vehicles | 1,248 (2.2%) | 888 (2.0%) |
| Total | 55,629 (100.0%) | 44,241 (100.0%) |
Commute Time in Mckinney
The most frequently occuring commute durations in Mckinney are 15 to 19 minutes (13,162 commuters, 16.2%), 30 to 34 minutes (11,869 commuters, 14.6%), and 20 to 24 minutes (11,036 commuters, 13.6%).
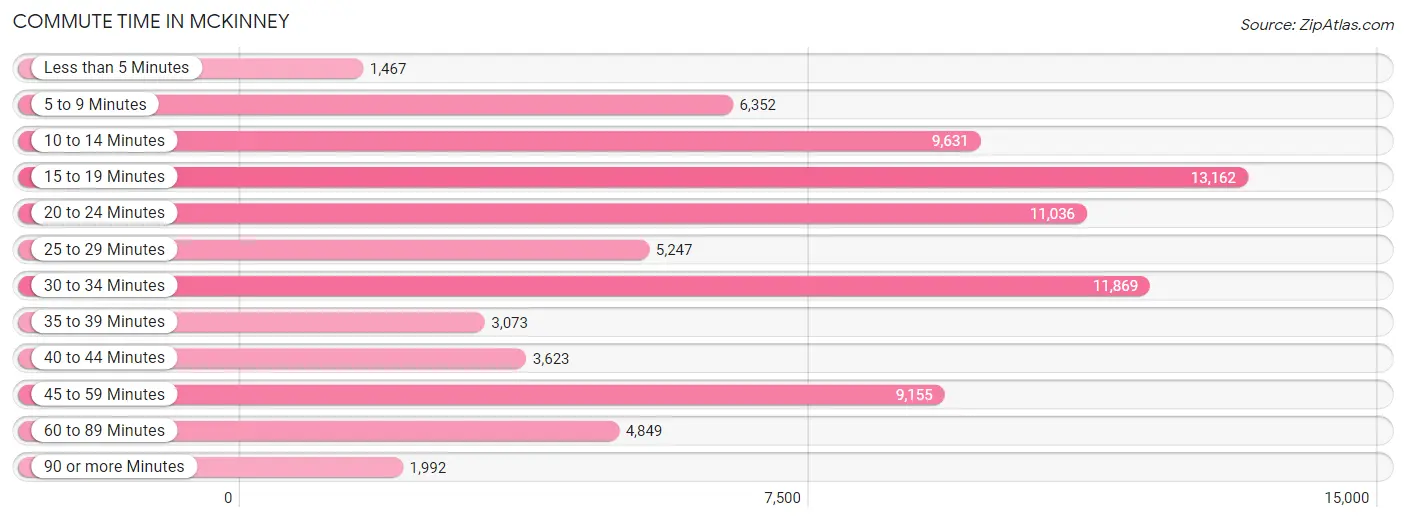
| Commute Time | # Commuters | % Commuters |
| Less than 5 Minutes | 1,467 | 1.8% |
| 5 to 9 Minutes | 6,352 | 7.8% |
| 10 to 14 Minutes | 9,631 | 11.8% |
| 15 to 19 Minutes | 13,162 | 16.2% |
| 20 to 24 Minutes | 11,036 | 13.6% |
| 25 to 29 Minutes | 5,247 | 6.4% |
| 30 to 34 Minutes | 11,869 | 14.6% |
| 35 to 39 Minutes | 3,073 | 3.8% |
| 40 to 44 Minutes | 3,623 | 4.4% |
| 45 to 59 Minutes | 9,155 | 11.2% |
| 60 to 89 Minutes | 4,849 | 5.9% |
| 90 or more Minutes | 1,992 | 2.5% |
Commute Time by Sex in Mckinney
The most common commute times in Mckinney are 30 to 34 minutes (6,997 commuters, 15.4%) for males and 15 to 19 minutes (6,714 commuters, 18.6%) for females.
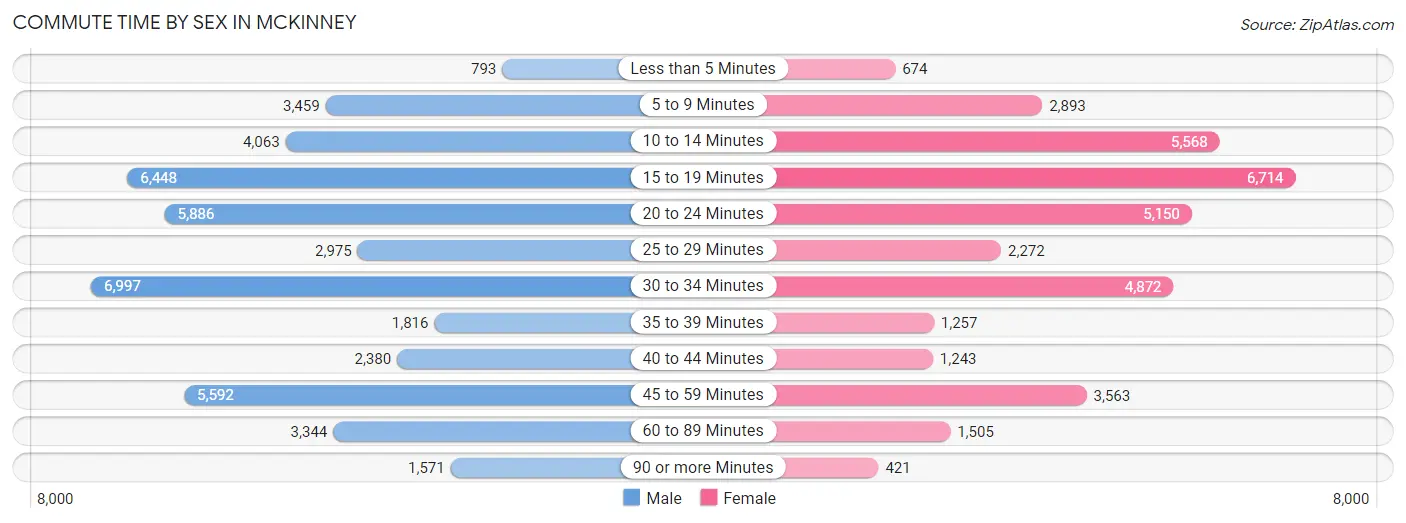
| Commute Time | Male | Female |
| Less than 5 Minutes | 793 (1.8%) | 674 (1.9%) |
| 5 to 9 Minutes | 3,459 (7.6%) | 2,893 (8.0%) |
| 10 to 14 Minutes | 4,063 (9.0%) | 5,568 (15.4%) |
| 15 to 19 Minutes | 6,448 (14.2%) | 6,714 (18.6%) |
| 20 to 24 Minutes | 5,886 (13.0%) | 5,150 (14.2%) |
| 25 to 29 Minutes | 2,975 (6.6%) | 2,272 (6.3%) |
| 30 to 34 Minutes | 6,997 (15.4%) | 4,872 (13.5%) |
| 35 to 39 Minutes | 1,816 (4.0%) | 1,257 (3.5%) |
| 40 to 44 Minutes | 2,380 (5.2%) | 1,243 (3.4%) |
| 45 to 59 Minutes | 5,592 (12.3%) | 3,563 (9.9%) |
| 60 to 89 Minutes | 3,344 (7.4%) | 1,505 (4.2%) |
| 90 or more Minutes | 1,571 (3.5%) | 421 (1.2%) |
Time of Departure to Work by Sex in Mckinney
The most frequent times of departure to work in Mckinney are 7:00 AM to 7:29 AM (7,711, 17.0%) for males and 7:00 AM to 7:29 AM (5,784, 16.0%) for females.
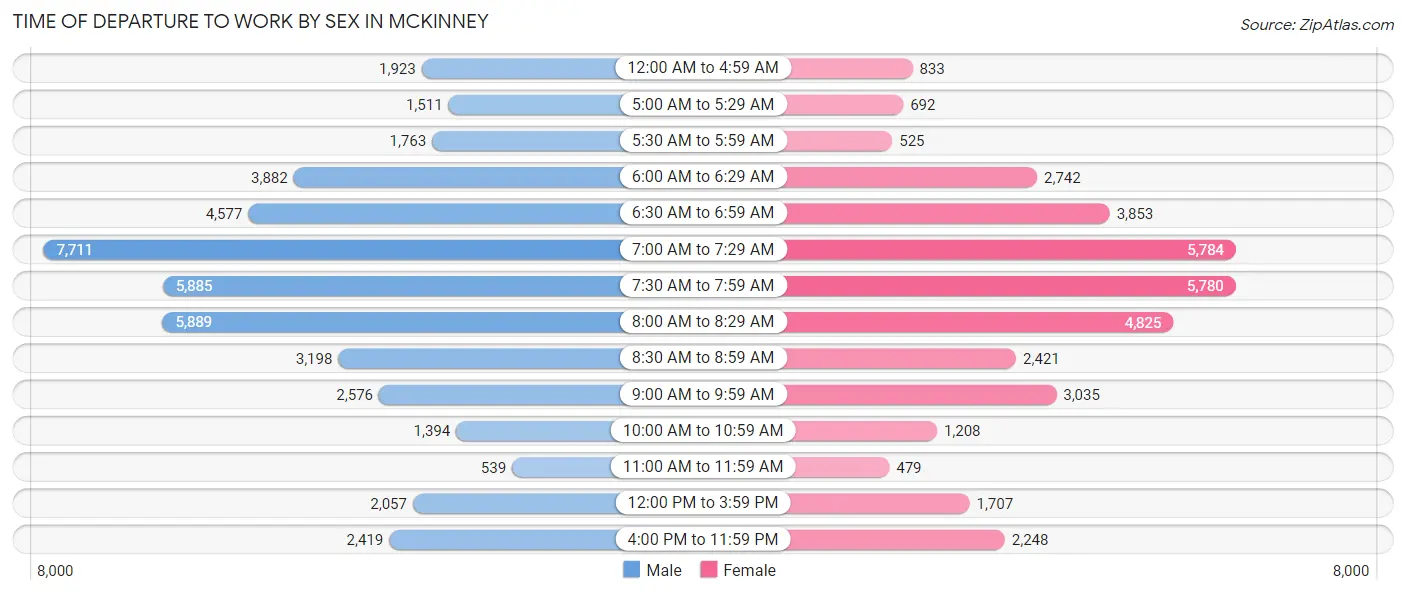
| Time of Departure | Male | Female |
| 12:00 AM to 4:59 AM | 1,923 (4.2%) | 833 (2.3%) |
| 5:00 AM to 5:29 AM | 1,511 (3.3%) | 692 (1.9%) |
| 5:30 AM to 5:59 AM | 1,763 (3.9%) | 525 (1.5%) |
| 6:00 AM to 6:29 AM | 3,882 (8.6%) | 2,742 (7.6%) |
| 6:30 AM to 6:59 AM | 4,577 (10.1%) | 3,853 (10.7%) |
| 7:00 AM to 7:29 AM | 7,711 (17.0%) | 5,784 (16.0%) |
| 7:30 AM to 7:59 AM | 5,885 (13.0%) | 5,780 (16.0%) |
| 8:00 AM to 8:29 AM | 5,889 (13.0%) | 4,825 (13.4%) |
| 8:30 AM to 8:59 AM | 3,198 (7.1%) | 2,421 (6.7%) |
| 9:00 AM to 9:59 AM | 2,576 (5.7%) | 3,035 (8.4%) |
| 10:00 AM to 10:59 AM | 1,394 (3.1%) | 1,208 (3.3%) |
| 11:00 AM to 11:59 AM | 539 (1.2%) | 479 (1.3%) |
| 12:00 PM to 3:59 PM | 2,057 (4.5%) | 1,707 (4.7%) |
| 4:00 PM to 11:59 PM | 2,419 (5.3%) | 2,248 (6.2%) |
| Total | 45,324 (100.0%) | 36,132 (100.0%) |
Housing Occupancy in Mckinney
Occupancy by Ownership in Mckinney
Of the total 68,224 dwellings in Mckinney, owner-occupied units account for 44,244 (64.8%), while renter-occupied units make up 23,980 (35.1%).
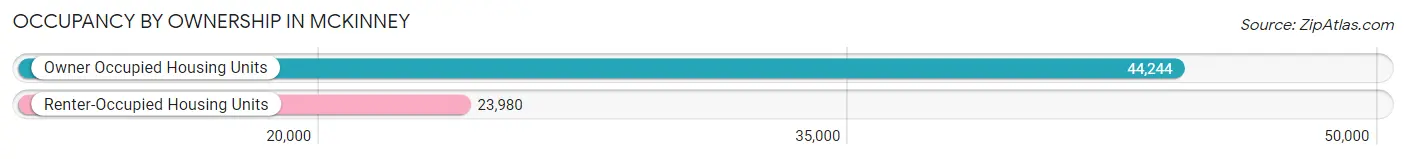
| Occupancy | # Housing Units | % Housing Units |
| Owner Occupied Housing Units | 44,244 | 64.8% |
| Renter-Occupied Housing Units | 23,980 | 35.1% |
| Total Occupied Housing Units | 68,224 | 100.0% |
Occupancy by Household Size in Mckinney
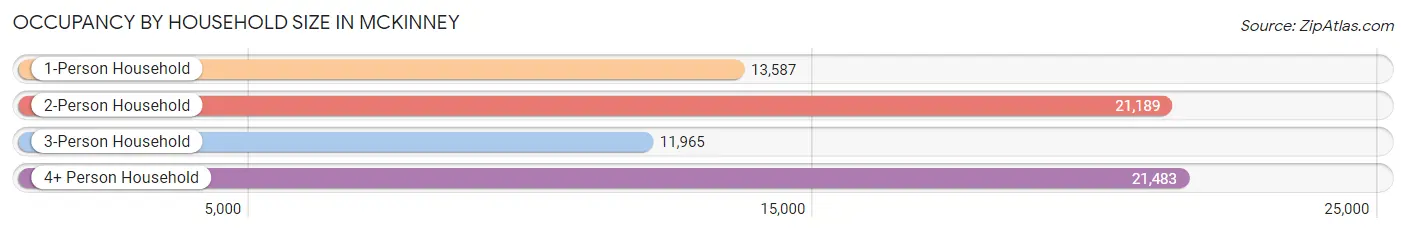
| Household Size | # Housing Units | % Housing Units |
| 1-Person Household | 13,587 | 19.9% |
| 2-Person Household | 21,189 | 31.1% |
| 3-Person Household | 11,965 | 17.5% |
| 4+ Person Household | 21,483 | 31.5% |
| Total Housing Units | 68,224 | 100.0% |
Occupancy by Ownership by Household Size in Mckinney
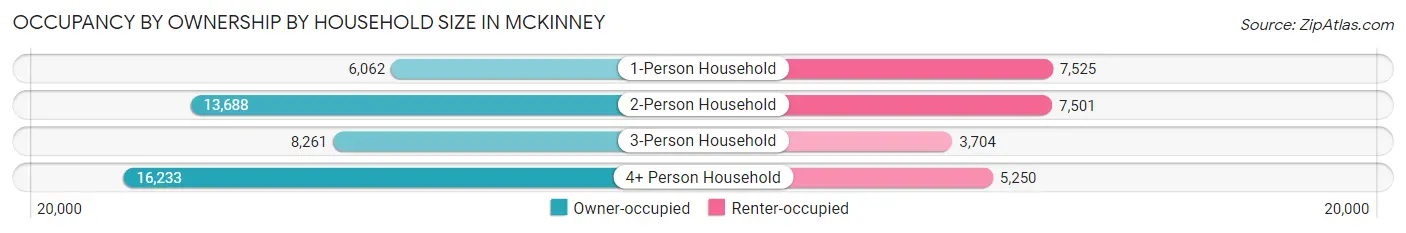
| Household Size | Owner-occupied | Renter-occupied |
| 1-Person Household | 6,062 (44.6%) | 7,525 (55.4%) |
| 2-Person Household | 13,688 (64.6%) | 7,501 (35.4%) |
| 3-Person Household | 8,261 (69.0%) | 3,704 (31.0%) |
| 4+ Person Household | 16,233 (75.6%) | 5,250 (24.4%) |
| Total Housing Units | 44,244 (64.8%) | 23,980 (35.1%) |
Occupancy by Educational Attainment in Mckinney
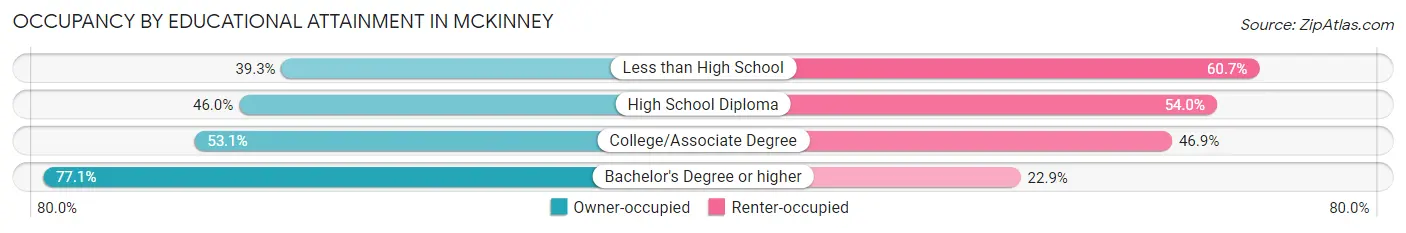
| Household Size | Owner-occupied | Renter-occupied |
| Less than High School | 914 (39.3%) | 1,414 (60.7%) |
| High School Diploma | 4,076 (46.0%) | 4,787 (54.0%) |
| College/Associate Degree | 10,411 (53.1%) | 9,202 (46.9%) |
| Bachelor's Degree or higher | 28,843 (77.1%) | 8,577 (22.9%) |
Occupancy by Age of Householder in Mckinney
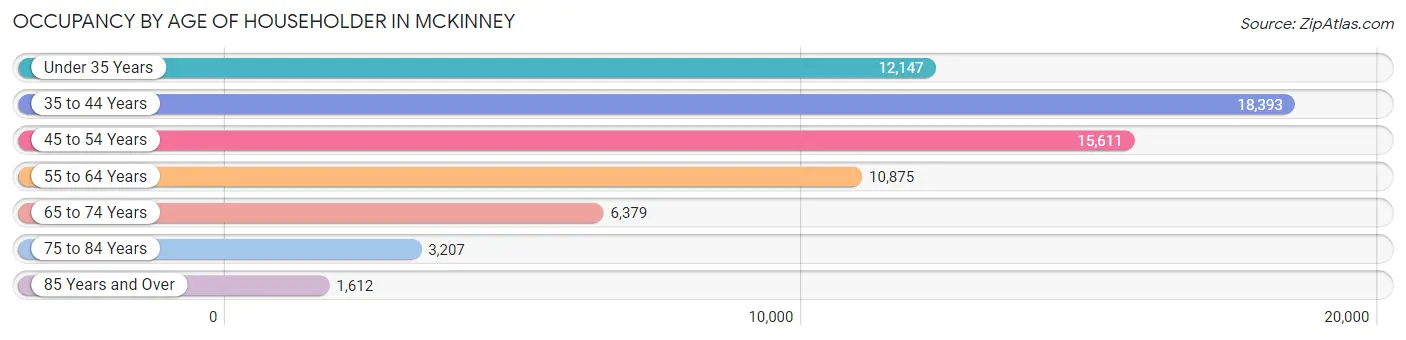
| Age Bracket | # Households | % Households |
| Under 35 Years | 12,147 | 17.8% |
| 35 to 44 Years | 18,393 | 27.0% |
| 45 to 54 Years | 15,611 | 22.9% |
| 55 to 64 Years | 10,875 | 15.9% |
| 65 to 74 Years | 6,379 | 9.3% |
| 75 to 84 Years | 3,207 | 4.7% |
| 85 Years and Over | 1,612 | 2.4% |
| Total | 68,224 | 100.0% |
Housing Finances in Mckinney
Median Income by Occupancy in Mckinney
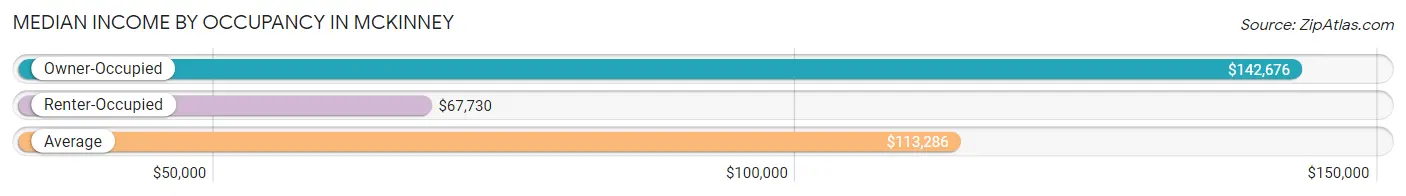
| Occupancy Type | # Households | Median Income |
| Owner-Occupied | 44,244 (64.8%) | $142,676 |
| Renter-Occupied | 23,980 (35.1%) | $67,730 |
| Average | 68,224 (100.0%) | $113,286 |
Occupancy by Householder Income Bracket in Mckinney
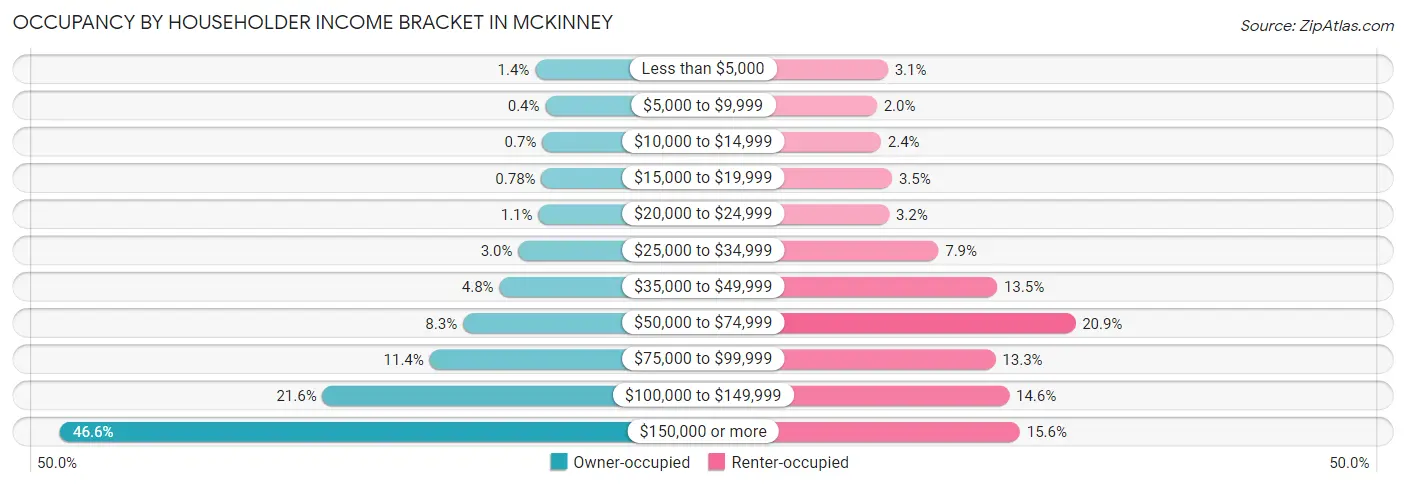
| Income Bracket | Owner-occupied | Renter-occupied |
| Less than $5,000 | 608 (1.4%) | 733 (3.1%) |
| $5,000 to $9,999 | 178 (0.4%) | 485 (2.0%) |
| $10,000 to $14,999 | 309 (0.7%) | 579 (2.4%) |
| $15,000 to $19,999 | 347 (0.8%) | 832 (3.5%) |
| $20,000 to $24,999 | 472 (1.1%) | 763 (3.2%) |
| $25,000 to $34,999 | 1,318 (3.0%) | 1,890 (7.9%) |
| $35,000 to $49,999 | 2,113 (4.8%) | 3,230 (13.5%) |
| $50,000 to $74,999 | 3,652 (8.3%) | 5,017 (20.9%) |
| $75,000 to $99,999 | 5,056 (11.4%) | 3,195 (13.3%) |
| $100,000 to $149,999 | 9,571 (21.6%) | 3,505 (14.6%) |
| $150,000 or more | 20,620 (46.6%) | 3,751 (15.6%) |
| Total | 44,244 (100.0%) | 23,980 (100.0%) |
Monthly Housing Cost Tiers in Mckinney
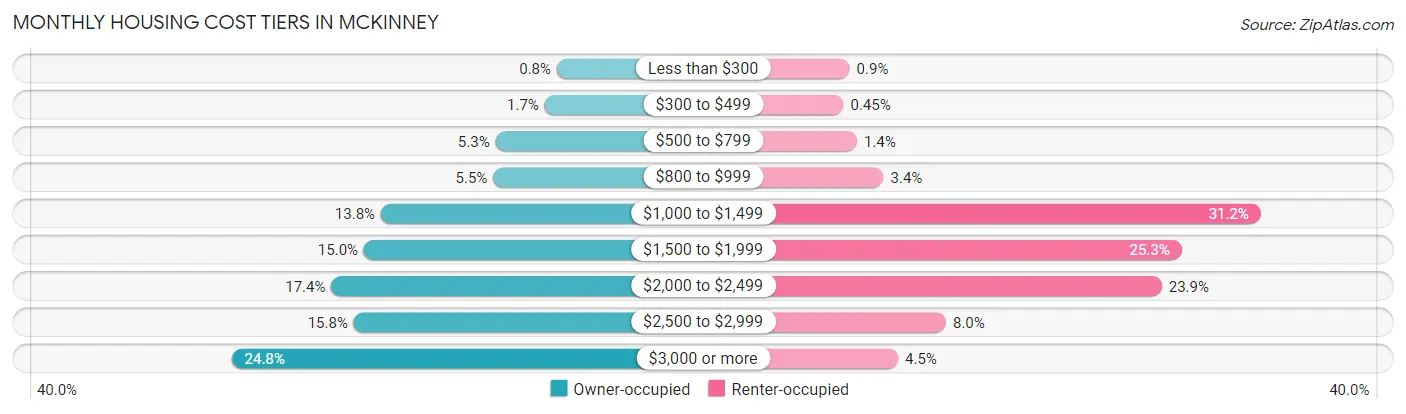
| Monthly Cost | Owner-occupied | Renter-occupied |
| Less than $300 | 355 (0.8%) | 216 (0.9%) |
| $300 to $499 | 752 (1.7%) | 109 (0.4%) |
| $500 to $799 | 2,354 (5.3%) | 345 (1.4%) |
| $800 to $999 | 2,430 (5.5%) | 816 (3.4%) |
| $1,000 to $1,499 | 6,089 (13.8%) | 7,475 (31.2%) |
| $1,500 to $1,999 | 6,641 (15.0%) | 6,077 (25.3%) |
| $2,000 to $2,499 | 7,702 (17.4%) | 5,730 (23.9%) |
| $2,500 to $2,999 | 6,971 (15.8%) | 1,919 (8.0%) |
| $3,000 or more | 10,950 (24.7%) | 1,072 (4.5%) |
| Total | 44,244 (100.0%) | 23,980 (100.0%) |
Physical Housing Characteristics in Mckinney
Housing Structures in Mckinney
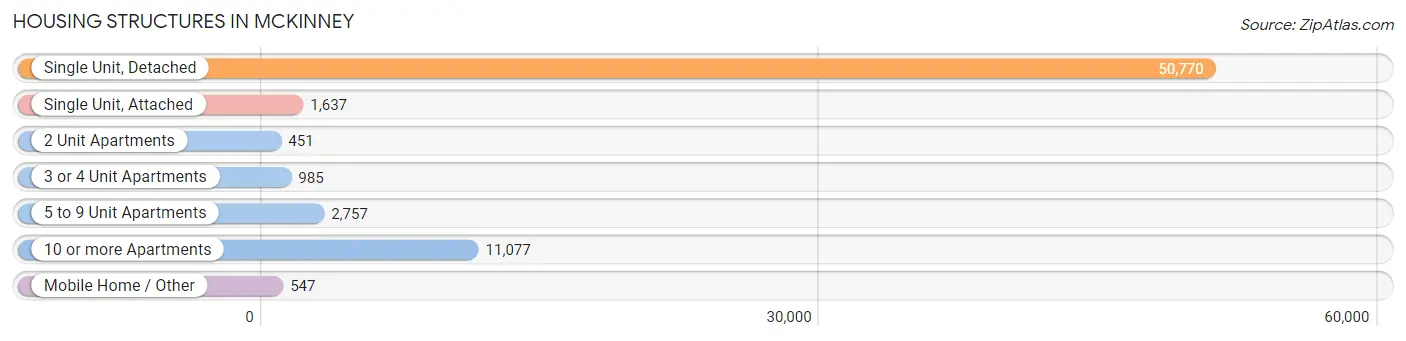
| Structure Type | # Housing Units | % Housing Units |
| Single Unit, Detached | 50,770 | 74.4% |
| Single Unit, Attached | 1,637 | 2.4% |
| 2 Unit Apartments | 451 | 0.7% |
| 3 or 4 Unit Apartments | 985 | 1.4% |
| 5 to 9 Unit Apartments | 2,757 | 4.0% |
| 10 or more Apartments | 11,077 | 16.2% |
| Mobile Home / Other | 547 | 0.8% |
| Total | 68,224 | 100.0% |
Housing Structures by Occupancy in Mckinney
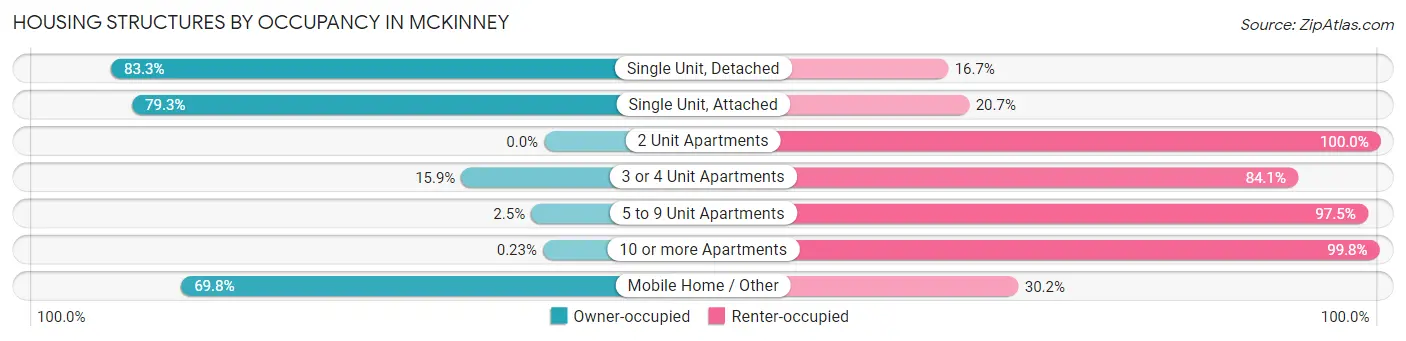
| Structure Type | Owner-occupied | Renter-occupied |
| Single Unit, Detached | 42,313 (83.3%) | 8,457 (16.7%) |
| Single Unit, Attached | 1,298 (79.3%) | 339 (20.7%) |
| 2 Unit Apartments | 0 (0.0%) | 451 (100.0%) |
| 3 or 4 Unit Apartments | 157 (15.9%) | 828 (84.1%) |
| 5 to 9 Unit Apartments | 69 (2.5%) | 2,688 (97.5%) |
| 10 or more Apartments | 25 (0.2%) | 11,052 (99.8%) |
| Mobile Home / Other | 382 (69.8%) | 165 (30.2%) |
| Total | 44,244 (64.8%) | 23,980 (35.1%) |
Housing Structures by Number of Rooms in Mckinney
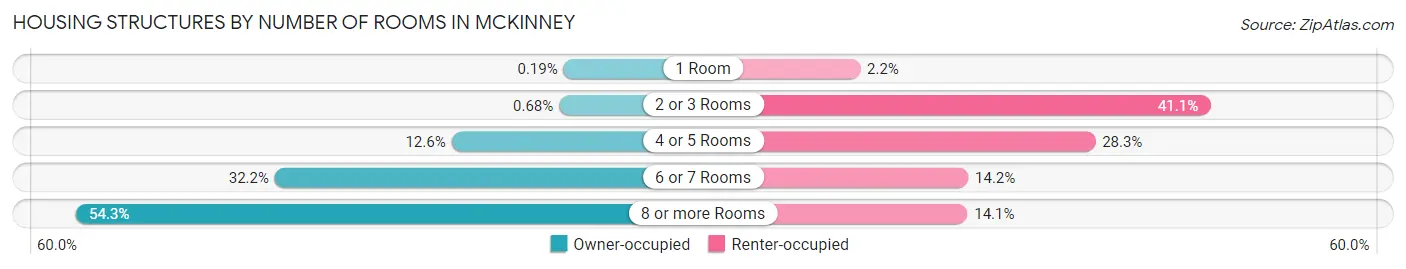
| Number of Rooms | Owner-occupied | Renter-occupied |
| 1 Room | 82 (0.2%) | 537 (2.2%) |
| 2 or 3 Rooms | 303 (0.7%) | 9,848 (41.1%) |
| 4 or 5 Rooms | 5,584 (12.6%) | 6,793 (28.3%) |
| 6 or 7 Rooms | 14,259 (32.2%) | 3,412 (14.2%) |
| 8 or more Rooms | 24,016 (54.3%) | 3,390 (14.1%) |
| Total | 44,244 (100.0%) | 23,980 (100.0%) |
Housing Structure by Heating Type in Mckinney
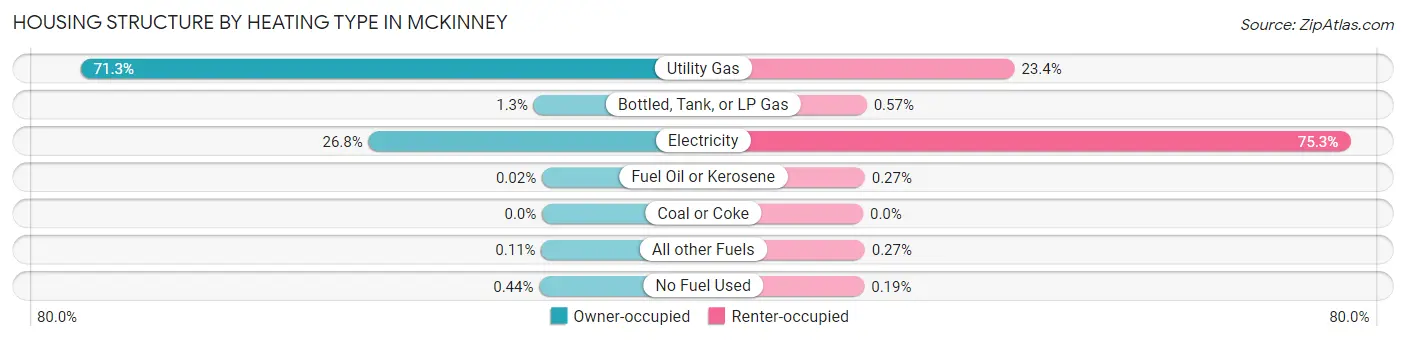
| Heating Type | Owner-occupied | Renter-occupied |
| Utility Gas | 31,561 (71.3%) | 5,614 (23.4%) |
| Bottled, Tank, or LP Gas | 560 (1.3%) | 137 (0.6%) |
| Electricity | 11,872 (26.8%) | 18,055 (75.3%) |
| Fuel Oil or Kerosene | 9 (0.0%) | 64 (0.3%) |
| Coal or Coke | 0 (0.0%) | 0 (0.0%) |
| All other Fuels | 49 (0.1%) | 64 (0.3%) |
| No Fuel Used | 193 (0.4%) | 46 (0.2%) |
| Total | 44,244 (100.0%) | 23,980 (100.0%) |
Household Vehicle Usage in Mckinney
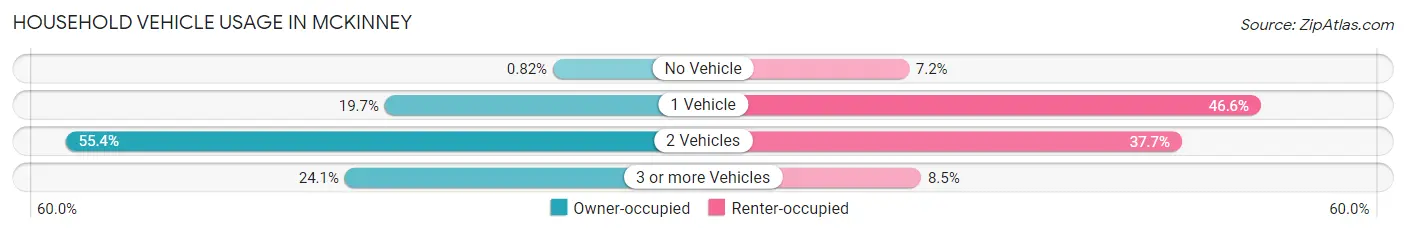
| Vehicles per Household | Owner-occupied | Renter-occupied |
| No Vehicle | 363 (0.8%) | 1,716 (7.2%) |
| 1 Vehicle | 8,693 (19.7%) | 11,172 (46.6%) |
| 2 Vehicles | 24,512 (55.4%) | 9,048 (37.7%) |
| 3 or more Vehicles | 10,676 (24.1%) | 2,044 (8.5%) |
| Total | 44,244 (100.0%) | 23,980 (100.0%) |
Real Estate & Mortgages in Mckinney
Real Estate and Mortgage Overview in Mckinney
| Characteristic | Without Mortgage | With Mortgage |
| Housing Units | 11,055 | 33,189 |
| Median Property Value | $375,800 | $409,000 |
| Median Household Income | $96,388 | $17,230 |
| Monthly Housing Costs | $1,008 | $10,860 |
| Real Estate Taxes | $6,420 | $610 |
Property Value by Mortgage Status in Mckinney
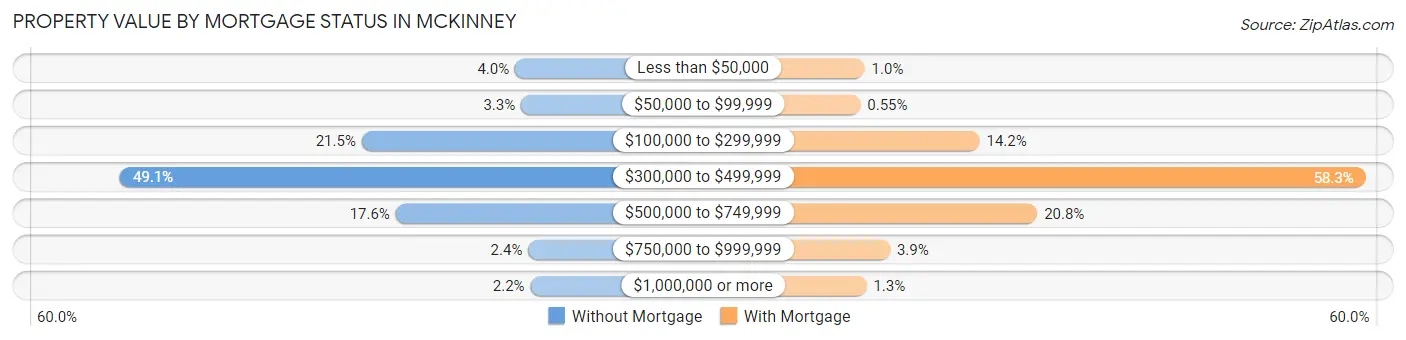
| Property Value | Without Mortgage | With Mortgage |
| Less than $50,000 | 437 (4.0%) | 346 (1.0%) |
| $50,000 to $99,999 | 360 (3.3%) | 181 (0.5%) |
| $100,000 to $299,999 | 2,373 (21.5%) | 4,703 (14.2%) |
| $300,000 to $499,999 | 5,428 (49.1%) | 19,350 (58.3%) |
| $500,000 to $749,999 | 1,945 (17.6%) | 6,891 (20.8%) |
| $750,000 to $999,999 | 270 (2.4%) | 1,304 (3.9%) |
| $1,000,000 or more | 242 (2.2%) | 414 (1.3%) |
| Total | 11,055 (100.0%) | 33,189 (100.0%) |
Household Income by Mortgage Status in Mckinney
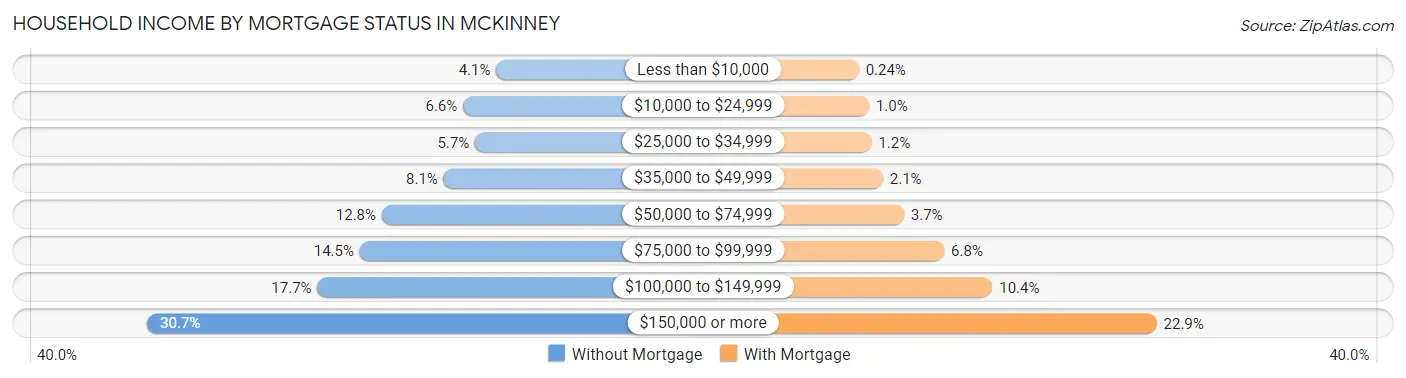
| Household Income | Without Mortgage | With Mortgage |
| Less than $10,000 | 449 (4.1%) | 80 (0.2%) |
| $10,000 to $24,999 | 728 (6.6%) | 337 (1.0%) |
| $25,000 to $34,999 | 628 (5.7%) | 400 (1.2%) |
| $35,000 to $49,999 | 892 (8.1%) | 690 (2.1%) |
| $50,000 to $74,999 | 1,413 (12.8%) | 1,221 (3.7%) |
| $75,000 to $99,999 | 1,599 (14.5%) | 2,239 (6.8%) |
| $100,000 to $149,999 | 1,956 (17.7%) | 3,457 (10.4%) |
| $150,000 or more | 3,390 (30.7%) | 7,615 (22.9%) |
| Total | 11,055 (100.0%) | 33,189 (100.0%) |
Property Value to Household Income Ratio in Mckinney
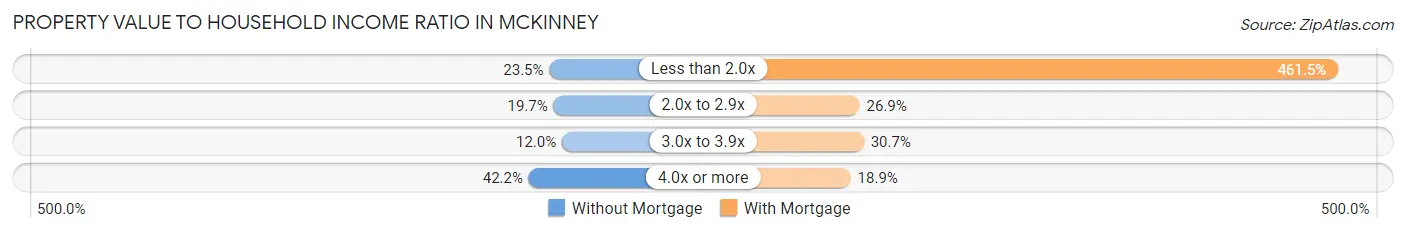
| Value-to-Income Ratio | Without Mortgage | With Mortgage |
| Less than 2.0x | 2,595 (23.5%) | 153,158 (461.5%) |
| 2.0x to 2.9x | 2,178 (19.7%) | 8,920 (26.9%) |
| 3.0x to 3.9x | 1,325 (12.0%) | 10,172 (30.6%) |
| 4.0x or more | 4,663 (42.2%) | 6,257 (18.9%) |
| Total | 11,055 (100.0%) | 33,189 (100.0%) |
Real Estate Taxes by Mortgage Status in Mckinney
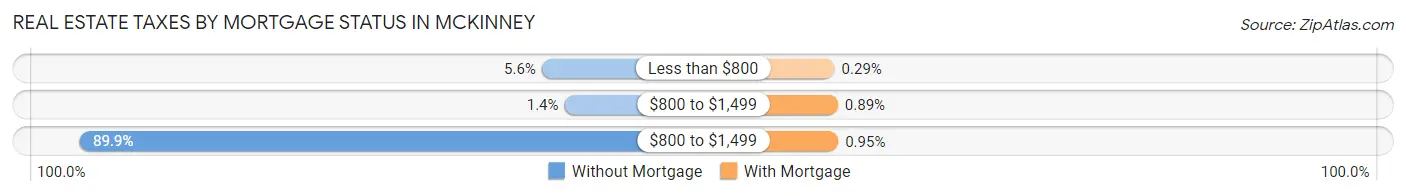
| Property Taxes | Without Mortgage | With Mortgage |
| Less than $800 | 615 (5.6%) | 95 (0.3%) |
| $800 to $1,499 | 156 (1.4%) | 294 (0.9%) |
| $800 to $1,499 | 9,934 (89.9%) | 314 (0.9%) |
| Total | 11,055 (100.0%) | 33,189 (100.0%) |
Health & Disability in Mckinney
Health Insurance Coverage by Age in Mckinney
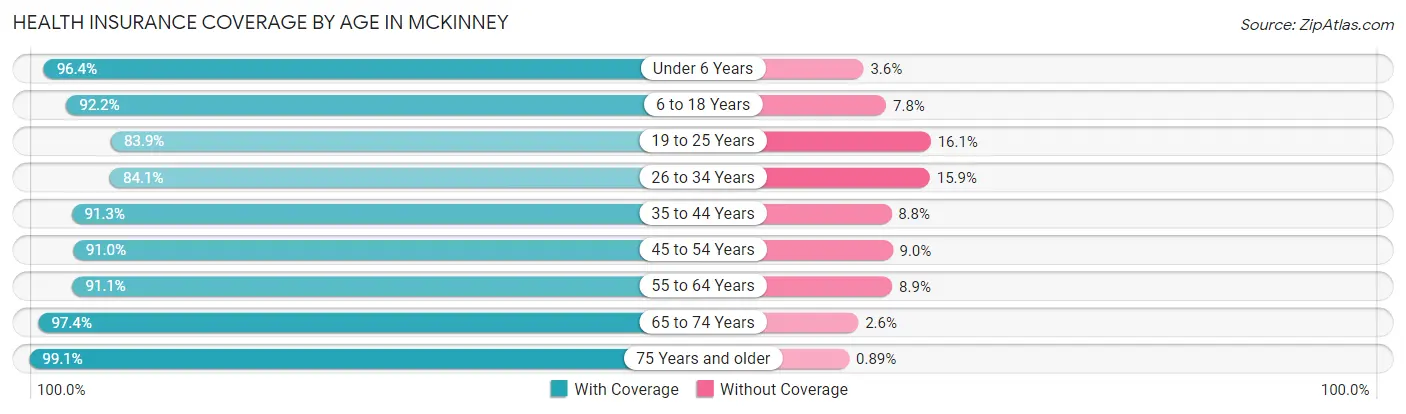
| Age Bracket | With Coverage | Without Coverage |
| Under 6 Years | 14,176 (96.4%) | 526 (3.6%) |
| 6 to 18 Years | 39,449 (92.2%) | 3,335 (7.8%) |
| 19 to 25 Years | 12,765 (83.9%) | 2,451 (16.1%) |
| 26 to 34 Years | 16,006 (84.1%) | 3,035 (15.9%) |
| 35 to 44 Years | 32,013 (91.2%) | 3,070 (8.7%) |
| 45 to 54 Years | 25,725 (91.0%) | 2,540 (9.0%) |
| 55 to 64 Years | 17,621 (91.1%) | 1,728 (8.9%) |
| 65 to 74 Years | 11,611 (97.4%) | 310 (2.6%) |
| 75 Years and older | 8,133 (99.1%) | 73 (0.9%) |
| Total | 177,499 (91.2%) | 17,068 (8.8%) |
Health Insurance Coverage by Citizenship Status in Mckinney
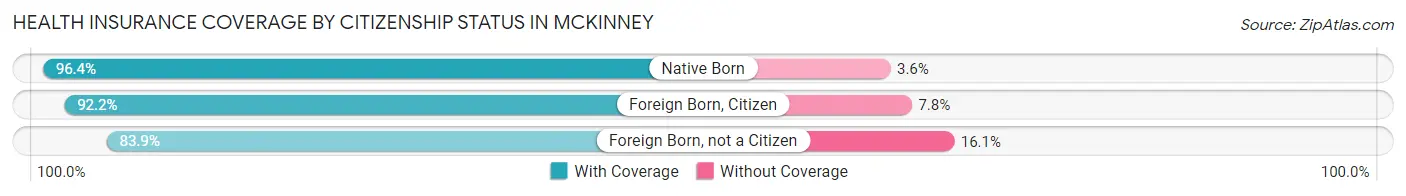
| Citizenship Status | With Coverage | Without Coverage |
| Native Born | 14,176 (96.4%) | 526 (3.6%) |
| Foreign Born, Citizen | 39,449 (92.2%) | 3,335 (7.8%) |
| Foreign Born, not a Citizen | 12,765 (83.9%) | 2,451 (16.1%) |
Health Insurance Coverage by Household Income in Mckinney
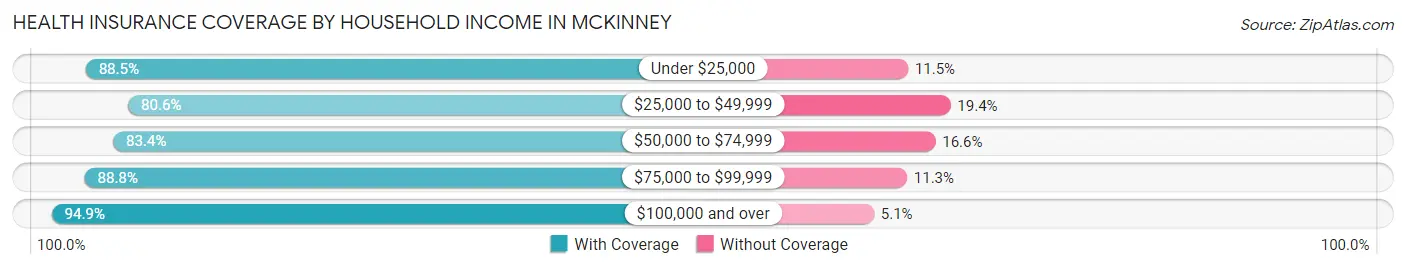
| Household Income | With Coverage | Without Coverage |
| Under $25,000 | 8,826 (88.5%) | 1,142 (11.5%) |
| $25,000 to $49,999 | 15,377 (80.6%) | 3,704 (19.4%) |
| $50,000 to $74,999 | 17,856 (83.4%) | 3,549 (16.6%) |
| $75,000 to $99,999 | 19,470 (88.7%) | 2,467 (11.3%) |
| $100,000 and over | 115,837 (94.9%) | 6,189 (5.1%) |
Public vs Private Health Insurance Coverage by Age in Mckinney
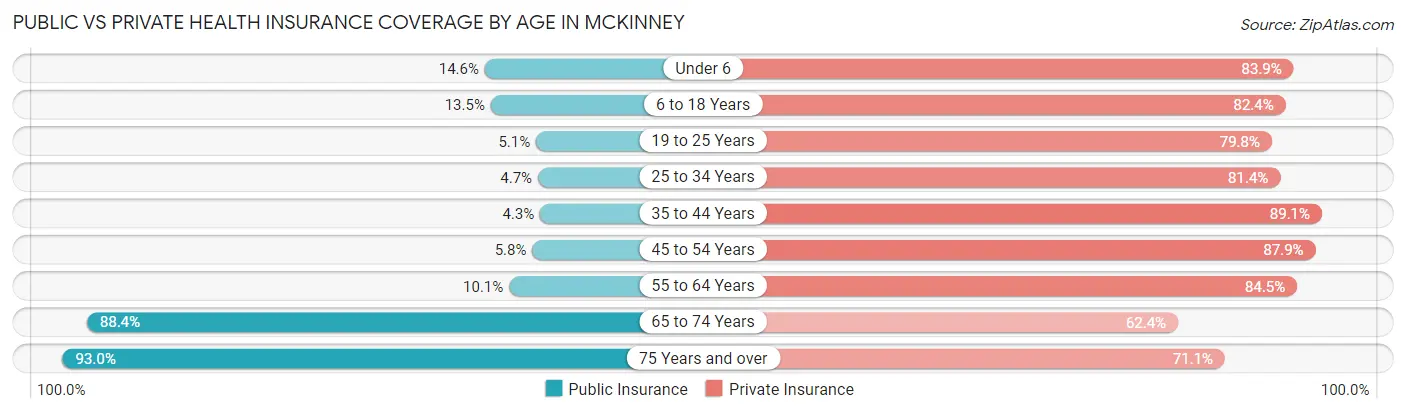
| Age Bracket | Public Insurance | Private Insurance |
| Under 6 | 2,144 (14.6%) | 12,329 (83.9%) |
| 6 to 18 Years | 5,768 (13.5%) | 35,236 (82.4%) |
| 19 to 25 Years | 772 (5.1%) | 12,143 (79.8%) |
| 25 to 34 Years | 899 (4.7%) | 15,491 (81.4%) |
| 35 to 44 Years | 1,517 (4.3%) | 31,258 (89.1%) |
| 45 to 54 Years | 1,628 (5.8%) | 24,849 (87.9%) |
| 55 to 64 Years | 1,948 (10.1%) | 16,352 (84.5%) |
| 65 to 74 Years | 10,543 (88.4%) | 7,438 (62.4%) |
| 75 Years and over | 7,628 (93.0%) | 5,835 (71.1%) |
| Total | 32,847 (16.9%) | 160,931 (82.7%) |
Disability Status by Sex by Age in Mckinney
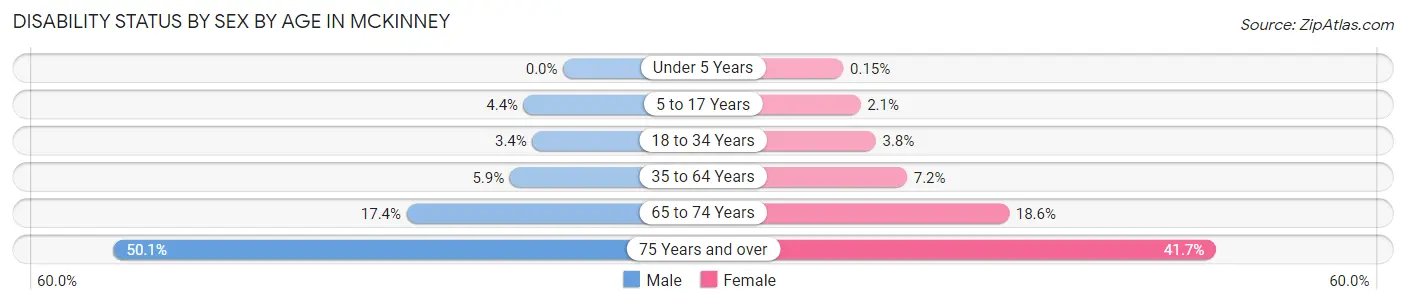
| Age Bracket | Male | Female |
| Under 5 Years | 0 (0.0%) | 9 (0.2%) |
| 5 to 17 Years | 957 (4.4%) | 413 (2.1%) |
| 18 to 34 Years | 631 (3.4%) | 728 (3.8%) |
| 35 to 64 Years | 2,505 (5.9%) | 2,937 (7.2%) |
| 65 to 74 Years | 951 (17.4%) | 1,202 (18.6%) |
| 75 Years and over | 1,688 (50.1%) | 2,016 (41.7%) |
Disability Class by Sex by Age in Mckinney
Disability Class: Hearing Difficulty
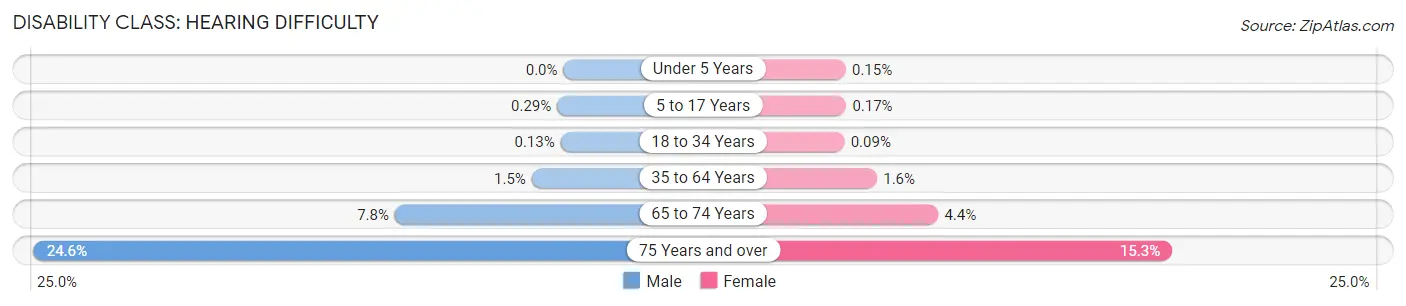
| Age Bracket | Male | Female |
| Under 5 Years | 0 (0.0%) | 9 (0.2%) |
| 5 to 17 Years | 63 (0.3%) | 35 (0.2%) |
| 18 to 34 Years | 24 (0.1%) | 18 (0.1%) |
| 35 to 64 Years | 618 (1.5%) | 650 (1.6%) |
| 65 to 74 Years | 427 (7.8%) | 287 (4.4%) |
| 75 Years and over | 828 (24.6%) | 741 (15.3%) |
Disability Class: Vision Difficulty
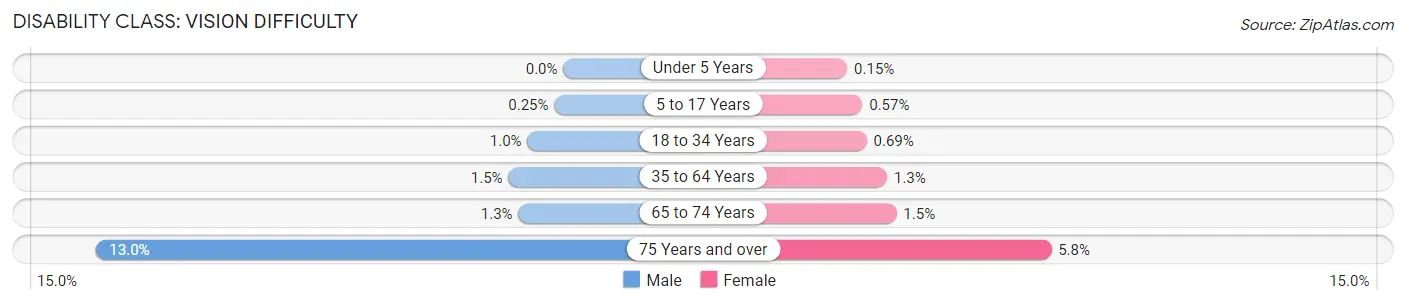
| Age Bracket | Male | Female |
| Under 5 Years | 0 (0.0%) | 9 (0.2%) |
| 5 to 17 Years | 54 (0.3%) | 115 (0.6%) |
| 18 to 34 Years | 184 (1.0%) | 133 (0.7%) |
| 35 to 64 Years | 645 (1.5%) | 511 (1.3%) |
| 65 to 74 Years | 68 (1.3%) | 98 (1.5%) |
| 75 Years and over | 438 (13.0%) | 282 (5.8%) |
Disability Class: Cognitive Difficulty
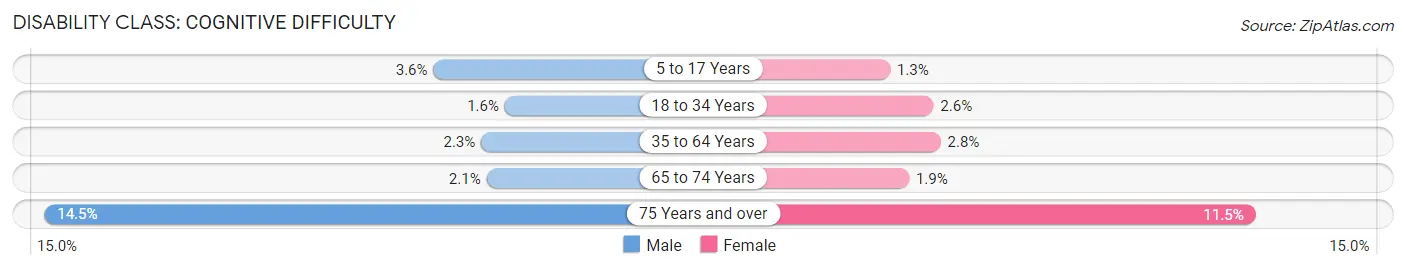
| Age Bracket | Male | Female |
| 5 to 17 Years | 790 (3.6%) | 270 (1.3%) |
| 18 to 34 Years | 301 (1.6%) | 493 (2.5%) |
| 35 to 64 Years | 965 (2.3%) | 1,115 (2.8%) |
| 65 to 74 Years | 117 (2.1%) | 121 (1.9%) |
| 75 Years and over | 487 (14.4%) | 557 (11.5%) |
Disability Class: Ambulatory Difficulty
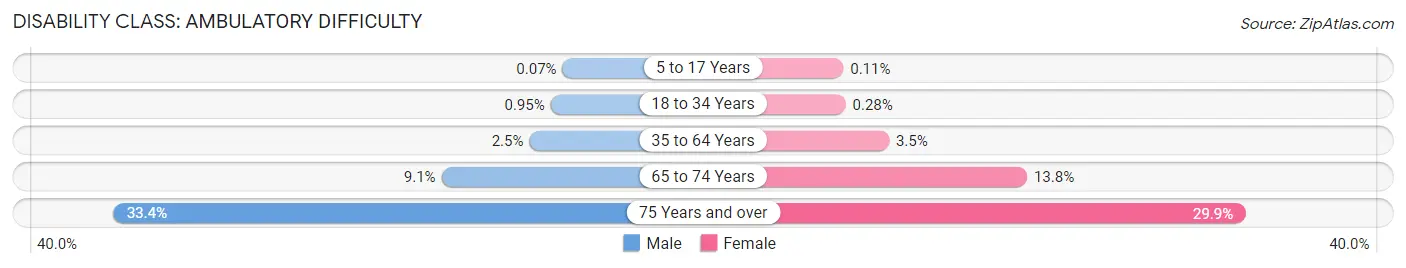
| Age Bracket | Male | Female |
| 5 to 17 Years | 16 (0.1%) | 23 (0.1%) |
| 18 to 34 Years | 176 (0.9%) | 55 (0.3%) |
| 35 to 64 Years | 1,065 (2.5%) | 1,421 (3.5%) |
| 65 to 74 Years | 494 (9.0%) | 889 (13.8%) |
| 75 Years and over | 1,125 (33.4%) | 1,448 (29.9%) |
Disability Class: Self-Care Difficulty
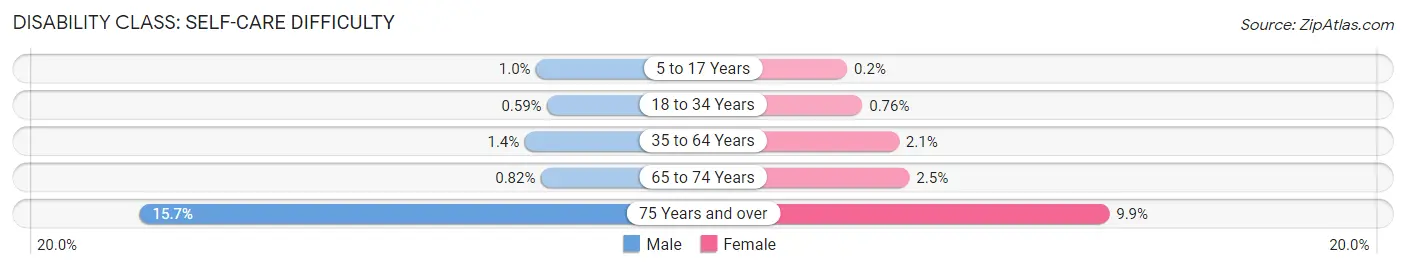
| Age Bracket | Male | Female |
| 5 to 17 Years | 219 (1.0%) | 40 (0.2%) |
| 18 to 34 Years | 108 (0.6%) | 147 (0.8%) |
| 35 to 64 Years | 597 (1.4%) | 858 (2.1%) |
| 65 to 74 Years | 45 (0.8%) | 162 (2.5%) |
| 75 Years and over | 530 (15.7%) | 480 (9.9%) |
Technology Access in Mckinney
Computing Device Access in Mckinney
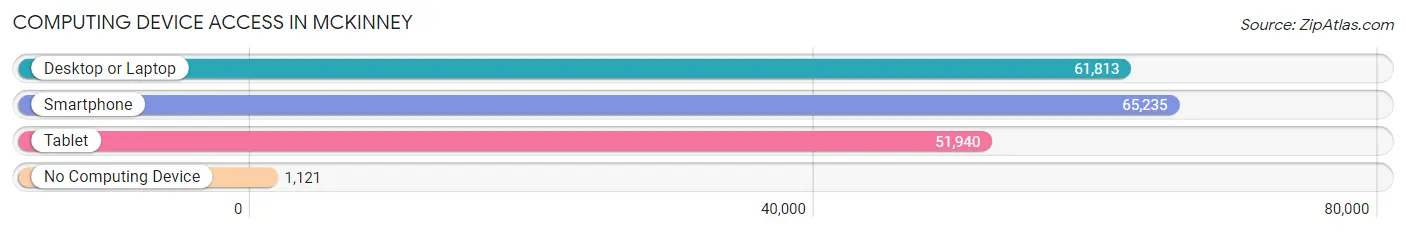
| Device Type | # Households | % Households |
| Desktop or Laptop | 61,813 | 90.6% |
| Smartphone | 65,235 | 95.6% |
| Tablet | 51,940 | 76.1% |
| No Computing Device | 1,121 | 1.6% |
| Total | 68,224 | 100.0% |
Internet Access in Mckinney
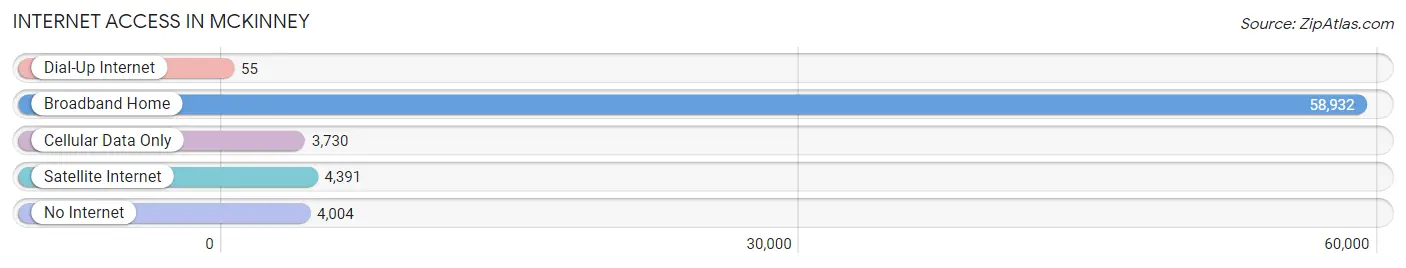
| Internet Type | # Households | % Households |
| Dial-Up Internet | 55 | 0.1% |
| Broadband Home | 58,932 | 86.4% |
| Cellular Data Only | 3,730 | 5.5% |
| Satellite Internet | 4,391 | 6.4% |
| No Internet | 4,004 | 5.9% |
| Total | 68,224 | 100.0% |
Mckinney Summary
McKinney, Texas is a city located in Collin County, Texas, United States. It is the county seat of Collin County and is part of the Dallas-Fort Worth-Arlington metropolitan area. As of the 2010 census, the city had a population of 131,117, making it the 19th-most populous city in Texas. It is the second-fastest growing city in the United States, and the fastest growing city in the state of Texas.
History
McKinney was founded in 1848 by William Davis, who named the city after his grandfather, Collin McKinney. The city was incorporated in 1858 and was designated as the county seat of Collin County. The city grew rapidly in the late 19th century, and by 1900, it had a population of 1,636.
In the early 20th century, the city experienced a period of growth and development, with the construction of the Houston and Texas Central Railway in 1904. The city also became a center for cotton production and processing, and by the 1920s, it had become a major center for the cotton industry.
In the 1950s, the city experienced a period of rapid growth, with the population increasing from 4,000 to more than 10,000. This growth was largely due to the expansion of the Dallas-Fort Worth metropolitan area.
Geography
McKinney is located in Collin County, Texas, about 30 miles north of Dallas. It is situated on the eastern edge of the Dallas-Fort Worth metropolitan area. The city is located at the intersection of U.S. Highway 75 and State Highway 121.
The city has a total area of 62.9 square miles, of which 62.2 square miles is land and 0.7 square miles is water. The city is located in the Blackland Prairie region of Texas, and is characterized by rolling hills and flat plains.
Economy
McKinney has a diverse economy, with a variety of industries represented. The city is home to a number of corporate headquarters, including Raytheon, Encore Wire Corporation, and Torchmark Corporation. The city is also home to a number of manufacturing and distribution centers, including those of PepsiCo, Frito-Lay, and Dr Pepper Snapple Group.
The city is also home to a number of healthcare providers, including Baylor Scott & White Medical Center, Medical City McKinney, and Texas Health Presbyterian Hospital.
Demographics
As of the 2010 census, the city had a population of 131,117. The racial makeup of the city was 75.3% White, 11.2% African American, 0.7% Native American, 4.3% Asian, 0.1% Pacific Islander, 5.7% from other races, and 2.9% from two or more races. Hispanic or Latino of any race were 18.5% of the population.
The median income for a household in the city was $68,945, and the median income for a family was $80,856. The per capita income for the city was $32,945. About 8.2% of families and 10.7% of the population were below the poverty line, including 15.2% of those under age 18 and 8.2% of those age 65 or over.
Common Questions
What is Per Capita Income in Mckinney?
Per Capita income in Mckinney is $49,773.
What is the Median Family Income in Mckinney?
Median Family Income in Mckinney is $130,641.
What is the Median Household income in Mckinney?
Median Household Income in Mckinney is $113,286.
What is Income or Wage Gap in Mckinney?
Income or Wage Gap in Mckinney is 42.0%.
Women in Mckinney earn 58.0 cents for every dollar earned by a man.
What is Family Income Deficit in Mckinney?
Family Income Deficit in Mckinney is $10,763.
Families that are below poverty line in Mckinney earn $10,763 less on average than the poverty threshold level.
What is Inequality or Gini Index in Mckinney?
Inequality or Gini Index in Mckinney is 0.42.
What is the Total Population of Mckinney?
Total Population of Mckinney is 196,160.
What is the Total Male Population of Mckinney?
Total Male Population of Mckinney is 98,395.
What is the Total Female Population of Mckinney?
Total Female Population of Mckinney is 97,765.
What is the Ratio of Males per 100 Females in Mckinney?
There are 100.64 Males per 100 Females in Mckinney.
What is the Ratio of Females per 100 Males in Mckinney?
There are 99.36 Females per 100 Males in Mckinney.
What is the Median Population Age in Mckinney?
Median Population Age in Mckinney is 36.9 Years.
What is the Average Family Size in Mckinney
Average Family Size in Mckinney is 3.3 People.
What is the Average Household Size in Mckinney
Average Household Size in Mckinney is 2.9 People.
How Large is the Labor Force in Mckinney?
There are 104,652 People in the Labor Forcein in Mckinney.
What is the Percentage of People in the Labor Force in Mckinney?
70.8% of People are in the Labor Force in Mckinney.
What is the Unemployment Rate in Mckinney?
Unemployment Rate in Mckinney is 3.7%.