Schofield Barracks, HI Map & Demographics
Schofield Barracks Map
Schofield Barracks Overview
$28,572
PER CAPITA INCOME
$70,822
AVG FAMILY INCOME
$69,755
AVG HOUSEHOLD INCOME
12.7%
WAGE / INCOME GAP [ % ]
87.3¢/ $1
WAGE / INCOME GAP [ $ ]
0.35
INEQUALITY / GINI INDEX
18,133
TOTAL POPULATION
11,565
MALE POPULATION
6,568
FEMALE POPULATION
176.08
MALES / 100 FEMALES
56.79
FEMALES / 100 MALES
22.6
MEDIAN AGE
3.4
AVG FAMILY SIZE
3.1
AVG HOUSEHOLD SIZE
11,038
LABOR FORCE [ PEOPLE ]
85.0%
PERCENT IN LABOR FORCE
8.9%
UNEMPLOYMENT RATE
Schofield Barracks Zip Codes
Schofield Barracks Area Codes
Income in Schofield Barracks
Income Overview in Schofield Barracks
Per Capita Income in Schofield Barracks is $28,572, while median incomes of families and households are $70,822 and $69,755 respectively.
| Characteristic | Number | Measure |
| Per Capita Income | 18,133 | $28,572 |
| Median Family Income | 3,597 | $70,822 |
| Mean Family Income | 3,597 | $78,320 |
| Median Household Income | 4,213 | $69,755 |
| Mean Household Income | 4,213 | $85,106 |
| Income Deficit | 3,597 | $0 |
| Wage / Income Gap (%) | 18,133 | 12.69% |
| Wage / Income Gap ($) | 18,133 | 87.31¢ per $1 |
| Gini / Inequality Index | 18,133 | 0.35 |
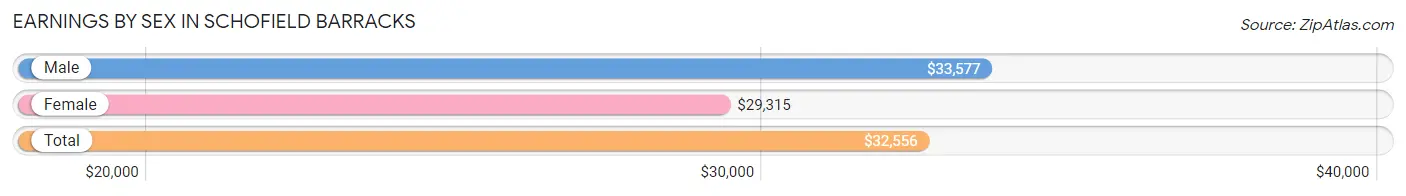
Earnings by Sex in Schofield Barracks
Average Earnings in Schofield Barracks are $32,556, $33,577 for men and $29,315 for women, a difference of 12.7%.
| Sex | Number | Average Earnings |
| Male | 8,578 (76.3%) | $33,577 |
| Female | 2,671 (23.7%) | $29,315 |
| Total | 11,249 (100.0%) | $32,556 |
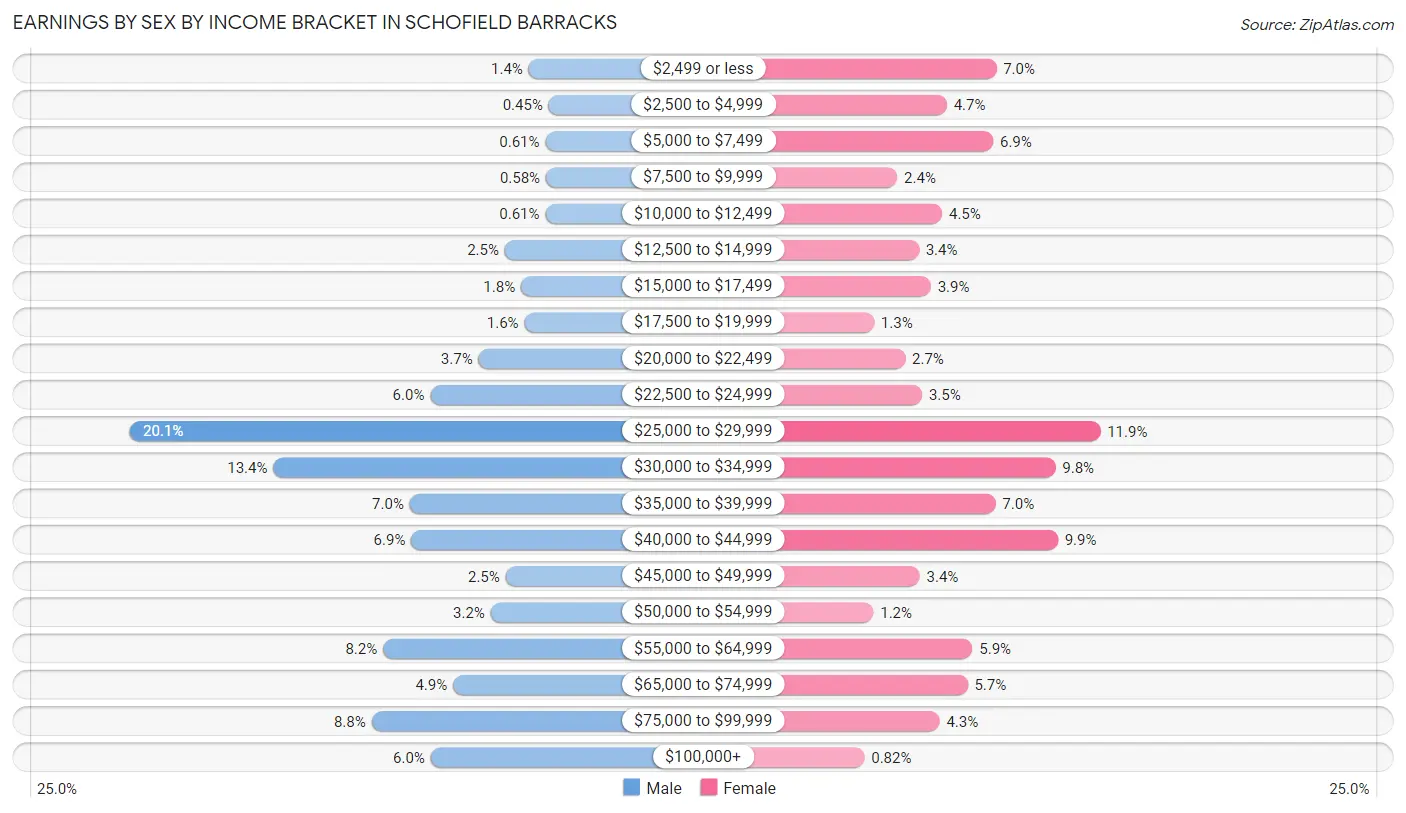
Earnings by Sex by Income Bracket in Schofield Barracks
The most common earnings brackets in Schofield Barracks are $25,000 to $29,999 for men (1,721 | 20.1%) and $25,000 to $29,999 for women (317 | 11.9%).
| Income | Male | Female |
| $2,499 or less | 119 (1.4%) | 187 (7.0%) |
| $2,500 to $4,999 | 39 (0.4%) | 125 (4.7%) |
| $5,000 to $7,499 | 52 (0.6%) | 183 (6.9%) |
| $7,500 to $9,999 | 50 (0.6%) | 63 (2.4%) |
| $10,000 to $12,499 | 52 (0.6%) | 119 (4.5%) |
| $12,500 to $14,999 | 215 (2.5%) | 90 (3.4%) |
| $15,000 to $17,499 | 150 (1.8%) | 105 (3.9%) |
| $17,500 to $19,999 | 136 (1.6%) | 34 (1.3%) |
| $20,000 to $22,499 | 321 (3.7%) | 73 (2.7%) |
| $22,500 to $24,999 | 515 (6.0%) | 94 (3.5%) |
| $25,000 to $29,999 | 1,721 (20.1%) | 317 (11.9%) |
| $30,000 to $34,999 | 1,145 (13.4%) | 261 (9.8%) |
| $35,000 to $39,999 | 597 (7.0%) | 186 (7.0%) |
| $40,000 to $44,999 | 591 (6.9%) | 264 (9.9%) |
| $45,000 to $49,999 | 212 (2.5%) | 91 (3.4%) |
| $50,000 to $54,999 | 272 (3.2%) | 33 (1.2%) |
| $55,000 to $64,999 | 704 (8.2%) | 157 (5.9%) |
| $65,000 to $74,999 | 423 (4.9%) | 151 (5.7%) |
| $75,000 to $99,999 | 751 (8.7%) | 116 (4.3%) |
| $100,000+ | 513 (6.0%) | 22 (0.8%) |
| Total | 8,578 (100.0%) | 2,671 (100.0%) |
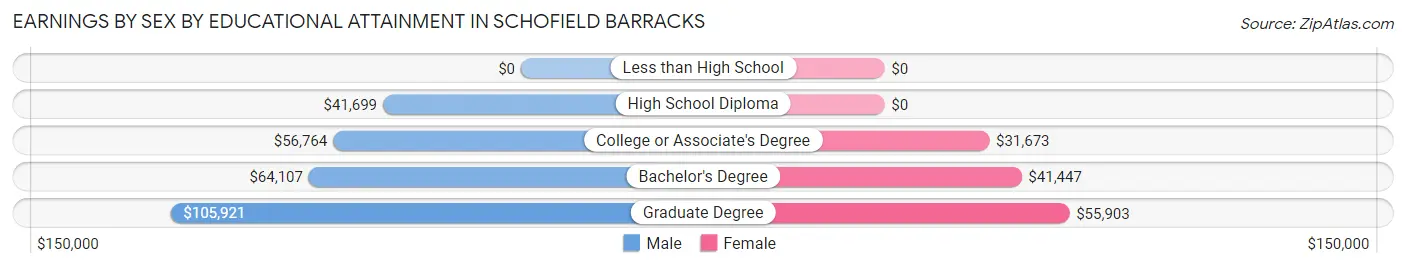
Earnings by Sex by Educational Attainment in Schofield Barracks
Average earnings in Schofield Barracks are $55,638 for men and $34,310 for women, a difference of 38.3%. Men with an educational attainment of graduate degree enjoy the highest average annual earnings of $105,921, while those with high school diploma education earn the least with $41,699. Women with an educational attainment of graduate degree earn the most with the average annual earnings of $55,903, while those with college or associate's degree education have the smallest earnings of $31,673.
| Educational Attainment | Male Income | Female Income |
| Less than High School | - | - |
| High School Diploma | $41,699 | $0 |
| College or Associate's Degree | $56,764 | $31,673 |
| Bachelor's Degree | $64,107 | $41,447 |
| Graduate Degree | $105,921 | $55,903 |
| Total | $55,638 | $34,310 |
Family Income in Schofield Barracks
Family Income Brackets in Schofield Barracks
According to the Schofield Barracks family income data, there are 892 families falling into the $75,000 to $99,999 income range, which is the most common income bracket and makes up 24.8% of all families. Conversely, the $10,000 to $14,999 income bracket is the least frequent group with only 22 families (0.6%) belonging to this category.
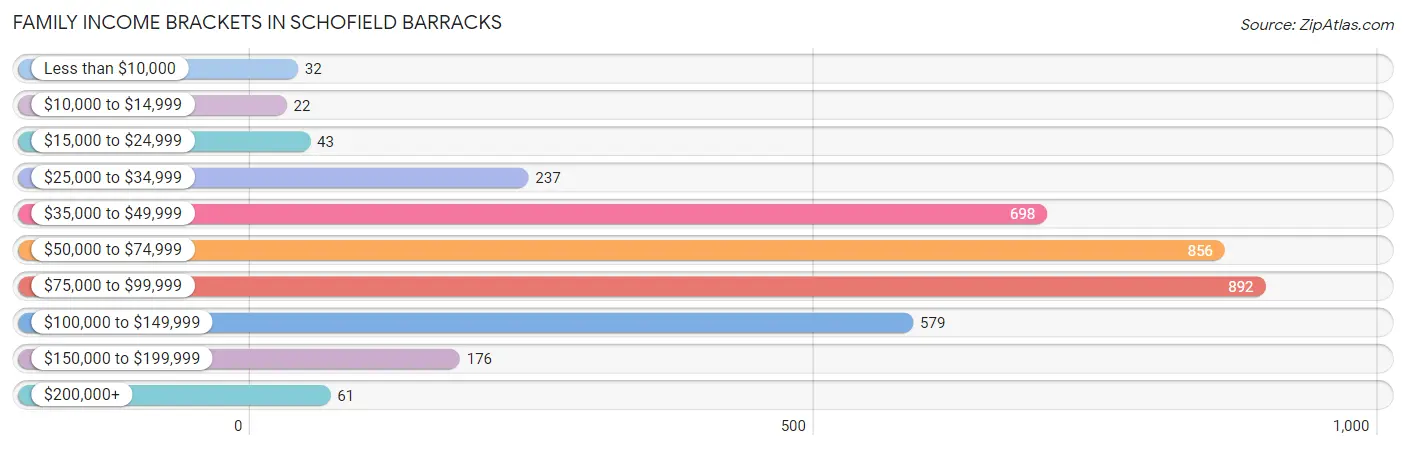
| Income Bracket | # Families | % Families |
| Less than $10,000 | 32 | 0.9% |
| $10,000 to $14,999 | 22 | 0.6% |
| $15,000 to $24,999 | 43 | 1.2% |
| $25,000 to $34,999 | 237 | 6.6% |
| $35,000 to $49,999 | 698 | 19.4% |
| $50,000 to $74,999 | 856 | 23.8% |
| $75,000 to $99,999 | 892 | 24.8% |
| $100,000 to $149,999 | 579 | 16.1% |
| $150,000 to $199,999 | 176 | 4.9% |
| $200,000+ | 61 | 1.7% |
Family Income by Famaliy Size in Schofield Barracks
5-person families (488 | 13.6%) account for the highest median family income in Schofield Barracks with $86,121 per family, while 2-person families (1,203 | 33.4%) have the highest median income of $31,157 per family member.
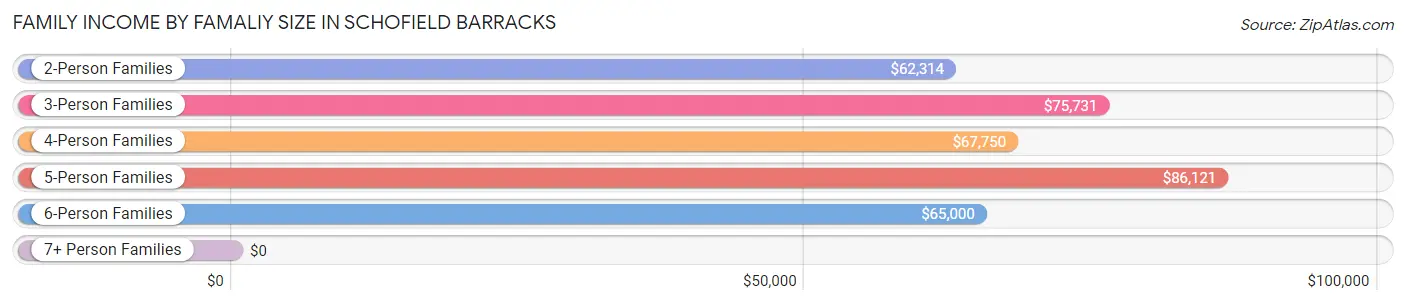
| Income Bracket | # Families | Median Income |
| 2-Person Families | 1,203 (33.4%) | $62,314 |
| 3-Person Families | 857 (23.8%) | $75,731 |
| 4-Person Families | 822 (22.9%) | $67,750 |
| 5-Person Families | 488 (13.6%) | $86,121 |
| 6-Person Families | 198 (5.5%) | $65,000 |
| 7+ Person Families | 29 (0.8%) | $0 |
| Total | 3,597 (100.0%) | $70,822 |
Family Income by Number of Earners in Schofield Barracks
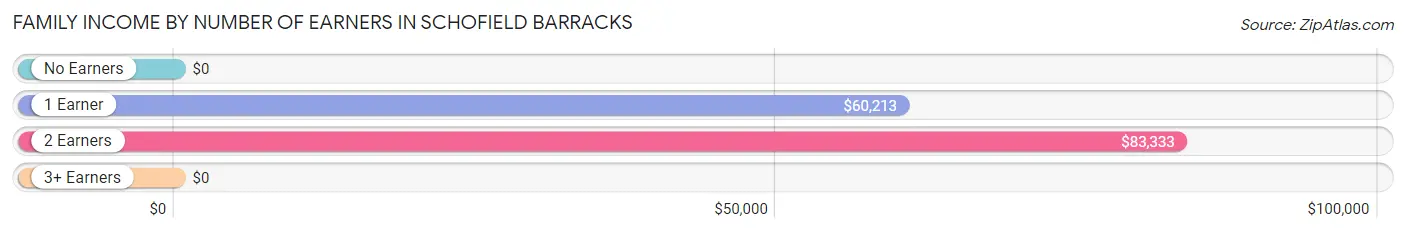
| Number of Earners | # Families | Median Income |
| No Earners | 34 (0.9%) | $0 |
| 1 Earner | 1,576 (43.8%) | $60,213 |
| 2 Earners | 1,890 (52.5%) | $83,333 |
| 3+ Earners | 97 (2.7%) | $0 |
| Total | 3,597 (100.0%) | $70,822 |
Household Income in Schofield Barracks
Household Income Brackets in Schofield Barracks
With 1,003 households falling in the category, the $50,000 to $74,999 income range is the most frequent in Schofield Barracks, accounting for 23.8% of all households. In contrast, only 51 households (1.2%) fall into the less than $10,000 income bracket, making it the least populous group.
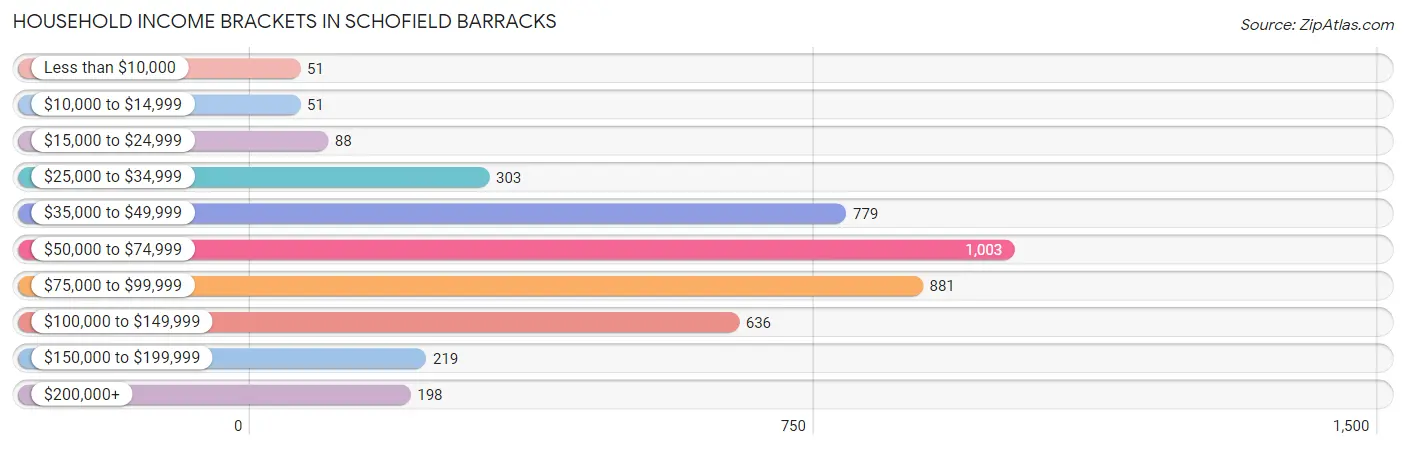
| Income Bracket | # Households | % Households |
| Less than $10,000 | 51 | 1.2% |
| $10,000 to $14,999 | 51 | 1.2% |
| $15,000 to $24,999 | 88 | 2.1% |
| $25,000 to $34,999 | 303 | 7.2% |
| $35,000 to $49,999 | 779 | 18.5% |
| $50,000 to $74,999 | 1,003 | 23.8% |
| $75,000 to $99,999 | 881 | 20.9% |
| $100,000 to $149,999 | 636 | 15.1% |
| $150,000 to $199,999 | 219 | 5.2% |
| $200,000+ | 198 | 4.7% |
Household Income by Householder Age in Schofield Barracks
The median household income in Schofield Barracks is $69,755, with the highest median household income of $77,500 found in the 25 to 44 years age bracket for the primary householder. A total of 2,820 households (66.9%) fall into this category. Meanwhile, the 65+ years age bracket for the primary householder has the lowest median household income of $0, with 6 households (0.1%) in this group.
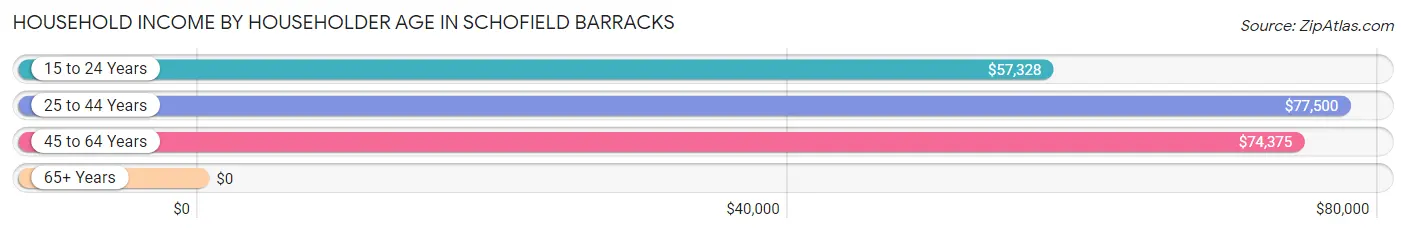
| Income Bracket | # Households | Median Income |
| 15 to 24 Years | 1,246 (29.6%) | $57,328 |
| 25 to 44 Years | 2,820 (66.9%) | $77,500 |
| 45 to 64 Years | 141 (3.4%) | $74,375 |
| 65+ Years | 6 (0.1%) | $0 |
| Total | 4,213 (100.0%) | $69,755 |
Poverty in Schofield Barracks
Income Below Poverty by Sex and Age in Schofield Barracks
With 7.3% poverty level for males and 6.0% for females among the residents of Schofield Barracks, 16 and 17 year old males and 5 year old females are the most vulnerable to poverty, with 31 males (39.2%) and 61 females (23.8%) in their respective age groups living below the poverty level.
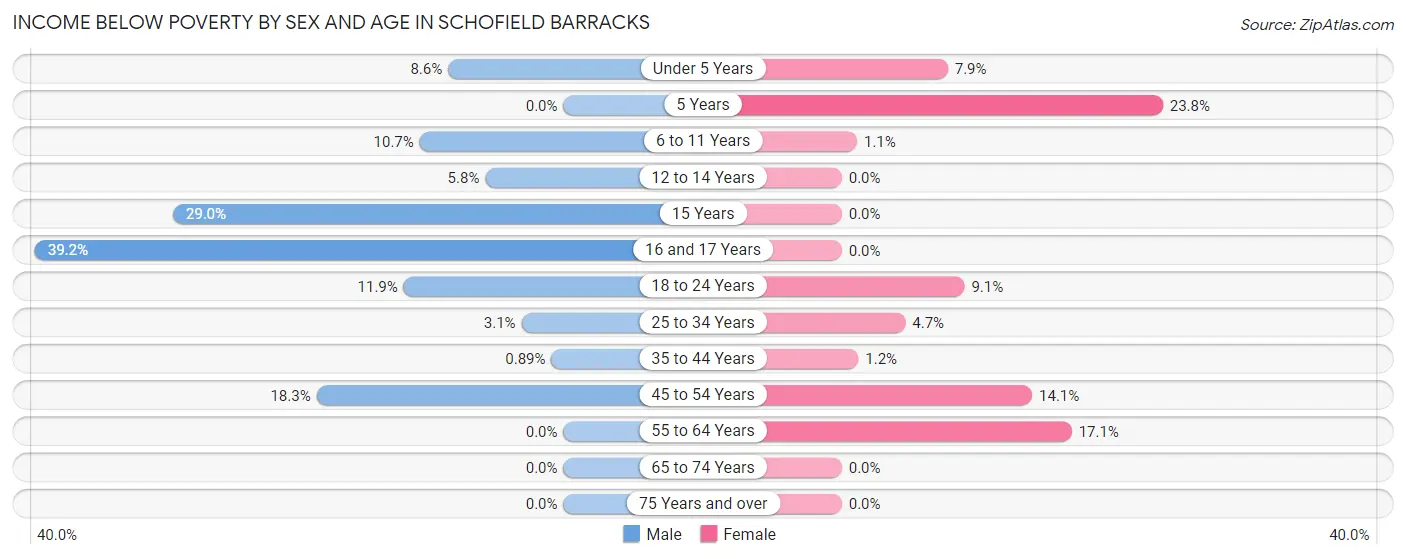
| Age Bracket | Male | Female |
| Under 5 Years | 134 (8.6%) | 91 (7.9%) |
| 5 Years | 0 (0.0%) | 61 (23.8%) |
| 6 to 11 Years | 76 (10.7%) | 9 (1.1%) |
| 12 to 14 Years | 16 (5.8%) | 0 (0.0%) |
| 15 Years | 20 (29.0%) | 0 (0.0%) |
| 16 and 17 Years | 31 (39.2%) | 0 (0.0%) |
| 18 to 24 Years | 148 (11.9%) | 91 (9.1%) |
| 25 to 34 Years | 64 (3.1%) | 80 (4.7%) |
| 35 to 44 Years | 7 (0.9%) | 7 (1.2%) |
| 45 to 54 Years | 22 (18.3%) | 13 (14.1%) |
| 55 to 64 Years | 0 (0.0%) | 7 (17.1%) |
| 65 to 74 Years | 0 (0.0%) | 0 (0.0%) |
| 75 Years and over | 0 (0.0%) | 0 (0.0%) |
| Total | 518 (7.3%) | 359 (6.0%) |
Income Above Poverty by Sex and Age in Schofield Barracks
According to the poverty statistics in Schofield Barracks, males aged 5 years and females aged 12 to 14 years are the age groups that are most secure financially, with 100.0% of males and 100.0% of females in these age groups living above the poverty line.
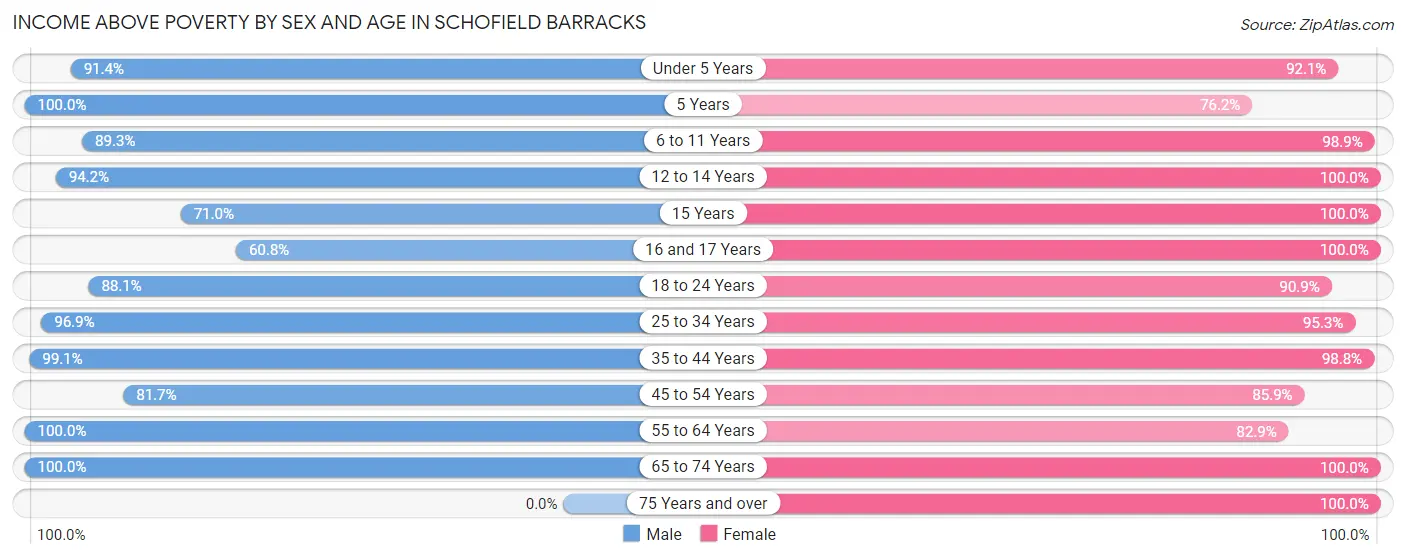
| Age Bracket | Male | Female |
| Under 5 Years | 1,432 (91.4%) | 1,065 (92.1%) |
| 5 Years | 115 (100.0%) | 195 (76.2%) |
| 6 to 11 Years | 636 (89.3%) | 788 (98.9%) |
| 12 to 14 Years | 260 (94.2%) | 158 (100.0%) |
| 15 Years | 49 (71.0%) | 36 (100.0%) |
| 16 and 17 Years | 48 (60.8%) | 105 (100.0%) |
| 18 to 24 Years | 1,100 (88.1%) | 908 (90.9%) |
| 25 to 34 Years | 1,995 (96.9%) | 1,616 (95.3%) |
| 35 to 44 Years | 777 (99.1%) | 562 (98.8%) |
| 45 to 54 Years | 98 (81.7%) | 79 (85.9%) |
| 55 to 64 Years | 21 (100.0%) | 34 (82.9%) |
| 65 to 74 Years | 3 (100.0%) | 11 (100.0%) |
| 75 Years and over | 0 (0.0%) | 14 (100.0%) |
| Total | 6,534 (92.6%) | 5,571 (94.0%) |
Income Below Poverty Among Married-Couple Families in Schofield Barracks
The poverty statistics for married-couple families in Schofield Barracks show that 4.4% or 150 of the total 3,392 families live below the poverty line. Families with 3 or 4 children have the highest poverty rate of 9.8%, comprising of 62 families. On the other hand, families with 5 or more children have the lowest poverty rate of 0.0%, which includes 0 families.
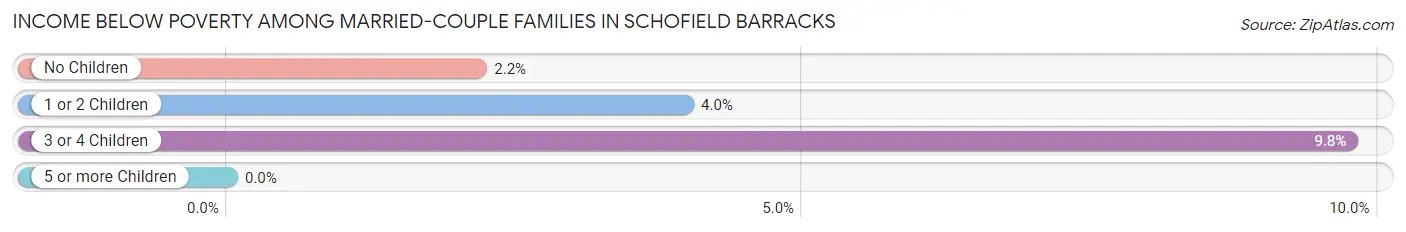
| Children | Above Poverty | Below Poverty |
| No Children | 1,126 (97.8%) | 25 (2.2%) |
| 1 or 2 Children | 1,522 (96.0%) | 63 (4.0%) |
| 3 or 4 Children | 574 (90.2%) | 62 (9.8%) |
| 5 or more Children | 20 (100.0%) | 0 (0.0%) |
| Total | 3,242 (95.6%) | 150 (4.4%) |
Income Below Poverty Among Single-Parent Households in Schofield Barracks
According to the poverty data in Schofield Barracks, 17.9% or 7 single-father households and 7.8% or 13 single-mother households are living below the poverty line. Among single-father households, those with 3 or 4 children have the highest poverty rate, with 7 households (100.0%) experiencing poverty. Likewise, among single-mother households, those with 1 or 2 children have the highest poverty rate, with 13 households (11.3%) falling below the poverty line.
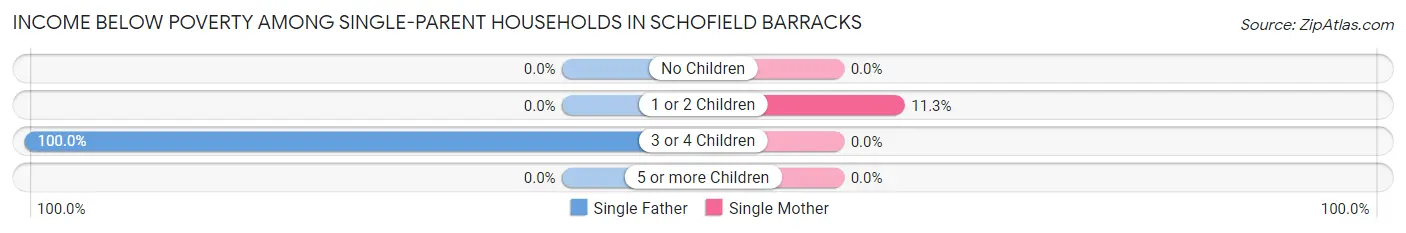
| Children | Single Father | Single Mother |
| No Children | 0 (0.0%) | 0 (0.0%) |
| 1 or 2 Children | 0 (0.0%) | 13 (11.3%) |
| 3 or 4 Children | 7 (100.0%) | 0 (0.0%) |
| 5 or more Children | 0 (0.0%) | 0 (0.0%) |
| Total | 7 (17.9%) | 13 (7.8%) |
Income Below Poverty Among Married-Couple vs Single-Parent Households in Schofield Barracks
The poverty data for Schofield Barracks shows that 150 of the married-couple family households (4.4%) and 20 of the single-parent households (9.8%) are living below the poverty level. Within the married-couple family households, those with 3 or 4 children have the highest poverty rate, with 62 households (9.8%) falling below the poverty line. Among the single-parent households, those with 3 or 4 children have the highest poverty rate, with 7 household (12.1%) living below poverty.
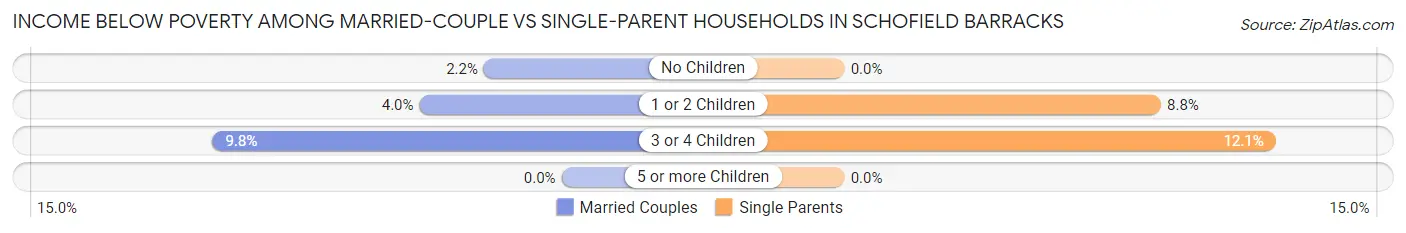
| Children | Married-Couple Families | Single-Parent Households |
| No Children | 25 (2.2%) | 0 (0.0%) |
| 1 or 2 Children | 63 (4.0%) | 13 (8.8%) |
| 3 or 4 Children | 62 (9.8%) | 7 (12.1%) |
| 5 or more Children | 0 (0.0%) | 0 (0.0%) |
| Total | 150 (4.4%) | 20 (9.8%) |
Race in Schofield Barracks
The most populous races in Schofield Barracks are White / Caucasian (10,376 | 57.2%), Hispanic or Latino (3,759 | 20.7%), and Black / African American (3,419 | 18.9%).
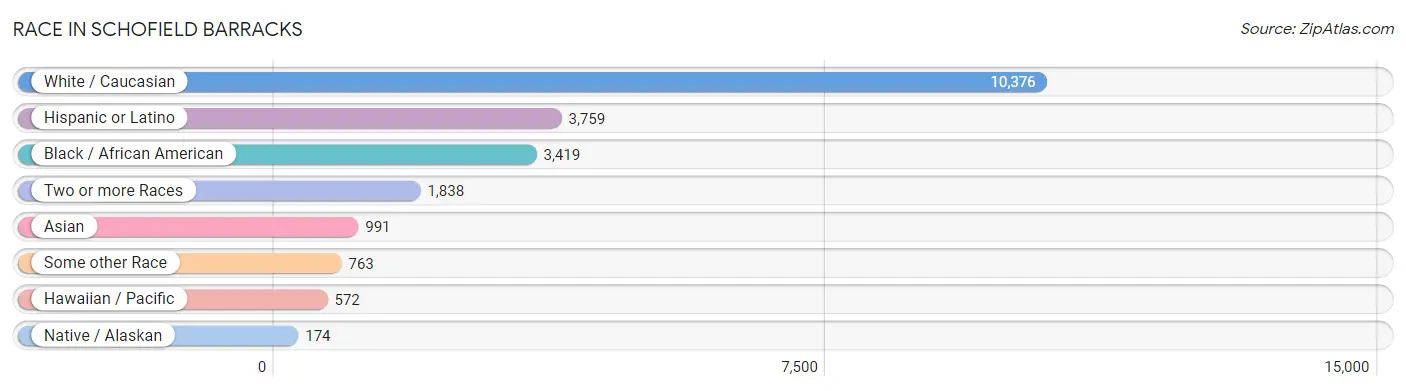
| Race | # Population | % Population |
| Asian | 991 | 5.5% |
| Black / African American | 3,419 | 18.9% |
| Hawaiian / Pacific | 572 | 3.2% |
| Hispanic or Latino | 3,759 | 20.7% |
| Native / Alaskan | 174 | 1.0% |
| White / Caucasian | 10,376 | 57.2% |
| Two or more Races | 1,838 | 10.1% |
| Some other Race | 763 | 4.2% |
| Total | 18,133 | 100.0% |
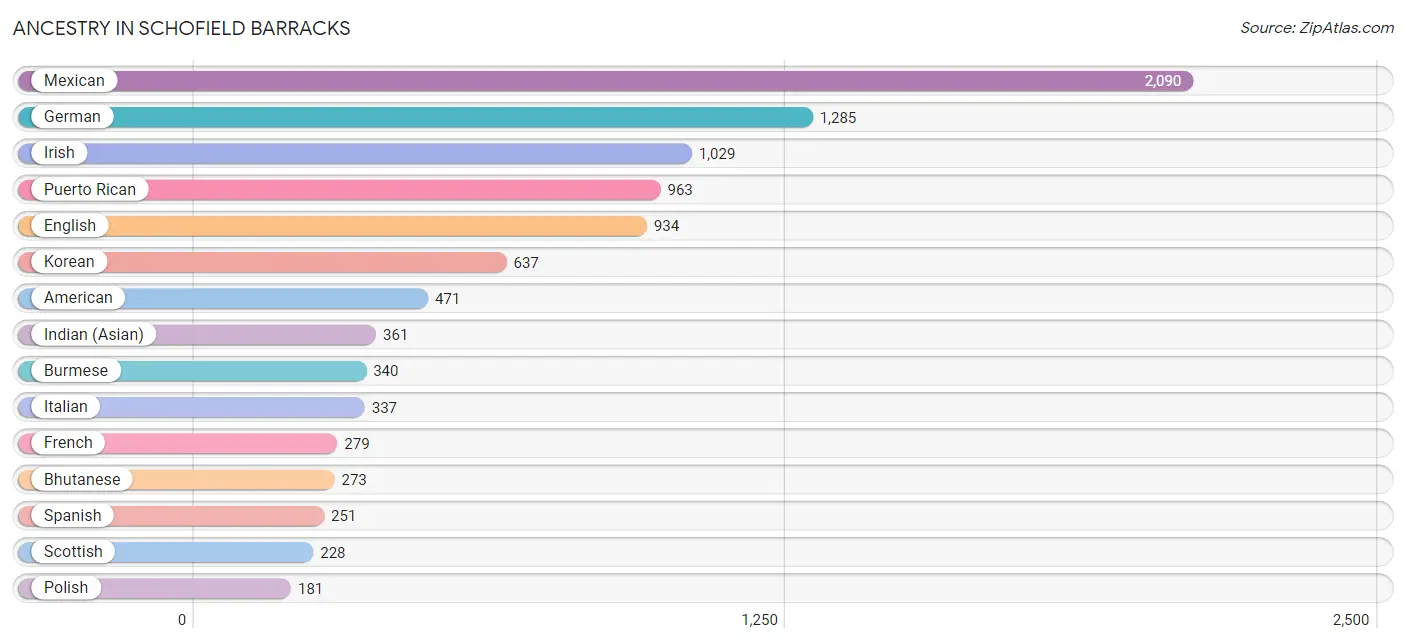
Ancestry in Schofield Barracks
The most populous ancestries reported in Schofield Barracks are Mexican (2,090 | 11.5%), German (1,285 | 7.1%), Irish (1,029 | 5.7%), Puerto Rican (963 | 5.3%), and English (934 | 5.1%), together accounting for 34.7% of all Schofield Barracks residents.
| Ancestry | # Population | % Population |
| African | 62 | 0.3% |
| American | 471 | 2.6% |
| Apache | 13 | 0.1% |
| Arab | 84 | 0.5% |
| Armenian | 13 | 0.1% |
| Bangladeshi | 11 | 0.1% |
| Belgian | 29 | 0.2% |
| Bhutanese | 273 | 1.5% |
| Blackfeet | 47 | 0.3% |
| British | 5 | 0.0% |
| Burmese | 340 | 1.9% |
| Canadian | 16 | 0.1% |
| Central American | 93 | 0.5% |
| Central American Indian | 10 | 0.1% |
| Cherokee | 39 | 0.2% |
| Chickasaw | 33 | 0.2% |
| Choctaw | 17 | 0.1% |
| Colombian | 55 | 0.3% |
| Creek | 8 | 0.0% |
| Croatian | 64 | 0.4% |
| Cuban | 50 | 0.3% |
| Czech | 28 | 0.2% |
| Czechoslovakian | 3 | 0.0% |
| Dominican | 7 | 0.0% |
| Dutch | 75 | 0.4% |
| Eastern European | 17 | 0.1% |
| Ecuadorian | 10 | 0.1% |
| Egyptian | 4 | 0.0% |
| English | 934 | 5.1% |
| European | 134 | 0.7% |
| Fijian | 80 | 0.4% |
| French | 279 | 1.5% |
| French Canadian | 14 | 0.1% |
| German | 1,285 | 7.1% |
| Ghanaian | 14 | 0.1% |
| Greek | 12 | 0.1% |
| Guamanian / Chamorro | 84 | 0.5% |
| Guatemalan | 30 | 0.2% |
| Haitian | 6 | 0.0% |
| Honduran | 4 | 0.0% |
| Hungarian | 4 | 0.0% |
| Indian (Asian) | 361 | 2.0% |
| Iranian | 57 | 0.3% |
| Irish | 1,029 | 5.7% |
| Iroquois | 6 | 0.0% |
| Italian | 337 | 1.9% |
| Jamaican | 126 | 0.7% |
| Kenyan | 4 | 0.0% |
| Korean | 637 | 3.5% |
| Laotian | 20 | 0.1% |
| Lebanese | 12 | 0.1% |
| Lumbee | 81 | 0.4% |
| Malaysian | 20 | 0.1% |
| Mexican | 2,090 | 11.5% |
| Mexican American Indian | 11 | 0.1% |
| Moroccan | 22 | 0.1% |
| Native Hawaiian | 140 | 0.8% |
| Navajo | 7 | 0.0% |
| Nepalese | 20 | 0.1% |
| Northern European | 6 | 0.0% |
| Norwegian | 86 | 0.5% |
| Osage | 10 | 0.1% |
| Pakistani | 33 | 0.2% |
| Palestinian | 46 | 0.3% |
| Panamanian | 31 | 0.2% |
| Peruvian | 8 | 0.0% |
| Polish | 181 | 1.0% |
| Portuguese | 93 | 0.5% |
| Puerto Rican | 963 | 5.3% |
| Russian | 20 | 0.1% |
| Salvadoran | 28 | 0.2% |
| Samoan | 179 | 1.0% |
| Scandinavian | 74 | 0.4% |
| Scotch-Irish | 130 | 0.7% |
| Scottish | 228 | 1.3% |
| Slovak | 12 | 0.1% |
| South American | 102 | 0.6% |
| Spaniard | 65 | 0.4% |
| Spanish | 251 | 1.4% |
| Sri Lankan | 46 | 0.3% |
| Subsaharan African | 80 | 0.4% |
| Swedish | 71 | 0.4% |
| Thai | 16 | 0.1% |
| Trinidadian and Tobagonian | 32 | 0.2% |
| Ukrainian | 16 | 0.1% |
| Venezuelan | 29 | 0.2% |
| Welsh | 92 | 0.5% |
| West Indian | 7 | 0.0% | View All 88 Rows |
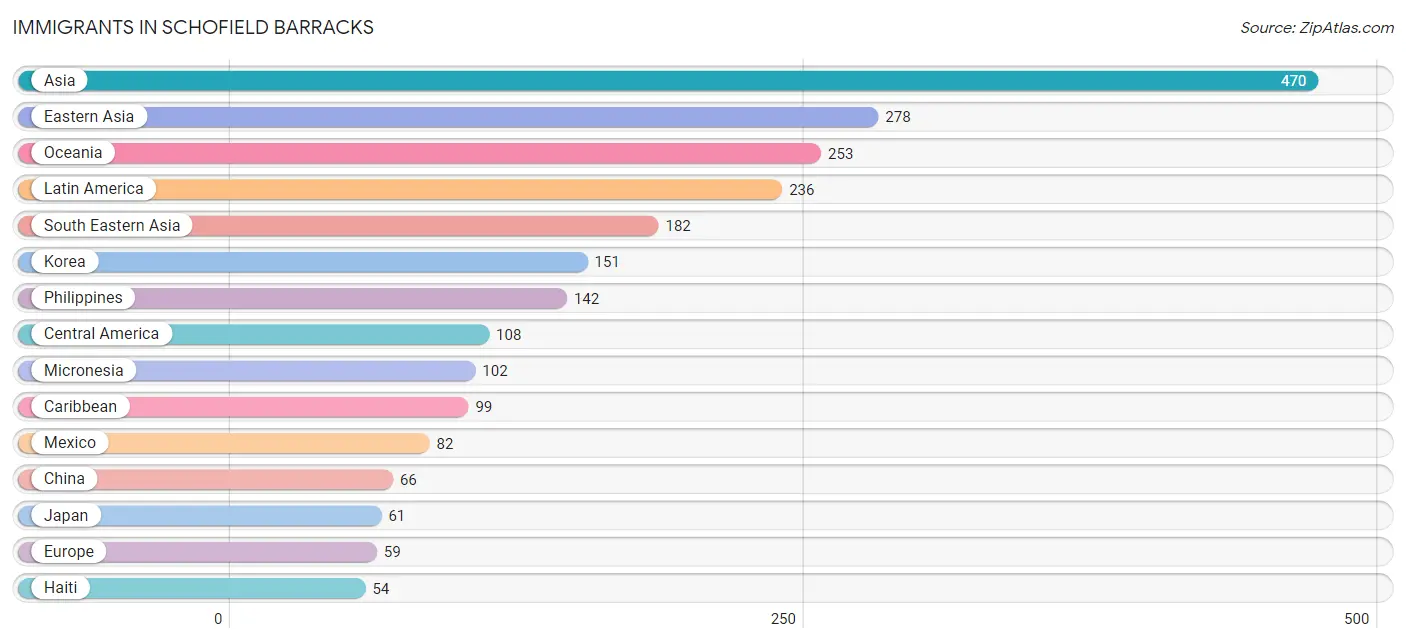
Immigrants in Schofield Barracks
The most numerous immigrant groups reported in Schofield Barracks came from Asia (470 | 2.6%), Eastern Asia (278 | 1.5%), Oceania (253 | 1.4%), Latin America (236 | 1.3%), and South Eastern Asia (182 | 1.0%), together accounting for 7.8% of all Schofield Barracks residents.
| Immigration Origin | # Population | % Population |
| Africa | 11 | 0.1% |
| Asia | 470 | 2.6% |
| Caribbean | 99 | 0.5% |
| Central America | 108 | 0.6% |
| China | 66 | 0.4% |
| Croatia | 26 | 0.1% |
| Cuba | 23 | 0.1% |
| Eastern Asia | 278 | 1.5% |
| Eastern Europe | 46 | 0.3% |
| Ecuador | 10 | 0.1% |
| Europe | 59 | 0.3% |
| Germany | 13 | 0.1% |
| Ghana | 5 | 0.0% |
| Guatemala | 6 | 0.0% |
| Haiti | 54 | 0.3% |
| Honduras | 13 | 0.1% |
| India | 10 | 0.1% |
| Indonesia | 5 | 0.0% |
| Jamaica | 22 | 0.1% |
| Japan | 61 | 0.3% |
| Korea | 151 | 0.8% |
| Latin America | 236 | 1.3% |
| Mexico | 82 | 0.4% |
| Micronesia | 102 | 0.6% |
| Oceania | 253 | 1.4% |
| Panama | 7 | 0.0% |
| Peru | 9 | 0.1% |
| Philippines | 142 | 0.8% |
| Russia | 20 | 0.1% |
| South America | 29 | 0.2% |
| South Central Asia | 10 | 0.1% |
| South Eastern Asia | 182 | 1.0% |
| Venezuela | 10 | 0.1% |
| Vietnam | 35 | 0.2% |
| Western Africa | 5 | 0.0% |
| Western Europe | 13 | 0.1% | View All 36 Rows |
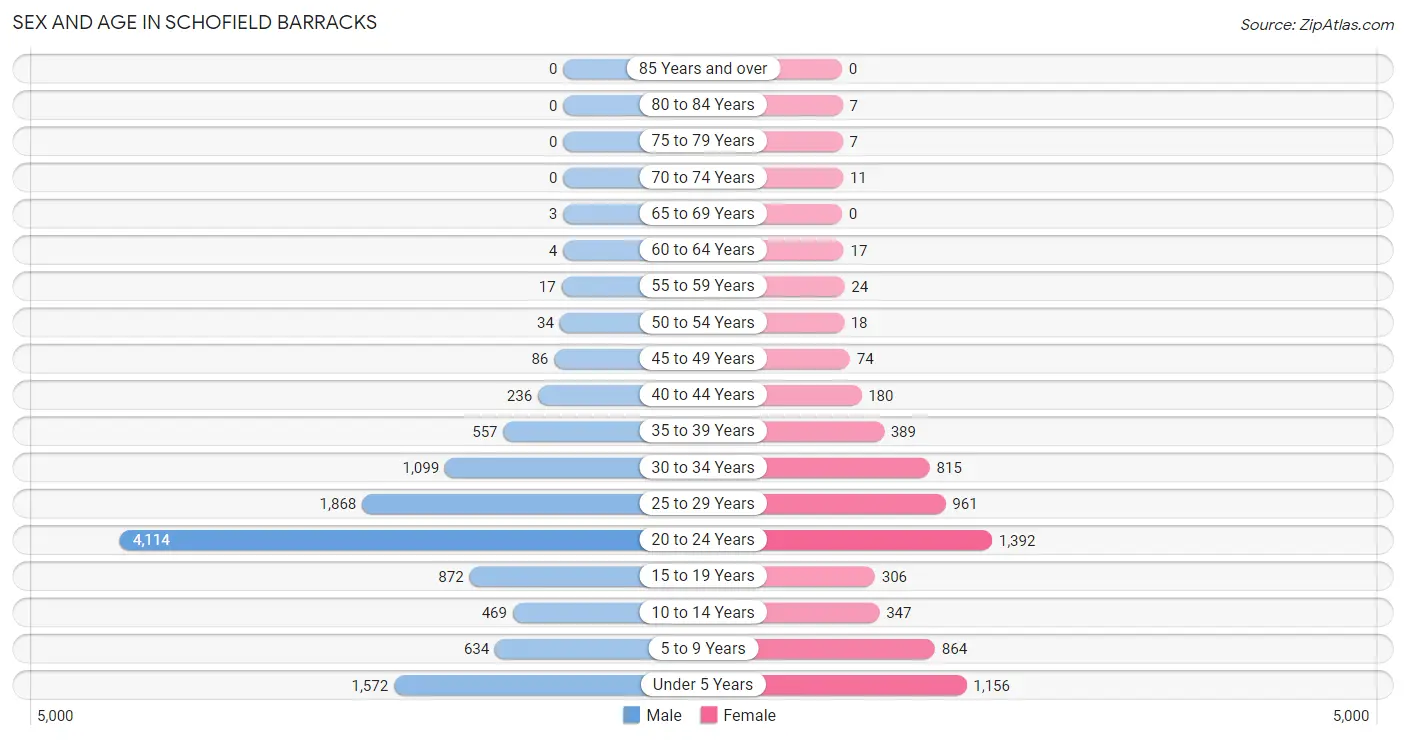
Sex and Age in Schofield Barracks
Sex and Age in Schofield Barracks
The most populous age groups in Schofield Barracks are 20 to 24 Years (4,114 | 35.6%) for men and 20 to 24 Years (1,392 | 21.2%) for women.
| Age Bracket | Male | Female |
| Under 5 Years | 1,572 (13.6%) | 1,156 (17.6%) |
| 5 to 9 Years | 634 (5.5%) | 864 (13.2%) |
| 10 to 14 Years | 469 (4.1%) | 347 (5.3%) |
| 15 to 19 Years | 872 (7.5%) | 306 (4.7%) |
| 20 to 24 Years | 4,114 (35.6%) | 1,392 (21.2%) |
| 25 to 29 Years | 1,868 (16.2%) | 961 (14.6%) |
| 30 to 34 Years | 1,099 (9.5%) | 815 (12.4%) |
| 35 to 39 Years | 557 (4.8%) | 389 (5.9%) |
| 40 to 44 Years | 236 (2.0%) | 180 (2.7%) |
| 45 to 49 Years | 86 (0.7%) | 74 (1.1%) |
| 50 to 54 Years | 34 (0.3%) | 18 (0.3%) |
| 55 to 59 Years | 17 (0.2%) | 24 (0.4%) |
| 60 to 64 Years | 4 (0.0%) | 17 (0.3%) |
| 65 to 69 Years | 3 (0.0%) | 0 (0.0%) |
| 70 to 74 Years | 0 (0.0%) | 11 (0.2%) |
| 75 to 79 Years | 0 (0.0%) | 7 (0.1%) |
| 80 to 84 Years | 0 (0.0%) | 7 (0.1%) |
| 85 Years and over | 0 (0.0%) | 0 (0.0%) |
| Total | 11,565 (100.0%) | 6,568 (100.0%) |
Families and Households in Schofield Barracks
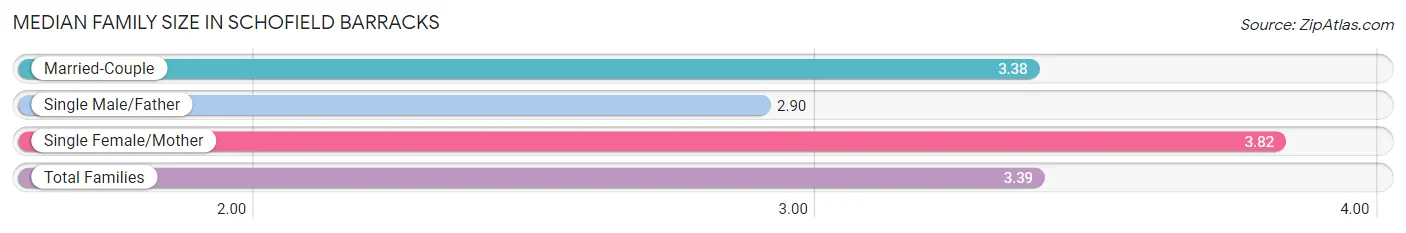
Median Family Size in Schofield Barracks
The median family size in Schofield Barracks is 3.39 persons per family, with single female/mother families (166 | 4.6%) accounting for the largest median family size of 3.82 persons per family. On the other hand, single male/father families (39 | 1.1%) represent the smallest median family size with 2.90 persons per family.
| Family Type | # Families | Family Size |
| Married-Couple | 3,392 (94.3%) | 3.38 |
| Single Male/Father | 39 (1.1%) | 2.90 |
| Single Female/Mother | 166 (4.6%) | 3.82 |
| Total Families | 3,597 (100.0%) | 3.39 |
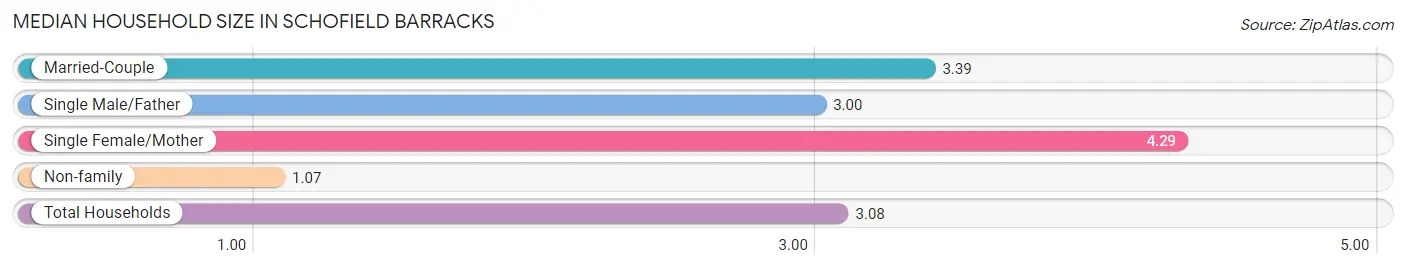
Median Household Size in Schofield Barracks
The median household size in Schofield Barracks is 3.08 persons per household, with single female/mother households (166 | 3.9%) accounting for the largest median household size of 4.29 persons per household. non-family households (616 | 14.6%) represent the smallest median household size with 1.07 persons per household.
| Household Type | # Households | Household Size |
| Married-Couple | 3,392 (80.5%) | 3.39 |
| Single Male/Father | 39 (0.9%) | 3.00 |
| Single Female/Mother | 166 (3.9%) | 4.29 |
| Non-family | 616 (14.6%) | 1.07 |
| Total Households | 4,213 (100.0%) | 3.08 |
Household Size by Marriage Status in Schofield Barracks
Out of a total of 4,213 households in Schofield Barracks, 3,597 (85.4%) are family households, while 616 (14.6%) are nonfamily households. The most numerous type of family households are 2-person households, comprising 1,167, and the most common type of nonfamily households are 1-person households, comprising 573.
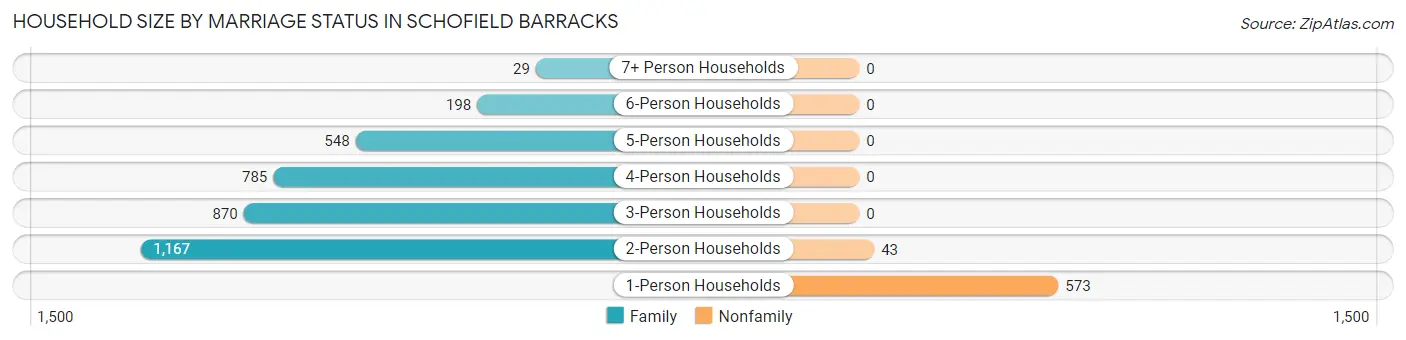
| Household Size | Family Households | Nonfamily Households |
| 1-Person Households | - | 573 (13.6%) |
| 2-Person Households | 1,167 (27.7%) | 43 (1.0%) |
| 3-Person Households | 870 (20.6%) | 0 (0.0%) |
| 4-Person Households | 785 (18.6%) | 0 (0.0%) |
| 5-Person Households | 548 (13.0%) | 0 (0.0%) |
| 6-Person Households | 198 (4.7%) | 0 (0.0%) |
| 7+ Person Households | 29 (0.7%) | 0 (0.0%) |
| Total | 3,597 (85.4%) | 616 (14.6%) |
Female Fertility in Schofield Barracks
Fertility by Age in Schofield Barracks
Average fertility rate in Schofield Barracks is 132.0 births per 1,000 women. Women in the age bracket of 20 to 34 years have the highest fertility rate with 150.0 births per 1,000 women. Women in the age bracket of 20 to 34 years acount for 86.8% of all women with births.
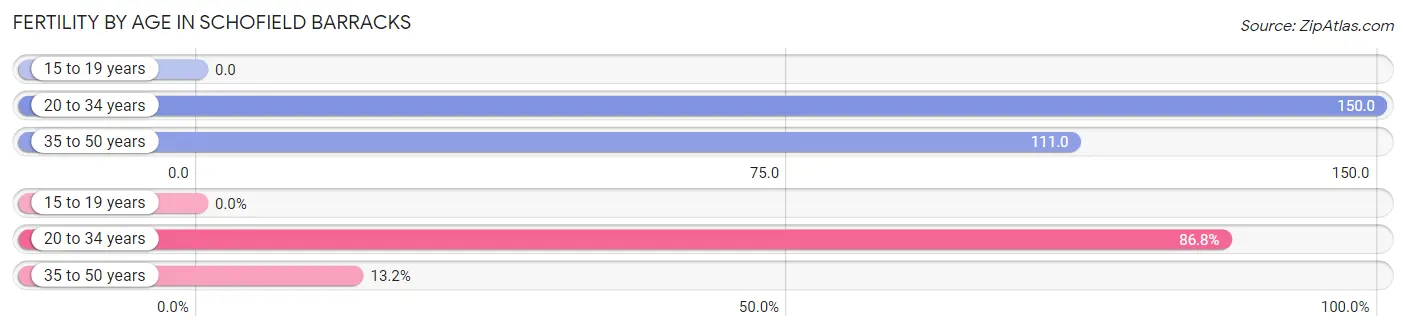
| Age Bracket | Women with Births | Births / 1,000 Women |
| 15 to 19 years | 0 (0.0%) | 0.0 |
| 20 to 34 years | 474 (86.8%) | 150.0 |
| 35 to 50 years | 72 (13.2%) | 111.0 |
| Total | 546 (100.0%) | 132.0 |
Fertility by Age by Marriage Status in Schofield Barracks
97.3% of women with births (546) in Schofield Barracks are married. The highest percentage of unmarried women with births falls into 35 to 50 years age bracket with 6.9% of them unmarried at the time of birth, while the lowest percentage of unmarried women with births belong to 20 to 34 years age bracket with 2.1% of them unmarried.
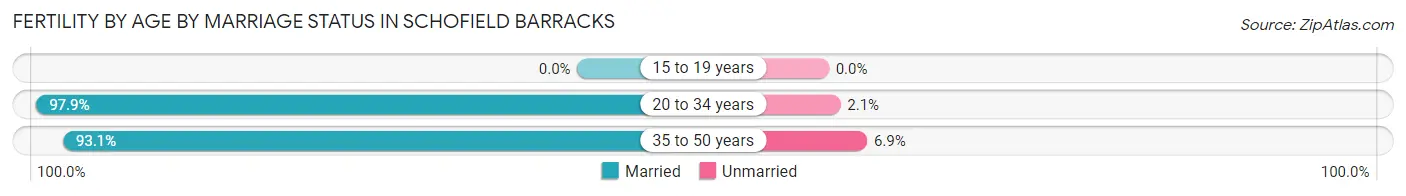
| Age Bracket | Married | Unmarried |
| 15 to 19 years | 0 (0.0%) | 0 (0.0%) |
| 20 to 34 years | 464 (97.9%) | 10 (2.1%) |
| 35 to 50 years | 67 (93.1%) | 5 (6.9%) |
| Total | 531 (97.3%) | 15 (2.8%) |
Fertility by Education in Schofield Barracks
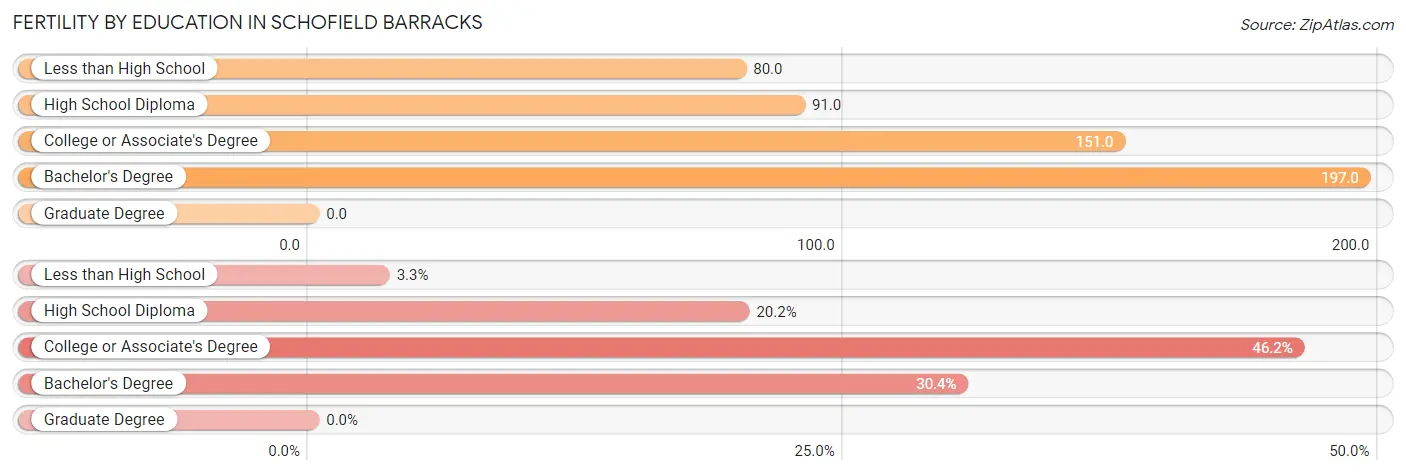
| Educational Attainment | Women with Births | Births / 1,000 Women |
| Less than High School | 18 (3.3%) | 80.0 |
| High School Diploma | 110 (20.2%) | 91.0 |
| College or Associate's Degree | 252 (46.2%) | 151.0 |
| Bachelor's Degree | 166 (30.4%) | 197.0 |
| Graduate Degree | 0 (0.0%) | 0.0 |
| Total | 546 (100.0%) | 132.0 |
Fertility by Education by Marriage Status in Schofield Barracks
2.8% of women with births in Schofield Barracks are unmarried. Women with the educational attainment of less than high school are most likely to be married with 100.0% of them married at childbirth, while women with the educational attainment of high school diploma are least likely to be married with 9.1% of them unmarried at childbirth.
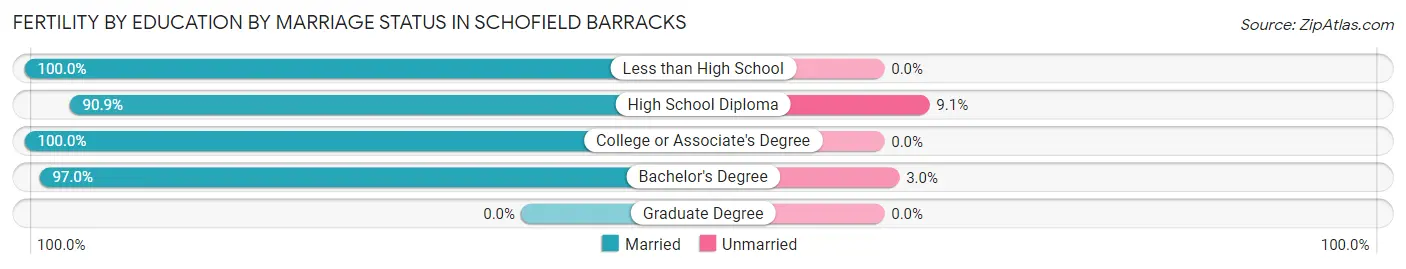
| Educational Attainment | Married | Unmarried |
| Less than High School | 18 (100.0%) | 0 (0.0%) |
| High School Diploma | 100 (90.9%) | 10 (9.1%) |
| College or Associate's Degree | 252 (100.0%) | 0 (0.0%) |
| Bachelor's Degree | 161 (97.0%) | 5 (3.0%) |
| Graduate Degree | 0 (0.0%) | 0 (0.0%) |
| Total | 531 (97.3%) | 15 (2.8%) |
Employment Characteristics in Schofield Barracks
Employment by Class of Employer in Schofield Barracks
Among the 10,645 employed individuals in Schofield Barracks, federal government employees (9,149 | 86.0%), private company employees (1,004 | 9.4%), and not-for-profit organizations (186 | 1.8%) make up the most common classes of employment.
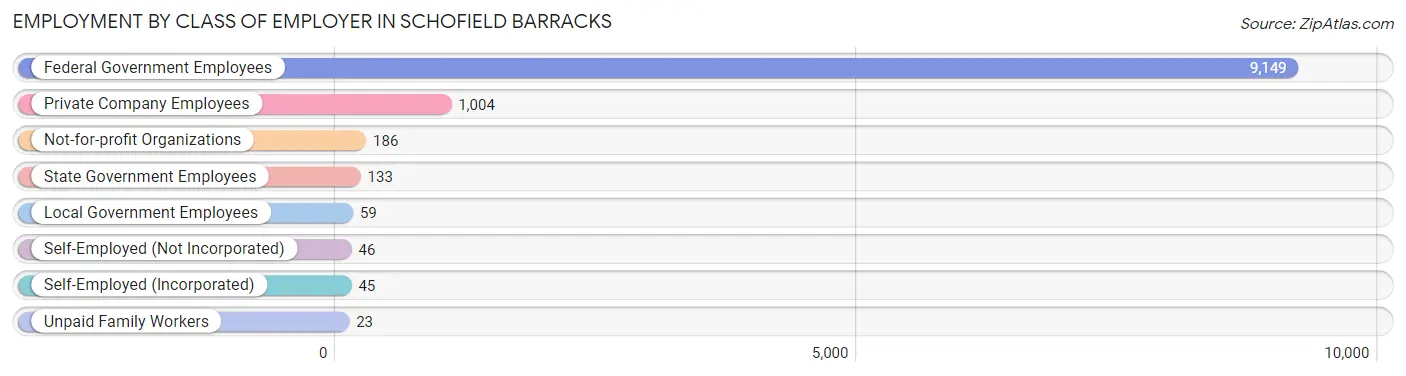
| Employer Class | # Employees | % Employees |
| Private Company Employees | 1,004 | 9.4% |
| Self-Employed (Incorporated) | 45 | 0.4% |
| Self-Employed (Not Incorporated) | 46 | 0.4% |
| Not-for-profit Organizations | 186 | 1.8% |
| Local Government Employees | 59 | 0.5% |
| State Government Employees | 133 | 1.3% |
| Federal Government Employees | 9,149 | 86.0% |
| Unpaid Family Workers | 23 | 0.2% |
| Total | 10,645 | 100.0% |
Employment Status by Age in Schofield Barracks
According to the labor force statistics for Schofield Barracks, out of the total population over 16 years of age (12,986), 85.0% or 11,038 individuals are in the labor force, with 8.9% or 982 of them unemployed. The age group with the highest labor force participation rate is 20 to 24 years, with 91.9% or 5,060 individuals in the labor force. Within the labor force, the 55 to 59 years age range has the highest percentage of unemployed individuals, with 26.1% or 8 of them being unemployed.
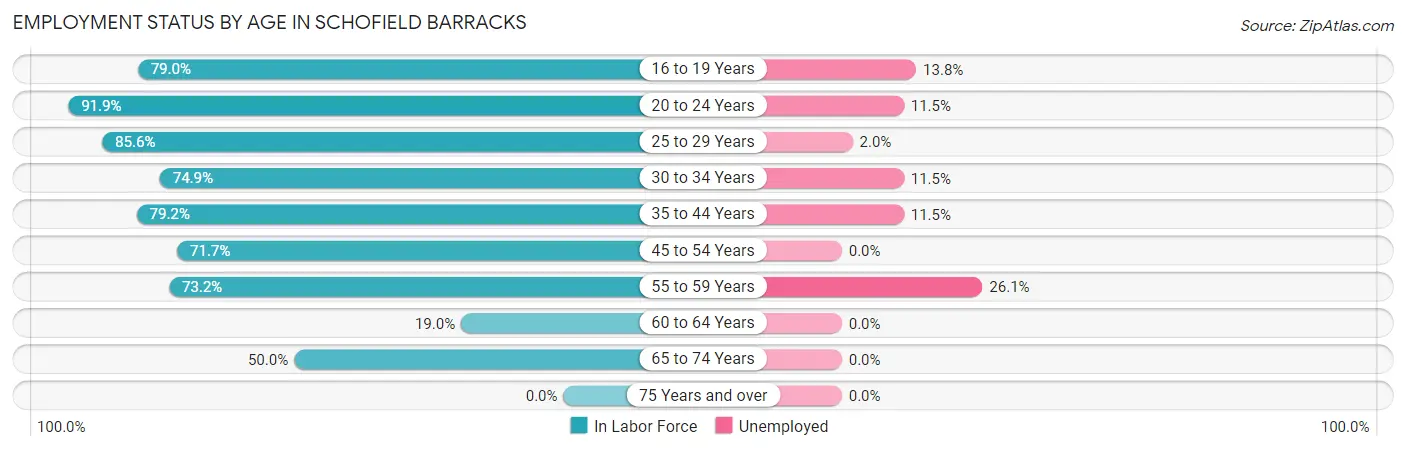
| Age Bracket | In Labor Force | Unemployed |
| 16 to 19 Years | 848 (79.0%) | 117 (13.8%) |
| 20 to 24 Years | 5,060 (91.9%) | 582 (11.5%) |
| 25 to 29 Years | 2,422 (85.6%) | 48 (2.0%) |
| 30 to 34 Years | 1,434 (74.9%) | 165 (11.5%) |
| 35 to 44 Years | 1,079 (79.2%) | 124 (11.5%) |
| 45 to 54 Years | 152 (71.7%) | 0 (0.0%) |
| 55 to 59 Years | 30 (73.2%) | 8 (26.1%) |
| 60 to 64 Years | 4 (19.0%) | 0 (0.0%) |
| 65 to 74 Years | 7 (50.0%) | 0 (0.0%) |
| 75 Years and over | 0 (0.0%) | 0 (0.0%) |
| Total | 11,038 (85.0%) | 982 (8.9%) |
Employment Status by Educational Attainment in Schofield Barracks
According to labor force statistics for Schofield Barracks, 80.3% of individuals (5,122) out of the total population between 25 and 64 years of age (6,379) are in the labor force, with 7.4% or 379 of them being unemployed. The group with the highest labor force participation rate are those with the educational attainment of high school diploma, with 84.4% or 1,403 individuals in the labor force. Within the labor force, individuals with high school diploma education have the highest percentage of unemployment, with 14.3% or 201 of them being unemployed.
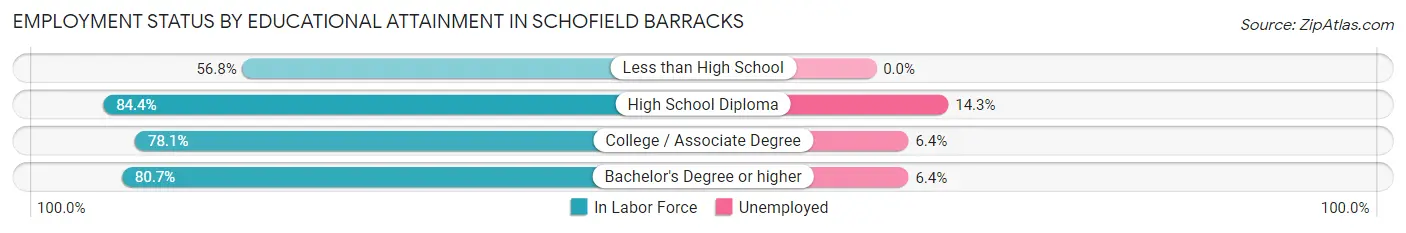
| Educational Attainment | In Labor Force | Unemployed |
| Less than High School | 42 (56.8%) | 0 (0.0%) |
| High School Diploma | 1,403 (84.4%) | 238 (14.3%) |
| College / Associate Degree | 2,115 (78.1%) | 173 (6.4%) |
| Bachelor's Degree or higher | 1,562 (80.7%) | 124 (6.4%) |
| Total | 5,122 (80.3%) | 472 (7.4%) |
Employment Occupations by Sex in Schofield Barracks
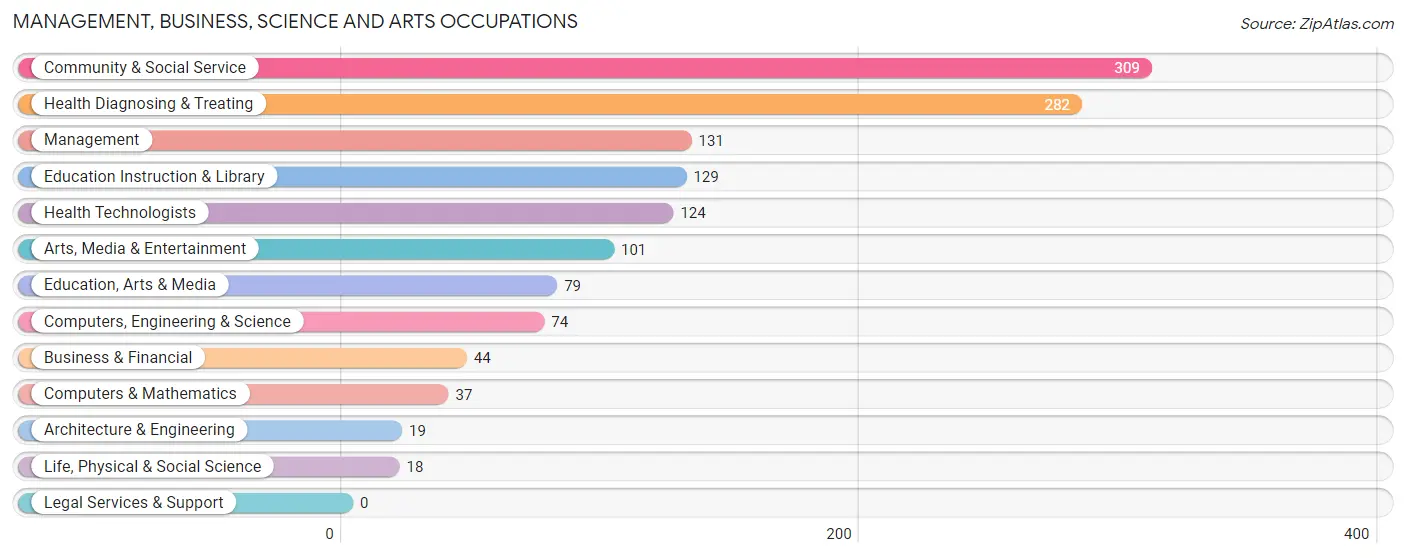
Management, Business, Science and Arts Occupations
The most common Management, Business, Science and Arts occupations in Schofield Barracks are Community & Social Service (309 | 13.5%), Health Diagnosing & Treating (282 | 12.3%), Management (131 | 5.7%), Education Instruction & Library (129 | 5.6%), and Health Technologists (124 | 5.4%).
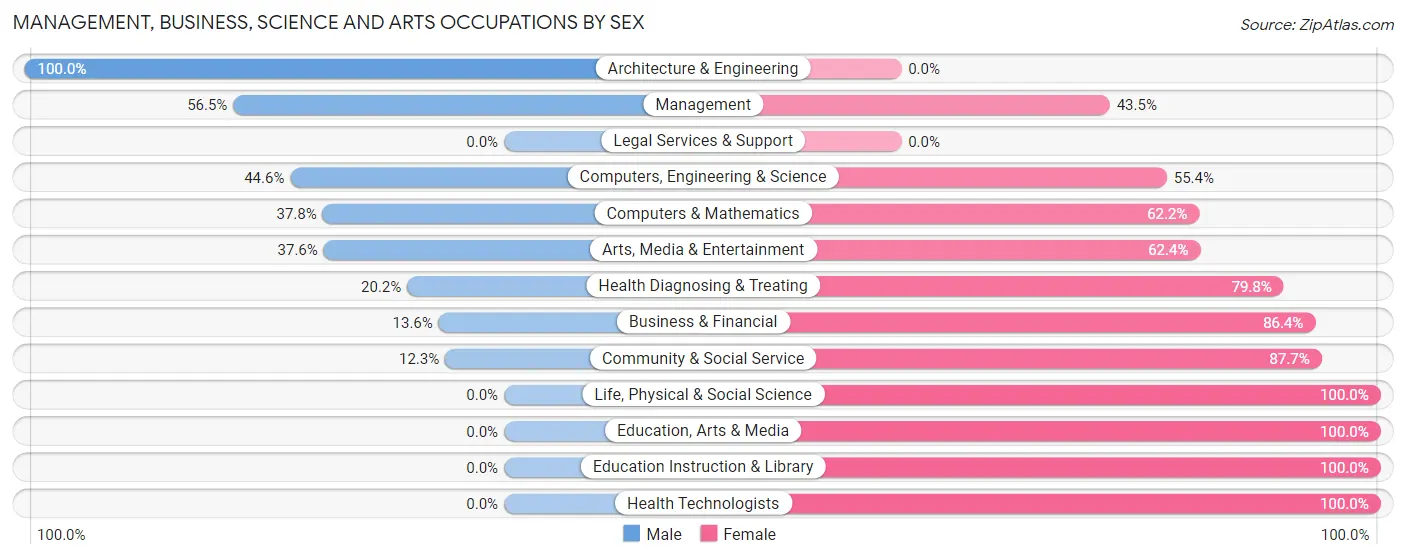
Management, Business, Science and Arts Occupations by Sex
Within the Management, Business, Science and Arts occupations in Schofield Barracks, the most male-oriented occupations are Architecture & Engineering (100.0%), Management (56.5%), and Computers, Engineering & Science (44.6%), while the most female-oriented occupations are Life, Physical & Social Science (100.0%), Education, Arts & Media (100.0%), and Education Instruction & Library (100.0%).
| Occupation | Male | Female |
| Management | 74 (56.5%) | 57 (43.5%) |
| Business & Financial | 6 (13.6%) | 38 (86.4%) |
| Computers, Engineering & Science | 33 (44.6%) | 41 (55.4%) |
| Computers & Mathematics | 14 (37.8%) | 23 (62.2%) |
| Architecture & Engineering | 19 (100.0%) | 0 (0.0%) |
| Life, Physical & Social Science | 0 (0.0%) | 18 (100.0%) |
| Community & Social Service | 38 (12.3%) | 271 (87.7%) |
| Education, Arts & Media | 0 (0.0%) | 79 (100.0%) |
| Legal Services & Support | 0 (0.0%) | 0 (0.0%) |
| Education Instruction & Library | 0 (0.0%) | 129 (100.0%) |
| Arts, Media & Entertainment | 38 (37.6%) | 63 (62.4%) |
| Health Diagnosing & Treating | 57 (20.2%) | 225 (79.8%) |
| Health Technologists | 0 (0.0%) | 124 (100.0%) |
| Total (Category) | 208 (24.8%) | 632 (75.2%) |
| Total (Overall) | 934 (40.7%) | 1,363 (59.3%) |
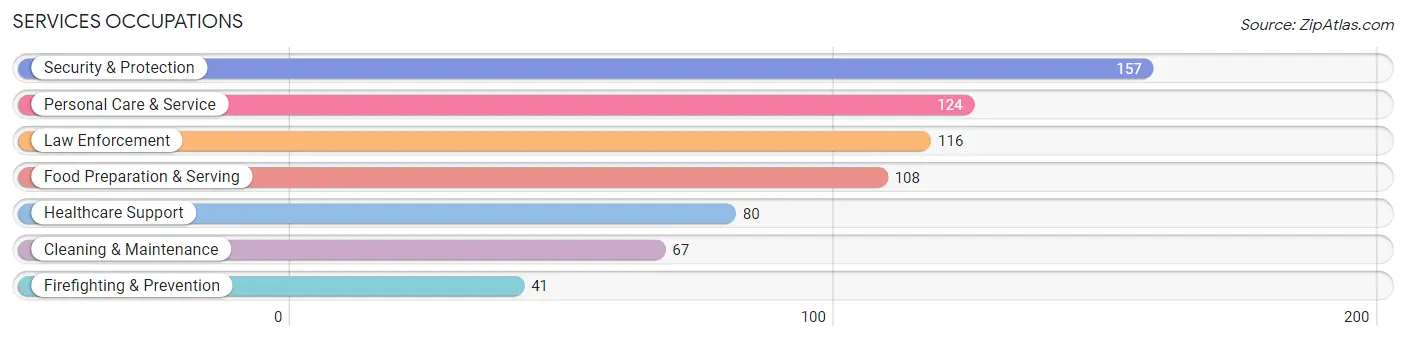
Services Occupations
The most common Services occupations in Schofield Barracks are Security & Protection (157 | 6.8%), Personal Care & Service (124 | 5.4%), Law Enforcement (116 | 5.1%), Food Preparation & Serving (108 | 4.7%), and Healthcare Support (80 | 3.5%).
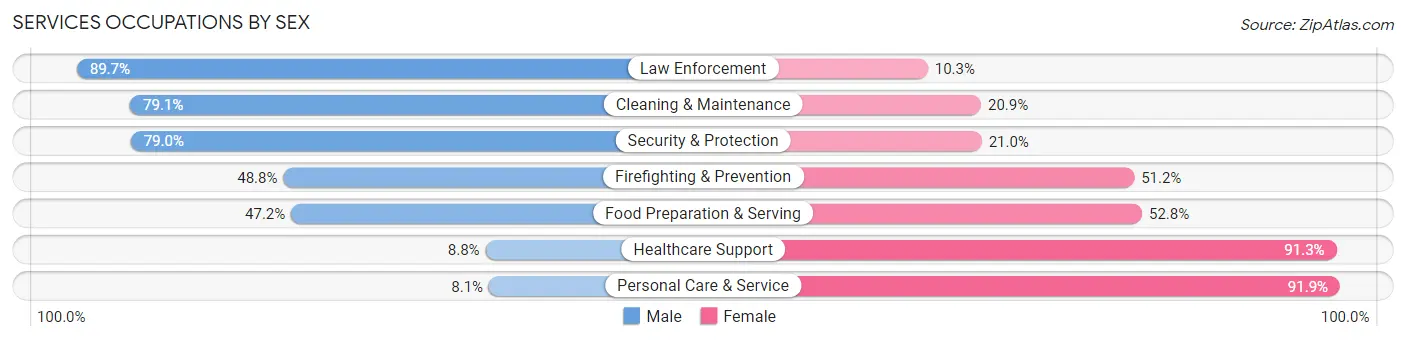
Services Occupations by Sex
Within the Services occupations in Schofield Barracks, the most male-oriented occupations are Law Enforcement (89.7%), Cleaning & Maintenance (79.1%), and Security & Protection (79.0%), while the most female-oriented occupations are Personal Care & Service (91.9%), Healthcare Support (91.2%), and Food Preparation & Serving (52.8%).
| Occupation | Male | Female |
| Healthcare Support | 7 (8.7%) | 73 (91.2%) |
| Security & Protection | 124 (79.0%) | 33 (21.0%) |
| Firefighting & Prevention | 20 (48.8%) | 21 (51.2%) |
| Law Enforcement | 104 (89.7%) | 12 (10.3%) |
| Food Preparation & Serving | 51 (47.2%) | 57 (52.8%) |
| Cleaning & Maintenance | 53 (79.1%) | 14 (20.9%) |
| Personal Care & Service | 10 (8.1%) | 114 (91.9%) |
| Total (Category) | 245 (45.7%) | 291 (54.3%) |
| Total (Overall) | 934 (40.7%) | 1,363 (59.3%) |
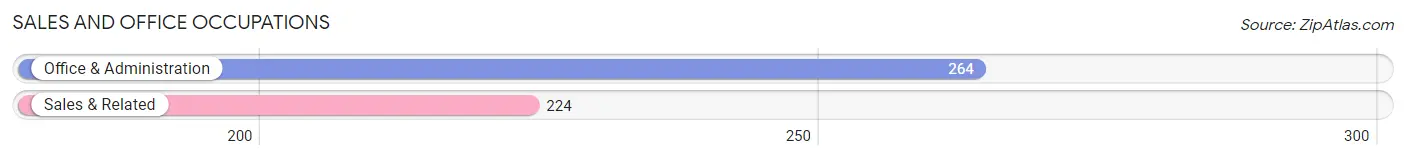
Sales and Office Occupations
The most common Sales and Office occupations in Schofield Barracks are Office & Administration (264 | 11.5%), and Sales & Related (224 | 9.8%).
Sales and Office Occupations by Sex
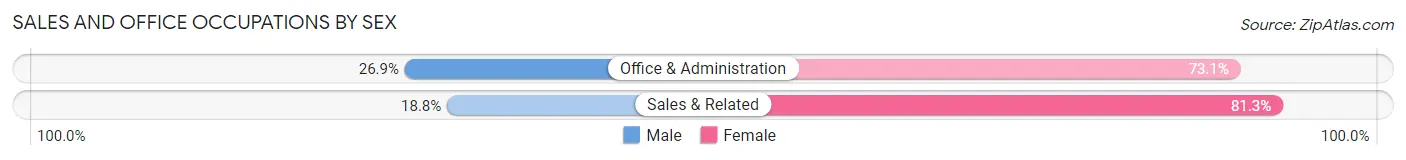
| Occupation | Male | Female |
| Sales & Related | 42 (18.8%) | 182 (81.2%) |
| Office & Administration | 71 (26.9%) | 193 (73.1%) |
| Total (Category) | 113 (23.2%) | 375 (76.8%) |
| Total (Overall) | 934 (40.7%) | 1,363 (59.3%) |
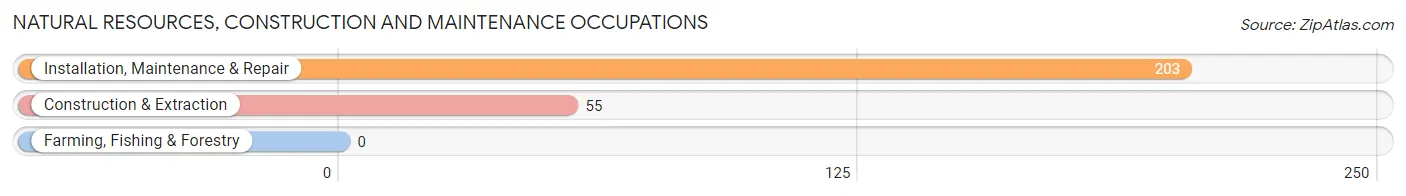
Natural Resources, Construction and Maintenance Occupations
The most common Natural Resources, Construction and Maintenance occupations in Schofield Barracks are Installation, Maintenance & Repair (203 | 8.8%), and Construction & Extraction (55 | 2.4%).
Natural Resources, Construction and Maintenance Occupations by Sex
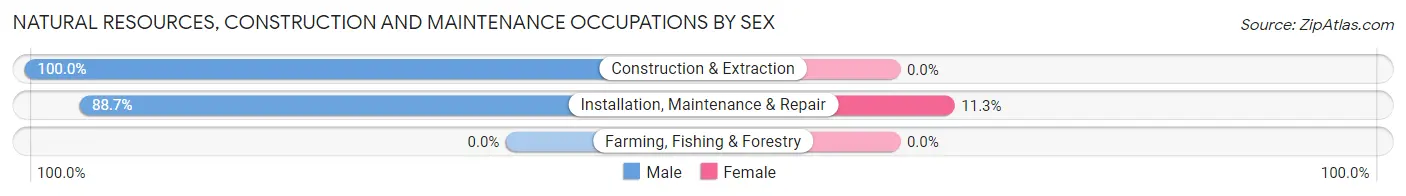
| Occupation | Male | Female |
| Farming, Fishing & Forestry | 0 (0.0%) | 0 (0.0%) |
| Construction & Extraction | 55 (100.0%) | 0 (0.0%) |
| Installation, Maintenance & Repair | 180 (88.7%) | 23 (11.3%) |
| Total (Category) | 235 (91.1%) | 23 (8.9%) |
| Total (Overall) | 934 (40.7%) | 1,363 (59.3%) |
Production, Transportation and Moving Occupations
The most common Production, Transportation and Moving occupations in Schofield Barracks are Material Moving (97 | 4.2%), Transportation (57 | 2.5%), and Production (21 | 0.9%).
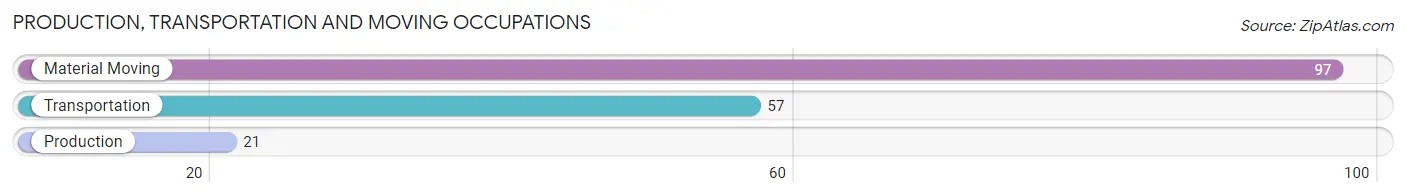
Production, Transportation and Moving Occupations by Sex
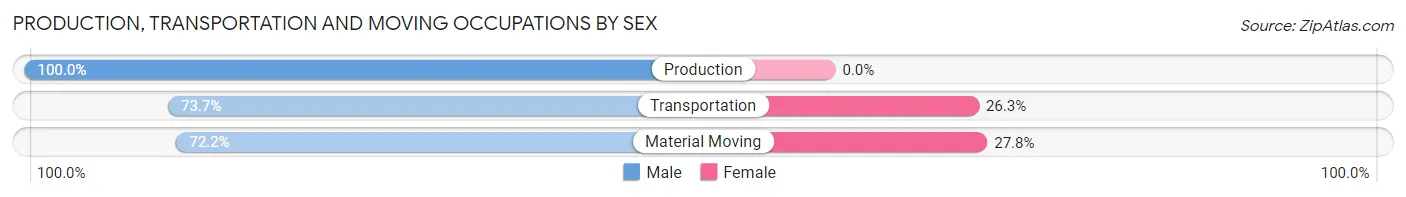
| Occupation | Male | Female |
| Production | 21 (100.0%) | 0 (0.0%) |
| Transportation | 42 (73.7%) | 15 (26.3%) |
| Material Moving | 70 (72.2%) | 27 (27.8%) |
| Total (Category) | 133 (76.0%) | 42 (24.0%) |
| Total (Overall) | 934 (40.7%) | 1,363 (59.3%) |
Employment Industries by Sex in Schofield Barracks
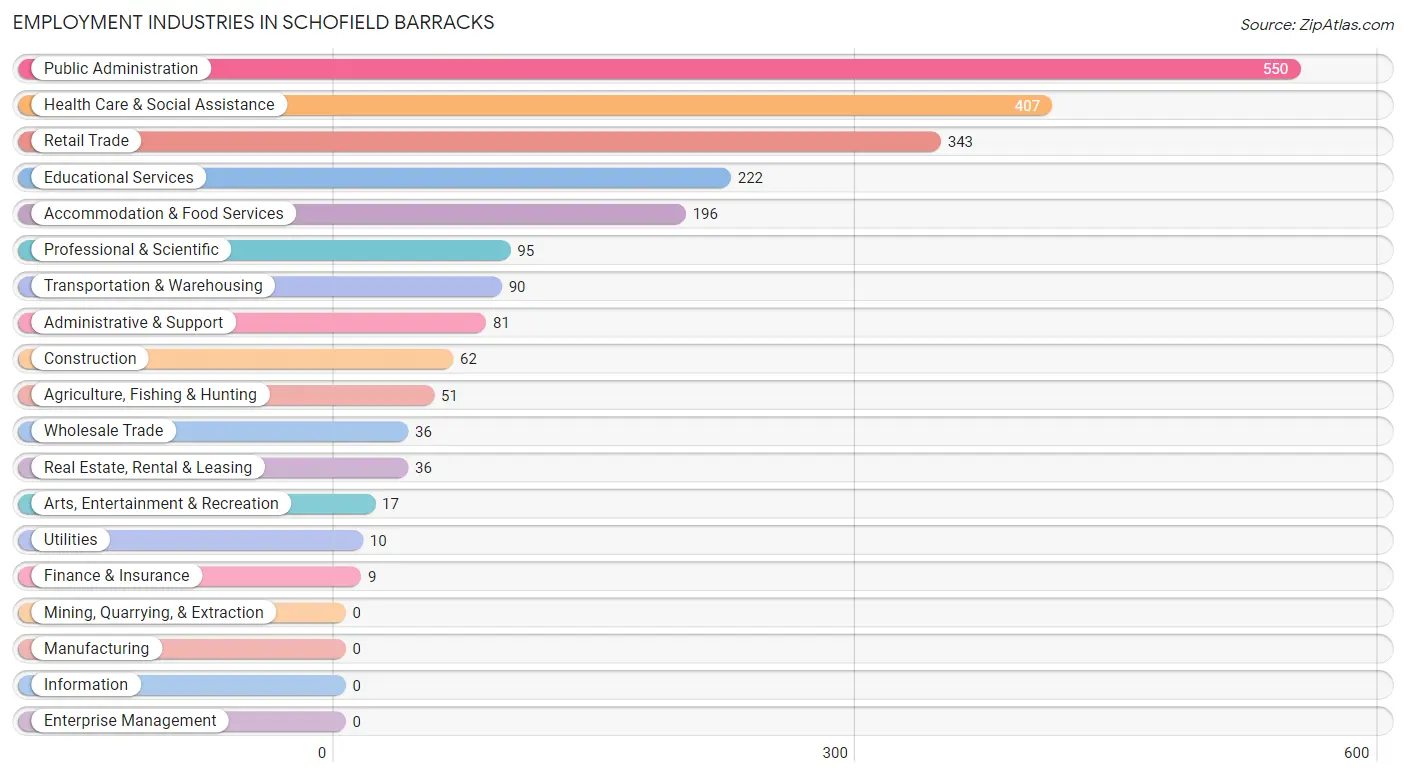
Employment Industries in Schofield Barracks
The major employment industries in Schofield Barracks include Public Administration (550 | 23.9%), Health Care & Social Assistance (407 | 17.7%), Retail Trade (343 | 14.9%), Educational Services (222 | 9.7%), and Accommodation & Food Services (196 | 8.5%).
Employment Industries by Sex in Schofield Barracks
The Schofield Barracks industries that see more men than women are Agriculture, Fishing & Hunting (100.0%), Wholesale Trade (100.0%), and Utilities (100.0%), whereas the industries that tend to have a higher number of women are Finance & Insurance (100.0%), Educational Services (97.8%), and Health Care & Social Assistance (92.4%).
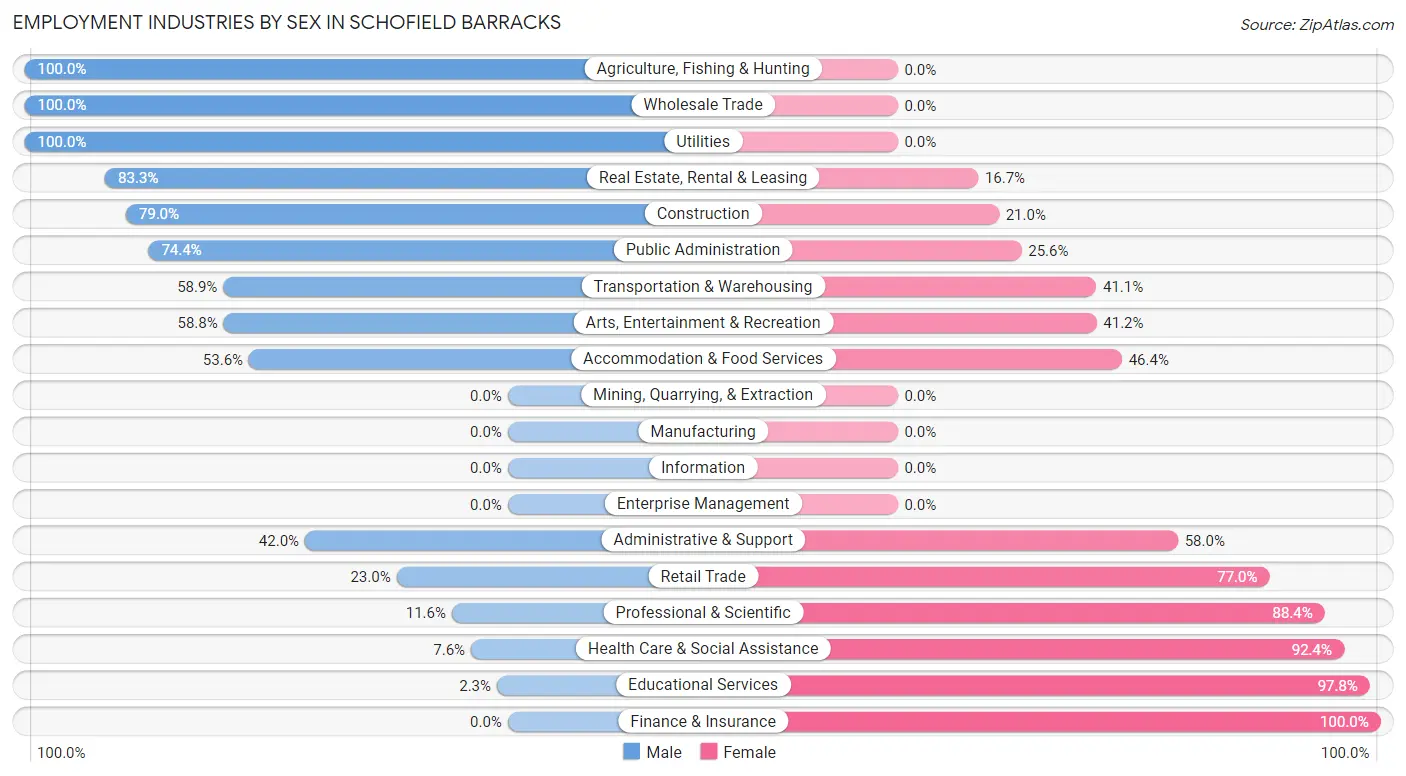
| Industry | Male | Female |
| Agriculture, Fishing & Hunting | 51 (100.0%) | 0 (0.0%) |
| Mining, Quarrying, & Extraction | 0 (0.0%) | 0 (0.0%) |
| Construction | 49 (79.0%) | 13 (21.0%) |
| Manufacturing | 0 (0.0%) | 0 (0.0%) |
| Wholesale Trade | 36 (100.0%) | 0 (0.0%) |
| Retail Trade | 79 (23.0%) | 264 (77.0%) |
| Transportation & Warehousing | 53 (58.9%) | 37 (41.1%) |
| Utilities | 10 (100.0%) | 0 (0.0%) |
| Information | 0 (0.0%) | 0 (0.0%) |
| Finance & Insurance | 0 (0.0%) | 9 (100.0%) |
| Real Estate, Rental & Leasing | 30 (83.3%) | 6 (16.7%) |
| Professional & Scientific | 11 (11.6%) | 84 (88.4%) |
| Enterprise Management | 0 (0.0%) | 0 (0.0%) |
| Administrative & Support | 34 (42.0%) | 47 (58.0%) |
| Educational Services | 5 (2.2%) | 217 (97.8%) |
| Health Care & Social Assistance | 31 (7.6%) | 376 (92.4%) |
| Arts, Entertainment & Recreation | 10 (58.8%) | 7 (41.2%) |
| Accommodation & Food Services | 105 (53.6%) | 91 (46.4%) |
| Public Administration | 409 (74.4%) | 141 (25.6%) |
| Total | 934 (40.7%) | 1,363 (59.3%) |
Education in Schofield Barracks
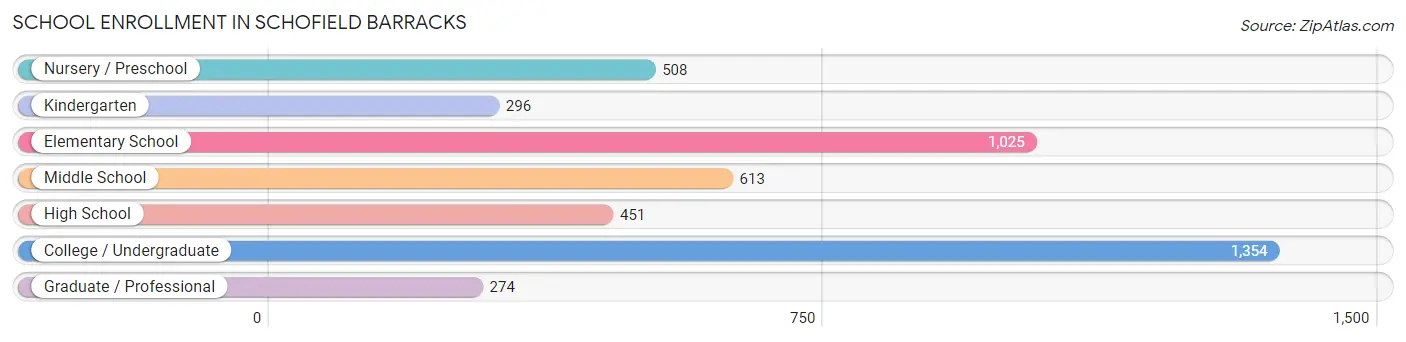
School Enrollment in Schofield Barracks
The most common levels of schooling among the 4,521 students in Schofield Barracks are college / undergraduate (1,354 | 29.9%), elementary school (1,025 | 22.7%), and middle school (613 | 13.6%).
| School Level | # Students | % Students |
| Nursery / Preschool | 508 | 11.2% |
| Kindergarten | 296 | 6.6% |
| Elementary School | 1,025 | 22.7% |
| Middle School | 613 | 13.6% |
| High School | 451 | 10.0% |
| College / Undergraduate | 1,354 | 29.9% |
| Graduate / Professional | 274 | 6.1% |
| Total | 4,521 | 100.0% |
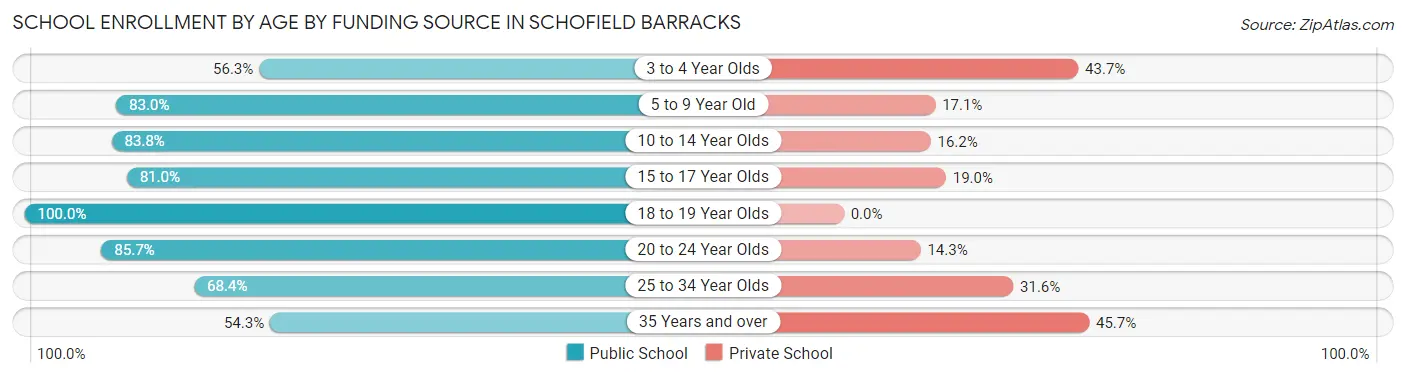
School Enrollment by Age by Funding Source in Schofield Barracks
Out of a total of 4,521 students who are enrolled in schools in Schofield Barracks, 1,040 (23.0%) attend a private institution, while the remaining 3,481 (77.0%) are enrolled in public schools. The age group of 35 years and over has the highest likelihood of being enrolled in private schools, with 112 (45.7% in the age bracket) enrolled. Conversely, the age group of 18 to 19 year olds has the lowest likelihood of being enrolled in a private school, with 79 (100.0% in the age bracket) attending a public institution.
| Age Bracket | Public School | Private School |
| 3 to 4 Year Olds | 254 (56.3%) | 197 (43.7%) |
| 5 to 9 Year Old | 1,075 (83.0%) | 221 (17.1%) |
| 10 to 14 Year Olds | 684 (83.8%) | 132 (16.2%) |
| 15 to 17 Year Olds | 234 (81.0%) | 55 (19.0%) |
| 18 to 19 Year Olds | 79 (100.0%) | 0 (0.0%) |
| 20 to 24 Year Olds | 509 (85.7%) | 85 (14.3%) |
| 25 to 34 Year Olds | 514 (68.4%) | 237 (31.6%) |
| 35 Years and over | 133 (54.3%) | 112 (45.7%) |
| Total | 3,481 (77.0%) | 1,040 (23.0%) |
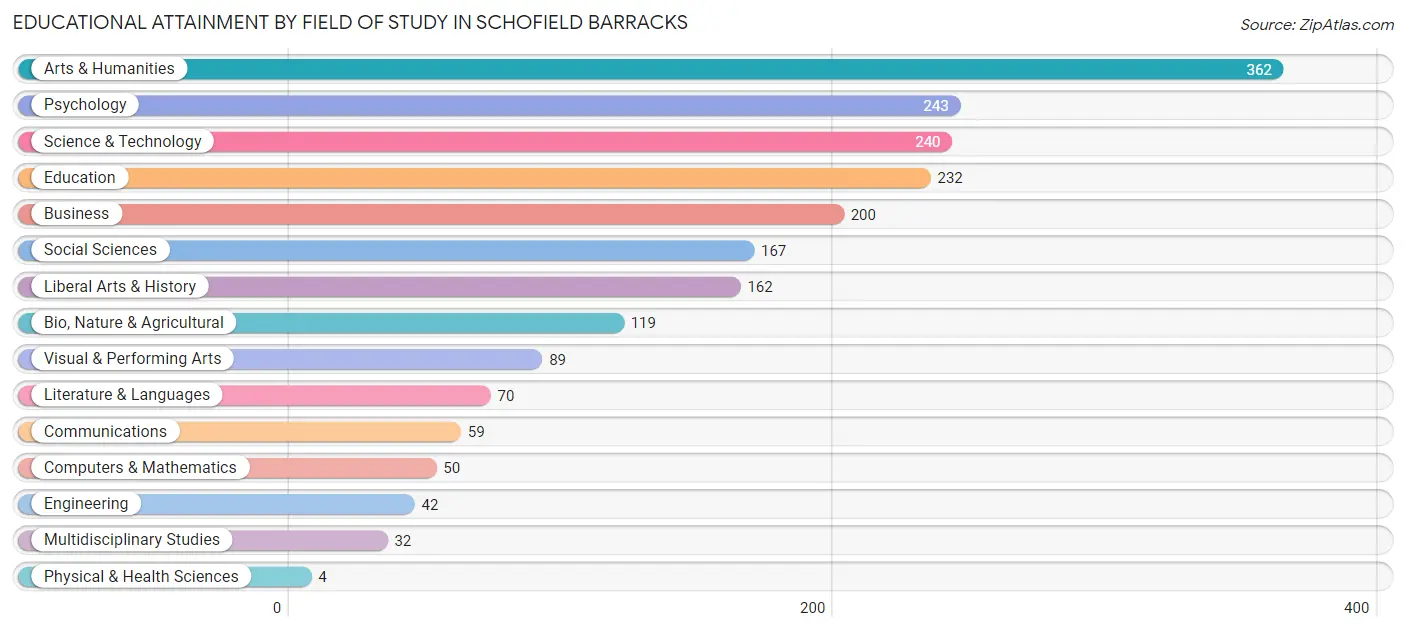
Educational Attainment by Field of Study in Schofield Barracks
Arts & humanities (362 | 17.5%), psychology (243 | 11.7%), science & technology (240 | 11.6%), education (232 | 11.2%), and business (200 | 9.7%) are the most common fields of study among 2,071 individuals in Schofield Barracks who have obtained a bachelor's degree or higher.
| Field of Study | # Graduates | % Graduates |
| Computers & Mathematics | 50 | 2.4% |
| Bio, Nature & Agricultural | 119 | 5.8% |
| Physical & Health Sciences | 4 | 0.2% |
| Psychology | 243 | 11.7% |
| Social Sciences | 167 | 8.1% |
| Engineering | 42 | 2.0% |
| Multidisciplinary Studies | 32 | 1.5% |
| Science & Technology | 240 | 11.6% |
| Business | 200 | 9.7% |
| Education | 232 | 11.2% |
| Literature & Languages | 70 | 3.4% |
| Liberal Arts & History | 162 | 7.8% |
| Visual & Performing Arts | 89 | 4.3% |
| Communications | 59 | 2.9% |
| Arts & Humanities | 362 | 17.5% |
| Total | 2,071 | 100.0% |
Transportation & Commute in Schofield Barracks
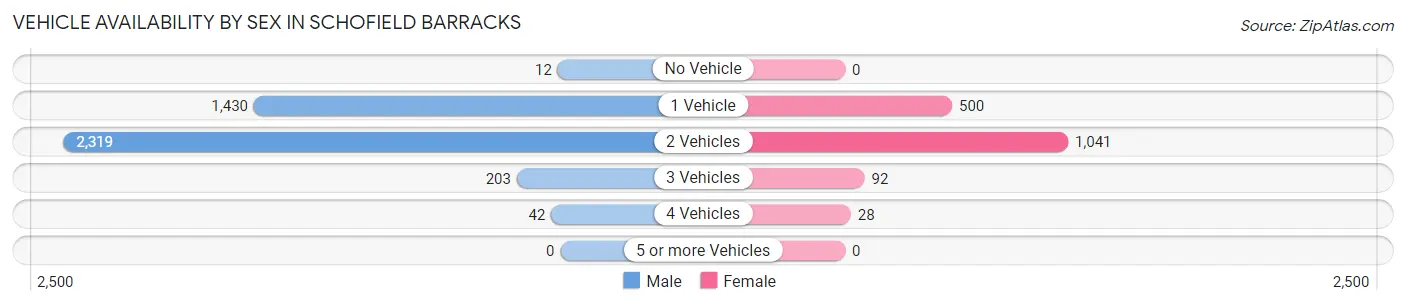
Vehicle Availability by Sex in Schofield Barracks
The most prevalent vehicle ownership categories in Schofield Barracks are males with 2 vehicles (2,319, accounting for 57.9%) and females with 2 vehicles (1,041, making up 139.6%).
| Vehicles Available | Male | Female |
| No Vehicle | 12 (0.3%) | 0 (0.0%) |
| 1 Vehicle | 1,430 (35.7%) | 500 (30.1%) |
| 2 Vehicles | 2,319 (57.9%) | 1,041 (62.7%) |
| 3 Vehicles | 203 (5.1%) | 92 (5.5%) |
| 4 Vehicles | 42 (1.1%) | 28 (1.7%) |
| 5 or more Vehicles | 0 (0.0%) | 0 (0.0%) |
| Total | 4,006 (100.0%) | 1,661 (100.0%) |
Commute Time in Schofield Barracks
The most frequently occuring commute durations in Schofield Barracks are 5 to 9 minutes (3,767 commuters, 36.2%), 10 to 14 minutes (2,002 commuters, 19.2%), and less than 5 minutes (1,831 commuters, 17.6%).
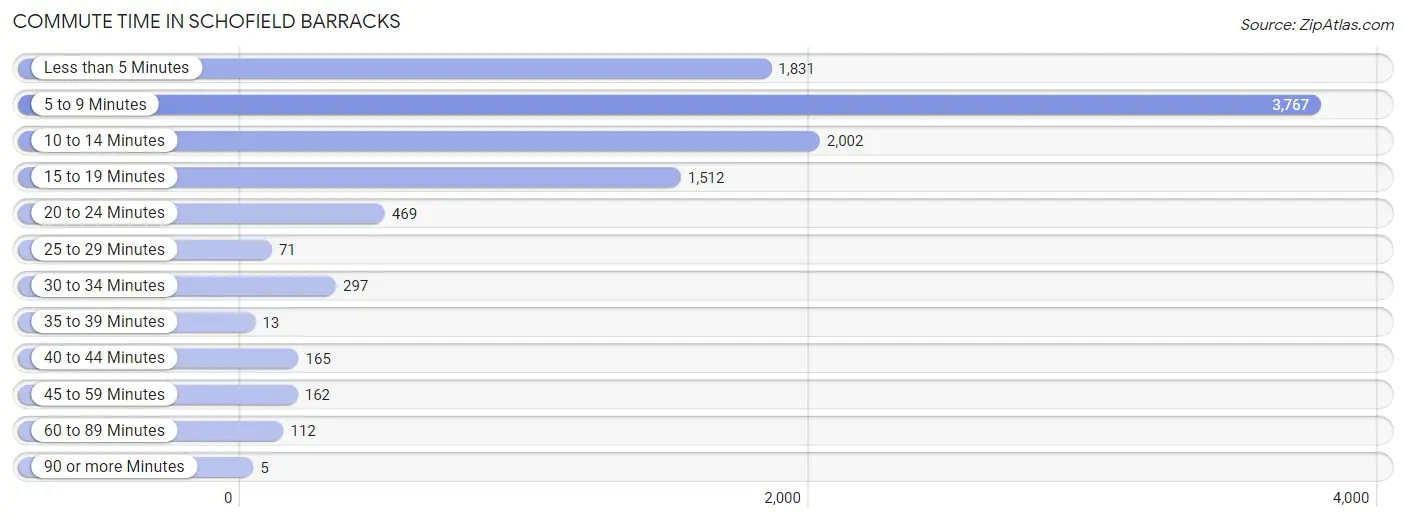
| Commute Time | # Commuters | % Commuters |
| Less than 5 Minutes | 1,831 | 17.6% |
| 5 to 9 Minutes | 3,767 | 36.2% |
| 10 to 14 Minutes | 2,002 | 19.2% |
| 15 to 19 Minutes | 1,512 | 14.5% |
| 20 to 24 Minutes | 469 | 4.5% |
| 25 to 29 Minutes | 71 | 0.7% |
| 30 to 34 Minutes | 297 | 2.9% |
| 35 to 39 Minutes | 13 | 0.1% |
| 40 to 44 Minutes | 165 | 1.6% |
| 45 to 59 Minutes | 162 | 1.6% |
| 60 to 89 Minutes | 112 | 1.1% |
| 90 or more Minutes | 5 | 0.1% |
Commute Time by Sex in Schofield Barracks
The most common commute times in Schofield Barracks are 5 to 9 minutes (3,292 commuters, 39.7%) for males and 5 to 9 minutes (475 commuters, 22.5%) for females.
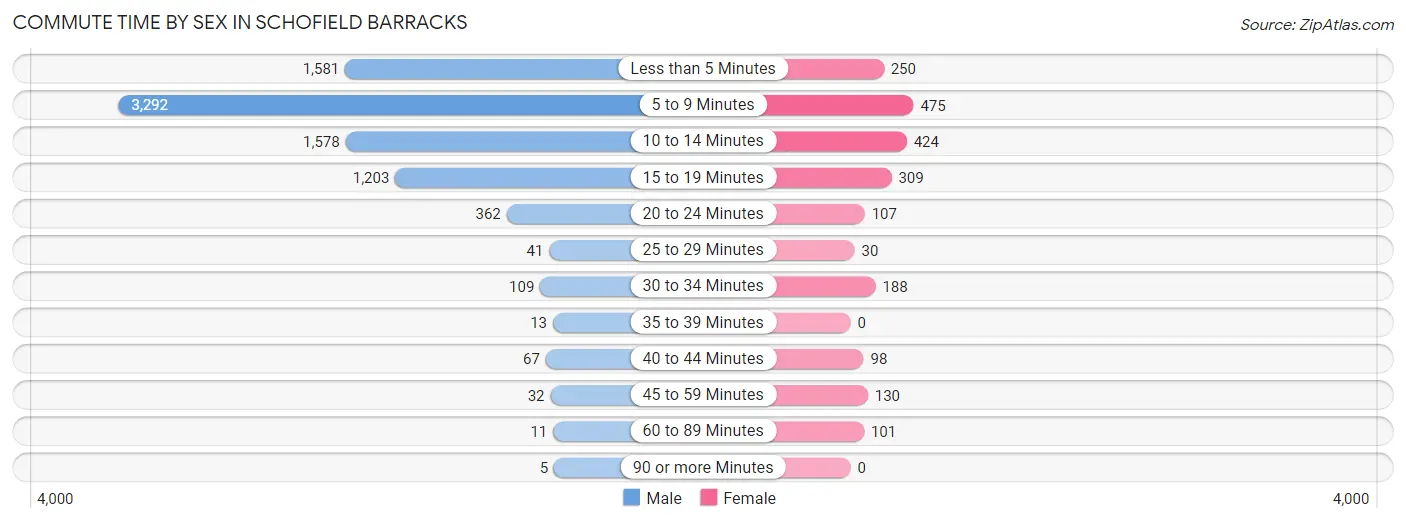
| Commute Time | Male | Female |
| Less than 5 Minutes | 1,581 (19.1%) | 250 (11.8%) |
| 5 to 9 Minutes | 3,292 (39.7%) | 475 (22.5%) |
| 10 to 14 Minutes | 1,578 (19.0%) | 424 (20.1%) |
| 15 to 19 Minutes | 1,203 (14.5%) | 309 (14.6%) |
| 20 to 24 Minutes | 362 (4.4%) | 107 (5.1%) |
| 25 to 29 Minutes | 41 (0.5%) | 30 (1.4%) |
| 30 to 34 Minutes | 109 (1.3%) | 188 (8.9%) |
| 35 to 39 Minutes | 13 (0.2%) | 0 (0.0%) |
| 40 to 44 Minutes | 67 (0.8%) | 98 (4.6%) |
| 45 to 59 Minutes | 32 (0.4%) | 130 (6.2%) |
| 60 to 89 Minutes | 11 (0.1%) | 101 (4.8%) |
| 90 or more Minutes | 5 (0.1%) | 0 (0.0%) |
Time of Departure to Work by Sex in Schofield Barracks
The most frequent times of departure to work in Schofield Barracks are 6:00 AM to 6:29 AM (1,915, 23.1%) for males and 6:00 AM to 6:29 AM (424, 20.1%) for females.
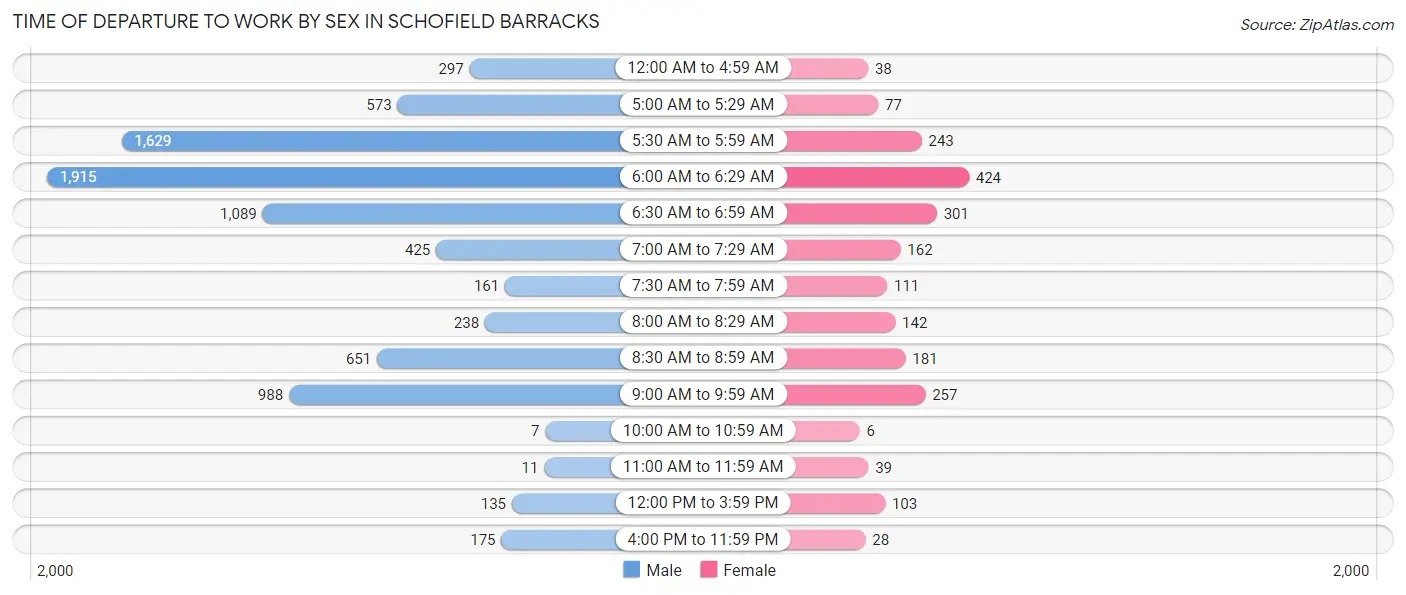
| Time of Departure | Male | Female |
| 12:00 AM to 4:59 AM | 297 (3.6%) | 38 (1.8%) |
| 5:00 AM to 5:29 AM | 573 (6.9%) | 77 (3.6%) |
| 5:30 AM to 5:59 AM | 1,629 (19.6%) | 243 (11.5%) |
| 6:00 AM to 6:29 AM | 1,915 (23.1%) | 424 (20.1%) |
| 6:30 AM to 6:59 AM | 1,089 (13.1%) | 301 (14.2%) |
| 7:00 AM to 7:29 AM | 425 (5.1%) | 162 (7.7%) |
| 7:30 AM to 7:59 AM | 161 (1.9%) | 111 (5.3%) |
| 8:00 AM to 8:29 AM | 238 (2.9%) | 142 (6.7%) |
| 8:30 AM to 8:59 AM | 651 (7.9%) | 181 (8.6%) |
| 9:00 AM to 9:59 AM | 988 (11.9%) | 257 (12.2%) |
| 10:00 AM to 10:59 AM | 7 (0.1%) | 6 (0.3%) |
| 11:00 AM to 11:59 AM | 11 (0.1%) | 39 (1.8%) |
| 12:00 PM to 3:59 PM | 135 (1.6%) | 103 (4.9%) |
| 4:00 PM to 11:59 PM | 175 (2.1%) | 28 (1.3%) |
| Total | 8,294 (100.0%) | 2,112 (100.0%) |
Housing Occupancy in Schofield Barracks
Occupancy by Ownership in Schofield Barracks
Of the total 4,213 dwellings in Schofield Barracks, owner-occupied units account for 10 (0.2%), while renter-occupied units make up 4,203 (99.8%).
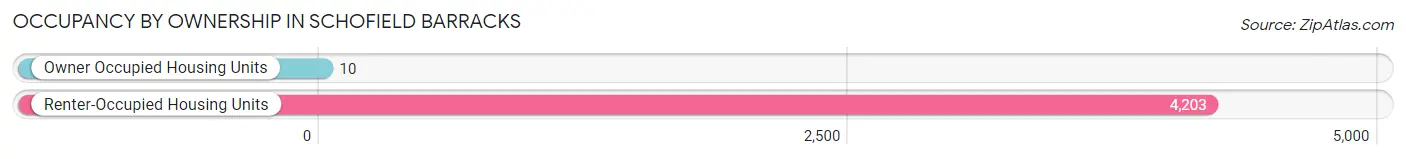
| Occupancy | # Housing Units | % Housing Units |
| Owner Occupied Housing Units | 10 | 0.2% |
| Renter-Occupied Housing Units | 4,203 | 99.8% |
| Total Occupied Housing Units | 4,213 | 100.0% |
Occupancy by Household Size in Schofield Barracks
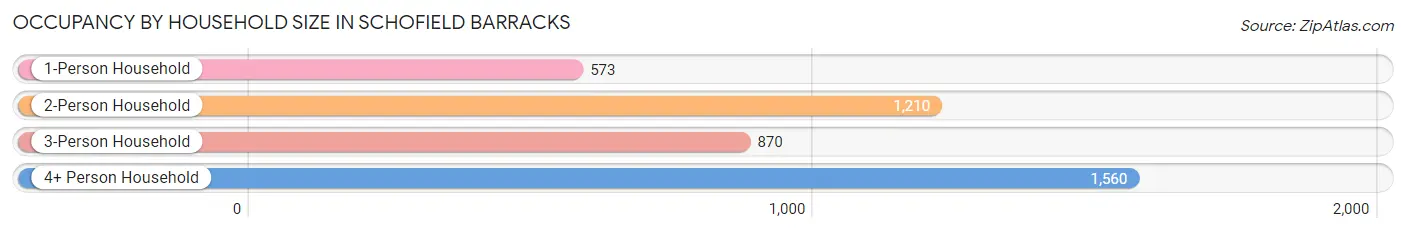
| Household Size | # Housing Units | % Housing Units |
| 1-Person Household | 573 | 13.6% |
| 2-Person Household | 1,210 | 28.7% |
| 3-Person Household | 870 | 20.6% |
| 4+ Person Household | 1,560 | 37.0% |
| Total Housing Units | 4,213 | 100.0% |
Occupancy by Ownership by Household Size in Schofield Barracks
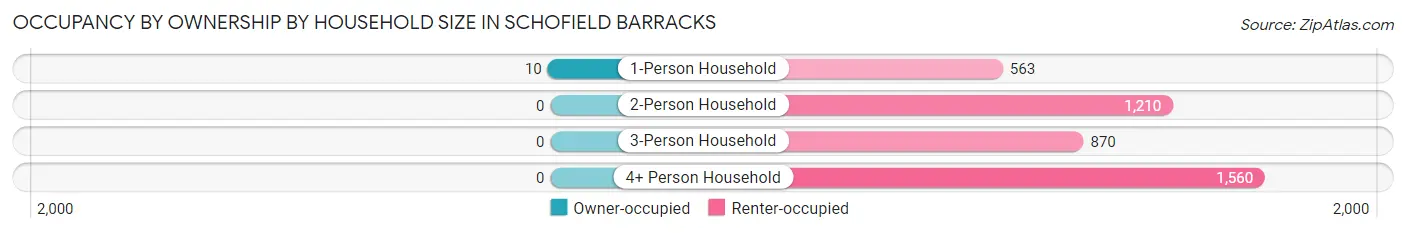
| Household Size | Owner-occupied | Renter-occupied |
| 1-Person Household | 10 (1.8%) | 563 (98.3%) |
| 2-Person Household | 0 (0.0%) | 1,210 (100.0%) |
| 3-Person Household | 0 (0.0%) | 870 (100.0%) |
| 4+ Person Household | 0 (0.0%) | 1,560 (100.0%) |
| Total Housing Units | 10 (0.2%) | 4,203 (99.8%) |
Occupancy by Educational Attainment in Schofield Barracks
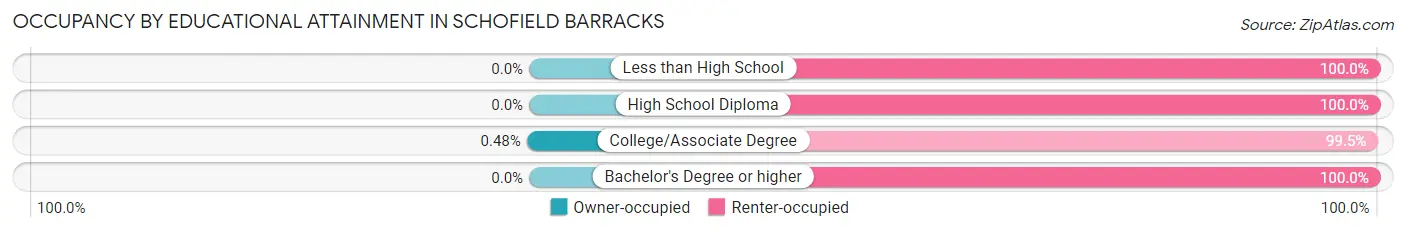
| Household Size | Owner-occupied | Renter-occupied |
| Less than High School | 0 (0.0%) | 7 (100.0%) |
| High School Diploma | 0 (0.0%) | 1,106 (100.0%) |
| College/Associate Degree | 10 (0.5%) | 2,078 (99.5%) |
| Bachelor's Degree or higher | 0 (0.0%) | 1,012 (100.0%) |
Occupancy by Age of Householder in Schofield Barracks
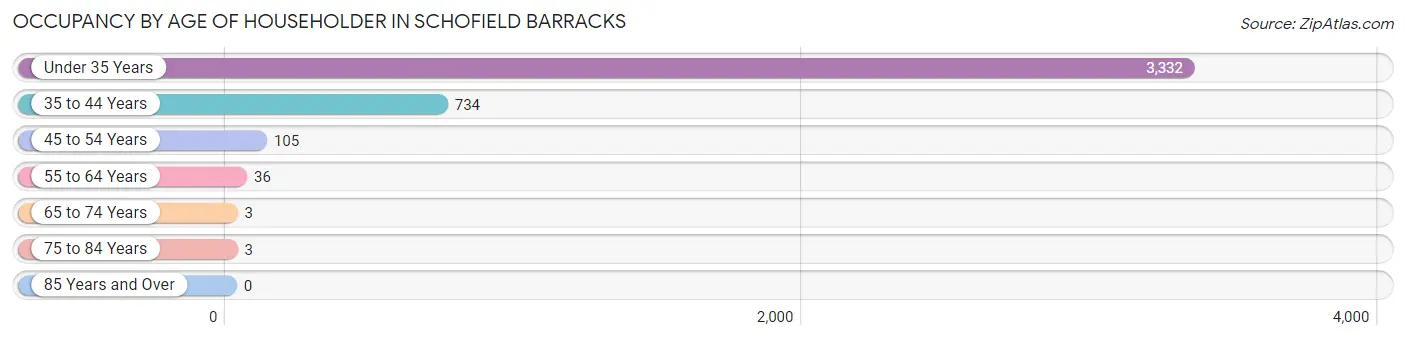
| Age Bracket | # Households | % Households |
| Under 35 Years | 3,332 | 79.1% |
| 35 to 44 Years | 734 | 17.4% |
| 45 to 54 Years | 105 | 2.5% |
| 55 to 64 Years | 36 | 0.9% |
| 65 to 74 Years | 3 | 0.1% |
| 75 to 84 Years | 3 | 0.1% |
| 85 Years and Over | 0 | 0.0% |
| Total | 4,213 | 100.0% |
Housing Finances in Schofield Barracks
Median Income by Occupancy in Schofield Barracks
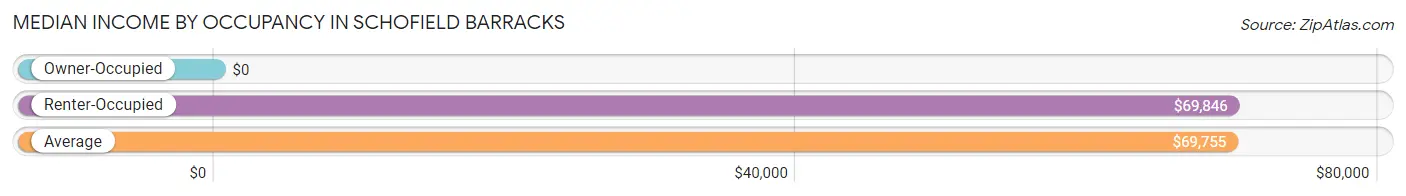
| Occupancy Type | # Households | Median Income |
| Owner-Occupied | 10 (0.2%) | $0 |
| Renter-Occupied | 4,203 (99.8%) | $69,846 |
| Average | 4,213 (100.0%) | $69,755 |
Occupancy by Householder Income Bracket in Schofield Barracks
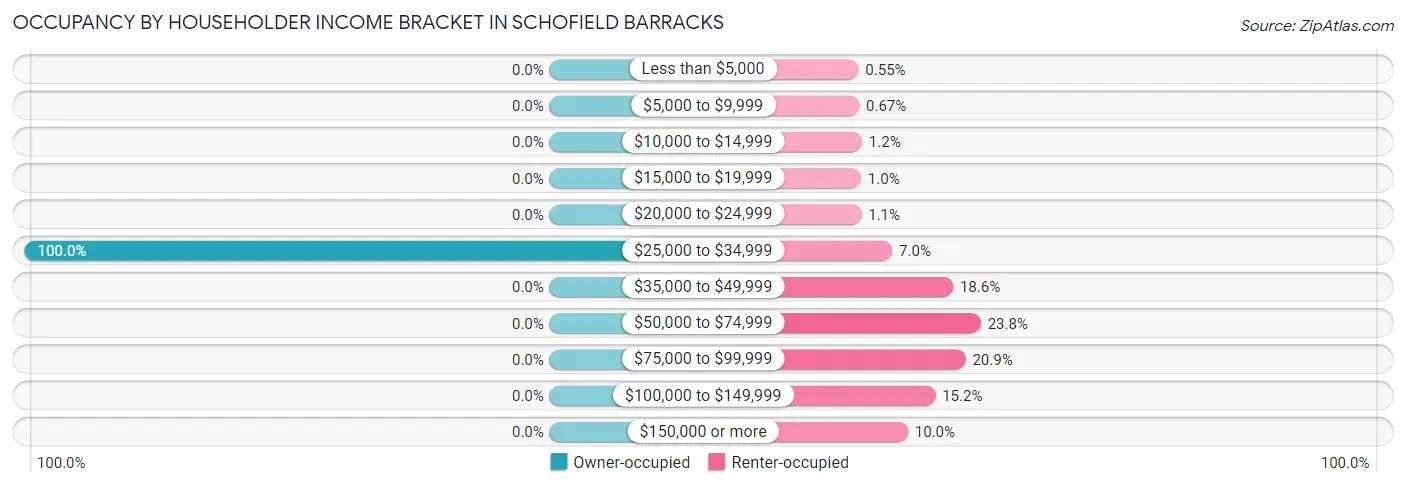
| Income Bracket | Owner-occupied | Renter-occupied |
| Less than $5,000 | 0 (0.0%) | 23 (0.5%) |
| $5,000 to $9,999 | 0 (0.0%) | 28 (0.7%) |
| $10,000 to $14,999 | 0 (0.0%) | 51 (1.2%) |
| $15,000 to $19,999 | 0 (0.0%) | 43 (1.0%) |
| $20,000 to $24,999 | 0 (0.0%) | 46 (1.1%) |
| $25,000 to $34,999 | 10 (100.0%) | 293 (7.0%) |
| $35,000 to $49,999 | 0 (0.0%) | 780 (18.6%) |
| $50,000 to $74,999 | 0 (0.0%) | 1,002 (23.8%) |
| $75,000 to $99,999 | 0 (0.0%) | 880 (20.9%) |
| $100,000 to $149,999 | 0 (0.0%) | 638 (15.2%) |
| $150,000 or more | 0 (0.0%) | 419 (10.0%) |
| Total | 10 (100.0%) | 4,203 (100.0%) |
Monthly Housing Cost Tiers in Schofield Barracks
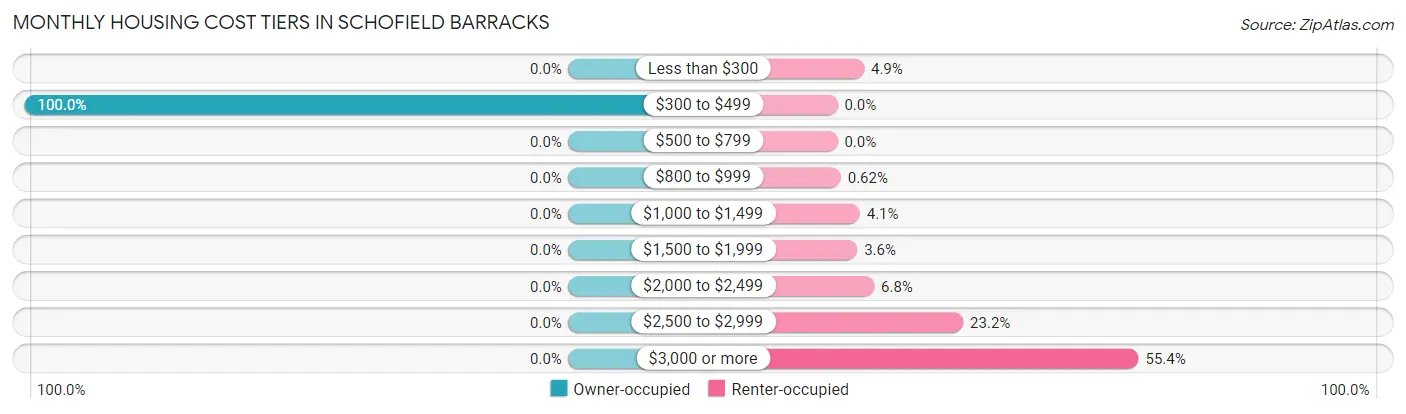
| Monthly Cost | Owner-occupied | Renter-occupied |
| Less than $300 | 0 (0.0%) | 206 (4.9%) |
| $300 to $499 | 10 (100.0%) | 0 (0.0%) |
| $500 to $799 | 0 (0.0%) | 0 (0.0%) |
| $800 to $999 | 0 (0.0%) | 26 (0.6%) |
| $1,000 to $1,499 | 0 (0.0%) | 173 (4.1%) |
| $1,500 to $1,999 | 0 (0.0%) | 153 (3.6%) |
| $2,000 to $2,499 | 0 (0.0%) | 284 (6.8%) |
| $2,500 to $2,999 | 0 (0.0%) | 973 (23.2%) |
| $3,000 or more | 0 (0.0%) | 2,330 (55.4%) |
| Total | 10 (100.0%) | 4,203 (100.0%) |
Physical Housing Characteristics in Schofield Barracks
Housing Structures in Schofield Barracks
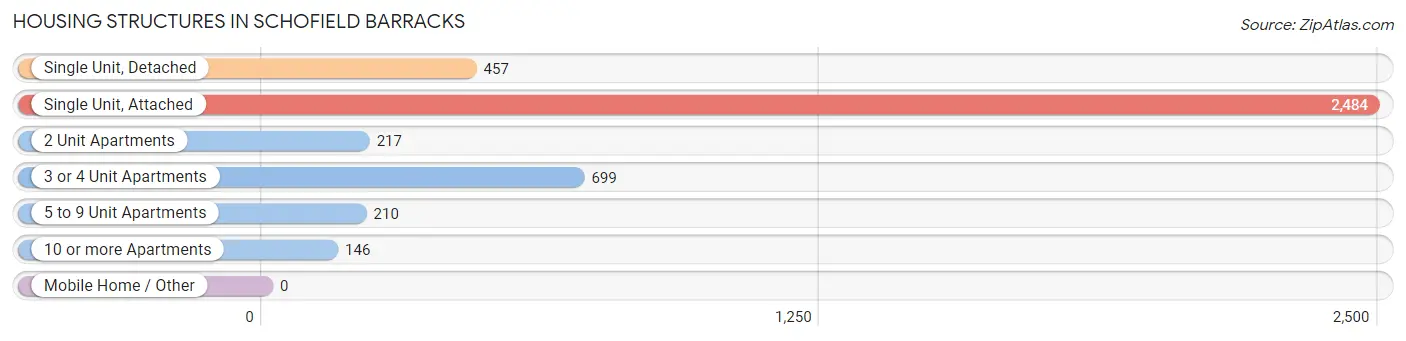
| Structure Type | # Housing Units | % Housing Units |
| Single Unit, Detached | 457 | 10.8% |
| Single Unit, Attached | 2,484 | 59.0% |
| 2 Unit Apartments | 217 | 5.1% |
| 3 or 4 Unit Apartments | 699 | 16.6% |
| 5 to 9 Unit Apartments | 210 | 5.0% |
| 10 or more Apartments | 146 | 3.5% |
| Mobile Home / Other | 0 | 0.0% |
| Total | 4,213 | 100.0% |
Housing Structures by Occupancy in Schofield Barracks
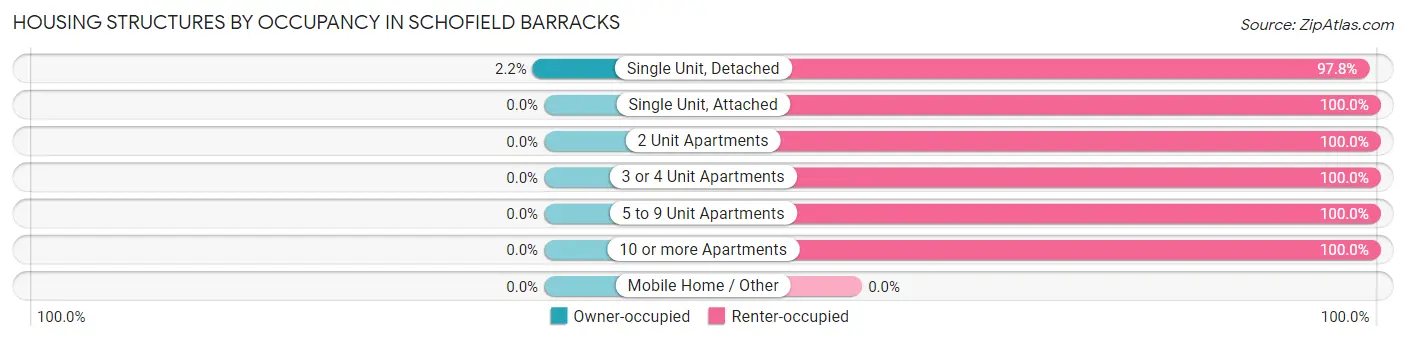
| Structure Type | Owner-occupied | Renter-occupied |
| Single Unit, Detached | 10 (2.2%) | 447 (97.8%) |
| Single Unit, Attached | 0 (0.0%) | 2,484 (100.0%) |
| 2 Unit Apartments | 0 (0.0%) | 217 (100.0%) |
| 3 or 4 Unit Apartments | 0 (0.0%) | 699 (100.0%) |
| 5 to 9 Unit Apartments | 0 (0.0%) | 210 (100.0%) |
| 10 or more Apartments | 0 (0.0%) | 146 (100.0%) |
| Mobile Home / Other | 0 (0.0%) | 0 (0.0%) |
| Total | 10 (0.2%) | 4,203 (99.8%) |
Housing Structures by Number of Rooms in Schofield Barracks
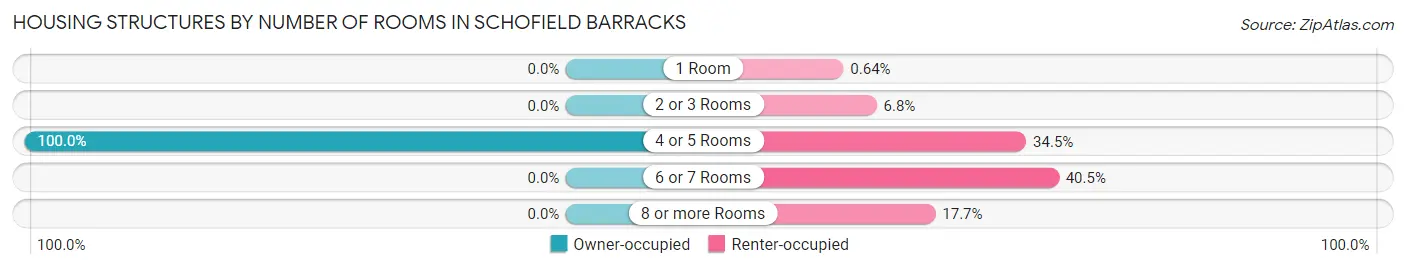
| Number of Rooms | Owner-occupied | Renter-occupied |
| 1 Room | 0 (0.0%) | 27 (0.6%) |
| 2 or 3 Rooms | 0 (0.0%) | 285 (6.8%) |
| 4 or 5 Rooms | 10 (100.0%) | 1,448 (34.4%) |
| 6 or 7 Rooms | 0 (0.0%) | 1,701 (40.5%) |
| 8 or more Rooms | 0 (0.0%) | 742 (17.6%) |
| Total | 10 (100.0%) | 4,203 (100.0%) |
Housing Structure by Heating Type in Schofield Barracks
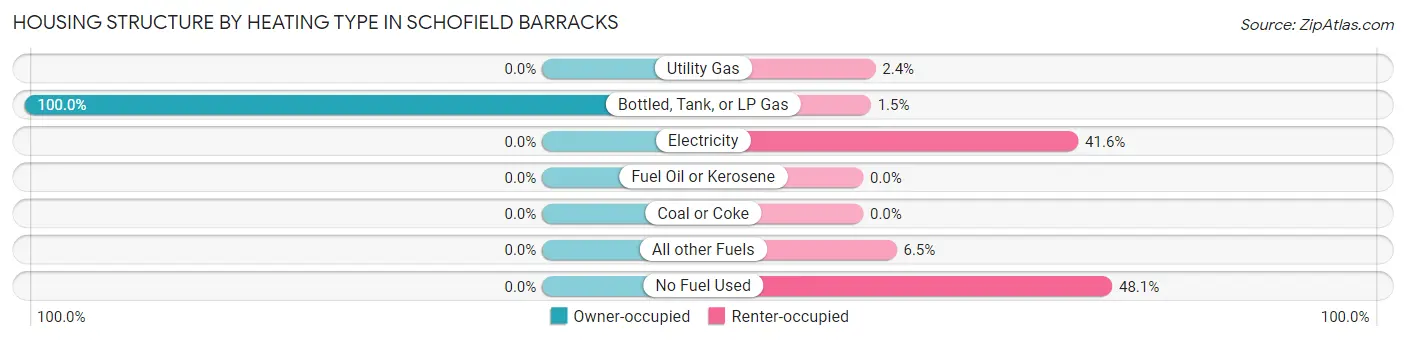
| Heating Type | Owner-occupied | Renter-occupied |
| Utility Gas | 0 (0.0%) | 100 (2.4%) |
| Bottled, Tank, or LP Gas | 10 (100.0%) | 62 (1.5%) |
| Electricity | 0 (0.0%) | 1,747 (41.6%) |
| Fuel Oil or Kerosene | 0 (0.0%) | 0 (0.0%) |
| Coal or Coke | 0 (0.0%) | 0 (0.0%) |
| All other Fuels | 0 (0.0%) | 272 (6.5%) |
| No Fuel Used | 0 (0.0%) | 2,022 (48.1%) |
| Total | 10 (100.0%) | 4,203 (100.0%) |
Household Vehicle Usage in Schofield Barracks
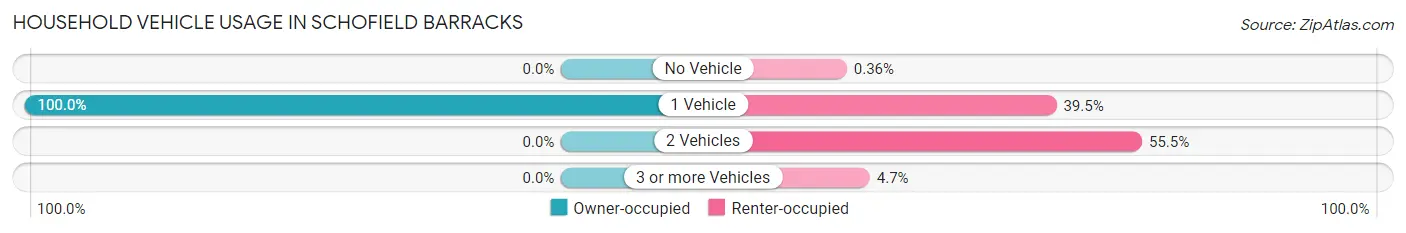
| Vehicles per Household | Owner-occupied | Renter-occupied |
| No Vehicle | 0 (0.0%) | 15 (0.4%) |
| 1 Vehicle | 10 (100.0%) | 1,660 (39.5%) |
| 2 Vehicles | 0 (0.0%) | 2,332 (55.5%) |
| 3 or more Vehicles | 0 (0.0%) | 196 (4.7%) |
| Total | 10 (100.0%) | 4,203 (100.0%) |
Real Estate & Mortgages in Schofield Barracks
Real Estate and Mortgage Overview in Schofield Barracks
| Characteristic | Without Mortgage | With Mortgage |
| Housing Units | 10 | 0 |
| Median Property Value | - | - |
| Median Household Income | - | - |
| Monthly Housing Costs | - | - |
| Real Estate Taxes | - | - |
Property Value by Mortgage Status in Schofield Barracks
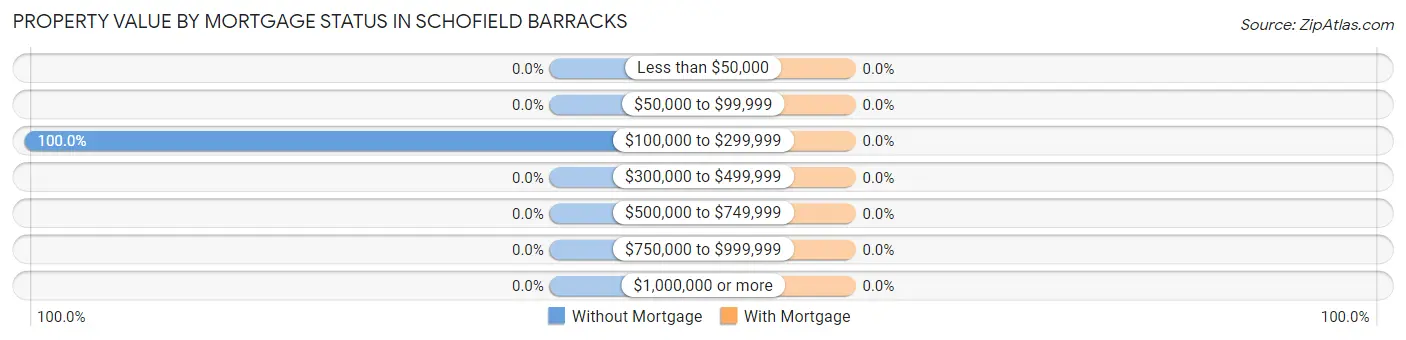
| Property Value | Without Mortgage | With Mortgage |
| Less than $50,000 | 0 (0.0%) | 0 (0.0%) |
| $50,000 to $99,999 | 0 (0.0%) | 0 (0.0%) |
| $100,000 to $299,999 | 10 (100.0%) | 0 (0.0%) |
| $300,000 to $499,999 | 0 (0.0%) | 0 (0.0%) |
| $500,000 to $749,999 | 0 (0.0%) | 0 (0.0%) |
| $750,000 to $999,999 | 0 (0.0%) | 0 (0.0%) |
| $1,000,000 or more | 0 (0.0%) | 0 (0.0%) |
| Total | 10 (100.0%) | 0 (0.0%) |
Household Income by Mortgage Status in Schofield Barracks
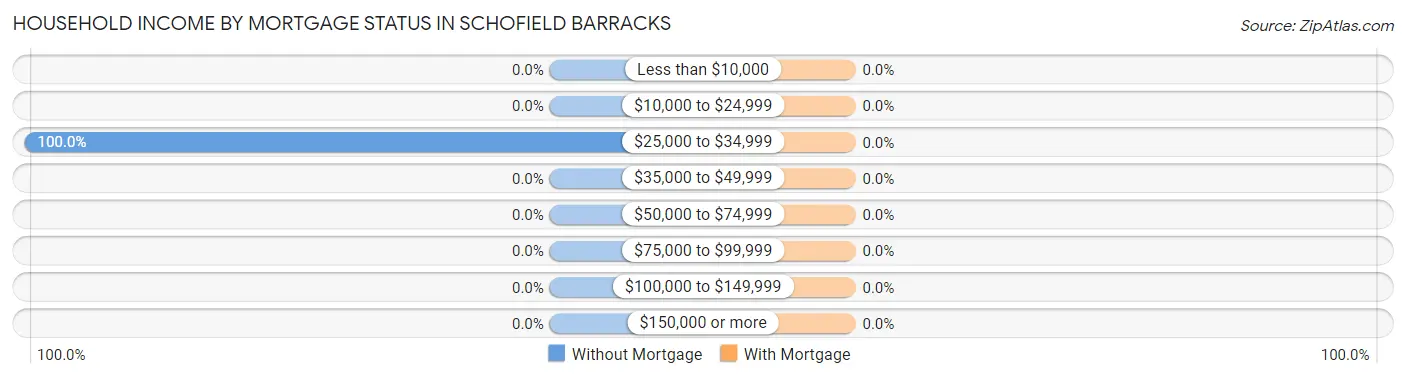
| Household Income | Without Mortgage | With Mortgage |
| Less than $10,000 | 0 (0.0%) | 0 (0.0%) |
| $10,000 to $24,999 | 0 (0.0%) | 0 (0.0%) |
| $25,000 to $34,999 | 10 (100.0%) | 0 (0.0%) |
| $35,000 to $49,999 | 0 (0.0%) | 0 (0.0%) |
| $50,000 to $74,999 | 0 (0.0%) | 0 (0.0%) |
| $75,000 to $99,999 | 0 (0.0%) | 0 (0.0%) |
| $100,000 to $149,999 | 0 (0.0%) | 0 (0.0%) |
| $150,000 or more | 0 (0.0%) | 0 (0.0%) |
| Total | 10 (100.0%) | 0 (0.0%) |
Property Value to Household Income Ratio in Schofield Barracks
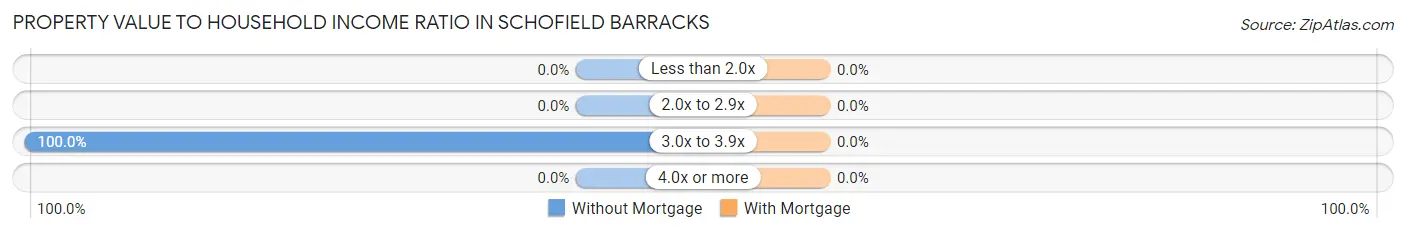
| Value-to-Income Ratio | Without Mortgage | With Mortgage |
| Less than 2.0x | 0 (0.0%) | 0 (0.0%) |
| 2.0x to 2.9x | 0 (0.0%) | 0 (0.0%) |
| 3.0x to 3.9x | 10 (100.0%) | 0 (0.0%) |
| 4.0x or more | 0 (0.0%) | 0 (0.0%) |
| Total | 10 (100.0%) | 0 (0.0%) |
Real Estate Taxes by Mortgage Status in Schofield Barracks
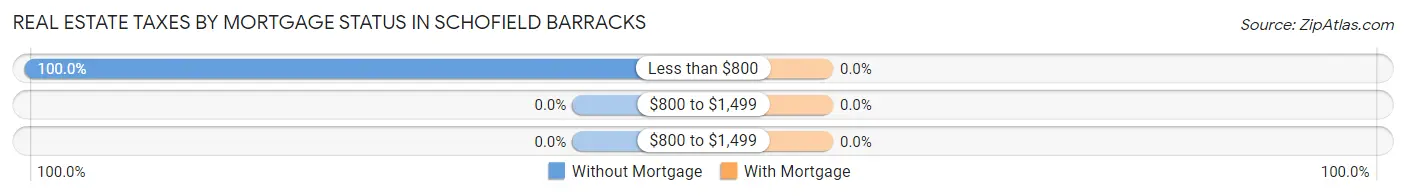
| Property Taxes | Without Mortgage | With Mortgage |
| Less than $800 | 10 (100.0%) | 0 (0.0%) |
| $800 to $1,499 | 0 (0.0%) | 0 (0.0%) |
| $800 to $1,499 | 0 (0.0%) | 0 (0.0%) |
| Total | 10 (100.0%) | 0 (0.0%) |
Health & Disability in Schofield Barracks
Health Insurance Coverage by Age in Schofield Barracks
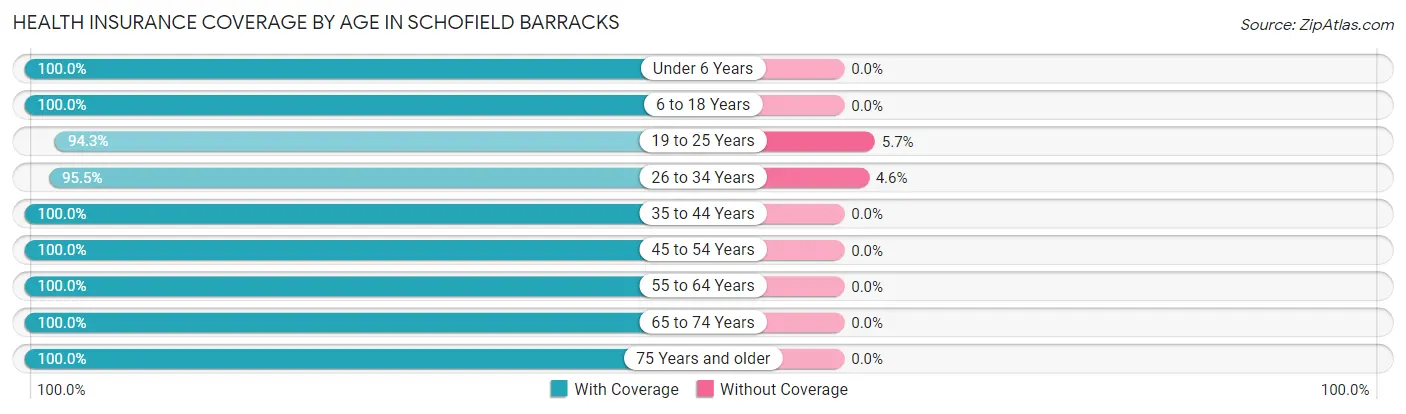
| Age Bracket | With Coverage | Without Coverage |
| Under 6 Years | 3,099 (100.0%) | 0 (0.0%) |
| 6 to 18 Years | 2,267 (100.0%) | 0 (0.0%) |
| 19 to 25 Years | 1,242 (94.3%) | 75 (5.7%) |
| 26 to 34 Years | 1,615 (95.5%) | 77 (4.5%) |
| 35 to 44 Years | 798 (100.0%) | 0 (0.0%) |
| 45 to 54 Years | 103 (100.0%) | 0 (0.0%) |
| 55 to 64 Years | 55 (100.0%) | 0 (0.0%) |
| 65 to 74 Years | 14 (100.0%) | 0 (0.0%) |
| 75 Years and older | 14 (100.0%) | 0 (0.0%) |
| Total | 9,207 (98.4%) | 152 (1.6%) |
Health Insurance Coverage by Citizenship Status in Schofield Barracks
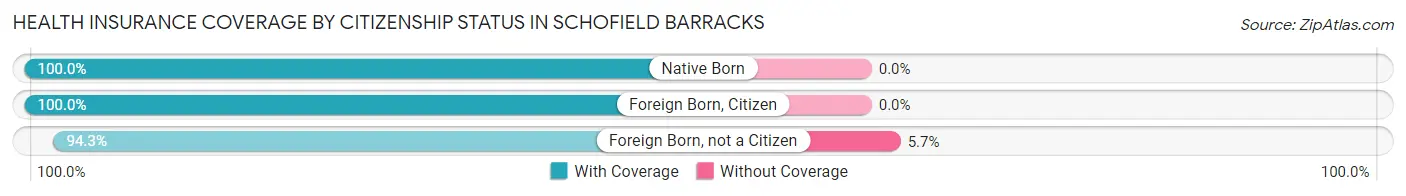
| Citizenship Status | With Coverage | Without Coverage |
| Native Born | 3,099 (100.0%) | 0 (0.0%) |
| Foreign Born, Citizen | 2,267 (100.0%) | 0 (0.0%) |
| Foreign Born, not a Citizen | 1,242 (94.3%) | 75 (5.7%) |
Health Insurance Coverage by Household Income in Schofield Barracks
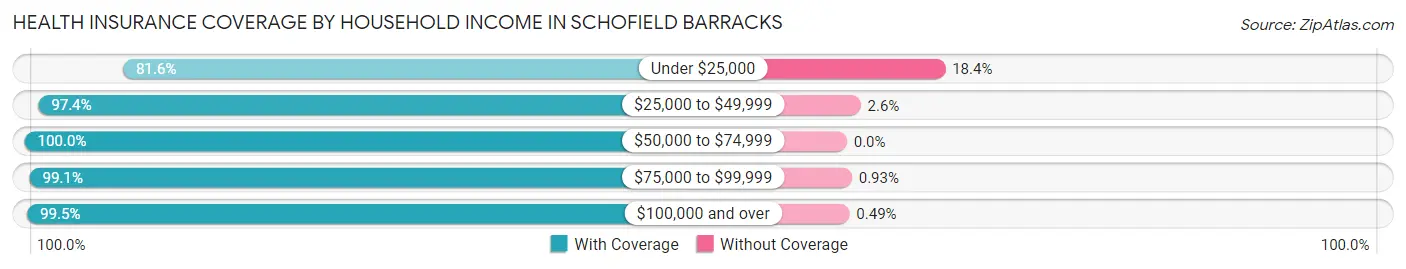
| Household Income | With Coverage | Without Coverage |
| Under $25,000 | 283 (81.6%) | 64 (18.4%) |
| $25,000 to $49,999 | 2,151 (97.4%) | 57 (2.6%) |
| $50,000 to $74,999 | 2,212 (100.0%) | 0 (0.0%) |
| $75,000 to $99,999 | 1,925 (99.1%) | 18 (0.9%) |
| $100,000 and over | 2,636 (99.5%) | 13 (0.5%) |
Public vs Private Health Insurance Coverage by Age in Schofield Barracks
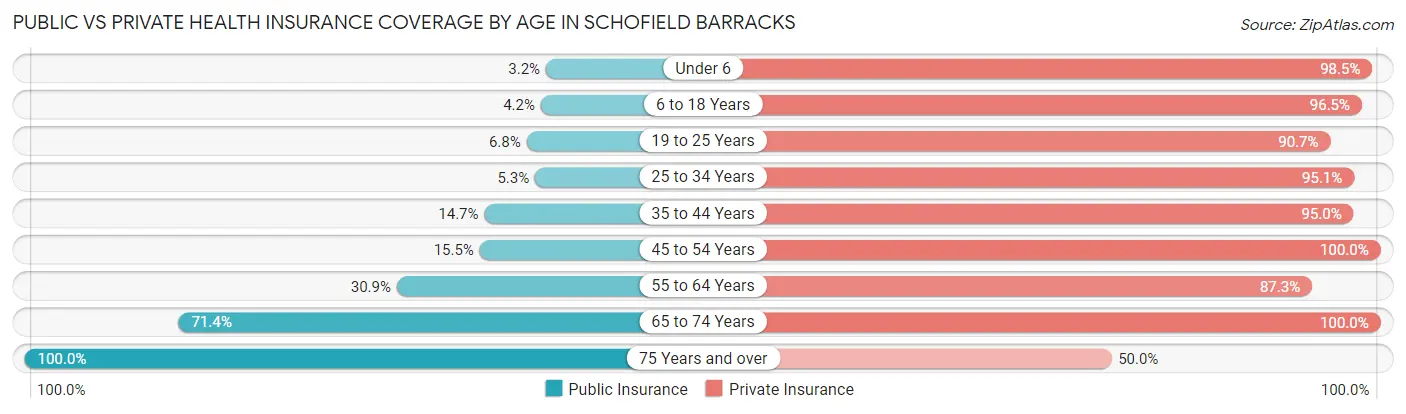
| Age Bracket | Public Insurance | Private Insurance |
| Under 6 | 100 (3.2%) | 3,051 (98.5%) |
| 6 to 18 Years | 95 (4.2%) | 2,188 (96.5%) |
| 19 to 25 Years | 90 (6.8%) | 1,194 (90.7%) |
| 25 to 34 Years | 89 (5.3%) | 1,609 (95.1%) |
| 35 to 44 Years | 117 (14.7%) | 758 (95.0%) |
| 45 to 54 Years | 16 (15.5%) | 103 (100.0%) |
| 55 to 64 Years | 17 (30.9%) | 48 (87.3%) |
| 65 to 74 Years | 10 (71.4%) | 14 (100.0%) |
| 75 Years and over | 14 (100.0%) | 7 (50.0%) |
| Total | 548 (5.9%) | 8,972 (95.9%) |
Disability Status by Sex by Age in Schofield Barracks
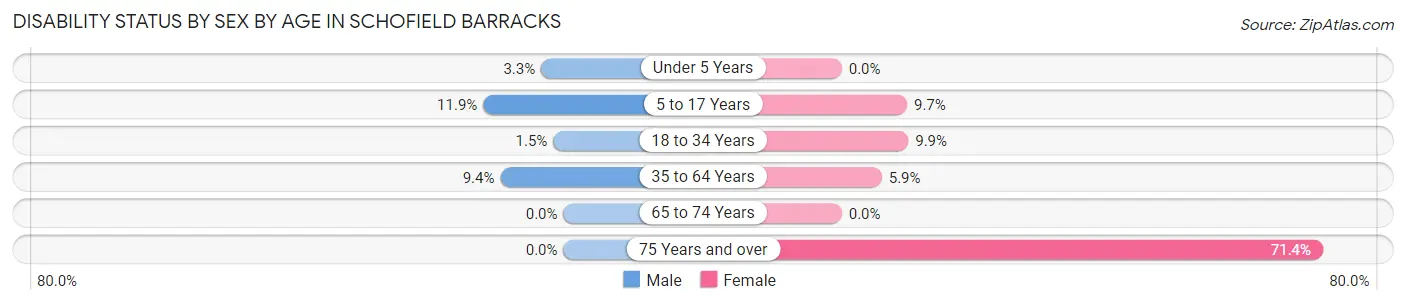
| Age Bracket | Male | Female |
| Under 5 Years | 52 (3.3%) | 0 (0.0%) |
| 5 to 17 Years | 149 (11.9%) | 131 (9.7%) |
| 18 to 34 Years | 10 (1.5%) | 235 (9.9%) |
| 35 to 64 Years | 28 (9.4%) | 39 (5.9%) |
| 65 to 74 Years | 0 (0.0%) | 0 (0.0%) |
| 75 Years and over | 0 (0.0%) | 10 (71.4%) |
Disability Class by Sex by Age in Schofield Barracks
Disability Class: Hearing Difficulty
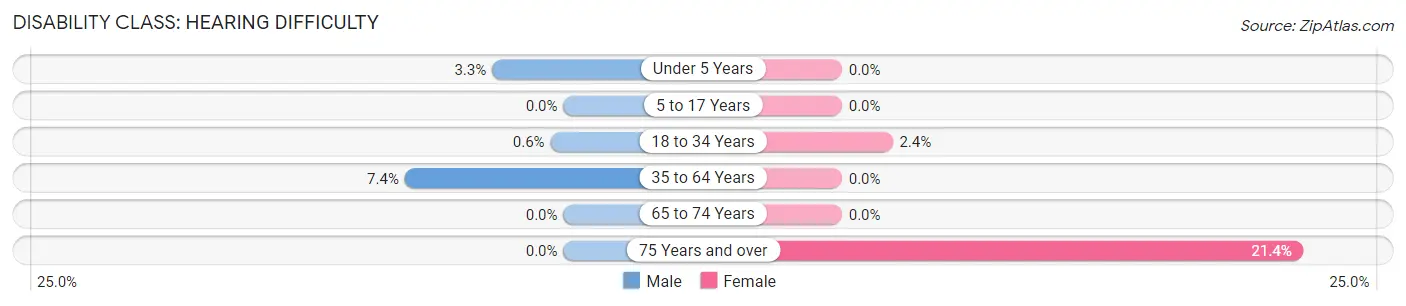
| Age Bracket | Male | Female |
| Under 5 Years | 52 (3.3%) | 0 (0.0%) |
| 5 to 17 Years | 0 (0.0%) | 0 (0.0%) |
| 18 to 34 Years | 4 (0.6%) | 56 (2.4%) |
| 35 to 64 Years | 22 (7.4%) | 0 (0.0%) |
| 65 to 74 Years | 0 (0.0%) | 0 (0.0%) |
| 75 Years and over | 0 (0.0%) | 3 (21.4%) |
Disability Class: Vision Difficulty
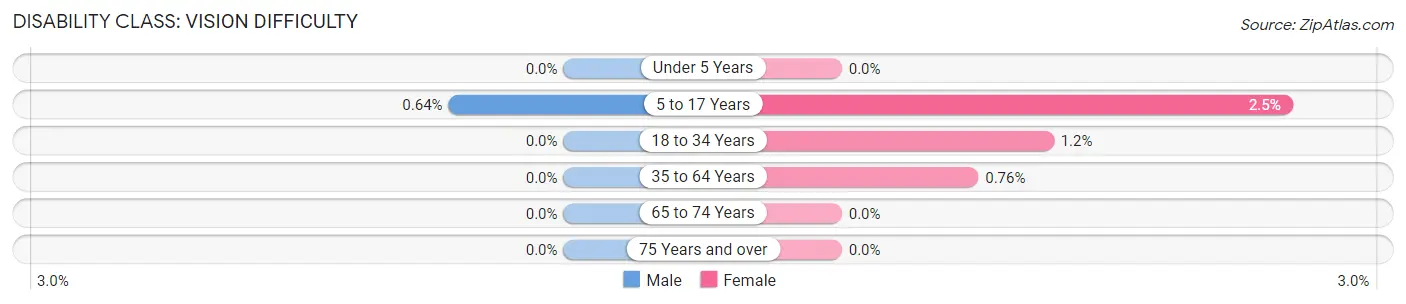
| Age Bracket | Male | Female |
| Under 5 Years | 0 (0.0%) | 0 (0.0%) |
| 5 to 17 Years | 8 (0.6%) | 34 (2.5%) |
| 18 to 34 Years | 0 (0.0%) | 28 (1.2%) |
| 35 to 64 Years | 0 (0.0%) | 5 (0.8%) |
| 65 to 74 Years | 0 (0.0%) | 0 (0.0%) |
| 75 Years and over | 0 (0.0%) | 0 (0.0%) |
Disability Class: Cognitive Difficulty
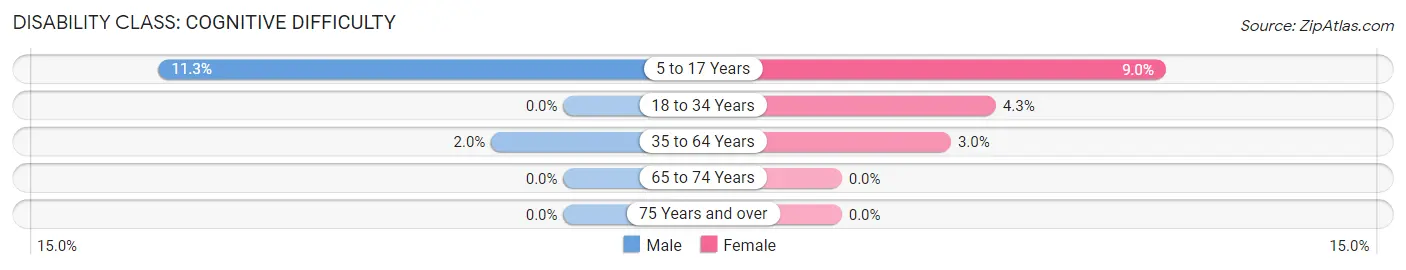
| Age Bracket | Male | Female |
| 5 to 17 Years | 141 (11.3%) | 122 (9.0%) |
| 18 to 34 Years | 0 (0.0%) | 102 (4.3%) |
| 35 to 64 Years | 6 (2.0%) | 20 (3.0%) |
| 65 to 74 Years | 0 (0.0%) | 0 (0.0%) |
| 75 Years and over | 0 (0.0%) | 0 (0.0%) |
Disability Class: Ambulatory Difficulty
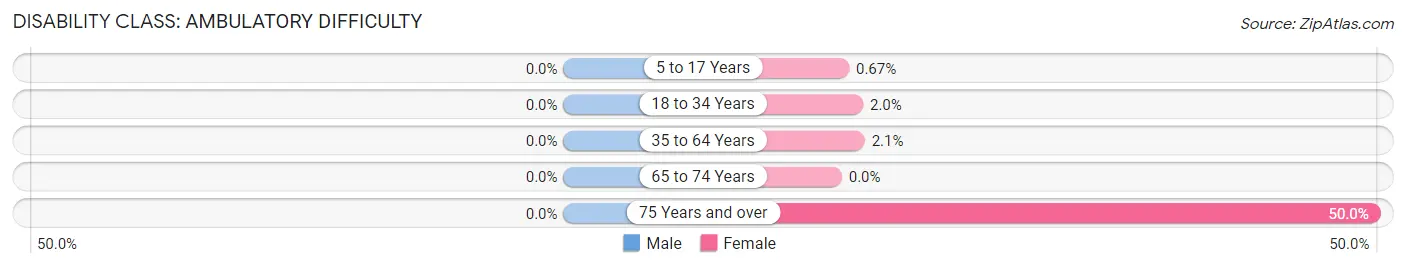
| Age Bracket | Male | Female |
| 5 to 17 Years | 0 (0.0%) | 9 (0.7%) |
| 18 to 34 Years | 0 (0.0%) | 47 (2.0%) |
| 35 to 64 Years | 0 (0.0%) | 14 (2.1%) |
| 65 to 74 Years | 0 (0.0%) | 0 (0.0%) |
| 75 Years and over | 0 (0.0%) | 7 (50.0%) |
Disability Class: Self-Care Difficulty
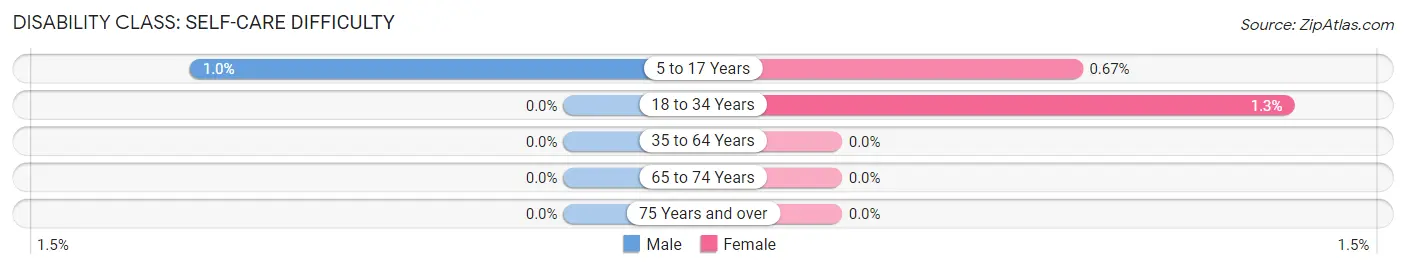
| Age Bracket | Male | Female |
| 5 to 17 Years | 13 (1.0%) | 9 (0.7%) |
| 18 to 34 Years | 0 (0.0%) | 30 (1.3%) |
| 35 to 64 Years | 0 (0.0%) | 0 (0.0%) |
| 65 to 74 Years | 0 (0.0%) | 0 (0.0%) |
| 75 Years and over | 0 (0.0%) | 0 (0.0%) |
Technology Access in Schofield Barracks
Computing Device Access in Schofield Barracks
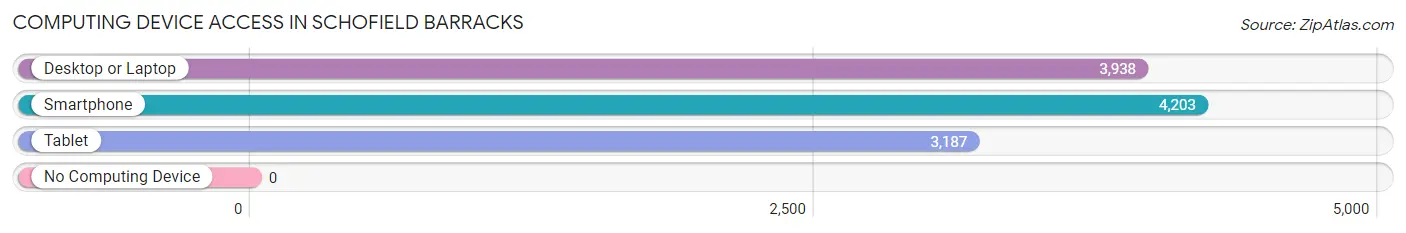
| Device Type | # Households | % Households |
| Desktop or Laptop | 3,938 | 93.5% |
| Smartphone | 4,203 | 99.8% |
| Tablet | 3,187 | 75.6% |
| No Computing Device | 0 | 0.0% |
| Total | 4,213 | 100.0% |
Internet Access in Schofield Barracks
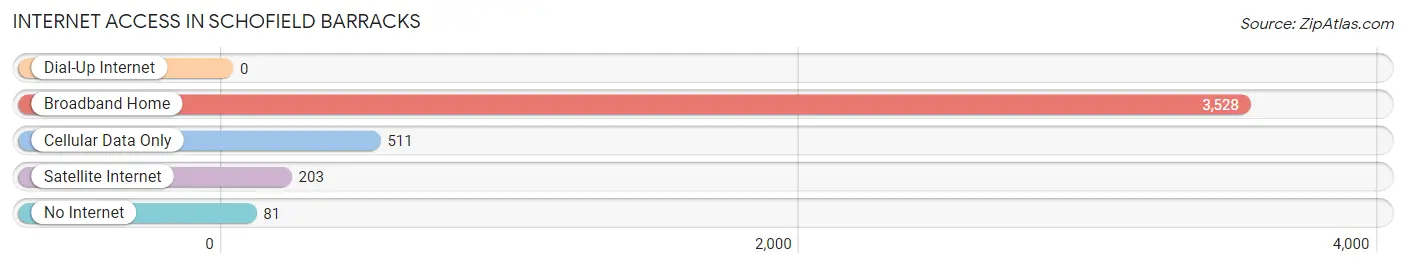
| Internet Type | # Households | % Households |
| Dial-Up Internet | 0 | 0.0% |
| Broadband Home | 3,528 | 83.7% |
| Cellular Data Only | 511 | 12.1% |
| Satellite Internet | 203 | 4.8% |
| No Internet | 81 | 1.9% |
| Total | 4,213 | 100.0% |
Schofield Barracks Summary
Schofield Barracks is a United States Army installation located in the city of Wahiawa, Hawaii. It is the largest Army installation in the state of Hawaii and is home to the 25th Infantry Division, the 8th Theater Sustainment Command, and the U.S. Army Garrison-Hawaii. The base was established in 1908 and is named after Lieutenant General John McAllister Schofield, a Union Army officer during the American Civil War.
History
Schofield Barracks was established in 1908 as a military post for the U.S. Army. It was named after Lieutenant General John McAllister Schofield, a Union Army officer during the American Civil War. The base was originally used as a training center for the Hawaiian Division, which was formed in 1921. During World War II, Schofield Barracks was the headquarters for the U.S. Army's 24th Infantry Division. The base was also used as a staging area for the invasion of the Japanese-held islands in the Pacific.
After the war, Schofield Barracks was used as a training center for the U.S. Army's 25th Infantry Division. The base was also used as a staging area for the Korean War and the Vietnam War. In the 1970s, the base was used as a staging area for the U.S. Army's deployment to the Persian Gulf War.
Geography
Schofield Barracks is located in the city of Wahiawa, Hawaii, on the island of Oahu. The base is situated in the central part of the island, approximately 20 miles northwest of Honolulu. The base is surrounded by the Waianae Mountains to the west and the Koolau Mountains to the east. The base covers an area of approximately 4,000 acres and is home to more than 10,000 military personnel and their families.
Economy
Schofield Barracks is a major economic driver for the state of Hawaii. The base has an annual economic impact of more than $1.2 billion, making it one of the largest employers in the state. The base is home to more than 10,000 military personnel and their families, as well as more than 5,000 civilian employees. The base also provides jobs for more than 1,000 contractors.
The base is home to a variety of businesses, including retail stores, restaurants, and entertainment venues. The base also has a variety of recreational facilities, including a golf course, a bowling alley, and a movie theater.
Demographics
As of 2020, Schofield Barracks had a population of approximately 10,000 military personnel and their families. The base is home to a diverse population, with more than 40% of the population being of Asian descent. The base also has a large Hispanic population, with more than 20% of the population being of Hispanic or Latino origin. The base also has a large Native Hawaiian population, with more than 10% of the population being of Native Hawaiian or other Pacific Islander descent.
Common Questions
What is Per Capita Income in Schofield Barracks?
Per Capita income in Schofield Barracks is $28,572.
What is the Median Family Income in Schofield Barracks?
Median Family Income in Schofield Barracks is $70,822.
What is the Median Household income in Schofield Barracks?
Median Household Income in Schofield Barracks is $69,755.
What is Income or Wage Gap in Schofield Barracks?
Income or Wage Gap in Schofield Barracks is 12.7%.
Women in Schofield Barracks earn 87.3 cents for every dollar earned by a man.
What is Inequality or Gini Index in Schofield Barracks?
Inequality or Gini Index in Schofield Barracks is 0.35.
What is the Total Population of Schofield Barracks?
Total Population of Schofield Barracks is 18,133.
What is the Total Male Population of Schofield Barracks?
Total Male Population of Schofield Barracks is 11,565.
What is the Total Female Population of Schofield Barracks?
Total Female Population of Schofield Barracks is 6,568.
What is the Ratio of Males per 100 Females in Schofield Barracks?
There are 176.08 Males per 100 Females in Schofield Barracks.
What is the Ratio of Females per 100 Males in Schofield Barracks?
There are 56.79 Females per 100 Males in Schofield Barracks.
What is the Median Population Age in Schofield Barracks?
Median Population Age in Schofield Barracks is 22.6 Years.
What is the Average Family Size in Schofield Barracks
Average Family Size in Schofield Barracks is 3.4 People.
What is the Average Household Size in Schofield Barracks
Average Household Size in Schofield Barracks is 3.1 People.
How Large is the Labor Force in Schofield Barracks?
There are 11,038 People in the Labor Forcein in Schofield Barracks.
What is the Percentage of People in the Labor Force in Schofield Barracks?
85.0% of People are in the Labor Force in Schofield Barracks.
What is the Unemployment Rate in Schofield Barracks?
Unemployment Rate in Schofield Barracks is 8.9%.