Rockfish, NC Map & Demographics
Rockfish Map
Rockfish Overview
$29,245
PER CAPITA INCOME
$66,615
AVG FAMILY INCOME
$61,172
AVG HOUSEHOLD INCOME
19.4%
WAGE / INCOME GAP [ % ]
80.6¢/ $1
WAGE / INCOME GAP [ $ ]
0.35
INEQUALITY / GINI INDEX
3,569
TOTAL POPULATION
1,744
MALE POPULATION
1,825
FEMALE POPULATION
95.56
MALES / 100 FEMALES
104.64
FEMALES / 100 MALES
34.6
MEDIAN AGE
3.1
AVG FAMILY SIZE
2.6
AVG HOUSEHOLD SIZE
1,813
LABOR FORCE [ PEOPLE ]
63.5%
PERCENT IN LABOR FORCE
4.6%
UNEMPLOYMENT RATE
Income in Rockfish
Income Overview in Rockfish
Per Capita Income in Rockfish is $29,245, while median incomes of families and households are $66,615 and $61,172 respectively.
| Characteristic | Number | Measure |
| Per Capita Income | 3,569 | $29,245 |
| Median Family Income | 933 | $66,615 |
| Mean Family Income | 933 | $83,959 |
| Median Household Income | 1,364 | $61,172 |
| Mean Household Income | 1,364 | $74,035 |
| Income Deficit | 933 | $0 |
| Wage / Income Gap (%) | 3,569 | 19.44% |
| Wage / Income Gap ($) | 3,569 | 80.56¢ per $1 |
| Gini / Inequality Index | 3,569 | 0.35 |
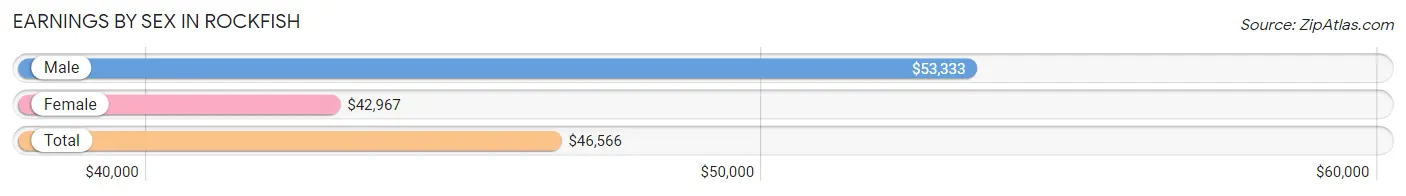
Earnings by Sex in Rockfish
Average Earnings in Rockfish are $46,566, $53,333 for men and $42,967 for women, a difference of 19.4%.
| Sex | Number | Average Earnings |
| Male | 908 (49.4%) | $53,333 |
| Female | 930 (50.6%) | $42,967 |
| Total | 1,838 (100.0%) | $46,566 |
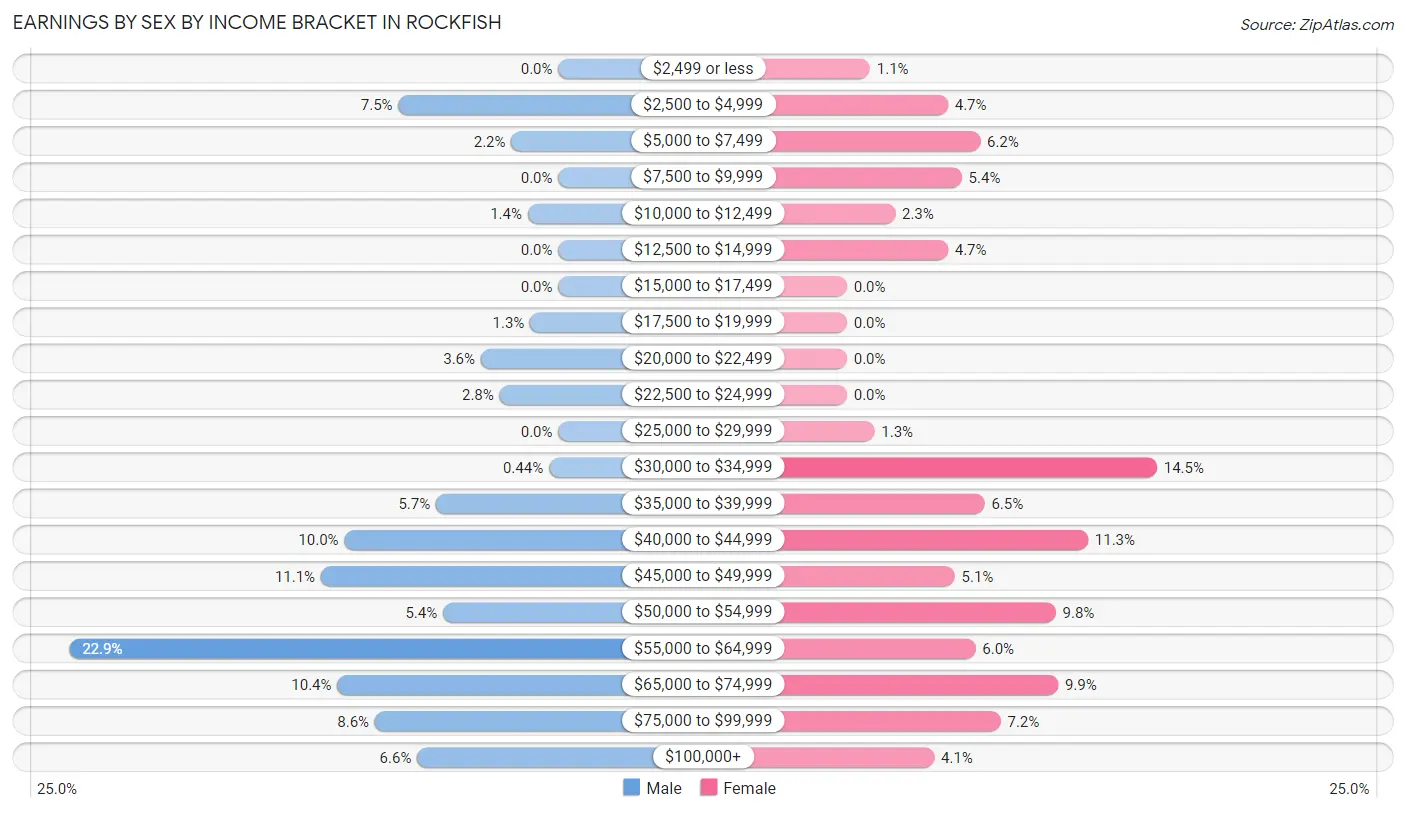
Earnings by Sex by Income Bracket in Rockfish
The most common earnings brackets in Rockfish are $55,000 to $64,999 for men (208 | 22.9%) and $30,000 to $34,999 for women (135 | 14.5%).
| Income | Male | Female |
| $2,499 or less | 0 (0.0%) | 10 (1.1%) |
| $2,500 to $4,999 | 68 (7.5%) | 44 (4.7%) |
| $5,000 to $7,499 | 20 (2.2%) | 58 (6.2%) |
| $7,500 to $9,999 | 0 (0.0%) | 50 (5.4%) |
| $10,000 to $12,499 | 13 (1.4%) | 21 (2.3%) |
| $12,500 to $14,999 | 0 (0.0%) | 44 (4.7%) |
| $15,000 to $17,499 | 0 (0.0%) | 0 (0.0%) |
| $17,500 to $19,999 | 12 (1.3%) | 0 (0.0%) |
| $20,000 to $22,499 | 33 (3.6%) | 0 (0.0%) |
| $22,500 to $24,999 | 25 (2.8%) | 0 (0.0%) |
| $25,000 to $29,999 | 0 (0.0%) | 12 (1.3%) |
| $30,000 to $34,999 | 4 (0.4%) | 135 (14.5%) |
| $35,000 to $39,999 | 52 (5.7%) | 60 (6.5%) |
| $40,000 to $44,999 | 91 (10.0%) | 105 (11.3%) |
| $45,000 to $49,999 | 101 (11.1%) | 47 (5.1%) |
| $50,000 to $54,999 | 49 (5.4%) | 91 (9.8%) |
| $55,000 to $64,999 | 208 (22.9%) | 56 (6.0%) |
| $65,000 to $74,999 | 94 (10.3%) | 92 (9.9%) |
| $75,000 to $99,999 | 78 (8.6%) | 67 (7.2%) |
| $100,000+ | 60 (6.6%) | 38 (4.1%) |
| Total | 908 (100.0%) | 930 (100.0%) |
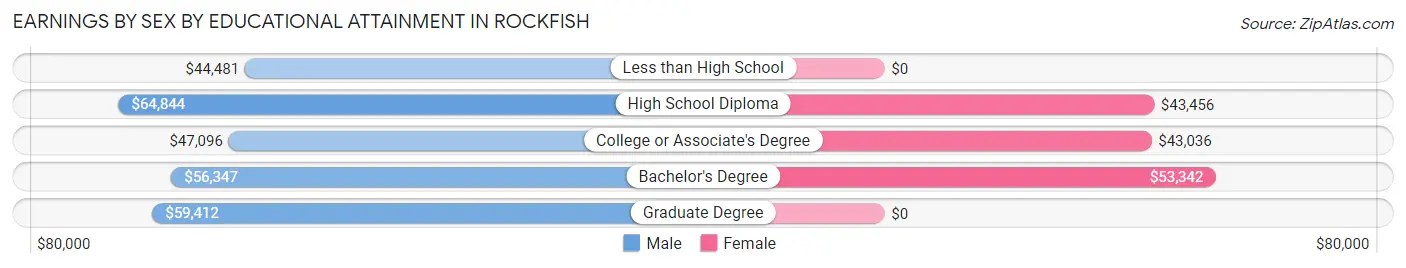
Earnings by Sex by Educational Attainment in Rockfish
Average earnings in Rockfish are $55,489 for men and $44,451 for women, a difference of 19.9%. Men with an educational attainment of high school diploma enjoy the highest average annual earnings of $64,844, while those with less than high school education earn the least with $44,481. Women with an educational attainment of bachelor's degree earn the most with the average annual earnings of $53,342, while those with college or associate's degree education have the smallest earnings of $43,036.
| Educational Attainment | Male Income | Female Income |
| Less than High School | $44,481 | $0 |
| High School Diploma | $64,844 | $43,456 |
| College or Associate's Degree | $47,096 | $43,036 |
| Bachelor's Degree | $56,347 | $53,342 |
| Graduate Degree | $59,412 | $0 |
| Total | $55,489 | $44,451 |
Family Income in Rockfish
Family Income Brackets in Rockfish
According to the Rockfish family income data, there are 256 families falling into the $50,000 to $74,999 income range, which is the most common income bracket and makes up 27.4% of all families.
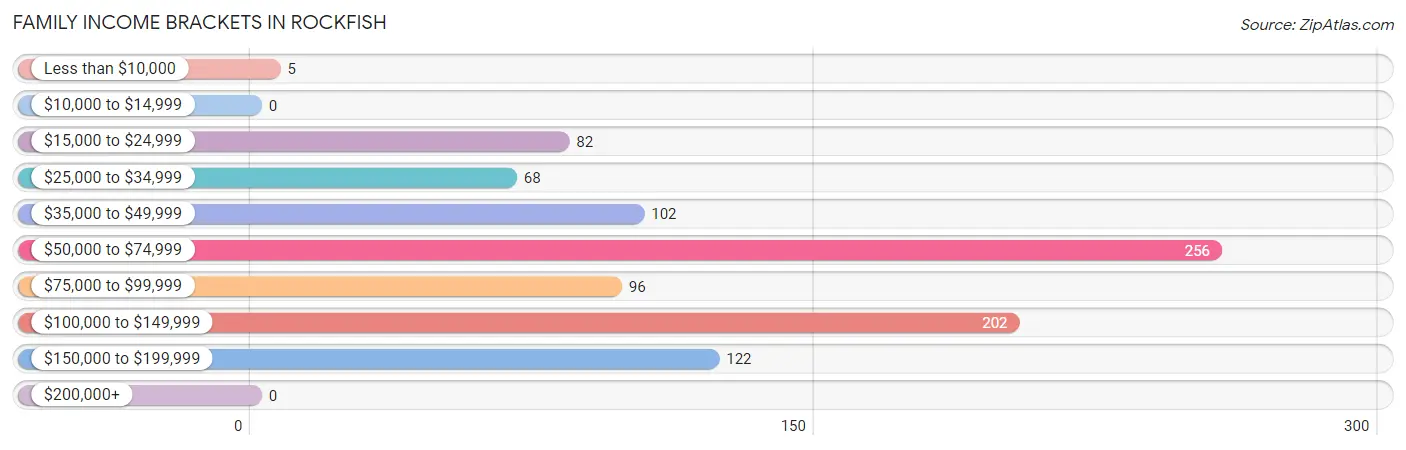
| Income Bracket | # Families | % Families |
| Less than $10,000 | 5 | 0.5% |
| $10,000 to $14,999 | 0 | 0.0% |
| $15,000 to $24,999 | 82 | 8.8% |
| $25,000 to $34,999 | 68 | 7.3% |
| $35,000 to $49,999 | 102 | 10.9% |
| $50,000 to $74,999 | 256 | 27.4% |
| $75,000 to $99,999 | 96 | 10.3% |
| $100,000 to $149,999 | 202 | 21.7% |
| $150,000 to $199,999 | 122 | 13.1% |
| $200,000+ | 0 | 0.0% |
Family Income by Famaliy Size in Rockfish
2-person families (568 | 60.9%) account for the highest median family income in Rockfish with $74,545 per family, while 2-person families (568 | 60.9%) have the highest median income of $37,272 per family member.
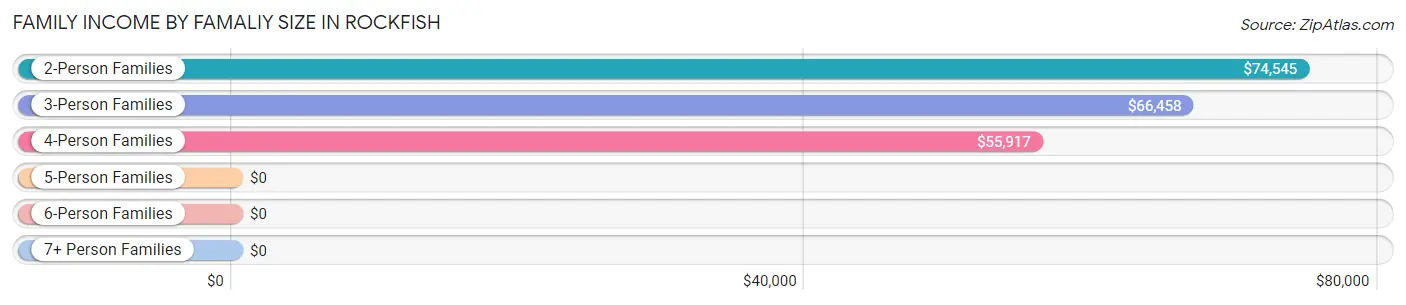
| Income Bracket | # Families | Median Income |
| 2-Person Families | 568 (60.9%) | $74,545 |
| 3-Person Families | 146 (15.7%) | $66,458 |
| 4-Person Families | 191 (20.5%) | $55,917 |
| 5-Person Families | 28 (3.0%) | $0 |
| 6-Person Families | 0 (0.0%) | $0 |
| 7+ Person Families | 0 (0.0%) | $0 |
| Total | 933 (100.0%) | $66,615 |
Family Income by Number of Earners in Rockfish
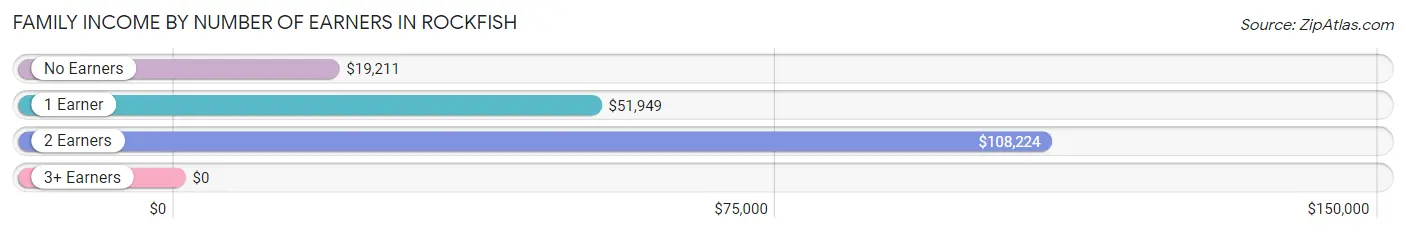
| Number of Earners | # Families | Median Income |
| No Earners | 90 (9.7%) | $19,211 |
| 1 Earner | 419 (44.9%) | $51,949 |
| 2 Earners | 397 (42.5%) | $108,224 |
| 3+ Earners | 27 (2.9%) | $0 |
| Total | 933 (100.0%) | $66,615 |
Household Income in Rockfish
Household Income Brackets in Rockfish
With 481 households falling in the category, the $50,000 to $74,999 income range is the most frequent in Rockfish, accounting for 35.3% of all households.
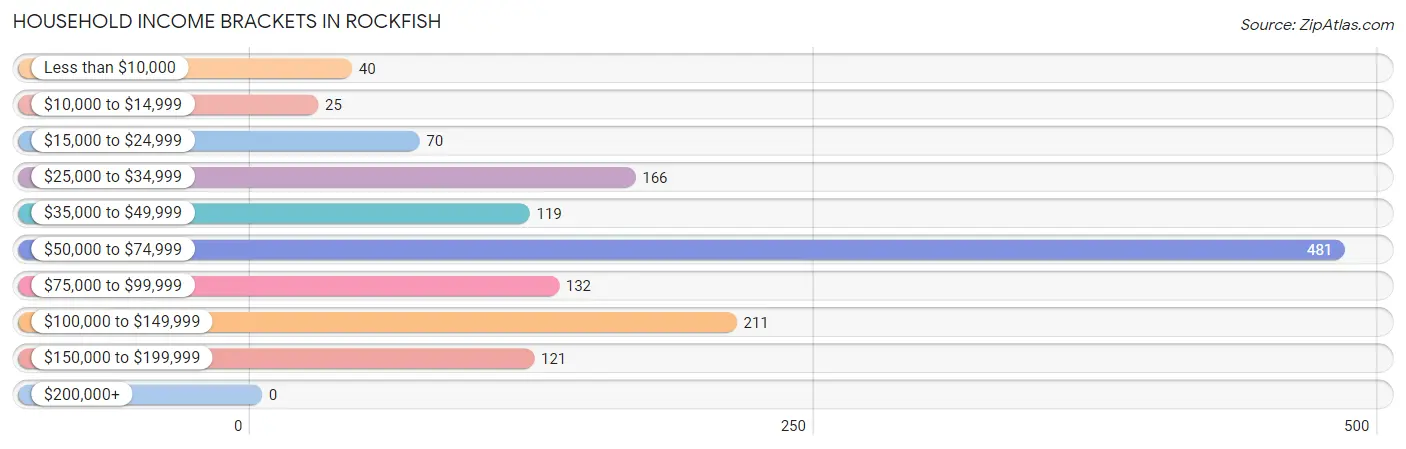
| Income Bracket | # Households | % Households |
| Less than $10,000 | 40 | 2.9% |
| $10,000 to $14,999 | 25 | 1.8% |
| $15,000 to $24,999 | 70 | 5.1% |
| $25,000 to $34,999 | 166 | 12.2% |
| $35,000 to $49,999 | 119 | 8.7% |
| $50,000 to $74,999 | 481 | 35.3% |
| $75,000 to $99,999 | 132 | 9.7% |
| $100,000 to $149,999 | 211 | 15.5% |
| $150,000 to $199,999 | 121 | 8.9% |
| $200,000+ | 0 | 0.0% |
Household Income by Householder Age in Rockfish
The median household income in Rockfish is $61,172, with the highest median household income of $70,909 found in the 65+ years age bracket for the primary householder. A total of 142 households (10.4%) fall into this category. Meanwhile, the 15 to 24 years age bracket for the primary householder has the lowest median household income of $0, with 71 households (5.2%) in this group.
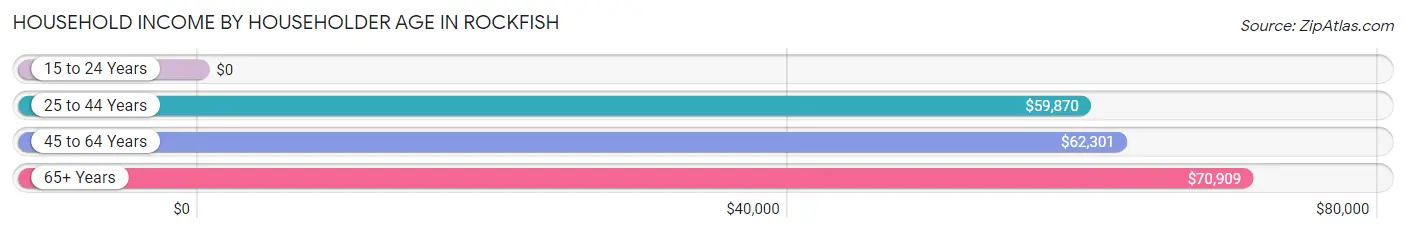
| Income Bracket | # Households | Median Income |
| 15 to 24 Years | 71 (5.2%) | $0 |
| 25 to 44 Years | 670 (49.1%) | $59,870 |
| 45 to 64 Years | 481 (35.3%) | $62,301 |
| 65+ Years | 142 (10.4%) | $70,909 |
| Total | 1,364 (100.0%) | $61,172 |
Poverty in Rockfish
Income Below Poverty by Sex and Age in Rockfish
With 9.4% poverty level for males and 7.0% for females among the residents of Rockfish, 55 to 64 year old males and 65 to 74 year old females are the most vulnerable to poverty, with 72 males (35.5%) and 28 females (30.8%) in their respective age groups living below the poverty level.
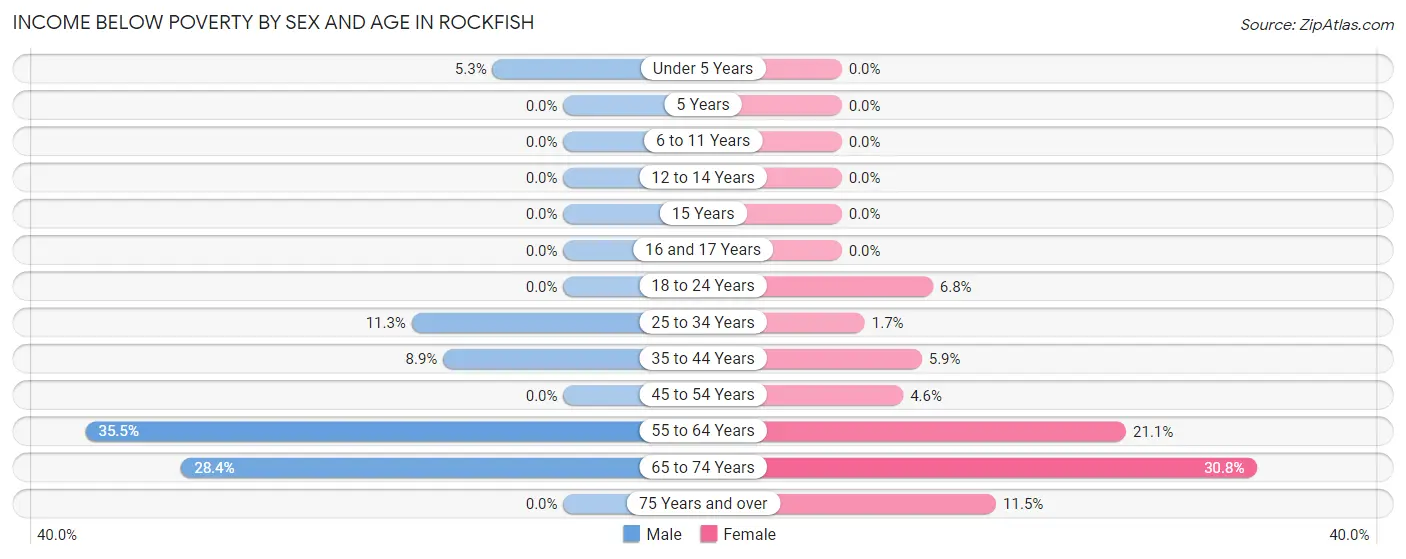
| Age Bracket | Male | Female |
| Under 5 Years | 6 (5.3%) | 0 (0.0%) |
| 5 Years | 0 (0.0%) | 0 (0.0%) |
| 6 to 11 Years | 0 (0.0%) | 0 (0.0%) |
| 12 to 14 Years | 0 (0.0%) | 0 (0.0%) |
| 15 Years | 0 (0.0%) | 0 (0.0%) |
| 16 and 17 Years | 0 (0.0%) | 0 (0.0%) |
| 18 to 24 Years | 0 (0.0%) | 14 (6.8%) |
| 25 to 34 Years | 34 (11.3%) | 5 (1.7%) |
| 35 to 44 Years | 33 (8.9%) | 19 (5.9%) |
| 45 to 54 Years | 0 (0.0%) | 12 (4.6%) |
| 55 to 64 Years | 72 (35.5%) | 38 (21.1%) |
| 65 to 74 Years | 19 (28.4%) | 28 (30.8%) |
| 75 Years and over | 0 (0.0%) | 11 (11.5%) |
| Total | 164 (9.4%) | 127 (7.0%) |
Income Above Poverty by Sex and Age in Rockfish
According to the poverty statistics in Rockfish, males aged 6 to 11 years and females aged under 5 years are the age groups that are most secure financially, with 100.0% of males and 100.0% of females in these age groups living above the poverty line.
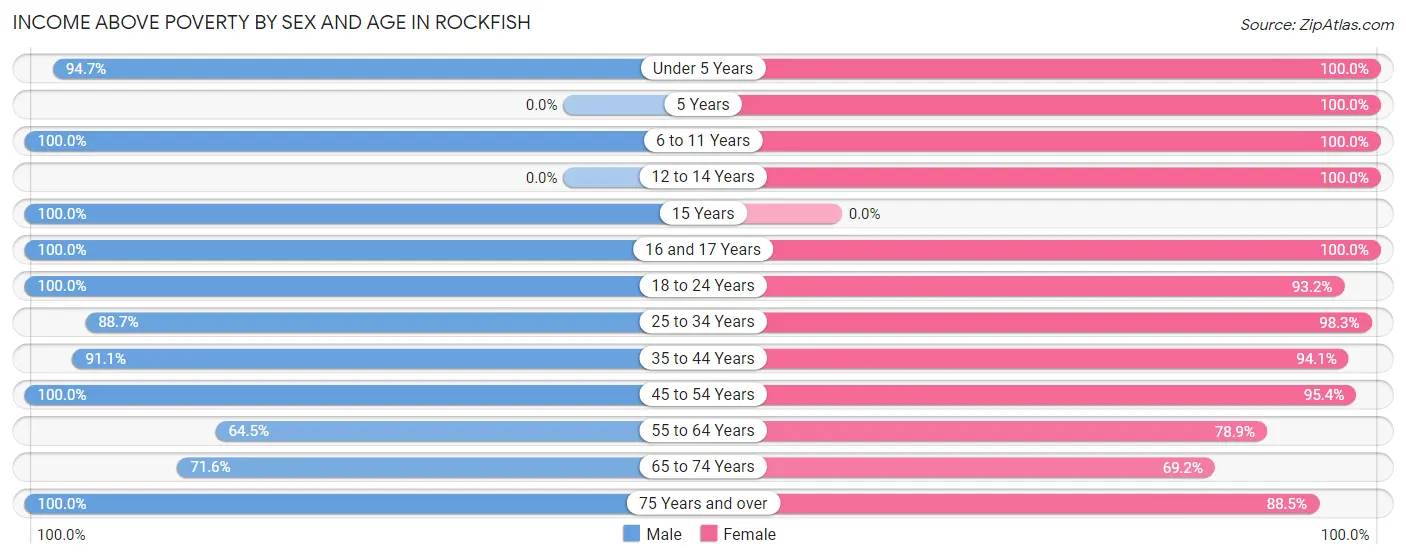
| Age Bracket | Male | Female |
| Under 5 Years | 108 (94.7%) | 86 (100.0%) |
| 5 Years | 0 (0.0%) | 94 (100.0%) |
| 6 to 11 Years | 171 (100.0%) | 82 (100.0%) |
| 12 to 14 Years | 0 (0.0%) | 85 (100.0%) |
| 15 Years | 79 (100.0%) | 0 (0.0%) |
| 16 and 17 Years | 102 (100.0%) | 29 (100.0%) |
| 18 to 24 Years | 170 (100.0%) | 193 (93.2%) |
| 25 to 34 Years | 268 (88.7%) | 287 (98.3%) |
| 35 to 44 Years | 337 (91.1%) | 301 (94.1%) |
| 45 to 54 Years | 82 (100.0%) | 251 (95.4%) |
| 55 to 64 Years | 131 (64.5%) | 142 (78.9%) |
| 65 to 74 Years | 48 (71.6%) | 63 (69.2%) |
| 75 Years and over | 81 (100.0%) | 85 (88.5%) |
| Total | 1,577 (90.6%) | 1,698 (93.0%) |
Income Below Poverty Among Married-Couple Families in Rockfish
The poverty statistics for married-couple families in Rockfish show that 2.2% or 13 of the total 581 families live below the poverty line. Families with no children have the highest poverty rate of 4.3%, comprising of 13 families. On the other hand, families with 1 or 2 children have the lowest poverty rate of 0.0%, which includes 0 families.
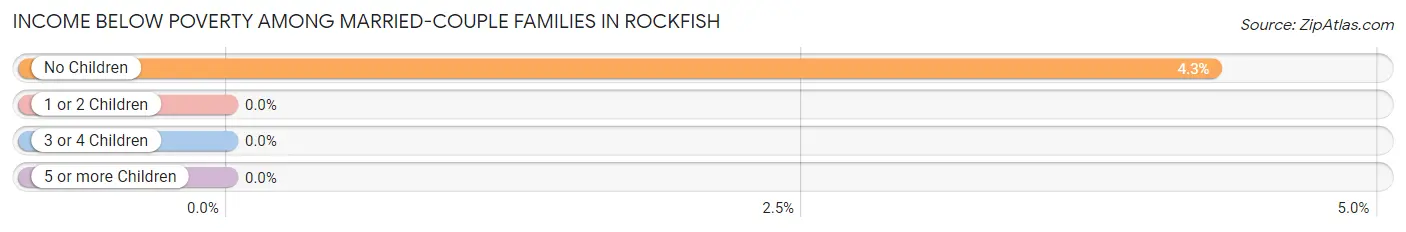
| Children | Above Poverty | Below Poverty |
| No Children | 291 (95.7%) | 13 (4.3%) |
| 1 or 2 Children | 272 (100.0%) | 0 (0.0%) |
| 3 or 4 Children | 5 (100.0%) | 0 (0.0%) |
| 5 or more Children | 0 (0.0%) | 0 (0.0%) |
| Total | 568 (97.8%) | 13 (2.2%) |
Income Below Poverty Among Single-Parent Households in Rockfish
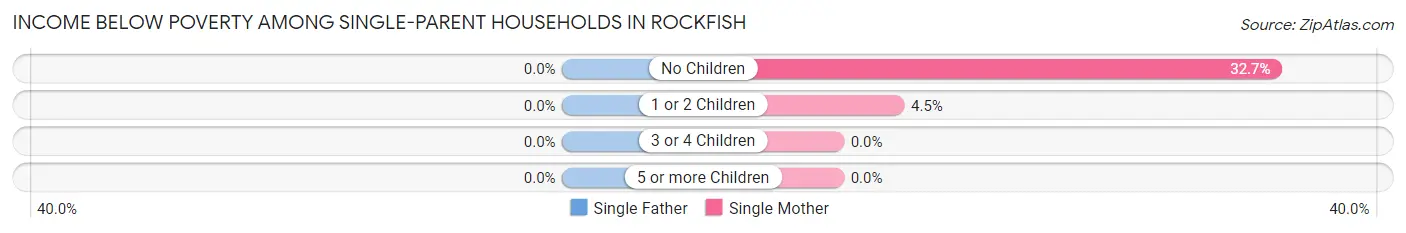
| Children | Single Father | Single Mother |
| No Children | 0 (0.0%) | 50 (32.7%) |
| 1 or 2 Children | 0 (0.0%) | 5 (4.5%) |
| 3 or 4 Children | 0 (0.0%) | 0 (0.0%) |
| 5 or more Children | 0 (0.0%) | 0 (0.0%) |
| Total | 0 (0.0%) | 55 (18.6%) |
Income Below Poverty Among Married-Couple vs Single-Parent Households in Rockfish
The poverty data for Rockfish shows that 13 of the married-couple family households (2.2%) and 55 of the single-parent households (15.6%) are living below the poverty level. Within the married-couple family households, those with no children have the highest poverty rate, with 13 households (4.3%) falling below the poverty line. Among the single-parent households, those with no children have the highest poverty rate, with 50 household (24.9%) living below poverty.
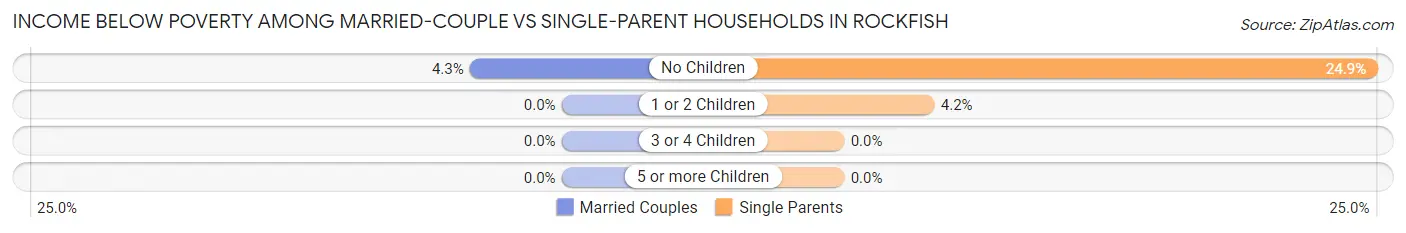
| Children | Married-Couple Families | Single-Parent Households |
| No Children | 13 (4.3%) | 50 (24.9%) |
| 1 or 2 Children | 0 (0.0%) | 5 (4.2%) |
| 3 or 4 Children | 0 (0.0%) | 0 (0.0%) |
| 5 or more Children | 0 (0.0%) | 0 (0.0%) |
| Total | 13 (2.2%) | 55 (15.6%) |
Race in Rockfish
The most populous races in Rockfish are White / Caucasian (2,102 | 58.9%), Black / African American (576 | 16.1%), and Hispanic or Latino (527 | 14.8%).
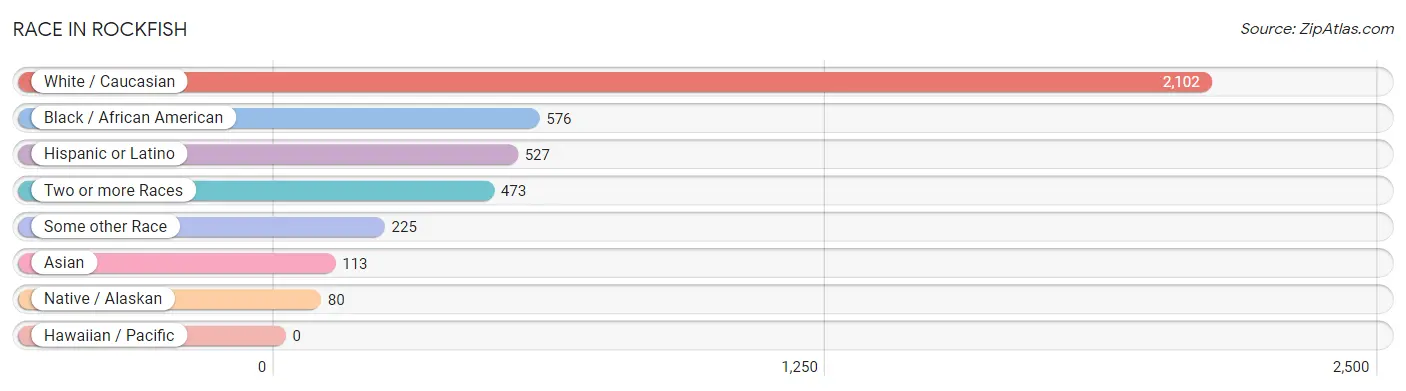
| Race | # Population | % Population |
| Asian | 113 | 3.2% |
| Black / African American | 576 | 16.1% |
| Hawaiian / Pacific | 0 | 0.0% |
| Hispanic or Latino | 527 | 14.8% |
| Native / Alaskan | 80 | 2.2% |
| White / Caucasian | 2,102 | 58.9% |
| Two or more Races | 473 | 13.3% |
| Some other Race | 225 | 6.3% |
| Total | 3,569 | 100.0% |
Ancestry in Rockfish
The most populous ancestries reported in Rockfish are American (434 | 12.2%), Puerto Rican (222 | 6.2%), Mexican (214 | 6.0%), English (174 | 4.9%), and German (154 | 4.3%), together accounting for 33.6% of all Rockfish residents.
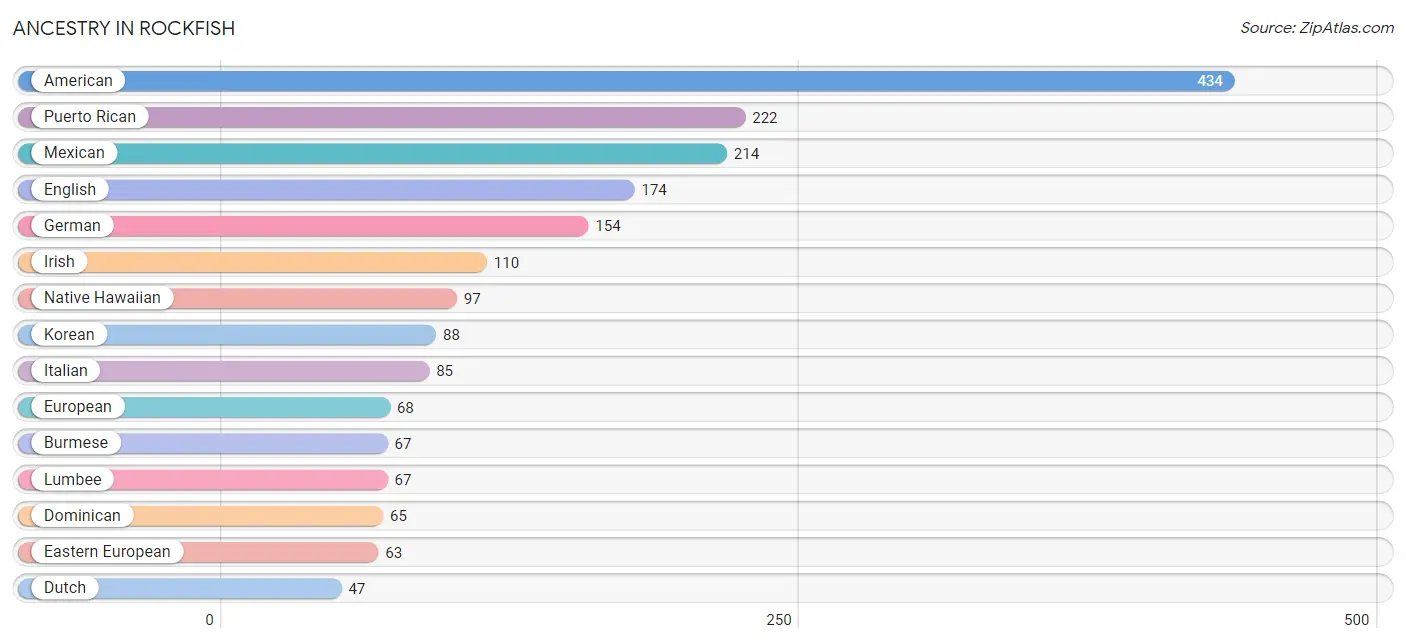
| Ancestry | # Population | % Population |
| American | 434 | 12.2% |
| Arab | 24 | 0.7% |
| Bhutanese | 26 | 0.7% |
| British | 33 | 0.9% |
| Burmese | 67 | 1.9% |
| Central American | 7 | 0.2% |
| Cuban | 5 | 0.1% |
| Dominican | 65 | 1.8% |
| Dutch | 47 | 1.3% |
| Eastern European | 63 | 1.8% |
| English | 174 | 4.9% |
| European | 68 | 1.9% |
| French | 43 | 1.2% |
| German | 154 | 4.3% |
| Irish | 110 | 3.1% |
| Italian | 85 | 2.4% |
| Korean | 88 | 2.5% |
| Lebanese | 24 | 0.7% |
| Lumbee | 67 | 1.9% |
| Mexican | 214 | 6.0% |
| Native Hawaiian | 97 | 2.7% |
| Nepalese | 27 | 0.8% |
| Nigerian | 15 | 0.4% |
| Panamanian | 7 | 0.2% |
| Puerto Rican | 222 | 6.2% |
| Scotch-Irish | 38 | 1.1% |
| Scottish | 6 | 0.2% |
| Subsaharan African | 15 | 0.4% |
| Swedish | 19 | 0.5% | View All 29 Rows |
Immigrants in Rockfish
The most numerous immigrant groups reported in Rockfish came from Latin America (71 | 2.0%), Central America (36 | 1.0%), Caribbean (35 | 1.0%), Dominican Republic (30 | 0.8%), and Mexico (29 | 0.8%), together accounting for 5.6% of all Rockfish residents.
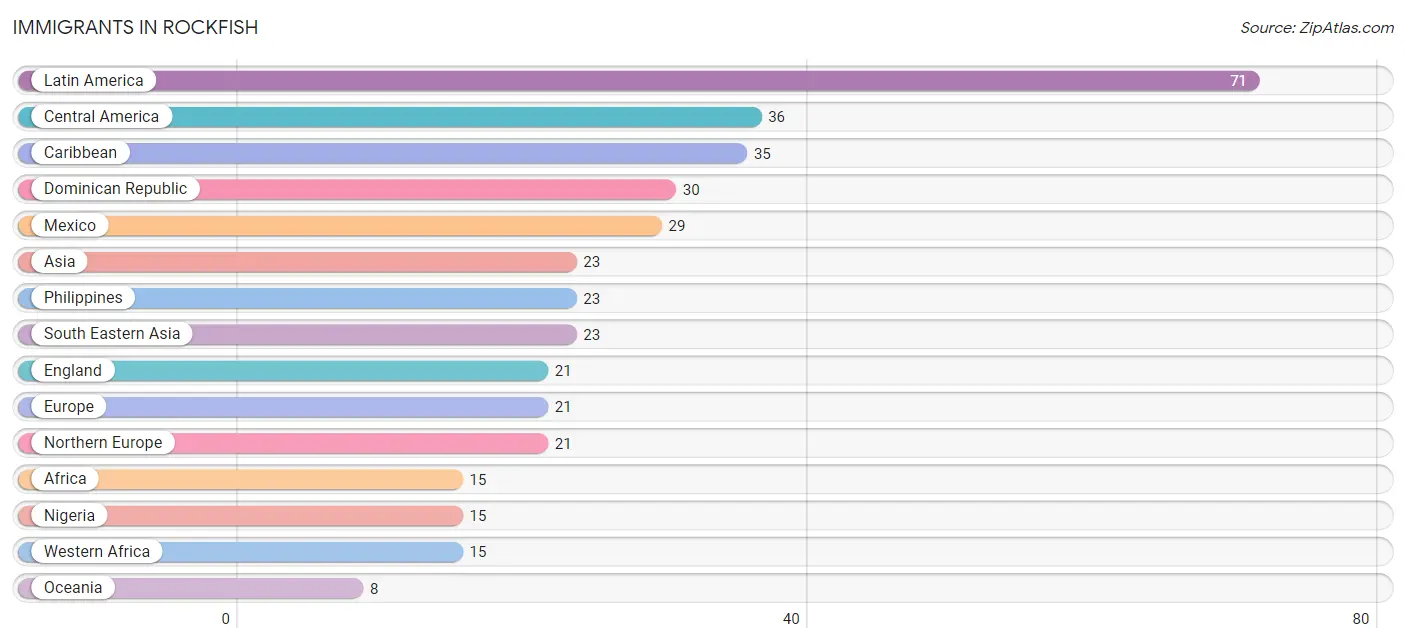
| Immigration Origin | # Population | % Population |
| Africa | 15 | 0.4% |
| Asia | 23 | 0.6% |
| Caribbean | 35 | 1.0% |
| Central America | 36 | 1.0% |
| Cuba | 5 | 0.1% |
| Dominican Republic | 30 | 0.8% |
| England | 21 | 0.6% |
| Europe | 21 | 0.6% |
| Latin America | 71 | 2.0% |
| Mexico | 29 | 0.8% |
| Nigeria | 15 | 0.4% |
| Northern Europe | 21 | 0.6% |
| Oceania | 8 | 0.2% |
| Panama | 7 | 0.2% |
| Philippines | 23 | 0.6% |
| South Eastern Asia | 23 | 0.6% |
| Western Africa | 15 | 0.4% | View All 17 Rows |
Sex and Age in Rockfish
Sex and Age in Rockfish
The most populous age groups in Rockfish are 40 to 44 Years (267 | 15.3%) for men and 50 to 54 Years (197 | 10.8%) for women.
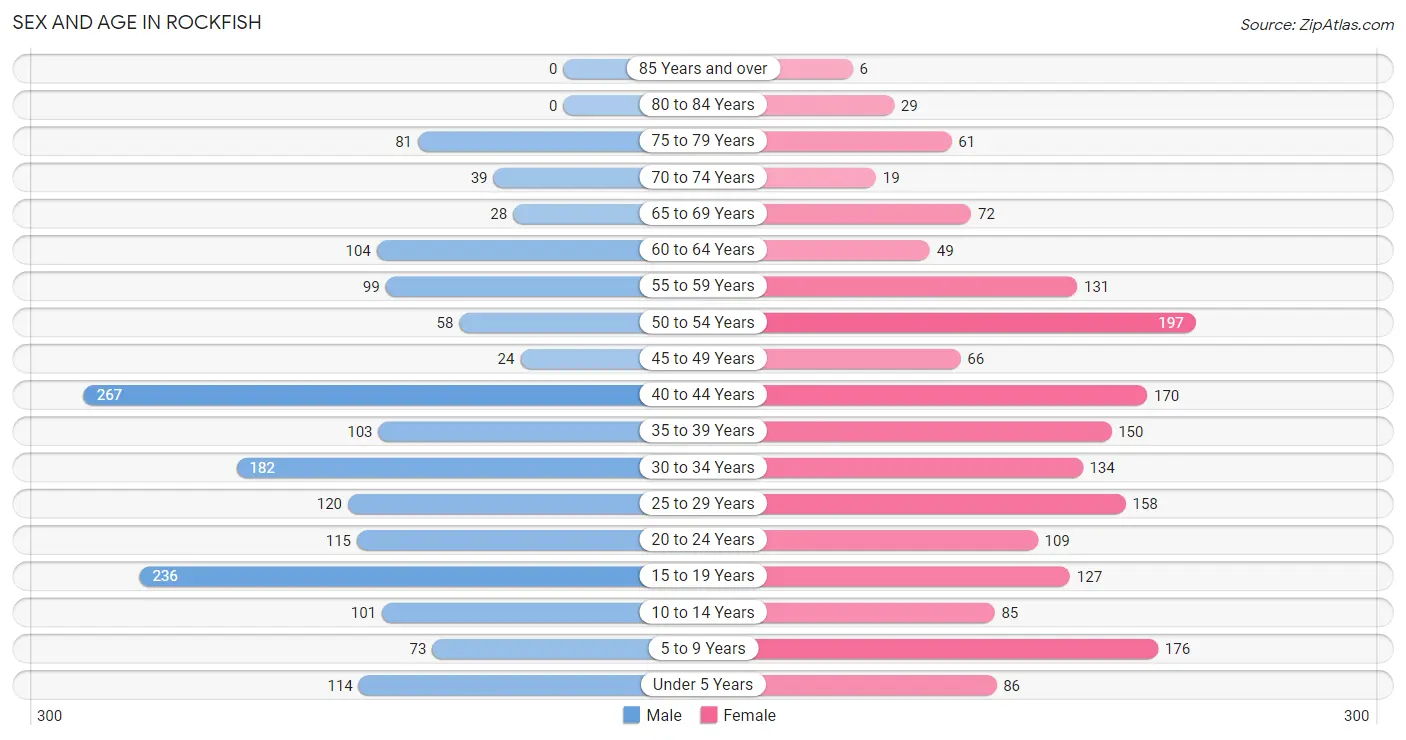
| Age Bracket | Male | Female |
| Under 5 Years | 114 (6.5%) | 86 (4.7%) |
| 5 to 9 Years | 73 (4.2%) | 176 (9.6%) |
| 10 to 14 Years | 101 (5.8%) | 85 (4.7%) |
| 15 to 19 Years | 236 (13.5%) | 127 (7.0%) |
| 20 to 24 Years | 115 (6.6%) | 109 (6.0%) |
| 25 to 29 Years | 120 (6.9%) | 158 (8.7%) |
| 30 to 34 Years | 182 (10.4%) | 134 (7.3%) |
| 35 to 39 Years | 103 (5.9%) | 150 (8.2%) |
| 40 to 44 Years | 267 (15.3%) | 170 (9.3%) |
| 45 to 49 Years | 24 (1.4%) | 66 (3.6%) |
| 50 to 54 Years | 58 (3.3%) | 197 (10.8%) |
| 55 to 59 Years | 99 (5.7%) | 131 (7.2%) |
| 60 to 64 Years | 104 (6.0%) | 49 (2.7%) |
| 65 to 69 Years | 28 (1.6%) | 72 (4.0%) |
| 70 to 74 Years | 39 (2.2%) | 19 (1.0%) |
| 75 to 79 Years | 81 (4.6%) | 61 (3.3%) |
| 80 to 84 Years | 0 (0.0%) | 29 (1.6%) |
| 85 Years and over | 0 (0.0%) | 6 (0.3%) |
| Total | 1,744 (100.0%) | 1,825 (100.0%) |
Families and Households in Rockfish
Median Family Size in Rockfish
The median family size in Rockfish is 3.10 persons per family, with married-couple families (581 | 62.3%) accounting for the largest median family size of 3.22 persons per family. On the other hand, single female/mother families (296 | 31.7%) represent the smallest median family size with 2.89 persons per family.
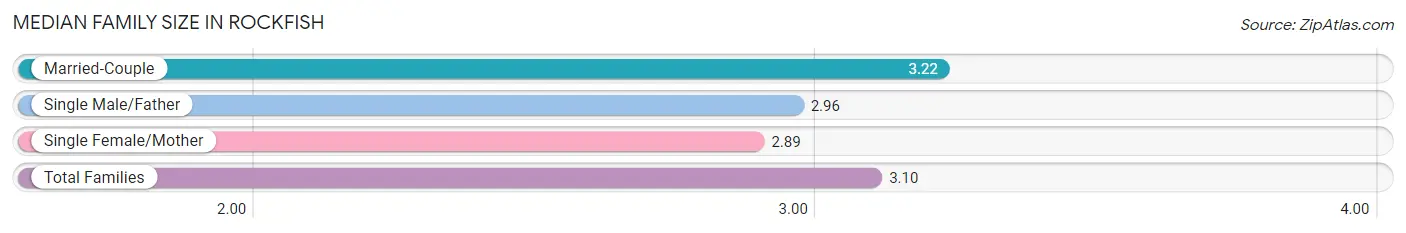
| Family Type | # Families | Family Size |
| Married-Couple | 581 (62.3%) | 3.22 |
| Single Male/Father | 56 (6.0%) | 2.96 |
| Single Female/Mother | 296 (31.7%) | 2.89 |
| Total Families | 933 (100.0%) | 3.10 |
Median Household Size in Rockfish
The median household size in Rockfish is 2.61 persons per household, with single male/father households (56 | 4.1%) accounting for the largest median household size of 3.84 persons per household. non-family households (431 | 31.6%) represent the smallest median household size with 1.19 persons per household.
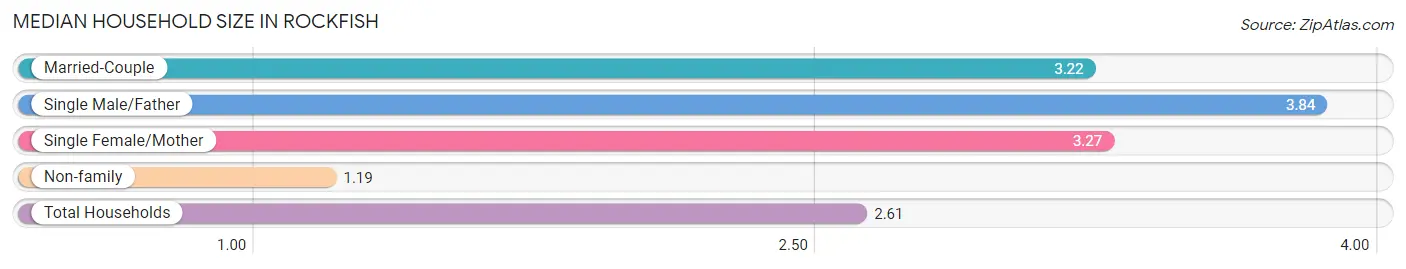
| Household Type | # Households | Household Size |
| Married-Couple | 581 (42.6%) | 3.22 |
| Single Male/Father | 56 (4.1%) | 3.84 |
| Single Female/Mother | 296 (21.7%) | 3.27 |
| Non-family | 431 (31.6%) | 1.19 |
| Total Households | 1,364 (100.0%) | 2.61 |
Household Size by Marriage Status in Rockfish
Out of a total of 1,364 households in Rockfish, 933 (68.4%) are family households, while 431 (31.6%) are nonfamily households. The most numerous type of family households are 2-person households, comprising 478, and the most common type of nonfamily households are 1-person households, comprising 368.
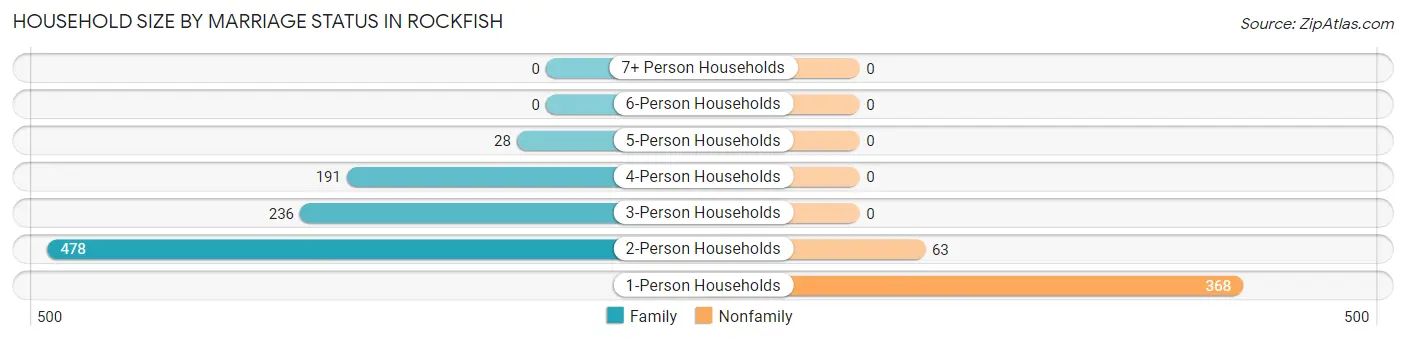
| Household Size | Family Households | Nonfamily Households |
| 1-Person Households | - | 368 (27.0%) |
| 2-Person Households | 478 (35.0%) | 63 (4.6%) |
| 3-Person Households | 236 (17.3%) | 0 (0.0%) |
| 4-Person Households | 191 (14.0%) | 0 (0.0%) |
| 5-Person Households | 28 (2.1%) | 0 (0.0%) |
| 6-Person Households | 0 (0.0%) | 0 (0.0%) |
| 7+ Person Households | 0 (0.0%) | 0 (0.0%) |
| Total | 933 (68.4%) | 431 (31.6%) |
Female Fertility in Rockfish
Fertility by Age in Rockfish
Average fertility rate in Rockfish is 72.0 births per 1,000 women. Women in the age bracket of 20 to 34 years have the highest fertility rate with 97.0 births per 1,000 women. Women in the age bracket of 20 to 34 years acount for 59.1% of all women with births.
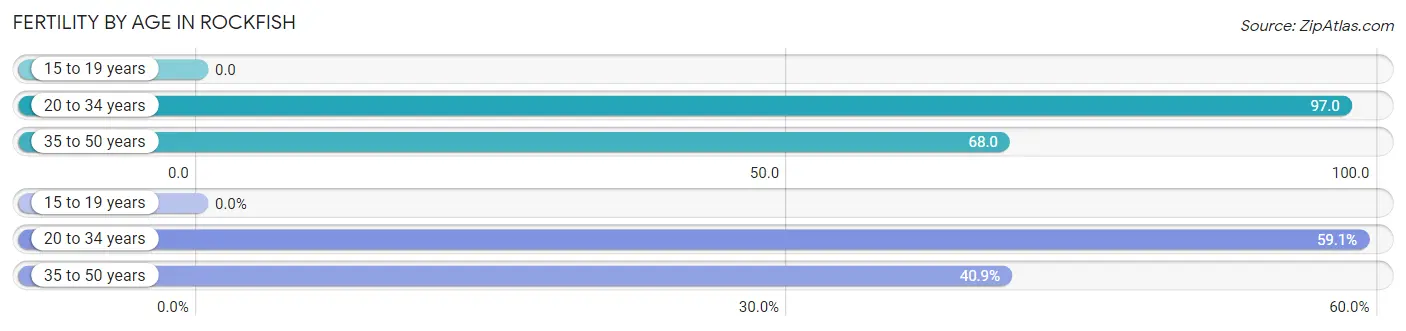
| Age Bracket | Women with Births | Births / 1,000 Women |
| 15 to 19 years | 0 (0.0%) | 0.0 |
| 20 to 34 years | 39 (59.1%) | 97.0 |
| 35 to 50 years | 27 (40.9%) | 68.0 |
| Total | 66 (100.0%) | 72.0 |
Fertility by Age by Marriage Status in Rockfish
39.4% of women with births (66) in Rockfish are married. The highest percentage of unmarried women with births falls into 20 to 34 years age bracket with 87.2% of them unmarried at the time of birth, while the lowest percentage of unmarried women with births belong to 35 to 50 years age bracket with 22.2% of them unmarried.
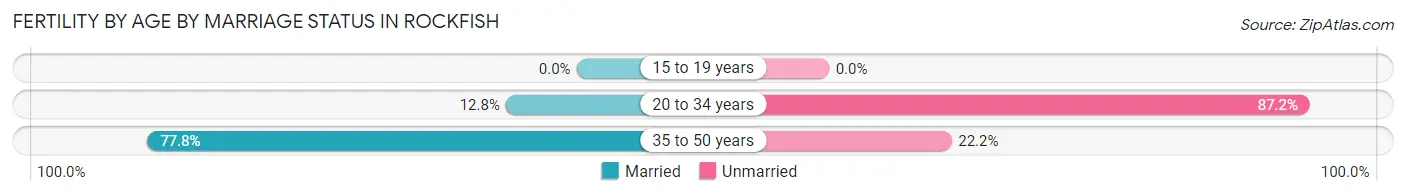
| Age Bracket | Married | Unmarried |
| 15 to 19 years | 0 (0.0%) | 0 (0.0%) |
| 20 to 34 years | 5 (12.8%) | 34 (87.2%) |
| 35 to 50 years | 21 (77.8%) | 6 (22.2%) |
| Total | 26 (39.4%) | 40 (60.6%) |
Fertility by Education in Rockfish
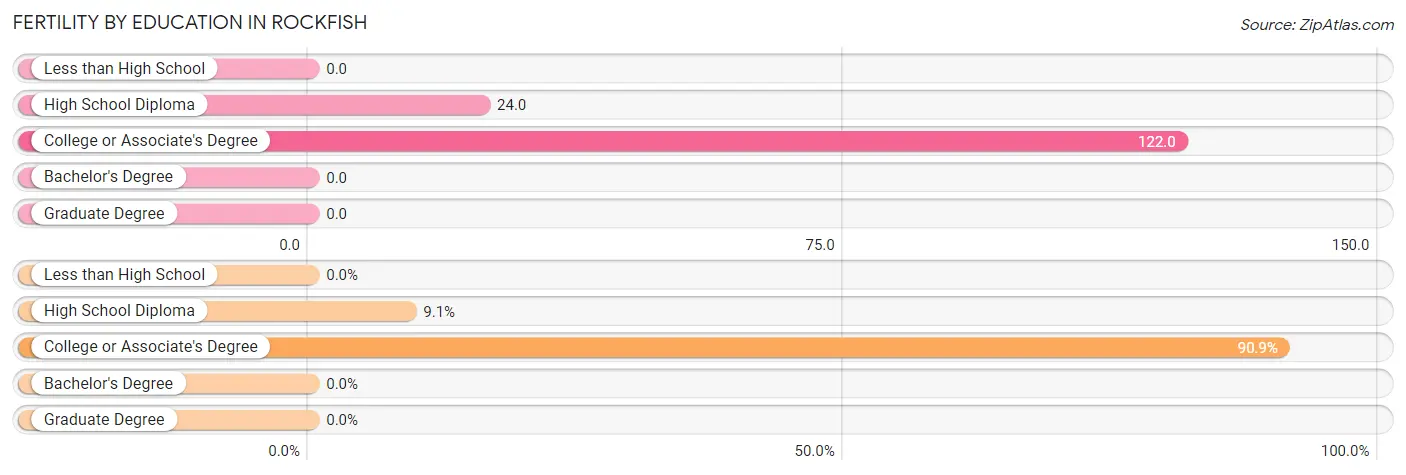
| Educational Attainment | Women with Births | Births / 1,000 Women |
| Less than High School | 0 (0.0%) | 0.0 |
| High School Diploma | 6 (9.1%) | 24.0 |
| College or Associate's Degree | 60 (90.9%) | 122.0 |
| Bachelor's Degree | 0 (0.0%) | 0.0 |
| Graduate Degree | 0 (0.0%) | 0.0 |
| Total | 66 (100.0%) | 72.0 |
Fertility by Education by Marriage Status in Rockfish
60.6% of women with births in Rockfish are unmarried. Women with the educational attainment of college or associate's degree are most likely to be married with 43.3% of them married at childbirth, while women with the educational attainment of high school diploma are least likely to be married with 100.0% of them unmarried at childbirth.
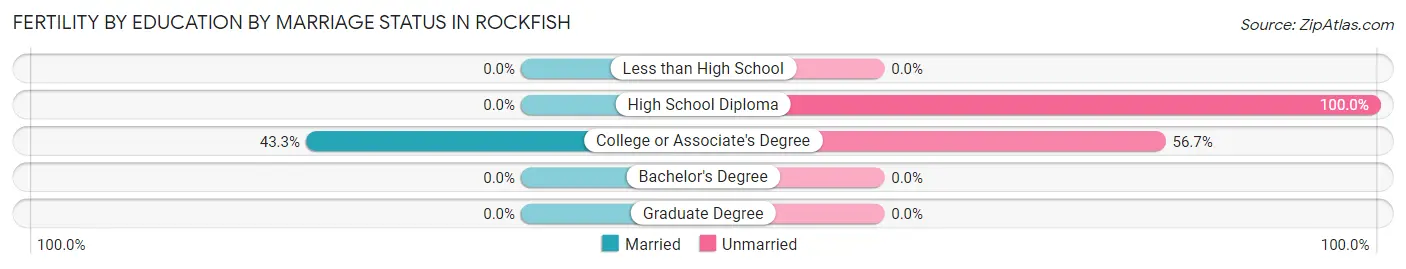
| Educational Attainment | Married | Unmarried |
| Less than High School | 0 (0.0%) | 0 (0.0%) |
| High School Diploma | 0 (0.0%) | 6 (100.0%) |
| College or Associate's Degree | 26 (43.3%) | 34 (56.7%) |
| Bachelor's Degree | 0 (0.0%) | 0 (0.0%) |
| Graduate Degree | 0 (0.0%) | 0 (0.0%) |
| Total | 26 (39.4%) | 40 (60.6%) |
Employment Characteristics in Rockfish
Employment by Class of Employer in Rockfish
Among the 1,730 employed individuals in Rockfish, private company employees (996 | 57.6%), federal government employees (343 | 19.8%), and self-employed (not incorporated) (195 | 11.3%) make up the most common classes of employment.
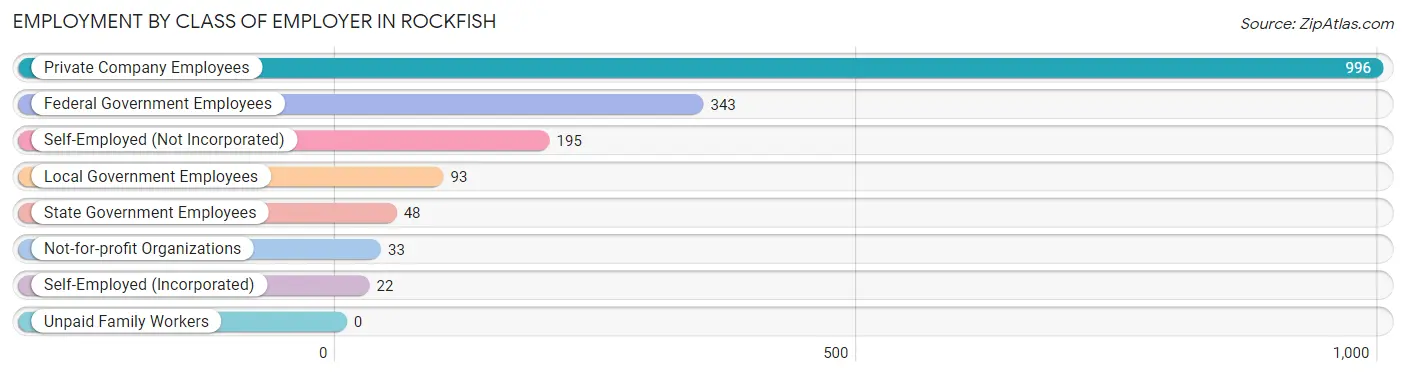
| Employer Class | # Employees | % Employees |
| Private Company Employees | 996 | 57.6% |
| Self-Employed (Incorporated) | 22 | 1.3% |
| Self-Employed (Not Incorporated) | 195 | 11.3% |
| Not-for-profit Organizations | 33 | 1.9% |
| Local Government Employees | 93 | 5.4% |
| State Government Employees | 48 | 2.8% |
| Federal Government Employees | 343 | 19.8% |
| Unpaid Family Workers | 0 | 0.0% |
| Total | 1,730 | 100.0% |
Employment Status by Age in Rockfish
According to the labor force statistics for Rockfish, out of the total population over 16 years of age (2,855), 63.5% or 1,813 individuals are in the labor force, with 4.6% or 83 of them unemployed. The age group with the highest labor force participation rate is 45 to 54 years, with 90.1% or 311 individuals in the labor force. Within the labor force, the 16 to 19 years age range has the highest percentage of unemployed individuals, with 33.3% or 44 of them being unemployed.
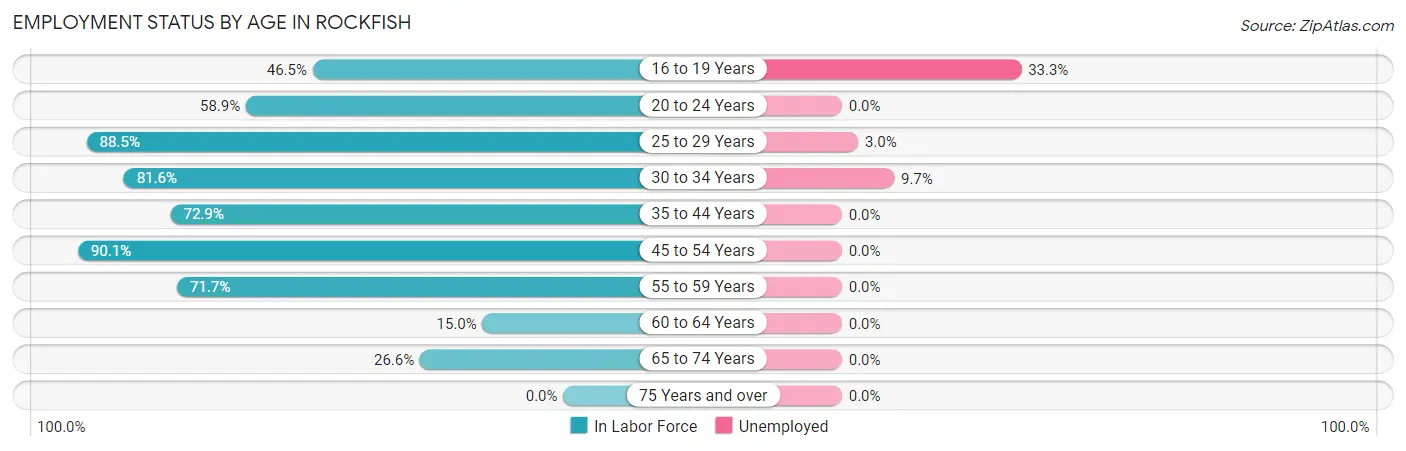
| Age Bracket | In Labor Force | Unemployed |
| 16 to 19 Years | 132 (46.5%) | 44 (33.3%) |
| 20 to 24 Years | 132 (58.9%) | 0 (0.0%) |
| 25 to 29 Years | 246 (88.5%) | 7 (3.0%) |
| 30 to 34 Years | 258 (81.6%) | 25 (9.7%) |
| 35 to 44 Years | 503 (72.9%) | 0 (0.0%) |
| 45 to 54 Years | 311 (90.1%) | 0 (0.0%) |
| 55 to 59 Years | 165 (71.7%) | 0 (0.0%) |
| 60 to 64 Years | 23 (15.0%) | 0 (0.0%) |
| 65 to 74 Years | 42 (26.6%) | 0 (0.0%) |
| 75 Years and over | 0 (0.0%) | 0 (0.0%) |
| Total | 1,813 (63.5%) | 83 (4.6%) |
Employment Status by Educational Attainment in Rockfish
According to labor force statistics for Rockfish, 74.9% of individuals (1,507) out of the total population between 25 and 64 years of age (2,012) are in the labor force, with 2.2% or 33 of them being unemployed. The group with the highest labor force participation rate are those with the educational attainment of bachelor's degree or higher, with 92.6% or 324 individuals in the labor force. Within the labor force, individuals with high school diploma education have the highest percentage of unemployment, with 8.5% or 29 of them being unemployed.
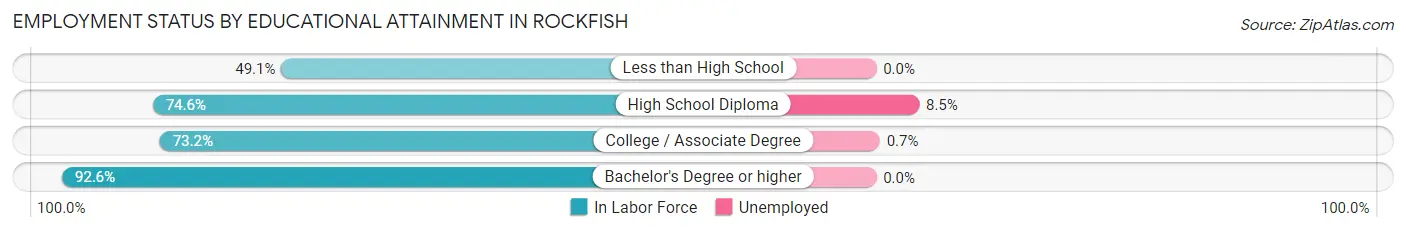
| Educational Attainment | In Labor Force | Unemployed |
| Less than High School | 84 (49.1%) | 0 (0.0%) |
| High School Diploma | 343 (74.6%) | 39 (8.5%) |
| College / Associate Degree | 755 (73.2%) | 7 (0.7%) |
| Bachelor's Degree or higher | 324 (92.6%) | 0 (0.0%) |
| Total | 1,507 (74.9%) | 44 (2.2%) |
Employment Occupations by Sex in Rockfish
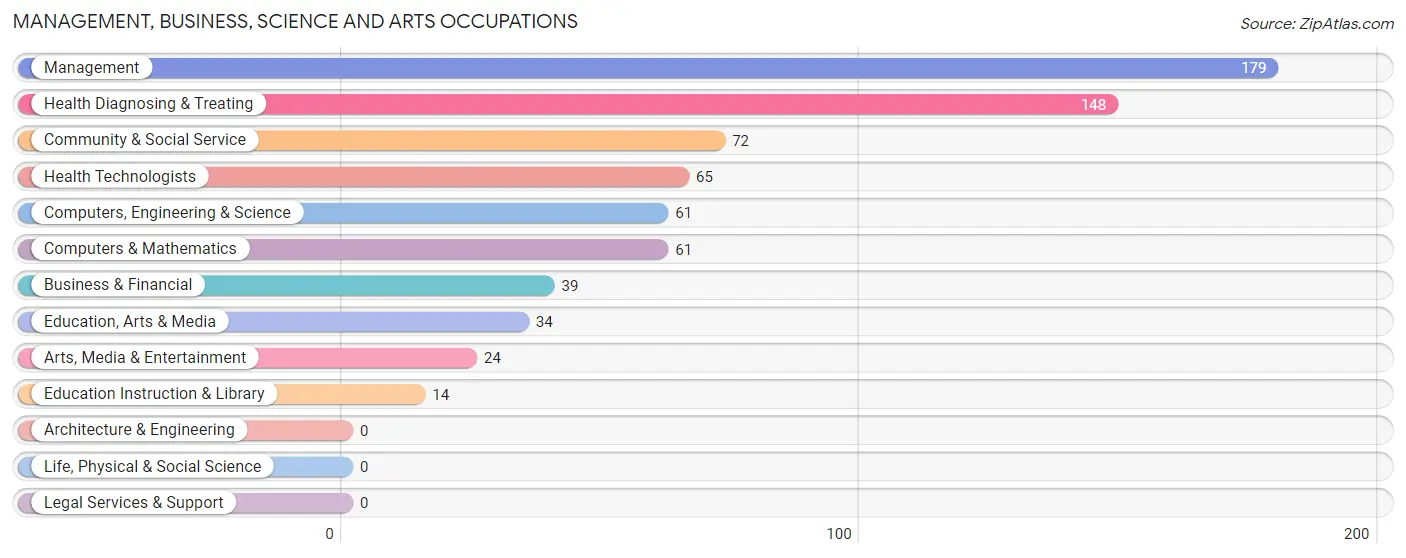
Management, Business, Science and Arts Occupations
The most common Management, Business, Science and Arts occupations in Rockfish are Management (179 | 11.7%), Health Diagnosing & Treating (148 | 9.7%), Community & Social Service (72 | 4.7%), Health Technologists (65 | 4.3%), and Computers, Engineering & Science (61 | 4.0%).
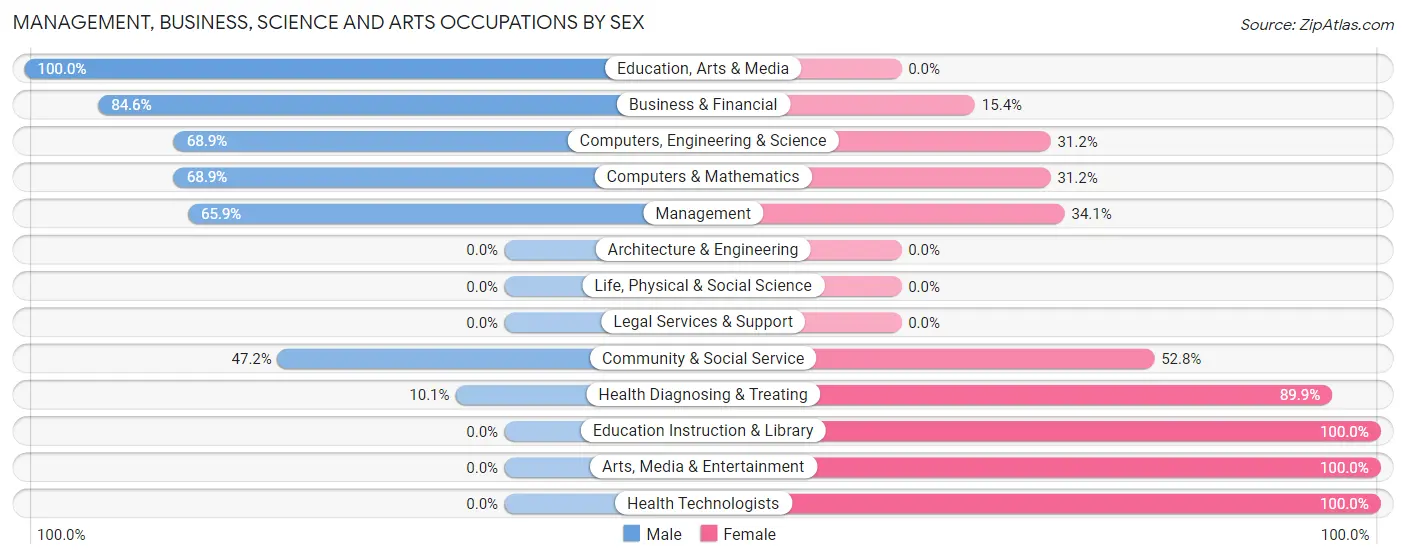
Management, Business, Science and Arts Occupations by Sex
Within the Management, Business, Science and Arts occupations in Rockfish, the most male-oriented occupations are Education, Arts & Media (100.0%), Business & Financial (84.6%), and Computers, Engineering & Science (68.9%), while the most female-oriented occupations are Education Instruction & Library (100.0%), Arts, Media & Entertainment (100.0%), and Health Technologists (100.0%).
| Occupation | Male | Female |
| Management | 118 (65.9%) | 61 (34.1%) |
| Business & Financial | 33 (84.6%) | 6 (15.4%) |
| Computers, Engineering & Science | 42 (68.9%) | 19 (31.1%) |
| Computers & Mathematics | 42 (68.9%) | 19 (31.1%) |
| Architecture & Engineering | 0 (0.0%) | 0 (0.0%) |
| Life, Physical & Social Science | 0 (0.0%) | 0 (0.0%) |
| Community & Social Service | 34 (47.2%) | 38 (52.8%) |
| Education, Arts & Media | 34 (100.0%) | 0 (0.0%) |
| Legal Services & Support | 0 (0.0%) | 0 (0.0%) |
| Education Instruction & Library | 0 (0.0%) | 14 (100.0%) |
| Arts, Media & Entertainment | 0 (0.0%) | 24 (100.0%) |
| Health Diagnosing & Treating | 15 (10.1%) | 133 (89.9%) |
| Health Technologists | 0 (0.0%) | 65 (100.0%) |
| Total (Category) | 242 (48.5%) | 257 (51.5%) |
| Total (Overall) | 710 (46.4%) | 820 (53.6%) |
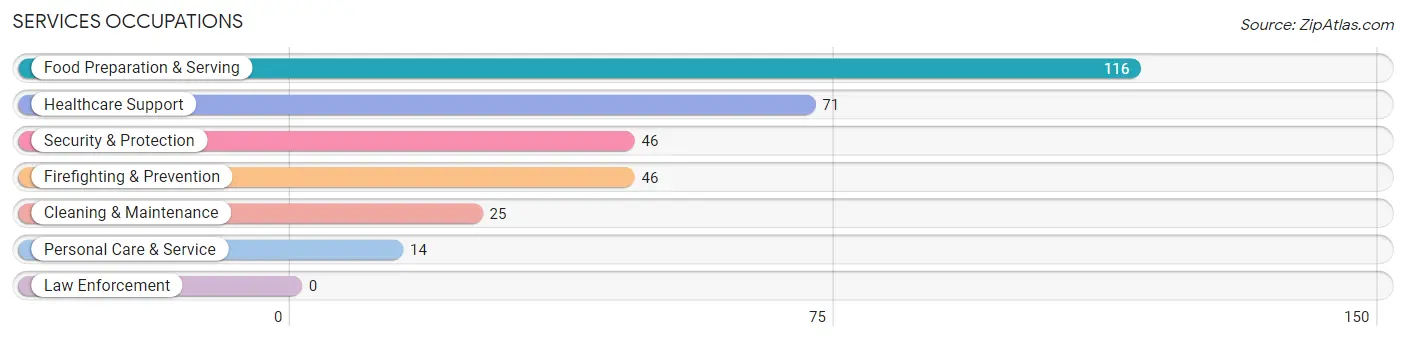
Services Occupations
The most common Services occupations in Rockfish are Food Preparation & Serving (116 | 7.6%), Healthcare Support (71 | 4.6%), Security & Protection (46 | 3.0%), Firefighting & Prevention (46 | 3.0%), and Cleaning & Maintenance (25 | 1.6%).
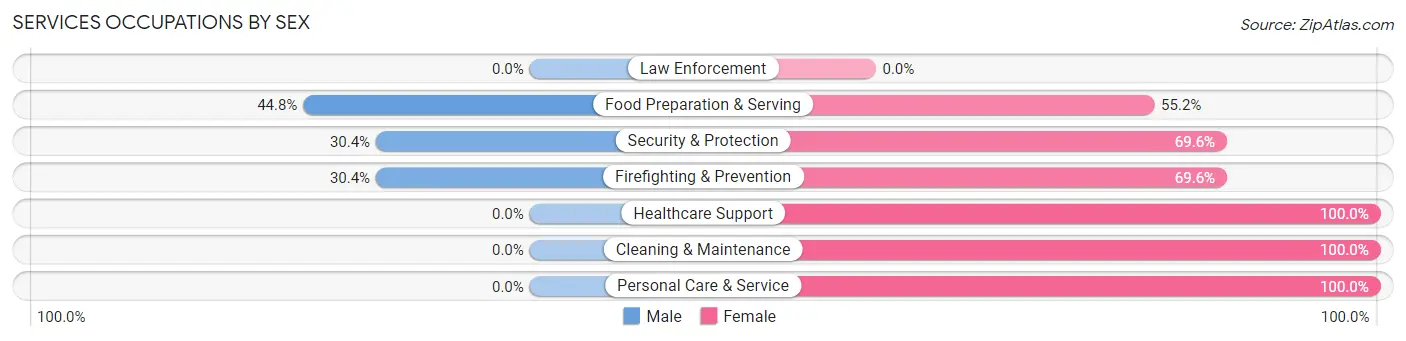
Services Occupations by Sex
Within the Services occupations in Rockfish, the most male-oriented occupations are Food Preparation & Serving (44.8%), Security & Protection (30.4%), and Firefighting & Prevention (30.4%), while the most female-oriented occupations are Healthcare Support (100.0%), Cleaning & Maintenance (100.0%), and Personal Care & Service (100.0%).
| Occupation | Male | Female |
| Healthcare Support | 0 (0.0%) | 71 (100.0%) |
| Security & Protection | 14 (30.4%) | 32 (69.6%) |
| Firefighting & Prevention | 14 (30.4%) | 32 (69.6%) |
| Law Enforcement | 0 (0.0%) | 0 (0.0%) |
| Food Preparation & Serving | 52 (44.8%) | 64 (55.2%) |
| Cleaning & Maintenance | 0 (0.0%) | 25 (100.0%) |
| Personal Care & Service | 0 (0.0%) | 14 (100.0%) |
| Total (Category) | 66 (24.3%) | 206 (75.7%) |
| Total (Overall) | 710 (46.4%) | 820 (53.6%) |
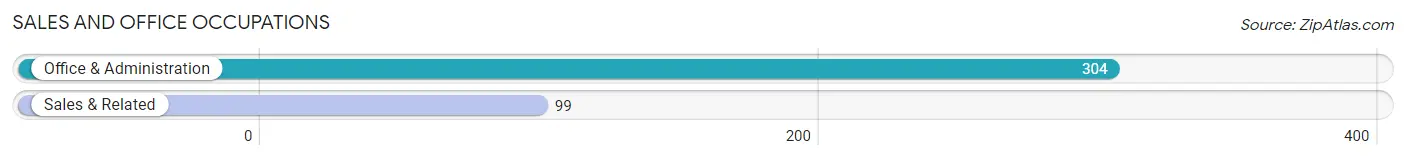
Sales and Office Occupations
The most common Sales and Office occupations in Rockfish are Office & Administration (304 | 19.9%), and Sales & Related (99 | 6.5%).
Sales and Office Occupations by Sex
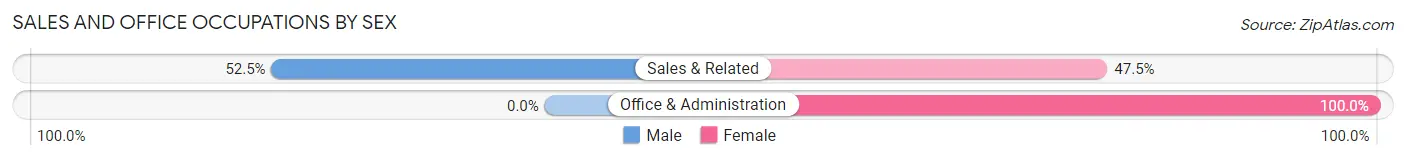
| Occupation | Male | Female |
| Sales & Related | 52 (52.5%) | 47 (47.5%) |
| Office & Administration | 0 (0.0%) | 304 (100.0%) |
| Total (Category) | 52 (12.9%) | 351 (87.1%) |
| Total (Overall) | 710 (46.4%) | 820 (53.6%) |
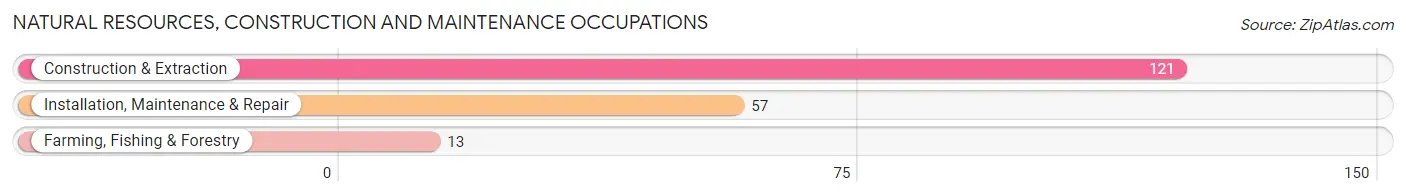
Natural Resources, Construction and Maintenance Occupations
The most common Natural Resources, Construction and Maintenance occupations in Rockfish are Construction & Extraction (121 | 7.9%), Installation, Maintenance & Repair (57 | 3.7%), and Farming, Fishing & Forestry (13 | 0.9%).
Natural Resources, Construction and Maintenance Occupations by Sex
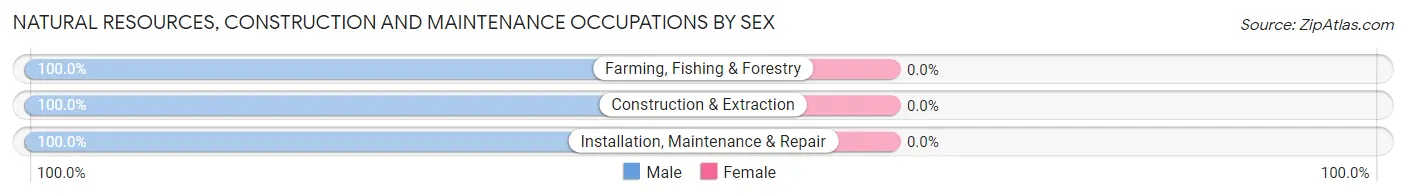
| Occupation | Male | Female |
| Farming, Fishing & Forestry | 13 (100.0%) | 0 (0.0%) |
| Construction & Extraction | 121 (100.0%) | 0 (0.0%) |
| Installation, Maintenance & Repair | 57 (100.0%) | 0 (0.0%) |
| Total (Category) | 191 (100.0%) | 0 (0.0%) |
| Total (Overall) | 710 (46.4%) | 820 (53.6%) |
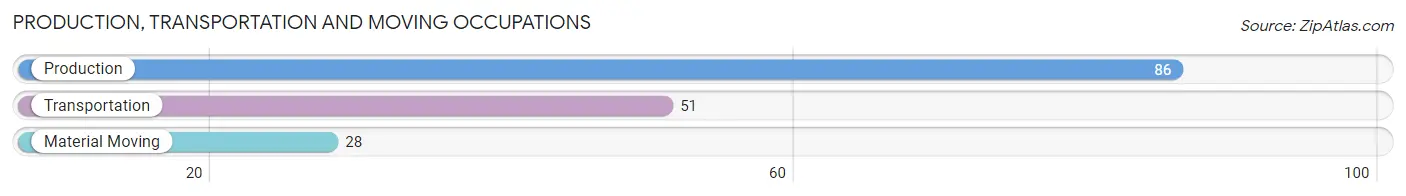
Production, Transportation and Moving Occupations
The most common Production, Transportation and Moving occupations in Rockfish are Production (86 | 5.6%), Transportation (51 | 3.3%), and Material Moving (28 | 1.8%).
Production, Transportation and Moving Occupations by Sex
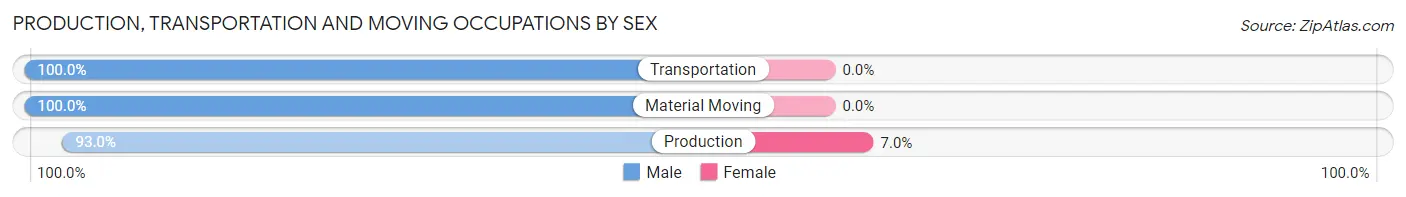
| Occupation | Male | Female |
| Production | 80 (93.0%) | 6 (7.0%) |
| Transportation | 51 (100.0%) | 0 (0.0%) |
| Material Moving | 28 (100.0%) | 0 (0.0%) |
| Total (Category) | 159 (96.4%) | 6 (3.6%) |
| Total (Overall) | 710 (46.4%) | 820 (53.6%) |
Employment Industries by Sex in Rockfish
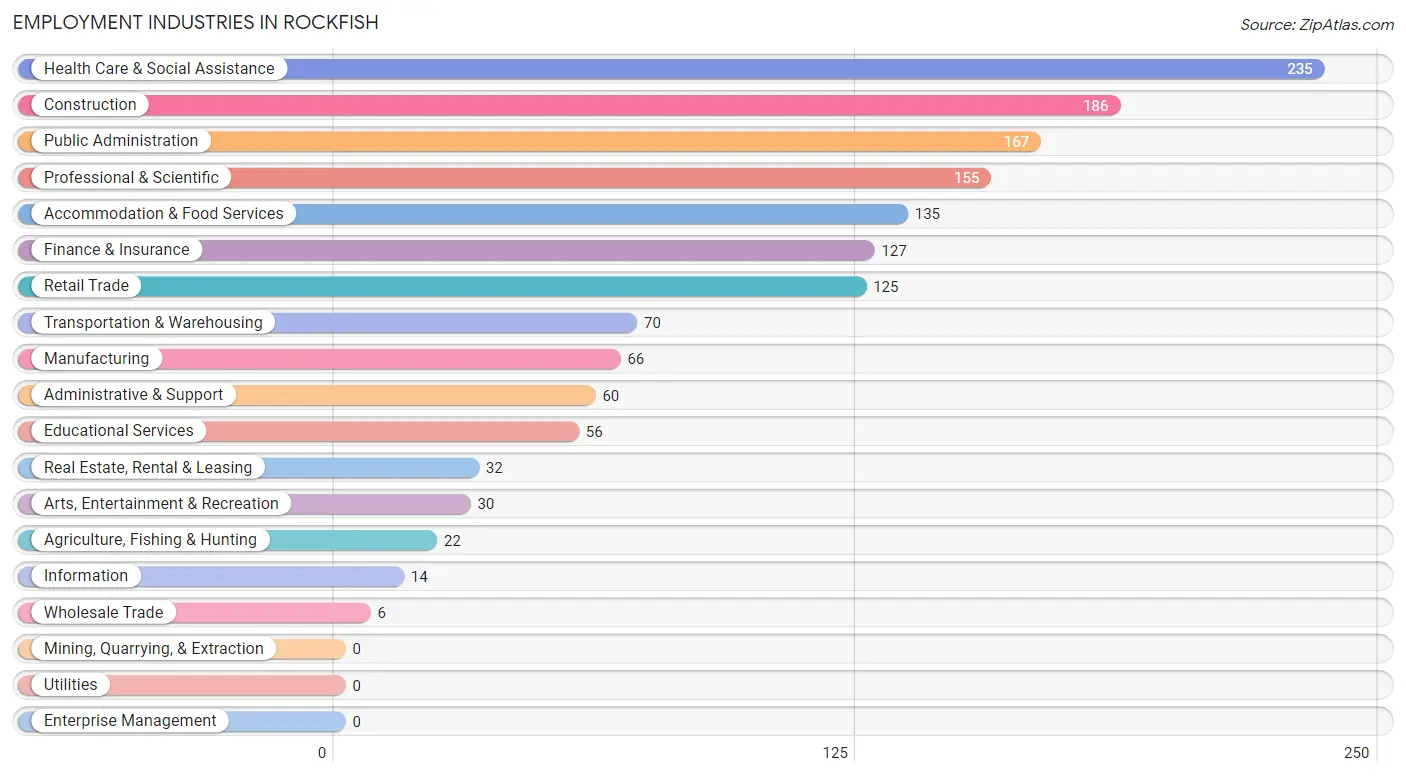
Employment Industries in Rockfish
The major employment industries in Rockfish include Health Care & Social Assistance (235 | 15.4%), Construction (186 | 12.2%), Public Administration (167 | 10.9%), Professional & Scientific (155 | 10.1%), and Accommodation & Food Services (135 | 8.8%).
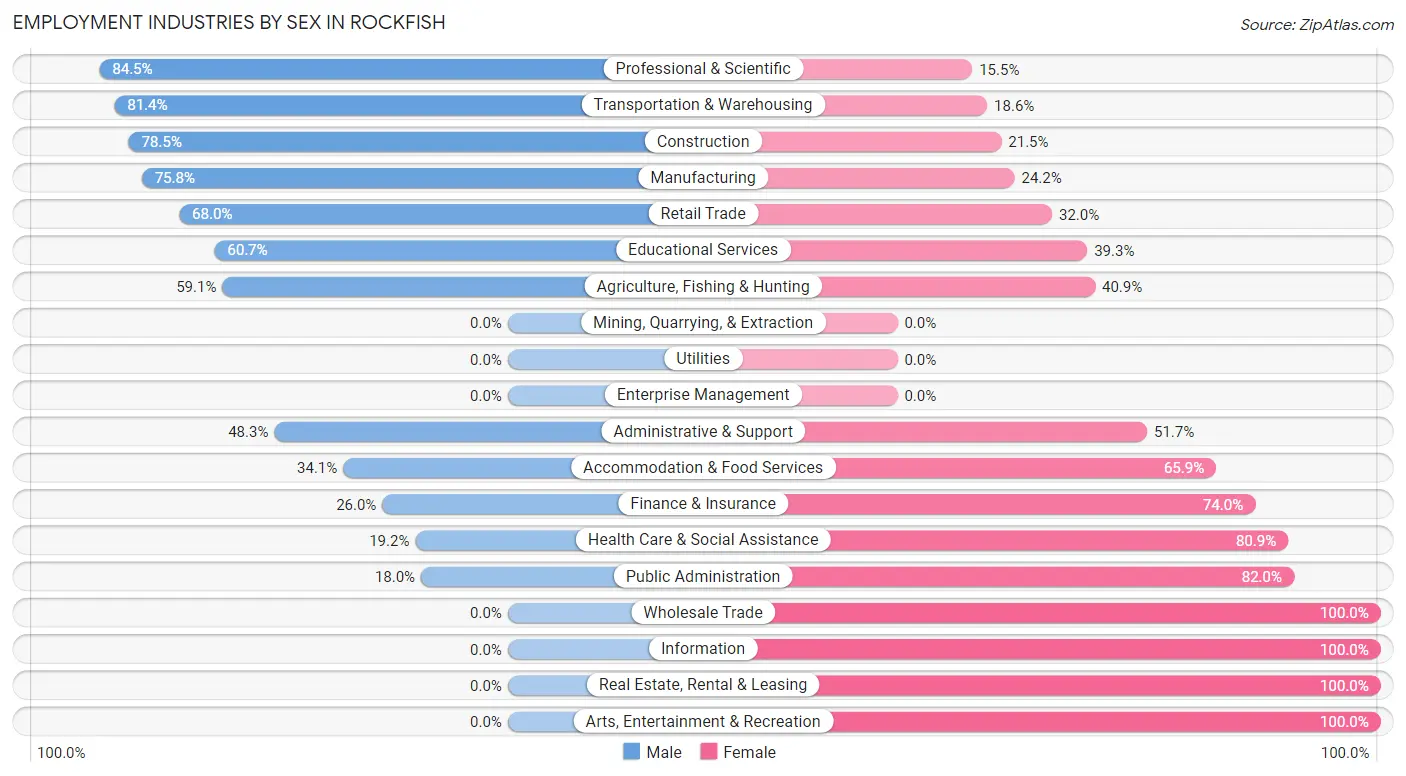
Employment Industries by Sex in Rockfish
The Rockfish industries that see more men than women are Professional & Scientific (84.5%), Transportation & Warehousing (81.4%), and Construction (78.5%), whereas the industries that tend to have a higher number of women are Wholesale Trade (100.0%), Information (100.0%), and Real Estate, Rental & Leasing (100.0%).
| Industry | Male | Female |
| Agriculture, Fishing & Hunting | 13 (59.1%) | 9 (40.9%) |
| Mining, Quarrying, & Extraction | 0 (0.0%) | 0 (0.0%) |
| Construction | 146 (78.5%) | 40 (21.5%) |
| Manufacturing | 50 (75.8%) | 16 (24.2%) |
| Wholesale Trade | 0 (0.0%) | 6 (100.0%) |
| Retail Trade | 85 (68.0%) | 40 (32.0%) |
| Transportation & Warehousing | 57 (81.4%) | 13 (18.6%) |
| Utilities | 0 (0.0%) | 0 (0.0%) |
| Information | 0 (0.0%) | 14 (100.0%) |
| Finance & Insurance | 33 (26.0%) | 94 (74.0%) |
| Real Estate, Rental & Leasing | 0 (0.0%) | 32 (100.0%) |
| Professional & Scientific | 131 (84.5%) | 24 (15.5%) |
| Enterprise Management | 0 (0.0%) | 0 (0.0%) |
| Administrative & Support | 29 (48.3%) | 31 (51.7%) |
| Educational Services | 34 (60.7%) | 22 (39.3%) |
| Health Care & Social Assistance | 45 (19.2%) | 190 (80.8%) |
| Arts, Entertainment & Recreation | 0 (0.0%) | 30 (100.0%) |
| Accommodation & Food Services | 46 (34.1%) | 89 (65.9%) |
| Public Administration | 30 (18.0%) | 137 (82.0%) |
| Total | 710 (46.4%) | 820 (53.6%) |
Education in Rockfish
School Enrollment in Rockfish
The most common levels of schooling among the 1,063 students in Rockfish are high school (323 | 30.4%), college / undergraduate (241 | 22.7%), and middle school (186 | 17.5%).
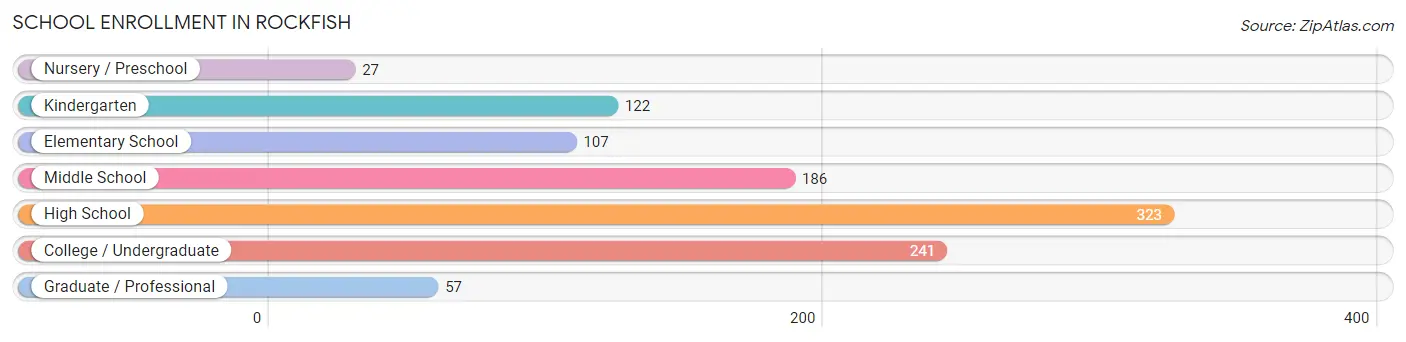
| School Level | # Students | % Students |
| Nursery / Preschool | 27 | 2.5% |
| Kindergarten | 122 | 11.5% |
| Elementary School | 107 | 10.1% |
| Middle School | 186 | 17.5% |
| High School | 323 | 30.4% |
| College / Undergraduate | 241 | 22.7% |
| Graduate / Professional | 57 | 5.4% |
| Total | 1,063 | 100.0% |
School Enrollment by Age by Funding Source in Rockfish
Out of a total of 1,063 students who are enrolled in schools in Rockfish, 230 (21.6%) attend a private institution, while the remaining 833 (78.4%) are enrolled in public schools. The age group of 18 to 19 year olds has the highest likelihood of being enrolled in private schools, with 80 (55.9% in the age bracket) enrolled. Conversely, the age group of 3 to 4 year olds has the lowest likelihood of being enrolled in a private school, with 27 (100.0% in the age bracket) attending a public institution.
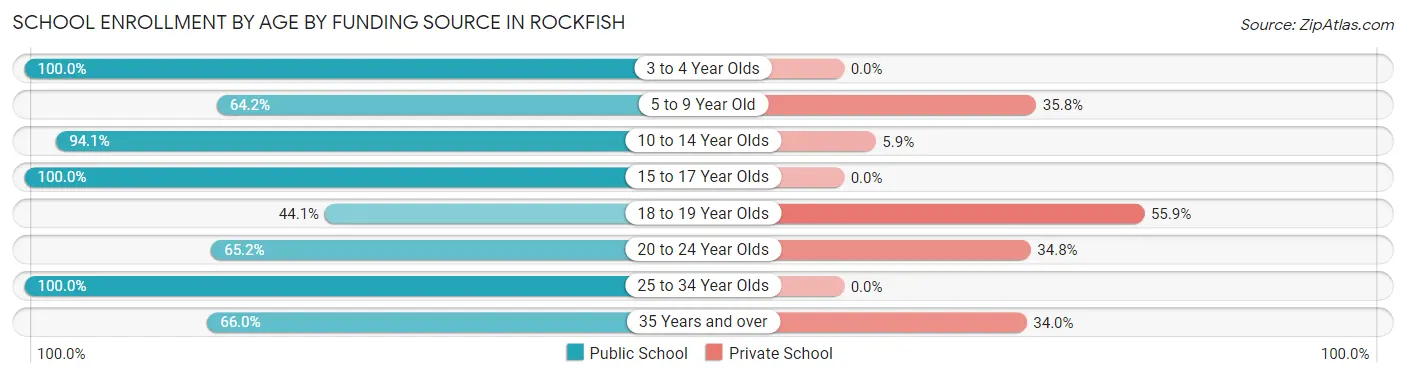
| Age Bracket | Public School | Private School |
| 3 to 4 Year Olds | 27 (100.0%) | 0 (0.0%) |
| 5 to 9 Year Old | 147 (64.2%) | 82 (35.8%) |
| 10 to 14 Year Olds | 175 (94.1%) | 11 (5.9%) |
| 15 to 17 Year Olds | 210 (100.0%) | 0 (0.0%) |
| 18 to 19 Year Olds | 63 (44.1%) | 80 (55.9%) |
| 20 to 24 Year Olds | 15 (65.2%) | 8 (34.8%) |
| 25 to 34 Year Olds | 101 (100.0%) | 0 (0.0%) |
| 35 Years and over | 95 (66.0%) | 49 (34.0%) |
| Total | 833 (78.4%) | 230 (21.6%) |
Educational Attainment by Field of Study in Rockfish
Arts & humanities (96 | 23.0%), science & technology (81 | 19.4%), business (65 | 15.5%), communications (43 | 10.3%), and computers & mathematics (34 | 8.1%) are the most common fields of study among 418 individuals in Rockfish who have obtained a bachelor's degree or higher.
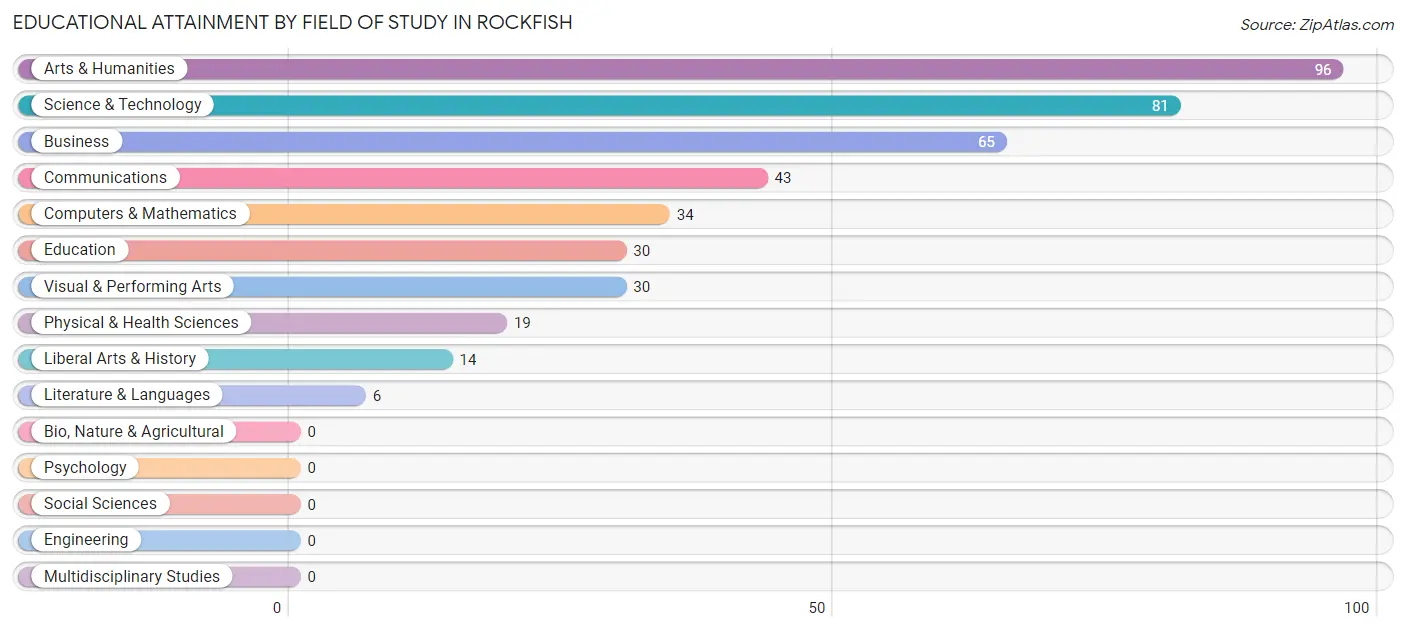
| Field of Study | # Graduates | % Graduates |
| Computers & Mathematics | 34 | 8.1% |
| Bio, Nature & Agricultural | 0 | 0.0% |
| Physical & Health Sciences | 19 | 4.5% |
| Psychology | 0 | 0.0% |
| Social Sciences | 0 | 0.0% |
| Engineering | 0 | 0.0% |
| Multidisciplinary Studies | 0 | 0.0% |
| Science & Technology | 81 | 19.4% |
| Business | 65 | 15.5% |
| Education | 30 | 7.2% |
| Literature & Languages | 6 | 1.4% |
| Liberal Arts & History | 14 | 3.4% |
| Visual & Performing Arts | 30 | 7.2% |
| Communications | 43 | 10.3% |
| Arts & Humanities | 96 | 23.0% |
| Total | 418 | 100.0% |
Transportation & Commute in Rockfish
Vehicle Availability by Sex in Rockfish
The most prevalent vehicle ownership categories in Rockfish are males with 2 vehicles (312, accounting for 36.2%) and females with 2 vehicles (359, making up 35.9%).
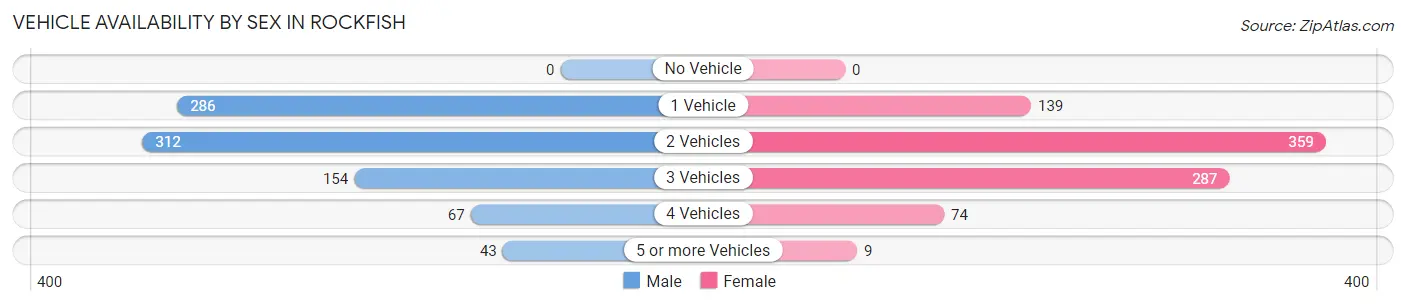
| Vehicles Available | Male | Female |
| No Vehicle | 0 (0.0%) | 0 (0.0%) |
| 1 Vehicle | 286 (33.2%) | 139 (16.0%) |
| 2 Vehicles | 312 (36.2%) | 359 (41.4%) |
| 3 Vehicles | 154 (17.9%) | 287 (33.1%) |
| 4 Vehicles | 67 (7.8%) | 74 (8.5%) |
| 5 or more Vehicles | 43 (5.0%) | 9 (1.0%) |
| Total | 862 (100.0%) | 868 (100.0%) |
Commute Time in Rockfish
The most frequently occuring commute durations in Rockfish are 30 to 34 minutes (356 commuters, 25.0%), 20 to 24 minutes (224 commuters, 15.7%), and 15 to 19 minutes (183 commuters, 12.8%).
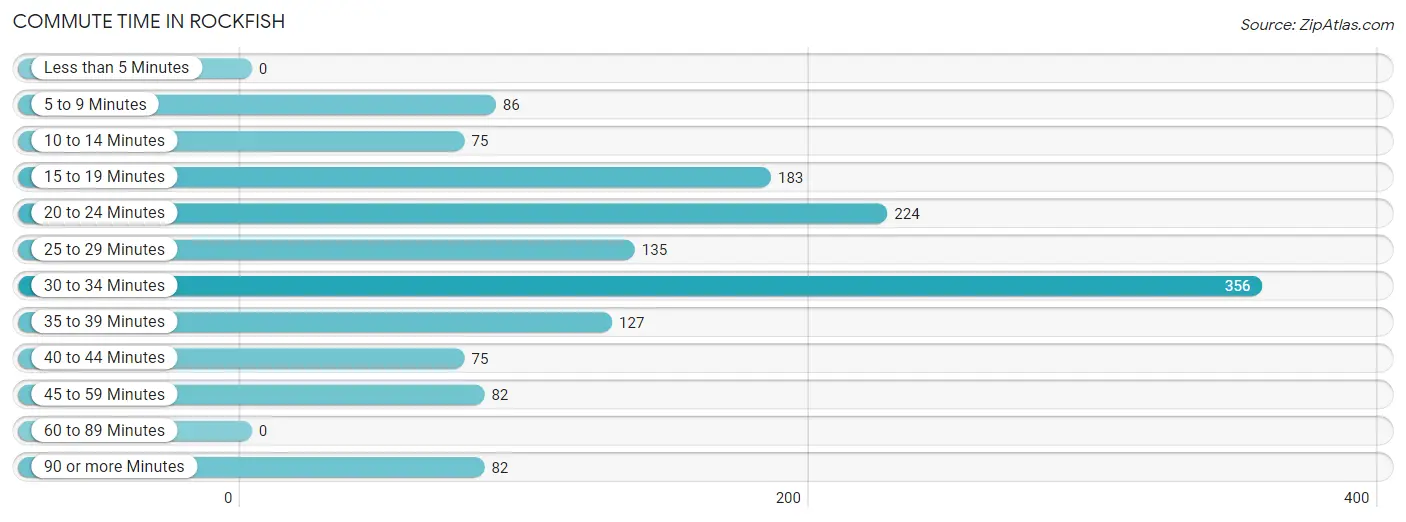
| Commute Time | # Commuters | % Commuters |
| Less than 5 Minutes | 0 | 0.0% |
| 5 to 9 Minutes | 86 | 6.0% |
| 10 to 14 Minutes | 75 | 5.3% |
| 15 to 19 Minutes | 183 | 12.8% |
| 20 to 24 Minutes | 224 | 15.7% |
| 25 to 29 Minutes | 135 | 9.5% |
| 30 to 34 Minutes | 356 | 25.0% |
| 35 to 39 Minutes | 127 | 8.9% |
| 40 to 44 Minutes | 75 | 5.3% |
| 45 to 59 Minutes | 82 | 5.8% |
| 60 to 89 Minutes | 0 | 0.0% |
| 90 or more Minutes | 82 | 5.8% |
Commute Time by Sex in Rockfish
The most common commute times in Rockfish are 15 to 19 minutes (111 commuters, 15.9%) for males and 30 to 34 minutes (248 commuters, 34.1%) for females.
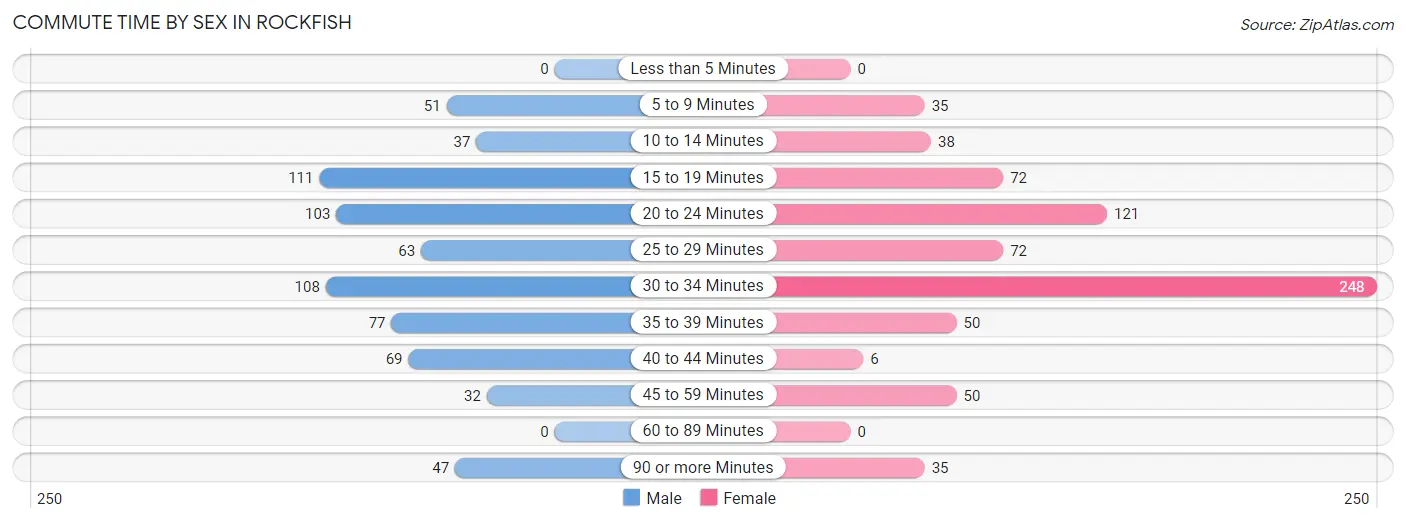
| Commute Time | Male | Female |
| Less than 5 Minutes | 0 (0.0%) | 0 (0.0%) |
| 5 to 9 Minutes | 51 (7.3%) | 35 (4.8%) |
| 10 to 14 Minutes | 37 (5.3%) | 38 (5.2%) |
| 15 to 19 Minutes | 111 (15.9%) | 72 (9.9%) |
| 20 to 24 Minutes | 103 (14.8%) | 121 (16.6%) |
| 25 to 29 Minutes | 63 (9.0%) | 72 (9.9%) |
| 30 to 34 Minutes | 108 (15.5%) | 248 (34.1%) |
| 35 to 39 Minutes | 77 (11.0%) | 50 (6.9%) |
| 40 to 44 Minutes | 69 (9.9%) | 6 (0.8%) |
| 45 to 59 Minutes | 32 (4.6%) | 50 (6.9%) |
| 60 to 89 Minutes | 0 (0.0%) | 0 (0.0%) |
| 90 or more Minutes | 47 (6.7%) | 35 (4.8%) |
Time of Departure to Work by Sex in Rockfish
The most frequent times of departure to work in Rockfish are 4:00 PM to 11:59 PM (136, 19.5%) for males and 12:00 PM to 3:59 PM (160, 22.0%) for females.
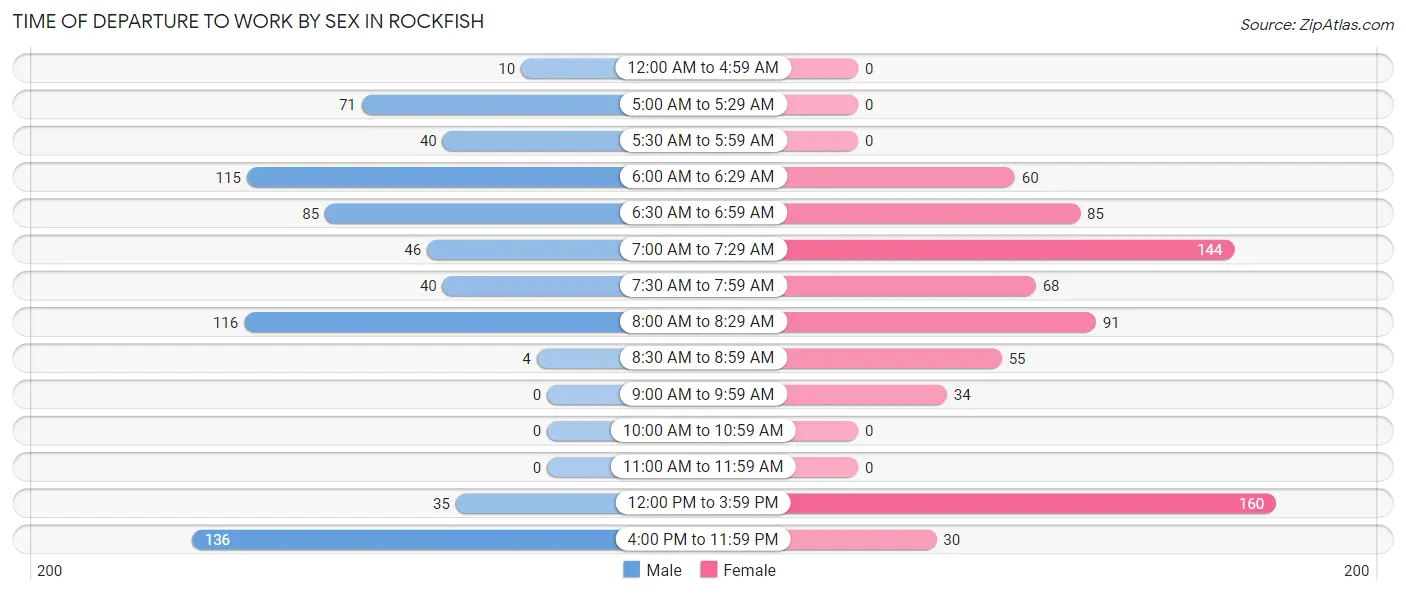
| Time of Departure | Male | Female |
| 12:00 AM to 4:59 AM | 10 (1.4%) | 0 (0.0%) |
| 5:00 AM to 5:29 AM | 71 (10.2%) | 0 (0.0%) |
| 5:30 AM to 5:59 AM | 40 (5.7%) | 0 (0.0%) |
| 6:00 AM to 6:29 AM | 115 (16.5%) | 60 (8.3%) |
| 6:30 AM to 6:59 AM | 85 (12.2%) | 85 (11.7%) |
| 7:00 AM to 7:29 AM | 46 (6.6%) | 144 (19.8%) |
| 7:30 AM to 7:59 AM | 40 (5.7%) | 68 (9.3%) |
| 8:00 AM to 8:29 AM | 116 (16.6%) | 91 (12.5%) |
| 8:30 AM to 8:59 AM | 4 (0.6%) | 55 (7.6%) |
| 9:00 AM to 9:59 AM | 0 (0.0%) | 34 (4.7%) |
| 10:00 AM to 10:59 AM | 0 (0.0%) | 0 (0.0%) |
| 11:00 AM to 11:59 AM | 0 (0.0%) | 0 (0.0%) |
| 12:00 PM to 3:59 PM | 35 (5.0%) | 160 (22.0%) |
| 4:00 PM to 11:59 PM | 136 (19.5%) | 30 (4.1%) |
| Total | 698 (100.0%) | 727 (100.0%) |
Housing Occupancy in Rockfish
Occupancy by Ownership in Rockfish
Of the total 1,364 dwellings in Rockfish, owner-occupied units account for 1,051 (77.0%), while renter-occupied units make up 313 (23.0%).
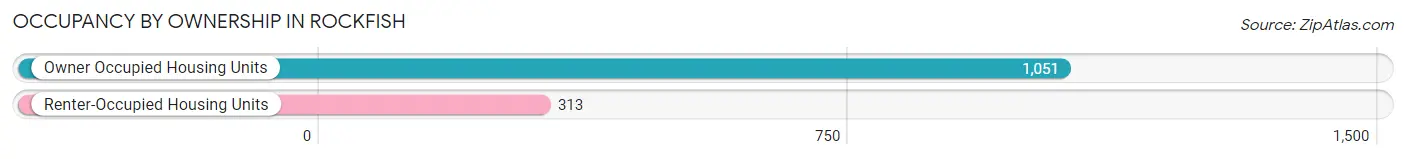
| Occupancy | # Housing Units | % Housing Units |
| Owner Occupied Housing Units | 1,051 | 77.0% |
| Renter-Occupied Housing Units | 313 | 23.0% |
| Total Occupied Housing Units | 1,364 | 100.0% |
Occupancy by Household Size in Rockfish
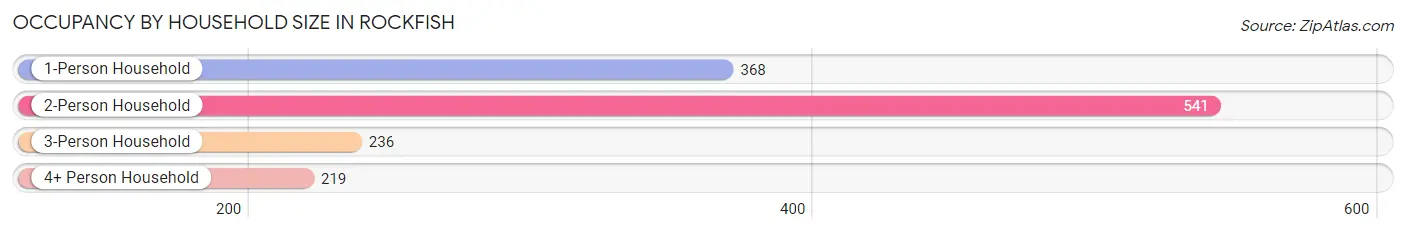
| Household Size | # Housing Units | % Housing Units |
| 1-Person Household | 368 | 27.0% |
| 2-Person Household | 541 | 39.7% |
| 3-Person Household | 236 | 17.3% |
| 4+ Person Household | 219 | 16.1% |
| Total Housing Units | 1,364 | 100.0% |
Occupancy by Ownership by Household Size in Rockfish
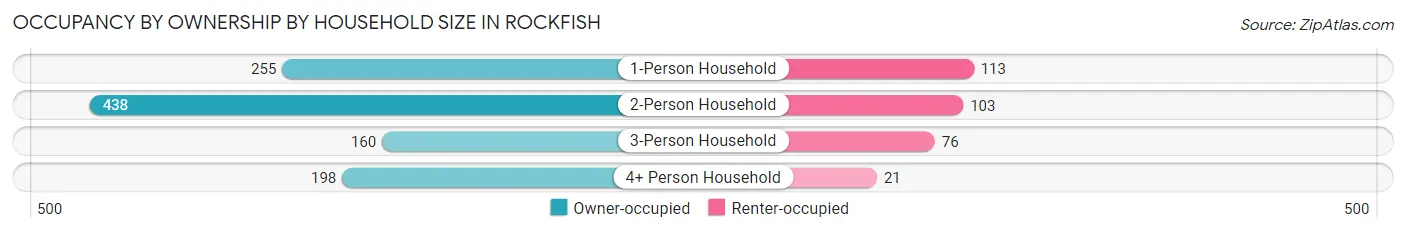
| Household Size | Owner-occupied | Renter-occupied |
| 1-Person Household | 255 (69.3%) | 113 (30.7%) |
| 2-Person Household | 438 (81.0%) | 103 (19.0%) |
| 3-Person Household | 160 (67.8%) | 76 (32.2%) |
| 4+ Person Household | 198 (90.4%) | 21 (9.6%) |
| Total Housing Units | 1,051 (77.0%) | 313 (23.0%) |
Occupancy by Educational Attainment in Rockfish
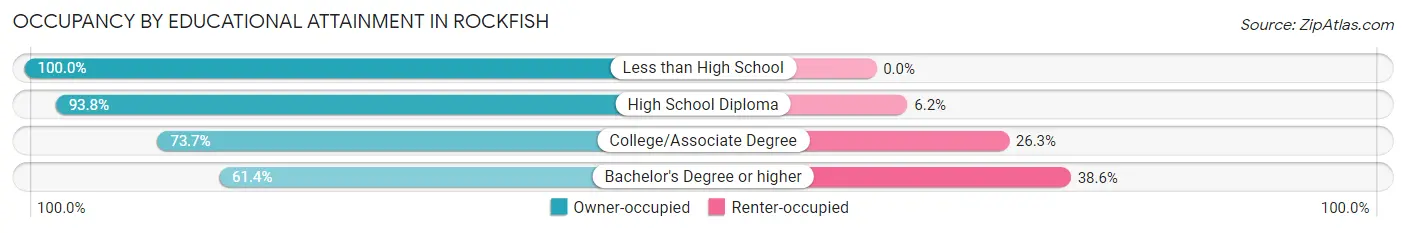
| Household Size | Owner-occupied | Renter-occupied |
| Less than High School | 65 (100.0%) | 0 (0.0%) |
| High School Diploma | 334 (93.8%) | 22 (6.2%) |
| College/Associate Degree | 437 (73.7%) | 156 (26.3%) |
| Bachelor's Degree or higher | 215 (61.4%) | 135 (38.6%) |
Occupancy by Age of Householder in Rockfish
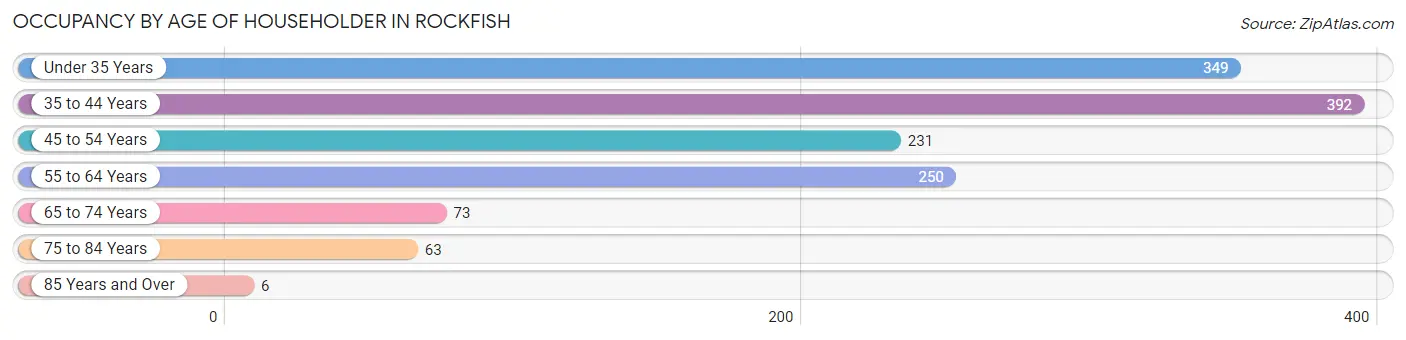
| Age Bracket | # Households | % Households |
| Under 35 Years | 349 | 25.6% |
| 35 to 44 Years | 392 | 28.7% |
| 45 to 54 Years | 231 | 16.9% |
| 55 to 64 Years | 250 | 18.3% |
| 65 to 74 Years | 73 | 5.3% |
| 75 to 84 Years | 63 | 4.6% |
| 85 Years and Over | 6 | 0.4% |
| Total | 1,364 | 100.0% |
Housing Finances in Rockfish
Median Income by Occupancy in Rockfish
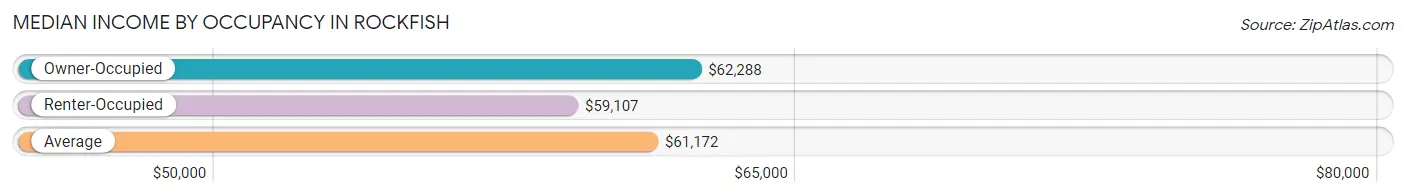
| Occupancy Type | # Households | Median Income |
| Owner-Occupied | 1,051 (77.0%) | $62,288 |
| Renter-Occupied | 313 (23.0%) | $59,107 |
| Average | 1,364 (100.0%) | $61,172 |
Occupancy by Householder Income Bracket in Rockfish
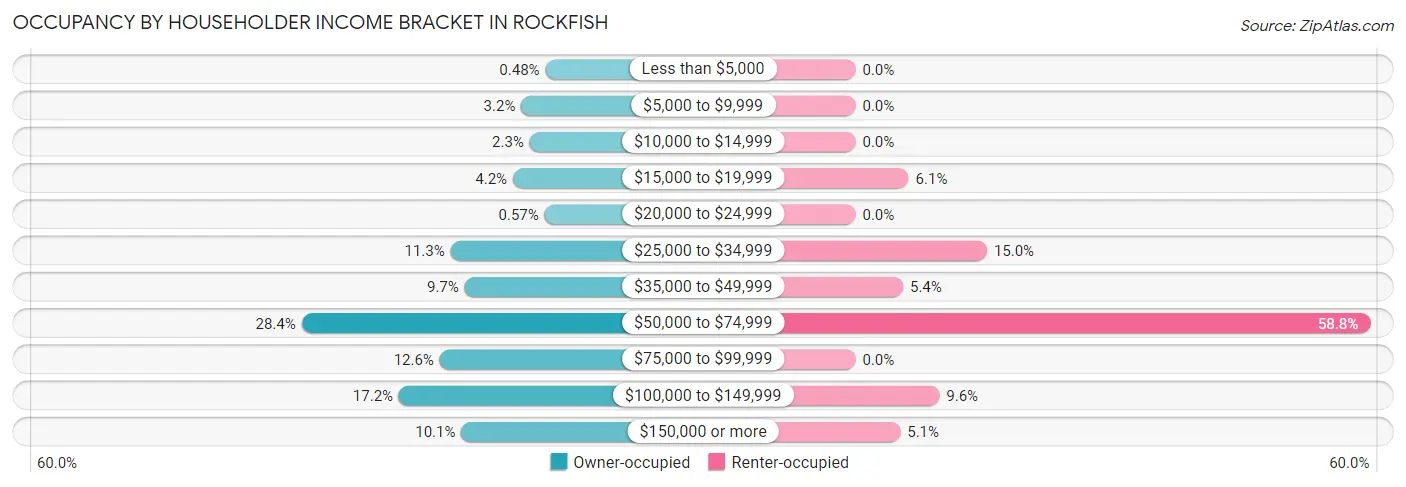
| Income Bracket | Owner-occupied | Renter-occupied |
| Less than $5,000 | 5 (0.5%) | 0 (0.0%) |
| $5,000 to $9,999 | 34 (3.2%) | 0 (0.0%) |
| $10,000 to $14,999 | 24 (2.3%) | 0 (0.0%) |
| $15,000 to $19,999 | 44 (4.2%) | 19 (6.1%) |
| $20,000 to $24,999 | 6 (0.6%) | 0 (0.0%) |
| $25,000 to $34,999 | 119 (11.3%) | 47 (15.0%) |
| $35,000 to $49,999 | 102 (9.7%) | 17 (5.4%) |
| $50,000 to $74,999 | 298 (28.3%) | 184 (58.8%) |
| $75,000 to $99,999 | 132 (12.6%) | 0 (0.0%) |
| $100,000 to $149,999 | 181 (17.2%) | 30 (9.6%) |
| $150,000 or more | 106 (10.1%) | 16 (5.1%) |
| Total | 1,051 (100.0%) | 313 (100.0%) |
Monthly Housing Cost Tiers in Rockfish
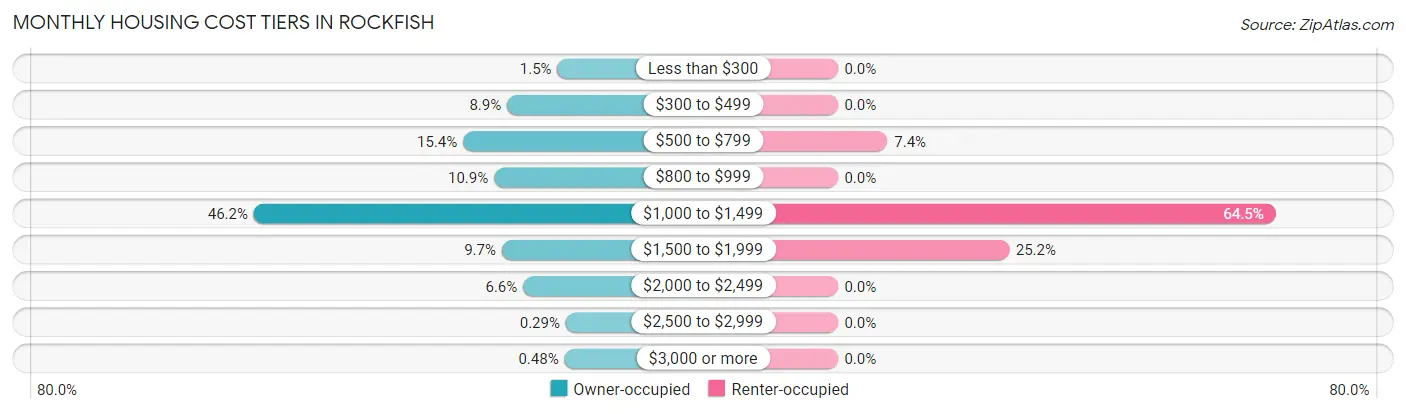
| Monthly Cost | Owner-occupied | Renter-occupied |
| Less than $300 | 16 (1.5%) | 0 (0.0%) |
| $300 to $499 | 94 (8.9%) | 0 (0.0%) |
| $500 to $799 | 162 (15.4%) | 23 (7.3%) |
| $800 to $999 | 114 (10.8%) | 0 (0.0%) |
| $1,000 to $1,499 | 486 (46.2%) | 202 (64.5%) |
| $1,500 to $1,999 | 102 (9.7%) | 79 (25.2%) |
| $2,000 to $2,499 | 69 (6.6%) | 0 (0.0%) |
| $2,500 to $2,999 | 3 (0.3%) | 0 (0.0%) |
| $3,000 or more | 5 (0.5%) | 0 (0.0%) |
| Total | 1,051 (100.0%) | 313 (100.0%) |
Physical Housing Characteristics in Rockfish
Housing Structures in Rockfish
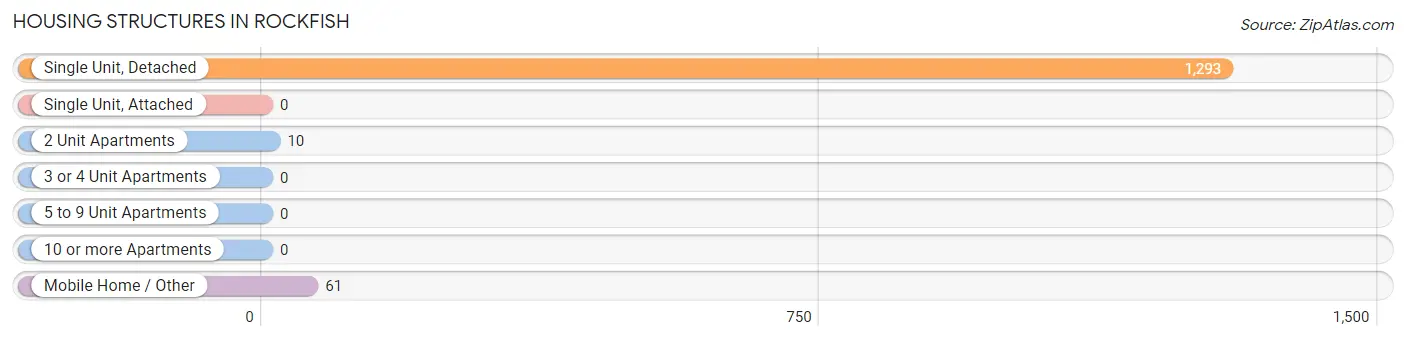
| Structure Type | # Housing Units | % Housing Units |
| Single Unit, Detached | 1,293 | 94.8% |
| Single Unit, Attached | 0 | 0.0% |
| 2 Unit Apartments | 10 | 0.7% |
| 3 or 4 Unit Apartments | 0 | 0.0% |
| 5 to 9 Unit Apartments | 0 | 0.0% |
| 10 or more Apartments | 0 | 0.0% |
| Mobile Home / Other | 61 | 4.5% |
| Total | 1,364 | 100.0% |
Housing Structures by Occupancy in Rockfish
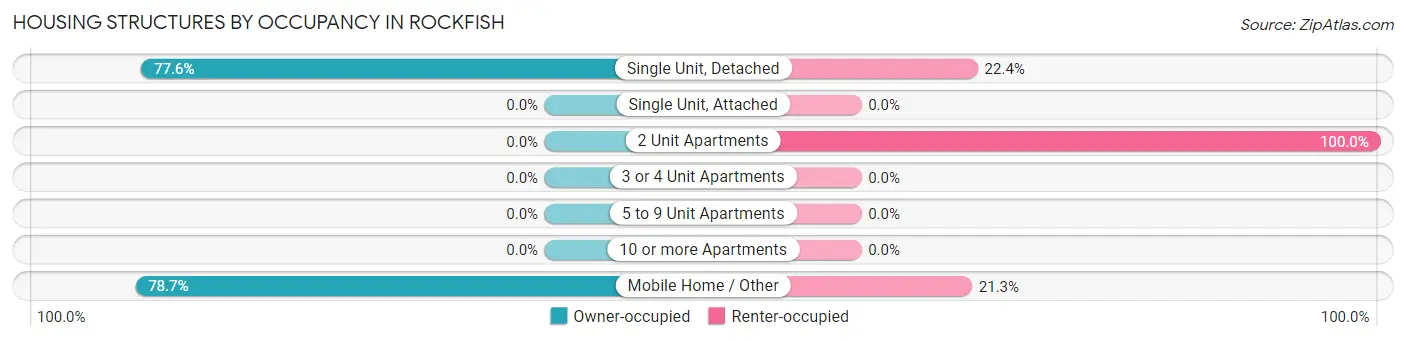
| Structure Type | Owner-occupied | Renter-occupied |
| Single Unit, Detached | 1,003 (77.6%) | 290 (22.4%) |
| Single Unit, Attached | 0 (0.0%) | 0 (0.0%) |
| 2 Unit Apartments | 0 (0.0%) | 10 (100.0%) |
| 3 or 4 Unit Apartments | 0 (0.0%) | 0 (0.0%) |
| 5 to 9 Unit Apartments | 0 (0.0%) | 0 (0.0%) |
| 10 or more Apartments | 0 (0.0%) | 0 (0.0%) |
| Mobile Home / Other | 48 (78.7%) | 13 (21.3%) |
| Total | 1,051 (77.0%) | 313 (23.0%) |
Housing Structures by Number of Rooms in Rockfish
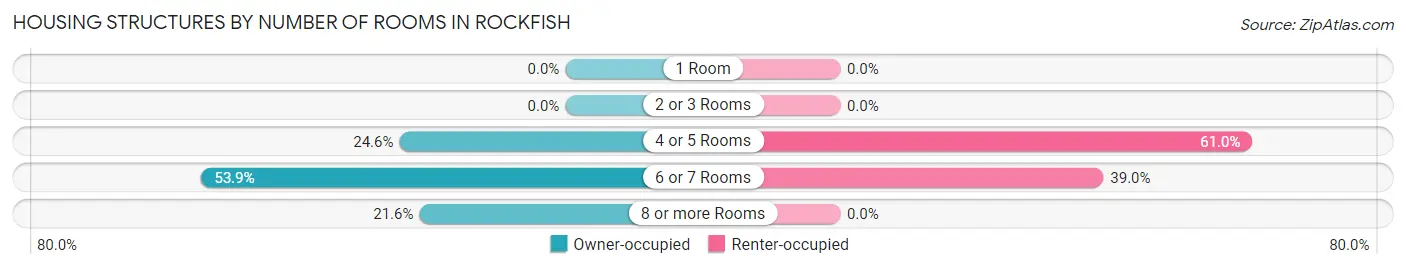
| Number of Rooms | Owner-occupied | Renter-occupied |
| 1 Room | 0 (0.0%) | 0 (0.0%) |
| 2 or 3 Rooms | 0 (0.0%) | 0 (0.0%) |
| 4 or 5 Rooms | 258 (24.5%) | 191 (61.0%) |
| 6 or 7 Rooms | 566 (53.8%) | 122 (39.0%) |
| 8 or more Rooms | 227 (21.6%) | 0 (0.0%) |
| Total | 1,051 (100.0%) | 313 (100.0%) |
Housing Structure by Heating Type in Rockfish
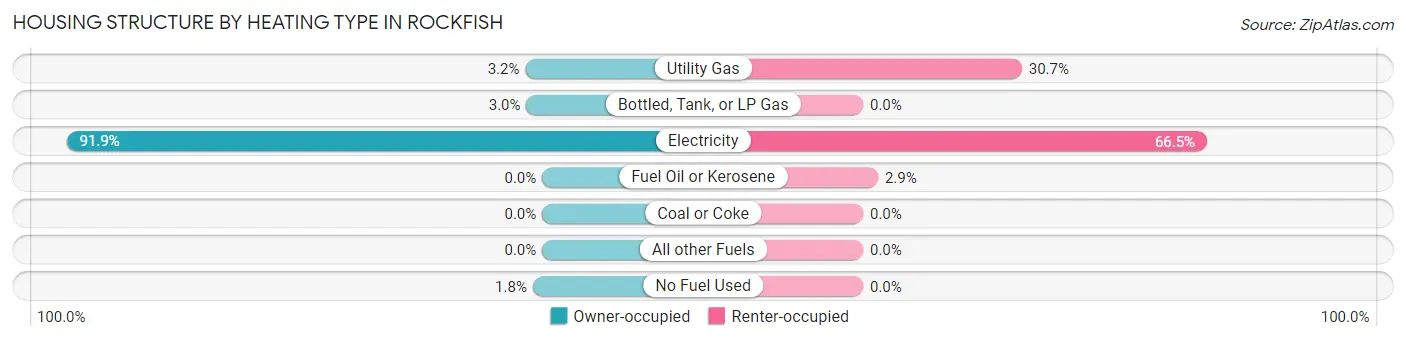
| Heating Type | Owner-occupied | Renter-occupied |
| Utility Gas | 34 (3.2%) | 96 (30.7%) |
| Bottled, Tank, or LP Gas | 32 (3.0%) | 0 (0.0%) |
| Electricity | 966 (91.9%) | 208 (66.4%) |
| Fuel Oil or Kerosene | 0 (0.0%) | 9 (2.9%) |
| Coal or Coke | 0 (0.0%) | 0 (0.0%) |
| All other Fuels | 0 (0.0%) | 0 (0.0%) |
| No Fuel Used | 19 (1.8%) | 0 (0.0%) |
| Total | 1,051 (100.0%) | 313 (100.0%) |
Household Vehicle Usage in Rockfish
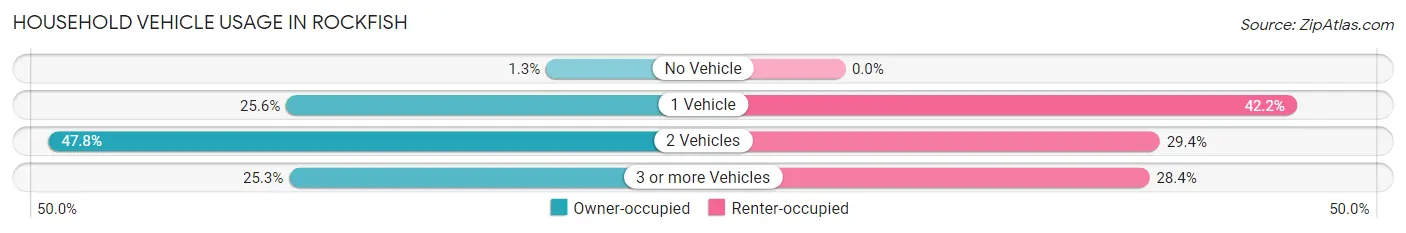
| Vehicles per Household | Owner-occupied | Renter-occupied |
| No Vehicle | 14 (1.3%) | 0 (0.0%) |
| 1 Vehicle | 269 (25.6%) | 132 (42.2%) |
| 2 Vehicles | 502 (47.8%) | 92 (29.4%) |
| 3 or more Vehicles | 266 (25.3%) | 89 (28.4%) |
| Total | 1,051 (100.0%) | 313 (100.0%) |
Real Estate & Mortgages in Rockfish
Real Estate and Mortgage Overview in Rockfish
| Characteristic | Without Mortgage | With Mortgage |
| Housing Units | 226 | 825 |
| Median Property Value | $186,900 | $168,500 |
| Median Household Income | $71,364 | $81 |
| Monthly Housing Costs | $504 | $5 |
| Real Estate Taxes | $1,667 | $34 |
Property Value by Mortgage Status in Rockfish
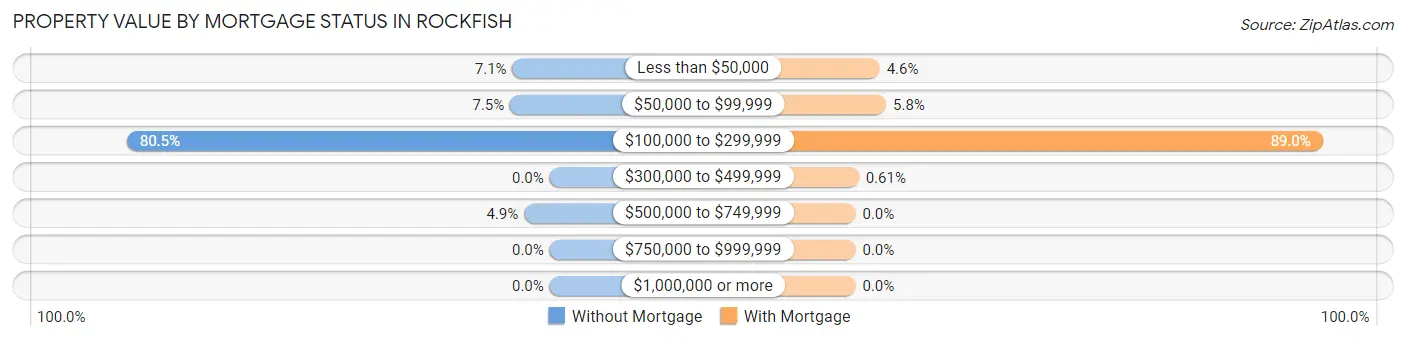
| Property Value | Without Mortgage | With Mortgage |
| Less than $50,000 | 16 (7.1%) | 38 (4.6%) |
| $50,000 to $99,999 | 17 (7.5%) | 48 (5.8%) |
| $100,000 to $299,999 | 182 (80.5%) | 734 (89.0%) |
| $300,000 to $499,999 | 0 (0.0%) | 5 (0.6%) |
| $500,000 to $749,999 | 11 (4.9%) | 0 (0.0%) |
| $750,000 to $999,999 | 0 (0.0%) | 0 (0.0%) |
| $1,000,000 or more | 0 (0.0%) | 0 (0.0%) |
| Total | 226 (100.0%) | 825 (100.0%) |
Household Income by Mortgage Status in Rockfish
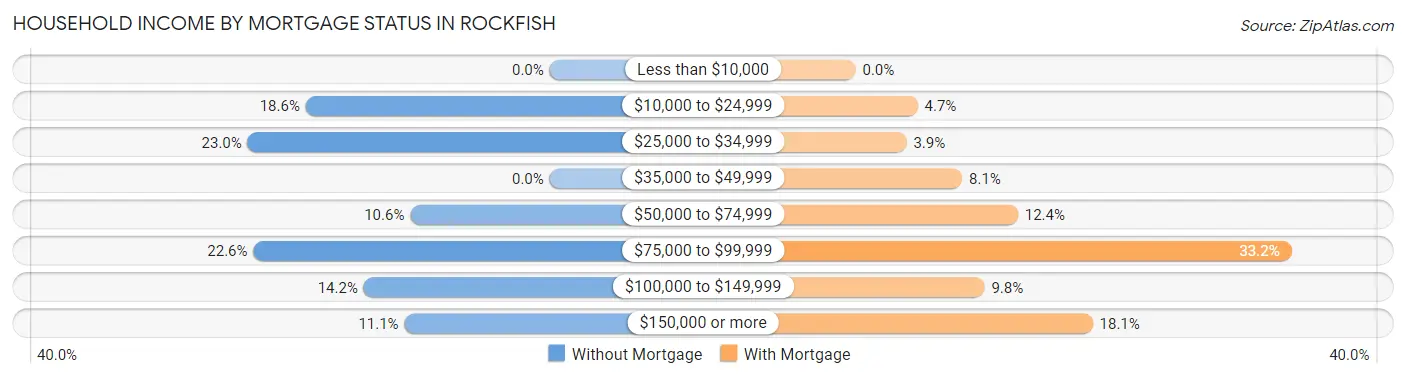
| Household Income | Without Mortgage | With Mortgage |
| Less than $10,000 | 0 (0.0%) | 0 (0.0%) |
| $10,000 to $24,999 | 42 (18.6%) | 39 (4.7%) |
| $25,000 to $34,999 | 52 (23.0%) | 32 (3.9%) |
| $35,000 to $49,999 | 0 (0.0%) | 67 (8.1%) |
| $50,000 to $74,999 | 24 (10.6%) | 102 (12.4%) |
| $75,000 to $99,999 | 51 (22.6%) | 274 (33.2%) |
| $100,000 to $149,999 | 32 (14.2%) | 81 (9.8%) |
| $150,000 or more | 25 (11.1%) | 149 (18.1%) |
| Total | 226 (100.0%) | 825 (100.0%) |
Property Value to Household Income Ratio in Rockfish
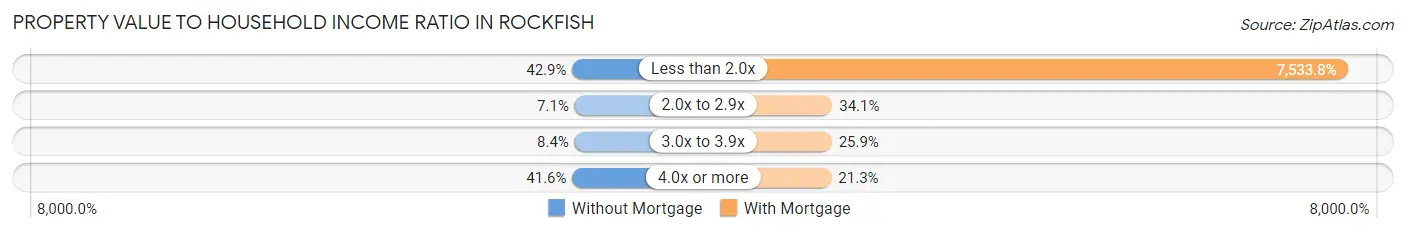
| Value-to-Income Ratio | Without Mortgage | With Mortgage |
| Less than 2.0x | 97 (42.9%) | 62,154 (7,533.8%) |
| 2.0x to 2.9x | 16 (7.1%) | 281 (34.1%) |
| 3.0x to 3.9x | 19 (8.4%) | 214 (25.9%) |
| 4.0x or more | 94 (41.6%) | 176 (21.3%) |
| Total | 226 (100.0%) | 825 (100.0%) |
Real Estate Taxes by Mortgage Status in Rockfish
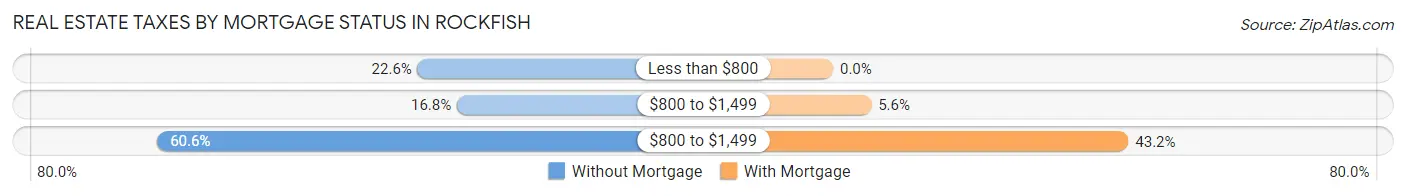
| Property Taxes | Without Mortgage | With Mortgage |
| Less than $800 | 51 (22.6%) | 0 (0.0%) |
| $800 to $1,499 | 38 (16.8%) | 46 (5.6%) |
| $800 to $1,499 | 137 (60.6%) | 356 (43.1%) |
| Total | 226 (100.0%) | 825 (100.0%) |
Health & Disability in Rockfish
Health Insurance Coverage by Age in Rockfish
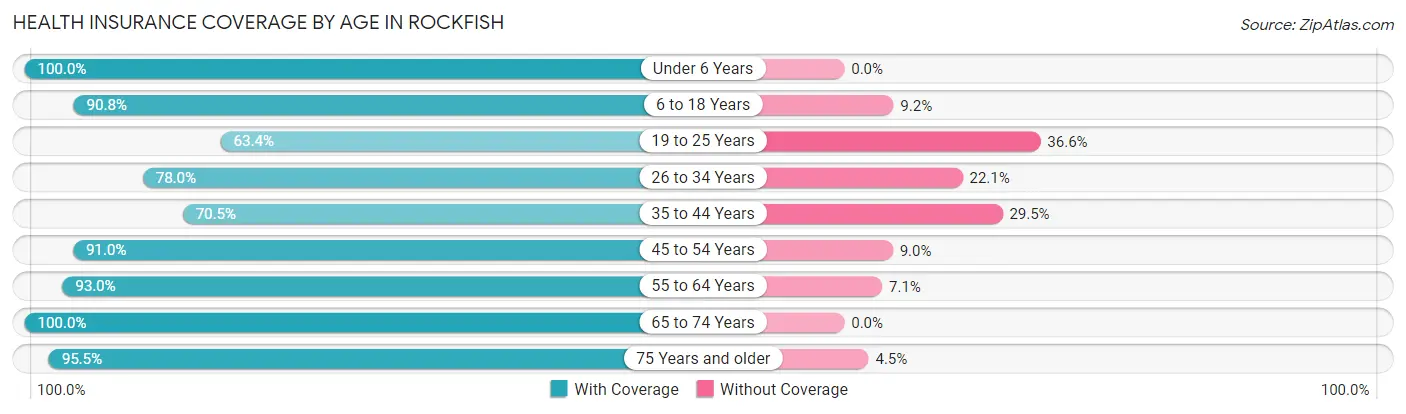
| Age Bracket | With Coverage | Without Coverage |
| Under 6 Years | 294 (100.0%) | 0 (0.0%) |
| 6 to 18 Years | 605 (90.8%) | 61 (9.2%) |
| 19 to 25 Years | 170 (63.4%) | 98 (36.6%) |
| 26 to 34 Years | 343 (77.9%) | 97 (22.1%) |
| 35 to 44 Years | 459 (70.5%) | 192 (29.5%) |
| 45 to 54 Years | 292 (91.0%) | 29 (9.0%) |
| 55 to 64 Years | 356 (92.9%) | 27 (7.0%) |
| 65 to 74 Years | 158 (100.0%) | 0 (0.0%) |
| 75 Years and older | 169 (95.5%) | 8 (4.5%) |
| Total | 2,846 (84.8%) | 512 (15.2%) |
Health Insurance Coverage by Citizenship Status in Rockfish
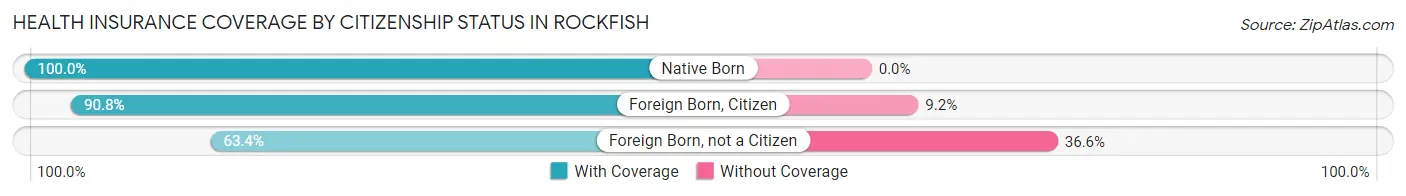
| Citizenship Status | With Coverage | Without Coverage |
| Native Born | 294 (100.0%) | 0 (0.0%) |
| Foreign Born, Citizen | 605 (90.8%) | 61 (9.2%) |
| Foreign Born, not a Citizen | 170 (63.4%) | 98 (36.6%) |
Health Insurance Coverage by Household Income in Rockfish
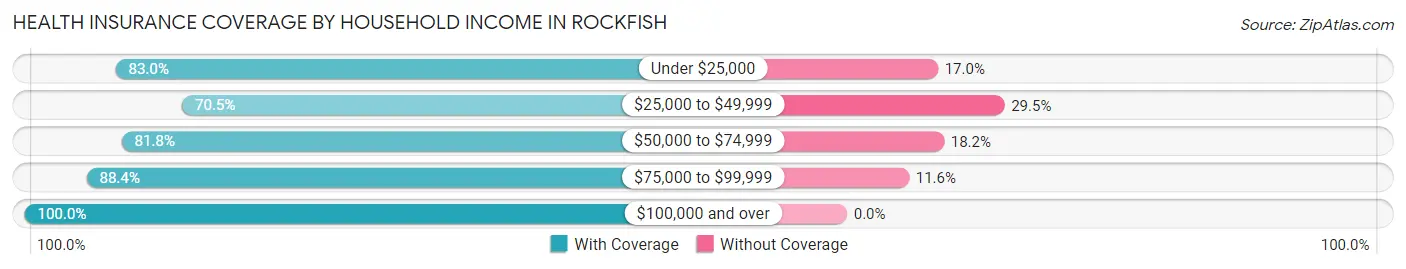
| Household Income | With Coverage | Without Coverage |
| Under $25,000 | 224 (83.0%) | 46 (17.0%) |
| $25,000 to $49,999 | 583 (70.5%) | 244 (29.5%) |
| $50,000 to $74,999 | 815 (81.8%) | 181 (18.2%) |
| $75,000 to $99,999 | 312 (88.4%) | 41 (11.6%) |
| $100,000 and over | 912 (100.0%) | 0 (0.0%) |
Public vs Private Health Insurance Coverage by Age in Rockfish
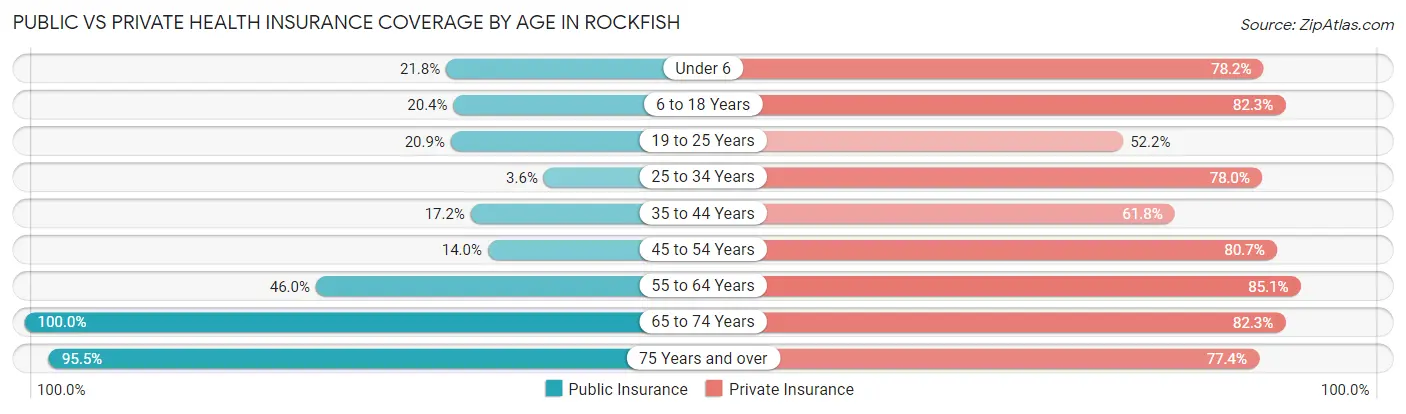
| Age Bracket | Public Insurance | Private Insurance |
| Under 6 | 64 (21.8%) | 230 (78.2%) |
| 6 to 18 Years | 136 (20.4%) | 548 (82.3%) |
| 19 to 25 Years | 56 (20.9%) | 140 (52.2%) |
| 25 to 34 Years | 16 (3.6%) | 343 (77.9%) |
| 35 to 44 Years | 112 (17.2%) | 402 (61.8%) |
| 45 to 54 Years | 45 (14.0%) | 259 (80.7%) |
| 55 to 64 Years | 176 (46.0%) | 326 (85.1%) |
| 65 to 74 Years | 158 (100.0%) | 130 (82.3%) |
| 75 Years and over | 169 (95.5%) | 137 (77.4%) |
| Total | 932 (27.8%) | 2,515 (74.9%) |
Disability Status by Sex by Age in Rockfish
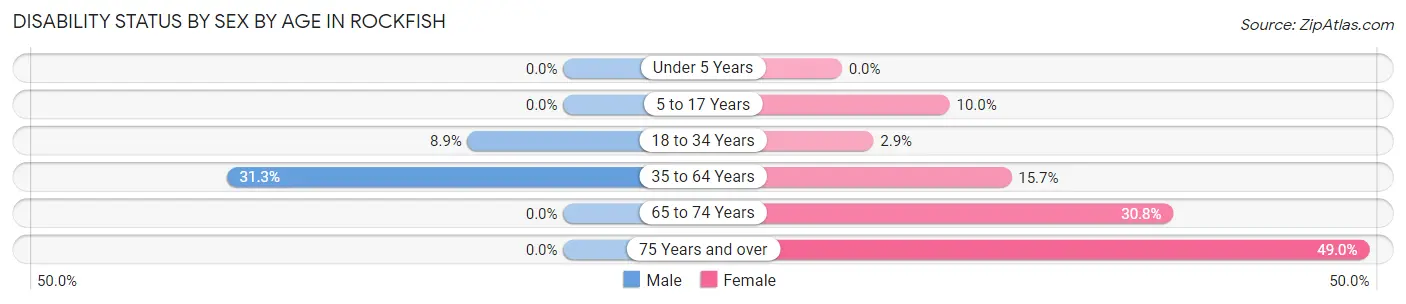
| Age Bracket | Male | Female |
| Under 5 Years | 0 (0.0%) | 0 (0.0%) |
| 5 to 17 Years | 0 (0.0%) | 29 (10.0%) |
| 18 to 34 Years | 34 (8.9%) | 13 (2.9%) |
| 35 to 64 Years | 185 (31.2%) | 120 (15.7%) |
| 65 to 74 Years | 0 (0.0%) | 28 (30.8%) |
| 75 Years and over | 0 (0.0%) | 47 (49.0%) |
Disability Class by Sex by Age in Rockfish
Disability Class: Hearing Difficulty
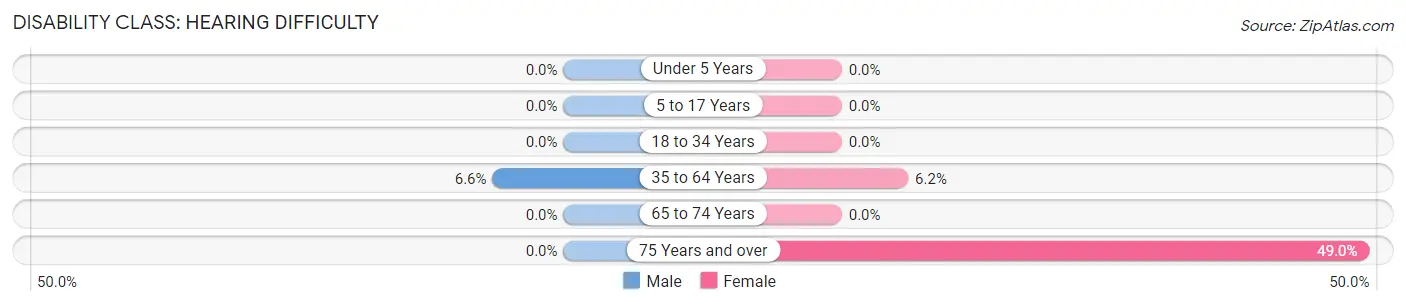
| Age Bracket | Male | Female |
| Under 5 Years | 0 (0.0%) | 0 (0.0%) |
| 5 to 17 Years | 0 (0.0%) | 0 (0.0%) |
| 18 to 34 Years | 0 (0.0%) | 0 (0.0%) |
| 35 to 64 Years | 39 (6.6%) | 47 (6.2%) |
| 65 to 74 Years | 0 (0.0%) | 0 (0.0%) |
| 75 Years and over | 0 (0.0%) | 47 (49.0%) |
Disability Class: Vision Difficulty
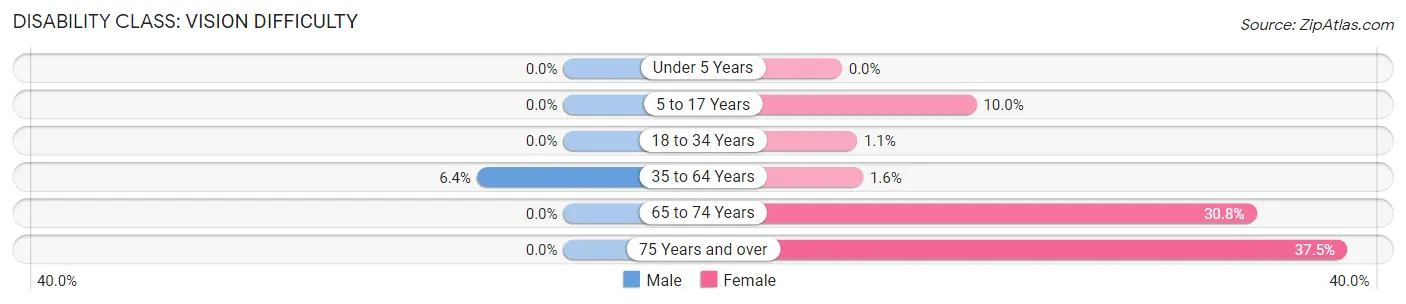
| Age Bracket | Male | Female |
| Under 5 Years | 0 (0.0%) | 0 (0.0%) |
| 5 to 17 Years | 0 (0.0%) | 29 (10.0%) |
| 18 to 34 Years | 0 (0.0%) | 5 (1.1%) |
| 35 to 64 Years | 38 (6.4%) | 12 (1.6%) |
| 65 to 74 Years | 0 (0.0%) | 28 (30.8%) |
| 75 Years and over | 0 (0.0%) | 36 (37.5%) |
Disability Class: Cognitive Difficulty
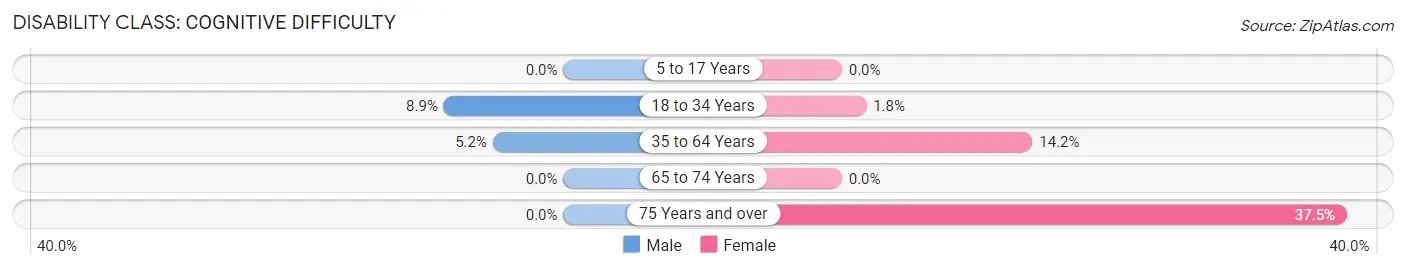
| Age Bracket | Male | Female |
| 5 to 17 Years | 0 (0.0%) | 0 (0.0%) |
| 18 to 34 Years | 34 (8.9%) | 8 (1.8%) |
| 35 to 64 Years | 31 (5.2%) | 108 (14.1%) |
| 65 to 74 Years | 0 (0.0%) | 0 (0.0%) |
| 75 Years and over | 0 (0.0%) | 36 (37.5%) |
Disability Class: Ambulatory Difficulty
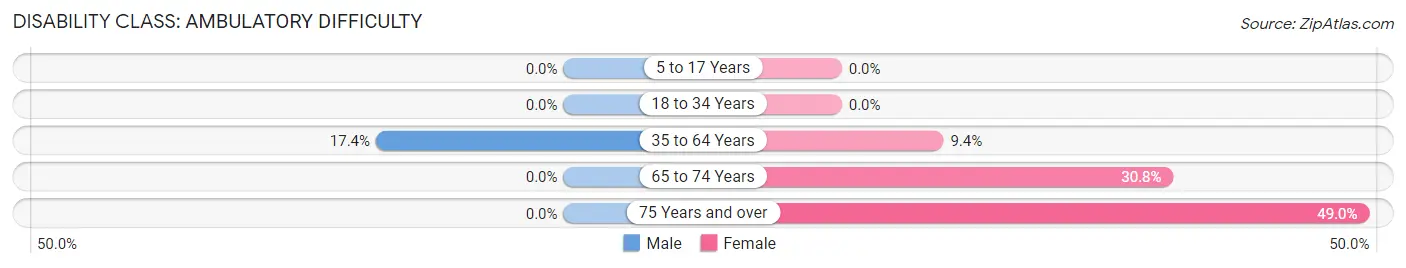
| Age Bracket | Male | Female |
| 5 to 17 Years | 0 (0.0%) | 0 (0.0%) |
| 18 to 34 Years | 0 (0.0%) | 0 (0.0%) |
| 35 to 64 Years | 103 (17.4%) | 72 (9.4%) |
| 65 to 74 Years | 0 (0.0%) | 28 (30.8%) |
| 75 Years and over | 0 (0.0%) | 47 (49.0%) |
Disability Class: Self-Care Difficulty
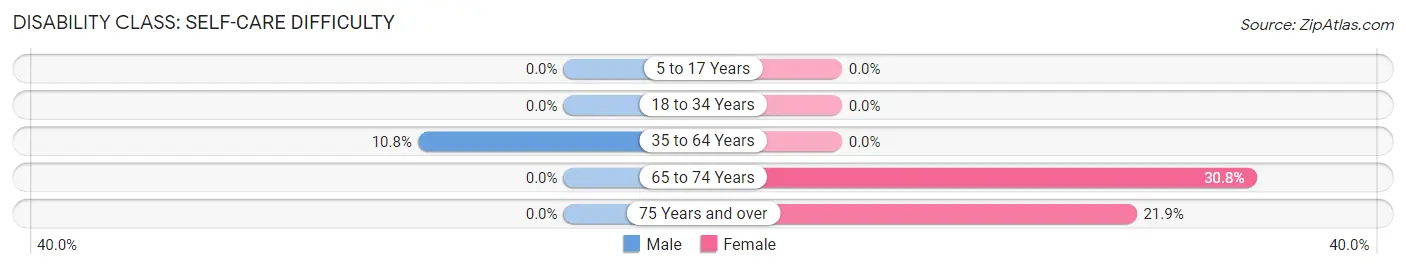
| Age Bracket | Male | Female |
| 5 to 17 Years | 0 (0.0%) | 0 (0.0%) |
| 18 to 34 Years | 0 (0.0%) | 0 (0.0%) |
| 35 to 64 Years | 64 (10.8%) | 0 (0.0%) |
| 65 to 74 Years | 0 (0.0%) | 28 (30.8%) |
| 75 Years and over | 0 (0.0%) | 21 (21.9%) |
Technology Access in Rockfish
Computing Device Access in Rockfish
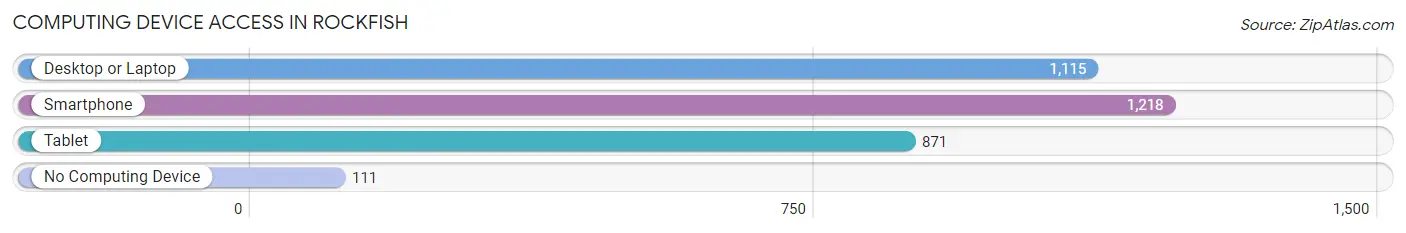
| Device Type | # Households | % Households |
| Desktop or Laptop | 1,115 | 81.7% |
| Smartphone | 1,218 | 89.3% |
| Tablet | 871 | 63.9% |
| No Computing Device | 111 | 8.1% |
| Total | 1,364 | 100.0% |
Internet Access in Rockfish
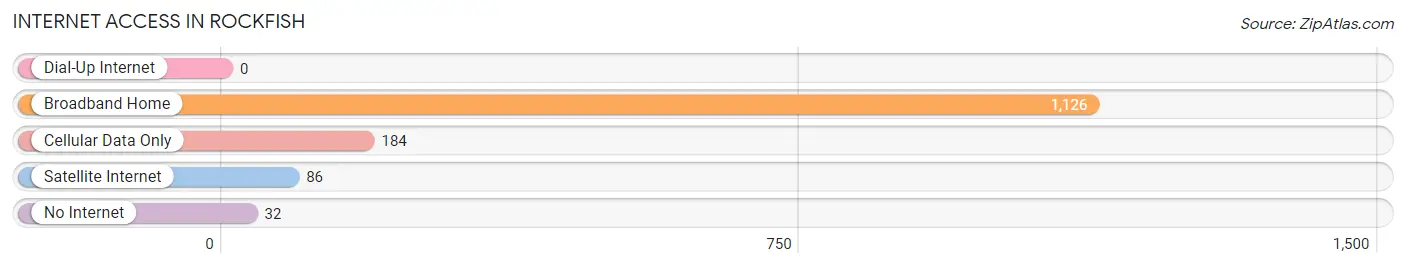
| Internet Type | # Households | % Households |
| Dial-Up Internet | 0 | 0.0% |
| Broadband Home | 1,126 | 82.6% |
| Cellular Data Only | 184 | 13.5% |
| Satellite Internet | 86 | 6.3% |
| No Internet | 32 | 2.4% |
| Total | 1,364 | 100.0% |
Rockfish Summary
Rockfish, North Carolina is a small town located in the foothills of the Blue Ridge Mountains in the western part of the state. It is situated in the Yadkin Valley region of North Carolina, and is part of the Hickory-Lenoir-Morganton Metropolitan Statistical Area. The town has a population of approximately 1,000 people, and is known for its rural charm and small-town atmosphere.
History
Rockfish was first settled in the late 1700s by a group of German immigrants who were looking for a place to call home. The town was originally known as “Rockfish Station”, and was named after the nearby Rockfish River. The town was officially incorporated in 1891, and the first post office was established in 1892.
In the early 1900s, Rockfish was a thriving agricultural community, with many of the town’s residents working in the local tobacco and cotton industries. The town also had a thriving lumber industry, and the local sawmill was a major employer in the area.
In the 1950s, Rockfish began to experience a decline in its economy as the tobacco and cotton industries began to decline. The sawmill also closed, leaving many of the town’s residents without jobs. In the late 1970s, the town began to experience a resurgence in its economy as the local furniture industry began to grow. Today, Rockfish is home to several furniture manufacturers, as well as a number of small businesses.
Geography
Rockfish is located in the foothills of the Blue Ridge Mountains in the western part of North Carolina. The town is situated in the Yadkin Valley region of the state, and is part of the Hickory-Lenoir-Morganton Metropolitan Statistical Area. The town is located approximately 30 miles northwest of Charlotte, and is bordered by the towns of Hickory, Lenoir, and Morganton.
The town is situated at an elevation of 1,000 feet, and is surrounded by rolling hills and lush forests. The town is located near the Catawba River, and is home to several small lakes and streams. The town is also located near the Pisgah National Forest, which offers a variety of outdoor activities such as hiking, camping, and fishing.
Economy
Rockfish’s economy is largely based on the furniture industry, which is the town’s largest employer. The town is home to several furniture manufacturers, as well as a number of small businesses. The town is also home to a number of agricultural operations, including tobacco, cotton, and livestock farms.
The town is also home to a number of retail stores, restaurants, and other businesses. The town is also home to a number of tourist attractions, including the Rockfish Valley Historical Museum and the Rockfish Valley Trail.
Demographics
As of the 2010 census, Rockfish had a population of 1,000 people. The town is predominantly white, with approximately 95% of the population being white. The town also has a small Hispanic population, with approximately 4% of the population being Hispanic. The town also has a small African American population, with approximately 1% of the population being African American.
The median household income in Rockfish is approximately $35,000, and the median home value is approximately $150,000. The town has a low unemployment rate, with approximately 4% of the population being unemployed. The town also has a low poverty rate, with approximately 8% of the population living below the poverty line.
Conclusion
Rockfish, North Carolina is a small town located in the foothills of the Blue Ridge Mountains in the western part of the state. The town has a population of approximately 1,000 people, and is known for its rural charm and small-town atmosphere. The town’s economy is largely based on the furniture industry, which is the town’s largest employer. The town is predominantly white, with approximately 95% of the population being white. The median household income in Rockfish is approximately $35,000, and the median home value is approximately $150,000. The town has a low unemployment rate, with approximately 4% of the population being unemployed. The town also has a low poverty rate, with approximately 8% of the population living below the poverty line.
Common Questions
What is Per Capita Income in Rockfish?
Per Capita income in Rockfish is $29,245.
What is the Median Family Income in Rockfish?
Median Family Income in Rockfish is $66,615.
What is the Median Household income in Rockfish?
Median Household Income in Rockfish is $61,172.
What is Income or Wage Gap in Rockfish?
Income or Wage Gap in Rockfish is 19.4%.
Women in Rockfish earn 80.6 cents for every dollar earned by a man.
What is Inequality or Gini Index in Rockfish?
Inequality or Gini Index in Rockfish is 0.35.
What is the Total Population of Rockfish?
Total Population of Rockfish is 3,569.
What is the Total Male Population of Rockfish?
Total Male Population of Rockfish is 1,744.
What is the Total Female Population of Rockfish?
Total Female Population of Rockfish is 1,825.
What is the Ratio of Males per 100 Females in Rockfish?
There are 95.56 Males per 100 Females in Rockfish.
What is the Ratio of Females per 100 Males in Rockfish?
There are 104.64 Females per 100 Males in Rockfish.
What is the Median Population Age in Rockfish?
Median Population Age in Rockfish is 34.6 Years.
What is the Average Family Size in Rockfish
Average Family Size in Rockfish is 3.1 People.
What is the Average Household Size in Rockfish
Average Household Size in Rockfish is 2.6 People.
How Large is the Labor Force in Rockfish?
There are 1,813 People in the Labor Forcein in Rockfish.
What is the Percentage of People in the Labor Force in Rockfish?
63.5% of People are in the Labor Force in Rockfish.
What is the Unemployment Rate in Rockfish?
Unemployment Rate in Rockfish is 4.6%.