Hickory, NC Map & Demographics
Hickory Map
Hickory Overview
$35,340
PER CAPITA INCOME
$75,298
AVG FAMILY INCOME
$58,251
AVG HOUSEHOLD INCOME
27.6%
WAGE / INCOME GAP [ % ]
72.4¢/ $1
WAGE / INCOME GAP [ $ ]
$8,934
FAMILY INCOME DEFICIT
0.49
INEQUALITY / GINI INDEX
43,352
TOTAL POPULATION
21,058
MALE POPULATION
22,294
FEMALE POPULATION
94.46
MALES / 100 FEMALES
105.87
FEMALES / 100 MALES
37.9
MEDIAN AGE
3.0
AVG FAMILY SIZE
2.4
AVG HOUSEHOLD SIZE
21,319
LABOR FORCE [ PEOPLE ]
59.8%
PERCENT IN LABOR FORCE
6.2%
UNEMPLOYMENT RATE
Hickory Area Codes
Income in Hickory
Income Overview in Hickory
Per Capita Income in Hickory is $35,340, while median incomes of families and households are $75,298 and $58,251 respectively.
| Characteristic | Number | Measure |
| Per Capita Income | 43,352 | $35,340 |
| Median Family Income | 10,579 | $75,298 |
| Mean Family Income | 10,579 | $105,721 |
| Median Household Income | 17,663 | $58,251 |
| Mean Household Income | 17,663 | $85,328 |
| Income Deficit | 10,579 | $8,934 |
| Wage / Income Gap (%) | 43,352 | 27.64% |
| Wage / Income Gap ($) | 43,352 | 72.36¢ per $1 |
| Gini / Inequality Index | 43,352 | 0.49 |
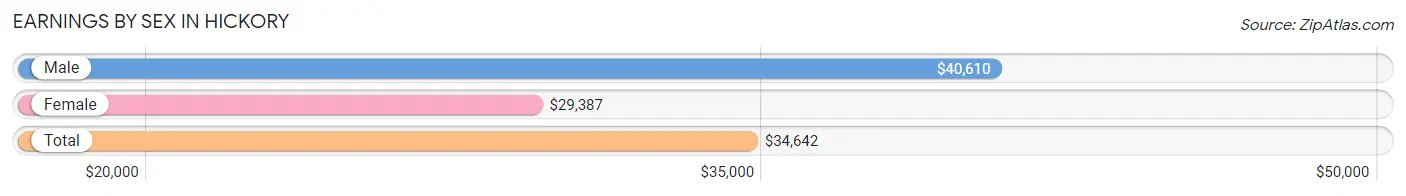
Earnings by Sex in Hickory
Average Earnings in Hickory are $34,642, $40,610 for men and $29,387 for women, a difference of 27.6%.
| Sex | Number | Average Earnings |
| Male | 11,547 (52.3%) | $40,610 |
| Female | 10,547 (47.7%) | $29,387 |
| Total | 22,094 (100.0%) | $34,642 |
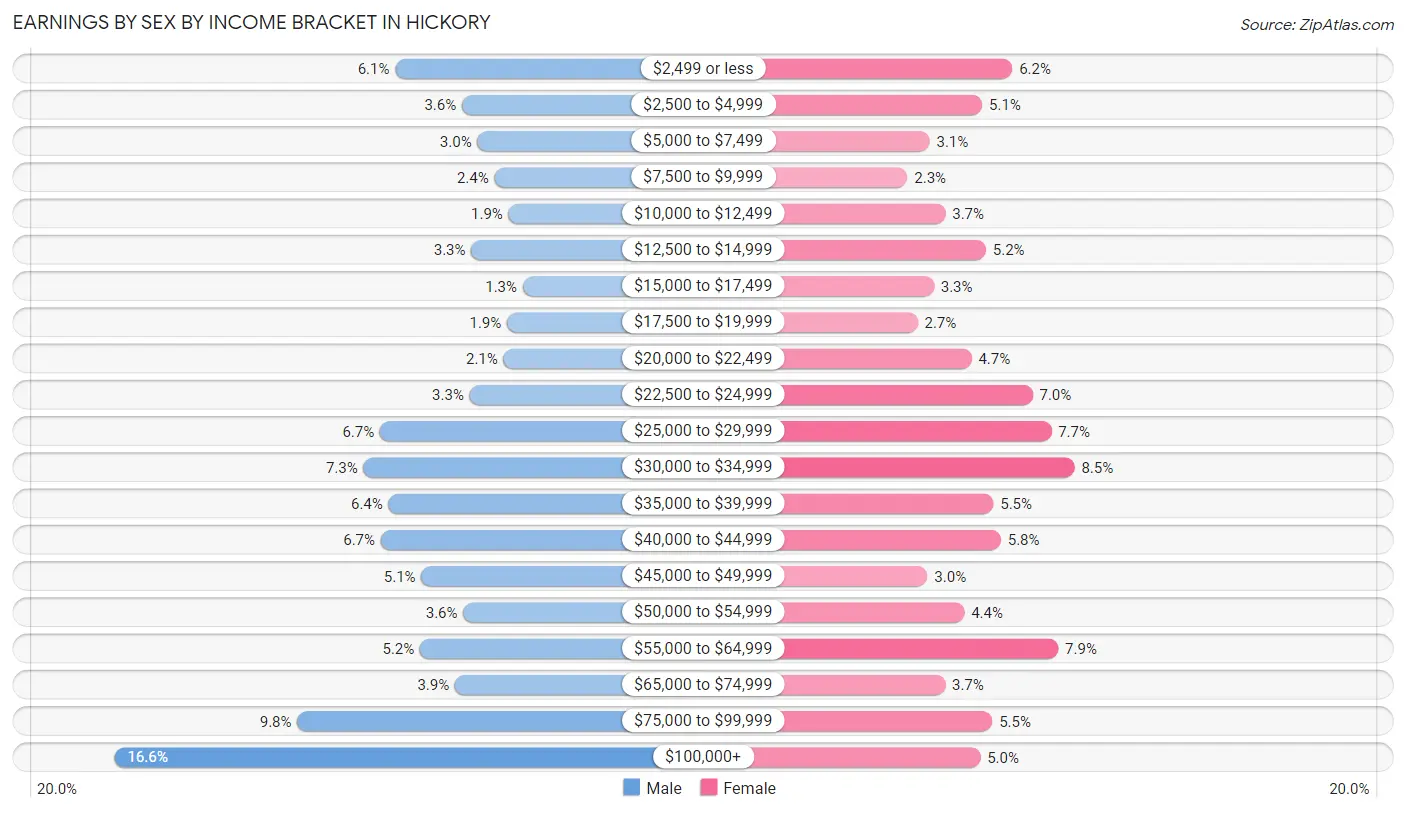
Earnings by Sex by Income Bracket in Hickory
The most common earnings brackets in Hickory are $100,000+ for men (1,920 | 16.6%) and $30,000 to $34,999 for women (900 | 8.5%).
| Income | Male | Female |
| $2,499 or less | 705 (6.1%) | 654 (6.2%) |
| $2,500 to $4,999 | 417 (3.6%) | 535 (5.1%) |
| $5,000 to $7,499 | 350 (3.0%) | 327 (3.1%) |
| $7,500 to $9,999 | 276 (2.4%) | 239 (2.3%) |
| $10,000 to $12,499 | 215 (1.9%) | 389 (3.7%) |
| $12,500 to $14,999 | 376 (3.3%) | 549 (5.2%) |
| $15,000 to $17,499 | 153 (1.3%) | 344 (3.3%) |
| $17,500 to $19,999 | 222 (1.9%) | 280 (2.6%) |
| $20,000 to $22,499 | 237 (2.1%) | 493 (4.7%) |
| $22,500 to $24,999 | 383 (3.3%) | 734 (7.0%) |
| $25,000 to $29,999 | 771 (6.7%) | 808 (7.7%) |
| $30,000 to $34,999 | 843 (7.3%) | 900 (8.5%) |
| $35,000 to $39,999 | 734 (6.4%) | 579 (5.5%) |
| $40,000 to $44,999 | 768 (6.7%) | 609 (5.8%) |
| $45,000 to $49,999 | 592 (5.1%) | 318 (3.0%) |
| $50,000 to $54,999 | 411 (3.6%) | 464 (4.4%) |
| $55,000 to $64,999 | 598 (5.2%) | 835 (7.9%) |
| $65,000 to $74,999 | 447 (3.9%) | 388 (3.7%) |
| $75,000 to $99,999 | 1,129 (9.8%) | 575 (5.4%) |
| $100,000+ | 1,920 (16.6%) | 527 (5.0%) |
| Total | 11,547 (100.0%) | 10,547 (100.0%) |
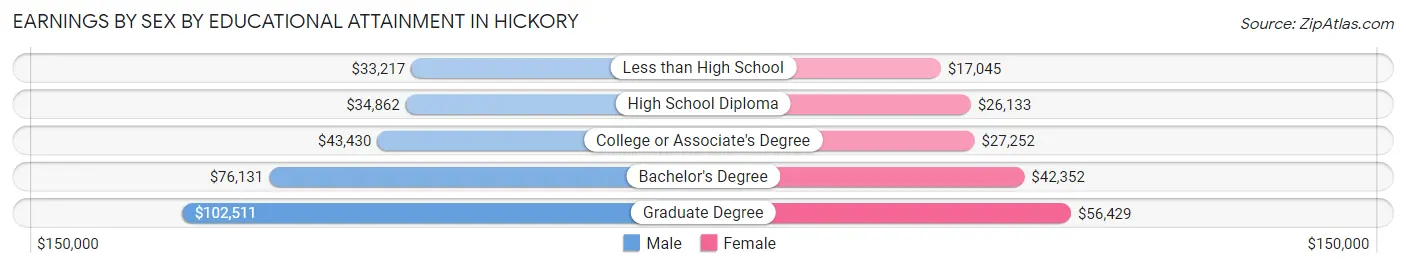
Earnings by Sex by Educational Attainment in Hickory
Average earnings in Hickory are $46,624 for men and $33,498 for women, a difference of 28.1%. Men with an educational attainment of graduate degree enjoy the highest average annual earnings of $102,511, while those with less than high school education earn the least with $33,217. Women with an educational attainment of graduate degree earn the most with the average annual earnings of $56,429, while those with less than high school education have the smallest earnings of $17,045.
| Educational Attainment | Male Income | Female Income |
| Less than High School | $33,217 | $17,045 |
| High School Diploma | $34,862 | $26,133 |
| College or Associate's Degree | $43,430 | $27,252 |
| Bachelor's Degree | $76,131 | $42,352 |
| Graduate Degree | $102,511 | $56,429 |
| Total | $46,624 | $33,498 |
Family Income in Hickory
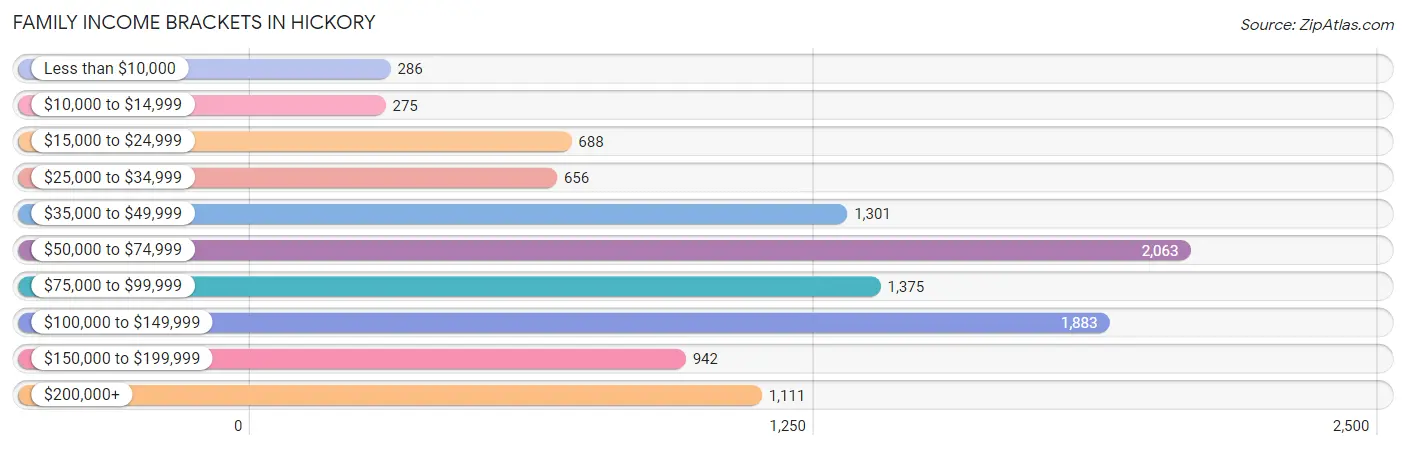
Family Income Brackets in Hickory
According to the Hickory family income data, there are 2,063 families falling into the $50,000 to $74,999 income range, which is the most common income bracket and makes up 19.5% of all families. Conversely, the $10,000 to $14,999 income bracket is the least frequent group with only 275 families (2.6%) belonging to this category.
| Income Bracket | # Families | % Families |
| Less than $10,000 | 286 | 2.7% |
| $10,000 to $14,999 | 275 | 2.6% |
| $15,000 to $24,999 | 688 | 6.5% |
| $25,000 to $34,999 | 656 | 6.2% |
| $35,000 to $49,999 | 1,301 | 12.3% |
| $50,000 to $74,999 | 2,063 | 19.5% |
| $75,000 to $99,999 | 1,375 | 13.0% |
| $100,000 to $149,999 | 1,883 | 17.8% |
| $150,000 to $199,999 | 942 | 8.9% |
| $200,000+ | 1,111 | 10.5% |
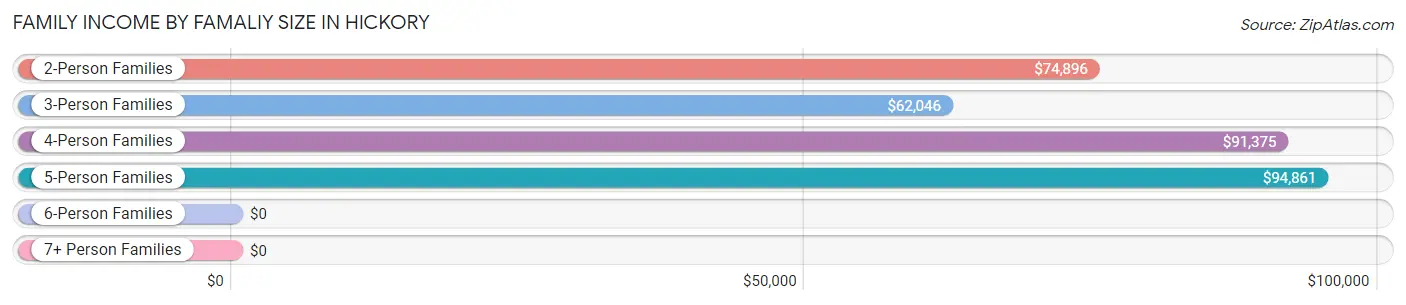
Family Income by Famaliy Size in Hickory
5-person families (723 | 6.8%) account for the highest median family income in Hickory with $94,861 per family, while 2-person families (4,904 | 46.4%) have the highest median income of $37,448 per family member.
| Income Bracket | # Families | Median Income |
| 2-Person Families | 4,904 (46.4%) | $74,896 |
| 3-Person Families | 2,587 (24.4%) | $62,046 |
| 4-Person Families | 2,113 (20.0%) | $91,375 |
| 5-Person Families | 723 (6.8%) | $94,861 |
| 6-Person Families | 175 (1.7%) | $0 |
| 7+ Person Families | 77 (0.7%) | $0 |
| Total | 10,579 (100.0%) | $75,298 |
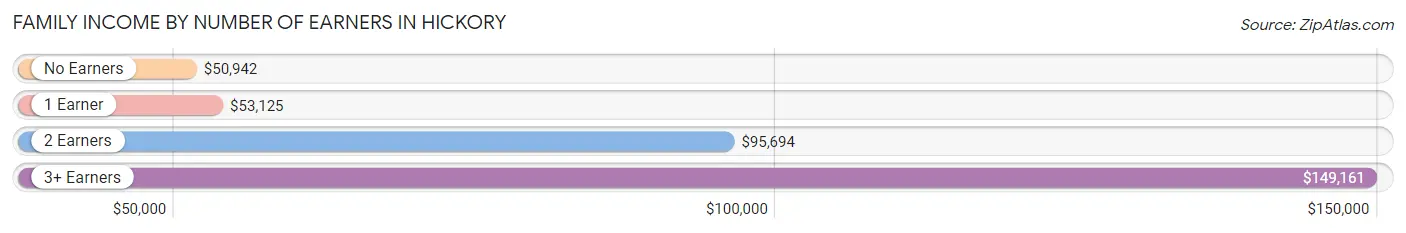
Family Income by Number of Earners in Hickory
The median family income in Hickory is $75,298, with families comprising 3+ earners (1,021) having the highest median family income of $149,161, while families with no earners (1,716) have the lowest median family income of $50,942, accounting for 9.7% and 16.2% of families, respectively.
| Number of Earners | # Families | Median Income |
| No Earners | 1,716 (16.2%) | $50,942 |
| 1 Earner | 3,539 (33.5%) | $53,125 |
| 2 Earners | 4,303 (40.7%) | $95,694 |
| 3+ Earners | 1,021 (9.7%) | $149,161 |
| Total | 10,579 (100.0%) | $75,298 |
Household Income in Hickory
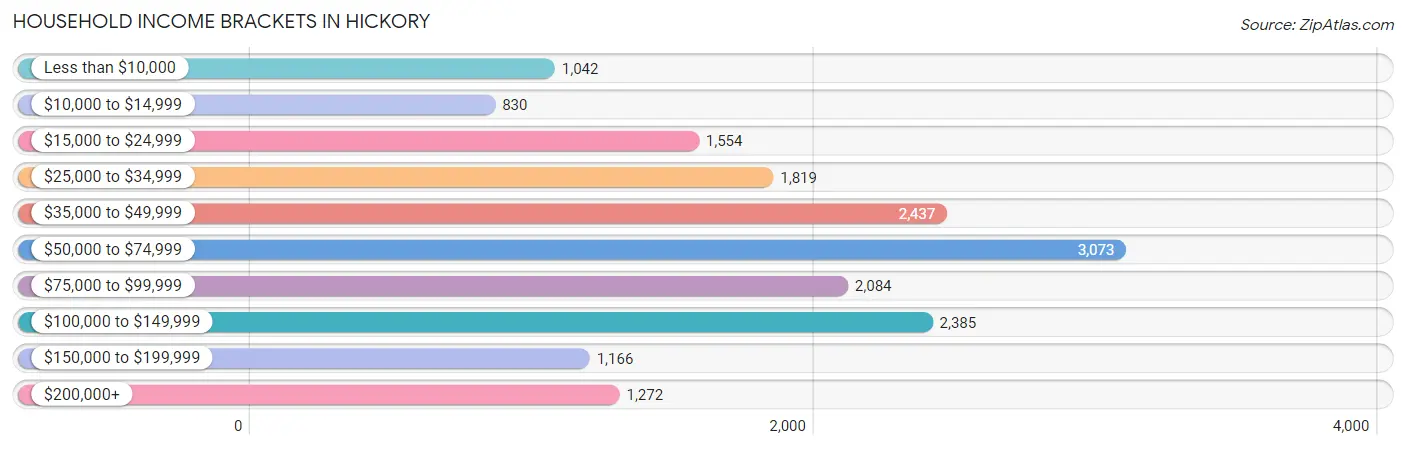
Household Income Brackets in Hickory
With 3,073 households falling in the category, the $50,000 to $74,999 income range is the most frequent in Hickory, accounting for 17.4% of all households. In contrast, only 830 households (4.7%) fall into the $10,000 to $14,999 income bracket, making it the least populous group.
| Income Bracket | # Households | % Households |
| Less than $10,000 | 1,042 | 5.9% |
| $10,000 to $14,999 | 830 | 4.7% |
| $15,000 to $24,999 | 1,554 | 8.8% |
| $25,000 to $34,999 | 1,819 | 10.3% |
| $35,000 to $49,999 | 2,437 | 13.8% |
| $50,000 to $74,999 | 3,073 | 17.4% |
| $75,000 to $99,999 | 2,084 | 11.8% |
| $100,000 to $149,999 | 2,385 | 13.5% |
| $150,000 to $199,999 | 1,166 | 6.6% |
| $200,000+ | 1,272 | 7.2% |
Household Income by Householder Age in Hickory
The median household income in Hickory is $58,251, with the highest median household income of $75,545 found in the 45 to 64 years age bracket for the primary householder. A total of 6,206 households (35.1%) fall into this category. Meanwhile, the 15 to 24 years age bracket for the primary householder has the lowest median household income of $43,605, with 1,074 households (6.1%) in this group.
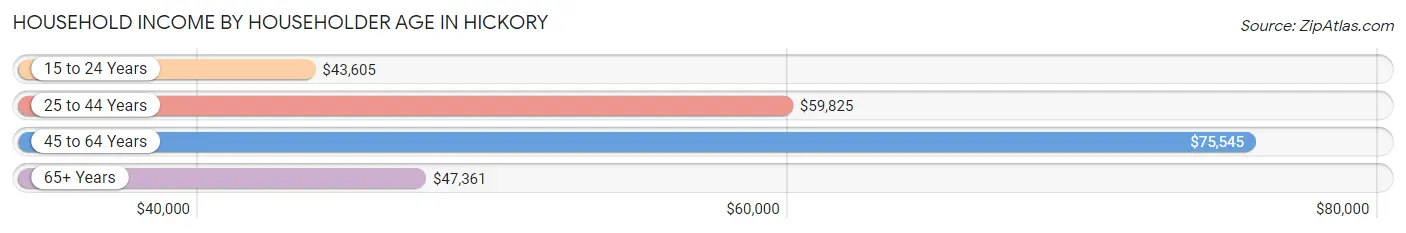
| Income Bracket | # Households | Median Income |
| 15 to 24 Years | 1,074 (6.1%) | $43,605 |
| 25 to 44 Years | 5,677 (32.1%) | $59,825 |
| 45 to 64 Years | 6,206 (35.1%) | $75,545 |
| 65+ Years | 4,706 (26.6%) | $47,361 |
| Total | 17,663 (100.0%) | $58,251 |
Poverty in Hickory
Income Below Poverty by Sex and Age in Hickory
With 15.3% poverty level for males and 17.8% for females among the residents of Hickory, 15 year old males and 15 year old females are the most vulnerable to poverty, with 140 males (37.2%) and 125 females (48.8%) in their respective age groups living below the poverty level.
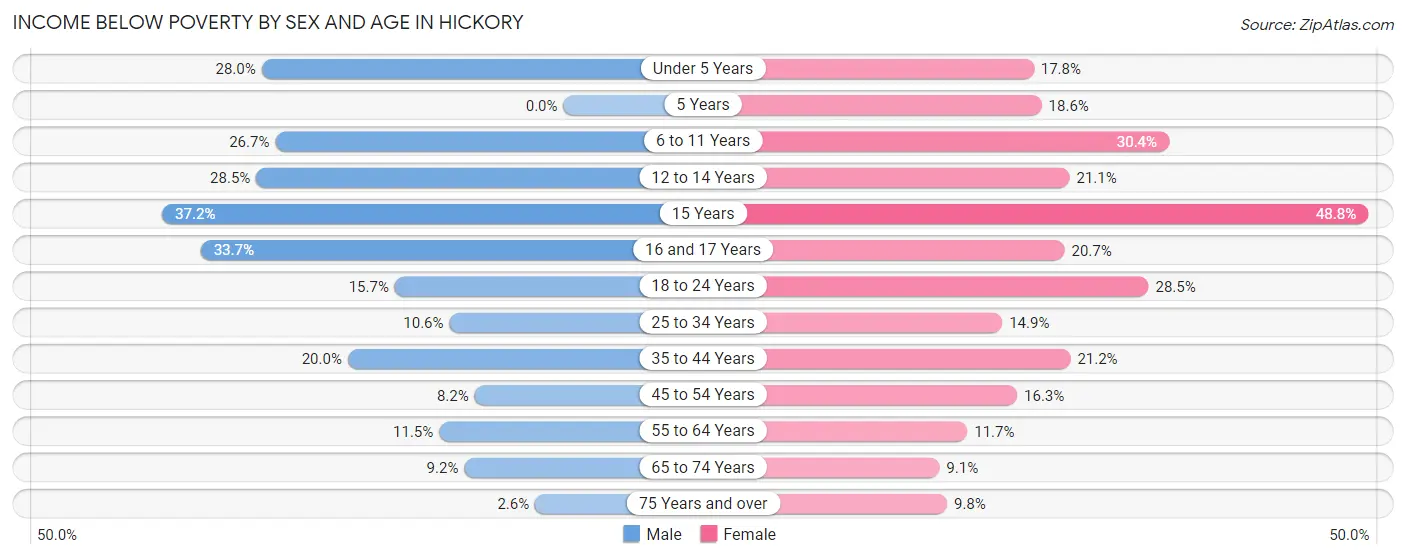
| Age Bracket | Male | Female |
| Under 5 Years | 237 (28.0%) | 198 (17.8%) |
| 5 Years | 0 (0.0%) | 51 (18.5%) |
| 6 to 11 Years | 392 (26.7%) | 413 (30.3%) |
| 12 to 14 Years | 264 (28.5%) | 156 (21.1%) |
| 15 Years | 140 (37.2%) | 125 (48.8%) |
| 16 and 17 Years | 245 (33.7%) | 124 (20.7%) |
| 18 to 24 Years | 375 (15.7%) | 591 (28.5%) |
| 25 to 34 Years | 276 (10.6%) | 478 (14.9%) |
| 35 to 44 Years | 472 (20.0%) | 553 (21.2%) |
| 45 to 54 Years | 232 (8.2%) | 463 (16.3%) |
| 55 to 64 Years | 283 (11.5%) | 295 (11.7%) |
| 65 to 74 Years | 185 (9.2%) | 185 (9.1%) |
| 75 Years and over | 31 (2.6%) | 167 (9.8%) |
| Total | 3,132 (15.3%) | 3,799 (17.8%) |
Income Above Poverty by Sex and Age in Hickory
According to the poverty statistics in Hickory, males aged 5 years and females aged 65 to 74 years are the age groups that are most secure financially, with 100.0% of males and 90.9% of females in these age groups living above the poverty line.
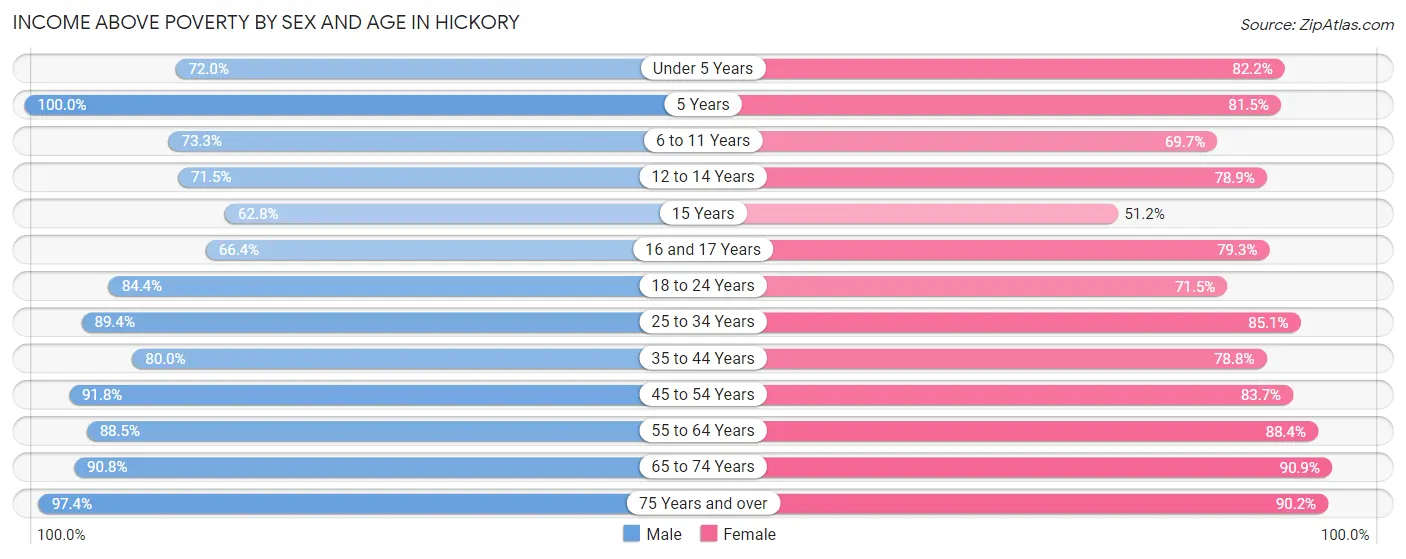
| Age Bracket | Male | Female |
| Under 5 Years | 609 (72.0%) | 913 (82.2%) |
| 5 Years | 254 (100.0%) | 224 (81.5%) |
| 6 to 11 Years | 1,074 (73.3%) | 948 (69.7%) |
| 12 to 14 Years | 662 (71.5%) | 582 (78.9%) |
| 15 Years | 236 (62.8%) | 131 (51.2%) |
| 16 and 17 Years | 483 (66.3%) | 476 (79.3%) |
| 18 to 24 Years | 2,021 (84.4%) | 1,485 (71.5%) |
| 25 to 34 Years | 2,332 (89.4%) | 2,733 (85.1%) |
| 35 to 44 Years | 1,887 (80.0%) | 2,053 (78.8%) |
| 45 to 54 Years | 2,585 (91.8%) | 2,382 (83.7%) |
| 55 to 64 Years | 2,171 (88.5%) | 2,237 (88.3%) |
| 65 to 74 Years | 1,825 (90.8%) | 1,856 (90.9%) |
| 75 Years and over | 1,146 (97.4%) | 1,543 (90.2%) |
| Total | 17,285 (84.7%) | 17,563 (82.2%) |
Income Below Poverty Among Married-Couple Families in Hickory
The poverty statistics for married-couple families in Hickory show that 5.3% or 383 of the total 7,251 families live below the poverty line. Families with 3 or 4 children have the highest poverty rate of 15.7%, comprising of 69 families. On the other hand, families with 5 or more children have the lowest poverty rate of 0.0%, which includes 0 families.
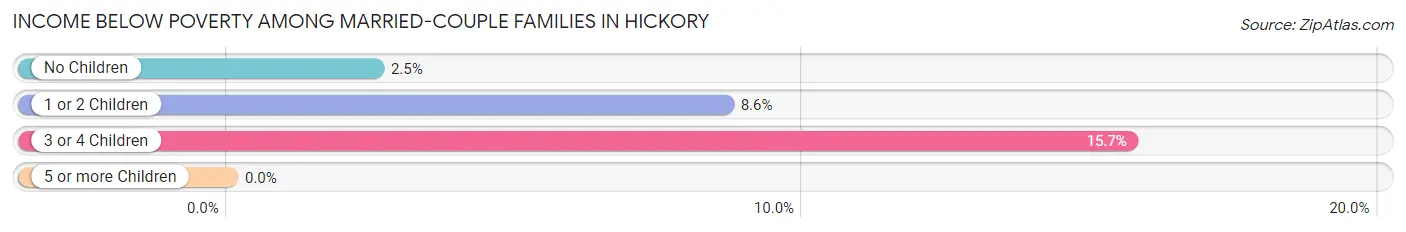
| Children | Above Poverty | Below Poverty |
| No Children | 4,338 (97.5%) | 113 (2.5%) |
| 1 or 2 Children | 2,128 (91.4%) | 201 (8.6%) |
| 3 or 4 Children | 371 (84.3%) | 69 (15.7%) |
| 5 or more Children | 31 (100.0%) | 0 (0.0%) |
| Total | 6,868 (94.7%) | 383 (5.3%) |
Income Below Poverty Among Single-Parent Households in Hickory
According to the poverty data in Hickory, 15.3% or 153 single-father households and 30.6% or 712 single-mother households are living below the poverty line. Among single-father households, those with 3 or 4 children have the highest poverty rate, with 19 households (45.2%) experiencing poverty. Likewise, among single-mother households, those with 3 or 4 children have the highest poverty rate, with 118 households (67.0%) falling below the poverty line.
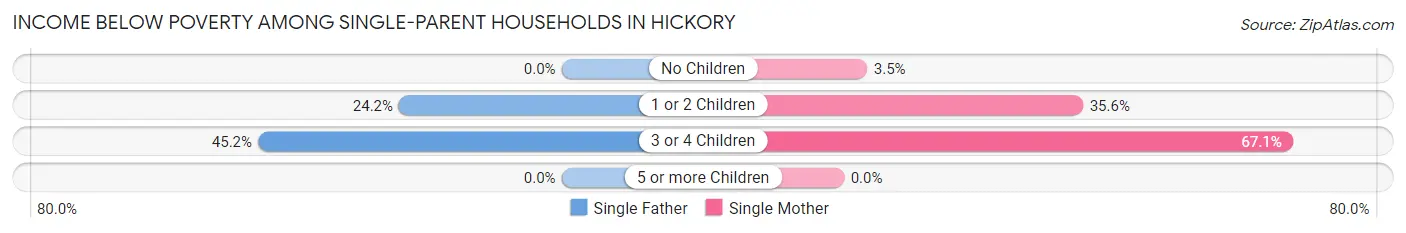
| Children | Single Father | Single Mother |
| No Children | 0 (0.0%) | 18 (3.5%) |
| 1 or 2 Children | 134 (24.2%) | 576 (35.6%) |
| 3 or 4 Children | 19 (45.2%) | 118 (67.0%) |
| 5 or more Children | 0 (0.0%) | 0 (0.0%) |
| Total | 153 (15.3%) | 712 (30.6%) |
Income Below Poverty Among Married-Couple vs Single-Parent Households in Hickory
The poverty data for Hickory shows that 383 of the married-couple family households (5.3%) and 865 of the single-parent households (26.0%) are living below the poverty level. Within the married-couple family households, those with 3 or 4 children have the highest poverty rate, with 69 households (15.7%) falling below the poverty line. Among the single-parent households, those with 3 or 4 children have the highest poverty rate, with 137 household (62.8%) living below poverty.
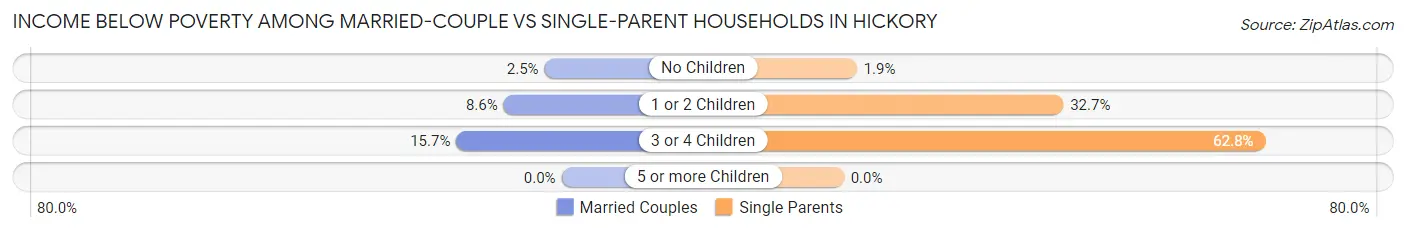
| Children | Married-Couple Families | Single-Parent Households |
| No Children | 113 (2.5%) | 18 (1.9%) |
| 1 or 2 Children | 201 (8.6%) | 710 (32.7%) |
| 3 or 4 Children | 69 (15.7%) | 137 (62.8%) |
| 5 or more Children | 0 (0.0%) | 0 (0.0%) |
| Total | 383 (5.3%) | 865 (26.0%) |
Race in Hickory
The most populous races in Hickory are White / Caucasian (30,239 | 69.8%), Black / African American (5,782 | 13.3%), and Hispanic or Latino (5,712 | 13.2%).
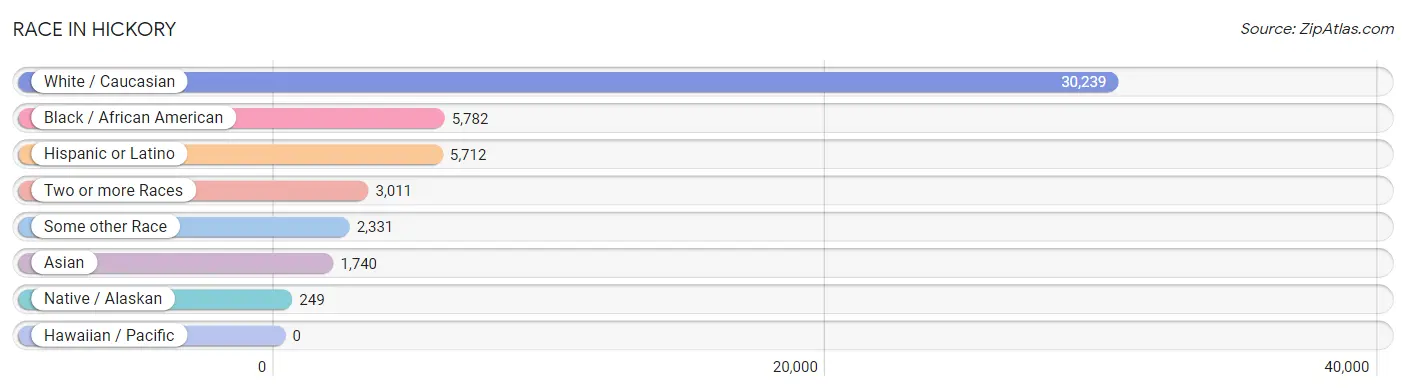
| Race | # Population | % Population |
| Asian | 1,740 | 4.0% |
| Black / African American | 5,782 | 13.3% |
| Hawaiian / Pacific | 0 | 0.0% |
| Hispanic or Latino | 5,712 | 13.2% |
| Native / Alaskan | 249 | 0.6% |
| White / Caucasian | 30,239 | 69.8% |
| Two or more Races | 3,011 | 7.0% |
| Some other Race | 2,331 | 5.4% |
| Total | 43,352 | 100.0% |
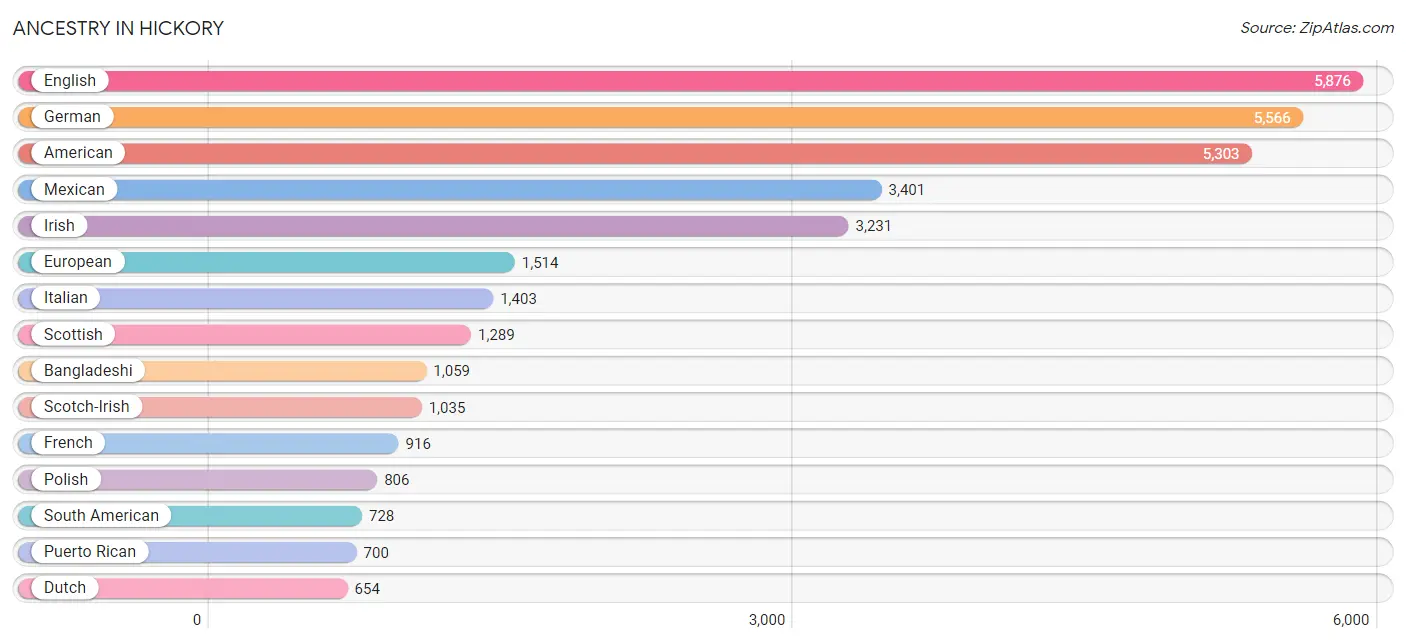
Ancestry in Hickory
The most populous ancestries reported in Hickory are English (5,876 | 13.6%), German (5,566 | 12.8%), American (5,303 | 12.2%), Mexican (3,401 | 7.9%), and Irish (3,231 | 7.4%), together accounting for 53.9% of all Hickory residents.
| Ancestry | # Population | % Population |
| African | 341 | 0.8% |
| Albanian | 17 | 0.0% |
| American | 5,303 | 12.2% |
| Apache | 20 | 0.1% |
| Arab | 41 | 0.1% |
| Argentinean | 190 | 0.4% |
| Armenian | 12 | 0.0% |
| Austrian | 12 | 0.0% |
| Bangladeshi | 1,059 | 2.4% |
| Bhutanese | 78 | 0.2% |
| Brazilian | 80 | 0.2% |
| British | 411 | 0.9% |
| Burmese | 15 | 0.0% |
| Cajun | 16 | 0.0% |
| Central American | 600 | 1.4% |
| Central American Indian | 2 | 0.0% |
| Cherokee | 96 | 0.2% |
| Chilean | 194 | 0.4% |
| Colombian | 113 | 0.3% |
| Costa Rican | 7 | 0.0% |
| Cuban | 81 | 0.2% |
| Czech | 6 | 0.0% |
| Czechoslovakian | 8 | 0.0% |
| Danish | 89 | 0.2% |
| Dominican | 52 | 0.1% |
| Dutch | 654 | 1.5% |
| Eastern European | 55 | 0.1% |
| Ecuadorian | 217 | 0.5% |
| Egyptian | 9 | 0.0% |
| English | 5,876 | 13.6% |
| Estonian | 5 | 0.0% |
| European | 1,514 | 3.5% |
| Finnish | 129 | 0.3% |
| French | 916 | 2.1% |
| French Canadian | 120 | 0.3% |
| German | 5,566 | 12.8% |
| Greek | 235 | 0.5% |
| Guamanian / Chamorro | 16 | 0.0% |
| Guatemalan | 173 | 0.4% |
| Honduran | 209 | 0.5% |
| Hungarian | 128 | 0.3% |
| Indian (Asian) | 106 | 0.2% |
| Iranian | 25 | 0.1% |
| Irish | 3,231 | 7.4% |
| Iroquois | 10 | 0.0% |
| Italian | 1,403 | 3.2% |
| Jamaican | 47 | 0.1% |
| Korean | 149 | 0.3% |
| Latvian | 21 | 0.1% |
| Lebanese | 32 | 0.1% |
| Lithuanian | 15 | 0.0% |
| Malaysian | 18 | 0.0% |
| Mexican | 3,401 | 7.9% |
| Mexican American Indian | 218 | 0.5% |
| Native Hawaiian | 20 | 0.1% |
| Nepalese | 21 | 0.1% |
| Northern European | 166 | 0.4% |
| Norwegian | 186 | 0.4% |
| Pakistani | 183 | 0.4% |
| Panamanian | 24 | 0.1% |
| Pennsylvania German | 13 | 0.0% |
| Peruvian | 8 | 0.0% |
| Polish | 806 | 1.9% |
| Portuguese | 10 | 0.0% |
| Puerto Rican | 700 | 1.6% |
| Romanian | 97 | 0.2% |
| Russian | 248 | 0.6% |
| Salvadoran | 187 | 0.4% |
| Scandinavian | 39 | 0.1% |
| Scotch-Irish | 1,035 | 2.4% |
| Scottish | 1,289 | 3.0% |
| Seminole | 56 | 0.1% |
| Slovak | 21 | 0.1% |
| Slovene | 8 | 0.0% |
| South American | 728 | 1.7% |
| Spaniard | 11 | 0.0% |
| Spanish | 60 | 0.1% |
| Sri Lankan | 254 | 0.6% |
| Subsaharan African | 341 | 0.8% |
| Swedish | 124 | 0.3% |
| Swiss | 11 | 0.0% |
| Thai | 87 | 0.2% |
| Ukrainian | 63 | 0.2% |
| Venezuelan | 6 | 0.0% |
| Welsh | 160 | 0.4% |
| West Indian | 9 | 0.0% | View All 86 Rows |
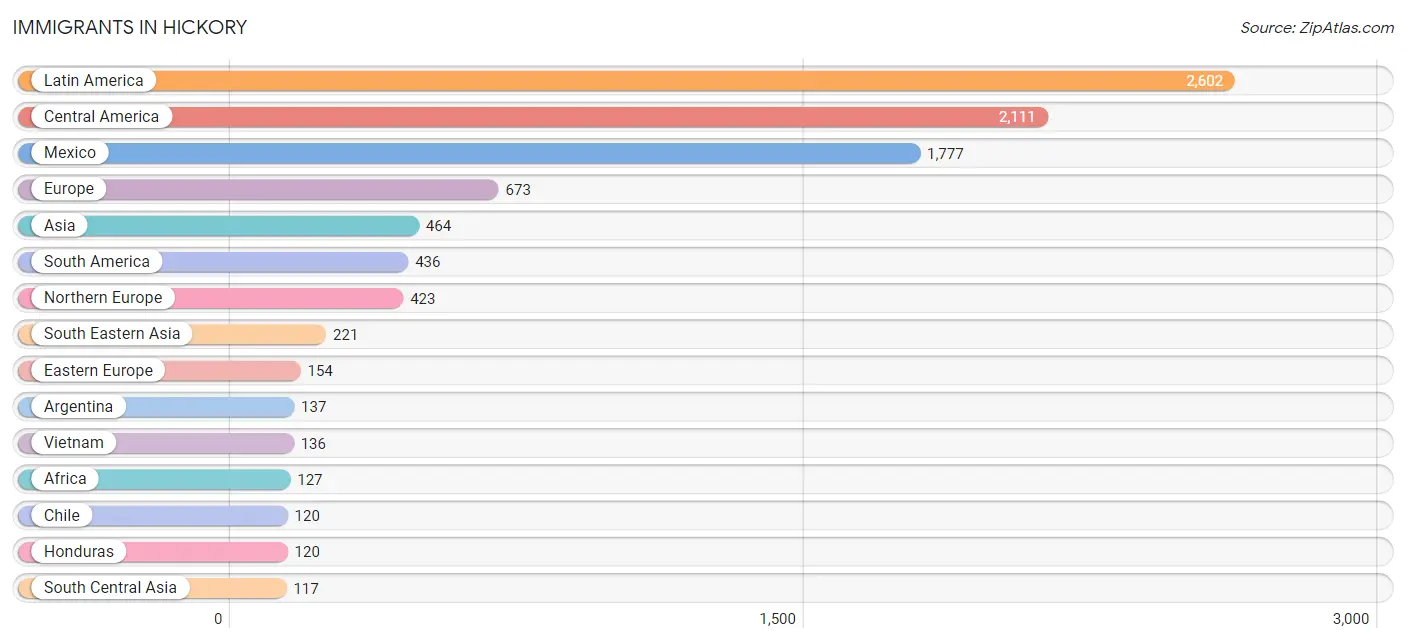
Immigrants in Hickory
The most numerous immigrant groups reported in Hickory came from Latin America (2,602 | 6.0%), Central America (2,111 | 4.9%), Mexico (1,777 | 4.1%), Europe (673 | 1.5%), and Asia (464 | 1.1%), together accounting for 17.6% of all Hickory residents.
| Immigration Origin | # Population | % Population |
| Africa | 127 | 0.3% |
| Albania | 17 | 0.0% |
| Argentina | 137 | 0.3% |
| Asia | 464 | 1.1% |
| Belarus | 15 | 0.0% |
| Belgium | 9 | 0.0% |
| Brazil | 94 | 0.2% |
| Cambodia | 1 | 0.0% |
| Caribbean | 55 | 0.1% |
| Central America | 2,111 | 4.9% |
| Chile | 120 | 0.3% |
| China | 63 | 0.2% |
| Colombia | 8 | 0.0% |
| Costa Rica | 7 | 0.0% |
| Cuba | 26 | 0.1% |
| Dominican Republic | 11 | 0.0% |
| Eastern Africa | 106 | 0.2% |
| Eastern Asia | 94 | 0.2% |
| Eastern Europe | 154 | 0.4% |
| Ecuador | 41 | 0.1% |
| Egypt | 9 | 0.0% |
| El Salvador | 107 | 0.3% |
| England | 72 | 0.2% |
| Europe | 673 | 1.5% |
| France | 12 | 0.0% |
| Germany | 14 | 0.0% |
| Guatemala | 100 | 0.2% |
| Haiti | 18 | 0.0% |
| Honduras | 120 | 0.3% |
| Hungary | 4 | 0.0% |
| India | 87 | 0.2% |
| Iran | 25 | 0.1% |
| Italy | 38 | 0.1% |
| Japan | 16 | 0.0% |
| Korea | 15 | 0.0% |
| Laos | 11 | 0.0% |
| Latin America | 2,602 | 6.0% |
| Lebanon | 32 | 0.1% |
| Mexico | 1,777 | 4.1% |
| Moldova | 9 | 0.0% |
| Northern Africa | 9 | 0.0% |
| Northern Europe | 423 | 1.0% |
| Peru | 30 | 0.1% |
| Philippines | 32 | 0.1% |
| Poland | 6 | 0.0% |
| Portugal | 10 | 0.0% |
| Romania | 70 | 0.2% |
| Scotland | 8 | 0.0% |
| Senegal | 7 | 0.0% |
| South Africa | 5 | 0.0% |
| South America | 436 | 1.0% |
| South Central Asia | 117 | 0.3% |
| South Eastern Asia | 221 | 0.5% |
| Southern Europe | 61 | 0.1% |
| Spain | 13 | 0.0% |
| Sri Lanka | 5 | 0.0% |
| Sweden | 12 | 0.0% |
| Thailand | 41 | 0.1% |
| Ukraine | 20 | 0.1% |
| Venezuela | 6 | 0.0% |
| Vietnam | 136 | 0.3% |
| Western Africa | 7 | 0.0% |
| Western Asia | 32 | 0.1% |
| Western Europe | 35 | 0.1% | View All 64 Rows |
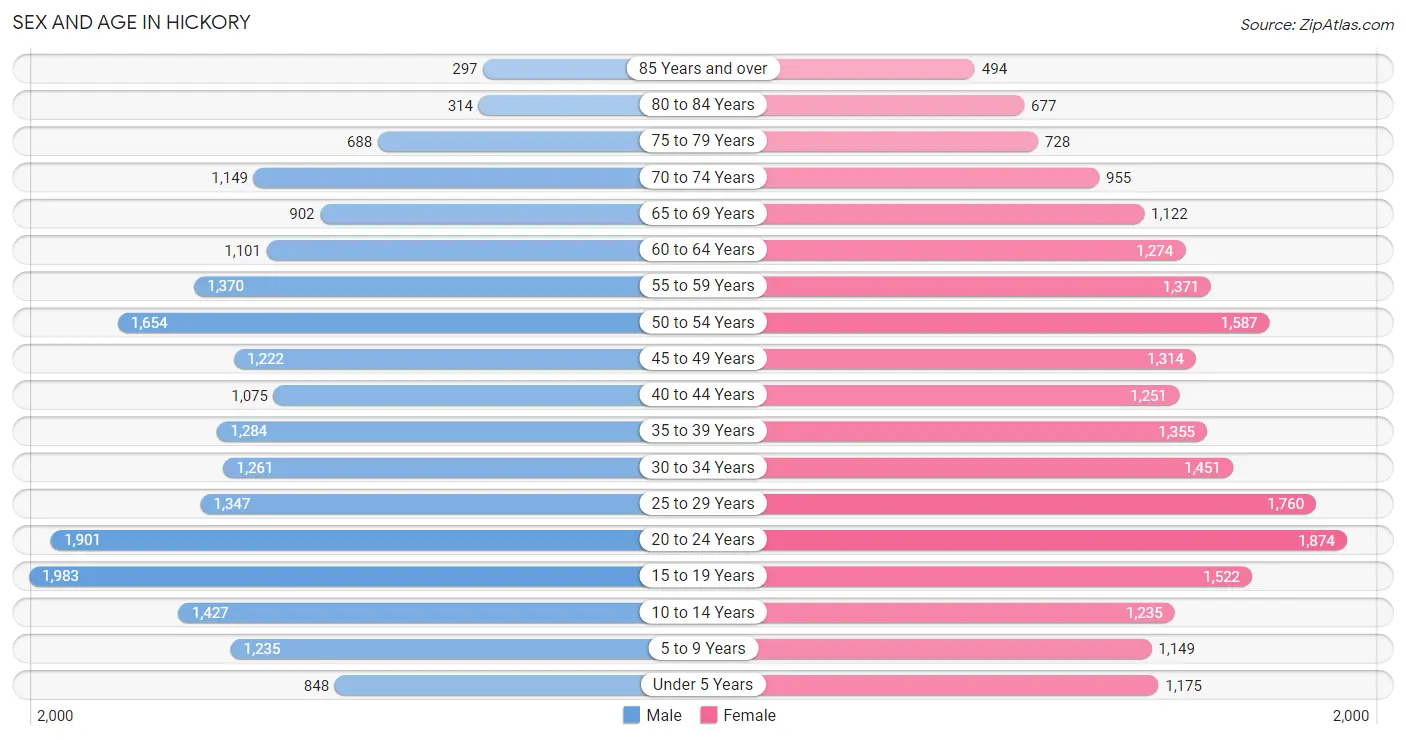
Sex and Age in Hickory
Sex and Age in Hickory
The most populous age groups in Hickory are 15 to 19 Years (1,983 | 9.4%) for men and 20 to 24 Years (1,874 | 8.4%) for women.
| Age Bracket | Male | Female |
| Under 5 Years | 848 (4.0%) | 1,175 (5.3%) |
| 5 to 9 Years | 1,235 (5.9%) | 1,149 (5.1%) |
| 10 to 14 Years | 1,427 (6.8%) | 1,235 (5.5%) |
| 15 to 19 Years | 1,983 (9.4%) | 1,522 (6.8%) |
| 20 to 24 Years | 1,901 (9.0%) | 1,874 (8.4%) |
| 25 to 29 Years | 1,347 (6.4%) | 1,760 (7.9%) |
| 30 to 34 Years | 1,261 (6.0%) | 1,451 (6.5%) |
| 35 to 39 Years | 1,284 (6.1%) | 1,355 (6.1%) |
| 40 to 44 Years | 1,075 (5.1%) | 1,251 (5.6%) |
| 45 to 49 Years | 1,222 (5.8%) | 1,314 (5.9%) |
| 50 to 54 Years | 1,654 (7.9%) | 1,587 (7.1%) |
| 55 to 59 Years | 1,370 (6.5%) | 1,371 (6.1%) |
| 60 to 64 Years | 1,101 (5.2%) | 1,274 (5.7%) |
| 65 to 69 Years | 902 (4.3%) | 1,122 (5.0%) |
| 70 to 74 Years | 1,149 (5.5%) | 955 (4.3%) |
| 75 to 79 Years | 688 (3.3%) | 728 (3.3%) |
| 80 to 84 Years | 314 (1.5%) | 677 (3.0%) |
| 85 Years and over | 297 (1.4%) | 494 (2.2%) |
| Total | 21,058 (100.0%) | 22,294 (100.0%) |
Families and Households in Hickory
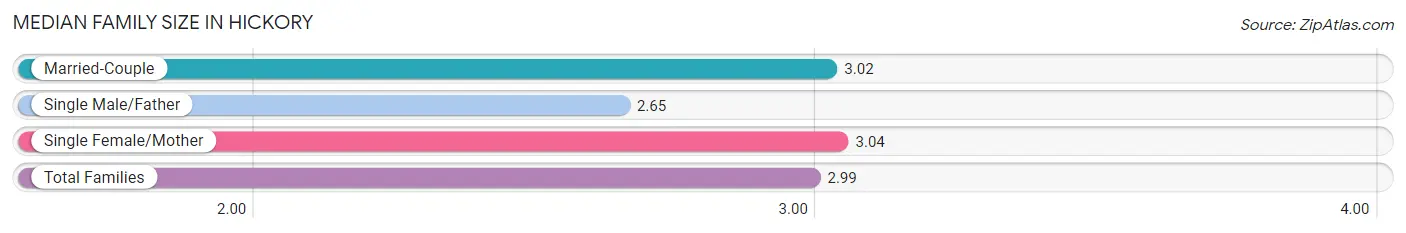
Median Family Size in Hickory
The median family size in Hickory is 2.99 persons per family, with single female/mother families (2,328 | 22.0%) accounting for the largest median family size of 3.04 persons per family. On the other hand, single male/father families (1,000 | 9.5%) represent the smallest median family size with 2.65 persons per family.
| Family Type | # Families | Family Size |
| Married-Couple | 7,251 (68.5%) | 3.02 |
| Single Male/Father | 1,000 (9.5%) | 2.65 |
| Single Female/Mother | 2,328 (22.0%) | 3.04 |
| Total Families | 10,579 (100.0%) | 2.99 |
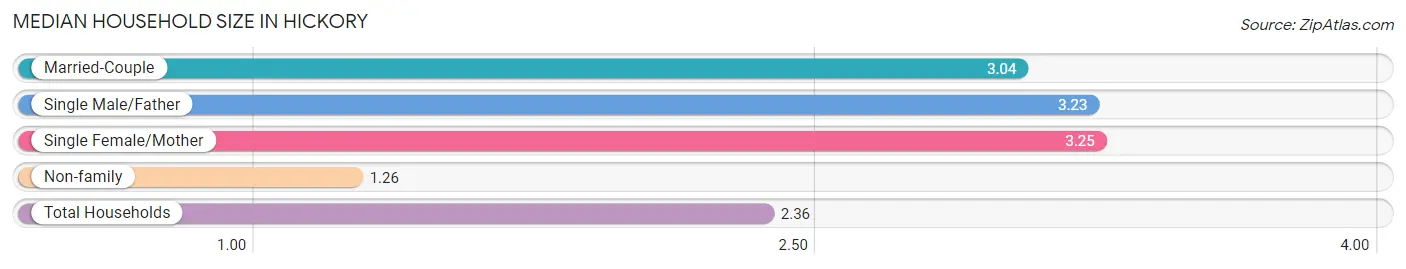
Median Household Size in Hickory
The median household size in Hickory is 2.36 persons per household, with single female/mother households (2,328 | 13.2%) accounting for the largest median household size of 3.25 persons per household. non-family households (7,084 | 40.1%) represent the smallest median household size with 1.26 persons per household.
| Household Type | # Households | Household Size |
| Married-Couple | 7,251 (41.0%) | 3.04 |
| Single Male/Father | 1,000 (5.7%) | 3.23 |
| Single Female/Mother | 2,328 (13.2%) | 3.25 |
| Non-family | 7,084 (40.1%) | 1.26 |
| Total Households | 17,663 (100.0%) | 2.36 |
Household Size by Marriage Status in Hickory
Out of a total of 17,663 households in Hickory, 10,579 (59.9%) are family households, while 7,084 (40.1%) are nonfamily households. The most numerous type of family households are 2-person households, comprising 4,513, and the most common type of nonfamily households are 1-person households, comprising 5,735.
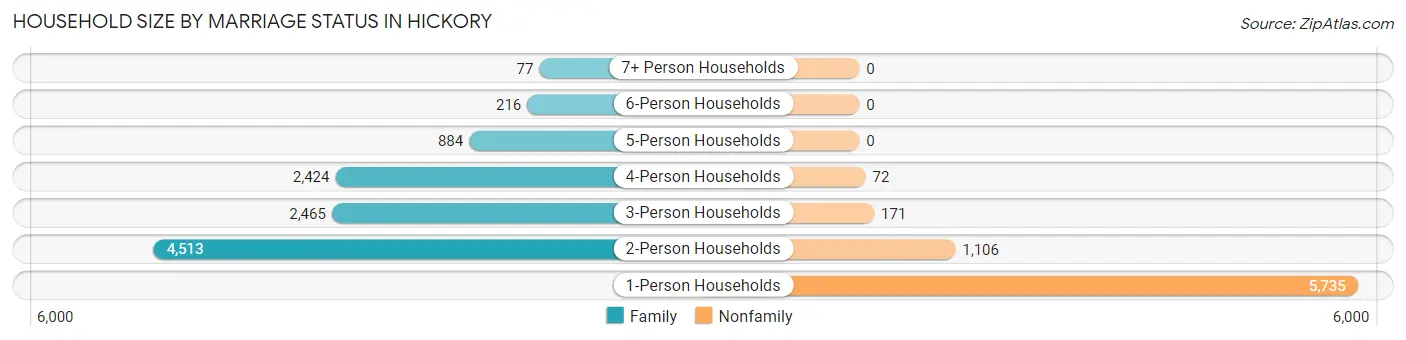
| Household Size | Family Households | Nonfamily Households |
| 1-Person Households | - | 5,735 (32.5%) |
| 2-Person Households | 4,513 (25.6%) | 1,106 (6.3%) |
| 3-Person Households | 2,465 (14.0%) | 171 (1.0%) |
| 4-Person Households | 2,424 (13.7%) | 72 (0.4%) |
| 5-Person Households | 884 (5.0%) | 0 (0.0%) |
| 6-Person Households | 216 (1.2%) | 0 (0.0%) |
| 7+ Person Households | 77 (0.4%) | 0 (0.0%) |
| Total | 10,579 (59.9%) | 7,084 (40.1%) |
Female Fertility in Hickory
Fertility by Age in Hickory
Average fertility rate in Hickory is 23.0 births per 1,000 women. Women in the age bracket of 20 to 34 years have the highest fertility rate with 36.0 births per 1,000 women. Women in the age bracket of 20 to 34 years acount for 72.7% of all women with births.
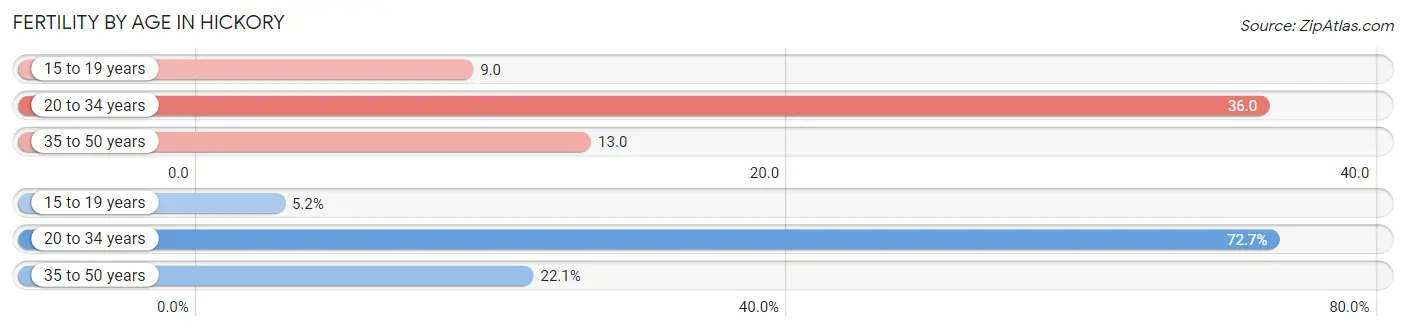
| Age Bracket | Women with Births | Births / 1,000 Women |
| 15 to 19 years | 13 (5.2%) | 9.0 |
| 20 to 34 years | 181 (72.7%) | 36.0 |
| 35 to 50 years | 55 (22.1%) | 13.0 |
| Total | 249 (100.0%) | 23.0 |
Fertility by Age by Marriage Status in Hickory
86.3% of women with births (249) in Hickory are married. The highest percentage of unmarried women with births falls into 15 to 19 years age bracket with 100.0% of them unmarried at the time of birth, while the lowest percentage of unmarried women with births belong to 20 to 34 years age bracket with 0.0% of them unmarried.
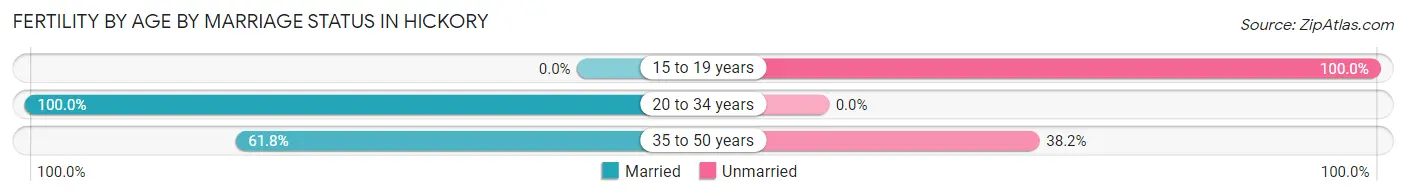
| Age Bracket | Married | Unmarried |
| 15 to 19 years | 0 (0.0%) | 13 (100.0%) |
| 20 to 34 years | 181 (100.0%) | 0 (0.0%) |
| 35 to 50 years | 34 (61.8%) | 21 (38.2%) |
| Total | 215 (86.4%) | 34 (13.7%) |
Fertility by Education in Hickory
Average fertility rate in Hickory is 23.0 births per 1,000 women. Women with the education attainment of bachelor's degree have the highest fertility rate of 52.0 births per 1,000 women, while women with the education attainment of college or associate's degree have the lowest fertility at 7.0 births per 1,000 women. Women with the education attainment of bachelor's degree represent 46.2% of all women with births.
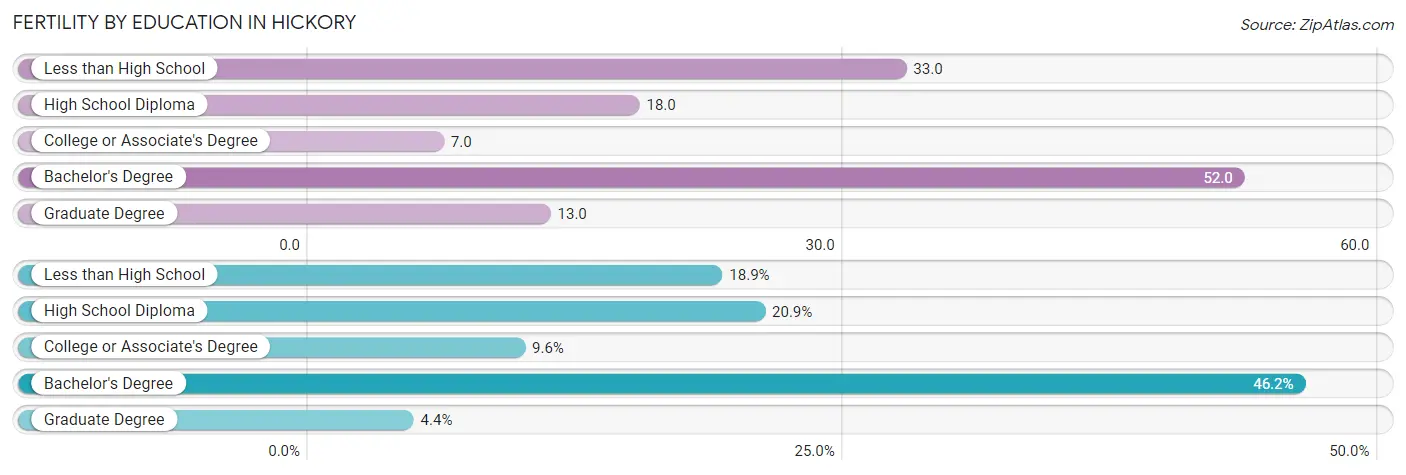
| Educational Attainment | Women with Births | Births / 1,000 Women |
| Less than High School | 47 (18.9%) | 33.0 |
| High School Diploma | 52 (20.9%) | 18.0 |
| College or Associate's Degree | 24 (9.6%) | 7.0 |
| Bachelor's Degree | 115 (46.2%) | 52.0 |
| Graduate Degree | 11 (4.4%) | 13.0 |
| Total | 249 (100.0%) | 23.0 |
Fertility by Education by Marriage Status in Hickory
13.7% of women with births in Hickory are unmarried. Women with the educational attainment of bachelor's degree are most likely to be married with 100.0% of them married at childbirth, while women with the educational attainment of less than high school are least likely to be married with 44.7% of them unmarried at childbirth.
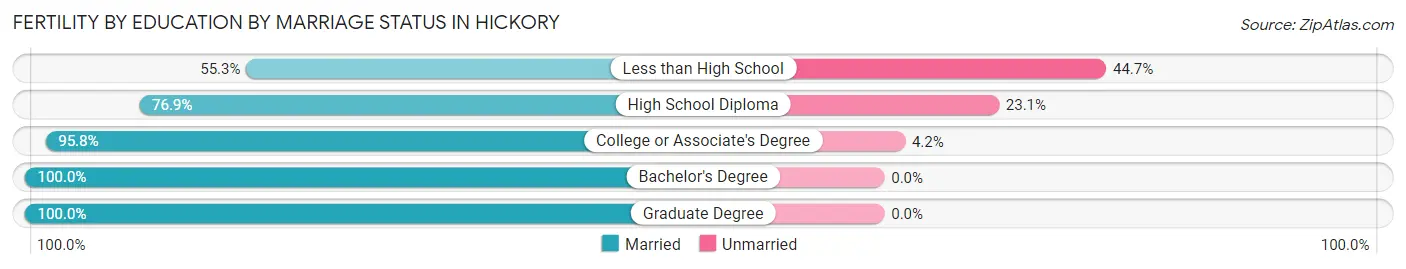
| Educational Attainment | Married | Unmarried |
| Less than High School | 26 (55.3%) | 21 (44.7%) |
| High School Diploma | 40 (76.9%) | 12 (23.1%) |
| College or Associate's Degree | 23 (95.8%) | 1 (4.2%) |
| Bachelor's Degree | 115 (100.0%) | 0 (0.0%) |
| Graduate Degree | 11 (100.0%) | 0 (0.0%) |
| Total | 215 (86.4%) | 34 (13.7%) |
Employment Characteristics in Hickory
Employment by Class of Employer in Hickory
Among the 19,729 employed individuals in Hickory, private company employees (14,250 | 72.2%), not-for-profit organizations (1,505 | 7.6%), and self-employed (not incorporated) (1,267 | 6.4%) make up the most common classes of employment.
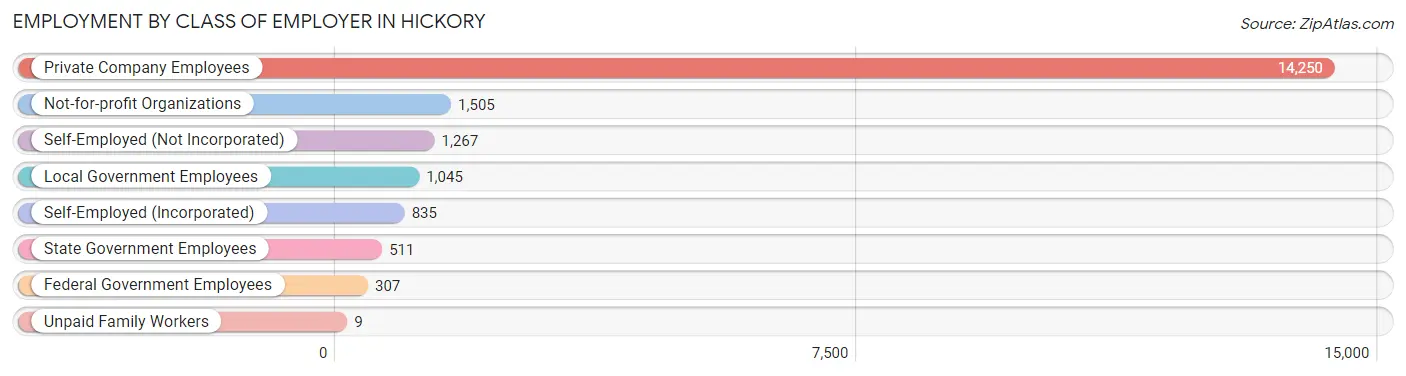
| Employer Class | # Employees | % Employees |
| Private Company Employees | 14,250 | 72.2% |
| Self-Employed (Incorporated) | 835 | 4.2% |
| Self-Employed (Not Incorporated) | 1,267 | 6.4% |
| Not-for-profit Organizations | 1,505 | 7.6% |
| Local Government Employees | 1,045 | 5.3% |
| State Government Employees | 511 | 2.6% |
| Federal Government Employees | 307 | 1.6% |
| Unpaid Family Workers | 9 | 0.1% |
| Total | 19,729 | 100.0% |
Employment Status by Age in Hickory
According to the labor force statistics for Hickory, out of the total population over 16 years of age (35,650), 59.8% or 21,319 individuals are in the labor force, with 6.2% or 1,322 of them unemployed. The age group with the highest labor force participation rate is 30 to 34 years, with 90.5% or 2,454 individuals in the labor force. Within the labor force, the 16 to 19 years age range has the highest percentage of unemployed individuals, with 18.0% or 217 of them being unemployed.
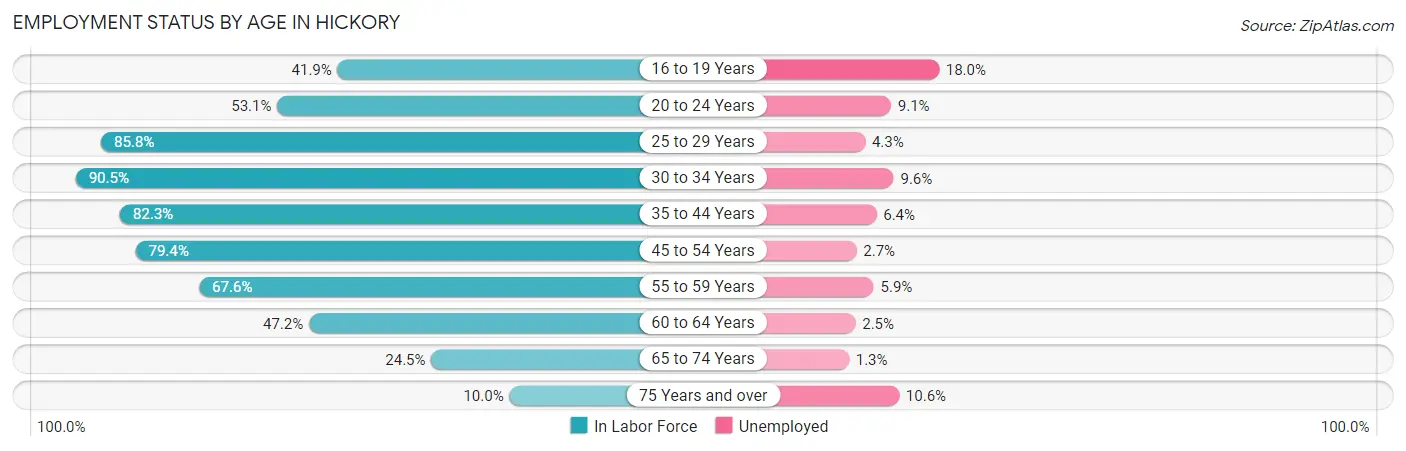
| Age Bracket | In Labor Force | Unemployed |
| 16 to 19 Years | 1,203 (41.9%) | 217 (18.0%) |
| 20 to 24 Years | 2,005 (53.1%) | 182 (9.1%) |
| 25 to 29 Years | 2,666 (85.8%) | 115 (4.3%) |
| 30 to 34 Years | 2,454 (90.5%) | 236 (9.6%) |
| 35 to 44 Years | 4,086 (82.3%) | 262 (6.4%) |
| 45 to 54 Years | 4,587 (79.4%) | 124 (2.7%) |
| 55 to 59 Years | 1,853 (67.6%) | 109 (5.9%) |
| 60 to 64 Years | 1,121 (47.2%) | 28 (2.5%) |
| 65 to 74 Years | 1,011 (24.5%) | 13 (1.3%) |
| 75 Years and over | 320 (10.0%) | 34 (10.6%) |
| Total | 21,319 (59.8%) | 1,322 (6.2%) |
Employment Status by Educational Attainment in Hickory
According to labor force statistics for Hickory, 77.3% of individuals (16,756) out of the total population between 25 and 64 years of age (21,677) are in the labor force, with 5.2% or 871 of them being unemployed. The group with the highest labor force participation rate are those with the educational attainment of bachelor's degree or higher, with 82.9% or 6,583 individuals in the labor force. Within the labor force, individuals with less than high school education have the highest percentage of unemployment, with 15.8% or 209 of them being unemployed.
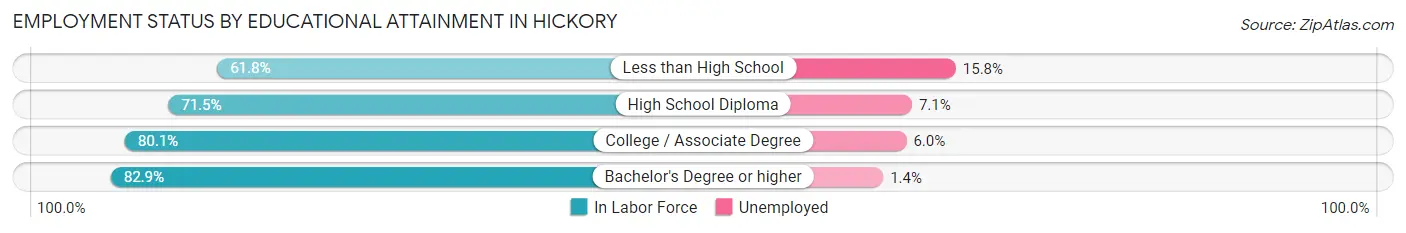
| Educational Attainment | In Labor Force | Unemployed |
| Less than High School | 1,324 (61.8%) | 339 (15.8%) |
| High School Diploma | 3,623 (71.5%) | 360 (7.1%) |
| College / Associate Degree | 5,227 (80.1%) | 392 (6.0%) |
| Bachelor's Degree or higher | 6,583 (82.9%) | 111 (1.4%) |
| Total | 16,756 (77.3%) | 1,127 (5.2%) |
Employment Occupations by Sex in Hickory
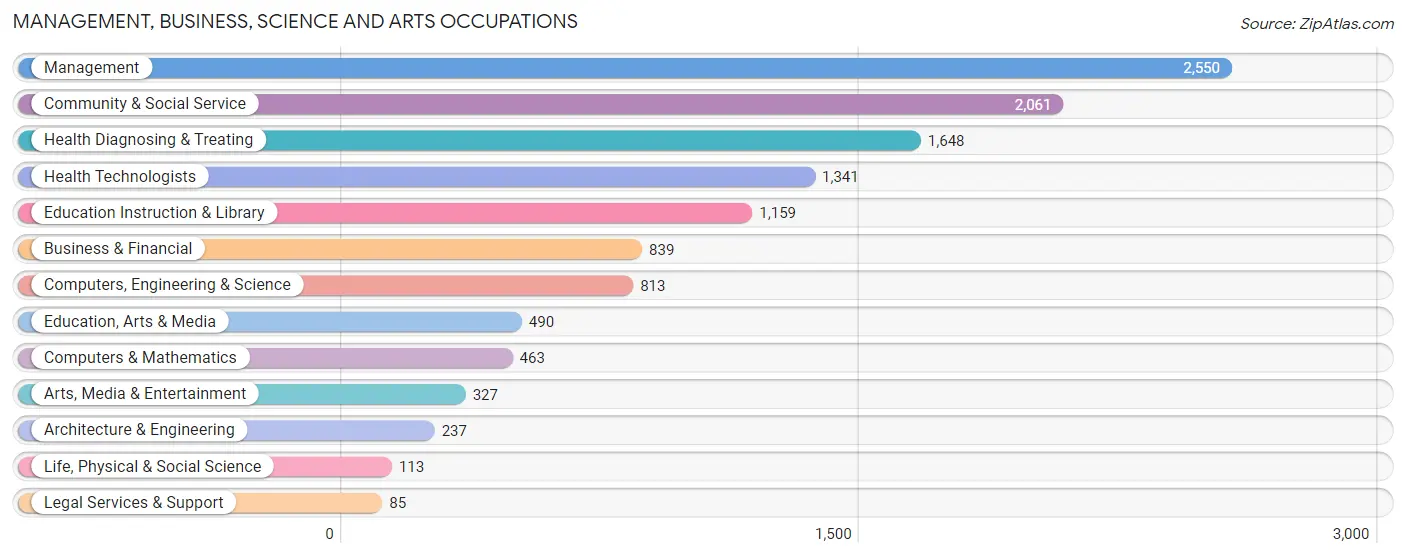
Management, Business, Science and Arts Occupations
The most common Management, Business, Science and Arts occupations in Hickory are Management (2,550 | 12.8%), Community & Social Service (2,061 | 10.3%), Health Diagnosing & Treating (1,648 | 8.3%), Health Technologists (1,341 | 6.7%), and Education Instruction & Library (1,159 | 5.8%).
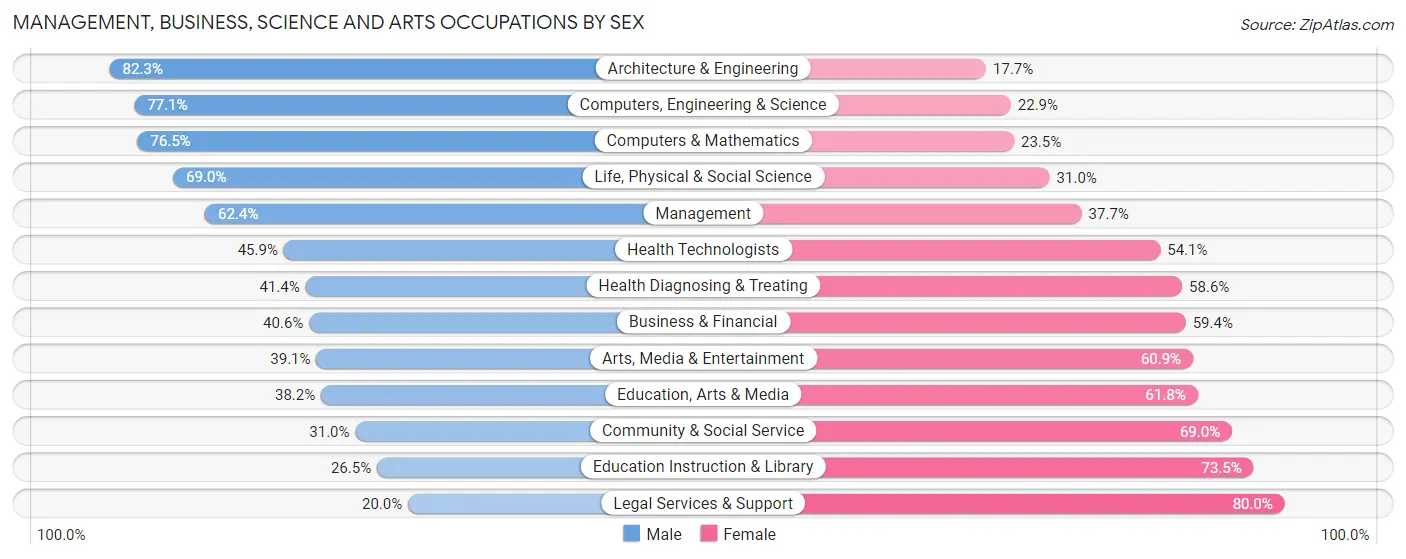
Management, Business, Science and Arts Occupations by Sex
Within the Management, Business, Science and Arts occupations in Hickory, the most male-oriented occupations are Architecture & Engineering (82.3%), Computers, Engineering & Science (77.1%), and Computers & Mathematics (76.5%), while the most female-oriented occupations are Legal Services & Support (80.0%), Education Instruction & Library (73.5%), and Community & Social Service (69.0%).
| Occupation | Male | Female |
| Management | 1,590 (62.4%) | 960 (37.7%) |
| Business & Financial | 341 (40.6%) | 498 (59.4%) |
| Computers, Engineering & Science | 627 (77.1%) | 186 (22.9%) |
| Computers & Mathematics | 354 (76.5%) | 109 (23.5%) |
| Architecture & Engineering | 195 (82.3%) | 42 (17.7%) |
| Life, Physical & Social Science | 78 (69.0%) | 35 (31.0%) |
| Community & Social Service | 639 (31.0%) | 1,422 (69.0%) |
| Education, Arts & Media | 187 (38.2%) | 303 (61.8%) |
| Legal Services & Support | 17 (20.0%) | 68 (80.0%) |
| Education Instruction & Library | 307 (26.5%) | 852 (73.5%) |
| Arts, Media & Entertainment | 128 (39.1%) | 199 (60.9%) |
| Health Diagnosing & Treating | 682 (41.4%) | 966 (58.6%) |
| Health Technologists | 616 (45.9%) | 725 (54.1%) |
| Total (Category) | 3,879 (49.0%) | 4,032 (51.0%) |
| Total (Overall) | 10,669 (53.4%) | 9,318 (46.6%) |
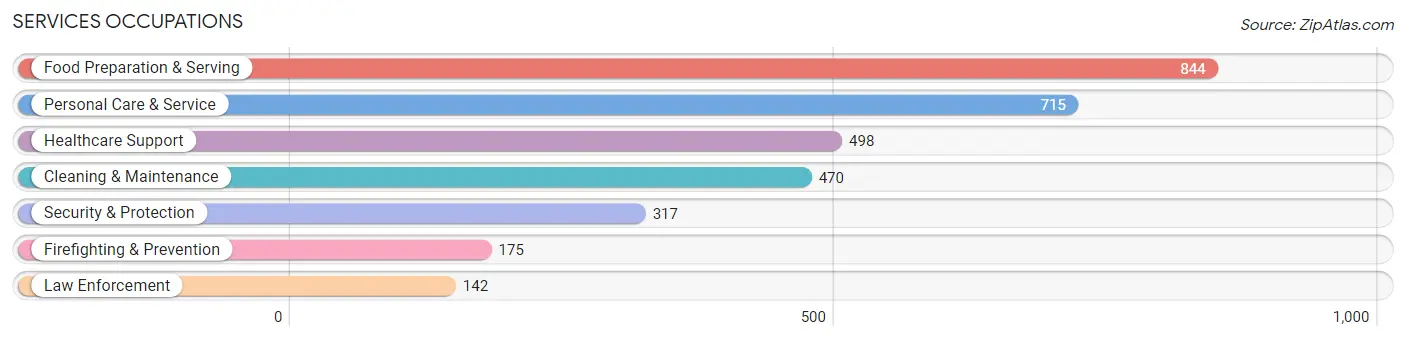
Services Occupations
The most common Services occupations in Hickory are Food Preparation & Serving (844 | 4.2%), Personal Care & Service (715 | 3.6%), Healthcare Support (498 | 2.5%), Cleaning & Maintenance (470 | 2.4%), and Security & Protection (317 | 1.6%).
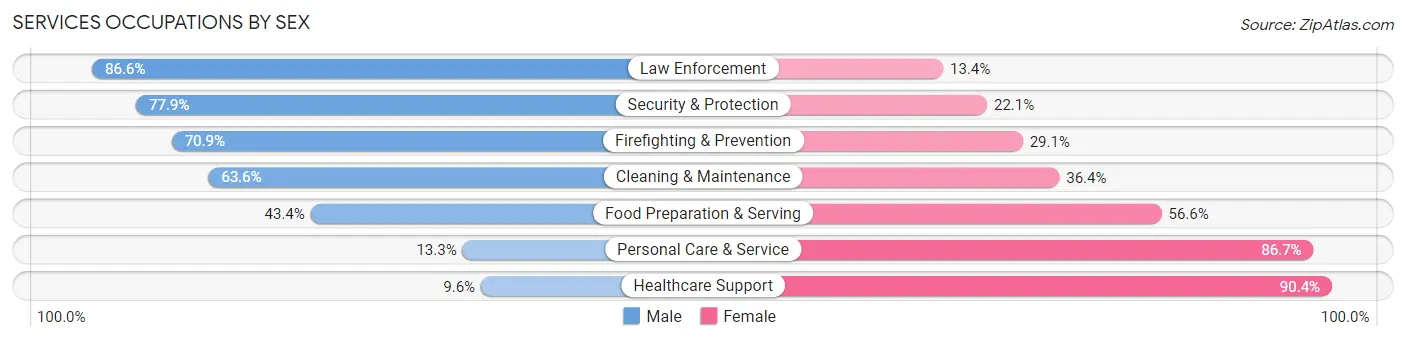
Services Occupations by Sex
Within the Services occupations in Hickory, the most male-oriented occupations are Law Enforcement (86.6%), Security & Protection (77.9%), and Firefighting & Prevention (70.9%), while the most female-oriented occupations are Healthcare Support (90.4%), Personal Care & Service (86.7%), and Food Preparation & Serving (56.6%).
| Occupation | Male | Female |
| Healthcare Support | 48 (9.6%) | 450 (90.4%) |
| Security & Protection | 247 (77.9%) | 70 (22.1%) |
| Firefighting & Prevention | 124 (70.9%) | 51 (29.1%) |
| Law Enforcement | 123 (86.6%) | 19 (13.4%) |
| Food Preparation & Serving | 366 (43.4%) | 478 (56.6%) |
| Cleaning & Maintenance | 299 (63.6%) | 171 (36.4%) |
| Personal Care & Service | 95 (13.3%) | 620 (86.7%) |
| Total (Category) | 1,055 (37.1%) | 1,789 (62.9%) |
| Total (Overall) | 10,669 (53.4%) | 9,318 (46.6%) |
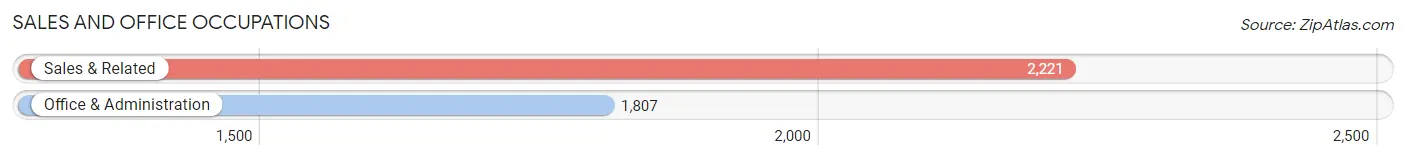
Sales and Office Occupations
The most common Sales and Office occupations in Hickory are Sales & Related (2,221 | 11.1%), and Office & Administration (1,807 | 9.0%).
Sales and Office Occupations by Sex
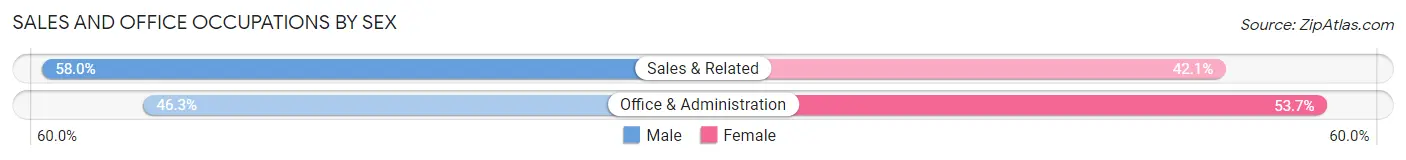
| Occupation | Male | Female |
| Sales & Related | 1,287 (58.0%) | 934 (42.0%) |
| Office & Administration | 836 (46.3%) | 971 (53.7%) |
| Total (Category) | 2,123 (52.7%) | 1,905 (47.3%) |
| Total (Overall) | 10,669 (53.4%) | 9,318 (46.6%) |
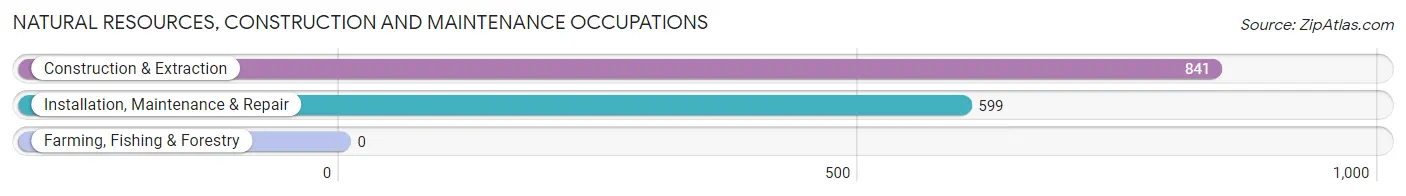
Natural Resources, Construction and Maintenance Occupations
The most common Natural Resources, Construction and Maintenance occupations in Hickory are Construction & Extraction (841 | 4.2%), and Installation, Maintenance & Repair (599 | 3.0%).
Natural Resources, Construction and Maintenance Occupations by Sex
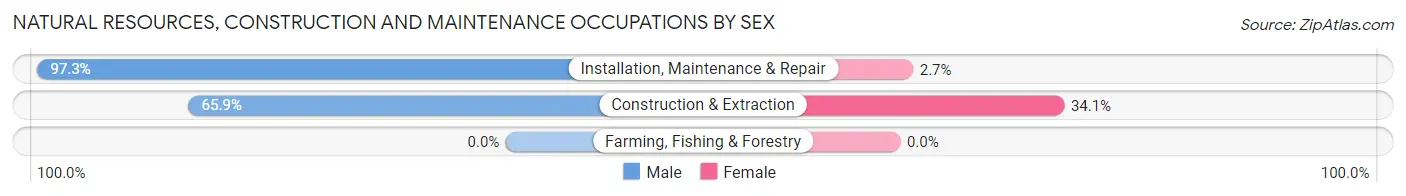
| Occupation | Male | Female |
| Farming, Fishing & Forestry | 0 (0.0%) | 0 (0.0%) |
| Construction & Extraction | 554 (65.9%) | 287 (34.1%) |
| Installation, Maintenance & Repair | 583 (97.3%) | 16 (2.7%) |
| Total (Category) | 1,137 (79.0%) | 303 (21.0%) |
| Total (Overall) | 10,669 (53.4%) | 9,318 (46.6%) |
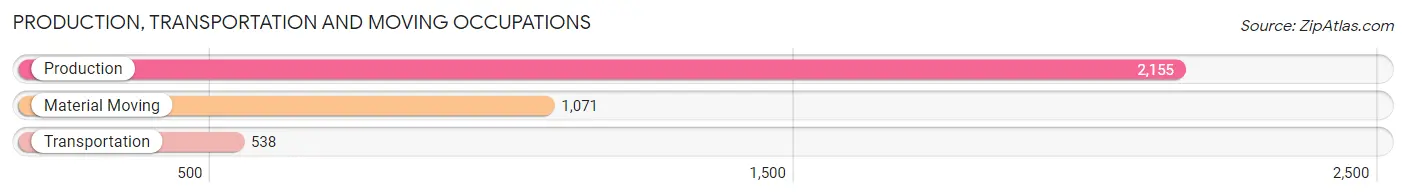
Production, Transportation and Moving Occupations
The most common Production, Transportation and Moving occupations in Hickory are Production (2,155 | 10.8%), Material Moving (1,071 | 5.4%), and Transportation (538 | 2.7%).
Production, Transportation and Moving Occupations by Sex
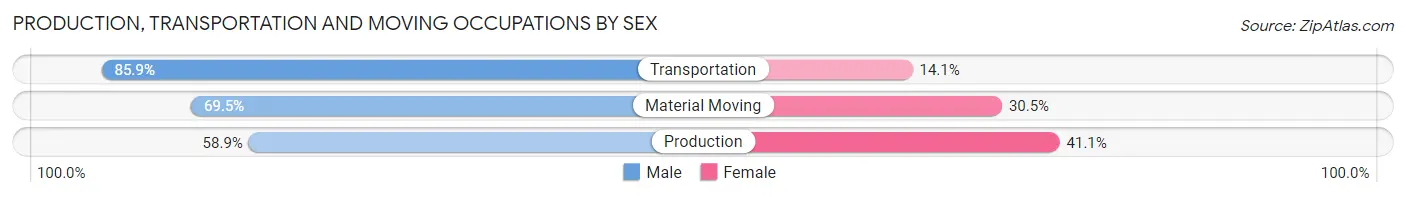
| Occupation | Male | Female |
| Production | 1,269 (58.9%) | 886 (41.1%) |
| Transportation | 462 (85.9%) | 76 (14.1%) |
| Material Moving | 744 (69.5%) | 327 (30.5%) |
| Total (Category) | 2,475 (65.7%) | 1,289 (34.3%) |
| Total (Overall) | 10,669 (53.4%) | 9,318 (46.6%) |
Employment Industries by Sex in Hickory
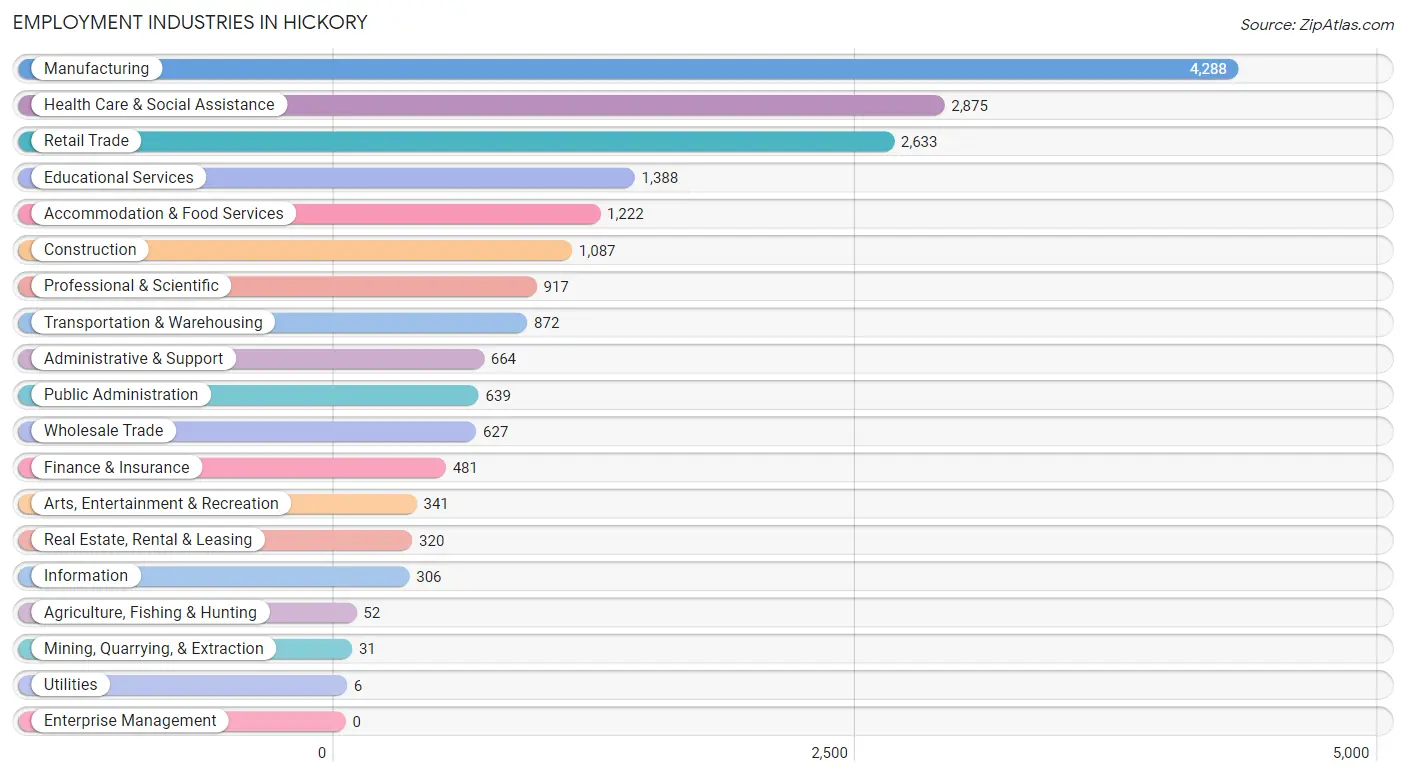
Employment Industries in Hickory
The major employment industries in Hickory include Manufacturing (4,288 | 21.4%), Health Care & Social Assistance (2,875 | 14.4%), Retail Trade (2,633 | 13.2%), Educational Services (1,388 | 6.9%), and Accommodation & Food Services (1,222 | 6.1%).
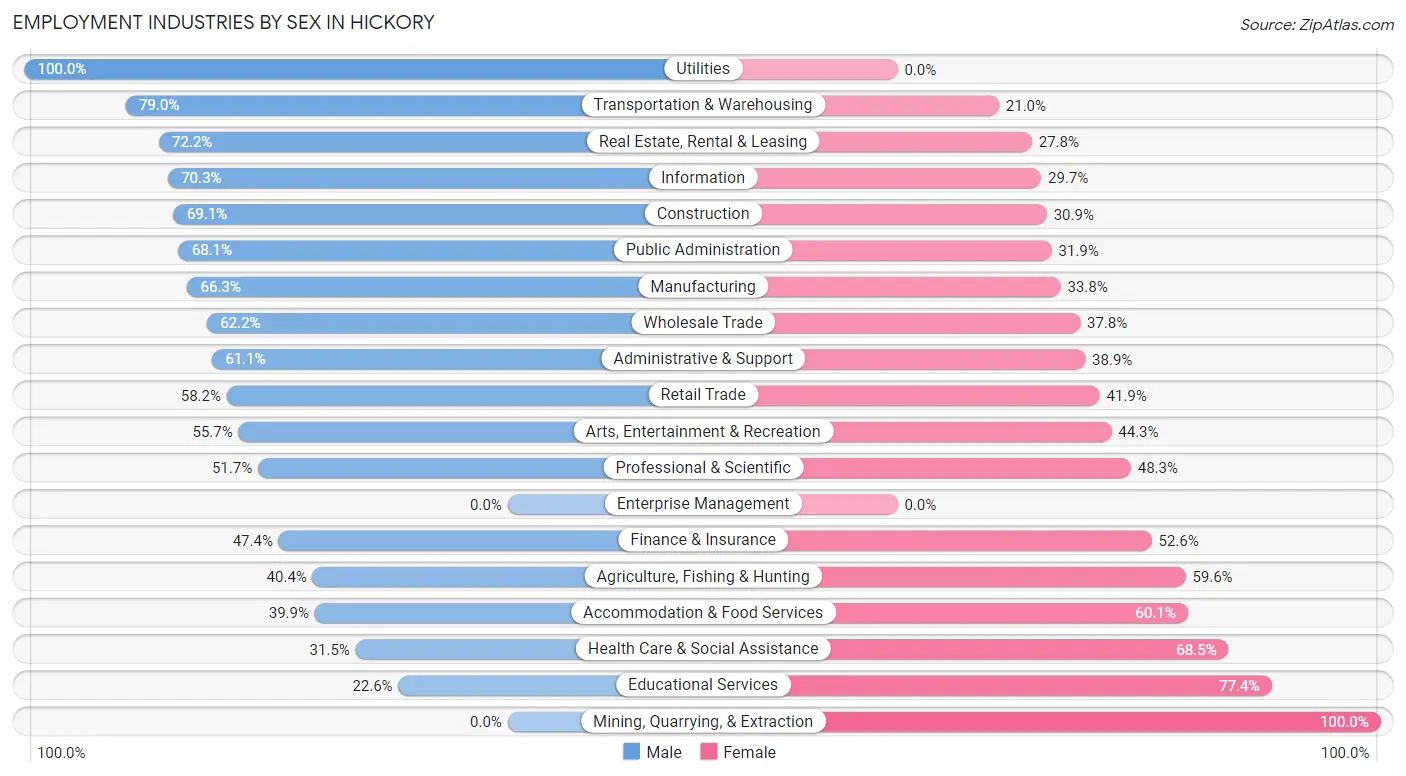
Employment Industries by Sex in Hickory
The Hickory industries that see more men than women are Utilities (100.0%), Transportation & Warehousing (79.0%), and Real Estate, Rental & Leasing (72.2%), whereas the industries that tend to have a higher number of women are Mining, Quarrying, & Extraction (100.0%), Educational Services (77.4%), and Health Care & Social Assistance (68.5%).
| Industry | Male | Female |
| Agriculture, Fishing & Hunting | 21 (40.4%) | 31 (59.6%) |
| Mining, Quarrying, & Extraction | 0 (0.0%) | 31 (100.0%) |
| Construction | 751 (69.1%) | 336 (30.9%) |
| Manufacturing | 2,841 (66.2%) | 1,447 (33.8%) |
| Wholesale Trade | 390 (62.2%) | 237 (37.8%) |
| Retail Trade | 1,531 (58.2%) | 1,102 (41.8%) |
| Transportation & Warehousing | 689 (79.0%) | 183 (21.0%) |
| Utilities | 6 (100.0%) | 0 (0.0%) |
| Information | 215 (70.3%) | 91 (29.7%) |
| Finance & Insurance | 228 (47.4%) | 253 (52.6%) |
| Real Estate, Rental & Leasing | 231 (72.2%) | 89 (27.8%) |
| Professional & Scientific | 474 (51.7%) | 443 (48.3%) |
| Enterprise Management | 0 (0.0%) | 0 (0.0%) |
| Administrative & Support | 406 (61.1%) | 258 (38.9%) |
| Educational Services | 314 (22.6%) | 1,074 (77.4%) |
| Health Care & Social Assistance | 905 (31.5%) | 1,970 (68.5%) |
| Arts, Entertainment & Recreation | 190 (55.7%) | 151 (44.3%) |
| Accommodation & Food Services | 488 (39.9%) | 734 (60.1%) |
| Public Administration | 435 (68.1%) | 204 (31.9%) |
| Total | 10,669 (53.4%) | 9,318 (46.6%) |
Education in Hickory
School Enrollment in Hickory
The most common levels of schooling among the 10,879 students in Hickory are college / undergraduate (3,018 | 27.7%), high school (2,309 | 21.2%), and middle school (2,016 | 18.5%).
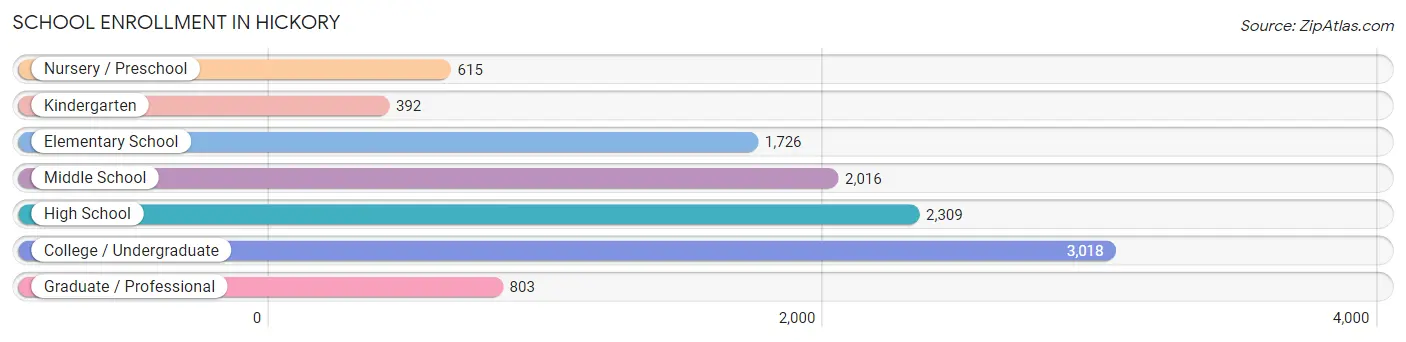
| School Level | # Students | % Students |
| Nursery / Preschool | 615 | 5.7% |
| Kindergarten | 392 | 3.6% |
| Elementary School | 1,726 | 15.9% |
| Middle School | 2,016 | 18.5% |
| High School | 2,309 | 21.2% |
| College / Undergraduate | 3,018 | 27.7% |
| Graduate / Professional | 803 | 7.4% |
| Total | 10,879 | 100.0% |
School Enrollment by Age by Funding Source in Hickory
Out of a total of 10,879 students who are enrolled in schools in Hickory, 3,035 (27.9%) attend a private institution, while the remaining 7,844 (72.1%) are enrolled in public schools. The age group of 3 to 4 year olds has the highest likelihood of being enrolled in private schools, with 294 (70.7% in the age bracket) enrolled. Conversely, the age group of 15 to 17 year olds has the lowest likelihood of being enrolled in a private school, with 1,775 (91.4% in the age bracket) attending a public institution.
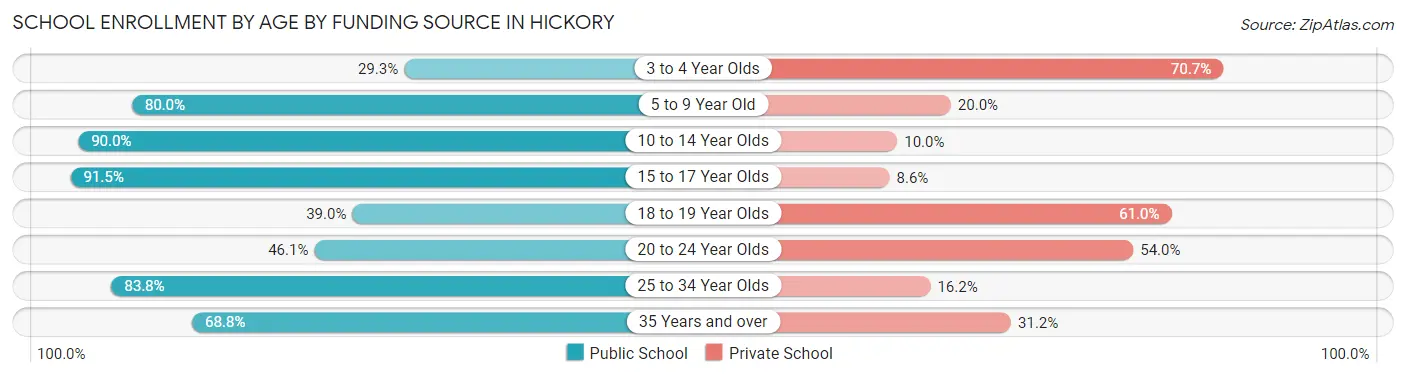
| Age Bracket | Public School | Private School |
| 3 to 4 Year Olds | 122 (29.3%) | 294 (70.7%) |
| 5 to 9 Year Old | 1,695 (80.0%) | 423 (20.0%) |
| 10 to 14 Year Olds | 2,163 (90.0%) | 240 (10.0%) |
| 15 to 17 Year Olds | 1,775 (91.4%) | 166 (8.6%) |
| 18 to 19 Year Olds | 475 (39.0%) | 744 (61.0%) |
| 20 to 24 Year Olds | 799 (46.1%) | 936 (53.9%) |
| 25 to 34 Year Olds | 539 (83.8%) | 104 (16.2%) |
| 35 Years and over | 278 (68.8%) | 126 (31.2%) |
| Total | 7,844 (72.1%) | 3,035 (27.9%) |
Educational Attainment by Field of Study in Hickory
Business (2,661 | 22.9%), education (1,527 | 13.1%), science & technology (1,225 | 10.5%), arts & humanities (1,062 | 9.1%), and bio, nature & agricultural (664 | 5.7%) are the most common fields of study among 11,620 individuals in Hickory who have obtained a bachelor's degree or higher.
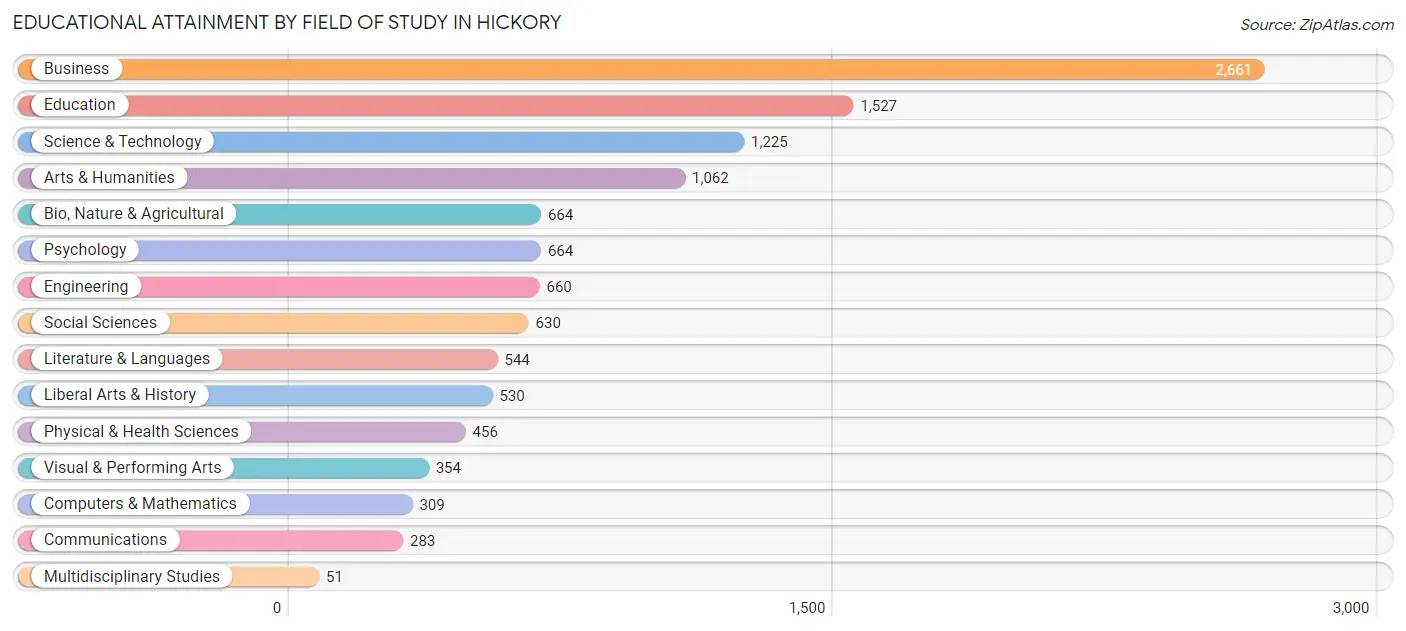
| Field of Study | # Graduates | % Graduates |
| Computers & Mathematics | 309 | 2.7% |
| Bio, Nature & Agricultural | 664 | 5.7% |
| Physical & Health Sciences | 456 | 3.9% |
| Psychology | 664 | 5.7% |
| Social Sciences | 630 | 5.4% |
| Engineering | 660 | 5.7% |
| Multidisciplinary Studies | 51 | 0.4% |
| Science & Technology | 1,225 | 10.5% |
| Business | 2,661 | 22.9% |
| Education | 1,527 | 13.1% |
| Literature & Languages | 544 | 4.7% |
| Liberal Arts & History | 530 | 4.6% |
| Visual & Performing Arts | 354 | 3.0% |
| Communications | 283 | 2.4% |
| Arts & Humanities | 1,062 | 9.1% |
| Total | 11,620 | 100.0% |
Transportation & Commute in Hickory
Vehicle Availability by Sex in Hickory
The most prevalent vehicle ownership categories in Hickory are males with 2 vehicles (4,443, accounting for 42.0%) and females with 2 vehicles (3,676, making up 49.4%).
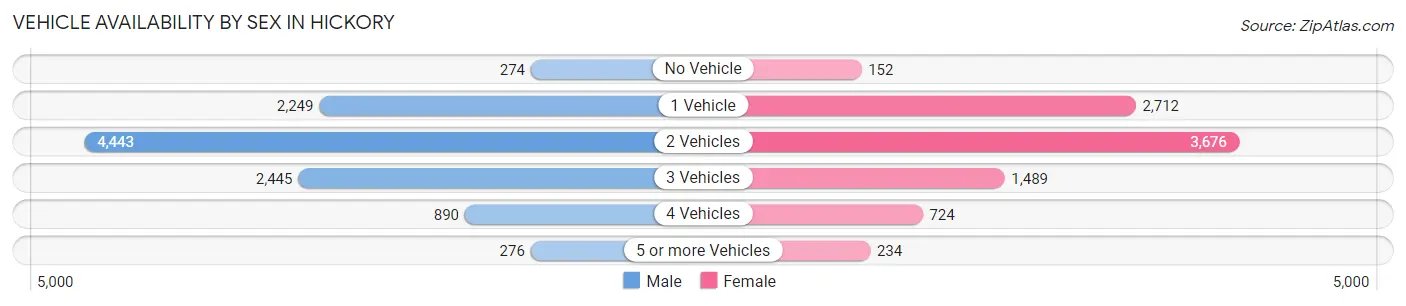
| Vehicles Available | Male | Female |
| No Vehicle | 274 (2.6%) | 152 (1.7%) |
| 1 Vehicle | 2,249 (21.3%) | 2,712 (30.2%) |
| 2 Vehicles | 4,443 (42.0%) | 3,676 (40.9%) |
| 3 Vehicles | 2,445 (23.1%) | 1,489 (16.6%) |
| 4 Vehicles | 890 (8.4%) | 724 (8.1%) |
| 5 or more Vehicles | 276 (2.6%) | 234 (2.6%) |
| Total | 10,577 (100.0%) | 8,987 (100.0%) |
Commute Time in Hickory
The most frequently occuring commute durations in Hickory are 10 to 14 minutes (3,996 commuters, 22.4%), 15 to 19 minutes (3,669 commuters, 20.6%), and 5 to 9 minutes (3,004 commuters, 16.8%).
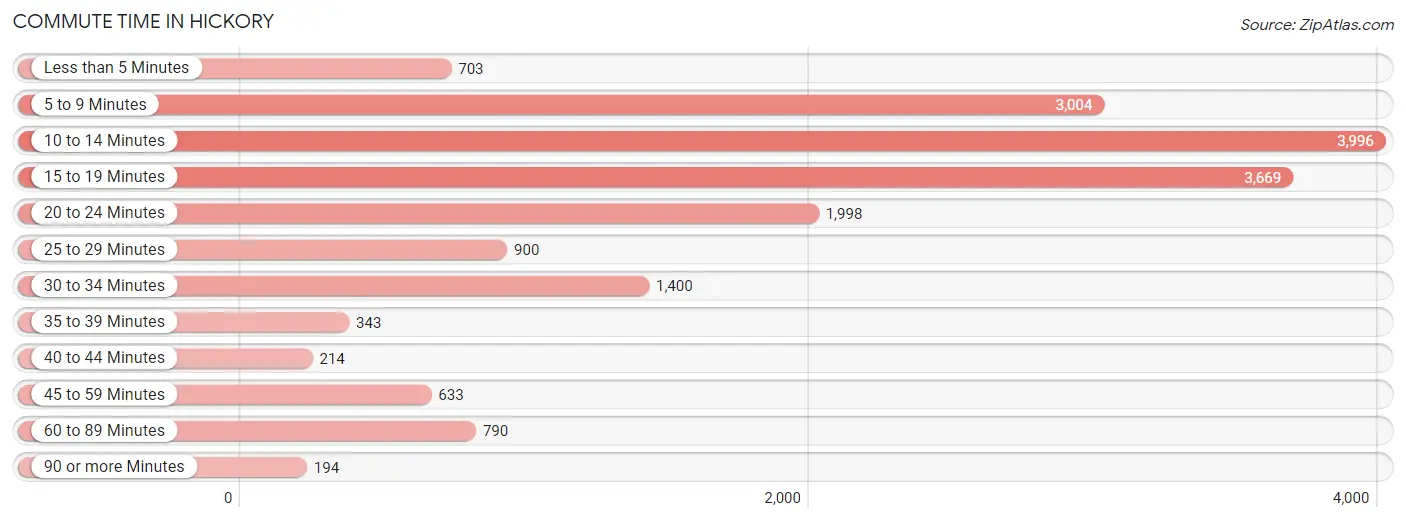
| Commute Time | # Commuters | % Commuters |
| Less than 5 Minutes | 703 | 3.9% |
| 5 to 9 Minutes | 3,004 | 16.8% |
| 10 to 14 Minutes | 3,996 | 22.4% |
| 15 to 19 Minutes | 3,669 | 20.6% |
| 20 to 24 Minutes | 1,998 | 11.2% |
| 25 to 29 Minutes | 900 | 5.0% |
| 30 to 34 Minutes | 1,400 | 7.9% |
| 35 to 39 Minutes | 343 | 1.9% |
| 40 to 44 Minutes | 214 | 1.2% |
| 45 to 59 Minutes | 633 | 3.5% |
| 60 to 89 Minutes | 790 | 4.4% |
| 90 or more Minutes | 194 | 1.1% |
Commute Time by Sex in Hickory
The most common commute times in Hickory are 10 to 14 minutes (2,320 commuters, 23.9%) for males and 5 to 9 minutes (1,871 commuters, 22.9%) for females.
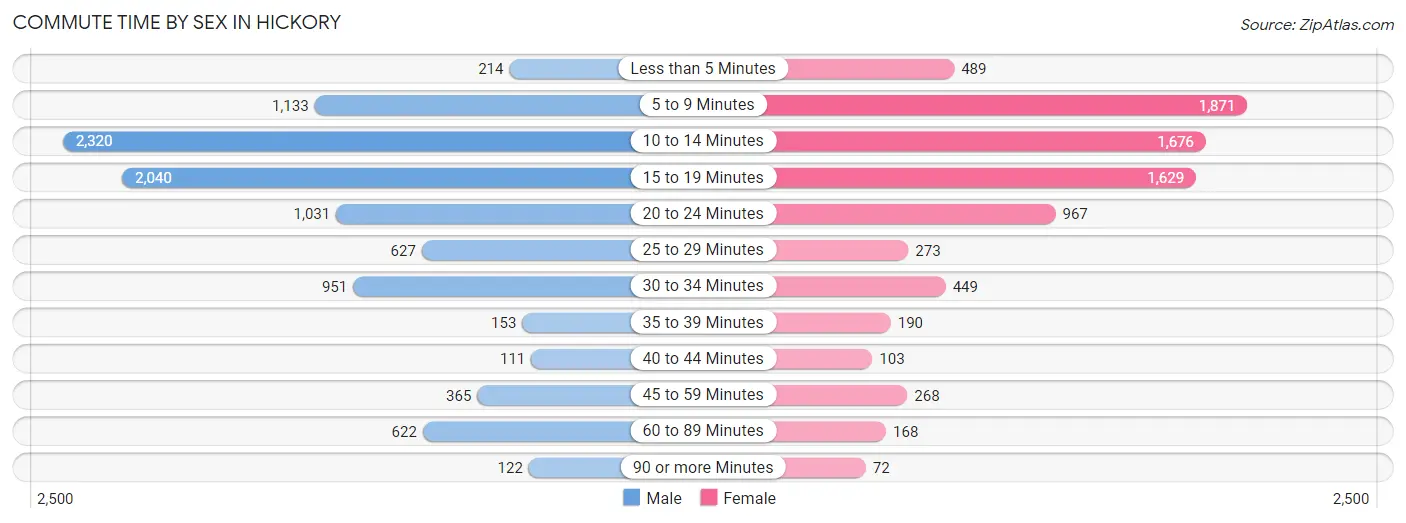
| Commute Time | Male | Female |
| Less than 5 Minutes | 214 (2.2%) | 489 (6.0%) |
| 5 to 9 Minutes | 1,133 (11.7%) | 1,871 (22.9%) |
| 10 to 14 Minutes | 2,320 (23.9%) | 1,676 (20.5%) |
| 15 to 19 Minutes | 2,040 (21.0%) | 1,629 (20.0%) |
| 20 to 24 Minutes | 1,031 (10.6%) | 967 (11.9%) |
| 25 to 29 Minutes | 627 (6.5%) | 273 (3.4%) |
| 30 to 34 Minutes | 951 (9.8%) | 449 (5.5%) |
| 35 to 39 Minutes | 153 (1.6%) | 190 (2.3%) |
| 40 to 44 Minutes | 111 (1.1%) | 103 (1.3%) |
| 45 to 59 Minutes | 365 (3.8%) | 268 (3.3%) |
| 60 to 89 Minutes | 622 (6.4%) | 168 (2.1%) |
| 90 or more Minutes | 122 (1.3%) | 72 (0.9%) |
Time of Departure to Work by Sex in Hickory
The most frequent times of departure to work in Hickory are 7:00 AM to 7:29 AM (1,543, 15.9%) for males and 7:00 AM to 7:29 AM (1,388, 17.0%) for females.
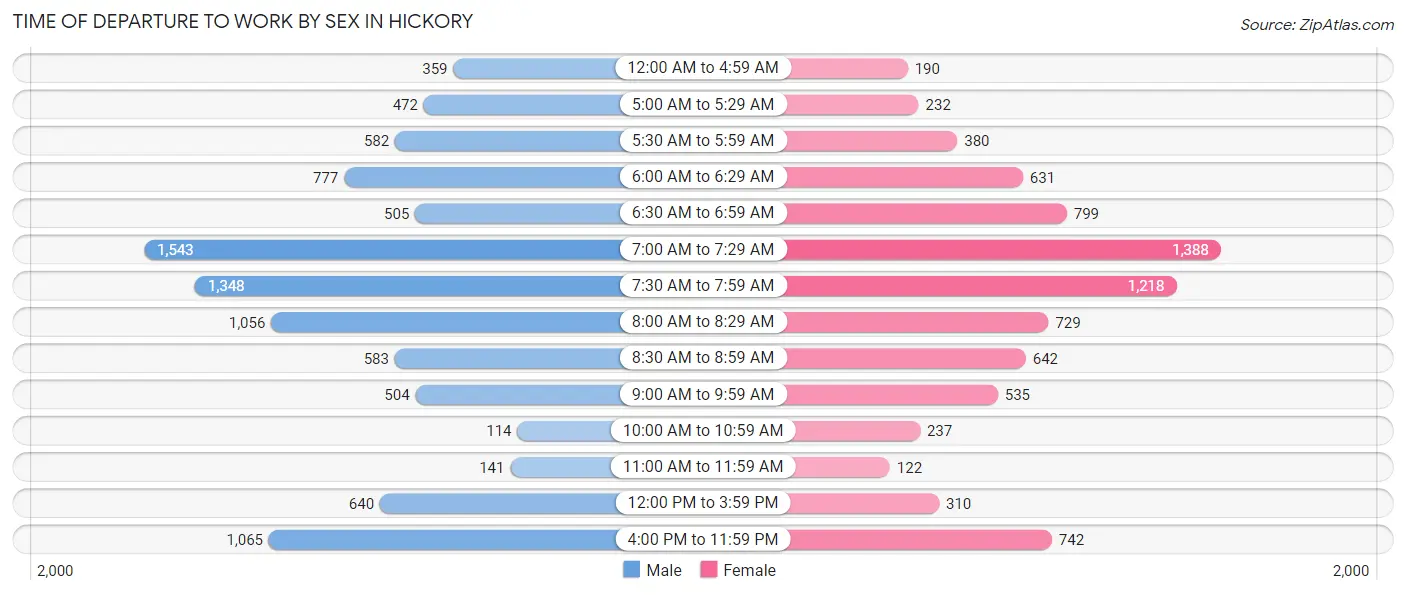
| Time of Departure | Male | Female |
| 12:00 AM to 4:59 AM | 359 (3.7%) | 190 (2.3%) |
| 5:00 AM to 5:29 AM | 472 (4.9%) | 232 (2.8%) |
| 5:30 AM to 5:59 AM | 582 (6.0%) | 380 (4.7%) |
| 6:00 AM to 6:29 AM | 777 (8.0%) | 631 (7.7%) |
| 6:30 AM to 6:59 AM | 505 (5.2%) | 799 (9.8%) |
| 7:00 AM to 7:29 AM | 1,543 (15.9%) | 1,388 (17.0%) |
| 7:30 AM to 7:59 AM | 1,348 (13.9%) | 1,218 (14.9%) |
| 8:00 AM to 8:29 AM | 1,056 (10.9%) | 729 (8.9%) |
| 8:30 AM to 8:59 AM | 583 (6.0%) | 642 (7.9%) |
| 9:00 AM to 9:59 AM | 504 (5.2%) | 535 (6.6%) |
| 10:00 AM to 10:59 AM | 114 (1.2%) | 237 (2.9%) |
| 11:00 AM to 11:59 AM | 141 (1.5%) | 122 (1.5%) |
| 12:00 PM to 3:59 PM | 640 (6.6%) | 310 (3.8%) |
| 4:00 PM to 11:59 PM | 1,065 (11.0%) | 742 (9.1%) |
| Total | 9,689 (100.0%) | 8,155 (100.0%) |
Housing Occupancy in Hickory
Occupancy by Ownership in Hickory
Of the total 17,663 dwellings in Hickory, owner-occupied units account for 9,475 (53.6%), while renter-occupied units make up 8,188 (46.4%).
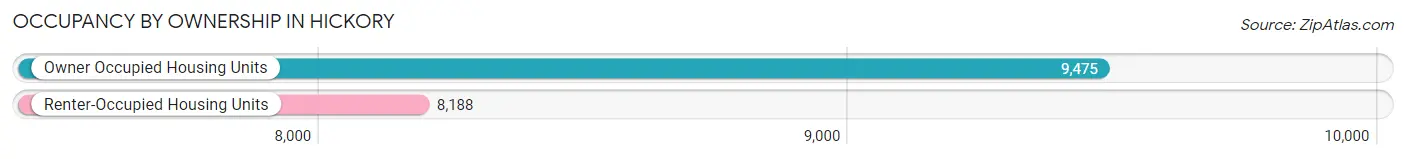
| Occupancy | # Housing Units | % Housing Units |
| Owner Occupied Housing Units | 9,475 | 53.6% |
| Renter-Occupied Housing Units | 8,188 | 46.4% |
| Total Occupied Housing Units | 17,663 | 100.0% |
Occupancy by Household Size in Hickory
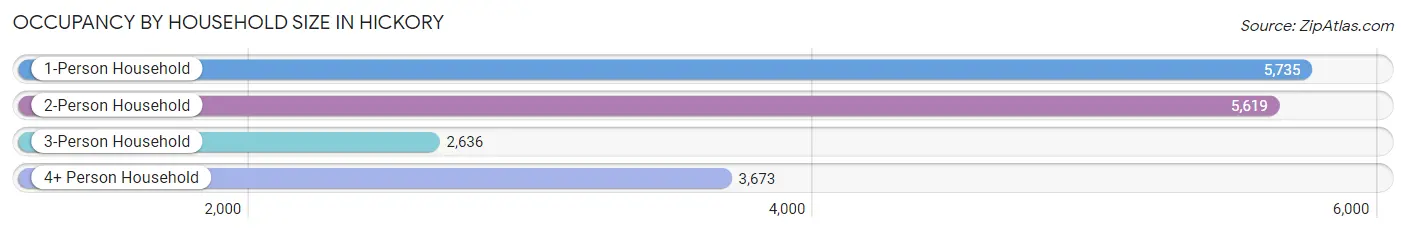
| Household Size | # Housing Units | % Housing Units |
| 1-Person Household | 5,735 | 32.5% |
| 2-Person Household | 5,619 | 31.8% |
| 3-Person Household | 2,636 | 14.9% |
| 4+ Person Household | 3,673 | 20.8% |
| Total Housing Units | 17,663 | 100.0% |
Occupancy by Ownership by Household Size in Hickory
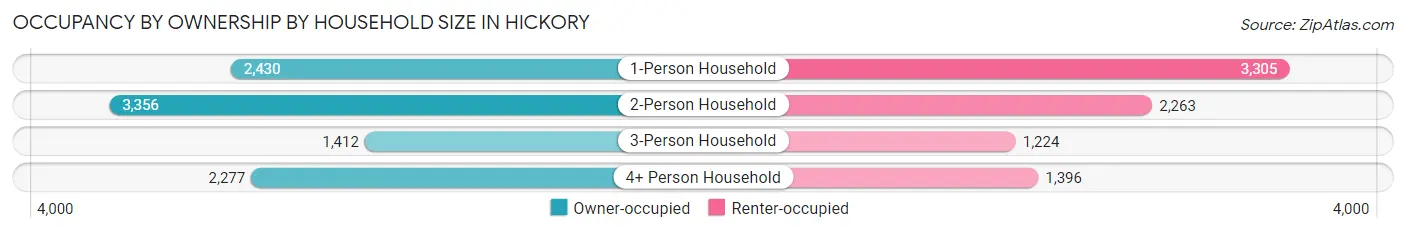
| Household Size | Owner-occupied | Renter-occupied |
| 1-Person Household | 2,430 (42.4%) | 3,305 (57.6%) |
| 2-Person Household | 3,356 (59.7%) | 2,263 (40.3%) |
| 3-Person Household | 1,412 (53.6%) | 1,224 (46.4%) |
| 4+ Person Household | 2,277 (62.0%) | 1,396 (38.0%) |
| Total Housing Units | 9,475 (53.6%) | 8,188 (46.4%) |
Occupancy by Educational Attainment in Hickory
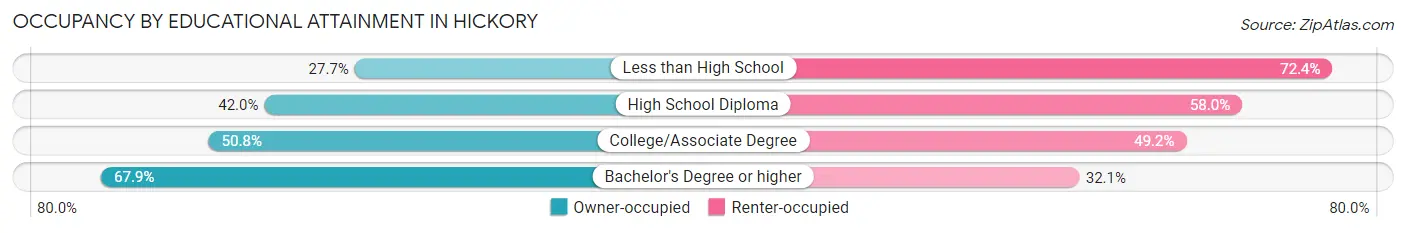
| Household Size | Owner-occupied | Renter-occupied |
| Less than High School | 399 (27.7%) | 1,044 (72.4%) |
| High School Diploma | 1,640 (42.0%) | 2,267 (58.0%) |
| College/Associate Degree | 2,739 (50.8%) | 2,652 (49.2%) |
| Bachelor's Degree or higher | 4,697 (67.9%) | 2,225 (32.1%) |
Occupancy by Age of Householder in Hickory
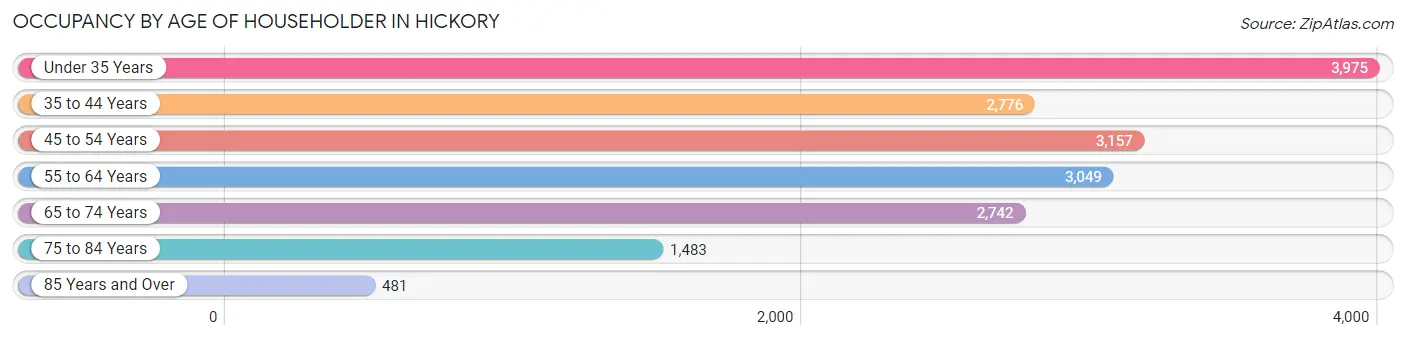
| Age Bracket | # Households | % Households |
| Under 35 Years | 3,975 | 22.5% |
| 35 to 44 Years | 2,776 | 15.7% |
| 45 to 54 Years | 3,157 | 17.9% |
| 55 to 64 Years | 3,049 | 17.3% |
| 65 to 74 Years | 2,742 | 15.5% |
| 75 to 84 Years | 1,483 | 8.4% |
| 85 Years and Over | 481 | 2.7% |
| Total | 17,663 | 100.0% |
Housing Finances in Hickory
Median Income by Occupancy in Hickory
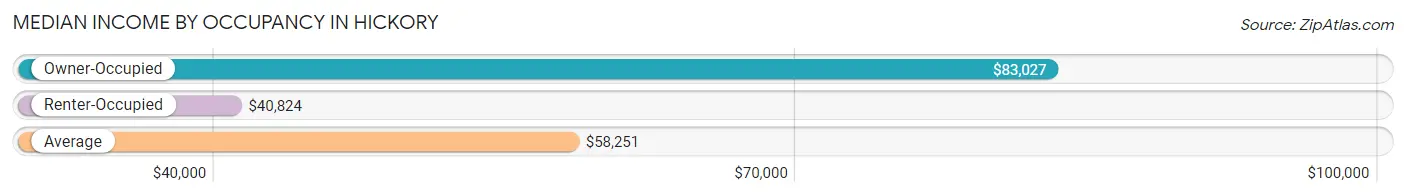
| Occupancy Type | # Households | Median Income |
| Owner-Occupied | 9,475 (53.6%) | $83,027 |
| Renter-Occupied | 8,188 (46.4%) | $40,824 |
| Average | 17,663 (100.0%) | $58,251 |
Occupancy by Householder Income Bracket in Hickory
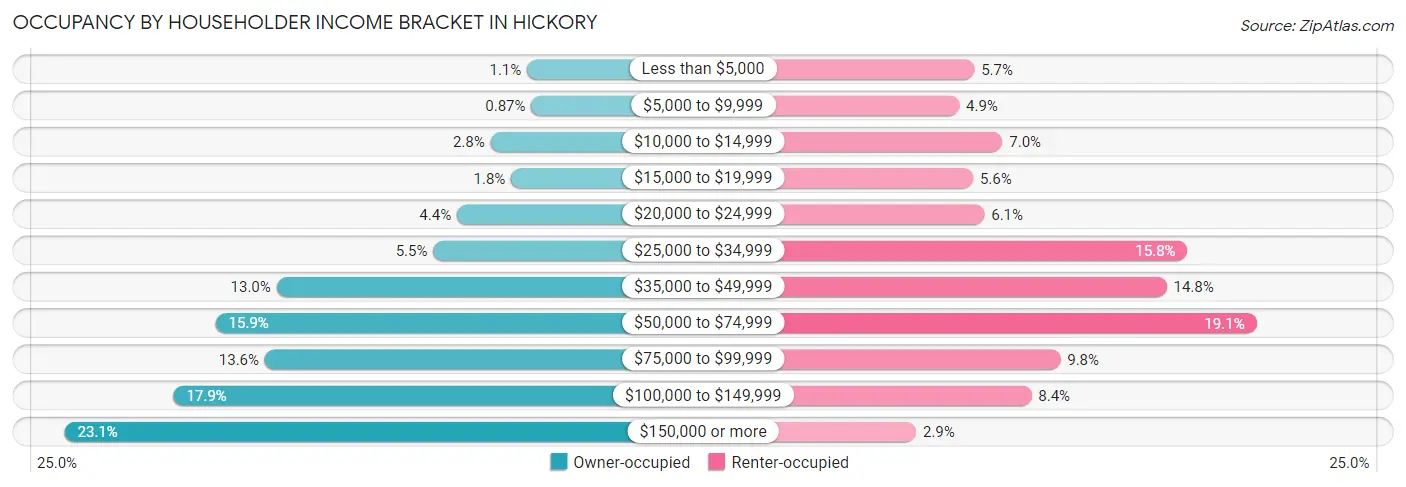
| Income Bracket | Owner-occupied | Renter-occupied |
| Less than $5,000 | 101 (1.1%) | 463 (5.7%) |
| $5,000 to $9,999 | 82 (0.9%) | 404 (4.9%) |
| $10,000 to $14,999 | 266 (2.8%) | 572 (7.0%) |
| $15,000 to $19,999 | 173 (1.8%) | 458 (5.6%) |
| $20,000 to $24,999 | 418 (4.4%) | 502 (6.1%) |
| $25,000 to $34,999 | 525 (5.5%) | 1,294 (15.8%) |
| $35,000 to $49,999 | 1,232 (13.0%) | 1,213 (14.8%) |
| $50,000 to $74,999 | 1,507 (15.9%) | 1,563 (19.1%) |
| $75,000 to $99,999 | 1,285 (13.6%) | 798 (9.8%) |
| $100,000 to $149,999 | 1,697 (17.9%) | 685 (8.4%) |
| $150,000 or more | 2,189 (23.1%) | 236 (2.9%) |
| Total | 9,475 (100.0%) | 8,188 (100.0%) |
Monthly Housing Cost Tiers in Hickory
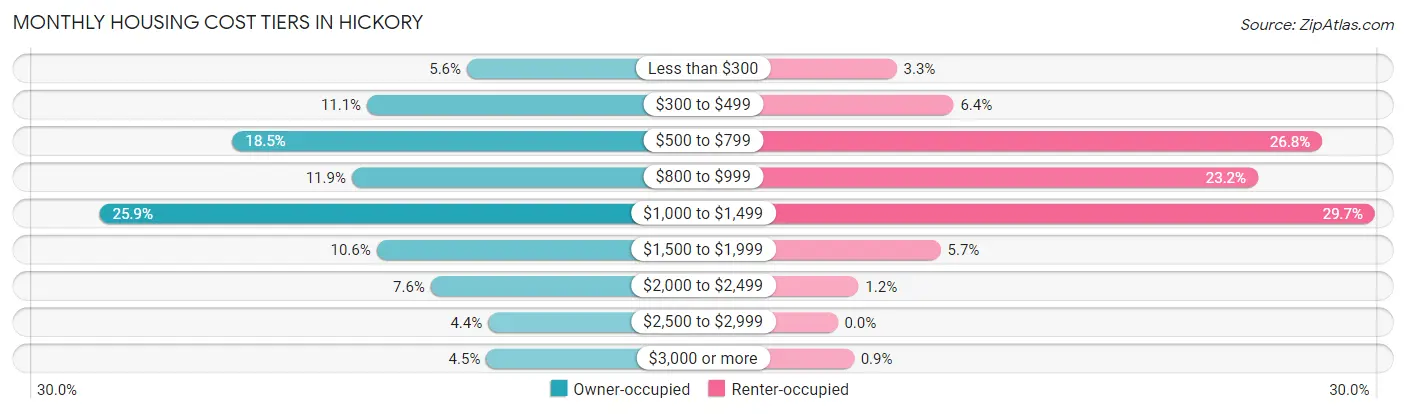
| Monthly Cost | Owner-occupied | Renter-occupied |
| Less than $300 | 528 (5.6%) | 268 (3.3%) |
| $300 to $499 | 1,051 (11.1%) | 525 (6.4%) |
| $500 to $799 | 1,755 (18.5%) | 2,192 (26.8%) |
| $800 to $999 | 1,130 (11.9%) | 1,901 (23.2%) |
| $1,000 to $1,499 | 2,450 (25.9%) | 2,430 (29.7%) |
| $1,500 to $1,999 | 1,001 (10.6%) | 467 (5.7%) |
| $2,000 to $2,499 | 717 (7.6%) | 95 (1.2%) |
| $2,500 to $2,999 | 417 (4.4%) | 0 (0.0%) |
| $3,000 or more | 426 (4.5%) | 74 (0.9%) |
| Total | 9,475 (100.0%) | 8,188 (100.0%) |
Physical Housing Characteristics in Hickory
Housing Structures in Hickory
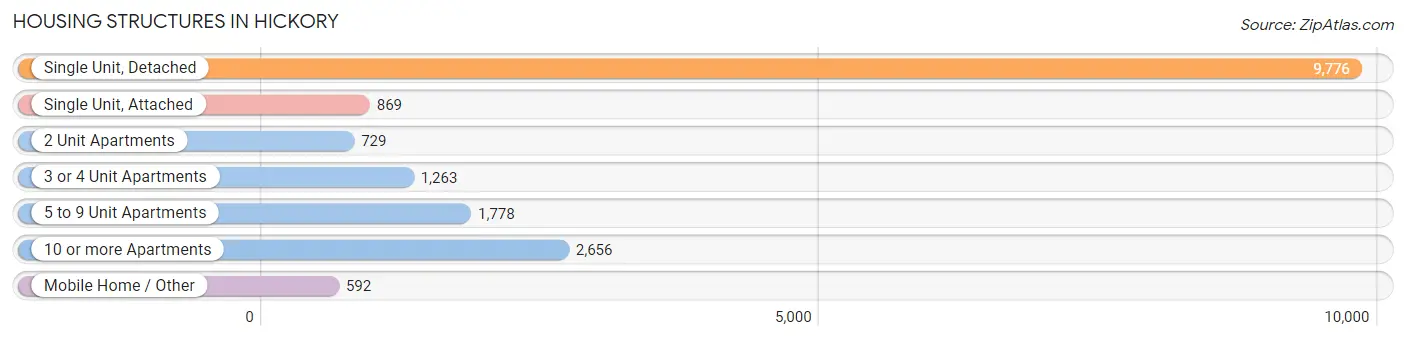
| Structure Type | # Housing Units | % Housing Units |
| Single Unit, Detached | 9,776 | 55.3% |
| Single Unit, Attached | 869 | 4.9% |
| 2 Unit Apartments | 729 | 4.1% |
| 3 or 4 Unit Apartments | 1,263 | 7.1% |
| 5 to 9 Unit Apartments | 1,778 | 10.1% |
| 10 or more Apartments | 2,656 | 15.0% |
| Mobile Home / Other | 592 | 3.4% |
| Total | 17,663 | 100.0% |
Housing Structures by Occupancy in Hickory
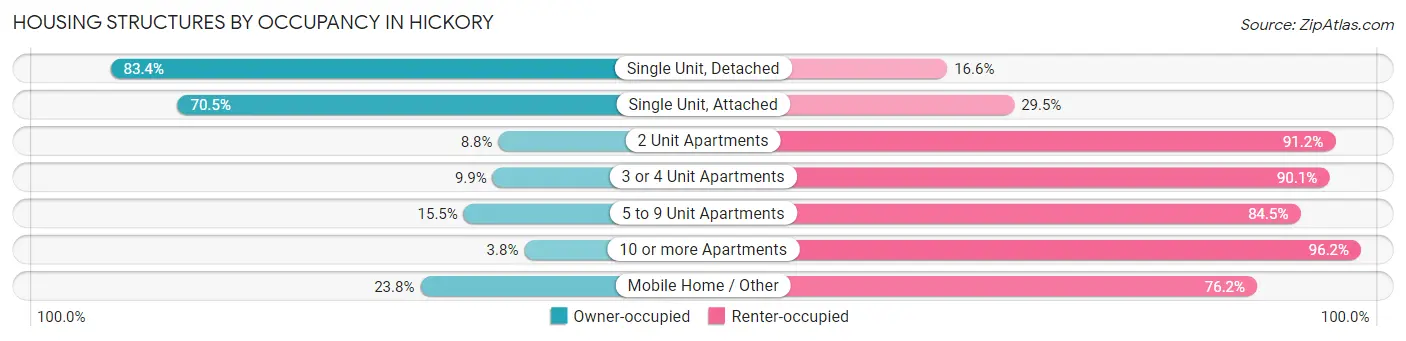
| Structure Type | Owner-occupied | Renter-occupied |
| Single Unit, Detached | 8,156 (83.4%) | 1,620 (16.6%) |
| Single Unit, Attached | 613 (70.5%) | 256 (29.5%) |
| 2 Unit Apartments | 64 (8.8%) | 665 (91.2%) |
| 3 or 4 Unit Apartments | 125 (9.9%) | 1,138 (90.1%) |
| 5 to 9 Unit Apartments | 275 (15.5%) | 1,503 (84.5%) |
| 10 or more Apartments | 101 (3.8%) | 2,555 (96.2%) |
| Mobile Home / Other | 141 (23.8%) | 451 (76.2%) |
| Total | 9,475 (53.6%) | 8,188 (46.4%) |
Housing Structures by Number of Rooms in Hickory
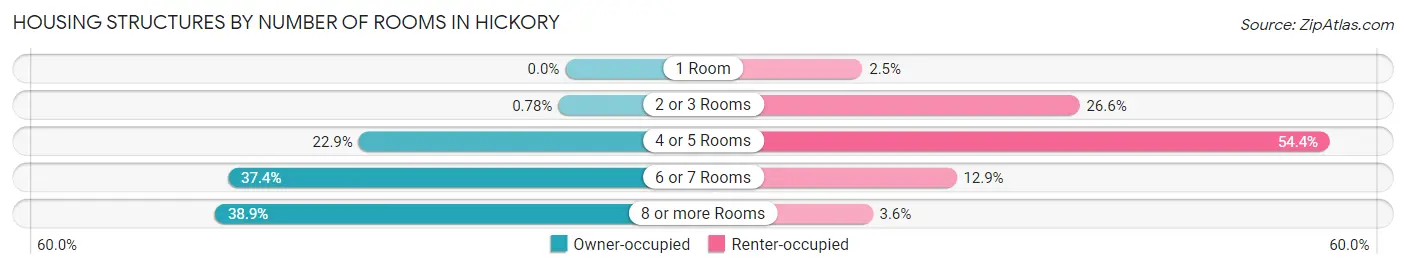
| Number of Rooms | Owner-occupied | Renter-occupied |
| 1 Room | 0 (0.0%) | 203 (2.5%) |
| 2 or 3 Rooms | 74 (0.8%) | 2,177 (26.6%) |
| 4 or 5 Rooms | 2,173 (22.9%) | 4,453 (54.4%) |
| 6 or 7 Rooms | 3,545 (37.4%) | 1,059 (12.9%) |
| 8 or more Rooms | 3,683 (38.9%) | 296 (3.6%) |
| Total | 9,475 (100.0%) | 8,188 (100.0%) |
Housing Structure by Heating Type in Hickory
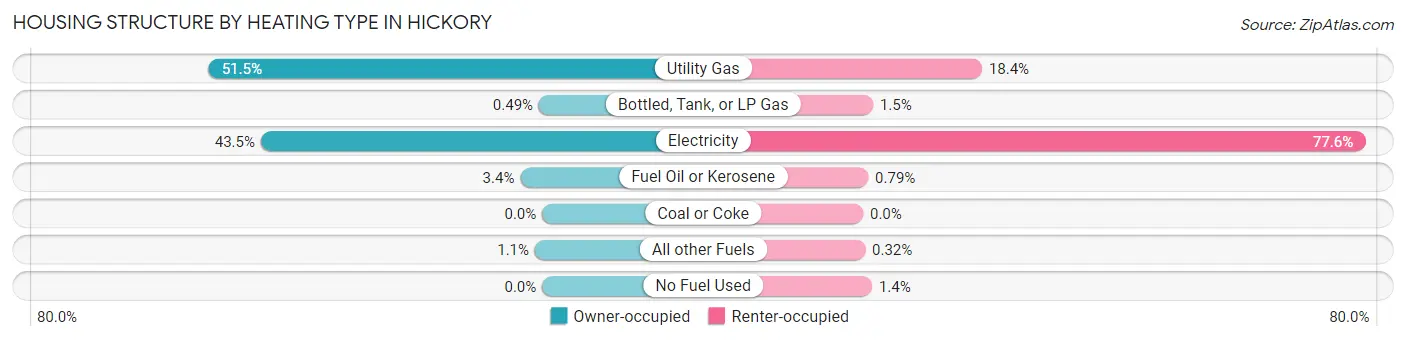
| Heating Type | Owner-occupied | Renter-occupied |
| Utility Gas | 4,882 (51.5%) | 1,505 (18.4%) |
| Bottled, Tank, or LP Gas | 46 (0.5%) | 125 (1.5%) |
| Electricity | 4,121 (43.5%) | 6,354 (77.6%) |
| Fuel Oil or Kerosene | 320 (3.4%) | 65 (0.8%) |
| Coal or Coke | 0 (0.0%) | 0 (0.0%) |
| All other Fuels | 106 (1.1%) | 26 (0.3%) |
| No Fuel Used | 0 (0.0%) | 113 (1.4%) |
| Total | 9,475 (100.0%) | 8,188 (100.0%) |
Household Vehicle Usage in Hickory
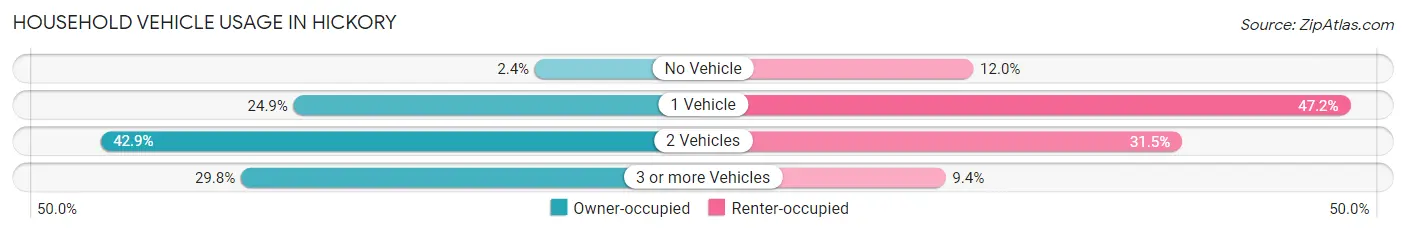
| Vehicles per Household | Owner-occupied | Renter-occupied |
| No Vehicle | 224 (2.4%) | 980 (12.0%) |
| 1 Vehicle | 2,358 (24.9%) | 3,863 (47.2%) |
| 2 Vehicles | 4,069 (42.9%) | 2,577 (31.5%) |
| 3 or more Vehicles | 2,824 (29.8%) | 768 (9.4%) |
| Total | 9,475 (100.0%) | 8,188 (100.0%) |
Real Estate & Mortgages in Hickory
Real Estate and Mortgage Overview in Hickory
| Characteristic | Without Mortgage | With Mortgage |
| Housing Units | 3,231 | 6,244 |
| Median Property Value | $246,400 | $230,000 |
| Median Household Income | $59,057 | $1,525 |
| Monthly Housing Costs | $511 | $426 |
| Real Estate Taxes | $2,076 | $32 |
Property Value by Mortgage Status in Hickory
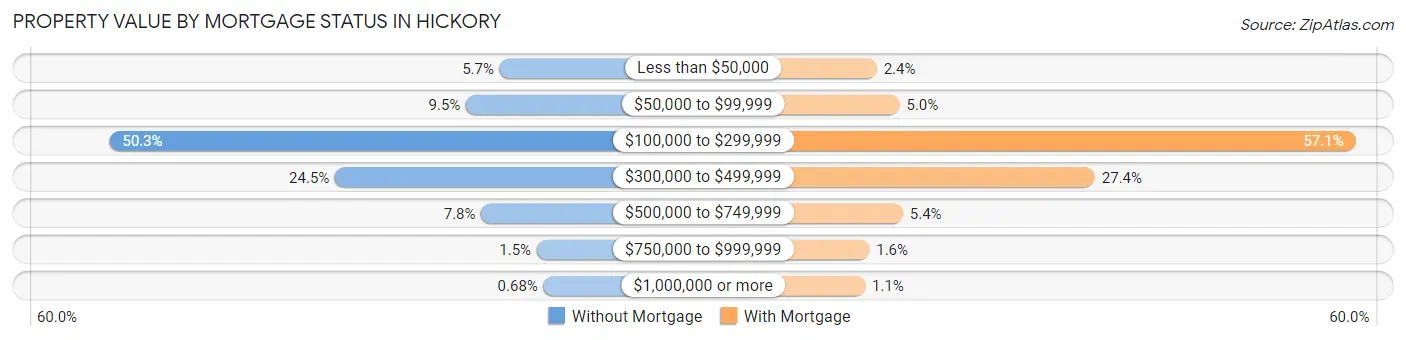
| Property Value | Without Mortgage | With Mortgage |
| Less than $50,000 | 184 (5.7%) | 151 (2.4%) |
| $50,000 to $99,999 | 308 (9.5%) | 314 (5.0%) |
| $100,000 to $299,999 | 1,626 (50.3%) | 3,567 (57.1%) |
| $300,000 to $499,999 | 792 (24.5%) | 1,708 (27.4%) |
| $500,000 to $749,999 | 252 (7.8%) | 338 (5.4%) |
| $750,000 to $999,999 | 47 (1.5%) | 98 (1.6%) |
| $1,000,000 or more | 22 (0.7%) | 68 (1.1%) |
| Total | 3,231 (100.0%) | 6,244 (100.0%) |
Household Income by Mortgage Status in Hickory
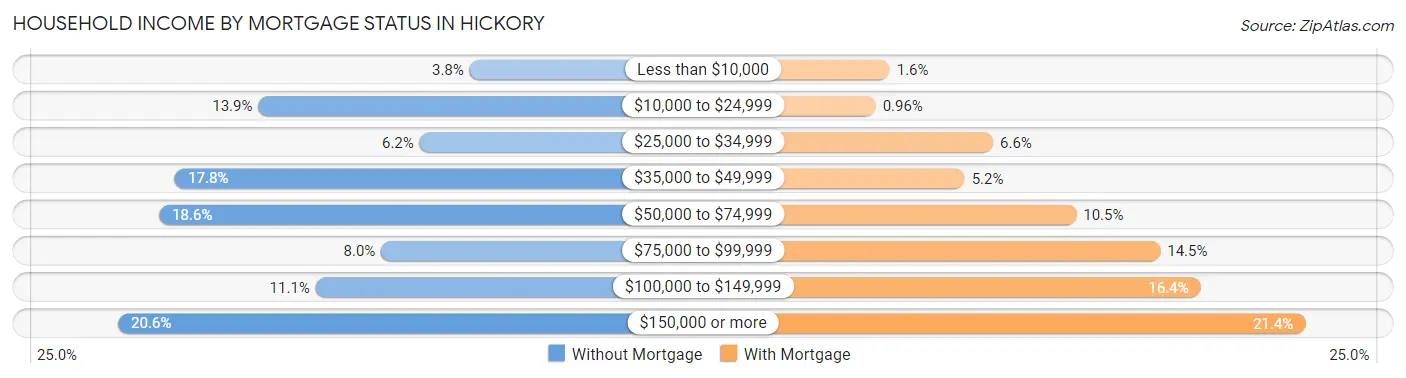
| Household Income | Without Mortgage | With Mortgage |
| Less than $10,000 | 123 (3.8%) | 102 (1.6%) |
| $10,000 to $24,999 | 448 (13.9%) | 60 (1.0%) |
| $25,000 to $34,999 | 200 (6.2%) | 409 (6.6%) |
| $35,000 to $49,999 | 576 (17.8%) | 325 (5.2%) |
| $50,000 to $74,999 | 601 (18.6%) | 656 (10.5%) |
| $75,000 to $99,999 | 259 (8.0%) | 906 (14.5%) |
| $100,000 to $149,999 | 360 (11.1%) | 1,026 (16.4%) |
| $150,000 or more | 664 (20.5%) | 1,337 (21.4%) |
| Total | 3,231 (100.0%) | 6,244 (100.0%) |
Property Value to Household Income Ratio in Hickory
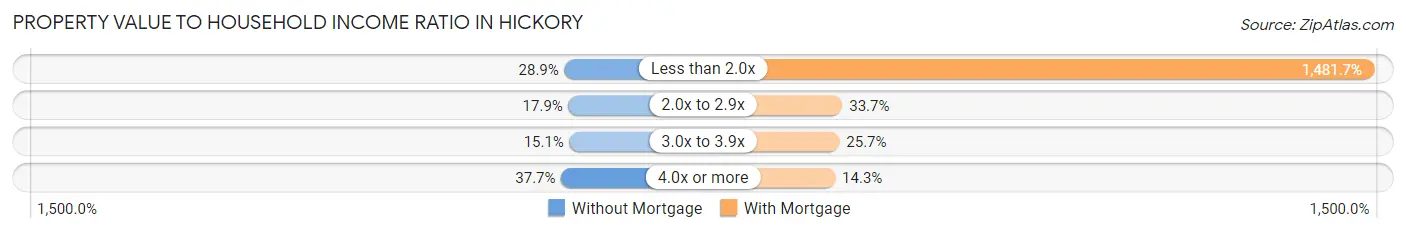
| Value-to-Income Ratio | Without Mortgage | With Mortgage |
| Less than 2.0x | 933 (28.9%) | 92,519 (1,481.7%) |
| 2.0x to 2.9x | 578 (17.9%) | 2,105 (33.7%) |
| 3.0x to 3.9x | 487 (15.1%) | 1,604 (25.7%) |
| 4.0x or more | 1,219 (37.7%) | 891 (14.3%) |
| Total | 3,231 (100.0%) | 6,244 (100.0%) |
Real Estate Taxes by Mortgage Status in Hickory
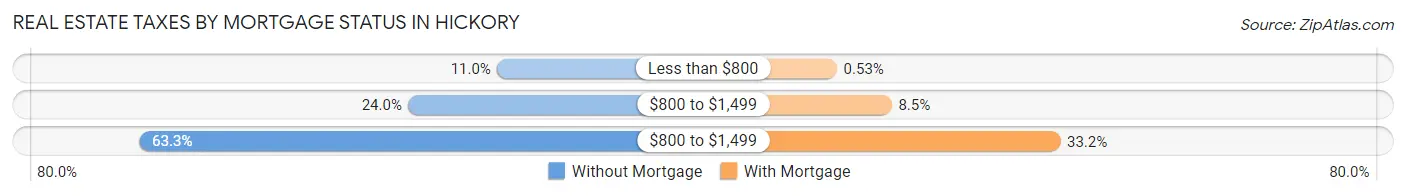
| Property Taxes | Without Mortgage | With Mortgage |
| Less than $800 | 356 (11.0%) | 33 (0.5%) |
| $800 to $1,499 | 776 (24.0%) | 533 (8.5%) |
| $800 to $1,499 | 2,044 (63.3%) | 2,071 (33.2%) |
| Total | 3,231 (100.0%) | 6,244 (100.0%) |
Health & Disability in Hickory
Health Insurance Coverage by Age in Hickory
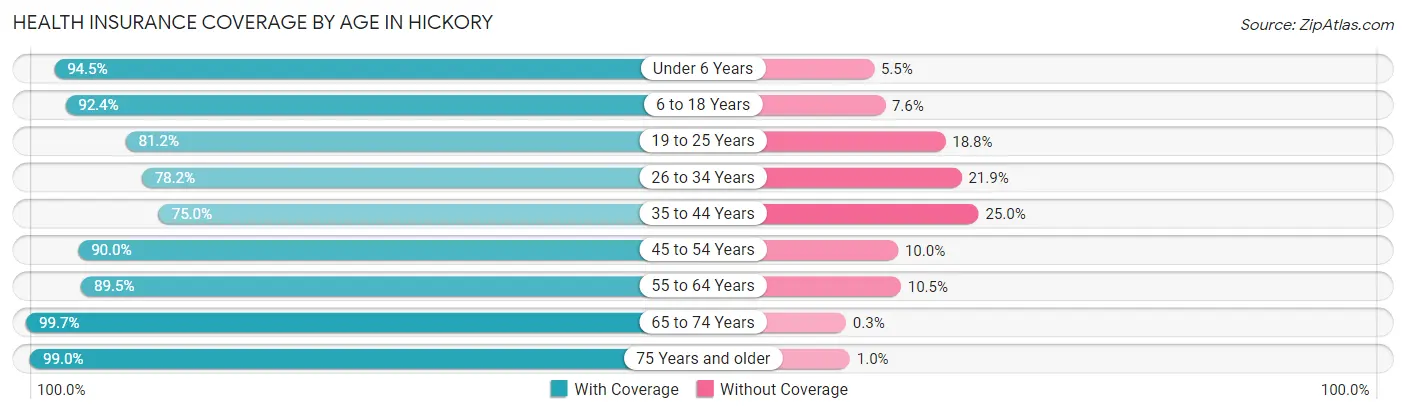
| Age Bracket | With Coverage | Without Coverage |
| Under 6 Years | 2,411 (94.5%) | 141 (5.5%) |
| 6 to 18 Years | 6,741 (92.4%) | 554 (7.6%) |
| 19 to 25 Years | 4,030 (81.2%) | 935 (18.8%) |
| 26 to 34 Years | 4,185 (78.1%) | 1,170 (21.8%) |
| 35 to 44 Years | 3,722 (75.0%) | 1,243 (25.0%) |
| 45 to 54 Years | 5,095 (90.0%) | 567 (10.0%) |
| 55 to 64 Years | 4,461 (89.5%) | 525 (10.5%) |
| 65 to 74 Years | 4,039 (99.7%) | 12 (0.3%) |
| 75 Years and older | 2,857 (99.0%) | 30 (1.0%) |
| Total | 37,541 (87.9%) | 5,177 (12.1%) |
Health Insurance Coverage by Citizenship Status in Hickory
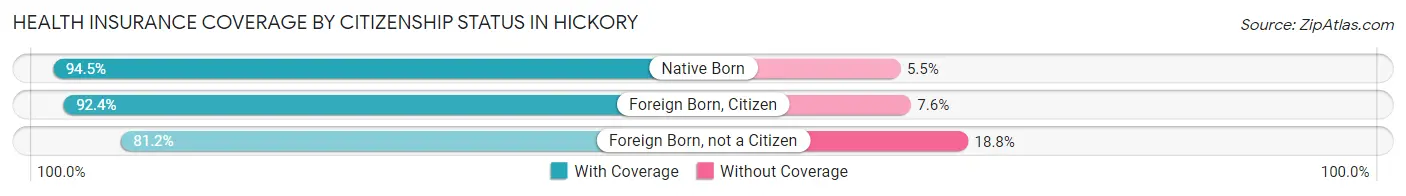
| Citizenship Status | With Coverage | Without Coverage |
| Native Born | 2,411 (94.5%) | 141 (5.5%) |
| Foreign Born, Citizen | 6,741 (92.4%) | 554 (7.6%) |
| Foreign Born, not a Citizen | 4,030 (81.2%) | 935 (18.8%) |
Health Insurance Coverage by Household Income in Hickory
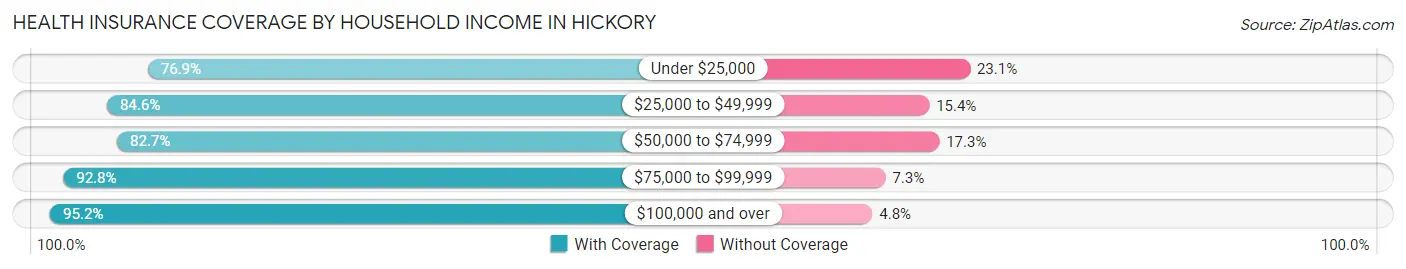
| Household Income | With Coverage | Without Coverage |
| Under $25,000 | 4,599 (76.9%) | 1,380 (23.1%) |
| $25,000 to $49,999 | 7,279 (84.6%) | 1,329 (15.4%) |
| $50,000 to $74,999 | 6,270 (82.7%) | 1,313 (17.3%) |
| $75,000 to $99,999 | 4,618 (92.7%) | 361 (7.2%) |
| $100,000 and over | 13,895 (95.2%) | 699 (4.8%) |
Public vs Private Health Insurance Coverage by Age in Hickory

| Age Bracket | Public Insurance | Private Insurance |
| Under 6 | 1,380 (54.1%) | 1,127 (44.2%) |
| 6 to 18 Years | 3,190 (43.7%) | 3,719 (51.0%) |
| 19 to 25 Years | 488 (9.8%) | 3,656 (73.6%) |
| 25 to 34 Years | 556 (10.4%) | 3,862 (72.1%) |
| 35 to 44 Years | 543 (10.9%) | 3,279 (66.0%) |
| 45 to 54 Years | 684 (12.1%) | 4,589 (81.0%) |
| 55 to 64 Years | 1,074 (21.5%) | 3,745 (75.1%) |
| 65 to 74 Years | 3,865 (95.4%) | 2,199 (54.3%) |
| 75 Years and over | 2,847 (98.6%) | 1,873 (64.9%) |
| Total | 14,627 (34.2%) | 28,049 (65.7%) |
Disability Status by Sex by Age in Hickory
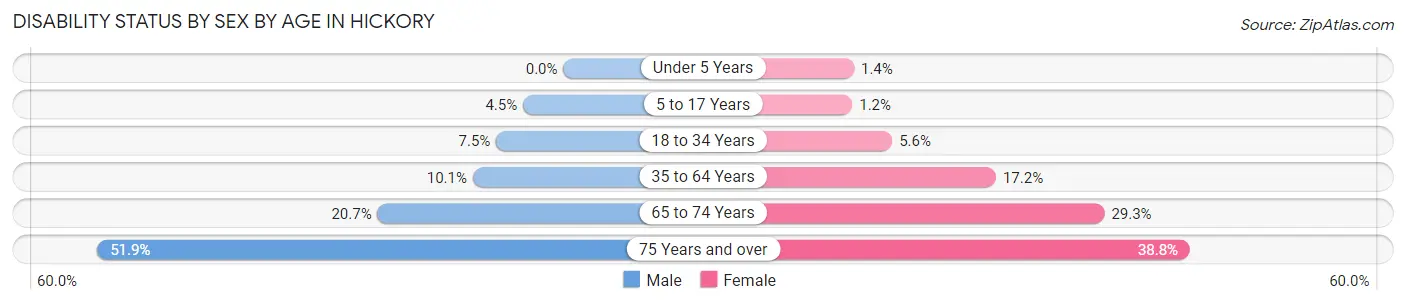
| Age Bracket | Male | Female |
| Under 5 Years | 0 (0.0%) | 16 (1.4%) |
| 5 to 17 Years | 169 (4.5%) | 38 (1.2%) |
| 18 to 34 Years | 403 (7.5%) | 323 (5.6%) |
| 35 to 64 Years | 769 (10.1%) | 1,371 (17.2%) |
| 65 to 74 Years | 416 (20.7%) | 597 (29.2%) |
| 75 Years and over | 611 (51.9%) | 663 (38.8%) |
Disability Class by Sex by Age in Hickory
Disability Class: Hearing Difficulty
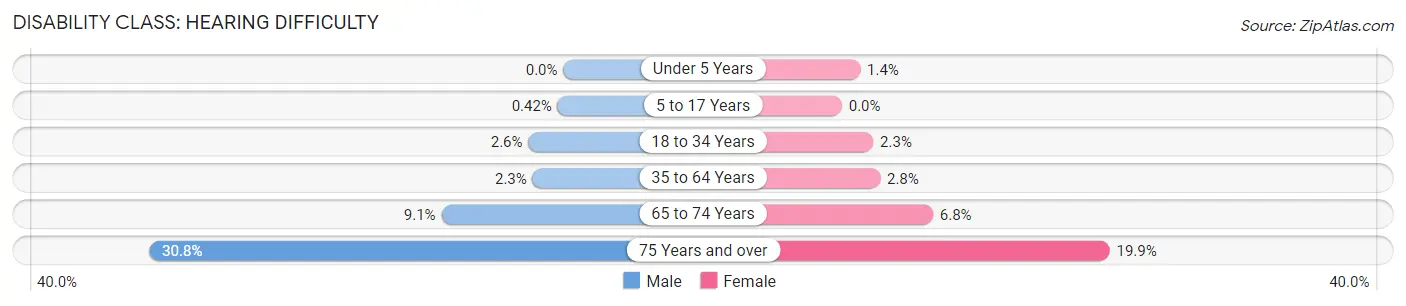
| Age Bracket | Male | Female |
| Under 5 Years | 0 (0.0%) | 16 (1.4%) |
| 5 to 17 Years | 16 (0.4%) | 0 (0.0%) |
| 18 to 34 Years | 140 (2.6%) | 134 (2.3%) |
| 35 to 64 Years | 174 (2.3%) | 227 (2.8%) |
| 65 to 74 Years | 182 (9.0%) | 138 (6.8%) |
| 75 Years and over | 362 (30.8%) | 340 (19.9%) |
Disability Class: Vision Difficulty
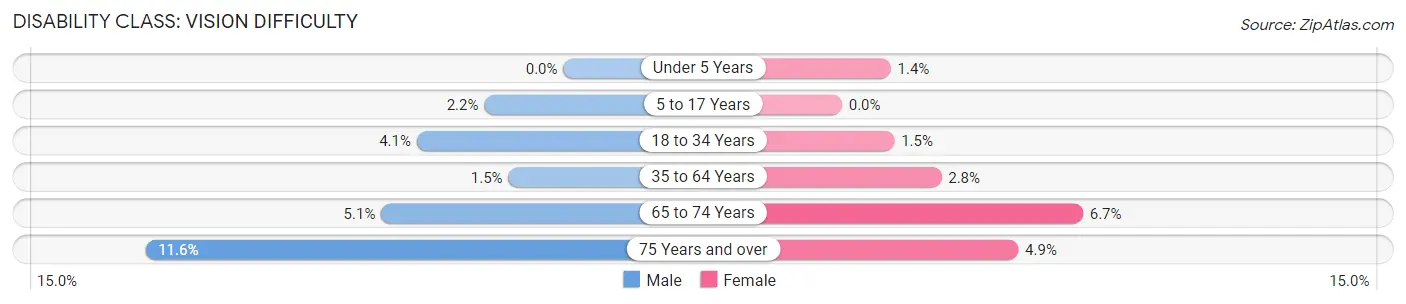
| Age Bracket | Male | Female |
| Under 5 Years | 0 (0.0%) | 16 (1.4%) |
| 5 to 17 Years | 83 (2.2%) | 0 (0.0%) |
| 18 to 34 Years | 220 (4.1%) | 84 (1.5%) |
| 35 to 64 Years | 117 (1.5%) | 221 (2.8%) |
| 65 to 74 Years | 102 (5.1%) | 137 (6.7%) |
| 75 Years and over | 137 (11.6%) | 84 (4.9%) |
Disability Class: Cognitive Difficulty
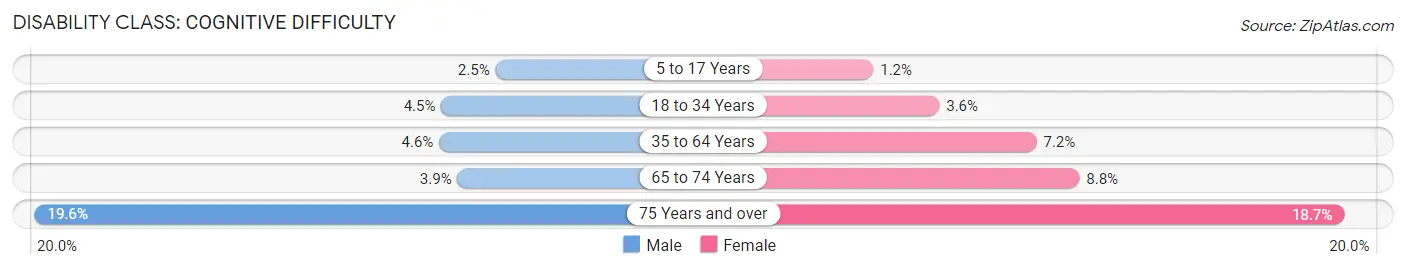
| Age Bracket | Male | Female |
| 5 to 17 Years | 95 (2.5%) | 38 (1.2%) |
| 18 to 34 Years | 244 (4.5%) | 208 (3.6%) |
| 35 to 64 Years | 352 (4.6%) | 577 (7.2%) |
| 65 to 74 Years | 79 (3.9%) | 180 (8.8%) |
| 75 Years and over | 231 (19.6%) | 319 (18.6%) |
Disability Class: Ambulatory Difficulty
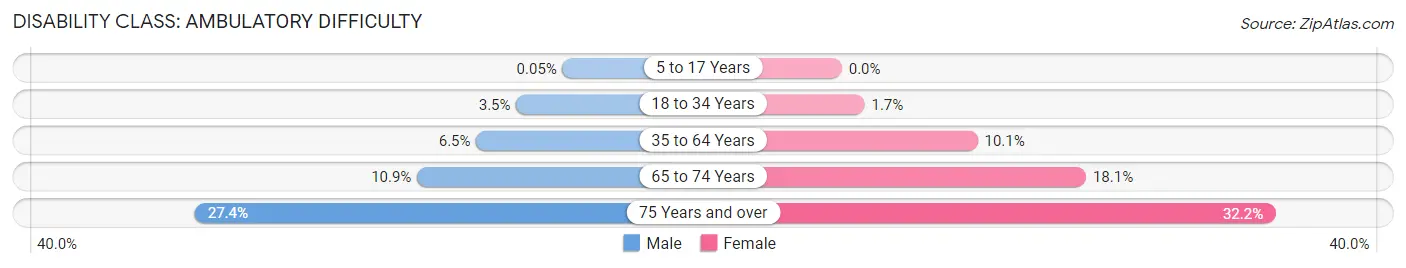
| Age Bracket | Male | Female |
| 5 to 17 Years | 2 (0.1%) | 0 (0.0%) |
| 18 to 34 Years | 188 (3.5%) | 97 (1.7%) |
| 35 to 64 Years | 493 (6.5%) | 805 (10.1%) |
| 65 to 74 Years | 218 (10.8%) | 370 (18.1%) |
| 75 Years and over | 322 (27.4%) | 550 (32.2%) |
Disability Class: Self-Care Difficulty
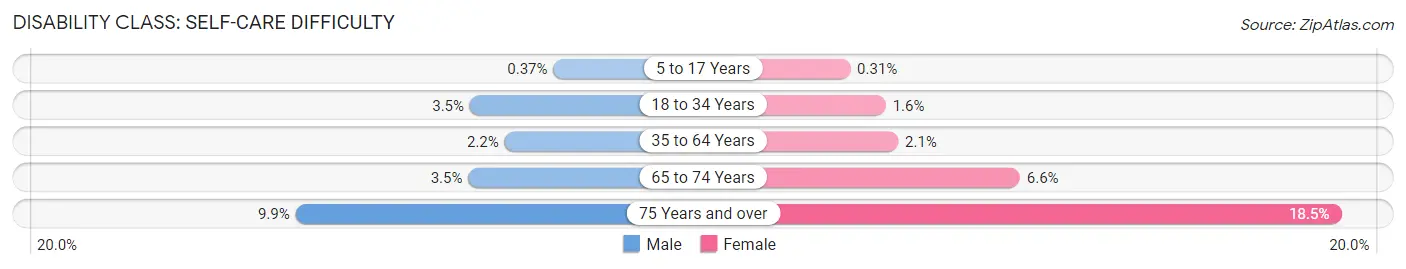
| Age Bracket | Male | Female |
| 5 to 17 Years | 14 (0.4%) | 10 (0.3%) |
| 18 to 34 Years | 187 (3.5%) | 94 (1.6%) |
| 35 to 64 Years | 166 (2.2%) | 167 (2.1%) |
| 65 to 74 Years | 71 (3.5%) | 135 (6.6%) |
| 75 Years and over | 117 (9.9%) | 317 (18.5%) |
Technology Access in Hickory
Computing Device Access in Hickory
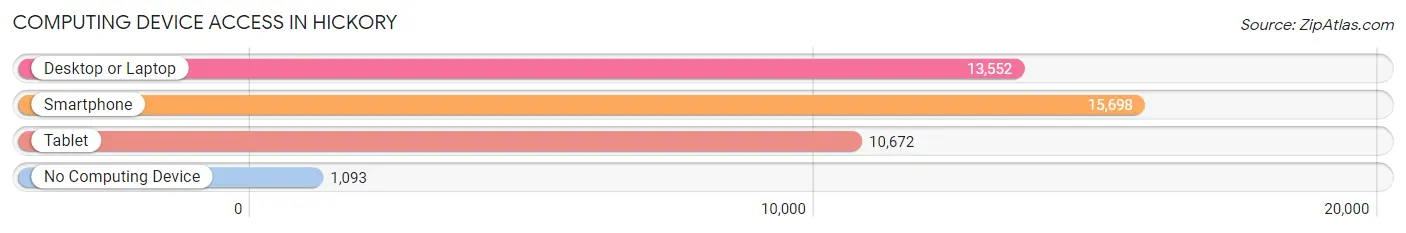
| Device Type | # Households | % Households |
| Desktop or Laptop | 13,552 | 76.7% |
| Smartphone | 15,698 | 88.9% |
| Tablet | 10,672 | 60.4% |
| No Computing Device | 1,093 | 6.2% |
| Total | 17,663 | 100.0% |
Internet Access in Hickory
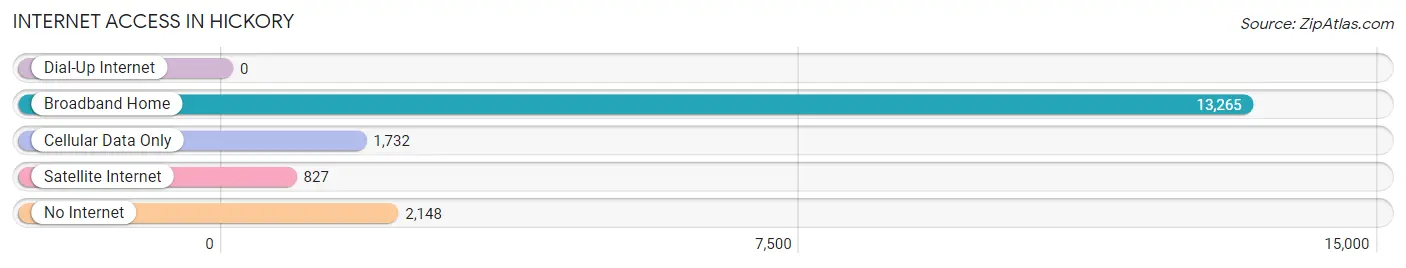
| Internet Type | # Households | % Households |
| Dial-Up Internet | 0 | 0.0% |
| Broadband Home | 13,265 | 75.1% |
| Cellular Data Only | 1,732 | 9.8% |
| Satellite Internet | 827 | 4.7% |
| No Internet | 2,148 | 12.2% |
| Total | 17,663 | 100.0% |
Hickory Summary
Hickory, North Carolina is a city located in Catawba County, North Carolina. It is the county seat of Catawba County and is located in the foothills of the Blue Ridge Mountains. The city is situated along the Catawba River and is part of the Hickory-Lenoir-Morganton Metropolitan Statistical Area. The city has a population of approximately 40,000 people and is the largest city in the county.
Geography
Hickory is located in the foothills of the Blue Ridge Mountains in western North Carolina. The city is situated along the Catawba River and is part of the Hickory-Lenoir-Morganton Metropolitan Statistical Area. The city is located at an elevation of 890 feet above sea level. The city has a total area of 24.2 square miles, of which 24.1 square miles is land and 0.1 square miles is water.
Climate
Hickory has a humid subtropical climate, with hot, humid summers and mild winters. The average annual temperature is 61.2°F, with an average high of 75.2°F and an average low of 47.2°F. The average annual precipitation is 45.2 inches, with an average of 4.2 inches of snowfall per year.
Demographics
As of the 2010 census, the population of Hickory was 40,010. The racial makeup of the city was 79.2% White, 14.7% African American, 0.3% Native American, 2.2% Asian, 0.1% Pacific Islander, 1.7% from other races, and 2.0% from two or more races. Hispanic or Latino of any race were 4.7% of the population.
Economy
Hickory is home to a variety of industries, including furniture manufacturing, textiles, and automotive parts. The city is also home to several major employers, including Corning, Inc., CommScope, and Continental Automotive Systems. The city is also home to several educational institutions, including Lenoir-Rhyne University, Catawba Valley Community College, and Appalachian State University.
History
Hickory was founded in 1849 by Henry Robinson, a Revolutionary War veteran. The city was named after the hickory trees that grew in the area. The city was incorporated in 1873 and was designated as the county seat of Catawba County in 1877.
In the late 19th century, Hickory was a major center for furniture manufacturing, and the city was known as the “Furniture Capital of the World.” The city was also home to several textile mills, and the city’s economy was largely based on these industries.
In the early 20th century, Hickory began to diversify its economy, and the city became home to several automotive parts manufacturers. The city also became home to several educational institutions, including Lenoir-Rhyne University, Catawba Valley Community College, and Appalachian State University.
Today, Hickory is a vibrant city with a diverse economy. The city is home to several major employers, including Corning, Inc., CommScope, and Continental Automotive Systems. The city is also home to a variety of cultural attractions, including the Hickory Museum of Art, the Hickory Community Theatre, and the Hickory Motor Speedway.
Common Questions
What is Per Capita Income in Hickory?
Per Capita income in Hickory is $35,340.
What is the Median Family Income in Hickory?
Median Family Income in Hickory is $75,298.
What is the Median Household income in Hickory?
Median Household Income in Hickory is $58,251.
What is Income or Wage Gap in Hickory?
Income or Wage Gap in Hickory is 27.6%.
Women in Hickory earn 72.4 cents for every dollar earned by a man.
What is Family Income Deficit in Hickory?
Family Income Deficit in Hickory is $8,934.
Families that are below poverty line in Hickory earn $8,934 less on average than the poverty threshold level.
What is Inequality or Gini Index in Hickory?
Inequality or Gini Index in Hickory is 0.49.
What is the Total Population of Hickory?
Total Population of Hickory is 43,352.
What is the Total Male Population of Hickory?
Total Male Population of Hickory is 21,058.
What is the Total Female Population of Hickory?
Total Female Population of Hickory is 22,294.
What is the Ratio of Males per 100 Females in Hickory?
There are 94.46 Males per 100 Females in Hickory.
What is the Ratio of Females per 100 Males in Hickory?
There are 105.87 Females per 100 Males in Hickory.
What is the Median Population Age in Hickory?
Median Population Age in Hickory is 37.9 Years.
What is the Average Family Size in Hickory
Average Family Size in Hickory is 3.0 People.
What is the Average Household Size in Hickory
Average Household Size in Hickory is 2.4 People.
How Large is the Labor Force in Hickory?
There are 21,319 People in the Labor Forcein in Hickory.
What is the Percentage of People in the Labor Force in Hickory?
59.8% of People are in the Labor Force in Hickory.
What is the Unemployment Rate in Hickory?
Unemployment Rate in Hickory is 6.2%.