Monroe, LA Map & Demographics
Monroe Map
Monroe Overview
$25,882
PER CAPITA INCOME
$51,446
AVG FAMILY INCOME
$36,550
AVG HOUSEHOLD INCOME
36.6%
WAGE / INCOME GAP [ % ]
63.4¢/ $1
WAGE / INCOME GAP [ $ ]
$12,752
FAMILY INCOME DEFICIT
0.59
INEQUALITY / GINI INDEX
47,631
TOTAL POPULATION
22,698
MALE POPULATION
24,933
FEMALE POPULATION
91.04
MALES / 100 FEMALES
109.85
FEMALES / 100 MALES
34.3
MEDIAN AGE
3.5
AVG FAMILY SIZE
2.5
AVG HOUSEHOLD SIZE
19,951
LABOR FORCE [ PEOPLE ]
54.2%
PERCENT IN LABOR FORCE
10.7%
UNEMPLOYMENT RATE
Monroe Area Codes
Income in Monroe
Income Overview in Monroe
Per Capita Income in Monroe is $25,882, while median incomes of families and households are $51,446 and $36,550 respectively.
| Characteristic | Number | Measure |
| Per Capita Income | 47,631 | $25,882 |
| Median Family Income | 9,621 | $51,446 |
| Mean Family Income | 9,621 | $87,162 |
| Median Household Income | 17,936 | $36,550 |
| Mean Household Income | 17,936 | $64,295 |
| Income Deficit | 9,621 | $12,752 |
| Wage / Income Gap (%) | 47,631 | 36.62% |
| Wage / Income Gap ($) | 47,631 | 63.38¢ per $1 |
| Gini / Inequality Index | 47,631 | 0.59 |
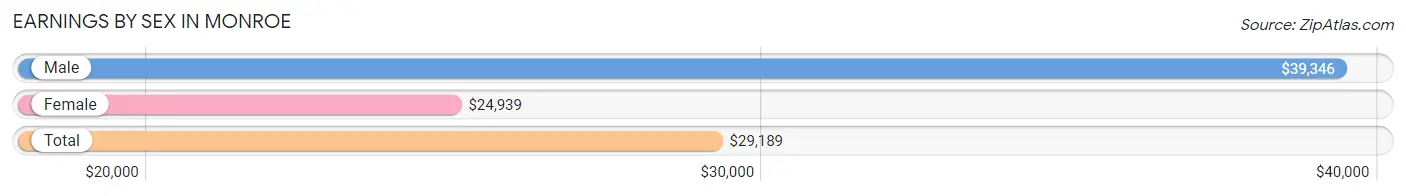
Earnings by Sex in Monroe
Average Earnings in Monroe are $29,189, $39,346 for men and $24,939 for women, a difference of 36.6%.
| Sex | Number | Average Earnings |
| Male | 8,989 (45.9%) | $39,346 |
| Female | 10,608 (54.1%) | $24,939 |
| Total | 19,597 (100.0%) | $29,189 |
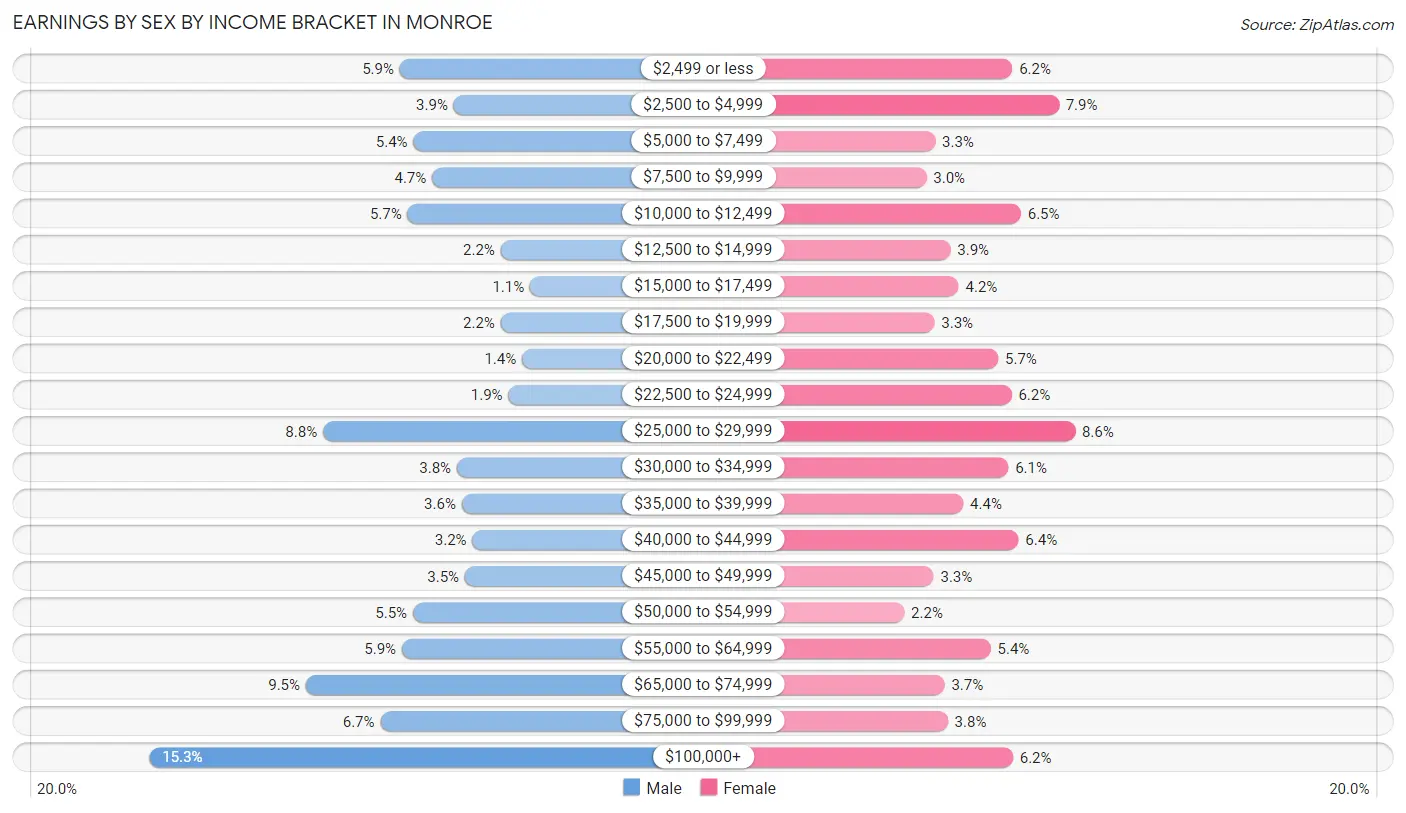
Earnings by Sex by Income Bracket in Monroe
The most common earnings brackets in Monroe are $100,000+ for men (1,378 | 15.3%) and $25,000 to $29,999 for women (907 | 8.6%).
| Income | Male | Female |
| $2,499 or less | 534 (5.9%) | 658 (6.2%) |
| $2,500 to $4,999 | 352 (3.9%) | 842 (7.9%) |
| $5,000 to $7,499 | 488 (5.4%) | 351 (3.3%) |
| $7,500 to $9,999 | 425 (4.7%) | 316 (3.0%) |
| $10,000 to $12,499 | 508 (5.7%) | 692 (6.5%) |
| $12,500 to $14,999 | 194 (2.2%) | 412 (3.9%) |
| $15,000 to $17,499 | 95 (1.1%) | 445 (4.2%) |
| $17,500 to $19,999 | 194 (2.2%) | 348 (3.3%) |
| $20,000 to $22,499 | 122 (1.4%) | 601 (5.7%) |
| $22,500 to $24,999 | 168 (1.9%) | 655 (6.2%) |
| $25,000 to $29,999 | 793 (8.8%) | 907 (8.6%) |
| $30,000 to $34,999 | 342 (3.8%) | 642 (6.0%) |
| $35,000 to $39,999 | 325 (3.6%) | 463 (4.4%) |
| $40,000 to $44,999 | 289 (3.2%) | 682 (6.4%) |
| $45,000 to $49,999 | 315 (3.5%) | 345 (3.3%) |
| $50,000 to $54,999 | 490 (5.4%) | 228 (2.1%) |
| $55,000 to $64,999 | 527 (5.9%) | 572 (5.4%) |
| $65,000 to $74,999 | 850 (9.5%) | 388 (3.7%) |
| $75,000 to $99,999 | 600 (6.7%) | 401 (3.8%) |
| $100,000+ | 1,378 (15.3%) | 660 (6.2%) |
| Total | 8,989 (100.0%) | 10,608 (100.0%) |
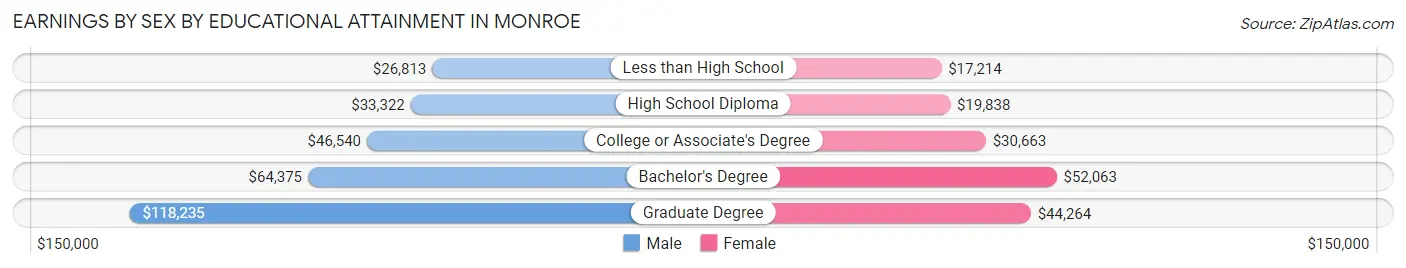
Earnings by Sex by Educational Attainment in Monroe
Average earnings in Monroe are $50,821 for men and $28,410 for women, a difference of 44.1%. Men with an educational attainment of graduate degree enjoy the highest average annual earnings of $118,235, while those with less than high school education earn the least with $26,813. Women with an educational attainment of bachelor's degree earn the most with the average annual earnings of $52,063, while those with less than high school education have the smallest earnings of $17,214.
| Educational Attainment | Male Income | Female Income |
| Less than High School | $26,813 | $17,214 |
| High School Diploma | $33,322 | $19,838 |
| College or Associate's Degree | $46,540 | $30,663 |
| Bachelor's Degree | $64,375 | $52,063 |
| Graduate Degree | $118,235 | $44,264 |
| Total | $50,821 | $28,410 |
Family Income in Monroe
Family Income Brackets in Monroe
According to the Monroe family income data, there are 1,385 families falling into the $50,000 to $74,999 income range, which is the most common income bracket and makes up 14.4% of all families. Conversely, the $150,000 to $199,999 income bracket is the least frequent group with only 664 families (6.9%) belonging to this category.
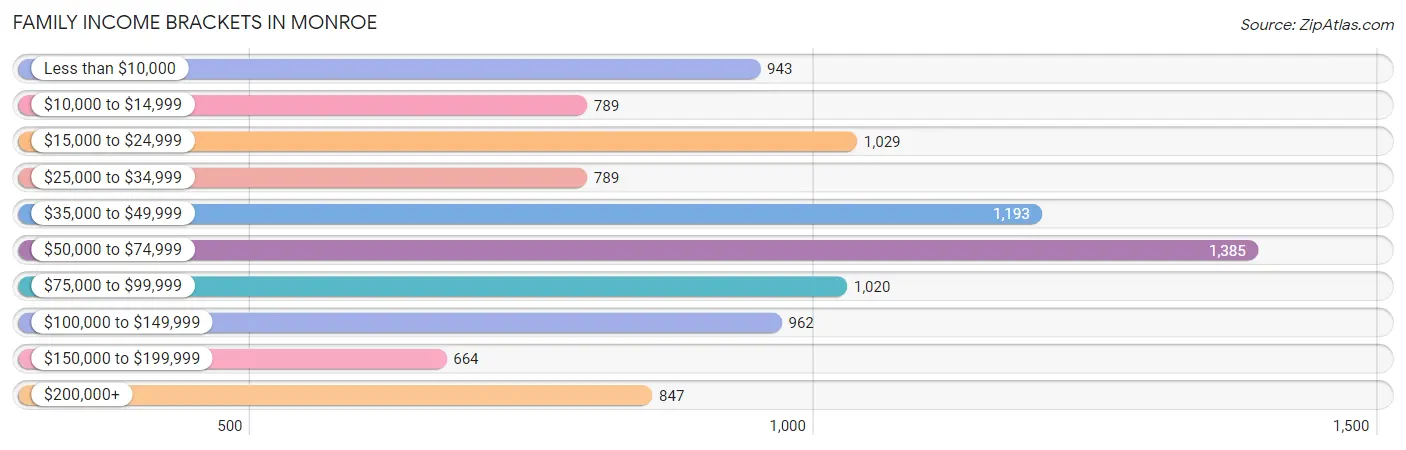
| Income Bracket | # Families | % Families |
| Less than $10,000 | 943 | 9.8% |
| $10,000 to $14,999 | 789 | 8.2% |
| $15,000 to $24,999 | 1,029 | 10.7% |
| $25,000 to $34,999 | 789 | 8.2% |
| $35,000 to $49,999 | 1,193 | 12.4% |
| $50,000 to $74,999 | 1,385 | 14.4% |
| $75,000 to $99,999 | 1,020 | 10.6% |
| $100,000 to $149,999 | 962 | 10.0% |
| $150,000 to $199,999 | 664 | 6.9% |
| $200,000+ | 847 | 8.8% |
Family Income by Famaliy Size in Monroe
4-person families (1,387 | 14.4%) account for the highest median family income in Monroe with $82,981 per family, while 2-person families (4,380 | 45.5%) have the highest median income of $27,117 per family member.
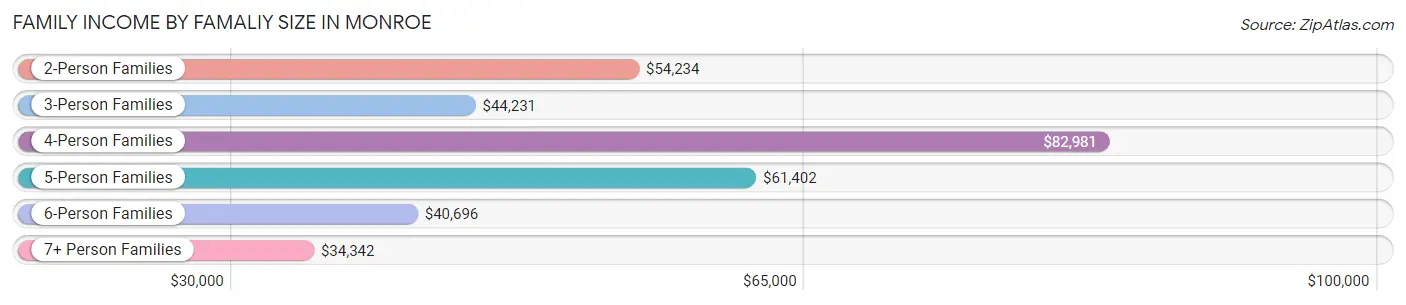
| Income Bracket | # Families | Median Income |
| 2-Person Families | 4,380 (45.5%) | $54,234 |
| 3-Person Families | 2,582 (26.8%) | $44,231 |
| 4-Person Families | 1,387 (14.4%) | $82,981 |
| 5-Person Families | 787 (8.2%) | $61,402 |
| 6-Person Families | 277 (2.9%) | $40,696 |
| 7+ Person Families | 208 (2.2%) | $34,342 |
| Total | 9,621 (100.0%) | $51,446 |
Family Income by Number of Earners in Monroe
The median family income in Monroe is $51,446, with families comprising 3+ earners (610) having the highest median family income of $140,536, while families with no earners (2,096) have the lowest median family income of $15,327, accounting for 6.3% and 21.8% of families, respectively.
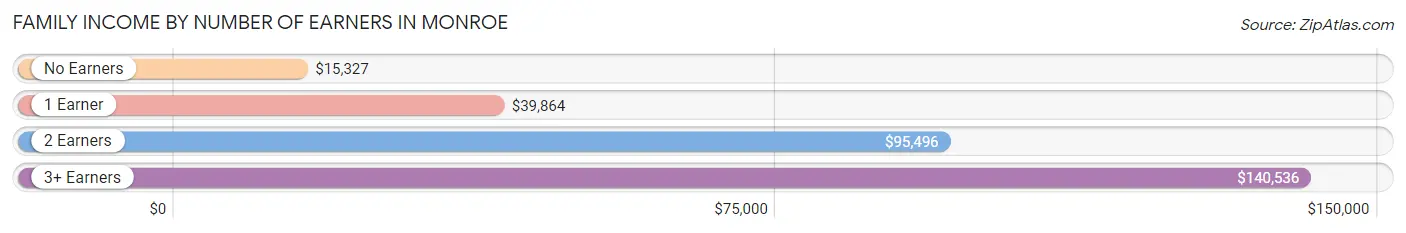
| Number of Earners | # Families | Median Income |
| No Earners | 2,096 (21.8%) | $15,327 |
| 1 Earner | 4,154 (43.2%) | $39,864 |
| 2 Earners | 2,761 (28.7%) | $95,496 |
| 3+ Earners | 610 (6.3%) | $140,536 |
| Total | 9,621 (100.0%) | $51,446 |
Household Income in Monroe
Household Income Brackets in Monroe
With 2,870 households falling in the category, the less than $10,000 income range is the most frequent in Monroe, accounting for 16.0% of all households. In contrast, only 807 households (4.5%) fall into the $150,000 to $199,999 income bracket, making it the least populous group.
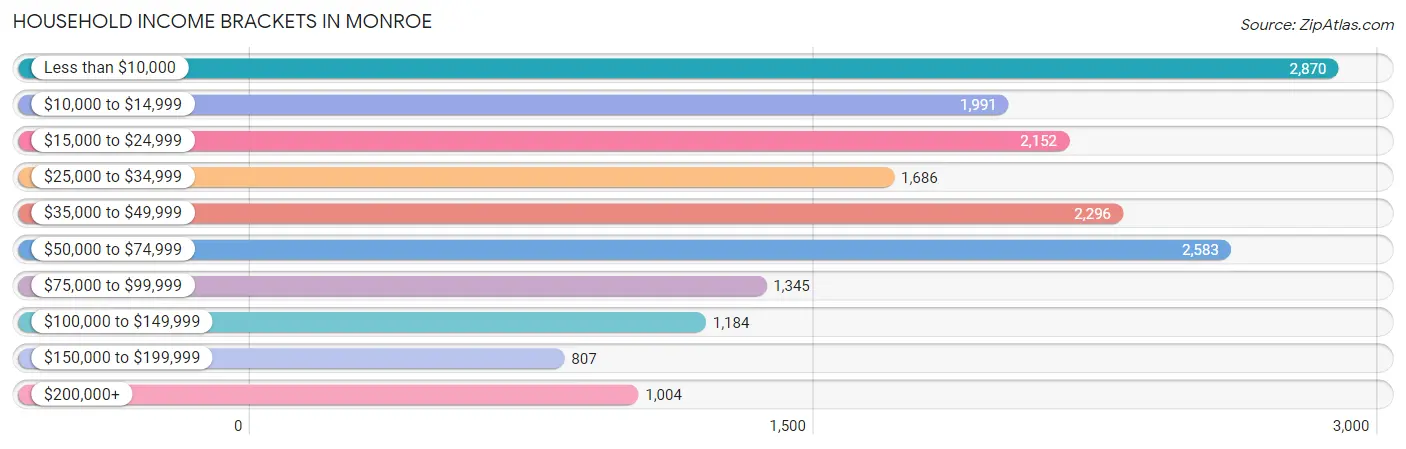
| Income Bracket | # Households | % Households |
| Less than $10,000 | 2,870 | 16.0% |
| $10,000 to $14,999 | 1,991 | 11.1% |
| $15,000 to $24,999 | 2,152 | 12.0% |
| $25,000 to $34,999 | 1,686 | 9.4% |
| $35,000 to $49,999 | 2,296 | 12.8% |
| $50,000 to $74,999 | 2,583 | 14.4% |
| $75,000 to $99,999 | 1,345 | 7.5% |
| $100,000 to $149,999 | 1,184 | 6.6% |
| $150,000 to $199,999 | 807 | 4.5% |
| $200,000+ | 1,004 | 5.6% |
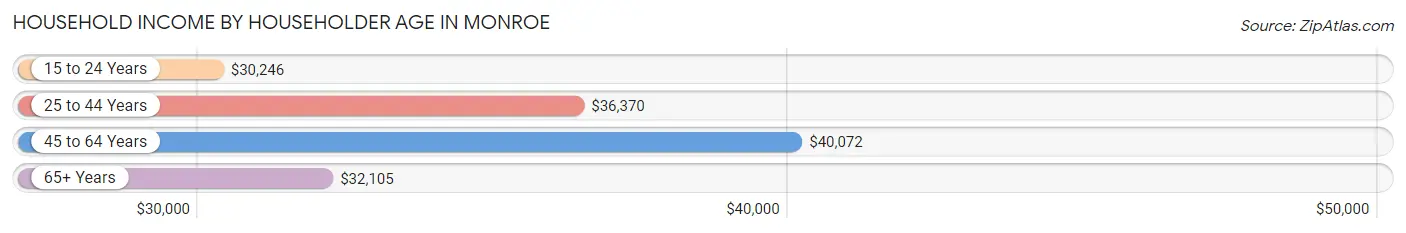
Household Income by Householder Age in Monroe
The median household income in Monroe is $36,550, with the highest median household income of $40,072 found in the 45 to 64 years age bracket for the primary householder. A total of 6,454 households (36.0%) fall into this category. Meanwhile, the 15 to 24 years age bracket for the primary householder has the lowest median household income of $30,246, with 833 households (4.6%) in this group.
| Income Bracket | # Households | Median Income |
| 15 to 24 Years | 833 (4.6%) | $30,246 |
| 25 to 44 Years | 5,879 (32.8%) | $36,370 |
| 45 to 64 Years | 6,454 (36.0%) | $40,072 |
| 65+ Years | 4,770 (26.6%) | $32,105 |
| Total | 17,936 (100.0%) | $36,550 |
Poverty in Monroe
Income Below Poverty by Sex and Age in Monroe
With 33.7% poverty level for males and 36.4% for females among the residents of Monroe, 5 year old males and 15 year old females are the most vulnerable to poverty, with 289 males (73.0%) and 201 females (59.3%) in their respective age groups living below the poverty level.
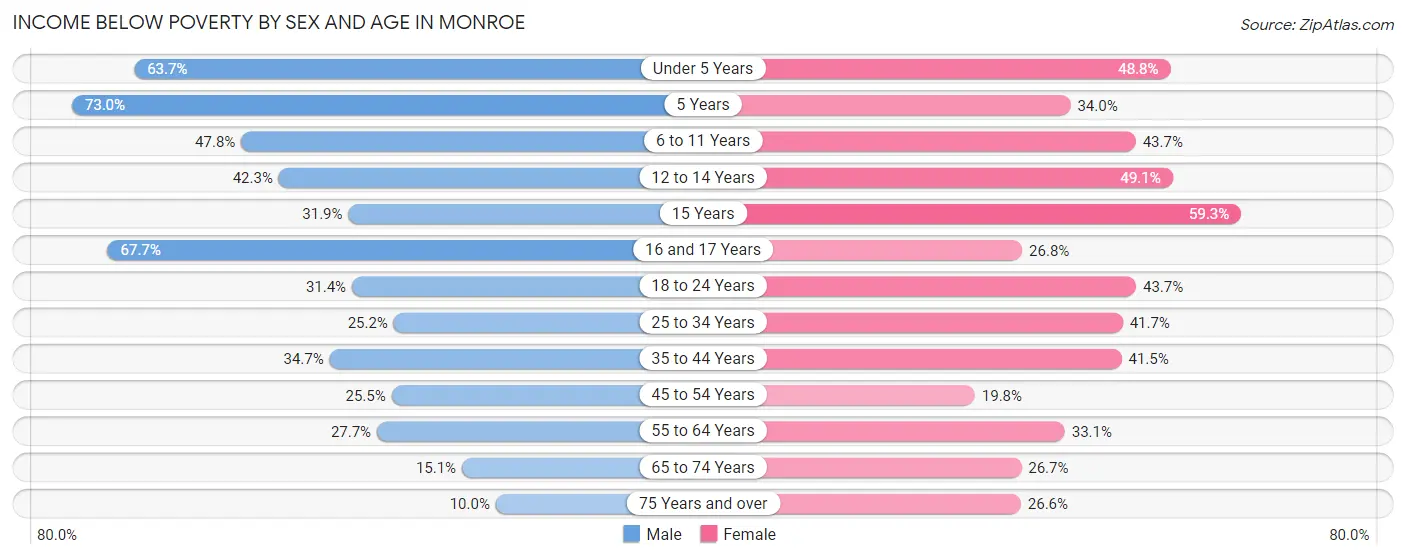
| Age Bracket | Male | Female |
| Under 5 Years | 1,059 (63.7%) | 843 (48.8%) |
| 5 Years | 289 (73.0%) | 90 (34.0%) |
| 6 to 11 Years | 731 (47.8%) | 839 (43.6%) |
| 12 to 14 Years | 519 (42.3%) | 467 (49.1%) |
| 15 Years | 196 (31.9%) | 201 (59.3%) |
| 16 and 17 Years | 406 (67.7%) | 154 (26.8%) |
| 18 to 24 Years | 543 (31.4%) | 807 (43.7%) |
| 25 to 34 Years | 754 (25.2%) | 1,373 (41.7%) |
| 35 to 44 Years | 874 (34.7%) | 1,183 (41.5%) |
| 45 to 54 Years | 573 (25.5%) | 546 (19.8%) |
| 55 to 64 Years | 687 (27.7%) | 1,003 (33.1%) |
| 65 to 74 Years | 252 (15.1%) | 578 (26.7%) |
| 75 Years and over | 109 (10.0%) | 469 (26.6%) |
| Total | 6,992 (33.7%) | 8,553 (36.4%) |
Income Above Poverty by Sex and Age in Monroe
According to the poverty statistics in Monroe, males aged 75 years and over and females aged 45 to 54 years are the age groups that are most secure financially, with 90.0% of males and 80.2% of females in these age groups living above the poverty line.
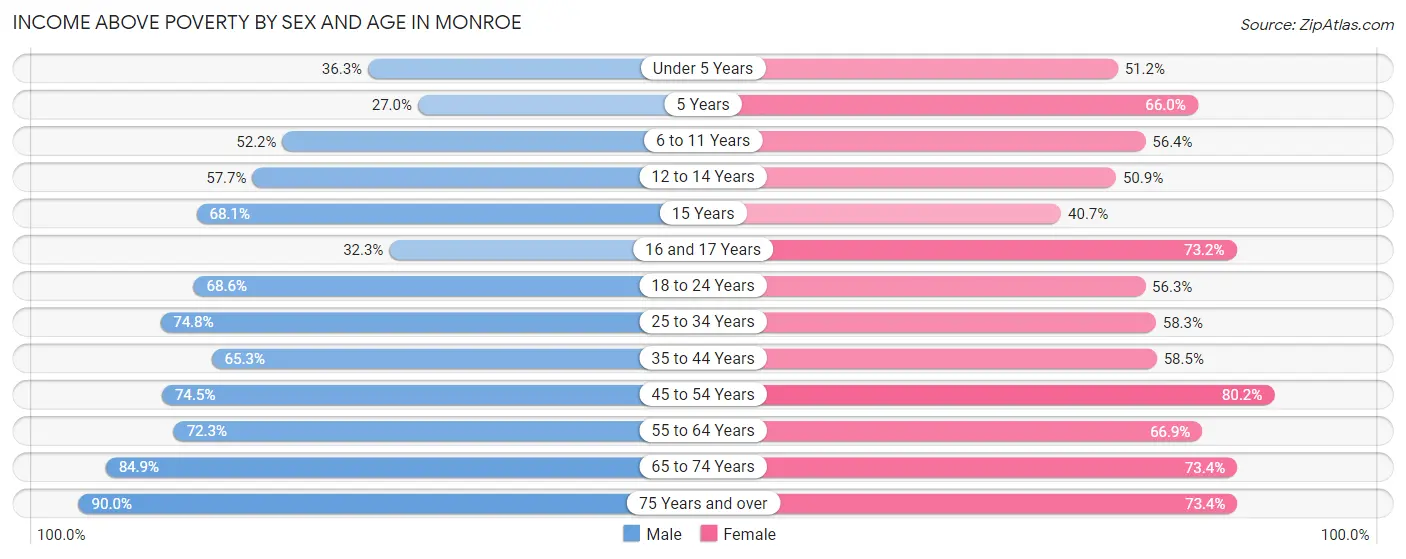
| Age Bracket | Male | Female |
| Under 5 Years | 603 (36.3%) | 885 (51.2%) |
| 5 Years | 107 (27.0%) | 175 (66.0%) |
| 6 to 11 Years | 797 (52.2%) | 1,083 (56.4%) |
| 12 to 14 Years | 709 (57.7%) | 484 (50.9%) |
| 15 Years | 418 (68.1%) | 138 (40.7%) |
| 16 and 17 Years | 194 (32.3%) | 421 (73.2%) |
| 18 to 24 Years | 1,187 (68.6%) | 1,040 (56.3%) |
| 25 to 34 Years | 2,239 (74.8%) | 1,919 (58.3%) |
| 35 to 44 Years | 1,643 (65.3%) | 1,665 (58.5%) |
| 45 to 54 Years | 1,673 (74.5%) | 2,217 (80.2%) |
| 55 to 64 Years | 1,795 (72.3%) | 2,026 (66.9%) |
| 65 to 74 Years | 1,421 (84.9%) | 1,591 (73.4%) |
| 75 Years and over | 977 (90.0%) | 1,295 (73.4%) |
| Total | 13,763 (66.3%) | 14,939 (63.6%) |
Income Below Poverty Among Married-Couple Families in Monroe
The poverty statistics for married-couple families in Monroe show that 8.5% or 389 of the total 4,606 families live below the poverty line. Families with 5 or more children have the highest poverty rate of 83.0%, comprising of 44 families. On the other hand, families with no children have the lowest poverty rate of 4.7%, which includes 122 families.
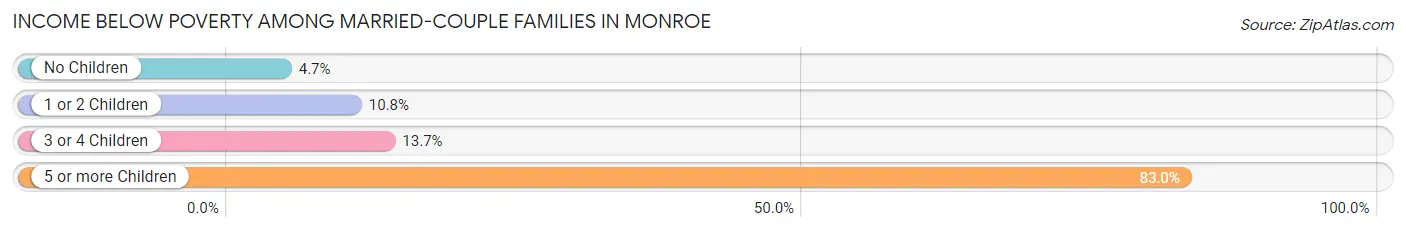
| Children | Above Poverty | Below Poverty |
| No Children | 2,487 (95.3%) | 122 (4.7%) |
| 1 or 2 Children | 1,324 (89.2%) | 160 (10.8%) |
| 3 or 4 Children | 397 (86.3%) | 63 (13.7%) |
| 5 or more Children | 9 (17.0%) | 44 (83.0%) |
| Total | 4,217 (91.5%) | 389 (8.5%) |
Income Below Poverty Among Single-Parent Households in Monroe
According to the poverty data in Monroe, 25.9% or 323 single-father households and 53.1% or 2,001 single-mother households are living below the poverty line. Among single-father households, those with 5 or more children have the highest poverty rate, with 12 households (100.0%) experiencing poverty. Likewise, among single-mother households, those with 5 or more children have the highest poverty rate, with 102 households (100.0%) falling below the poverty line.
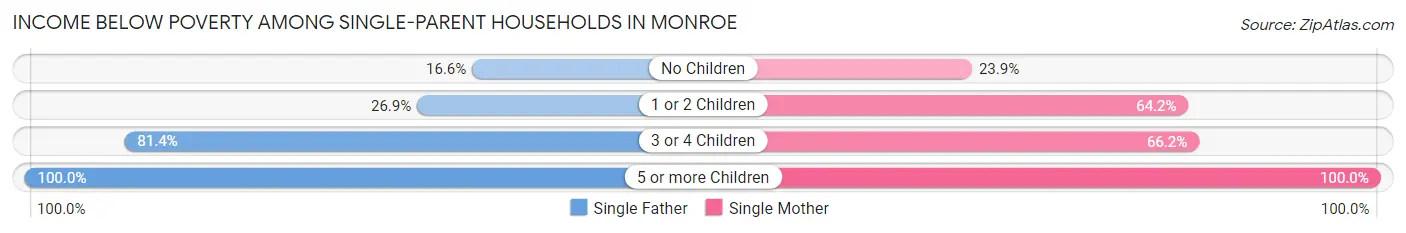
| Children | Single Father | Single Mother |
| No Children | 110 (16.6%) | 278 (23.9%) |
| 1 or 2 Children | 131 (26.9%) | 1,161 (64.2%) |
| 3 or 4 Children | 70 (81.4%) | 460 (66.2%) |
| 5 or more Children | 12 (100.0%) | 102 (100.0%) |
| Total | 323 (25.9%) | 2,001 (53.1%) |
Income Below Poverty Among Married-Couple vs Single-Parent Households in Monroe
The poverty data for Monroe shows that 389 of the married-couple family households (8.5%) and 2,324 of the single-parent households (46.3%) are living below the poverty level. Within the married-couple family households, those with 5 or more children have the highest poverty rate, with 44 households (83.0%) falling below the poverty line. Among the single-parent households, those with 5 or more children have the highest poverty rate, with 114 household (100.0%) living below poverty.
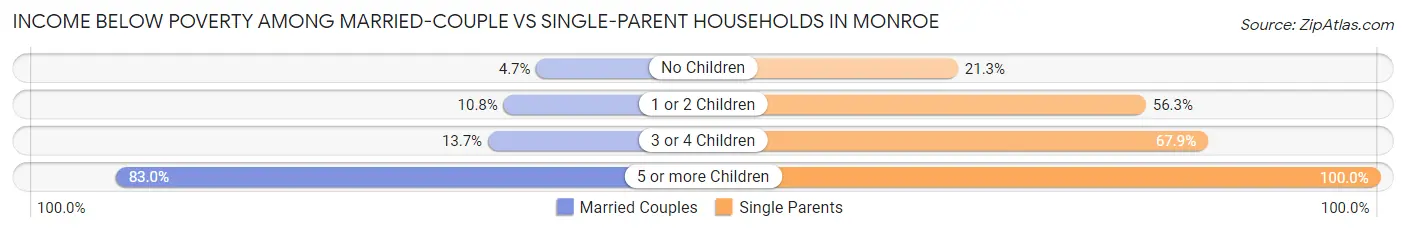
| Children | Married-Couple Families | Single-Parent Households |
| No Children | 122 (4.7%) | 388 (21.3%) |
| 1 or 2 Children | 160 (10.8%) | 1,292 (56.3%) |
| 3 or 4 Children | 63 (13.7%) | 530 (67.9%) |
| 5 or more Children | 44 (83.0%) | 114 (100.0%) |
| Total | 389 (8.5%) | 2,324 (46.3%) |
Race in Monroe
The most populous races in Monroe are Black / African American (29,102 | 61.1%), White / Caucasian (16,152 | 33.9%), and Some other Race (985 | 2.1%).
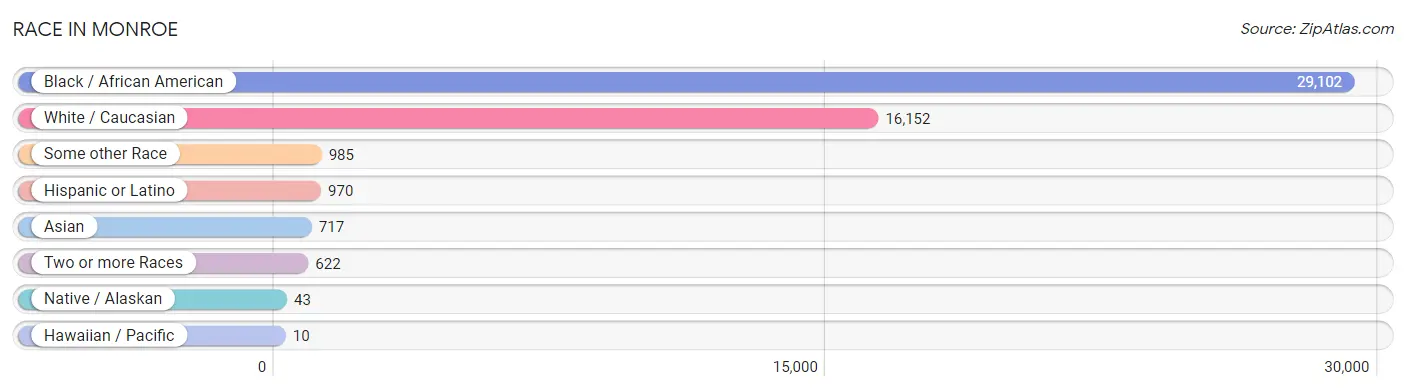
| Race | # Population | % Population |
| Asian | 717 | 1.5% |
| Black / African American | 29,102 | 61.1% |
| Hawaiian / Pacific | 10 | 0.0% |
| Hispanic or Latino | 970 | 2.0% |
| Native / Alaskan | 43 | 0.1% |
| White / Caucasian | 16,152 | 33.9% |
| Two or more Races | 622 | 1.3% |
| Some other Race | 985 | 2.1% |
| Total | 47,631 | 100.0% |
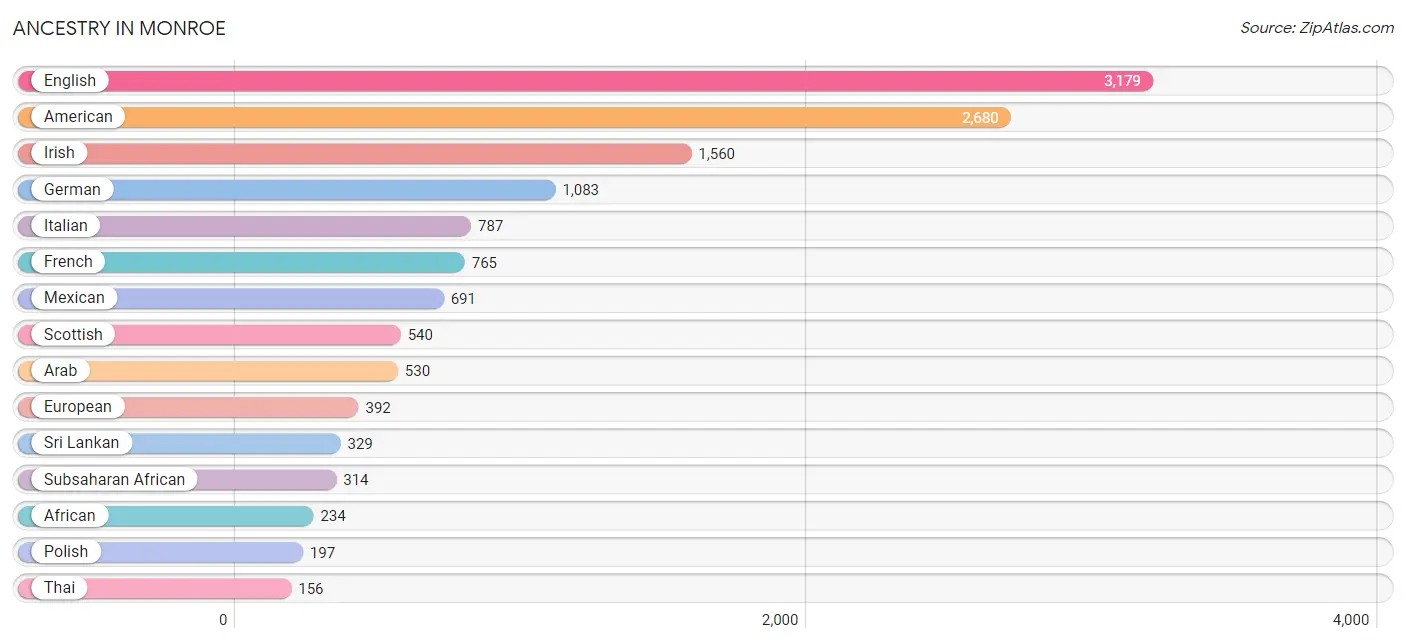
Ancestry in Monroe
The most populous ancestries reported in Monroe are English (3,179 | 6.7%), American (2,680 | 5.6%), Irish (1,560 | 3.3%), German (1,083 | 2.3%), and Italian (787 | 1.7%), together accounting for 19.5% of all Monroe residents.
| Ancestry | # Population | % Population |
| African | 234 | 0.5% |
| Albanian | 6 | 0.0% |
| American | 2,680 | 5.6% |
| Arab | 530 | 1.1% |
| Australian | 127 | 0.3% |
| Belizean | 20 | 0.0% |
| Bhutanese | 17 | 0.0% |
| Blackfeet | 17 | 0.0% |
| Brazilian | 6 | 0.0% |
| British | 69 | 0.1% |
| Burmese | 23 | 0.1% |
| Cajun | 67 | 0.1% |
| Canadian | 22 | 0.1% |
| Central American | 64 | 0.1% |
| Cherokee | 29 | 0.1% |
| Chippewa | 10 | 0.0% |
| Choctaw | 37 | 0.1% |
| Colombian | 5 | 0.0% |
| Cuban | 15 | 0.0% |
| Czech | 13 | 0.0% |
| Czechoslovakian | 113 | 0.2% |
| Danish | 113 | 0.2% |
| Dutch | 127 | 0.3% |
| Dutch West Indian | 13 | 0.0% |
| Eastern European | 45 | 0.1% |
| Egyptian | 20 | 0.0% |
| English | 3,179 | 6.7% |
| European | 392 | 0.8% |
| French | 765 | 1.6% |
| French Canadian | 86 | 0.2% |
| German | 1,083 | 2.3% |
| Greek | 55 | 0.1% |
| Honduran | 2 | 0.0% |
| Houma | 3 | 0.0% |
| Indian (Asian) | 70 | 0.2% |
| Iranian | 15 | 0.0% |
| Iraqi | 44 | 0.1% |
| Irish | 1,560 | 3.3% |
| Israeli | 39 | 0.1% |
| Italian | 787 | 1.7% |
| Jamaican | 55 | 0.1% |
| Korean | 8 | 0.0% |
| Lebanese | 51 | 0.1% |
| Lithuanian | 33 | 0.1% |
| Lumbee | 11 | 0.0% |
| Mexican | 691 | 1.5% |
| Moroccan | 35 | 0.1% |
| Native Hawaiian | 10 | 0.0% |
| Nepalese | 83 | 0.2% |
| Nigerian | 87 | 0.2% |
| Northern European | 2 | 0.0% |
| Norwegian | 18 | 0.0% |
| Palestinian | 86 | 0.2% |
| Polish | 197 | 0.4% |
| Puerto Rican | 46 | 0.1% |
| Russian | 42 | 0.1% |
| Salvadoran | 62 | 0.1% |
| Scotch-Irish | 155 | 0.3% |
| Scottish | 540 | 1.1% |
| Slovak | 16 | 0.0% |
| South American | 5 | 0.0% |
| Spaniard | 5 | 0.0% |
| Spanish | 24 | 0.1% |
| Sri Lankan | 329 | 0.7% |
| Subsaharan African | 314 | 0.7% |
| Swedish | 71 | 0.2% |
| Swiss | 17 | 0.0% |
| Thai | 156 | 0.3% |
| Ukrainian | 58 | 0.1% |
| Welsh | 49 | 0.1% |
| West Indian | 20 | 0.0% |
| Yugoslavian | 8 | 0.0% | View All 72 Rows |
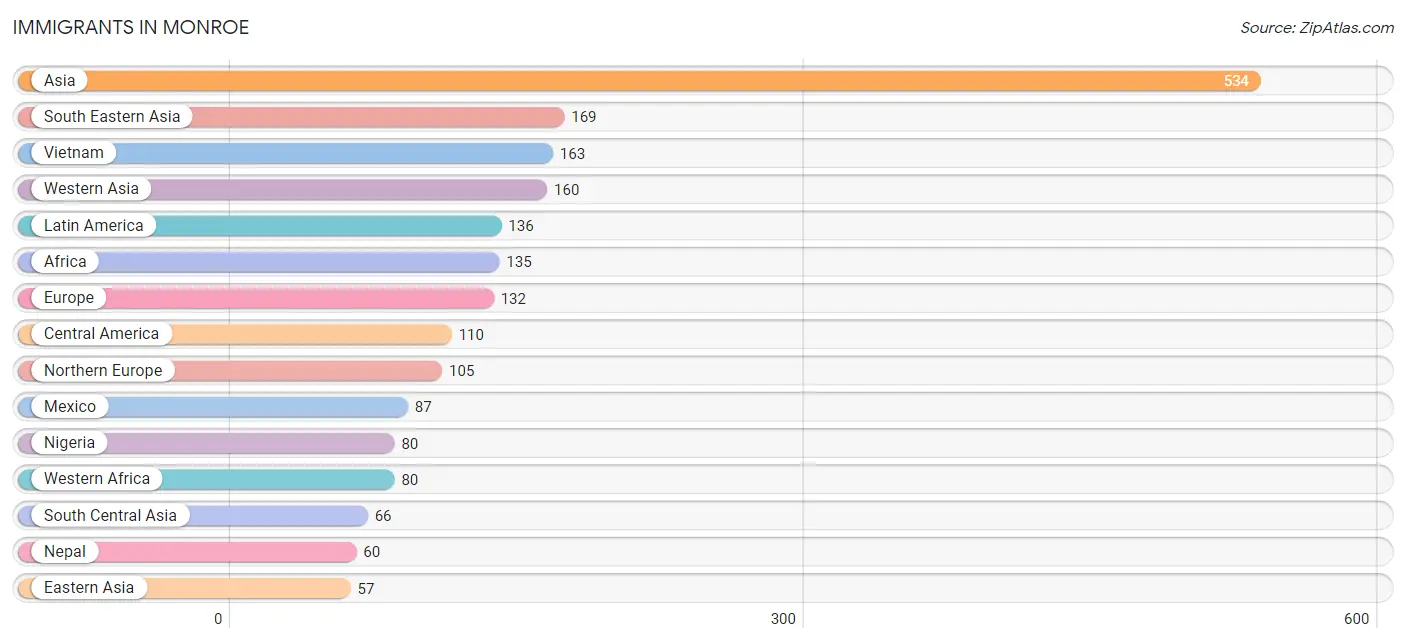
Immigrants in Monroe
The most numerous immigrant groups reported in Monroe came from Asia (534 | 1.1%), South Eastern Asia (169 | 0.4%), Vietnam (163 | 0.3%), Western Asia (160 | 0.3%), and Latin America (136 | 0.3%), together accounting for 2.4% of all Monroe residents.
| Immigration Origin | # Population | % Population |
| Africa | 135 | 0.3% |
| Asia | 534 | 1.1% |
| Bosnia and Herzegovina | 8 | 0.0% |
| Brazil | 6 | 0.0% |
| Canada | 26 | 0.1% |
| Caribbean | 20 | 0.0% |
| Central America | 110 | 0.2% |
| China | 43 | 0.1% |
| Eastern Asia | 57 | 0.1% |
| Eastern Europe | 20 | 0.0% |
| Egypt | 20 | 0.0% |
| Europe | 132 | 0.3% |
| Honduras | 23 | 0.1% |
| Iraq | 22 | 0.1% |
| Ireland | 8 | 0.0% |
| Israel | 39 | 0.1% |
| Italy | 7 | 0.0% |
| Korea | 14 | 0.0% |
| Latin America | 136 | 0.3% |
| Mexico | 87 | 0.2% |
| Morocco | 35 | 0.1% |
| Nepal | 60 | 0.1% |
| Nigeria | 80 | 0.2% |
| Northern Africa | 55 | 0.1% |
| Northern Europe | 105 | 0.2% |
| Pakistan | 6 | 0.0% |
| Philippines | 6 | 0.0% |
| Russia | 12 | 0.0% |
| Saudi Arabia | 51 | 0.1% |
| South America | 6 | 0.0% |
| South Central Asia | 66 | 0.1% |
| South Eastern Asia | 169 | 0.4% |
| Southern Europe | 7 | 0.0% |
| Vietnam | 163 | 0.3% |
| Western Africa | 80 | 0.2% |
| Western Asia | 160 | 0.3% |
| Yemen | 48 | 0.1% | View All 37 Rows |
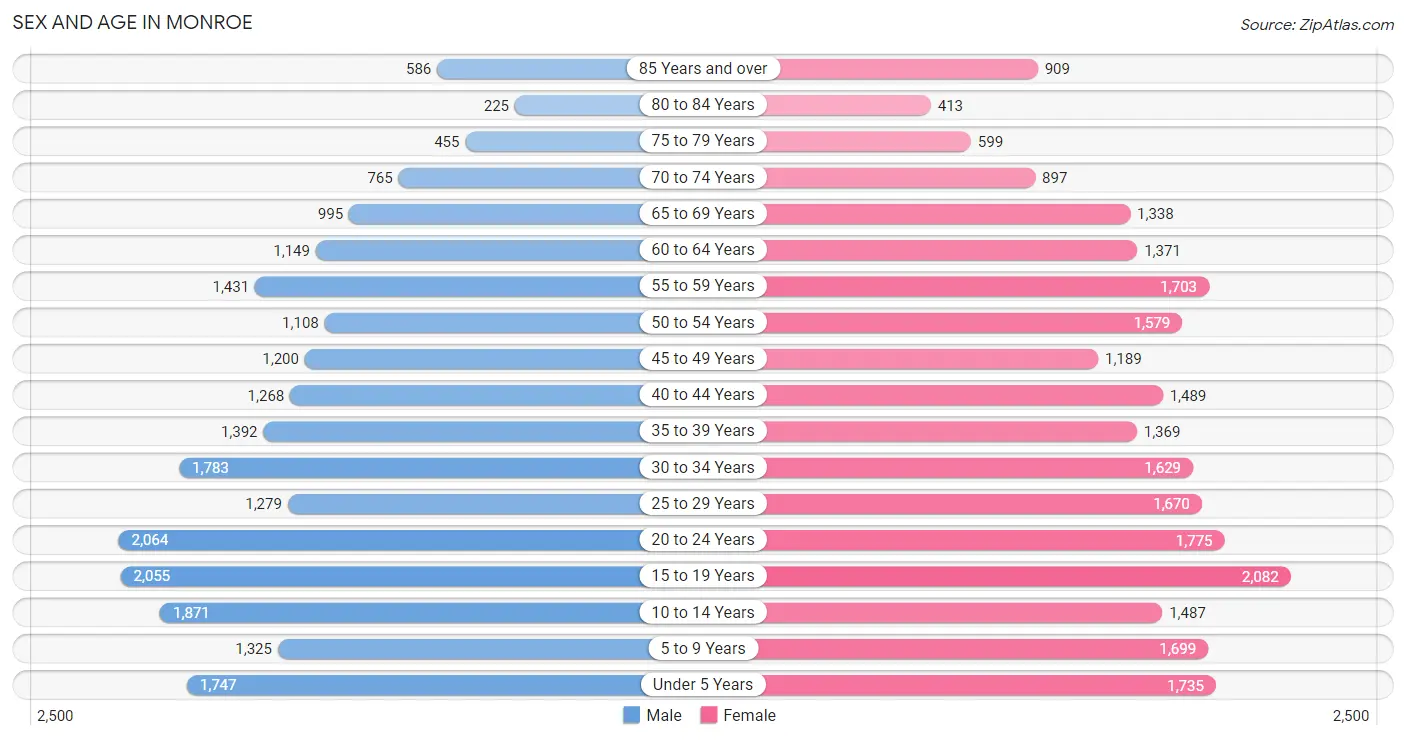
Sex and Age in Monroe
Sex and Age in Monroe
The most populous age groups in Monroe are 20 to 24 Years (2,064 | 9.1%) for men and 15 to 19 Years (2,082 | 8.4%) for women.
| Age Bracket | Male | Female |
| Under 5 Years | 1,747 (7.7%) | 1,735 (7.0%) |
| 5 to 9 Years | 1,325 (5.8%) | 1,699 (6.8%) |
| 10 to 14 Years | 1,871 (8.2%) | 1,487 (6.0%) |
| 15 to 19 Years | 2,055 (9.0%) | 2,082 (8.4%) |
| 20 to 24 Years | 2,064 (9.1%) | 1,775 (7.1%) |
| 25 to 29 Years | 1,279 (5.6%) | 1,670 (6.7%) |
| 30 to 34 Years | 1,783 (7.9%) | 1,629 (6.5%) |
| 35 to 39 Years | 1,392 (6.1%) | 1,369 (5.5%) |
| 40 to 44 Years | 1,268 (5.6%) | 1,489 (6.0%) |
| 45 to 49 Years | 1,200 (5.3%) | 1,189 (4.8%) |
| 50 to 54 Years | 1,108 (4.9%) | 1,579 (6.3%) |
| 55 to 59 Years | 1,431 (6.3%) | 1,703 (6.8%) |
| 60 to 64 Years | 1,149 (5.1%) | 1,371 (5.5%) |
| 65 to 69 Years | 995 (4.4%) | 1,338 (5.4%) |
| 70 to 74 Years | 765 (3.4%) | 897 (3.6%) |
| 75 to 79 Years | 455 (2.0%) | 599 (2.4%) |
| 80 to 84 Years | 225 (1.0%) | 413 (1.7%) |
| 85 Years and over | 586 (2.6%) | 909 (3.6%) |
| Total | 22,698 (100.0%) | 24,933 (100.0%) |
Families and Households in Monroe
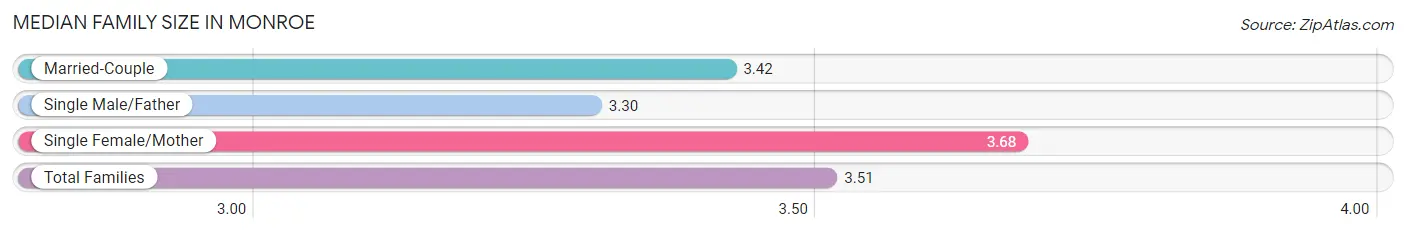
Median Family Size in Monroe
The median family size in Monroe is 3.51 persons per family, with single female/mother families (3,769 | 39.2%) accounting for the largest median family size of 3.68 persons per family. On the other hand, single male/father families (1,246 | 13.0%) represent the smallest median family size with 3.30 persons per family.
| Family Type | # Families | Family Size |
| Married-Couple | 4,606 (47.9%) | 3.42 |
| Single Male/Father | 1,246 (13.0%) | 3.30 |
| Single Female/Mother | 3,769 (39.2%) | 3.68 |
| Total Families | 9,621 (100.0%) | 3.51 |
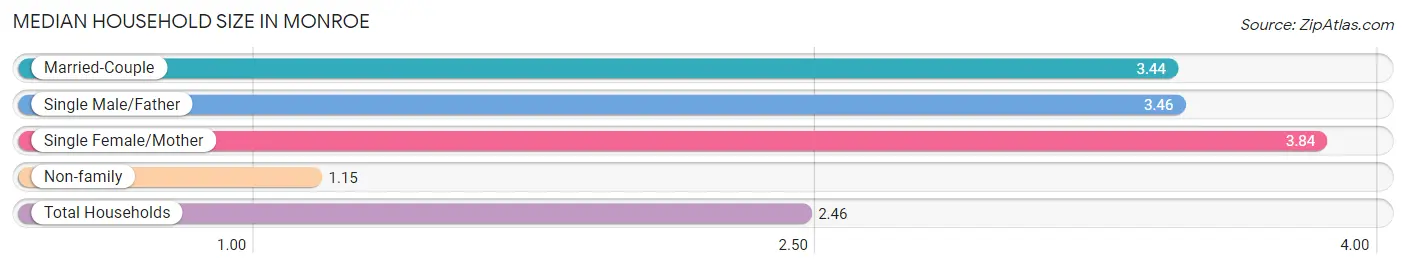
Median Household Size in Monroe
The median household size in Monroe is 2.46 persons per household, with single female/mother households (3,769 | 21.0%) accounting for the largest median household size of 3.84 persons per household. non-family households (8,315 | 46.4%) represent the smallest median household size with 1.15 persons per household.
| Household Type | # Households | Household Size |
| Married-Couple | 4,606 (25.7%) | 3.44 |
| Single Male/Father | 1,246 (7.0%) | 3.46 |
| Single Female/Mother | 3,769 (21.0%) | 3.84 |
| Non-family | 8,315 (46.4%) | 1.15 |
| Total Households | 17,936 (100.0%) | 2.46 |
Household Size by Marriage Status in Monroe
Out of a total of 17,936 households in Monroe, 9,621 (53.6%) are family households, while 8,315 (46.4%) are nonfamily households. The most numerous type of family households are 2-person households, comprising 4,020, and the most common type of nonfamily households are 1-person households, comprising 7,436.
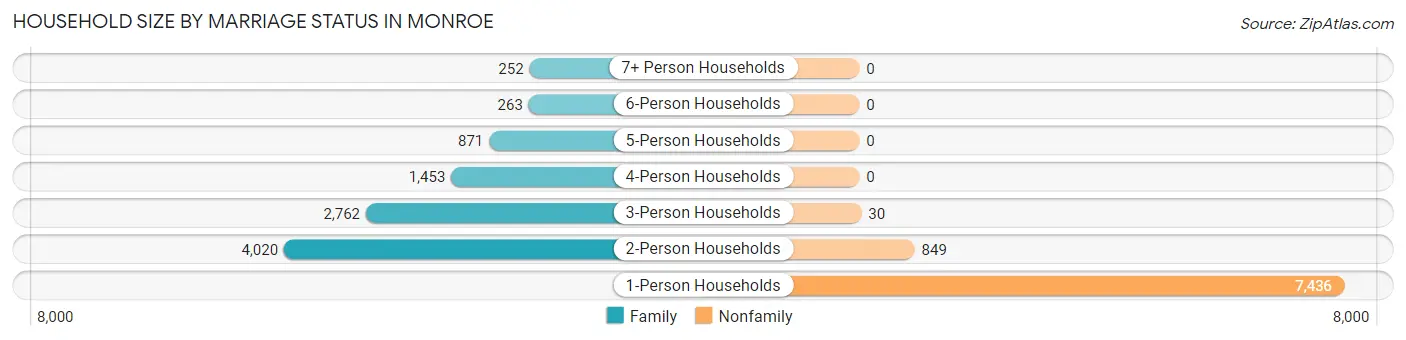
| Household Size | Family Households | Nonfamily Households |
| 1-Person Households | - | 7,436 (41.5%) |
| 2-Person Households | 4,020 (22.4%) | 849 (4.7%) |
| 3-Person Households | 2,762 (15.4%) | 30 (0.2%) |
| 4-Person Households | 1,453 (8.1%) | 0 (0.0%) |
| 5-Person Households | 871 (4.9%) | 0 (0.0%) |
| 6-Person Households | 263 (1.5%) | 0 (0.0%) |
| 7+ Person Households | 252 (1.4%) | 0 (0.0%) |
| Total | 9,621 (53.6%) | 8,315 (46.4%) |
Female Fertility in Monroe
Fertility by Age in Monroe
Average fertility rate in Monroe is 53.0 births per 1,000 women. Women in the age bracket of 20 to 34 years have the highest fertility rate with 88.0 births per 1,000 women. Women in the age bracket of 20 to 34 years acount for 72.5% of all women with births.
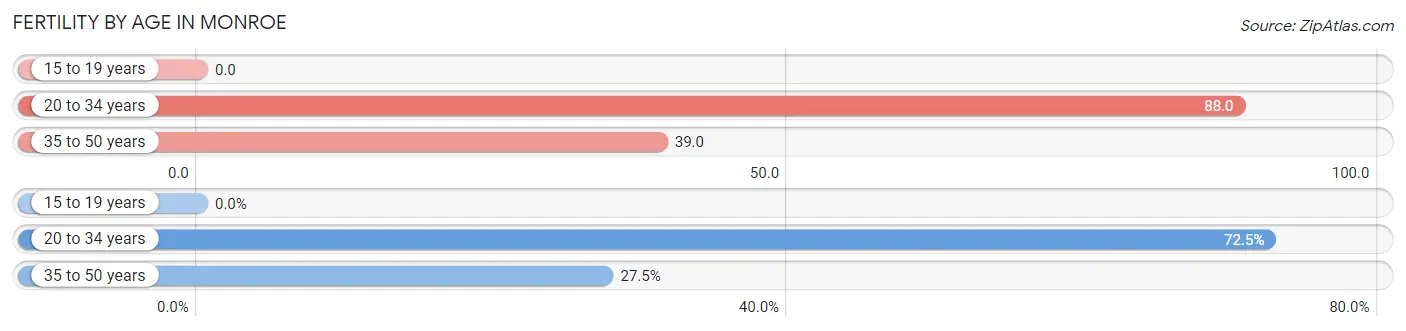
| Age Bracket | Women with Births | Births / 1,000 Women |
| 15 to 19 years | 0 (0.0%) | 0.0 |
| 20 to 34 years | 445 (72.5%) | 88.0 |
| 35 to 50 years | 169 (27.5%) | 39.0 |
| Total | 614 (100.0%) | 53.0 |
Fertility by Age by Marriage Status in Monroe
28.2% of women with births (614) in Monroe are married. The highest percentage of unmarried women with births falls into 20 to 34 years age bracket with 75.3% of them unmarried at the time of birth, while the lowest percentage of unmarried women with births belong to 35 to 50 years age bracket with 62.7% of them unmarried.
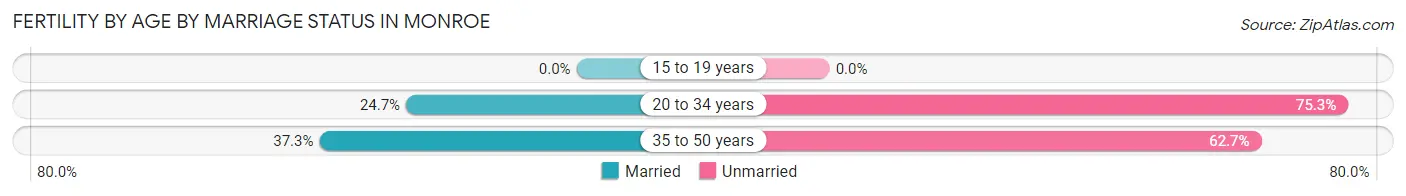
| Age Bracket | Married | Unmarried |
| 15 to 19 years | 0 (0.0%) | 0 (0.0%) |
| 20 to 34 years | 110 (24.7%) | 335 (75.3%) |
| 35 to 50 years | 63 (37.3%) | 106 (62.7%) |
| Total | 173 (28.2%) | 441 (71.8%) |
Fertility by Education in Monroe
Average fertility rate in Monroe is 53.0 births per 1,000 women. Women with the education attainment of bachelor's degree have the highest fertility rate of 91.0 births per 1,000 women, while women with the education attainment of college or associate's degree have the lowest fertility at 24.0 births per 1,000 women. Women with the education attainment of high school diploma represent 28.7% of all women with births.
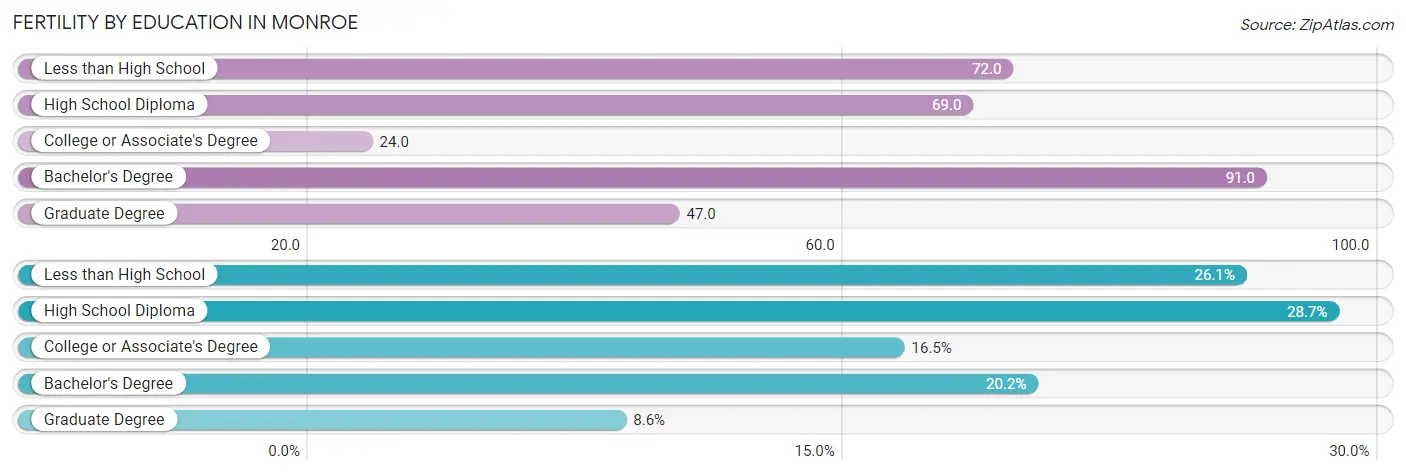
| Educational Attainment | Women with Births | Births / 1,000 Women |
| Less than High School | 160 (26.1%) | 72.0 |
| High School Diploma | 176 (28.7%) | 69.0 |
| College or Associate's Degree | 101 (16.5%) | 24.0 |
| Bachelor's Degree | 124 (20.2%) | 91.0 |
| Graduate Degree | 53 (8.6%) | 47.0 |
| Total | 614 (100.0%) | 53.0 |
Fertility by Education by Marriage Status in Monroe
71.8% of women with births in Monroe are unmarried. Women with the educational attainment of graduate degree are most likely to be married with 100.0% of them married at childbirth, while women with the educational attainment of college or associate's degree are least likely to be married with 93.1% of them unmarried at childbirth.
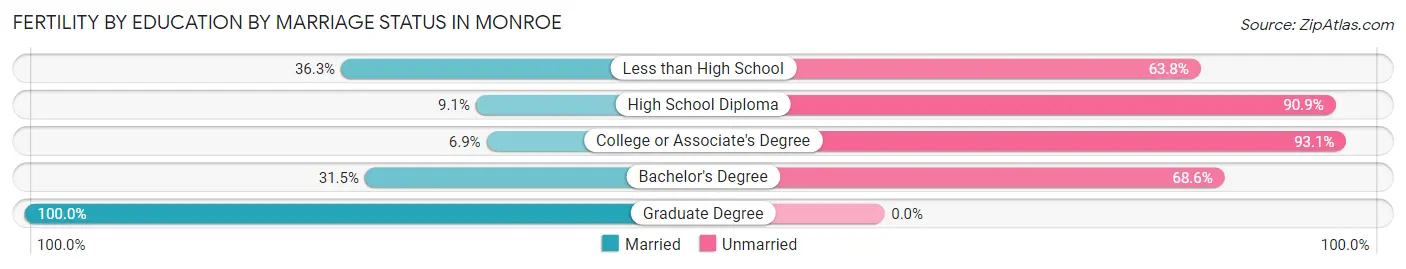
| Educational Attainment | Married | Unmarried |
| Less than High School | 58 (36.2%) | 102 (63.7%) |
| High School Diploma | 16 (9.1%) | 160 (90.9%) |
| College or Associate's Degree | 7 (6.9%) | 94 (93.1%) |
| Bachelor's Degree | 39 (31.5%) | 85 (68.5%) |
| Graduate Degree | 53 (100.0%) | 0 (0.0%) |
| Total | 173 (28.2%) | 441 (71.8%) |
Employment Characteristics in Monroe
Employment by Class of Employer in Monroe
Among the 17,328 employed individuals in Monroe, private company employees (11,951 | 69.0%), not-for-profit organizations (1,354 | 7.8%), and state government employees (1,180 | 6.8%) make up the most common classes of employment.
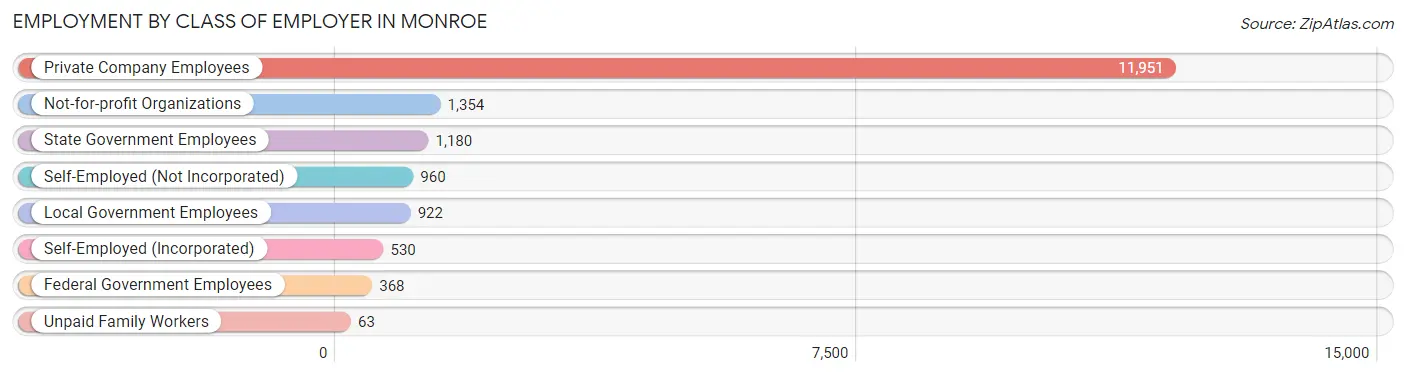
| Employer Class | # Employees | % Employees |
| Private Company Employees | 11,951 | 69.0% |
| Self-Employed (Incorporated) | 530 | 3.1% |
| Self-Employed (Not Incorporated) | 960 | 5.5% |
| Not-for-profit Organizations | 1,354 | 7.8% |
| Local Government Employees | 922 | 5.3% |
| State Government Employees | 1,180 | 6.8% |
| Federal Government Employees | 368 | 2.1% |
| Unpaid Family Workers | 63 | 0.4% |
| Total | 17,328 | 100.0% |
Employment Status by Age in Monroe
According to the labor force statistics for Monroe, out of the total population over 16 years of age (36,810), 54.2% or 19,951 individuals are in the labor force, with 10.7% or 2,135 of them unemployed. The age group with the highest labor force participation rate is 25 to 29 years, with 79.9% or 2,356 individuals in the labor force. Within the labor force, the 16 to 19 years age range has the highest percentage of unemployed individuals, with 22.0% or 209 of them being unemployed.
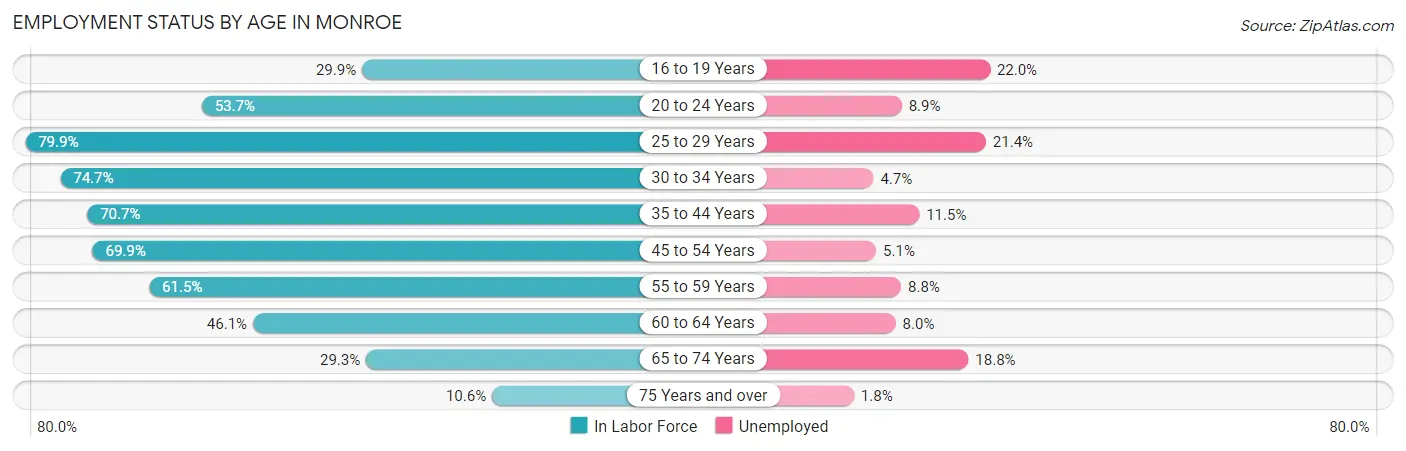
| Age Bracket | In Labor Force | Unemployed |
| 16 to 19 Years | 951 (29.9%) | 209 (22.0%) |
| 20 to 24 Years | 2,062 (53.7%) | 184 (8.9%) |
| 25 to 29 Years | 2,356 (79.9%) | 504 (21.4%) |
| 30 to 34 Years | 2,549 (74.7%) | 120 (4.7%) |
| 35 to 44 Years | 3,901 (70.7%) | 449 (11.5%) |
| 45 to 54 Years | 3,548 (69.9%) | 181 (5.1%) |
| 55 to 59 Years | 1,927 (61.5%) | 170 (8.8%) |
| 60 to 64 Years | 1,162 (46.1%) | 93 (8.0%) |
| 65 to 74 Years | 1,171 (29.3%) | 220 (18.8%) |
| 75 Years and over | 338 (10.6%) | 6 (1.8%) |
| Total | 19,951 (54.2%) | 2,135 (10.7%) |
Employment Status by Educational Attainment in Monroe
According to labor force statistics for Monroe, 68.3% of individuals (15,442) out of the total population between 25 and 64 years of age (22,609) are in the labor force, with 9.8% or 1,513 of them being unemployed. The group with the highest labor force participation rate are those with the educational attainment of bachelor's degree or higher, with 90.0% or 5,210 individuals in the labor force. Within the labor force, individuals with less than high school education have the highest percentage of unemployment, with 23.5% or 436 of them being unemployed.
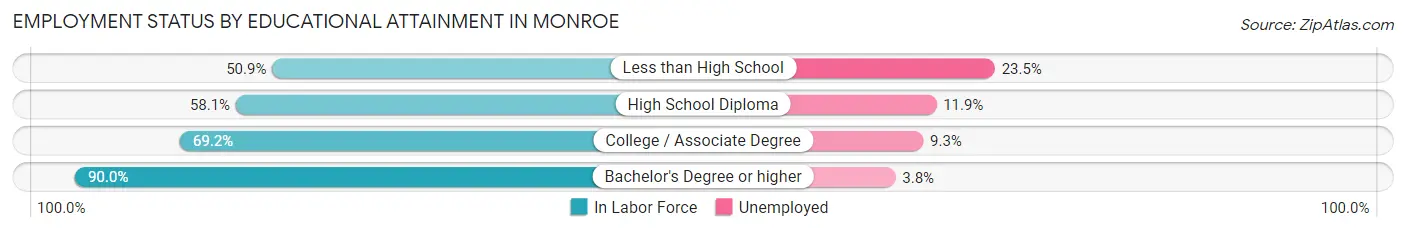
| Educational Attainment | In Labor Force | Unemployed |
| Less than High School | 1,854 (50.9%) | 856 (23.5%) |
| High School Diploma | 3,864 (58.1%) | 791 (11.9%) |
| College / Associate Degree | 4,516 (69.2%) | 607 (9.3%) |
| Bachelor's Degree or higher | 5,210 (90.0%) | 220 (3.8%) |
| Total | 15,442 (68.3%) | 2,216 (9.8%) |
Employment Occupations by Sex in Monroe
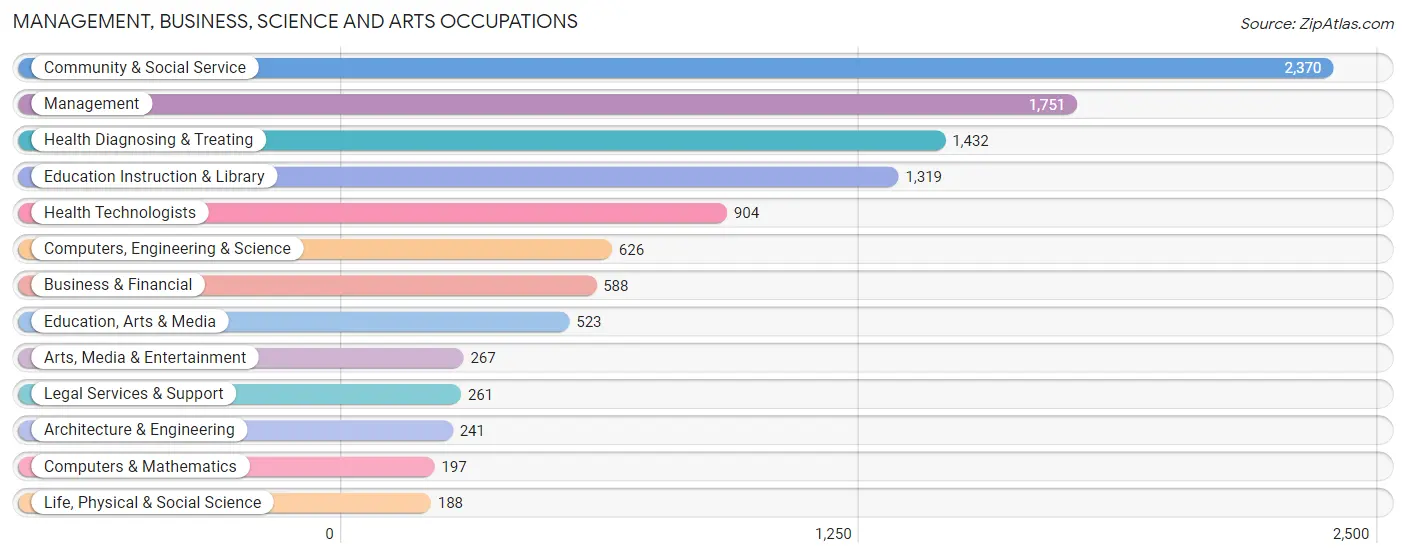
Management, Business, Science and Arts Occupations
The most common Management, Business, Science and Arts occupations in Monroe are Community & Social Service (2,370 | 13.3%), Management (1,751 | 9.8%), Health Diagnosing & Treating (1,432 | 8.1%), Education Instruction & Library (1,319 | 7.4%), and Health Technologists (904 | 5.1%).
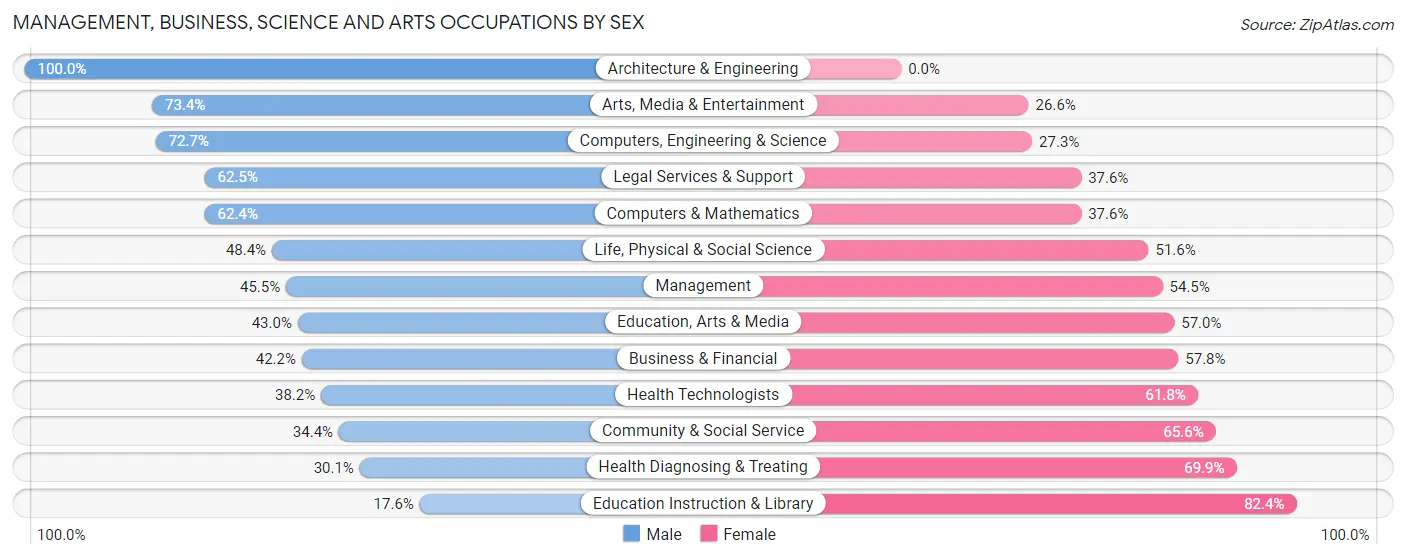
Management, Business, Science and Arts Occupations by Sex
Within the Management, Business, Science and Arts occupations in Monroe, the most male-oriented occupations are Architecture & Engineering (100.0%), Arts, Media & Entertainment (73.4%), and Computers, Engineering & Science (72.7%), while the most female-oriented occupations are Education Instruction & Library (82.4%), Health Diagnosing & Treating (69.9%), and Community & Social Service (65.6%).
| Occupation | Male | Female |
| Management | 796 (45.5%) | 955 (54.5%) |
| Business & Financial | 248 (42.2%) | 340 (57.8%) |
| Computers, Engineering & Science | 455 (72.7%) | 171 (27.3%) |
| Computers & Mathematics | 123 (62.4%) | 74 (37.6%) |
| Architecture & Engineering | 241 (100.0%) | 0 (0.0%) |
| Life, Physical & Social Science | 91 (48.4%) | 97 (51.6%) |
| Community & Social Service | 816 (34.4%) | 1,554 (65.6%) |
| Education, Arts & Media | 225 (43.0%) | 298 (57.0%) |
| Legal Services & Support | 163 (62.5%) | 98 (37.6%) |
| Education Instruction & Library | 232 (17.6%) | 1,087 (82.4%) |
| Arts, Media & Entertainment | 196 (73.4%) | 71 (26.6%) |
| Health Diagnosing & Treating | 431 (30.1%) | 1,001 (69.9%) |
| Health Technologists | 345 (38.2%) | 559 (61.8%) |
| Total (Category) | 2,746 (40.6%) | 4,021 (59.4%) |
| Total (Overall) | 8,079 (45.4%) | 9,710 (54.6%) |
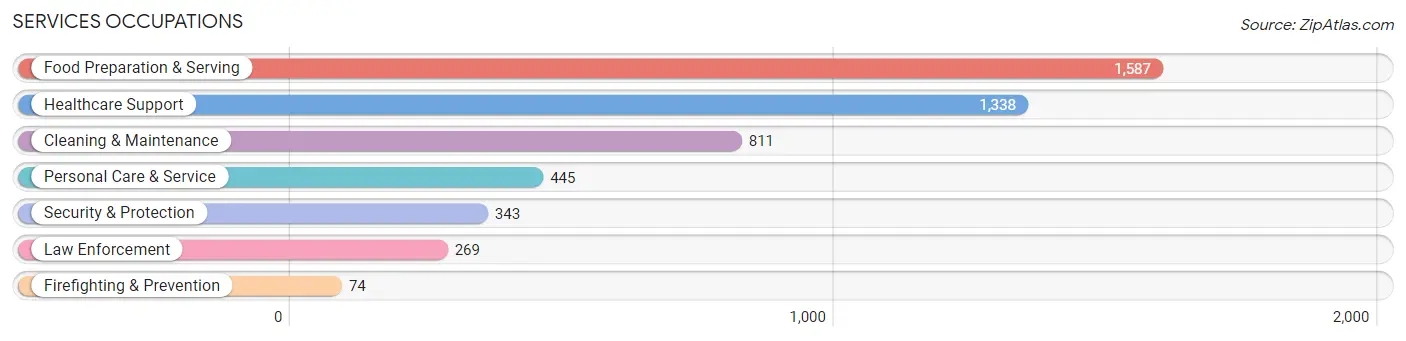
Services Occupations
The most common Services occupations in Monroe are Food Preparation & Serving (1,587 | 8.9%), Healthcare Support (1,338 | 7.5%), Cleaning & Maintenance (811 | 4.6%), Personal Care & Service (445 | 2.5%), and Security & Protection (343 | 1.9%).
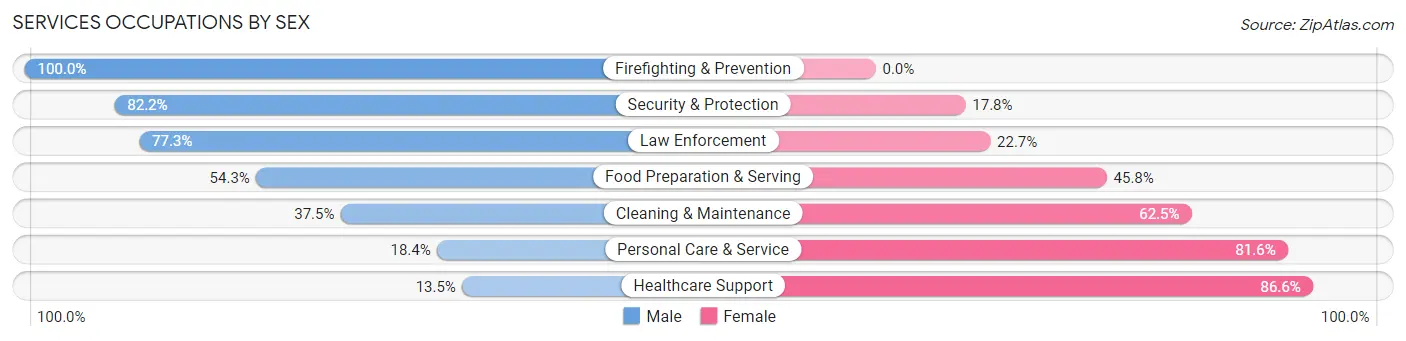
Services Occupations by Sex
Within the Services occupations in Monroe, the most male-oriented occupations are Firefighting & Prevention (100.0%), Security & Protection (82.2%), and Law Enforcement (77.3%), while the most female-oriented occupations are Healthcare Support (86.6%), Personal Care & Service (81.6%), and Cleaning & Maintenance (62.5%).
| Occupation | Male | Female |
| Healthcare Support | 180 (13.5%) | 1,158 (86.6%) |
| Security & Protection | 282 (82.2%) | 61 (17.8%) |
| Firefighting & Prevention | 74 (100.0%) | 0 (0.0%) |
| Law Enforcement | 208 (77.3%) | 61 (22.7%) |
| Food Preparation & Serving | 861 (54.2%) | 726 (45.8%) |
| Cleaning & Maintenance | 304 (37.5%) | 507 (62.5%) |
| Personal Care & Service | 82 (18.4%) | 363 (81.6%) |
| Total (Category) | 1,709 (37.8%) | 2,815 (62.2%) |
| Total (Overall) | 8,079 (45.4%) | 9,710 (54.6%) |
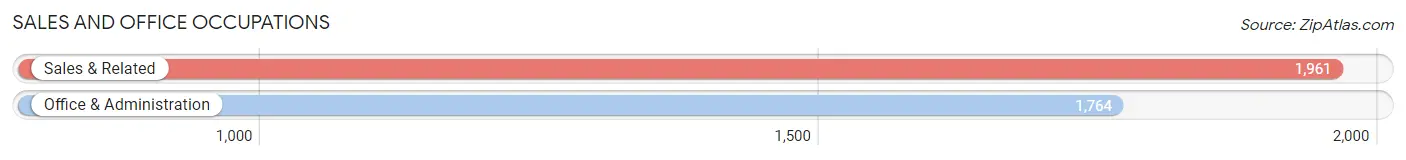
Sales and Office Occupations
The most common Sales and Office occupations in Monroe are Sales & Related (1,961 | 11.0%), and Office & Administration (1,764 | 9.9%).
Sales and Office Occupations by Sex
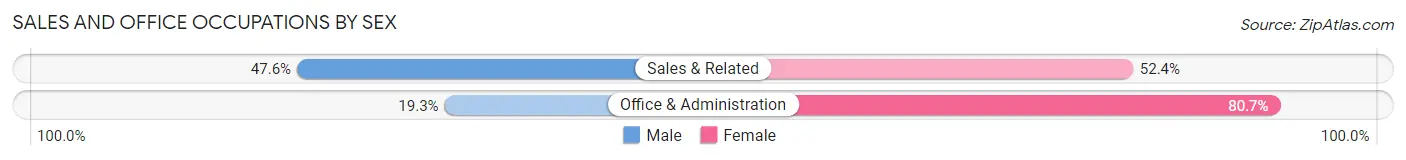
| Occupation | Male | Female |
| Sales & Related | 934 (47.6%) | 1,027 (52.4%) |
| Office & Administration | 340 (19.3%) | 1,424 (80.7%) |
| Total (Category) | 1,274 (34.2%) | 2,451 (65.8%) |
| Total (Overall) | 8,079 (45.4%) | 9,710 (54.6%) |
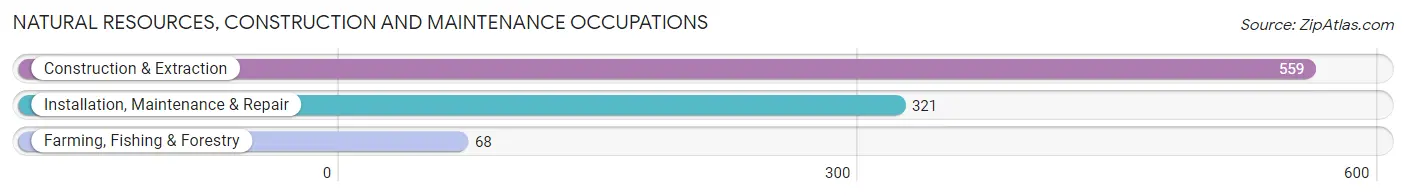
Natural Resources, Construction and Maintenance Occupations
The most common Natural Resources, Construction and Maintenance occupations in Monroe are Construction & Extraction (559 | 3.1%), Installation, Maintenance & Repair (321 | 1.8%), and Farming, Fishing & Forestry (68 | 0.4%).
Natural Resources, Construction and Maintenance Occupations by Sex
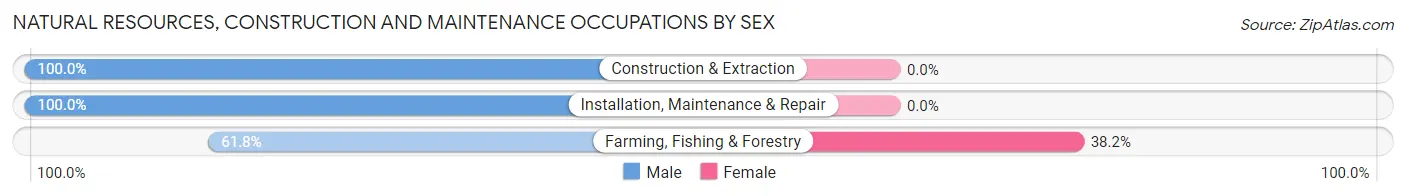
| Occupation | Male | Female |
| Farming, Fishing & Forestry | 42 (61.8%) | 26 (38.2%) |
| Construction & Extraction | 559 (100.0%) | 0 (0.0%) |
| Installation, Maintenance & Repair | 321 (100.0%) | 0 (0.0%) |
| Total (Category) | 922 (97.3%) | 26 (2.7%) |
| Total (Overall) | 8,079 (45.4%) | 9,710 (54.6%) |
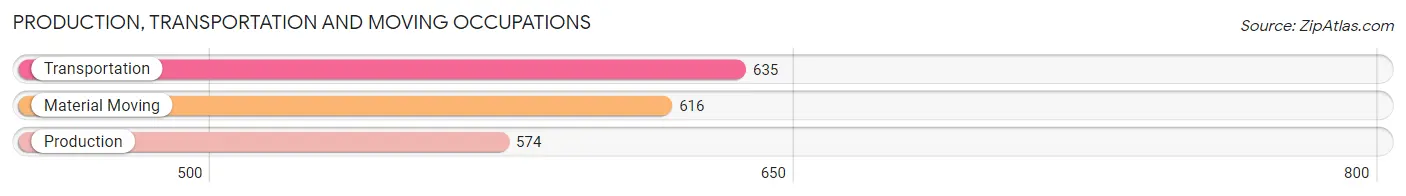
Production, Transportation and Moving Occupations
The most common Production, Transportation and Moving occupations in Monroe are Transportation (635 | 3.6%), Material Moving (616 | 3.5%), and Production (574 | 3.2%).
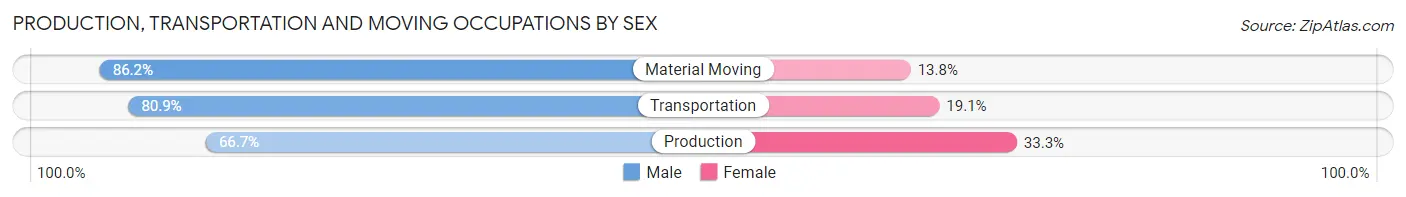
Production, Transportation and Moving Occupations by Sex
| Occupation | Male | Female |
| Production | 383 (66.7%) | 191 (33.3%) |
| Transportation | 514 (80.9%) | 121 (19.1%) |
| Material Moving | 531 (86.2%) | 85 (13.8%) |
| Total (Category) | 1,428 (78.2%) | 397 (21.7%) |
| Total (Overall) | 8,079 (45.4%) | 9,710 (54.6%) |
Employment Industries by Sex in Monroe
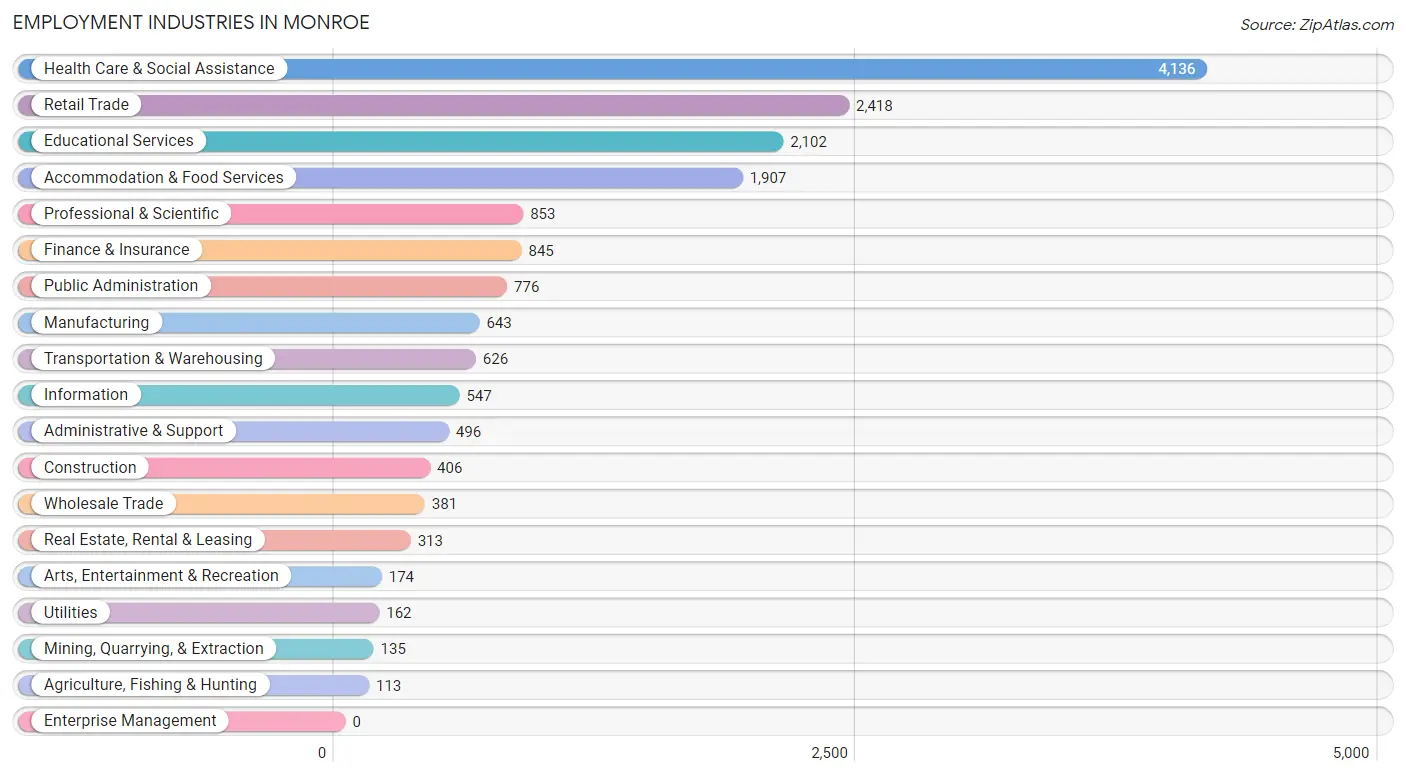
Employment Industries in Monroe
The major employment industries in Monroe include Health Care & Social Assistance (4,136 | 23.3%), Retail Trade (2,418 | 13.6%), Educational Services (2,102 | 11.8%), Accommodation & Food Services (1,907 | 10.7%), and Professional & Scientific (853 | 4.8%).
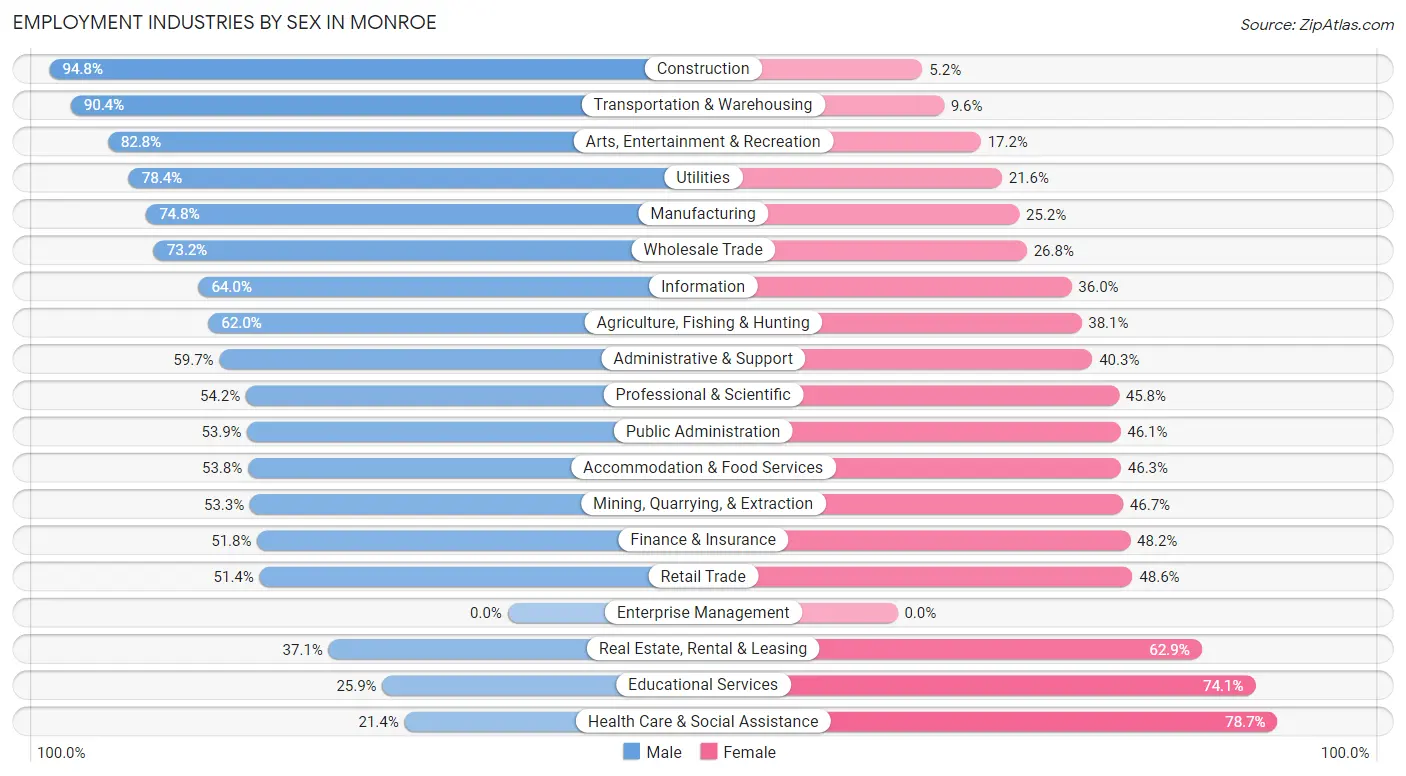
Employment Industries by Sex in Monroe
The Monroe industries that see more men than women are Construction (94.8%), Transportation & Warehousing (90.4%), and Arts, Entertainment & Recreation (82.8%), whereas the industries that tend to have a higher number of women are Health Care & Social Assistance (78.6%), Educational Services (74.1%), and Real Estate, Rental & Leasing (62.9%).
| Industry | Male | Female |
| Agriculture, Fishing & Hunting | 70 (62.0%) | 43 (38.1%) |
| Mining, Quarrying, & Extraction | 72 (53.3%) | 63 (46.7%) |
| Construction | 385 (94.8%) | 21 (5.2%) |
| Manufacturing | 481 (74.8%) | 162 (25.2%) |
| Wholesale Trade | 279 (73.2%) | 102 (26.8%) |
| Retail Trade | 1,242 (51.4%) | 1,176 (48.6%) |
| Transportation & Warehousing | 566 (90.4%) | 60 (9.6%) |
| Utilities | 127 (78.4%) | 35 (21.6%) |
| Information | 350 (64.0%) | 197 (36.0%) |
| Finance & Insurance | 438 (51.8%) | 407 (48.2%) |
| Real Estate, Rental & Leasing | 116 (37.1%) | 197 (62.9%) |
| Professional & Scientific | 462 (54.2%) | 391 (45.8%) |
| Enterprise Management | 0 (0.0%) | 0 (0.0%) |
| Administrative & Support | 296 (59.7%) | 200 (40.3%) |
| Educational Services | 545 (25.9%) | 1,557 (74.1%) |
| Health Care & Social Assistance | 883 (21.3%) | 3,253 (78.6%) |
| Arts, Entertainment & Recreation | 144 (82.8%) | 30 (17.2%) |
| Accommodation & Food Services | 1,025 (53.7%) | 882 (46.3%) |
| Public Administration | 418 (53.9%) | 358 (46.1%) |
| Total | 8,079 (45.4%) | 9,710 (54.6%) |
Education in Monroe
School Enrollment in Monroe
The most common levels of schooling among the 12,845 students in Monroe are college / undergraduate (3,667 | 28.5%), high school (2,716 | 21.1%), and middle school (2,278 | 17.7%).
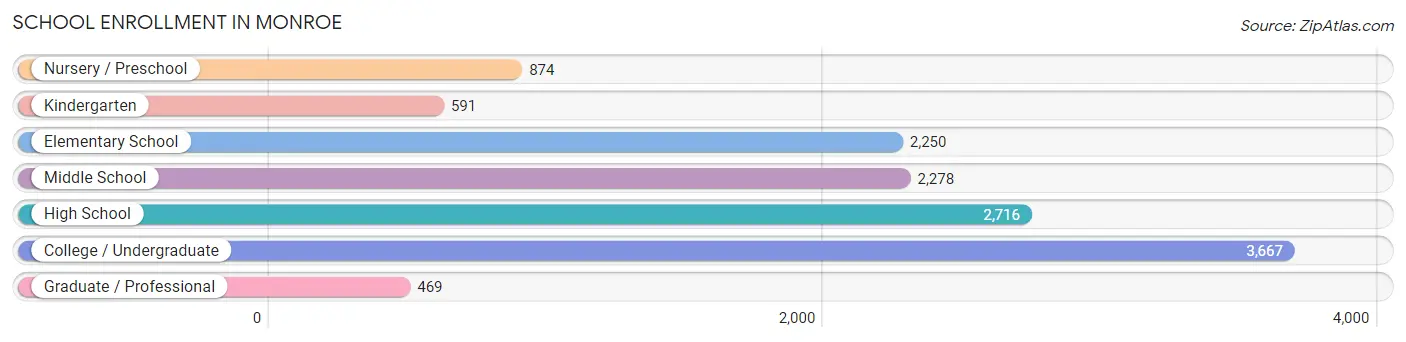
| School Level | # Students | % Students |
| Nursery / Preschool | 874 | 6.8% |
| Kindergarten | 591 | 4.6% |
| Elementary School | 2,250 | 17.5% |
| Middle School | 2,278 | 17.7% |
| High School | 2,716 | 21.1% |
| College / Undergraduate | 3,667 | 28.5% |
| Graduate / Professional | 469 | 3.6% |
| Total | 12,845 | 100.0% |
School Enrollment by Age by Funding Source in Monroe
Out of a total of 12,845 students who are enrolled in schools in Monroe, 2,312 (18.0%) attend a private institution, while the remaining 10,533 (82.0%) are enrolled in public schools. The age group of 35 years and over has the highest likelihood of being enrolled in private schools, with 128 (31.1% in the age bracket) enrolled. Conversely, the age group of 18 to 19 year olds has the lowest likelihood of being enrolled in a private school, with 1,458 (91.3% in the age bracket) attending a public institution.
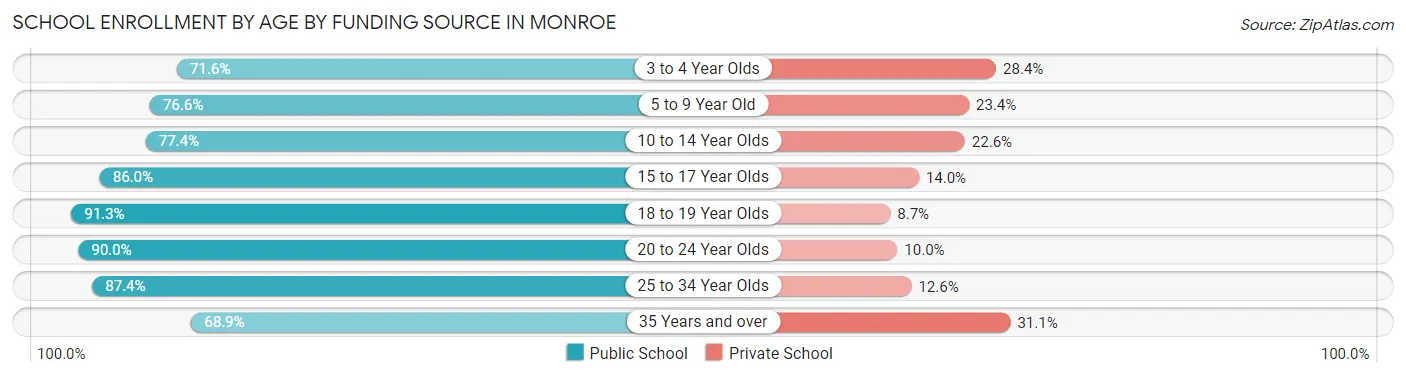
| Age Bracket | Public School | Private School |
| 3 to 4 Year Olds | 532 (71.6%) | 211 (28.4%) |
| 5 to 9 Year Old | 2,008 (76.6%) | 612 (23.4%) |
| 10 to 14 Year Olds | 2,328 (77.4%) | 679 (22.6%) |
| 15 to 17 Year Olds | 1,564 (86.0%) | 255 (14.0%) |
| 18 to 19 Year Olds | 1,458 (91.3%) | 139 (8.7%) |
| 20 to 24 Year Olds | 1,798 (90.0%) | 200 (10.0%) |
| 25 to 34 Year Olds | 567 (87.4%) | 82 (12.6%) |
| 35 Years and over | 284 (68.9%) | 128 (31.1%) |
| Total | 10,533 (82.0%) | 2,312 (18.0%) |
Educational Attainment by Field of Study in Monroe
Education (1,539 | 18.1%), business (1,273 | 15.0%), science & technology (1,210 | 14.2%), liberal arts & history (779 | 9.2%), and arts & humanities (740 | 8.7%) are the most common fields of study among 8,500 individuals in Monroe who have obtained a bachelor's degree or higher.
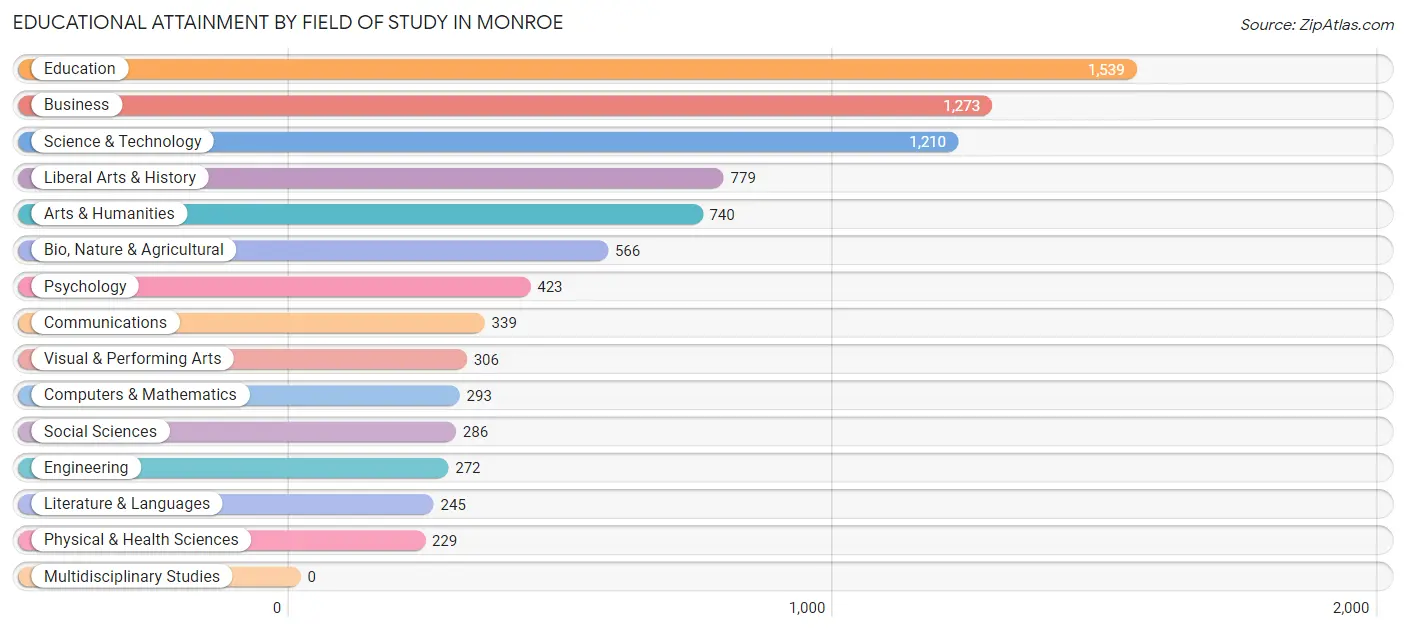
| Field of Study | # Graduates | % Graduates |
| Computers & Mathematics | 293 | 3.5% |
| Bio, Nature & Agricultural | 566 | 6.7% |
| Physical & Health Sciences | 229 | 2.7% |
| Psychology | 423 | 5.0% |
| Social Sciences | 286 | 3.4% |
| Engineering | 272 | 3.2% |
| Multidisciplinary Studies | 0 | 0.0% |
| Science & Technology | 1,210 | 14.2% |
| Business | 1,273 | 15.0% |
| Education | 1,539 | 18.1% |
| Literature & Languages | 245 | 2.9% |
| Liberal Arts & History | 779 | 9.2% |
| Visual & Performing Arts | 306 | 3.6% |
| Communications | 339 | 4.0% |
| Arts & Humanities | 740 | 8.7% |
| Total | 8,500 | 100.0% |
Transportation & Commute in Monroe
Vehicle Availability by Sex in Monroe
The most prevalent vehicle ownership categories in Monroe are males with 2 vehicles (3,297, accounting for 42.6%) and females with 2 vehicles (3,324, making up 36.2%).
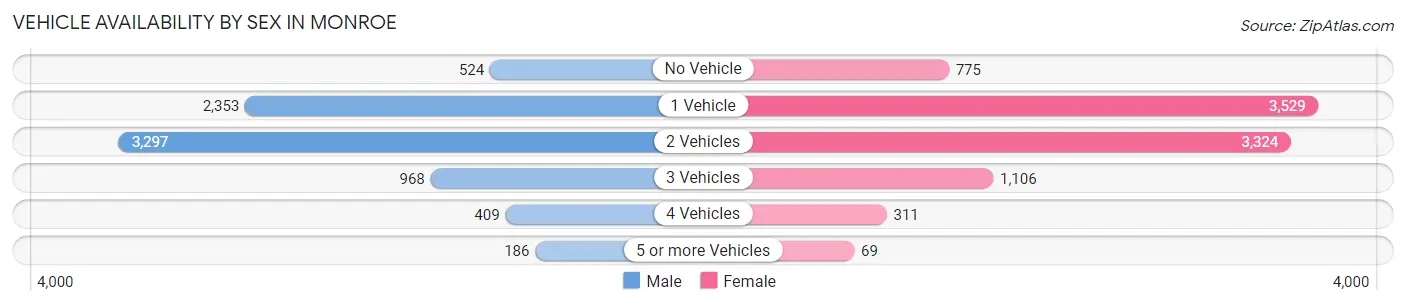
| Vehicles Available | Male | Female |
| No Vehicle | 524 (6.8%) | 775 (8.5%) |
| 1 Vehicle | 2,353 (30.4%) | 3,529 (38.7%) |
| 2 Vehicles | 3,297 (42.6%) | 3,324 (36.5%) |
| 3 Vehicles | 968 (12.5%) | 1,106 (12.1%) |
| 4 Vehicles | 409 (5.3%) | 311 (3.4%) |
| 5 or more Vehicles | 186 (2.4%) | 69 (0.8%) |
| Total | 7,737 (100.0%) | 9,114 (100.0%) |
Commute Time in Monroe
The most frequently occuring commute durations in Monroe are 10 to 14 minutes (4,539 commuters, 27.6%), 15 to 19 minutes (4,352 commuters, 26.4%), and 5 to 9 minutes (2,812 commuters, 17.1%).
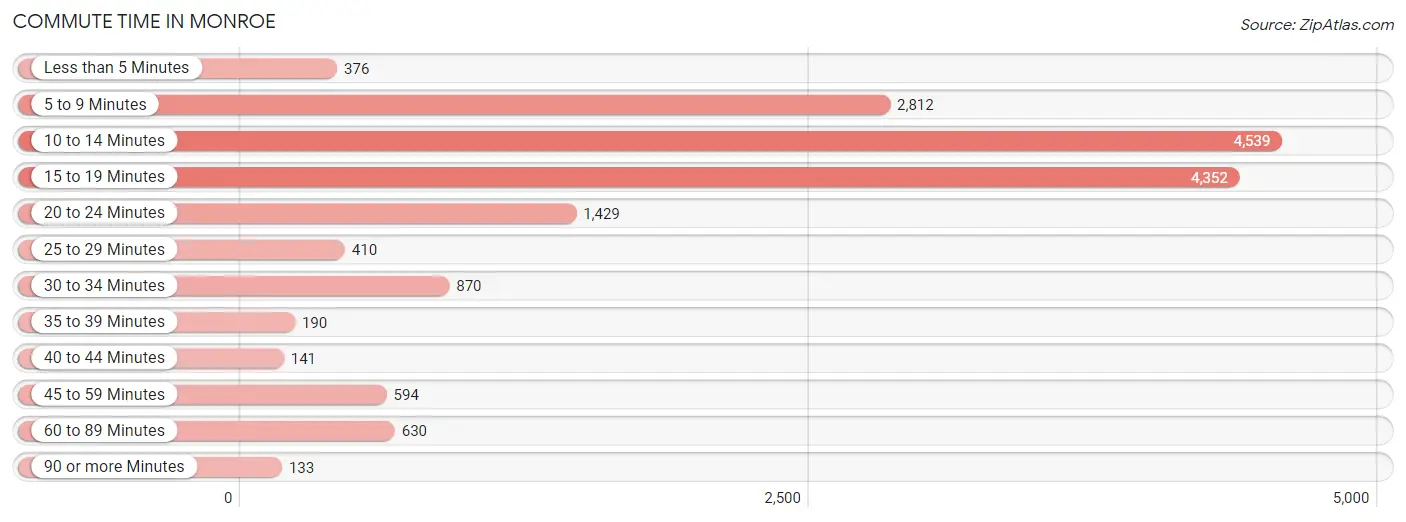
| Commute Time | # Commuters | % Commuters |
| Less than 5 Minutes | 376 | 2.3% |
| 5 to 9 Minutes | 2,812 | 17.1% |
| 10 to 14 Minutes | 4,539 | 27.6% |
| 15 to 19 Minutes | 4,352 | 26.4% |
| 20 to 24 Minutes | 1,429 | 8.7% |
| 25 to 29 Minutes | 410 | 2.5% |
| 30 to 34 Minutes | 870 | 5.3% |
| 35 to 39 Minutes | 190 | 1.1% |
| 40 to 44 Minutes | 141 | 0.9% |
| 45 to 59 Minutes | 594 | 3.6% |
| 60 to 89 Minutes | 630 | 3.8% |
| 90 or more Minutes | 133 | 0.8% |
Commute Time by Sex in Monroe
The most common commute times in Monroe are 15 to 19 minutes (2,188 commuters, 29.3%) for males and 10 to 14 minutes (2,519 commuters, 28.0%) for females.
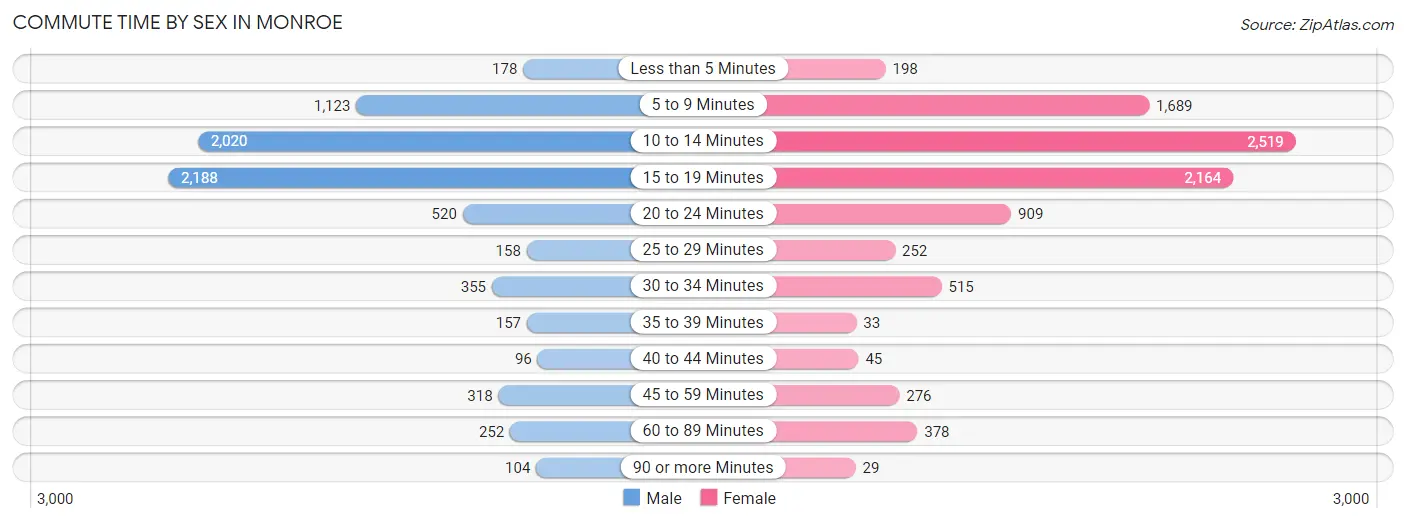
| Commute Time | Male | Female |
| Less than 5 Minutes | 178 (2.4%) | 198 (2.2%) |
| 5 to 9 Minutes | 1,123 (15.0%) | 1,689 (18.8%) |
| 10 to 14 Minutes | 2,020 (27.1%) | 2,519 (28.0%) |
| 15 to 19 Minutes | 2,188 (29.3%) | 2,164 (24.0%) |
| 20 to 24 Minutes | 520 (7.0%) | 909 (10.1%) |
| 25 to 29 Minutes | 158 (2.1%) | 252 (2.8%) |
| 30 to 34 Minutes | 355 (4.8%) | 515 (5.7%) |
| 35 to 39 Minutes | 157 (2.1%) | 33 (0.4%) |
| 40 to 44 Minutes | 96 (1.3%) | 45 (0.5%) |
| 45 to 59 Minutes | 318 (4.3%) | 276 (3.1%) |
| 60 to 89 Minutes | 252 (3.4%) | 378 (4.2%) |
| 90 or more Minutes | 104 (1.4%) | 29 (0.3%) |
Time of Departure to Work by Sex in Monroe
The most frequent times of departure to work in Monroe are 7:30 AM to 7:59 AM (1,386, 18.6%) for males and 7:00 AM to 7:29 AM (1,806, 20.1%) for females.
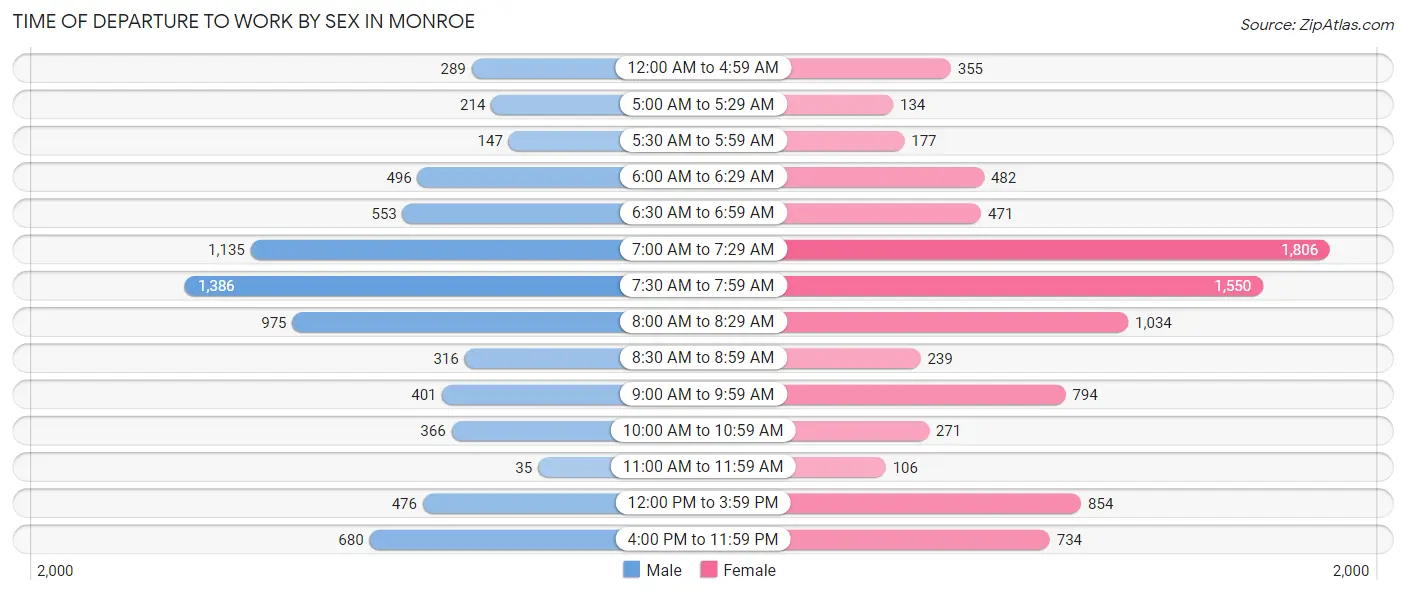
| Time of Departure | Male | Female |
| 12:00 AM to 4:59 AM | 289 (3.9%) | 355 (3.9%) |
| 5:00 AM to 5:29 AM | 214 (2.9%) | 134 (1.5%) |
| 5:30 AM to 5:59 AM | 147 (2.0%) | 177 (2.0%) |
| 6:00 AM to 6:29 AM | 496 (6.6%) | 482 (5.3%) |
| 6:30 AM to 6:59 AM | 553 (7.4%) | 471 (5.2%) |
| 7:00 AM to 7:29 AM | 1,135 (15.2%) | 1,806 (20.1%) |
| 7:30 AM to 7:59 AM | 1,386 (18.6%) | 1,550 (17.2%) |
| 8:00 AM to 8:29 AM | 975 (13.1%) | 1,034 (11.5%) |
| 8:30 AM to 8:59 AM | 316 (4.2%) | 239 (2.6%) |
| 9:00 AM to 9:59 AM | 401 (5.4%) | 794 (8.8%) |
| 10:00 AM to 10:59 AM | 366 (4.9%) | 271 (3.0%) |
| 11:00 AM to 11:59 AM | 35 (0.5%) | 106 (1.2%) |
| 12:00 PM to 3:59 PM | 476 (6.4%) | 854 (9.5%) |
| 4:00 PM to 11:59 PM | 680 (9.1%) | 734 (8.2%) |
| Total | 7,469 (100.0%) | 9,007 (100.0%) |
Housing Occupancy in Monroe
Occupancy by Ownership in Monroe
Of the total 17,936 dwellings in Monroe, owner-occupied units account for 7,995 (44.6%), while renter-occupied units make up 9,941 (55.4%).
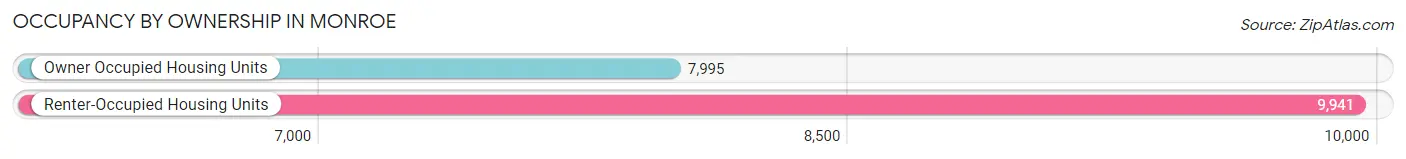
| Occupancy | # Housing Units | % Housing Units |
| Owner Occupied Housing Units | 7,995 | 44.6% |
| Renter-Occupied Housing Units | 9,941 | 55.4% |
| Total Occupied Housing Units | 17,936 | 100.0% |
Occupancy by Household Size in Monroe
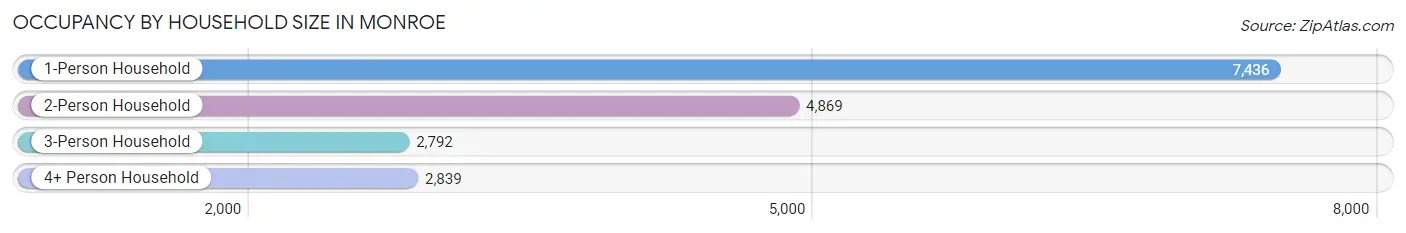
| Household Size | # Housing Units | % Housing Units |
| 1-Person Household | 7,436 | 41.5% |
| 2-Person Household | 4,869 | 27.2% |
| 3-Person Household | 2,792 | 15.6% |
| 4+ Person Household | 2,839 | 15.8% |
| Total Housing Units | 17,936 | 100.0% |
Occupancy by Ownership by Household Size in Monroe
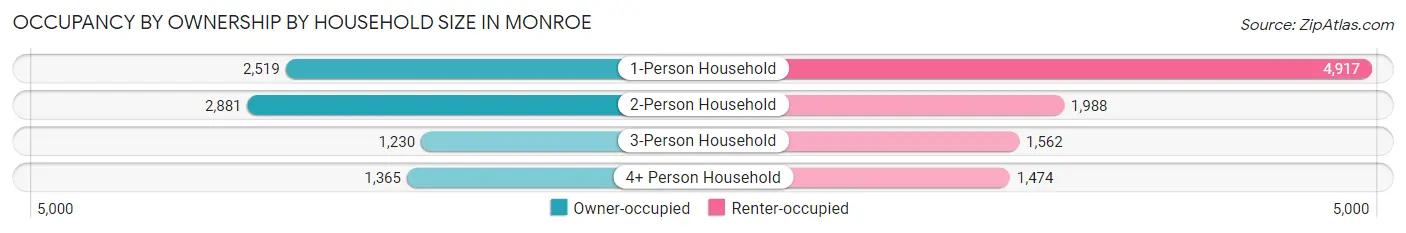
| Household Size | Owner-occupied | Renter-occupied |
| 1-Person Household | 2,519 (33.9%) | 4,917 (66.1%) |
| 2-Person Household | 2,881 (59.2%) | 1,988 (40.8%) |
| 3-Person Household | 1,230 (44.1%) | 1,562 (55.9%) |
| 4+ Person Household | 1,365 (48.1%) | 1,474 (51.9%) |
| Total Housing Units | 7,995 (44.6%) | 9,941 (55.4%) |
Occupancy by Educational Attainment in Monroe
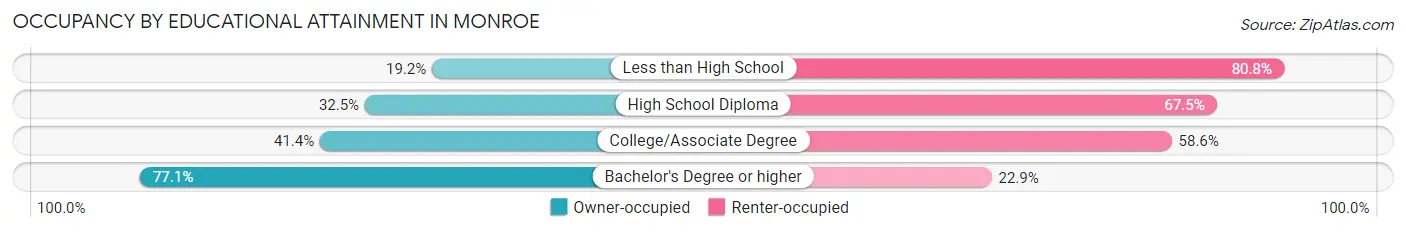
| Household Size | Owner-occupied | Renter-occupied |
| Less than High School | 486 (19.2%) | 2,045 (80.8%) |
| High School Diploma | 1,766 (32.5%) | 3,664 (67.5%) |
| College/Associate Degree | 2,264 (41.4%) | 3,200 (58.6%) |
| Bachelor's Degree or higher | 3,479 (77.1%) | 1,032 (22.9%) |
Occupancy by Age of Householder in Monroe
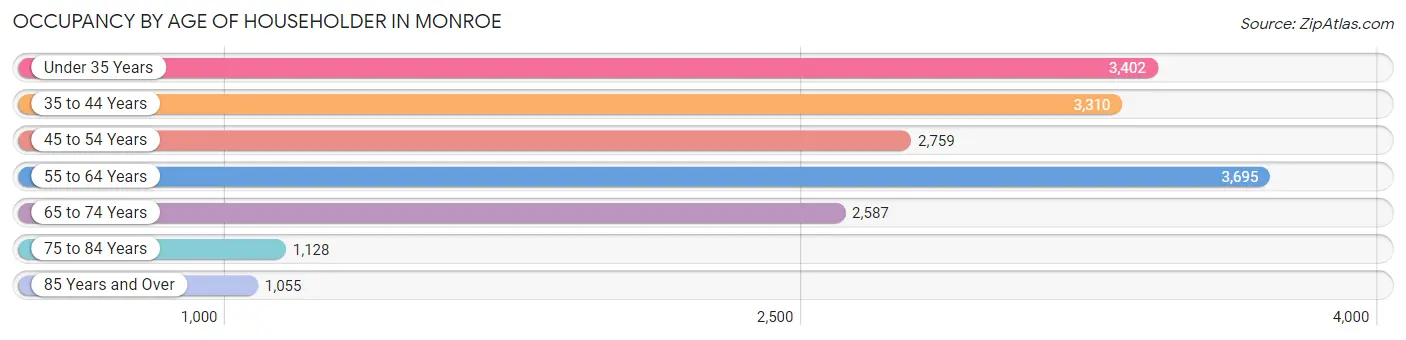
| Age Bracket | # Households | % Households |
| Under 35 Years | 3,402 | 19.0% |
| 35 to 44 Years | 3,310 | 18.4% |
| 45 to 54 Years | 2,759 | 15.4% |
| 55 to 64 Years | 3,695 | 20.6% |
| 65 to 74 Years | 2,587 | 14.4% |
| 75 to 84 Years | 1,128 | 6.3% |
| 85 Years and Over | 1,055 | 5.9% |
| Total | 17,936 | 100.0% |
Housing Finances in Monroe
Median Income by Occupancy in Monroe
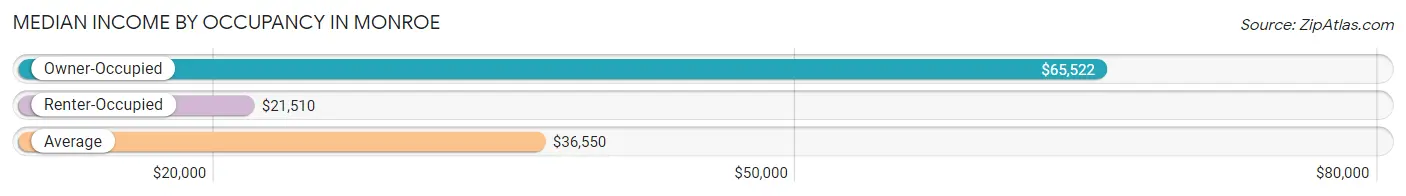
| Occupancy Type | # Households | Median Income |
| Owner-Occupied | 7,995 (44.6%) | $65,522 |
| Renter-Occupied | 9,941 (55.4%) | $21,510 |
| Average | 17,936 (100.0%) | $36,550 |
Occupancy by Householder Income Bracket in Monroe
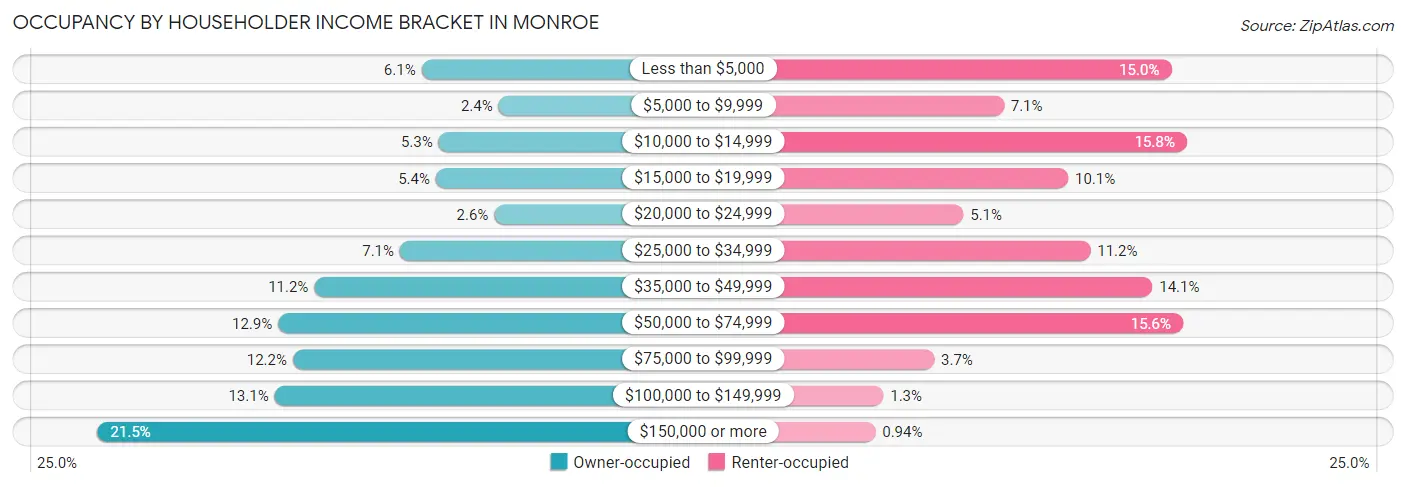
| Income Bracket | Owner-occupied | Renter-occupied |
| Less than $5,000 | 488 (6.1%) | 1,494 (15.0%) |
| $5,000 to $9,999 | 194 (2.4%) | 702 (7.1%) |
| $10,000 to $14,999 | 423 (5.3%) | 1,568 (15.8%) |
| $15,000 to $19,999 | 433 (5.4%) | 1,006 (10.1%) |
| $20,000 to $24,999 | 211 (2.6%) | 510 (5.1%) |
| $25,000 to $34,999 | 570 (7.1%) | 1,111 (11.2%) |
| $35,000 to $49,999 | 896 (11.2%) | 1,405 (14.1%) |
| $50,000 to $74,999 | 1,034 (12.9%) | 1,549 (15.6%) |
| $75,000 to $99,999 | 978 (12.2%) | 372 (3.7%) |
| $100,000 to $149,999 | 1,047 (13.1%) | 131 (1.3%) |
| $150,000 or more | 1,721 (21.5%) | 93 (0.9%) |
| Total | 7,995 (100.0%) | 9,941 (100.0%) |
Monthly Housing Cost Tiers in Monroe
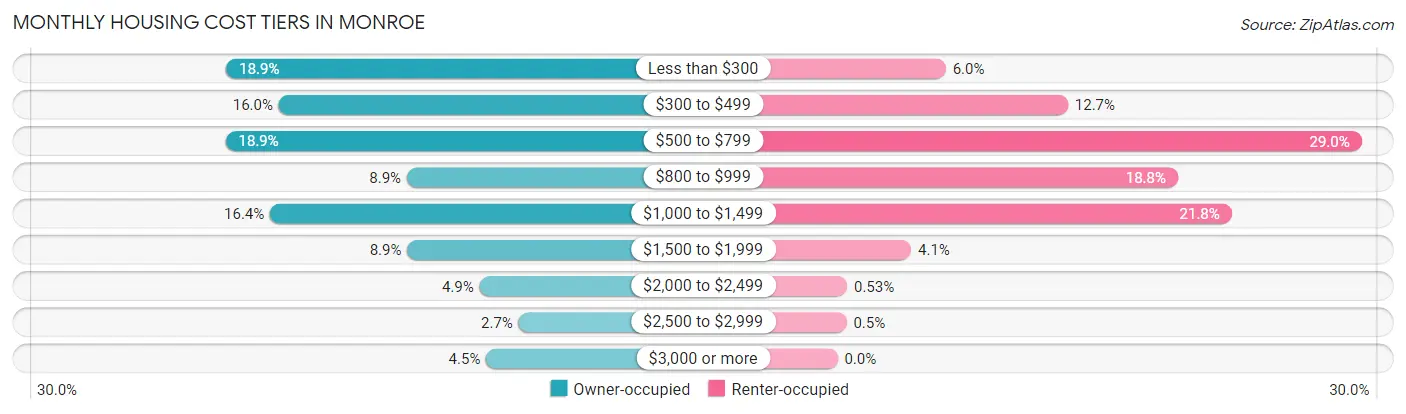
| Monthly Cost | Owner-occupied | Renter-occupied |
| Less than $300 | 1,509 (18.9%) | 594 (6.0%) |
| $300 to $499 | 1,276 (16.0%) | 1,265 (12.7%) |
| $500 to $799 | 1,512 (18.9%) | 2,878 (28.9%) |
| $800 to $999 | 710 (8.9%) | 1,869 (18.8%) |
| $1,000 to $1,499 | 1,314 (16.4%) | 2,164 (21.8%) |
| $1,500 to $1,999 | 708 (8.9%) | 405 (4.1%) |
| $2,000 to $2,499 | 389 (4.9%) | 53 (0.5%) |
| $2,500 to $2,999 | 217 (2.7%) | 50 (0.5%) |
| $3,000 or more | 360 (4.5%) | 0 (0.0%) |
| Total | 7,995 (100.0%) | 9,941 (100.0%) |
Physical Housing Characteristics in Monroe
Housing Structures in Monroe
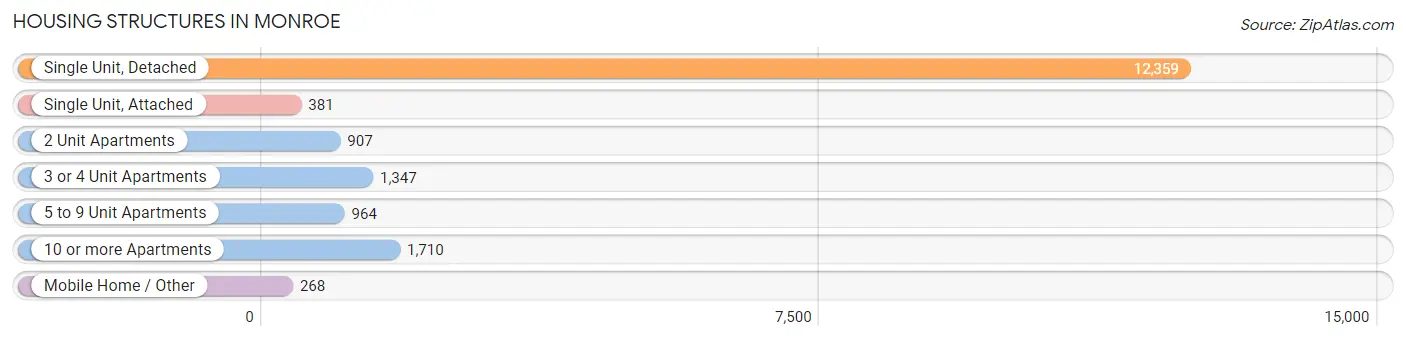
| Structure Type | # Housing Units | % Housing Units |
| Single Unit, Detached | 12,359 | 68.9% |
| Single Unit, Attached | 381 | 2.1% |
| 2 Unit Apartments | 907 | 5.1% |
| 3 or 4 Unit Apartments | 1,347 | 7.5% |
| 5 to 9 Unit Apartments | 964 | 5.4% |
| 10 or more Apartments | 1,710 | 9.5% |
| Mobile Home / Other | 268 | 1.5% |
| Total | 17,936 | 100.0% |
Housing Structures by Occupancy in Monroe
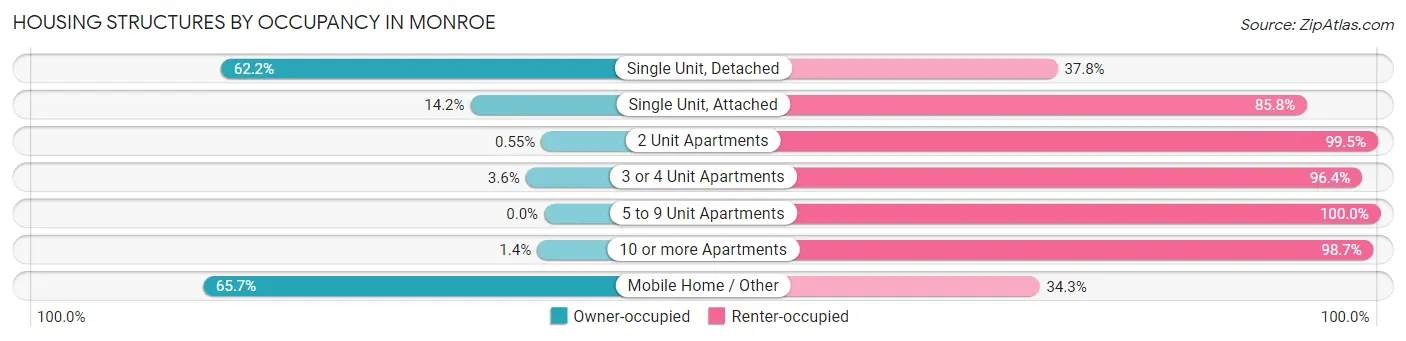
| Structure Type | Owner-occupied | Renter-occupied |
| Single Unit, Detached | 7,689 (62.2%) | 4,670 (37.8%) |
| Single Unit, Attached | 54 (14.2%) | 327 (85.8%) |
| 2 Unit Apartments | 5 (0.5%) | 902 (99.5%) |
| 3 or 4 Unit Apartments | 48 (3.6%) | 1,299 (96.4%) |
| 5 to 9 Unit Apartments | 0 (0.0%) | 964 (100.0%) |
| 10 or more Apartments | 23 (1.3%) | 1,687 (98.7%) |
| Mobile Home / Other | 176 (65.7%) | 92 (34.3%) |
| Total | 7,995 (44.6%) | 9,941 (55.4%) |
Housing Structures by Number of Rooms in Monroe
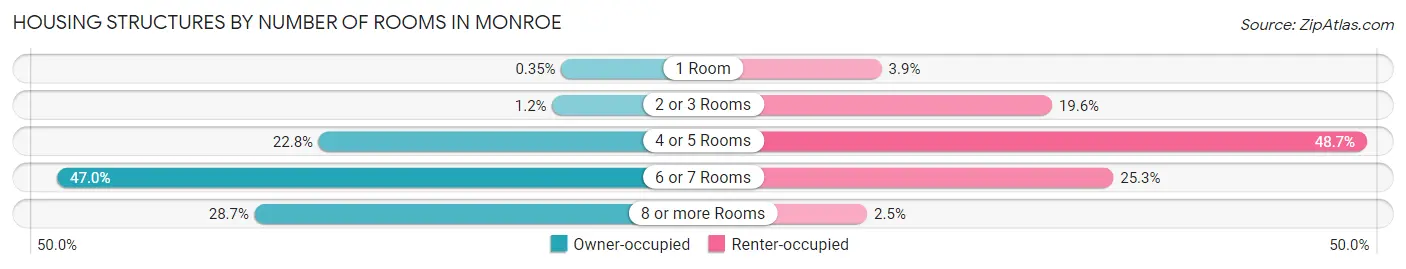
| Number of Rooms | Owner-occupied | Renter-occupied |
| 1 Room | 28 (0.4%) | 384 (3.9%) |
| 2 or 3 Rooms | 94 (1.2%) | 1,949 (19.6%) |
| 4 or 5 Rooms | 1,821 (22.8%) | 4,844 (48.7%) |
| 6 or 7 Rooms | 3,757 (47.0%) | 2,513 (25.3%) |
| 8 or more Rooms | 2,295 (28.7%) | 251 (2.5%) |
| Total | 7,995 (100.0%) | 9,941 (100.0%) |
Housing Structure by Heating Type in Monroe
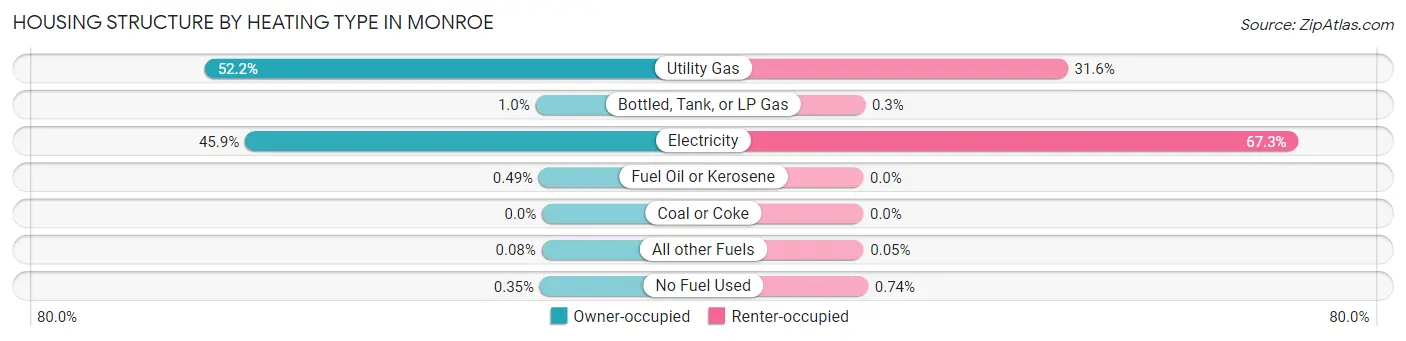
| Heating Type | Owner-occupied | Renter-occupied |
| Utility Gas | 4,169 (52.1%) | 3,142 (31.6%) |
| Bottled, Tank, or LP Gas | 81 (1.0%) | 30 (0.3%) |
| Electricity | 3,672 (45.9%) | 6,690 (67.3%) |
| Fuel Oil or Kerosene | 39 (0.5%) | 0 (0.0%) |
| Coal or Coke | 0 (0.0%) | 0 (0.0%) |
| All other Fuels | 6 (0.1%) | 5 (0.1%) |
| No Fuel Used | 28 (0.4%) | 74 (0.7%) |
| Total | 7,995 (100.0%) | 9,941 (100.0%) |
Household Vehicle Usage in Monroe
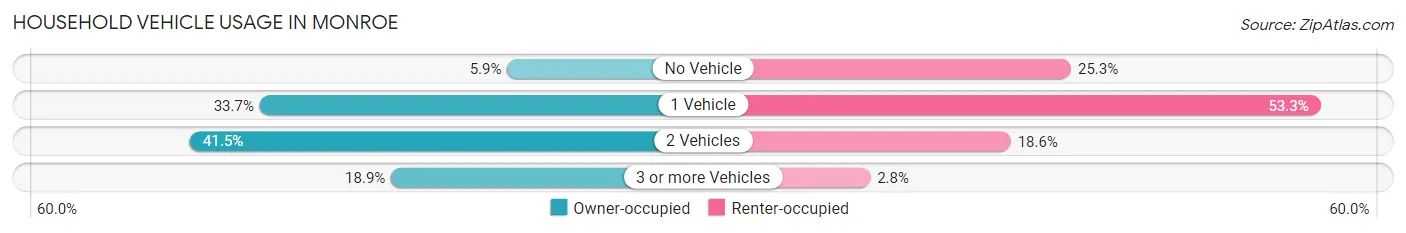
| Vehicles per Household | Owner-occupied | Renter-occupied |
| No Vehicle | 474 (5.9%) | 2,518 (25.3%) |
| 1 Vehicle | 2,691 (33.7%) | 5,296 (53.3%) |
| 2 Vehicles | 3,316 (41.5%) | 1,846 (18.6%) |
| 3 or more Vehicles | 1,514 (18.9%) | 281 (2.8%) |
| Total | 7,995 (100.0%) | 9,941 (100.0%) |
Real Estate & Mortgages in Monroe
Real Estate and Mortgage Overview in Monroe
| Characteristic | Without Mortgage | With Mortgage |
| Housing Units | 4,560 | 3,435 |
| Median Property Value | $101,000 | $228,400 |
| Median Household Income | $52,778 | $1,067 |
| Monthly Housing Costs | $405 | $346 |
| Real Estate Taxes | $334 | $36 |
Property Value by Mortgage Status in Monroe
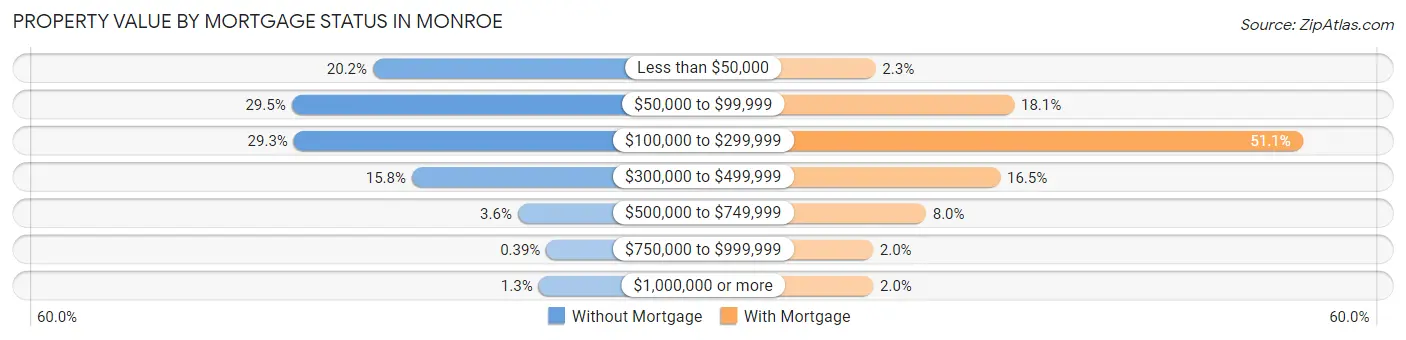
| Property Value | Without Mortgage | With Mortgage |
| Less than $50,000 | 921 (20.2%) | 78 (2.3%) |
| $50,000 to $99,999 | 1,345 (29.5%) | 622 (18.1%) |
| $100,000 to $299,999 | 1,334 (29.2%) | 1,755 (51.1%) |
| $300,000 to $499,999 | 718 (15.8%) | 567 (16.5%) |
| $500,000 to $749,999 | 166 (3.6%) | 276 (8.0%) |
| $750,000 to $999,999 | 18 (0.4%) | 68 (2.0%) |
| $1,000,000 or more | 58 (1.3%) | 69 (2.0%) |
| Total | 4,560 (100.0%) | 3,435 (100.0%) |
Household Income by Mortgage Status in Monroe
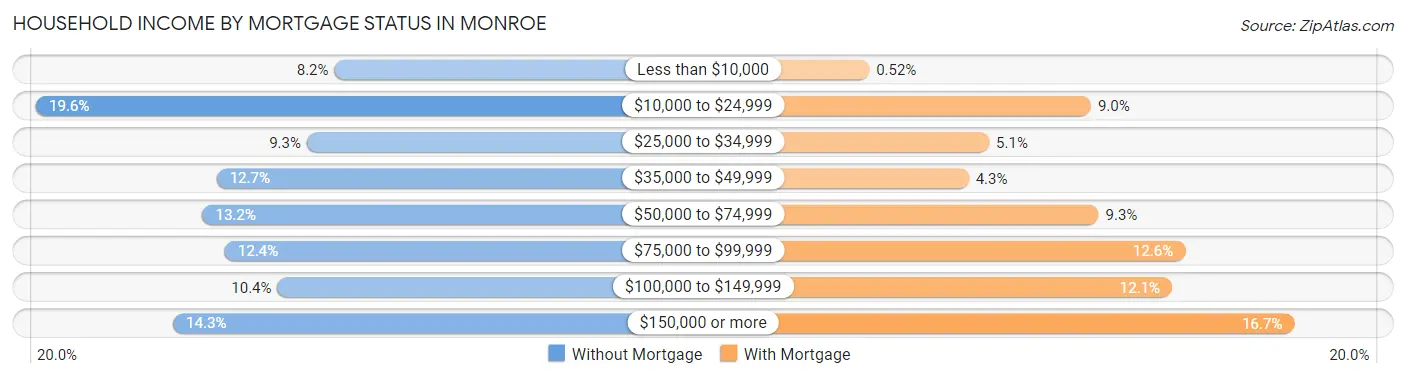
| Household Income | Without Mortgage | With Mortgage |
| Less than $10,000 | 374 (8.2%) | 18 (0.5%) |
| $10,000 to $24,999 | 892 (19.6%) | 308 (9.0%) |
| $25,000 to $34,999 | 422 (9.2%) | 175 (5.1%) |
| $35,000 to $49,999 | 578 (12.7%) | 148 (4.3%) |
| $50,000 to $74,999 | 603 (13.2%) | 318 (9.3%) |
| $75,000 to $99,999 | 564 (12.4%) | 431 (12.6%) |
| $100,000 to $149,999 | 473 (10.4%) | 414 (12.0%) |
| $150,000 or more | 654 (14.3%) | 574 (16.7%) |
| Total | 4,560 (100.0%) | 3,435 (100.0%) |
Property Value to Household Income Ratio in Monroe
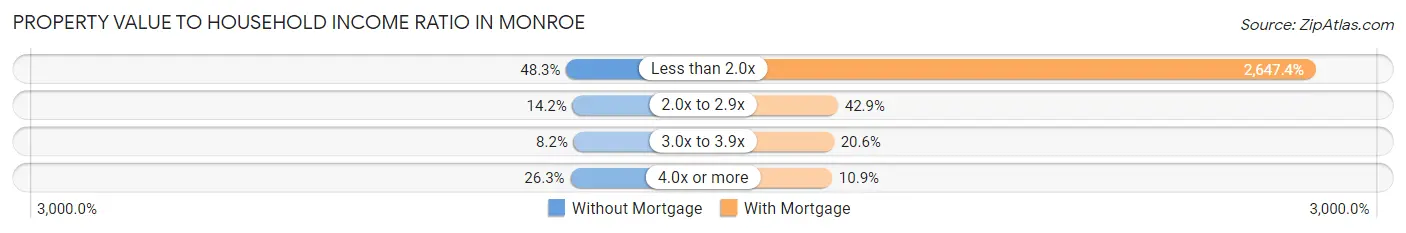
| Value-to-Income Ratio | Without Mortgage | With Mortgage |
| Less than 2.0x | 2,204 (48.3%) | 90,938 (2,647.4%) |
| 2.0x to 2.9x | 648 (14.2%) | 1,475 (42.9%) |
| 3.0x to 3.9x | 373 (8.2%) | 707 (20.6%) |
| 4.0x or more | 1,200 (26.3%) | 373 (10.9%) |
| Total | 4,560 (100.0%) | 3,435 (100.0%) |
Real Estate Taxes by Mortgage Status in Monroe
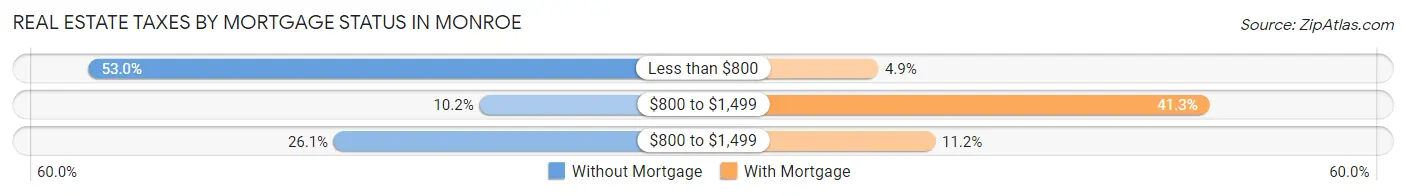
| Property Taxes | Without Mortgage | With Mortgage |
| Less than $800 | 2,416 (53.0%) | 169 (4.9%) |
| $800 to $1,499 | 463 (10.2%) | 1,417 (41.2%) |
| $800 to $1,499 | 1,190 (26.1%) | 384 (11.2%) |
| Total | 4,560 (100.0%) | 3,435 (100.0%) |
Health & Disability in Monroe
Health Insurance Coverage by Age in Monroe
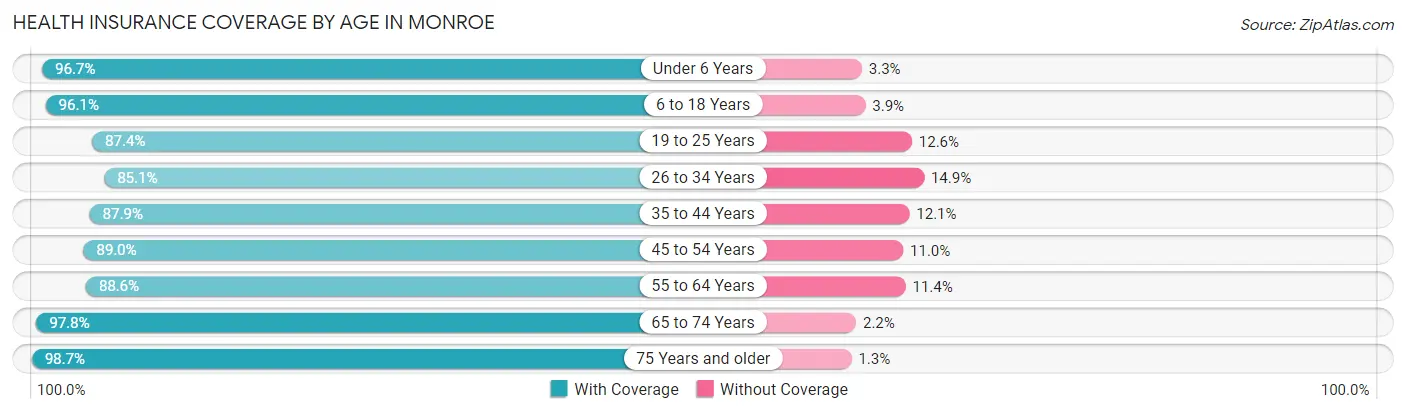
| Age Bracket | With Coverage | Without Coverage |
| Under 6 Years | 4,024 (96.7%) | 136 (3.3%) |
| 6 to 18 Years | 8,219 (96.1%) | 335 (3.9%) |
| 19 to 25 Years | 4,766 (87.4%) | 687 (12.6%) |
| 26 to 34 Years | 4,820 (85.1%) | 841 (14.9%) |
| 35 to 44 Years | 4,714 (87.9%) | 651 (12.1%) |
| 45 to 54 Years | 4,433 (89.0%) | 546 (11.0%) |
| 55 to 64 Years | 4,879 (88.6%) | 629 (11.4%) |
| 65 to 74 Years | 3,758 (97.8%) | 84 (2.2%) |
| 75 Years and older | 2,812 (98.7%) | 38 (1.3%) |
| Total | 42,425 (91.5%) | 3,947 (8.5%) |
Health Insurance Coverage by Citizenship Status in Monroe
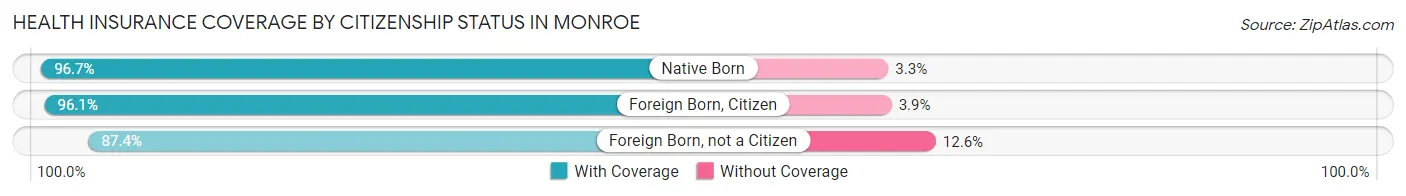
| Citizenship Status | With Coverage | Without Coverage |
| Native Born | 4,024 (96.7%) | 136 (3.3%) |
| Foreign Born, Citizen | 8,219 (96.1%) | 335 (3.9%) |
| Foreign Born, not a Citizen | 4,766 (87.4%) | 687 (12.6%) |
Health Insurance Coverage by Household Income in Monroe
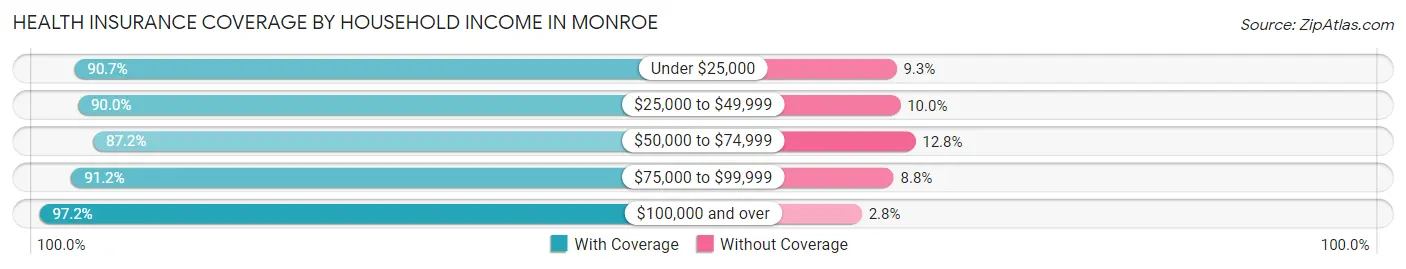
| Household Income | With Coverage | Without Coverage |
| Under $25,000 | 13,216 (90.7%) | 1,357 (9.3%) |
| $25,000 to $49,999 | 8,993 (90.0%) | 1,000 (10.0%) |
| $50,000 to $74,999 | 5,436 (87.2%) | 800 (12.8%) |
| $75,000 to $99,999 | 3,433 (91.2%) | 330 (8.8%) |
| $100,000 and over | 9,331 (97.2%) | 268 (2.8%) |
Public vs Private Health Insurance Coverage by Age in Monroe
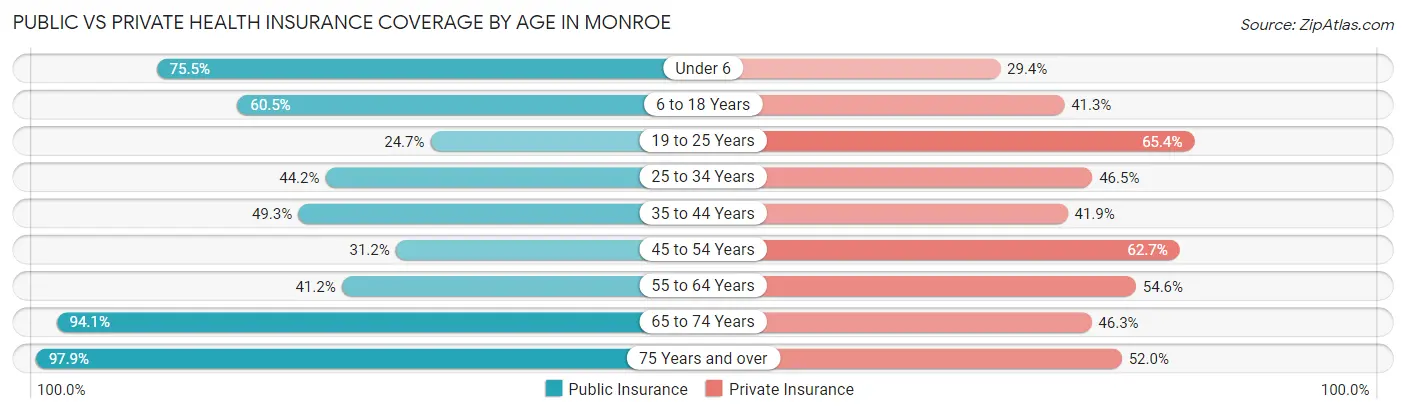
| Age Bracket | Public Insurance | Private Insurance |
| Under 6 | 3,140 (75.5%) | 1,222 (29.4%) |
| 6 to 18 Years | 5,174 (60.5%) | 3,531 (41.3%) |
| 19 to 25 Years | 1,347 (24.7%) | 3,567 (65.4%) |
| 25 to 34 Years | 2,501 (44.2%) | 2,631 (46.5%) |
| 35 to 44 Years | 2,643 (49.3%) | 2,248 (41.9%) |
| 45 to 54 Years | 1,551 (31.1%) | 3,122 (62.7%) |
| 55 to 64 Years | 2,268 (41.2%) | 3,006 (54.6%) |
| 65 to 74 Years | 3,614 (94.1%) | 1,780 (46.3%) |
| 75 Years and over | 2,791 (97.9%) | 1,481 (52.0%) |
| Total | 25,029 (54.0%) | 22,588 (48.7%) |
Disability Status by Sex by Age in Monroe
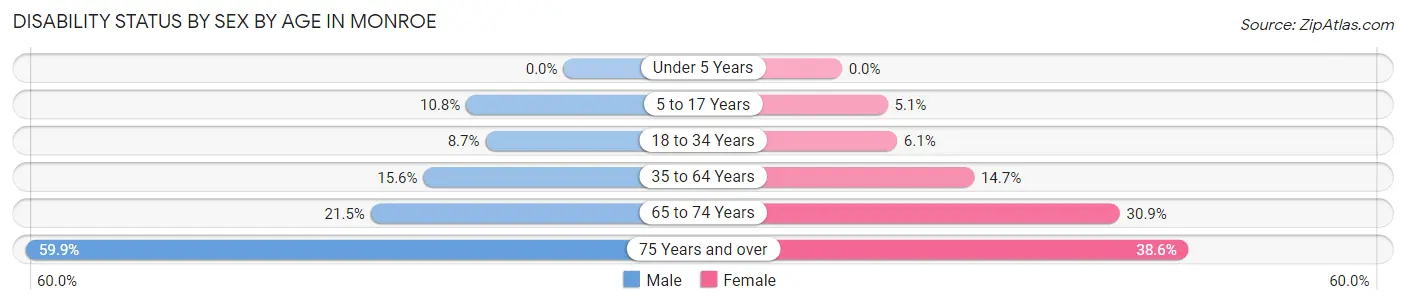
| Age Bracket | Male | Female |
| Under 5 Years | 0 (0.0%) | 0 (0.0%) |
| 5 to 17 Years | 476 (10.8%) | 209 (5.1%) |
| 18 to 34 Years | 488 (8.7%) | 383 (6.1%) |
| 35 to 64 Years | 1,124 (15.6%) | 1,272 (14.7%) |
| 65 to 74 Years | 359 (21.5%) | 671 (30.9%) |
| 75 Years and over | 650 (59.9%) | 681 (38.6%) |
Disability Class by Sex by Age in Monroe
Disability Class: Hearing Difficulty
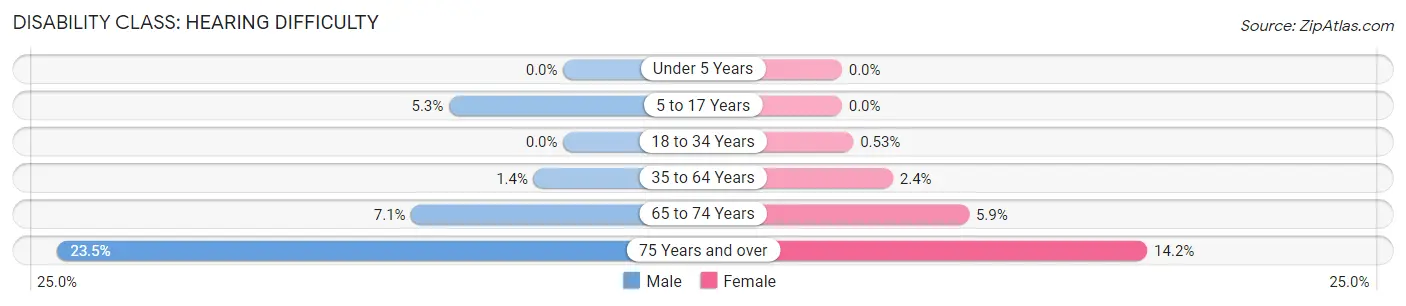
| Age Bracket | Male | Female |
| Under 5 Years | 0 (0.0%) | 0 (0.0%) |
| 5 to 17 Years | 233 (5.3%) | 0 (0.0%) |
| 18 to 34 Years | 0 (0.0%) | 33 (0.5%) |
| 35 to 64 Years | 99 (1.4%) | 205 (2.4%) |
| 65 to 74 Years | 118 (7.0%) | 128 (5.9%) |
| 75 Years and over | 255 (23.5%) | 250 (14.2%) |
Disability Class: Vision Difficulty
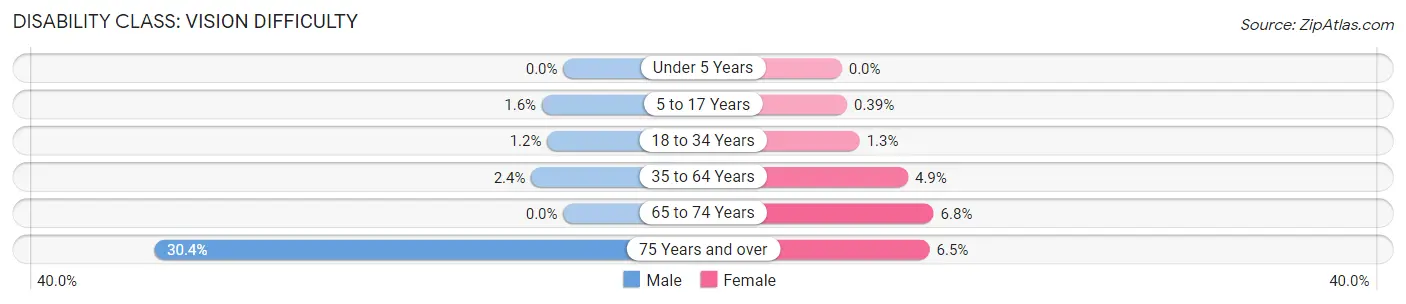
| Age Bracket | Male | Female |
| Under 5 Years | 0 (0.0%) | 0 (0.0%) |
| 5 to 17 Years | 70 (1.6%) | 16 (0.4%) |
| 18 to 34 Years | 67 (1.2%) | 83 (1.3%) |
| 35 to 64 Years | 172 (2.4%) | 425 (4.9%) |
| 65 to 74 Years | 0 (0.0%) | 148 (6.8%) |
| 75 Years and over | 330 (30.4%) | 115 (6.5%) |
Disability Class: Cognitive Difficulty
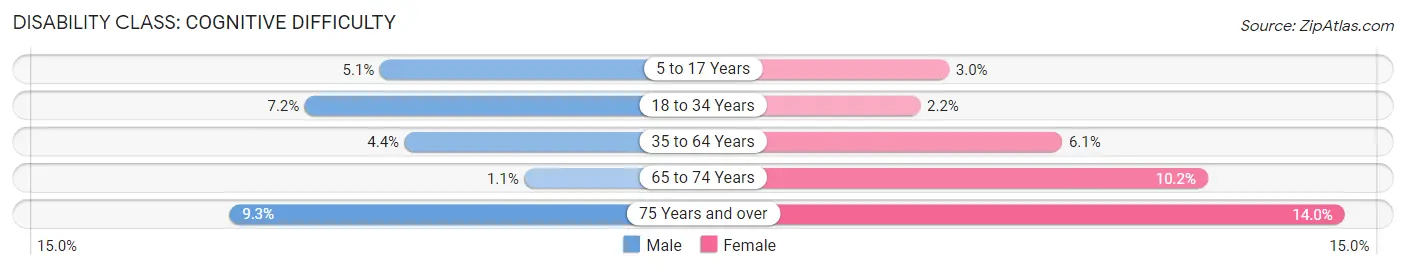
| Age Bracket | Male | Female |
| 5 to 17 Years | 224 (5.1%) | 122 (3.0%) |
| 18 to 34 Years | 404 (7.2%) | 136 (2.2%) |
| 35 to 64 Years | 318 (4.4%) | 530 (6.1%) |
| 65 to 74 Years | 18 (1.1%) | 221 (10.2%) |
| 75 Years and over | 101 (9.3%) | 247 (14.0%) |
Disability Class: Ambulatory Difficulty
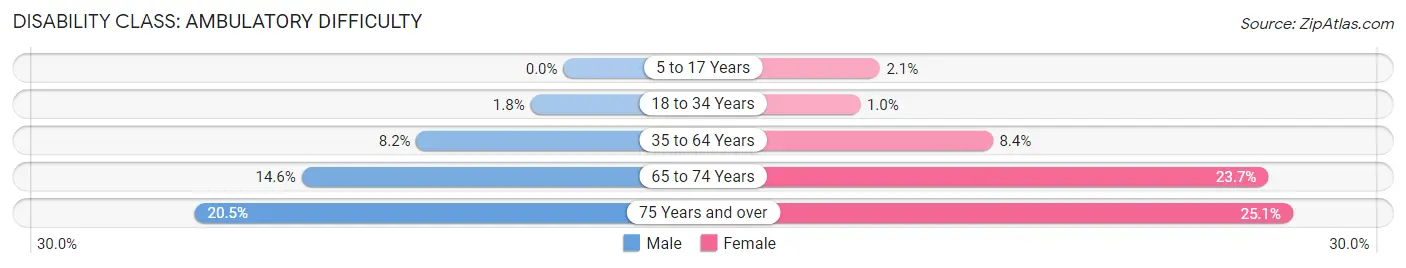
| Age Bracket | Male | Female |
| 5 to 17 Years | 0 (0.0%) | 86 (2.1%) |
| 18 to 34 Years | 103 (1.8%) | 63 (1.0%) |
| 35 to 64 Years | 590 (8.2%) | 725 (8.4%) |
| 65 to 74 Years | 244 (14.6%) | 515 (23.7%) |
| 75 Years and over | 223 (20.5%) | 443 (25.1%) |
Disability Class: Self-Care Difficulty
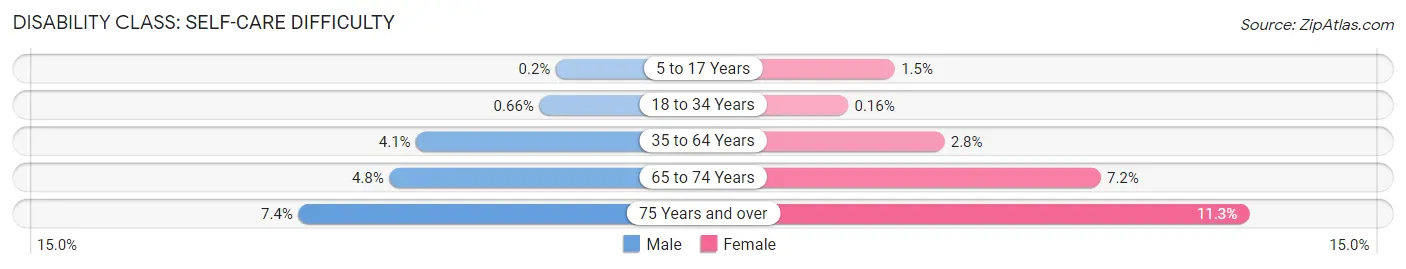
| Age Bracket | Male | Female |
| 5 to 17 Years | 9 (0.2%) | 60 (1.5%) |
| 18 to 34 Years | 37 (0.7%) | 10 (0.2%) |
| 35 to 64 Years | 295 (4.1%) | 245 (2.8%) |
| 65 to 74 Years | 81 (4.8%) | 156 (7.2%) |
| 75 Years and over | 80 (7.4%) | 200 (11.3%) |
Technology Access in Monroe
Computing Device Access in Monroe
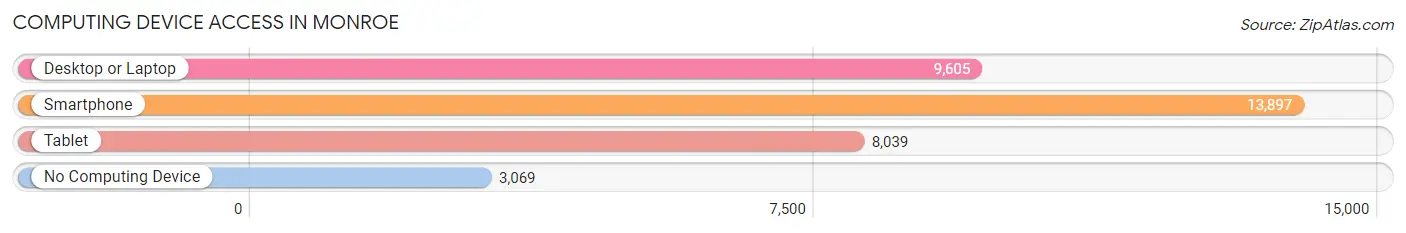
| Device Type | # Households | % Households |
| Desktop or Laptop | 9,605 | 53.5% |
| Smartphone | 13,897 | 77.5% |
| Tablet | 8,039 | 44.8% |
| No Computing Device | 3,069 | 17.1% |
| Total | 17,936 | 100.0% |
Internet Access in Monroe
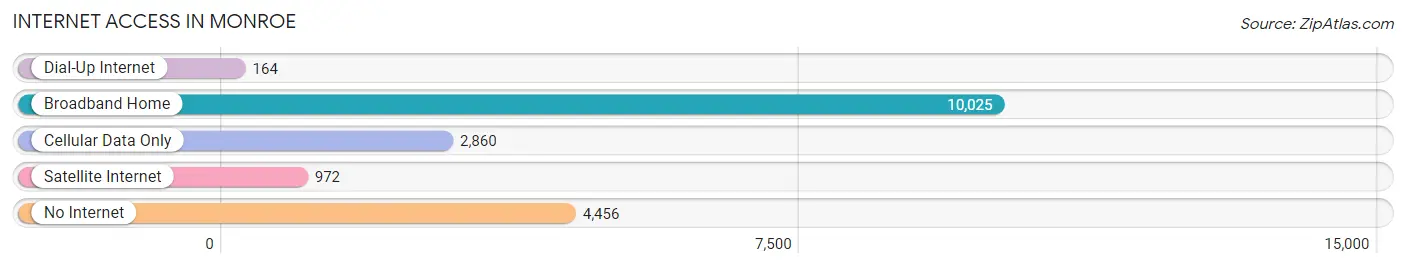
| Internet Type | # Households | % Households |
| Dial-Up Internet | 164 | 0.9% |
| Broadband Home | 10,025 | 55.9% |
| Cellular Data Only | 2,860 | 16.0% |
| Satellite Internet | 972 | 5.4% |
| No Internet | 4,456 | 24.8% |
| Total | 17,936 | 100.0% |
Monroe Summary
Monroe, Louisiana is a city located in the northeastern corner of the state, along the Ouachita River. It is the parish seat of Ouachita Parish and the eighth-largest city in the state. Monroe has a population of approximately 48,815 people, according to the 2010 census.
History
Monroe was founded in 1819 by settlers from the United States and France. The city was named after James Monroe, the fifth president of the United States. The city was originally a trading post and was known as the “Gateway to the Ouachita” due to its location at the confluence of the Ouachita and Tensas Rivers.
In the early 19th century, Monroe was a major port for steamboats traveling up and down the Ouachita River. The city was also a major center for the cotton trade. During the Civil War, Monroe was the site of several battles, including the Battle of Monroe in 1864.
In the late 19th century, Monroe became an important railroad hub. The city was also home to several large industries, including the Louisiana State Penitentiary, which opened in 1901.
Geography
Monroe is located in the northeastern corner of Louisiana, along the Ouachita River. The city is situated at the intersection of Interstate 20 and U.S. Highway 165. Monroe is approximately 90 miles east of Shreveport and 120 miles west of Jackson, Mississippi.
The city has a total area of 33.2 square miles, of which 32.9 square miles is land and 0.3 square miles is water. Monroe is located in a humid subtropical climate zone, with hot, humid summers and mild winters.
Economy
Monroe’s economy is largely based on manufacturing, healthcare, and education. The city is home to several large employers, including CenturyLink, the University of Louisiana at Monroe, and St. Francis Medical Center.
Monroe is also home to several large industrial parks, including the Monroe Industrial Park and the Ouachita Industrial Park. The city is also home to several large retail centers, including the Pecanland Mall and the Monroe Mall.
Demographics
According to the 2010 census, Monroe has a population of 48,815 people. The city has a median age of 33.7 years, with a population that is 54.2% African American, 37.3% White, 4.2% Hispanic or Latino, and 4.3% other.
The median household income in Monroe is $35,945, and the median family income is $44,945. The city has a poverty rate of 28.2%, with 22.3% of the population living below the poverty line.
Monroe is served by the Ouachita Parish School System, which includes 15 elementary schools, five middle schools, and four high schools. The city is also home to the University of Louisiana at Monroe, which has an enrollment of approximately 8,000 students.
Common Questions
What is Per Capita Income in Monroe?
Per Capita income in Monroe is $25,882.
What is the Median Family Income in Monroe?
Median Family Income in Monroe is $51,446.
What is the Median Household income in Monroe?
Median Household Income in Monroe is $36,550.
What is Income or Wage Gap in Monroe?
Income or Wage Gap in Monroe is 36.6%.
Women in Monroe earn 63.4 cents for every dollar earned by a man.
What is Family Income Deficit in Monroe?
Family Income Deficit in Monroe is $12,752.
Families that are below poverty line in Monroe earn $12,752 less on average than the poverty threshold level.
What is Inequality or Gini Index in Monroe?
Inequality or Gini Index in Monroe is 0.59.
What is the Total Population of Monroe?
Total Population of Monroe is 47,631.
What is the Total Male Population of Monroe?
Total Male Population of Monroe is 22,698.
What is the Total Female Population of Monroe?
Total Female Population of Monroe is 24,933.
What is the Ratio of Males per 100 Females in Monroe?
There are 91.04 Males per 100 Females in Monroe.
What is the Ratio of Females per 100 Males in Monroe?
There are 109.85 Females per 100 Males in Monroe.
What is the Median Population Age in Monroe?
Median Population Age in Monroe is 34.3 Years.
What is the Average Family Size in Monroe
Average Family Size in Monroe is 3.5 People.
What is the Average Household Size in Monroe
Average Household Size in Monroe is 2.5 People.
How Large is the Labor Force in Monroe?
There are 19,951 People in the Labor Forcein in Monroe.
What is the Percentage of People in the Labor Force in Monroe?
54.2% of People are in the Labor Force in Monroe.
What is the Unemployment Rate in Monroe?
Unemployment Rate in Monroe is 10.7%.