Troutdale, OR Map & Demographics
Troutdale Map
Troutdale Overview
$34,319
PER CAPITA INCOME
$94,671
AVG FAMILY INCOME
$86,307
AVG HOUSEHOLD INCOME
34.2%
WAGE / INCOME GAP [ % ]
65.8¢/ $1
WAGE / INCOME GAP [ $ ]
0.34
INEQUALITY / GINI INDEX
16,150
TOTAL POPULATION
8,325
MALE POPULATION
7,825
FEMALE POPULATION
106.39
MALES / 100 FEMALES
93.99
FEMALES / 100 MALES
35.4
MEDIAN AGE
3.5
AVG FAMILY SIZE
2.9
AVG HOUSEHOLD SIZE
8,750
LABOR FORCE [ PEOPLE ]
73.0%
PERCENT IN LABOR FORCE
4.4%
UNEMPLOYMENT RATE
Troutdale Zip Codes
Troutdale Area Codes
Income in Troutdale
Income Overview in Troutdale
Per Capita Income in Troutdale is $34,319, while median incomes of families and households are $94,671 and $86,307 respectively.
| Characteristic | Number | Measure |
| Per Capita Income | 16,150 | $34,319 |
| Median Family Income | 3,923 | $94,671 |
| Mean Family Income | 3,923 | $109,201 |
| Median Household Income | 5,503 | $86,307 |
| Mean Household Income | 5,503 | $99,333 |
| Income Deficit | 3,923 | $0 |
| Wage / Income Gap (%) | 16,150 | 34.21% |
| Wage / Income Gap ($) | 16,150 | 65.79¢ per $1 |
| Gini / Inequality Index | 16,150 | 0.34 |
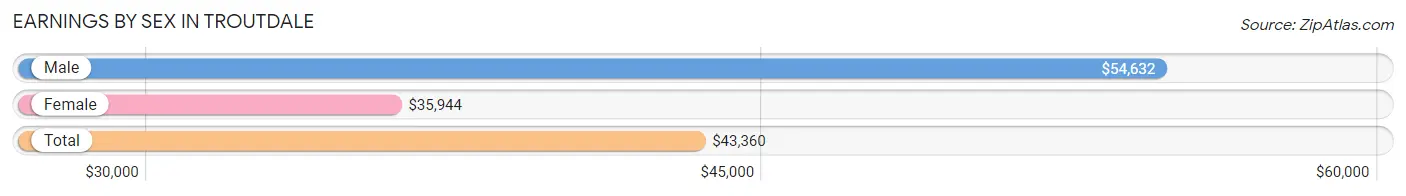
Earnings by Sex in Troutdale
Average Earnings in Troutdale are $43,360, $54,632 for men and $35,944 for women, a difference of 34.2%.
| Sex | Number | Average Earnings |
| Male | 4,594 (51.8%) | $54,632 |
| Female | 4,272 (48.2%) | $35,944 |
| Total | 8,866 (100.0%) | $43,360 |
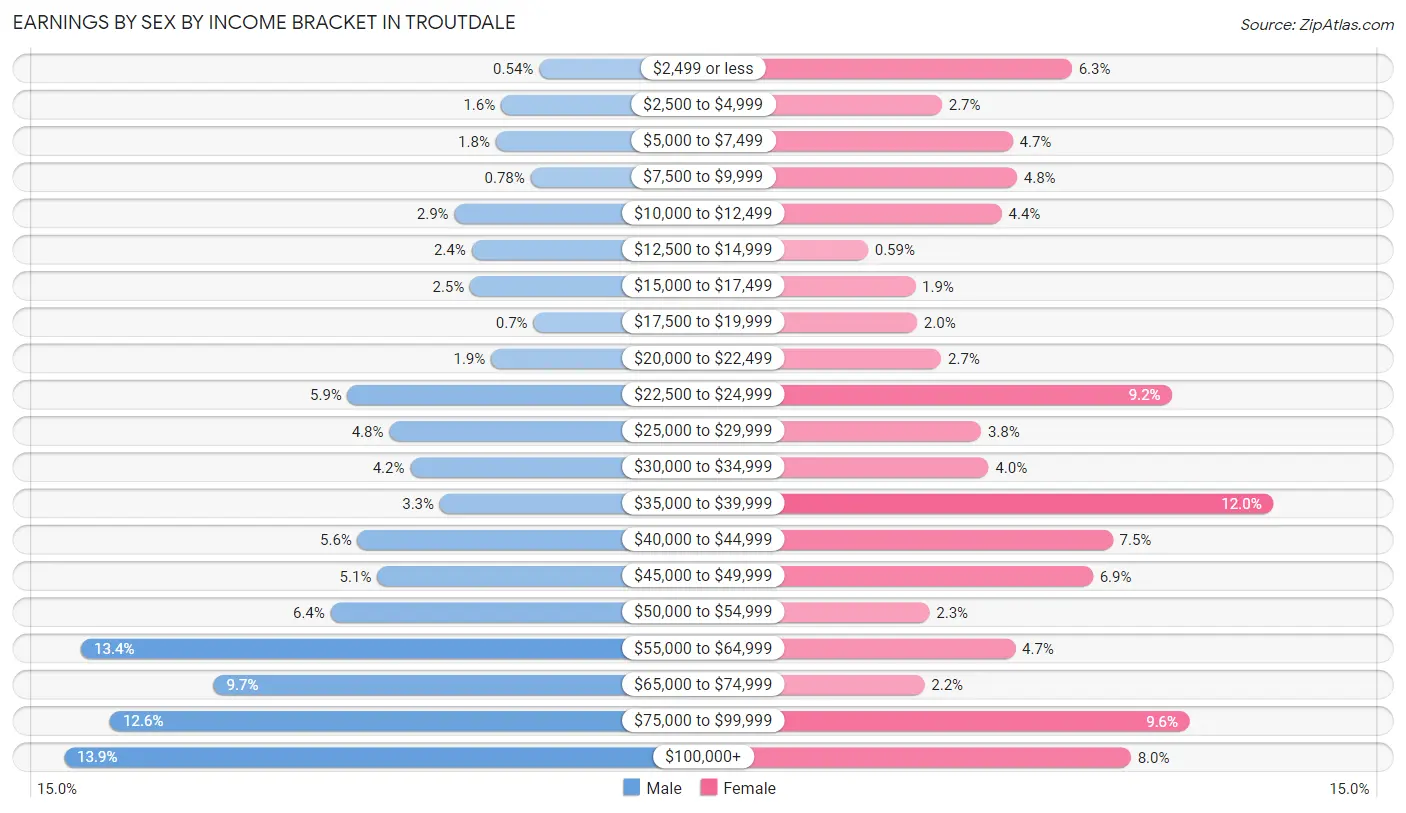
Earnings by Sex by Income Bracket in Troutdale
The most common earnings brackets in Troutdale are $100,000+ for men (638 | 13.9%) and $35,000 to $39,999 for women (512 | 12.0%).
| Income | Male | Female |
| $2,499 or less | 25 (0.5%) | 270 (6.3%) |
| $2,500 to $4,999 | 74 (1.6%) | 114 (2.7%) |
| $5,000 to $7,499 | 81 (1.8%) | 199 (4.7%) |
| $7,500 to $9,999 | 36 (0.8%) | 204 (4.8%) |
| $10,000 to $12,499 | 134 (2.9%) | 186 (4.3%) |
| $12,500 to $14,999 | 112 (2.4%) | 25 (0.6%) |
| $15,000 to $17,499 | 114 (2.5%) | 82 (1.9%) |
| $17,500 to $19,999 | 32 (0.7%) | 84 (2.0%) |
| $20,000 to $22,499 | 87 (1.9%) | 113 (2.6%) |
| $22,500 to $24,999 | 272 (5.9%) | 391 (9.1%) |
| $25,000 to $29,999 | 218 (4.8%) | 161 (3.8%) |
| $30,000 to $34,999 | 191 (4.2%) | 170 (4.0%) |
| $35,000 to $39,999 | 153 (3.3%) | 512 (12.0%) |
| $40,000 to $44,999 | 259 (5.6%) | 319 (7.5%) |
| $45,000 to $49,999 | 234 (5.1%) | 295 (6.9%) |
| $50,000 to $54,999 | 294 (6.4%) | 99 (2.3%) |
| $55,000 to $64,999 | 616 (13.4%) | 202 (4.7%) |
| $65,000 to $74,999 | 445 (9.7%) | 93 (2.2%) |
| $75,000 to $99,999 | 579 (12.6%) | 412 (9.6%) |
| $100,000+ | 638 (13.9%) | 341 (8.0%) |
| Total | 4,594 (100.0%) | 4,272 (100.0%) |
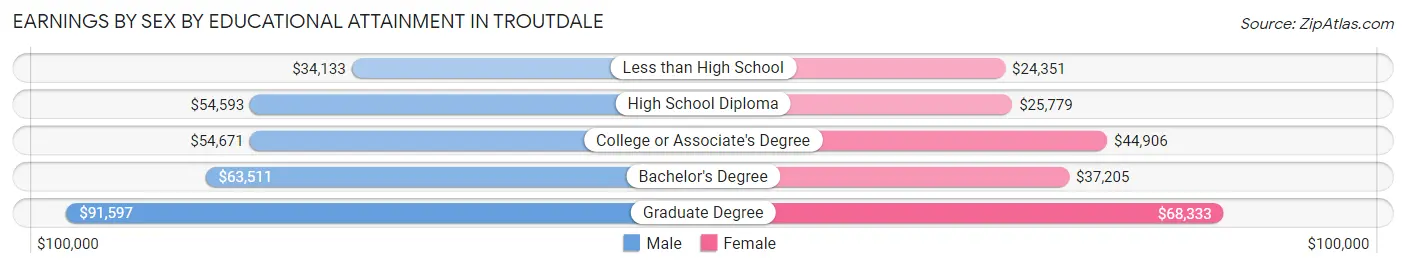
Earnings by Sex by Educational Attainment in Troutdale
Average earnings in Troutdale are $58,426 for men and $37,394 for women, a difference of 36.0%. Men with an educational attainment of graduate degree enjoy the highest average annual earnings of $91,597, while those with less than high school education earn the least with $34,133. Women with an educational attainment of graduate degree earn the most with the average annual earnings of $68,333, while those with less than high school education have the smallest earnings of $24,351.
| Educational Attainment | Male Income | Female Income |
| Less than High School | $34,133 | $24,351 |
| High School Diploma | $54,593 | $25,779 |
| College or Associate's Degree | $54,671 | $44,906 |
| Bachelor's Degree | $63,511 | $37,205 |
| Graduate Degree | $91,597 | $68,333 |
| Total | $58,426 | $37,394 |
Family Income in Troutdale
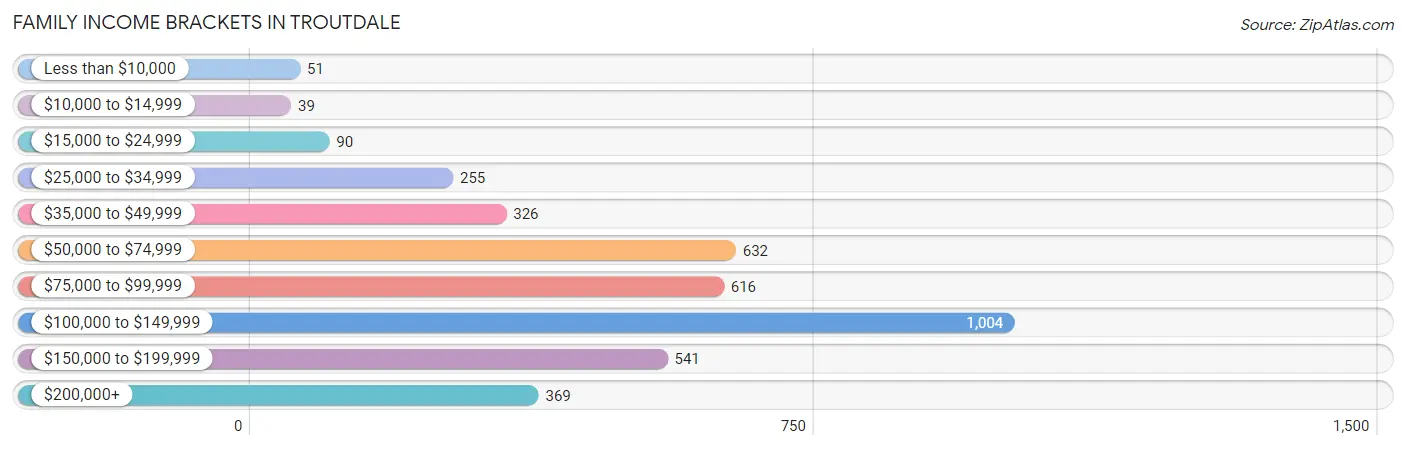
Family Income Brackets in Troutdale
According to the Troutdale family income data, there are 1,004 families falling into the $100,000 to $149,999 income range, which is the most common income bracket and makes up 25.6% of all families. Conversely, the $10,000 to $14,999 income bracket is the least frequent group with only 39 families (1.0%) belonging to this category.
| Income Bracket | # Families | % Families |
| Less than $10,000 | 51 | 1.3% |
| $10,000 to $14,999 | 39 | 1.0% |
| $15,000 to $24,999 | 90 | 2.3% |
| $25,000 to $34,999 | 255 | 6.5% |
| $35,000 to $49,999 | 326 | 8.3% |
| $50,000 to $74,999 | 632 | 16.1% |
| $75,000 to $99,999 | 616 | 15.7% |
| $100,000 to $149,999 | 1,004 | 25.6% |
| $150,000 to $199,999 | 541 | 13.8% |
| $200,000+ | 369 | 9.4% |
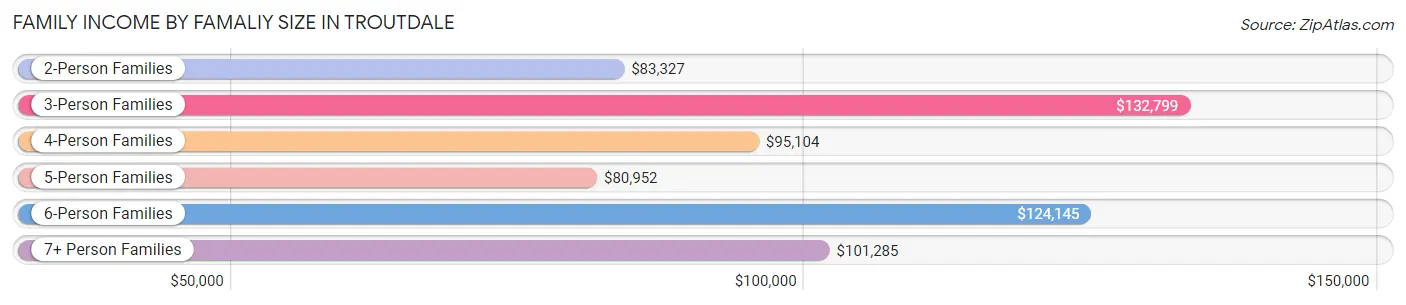
Family Income by Famaliy Size in Troutdale
3-person families (685 | 17.5%) account for the highest median family income in Troutdale with $132,799 per family, while 3-person families (685 | 17.5%) have the highest median income of $44,266 per family member.
| Income Bracket | # Families | Median Income |
| 2-Person Families | 1,577 (40.2%) | $83,327 |
| 3-Person Families | 685 (17.5%) | $132,799 |
| 4-Person Families | 837 (21.3%) | $95,104 |
| 5-Person Families | 392 (10.0%) | $80,952 |
| 6-Person Families | 237 (6.0%) | $124,145 |
| 7+ Person Families | 195 (5.0%) | $101,285 |
| Total | 3,923 (100.0%) | $94,671 |
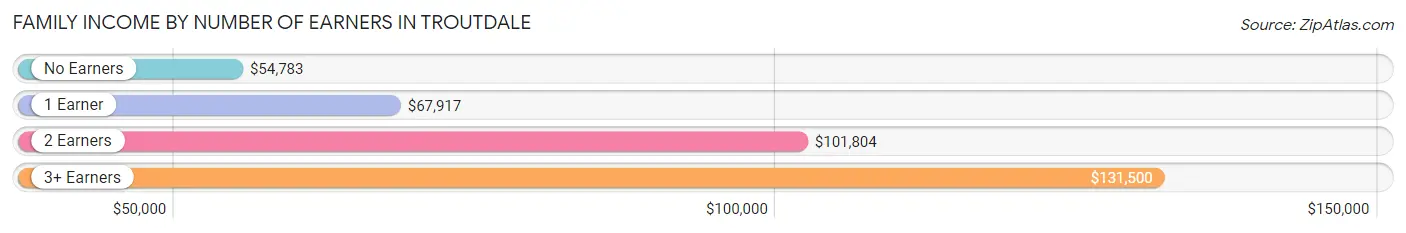
Family Income by Number of Earners in Troutdale
The median family income in Troutdale is $94,671, with families comprising 3+ earners (716) having the highest median family income of $131,500, while families with no earners (490) have the lowest median family income of $54,783, accounting for 18.2% and 12.5% of families, respectively.
| Number of Earners | # Families | Median Income |
| No Earners | 490 (12.5%) | $54,783 |
| 1 Earner | 904 (23.0%) | $67,917 |
| 2 Earners | 1,813 (46.2%) | $101,804 |
| 3+ Earners | 716 (18.2%) | $131,500 |
| Total | 3,923 (100.0%) | $94,671 |
Household Income in Troutdale
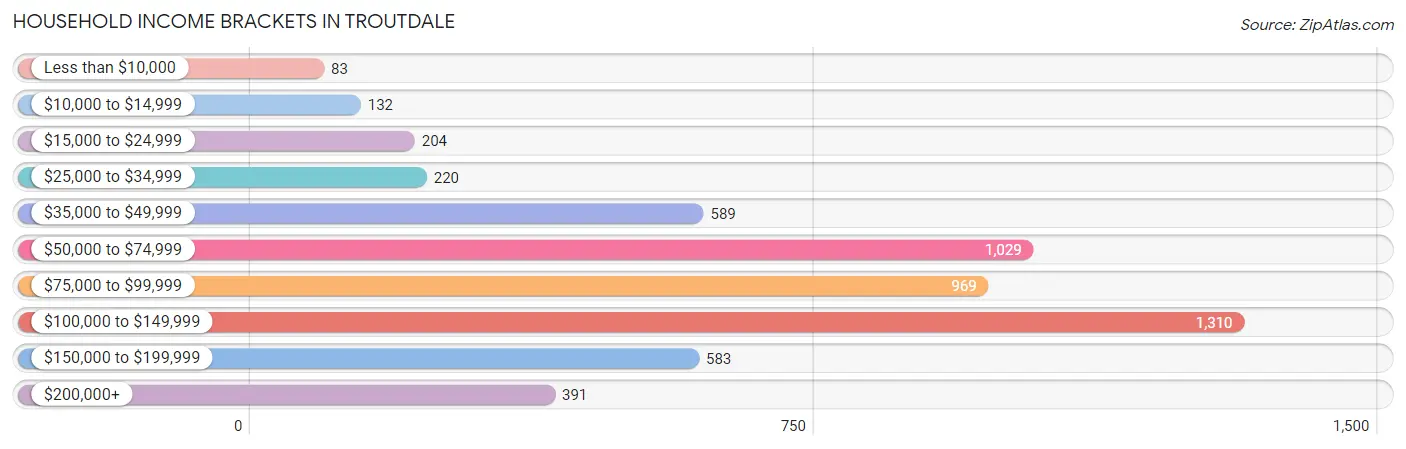
Household Income Brackets in Troutdale
With 1,310 households falling in the category, the $100,000 to $149,999 income range is the most frequent in Troutdale, accounting for 23.8% of all households. In contrast, only 83 households (1.5%) fall into the less than $10,000 income bracket, making it the least populous group.
| Income Bracket | # Households | % Households |
| Less than $10,000 | 83 | 1.5% |
| $10,000 to $14,999 | 132 | 2.4% |
| $15,000 to $24,999 | 204 | 3.7% |
| $25,000 to $34,999 | 220 | 4.0% |
| $35,000 to $49,999 | 589 | 10.7% |
| $50,000 to $74,999 | 1,029 | 18.7% |
| $75,000 to $99,999 | 969 | 17.6% |
| $100,000 to $149,999 | 1,310 | 23.8% |
| $150,000 to $199,999 | 583 | 10.6% |
| $200,000+ | 391 | 7.1% |
Household Income by Householder Age in Troutdale
The median household income in Troutdale is $86,307, with the highest median household income of $98,902 found in the 25 to 44 years age bracket for the primary householder. A total of 2,144 households (39.0%) fall into this category. Meanwhile, the 15 to 24 years age bracket for the primary householder has the lowest median household income of $52,244, with 179 households (3.3%) in this group.
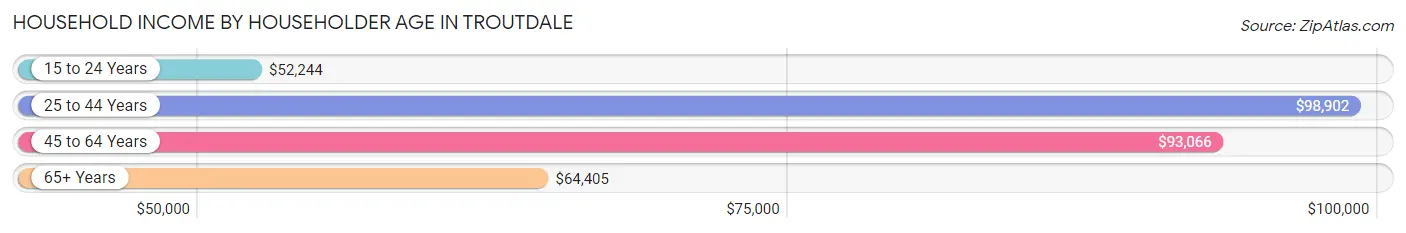
| Income Bracket | # Households | Median Income |
| 15 to 24 Years | 179 (3.3%) | $52,244 |
| 25 to 44 Years | 2,144 (39.0%) | $98,902 |
| 45 to 64 Years | 2,012 (36.6%) | $93,066 |
| 65+ Years | 1,168 (21.2%) | $64,405 |
| Total | 5,503 (100.0%) | $86,307 |
Poverty in Troutdale
Income Below Poverty by Sex and Age in Troutdale
With 6.7% poverty level for males and 8.1% for females among the residents of Troutdale, 12 to 14 year old males and under 5 year old females are the most vulnerable to poverty, with 43 males (10.0%) and 134 females (17.7%) in their respective age groups living below the poverty level.
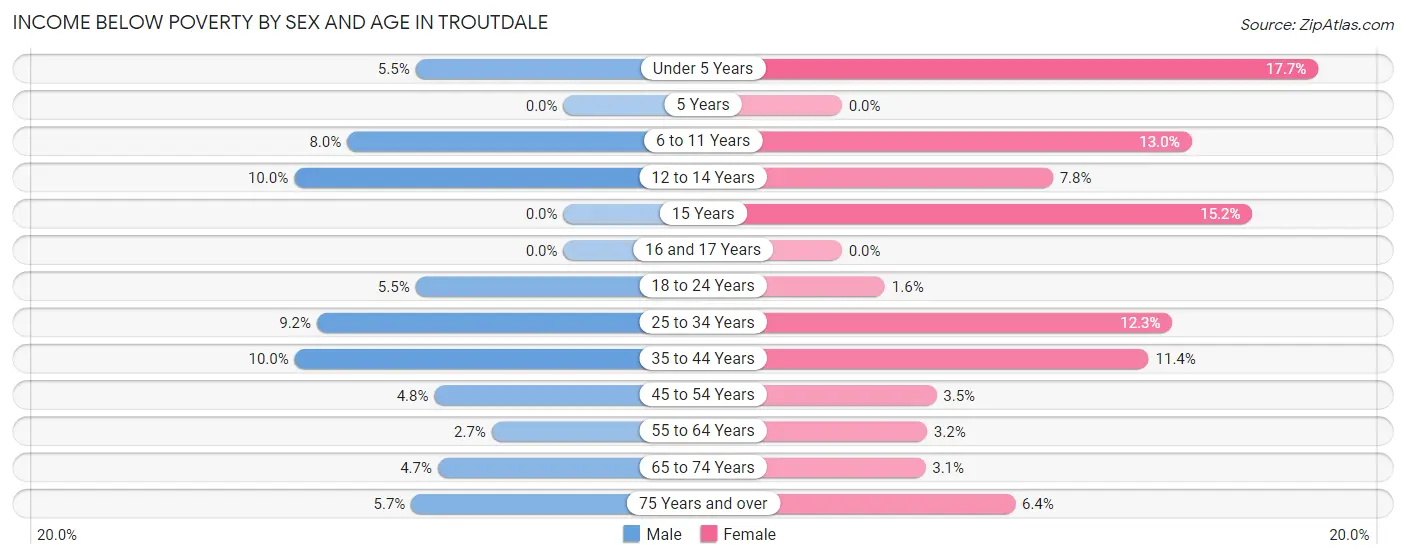
| Age Bracket | Male | Female |
| Under 5 Years | 39 (5.5%) | 134 (17.7%) |
| 5 Years | 0 (0.0%) | 0 (0.0%) |
| 6 to 11 Years | 83 (8.0%) | 74 (13.0%) |
| 12 to 14 Years | 43 (10.0%) | 27 (7.8%) |
| 15 Years | 0 (0.0%) | 16 (15.2%) |
| 16 and 17 Years | 0 (0.0%) | 0 (0.0%) |
| 18 to 24 Years | 32 (5.5%) | 10 (1.6%) |
| 25 to 34 Years | 111 (9.1%) | 126 (12.3%) |
| 35 to 44 Years | 133 (10.0%) | 147 (11.4%) |
| 45 to 54 Years | 45 (4.8%) | 33 (3.5%) |
| 55 to 64 Years | 26 (2.7%) | 26 (3.2%) |
| 65 to 74 Years | 32 (4.7%) | 22 (3.1%) |
| 75 Years and over | 10 (5.7%) | 18 (6.4%) |
| Total | 554 (6.7%) | 633 (8.1%) |
Income Above Poverty by Sex and Age in Troutdale
According to the poverty statistics in Troutdale, males aged 5 years and females aged 5 years are the age groups that are most secure financially, with 100.0% of males and 100.0% of females in these age groups living above the poverty line.
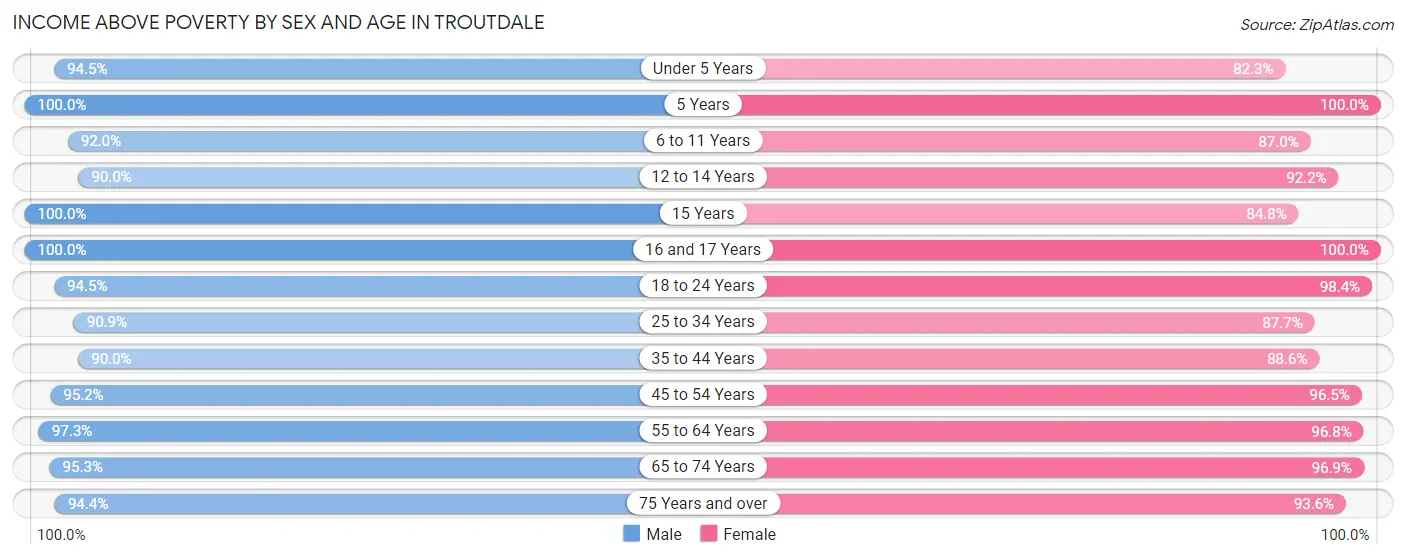
| Age Bracket | Male | Female |
| Under 5 Years | 672 (94.5%) | 624 (82.3%) |
| 5 Years | 45 (100.0%) | 47 (100.0%) |
| 6 to 11 Years | 951 (92.0%) | 496 (87.0%) |
| 12 to 14 Years | 387 (90.0%) | 318 (92.2%) |
| 15 Years | 69 (100.0%) | 89 (84.8%) |
| 16 and 17 Years | 113 (100.0%) | 262 (100.0%) |
| 18 to 24 Years | 551 (94.5%) | 616 (98.4%) |
| 25 to 34 Years | 1,102 (90.8%) | 901 (87.7%) |
| 35 to 44 Years | 1,199 (90.0%) | 1,144 (88.6%) |
| 45 to 54 Years | 894 (95.2%) | 908 (96.5%) |
| 55 to 64 Years | 952 (97.3%) | 797 (96.8%) |
| 65 to 74 Years | 654 (95.3%) | 687 (96.9%) |
| 75 Years and over | 167 (94.4%) | 262 (93.6%) |
| Total | 7,756 (93.3%) | 7,151 (91.9%) |
Income Below Poverty Among Married-Couple Families in Troutdale
The poverty statistics for married-couple families in Troutdale show that 4.1% or 124 of the total 3,033 families live below the poverty line. Families with 3 or 4 children have the highest poverty rate of 8.6%, comprising of 23 families. On the other hand, families with 5 or more children have the lowest poverty rate of 0.0%, which includes 0 families.
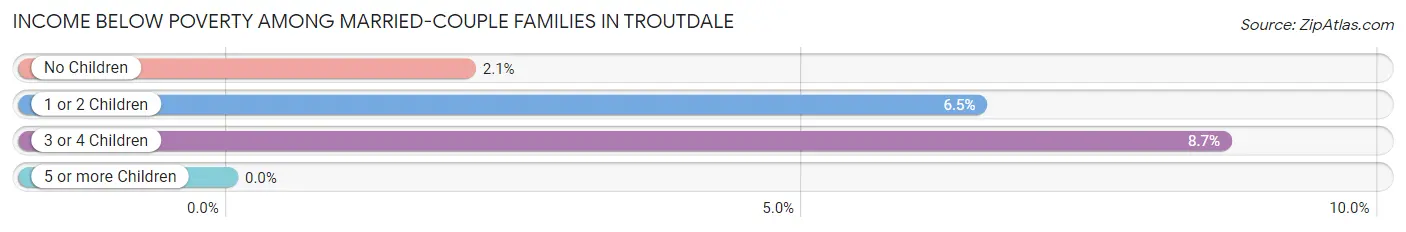
| Children | Above Poverty | Below Poverty |
| No Children | 1,511 (97.9%) | 32 (2.1%) |
| 1 or 2 Children | 989 (93.5%) | 69 (6.5%) |
| 3 or 4 Children | 243 (91.3%) | 23 (8.6%) |
| 5 or more Children | 166 (100.0%) | 0 (0.0%) |
| Total | 2,909 (95.9%) | 124 (4.1%) |
Income Below Poverty Among Single-Parent Households in Troutdale
According to the poverty data in Troutdale, 5.6% or 26 single-father households and 19.3% or 82 single-mother households are living below the poverty line. Among single-father households, those with 1 or 2 children have the highest poverty rate, with 26 households (16.2%) experiencing poverty. Likewise, among single-mother households, those with 3 or 4 children have the highest poverty rate, with 42 households (68.9%) falling below the poverty line.
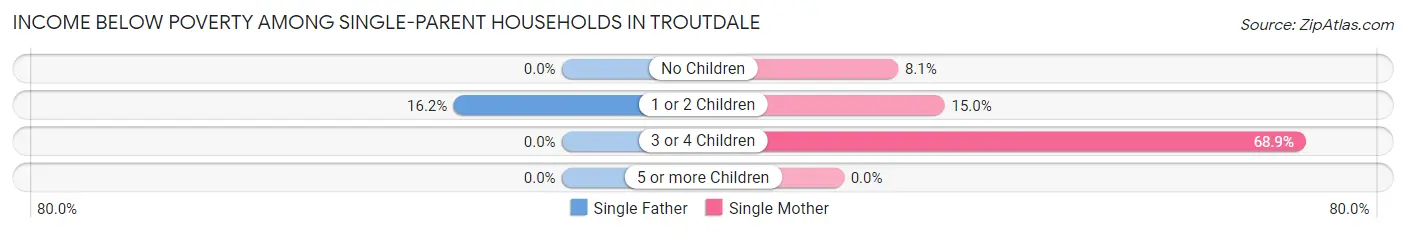
| Children | Single Father | Single Mother |
| No Children | 0 (0.0%) | 14 (8.1%) |
| 1 or 2 Children | 26 (16.2%) | 26 (15.0%) |
| 3 or 4 Children | 0 (0.0%) | 42 (68.9%) |
| 5 or more Children | 0 (0.0%) | 0 (0.0%) |
| Total | 26 (5.6%) | 82 (19.3%) |
Income Below Poverty Among Married-Couple vs Single-Parent Households in Troutdale
The poverty data for Troutdale shows that 124 of the married-couple family households (4.1%) and 108 of the single-parent households (12.1%) are living below the poverty level. Within the married-couple family households, those with 3 or 4 children have the highest poverty rate, with 23 households (8.6%) falling below the poverty line. Among the single-parent households, those with 3 or 4 children have the highest poverty rate, with 42 household (23.9%) living below poverty.
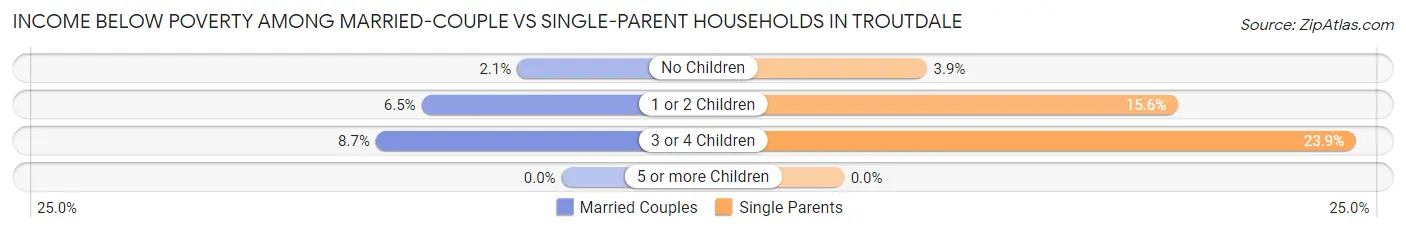
| Children | Married-Couple Families | Single-Parent Households |
| No Children | 32 (2.1%) | 14 (3.9%) |
| 1 or 2 Children | 69 (6.5%) | 52 (15.6%) |
| 3 or 4 Children | 23 (8.6%) | 42 (23.9%) |
| 5 or more Children | 0 (0.0%) | 0 (0.0%) |
| Total | 124 (4.1%) | 108 (12.1%) |
Race in Troutdale
The most populous races in Troutdale are White / Caucasian (12,789 | 79.2%), Hispanic or Latino (2,687 | 16.6%), and Two or more Races (1,441 | 8.9%).
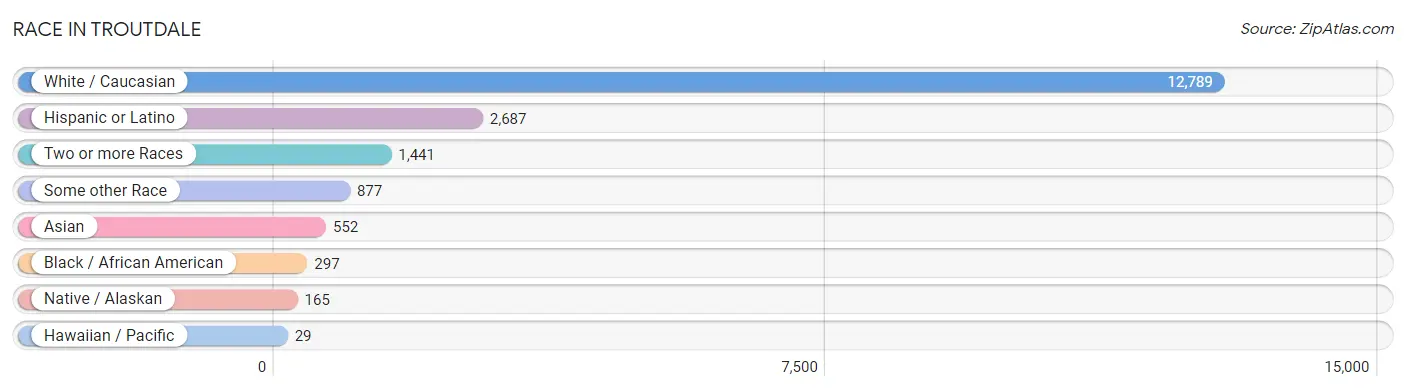
| Race | # Population | % Population |
| Asian | 552 | 3.4% |
| Black / African American | 297 | 1.8% |
| Hawaiian / Pacific | 29 | 0.2% |
| Hispanic or Latino | 2,687 | 16.6% |
| Native / Alaskan | 165 | 1.0% |
| White / Caucasian | 12,789 | 79.2% |
| Two or more Races | 1,441 | 8.9% |
| Some other Race | 877 | 5.4% |
| Total | 16,150 | 100.0% |
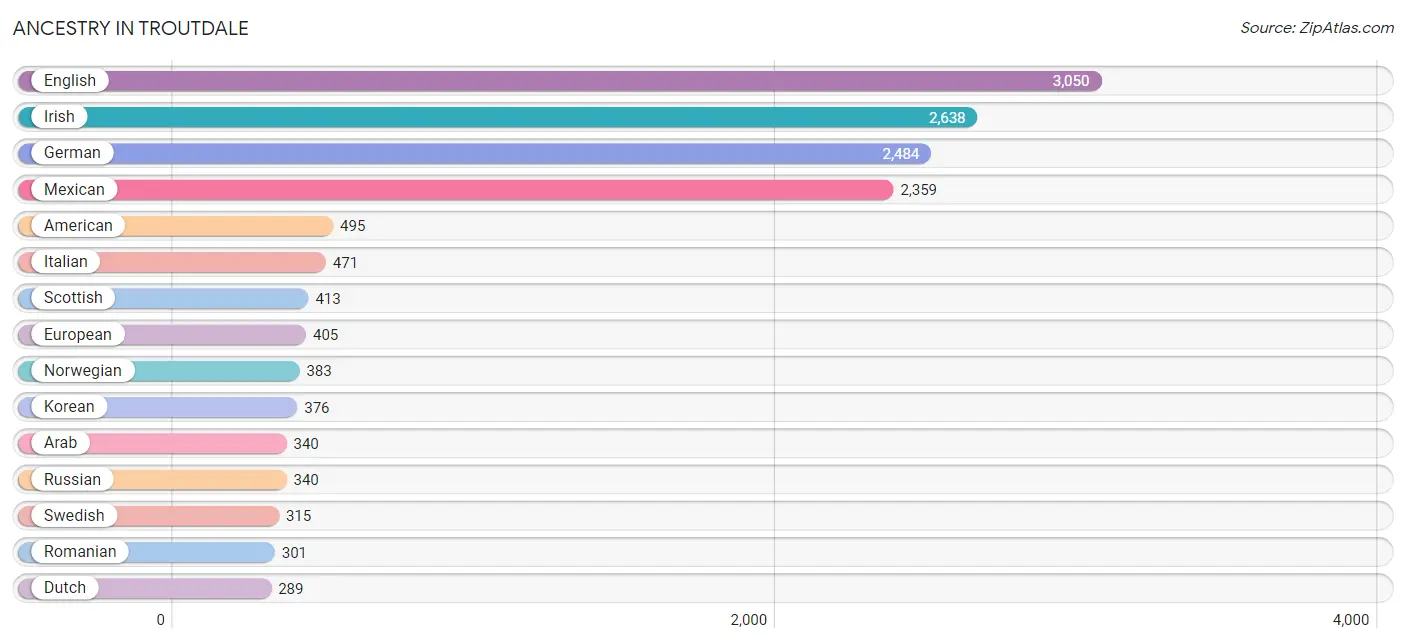
Ancestry in Troutdale
The most populous ancestries reported in Troutdale are English (3,050 | 18.9%), Irish (2,638 | 16.3%), German (2,484 | 15.4%), Mexican (2,359 | 14.6%), and American (495 | 3.1%), together accounting for 68.3% of all Troutdale residents.
| Ancestry | # Population | % Population |
| African | 10 | 0.1% |
| American | 495 | 3.1% |
| Arab | 340 | 2.1% |
| Armenian | 66 | 0.4% |
| Australian | 15 | 0.1% |
| Austrian | 23 | 0.1% |
| Bangladeshi | 81 | 0.5% |
| Belgian | 13 | 0.1% |
| Belizean | 52 | 0.3% |
| Bhutanese | 66 | 0.4% |
| British | 121 | 0.7% |
| Bulgarian | 10 | 0.1% |
| Burmese | 7 | 0.0% |
| Central American | 45 | 0.3% |
| Cherokee | 43 | 0.3% |
| Cuban | 28 | 0.2% |
| Czech | 54 | 0.3% |
| Czechoslovakian | 11 | 0.1% |
| Danish | 38 | 0.2% |
| Dutch | 289 | 1.8% |
| Eastern European | 46 | 0.3% |
| Ecuadorian | 31 | 0.2% |
| Egyptian | 131 | 0.8% |
| English | 3,050 | 18.9% |
| European | 405 | 2.5% |
| Fijian | 4 | 0.0% |
| Finnish | 117 | 0.7% |
| French | 222 | 1.4% |
| French Canadian | 23 | 0.1% |
| German | 2,484 | 15.4% |
| Greek | 34 | 0.2% |
| Guatemalan | 28 | 0.2% |
| Hungarian | 25 | 0.2% |
| Indian (Asian) | 88 | 0.5% |
| Inupiat | 9 | 0.1% |
| Iraqi | 12 | 0.1% |
| Irish | 2,638 | 16.3% |
| Italian | 471 | 2.9% |
| Korean | 376 | 2.3% |
| Lebanese | 171 | 1.1% |
| Mexican | 2,359 | 14.6% |
| Mexican American Indian | 58 | 0.4% |
| Native Hawaiian | 25 | 0.2% |
| Nepalese | 126 | 0.8% |
| Northern European | 65 | 0.4% |
| Norwegian | 383 | 2.4% |
| Paiute | 26 | 0.2% |
| Peruvian | 64 | 0.4% |
| Polish | 50 | 0.3% |
| Portuguese | 71 | 0.4% |
| Puerto Rican | 17 | 0.1% |
| Romanian | 301 | 1.9% |
| Russian | 340 | 2.1% |
| Salvadoran | 17 | 0.1% |
| Scandinavian | 38 | 0.2% |
| Scotch-Irish | 69 | 0.4% |
| Scottish | 413 | 2.6% |
| South American | 95 | 0.6% |
| Spaniard | 75 | 0.5% |
| Spanish | 52 | 0.3% |
| Sri Lankan | 244 | 1.5% |
| Subsaharan African | 10 | 0.1% |
| Swedish | 315 | 1.9% |
| Swiss | 89 | 0.5% |
| Tongan | 17 | 0.1% |
| Ukrainian | 50 | 0.3% |
| Ute | 7 | 0.0% |
| Welsh | 110 | 0.7% | View All 68 Rows |
Immigrants in Troutdale
The most numerous immigrant groups reported in Troutdale came from Latin America (811 | 5.0%), Central America (744 | 4.6%), Mexico (712 | 4.4%), Asia (590 | 3.6%), and Europe (573 | 3.5%), together accounting for 21.2% of all Troutdale residents.
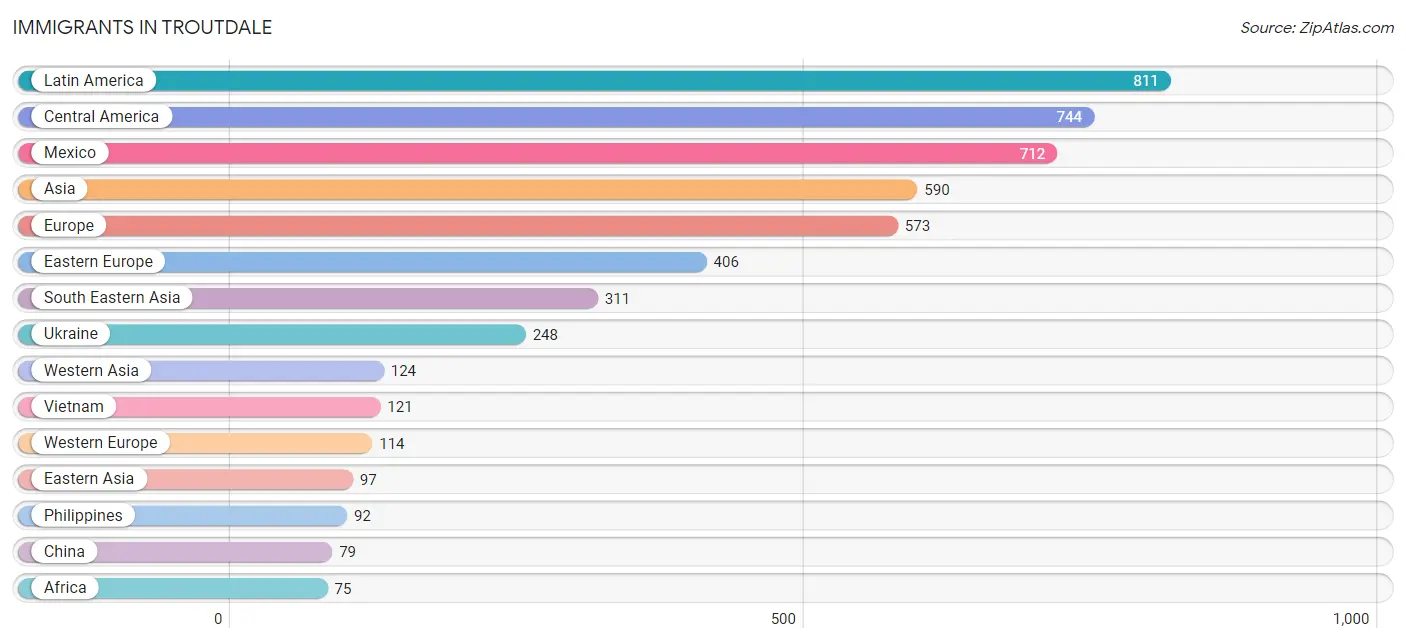
| Immigration Origin | # Population | % Population |
| Africa | 75 | 0.5% |
| Asia | 590 | 3.6% |
| Australia | 7 | 0.0% |
| Austria | 14 | 0.1% |
| Belize | 32 | 0.2% |
| Bosnia and Herzegovina | 25 | 0.2% |
| Canada | 9 | 0.1% |
| Caribbean | 14 | 0.1% |
| Central America | 744 | 4.6% |
| China | 79 | 0.5% |
| Cuba | 14 | 0.1% |
| Eastern Africa | 1 | 0.0% |
| Eastern Asia | 97 | 0.6% |
| Eastern Europe | 406 | 2.5% |
| Egypt | 74 | 0.5% |
| England | 53 | 0.3% |
| Ethiopia | 1 | 0.0% |
| Europe | 573 | 3.5% |
| France | 28 | 0.2% |
| Germany | 39 | 0.2% |
| Iraq | 11 | 0.1% |
| Korea | 18 | 0.1% |
| Laos | 70 | 0.4% |
| Latin America | 811 | 5.0% |
| Mexico | 712 | 4.4% |
| Micronesia | 5 | 0.0% |
| Moldova | 74 | 0.5% |
| Northern Africa | 74 | 0.5% |
| Northern Europe | 53 | 0.3% |
| Oceania | 16 | 0.1% |
| Peru | 53 | 0.3% |
| Philippines | 92 | 0.6% |
| Romania | 58 | 0.4% |
| Russia | 1 | 0.0% |
| Saudi Arabia | 11 | 0.1% |
| South America | 53 | 0.3% |
| South Central Asia | 32 | 0.2% |
| South Eastern Asia | 311 | 1.9% |
| Switzerland | 33 | 0.2% |
| Thailand | 28 | 0.2% |
| Ukraine | 248 | 1.5% |
| Vietnam | 121 | 0.7% |
| Western Asia | 124 | 0.8% |
| Western Europe | 114 | 0.7% | View All 44 Rows |
Sex and Age in Troutdale
Sex and Age in Troutdale
The most populous age groups in Troutdale are 40 to 44 Years (864 | 10.4%) for men and 40 to 44 Years (893 | 11.4%) for women.
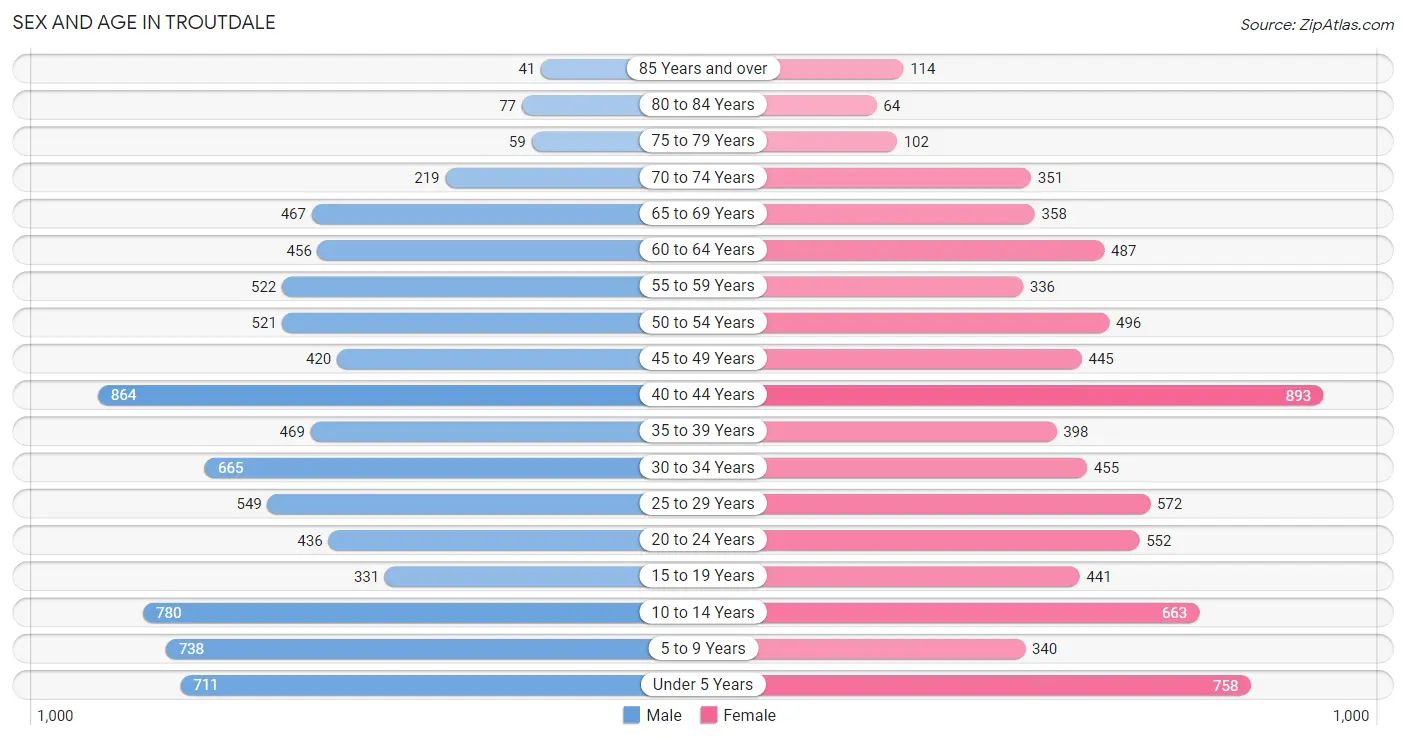
| Age Bracket | Male | Female |
| Under 5 Years | 711 (8.5%) | 758 (9.7%) |
| 5 to 9 Years | 738 (8.9%) | 340 (4.3%) |
| 10 to 14 Years | 780 (9.4%) | 663 (8.5%) |
| 15 to 19 Years | 331 (4.0%) | 441 (5.6%) |
| 20 to 24 Years | 436 (5.2%) | 552 (7.0%) |
| 25 to 29 Years | 549 (6.6%) | 572 (7.3%) |
| 30 to 34 Years | 665 (8.0%) | 455 (5.8%) |
| 35 to 39 Years | 469 (5.6%) | 398 (5.1%) |
| 40 to 44 Years | 864 (10.4%) | 893 (11.4%) |
| 45 to 49 Years | 420 (5.1%) | 445 (5.7%) |
| 50 to 54 Years | 521 (6.3%) | 496 (6.3%) |
| 55 to 59 Years | 522 (6.3%) | 336 (4.3%) |
| 60 to 64 Years | 456 (5.5%) | 487 (6.2%) |
| 65 to 69 Years | 467 (5.6%) | 358 (4.6%) |
| 70 to 74 Years | 219 (2.6%) | 351 (4.5%) |
| 75 to 79 Years | 59 (0.7%) | 102 (1.3%) |
| 80 to 84 Years | 77 (0.9%) | 64 (0.8%) |
| 85 Years and over | 41 (0.5%) | 114 (1.5%) |
| Total | 8,325 (100.0%) | 7,825 (100.0%) |
Families and Households in Troutdale
Median Family Size in Troutdale
The median family size in Troutdale is 3.49 persons per family, with married-couple families (3,033 | 77.3%) accounting for the largest median family size of 3.64 persons per family. On the other hand, single male/father families (466 | 11.9%) represent the smallest median family size with 2.65 persons per family.
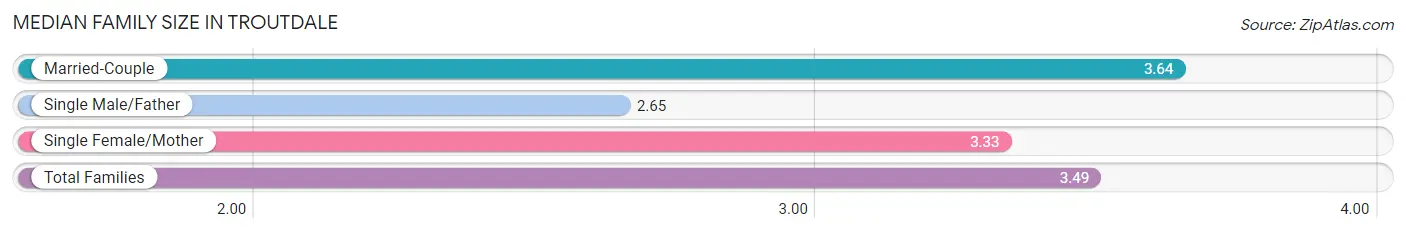
| Family Type | # Families | Family Size |
| Married-Couple | 3,033 (77.3%) | 3.64 |
| Single Male/Father | 466 (11.9%) | 2.65 |
| Single Female/Mother | 424 (10.8%) | 3.33 |
| Total Families | 3,923 (100.0%) | 3.49 |
Median Household Size in Troutdale
The median household size in Troutdale is 2.93 persons per household, with married-couple households (3,033 | 55.1%) accounting for the largest median household size of 3.64 persons per household. non-family households (1,580 | 28.7%) represent the smallest median household size with 1.36 persons per household.
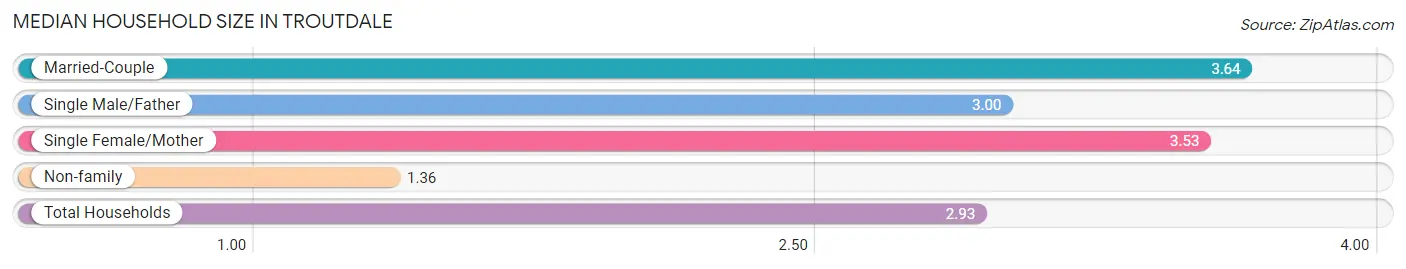
| Household Type | # Households | Household Size |
| Married-Couple | 3,033 (55.1%) | 3.64 |
| Single Male/Father | 466 (8.5%) | 3.00 |
| Single Female/Mother | 424 (7.7%) | 3.53 |
| Non-family | 1,580 (28.7%) | 1.36 |
| Total Households | 5,503 (100.0%) | 2.93 |
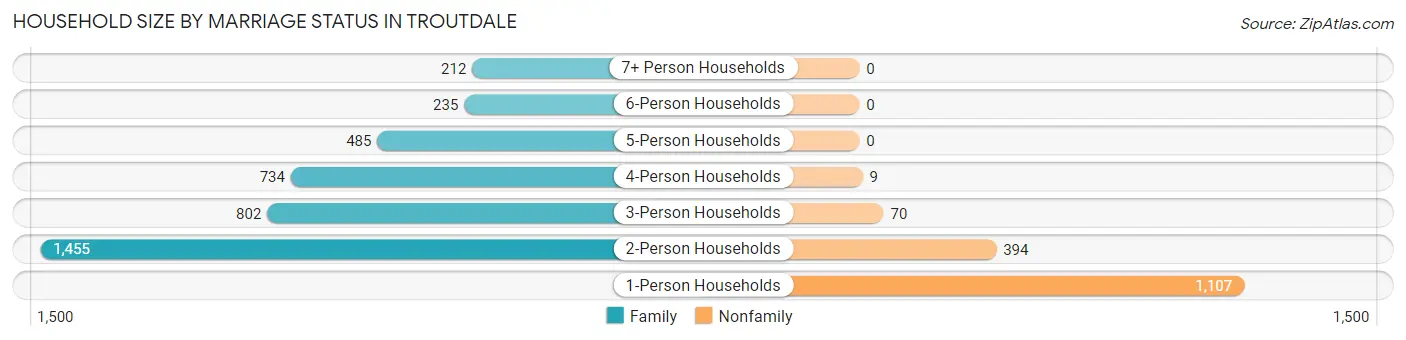
Household Size by Marriage Status in Troutdale
Out of a total of 5,503 households in Troutdale, 3,923 (71.3%) are family households, while 1,580 (28.7%) are nonfamily households. The most numerous type of family households are 2-person households, comprising 1,455, and the most common type of nonfamily households are 1-person households, comprising 1,107.
| Household Size | Family Households | Nonfamily Households |
| 1-Person Households | - | 1,107 (20.1%) |
| 2-Person Households | 1,455 (26.4%) | 394 (7.2%) |
| 3-Person Households | 802 (14.6%) | 70 (1.3%) |
| 4-Person Households | 734 (13.3%) | 9 (0.2%) |
| 5-Person Households | 485 (8.8%) | 0 (0.0%) |
| 6-Person Households | 235 (4.3%) | 0 (0.0%) |
| 7+ Person Households | 212 (3.8%) | 0 (0.0%) |
| Total | 3,923 (71.3%) | 1,580 (28.7%) |
Female Fertility in Troutdale
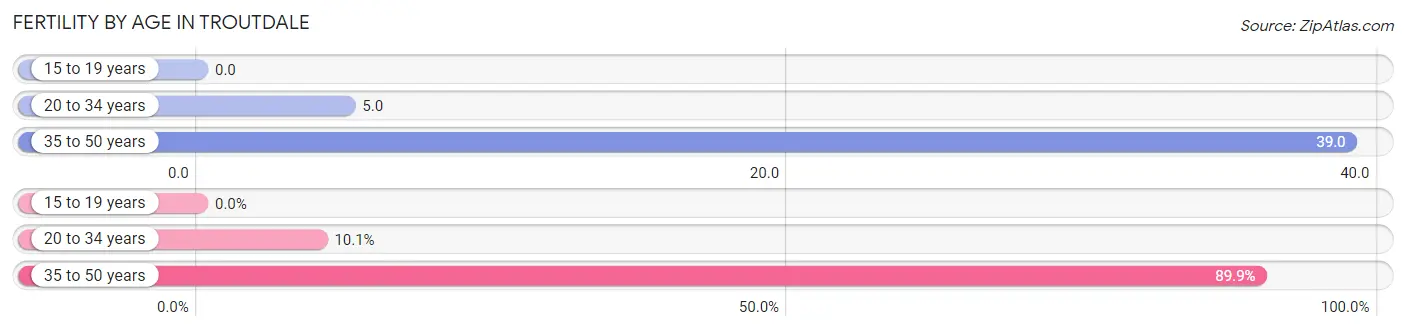
Fertility by Age in Troutdale
Average fertility rate in Troutdale is 21.0 births per 1,000 women. Women in the age bracket of 35 to 50 years have the highest fertility rate with 39.0 births per 1,000 women. Women in the age bracket of 35 to 50 years acount for 89.9% of all women with births.
| Age Bracket | Women with Births | Births / 1,000 Women |
| 15 to 19 years | 0 (0.0%) | 0.0 |
| 20 to 34 years | 8 (10.1%) | 5.0 |
| 35 to 50 years | 71 (89.9%) | 39.0 |
| Total | 79 (100.0%) | 21.0 |
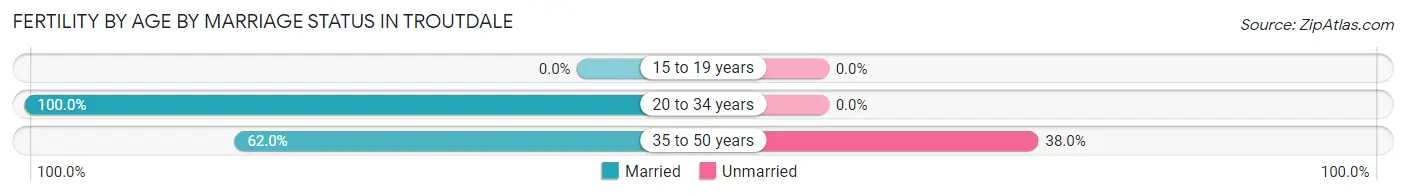
Fertility by Age by Marriage Status in Troutdale
65.8% of women with births (79) in Troutdale are married. The highest percentage of unmarried women with births falls into 35 to 50 years age bracket with 38.0% of them unmarried at the time of birth, while the lowest percentage of unmarried women with births belong to 20 to 34 years age bracket with 0.0% of them unmarried.
| Age Bracket | Married | Unmarried |
| 15 to 19 years | 0 (0.0%) | 0 (0.0%) |
| 20 to 34 years | 8 (100.0%) | 0 (0.0%) |
| 35 to 50 years | 44 (62.0%) | 27 (38.0%) |
| Total | 52 (65.8%) | 27 (34.2%) |
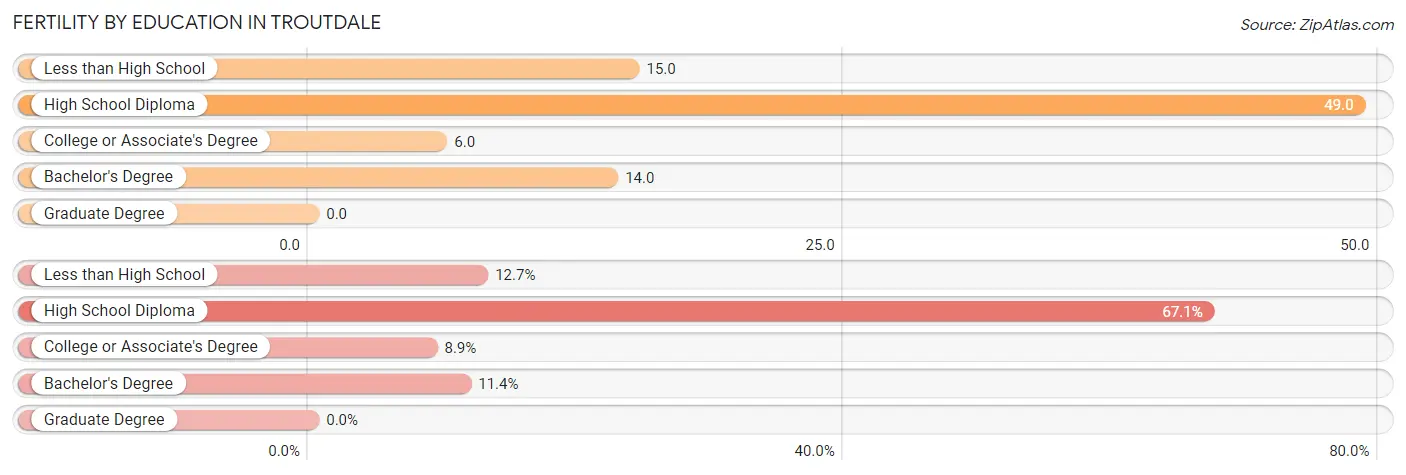
Fertility by Education in Troutdale
| Educational Attainment | Women with Births | Births / 1,000 Women |
| Less than High School | 10 (12.7%) | 15.0 |
| High School Diploma | 53 (67.1%) | 49.0 |
| College or Associate's Degree | 7 (8.9%) | 6.0 |
| Bachelor's Degree | 9 (11.4%) | 14.0 |
| Graduate Degree | 0 (0.0%) | 0.0 |
| Total | 79 (100.0%) | 21.0 |
Fertility by Education by Marriage Status in Troutdale
34.2% of women with births in Troutdale are unmarried. Women with the educational attainment of less than high school are most likely to be married with 100.0% of them married at childbirth, while women with the educational attainment of high school diploma are least likely to be married with 50.9% of them unmarried at childbirth.
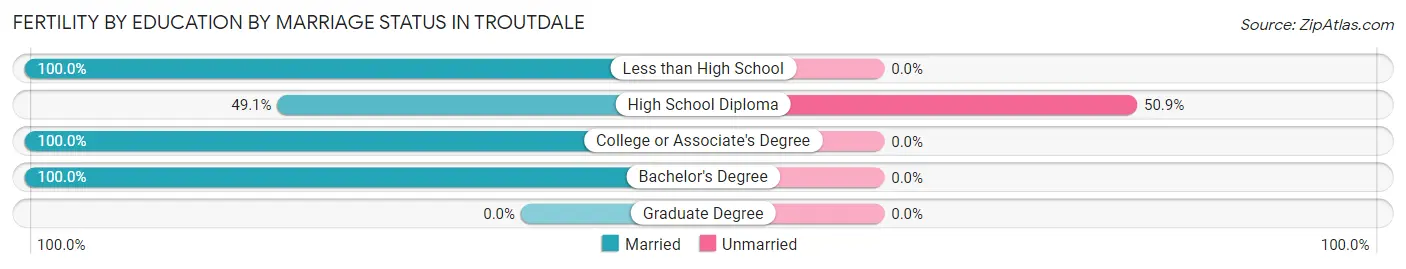
| Educational Attainment | Married | Unmarried |
| Less than High School | 10 (100.0%) | 0 (0.0%) |
| High School Diploma | 26 (49.1%) | 27 (50.9%) |
| College or Associate's Degree | 7 (100.0%) | 0 (0.0%) |
| Bachelor's Degree | 9 (100.0%) | 0 (0.0%) |
| Graduate Degree | 0 (0.0%) | 0 (0.0%) |
| Total | 52 (65.8%) | 27 (34.2%) |
Employment Characteristics in Troutdale
Employment by Class of Employer in Troutdale
Among the 8,293 employed individuals in Troutdale, private company employees (6,224 | 75.0%), not-for-profit organizations (755 | 9.1%), and local government employees (425 | 5.1%) make up the most common classes of employment.
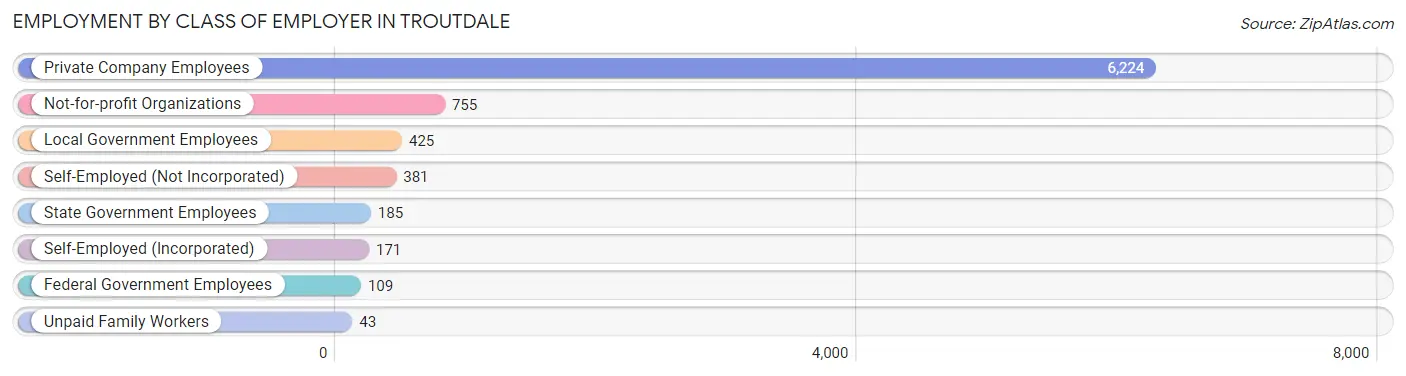
| Employer Class | # Employees | % Employees |
| Private Company Employees | 6,224 | 75.0% |
| Self-Employed (Incorporated) | 171 | 2.1% |
| Self-Employed (Not Incorporated) | 381 | 4.6% |
| Not-for-profit Organizations | 755 | 9.1% |
| Local Government Employees | 425 | 5.1% |
| State Government Employees | 185 | 2.2% |
| Federal Government Employees | 109 | 1.3% |
| Unpaid Family Workers | 43 | 0.5% |
| Total | 8,293 | 100.0% |
Employment Status by Age in Troutdale
According to the labor force statistics for Troutdale, out of the total population over 16 years of age (11,986), 73.0% or 8,750 individuals are in the labor force, with 4.4% or 385 of them unemployed. The age group with the highest labor force participation rate is 20 to 24 years, with 91.3% or 902 individuals in the labor force. Within the labor force, the 16 to 19 years age range has the highest percentage of unemployed individuals, with 28.7% or 94 of them being unemployed.
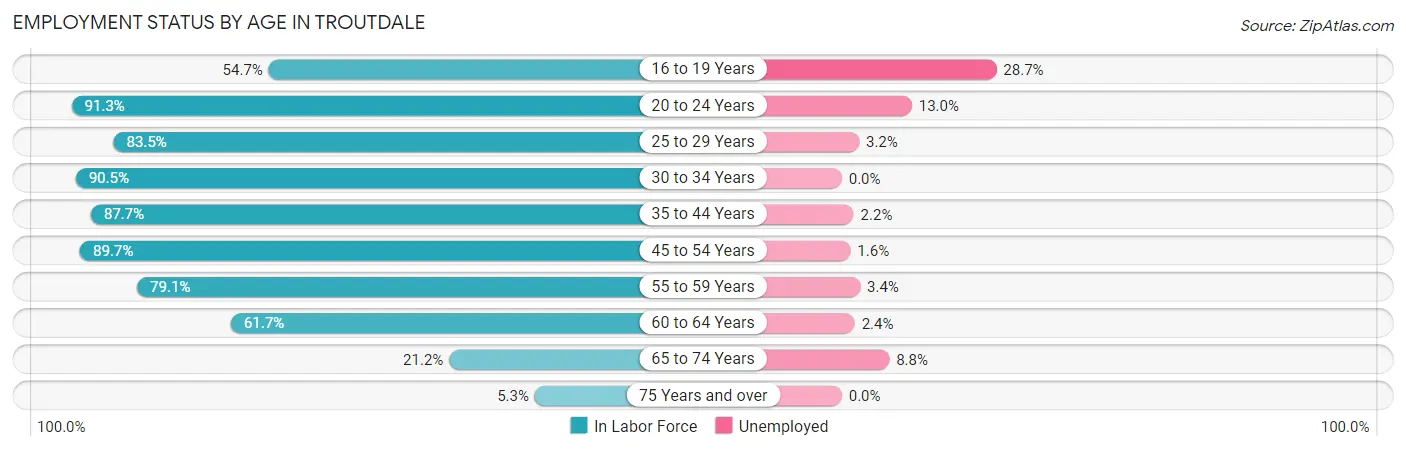
| Age Bracket | In Labor Force | Unemployed |
| 16 to 19 Years | 327 (54.7%) | 94 (28.7%) |
| 20 to 24 Years | 902 (91.3%) | 117 (13.0%) |
| 25 to 29 Years | 936 (83.5%) | 30 (3.2%) |
| 30 to 34 Years | 1,014 (90.5%) | 0 (0.0%) |
| 35 to 44 Years | 2,301 (87.7%) | 51 (2.2%) |
| 45 to 54 Years | 1,688 (89.7%) | 27 (1.6%) |
| 55 to 59 Years | 679 (79.1%) | 23 (3.4%) |
| 60 to 64 Years | 582 (61.7%) | 14 (2.4%) |
| 65 to 74 Years | 296 (21.2%) | 26 (8.8%) |
| 75 Years and over | 24 (5.3%) | 0 (0.0%) |
| Total | 8,750 (73.0%) | 385 (4.4%) |
Employment Status by Educational Attainment in Troutdale
According to labor force statistics for Troutdale, 84.3% of individuals (7,206) out of the total population between 25 and 64 years of age (8,548) are in the labor force, with 2.0% or 144 of them being unemployed. The group with the highest labor force participation rate are those with the educational attainment of bachelor's degree or higher, with 92.0% or 1,948 individuals in the labor force. Within the labor force, individuals with less than high school education have the highest percentage of unemployment, with 5.8% or 32 of them being unemployed.
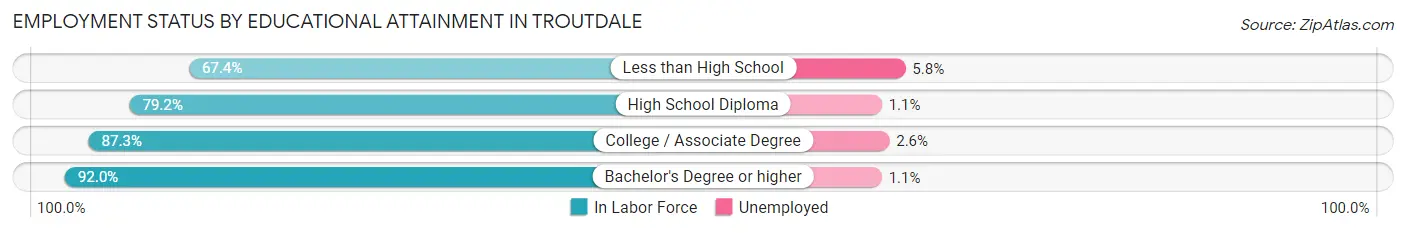
| Educational Attainment | In Labor Force | Unemployed |
| Less than High School | 549 (67.4%) | 47 (5.8%) |
| High School Diploma | 1,930 (79.2%) | 27 (1.1%) |
| College / Associate Degree | 2,775 (87.3%) | 83 (2.6%) |
| Bachelor's Degree or higher | 1,948 (92.0%) | 23 (1.1%) |
| Total | 7,206 (84.3%) | 171 (2.0%) |
Employment Occupations by Sex in Troutdale
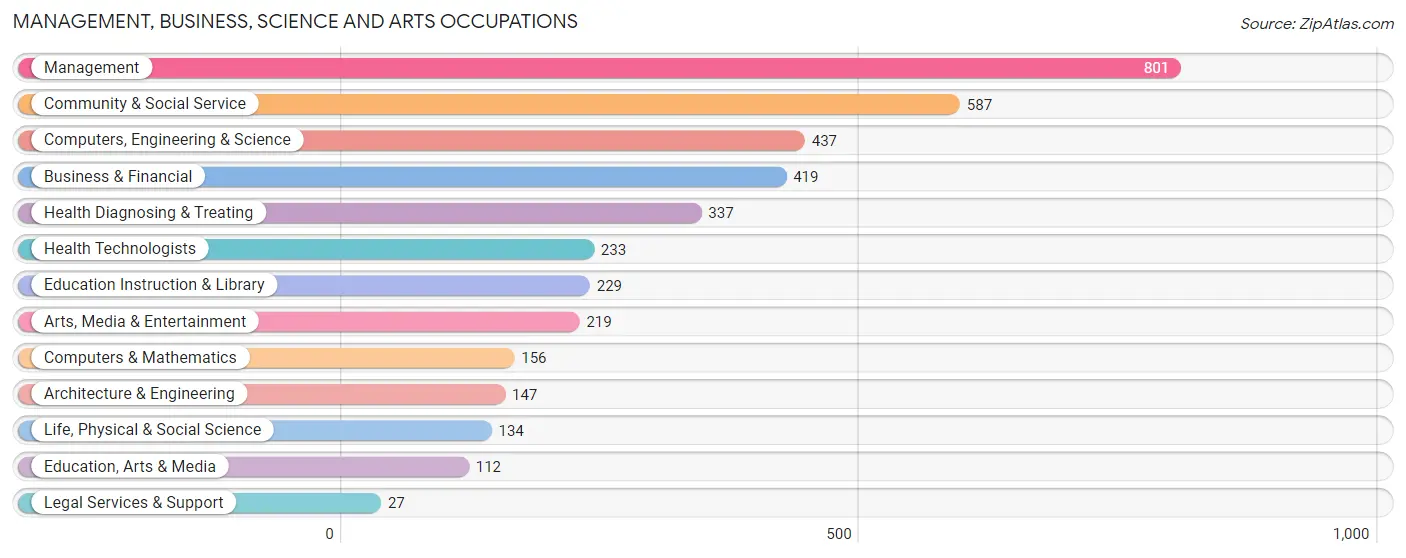
Management, Business, Science and Arts Occupations
The most common Management, Business, Science and Arts occupations in Troutdale are Management (801 | 9.6%), Community & Social Service (587 | 7.0%), Computers, Engineering & Science (437 | 5.2%), Business & Financial (419 | 5.0%), and Health Diagnosing & Treating (337 | 4.0%).
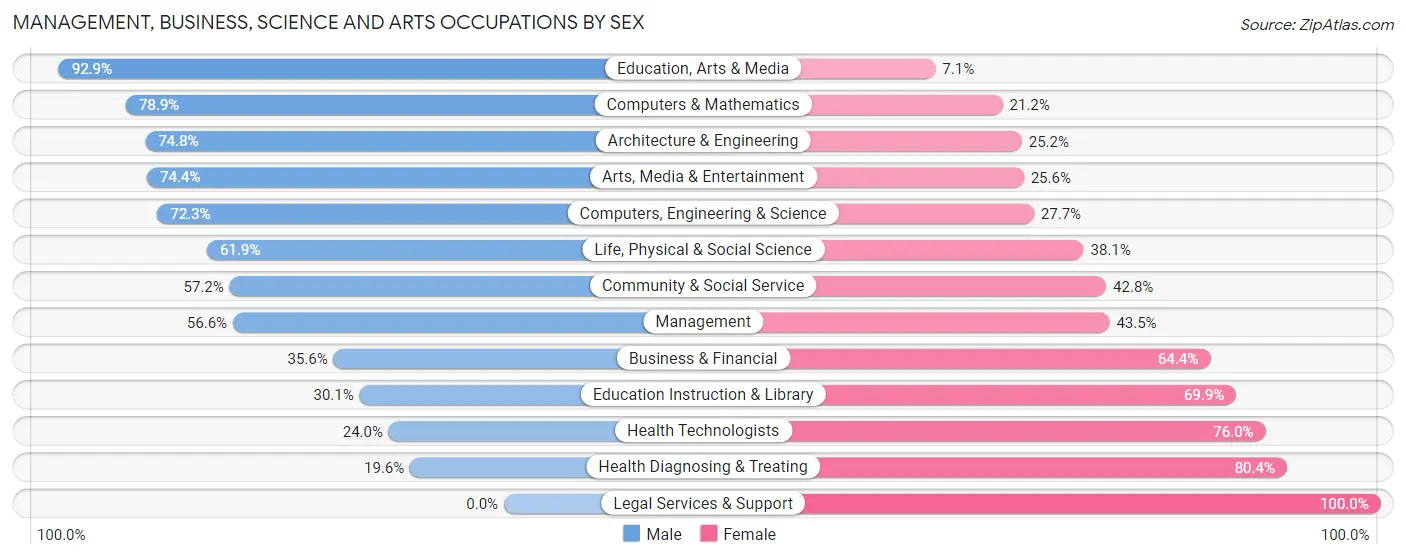
Management, Business, Science and Arts Occupations by Sex
Within the Management, Business, Science and Arts occupations in Troutdale, the most male-oriented occupations are Education, Arts & Media (92.9%), Computers & Mathematics (78.8%), and Architecture & Engineering (74.8%), while the most female-oriented occupations are Legal Services & Support (100.0%), Health Diagnosing & Treating (80.4%), and Health Technologists (76.0%).
| Occupation | Male | Female |
| Management | 453 (56.6%) | 348 (43.4%) |
| Business & Financial | 149 (35.6%) | 270 (64.4%) |
| Computers, Engineering & Science | 316 (72.3%) | 121 (27.7%) |
| Computers & Mathematics | 123 (78.8%) | 33 (21.1%) |
| Architecture & Engineering | 110 (74.8%) | 37 (25.2%) |
| Life, Physical & Social Science | 83 (61.9%) | 51 (38.1%) |
| Community & Social Service | 336 (57.2%) | 251 (42.8%) |
| Education, Arts & Media | 104 (92.9%) | 8 (7.1%) |
| Legal Services & Support | 0 (0.0%) | 27 (100.0%) |
| Education Instruction & Library | 69 (30.1%) | 160 (69.9%) |
| Arts, Media & Entertainment | 163 (74.4%) | 56 (25.6%) |
| Health Diagnosing & Treating | 66 (19.6%) | 271 (80.4%) |
| Health Technologists | 56 (24.0%) | 177 (76.0%) |
| Total (Category) | 1,320 (51.1%) | 1,261 (48.9%) |
| Total (Overall) | 4,333 (51.8%) | 4,036 (48.2%) |
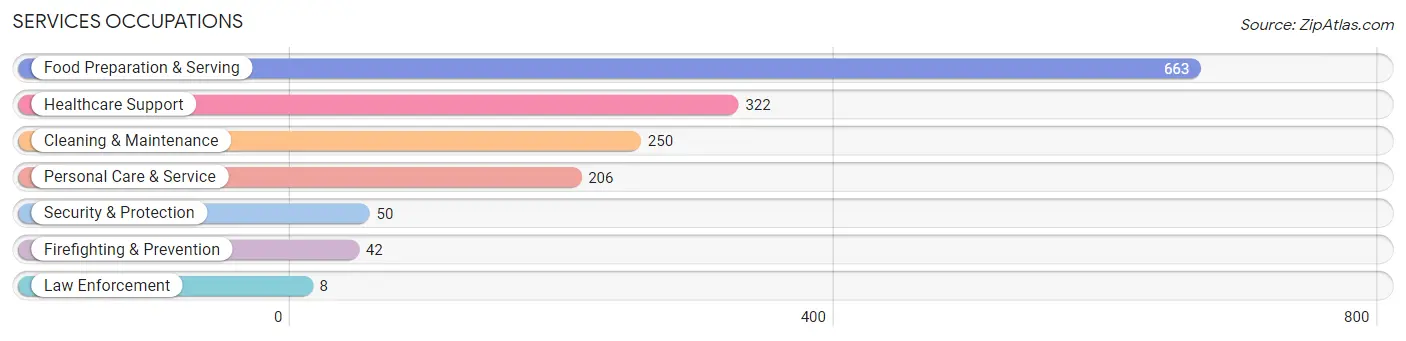
Services Occupations
The most common Services occupations in Troutdale are Food Preparation & Serving (663 | 7.9%), Healthcare Support (322 | 3.8%), Cleaning & Maintenance (250 | 3.0%), Personal Care & Service (206 | 2.5%), and Security & Protection (50 | 0.6%).
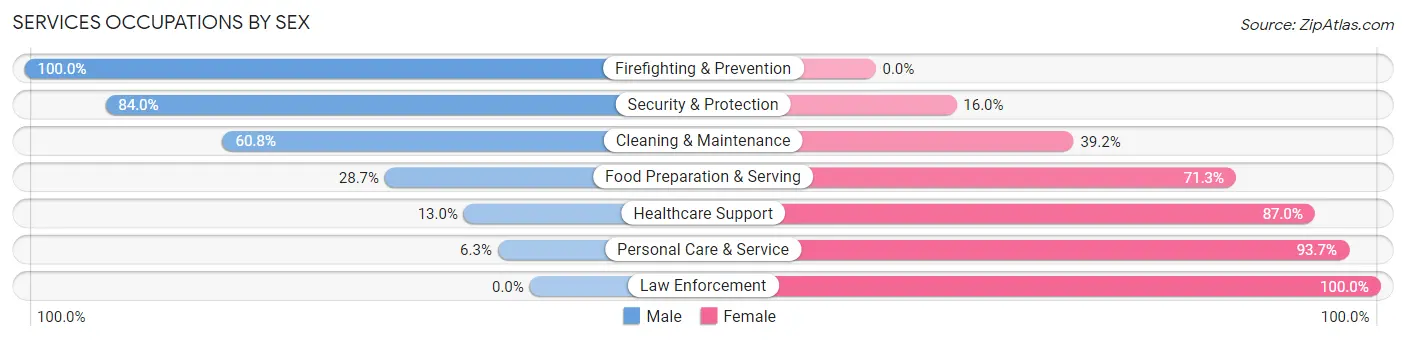
Services Occupations by Sex
Within the Services occupations in Troutdale, the most male-oriented occupations are Firefighting & Prevention (100.0%), Security & Protection (84.0%), and Cleaning & Maintenance (60.8%), while the most female-oriented occupations are Law Enforcement (100.0%), Personal Care & Service (93.7%), and Healthcare Support (87.0%).
| Occupation | Male | Female |
| Healthcare Support | 42 (13.0%) | 280 (87.0%) |
| Security & Protection | 42 (84.0%) | 8 (16.0%) |
| Firefighting & Prevention | 42 (100.0%) | 0 (0.0%) |
| Law Enforcement | 0 (0.0%) | 8 (100.0%) |
| Food Preparation & Serving | 190 (28.7%) | 473 (71.3%) |
| Cleaning & Maintenance | 152 (60.8%) | 98 (39.2%) |
| Personal Care & Service | 13 (6.3%) | 193 (93.7%) |
| Total (Category) | 439 (29.4%) | 1,052 (70.6%) |
| Total (Overall) | 4,333 (51.8%) | 4,036 (48.2%) |
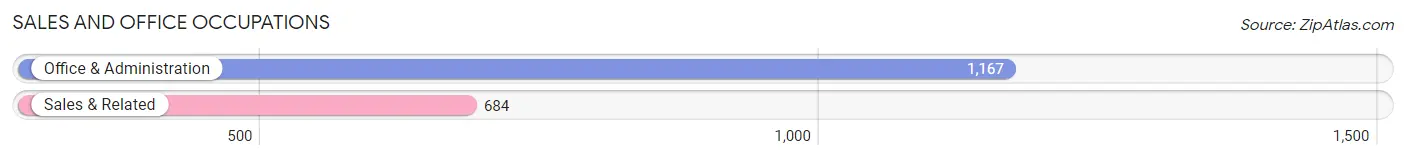
Sales and Office Occupations
The most common Sales and Office occupations in Troutdale are Office & Administration (1,167 | 13.9%), and Sales & Related (684 | 8.2%).
Sales and Office Occupations by Sex
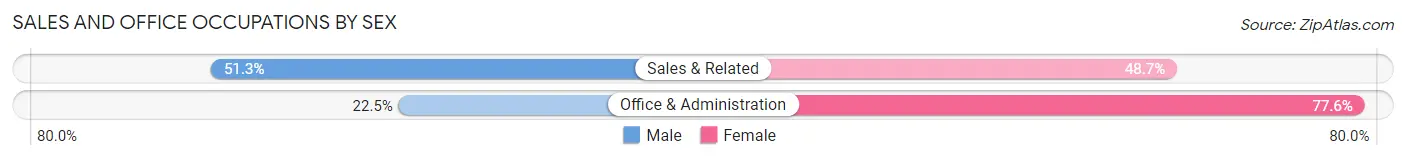
| Occupation | Male | Female |
| Sales & Related | 351 (51.3%) | 333 (48.7%) |
| Office & Administration | 262 (22.5%) | 905 (77.5%) |
| Total (Category) | 613 (33.1%) | 1,238 (66.9%) |
| Total (Overall) | 4,333 (51.8%) | 4,036 (48.2%) |
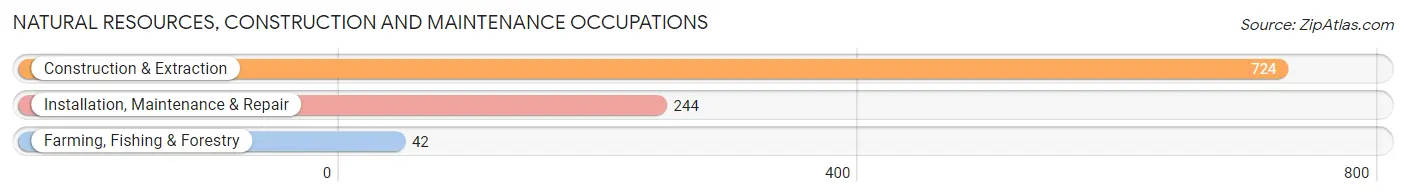
Natural Resources, Construction and Maintenance Occupations
The most common Natural Resources, Construction and Maintenance occupations in Troutdale are Construction & Extraction (724 | 8.6%), Installation, Maintenance & Repair (244 | 2.9%), and Farming, Fishing & Forestry (42 | 0.5%).
Natural Resources, Construction and Maintenance Occupations by Sex
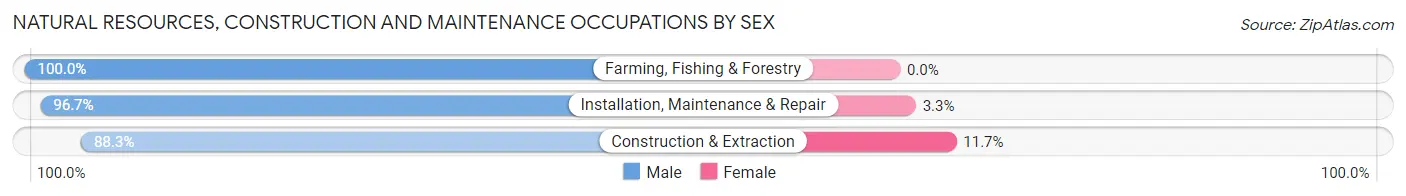
| Occupation | Male | Female |
| Farming, Fishing & Forestry | 42 (100.0%) | 0 (0.0%) |
| Construction & Extraction | 639 (88.3%) | 85 (11.7%) |
| Installation, Maintenance & Repair | 236 (96.7%) | 8 (3.3%) |
| Total (Category) | 917 (90.8%) | 93 (9.2%) |
| Total (Overall) | 4,333 (51.8%) | 4,036 (48.2%) |
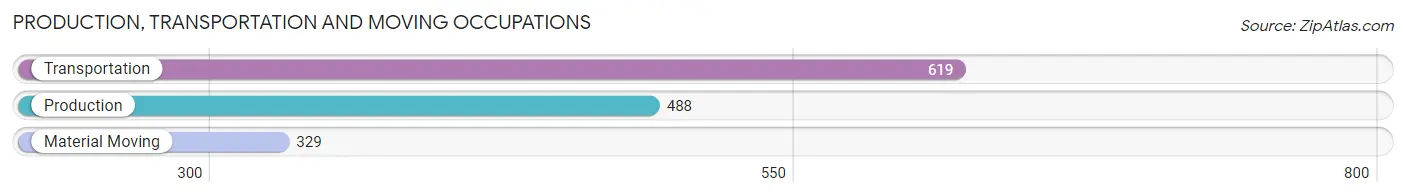
Production, Transportation and Moving Occupations
The most common Production, Transportation and Moving occupations in Troutdale are Transportation (619 | 7.4%), Production (488 | 5.8%), and Material Moving (329 | 3.9%).
Production, Transportation and Moving Occupations by Sex
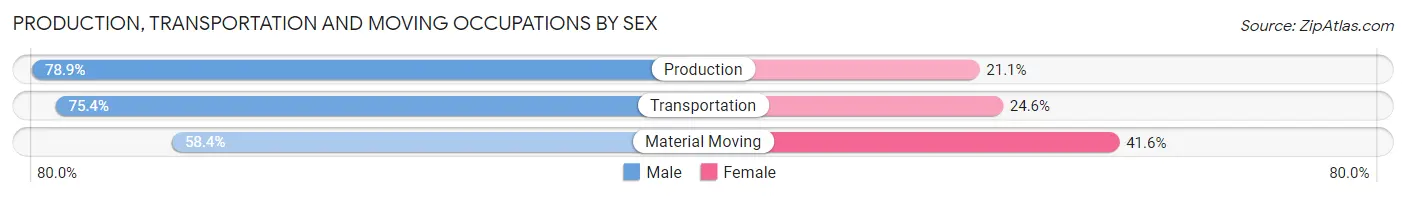
| Occupation | Male | Female |
| Production | 385 (78.9%) | 103 (21.1%) |
| Transportation | 467 (75.4%) | 152 (24.6%) |
| Material Moving | 192 (58.4%) | 137 (41.6%) |
| Total (Category) | 1,044 (72.7%) | 392 (27.3%) |
| Total (Overall) | 4,333 (51.8%) | 4,036 (48.2%) |
Employment Industries by Sex in Troutdale
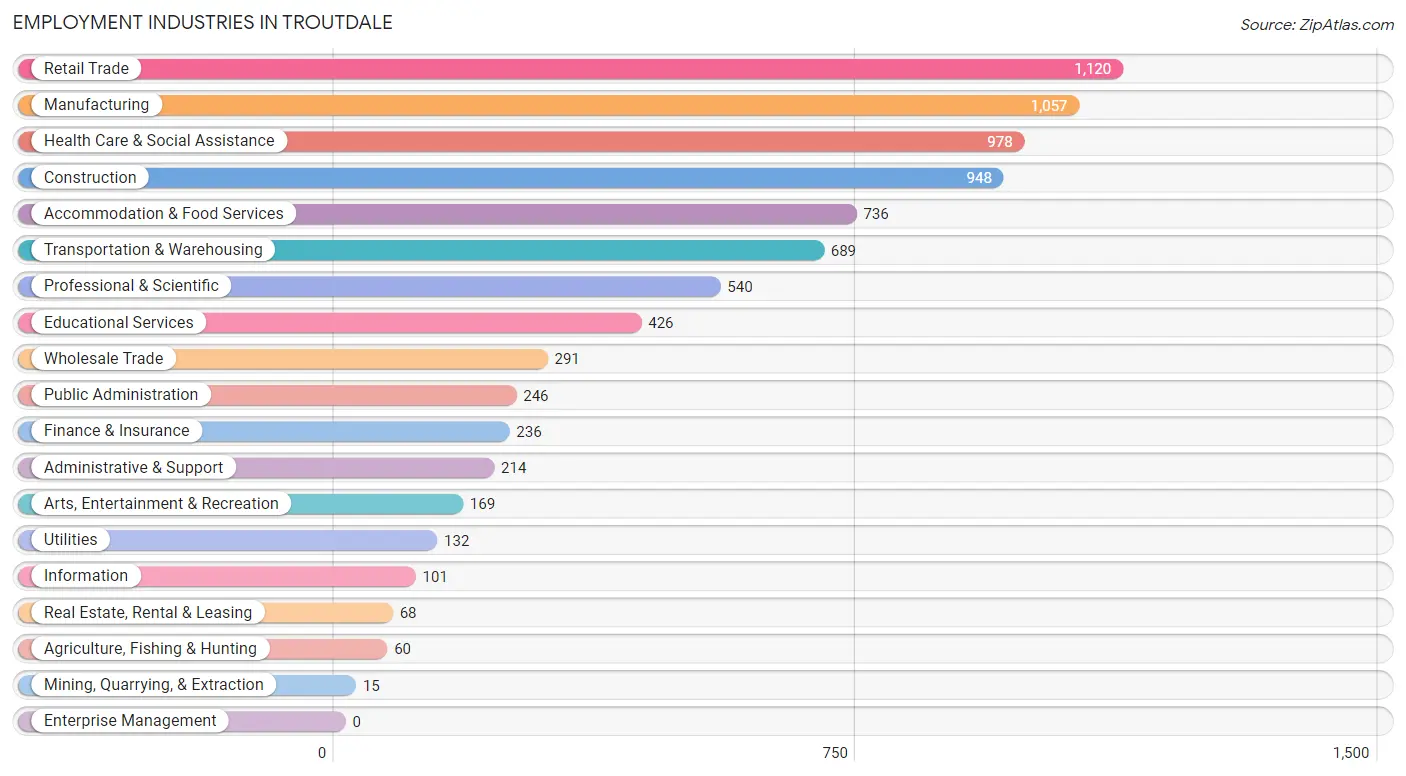
Employment Industries in Troutdale
The major employment industries in Troutdale include Retail Trade (1,120 | 13.4%), Manufacturing (1,057 | 12.6%), Health Care & Social Assistance (978 | 11.7%), Construction (948 | 11.3%), and Accommodation & Food Services (736 | 8.8%).
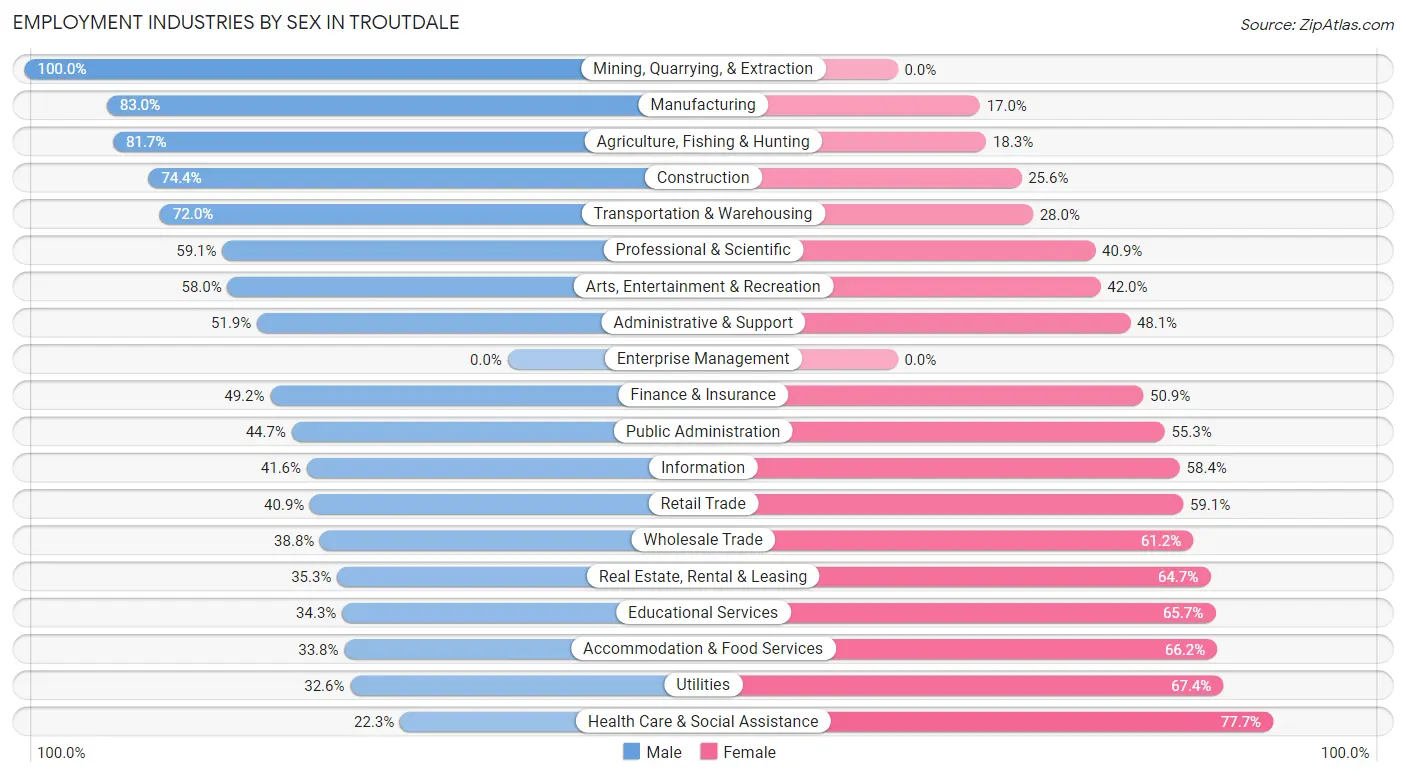
Employment Industries by Sex in Troutdale
The Troutdale industries that see more men than women are Mining, Quarrying, & Extraction (100.0%), Manufacturing (83.0%), and Agriculture, Fishing & Hunting (81.7%), whereas the industries that tend to have a higher number of women are Health Care & Social Assistance (77.7%), Utilities (67.4%), and Accommodation & Food Services (66.2%).
| Industry | Male | Female |
| Agriculture, Fishing & Hunting | 49 (81.7%) | 11 (18.3%) |
| Mining, Quarrying, & Extraction | 15 (100.0%) | 0 (0.0%) |
| Construction | 705 (74.4%) | 243 (25.6%) |
| Manufacturing | 877 (83.0%) | 180 (17.0%) |
| Wholesale Trade | 113 (38.8%) | 178 (61.2%) |
| Retail Trade | 458 (40.9%) | 662 (59.1%) |
| Transportation & Warehousing | 496 (72.0%) | 193 (28.0%) |
| Utilities | 43 (32.6%) | 89 (67.4%) |
| Information | 42 (41.6%) | 59 (58.4%) |
| Finance & Insurance | 116 (49.1%) | 120 (50.8%) |
| Real Estate, Rental & Leasing | 24 (35.3%) | 44 (64.7%) |
| Professional & Scientific | 319 (59.1%) | 221 (40.9%) |
| Enterprise Management | 0 (0.0%) | 0 (0.0%) |
| Administrative & Support | 111 (51.9%) | 103 (48.1%) |
| Educational Services | 146 (34.3%) | 280 (65.7%) |
| Health Care & Social Assistance | 218 (22.3%) | 760 (77.7%) |
| Arts, Entertainment & Recreation | 98 (58.0%) | 71 (42.0%) |
| Accommodation & Food Services | 249 (33.8%) | 487 (66.2%) |
| Public Administration | 110 (44.7%) | 136 (55.3%) |
| Total | 4,333 (51.8%) | 4,036 (48.2%) |
Education in Troutdale
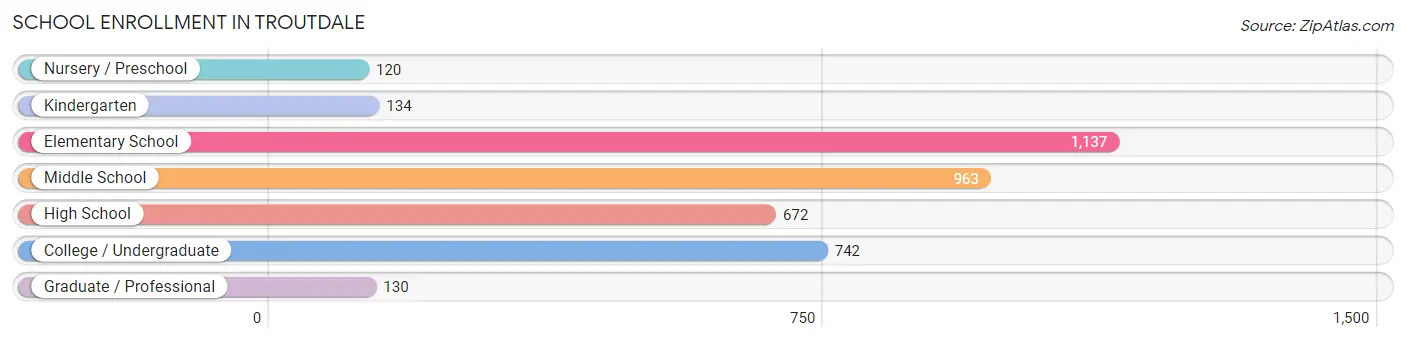
School Enrollment in Troutdale
The most common levels of schooling among the 3,898 students in Troutdale are elementary school (1,137 | 29.2%), middle school (963 | 24.7%), and college / undergraduate (742 | 19.0%).
| School Level | # Students | % Students |
| Nursery / Preschool | 120 | 3.1% |
| Kindergarten | 134 | 3.4% |
| Elementary School | 1,137 | 29.2% |
| Middle School | 963 | 24.7% |
| High School | 672 | 17.2% |
| College / Undergraduate | 742 | 19.0% |
| Graduate / Professional | 130 | 3.3% |
| Total | 3,898 | 100.0% |
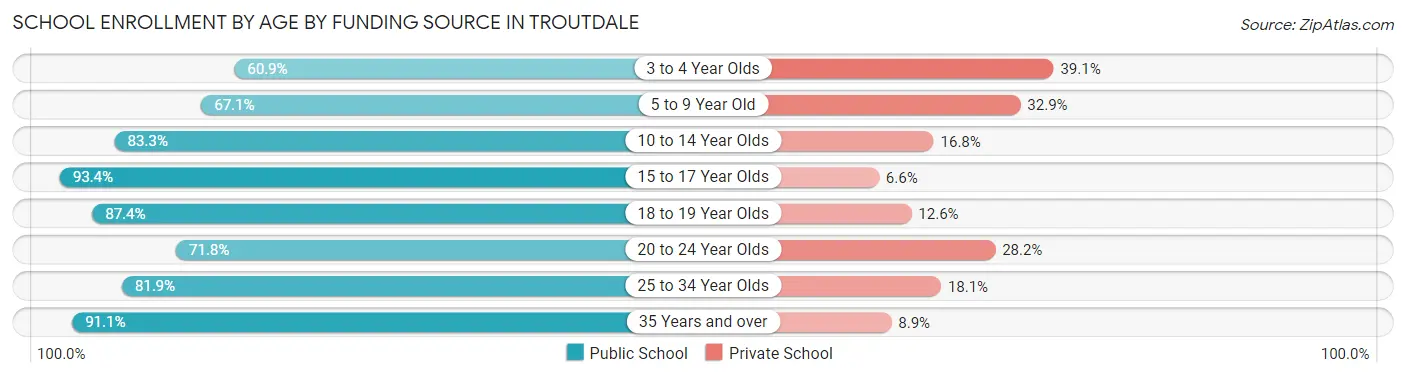
School Enrollment by Age by Funding Source in Troutdale
Out of a total of 3,898 students who are enrolled in schools in Troutdale, 780 (20.0%) attend a private institution, while the remaining 3,118 (80.0%) are enrolled in public schools. The age group of 3 to 4 year olds has the highest likelihood of being enrolled in private schools, with 34 (39.1% in the age bracket) enrolled. Conversely, the age group of 15 to 17 year olds has the lowest likelihood of being enrolled in a private school, with 513 (93.4% in the age bracket) attending a public institution.
| Age Bracket | Public School | Private School |
| 3 to 4 Year Olds | 53 (60.9%) | 34 (39.1%) |
| 5 to 9 Year Old | 654 (67.1%) | 321 (32.9%) |
| 10 to 14 Year Olds | 1,163 (83.3%) | 234 (16.8%) |
| 15 to 17 Year Olds | 513 (93.4%) | 36 (6.6%) |
| 18 to 19 Year Olds | 90 (87.4%) | 13 (12.6%) |
| 20 to 24 Year Olds | 173 (71.8%) | 68 (28.2%) |
| 25 to 34 Year Olds | 235 (81.9%) | 52 (18.1%) |
| 35 Years and over | 236 (91.1%) | 23 (8.9%) |
| Total | 3,118 (80.0%) | 780 (20.0%) |
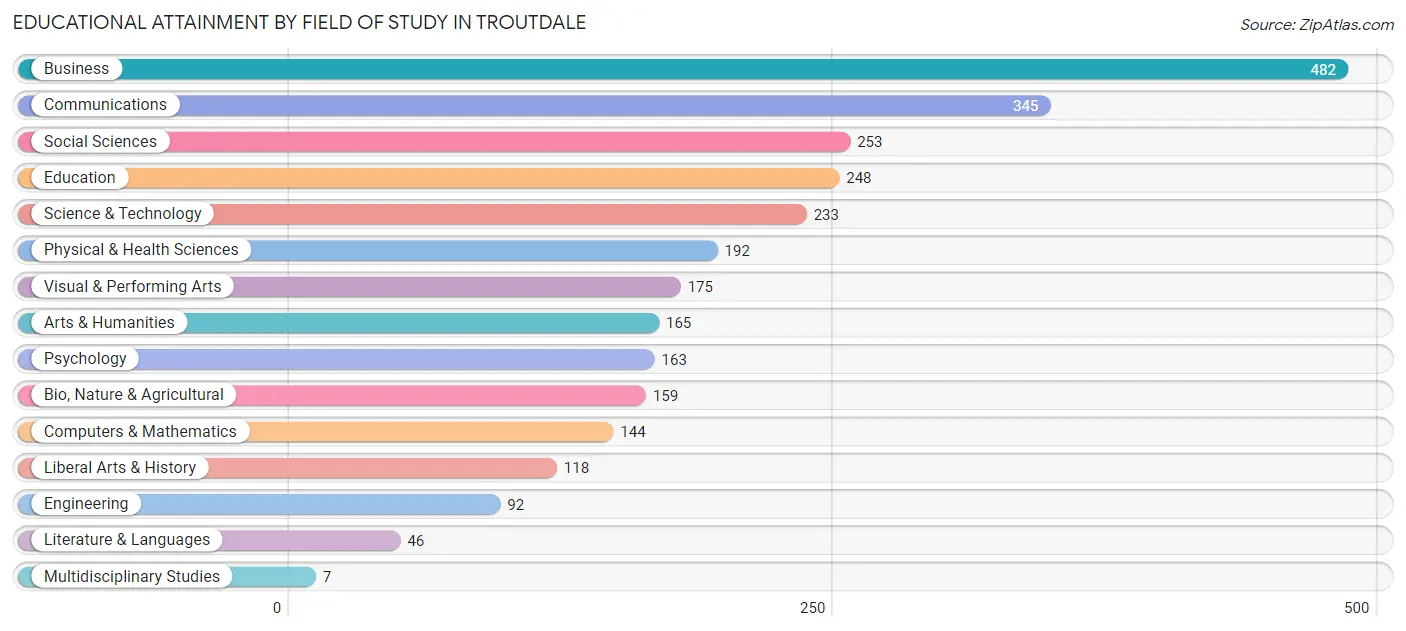
Educational Attainment by Field of Study in Troutdale
Business (482 | 17.1%), communications (345 | 12.2%), social sciences (253 | 9.0%), education (248 | 8.8%), and science & technology (233 | 8.3%) are the most common fields of study among 2,822 individuals in Troutdale who have obtained a bachelor's degree or higher.
| Field of Study | # Graduates | % Graduates |
| Computers & Mathematics | 144 | 5.1% |
| Bio, Nature & Agricultural | 159 | 5.6% |
| Physical & Health Sciences | 192 | 6.8% |
| Psychology | 163 | 5.8% |
| Social Sciences | 253 | 9.0% |
| Engineering | 92 | 3.3% |
| Multidisciplinary Studies | 7 | 0.3% |
| Science & Technology | 233 | 8.3% |
| Business | 482 | 17.1% |
| Education | 248 | 8.8% |
| Literature & Languages | 46 | 1.6% |
| Liberal Arts & History | 118 | 4.2% |
| Visual & Performing Arts | 175 | 6.2% |
| Communications | 345 | 12.2% |
| Arts & Humanities | 165 | 5.9% |
| Total | 2,822 | 100.0% |
Transportation & Commute in Troutdale
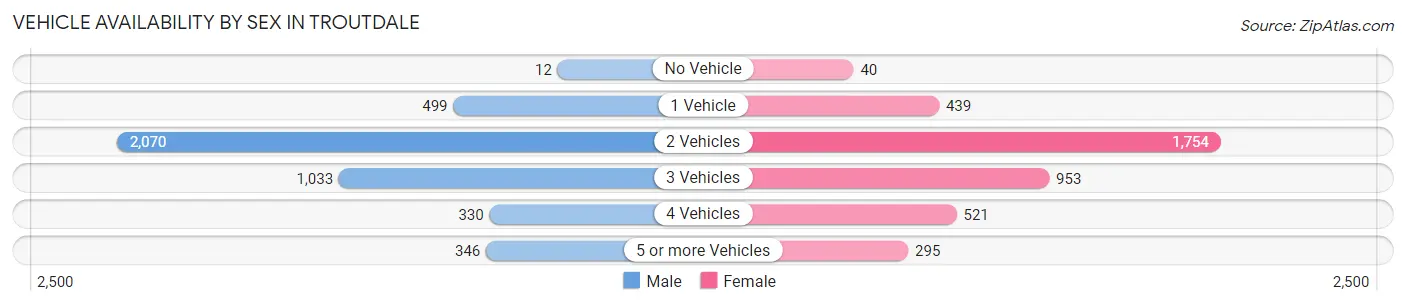
Vehicle Availability by Sex in Troutdale
The most prevalent vehicle ownership categories in Troutdale are males with 2 vehicles (2,070, accounting for 48.2%) and females with 2 vehicles (1,754, making up 51.7%).
| Vehicles Available | Male | Female |
| No Vehicle | 12 (0.3%) | 40 (1.0%) |
| 1 Vehicle | 499 (11.6%) | 439 (11.0%) |
| 2 Vehicles | 2,070 (48.2%) | 1,754 (43.8%) |
| 3 Vehicles | 1,033 (24.1%) | 953 (23.8%) |
| 4 Vehicles | 330 (7.7%) | 521 (13.0%) |
| 5 or more Vehicles | 346 (8.1%) | 295 (7.4%) |
| Total | 4,290 (100.0%) | 4,002 (100.0%) |
Commute Time in Troutdale
The most frequently occuring commute durations in Troutdale are 30 to 34 minutes (1,592 commuters, 22.1%), 10 to 14 minutes (1,064 commuters, 14.8%), and 20 to 24 minutes (819 commuters, 11.4%).
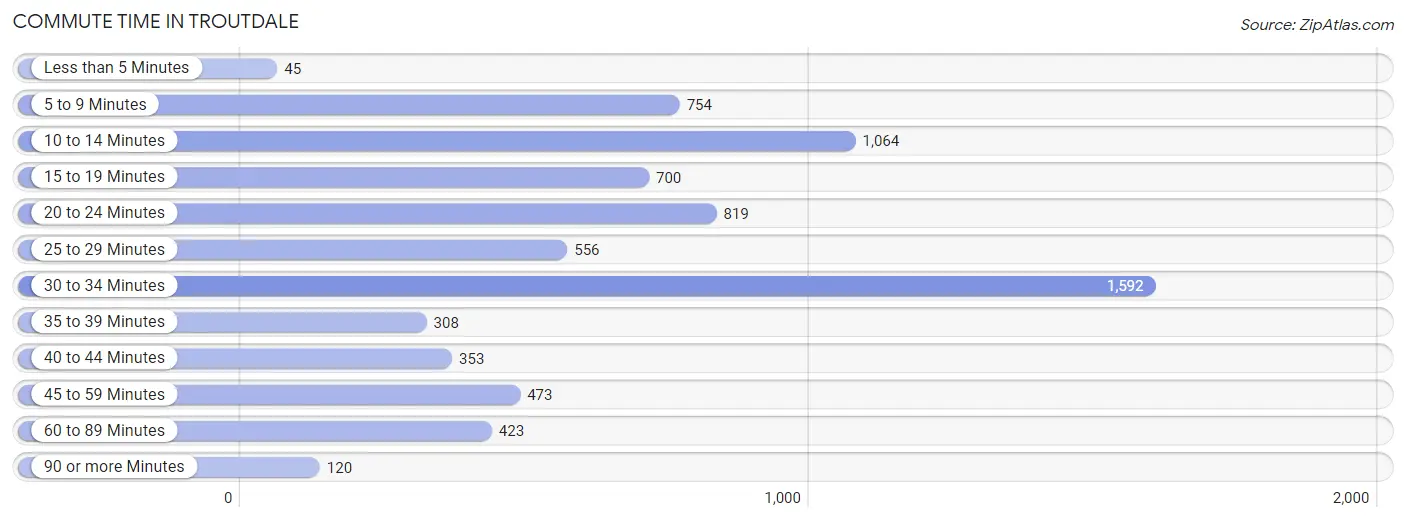
| Commute Time | # Commuters | % Commuters |
| Less than 5 Minutes | 45 | 0.6% |
| 5 to 9 Minutes | 754 | 10.5% |
| 10 to 14 Minutes | 1,064 | 14.8% |
| 15 to 19 Minutes | 700 | 9.7% |
| 20 to 24 Minutes | 819 | 11.4% |
| 25 to 29 Minutes | 556 | 7.7% |
| 30 to 34 Minutes | 1,592 | 22.1% |
| 35 to 39 Minutes | 308 | 4.3% |
| 40 to 44 Minutes | 353 | 4.9% |
| 45 to 59 Minutes | 473 | 6.6% |
| 60 to 89 Minutes | 423 | 5.9% |
| 90 or more Minutes | 120 | 1.7% |
Commute Time by Sex in Troutdale
The most common commute times in Troutdale are 30 to 34 minutes (896 commuters, 23.7%) for males and 30 to 34 minutes (696 commuters, 20.3%) for females.
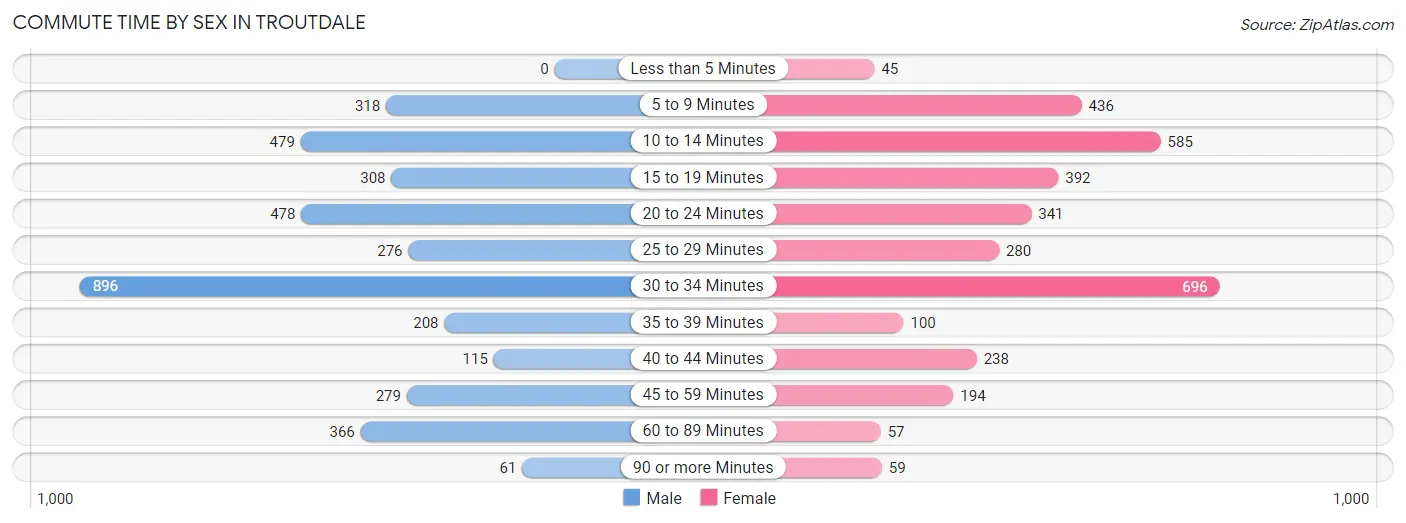
| Commute Time | Male | Female |
| Less than 5 Minutes | 0 (0.0%) | 45 (1.3%) |
| 5 to 9 Minutes | 318 (8.4%) | 436 (12.7%) |
| 10 to 14 Minutes | 479 (12.7%) | 585 (17.1%) |
| 15 to 19 Minutes | 308 (8.1%) | 392 (11.5%) |
| 20 to 24 Minutes | 478 (12.6%) | 341 (10.0%) |
| 25 to 29 Minutes | 276 (7.3%) | 280 (8.2%) |
| 30 to 34 Minutes | 896 (23.7%) | 696 (20.3%) |
| 35 to 39 Minutes | 208 (5.5%) | 100 (2.9%) |
| 40 to 44 Minutes | 115 (3.0%) | 238 (7.0%) |
| 45 to 59 Minutes | 279 (7.4%) | 194 (5.7%) |
| 60 to 89 Minutes | 366 (9.7%) | 57 (1.7%) |
| 90 or more Minutes | 61 (1.6%) | 59 (1.7%) |
Time of Departure to Work by Sex in Troutdale
The most frequent times of departure to work in Troutdale are 12:00 PM to 3:59 PM (505, 13.4%) for males and 7:00 AM to 7:29 AM (537, 15.7%) for females.
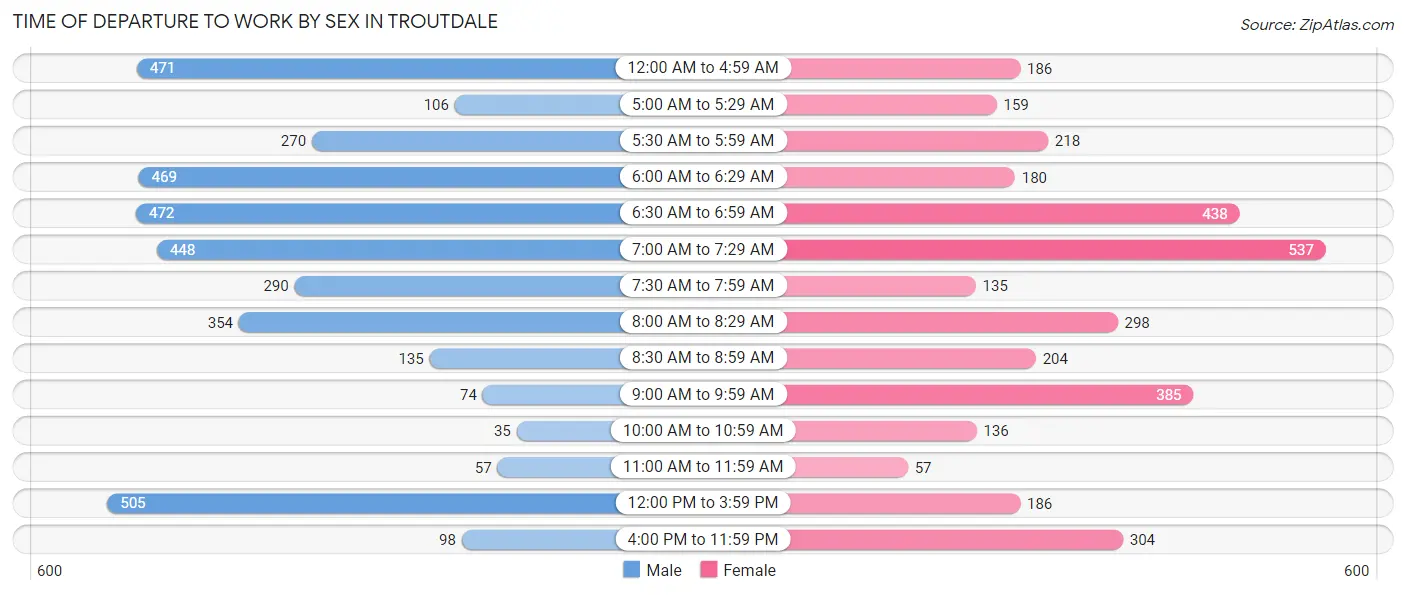
| Time of Departure | Male | Female |
| 12:00 AM to 4:59 AM | 471 (12.4%) | 186 (5.4%) |
| 5:00 AM to 5:29 AM | 106 (2.8%) | 159 (4.6%) |
| 5:30 AM to 5:59 AM | 270 (7.1%) | 218 (6.4%) |
| 6:00 AM to 6:29 AM | 469 (12.4%) | 180 (5.3%) |
| 6:30 AM to 6:59 AM | 472 (12.5%) | 438 (12.8%) |
| 7:00 AM to 7:29 AM | 448 (11.8%) | 537 (15.7%) |
| 7:30 AM to 7:59 AM | 290 (7.7%) | 135 (3.9%) |
| 8:00 AM to 8:29 AM | 354 (9.4%) | 298 (8.7%) |
| 8:30 AM to 8:59 AM | 135 (3.6%) | 204 (6.0%) |
| 9:00 AM to 9:59 AM | 74 (2.0%) | 385 (11.3%) |
| 10:00 AM to 10:59 AM | 35 (0.9%) | 136 (4.0%) |
| 11:00 AM to 11:59 AM | 57 (1.5%) | 57 (1.7%) |
| 12:00 PM to 3:59 PM | 505 (13.4%) | 186 (5.4%) |
| 4:00 PM to 11:59 PM | 98 (2.6%) | 304 (8.9%) |
| Total | 3,784 (100.0%) | 3,423 (100.0%) |
Housing Occupancy in Troutdale
Occupancy by Ownership in Troutdale
Of the total 5,503 dwellings in Troutdale, owner-occupied units account for 3,803 (69.1%), while renter-occupied units make up 1,700 (30.9%).
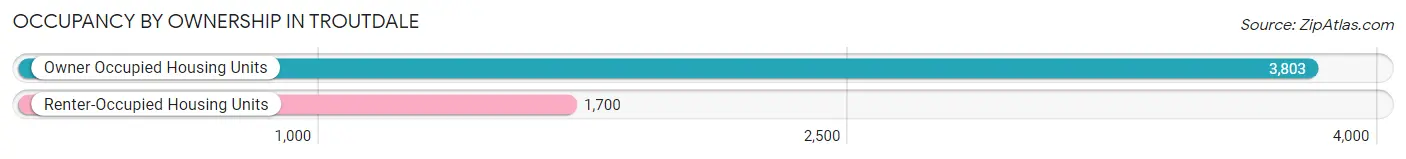
| Occupancy | # Housing Units | % Housing Units |
| Owner Occupied Housing Units | 3,803 | 69.1% |
| Renter-Occupied Housing Units | 1,700 | 30.9% |
| Total Occupied Housing Units | 5,503 | 100.0% |
Occupancy by Household Size in Troutdale
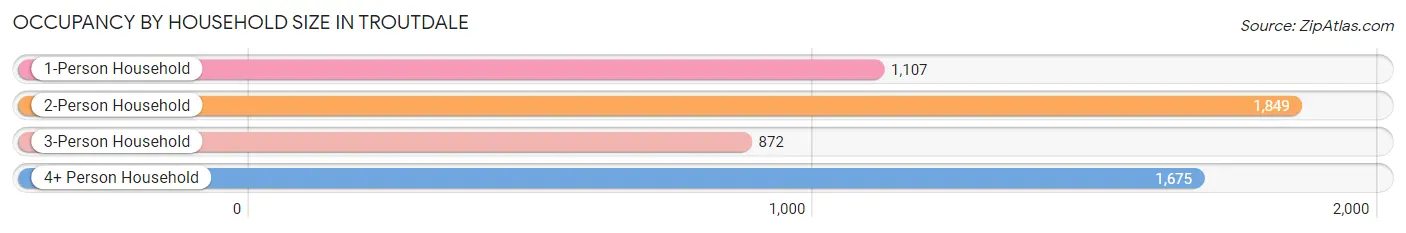
| Household Size | # Housing Units | % Housing Units |
| 1-Person Household | 1,107 | 20.1% |
| 2-Person Household | 1,849 | 33.6% |
| 3-Person Household | 872 | 15.9% |
| 4+ Person Household | 1,675 | 30.4% |
| Total Housing Units | 5,503 | 100.0% |
Occupancy by Ownership by Household Size in Troutdale
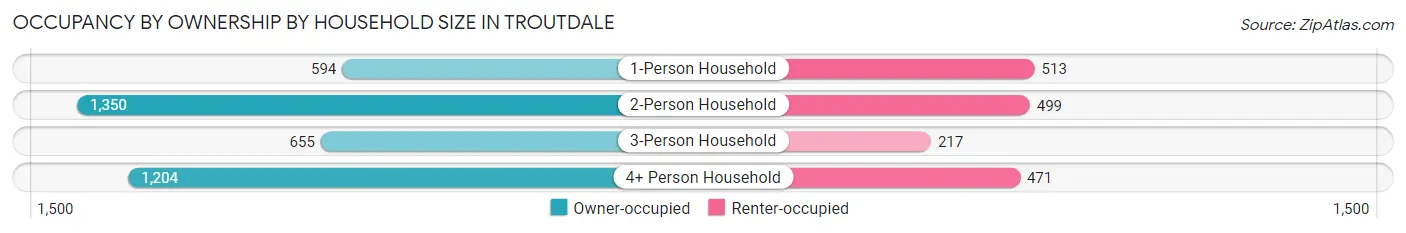
| Household Size | Owner-occupied | Renter-occupied |
| 1-Person Household | 594 (53.7%) | 513 (46.3%) |
| 2-Person Household | 1,350 (73.0%) | 499 (27.0%) |
| 3-Person Household | 655 (75.1%) | 217 (24.9%) |
| 4+ Person Household | 1,204 (71.9%) | 471 (28.1%) |
| Total Housing Units | 3,803 (69.1%) | 1,700 (30.9%) |
Occupancy by Educational Attainment in Troutdale
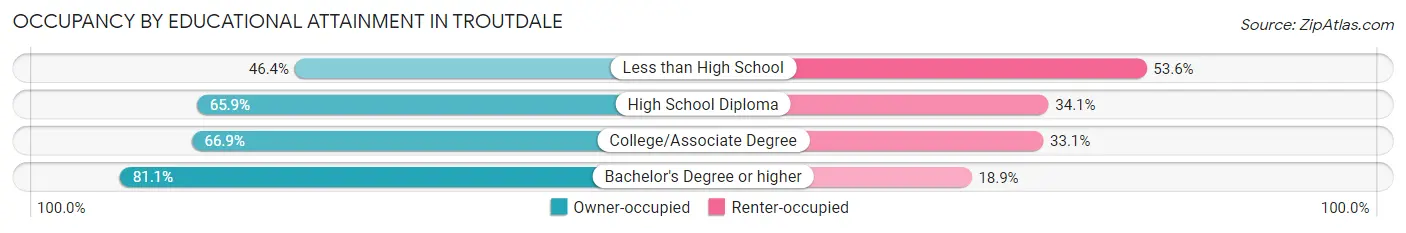
| Household Size | Owner-occupied | Renter-occupied |
| Less than High School | 149 (46.4%) | 172 (53.6%) |
| High School Diploma | 951 (65.9%) | 493 (34.1%) |
| College/Associate Degree | 1,548 (66.9%) | 766 (33.1%) |
| Bachelor's Degree or higher | 1,155 (81.1%) | 269 (18.9%) |
Occupancy by Age of Householder in Troutdale
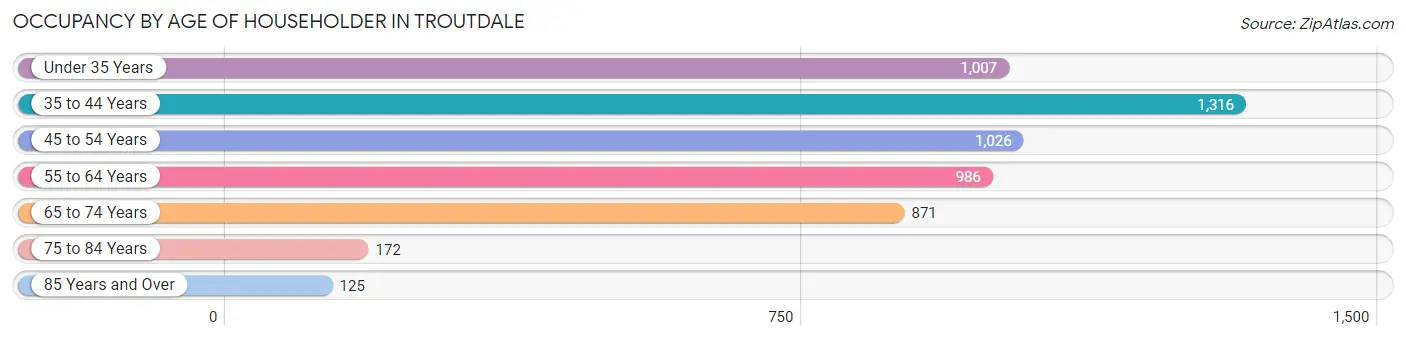
| Age Bracket | # Households | % Households |
| Under 35 Years | 1,007 | 18.3% |
| 35 to 44 Years | 1,316 | 23.9% |
| 45 to 54 Years | 1,026 | 18.6% |
| 55 to 64 Years | 986 | 17.9% |
| 65 to 74 Years | 871 | 15.8% |
| 75 to 84 Years | 172 | 3.1% |
| 85 Years and Over | 125 | 2.3% |
| Total | 5,503 | 100.0% |
Housing Finances in Troutdale
Median Income by Occupancy in Troutdale
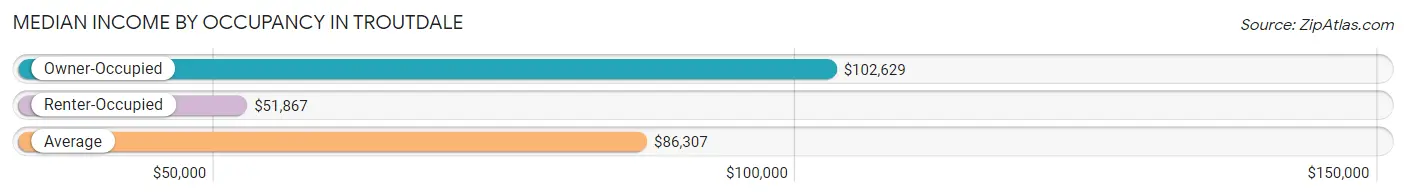
| Occupancy Type | # Households | Median Income |
| Owner-Occupied | 3,803 (69.1%) | $102,629 |
| Renter-Occupied | 1,700 (30.9%) | $51,867 |
| Average | 5,503 (100.0%) | $86,307 |
Occupancy by Householder Income Bracket in Troutdale
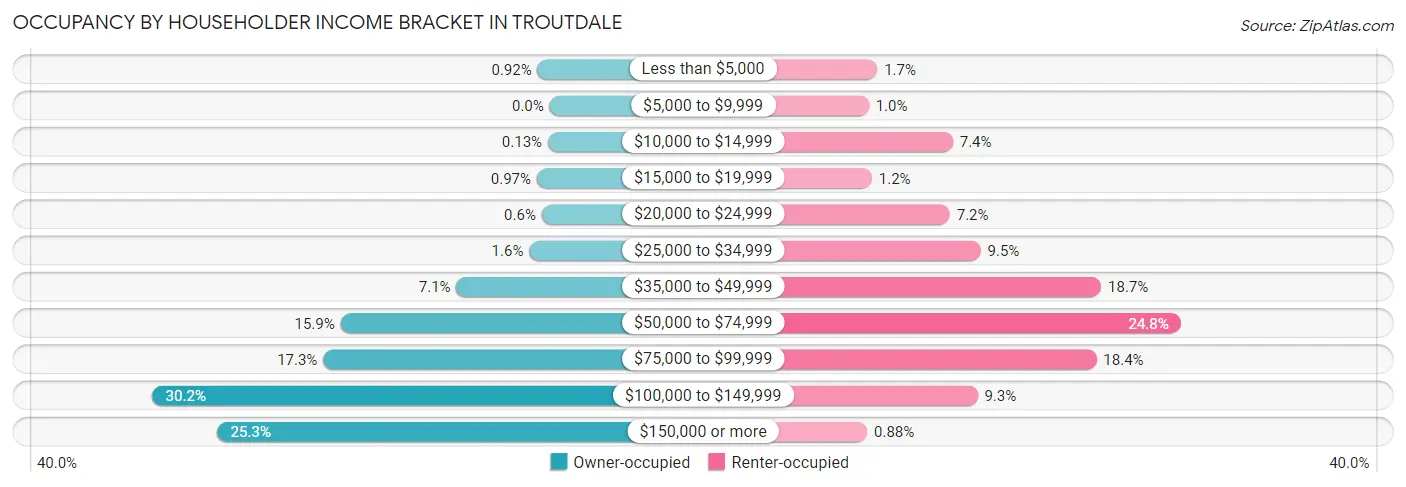
| Income Bracket | Owner-occupied | Renter-occupied |
| Less than $5,000 | 35 (0.9%) | 28 (1.7%) |
| $5,000 to $9,999 | 0 (0.0%) | 17 (1.0%) |
| $10,000 to $14,999 | 5 (0.1%) | 126 (7.4%) |
| $15,000 to $19,999 | 37 (1.0%) | 21 (1.2%) |
| $20,000 to $24,999 | 23 (0.6%) | 122 (7.2%) |
| $25,000 to $34,999 | 59 (1.5%) | 162 (9.5%) |
| $35,000 to $49,999 | 270 (7.1%) | 318 (18.7%) |
| $50,000 to $74,999 | 606 (15.9%) | 421 (24.8%) |
| $75,000 to $99,999 | 656 (17.2%) | 312 (18.3%) |
| $100,000 to $149,999 | 1,150 (30.2%) | 158 (9.3%) |
| $150,000 or more | 962 (25.3%) | 15 (0.9%) |
| Total | 3,803 (100.0%) | 1,700 (100.0%) |
Monthly Housing Cost Tiers in Troutdale
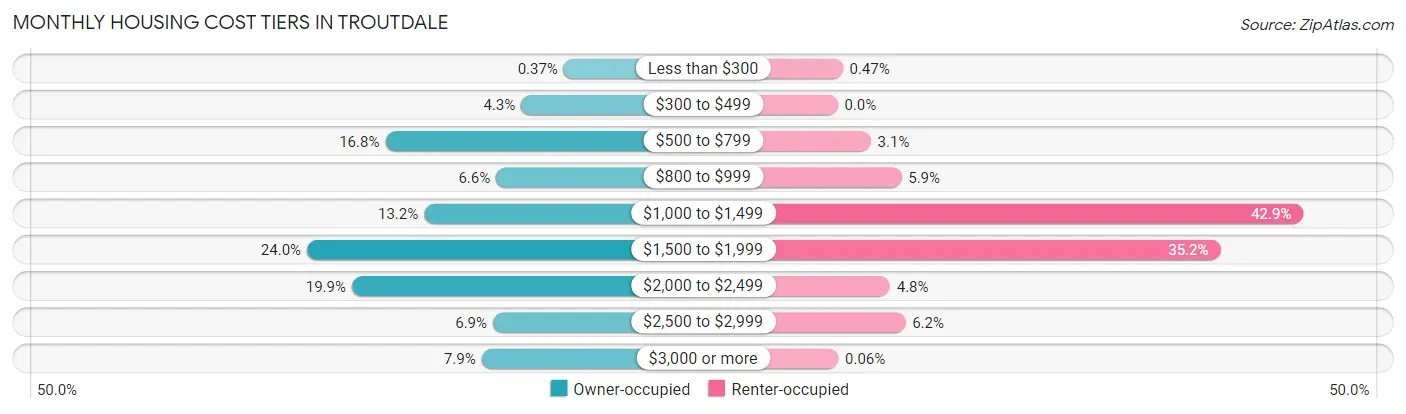
| Monthly Cost | Owner-occupied | Renter-occupied |
| Less than $300 | 14 (0.4%) | 8 (0.5%) |
| $300 to $499 | 163 (4.3%) | 0 (0.0%) |
| $500 to $799 | 639 (16.8%) | 52 (3.1%) |
| $800 to $999 | 251 (6.6%) | 100 (5.9%) |
| $1,000 to $1,499 | 503 (13.2%) | 729 (42.9%) |
| $1,500 to $1,999 | 913 (24.0%) | 599 (35.2%) |
| $2,000 to $2,499 | 756 (19.9%) | 82 (4.8%) |
| $2,500 to $2,999 | 262 (6.9%) | 106 (6.2%) |
| $3,000 or more | 302 (7.9%) | 1 (0.1%) |
| Total | 3,803 (100.0%) | 1,700 (100.0%) |
Physical Housing Characteristics in Troutdale
Housing Structures in Troutdale
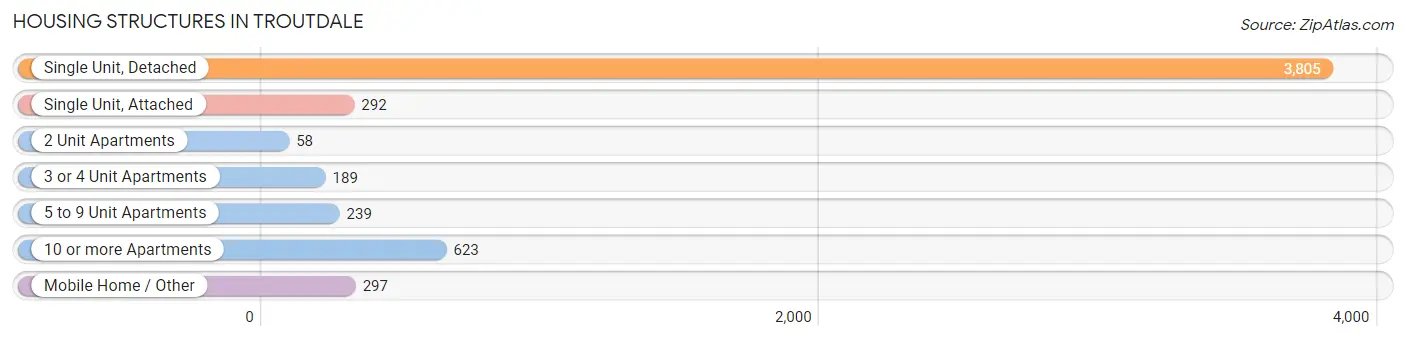
| Structure Type | # Housing Units | % Housing Units |
| Single Unit, Detached | 3,805 | 69.1% |
| Single Unit, Attached | 292 | 5.3% |
| 2 Unit Apartments | 58 | 1.1% |
| 3 or 4 Unit Apartments | 189 | 3.4% |
| 5 to 9 Unit Apartments | 239 | 4.3% |
| 10 or more Apartments | 623 | 11.3% |
| Mobile Home / Other | 297 | 5.4% |
| Total | 5,503 | 100.0% |
Housing Structures by Occupancy in Troutdale
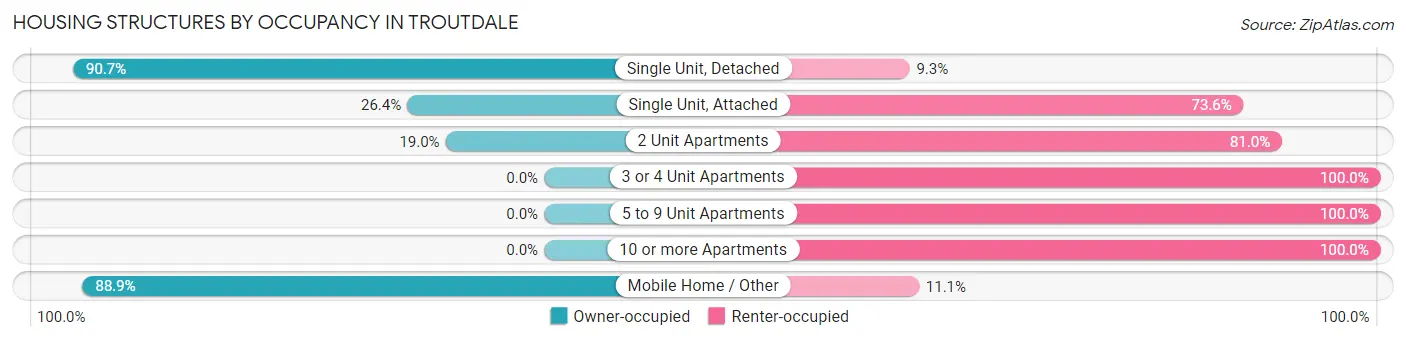
| Structure Type | Owner-occupied | Renter-occupied |
| Single Unit, Detached | 3,451 (90.7%) | 354 (9.3%) |
| Single Unit, Attached | 77 (26.4%) | 215 (73.6%) |
| 2 Unit Apartments | 11 (19.0%) | 47 (81.0%) |
| 3 or 4 Unit Apartments | 0 (0.0%) | 189 (100.0%) |
| 5 to 9 Unit Apartments | 0 (0.0%) | 239 (100.0%) |
| 10 or more Apartments | 0 (0.0%) | 623 (100.0%) |
| Mobile Home / Other | 264 (88.9%) | 33 (11.1%) |
| Total | 3,803 (69.1%) | 1,700 (30.9%) |
Housing Structures by Number of Rooms in Troutdale
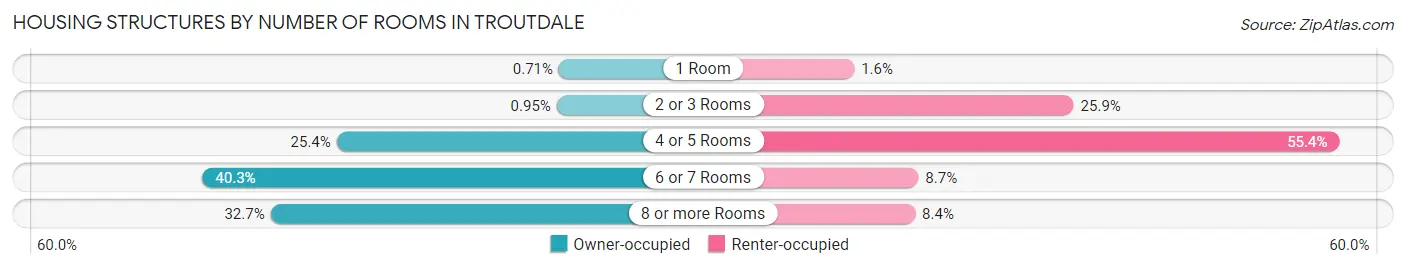
| Number of Rooms | Owner-occupied | Renter-occupied |
| 1 Room | 27 (0.7%) | 27 (1.6%) |
| 2 or 3 Rooms | 36 (0.9%) | 441 (25.9%) |
| 4 or 5 Rooms | 965 (25.4%) | 942 (55.4%) |
| 6 or 7 Rooms | 1,531 (40.3%) | 148 (8.7%) |
| 8 or more Rooms | 1,244 (32.7%) | 142 (8.4%) |
| Total | 3,803 (100.0%) | 1,700 (100.0%) |
Housing Structure by Heating Type in Troutdale
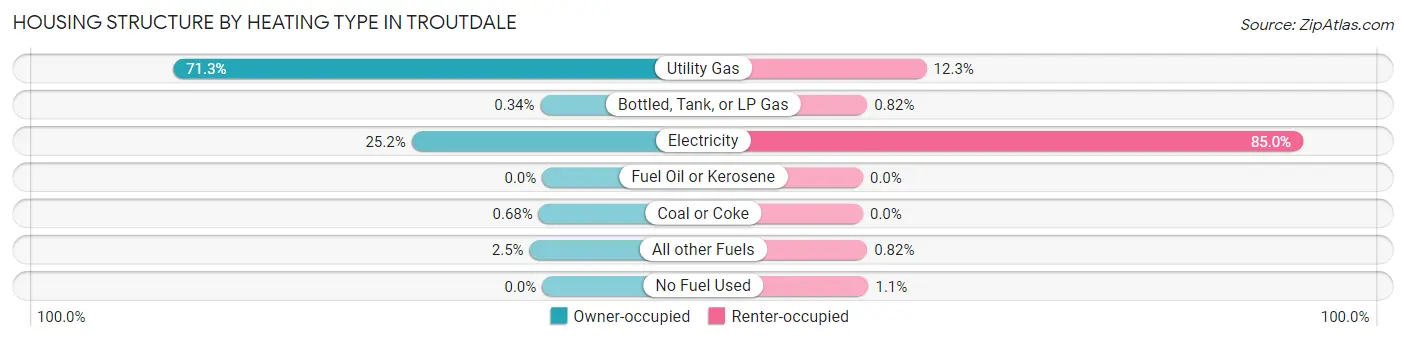
| Heating Type | Owner-occupied | Renter-occupied |
| Utility Gas | 2,711 (71.3%) | 209 (12.3%) |
| Bottled, Tank, or LP Gas | 13 (0.3%) | 14 (0.8%) |
| Electricity | 960 (25.2%) | 1,445 (85.0%) |
| Fuel Oil or Kerosene | 0 (0.0%) | 0 (0.0%) |
| Coal or Coke | 26 (0.7%) | 0 (0.0%) |
| All other Fuels | 93 (2.5%) | 14 (0.8%) |
| No Fuel Used | 0 (0.0%) | 18 (1.1%) |
| Total | 3,803 (100.0%) | 1,700 (100.0%) |
Household Vehicle Usage in Troutdale
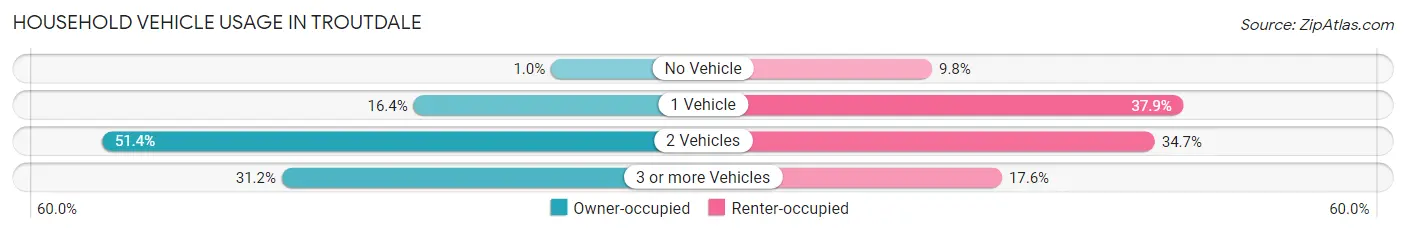
| Vehicles per Household | Owner-occupied | Renter-occupied |
| No Vehicle | 39 (1.0%) | 166 (9.8%) |
| 1 Vehicle | 625 (16.4%) | 645 (37.9%) |
| 2 Vehicles | 1,953 (51.3%) | 590 (34.7%) |
| 3 or more Vehicles | 1,186 (31.2%) | 299 (17.6%) |
| Total | 3,803 (100.0%) | 1,700 (100.0%) |
Real Estate & Mortgages in Troutdale
Real Estate and Mortgage Overview in Troutdale
| Characteristic | Without Mortgage | With Mortgage |
| Housing Units | 1,063 | 2,740 |
| Median Property Value | $402,900 | $407,000 |
| Median Household Income | $83,574 | $806 |
| Monthly Housing Costs | $656 | $284 |
| Real Estate Taxes | $4,186 | $29 |
Property Value by Mortgage Status in Troutdale
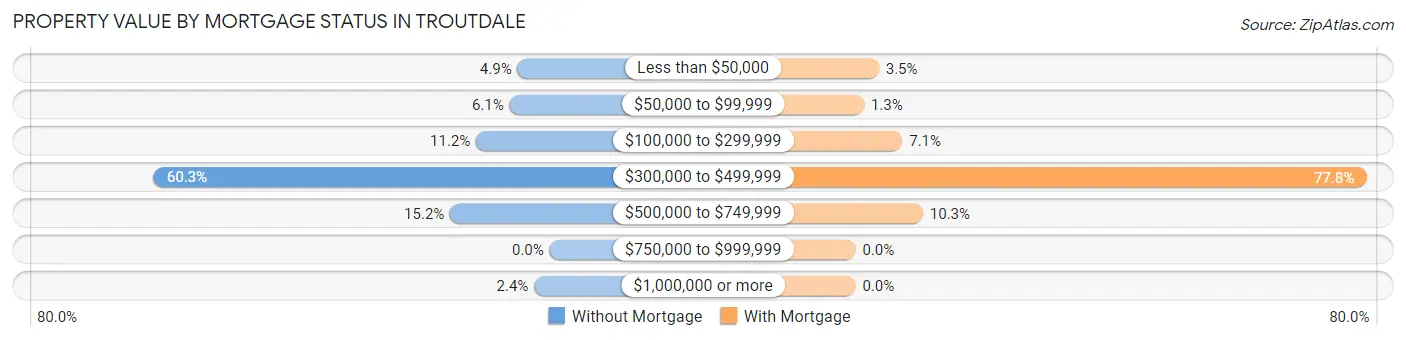
| Property Value | Without Mortgage | With Mortgage |
| Less than $50,000 | 52 (4.9%) | 97 (3.5%) |
| $50,000 to $99,999 | 65 (6.1%) | 35 (1.3%) |
| $100,000 to $299,999 | 119 (11.2%) | 195 (7.1%) |
| $300,000 to $499,999 | 641 (60.3%) | 2,132 (77.8%) |
| $500,000 to $749,999 | 161 (15.1%) | 281 (10.3%) |
| $750,000 to $999,999 | 0 (0.0%) | 0 (0.0%) |
| $1,000,000 or more | 25 (2.4%) | 0 (0.0%) |
| Total | 1,063 (100.0%) | 2,740 (100.0%) |
Household Income by Mortgage Status in Troutdale
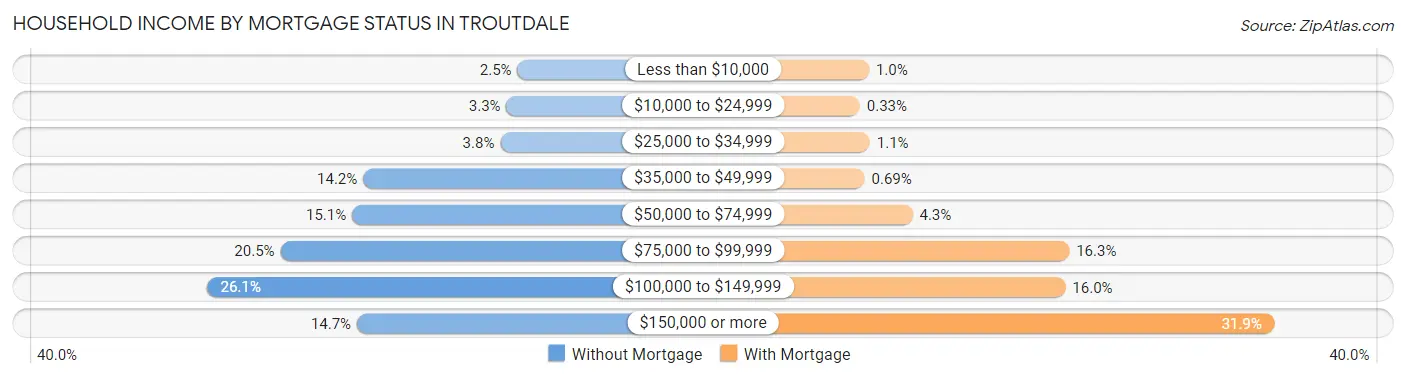
| Household Income | Without Mortgage | With Mortgage |
| Less than $10,000 | 26 (2.5%) | 28 (1.0%) |
| $10,000 to $24,999 | 35 (3.3%) | 9 (0.3%) |
| $25,000 to $34,999 | 40 (3.8%) | 30 (1.1%) |
| $35,000 to $49,999 | 151 (14.2%) | 19 (0.7%) |
| $50,000 to $74,999 | 160 (15.0%) | 119 (4.3%) |
| $75,000 to $99,999 | 218 (20.5%) | 446 (16.3%) |
| $100,000 to $149,999 | 277 (26.1%) | 438 (16.0%) |
| $150,000 or more | 156 (14.7%) | 873 (31.9%) |
| Total | 1,063 (100.0%) | 2,740 (100.0%) |
Property Value to Household Income Ratio in Troutdale
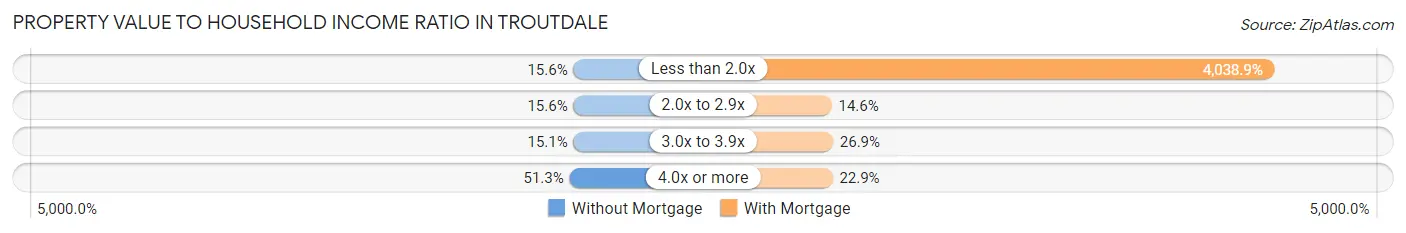
| Value-to-Income Ratio | Without Mortgage | With Mortgage |
| Less than 2.0x | 166 (15.6%) | 110,667 (4,038.9%) |
| 2.0x to 2.9x | 166 (15.6%) | 399 (14.6%) |
| 3.0x to 3.9x | 160 (15.0%) | 737 (26.9%) |
| 4.0x or more | 545 (51.3%) | 626 (22.9%) |
| Total | 1,063 (100.0%) | 2,740 (100.0%) |
Real Estate Taxes by Mortgage Status in Troutdale
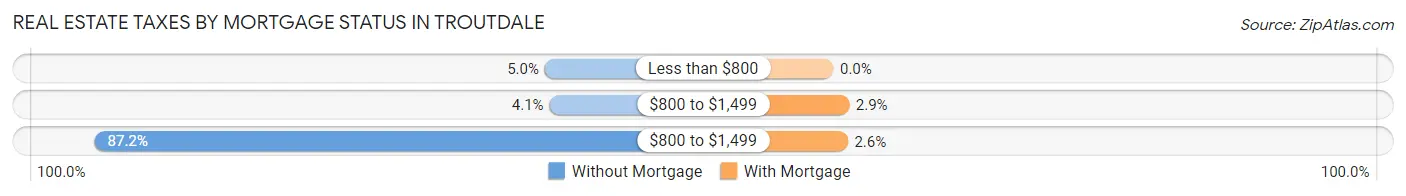
| Property Taxes | Without Mortgage | With Mortgage |
| Less than $800 | 53 (5.0%) | 0 (0.0%) |
| $800 to $1,499 | 44 (4.1%) | 79 (2.9%) |
| $800 to $1,499 | 927 (87.2%) | 72 (2.6%) |
| Total | 1,063 (100.0%) | 2,740 (100.0%) |
Health & Disability in Troutdale
Health Insurance Coverage by Age in Troutdale
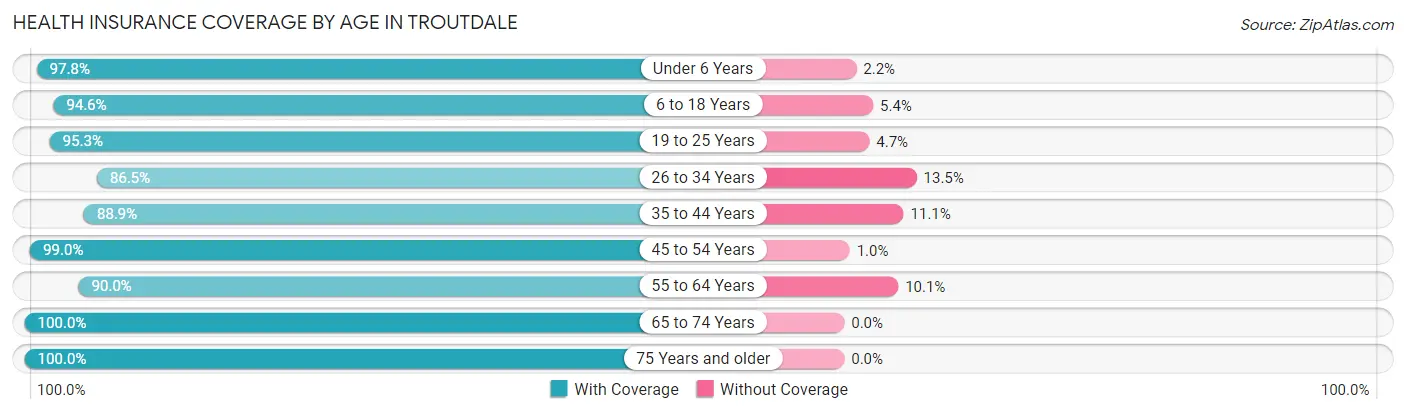
| Age Bracket | With Coverage | Without Coverage |
| Under 6 Years | 1,526 (97.8%) | 35 (2.2%) |
| 6 to 18 Years | 2,906 (94.6%) | 165 (5.4%) |
| 19 to 25 Years | 1,262 (95.3%) | 62 (4.7%) |
| 26 to 34 Years | 1,758 (86.5%) | 274 (13.5%) |
| 35 to 44 Years | 2,333 (88.9%) | 290 (11.1%) |
| 45 to 54 Years | 1,861 (99.0%) | 19 (1.0%) |
| 55 to 64 Years | 1,620 (89.9%) | 181 (10.1%) |
| 65 to 74 Years | 1,395 (100.0%) | 0 (0.0%) |
| 75 Years and older | 457 (100.0%) | 0 (0.0%) |
| Total | 15,118 (93.6%) | 1,026 (6.4%) |
Health Insurance Coverage by Citizenship Status in Troutdale
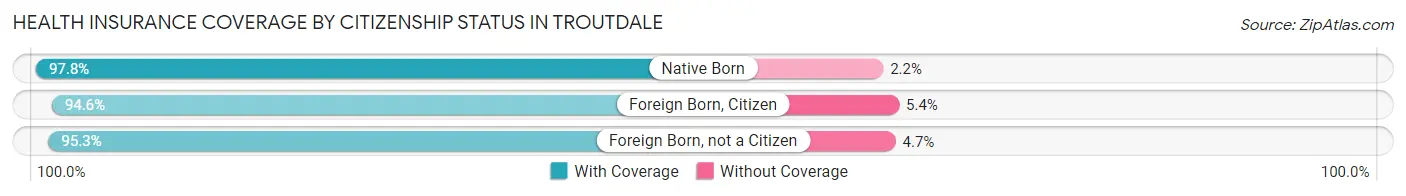
| Citizenship Status | With Coverage | Without Coverage |
| Native Born | 1,526 (97.8%) | 35 (2.2%) |
| Foreign Born, Citizen | 2,906 (94.6%) | 165 (5.4%) |
| Foreign Born, not a Citizen | 1,262 (95.3%) | 62 (4.7%) |
Health Insurance Coverage by Household Income in Troutdale
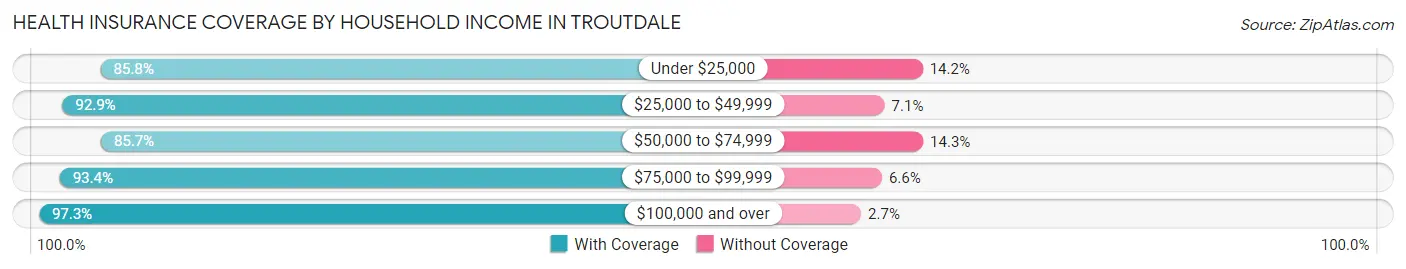
| Household Income | With Coverage | Without Coverage |
| Under $25,000 | 579 (85.8%) | 96 (14.2%) |
| $25,000 to $49,999 | 1,781 (92.9%) | 136 (7.1%) |
| $50,000 to $74,999 | 2,462 (85.7%) | 411 (14.3%) |
| $75,000 to $99,999 | 2,326 (93.4%) | 164 (6.6%) |
| $100,000 and over | 7,925 (97.3%) | 219 (2.7%) |
Public vs Private Health Insurance Coverage by Age in Troutdale
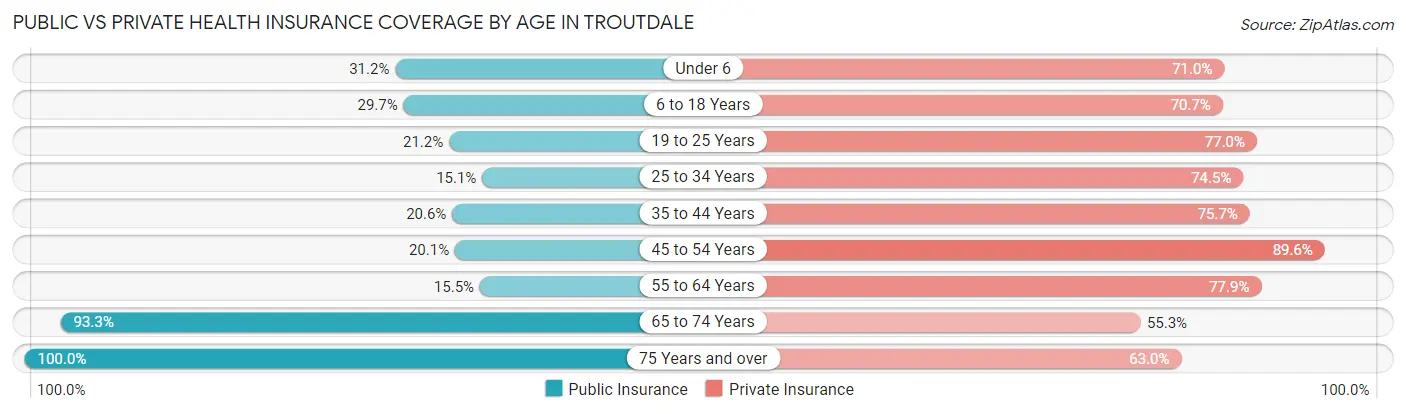
| Age Bracket | Public Insurance | Private Insurance |
| Under 6 | 487 (31.2%) | 1,108 (71.0%) |
| 6 to 18 Years | 911 (29.7%) | 2,171 (70.7%) |
| 19 to 25 Years | 281 (21.2%) | 1,020 (77.0%) |
| 25 to 34 Years | 306 (15.1%) | 1,514 (74.5%) |
| 35 to 44 Years | 541 (20.6%) | 1,986 (75.7%) |
| 45 to 54 Years | 378 (20.1%) | 1,685 (89.6%) |
| 55 to 64 Years | 279 (15.5%) | 1,402 (77.8%) |
| 65 to 74 Years | 1,302 (93.3%) | 772 (55.3%) |
| 75 Years and over | 457 (100.0%) | 288 (63.0%) |
| Total | 4,942 (30.6%) | 11,946 (74.0%) |
Disability Status by Sex by Age in Troutdale
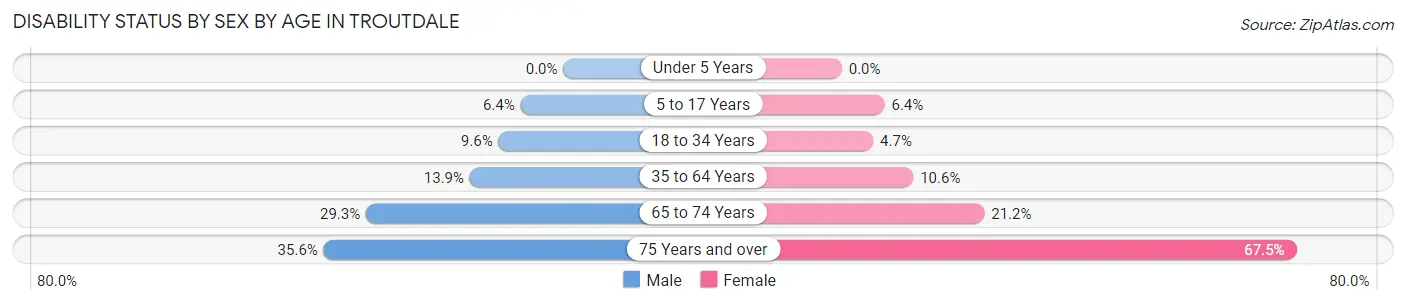
| Age Bracket | Male | Female |
| Under 5 Years | 0 (0.0%) | 0 (0.0%) |
| 5 to 17 Years | 108 (6.4%) | 87 (6.4%) |
| 18 to 34 Years | 173 (9.6%) | 77 (4.7%) |
| 35 to 64 Years | 451 (13.9%) | 324 (10.6%) |
| 65 to 74 Years | 201 (29.3%) | 150 (21.2%) |
| 75 Years and over | 63 (35.6%) | 189 (67.5%) |
Disability Class by Sex by Age in Troutdale
Disability Class: Hearing Difficulty
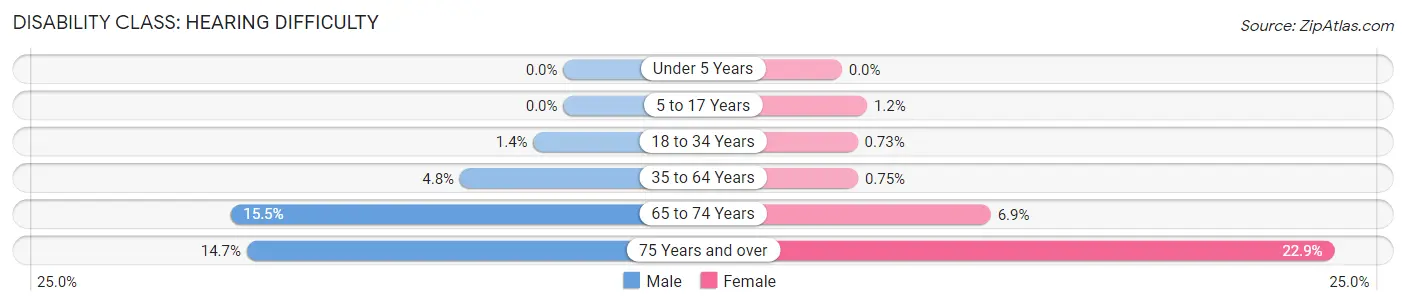
| Age Bracket | Male | Female |
| Under 5 Years | 0 (0.0%) | 0 (0.0%) |
| 5 to 17 Years | 0 (0.0%) | 16 (1.2%) |
| 18 to 34 Years | 25 (1.4%) | 12 (0.7%) |
| 35 to 64 Years | 156 (4.8%) | 23 (0.7%) |
| 65 to 74 Years | 106 (15.4%) | 49 (6.9%) |
| 75 Years and over | 26 (14.7%) | 64 (22.9%) |
Disability Class: Vision Difficulty
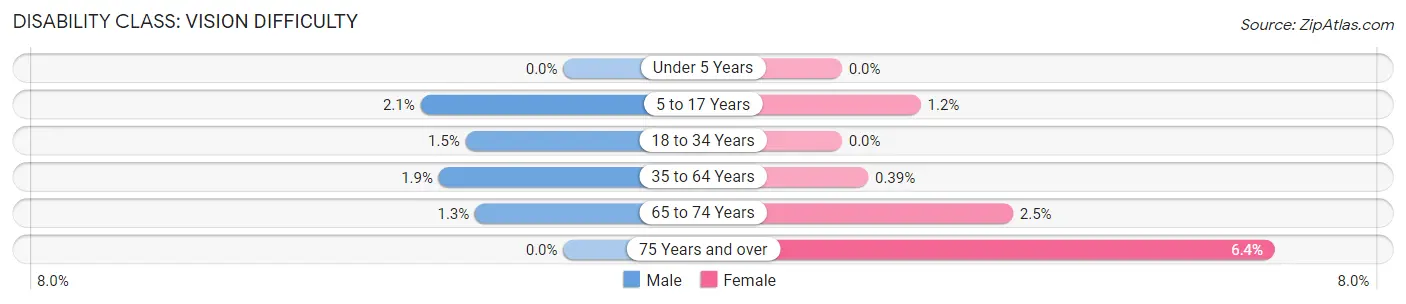
| Age Bracket | Male | Female |
| Under 5 Years | 0 (0.0%) | 0 (0.0%) |
| 5 to 17 Years | 36 (2.1%) | 16 (1.2%) |
| 18 to 34 Years | 26 (1.5%) | 0 (0.0%) |
| 35 to 64 Years | 60 (1.8%) | 12 (0.4%) |
| 65 to 74 Years | 9 (1.3%) | 18 (2.5%) |
| 75 Years and over | 0 (0.0%) | 18 (6.4%) |
Disability Class: Cognitive Difficulty
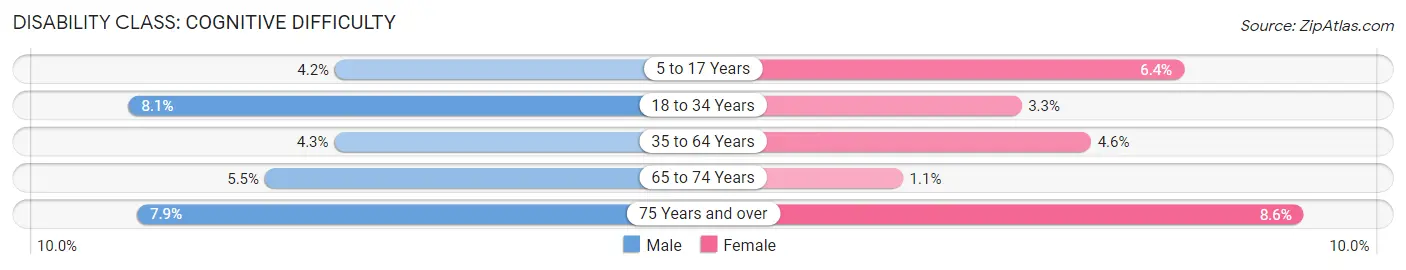
| Age Bracket | Male | Female |
| 5 to 17 Years | 72 (4.2%) | 87 (6.4%) |
| 18 to 34 Years | 145 (8.1%) | 55 (3.3%) |
| 35 to 64 Years | 138 (4.3%) | 141 (4.6%) |
| 65 to 74 Years | 38 (5.5%) | 8 (1.1%) |
| 75 Years and over | 14 (7.9%) | 24 (8.6%) |
Disability Class: Ambulatory Difficulty
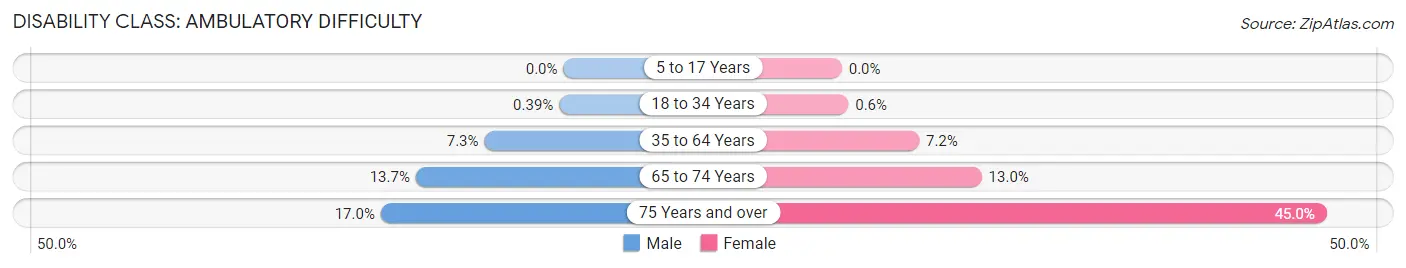
| Age Bracket | Male | Female |
| 5 to 17 Years | 0 (0.0%) | 0 (0.0%) |
| 18 to 34 Years | 7 (0.4%) | 10 (0.6%) |
| 35 to 64 Years | 238 (7.3%) | 219 (7.2%) |
| 65 to 74 Years | 94 (13.7%) | 92 (13.0%) |
| 75 Years and over | 30 (17.0%) | 126 (45.0%) |
Disability Class: Self-Care Difficulty
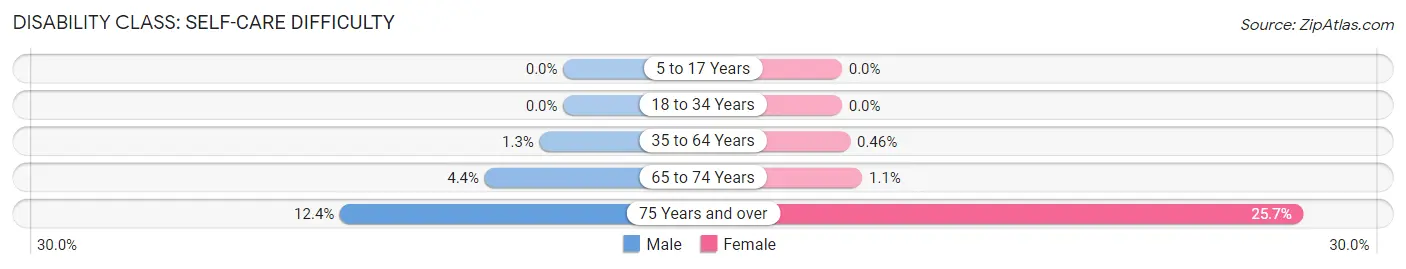
| Age Bracket | Male | Female |
| 5 to 17 Years | 0 (0.0%) | 0 (0.0%) |
| 18 to 34 Years | 0 (0.0%) | 0 (0.0%) |
| 35 to 64 Years | 43 (1.3%) | 14 (0.5%) |
| 65 to 74 Years | 30 (4.4%) | 8 (1.1%) |
| 75 Years and over | 22 (12.4%) | 72 (25.7%) |
Technology Access in Troutdale
Computing Device Access in Troutdale
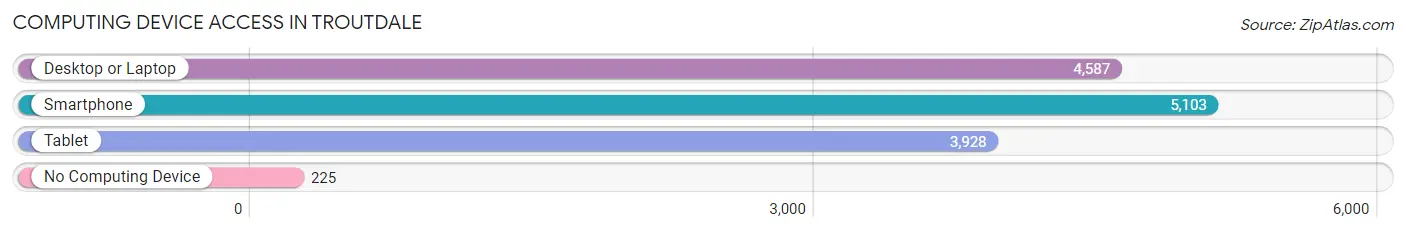
| Device Type | # Households | % Households |
| Desktop or Laptop | 4,587 | 83.4% |
| Smartphone | 5,103 | 92.7% |
| Tablet | 3,928 | 71.4% |
| No Computing Device | 225 | 4.1% |
| Total | 5,503 | 100.0% |
Internet Access in Troutdale
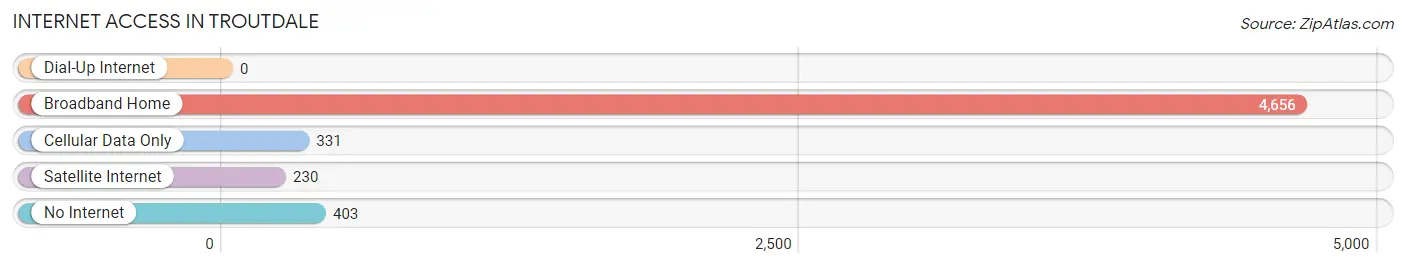
| Internet Type | # Households | % Households |
| Dial-Up Internet | 0 | 0.0% |
| Broadband Home | 4,656 | 84.6% |
| Cellular Data Only | 331 | 6.0% |
| Satellite Internet | 230 | 4.2% |
| No Internet | 403 | 7.3% |
| Total | 5,503 | 100.0% |
Troutdale Summary
Troutdale, Oregon is a small city located in Multnomah County, Oregon, United States. It is situated in the Columbia River Gorge, just east of Portland. The city is known for its scenic beauty, outdoor recreation, and historic downtown.
History
Troutdale was first settled in the early 1800s by pioneers who were attracted to the area by its abundant natural resources. The first settlers were mostly farmers and loggers, who established small homesteads along the banks of the Sandy River. The town was officially incorporated in 1907, and the name Troutdale was chosen to reflect the abundance of trout in the area.
In the early 1900s, Troutdale was a thriving logging and farming community. The town was home to several sawmills, a flour mill, and a cannery. The town also had a thriving commercial district, with several stores, restaurants, and hotels.
In the 1950s, Troutdale began to experience a decline in its economy. The logging industry had declined, and the town’s population began to decline as well. In the 1970s, Troutdale began to experience a resurgence in its economy, as the city began to attract new businesses and residents.
Geography
Troutdale is located in the Columbia River Gorge, just east of Portland. The city is situated on the banks of the Sandy River, and is surrounded by the Cascade Mountains to the east and the Coast Range to the west. The city is located at an elevation of approximately 500 feet, and has a total area of 4.2 square miles.
The climate in Troutdale is mild and temperate, with warm summers and cool winters. The average annual temperature is around 50 degrees Fahrenheit, and the average annual precipitation is around 40 inches.
Economy
Troutdale’s economy is largely based on tourism and retail. The city is home to several tourist attractions, including the Troutdale Historical Museum, the Troutdale Art Gallery, and the Troutdale Farmers Market. The city is also home to several retail stores, restaurants, and hotels.
Troutdale is also home to several manufacturing companies, including Columbia Sportswear, which produces outdoor apparel and gear. The city is also home to several technology companies, including Intel, which has a large manufacturing facility in the city.
Demographics
As of the 2010 census, Troutdale had a population of 15,962. The racial makeup of the city was 87.3% White, 4.2% Asian, 2.2% African American, 0.7% Native American, and 0.4% Pacific Islander. The median household income was $50,945, and the median family income was $60,945.
Troutdale is a diverse city, with a variety of cultures and backgrounds represented. The city is home to a large Hispanic population, as well as a large Asian population. The city is also home to a large number of immigrants, with over 20% of the population being foreign-born.
Conclusion
Troutdale, Oregon is a small city located in Multnomah County, Oregon, United States. It is situated in the Columbia River Gorge, just east of Portland. The city is known for its scenic beauty, outdoor recreation, and historic downtown. Troutdale’s economy is largely based on tourism and retail, and the city is home to several tourist attractions, manufacturing companies, and technology companies. The city is also home to a diverse population, with a variety of cultures and backgrounds represented.
Common Questions
What is Per Capita Income in Troutdale?
Per Capita income in Troutdale is $34,319.
What is the Median Family Income in Troutdale?
Median Family Income in Troutdale is $94,671.
What is the Median Household income in Troutdale?
Median Household Income in Troutdale is $86,307.
What is Income or Wage Gap in Troutdale?
Income or Wage Gap in Troutdale is 34.2%.
Women in Troutdale earn 65.8 cents for every dollar earned by a man.
What is Inequality or Gini Index in Troutdale?
Inequality or Gini Index in Troutdale is 0.34.
What is the Total Population of Troutdale?
Total Population of Troutdale is 16,150.
What is the Total Male Population of Troutdale?
Total Male Population of Troutdale is 8,325.
What is the Total Female Population of Troutdale?
Total Female Population of Troutdale is 7,825.
What is the Ratio of Males per 100 Females in Troutdale?
There are 106.39 Males per 100 Females in Troutdale.
What is the Ratio of Females per 100 Males in Troutdale?
There are 93.99 Females per 100 Males in Troutdale.
What is the Median Population Age in Troutdale?
Median Population Age in Troutdale is 35.4 Years.
What is the Average Family Size in Troutdale
Average Family Size in Troutdale is 3.5 People.
What is the Average Household Size in Troutdale
Average Household Size in Troutdale is 2.9 People.
How Large is the Labor Force in Troutdale?
There are 8,750 People in the Labor Forcein in Troutdale.
What is the Percentage of People in the Labor Force in Troutdale?
73.0% of People are in the Labor Force in Troutdale.
What is the Unemployment Rate in Troutdale?
Unemployment Rate in Troutdale is 4.4%.