Ishpeming, MI Map & Demographics
Ishpeming Map
Ishpeming Overview
$26,497
PER CAPITA INCOME
$67,965
AVG FAMILY INCOME
$53,202
AVG HOUSEHOLD INCOME
43.0%
WAGE / INCOME GAP [ % ]
57.0¢/ $1
WAGE / INCOME GAP [ $ ]
0.40
INEQUALITY / GINI INDEX
6,191
TOTAL POPULATION
2,853
MALE POPULATION
3,338
FEMALE POPULATION
85.47
MALES / 100 FEMALES
117.00
FEMALES / 100 MALES
36.4
MEDIAN AGE
3.2
AVG FAMILY SIZE
2.5
AVG HOUSEHOLD SIZE
3,096
LABOR FORCE [ PEOPLE ]
63.3%
PERCENT IN LABOR FORCE
7.7%
UNEMPLOYMENT RATE
Ishpeming Zip Codes
Ishpeming Area Codes
Income in Ishpeming
Income Overview in Ishpeming
Per Capita Income in Ishpeming is $26,497, while median incomes of families and households are $67,965 and $53,202 respectively.
| Characteristic | Number | Measure |
| Per Capita Income | 6,191 | $26,497 |
| Median Family Income | 1,497 | $67,965 |
| Mean Family Income | 1,497 | $76,963 |
| Median Household Income | 2,441 | $53,202 |
| Mean Household Income | 2,441 | $64,620 |
| Income Deficit | 1,497 | $0 |
| Wage / Income Gap (%) | 6,191 | 42.99% |
| Wage / Income Gap ($) | 6,191 | 57.01¢ per $1 |
| Gini / Inequality Index | 6,191 | 0.40 |
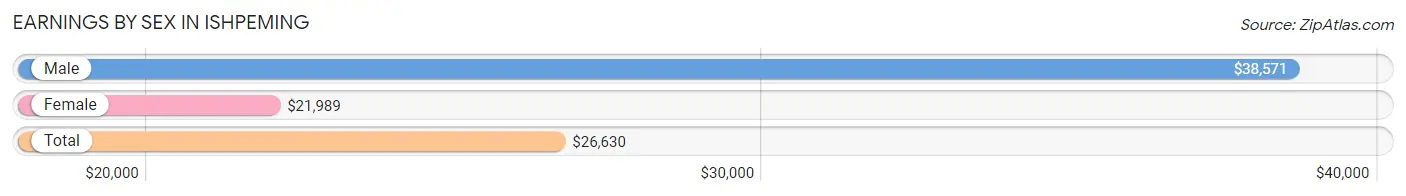
Earnings by Sex in Ishpeming
Average Earnings in Ishpeming are $26,630, $38,571 for men and $21,989 for women, a difference of 43.0%.
| Sex | Number | Average Earnings |
| Male | 1,382 (44.4%) | $38,571 |
| Female | 1,733 (55.6%) | $21,989 |
| Total | 3,115 (100.0%) | $26,630 |
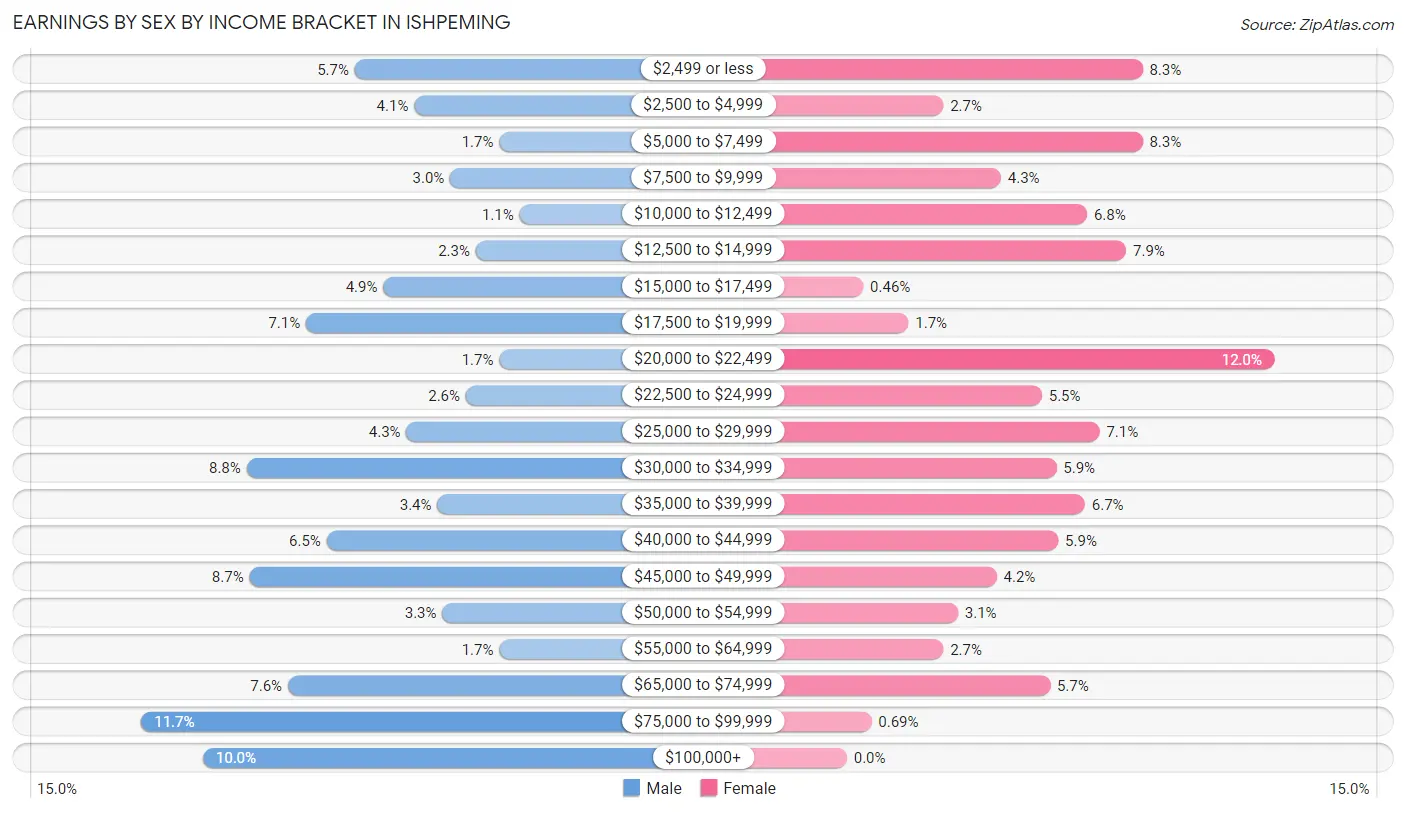
Earnings by Sex by Income Bracket in Ishpeming
The most common earnings brackets in Ishpeming are $75,000 to $99,999 for men (162 | 11.7%) and $20,000 to $22,499 for women (208 | 12.0%).
| Income | Male | Female |
| $2,499 or less | 79 (5.7%) | 144 (8.3%) |
| $2,500 to $4,999 | 56 (4.1%) | 47 (2.7%) |
| $5,000 to $7,499 | 23 (1.7%) | 144 (8.3%) |
| $7,500 to $9,999 | 42 (3.0%) | 75 (4.3%) |
| $10,000 to $12,499 | 15 (1.1%) | 117 (6.8%) |
| $12,500 to $14,999 | 32 (2.3%) | 136 (7.9%) |
| $15,000 to $17,499 | 68 (4.9%) | 8 (0.5%) |
| $17,500 to $19,999 | 98 (7.1%) | 30 (1.7%) |
| $20,000 to $22,499 | 23 (1.7%) | 208 (12.0%) |
| $22,500 to $24,999 | 36 (2.6%) | 95 (5.5%) |
| $25,000 to $29,999 | 59 (4.3%) | 123 (7.1%) |
| $30,000 to $34,999 | 121 (8.8%) | 102 (5.9%) |
| $35,000 to $39,999 | 47 (3.4%) | 116 (6.7%) |
| $40,000 to $44,999 | 90 (6.5%) | 103 (5.9%) |
| $45,000 to $49,999 | 120 (8.7%) | 73 (4.2%) |
| $50,000 to $54,999 | 45 (3.3%) | 54 (3.1%) |
| $55,000 to $64,999 | 23 (1.7%) | 47 (2.7%) |
| $65,000 to $74,999 | 105 (7.6%) | 99 (5.7%) |
| $75,000 to $99,999 | 162 (11.7%) | 12 (0.7%) |
| $100,000+ | 138 (10.0%) | 0 (0.0%) |
| Total | 1,382 (100.0%) | 1,733 (100.0%) |
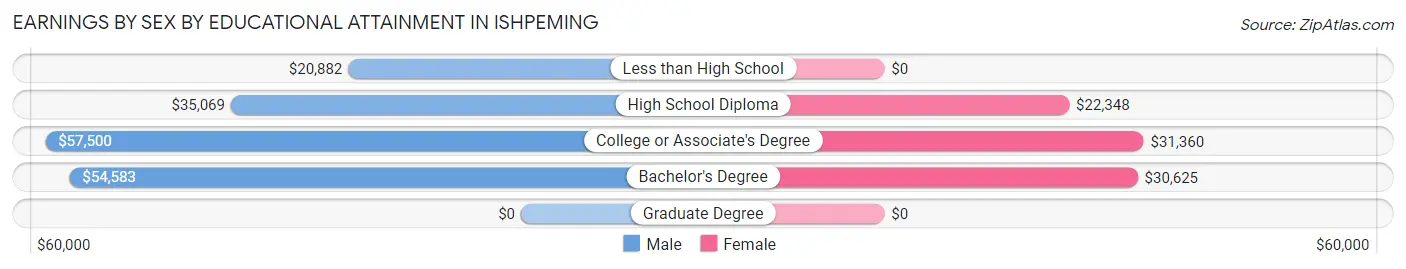
Earnings by Sex by Educational Attainment in Ishpeming
Average earnings in Ishpeming are $46,017 for men and $25,815 for women, a difference of 43.9%. Men with an educational attainment of college or associate's degree enjoy the highest average annual earnings of $57,500, while those with less than high school education earn the least with $20,882. Women with an educational attainment of college or associate's degree earn the most with the average annual earnings of $31,360, while those with high school diploma education have the smallest earnings of $22,348.
| Educational Attainment | Male Income | Female Income |
| Less than High School | $20,882 | $0 |
| High School Diploma | $35,069 | $22,348 |
| College or Associate's Degree | $57,500 | $31,360 |
| Bachelor's Degree | $54,583 | $30,625 |
| Graduate Degree | - | - |
| Total | $46,017 | $25,815 |
Family Income in Ishpeming
Family Income Brackets in Ishpeming
According to the Ishpeming family income data, there are 308 families falling into the $50,000 to $74,999 income range, which is the most common income bracket and makes up 20.6% of all families. Conversely, the $10,000 to $14,999 income bracket is the least frequent group with only 16 families (1.1%) belonging to this category.
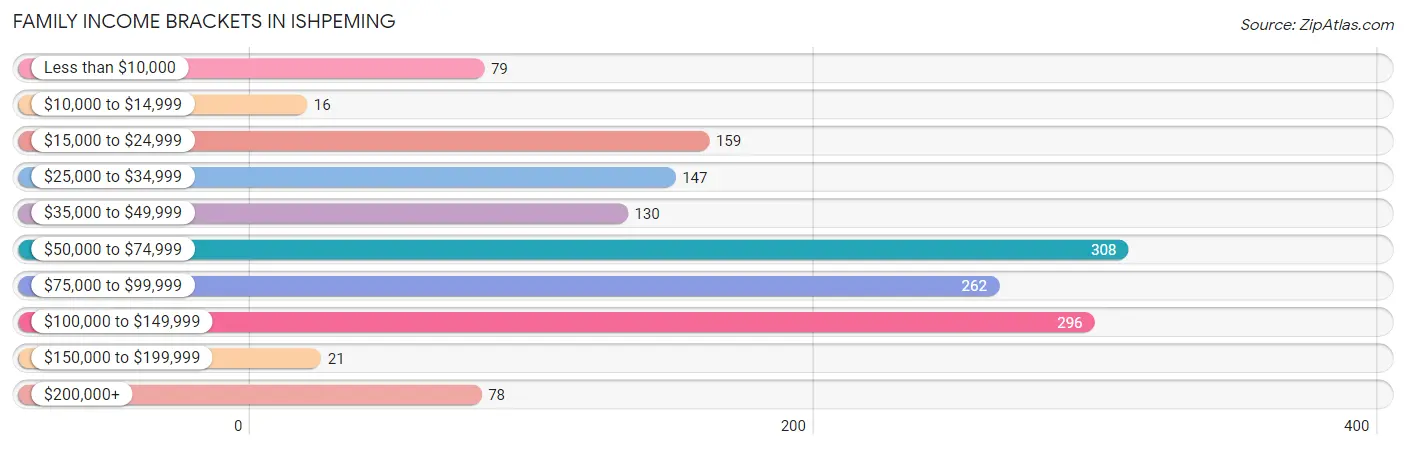
| Income Bracket | # Families | % Families |
| Less than $10,000 | 79 | 5.3% |
| $10,000 to $14,999 | 16 | 1.1% |
| $15,000 to $24,999 | 159 | 10.6% |
| $25,000 to $34,999 | 147 | 9.8% |
| $35,000 to $49,999 | 130 | 8.7% |
| $50,000 to $74,999 | 308 | 20.6% |
| $75,000 to $99,999 | 262 | 17.5% |
| $100,000 to $149,999 | 296 | 19.8% |
| $150,000 to $199,999 | 21 | 1.4% |
| $200,000+ | 78 | 5.2% |
Family Income by Famaliy Size in Ishpeming
5-person families (114 | 7.6%) account for the highest median family income in Ishpeming with $123,929 per family, while 2-person families (732 | 48.9%) have the highest median income of $30,349 per family member.
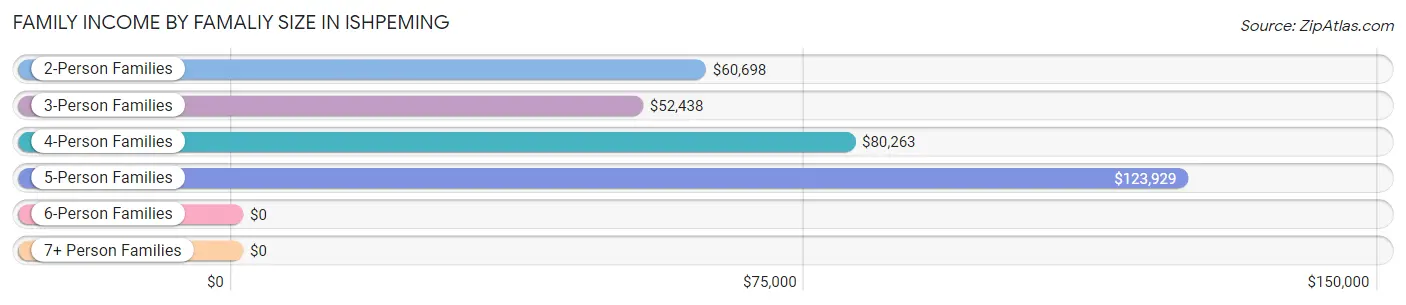
| Income Bracket | # Families | Median Income |
| 2-Person Families | 732 (48.9%) | $60,698 |
| 3-Person Families | 297 (19.8%) | $52,438 |
| 4-Person Families | 260 (17.4%) | $80,263 |
| 5-Person Families | 114 (7.6%) | $123,929 |
| 6-Person Families | 88 (5.9%) | $0 |
| 7+ Person Families | 6 (0.4%) | $0 |
| Total | 1,497 (100.0%) | $67,965 |
Family Income by Number of Earners in Ishpeming
The median family income in Ishpeming is $67,965, with families comprising 3+ earners (178) having the highest median family income of $104,565, while families with 1 earner (489) have the lowest median family income of $35,032, accounting for 11.9% and 32.7% of families, respectively.
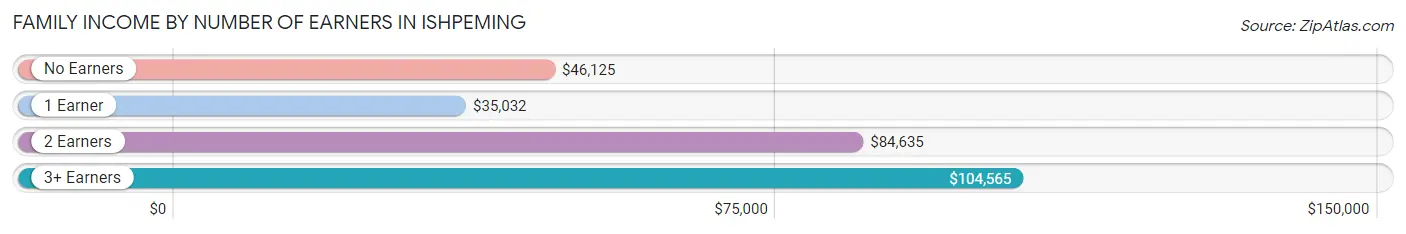
| Number of Earners | # Families | Median Income |
| No Earners | 313 (20.9%) | $46,125 |
| 1 Earner | 489 (32.7%) | $35,032 |
| 2 Earners | 517 (34.5%) | $84,635 |
| 3+ Earners | 178 (11.9%) | $104,565 |
| Total | 1,497 (100.0%) | $67,965 |
Household Income in Ishpeming
Household Income Brackets in Ishpeming
With 503 households falling in the category, the $50,000 to $74,999 income range is the most frequent in Ishpeming, accounting for 20.6% of all households. In contrast, only 34 households (1.4%) fall into the $150,000 to $199,999 income bracket, making it the least populous group.
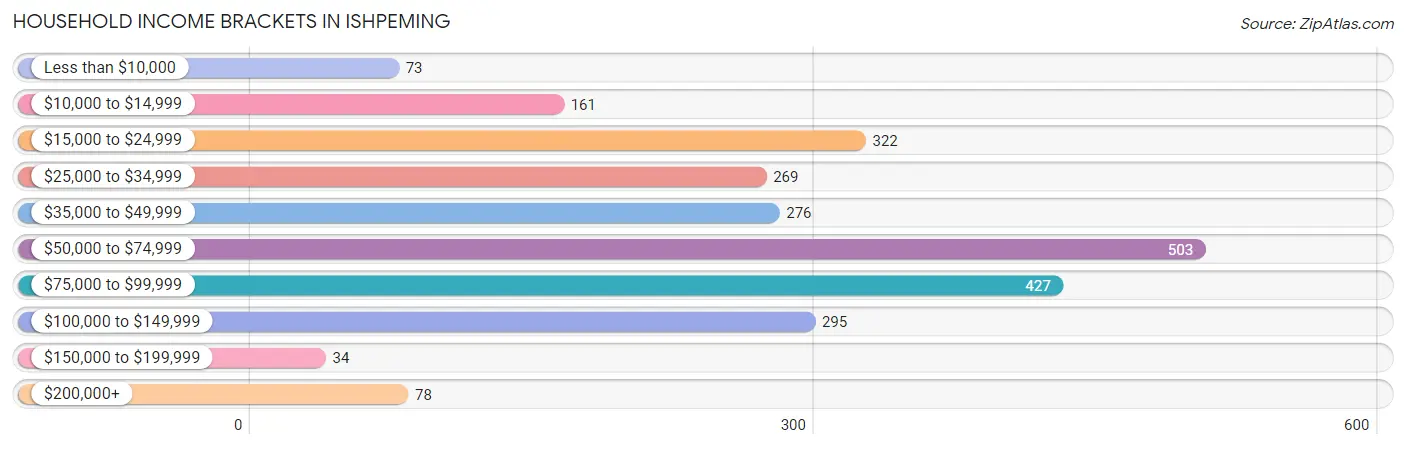
| Income Bracket | # Households | % Households |
| Less than $10,000 | 73 | 3.0% |
| $10,000 to $14,999 | 161 | 6.6% |
| $15,000 to $24,999 | 322 | 13.2% |
| $25,000 to $34,999 | 269 | 11.0% |
| $35,000 to $49,999 | 276 | 11.3% |
| $50,000 to $74,999 | 503 | 20.6% |
| $75,000 to $99,999 | 427 | 17.5% |
| $100,000 to $149,999 | 295 | 12.1% |
| $150,000 to $199,999 | 34 | 1.4% |
| $200,000+ | 78 | 3.2% |
Household Income by Householder Age in Ishpeming
The median household income in Ishpeming is $53,202, with the highest median household income of $68,883 found in the 45 to 64 years age bracket for the primary householder. A total of 893 households (36.6%) fall into this category. Meanwhile, the 15 to 24 years age bracket for the primary householder has the lowest median household income of $0, with 109 households (4.5%) in this group.
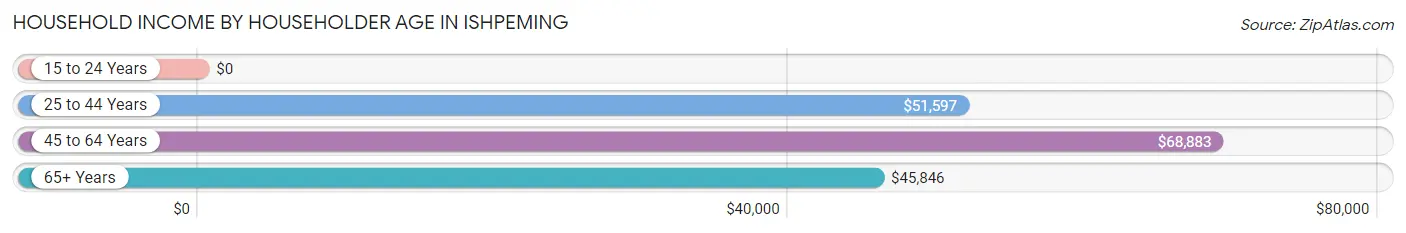
| Income Bracket | # Households | Median Income |
| 15 to 24 Years | 109 (4.5%) | $0 |
| 25 to 44 Years | 766 (31.4%) | $51,597 |
| 45 to 64 Years | 893 (36.6%) | $68,883 |
| 65+ Years | 673 (27.6%) | $45,846 |
| Total | 2,441 (100.0%) | $53,202 |
Poverty in Ishpeming
Income Below Poverty by Sex and Age in Ishpeming
With 11.6% poverty level for males and 16.3% for females among the residents of Ishpeming, 12 to 14 year old males and 12 to 14 year old females are the most vulnerable to poverty, with 52 males (52.0%) and 65 females (36.7%) in their respective age groups living below the poverty level.
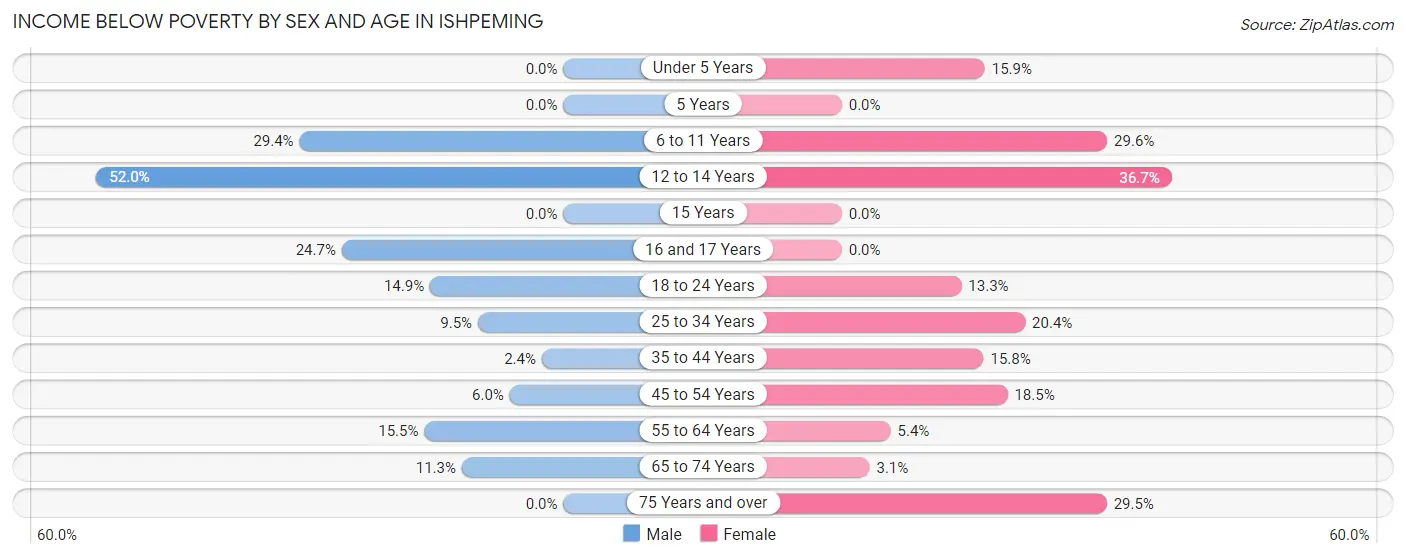
| Age Bracket | Male | Female |
| Under 5 Years | 0 (0.0%) | 36 (15.9%) |
| 5 Years | 0 (0.0%) | 0 (0.0%) |
| 6 to 11 Years | 72 (29.4%) | 39 (29.5%) |
| 12 to 14 Years | 52 (52.0%) | 65 (36.7%) |
| 15 Years | 0 (0.0%) | 0 (0.0%) |
| 16 and 17 Years | 19 (24.7%) | 0 (0.0%) |
| 18 to 24 Years | 45 (14.8%) | 61 (13.3%) |
| 25 to 34 Years | 35 (9.5%) | 87 (20.4%) |
| 35 to 44 Years | 8 (2.4%) | 45 (15.8%) |
| 45 to 54 Years | 25 (6.0%) | 86 (18.4%) |
| 55 to 64 Years | 35 (15.5%) | 19 (5.4%) |
| 65 to 74 Years | 31 (11.3%) | 9 (3.1%) |
| 75 Years and over | 0 (0.0%) | 82 (29.5%) |
| Total | 322 (11.6%) | 529 (16.3%) |
Income Above Poverty by Sex and Age in Ishpeming
According to the poverty statistics in Ishpeming, males aged under 5 years and females aged 5 years are the age groups that are most secure financially, with 100.0% of males and 100.0% of females in these age groups living above the poverty line.
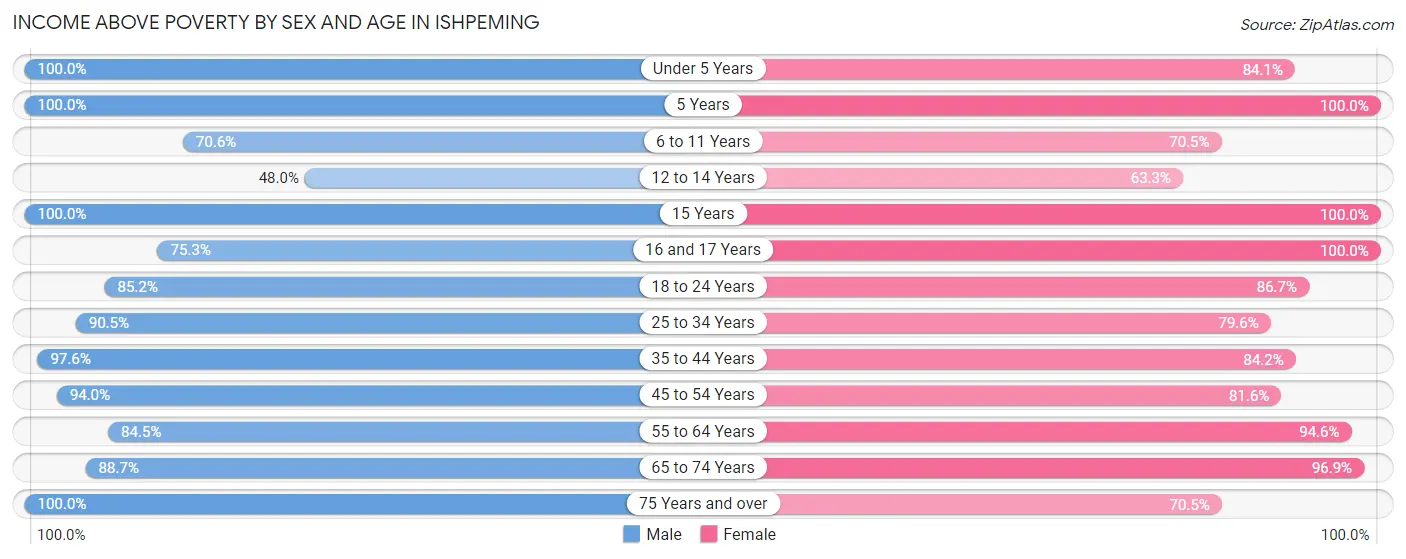
| Age Bracket | Male | Female |
| Under 5 Years | 239 (100.0%) | 190 (84.1%) |
| 5 Years | 33 (100.0%) | 25 (100.0%) |
| 6 to 11 Years | 173 (70.6%) | 93 (70.5%) |
| 12 to 14 Years | 48 (48.0%) | 112 (63.3%) |
| 15 Years | 23 (100.0%) | 70 (100.0%) |
| 16 and 17 Years | 58 (75.3%) | 60 (100.0%) |
| 18 to 24 Years | 258 (85.2%) | 397 (86.7%) |
| 25 to 34 Years | 333 (90.5%) | 339 (79.6%) |
| 35 to 44 Years | 325 (97.6%) | 240 (84.2%) |
| 45 to 54 Years | 393 (94.0%) | 380 (81.6%) |
| 55 to 64 Years | 191 (84.5%) | 330 (94.6%) |
| 65 to 74 Years | 243 (88.7%) | 282 (96.9%) |
| 75 Years and over | 144 (100.0%) | 196 (70.5%) |
| Total | 2,461 (88.4%) | 2,714 (83.7%) |
Income Below Poverty Among Married-Couple Families in Ishpeming
The poverty statistics for married-couple families in Ishpeming show that 8.7% or 95 of the total 1,087 families live below the poverty line. Families with 3 or 4 children have the highest poverty rate of 41.3%, comprising of 45 families. On the other hand, families with 1 or 2 children have the lowest poverty rate of 3.7%, which includes 12 families.
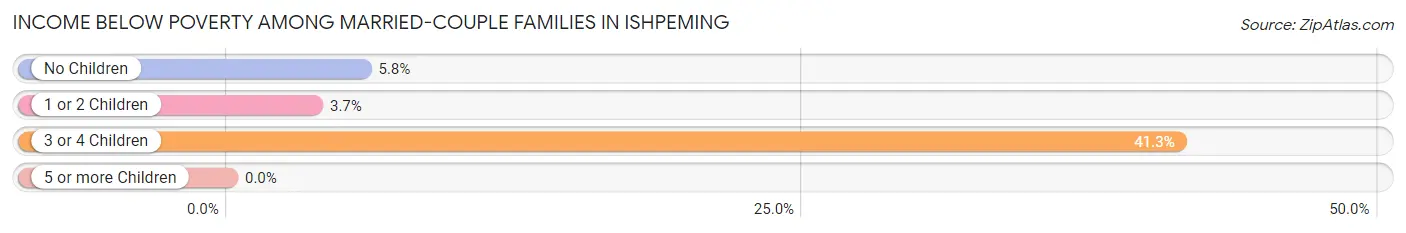
| Children | Above Poverty | Below Poverty |
| No Children | 616 (94.2%) | 38 (5.8%) |
| 1 or 2 Children | 312 (96.3%) | 12 (3.7%) |
| 3 or 4 Children | 64 (58.7%) | 45 (41.3%) |
| 5 or more Children | 0 (0.0%) | 0 (0.0%) |
| Total | 992 (91.3%) | 95 (8.7%) |
Income Below Poverty Among Single-Parent Households in Ishpeming
According to the poverty data in Ishpeming, 31.5% or 39 single-father households and 28.0% or 80 single-mother households are living below the poverty line. Among single-father households, those with 1 or 2 children have the highest poverty rate, with 39 households (47.0%) experiencing poverty. Likewise, among single-mother households, those with 1 or 2 children have the highest poverty rate, with 68 households (47.2%) falling below the poverty line.
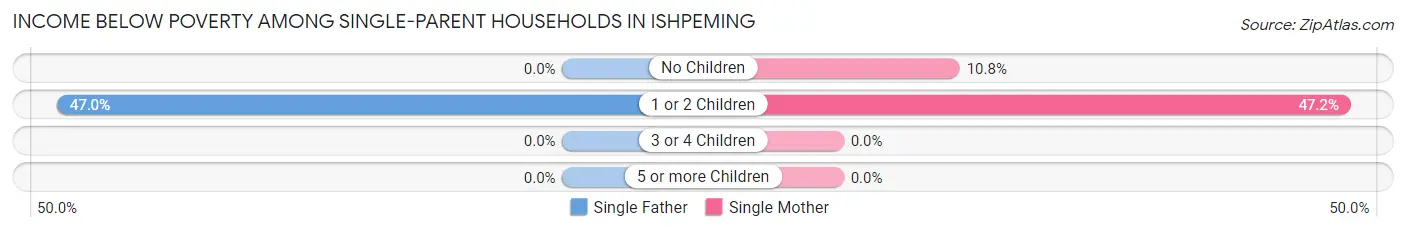
| Children | Single Father | Single Mother |
| No Children | 0 (0.0%) | 12 (10.8%) |
| 1 or 2 Children | 39 (47.0%) | 68 (47.2%) |
| 3 or 4 Children | 0 (0.0%) | 0 (0.0%) |
| 5 or more Children | 0 (0.0%) | 0 (0.0%) |
| Total | 39 (31.5%) | 80 (28.0%) |
Income Below Poverty Among Married-Couple vs Single-Parent Households in Ishpeming
The poverty data for Ishpeming shows that 95 of the married-couple family households (8.7%) and 119 of the single-parent households (29.0%) are living below the poverty level. Within the married-couple family households, those with 3 or 4 children have the highest poverty rate, with 45 households (41.3%) falling below the poverty line. Among the single-parent households, those with 1 or 2 children have the highest poverty rate, with 107 household (47.1%) living below poverty.
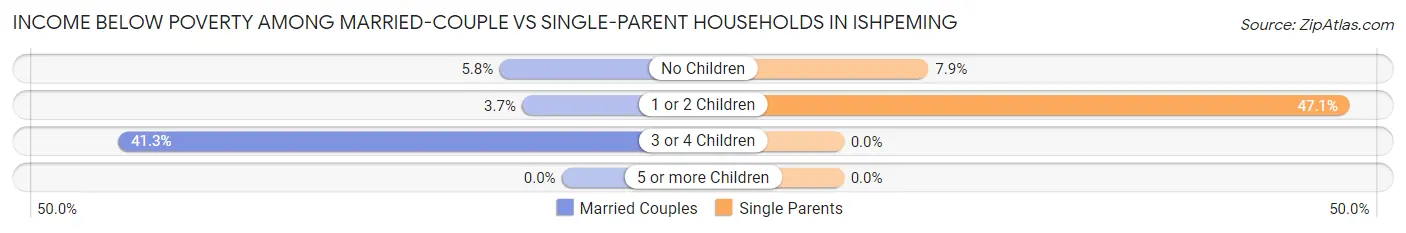
| Children | Married-Couple Families | Single-Parent Households |
| No Children | 38 (5.8%) | 12 (7.9%) |
| 1 or 2 Children | 12 (3.7%) | 107 (47.1%) |
| 3 or 4 Children | 45 (41.3%) | 0 (0.0%) |
| 5 or more Children | 0 (0.0%) | 0 (0.0%) |
| Total | 95 (8.7%) | 119 (29.0%) |
Race in Ishpeming
The most populous races in Ishpeming are White / Caucasian (5,629 | 90.9%), Two or more Races (407 | 6.6%), and Hispanic or Latino (73 | 1.2%).
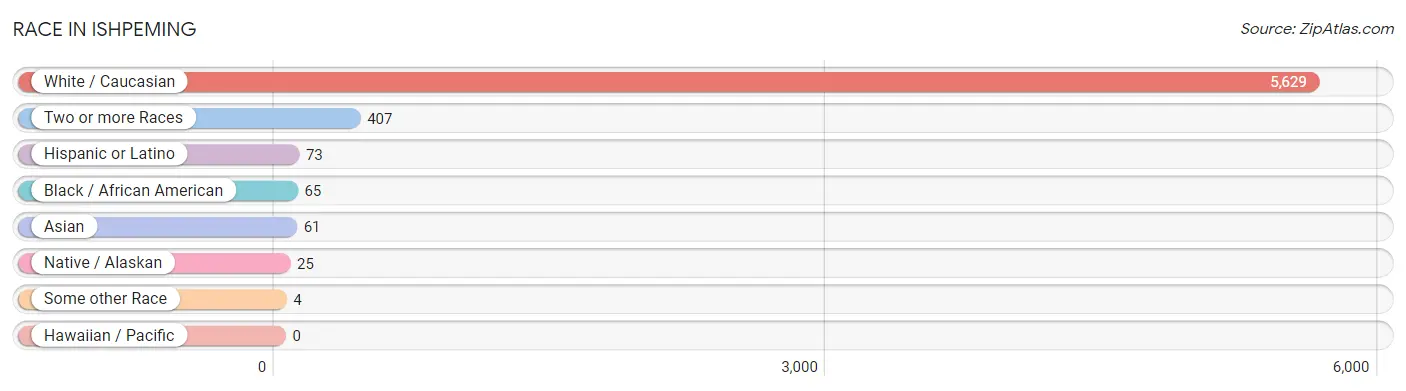
| Race | # Population | % Population |
| Asian | 61 | 1.0% |
| Black / African American | 65 | 1.1% |
| Hawaiian / Pacific | 0 | 0.0% |
| Hispanic or Latino | 73 | 1.2% |
| Native / Alaskan | 25 | 0.4% |
| White / Caucasian | 5,629 | 90.9% |
| Two or more Races | 407 | 6.6% |
| Some other Race | 4 | 0.1% |
| Total | 6,191 | 100.0% |
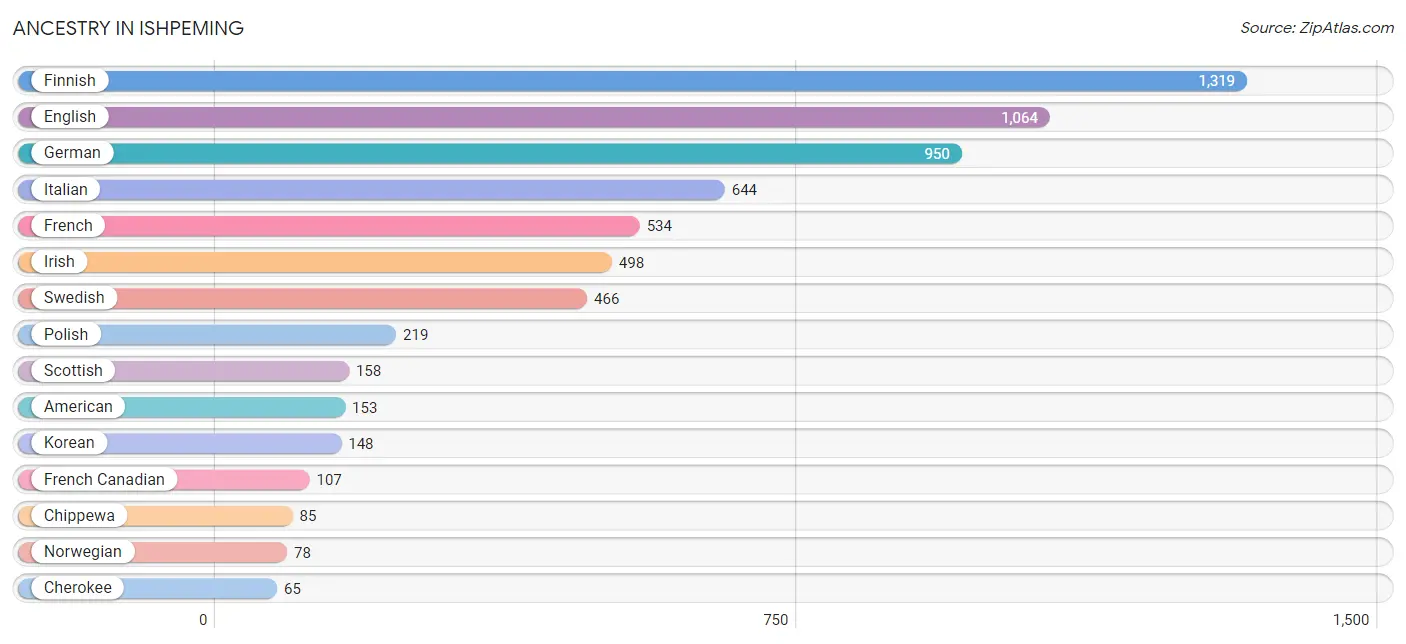
Ancestry in Ishpeming
The most populous ancestries reported in Ishpeming are Finnish (1,319 | 21.3%), English (1,064 | 17.2%), German (950 | 15.3%), Italian (644 | 10.4%), and French (534 | 8.6%), together accounting for 72.9% of all Ishpeming residents.
| Ancestry | # Population | % Population |
| African | 43 | 0.7% |
| American | 153 | 2.5% |
| Belgian | 7 | 0.1% |
| Bhutanese | 8 | 0.1% |
| British | 27 | 0.4% |
| Burmese | 12 | 0.2% |
| Cherokee | 65 | 1.1% |
| Chippewa | 85 | 1.4% |
| Croatian | 14 | 0.2% |
| Czech | 44 | 0.7% |
| Czechoslovakian | 8 | 0.1% |
| Danish | 28 | 0.4% |
| Dutch | 53 | 0.9% |
| Eastern European | 22 | 0.4% |
| English | 1,064 | 17.2% |
| European | 42 | 0.7% |
| Finnish | 1,319 | 21.3% |
| French | 534 | 8.6% |
| French Canadian | 107 | 1.7% |
| German | 950 | 15.3% |
| Greek | 16 | 0.3% |
| Hungarian | 25 | 0.4% |
| Irish | 498 | 8.0% |
| Italian | 644 | 10.4% |
| Korean | 148 | 2.4% |
| Mexican | 35 | 0.6% |
| Northern European | 52 | 0.8% |
| Norwegian | 78 | 1.3% |
| Polish | 219 | 3.5% |
| Portuguese | 12 | 0.2% |
| Romanian | 9 | 0.2% |
| Russian | 63 | 1.0% |
| Scandinavian | 45 | 0.7% |
| Scotch-Irish | 27 | 0.4% |
| Scottish | 158 | 2.5% |
| Slovak | 20 | 0.3% |
| Spanish | 38 | 0.6% |
| Subsaharan African | 58 | 0.9% |
| Swedish | 466 | 7.5% |
| Swiss | 37 | 0.6% |
| Ukrainian | 9 | 0.2% |
| Zimbabwean | 15 | 0.2% | View All 42 Rows |
Immigrants in Ishpeming
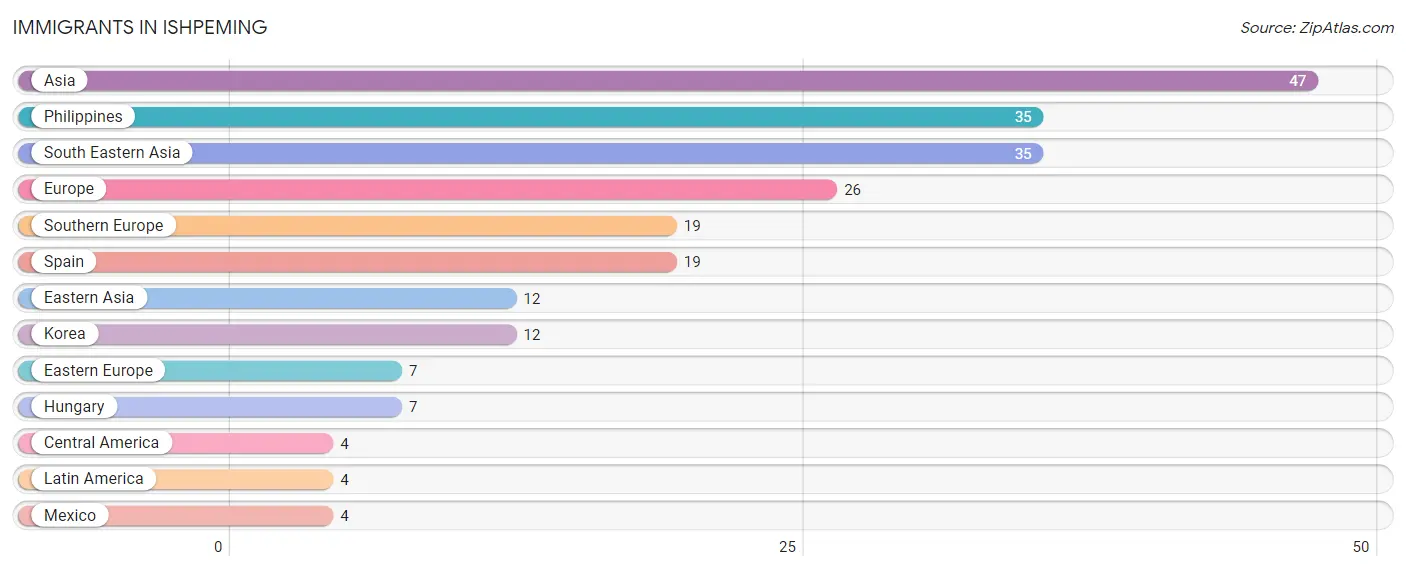
The most numerous immigrant groups reported in Ishpeming came from Asia (47 | 0.8%), Philippines (35 | 0.6%), South Eastern Asia (35 | 0.6%), Europe (26 | 0.4%), and Southern Europe (19 | 0.3%), together accounting for 2.6% of all Ishpeming residents.
| Immigration Origin | # Population | % Population |
| Asia | 47 | 0.8% |
| Central America | 4 | 0.1% |
| Eastern Asia | 12 | 0.2% |
| Eastern Europe | 7 | 0.1% |
| Europe | 26 | 0.4% |
| Hungary | 7 | 0.1% |
| Korea | 12 | 0.2% |
| Latin America | 4 | 0.1% |
| Mexico | 4 | 0.1% |
| Philippines | 35 | 0.6% |
| South Eastern Asia | 35 | 0.6% |
| Southern Europe | 19 | 0.3% |
| Spain | 19 | 0.3% | View All 13 Rows |
Sex and Age in Ishpeming
Sex and Age in Ishpeming
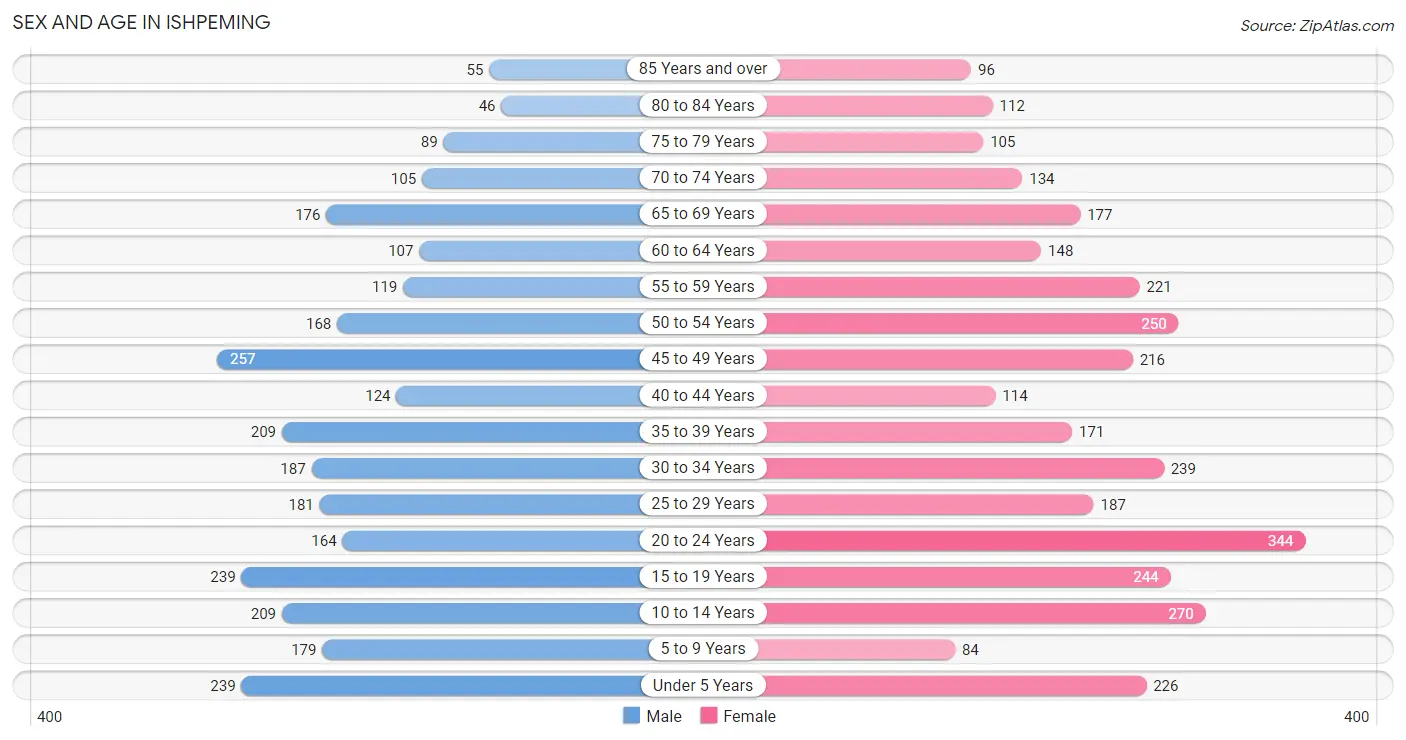
The most populous age groups in Ishpeming are 45 to 49 Years (257 | 9.0%) for men and 20 to 24 Years (344 | 10.3%) for women.
| Age Bracket | Male | Female |
| Under 5 Years | 239 (8.4%) | 226 (6.8%) |
| 5 to 9 Years | 179 (6.3%) | 84 (2.5%) |
| 10 to 14 Years | 209 (7.3%) | 270 (8.1%) |
| 15 to 19 Years | 239 (8.4%) | 244 (7.3%) |
| 20 to 24 Years | 164 (5.8%) | 344 (10.3%) |
| 25 to 29 Years | 181 (6.3%) | 187 (5.6%) |
| 30 to 34 Years | 187 (6.6%) | 239 (7.2%) |
| 35 to 39 Years | 209 (7.3%) | 171 (5.1%) |
| 40 to 44 Years | 124 (4.3%) | 114 (3.4%) |
| 45 to 49 Years | 257 (9.0%) | 216 (6.5%) |
| 50 to 54 Years | 168 (5.9%) | 250 (7.5%) |
| 55 to 59 Years | 119 (4.2%) | 221 (6.6%) |
| 60 to 64 Years | 107 (3.7%) | 148 (4.4%) |
| 65 to 69 Years | 176 (6.2%) | 177 (5.3%) |
| 70 to 74 Years | 105 (3.7%) | 134 (4.0%) |
| 75 to 79 Years | 89 (3.1%) | 105 (3.2%) |
| 80 to 84 Years | 46 (1.6%) | 112 (3.4%) |
| 85 Years and over | 55 (1.9%) | 96 (2.9%) |
| Total | 2,853 (100.0%) | 3,338 (100.0%) |
Families and Households in Ishpeming
Median Family Size in Ishpeming
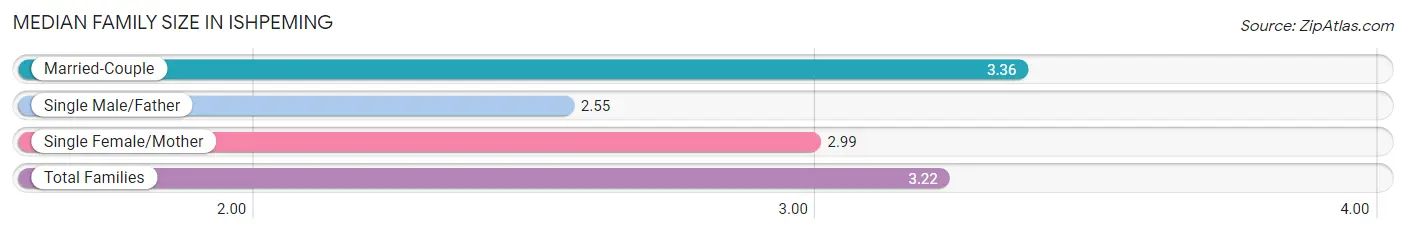
The median family size in Ishpeming is 3.22 persons per family, with married-couple families (1,087 | 72.6%) accounting for the largest median family size of 3.36 persons per family. On the other hand, single male/father families (124 | 8.3%) represent the smallest median family size with 2.55 persons per family.
| Family Type | # Families | Family Size |
| Married-Couple | 1,087 (72.6%) | 3.36 |
| Single Male/Father | 124 (8.3%) | 2.55 |
| Single Female/Mother | 286 (19.1%) | 2.99 |
| Total Families | 1,497 (100.0%) | 3.22 |
Median Household Size in Ishpeming
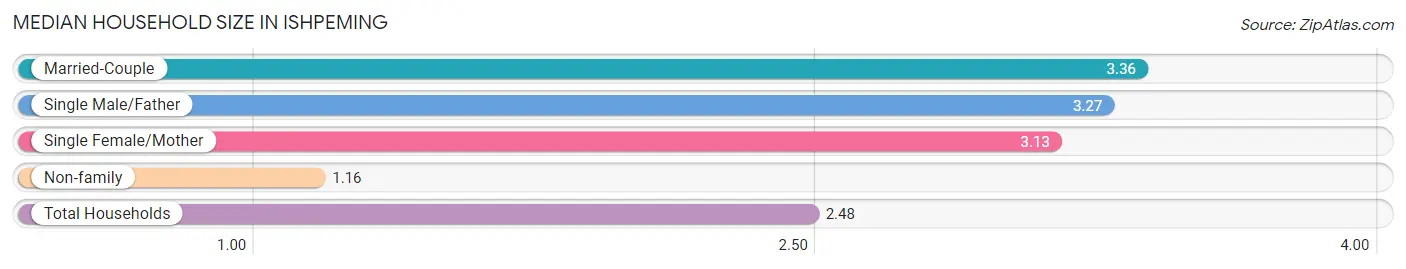
The median household size in Ishpeming is 2.48 persons per household, with married-couple households (1,087 | 44.5%) accounting for the largest median household size of 3.36 persons per household. non-family households (944 | 38.7%) represent the smallest median household size with 1.16 persons per household.
| Household Type | # Households | Household Size |
| Married-Couple | 1,087 (44.5%) | 3.36 |
| Single Male/Father | 124 (5.1%) | 3.27 |
| Single Female/Mother | 286 (11.7%) | 3.13 |
| Non-family | 944 (38.7%) | 1.16 |
| Total Households | 2,441 (100.0%) | 2.48 |
Household Size by Marriage Status in Ishpeming
Out of a total of 2,441 households in Ishpeming, 1,497 (61.3%) are family households, while 944 (38.7%) are nonfamily households. The most numerous type of family households are 2-person households, comprising 657, and the most common type of nonfamily households are 1-person households, comprising 786.
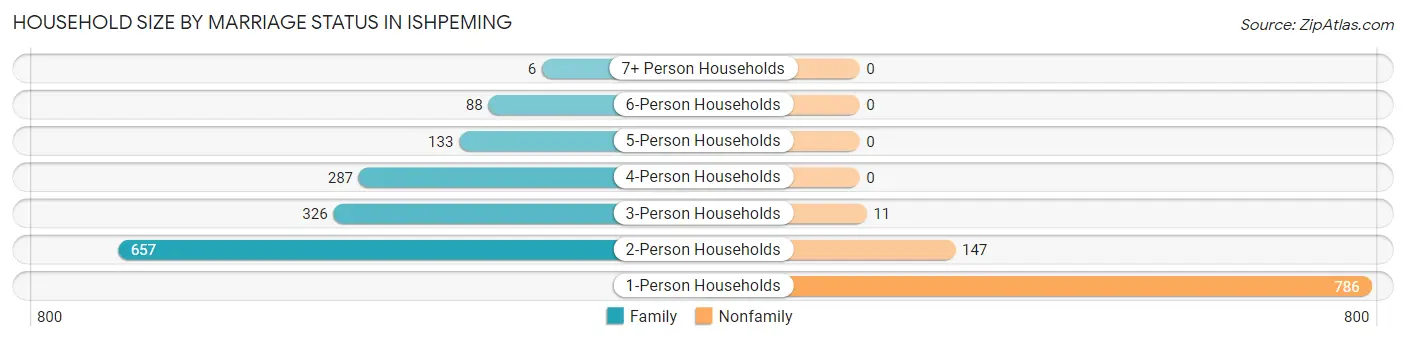
| Household Size | Family Households | Nonfamily Households |
| 1-Person Households | - | 786 (32.2%) |
| 2-Person Households | 657 (26.9%) | 147 (6.0%) |
| 3-Person Households | 326 (13.4%) | 11 (0.4%) |
| 4-Person Households | 287 (11.8%) | 0 (0.0%) |
| 5-Person Households | 133 (5.4%) | 0 (0.0%) |
| 6-Person Households | 88 (3.6%) | 0 (0.0%) |
| 7+ Person Households | 6 (0.3%) | 0 (0.0%) |
| Total | 1,497 (61.3%) | 944 (38.7%) |
Female Fertility in Ishpeming
Fertility by Age in Ishpeming
Average fertility rate in Ishpeming is 47.0 births per 1,000 women. Women in the age bracket of 20 to 34 years have the highest fertility rate with 95.0 births per 1,000 women. Women in the age bracket of 20 to 34 years acount for 100.0% of all women with births.
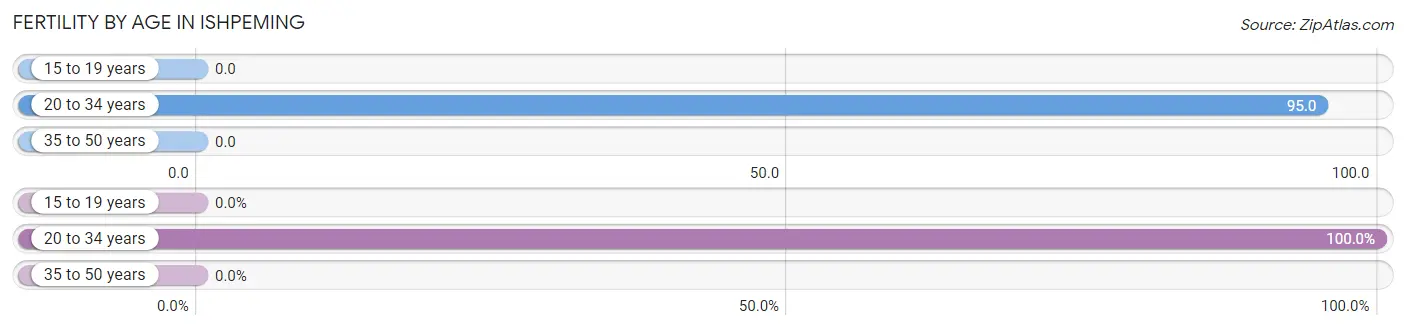
| Age Bracket | Women with Births | Births / 1,000 Women |
| 15 to 19 years | 0 (0.0%) | 0.0 |
| 20 to 34 years | 73 (100.0%) | 95.0 |
| 35 to 50 years | 0 (0.0%) | 0.0 |
| Total | 73 (100.0%) | 47.0 |
Fertility by Age by Marriage Status in Ishpeming
87.7% of women with births (73) in Ishpeming are married. The highest percentage of unmarried women with births falls into 20 to 34 years age bracket with 12.3% of them unmarried at the time of birth, while the lowest percentage of unmarried women with births belong to 20 to 34 years age bracket with 12.3% of them unmarried.
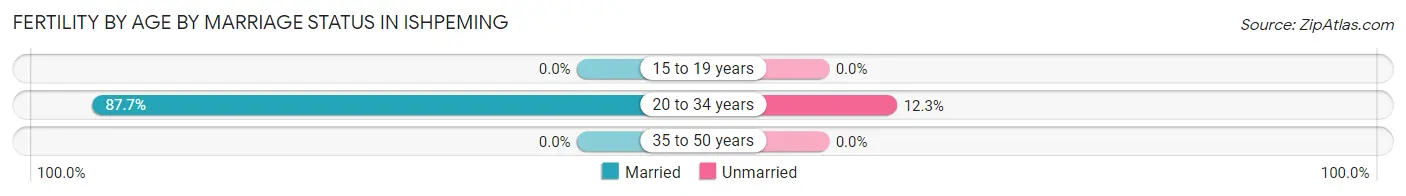
| Age Bracket | Married | Unmarried |
| 15 to 19 years | 0 (0.0%) | 0 (0.0%) |
| 20 to 34 years | 64 (87.7%) | 9 (12.3%) |
| 35 to 50 years | 0 (0.0%) | 0 (0.0%) |
| Total | 64 (87.7%) | 9 (12.3%) |
Fertility by Education in Ishpeming
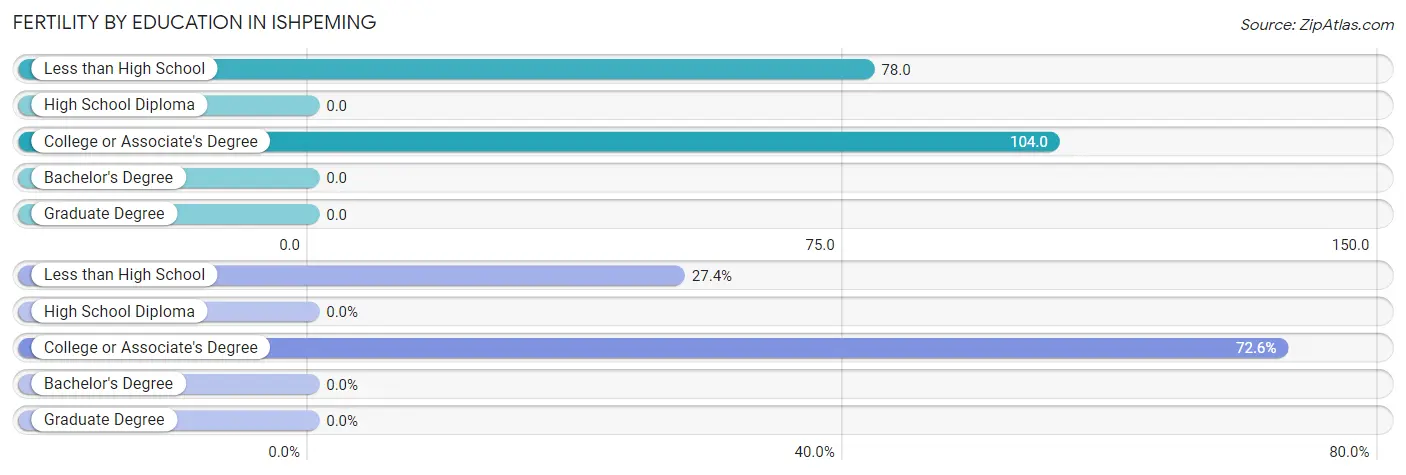
| Educational Attainment | Women with Births | Births / 1,000 Women |
| Less than High School | 20 (27.4%) | 78.0 |
| High School Diploma | 0 (0.0%) | 0.0 |
| College or Associate's Degree | 53 (72.6%) | 104.0 |
| Bachelor's Degree | 0 (0.0%) | 0.0 |
| Graduate Degree | 0 (0.0%) | 0.0 |
| Total | 73 (100.0%) | 47.0 |
Fertility by Education by Marriage Status in Ishpeming
12.3% of women with births in Ishpeming are unmarried. Women with the educational attainment of college or associate's degree are most likely to be married with 100.0% of them married at childbirth, while women with the educational attainment of less than high school are least likely to be married with 45.0% of them unmarried at childbirth.
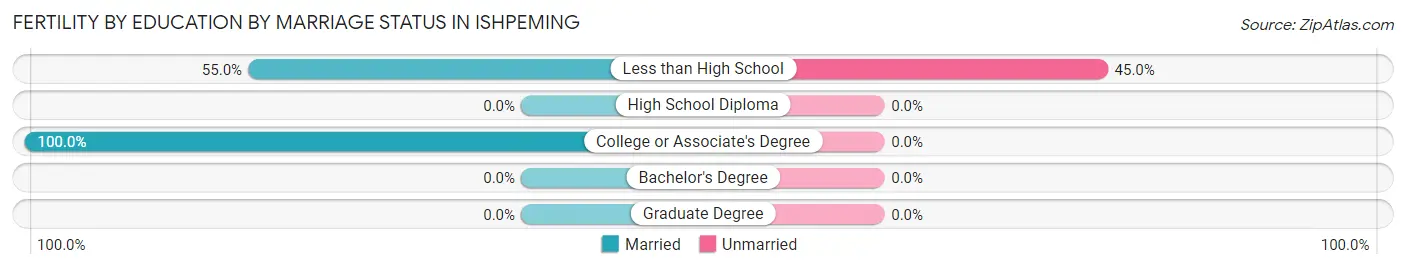
| Educational Attainment | Married | Unmarried |
| Less than High School | 11 (55.0%) | 9 (45.0%) |
| High School Diploma | 0 (0.0%) | 0 (0.0%) |
| College or Associate's Degree | 53 (100.0%) | 0 (0.0%) |
| Bachelor's Degree | 0 (0.0%) | 0 (0.0%) |
| Graduate Degree | 0 (0.0%) | 0 (0.0%) |
| Total | 64 (87.7%) | 9 (12.3%) |
Employment Characteristics in Ishpeming
Employment by Class of Employer in Ishpeming
Among the 2,811 employed individuals in Ishpeming, private company employees (1,941 | 69.1%), not-for-profit organizations (279 | 9.9%), and state government employees (160 | 5.7%) make up the most common classes of employment.
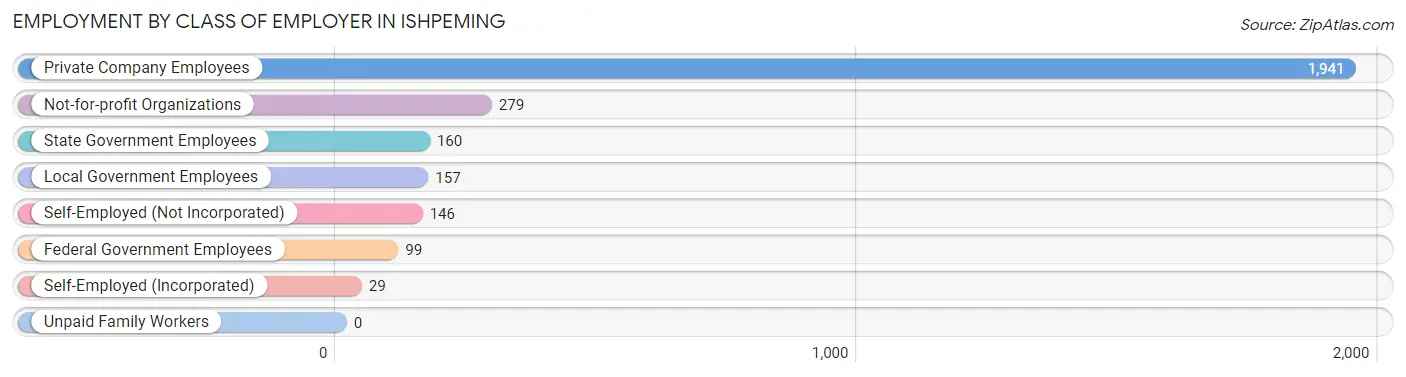
| Employer Class | # Employees | % Employees |
| Private Company Employees | 1,941 | 69.1% |
| Self-Employed (Incorporated) | 29 | 1.0% |
| Self-Employed (Not Incorporated) | 146 | 5.2% |
| Not-for-profit Organizations | 279 | 9.9% |
| Local Government Employees | 157 | 5.6% |
| State Government Employees | 160 | 5.7% |
| Federal Government Employees | 99 | 3.5% |
| Unpaid Family Workers | 0 | 0.0% |
| Total | 2,811 | 100.0% |
Employment Status by Age in Ishpeming
According to the labor force statistics for Ishpeming, out of the total population over 16 years of age (4,891), 63.3% or 3,096 individuals are in the labor force, with 7.7% or 238 of them unemployed. The age group with the highest labor force participation rate is 20 to 24 years, with 98.8% or 502 individuals in the labor force. Within the labor force, the 30 to 34 years age range has the highest percentage of unemployed individuals, with 21.7% or 88 of them being unemployed.
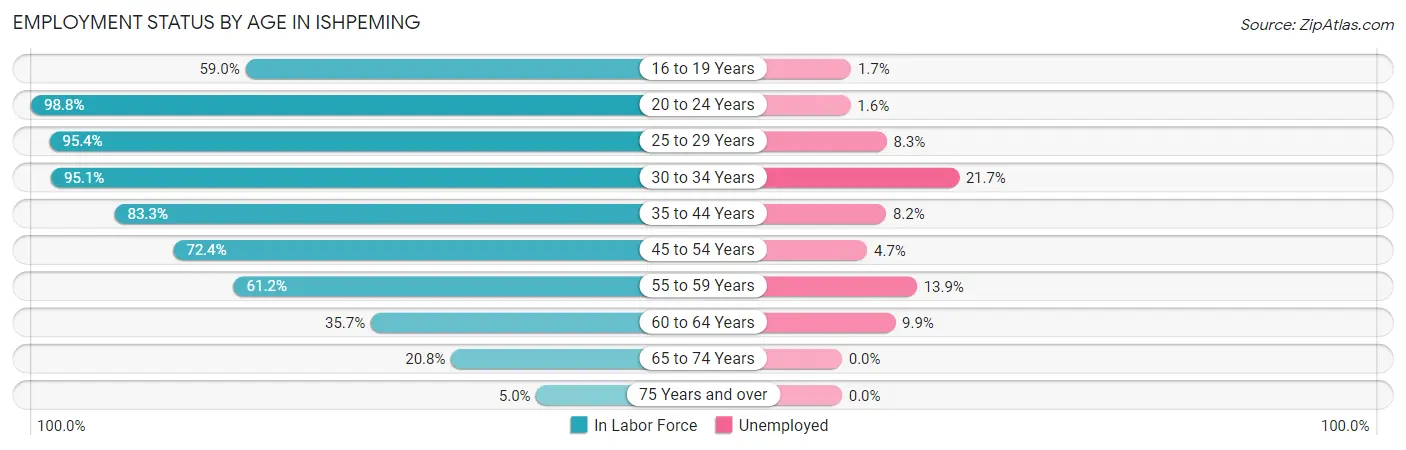
| Age Bracket | In Labor Force | Unemployed |
| 16 to 19 Years | 230 (59.0%) | 4 (1.7%) |
| 20 to 24 Years | 502 (98.8%) | 8 (1.6%) |
| 25 to 29 Years | 351 (95.4%) | 29 (8.3%) |
| 30 to 34 Years | 405 (95.1%) | 88 (21.7%) |
| 35 to 44 Years | 515 (83.3%) | 42 (8.2%) |
| 45 to 54 Years | 645 (72.4%) | 30 (4.7%) |
| 55 to 59 Years | 208 (61.2%) | 29 (13.9%) |
| 60 to 64 Years | 91 (35.7%) | 9 (9.9%) |
| 65 to 74 Years | 123 (20.8%) | 0 (0.0%) |
| 75 Years and over | 25 (5.0%) | 0 (0.0%) |
| Total | 3,096 (63.3%) | 238 (7.7%) |
Employment Status by Educational Attainment in Ishpeming
According to labor force statistics for Ishpeming, 76.4% of individuals (2,214) out of the total population between 25 and 64 years of age (2,898) are in the labor force, with 10.2% or 226 of them being unemployed. The group with the highest labor force participation rate are those with the educational attainment of bachelor's degree or higher, with 81.7% or 657 individuals in the labor force. Within the labor force, individuals with high school diploma education have the highest percentage of unemployment, with 24.7% or 144 of them being unemployed.
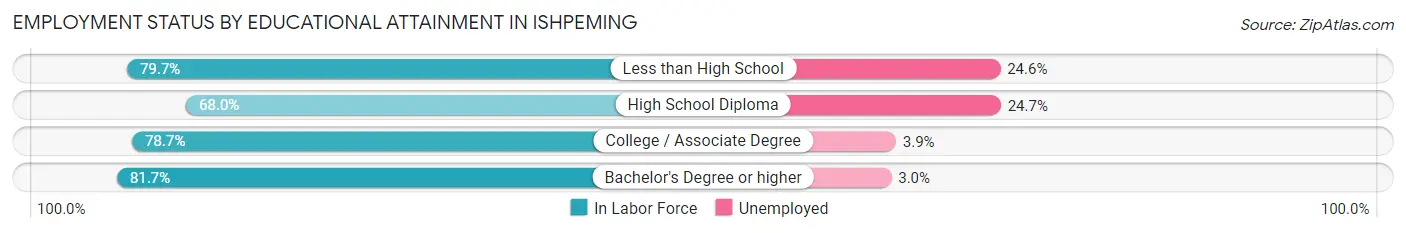
| Educational Attainment | In Labor Force | Unemployed |
| Less than High School | 122 (79.7%) | 38 (24.6%) |
| High School Diploma | 583 (68.0%) | 212 (24.7%) |
| College / Associate Degree | 853 (78.7%) | 42 (3.9%) |
| Bachelor's Degree or higher | 657 (81.7%) | 24 (3.0%) |
| Total | 2,214 (76.4%) | 296 (10.2%) |
Employment Occupations by Sex in Ishpeming
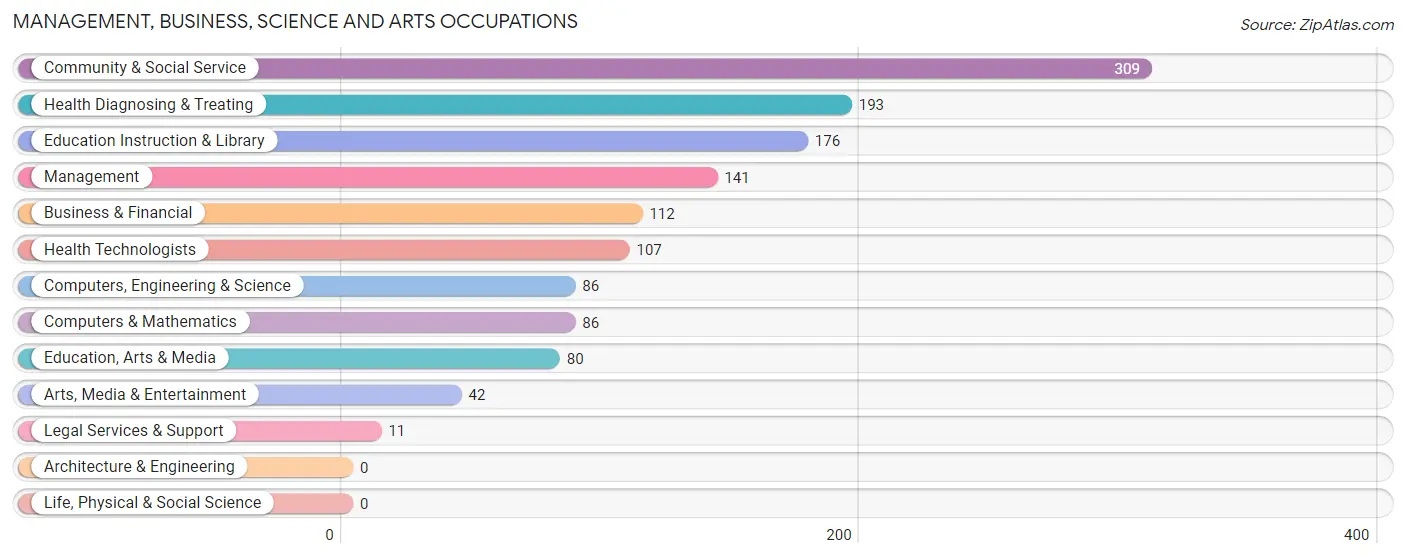
Management, Business, Science and Arts Occupations
The most common Management, Business, Science and Arts occupations in Ishpeming are Community & Social Service (309 | 10.8%), Health Diagnosing & Treating (193 | 6.8%), Education Instruction & Library (176 | 6.2%), Management (141 | 4.9%), and Business & Financial (112 | 3.9%).
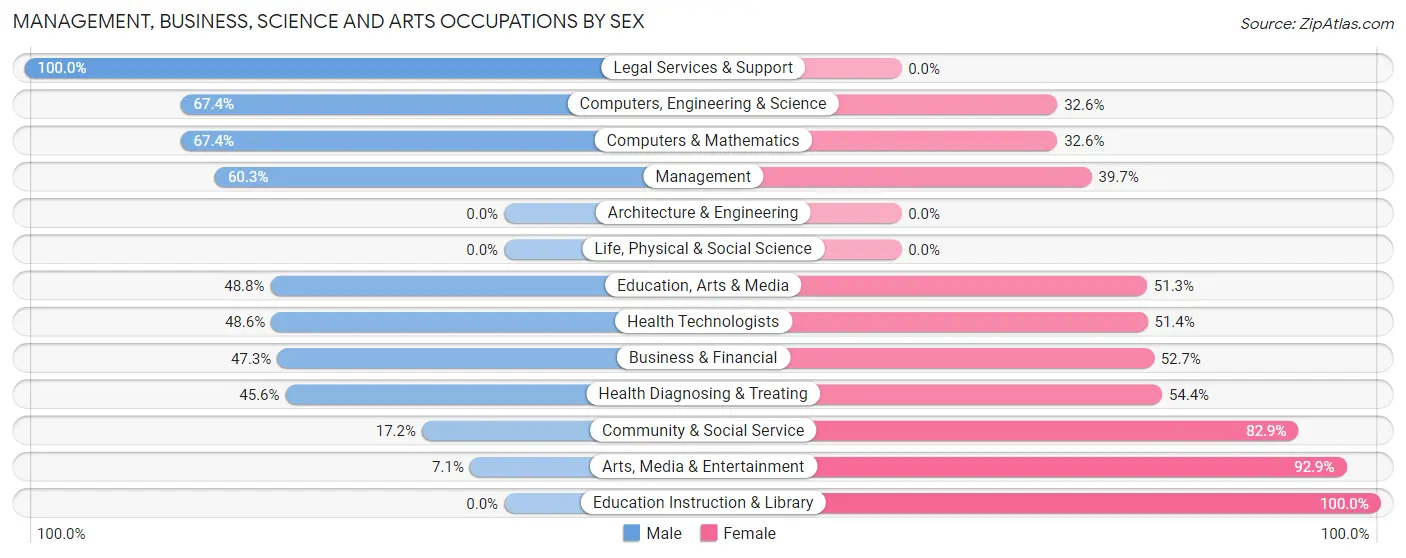
Management, Business, Science and Arts Occupations by Sex
Within the Management, Business, Science and Arts occupations in Ishpeming, the most male-oriented occupations are Legal Services & Support (100.0%), Computers, Engineering & Science (67.4%), and Computers & Mathematics (67.4%), while the most female-oriented occupations are Education Instruction & Library (100.0%), Arts, Media & Entertainment (92.9%), and Community & Social Service (82.9%).
| Occupation | Male | Female |
| Management | 85 (60.3%) | 56 (39.7%) |
| Business & Financial | 53 (47.3%) | 59 (52.7%) |
| Computers, Engineering & Science | 58 (67.4%) | 28 (32.6%) |
| Computers & Mathematics | 58 (67.4%) | 28 (32.6%) |
| Architecture & Engineering | 0 (0.0%) | 0 (0.0%) |
| Life, Physical & Social Science | 0 (0.0%) | 0 (0.0%) |
| Community & Social Service | 53 (17.2%) | 256 (82.9%) |
| Education, Arts & Media | 39 (48.7%) | 41 (51.2%) |
| Legal Services & Support | 11 (100.0%) | 0 (0.0%) |
| Education Instruction & Library | 0 (0.0%) | 176 (100.0%) |
| Arts, Media & Entertainment | 3 (7.1%) | 39 (92.9%) |
| Health Diagnosing & Treating | 88 (45.6%) | 105 (54.4%) |
| Health Technologists | 52 (48.6%) | 55 (51.4%) |
| Total (Category) | 337 (40.1%) | 504 (59.9%) |
| Total (Overall) | 1,221 (42.7%) | 1,635 (57.3%) |
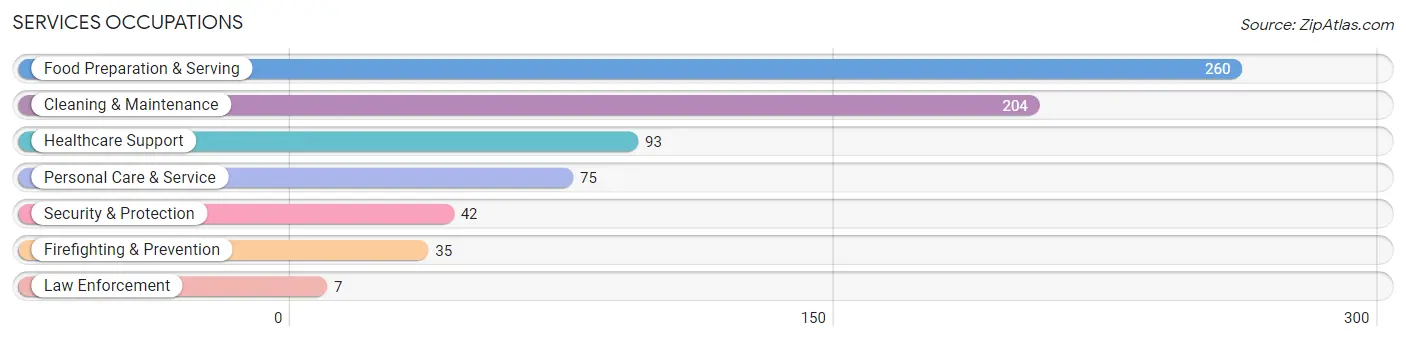
Services Occupations
The most common Services occupations in Ishpeming are Food Preparation & Serving (260 | 9.1%), Cleaning & Maintenance (204 | 7.1%), Healthcare Support (93 | 3.3%), Personal Care & Service (75 | 2.6%), and Security & Protection (42 | 1.5%).
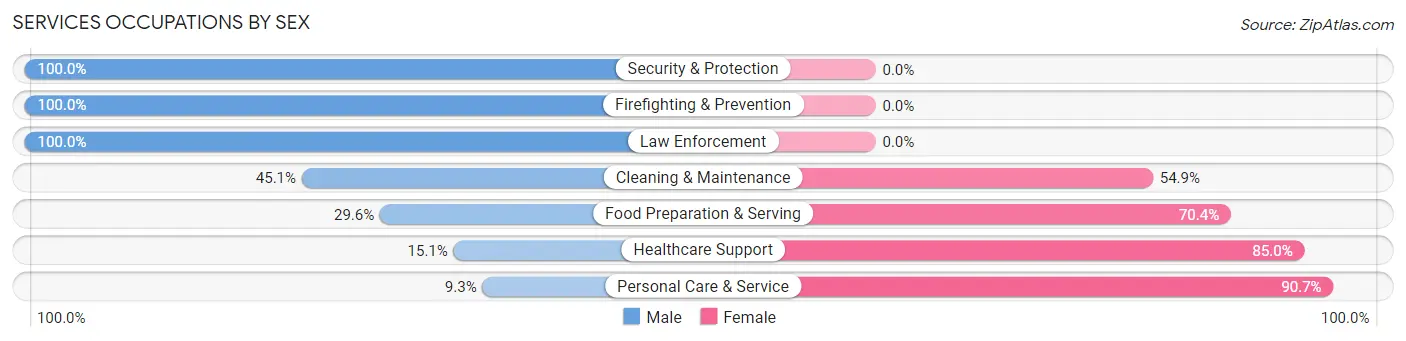
Services Occupations by Sex
Within the Services occupations in Ishpeming, the most male-oriented occupations are Security & Protection (100.0%), Firefighting & Prevention (100.0%), and Law Enforcement (100.0%), while the most female-oriented occupations are Personal Care & Service (90.7%), Healthcare Support (85.0%), and Food Preparation & Serving (70.4%).
| Occupation | Male | Female |
| Healthcare Support | 14 (15.0%) | 79 (85.0%) |
| Security & Protection | 42 (100.0%) | 0 (0.0%) |
| Firefighting & Prevention | 35 (100.0%) | 0 (0.0%) |
| Law Enforcement | 7 (100.0%) | 0 (0.0%) |
| Food Preparation & Serving | 77 (29.6%) | 183 (70.4%) |
| Cleaning & Maintenance | 92 (45.1%) | 112 (54.9%) |
| Personal Care & Service | 7 (9.3%) | 68 (90.7%) |
| Total (Category) | 232 (34.4%) | 442 (65.6%) |
| Total (Overall) | 1,221 (42.7%) | 1,635 (57.3%) |
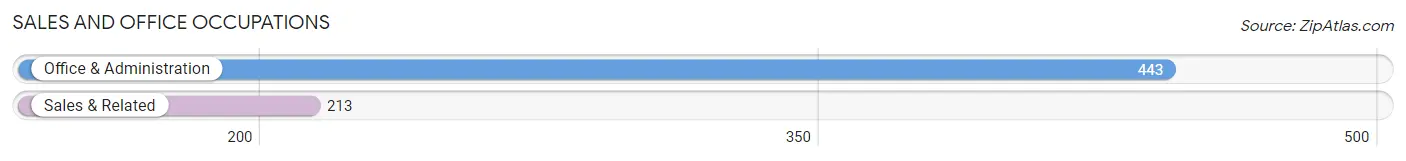
Sales and Office Occupations
The most common Sales and Office occupations in Ishpeming are Office & Administration (443 | 15.5%), and Sales & Related (213 | 7.5%).
Sales and Office Occupations by Sex
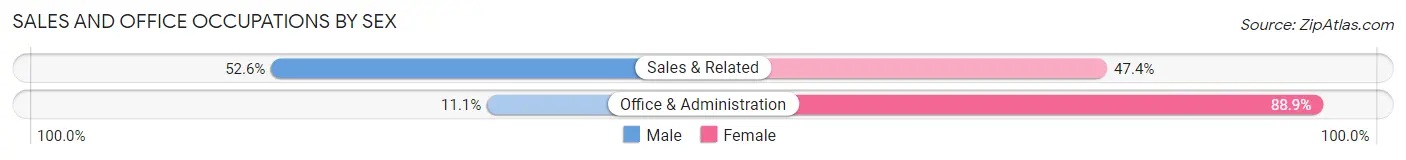
| Occupation | Male | Female |
| Sales & Related | 112 (52.6%) | 101 (47.4%) |
| Office & Administration | 49 (11.1%) | 394 (88.9%) |
| Total (Category) | 161 (24.5%) | 495 (75.5%) |
| Total (Overall) | 1,221 (42.7%) | 1,635 (57.3%) |
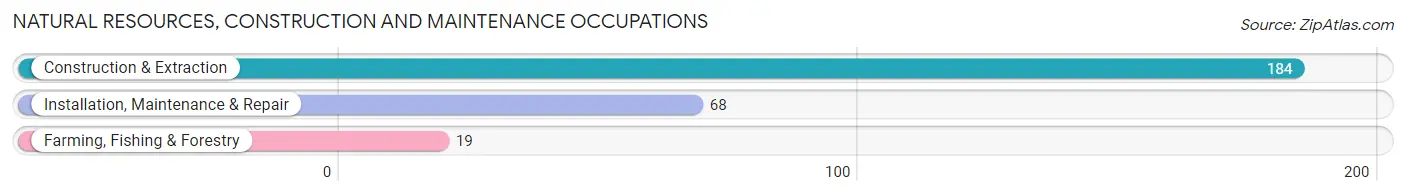
Natural Resources, Construction and Maintenance Occupations
The most common Natural Resources, Construction and Maintenance occupations in Ishpeming are Construction & Extraction (184 | 6.4%), Installation, Maintenance & Repair (68 | 2.4%), and Farming, Fishing & Forestry (19 | 0.7%).
Natural Resources, Construction and Maintenance Occupations by Sex
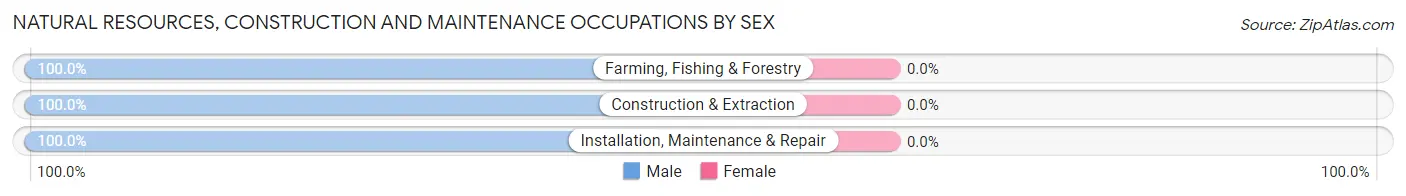
| Occupation | Male | Female |
| Farming, Fishing & Forestry | 19 (100.0%) | 0 (0.0%) |
| Construction & Extraction | 184 (100.0%) | 0 (0.0%) |
| Installation, Maintenance & Repair | 68 (100.0%) | 0 (0.0%) |
| Total (Category) | 271 (100.0%) | 0 (0.0%) |
| Total (Overall) | 1,221 (42.7%) | 1,635 (57.3%) |
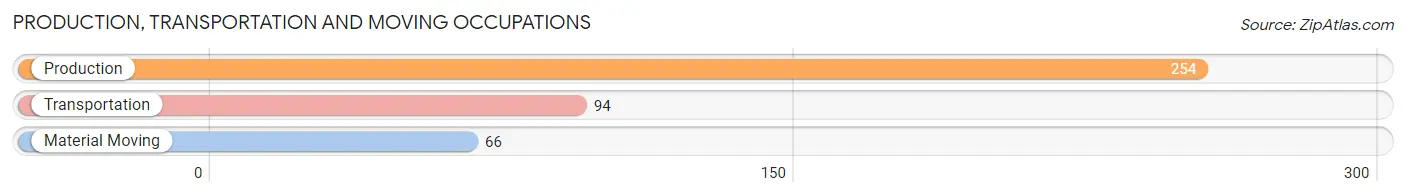
Production, Transportation and Moving Occupations
The most common Production, Transportation and Moving occupations in Ishpeming are Production (254 | 8.9%), Transportation (94 | 3.3%), and Material Moving (66 | 2.3%).
Production, Transportation and Moving Occupations by Sex
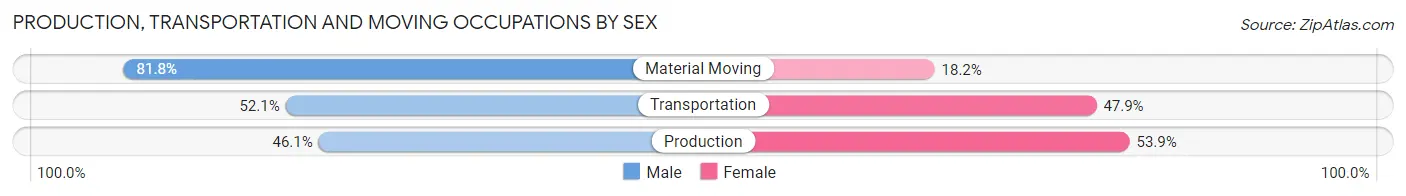
| Occupation | Male | Female |
| Production | 117 (46.1%) | 137 (53.9%) |
| Transportation | 49 (52.1%) | 45 (47.9%) |
| Material Moving | 54 (81.8%) | 12 (18.2%) |
| Total (Category) | 220 (53.1%) | 194 (46.9%) |
| Total (Overall) | 1,221 (42.7%) | 1,635 (57.3%) |
Employment Industries by Sex in Ishpeming
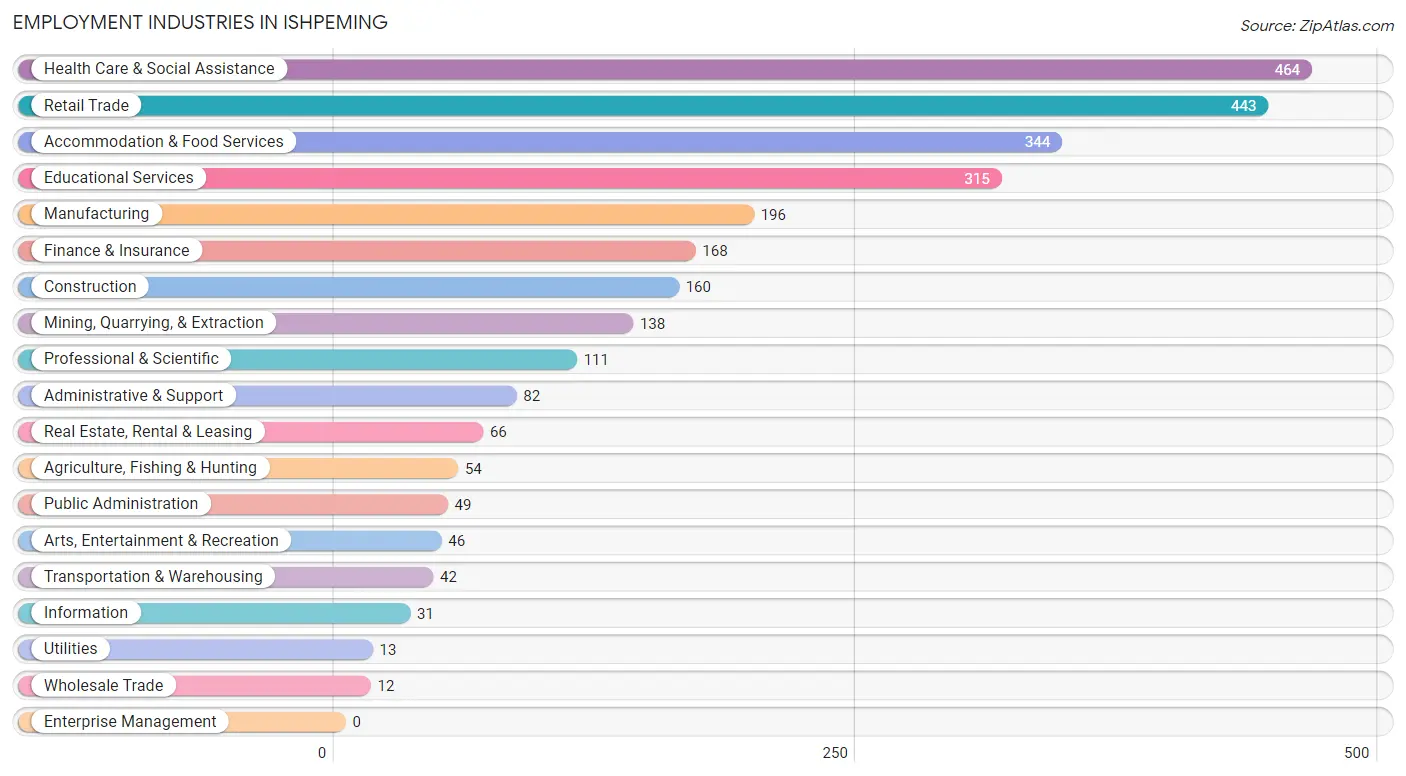
Employment Industries in Ishpeming
The major employment industries in Ishpeming include Health Care & Social Assistance (464 | 16.3%), Retail Trade (443 | 15.5%), Accommodation & Food Services (344 | 12.0%), Educational Services (315 | 11.0%), and Manufacturing (196 | 6.9%).
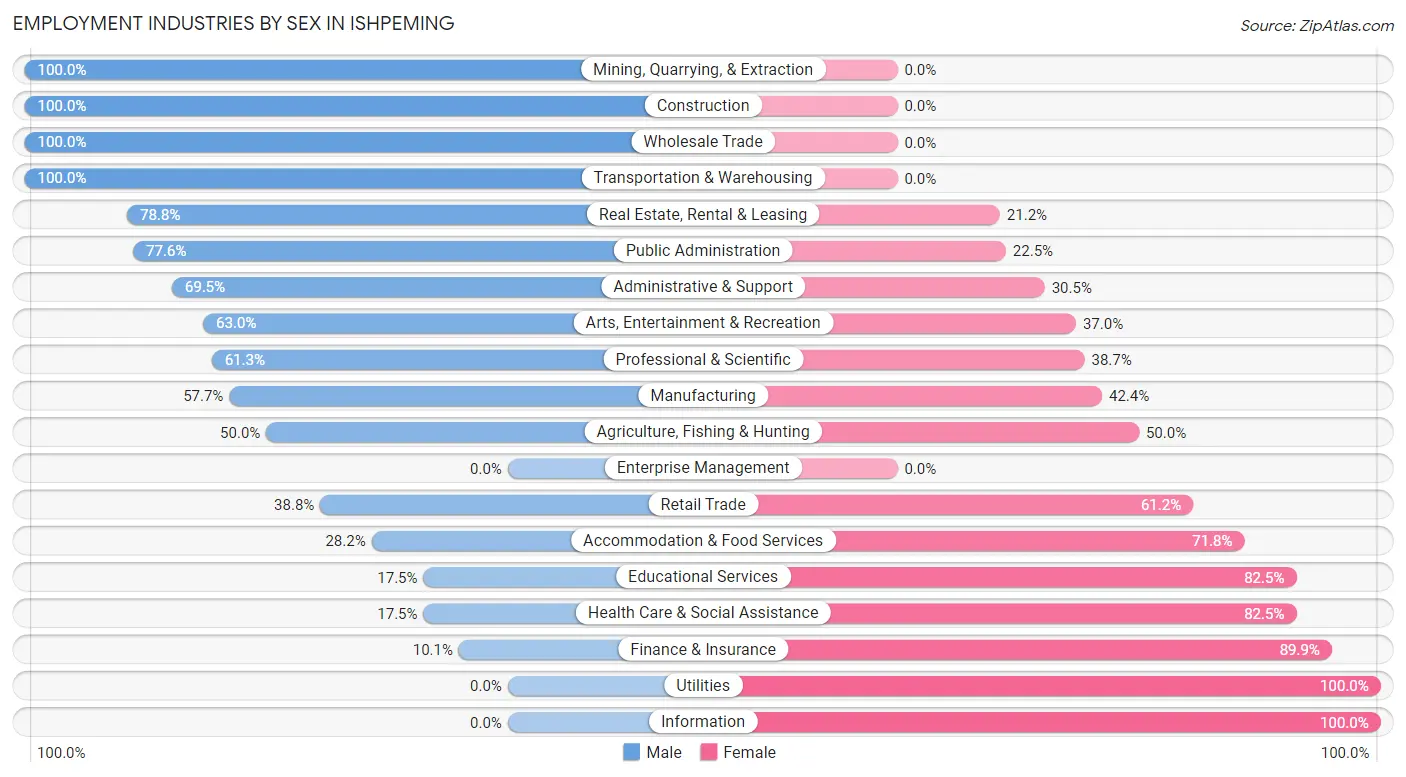
Employment Industries by Sex in Ishpeming
The Ishpeming industries that see more men than women are Mining, Quarrying, & Extraction (100.0%), Construction (100.0%), and Wholesale Trade (100.0%), whereas the industries that tend to have a higher number of women are Utilities (100.0%), Information (100.0%), and Finance & Insurance (89.9%).
| Industry | Male | Female |
| Agriculture, Fishing & Hunting | 27 (50.0%) | 27 (50.0%) |
| Mining, Quarrying, & Extraction | 138 (100.0%) | 0 (0.0%) |
| Construction | 160 (100.0%) | 0 (0.0%) |
| Manufacturing | 113 (57.7%) | 83 (42.3%) |
| Wholesale Trade | 12 (100.0%) | 0 (0.0%) |
| Retail Trade | 172 (38.8%) | 271 (61.2%) |
| Transportation & Warehousing | 42 (100.0%) | 0 (0.0%) |
| Utilities | 0 (0.0%) | 13 (100.0%) |
| Information | 0 (0.0%) | 31 (100.0%) |
| Finance & Insurance | 17 (10.1%) | 151 (89.9%) |
| Real Estate, Rental & Leasing | 52 (78.8%) | 14 (21.2%) |
| Professional & Scientific | 68 (61.3%) | 43 (38.7%) |
| Enterprise Management | 0 (0.0%) | 0 (0.0%) |
| Administrative & Support | 57 (69.5%) | 25 (30.5%) |
| Educational Services | 55 (17.5%) | 260 (82.5%) |
| Health Care & Social Assistance | 81 (17.5%) | 383 (82.5%) |
| Arts, Entertainment & Recreation | 29 (63.0%) | 17 (37.0%) |
| Accommodation & Food Services | 97 (28.2%) | 247 (71.8%) |
| Public Administration | 38 (77.5%) | 11 (22.5%) |
| Total | 1,221 (42.7%) | 1,635 (57.3%) |
Education in Ishpeming
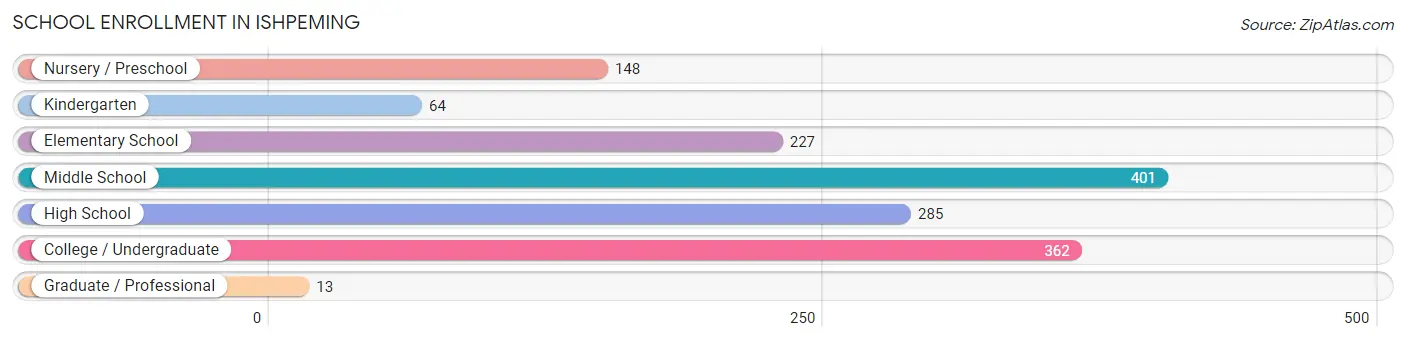
School Enrollment in Ishpeming
The most common levels of schooling among the 1,500 students in Ishpeming are middle school (401 | 26.7%), college / undergraduate (362 | 24.1%), and high school (285 | 19.0%).
| School Level | # Students | % Students |
| Nursery / Preschool | 148 | 9.9% |
| Kindergarten | 64 | 4.3% |
| Elementary School | 227 | 15.1% |
| Middle School | 401 | 26.7% |
| High School | 285 | 19.0% |
| College / Undergraduate | 362 | 24.1% |
| Graduate / Professional | 13 | 0.9% |
| Total | 1,500 | 100.0% |
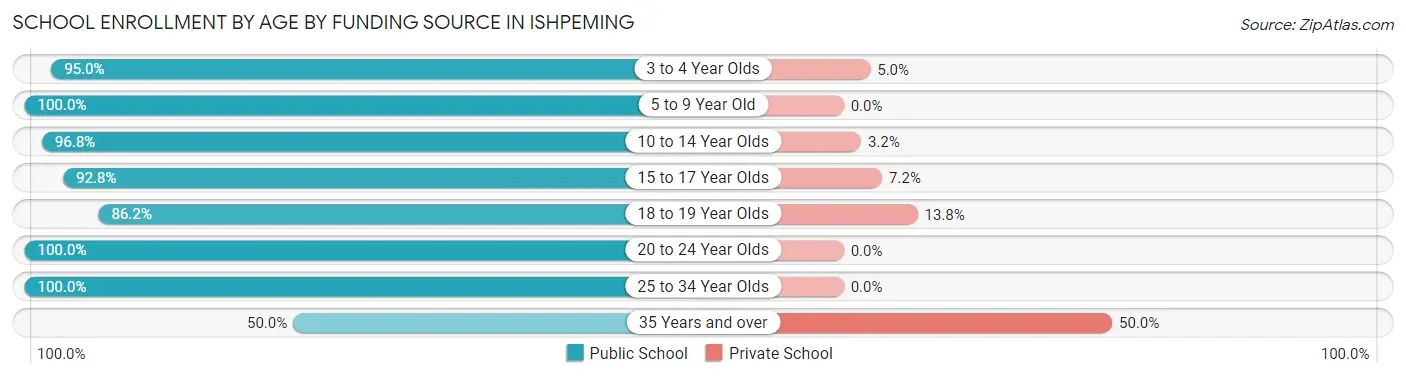
School Enrollment by Age by Funding Source in Ishpeming
Out of a total of 1,500 students who are enrolled in schools in Ishpeming, 80 (5.3%) attend a private institution, while the remaining 1,420 (94.7%) are enrolled in public schools. The age group of 35 years and over has the highest likelihood of being enrolled in private schools, with 23 (50.0% in the age bracket) enrolled. Conversely, the age group of 5 to 9 year old has the lowest likelihood of being enrolled in a private school, with 254 (100.0% in the age bracket) attending a public institution.
| Age Bracket | Public School | Private School |
| 3 to 4 Year Olds | 115 (95.0%) | 6 (5.0%) |
| 5 to 9 Year Old | 254 (100.0%) | 0 (0.0%) |
| 10 to 14 Year Olds | 450 (96.8%) | 15 (3.2%) |
| 15 to 17 Year Olds | 207 (92.8%) | 16 (7.2%) |
| 18 to 19 Year Olds | 119 (86.2%) | 19 (13.8%) |
| 20 to 24 Year Olds | 174 (100.0%) | 0 (0.0%) |
| 25 to 34 Year Olds | 79 (100.0%) | 0 (0.0%) |
| 35 Years and over | 23 (50.0%) | 23 (50.0%) |
| Total | 1,420 (94.7%) | 80 (5.3%) |
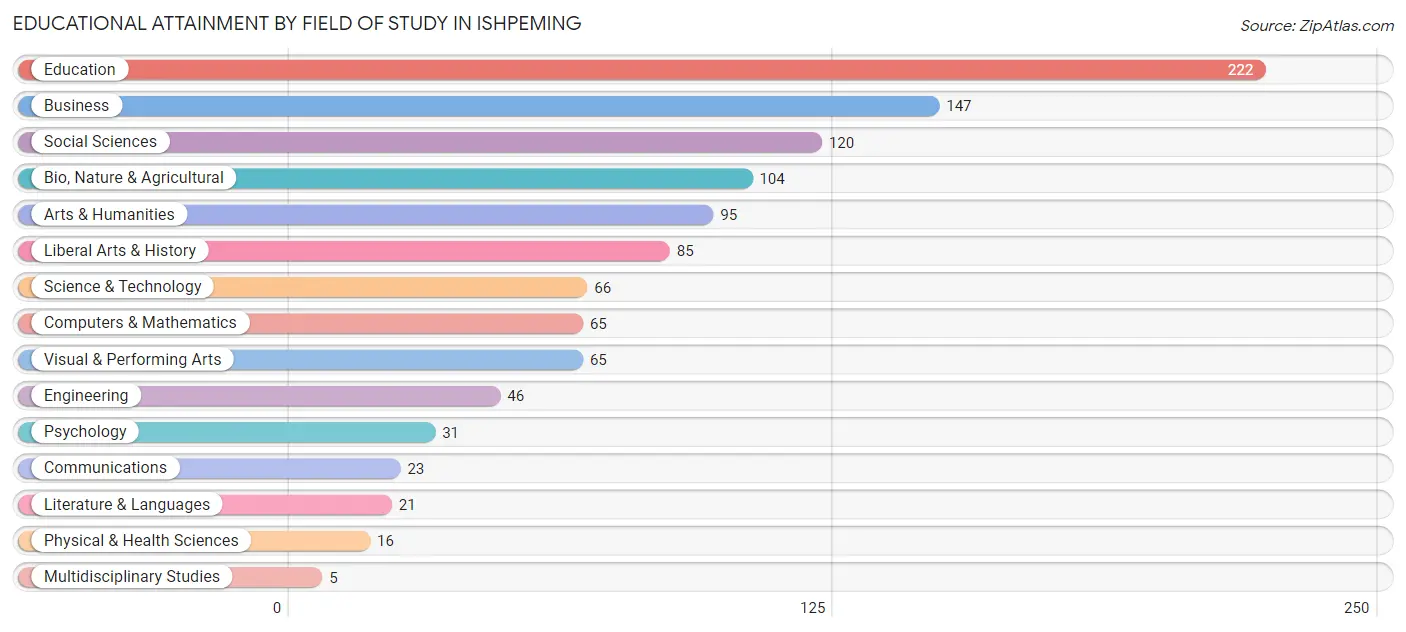
Educational Attainment by Field of Study in Ishpeming
Education (222 | 20.0%), business (147 | 13.2%), social sciences (120 | 10.8%), bio, nature & agricultural (104 | 9.4%), and arts & humanities (95 | 8.6%) are the most common fields of study among 1,111 individuals in Ishpeming who have obtained a bachelor's degree or higher.
| Field of Study | # Graduates | % Graduates |
| Computers & Mathematics | 65 | 5.9% |
| Bio, Nature & Agricultural | 104 | 9.4% |
| Physical & Health Sciences | 16 | 1.4% |
| Psychology | 31 | 2.8% |
| Social Sciences | 120 | 10.8% |
| Engineering | 46 | 4.1% |
| Multidisciplinary Studies | 5 | 0.4% |
| Science & Technology | 66 | 5.9% |
| Business | 147 | 13.2% |
| Education | 222 | 20.0% |
| Literature & Languages | 21 | 1.9% |
| Liberal Arts & History | 85 | 7.6% |
| Visual & Performing Arts | 65 | 5.9% |
| Communications | 23 | 2.1% |
| Arts & Humanities | 95 | 8.6% |
| Total | 1,111 | 100.0% |
Transportation & Commute in Ishpeming
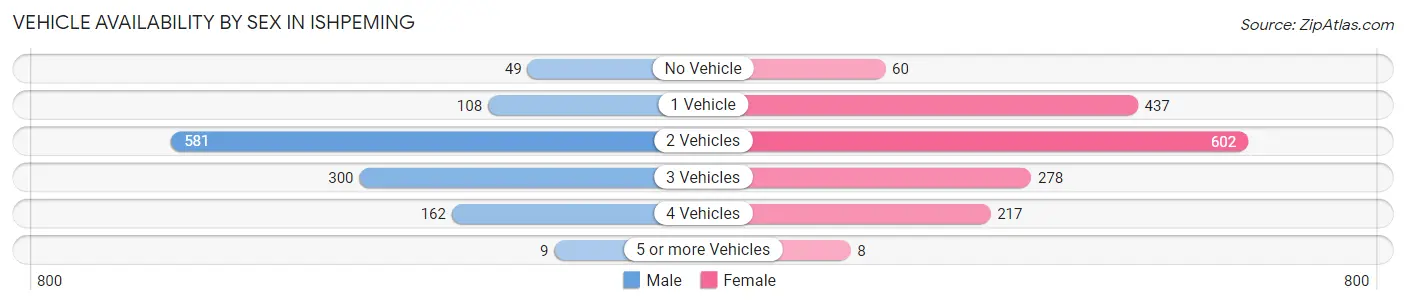
Vehicle Availability by Sex in Ishpeming
The most prevalent vehicle ownership categories in Ishpeming are males with 2 vehicles (581, accounting for 48.1%) and females with 2 vehicles (602, making up 36.3%).
| Vehicles Available | Male | Female |
| No Vehicle | 49 (4.1%) | 60 (3.7%) |
| 1 Vehicle | 108 (8.9%) | 437 (27.3%) |
| 2 Vehicles | 581 (48.1%) | 602 (37.6%) |
| 3 Vehicles | 300 (24.8%) | 278 (17.3%) |
| 4 Vehicles | 162 (13.4%) | 217 (13.6%) |
| 5 or more Vehicles | 9 (0.7%) | 8 (0.5%) |
| Total | 1,209 (100.0%) | 1,602 (100.0%) |
Commute Time in Ishpeming
The most frequently occuring commute durations in Ishpeming are 20 to 24 minutes (634 commuters, 24.5%), 5 to 9 minutes (535 commuters, 20.7%), and 10 to 14 minutes (452 commuters, 17.5%).
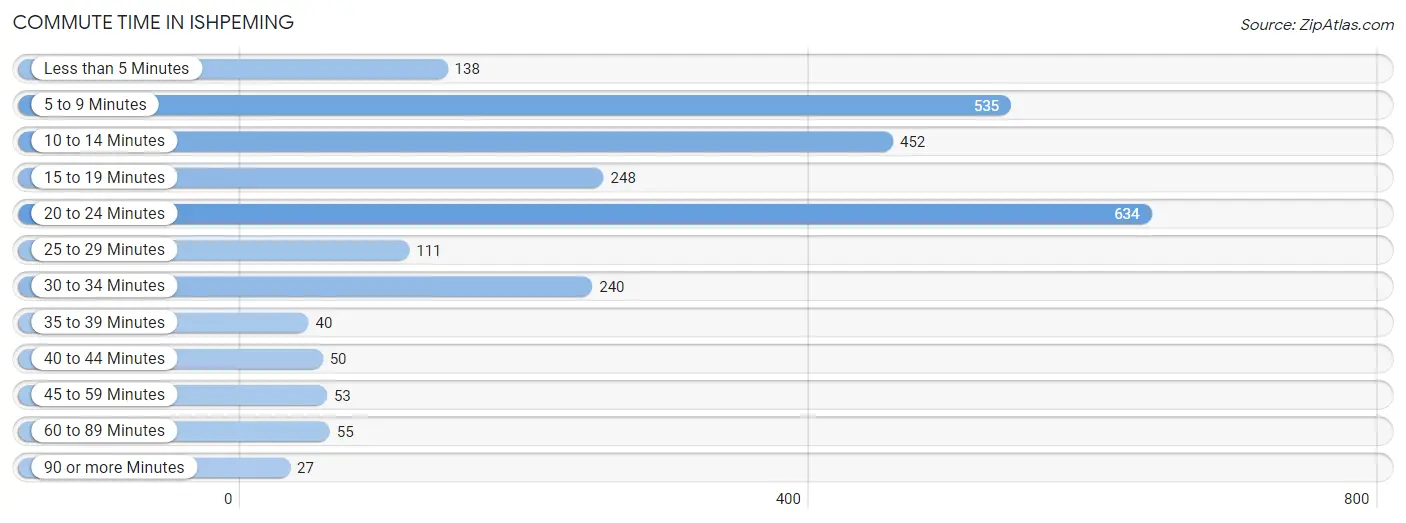
| Commute Time | # Commuters | % Commuters |
| Less than 5 Minutes | 138 | 5.3% |
| 5 to 9 Minutes | 535 | 20.7% |
| 10 to 14 Minutes | 452 | 17.5% |
| 15 to 19 Minutes | 248 | 9.6% |
| 20 to 24 Minutes | 634 | 24.5% |
| 25 to 29 Minutes | 111 | 4.3% |
| 30 to 34 Minutes | 240 | 9.3% |
| 35 to 39 Minutes | 40 | 1.5% |
| 40 to 44 Minutes | 50 | 1.9% |
| 45 to 59 Minutes | 53 | 2.1% |
| 60 to 89 Minutes | 55 | 2.1% |
| 90 or more Minutes | 27 | 1.1% |
Commute Time by Sex in Ishpeming
The most common commute times in Ishpeming are 20 to 24 minutes (326 commuters, 29.2%) for males and 5 to 9 minutes (415 commuters, 28.3%) for females.
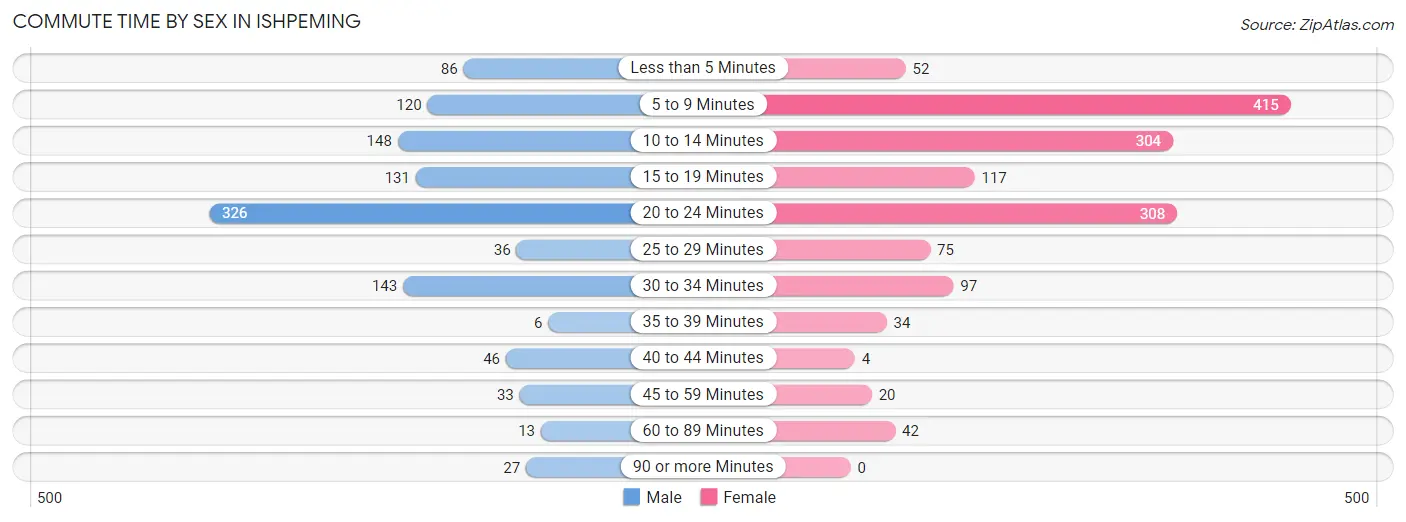
| Commute Time | Male | Female |
| Less than 5 Minutes | 86 (7.7%) | 52 (3.5%) |
| 5 to 9 Minutes | 120 (10.8%) | 415 (28.3%) |
| 10 to 14 Minutes | 148 (13.3%) | 304 (20.7%) |
| 15 to 19 Minutes | 131 (11.7%) | 117 (8.0%) |
| 20 to 24 Minutes | 326 (29.2%) | 308 (21.0%) |
| 25 to 29 Minutes | 36 (3.2%) | 75 (5.1%) |
| 30 to 34 Minutes | 143 (12.8%) | 97 (6.6%) |
| 35 to 39 Minutes | 6 (0.5%) | 34 (2.3%) |
| 40 to 44 Minutes | 46 (4.1%) | 4 (0.3%) |
| 45 to 59 Minutes | 33 (3.0%) | 20 (1.4%) |
| 60 to 89 Minutes | 13 (1.2%) | 42 (2.9%) |
| 90 or more Minutes | 27 (2.4%) | 0 (0.0%) |
Time of Departure to Work by Sex in Ishpeming
The most frequent times of departure to work in Ishpeming are 7:30 AM to 7:59 AM (207, 18.6%) for males and 7:30 AM to 7:59 AM (309, 21.0%) for females.
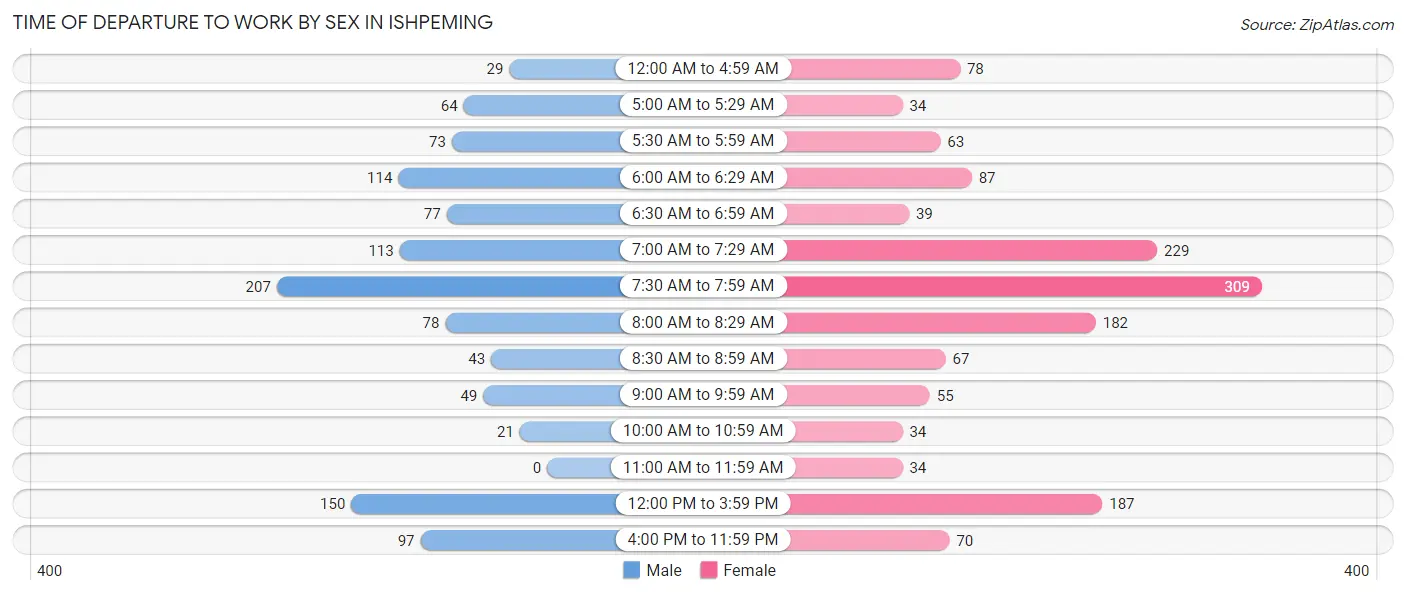
| Time of Departure | Male | Female |
| 12:00 AM to 4:59 AM | 29 (2.6%) | 78 (5.3%) |
| 5:00 AM to 5:29 AM | 64 (5.7%) | 34 (2.3%) |
| 5:30 AM to 5:59 AM | 73 (6.6%) | 63 (4.3%) |
| 6:00 AM to 6:29 AM | 114 (10.2%) | 87 (5.9%) |
| 6:30 AM to 6:59 AM | 77 (6.9%) | 39 (2.7%) |
| 7:00 AM to 7:29 AM | 113 (10.1%) | 229 (15.6%) |
| 7:30 AM to 7:59 AM | 207 (18.6%) | 309 (21.0%) |
| 8:00 AM to 8:29 AM | 78 (7.0%) | 182 (12.4%) |
| 8:30 AM to 8:59 AM | 43 (3.9%) | 67 (4.6%) |
| 9:00 AM to 9:59 AM | 49 (4.4%) | 55 (3.7%) |
| 10:00 AM to 10:59 AM | 21 (1.9%) | 34 (2.3%) |
| 11:00 AM to 11:59 AM | 0 (0.0%) | 34 (2.3%) |
| 12:00 PM to 3:59 PM | 150 (13.5%) | 187 (12.7%) |
| 4:00 PM to 11:59 PM | 97 (8.7%) | 70 (4.8%) |
| Total | 1,115 (100.0%) | 1,468 (100.0%) |
Housing Occupancy in Ishpeming
Occupancy by Ownership in Ishpeming
Of the total 2,441 dwellings in Ishpeming, owner-occupied units account for 1,785 (73.1%), while renter-occupied units make up 656 (26.9%).
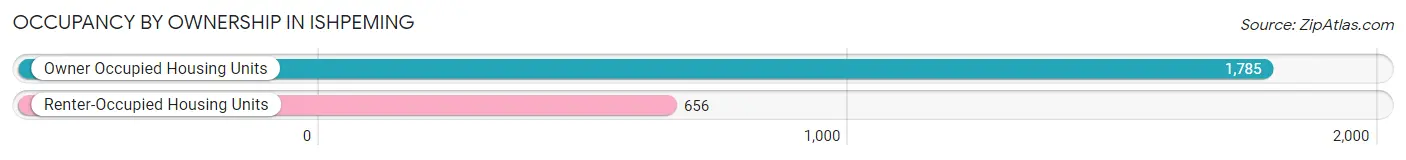
| Occupancy | # Housing Units | % Housing Units |
| Owner Occupied Housing Units | 1,785 | 73.1% |
| Renter-Occupied Housing Units | 656 | 26.9% |
| Total Occupied Housing Units | 2,441 | 100.0% |
Occupancy by Household Size in Ishpeming
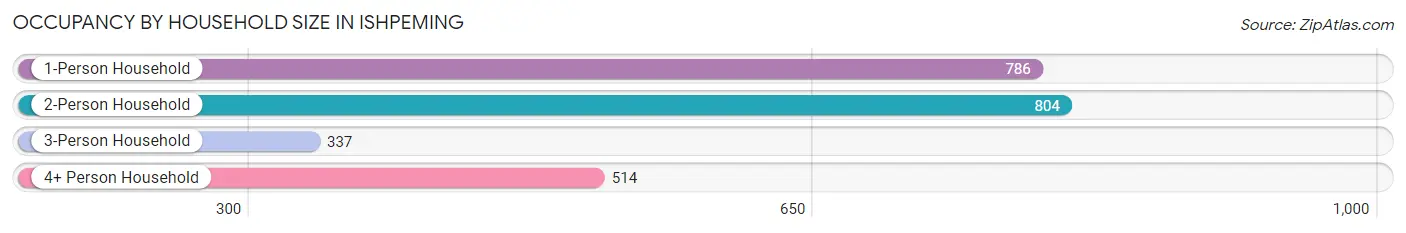
| Household Size | # Housing Units | % Housing Units |
| 1-Person Household | 786 | 32.2% |
| 2-Person Household | 804 | 32.9% |
| 3-Person Household | 337 | 13.8% |
| 4+ Person Household | 514 | 21.1% |
| Total Housing Units | 2,441 | 100.0% |
Occupancy by Ownership by Household Size in Ishpeming
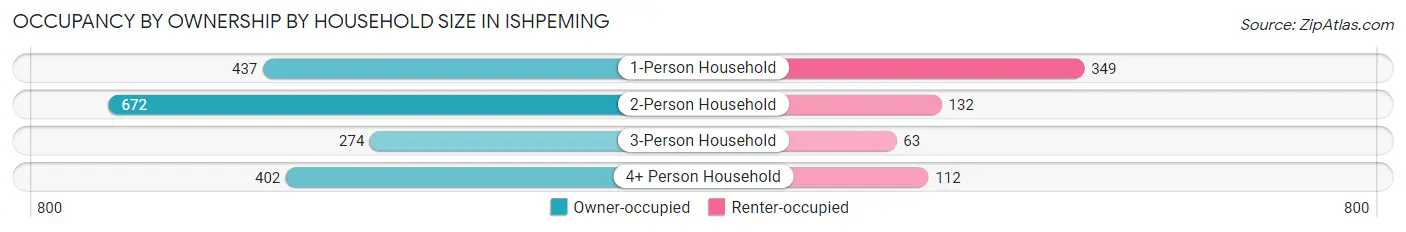
| Household Size | Owner-occupied | Renter-occupied |
| 1-Person Household | 437 (55.6%) | 349 (44.4%) |
| 2-Person Household | 672 (83.6%) | 132 (16.4%) |
| 3-Person Household | 274 (81.3%) | 63 (18.7%) |
| 4+ Person Household | 402 (78.2%) | 112 (21.8%) |
| Total Housing Units | 1,785 (73.1%) | 656 (26.9%) |
Occupancy by Educational Attainment in Ishpeming
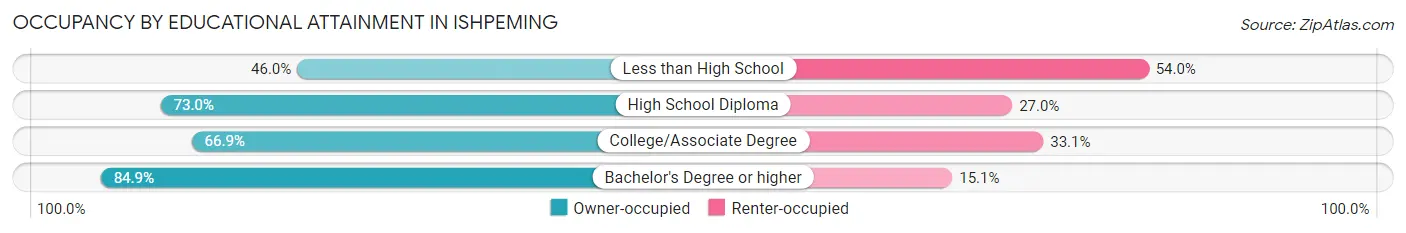
| Household Size | Owner-occupied | Renter-occupied |
| Less than High School | 57 (46.0%) | 67 (54.0%) |
| High School Diploma | 547 (73.0%) | 202 (27.0%) |
| College/Associate Degree | 557 (66.9%) | 276 (33.1%) |
| Bachelor's Degree or higher | 624 (84.9%) | 111 (15.1%) |
Occupancy by Age of Householder in Ishpeming
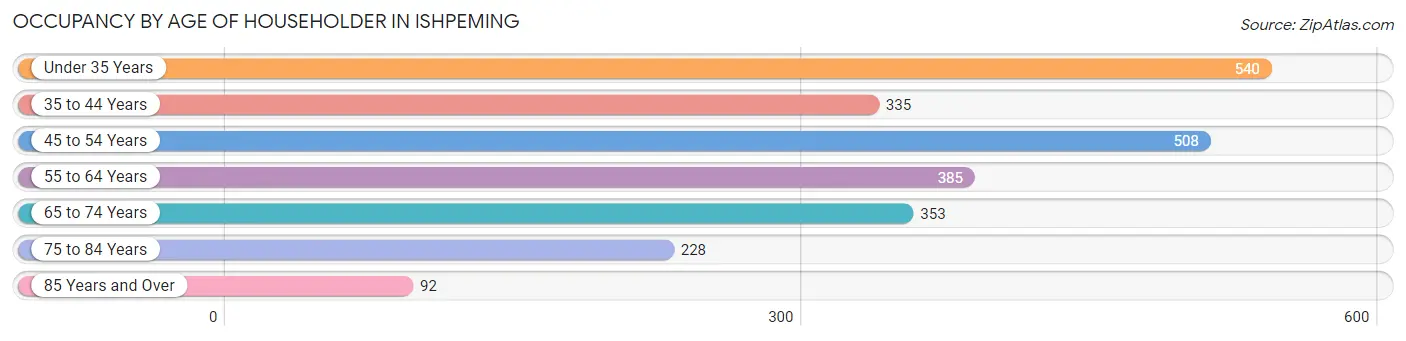
| Age Bracket | # Households | % Households |
| Under 35 Years | 540 | 22.1% |
| 35 to 44 Years | 335 | 13.7% |
| 45 to 54 Years | 508 | 20.8% |
| 55 to 64 Years | 385 | 15.8% |
| 65 to 74 Years | 353 | 14.5% |
| 75 to 84 Years | 228 | 9.3% |
| 85 Years and Over | 92 | 3.8% |
| Total | 2,441 | 100.0% |
Housing Finances in Ishpeming
Median Income by Occupancy in Ishpeming
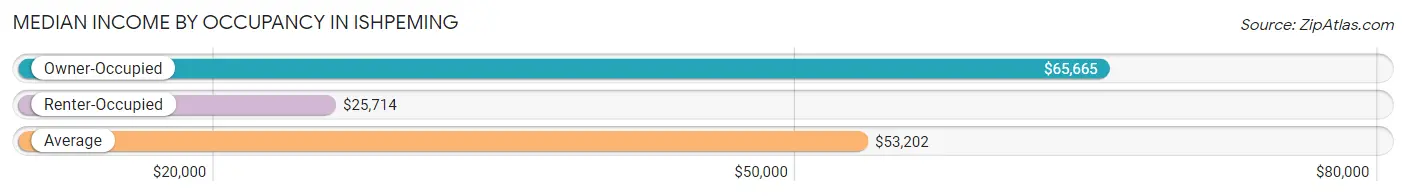
| Occupancy Type | # Households | Median Income |
| Owner-Occupied | 1,785 (73.1%) | $65,665 |
| Renter-Occupied | 656 (26.9%) | $25,714 |
| Average | 2,441 (100.0%) | $53,202 |
Occupancy by Householder Income Bracket in Ishpeming
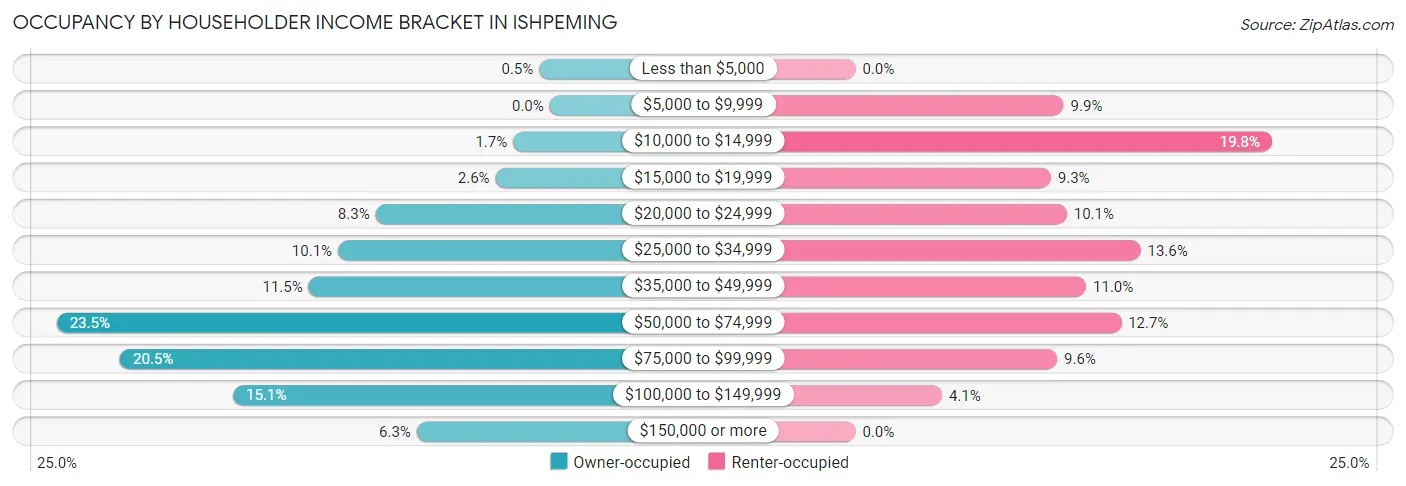
| Income Bracket | Owner-occupied | Renter-occupied |
| Less than $5,000 | 9 (0.5%) | 0 (0.0%) |
| $5,000 to $9,999 | 0 (0.0%) | 65 (9.9%) |
| $10,000 to $14,999 | 31 (1.7%) | 130 (19.8%) |
| $15,000 to $19,999 | 46 (2.6%) | 61 (9.3%) |
| $20,000 to $24,999 | 148 (8.3%) | 66 (10.1%) |
| $25,000 to $34,999 | 180 (10.1%) | 89 (13.6%) |
| $35,000 to $49,999 | 205 (11.5%) | 72 (11.0%) |
| $50,000 to $74,999 | 419 (23.5%) | 83 (12.7%) |
| $75,000 to $99,999 | 365 (20.4%) | 63 (9.6%) |
| $100,000 to $149,999 | 269 (15.1%) | 27 (4.1%) |
| $150,000 or more | 113 (6.3%) | 0 (0.0%) |
| Total | 1,785 (100.0%) | 656 (100.0%) |
Monthly Housing Cost Tiers in Ishpeming
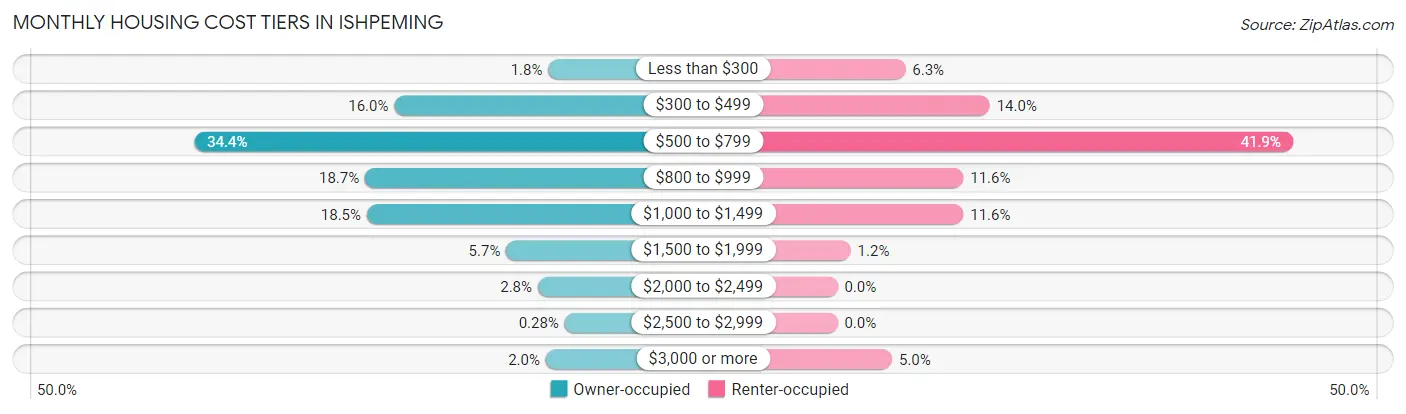
| Monthly Cost | Owner-occupied | Renter-occupied |
| Less than $300 | 32 (1.8%) | 41 (6.2%) |
| $300 to $499 | 285 (16.0%) | 92 (14.0%) |
| $500 to $799 | 614 (34.4%) | 275 (41.9%) |
| $800 to $999 | 333 (18.7%) | 76 (11.6%) |
| $1,000 to $1,499 | 330 (18.5%) | 76 (11.6%) |
| $1,500 to $1,999 | 101 (5.7%) | 8 (1.2%) |
| $2,000 to $2,499 | 49 (2.8%) | 0 (0.0%) |
| $2,500 to $2,999 | 5 (0.3%) | 0 (0.0%) |
| $3,000 or more | 36 (2.0%) | 33 (5.0%) |
| Total | 1,785 (100.0%) | 656 (100.0%) |
Physical Housing Characteristics in Ishpeming
Housing Structures in Ishpeming
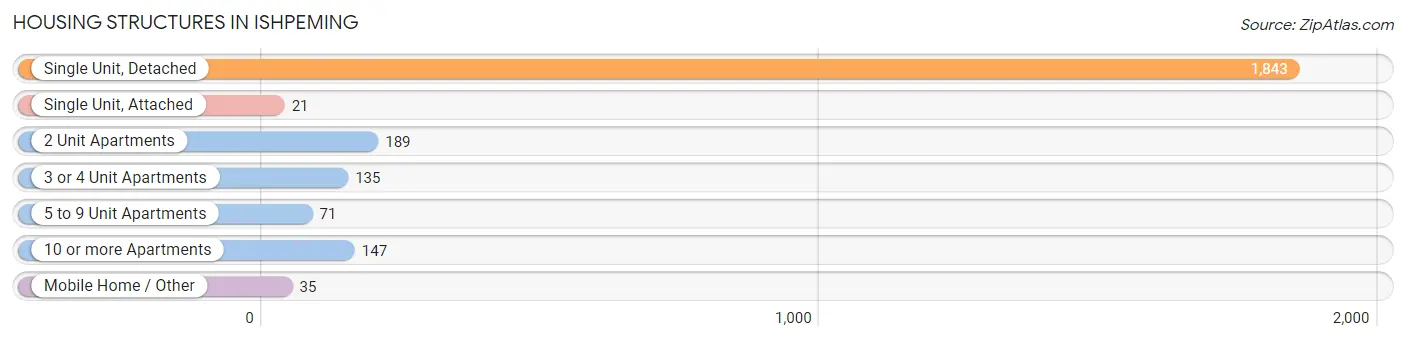
| Structure Type | # Housing Units | % Housing Units |
| Single Unit, Detached | 1,843 | 75.5% |
| Single Unit, Attached | 21 | 0.9% |
| 2 Unit Apartments | 189 | 7.7% |
| 3 or 4 Unit Apartments | 135 | 5.5% |
| 5 to 9 Unit Apartments | 71 | 2.9% |
| 10 or more Apartments | 147 | 6.0% |
| Mobile Home / Other | 35 | 1.4% |
| Total | 2,441 | 100.0% |
Housing Structures by Occupancy in Ishpeming
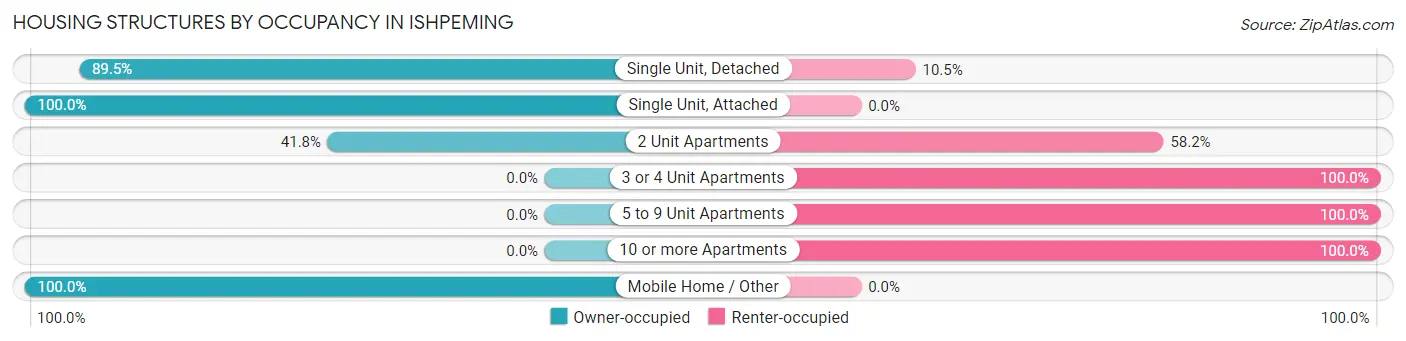
| Structure Type | Owner-occupied | Renter-occupied |
| Single Unit, Detached | 1,650 (89.5%) | 193 (10.5%) |
| Single Unit, Attached | 21 (100.0%) | 0 (0.0%) |
| 2 Unit Apartments | 79 (41.8%) | 110 (58.2%) |
| 3 or 4 Unit Apartments | 0 (0.0%) | 135 (100.0%) |
| 5 to 9 Unit Apartments | 0 (0.0%) | 71 (100.0%) |
| 10 or more Apartments | 0 (0.0%) | 147 (100.0%) |
| Mobile Home / Other | 35 (100.0%) | 0 (0.0%) |
| Total | 1,785 (73.1%) | 656 (26.9%) |
Housing Structures by Number of Rooms in Ishpeming
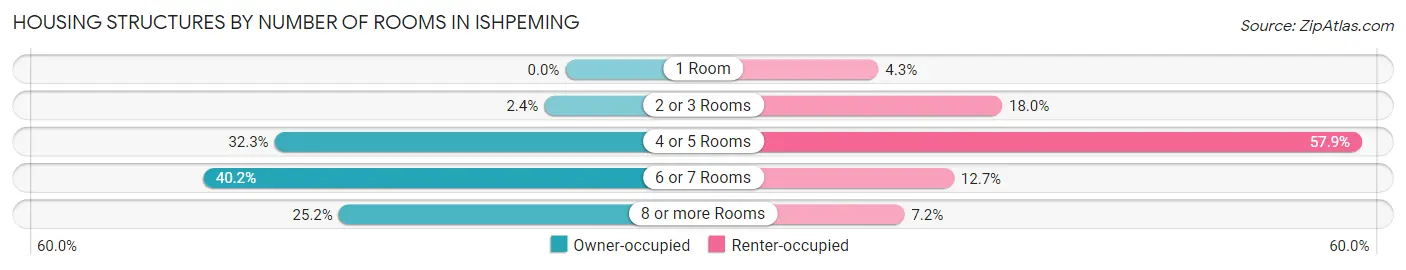
| Number of Rooms | Owner-occupied | Renter-occupied |
| 1 Room | 0 (0.0%) | 28 (4.3%) |
| 2 or 3 Rooms | 42 (2.4%) | 118 (18.0%) |
| 4 or 5 Rooms | 576 (32.3%) | 380 (57.9%) |
| 6 or 7 Rooms | 718 (40.2%) | 83 (12.7%) |
| 8 or more Rooms | 449 (25.2%) | 47 (7.2%) |
| Total | 1,785 (100.0%) | 656 (100.0%) |
Housing Structure by Heating Type in Ishpeming
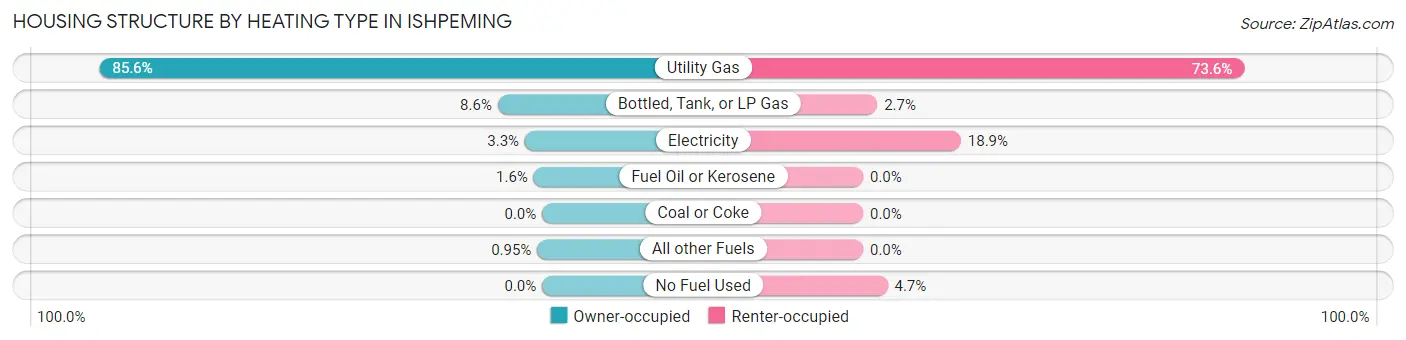
| Heating Type | Owner-occupied | Renter-occupied |
| Utility Gas | 1,527 (85.6%) | 483 (73.6%) |
| Bottled, Tank, or LP Gas | 153 (8.6%) | 18 (2.7%) |
| Electricity | 59 (3.3%) | 124 (18.9%) |
| Fuel Oil or Kerosene | 29 (1.6%) | 0 (0.0%) |
| Coal or Coke | 0 (0.0%) | 0 (0.0%) |
| All other Fuels | 17 (0.9%) | 0 (0.0%) |
| No Fuel Used | 0 (0.0%) | 31 (4.7%) |
| Total | 1,785 (100.0%) | 656 (100.0%) |
Household Vehicle Usage in Ishpeming
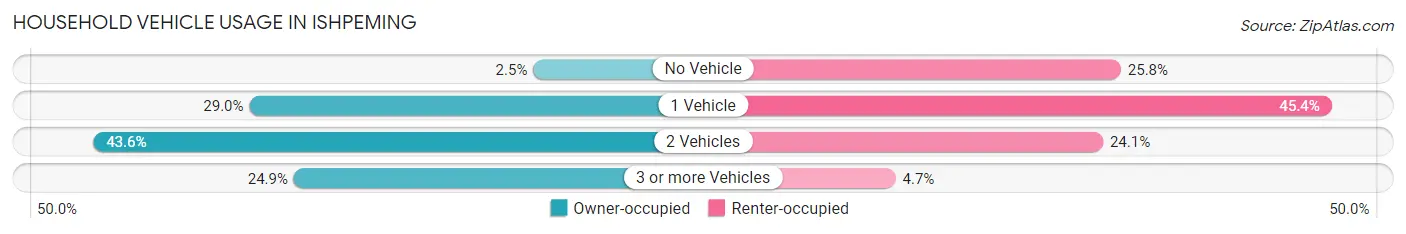
| Vehicles per Household | Owner-occupied | Renter-occupied |
| No Vehicle | 45 (2.5%) | 169 (25.8%) |
| 1 Vehicle | 518 (29.0%) | 298 (45.4%) |
| 2 Vehicles | 778 (43.6%) | 158 (24.1%) |
| 3 or more Vehicles | 444 (24.9%) | 31 (4.7%) |
| Total | 1,785 (100.0%) | 656 (100.0%) |
Real Estate & Mortgages in Ishpeming
Real Estate and Mortgage Overview in Ishpeming
| Characteristic | Without Mortgage | With Mortgage |
| Housing Units | 824 | 961 |
| Median Property Value | $106,300 | $106,100 |
| Median Household Income | $60,250 | $59 |
| Monthly Housing Costs | $541 | $36 |
| Real Estate Taxes | $1,624 | $30 |
Property Value by Mortgage Status in Ishpeming
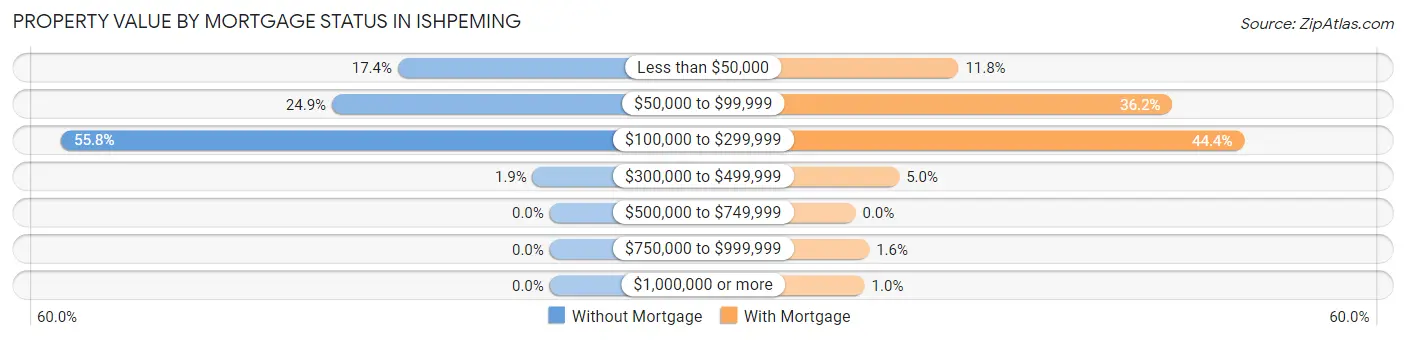
| Property Value | Without Mortgage | With Mortgage |
| Less than $50,000 | 143 (17.3%) | 113 (11.8%) |
| $50,000 to $99,999 | 205 (24.9%) | 348 (36.2%) |
| $100,000 to $299,999 | 460 (55.8%) | 427 (44.4%) |
| $300,000 to $499,999 | 16 (1.9%) | 48 (5.0%) |
| $500,000 to $749,999 | 0 (0.0%) | 0 (0.0%) |
| $750,000 to $999,999 | 0 (0.0%) | 15 (1.6%) |
| $1,000,000 or more | 0 (0.0%) | 10 (1.0%) |
| Total | 824 (100.0%) | 961 (100.0%) |
Household Income by Mortgage Status in Ishpeming
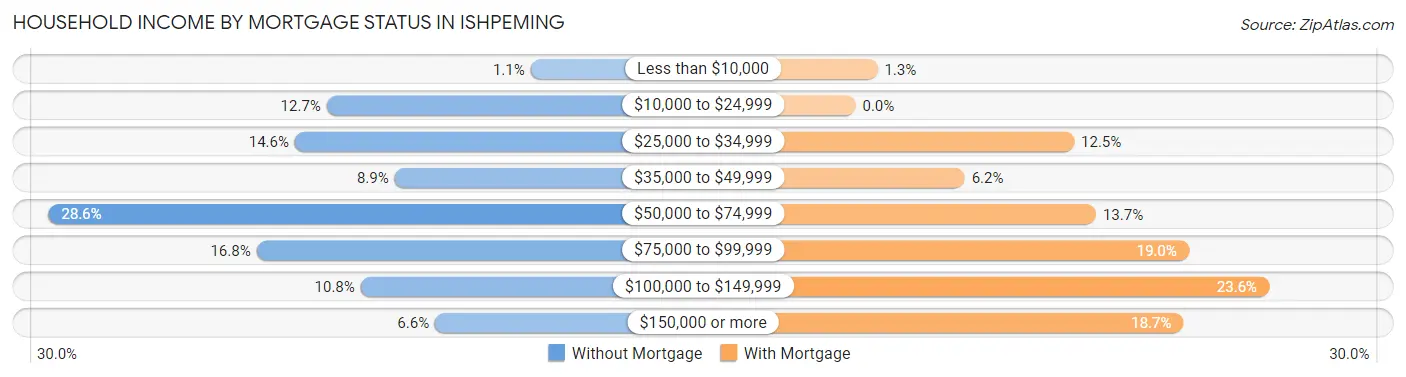
| Household Income | Without Mortgage | With Mortgage |
| Less than $10,000 | 9 (1.1%) | 12 (1.3%) |
| $10,000 to $24,999 | 105 (12.7%) | 0 (0.0%) |
| $25,000 to $34,999 | 120 (14.6%) | 120 (12.5%) |
| $35,000 to $49,999 | 73 (8.9%) | 60 (6.2%) |
| $50,000 to $74,999 | 236 (28.6%) | 132 (13.7%) |
| $75,000 to $99,999 | 138 (16.8%) | 183 (19.0%) |
| $100,000 to $149,999 | 89 (10.8%) | 227 (23.6%) |
| $150,000 or more | 54 (6.6%) | 180 (18.7%) |
| Total | 824 (100.0%) | 961 (100.0%) |
Property Value to Household Income Ratio in Ishpeming
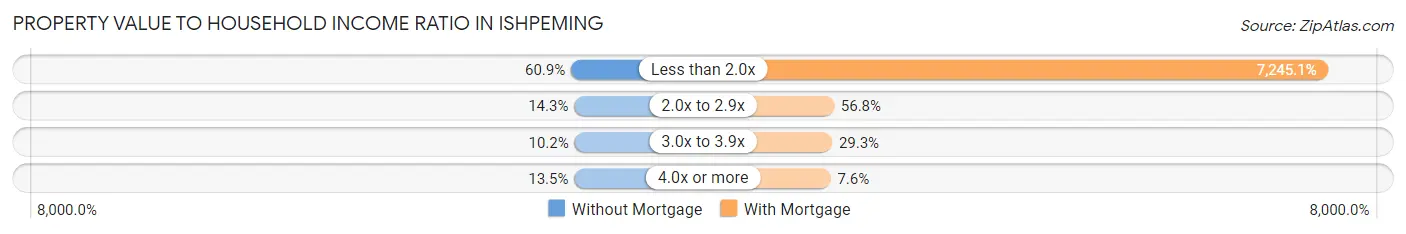
| Value-to-Income Ratio | Without Mortgage | With Mortgage |
| Less than 2.0x | 502 (60.9%) | 69,625 (7,245.1%) |
| 2.0x to 2.9x | 118 (14.3%) | 546 (56.8%) |
| 3.0x to 3.9x | 84 (10.2%) | 282 (29.3%) |
| 4.0x or more | 111 (13.5%) | 73 (7.6%) |
| Total | 824 (100.0%) | 961 (100.0%) |
Real Estate Taxes by Mortgage Status in Ishpeming
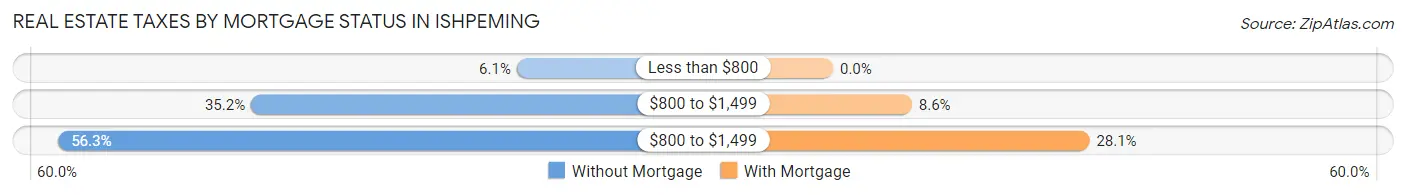
| Property Taxes | Without Mortgage | With Mortgage |
| Less than $800 | 50 (6.1%) | 0 (0.0%) |
| $800 to $1,499 | 290 (35.2%) | 83 (8.6%) |
| $800 to $1,499 | 464 (56.3%) | 270 (28.1%) |
| Total | 824 (100.0%) | 961 (100.0%) |
Health & Disability in Ishpeming
Health Insurance Coverage by Age in Ishpeming
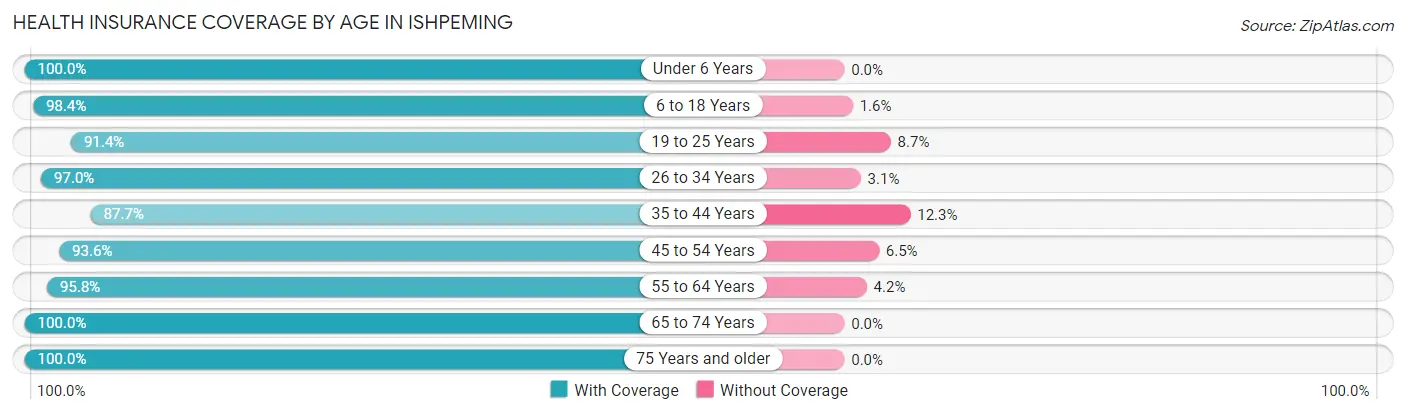
| Age Bracket | With Coverage | Without Coverage |
| Under 6 Years | 523 (100.0%) | 0 (0.0%) |
| 6 to 18 Years | 1,005 (98.4%) | 16 (1.6%) |
| 19 to 25 Years | 634 (91.3%) | 60 (8.6%) |
| 26 to 34 Years | 731 (97.0%) | 23 (3.0%) |
| 35 to 44 Years | 542 (87.7%) | 76 (12.3%) |
| 45 to 54 Years | 827 (93.5%) | 57 (6.5%) |
| 55 to 64 Years | 551 (95.8%) | 24 (4.2%) |
| 65 to 74 Years | 565 (100.0%) | 0 (0.0%) |
| 75 Years and older | 422 (100.0%) | 0 (0.0%) |
| Total | 5,800 (95.8%) | 256 (4.2%) |
Health Insurance Coverage by Citizenship Status in Ishpeming
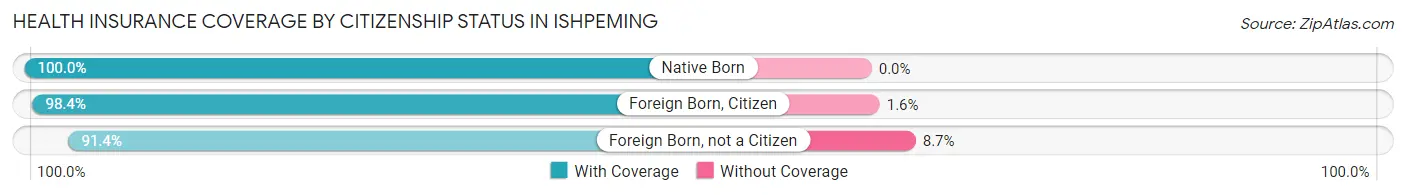
| Citizenship Status | With Coverage | Without Coverage |
| Native Born | 523 (100.0%) | 0 (0.0%) |
| Foreign Born, Citizen | 1,005 (98.4%) | 16 (1.6%) |
| Foreign Born, not a Citizen | 634 (91.3%) | 60 (8.6%) |
Health Insurance Coverage by Household Income in Ishpeming
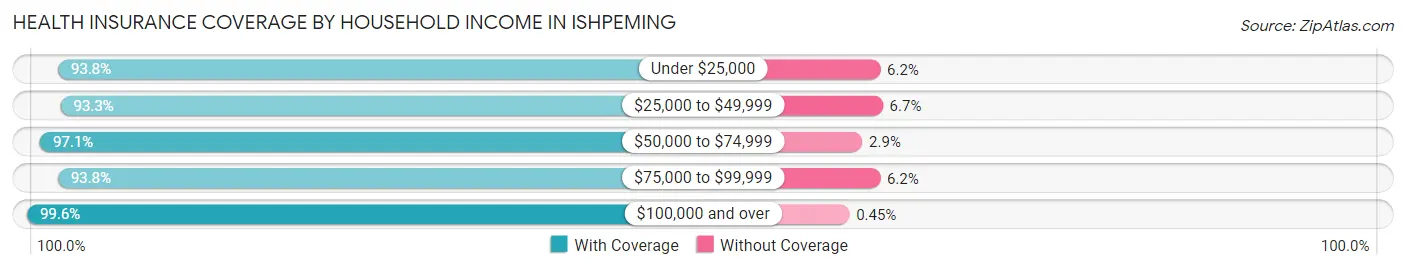
| Household Income | With Coverage | Without Coverage |
| Under $25,000 | 947 (93.8%) | 63 (6.2%) |
| $25,000 to $49,999 | 1,097 (93.3%) | 79 (6.7%) |
| $50,000 to $74,999 | 1,080 (97.1%) | 32 (2.9%) |
| $75,000 to $99,999 | 1,133 (93.8%) | 75 (6.2%) |
| $100,000 and over | 1,538 (99.6%) | 7 (0.4%) |
Public vs Private Health Insurance Coverage by Age in Ishpeming
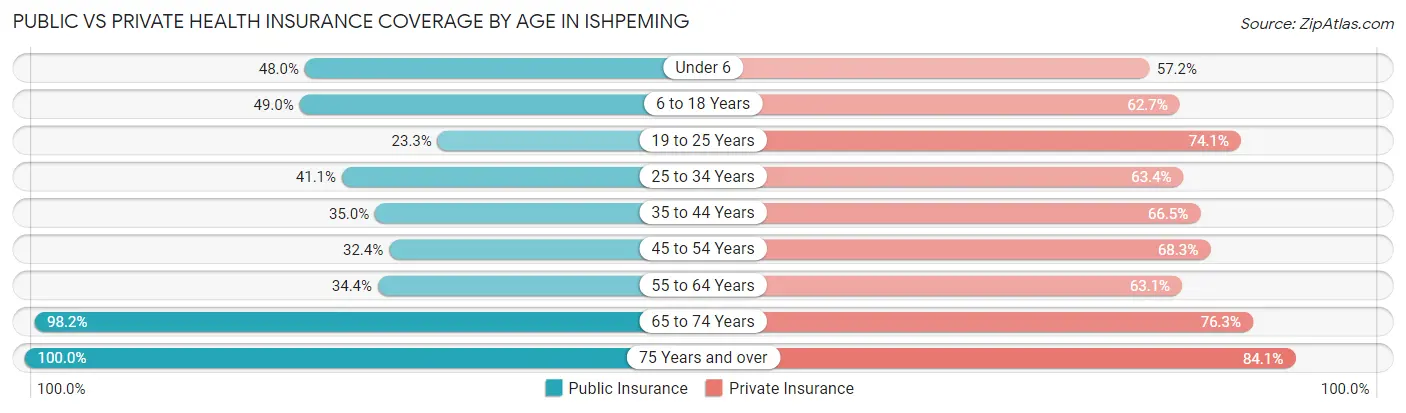
| Age Bracket | Public Insurance | Private Insurance |
| Under 6 | 251 (48.0%) | 299 (57.2%) |
| 6 to 18 Years | 500 (49.0%) | 640 (62.7%) |
| 19 to 25 Years | 162 (23.3%) | 514 (74.1%) |
| 25 to 34 Years | 310 (41.1%) | 478 (63.4%) |
| 35 to 44 Years | 216 (34.9%) | 411 (66.5%) |
| 45 to 54 Years | 286 (32.4%) | 604 (68.3%) |
| 55 to 64 Years | 198 (34.4%) | 363 (63.1%) |
| 65 to 74 Years | 555 (98.2%) | 431 (76.3%) |
| 75 Years and over | 422 (100.0%) | 355 (84.1%) |
| Total | 2,900 (47.9%) | 4,095 (67.6%) |
Disability Status by Sex by Age in Ishpeming
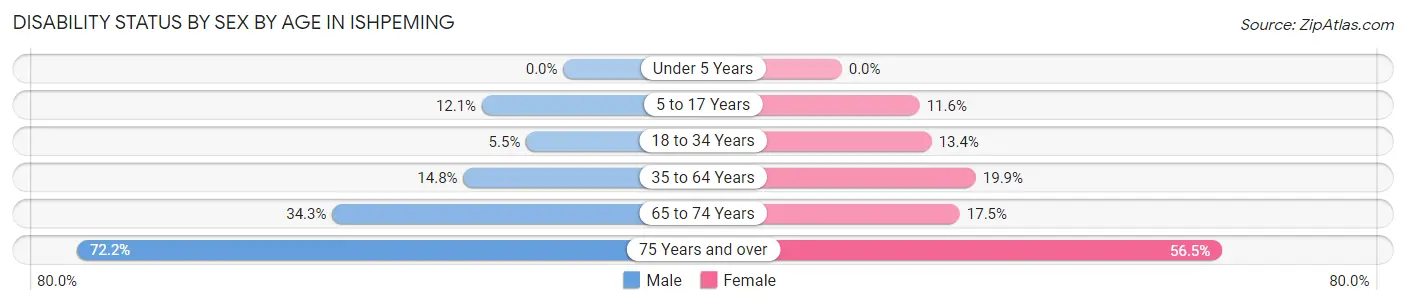
| Age Bracket | Male | Female |
| Under 5 Years | 0 (0.0%) | 0 (0.0%) |
| 5 to 17 Years | 59 (12.1%) | 56 (11.6%) |
| 18 to 34 Years | 37 (5.5%) | 118 (13.4%) |
| 35 to 64 Years | 145 (14.8%) | 219 (19.9%) |
| 65 to 74 Years | 94 (34.3%) | 51 (17.5%) |
| 75 Years and over | 104 (72.2%) | 157 (56.5%) |
Disability Class by Sex by Age in Ishpeming
Disability Class: Hearing Difficulty
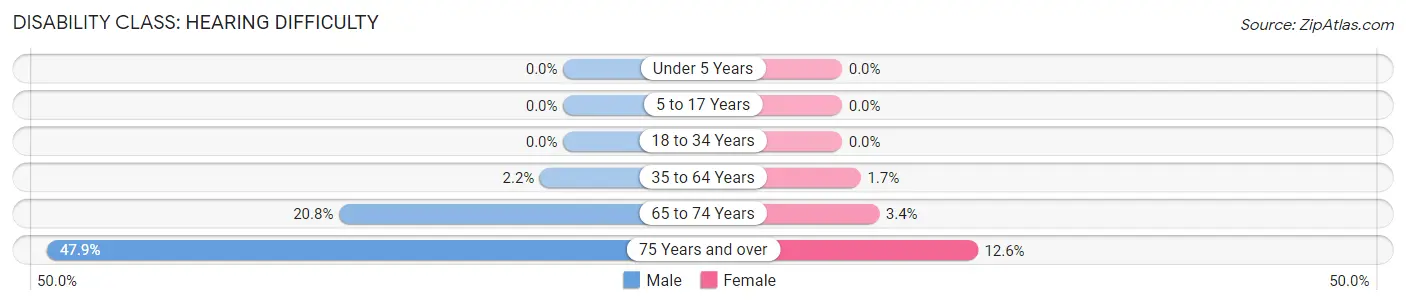
| Age Bracket | Male | Female |
| Under 5 Years | 0 (0.0%) | 0 (0.0%) |
| 5 to 17 Years | 0 (0.0%) | 0 (0.0%) |
| 18 to 34 Years | 0 (0.0%) | 0 (0.0%) |
| 35 to 64 Years | 21 (2.1%) | 19 (1.7%) |
| 65 to 74 Years | 57 (20.8%) | 10 (3.4%) |
| 75 Years and over | 69 (47.9%) | 35 (12.6%) |
Disability Class: Vision Difficulty
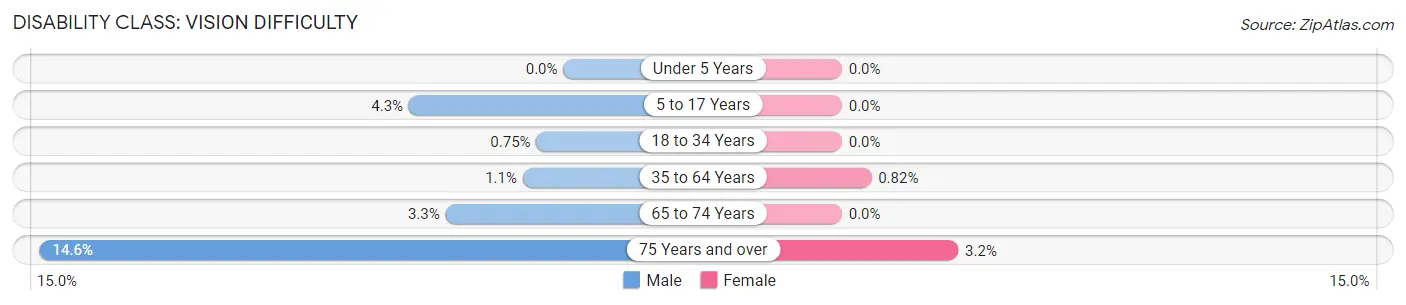
| Age Bracket | Male | Female |
| Under 5 Years | 0 (0.0%) | 0 (0.0%) |
| 5 to 17 Years | 21 (4.3%) | 0 (0.0%) |
| 18 to 34 Years | 5 (0.7%) | 0 (0.0%) |
| 35 to 64 Years | 11 (1.1%) | 9 (0.8%) |
| 65 to 74 Years | 9 (3.3%) | 0 (0.0%) |
| 75 Years and over | 21 (14.6%) | 9 (3.2%) |
Disability Class: Cognitive Difficulty
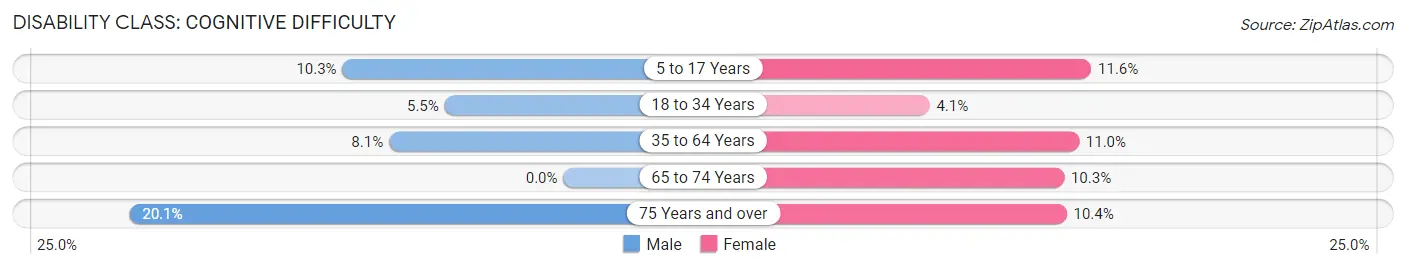
| Age Bracket | Male | Female |
| 5 to 17 Years | 50 (10.2%) | 56 (11.6%) |
| 18 to 34 Years | 37 (5.5%) | 36 (4.1%) |
| 35 to 64 Years | 79 (8.1%) | 121 (11.0%) |
| 65 to 74 Years | 0 (0.0%) | 30 (10.3%) |
| 75 Years and over | 29 (20.1%) | 29 (10.4%) |
Disability Class: Ambulatory Difficulty
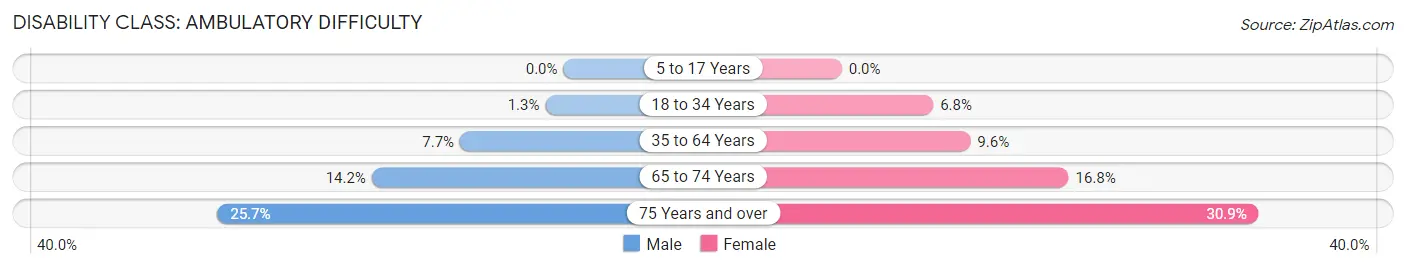
| Age Bracket | Male | Female |
| 5 to 17 Years | 0 (0.0%) | 0 (0.0%) |
| 18 to 34 Years | 9 (1.3%) | 60 (6.8%) |
| 35 to 64 Years | 75 (7.7%) | 105 (9.6%) |
| 65 to 74 Years | 39 (14.2%) | 49 (16.8%) |
| 75 Years and over | 37 (25.7%) | 86 (30.9%) |
Disability Class: Self-Care Difficulty
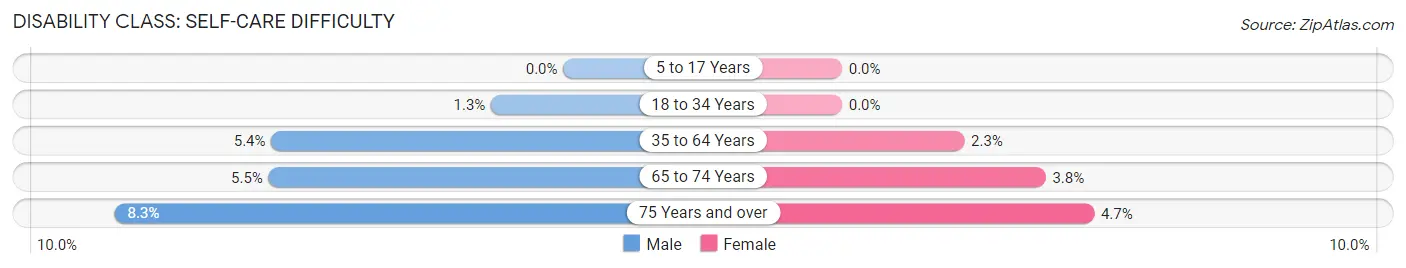
| Age Bracket | Male | Female |
| 5 to 17 Years | 0 (0.0%) | 0 (0.0%) |
| 18 to 34 Years | 9 (1.3%) | 0 (0.0%) |
| 35 to 64 Years | 53 (5.4%) | 25 (2.3%) |
| 65 to 74 Years | 15 (5.5%) | 11 (3.8%) |
| 75 Years and over | 12 (8.3%) | 13 (4.7%) |
Technology Access in Ishpeming
Computing Device Access in Ishpeming
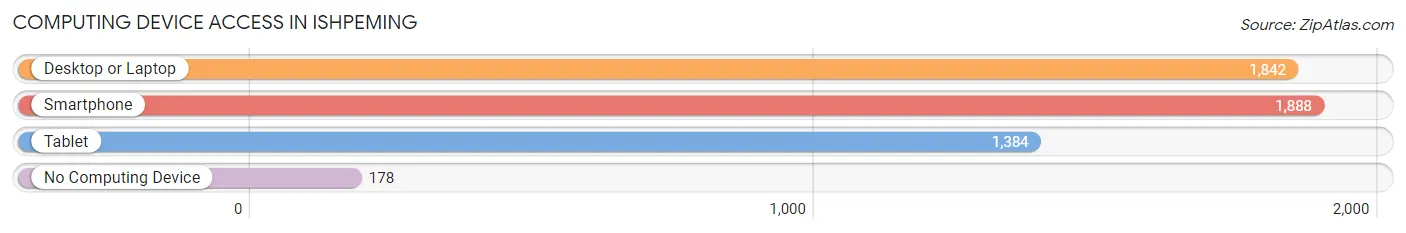
| Device Type | # Households | % Households |
| Desktop or Laptop | 1,842 | 75.5% |
| Smartphone | 1,888 | 77.3% |
| Tablet | 1,384 | 56.7% |
| No Computing Device | 178 | 7.3% |
| Total | 2,441 | 100.0% |
Internet Access in Ishpeming
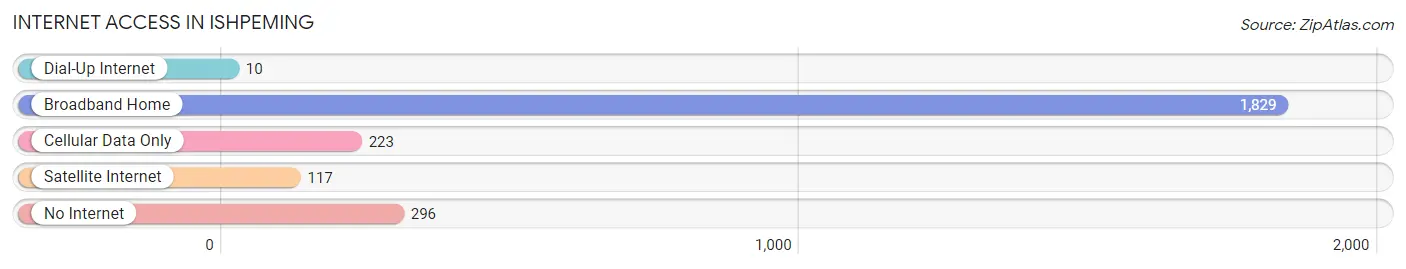
| Internet Type | # Households | % Households |
| Dial-Up Internet | 10 | 0.4% |
| Broadband Home | 1,829 | 74.9% |
| Cellular Data Only | 223 | 9.1% |
| Satellite Internet | 117 | 4.8% |
| No Internet | 296 | 12.1% |
| Total | 2,441 | 100.0% |
Ishpeming Summary
Ishpeming is a city located in the Upper Peninsula of Michigan, United States. It is the county seat of Marquette County and is situated on the northern edge of the Marquette Iron Range. The population was 6,470 at the 2010 census.
History
Ishpeming was founded in 1853 by Jacob H. F. Wilcox, a surveyor for the Jackson Mining Company. The city was named after the Ojibwa word for “on the summit” or “high ground”. The city was incorporated in 1871.
The city was a major center of iron ore mining in the late 19th and early 20th centuries. The Jackson Mine, located just outside of Ishpeming, was one of the most productive iron ore mines in the country. The city was also home to the National Mine, which was the deepest iron ore mine in the world at the time.
Geography
Ishpeming is located at 46°33′N 87°37′W (46.55, -87.62). According to the United States Census Bureau, the city has a total area of 8.2 square miles (21.2 km2), of which 8.1 square miles (21.0 km2) is land and 0.1 square miles (0.2 km2) is water.
The city is located in the Upper Peninsula of Michigan, near the northern edge of the Marquette Iron Range. The city is situated on a ridge of land between two rivers, the Carp River to the east and the Dead River to the west.
Economy
Ishpeming’s economy is largely based on the mining industry. The city is home to several iron ore mines, including the Jackson Mine and the National Mine. The city is also home to several manufacturing companies, including a paper mill and a steel mill.
The city is also home to several tourist attractions, including the National Ski Hall of Fame and the Ishpeming Ski Jumping Complex. The city is also home to several festivals, including the Ishpeming Blueberry Festival and the Ishpeming Music Festival.
Demographics
As of the census of 2010, there were 6,470 people, 2,817 households, and 1,637 families residing in the city. The population density was 797.3 people per square mile (307.9/km2). There were 3,093 housing units at an average density of 381.2 per square mile (147.2/km2). The racial makeup of the city was 95.2% White, 0.7% African American, 0.7% Native American, 0.7% Asian, 0.1% Pacific Islander, 0.7% from other races, and 2.0% from two or more races. Hispanic or Latino of any race were 2.2% of the population.
There were 2,817 households, out of which 25.2% had children under the age of 18 living with them, 39.2% were married couples living together, 13.7% had a female householder with no husband present, and 42.7% were non-families. 36.7% of all households were made up of individuals, and 16.2% had someone living alone who was 65 years of age or older. The average household size was 2.20 and the average family size was 2.86.
In the city, the population was spread out, with 22.2% under the age of 18, 8.2% from 18 to 24, 25.2% from 25 to 44, 24.2% from 45 to 64, and 20.2% who were 65 years of age or older. The median age was 40 years. For every 100 females, there were 91.2 males. For every 100 females age 18 and over, there were 87.3 males.
The median income for a household in the city was $31,944, and the median income for a family was $41,944. Males had a median income of $35,000 versus $25,000 for females. The per capita income for the city was $17,845. About 11.2% of families and 14.2% of the population were below the poverty line, including 19.2% of those under age 18 and 8.2% of those age 65 or over.
Common Questions
What is Per Capita Income in Ishpeming?
Per Capita income in Ishpeming is $26,497.
What is the Median Family Income in Ishpeming?
Median Family Income in Ishpeming is $67,965.
What is the Median Household income in Ishpeming?
Median Household Income in Ishpeming is $53,202.
What is Income or Wage Gap in Ishpeming?
Income or Wage Gap in Ishpeming is 43.0%.
Women in Ishpeming earn 57.0 cents for every dollar earned by a man.
What is Inequality or Gini Index in Ishpeming?
Inequality or Gini Index in Ishpeming is 0.40.
What is the Total Population of Ishpeming?
Total Population of Ishpeming is 6,191.
What is the Total Male Population of Ishpeming?
Total Male Population of Ishpeming is 2,853.
What is the Total Female Population of Ishpeming?
Total Female Population of Ishpeming is 3,338.
What is the Ratio of Males per 100 Females in Ishpeming?
There are 85.47 Males per 100 Females in Ishpeming.
What is the Ratio of Females per 100 Males in Ishpeming?
There are 117.00 Females per 100 Males in Ishpeming.
What is the Median Population Age in Ishpeming?
Median Population Age in Ishpeming is 36.4 Years.
What is the Average Family Size in Ishpeming
Average Family Size in Ishpeming is 3.2 People.
What is the Average Household Size in Ishpeming
Average Household Size in Ishpeming is 2.5 People.
How Large is the Labor Force in Ishpeming?
There are 3,096 People in the Labor Forcein in Ishpeming.
What is the Percentage of People in the Labor Force in Ishpeming?
63.3% of People are in the Labor Force in Ishpeming.
What is the Unemployment Rate in Ishpeming?
Unemployment Rate in Ishpeming is 7.7%.