Coopersville, MI Map & Demographics
Coopersville Map
Coopersville Overview
$26,915
PER CAPITA INCOME
$64,866
AVG FAMILY INCOME
$62,995
AVG HOUSEHOLD INCOME
23.3%
WAGE / INCOME GAP [ % ]
76.7¢/ $1
WAGE / INCOME GAP [ $ ]
0.37
INEQUALITY / GINI INDEX
4,804
TOTAL POPULATION
2,536
MALE POPULATION
2,268
FEMALE POPULATION
111.82
MALES / 100 FEMALES
89.43
FEMALES / 100 MALES
31.2
MEDIAN AGE
3.1
AVG FAMILY SIZE
2.8
AVG HOUSEHOLD SIZE
2,458
LABOR FORCE [ PEOPLE ]
70.1%
PERCENT IN LABOR FORCE
7.5%
UNEMPLOYMENT RATE
Coopersville Zip Codes
Coopersville Area Codes
Income in Coopersville
Income Overview in Coopersville
Per Capita Income in Coopersville is $26,915, while median incomes of families and households are $64,866 and $62,995 respectively.
| Characteristic | Number | Measure |
| Per Capita Income | 4,804 | $26,915 |
| Median Family Income | 1,312 | $64,866 |
| Mean Family Income | 1,312 | $85,961 |
| Median Household Income | 1,712 | $62,995 |
| Mean Household Income | 1,712 | $77,210 |
| Income Deficit | 1,312 | $0 |
| Wage / Income Gap (%) | 4,804 | 23.35% |
| Wage / Income Gap ($) | 4,804 | 76.65¢ per $1 |
| Gini / Inequality Index | 4,804 | 0.37 |
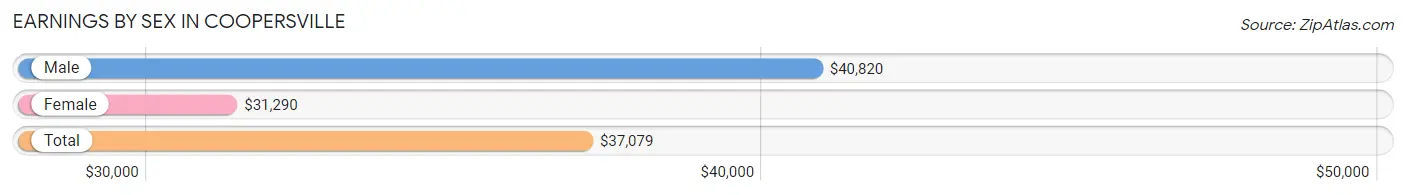
Earnings by Sex in Coopersville
Average Earnings in Coopersville are $37,079, $40,820 for men and $31,290 for women, a difference of 23.4%.
| Sex | Number | Average Earnings |
| Male | 1,342 (52.5%) | $40,820 |
| Female | 1,214 (47.5%) | $31,290 |
| Total | 2,556 (100.0%) | $37,079 |
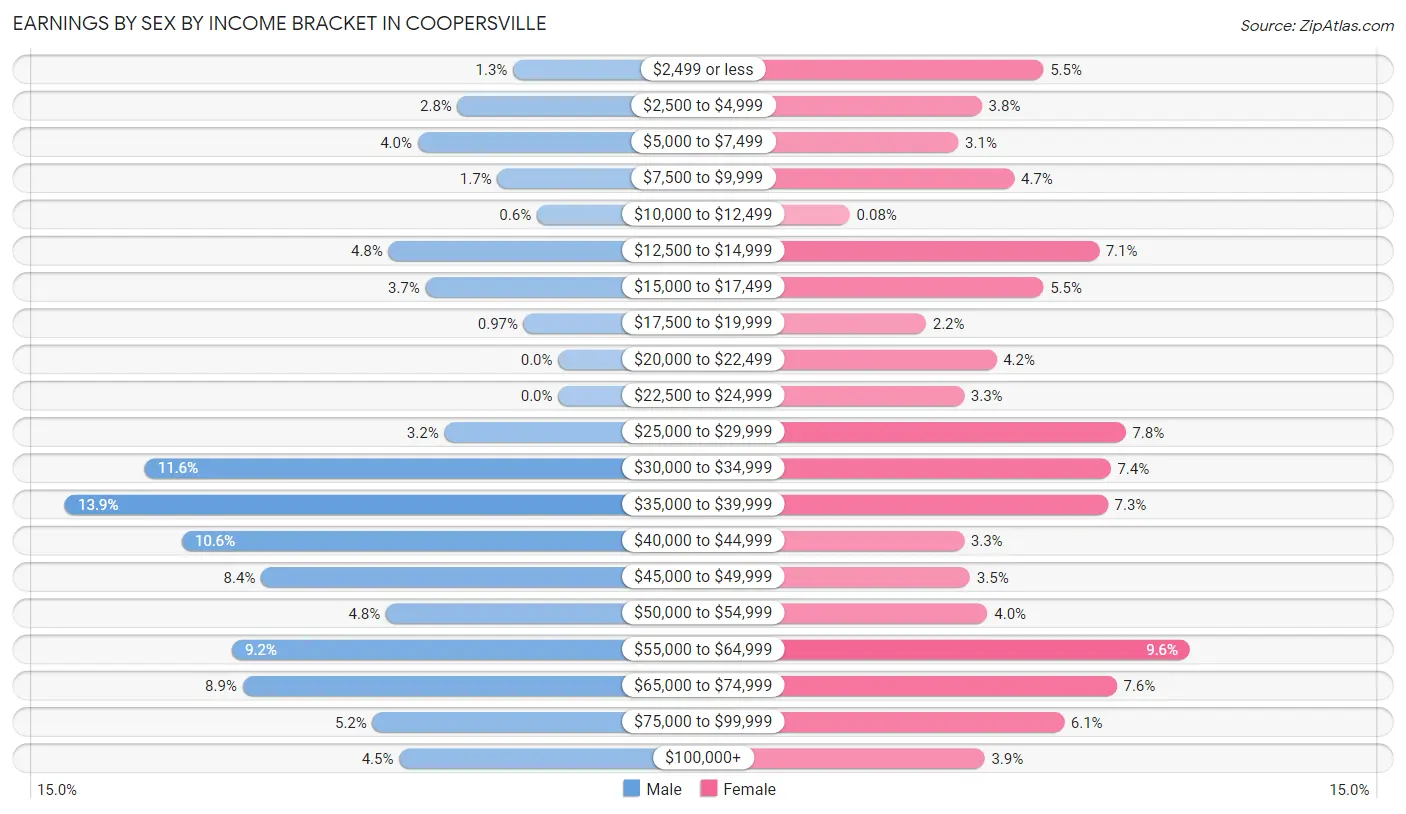
Earnings by Sex by Income Bracket in Coopersville
The most common earnings brackets in Coopersville are $35,000 to $39,999 for men (186 | 13.9%) and $55,000 to $64,999 for women (117 | 9.6%).
| Income | Male | Female |
| $2,499 or less | 17 (1.3%) | 67 (5.5%) |
| $2,500 to $4,999 | 38 (2.8%) | 46 (3.8%) |
| $5,000 to $7,499 | 53 (4.0%) | 38 (3.1%) |
| $7,500 to $9,999 | 23 (1.7%) | 57 (4.7%) |
| $10,000 to $12,499 | 8 (0.6%) | 1 (0.1%) |
| $12,500 to $14,999 | 64 (4.8%) | 86 (7.1%) |
| $15,000 to $17,499 | 50 (3.7%) | 67 (5.5%) |
| $17,500 to $19,999 | 13 (1.0%) | 27 (2.2%) |
| $20,000 to $22,499 | 0 (0.0%) | 51 (4.2%) |
| $22,500 to $24,999 | 0 (0.0%) | 40 (3.3%) |
| $25,000 to $29,999 | 43 (3.2%) | 95 (7.8%) |
| $30,000 to $34,999 | 156 (11.6%) | 90 (7.4%) |
| $35,000 to $39,999 | 186 (13.9%) | 89 (7.3%) |
| $40,000 to $44,999 | 142 (10.6%) | 40 (3.3%) |
| $45,000 to $49,999 | 112 (8.4%) | 42 (3.5%) |
| $50,000 to $54,999 | 65 (4.8%) | 48 (4.0%) |
| $55,000 to $64,999 | 123 (9.2%) | 117 (9.6%) |
| $65,000 to $74,999 | 119 (8.9%) | 92 (7.6%) |
| $75,000 to $99,999 | 70 (5.2%) | 74 (6.1%) |
| $100,000+ | 60 (4.5%) | 47 (3.9%) |
| Total | 1,342 (100.0%) | 1,214 (100.0%) |
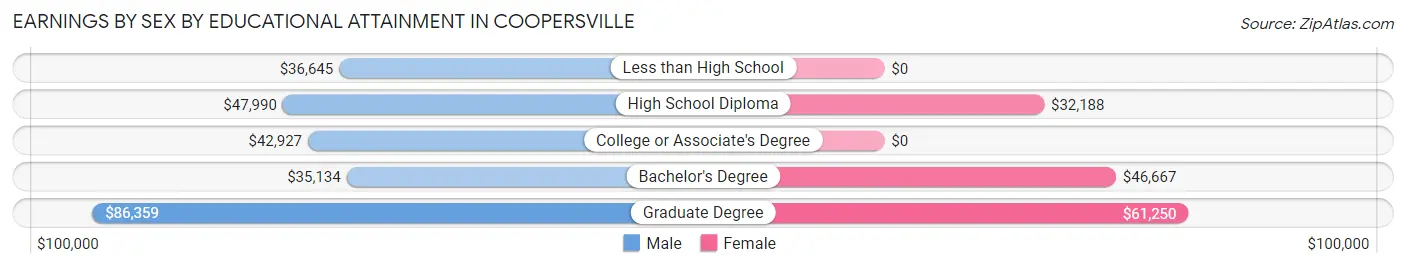
Earnings by Sex by Educational Attainment in Coopersville
Average earnings in Coopersville are $43,339 for men and $34,375 for women, a difference of 20.7%. Men with an educational attainment of graduate degree enjoy the highest average annual earnings of $86,359, while those with bachelor's degree education earn the least with $35,134. Women with an educational attainment of graduate degree earn the most with the average annual earnings of $61,250, while those with high school diploma education have the smallest earnings of $32,188.
| Educational Attainment | Male Income | Female Income |
| Less than High School | $36,645 | $0 |
| High School Diploma | $47,990 | $32,188 |
| College or Associate's Degree | $42,927 | $0 |
| Bachelor's Degree | $35,134 | $46,667 |
| Graduate Degree | $86,359 | $61,250 |
| Total | $43,339 | $34,375 |
Family Income in Coopersville
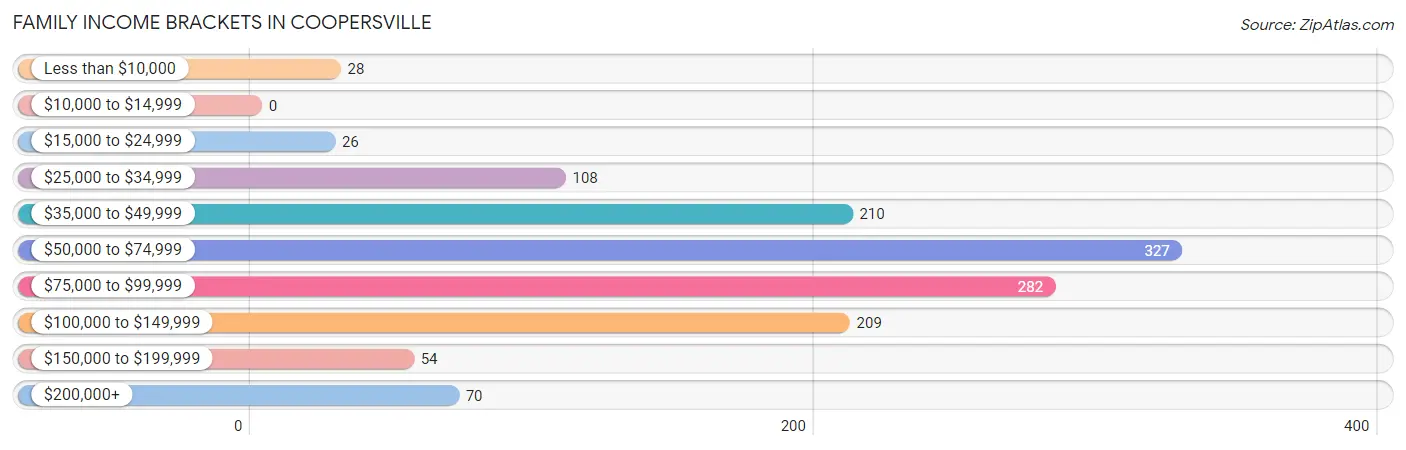
Family Income Brackets in Coopersville
According to the Coopersville family income data, there are 327 families falling into the $50,000 to $74,999 income range, which is the most common income bracket and makes up 24.9% of all families.
| Income Bracket | # Families | % Families |
| Less than $10,000 | 28 | 2.1% |
| $10,000 to $14,999 | 0 | 0.0% |
| $15,000 to $24,999 | 26 | 2.0% |
| $25,000 to $34,999 | 108 | 8.2% |
| $35,000 to $49,999 | 210 | 16.0% |
| $50,000 to $74,999 | 327 | 24.9% |
| $75,000 to $99,999 | 282 | 21.5% |
| $100,000 to $149,999 | 209 | 15.9% |
| $150,000 to $199,999 | 54 | 4.1% |
| $200,000+ | 70 | 5.3% |
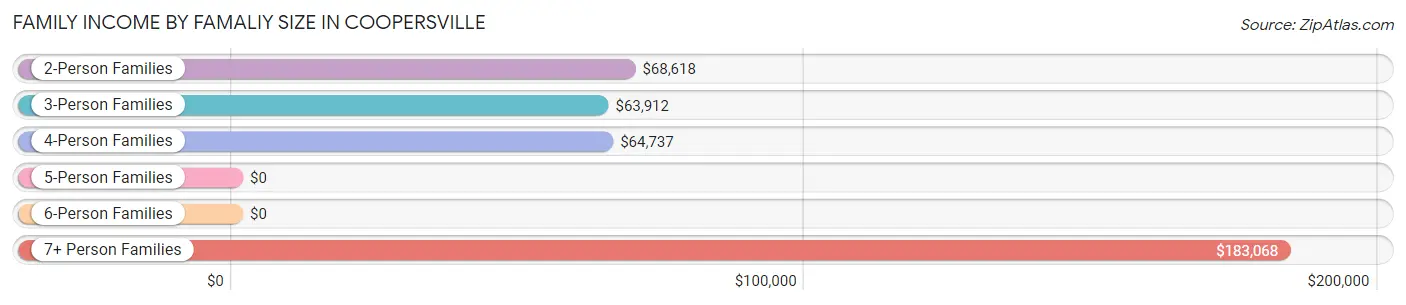
Family Income by Famaliy Size in Coopersville
7+ person families (17 | 1.3%) account for the highest median family income in Coopersville with $183,068 per family, while 2-person families (565 | 43.1%) have the highest median income of $34,309 per family member.
| Income Bracket | # Families | Median Income |
| 2-Person Families | 565 (43.1%) | $68,618 |
| 3-Person Families | 279 (21.3%) | $63,912 |
| 4-Person Families | 258 (19.7%) | $64,737 |
| 5-Person Families | 148 (11.3%) | $0 |
| 6-Person Families | 45 (3.4%) | $0 |
| 7+ Person Families | 17 (1.3%) | $183,068 |
| Total | 1,312 (100.0%) | $64,866 |
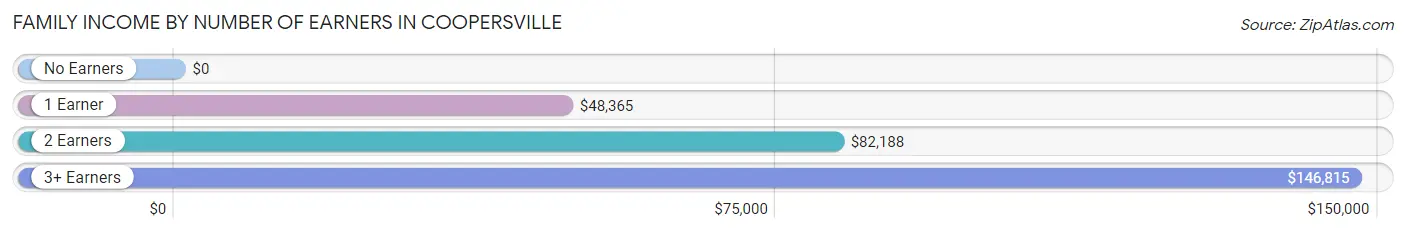
Family Income by Number of Earners in Coopersville
| Number of Earners | # Families | Median Income |
| No Earners | 67 (5.1%) | $0 |
| 1 Earner | 489 (37.3%) | $48,365 |
| 2 Earners | 615 (46.9%) | $82,188 |
| 3+ Earners | 141 (10.7%) | $146,815 |
| Total | 1,312 (100.0%) | $64,866 |
Household Income in Coopersville
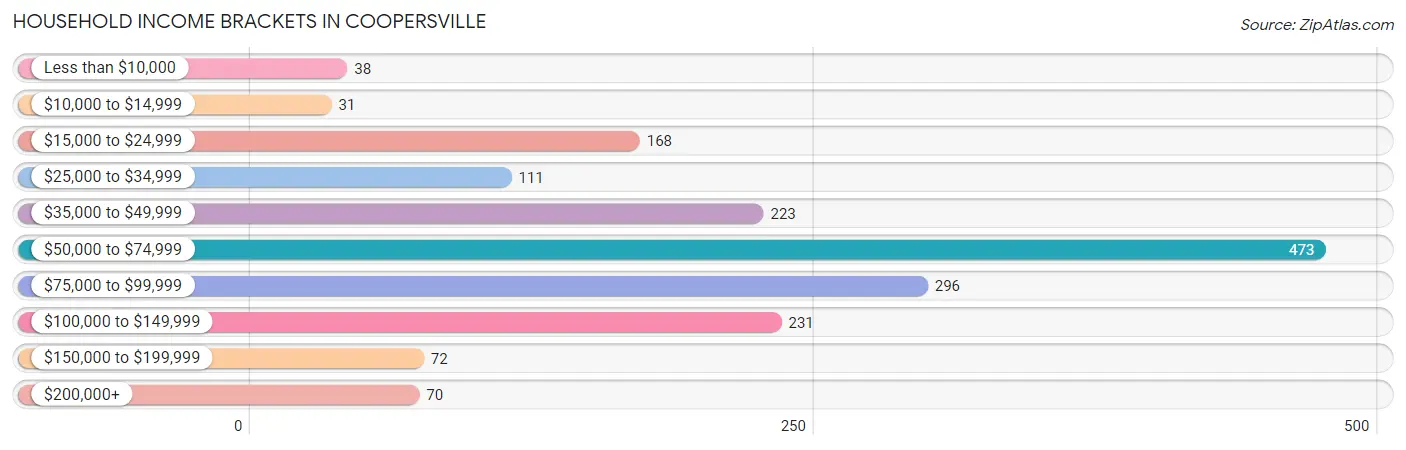
Household Income Brackets in Coopersville
With 473 households falling in the category, the $50,000 to $74,999 income range is the most frequent in Coopersville, accounting for 27.6% of all households. In contrast, only 31 households (1.8%) fall into the $10,000 to $14,999 income bracket, making it the least populous group.
| Income Bracket | # Households | % Households |
| Less than $10,000 | 38 | 2.2% |
| $10,000 to $14,999 | 31 | 1.8% |
| $15,000 to $24,999 | 168 | 9.8% |
| $25,000 to $34,999 | 111 | 6.5% |
| $35,000 to $49,999 | 223 | 13.0% |
| $50,000 to $74,999 | 473 | 27.6% |
| $75,000 to $99,999 | 296 | 17.3% |
| $100,000 to $149,999 | 231 | 13.5% |
| $150,000 to $199,999 | 72 | 4.2% |
| $200,000+ | 70 | 4.1% |
Household Income by Householder Age in Coopersville
The median household income in Coopersville is $62,995, with the highest median household income of $84,375 found in the 45 to 64 years age bracket for the primary householder. A total of 448 households (26.2%) fall into this category. Meanwhile, the 65+ years age bracket for the primary householder has the lowest median household income of $34,492, with 369 households (21.5%) in this group.
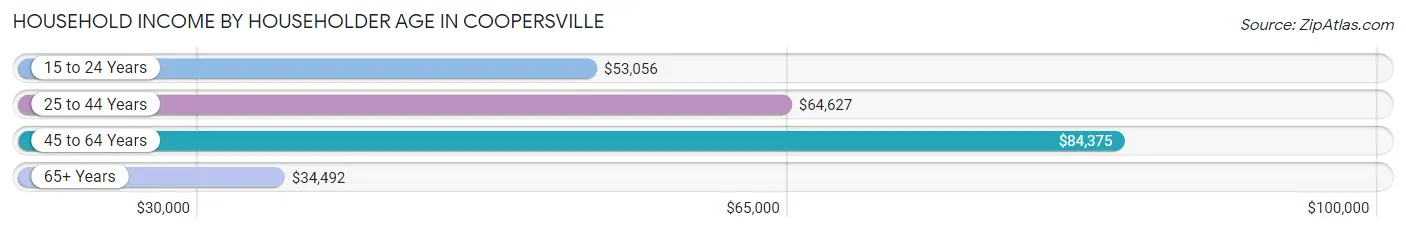
| Income Bracket | # Households | Median Income |
| 15 to 24 Years | 134 (7.8%) | $53,056 |
| 25 to 44 Years | 761 (44.5%) | $64,627 |
| 45 to 64 Years | 448 (26.2%) | $84,375 |
| 65+ Years | 369 (21.5%) | $34,492 |
| Total | 1,712 (100.0%) | $62,995 |
Poverty in Coopersville
Income Below Poverty by Sex and Age in Coopersville
With 4.0% poverty level for males and 4.8% for females among the residents of Coopersville, 35 to 44 year old males and 75 year old and over females are the most vulnerable to poverty, with 49 males (15.4%) and 36 females (18.8%) in their respective age groups living below the poverty level.
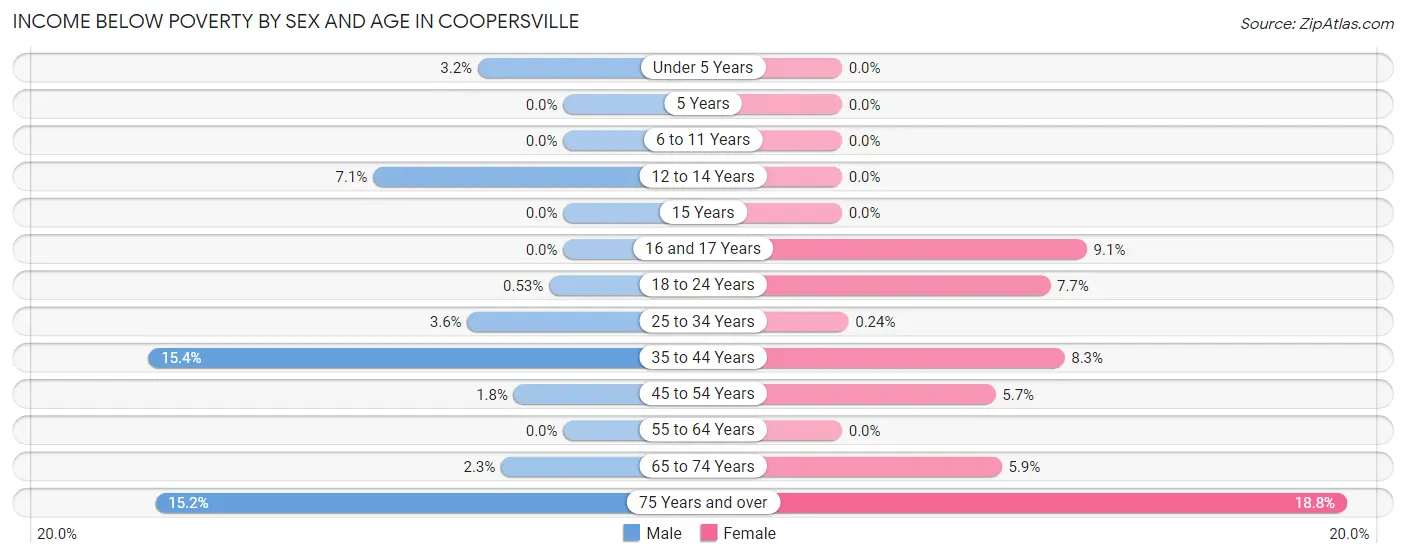
| Age Bracket | Male | Female |
| Under 5 Years | 10 (3.2%) | 0 (0.0%) |
| 5 Years | 0 (0.0%) | 0 (0.0%) |
| 6 to 11 Years | 0 (0.0%) | 0 (0.0%) |
| 12 to 14 Years | 6 (7.1%) | 0 (0.0%) |
| 15 Years | 0 (0.0%) | 0 (0.0%) |
| 16 and 17 Years | 0 (0.0%) | 5 (9.1%) |
| 18 to 24 Years | 1 (0.5%) | 16 (7.7%) |
| 25 to 34 Years | 16 (3.6%) | 1 (0.2%) |
| 35 to 44 Years | 49 (15.4%) | 28 (8.3%) |
| 45 to 54 Years | 5 (1.8%) | 15 (5.7%) |
| 55 to 64 Years | 0 (0.0%) | 0 (0.0%) |
| 65 to 74 Years | 3 (2.3%) | 8 (5.9%) |
| 75 Years and over | 10 (15.1%) | 36 (18.8%) |
| Total | 100 (4.0%) | 109 (4.8%) |
Income Above Poverty by Sex and Age in Coopersville
According to the poverty statistics in Coopersville, males aged 5 years and females aged under 5 years are the age groups that are most secure financially, with 100.0% of males and 100.0% of females in these age groups living above the poverty line.
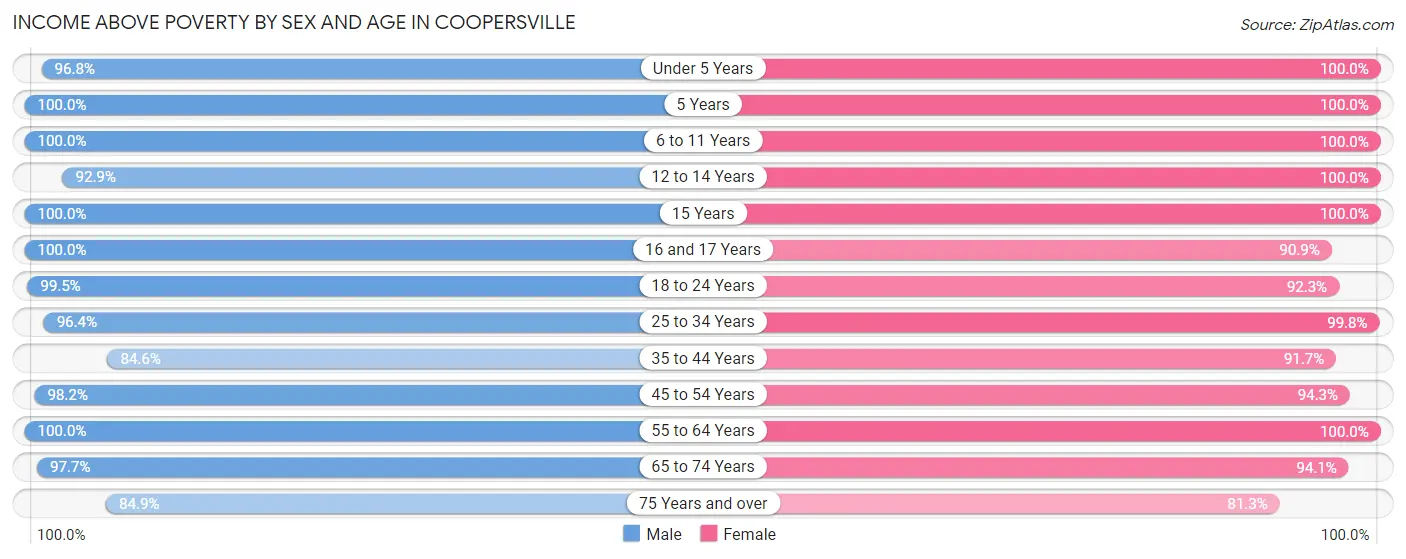
| Age Bracket | Male | Female |
| Under 5 Years | 305 (96.8%) | 129 (100.0%) |
| 5 Years | 65 (100.0%) | 3 (100.0%) |
| 6 to 11 Years | 314 (100.0%) | 199 (100.0%) |
| 12 to 14 Years | 79 (92.9%) | 106 (100.0%) |
| 15 Years | 54 (100.0%) | 18 (100.0%) |
| 16 and 17 Years | 73 (100.0%) | 50 (90.9%) |
| 18 to 24 Years | 188 (99.5%) | 191 (92.3%) |
| 25 to 34 Years | 434 (96.4%) | 422 (99.8%) |
| 35 to 44 Years | 269 (84.6%) | 311 (91.7%) |
| 45 to 54 Years | 267 (98.2%) | 248 (94.3%) |
| 55 to 64 Years | 200 (100.0%) | 182 (100.0%) |
| 65 to 74 Years | 127 (97.7%) | 127 (94.1%) |
| 75 Years and over | 56 (84.9%) | 156 (81.2%) |
| Total | 2,431 (96.1%) | 2,142 (95.2%) |
Income Below Poverty Among Married-Couple Families in Coopersville
The poverty statistics for married-couple families in Coopersville show that 1.5% or 14 of the total 928 families live below the poverty line. Families with 1 or 2 children have the highest poverty rate of 3.3%, comprising of 14 families. On the other hand, families with no children have the lowest poverty rate of 0.0%, which includes 0 families.
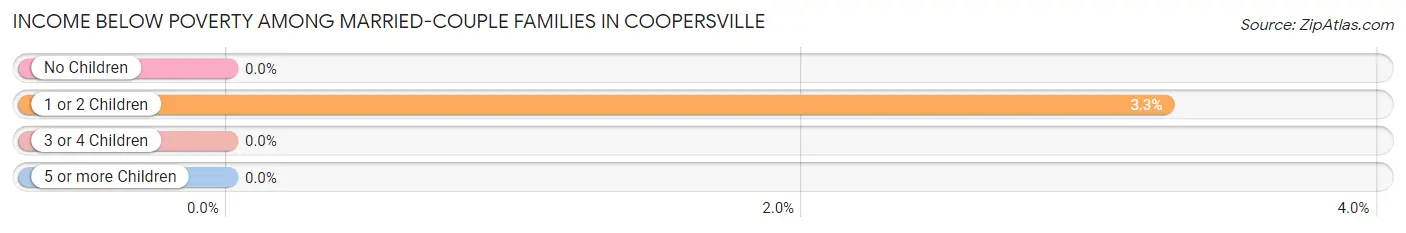
| Children | Above Poverty | Below Poverty |
| No Children | 420 (100.0%) | 0 (0.0%) |
| 1 or 2 Children | 415 (96.7%) | 14 (3.3%) |
| 3 or 4 Children | 73 (100.0%) | 0 (0.0%) |
| 5 or more Children | 6 (100.0%) | 0 (0.0%) |
| Total | 914 (98.5%) | 14 (1.5%) |
Income Below Poverty Among Single-Parent Households in Coopersville
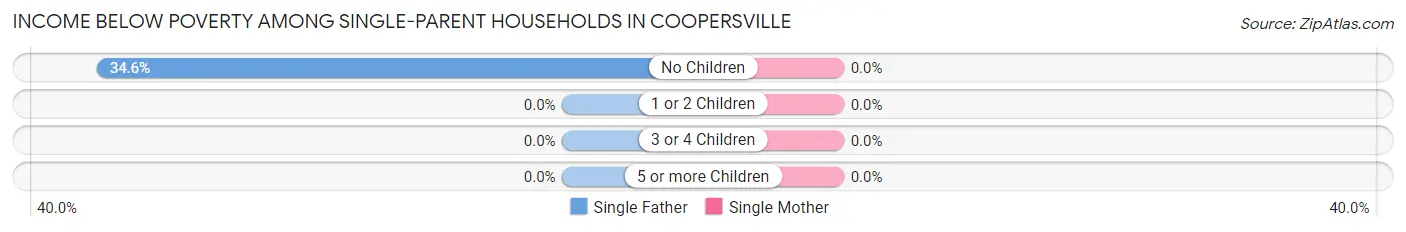
| Children | Single Father | Single Mother |
| No Children | 27 (34.6%) | 0 (0.0%) |
| 1 or 2 Children | 0 (0.0%) | 0 (0.0%) |
| 3 or 4 Children | 0 (0.0%) | 0 (0.0%) |
| 5 or more Children | 0 (0.0%) | 0 (0.0%) |
| Total | 27 (16.2%) | 0 (0.0%) |
Income Below Poverty Among Married-Couple vs Single-Parent Households in Coopersville
The poverty data for Coopersville shows that 14 of the married-couple family households (1.5%) and 27 of the single-parent households (7.0%) are living below the poverty level. Within the married-couple family households, those with 1 or 2 children have the highest poverty rate, with 14 households (3.3%) falling below the poverty line. Among the single-parent households, those with no children have the highest poverty rate, with 27 household (20.6%) living below poverty.
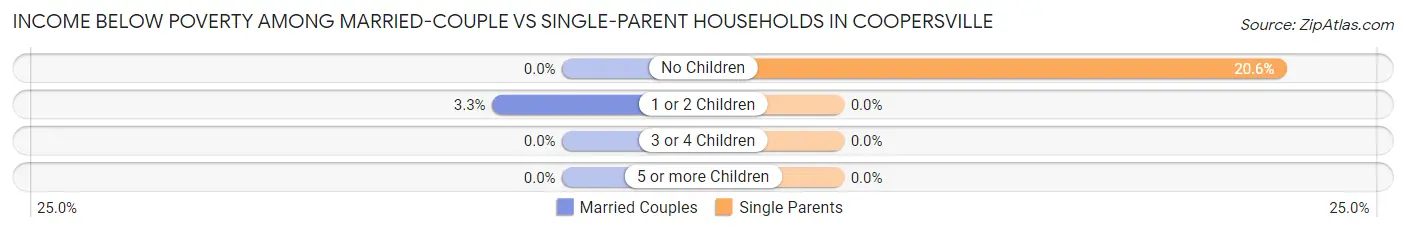
| Children | Married-Couple Families | Single-Parent Households |
| No Children | 0 (0.0%) | 27 (20.6%) |
| 1 or 2 Children | 14 (3.3%) | 0 (0.0%) |
| 3 or 4 Children | 0 (0.0%) | 0 (0.0%) |
| 5 or more Children | 0 (0.0%) | 0 (0.0%) |
| Total | 14 (1.5%) | 27 (7.0%) |
Race in Coopersville
The most populous races in Coopersville are White / Caucasian (4,355 | 90.6%), Two or more Races (391 | 8.1%), and Hispanic or Latino (205 | 4.3%).
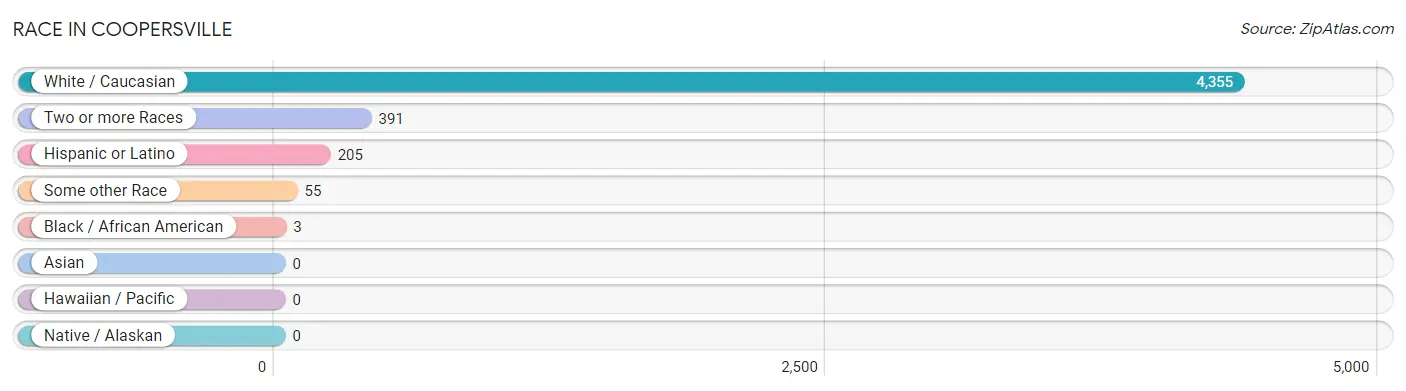
| Race | # Population | % Population |
| Asian | 0 | 0.0% |
| Black / African American | 3 | 0.1% |
| Hawaiian / Pacific | 0 | 0.0% |
| Hispanic or Latino | 205 | 4.3% |
| Native / Alaskan | 0 | 0.0% |
| White / Caucasian | 4,355 | 90.6% |
| Two or more Races | 391 | 8.1% |
| Some other Race | 55 | 1.1% |
| Total | 4,804 | 100.0% |
Ancestry in Coopersville
The most populous ancestries reported in Coopersville are German (1,485 | 30.9%), Dutch (999 | 20.8%), Polish (697 | 14.5%), English (628 | 13.1%), and Irish (363 | 7.6%), together accounting for 86.9% of all Coopersville residents.
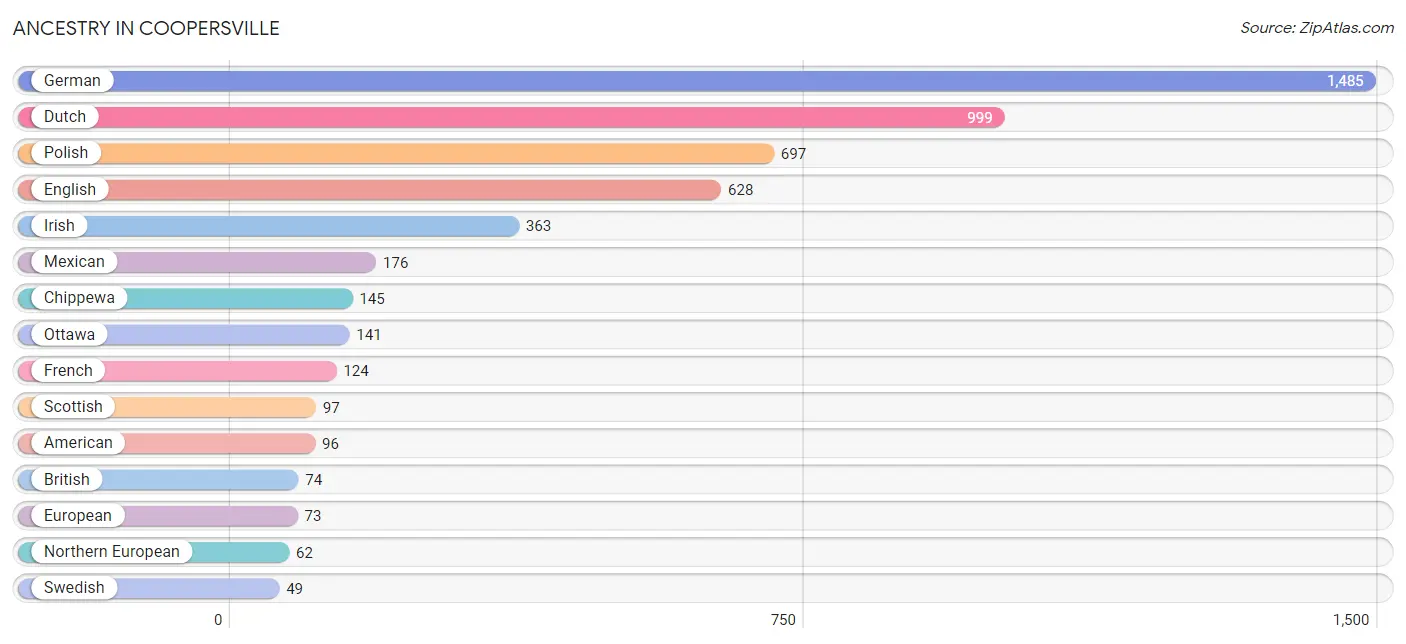
| Ancestry | # Population | % Population |
| American | 96 | 2.0% |
| Austrian | 14 | 0.3% |
| British | 74 | 1.5% |
| Cherokee | 6 | 0.1% |
| Chilean | 21 | 0.4% |
| Chippewa | 145 | 3.0% |
| Czech | 10 | 0.2% |
| Danish | 33 | 0.7% |
| Dutch | 999 | 20.8% |
| Eastern European | 4 | 0.1% |
| English | 628 | 13.1% |
| European | 73 | 1.5% |
| Finnish | 17 | 0.4% |
| French | 124 | 2.6% |
| French American Indian | 6 | 0.1% |
| French Canadian | 36 | 0.7% |
| German | 1,485 | 30.9% |
| Hungarian | 7 | 0.2% |
| Iranian | 4 | 0.1% |
| Irish | 363 | 7.6% |
| Italian | 25 | 0.5% |
| Jamaican | 1 | 0.0% |
| Lithuanian | 14 | 0.3% |
| Mexican | 176 | 3.7% |
| Northern European | 62 | 1.3% |
| Norwegian | 25 | 0.5% |
| Ottawa | 141 | 2.9% |
| Polish | 697 | 14.5% |
| Potawatomi | 39 | 0.8% |
| Puerto Rican | 4 | 0.1% |
| Russian | 18 | 0.4% |
| Scandinavian | 12 | 0.3% |
| Scotch-Irish | 22 | 0.5% |
| Scottish | 97 | 2.0% |
| South American | 21 | 0.4% |
| Spanish | 4 | 0.1% |
| Swedish | 49 | 1.0% |
| Swiss | 21 | 0.4% | View All 38 Rows |
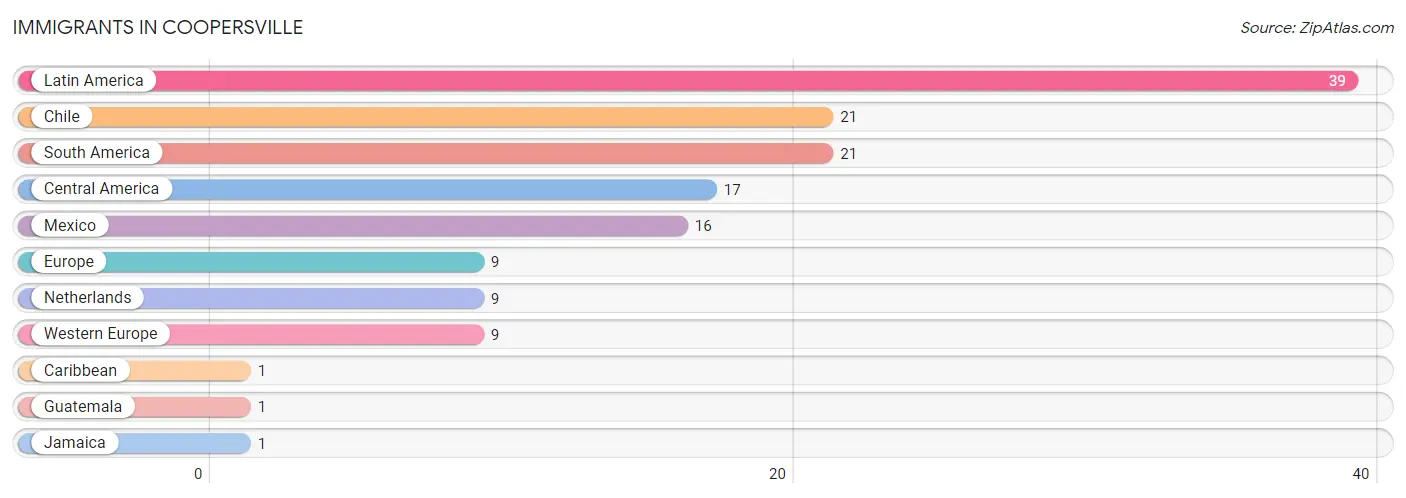
Immigrants in Coopersville
The most numerous immigrant groups reported in Coopersville came from Latin America (39 | 0.8%), Chile (21 | 0.4%), South America (21 | 0.4%), Central America (17 | 0.4%), and Mexico (16 | 0.3%), together accounting for 2.4% of all Coopersville residents.
| Immigration Origin | # Population | % Population |
| Caribbean | 1 | 0.0% |
| Central America | 17 | 0.4% |
| Chile | 21 | 0.4% |
| Europe | 9 | 0.2% |
| Guatemala | 1 | 0.0% |
| Jamaica | 1 | 0.0% |
| Latin America | 39 | 0.8% |
| Mexico | 16 | 0.3% |
| Netherlands | 9 | 0.2% |
| South America | 21 | 0.4% |
| Western Europe | 9 | 0.2% | View All 11 Rows |
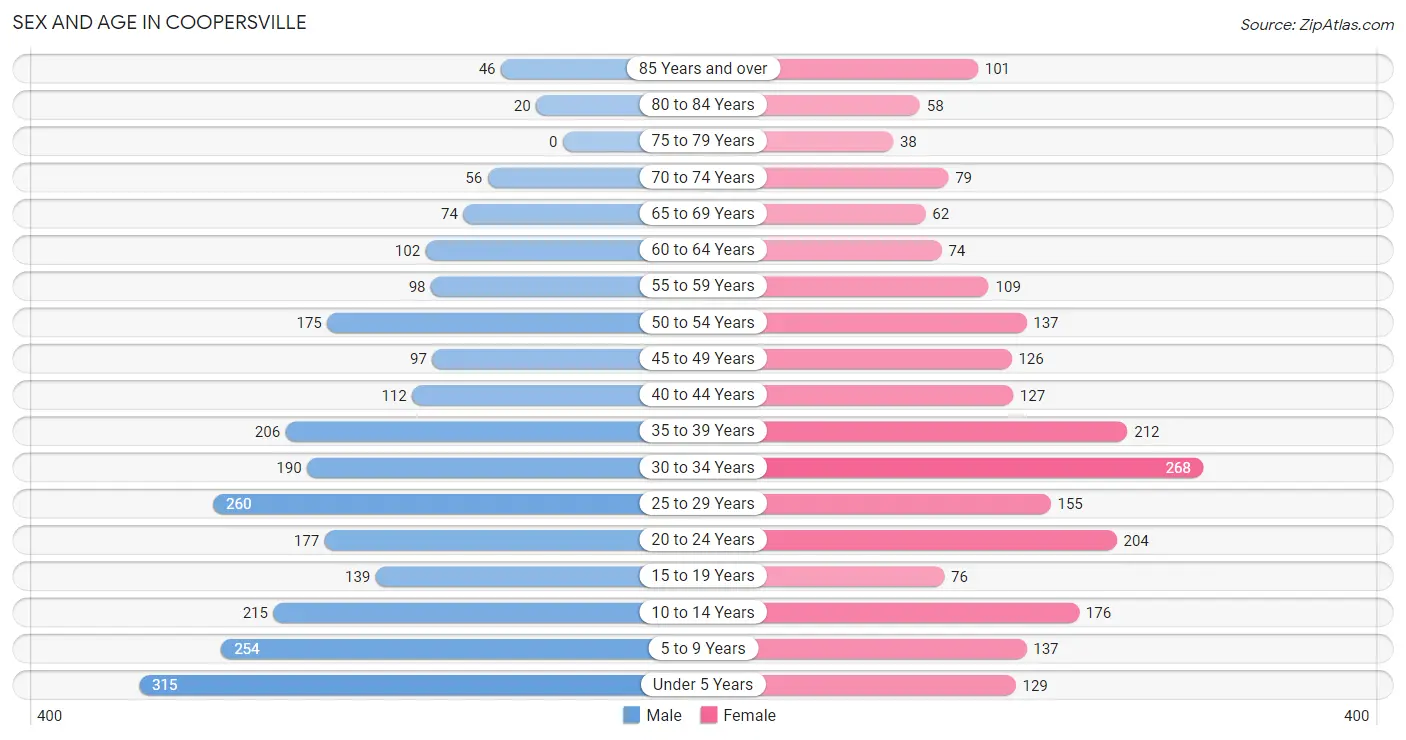
Sex and Age in Coopersville
Sex and Age in Coopersville
The most populous age groups in Coopersville are Under 5 Years (315 | 12.4%) for men and 30 to 34 Years (268 | 11.8%) for women.
| Age Bracket | Male | Female |
| Under 5 Years | 315 (12.4%) | 129 (5.7%) |
| 5 to 9 Years | 254 (10.0%) | 137 (6.0%) |
| 10 to 14 Years | 215 (8.5%) | 176 (7.8%) |
| 15 to 19 Years | 139 (5.5%) | 76 (3.4%) |
| 20 to 24 Years | 177 (7.0%) | 204 (9.0%) |
| 25 to 29 Years | 260 (10.2%) | 155 (6.8%) |
| 30 to 34 Years | 190 (7.5%) | 268 (11.8%) |
| 35 to 39 Years | 206 (8.1%) | 212 (9.3%) |
| 40 to 44 Years | 112 (4.4%) | 127 (5.6%) |
| 45 to 49 Years | 97 (3.8%) | 126 (5.6%) |
| 50 to 54 Years | 175 (6.9%) | 137 (6.0%) |
| 55 to 59 Years | 98 (3.9%) | 109 (4.8%) |
| 60 to 64 Years | 102 (4.0%) | 74 (3.3%) |
| 65 to 69 Years | 74 (2.9%) | 62 (2.7%) |
| 70 to 74 Years | 56 (2.2%) | 79 (3.5%) |
| 75 to 79 Years | 0 (0.0%) | 38 (1.7%) |
| 80 to 84 Years | 20 (0.8%) | 58 (2.6%) |
| 85 Years and over | 46 (1.8%) | 101 (4.4%) |
| Total | 2,536 (100.0%) | 2,268 (100.0%) |
Families and Households in Coopersville
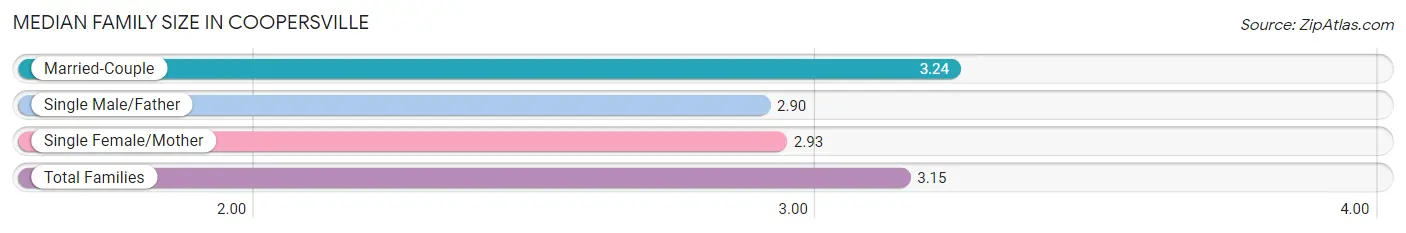
Median Family Size in Coopersville
The median family size in Coopersville is 3.15 persons per family, with married-couple families (928 | 70.7%) accounting for the largest median family size of 3.24 persons per family. On the other hand, single male/father families (167 | 12.7%) represent the smallest median family size with 2.90 persons per family.
| Family Type | # Families | Family Size |
| Married-Couple | 928 (70.7%) | 3.24 |
| Single Male/Father | 167 (12.7%) | 2.90 |
| Single Female/Mother | 217 (16.5%) | 2.93 |
| Total Families | 1,312 (100.0%) | 3.15 |
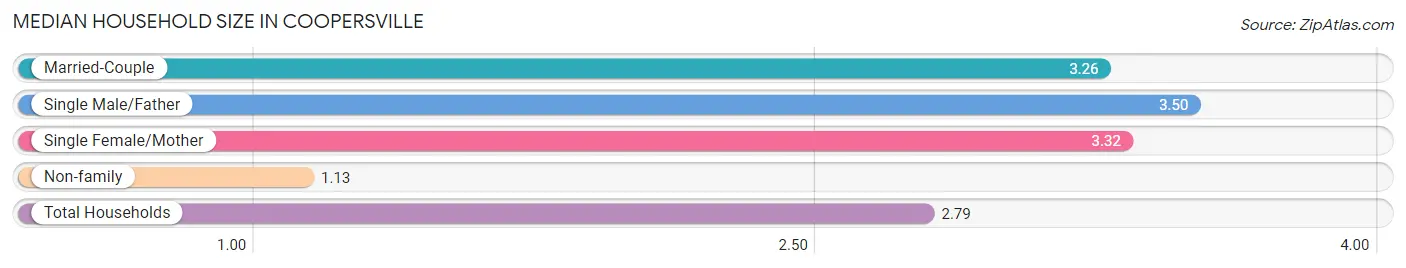
Median Household Size in Coopersville
The median household size in Coopersville is 2.79 persons per household, with single male/father households (167 | 9.8%) accounting for the largest median household size of 3.5 persons per household. non-family households (400 | 23.4%) represent the smallest median household size with 1.13 persons per household.
| Household Type | # Households | Household Size |
| Married-Couple | 928 (54.2%) | 3.26 |
| Single Male/Father | 167 (9.8%) | 3.50 |
| Single Female/Mother | 217 (12.7%) | 3.32 |
| Non-family | 400 (23.4%) | 1.13 |
| Total Households | 1,712 (100.0%) | 2.79 |
Household Size by Marriage Status in Coopersville
Out of a total of 1,712 households in Coopersville, 1,312 (76.6%) are family households, while 400 (23.4%) are nonfamily households. The most numerous type of family households are 2-person households, comprising 465, and the most common type of nonfamily households are 1-person households, comprising 332.
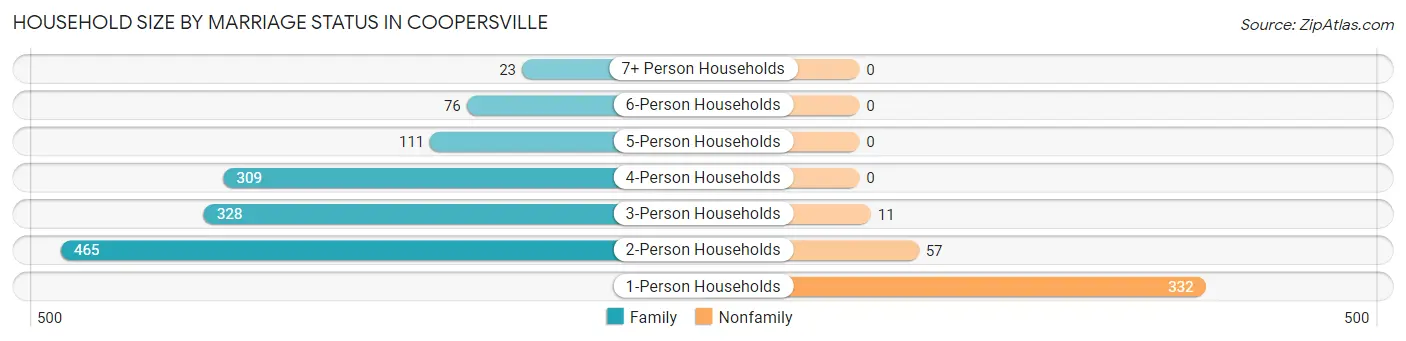
| Household Size | Family Households | Nonfamily Households |
| 1-Person Households | - | 332 (19.4%) |
| 2-Person Households | 465 (27.2%) | 57 (3.3%) |
| 3-Person Households | 328 (19.2%) | 11 (0.6%) |
| 4-Person Households | 309 (18.0%) | 0 (0.0%) |
| 5-Person Households | 111 (6.5%) | 0 (0.0%) |
| 6-Person Households | 76 (4.4%) | 0 (0.0%) |
| 7+ Person Households | 23 (1.3%) | 0 (0.0%) |
| Total | 1,312 (76.6%) | 400 (23.4%) |
Female Fertility in Coopersville
Fertility by Age in Coopersville
Average fertility rate in Coopersville is 79.0 births per 1,000 women. Women in the age bracket of 20 to 34 years have the highest fertility rate with 148.0 births per 1,000 women. Women in the age bracket of 20 to 34 years acount for 100.0% of all women with births.
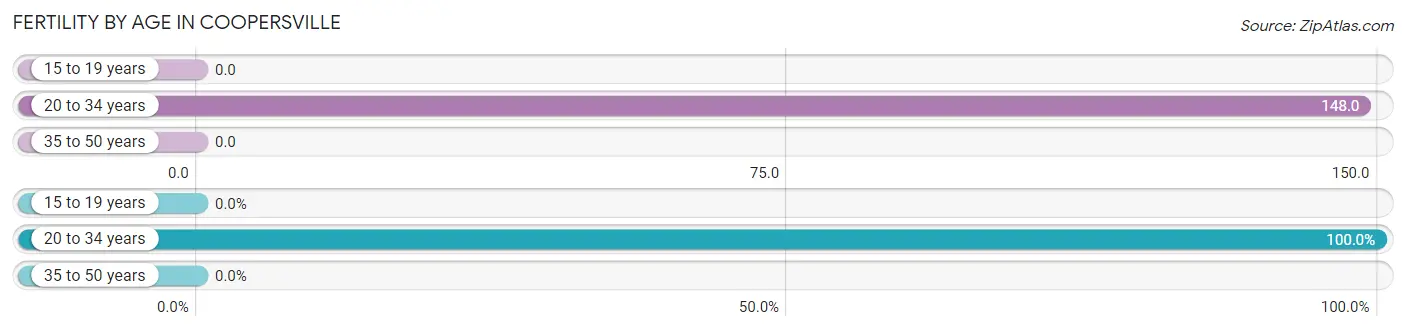
| Age Bracket | Women with Births | Births / 1,000 Women |
| 15 to 19 years | 0 (0.0%) | 0.0 |
| 20 to 34 years | 93 (100.0%) | 148.0 |
| 35 to 50 years | 0 (0.0%) | 0.0 |
| Total | 93 (100.0%) | 79.0 |
Fertility by Age by Marriage Status in Coopersville
77.4% of women with births (93) in Coopersville are married. The highest percentage of unmarried women with births falls into 20 to 34 years age bracket with 22.6% of them unmarried at the time of birth, while the lowest percentage of unmarried women with births belong to 20 to 34 years age bracket with 22.6% of them unmarried.
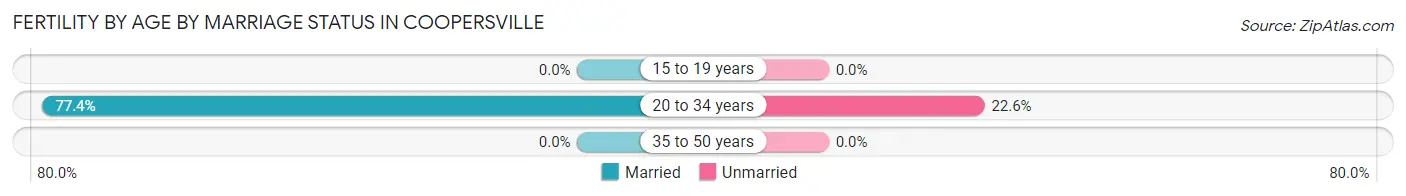
| Age Bracket | Married | Unmarried |
| 15 to 19 years | 0 (0.0%) | 0 (0.0%) |
| 20 to 34 years | 72 (77.4%) | 21 (22.6%) |
| 35 to 50 years | 0 (0.0%) | 0 (0.0%) |
| Total | 72 (77.4%) | 21 (22.6%) |
Fertility by Education in Coopersville
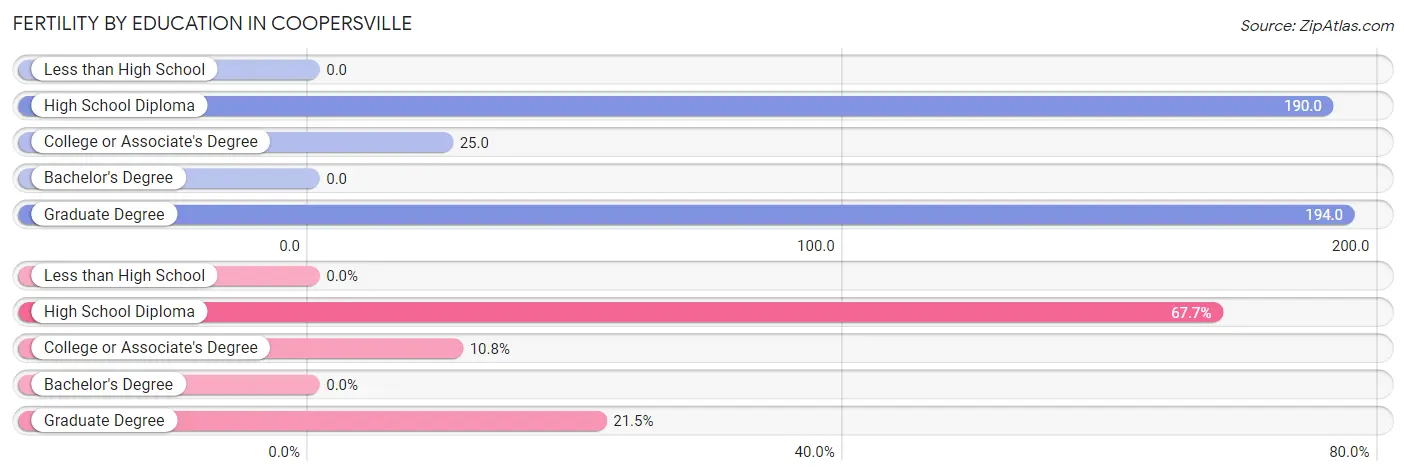
| Educational Attainment | Women with Births | Births / 1,000 Women |
| Less than High School | 0 (0.0%) | 0.0 |
| High School Diploma | 63 (67.7%) | 190.0 |
| College or Associate's Degree | 10 (10.7%) | 25.0 |
| Bachelor's Degree | 0 (0.0%) | 0.0 |
| Graduate Degree | 20 (21.5%) | 194.0 |
| Total | 93 (100.0%) | 79.0 |
Fertility by Education by Marriage Status in Coopersville
22.6% of women with births in Coopersville are unmarried. Women with the educational attainment of college or associate's degree are most likely to be married with 100.0% of them married at childbirth, while women with the educational attainment of high school diploma are least likely to be married with 33.3% of them unmarried at childbirth.
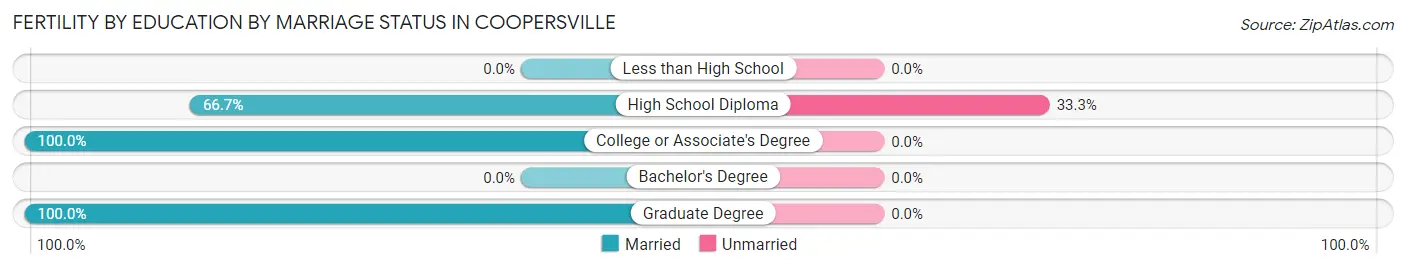
| Educational Attainment | Married | Unmarried |
| Less than High School | 0 (0.0%) | 0 (0.0%) |
| High School Diploma | 42 (66.7%) | 21 (33.3%) |
| College or Associate's Degree | 10 (100.0%) | 0 (0.0%) |
| Bachelor's Degree | 0 (0.0%) | 0 (0.0%) |
| Graduate Degree | 20 (100.0%) | 0 (0.0%) |
| Total | 72 (77.4%) | 21 (22.6%) |
Employment Characteristics in Coopersville
Employment by Class of Employer in Coopersville
Among the 2,192 employed individuals in Coopersville, private company employees (1,605 | 73.2%), not-for-profit organizations (233 | 10.6%), and self-employed (not incorporated) (116 | 5.3%) make up the most common classes of employment.
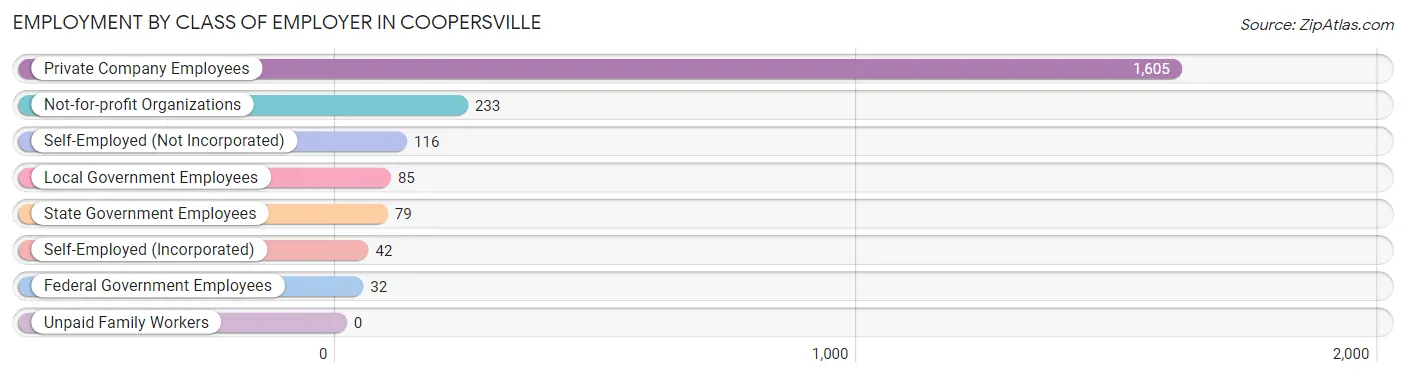
| Employer Class | # Employees | % Employees |
| Private Company Employees | 1,605 | 73.2% |
| Self-Employed (Incorporated) | 42 | 1.9% |
| Self-Employed (Not Incorporated) | 116 | 5.3% |
| Not-for-profit Organizations | 233 | 10.6% |
| Local Government Employees | 85 | 3.9% |
| State Government Employees | 79 | 3.6% |
| Federal Government Employees | 32 | 1.5% |
| Unpaid Family Workers | 0 | 0.0% |
| Total | 2,192 | 100.0% |
Employment Status by Age in Coopersville
According to the labor force statistics for Coopersville, out of the total population over 16 years of age (3,506), 70.1% or 2,458 individuals are in the labor force, with 7.5% or 184 of them unemployed. The age group with the highest labor force participation rate is 25 to 29 years, with 97.1% or 403 individuals in the labor force. Within the labor force, the 16 to 19 years age range has the highest percentage of unemployed individuals, with 20.5% or 9 of them being unemployed.
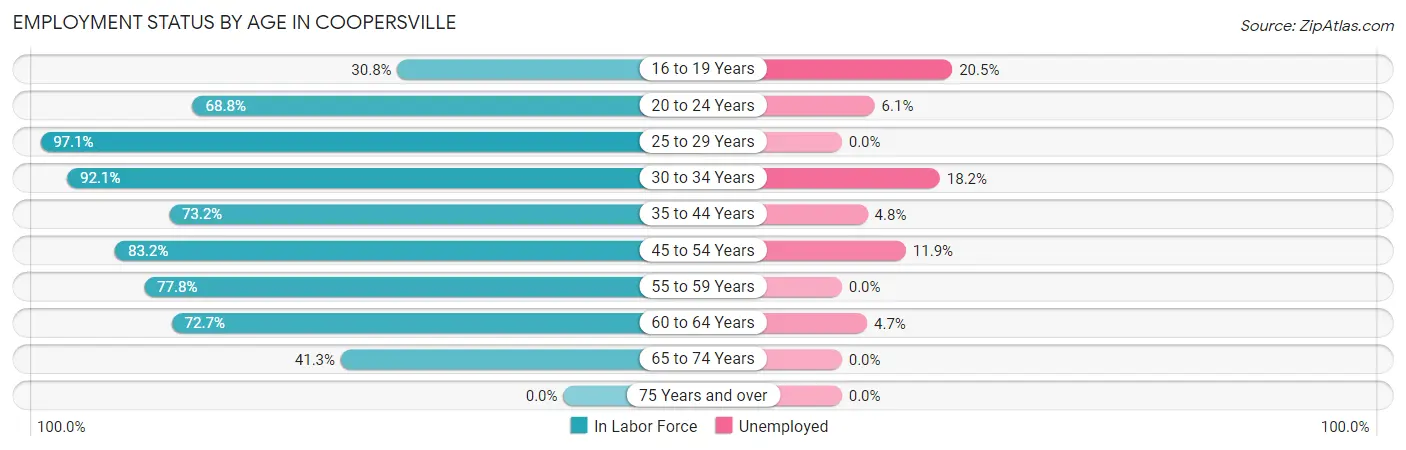
| Age Bracket | In Labor Force | Unemployed |
| 16 to 19 Years | 44 (30.8%) | 9 (20.5%) |
| 20 to 24 Years | 262 (68.8%) | 16 (6.1%) |
| 25 to 29 Years | 403 (97.1%) | 0 (0.0%) |
| 30 to 34 Years | 422 (92.1%) | 77 (18.2%) |
| 35 to 44 Years | 481 (73.2%) | 23 (4.8%) |
| 45 to 54 Years | 445 (83.2%) | 53 (11.9%) |
| 55 to 59 Years | 161 (77.8%) | 0 (0.0%) |
| 60 to 64 Years | 128 (72.7%) | 6 (4.7%) |
| 65 to 74 Years | 112 (41.3%) | 0 (0.0%) |
| 75 Years and over | 0 (0.0%) | 0 (0.0%) |
| Total | 2,458 (70.1%) | 184 (7.5%) |
Employment Status by Educational Attainment in Coopersville
According to labor force statistics for Coopersville, 83.3% of individuals (2,039) out of the total population between 25 and 64 years of age (2,448) are in the labor force, with 7.8% or 159 of them being unemployed. The group with the highest labor force participation rate are those with the educational attainment of bachelor's degree or higher, with 96.5% or 601 individuals in the labor force. Within the labor force, individuals with high school diploma education have the highest percentage of unemployment, with 19.0% or 121 of them being unemployed.
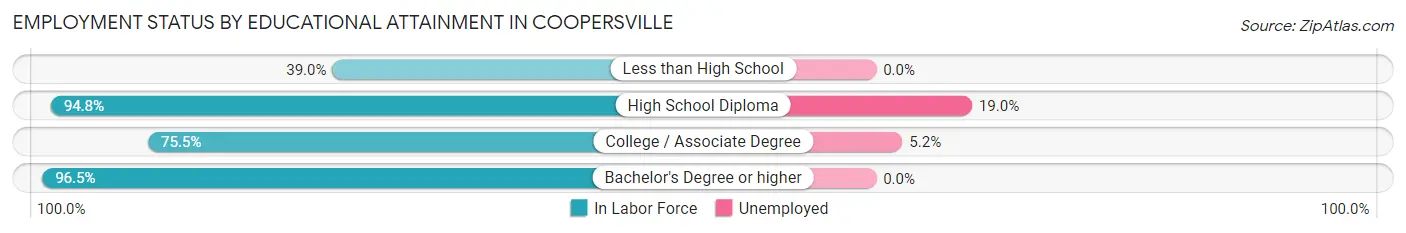
| Educational Attainment | In Labor Force | Unemployed |
| Less than High School | 73 (39.0%) | 0 (0.0%) |
| High School Diploma | 637 (94.8%) | 128 (19.0%) |
| College / Associate Degree | 729 (75.5%) | 50 (5.2%) |
| Bachelor's Degree or higher | 601 (96.5%) | 0 (0.0%) |
| Total | 2,039 (83.3%) | 191 (7.8%) |
Employment Occupations by Sex in Coopersville
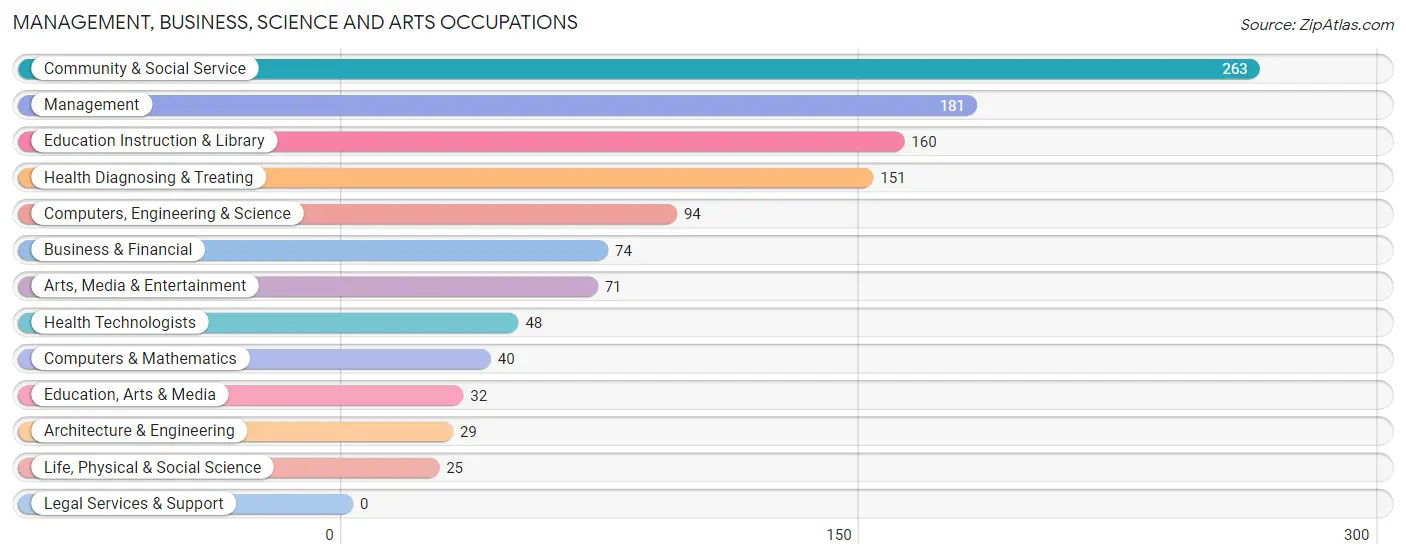
Management, Business, Science and Arts Occupations
The most common Management, Business, Science and Arts occupations in Coopersville are Community & Social Service (263 | 11.6%), Management (181 | 8.0%), Education Instruction & Library (160 | 7.0%), Health Diagnosing & Treating (151 | 6.6%), and Computers, Engineering & Science (94 | 4.1%).
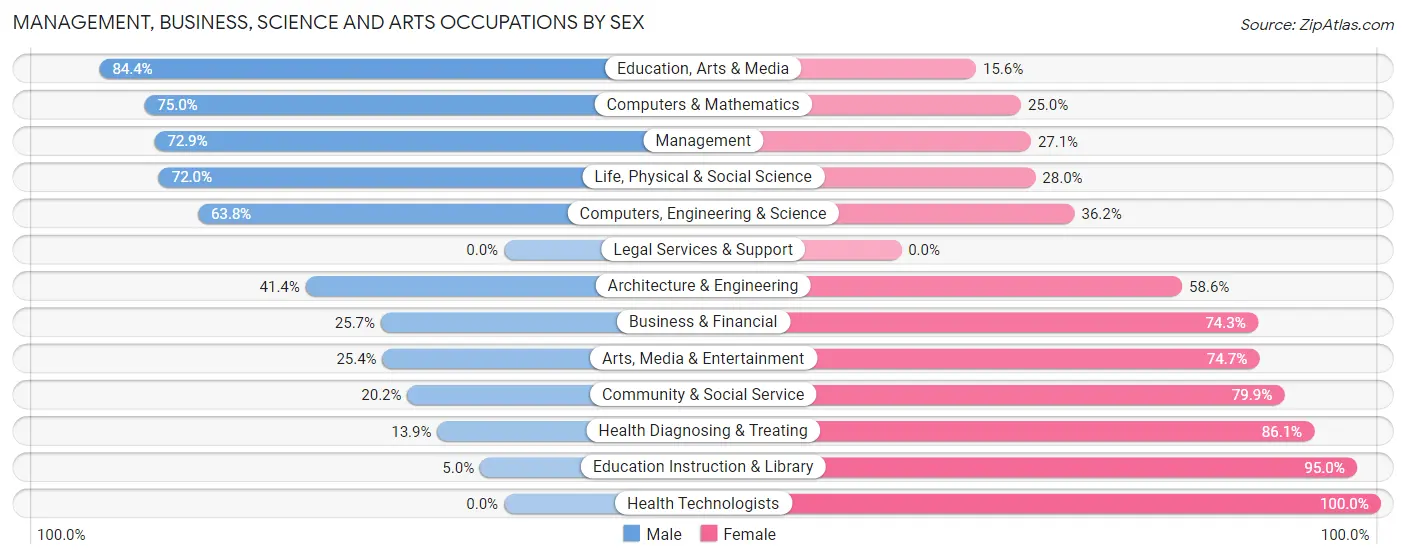
Management, Business, Science and Arts Occupations by Sex
Within the Management, Business, Science and Arts occupations in Coopersville, the most male-oriented occupations are Education, Arts & Media (84.4%), Computers & Mathematics (75.0%), and Management (72.9%), while the most female-oriented occupations are Health Technologists (100.0%), Education Instruction & Library (95.0%), and Health Diagnosing & Treating (86.1%).
| Occupation | Male | Female |
| Management | 132 (72.9%) | 49 (27.1%) |
| Business & Financial | 19 (25.7%) | 55 (74.3%) |
| Computers, Engineering & Science | 60 (63.8%) | 34 (36.2%) |
| Computers & Mathematics | 30 (75.0%) | 10 (25.0%) |
| Architecture & Engineering | 12 (41.4%) | 17 (58.6%) |
| Life, Physical & Social Science | 18 (72.0%) | 7 (28.0%) |
| Community & Social Service | 53 (20.2%) | 210 (79.8%) |
| Education, Arts & Media | 27 (84.4%) | 5 (15.6%) |
| Legal Services & Support | 0 (0.0%) | 0 (0.0%) |
| Education Instruction & Library | 8 (5.0%) | 152 (95.0%) |
| Arts, Media & Entertainment | 18 (25.4%) | 53 (74.7%) |
| Health Diagnosing & Treating | 21 (13.9%) | 130 (86.1%) |
| Health Technologists | 0 (0.0%) | 48 (100.0%) |
| Total (Category) | 285 (37.3%) | 478 (62.6%) |
| Total (Overall) | 1,198 (52.7%) | 1,076 (47.3%) |
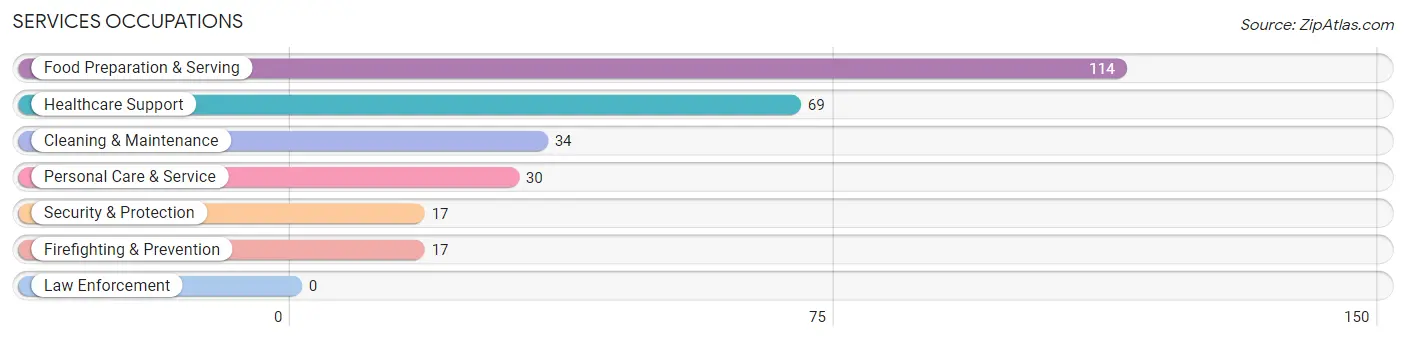
Services Occupations
The most common Services occupations in Coopersville are Food Preparation & Serving (114 | 5.0%), Healthcare Support (69 | 3.0%), Cleaning & Maintenance (34 | 1.5%), Personal Care & Service (30 | 1.3%), and Security & Protection (17 | 0.7%).
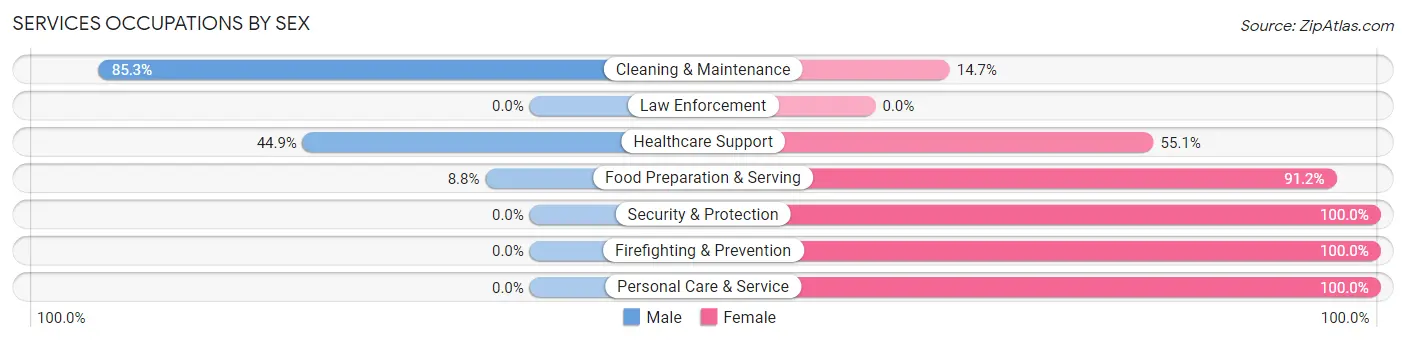
Services Occupations by Sex
Within the Services occupations in Coopersville, the most male-oriented occupations are Cleaning & Maintenance (85.3%), Healthcare Support (44.9%), and Food Preparation & Serving (8.8%), while the most female-oriented occupations are Security & Protection (100.0%), Firefighting & Prevention (100.0%), and Personal Care & Service (100.0%).
| Occupation | Male | Female |
| Healthcare Support | 31 (44.9%) | 38 (55.1%) |
| Security & Protection | 0 (0.0%) | 17 (100.0%) |
| Firefighting & Prevention | 0 (0.0%) | 17 (100.0%) |
| Law Enforcement | 0 (0.0%) | 0 (0.0%) |
| Food Preparation & Serving | 10 (8.8%) | 104 (91.2%) |
| Cleaning & Maintenance | 29 (85.3%) | 5 (14.7%) |
| Personal Care & Service | 0 (0.0%) | 30 (100.0%) |
| Total (Category) | 70 (26.5%) | 194 (73.5%) |
| Total (Overall) | 1,198 (52.7%) | 1,076 (47.3%) |
Sales and Office Occupations
The most common Sales and Office occupations in Coopersville are Sales & Related (211 | 9.3%), and Office & Administration (183 | 8.1%).

Sales and Office Occupations by Sex
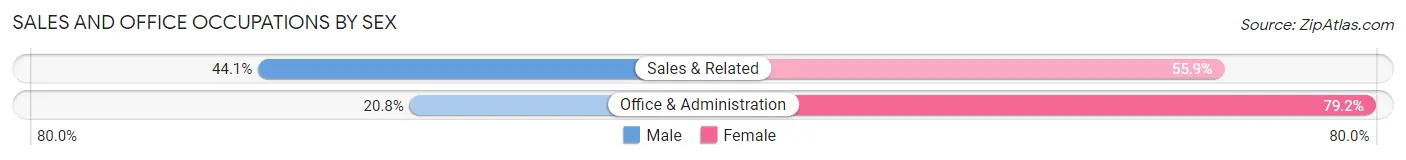
| Occupation | Male | Female |
| Sales & Related | 93 (44.1%) | 118 (55.9%) |
| Office & Administration | 38 (20.8%) | 145 (79.2%) |
| Total (Category) | 131 (33.3%) | 263 (66.7%) |
| Total (Overall) | 1,198 (52.7%) | 1,076 (47.3%) |
Natural Resources, Construction and Maintenance Occupations
The most common Natural Resources, Construction and Maintenance occupations in Coopersville are Construction & Extraction (124 | 5.4%), Installation, Maintenance & Repair (74 | 3.3%), and Farming, Fishing & Forestry (11 | 0.5%).

Natural Resources, Construction and Maintenance Occupations by Sex
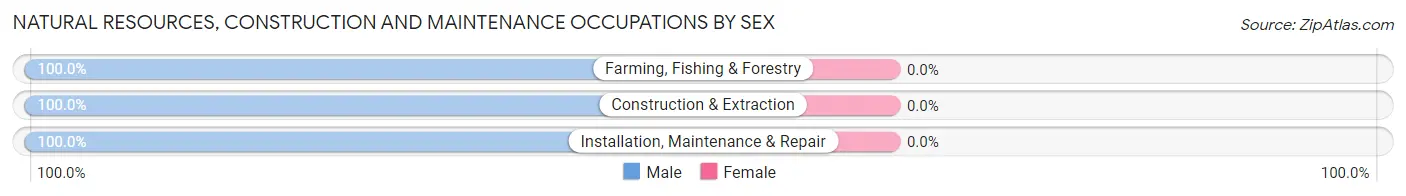
| Occupation | Male | Female |
| Farming, Fishing & Forestry | 11 (100.0%) | 0 (0.0%) |
| Construction & Extraction | 124 (100.0%) | 0 (0.0%) |
| Installation, Maintenance & Repair | 74 (100.0%) | 0 (0.0%) |
| Total (Category) | 209 (100.0%) | 0 (0.0%) |
| Total (Overall) | 1,198 (52.7%) | 1,076 (47.3%) |
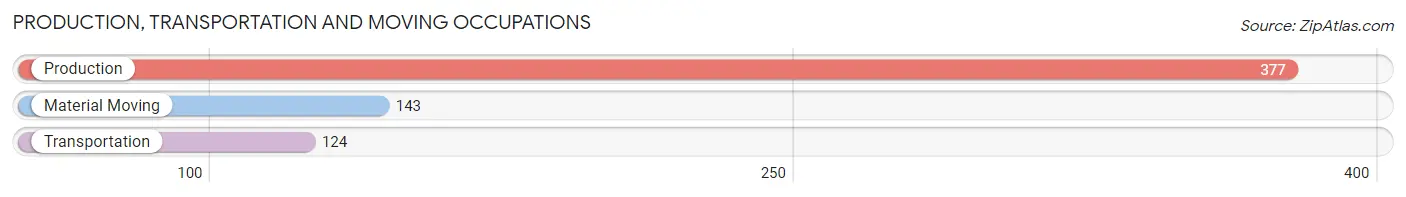
Production, Transportation and Moving Occupations
The most common Production, Transportation and Moving occupations in Coopersville are Production (377 | 16.6%), Material Moving (143 | 6.3%), and Transportation (124 | 5.4%).
Production, Transportation and Moving Occupations by Sex
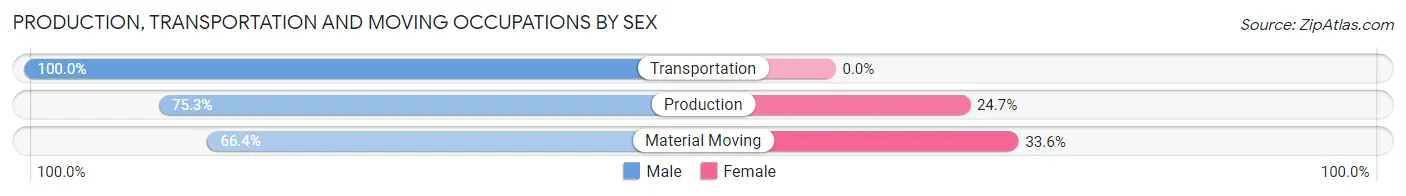
| Occupation | Male | Female |
| Production | 284 (75.3%) | 93 (24.7%) |
| Transportation | 124 (100.0%) | 0 (0.0%) |
| Material Moving | 95 (66.4%) | 48 (33.6%) |
| Total (Category) | 503 (78.1%) | 141 (21.9%) |
| Total (Overall) | 1,198 (52.7%) | 1,076 (47.3%) |
Employment Industries by Sex in Coopersville
Employment Industries in Coopersville
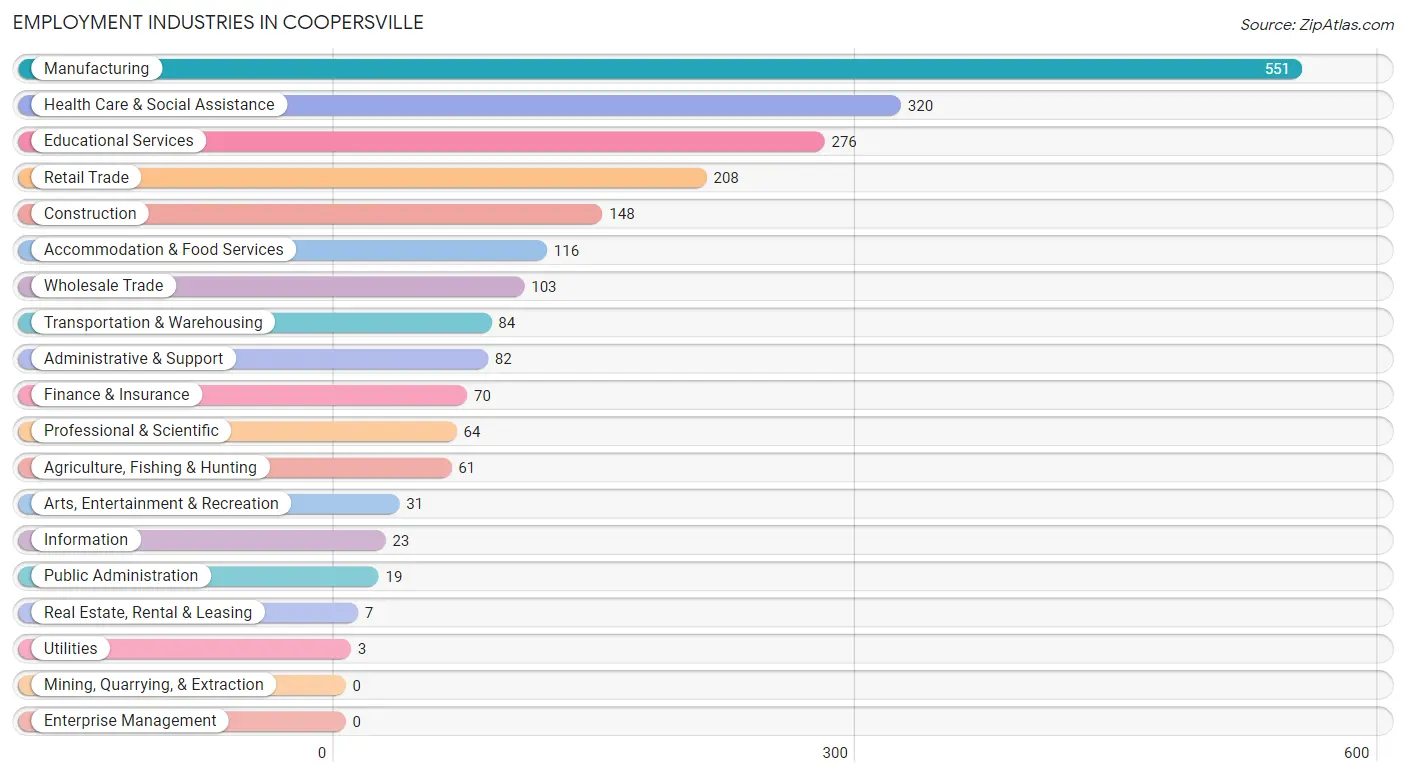
The major employment industries in Coopersville include Manufacturing (551 | 24.2%), Health Care & Social Assistance (320 | 14.1%), Educational Services (276 | 12.1%), Retail Trade (208 | 9.1%), and Construction (148 | 6.5%).
Employment Industries by Sex in Coopersville
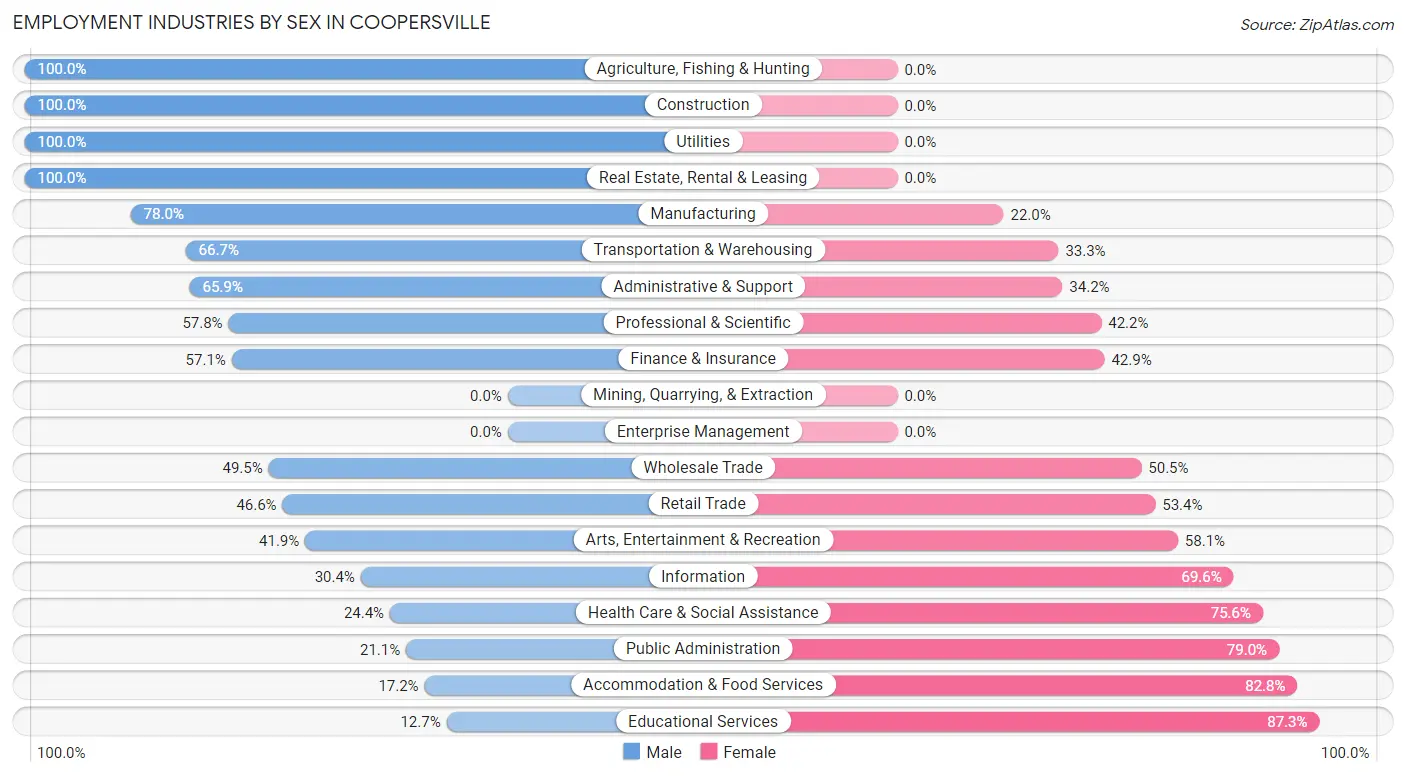
The Coopersville industries that see more men than women are Agriculture, Fishing & Hunting (100.0%), Construction (100.0%), and Utilities (100.0%), whereas the industries that tend to have a higher number of women are Educational Services (87.3%), Accommodation & Food Services (82.8%), and Public Administration (78.9%).
| Industry | Male | Female |
| Agriculture, Fishing & Hunting | 61 (100.0%) | 0 (0.0%) |
| Mining, Quarrying, & Extraction | 0 (0.0%) | 0 (0.0%) |
| Construction | 148 (100.0%) | 0 (0.0%) |
| Manufacturing | 430 (78.0%) | 121 (22.0%) |
| Wholesale Trade | 51 (49.5%) | 52 (50.5%) |
| Retail Trade | 97 (46.6%) | 111 (53.4%) |
| Transportation & Warehousing | 56 (66.7%) | 28 (33.3%) |
| Utilities | 3 (100.0%) | 0 (0.0%) |
| Information | 7 (30.4%) | 16 (69.6%) |
| Finance & Insurance | 40 (57.1%) | 30 (42.9%) |
| Real Estate, Rental & Leasing | 7 (100.0%) | 0 (0.0%) |
| Professional & Scientific | 37 (57.8%) | 27 (42.2%) |
| Enterprise Management | 0 (0.0%) | 0 (0.0%) |
| Administrative & Support | 54 (65.8%) | 28 (34.2%) |
| Educational Services | 35 (12.7%) | 241 (87.3%) |
| Health Care & Social Assistance | 78 (24.4%) | 242 (75.6%) |
| Arts, Entertainment & Recreation | 13 (41.9%) | 18 (58.1%) |
| Accommodation & Food Services | 20 (17.2%) | 96 (82.8%) |
| Public Administration | 4 (21.0%) | 15 (78.9%) |
| Total | 1,198 (52.7%) | 1,076 (47.3%) |
Education in Coopersville
School Enrollment in Coopersville
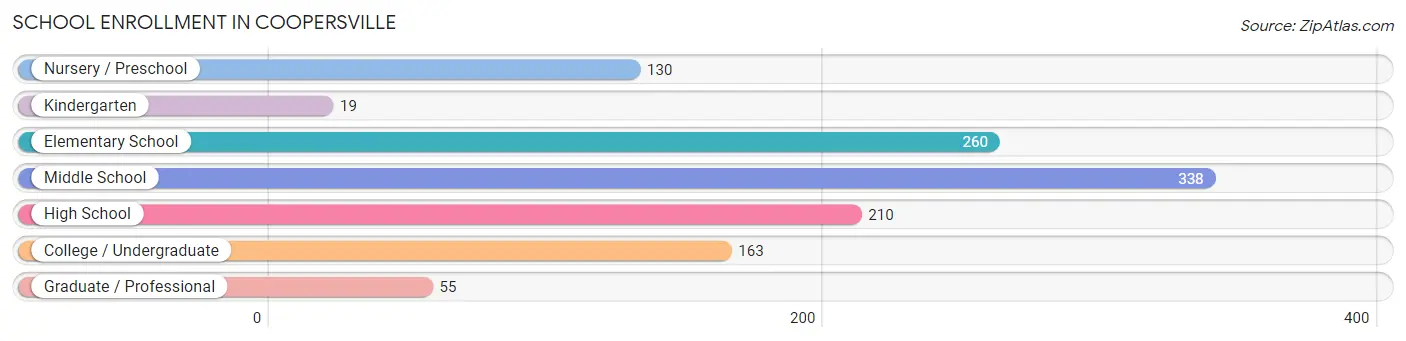
The most common levels of schooling among the 1,175 students in Coopersville are middle school (338 | 28.8%), elementary school (260 | 22.1%), and high school (210 | 17.9%).
| School Level | # Students | % Students |
| Nursery / Preschool | 130 | 11.1% |
| Kindergarten | 19 | 1.6% |
| Elementary School | 260 | 22.1% |
| Middle School | 338 | 28.8% |
| High School | 210 | 17.9% |
| College / Undergraduate | 163 | 13.9% |
| Graduate / Professional | 55 | 4.7% |
| Total | 1,175 | 100.0% |
School Enrollment by Age by Funding Source in Coopersville
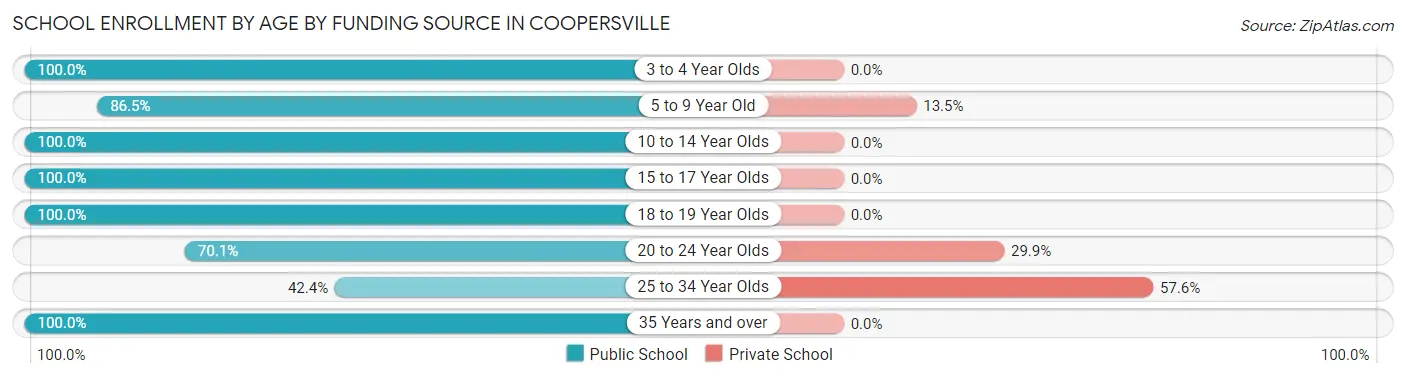
Out of a total of 1,175 students who are enrolled in schools in Coopersville, 116 (9.9%) attend a private institution, while the remaining 1,059 (90.1%) are enrolled in public schools. The age group of 25 to 34 year olds has the highest likelihood of being enrolled in private schools, with 34 (57.6% in the age bracket) enrolled. Conversely, the age group of 3 to 4 year olds has the lowest likelihood of being enrolled in a private school, with 95 (100.0% in the age bracket) attending a public institution.
| Age Bracket | Public School | Private School |
| 3 to 4 Year Olds | 95 (100.0%) | 0 (0.0%) |
| 5 to 9 Year Old | 230 (86.5%) | 36 (13.5%) |
| 10 to 14 Year Olds | 391 (100.0%) | 0 (0.0%) |
| 15 to 17 Year Olds | 200 (100.0%) | 0 (0.0%) |
| 18 to 19 Year Olds | 5 (100.0%) | 0 (0.0%) |
| 20 to 24 Year Olds | 108 (70.1%) | 46 (29.9%) |
| 25 to 34 Year Olds | 25 (42.4%) | 34 (57.6%) |
| 35 Years and over | 5 (100.0%) | 0 (0.0%) |
| Total | 1,059 (90.1%) | 116 (9.9%) |
Educational Attainment by Field of Study in Coopersville
Business (110 | 15.1%), psychology (103 | 14.1%), arts & humanities (89 | 12.2%), education (85 | 11.6%), and liberal arts & history (67 | 9.2%) are the most common fields of study among 730 individuals in Coopersville who have obtained a bachelor's degree or higher.
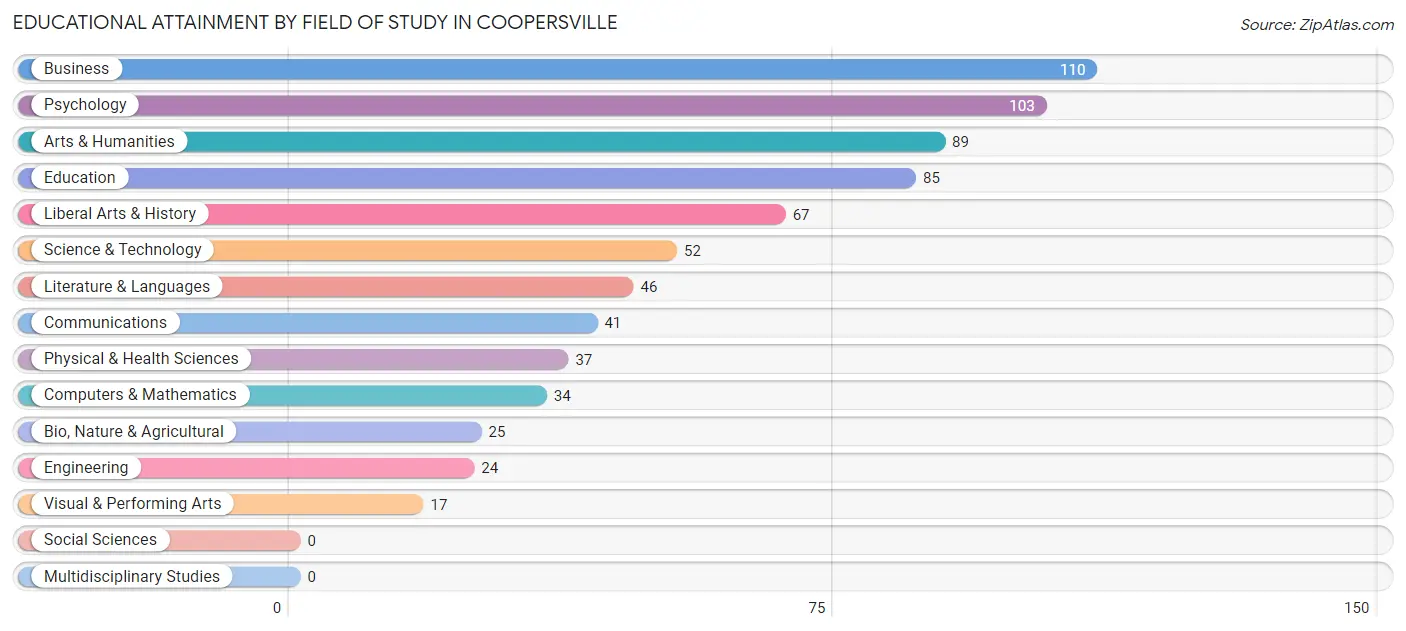
| Field of Study | # Graduates | % Graduates |
| Computers & Mathematics | 34 | 4.7% |
| Bio, Nature & Agricultural | 25 | 3.4% |
| Physical & Health Sciences | 37 | 5.1% |
| Psychology | 103 | 14.1% |
| Social Sciences | 0 | 0.0% |
| Engineering | 24 | 3.3% |
| Multidisciplinary Studies | 0 | 0.0% |
| Science & Technology | 52 | 7.1% |
| Business | 110 | 15.1% |
| Education | 85 | 11.6% |
| Literature & Languages | 46 | 6.3% |
| Liberal Arts & History | 67 | 9.2% |
| Visual & Performing Arts | 17 | 2.3% |
| Communications | 41 | 5.6% |
| Arts & Humanities | 89 | 12.2% |
| Total | 730 | 100.0% |
Transportation & Commute in Coopersville
Vehicle Availability by Sex in Coopersville
The most prevalent vehicle ownership categories in Coopersville are males with 2 vehicles (683, accounting for 59.9%) and females with 2 vehicles (594, making up 65.0%).
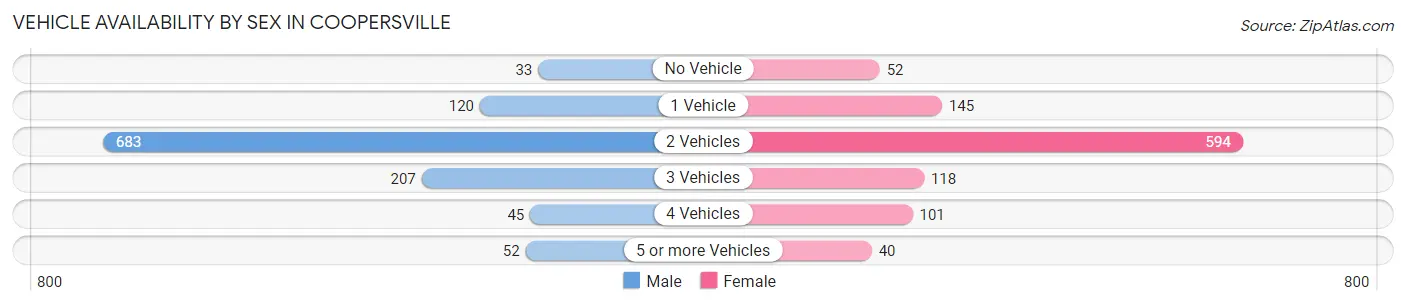
| Vehicles Available | Male | Female |
| No Vehicle | 33 (2.9%) | 52 (5.0%) |
| 1 Vehicle | 120 (10.5%) | 145 (13.8%) |
| 2 Vehicles | 683 (59.9%) | 594 (56.6%) |
| 3 Vehicles | 207 (18.2%) | 118 (11.2%) |
| 4 Vehicles | 45 (4.0%) | 101 (9.6%) |
| 5 or more Vehicles | 52 (4.6%) | 40 (3.8%) |
| Total | 1,140 (100.0%) | 1,050 (100.0%) |
Commute Time in Coopersville
The most frequently occuring commute durations in Coopersville are 5 to 9 minutes (366 commuters, 17.9%), 20 to 24 minutes (327 commuters, 16.0%), and 30 to 34 minutes (246 commuters, 12.0%).
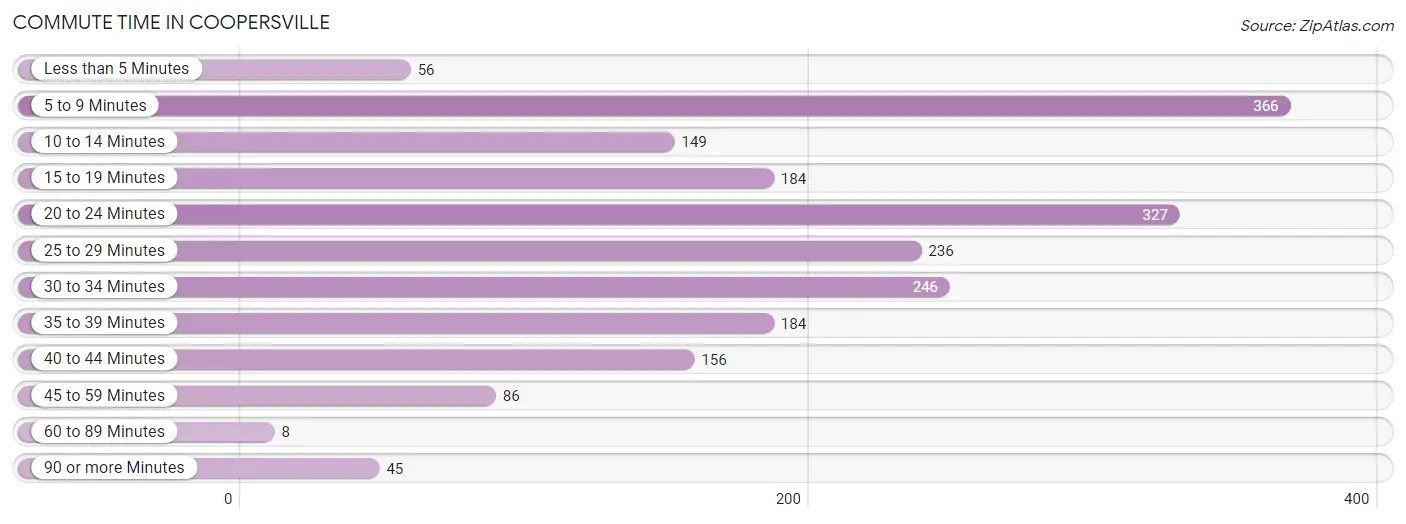
| Commute Time | # Commuters | % Commuters |
| Less than 5 Minutes | 56 | 2.7% |
| 5 to 9 Minutes | 366 | 17.9% |
| 10 to 14 Minutes | 149 | 7.3% |
| 15 to 19 Minutes | 184 | 9.0% |
| 20 to 24 Minutes | 327 | 16.0% |
| 25 to 29 Minutes | 236 | 11.6% |
| 30 to 34 Minutes | 246 | 12.0% |
| 35 to 39 Minutes | 184 | 9.0% |
| 40 to 44 Minutes | 156 | 7.6% |
| 45 to 59 Minutes | 86 | 4.2% |
| 60 to 89 Minutes | 8 | 0.4% |
| 90 or more Minutes | 45 | 2.2% |
Commute Time by Sex in Coopersville
The most common commute times in Coopersville are 30 to 34 minutes (189 commuters, 17.1%) for males and 5 to 9 minutes (208 commuters, 22.1%) for females.
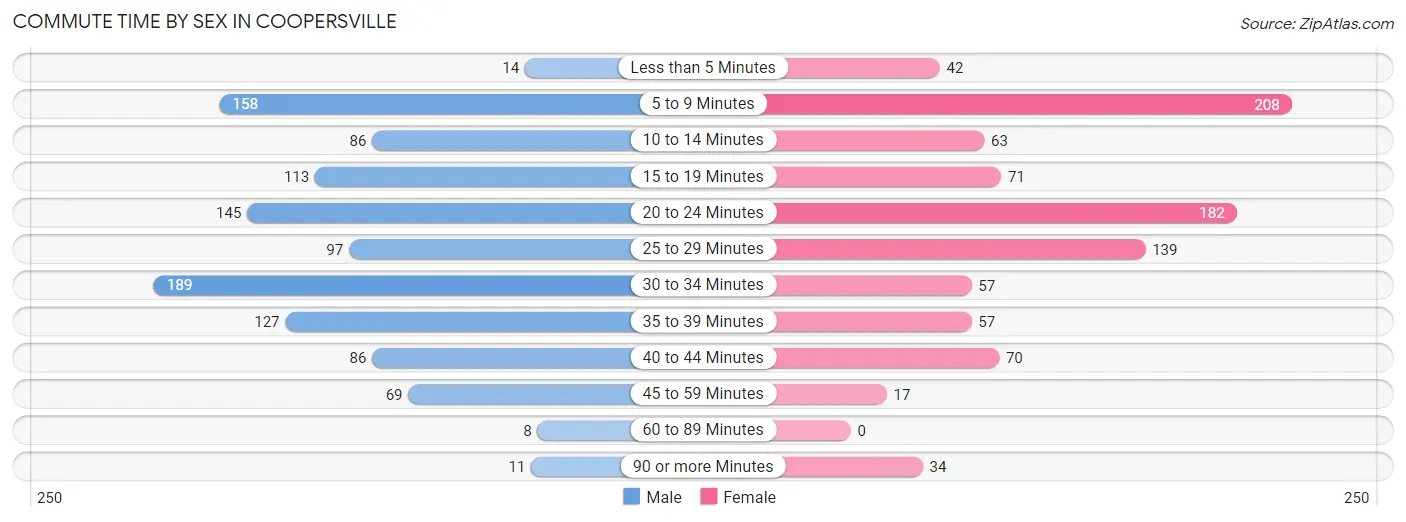
| Commute Time | Male | Female |
| Less than 5 Minutes | 14 (1.3%) | 42 (4.5%) |
| 5 to 9 Minutes | 158 (14.3%) | 208 (22.1%) |
| 10 to 14 Minutes | 86 (7.8%) | 63 (6.7%) |
| 15 to 19 Minutes | 113 (10.2%) | 71 (7.5%) |
| 20 to 24 Minutes | 145 (13.2%) | 182 (19.4%) |
| 25 to 29 Minutes | 97 (8.8%) | 139 (14.8%) |
| 30 to 34 Minutes | 189 (17.1%) | 57 (6.1%) |
| 35 to 39 Minutes | 127 (11.5%) | 57 (6.1%) |
| 40 to 44 Minutes | 86 (7.8%) | 70 (7.4%) |
| 45 to 59 Minutes | 69 (6.3%) | 17 (1.8%) |
| 60 to 89 Minutes | 8 (0.7%) | 0 (0.0%) |
| 90 or more Minutes | 11 (1.0%) | 34 (3.6%) |
Time of Departure to Work by Sex in Coopersville
The most frequent times of departure to work in Coopersville are 6:30 AM to 6:59 AM (158, 14.3%) for males and 6:30 AM to 6:59 AM (168, 17.9%) for females.
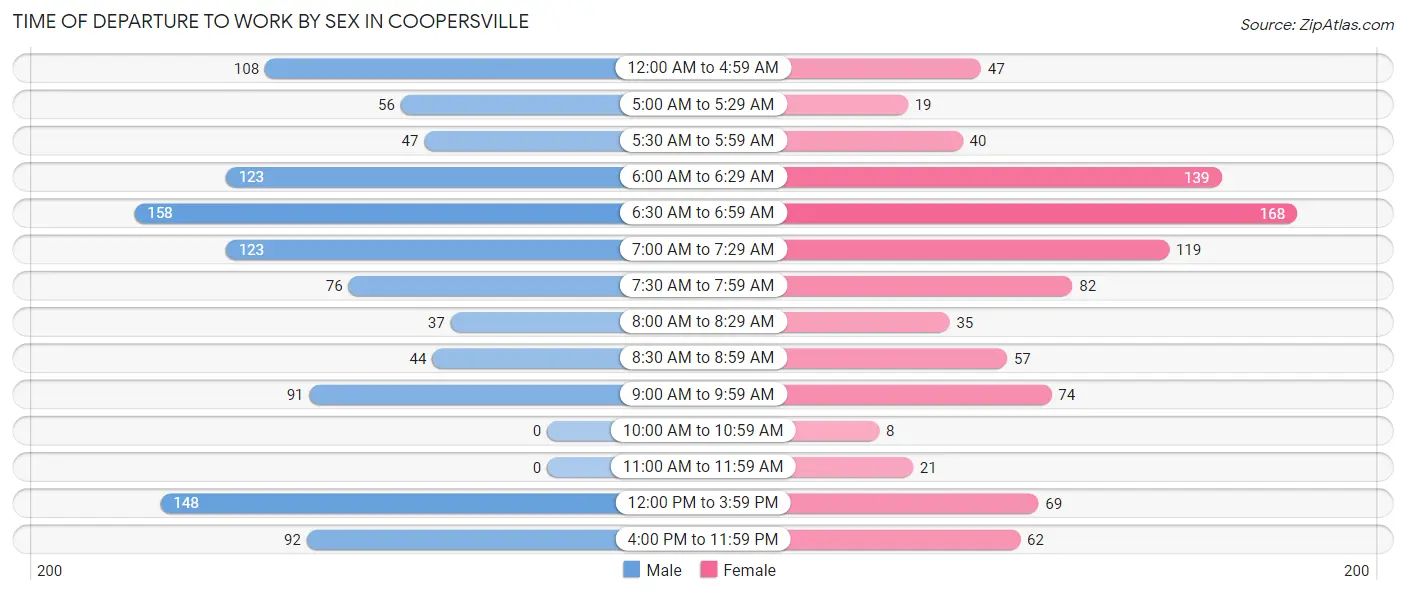
| Time of Departure | Male | Female |
| 12:00 AM to 4:59 AM | 108 (9.8%) | 47 (5.0%) |
| 5:00 AM to 5:29 AM | 56 (5.1%) | 19 (2.0%) |
| 5:30 AM to 5:59 AM | 47 (4.3%) | 40 (4.3%) |
| 6:00 AM to 6:29 AM | 123 (11.2%) | 139 (14.8%) |
| 6:30 AM to 6:59 AM | 158 (14.3%) | 168 (17.9%) |
| 7:00 AM to 7:29 AM | 123 (11.2%) | 119 (12.7%) |
| 7:30 AM to 7:59 AM | 76 (6.9%) | 82 (8.7%) |
| 8:00 AM to 8:29 AM | 37 (3.4%) | 35 (3.7%) |
| 8:30 AM to 8:59 AM | 44 (4.0%) | 57 (6.1%) |
| 9:00 AM to 9:59 AM | 91 (8.3%) | 74 (7.9%) |
| 10:00 AM to 10:59 AM | 0 (0.0%) | 8 (0.9%) |
| 11:00 AM to 11:59 AM | 0 (0.0%) | 21 (2.2%) |
| 12:00 PM to 3:59 PM | 148 (13.4%) | 69 (7.3%) |
| 4:00 PM to 11:59 PM | 92 (8.3%) | 62 (6.6%) |
| Total | 1,103 (100.0%) | 940 (100.0%) |
Housing Occupancy in Coopersville
Occupancy by Ownership in Coopersville
Of the total 1,712 dwellings in Coopersville, owner-occupied units account for 1,256 (73.4%), while renter-occupied units make up 456 (26.6%).
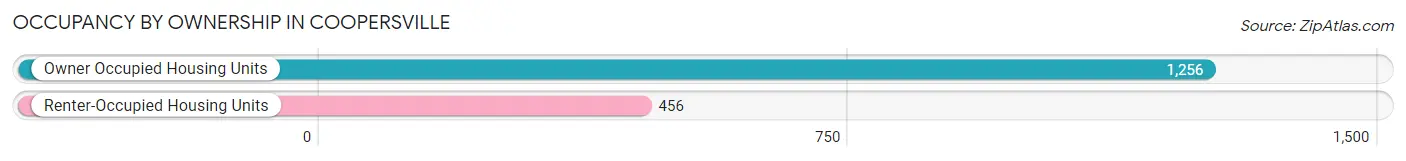
| Occupancy | # Housing Units | % Housing Units |
| Owner Occupied Housing Units | 1,256 | 73.4% |
| Renter-Occupied Housing Units | 456 | 26.6% |
| Total Occupied Housing Units | 1,712 | 100.0% |
Occupancy by Household Size in Coopersville
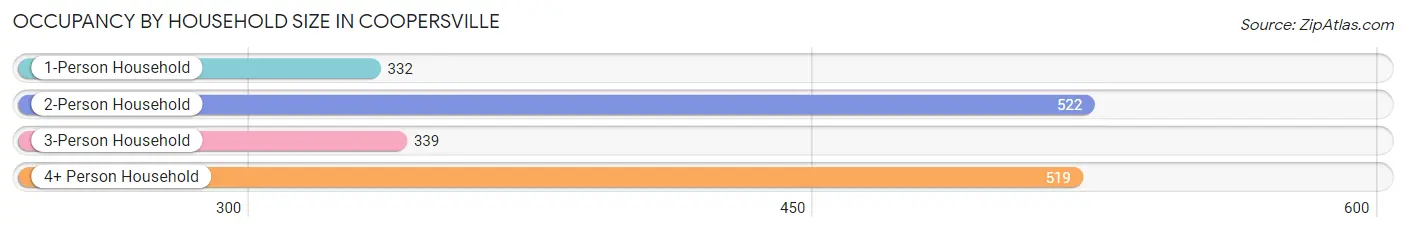
| Household Size | # Housing Units | % Housing Units |
| 1-Person Household | 332 | 19.4% |
| 2-Person Household | 522 | 30.5% |
| 3-Person Household | 339 | 19.8% |
| 4+ Person Household | 519 | 30.3% |
| Total Housing Units | 1,712 | 100.0% |
Occupancy by Ownership by Household Size in Coopersville
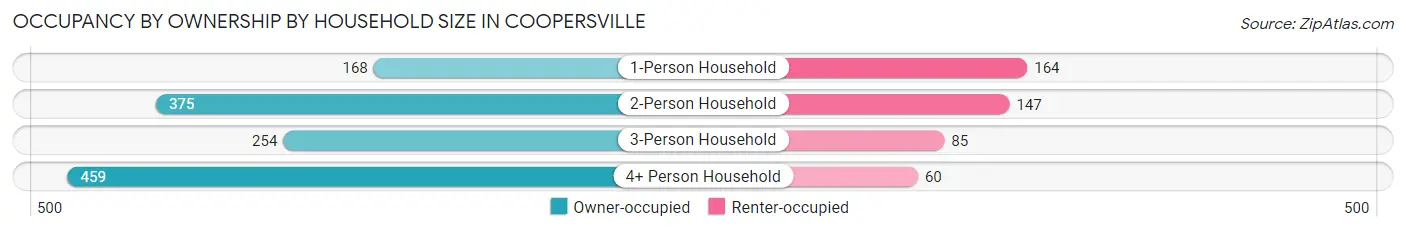
| Household Size | Owner-occupied | Renter-occupied |
| 1-Person Household | 168 (50.6%) | 164 (49.4%) |
| 2-Person Household | 375 (71.8%) | 147 (28.2%) |
| 3-Person Household | 254 (74.9%) | 85 (25.1%) |
| 4+ Person Household | 459 (88.4%) | 60 (11.6%) |
| Total Housing Units | 1,256 (73.4%) | 456 (26.6%) |
Occupancy by Educational Attainment in Coopersville
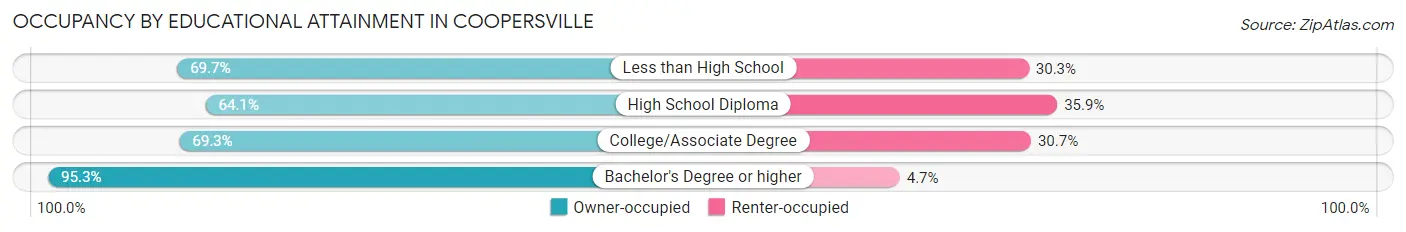
| Household Size | Owner-occupied | Renter-occupied |
| Less than High School | 129 (69.7%) | 56 (30.3%) |
| High School Diploma | 318 (64.1%) | 178 (35.9%) |
| College/Associate Degree | 463 (69.3%) | 205 (30.7%) |
| Bachelor's Degree or higher | 346 (95.3%) | 17 (4.7%) |
Occupancy by Age of Householder in Coopersville
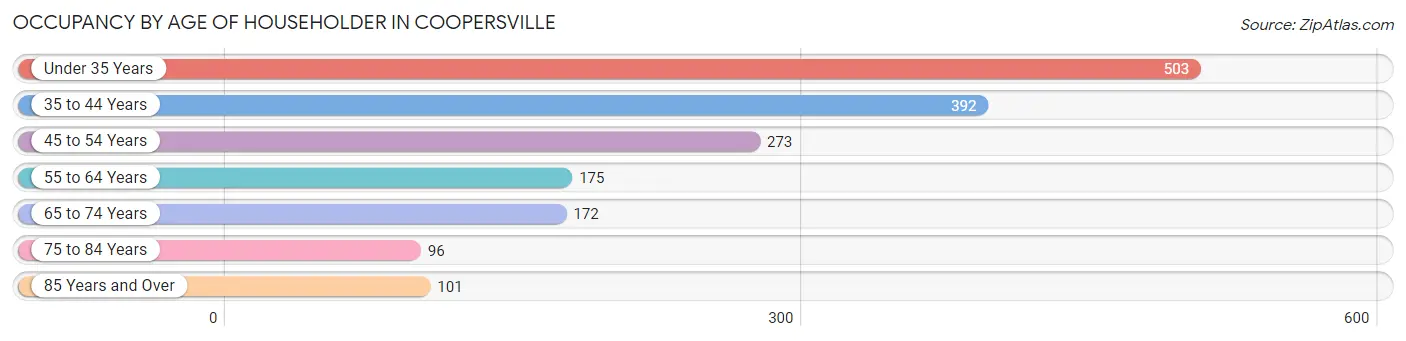
| Age Bracket | # Households | % Households |
| Under 35 Years | 503 | 29.4% |
| 35 to 44 Years | 392 | 22.9% |
| 45 to 54 Years | 273 | 16.0% |
| 55 to 64 Years | 175 | 10.2% |
| 65 to 74 Years | 172 | 10.1% |
| 75 to 84 Years | 96 | 5.6% |
| 85 Years and Over | 101 | 5.9% |
| Total | 1,712 | 100.0% |
Housing Finances in Coopersville
Median Income by Occupancy in Coopersville
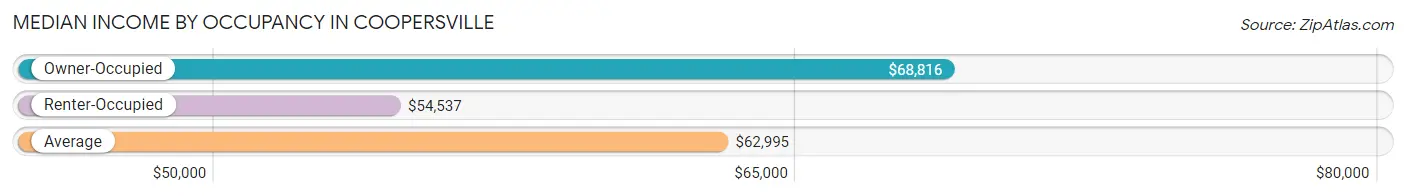
| Occupancy Type | # Households | Median Income |
| Owner-Occupied | 1,256 (73.4%) | $68,816 |
| Renter-Occupied | 456 (26.6%) | $54,537 |
| Average | 1,712 (100.0%) | $62,995 |
Occupancy by Householder Income Bracket in Coopersville
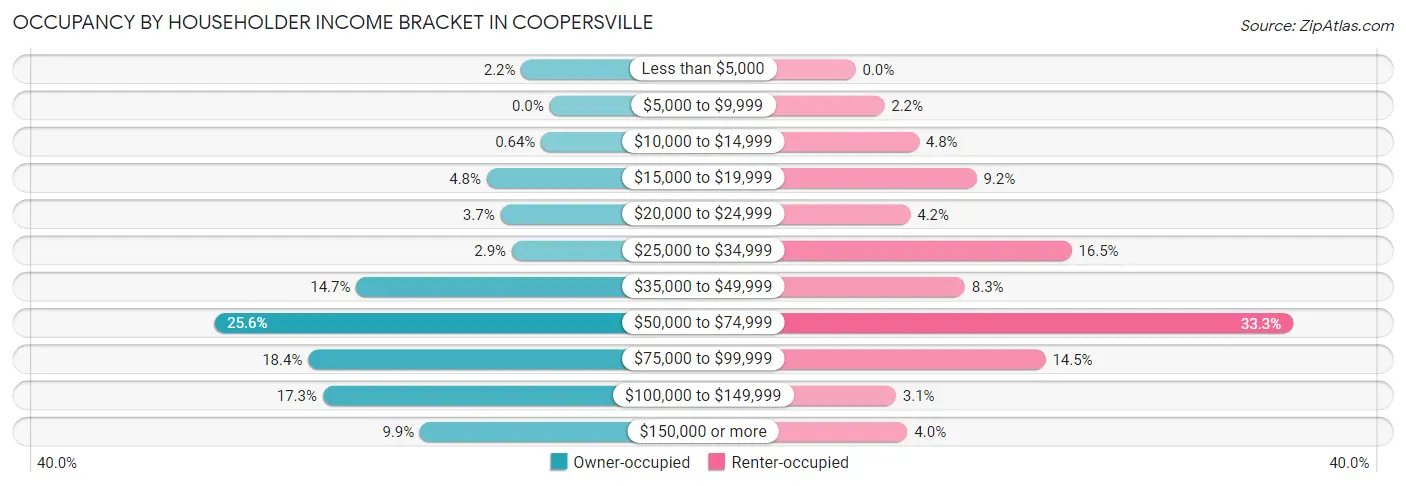
| Income Bracket | Owner-occupied | Renter-occupied |
| Less than $5,000 | 27 (2.1%) | 0 (0.0%) |
| $5,000 to $9,999 | 0 (0.0%) | 10 (2.2%) |
| $10,000 to $14,999 | 8 (0.6%) | 22 (4.8%) |
| $15,000 to $19,999 | 60 (4.8%) | 42 (9.2%) |
| $20,000 to $24,999 | 47 (3.7%) | 19 (4.2%) |
| $25,000 to $34,999 | 36 (2.9%) | 75 (16.5%) |
| $35,000 to $49,999 | 185 (14.7%) | 38 (8.3%) |
| $50,000 to $74,999 | 321 (25.6%) | 152 (33.3%) |
| $75,000 to $99,999 | 231 (18.4%) | 66 (14.5%) |
| $100,000 to $149,999 | 217 (17.3%) | 14 (3.1%) |
| $150,000 or more | 124 (9.9%) | 18 (4.0%) |
| Total | 1,256 (100.0%) | 456 (100.0%) |
Monthly Housing Cost Tiers in Coopersville
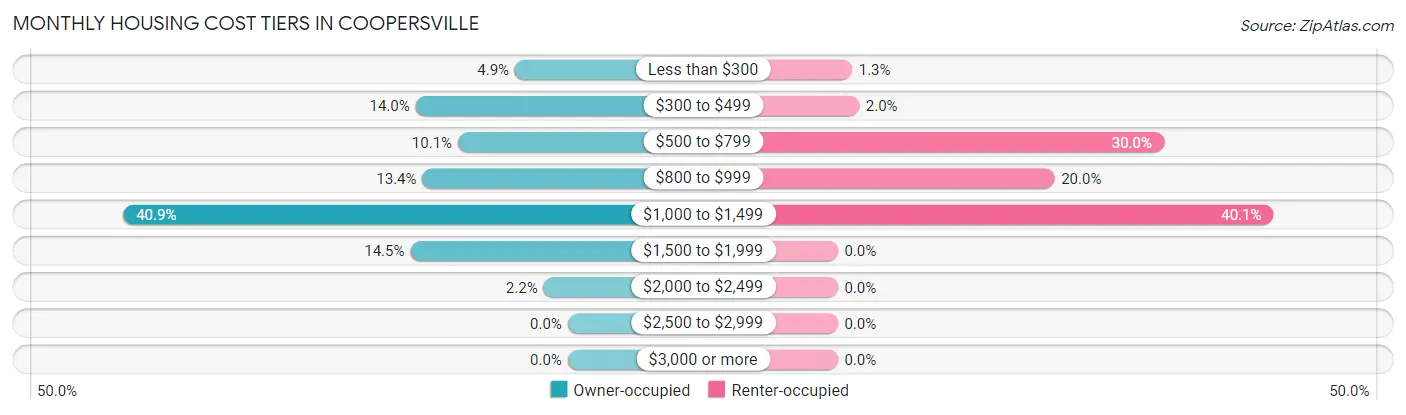
| Monthly Cost | Owner-occupied | Renter-occupied |
| Less than $300 | 61 (4.9%) | 6 (1.3%) |
| $300 to $499 | 176 (14.0%) | 9 (2.0%) |
| $500 to $799 | 127 (10.1%) | 137 (30.0%) |
| $800 to $999 | 168 (13.4%) | 91 (20.0%) |
| $1,000 to $1,499 | 514 (40.9%) | 183 (40.1%) |
| $1,500 to $1,999 | 182 (14.5%) | 0 (0.0%) |
| $2,000 to $2,499 | 28 (2.2%) | 0 (0.0%) |
| $2,500 to $2,999 | 0 (0.0%) | 0 (0.0%) |
| $3,000 or more | 0 (0.0%) | 0 (0.0%) |
| Total | 1,256 (100.0%) | 456 (100.0%) |
Physical Housing Characteristics in Coopersville
Housing Structures in Coopersville
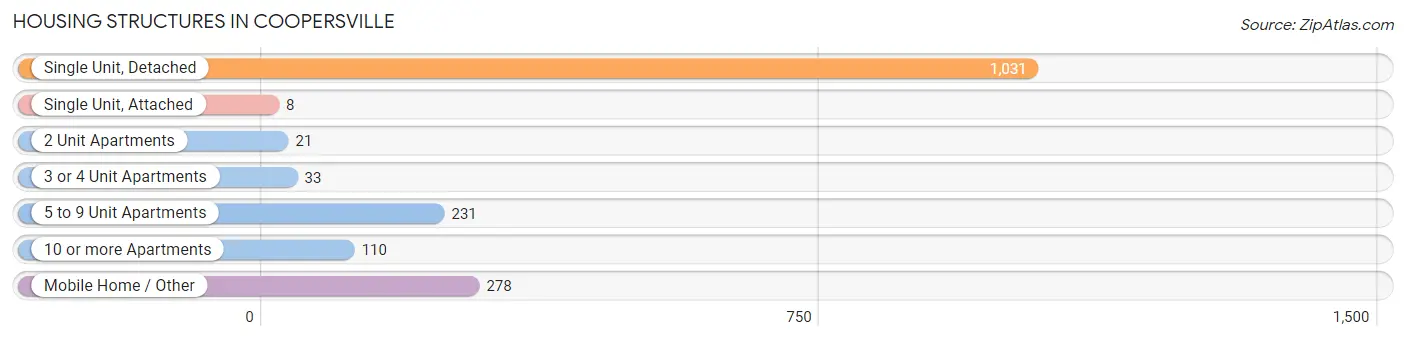
| Structure Type | # Housing Units | % Housing Units |
| Single Unit, Detached | 1,031 | 60.2% |
| Single Unit, Attached | 8 | 0.5% |
| 2 Unit Apartments | 21 | 1.2% |
| 3 or 4 Unit Apartments | 33 | 1.9% |
| 5 to 9 Unit Apartments | 231 | 13.5% |
| 10 or more Apartments | 110 | 6.4% |
| Mobile Home / Other | 278 | 16.2% |
| Total | 1,712 | 100.0% |
Housing Structures by Occupancy in Coopersville
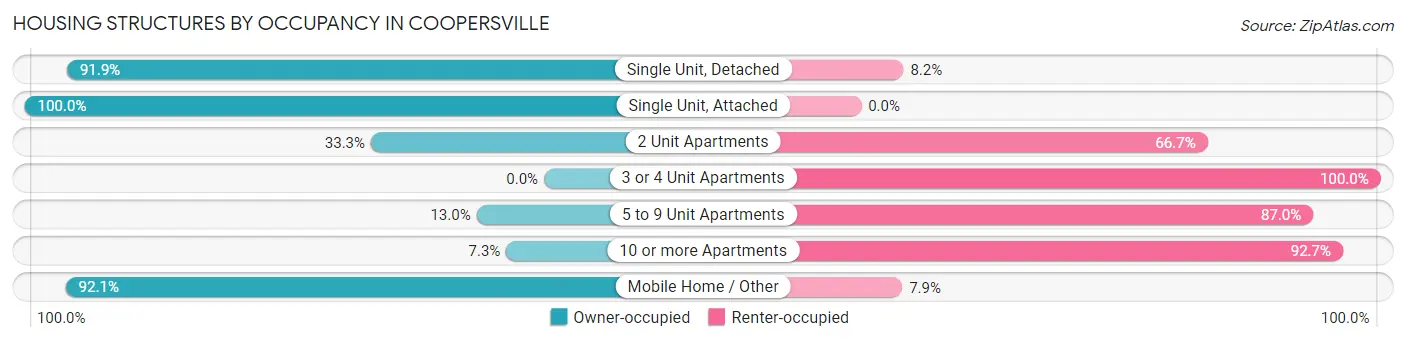
| Structure Type | Owner-occupied | Renter-occupied |
| Single Unit, Detached | 947 (91.8%) | 84 (8.2%) |
| Single Unit, Attached | 8 (100.0%) | 0 (0.0%) |
| 2 Unit Apartments | 7 (33.3%) | 14 (66.7%) |
| 3 or 4 Unit Apartments | 0 (0.0%) | 33 (100.0%) |
| 5 to 9 Unit Apartments | 30 (13.0%) | 201 (87.0%) |
| 10 or more Apartments | 8 (7.3%) | 102 (92.7%) |
| Mobile Home / Other | 256 (92.1%) | 22 (7.9%) |
| Total | 1,256 (73.4%) | 456 (26.6%) |
Housing Structures by Number of Rooms in Coopersville
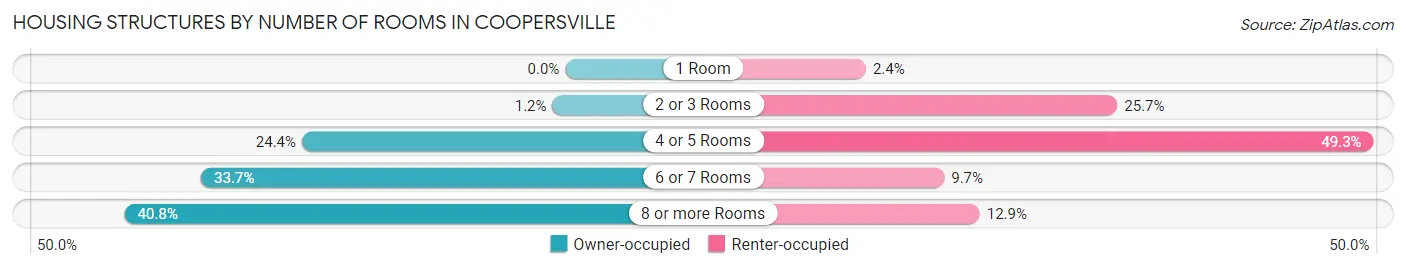
| Number of Rooms | Owner-occupied | Renter-occupied |
| 1 Room | 0 (0.0%) | 11 (2.4%) |
| 2 or 3 Rooms | 15 (1.2%) | 117 (25.7%) |
| 4 or 5 Rooms | 306 (24.4%) | 225 (49.3%) |
| 6 or 7 Rooms | 423 (33.7%) | 44 (9.7%) |
| 8 or more Rooms | 512 (40.8%) | 59 (12.9%) |
| Total | 1,256 (100.0%) | 456 (100.0%) |
Housing Structure by Heating Type in Coopersville
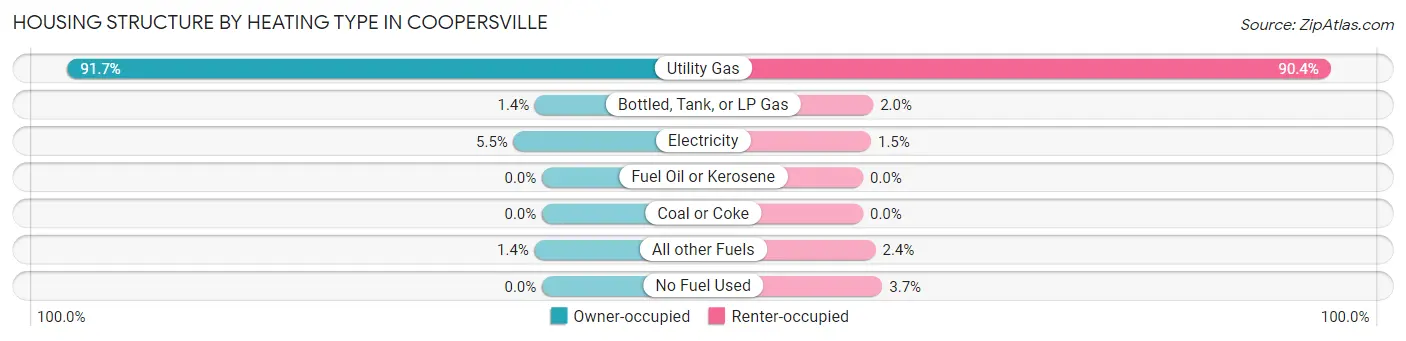
| Heating Type | Owner-occupied | Renter-occupied |
| Utility Gas | 1,152 (91.7%) | 412 (90.3%) |
| Bottled, Tank, or LP Gas | 17 (1.3%) | 9 (2.0%) |
| Electricity | 69 (5.5%) | 7 (1.5%) |
| Fuel Oil or Kerosene | 0 (0.0%) | 0 (0.0%) |
| Coal or Coke | 0 (0.0%) | 0 (0.0%) |
| All other Fuels | 18 (1.4%) | 11 (2.4%) |
| No Fuel Used | 0 (0.0%) | 17 (3.7%) |
| Total | 1,256 (100.0%) | 456 (100.0%) |
Household Vehicle Usage in Coopersville
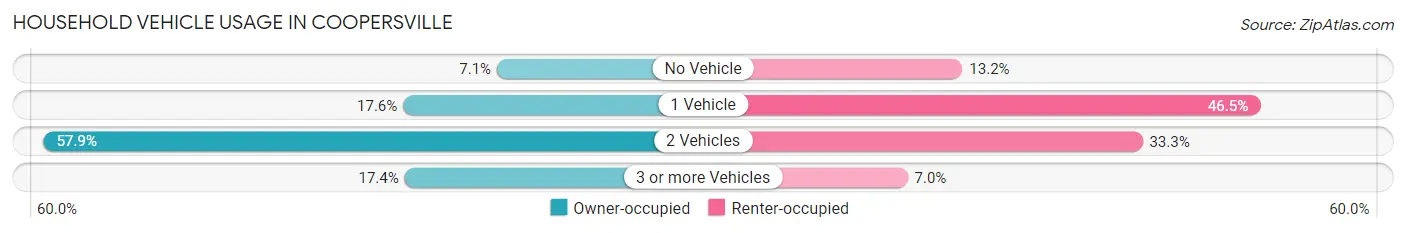
| Vehicles per Household | Owner-occupied | Renter-occupied |
| No Vehicle | 89 (7.1%) | 60 (13.2%) |
| 1 Vehicle | 221 (17.6%) | 212 (46.5%) |
| 2 Vehicles | 727 (57.9%) | 152 (33.3%) |
| 3 or more Vehicles | 219 (17.4%) | 32 (7.0%) |
| Total | 1,256 (100.0%) | 456 (100.0%) |
Real Estate & Mortgages in Coopersville
Real Estate and Mortgage Overview in Coopersville
| Characteristic | Without Mortgage | With Mortgage |
| Housing Units | 453 | 803 |
| Median Property Value | $207,600 | $194,200 |
| Median Household Income | $60,662 | $69 |
| Monthly Housing Costs | $491 | $0 |
| Real Estate Taxes | $2,646 | $117 |
Property Value by Mortgage Status in Coopersville
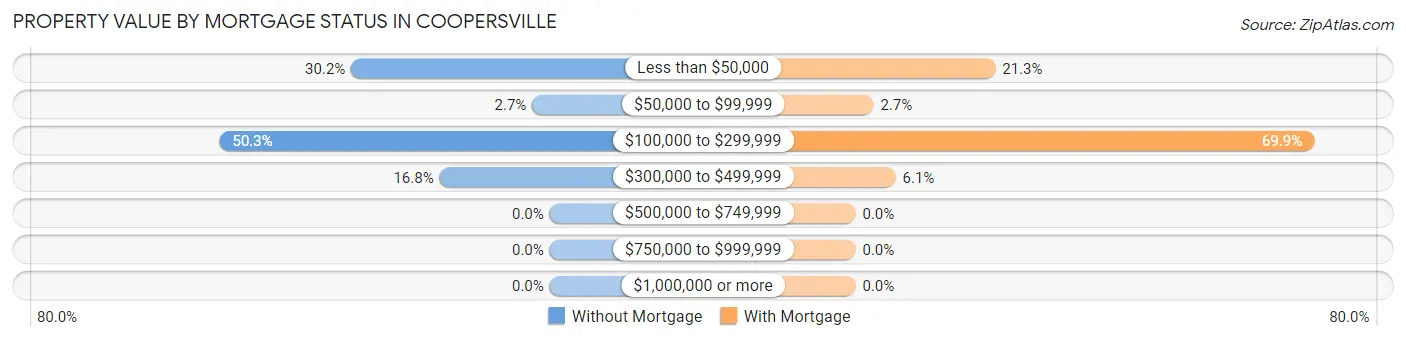
| Property Value | Without Mortgage | With Mortgage |
| Less than $50,000 | 137 (30.2%) | 171 (21.3%) |
| $50,000 to $99,999 | 12 (2.6%) | 22 (2.7%) |
| $100,000 to $299,999 | 228 (50.3%) | 561 (69.9%) |
| $300,000 to $499,999 | 76 (16.8%) | 49 (6.1%) |
| $500,000 to $749,999 | 0 (0.0%) | 0 (0.0%) |
| $750,000 to $999,999 | 0 (0.0%) | 0 (0.0%) |
| $1,000,000 or more | 0 (0.0%) | 0 (0.0%) |
| Total | 453 (100.0%) | 803 (100.0%) |
Household Income by Mortgage Status in Coopersville
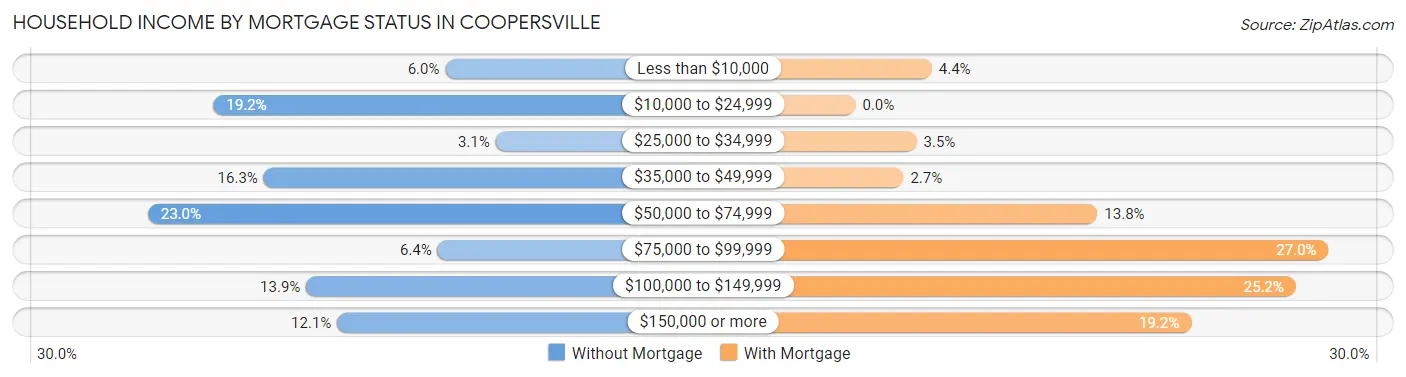
| Household Income | Without Mortgage | With Mortgage |
| Less than $10,000 | 27 (6.0%) | 35 (4.4%) |
| $10,000 to $24,999 | 87 (19.2%) | 0 (0.0%) |
| $25,000 to $34,999 | 14 (3.1%) | 28 (3.5%) |
| $35,000 to $49,999 | 74 (16.3%) | 22 (2.7%) |
| $50,000 to $74,999 | 104 (23.0%) | 111 (13.8%) |
| $75,000 to $99,999 | 29 (6.4%) | 217 (27.0%) |
| $100,000 to $149,999 | 63 (13.9%) | 202 (25.2%) |
| $150,000 or more | 55 (12.1%) | 154 (19.2%) |
| Total | 453 (100.0%) | 803 (100.0%) |
Property Value to Household Income Ratio in Coopersville
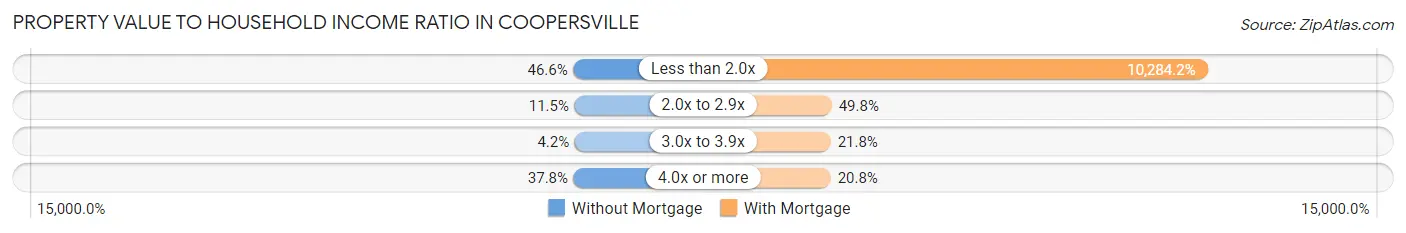
| Value-to-Income Ratio | Without Mortgage | With Mortgage |
| Less than 2.0x | 211 (46.6%) | 82,582 (10,284.2%) |
| 2.0x to 2.9x | 52 (11.5%) | 400 (49.8%) |
| 3.0x to 3.9x | 19 (4.2%) | 175 (21.8%) |
| 4.0x or more | 171 (37.8%) | 167 (20.8%) |
| Total | 453 (100.0%) | 803 (100.0%) |
Real Estate Taxes by Mortgage Status in Coopersville
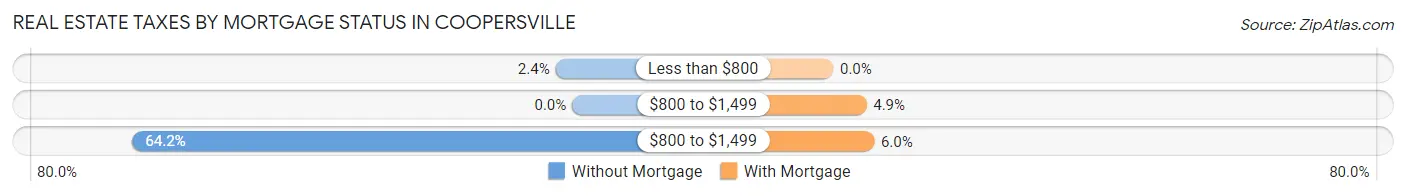
| Property Taxes | Without Mortgage | With Mortgage |
| Less than $800 | 11 (2.4%) | 0 (0.0%) |
| $800 to $1,499 | 0 (0.0%) | 39 (4.9%) |
| $800 to $1,499 | 291 (64.2%) | 48 (6.0%) |
| Total | 453 (100.0%) | 803 (100.0%) |
Health & Disability in Coopersville
Health Insurance Coverage by Age in Coopersville
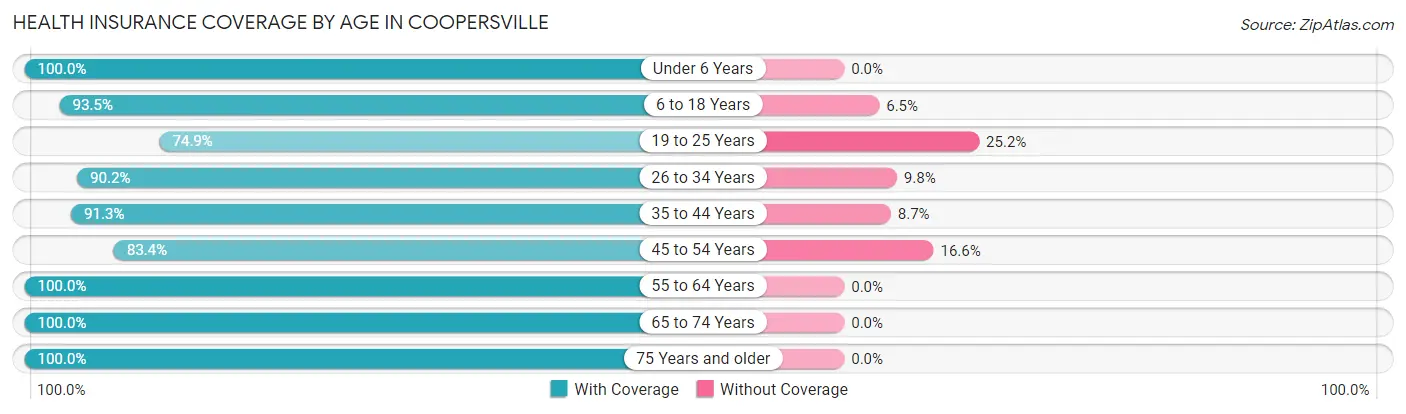
| Age Bracket | With Coverage | Without Coverage |
| Under 6 Years | 512 (100.0%) | 0 (0.0%) |
| 6 to 18 Years | 859 (93.5%) | 60 (6.5%) |
| 19 to 25 Years | 366 (74.9%) | 123 (25.2%) |
| 26 to 34 Years | 699 (90.2%) | 76 (9.8%) |
| 35 to 44 Years | 600 (91.3%) | 57 (8.7%) |
| 45 to 54 Years | 446 (83.4%) | 89 (16.6%) |
| 55 to 64 Years | 382 (100.0%) | 0 (0.0%) |
| 65 to 74 Years | 265 (100.0%) | 0 (0.0%) |
| 75 Years and older | 258 (100.0%) | 0 (0.0%) |
| Total | 4,387 (91.5%) | 405 (8.5%) |
Health Insurance Coverage by Citizenship Status in Coopersville
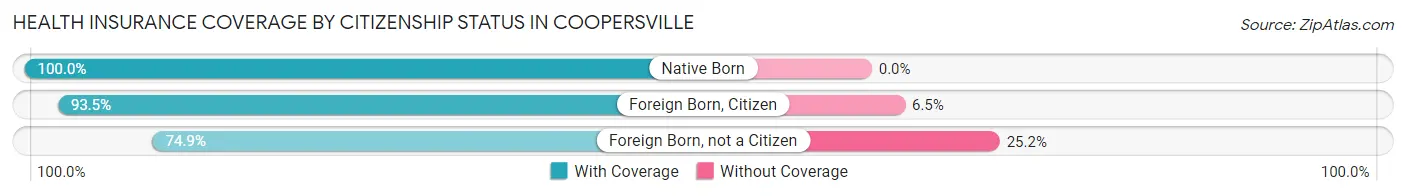
| Citizenship Status | With Coverage | Without Coverage |
| Native Born | 512 (100.0%) | 0 (0.0%) |
| Foreign Born, Citizen | 859 (93.5%) | 60 (6.5%) |
| Foreign Born, not a Citizen | 366 (74.9%) | 123 (25.2%) |
Health Insurance Coverage by Household Income in Coopersville
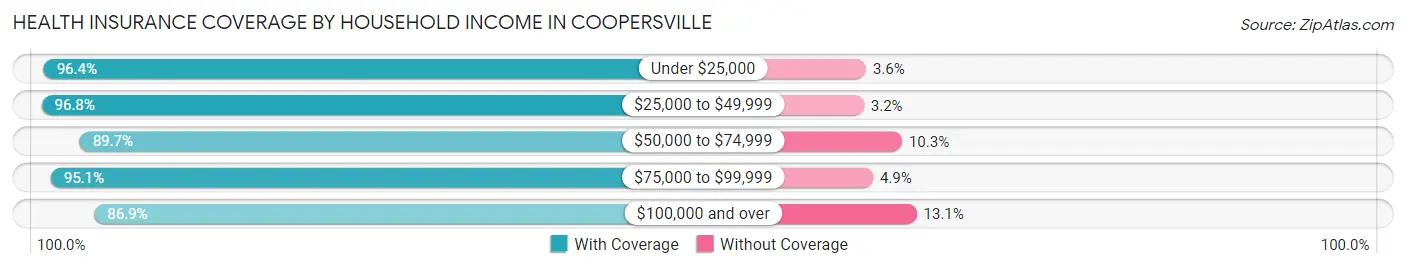
| Household Income | With Coverage | Without Coverage |
| Under $25,000 | 322 (96.4%) | 12 (3.6%) |
| $25,000 to $49,999 | 759 (96.8%) | 25 (3.2%) |
| $50,000 to $74,999 | 1,327 (89.7%) | 153 (10.3%) |
| $75,000 to $99,999 | 831 (95.1%) | 43 (4.9%) |
| $100,000 and over | 1,136 (86.9%) | 171 (13.1%) |
Public vs Private Health Insurance Coverage by Age in Coopersville
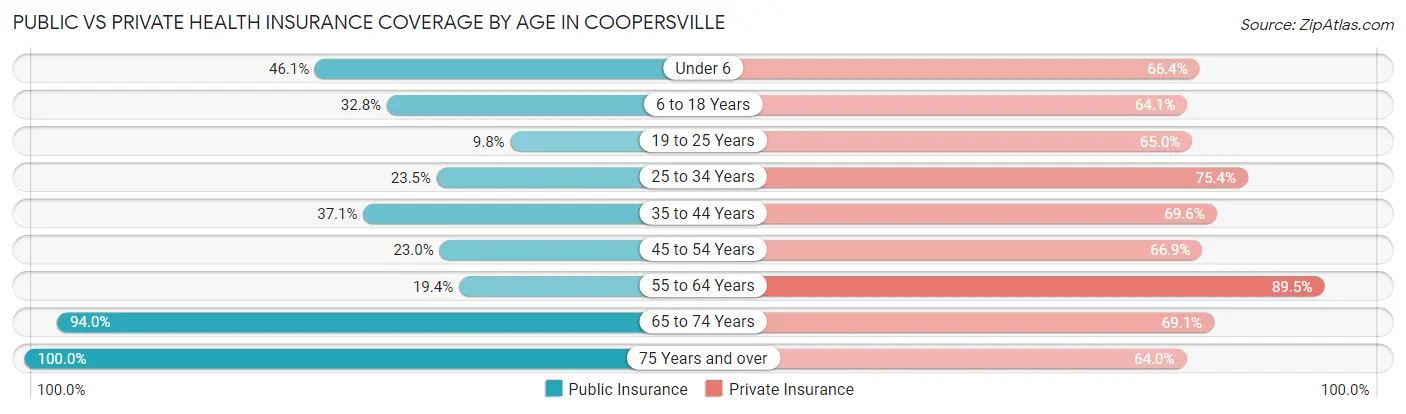
| Age Bracket | Public Insurance | Private Insurance |
| Under 6 | 236 (46.1%) | 340 (66.4%) |
| 6 to 18 Years | 301 (32.8%) | 589 (64.1%) |
| 19 to 25 Years | 48 (9.8%) | 318 (65.0%) |
| 25 to 34 Years | 182 (23.5%) | 584 (75.3%) |
| 35 to 44 Years | 244 (37.1%) | 457 (69.6%) |
| 45 to 54 Years | 123 (23.0%) | 358 (66.9%) |
| 55 to 64 Years | 74 (19.4%) | 342 (89.5%) |
| 65 to 74 Years | 249 (94.0%) | 183 (69.1%) |
| 75 Years and over | 258 (100.0%) | 165 (63.9%) |
| Total | 1,715 (35.8%) | 3,336 (69.6%) |
Disability Status by Sex by Age in Coopersville
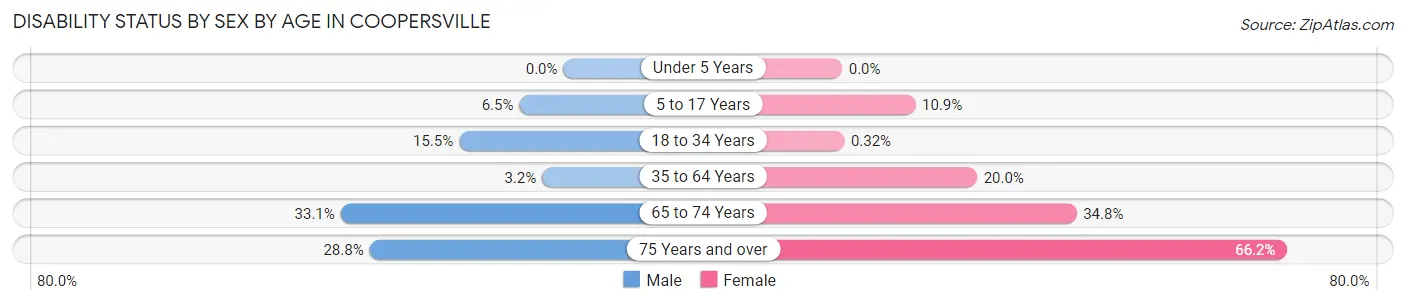
| Age Bracket | Male | Female |
| Under 5 Years | 0 (0.0%) | 0 (0.0%) |
| 5 to 17 Years | 39 (6.5%) | 42 (10.9%) |
| 18 to 34 Years | 99 (15.5%) | 2 (0.3%) |
| 35 to 64 Years | 25 (3.2%) | 157 (20.0%) |
| 65 to 74 Years | 43 (33.1%) | 47 (34.8%) |
| 75 Years and over | 19 (28.8%) | 127 (66.1%) |
Disability Class by Sex by Age in Coopersville
Disability Class: Hearing Difficulty
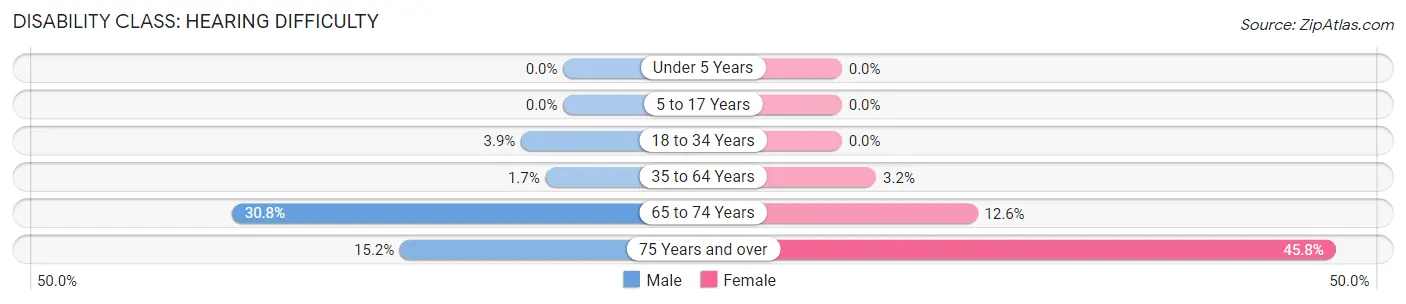
| Age Bracket | Male | Female |
| Under 5 Years | 0 (0.0%) | 0 (0.0%) |
| 5 to 17 Years | 0 (0.0%) | 0 (0.0%) |
| 18 to 34 Years | 25 (3.9%) | 0 (0.0%) |
| 35 to 64 Years | 13 (1.7%) | 25 (3.2%) |
| 65 to 74 Years | 40 (30.8%) | 17 (12.6%) |
| 75 Years and over | 10 (15.1%) | 88 (45.8%) |
Disability Class: Vision Difficulty
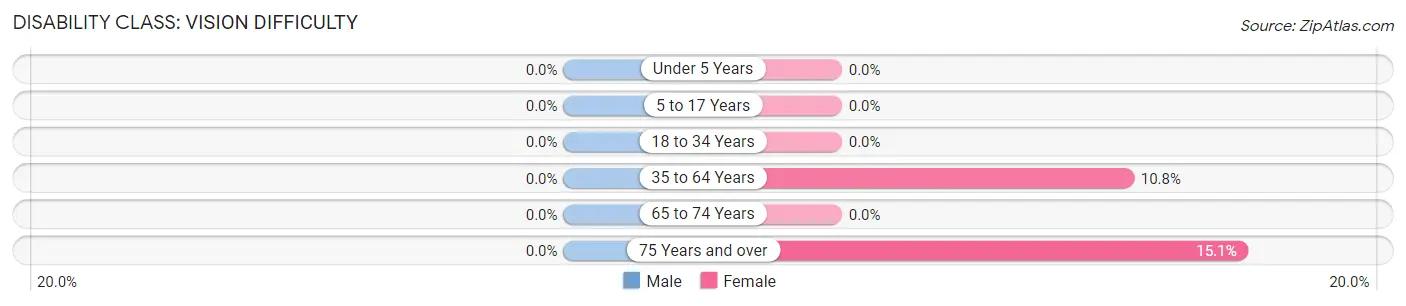
| Age Bracket | Male | Female |
| Under 5 Years | 0 (0.0%) | 0 (0.0%) |
| 5 to 17 Years | 0 (0.0%) | 0 (0.0%) |
| 18 to 34 Years | 0 (0.0%) | 0 (0.0%) |
| 35 to 64 Years | 0 (0.0%) | 85 (10.8%) |
| 65 to 74 Years | 0 (0.0%) | 0 (0.0%) |
| 75 Years and over | 0 (0.0%) | 29 (15.1%) |
Disability Class: Cognitive Difficulty
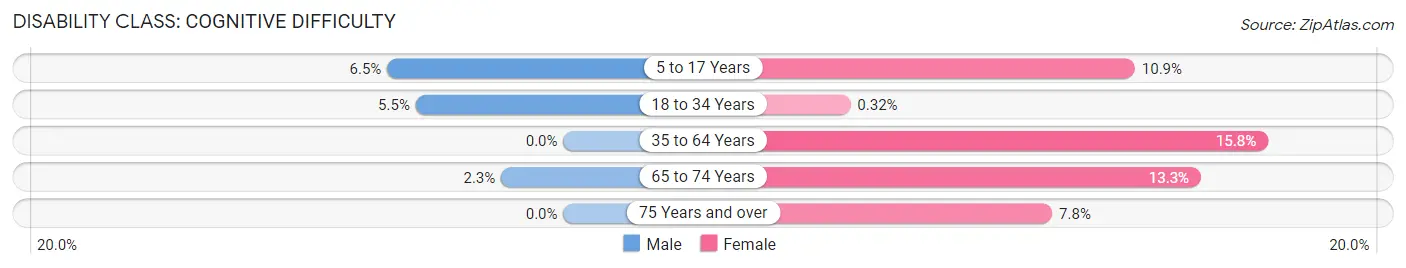
| Age Bracket | Male | Female |
| 5 to 17 Years | 39 (6.5%) | 42 (10.9%) |
| 18 to 34 Years | 35 (5.5%) | 2 (0.3%) |
| 35 to 64 Years | 0 (0.0%) | 124 (15.8%) |
| 65 to 74 Years | 3 (2.3%) | 18 (13.3%) |
| 75 Years and over | 0 (0.0%) | 15 (7.8%) |
Disability Class: Ambulatory Difficulty
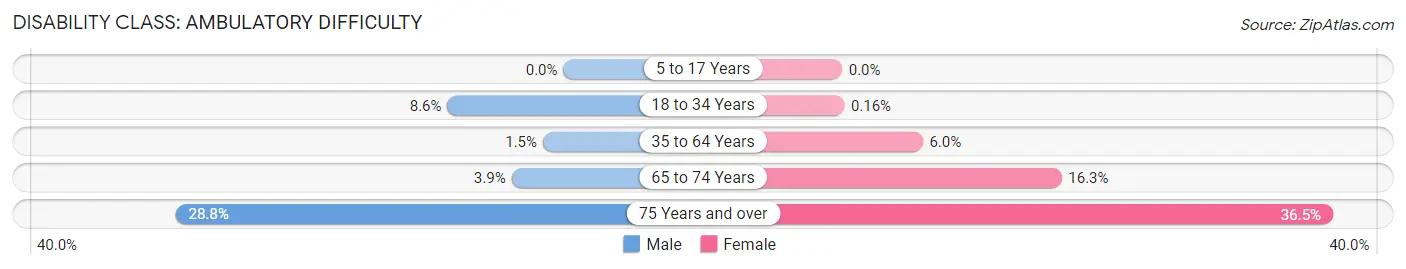
| Age Bracket | Male | Female |
| 5 to 17 Years | 0 (0.0%) | 0 (0.0%) |
| 18 to 34 Years | 55 (8.6%) | 1 (0.2%) |
| 35 to 64 Years | 12 (1.5%) | 47 (6.0%) |
| 65 to 74 Years | 5 (3.8%) | 22 (16.3%) |
| 75 Years and over | 19 (28.8%) | 70 (36.5%) |
Disability Class: Self-Care Difficulty
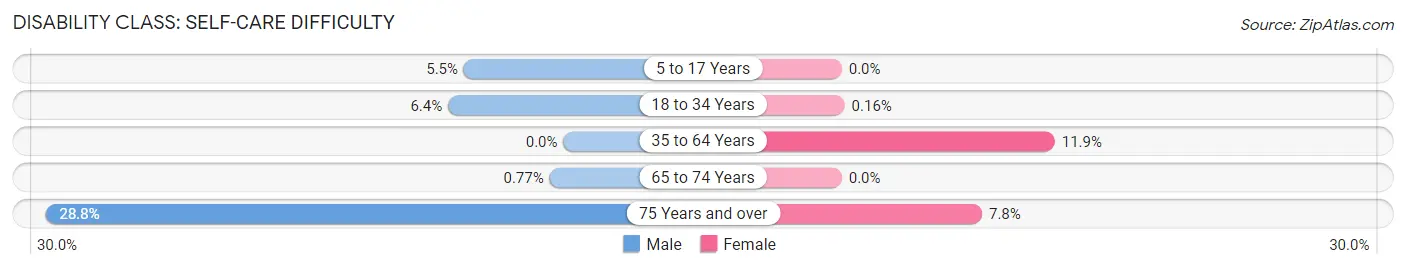
| Age Bracket | Male | Female |
| 5 to 17 Years | 33 (5.5%) | 0 (0.0%) |
| 18 to 34 Years | 41 (6.4%) | 1 (0.2%) |
| 35 to 64 Years | 0 (0.0%) | 93 (11.9%) |
| 65 to 74 Years | 1 (0.8%) | 0 (0.0%) |
| 75 Years and over | 19 (28.8%) | 15 (7.8%) |
Technology Access in Coopersville
Computing Device Access in Coopersville
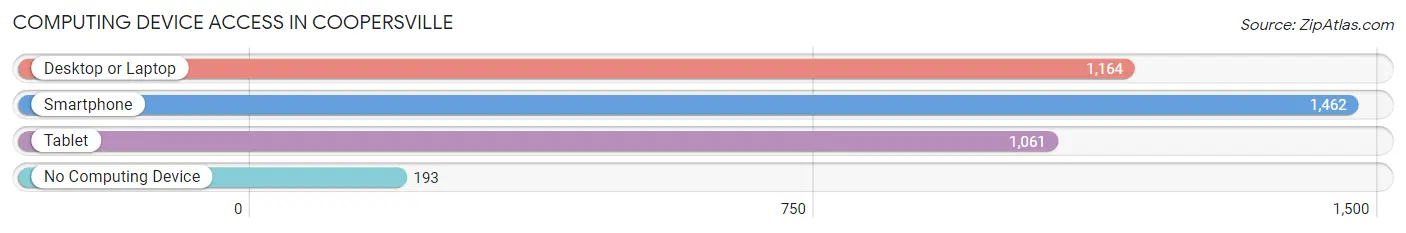
| Device Type | # Households | % Households |
| Desktop or Laptop | 1,164 | 68.0% |
| Smartphone | 1,462 | 85.4% |
| Tablet | 1,061 | 62.0% |
| No Computing Device | 193 | 11.3% |
| Total | 1,712 | 100.0% |
Internet Access in Coopersville
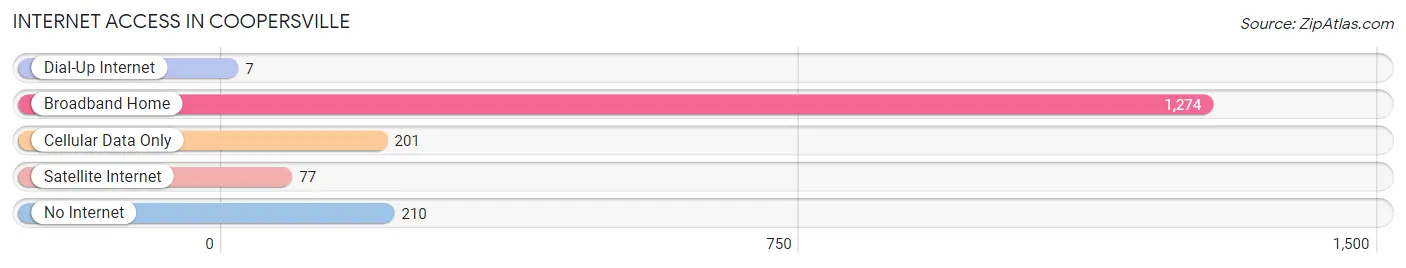
| Internet Type | # Households | % Households |
| Dial-Up Internet | 7 | 0.4% |
| Broadband Home | 1,274 | 74.4% |
| Cellular Data Only | 201 | 11.7% |
| Satellite Internet | 77 | 4.5% |
| No Internet | 210 | 12.3% |
| Total | 1,712 | 100.0% |
Coopersville Summary
Coopersville, Michigan is a small town located in Ottawa County, in the western part of the state. It is situated about 20 miles northwest of Grand Rapids, and is part of the greater Grand Rapids metropolitan area. The town has a population of about 3,000 people, and is known for its rural charm and small-town atmosphere.
History
Coopersville was founded in 1854 by William Cooper, a settler from New York. He purchased a large tract of land in the area and began to develop it into a small farming community. The town was originally known as Cooper's Station, and was later renamed Coopersville.
The town grew slowly over the years, and by the early 1900s had become a thriving agricultural center. The town was home to several large farms, as well as a number of small businesses. The town also had a railroad station, which allowed for easy transportation of goods and people.
In the 1950s, Coopersville began to experience a period of growth and development. The town was home to several new businesses, including a grocery store, a hardware store, and a bank. The town also had a number of churches, and a public school system.
Geography
Coopersville is located in the western part of Ottawa County, in the state of Michigan. The town is situated about 20 miles northwest of Grand Rapids, and is part of the greater Grand Rapids metropolitan area. The town is located on the banks of the Grand River, and is surrounded by rolling hills and farmland.
The town has a total area of 4.2 square miles, all of which is land. The town has a humid continental climate, with cold winters and warm summers. The average annual temperature is around 50 degrees Fahrenheit.
Economy
Coopersville has a strong agricultural economy, with many of the town's residents employed in farming and related industries. The town is home to several large farms, as well as a number of small businesses. The town also has a number of manufacturing and service-based businesses, including a grocery store, a hardware store, and a bank.
The town is also home to a number of tourist attractions, including the Coopersville Historical Museum, the Coopersville Farm Museum, and the Coopersville Antique Mall. The town also has a number of parks and recreational areas, including the Coopersville City Park and the Coopersville Nature Preserve.
Demographics
As of the 2010 census, Coopersville had a population of 3,000 people. The town has a median age of 39.7 years, and a median household income of $45,000. The town is predominantly white, with about 90% of the population identifying as Caucasian. The town also has a small Hispanic population, with about 5% of the population identifying as Hispanic or Latino. The town also has a small African American population, with about 2% of the population identifying as African American.
Common Questions
What is Per Capita Income in Coopersville?
Per Capita income in Coopersville is $26,915.
What is the Median Family Income in Coopersville?
Median Family Income in Coopersville is $64,866.
What is the Median Household income in Coopersville?
Median Household Income in Coopersville is $62,995.
What is Income or Wage Gap in Coopersville?
Income or Wage Gap in Coopersville is 23.3%.
Women in Coopersville earn 76.7 cents for every dollar earned by a man.
What is Inequality or Gini Index in Coopersville?
Inequality or Gini Index in Coopersville is 0.37.
What is the Total Population of Coopersville?
Total Population of Coopersville is 4,804.
What is the Total Male Population of Coopersville?
Total Male Population of Coopersville is 2,536.
What is the Total Female Population of Coopersville?
Total Female Population of Coopersville is 2,268.
What is the Ratio of Males per 100 Females in Coopersville?
There are 111.82 Males per 100 Females in Coopersville.
What is the Ratio of Females per 100 Males in Coopersville?
There are 89.43 Females per 100 Males in Coopersville.
What is the Median Population Age in Coopersville?
Median Population Age in Coopersville is 31.2 Years.
What is the Average Family Size in Coopersville
Average Family Size in Coopersville is 3.1 People.
What is the Average Household Size in Coopersville
Average Household Size in Coopersville is 2.8 People.
How Large is the Labor Force in Coopersville?
There are 2,458 People in the Labor Forcein in Coopersville.
What is the Percentage of People in the Labor Force in Coopersville?
70.1% of People are in the Labor Force in Coopersville.
What is the Unemployment Rate in Coopersville?
Unemployment Rate in Coopersville is 7.5%.