Zip Codes with the Lowest Poverty Level Among Children Under the Age of 5 in Michigan
RELATED REPORTS & OPTIONS
Lowest Poverty | Child 0-5
Michigan
Compare Zip Codes
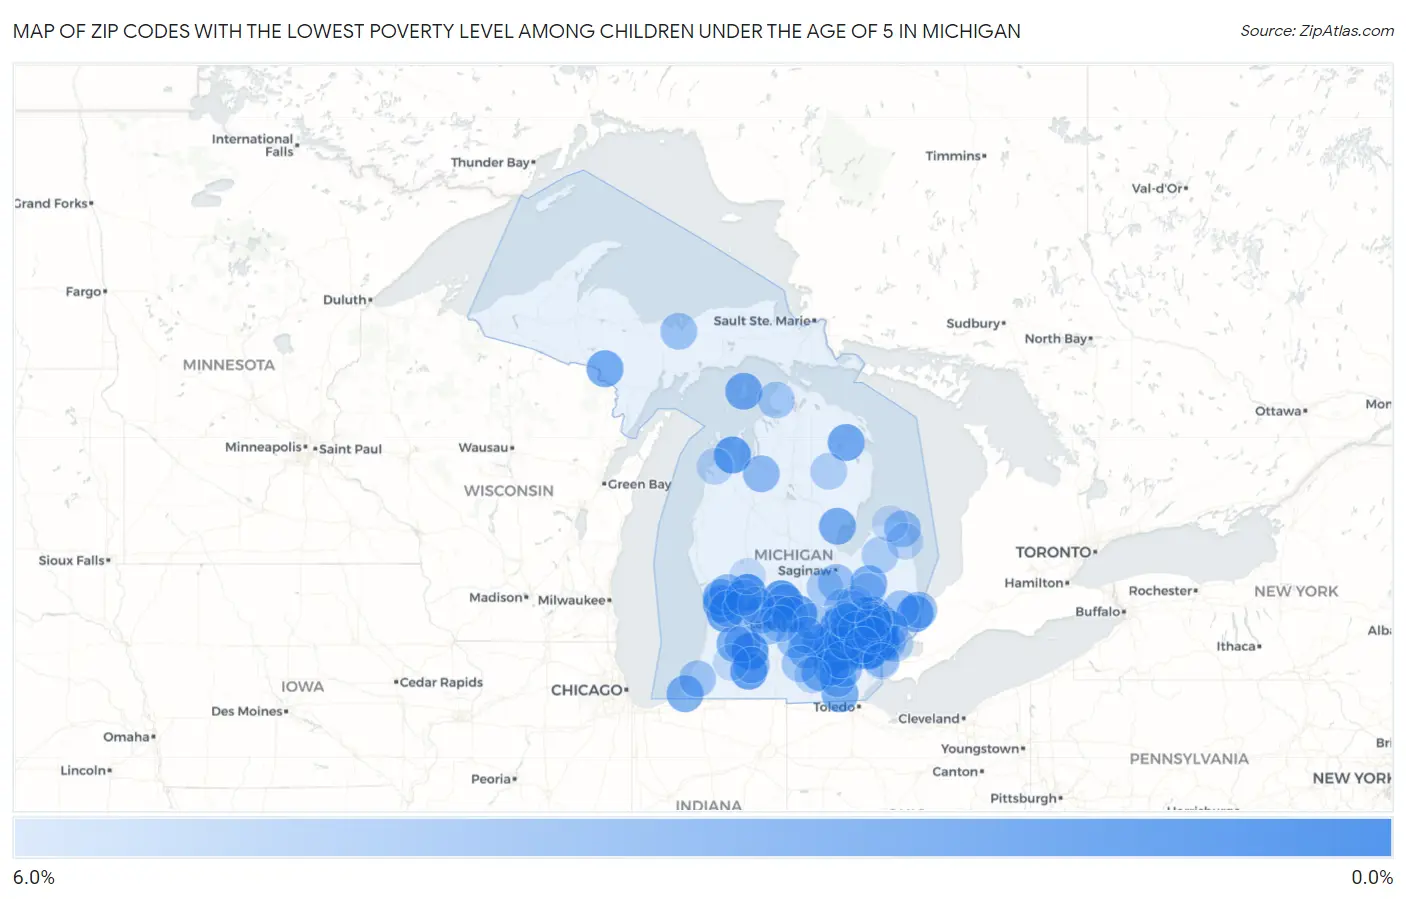
Map of Zip Codes with the Lowest Poverty Level Among Children Under the Age of 5 in Michigan
6.0%
0.0%
Zip Codes with the Lowest Poverty Level Among Children Under the Age of 5 in Michigan
| Zip Code | Child Poverty | vs State | vs National | |
| 1. | 48067 | 0.47% | 20.1%(-19.6)#1 | 18.1%(-17.6)#52 |
| 2. | 49341 | 0.51% | 20.1%(-19.6)#2 | 18.1%(-17.6)#65 |
| 3. | 49083 | 0.53% | 20.1%(-19.6)#3 | 18.1%(-17.5)#67 |
| 4. | 48154 | 0.63% | 20.1%(-19.5)#4 | 18.1%(-17.4)#105 |
| 5. | 48860 | 0.72% | 20.1%(-19.4)#5 | 18.1%(-17.3)#137 |
| 6. | 48168 | 0.89% | 20.1%(-19.2)#6 | 18.1%(-17.2)#223 |
| 7. | 49621 | 0.90% | 20.1%(-19.2)#7 | 18.1%(-17.2)#231 |
| 8. | 48306 | 0.93% | 20.1%(-19.2)#8 | 18.1%(-17.1)#247 |
| 9. | 48820 | 1.0% | 20.1%(-19.1)#9 | 18.1%(-17.0)#294 |
| 10. | 48855 | 1.2% | 20.1%(-18.9)#10 | 18.1%(-16.9)#384 |
| 11. | 49097 | 1.2% | 20.1%(-18.9)#11 | 18.1%(-16.8)#393 |
| 12. | 48073 | 1.3% | 20.1%(-18.9)#12 | 18.1%(-16.8)#400 |
| 13. | 48167 | 1.4% | 20.1%(-18.7)#13 | 18.1%(-16.6)#482 |
| 14. | 49401 | 1.4% | 20.1%(-18.7)#14 | 18.1%(-16.6)#496 |
| 15. | 48130 | 1.4% | 20.1%(-18.7)#15 | 18.1%(-16.6)#497 |
| 16. | 48371 | 1.5% | 20.1%(-18.6)#16 | 18.1%(-16.6)#517 |
| 17. | 49782 | 1.5% | 20.1%(-18.6)#17 | 18.1%(-16.5)#557 |
| 18. | 49426 | 1.5% | 20.1%(-18.6)#18 | 18.1%(-16.5)#559 |
| 19. | 48079 | 1.6% | 20.1%(-18.5)#19 | 18.1%(-16.5)#581 |
| 20. | 49753 | 1.6% | 20.1%(-18.5)#20 | 18.1%(-16.5)#587 |
| 21. | 49801 | 1.7% | 20.1%(-18.4)#21 | 18.1%(-16.3)#657 |
| 22. | 48118 | 1.9% | 20.1%(-18.3)#22 | 18.1%(-16.2)#748 |
| 23. | 48658 | 1.9% | 20.1%(-18.2)#23 | 18.1%(-16.1)#783 |
| 24. | 49285 | 2.1% | 20.1%(-18.0)#24 | 18.1%(-16.0)#898 |
| 25. | 49404 | 2.1% | 20.1%(-18.0)#25 | 18.1%(-15.9)#924 |
| 26. | 49228 | 2.2% | 20.1%(-18.0)#26 | 18.1%(-15.9)#940 |
| 27. | 49230 | 2.2% | 20.1%(-18.0)#27 | 18.1%(-15.9)#941 |
| 28. | 49128 | 2.2% | 20.1%(-18.0)#28 | 18.1%(-15.9)#944 |
| 29. | 48435 | 2.2% | 20.1%(-17.9)#29 | 18.1%(-15.8)#985 |
| 30. | 48137 | 2.3% | 20.1%(-17.8)#30 | 18.1%(-15.8)#1,026 |
| 31. | 49078 | 2.3% | 20.1%(-17.8)#31 | 18.1%(-15.7)#1,045 |
| 32. | 48815 | 2.4% | 20.1%(-17.8)#32 | 18.1%(-15.7)#1,060 |
| 33. | 48843 | 2.4% | 20.1%(-17.8)#33 | 18.1%(-15.7)#1,068 |
| 34. | 48323 | 2.4% | 20.1%(-17.7)#34 | 18.1%(-15.7)#1,088 |
| 35. | 48393 | 2.4% | 20.1%(-17.7)#35 | 18.1%(-15.6)#1,122 |
| 36. | 48873 | 2.6% | 20.1%(-17.5)#36 | 18.1%(-15.5)#1,228 |
| 37. | 48335 | 2.7% | 20.1%(-17.5)#37 | 18.1%(-15.4)#1,262 |
| 38. | 48875 | 2.7% | 20.1%(-17.4)#38 | 18.1%(-15.3)#1,308 |
| 39. | 49277 | 2.7% | 20.1%(-17.4)#39 | 18.1%(-15.3)#1,315 |
| 40. | 48150 | 2.8% | 20.1%(-17.4)#40 | 18.1%(-15.3)#1,333 |
| 41. | 48009 | 2.8% | 20.1%(-17.3)#41 | 18.1%(-15.2)#1,391 |
| 42. | 49680 | 2.9% | 20.1%(-17.2)#42 | 18.1%(-15.2)#1,437 |
| 43. | 48170 | 2.9% | 20.1%(-17.2)#43 | 18.1%(-15.1)#1,459 |
| 44. | 48346 | 2.9% | 20.1%(-17.2)#44 | 18.1%(-15.1)#1,471 |
| 45. | 49080 | 2.9% | 20.1%(-17.2)#45 | 18.1%(-15.1)#1,473 |
| 46. | 49286 | 3.0% | 20.1%(-17.1)#46 | 18.1%(-15.1)#1,502 |
| 47. | 48439 | 3.0% | 20.1%(-17.1)#47 | 18.1%(-15.0)#1,510 |
| 48. | 48098 | 3.1% | 20.1%(-17.1)#48 | 18.1%(-15.0)#1,550 |
| 49. | 49088 | 3.1% | 20.1%(-17.0)#49 | 18.1%(-15.0)#1,566 |
| 50. | 49403 | 3.1% | 20.1%(-17.0)#50 | 18.1%(-14.9)#1,587 |
| 51. | 48176 | 3.1% | 20.1%(-17.0)#51 | 18.1%(-14.9)#1,596 |
| 52. | 48353 | 3.1% | 20.1%(-17.0)#52 | 18.1%(-14.9)#1,601 |
| 53. | 48040 | 3.2% | 20.1%(-16.9)#53 | 18.1%(-14.8)#1,647 |
| 54. | 48158 | 3.3% | 20.1%(-16.9)#54 | 18.1%(-14.8)#1,674 |
| 55. | 48417 | 3.3% | 20.1%(-16.8)#55 | 18.1%(-14.8)#1,705 |
| 56. | 48468 | 3.3% | 20.1%(-16.8)#56 | 18.1%(-14.7)#1,724 |
| 57. | 49428 | 3.4% | 20.1%(-16.8)#57 | 18.1%(-14.7)#1,739 |
| 58. | 48103 | 3.4% | 20.1%(-16.7)#58 | 18.1%(-14.6)#1,773 |
| 59. | 48827 | 3.4% | 20.1%(-16.7)#59 | 18.1%(-14.6)#1,779 |
| 60. | 48897 | 3.4% | 20.1%(-16.7)#60 | 18.1%(-14.6)#1,795 |
| 61. | 48041 | 3.5% | 20.1%(-16.7)#61 | 18.1%(-14.6)#1,808 |
| 62. | 49862 | 3.5% | 20.1%(-16.6)#62 | 18.1%(-14.6)#1,826 |
| 63. | 49126 | 3.5% | 20.1%(-16.6)#63 | 18.1%(-14.6)#1,831 |
| 64. | 48822 | 3.6% | 20.1%(-16.5)#64 | 18.1%(-14.5)#1,880 |
| 65. | 49506 | 3.6% | 20.1%(-16.5)#65 | 18.1%(-14.4)#1,885 |
| 66. | 48840 | 3.7% | 20.1%(-16.5)#66 | 18.1%(-14.4)#1,922 |
| 67. | 48854 | 3.7% | 20.1%(-16.4)#67 | 18.1%(-14.4)#1,943 |
| 68. | 48116 | 3.7% | 20.1%(-16.4)#68 | 18.1%(-14.4)#1,963 |
| 69. | 48462 | 3.7% | 20.1%(-16.4)#69 | 18.1%(-14.3)#1,974 |
| 70. | 48015 | 3.7% | 20.1%(-16.4)#70 | 18.1%(-14.3)#1,978 |
| 71. | 49283 | 3.7% | 20.1%(-16.4)#71 | 18.1%(-14.3)#1,988 |
| 72. | 48315 | 3.8% | 20.1%(-16.4)#72 | 18.1%(-14.3)#1,996 |
| 73. | 49740 | 3.8% | 20.1%(-16.3)#73 | 18.1%(-14.2)#2,057 |
| 74. | 48329 | 3.9% | 20.1%(-16.3)#74 | 18.1%(-14.2)#2,076 |
| 75. | 48473 | 3.9% | 20.1%(-16.2)#75 | 18.1%(-14.2)#2,089 |
| 76. | 48451 | 4.1% | 20.1%(-16.0)#76 | 18.1%(-14.0)#2,238 |
| 77. | 48616 | 4.1% | 20.1%(-16.0)#77 | 18.1%(-13.9)#2,269 |
| 78. | 48726 | 4.1% | 20.1%(-16.0)#78 | 18.1%(-13.9)#2,280 |
| 79. | 48324 | 4.2% | 20.1%(-16.0)#79 | 18.1%(-13.9)#2,291 |
| 80. | 48217 | 4.2% | 20.1%(-15.9)#80 | 18.1%(-13.9)#2,325 |
| 81. | 48647 | 4.2% | 20.1%(-15.9)#81 | 18.1%(-13.9)#2,346 |
| 82. | 48430 | 4.3% | 20.1%(-15.9)#82 | 18.1%(-13.8)#2,380 |
| 83. | 48080 | 4.3% | 20.1%(-15.8)#83 | 18.1%(-13.7)#2,429 |
| 84. | 49331 | 4.4% | 20.1%(-15.7)#84 | 18.1%(-13.7)#2,479 |
| 85. | 48362 | 4.4% | 20.1%(-15.7)#85 | 18.1%(-13.7)#2,483 |
| 86. | 49233 | 4.4% | 20.1%(-15.7)#86 | 18.1%(-13.6)#2,506 |
| 87. | 48861 | 4.5% | 20.1%(-15.7)#87 | 18.1%(-13.6)#2,528 |
| 88. | 48356 | 4.5% | 20.1%(-15.6)#88 | 18.1%(-13.6)#2,560 |
| 89. | 49640 | 4.5% | 20.1%(-15.6)#89 | 18.1%(-13.5)#2,592 |
| 90. | 48360 | 4.6% | 20.1%(-15.5)#90 | 18.1%(-13.5)#2,622 |
| 91. | 49306 | 4.6% | 20.1%(-15.5)#91 | 18.1%(-13.5)#2,634 |
| 92. | 48441 | 4.6% | 20.1%(-15.5)#92 | 18.1%(-13.4)#2,651 |
| 93. | 48302 | 4.7% | 20.1%(-15.4)#93 | 18.1%(-13.3)#2,715 |
| 94. | 48375 | 4.8% | 20.1%(-15.3)#94 | 18.1%(-13.3)#2,765 |
| 95. | 48519 | 4.8% | 20.1%(-15.3)#95 | 18.1%(-13.3)#2,770 |
| 96. | 48229 | 4.9% | 20.1%(-15.2)#96 | 18.1%(-13.1)#2,840 |
| 97. | 48421 | 5.0% | 20.1%(-15.2)#97 | 18.1%(-13.1)#2,875 |
| 98. | 48467 | 5.0% | 20.1%(-15.1)#98 | 18.1%(-13.1)#2,904 |
| 99. | 49339 | 5.0% | 20.1%(-15.1)#99 | 18.1%(-13.1)#2,905 |
| 100. | 49071 | 5.0% | 20.1%(-15.1)#100 | 18.1%(-13.0)#2,928 |
Common Questions
What are the Top 10 Zip Codes with the Lowest Poverty Level Among Children Under the Age of 5 in Michigan?
Top 10 Zip Codes with the Lowest Poverty Level Among Children Under the Age of 5 in Michigan are:
What zip code has the Lowest Poverty Level Among Children Under the Age of 5 in Michigan?
48067 has the Lowest Poverty Level Among Children Under the Age of 5 in Michigan with 0.47%.
What is the Poverty Level Among Children Under the Age of 5 in the State of Michigan?
Poverty Level Among Children Under the Age of 5 in Michigan is 20.1%.
What is the Poverty Level Among Children Under the Age of 5 in the United States?
Poverty Level Among Children Under the Age of 5 in the United States is 18.1%.