Caro, MI Map & Demographics
Caro Map
Caro Overview
$27,429
PER CAPITA INCOME
$53,929
AVG FAMILY INCOME
$44,342
AVG HOUSEHOLD INCOME
20.8%
WAGE / INCOME GAP [ % ]
79.2¢/ $1
WAGE / INCOME GAP [ $ ]
0.45
INEQUALITY / GINI INDEX
4,294
TOTAL POPULATION
2,185
MALE POPULATION
2,109
FEMALE POPULATION
103.60
MALES / 100 FEMALES
96.52
FEMALES / 100 MALES
40.5
MEDIAN AGE
3.0
AVG FAMILY SIZE
2.1
AVG HOUSEHOLD SIZE
1,743
LABOR FORCE [ PEOPLE ]
51.0%
PERCENT IN LABOR FORCE
10.3%
UNEMPLOYMENT RATE
Caro Zip Codes
Caro Area Codes
Income in Caro
Income Overview in Caro
Per Capita Income in Caro is $27,429, while median incomes of families and households are $53,929 and $44,342 respectively.
| Characteristic | Number | Measure |
| Per Capita Income | 4,294 | $27,429 |
| Median Family Income | 930 | $53,929 |
| Mean Family Income | 930 | $74,987 |
| Median Household Income | 1,880 | $44,342 |
| Mean Household Income | 1,880 | $59,002 |
| Income Deficit | 930 | $0 |
| Wage / Income Gap (%) | 4,294 | 20.77% |
| Wage / Income Gap ($) | 4,294 | 79.23¢ per $1 |
| Gini / Inequality Index | 4,294 | 0.45 |
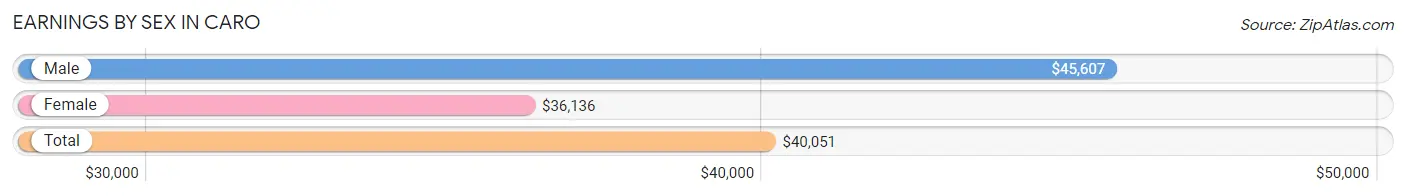
Earnings by Sex in Caro
Average Earnings in Caro are $40,051, $45,607 for men and $36,136 for women, a difference of 20.8%.
| Sex | Number | Average Earnings |
| Male | 952 (52.6%) | $45,607 |
| Female | 858 (47.4%) | $36,136 |
| Total | 1,810 (100.0%) | $40,051 |
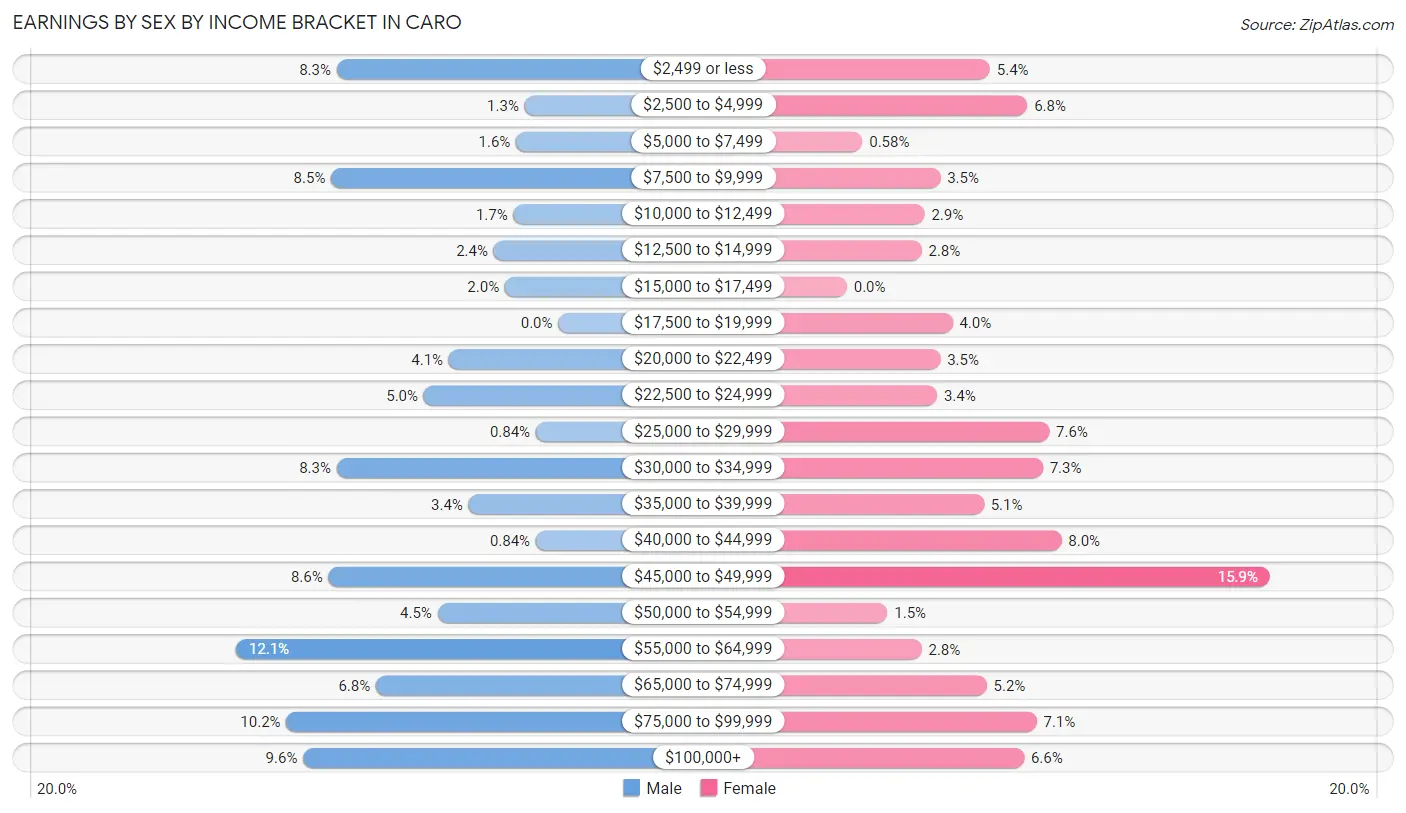
Earnings by Sex by Income Bracket in Caro
The most common earnings brackets in Caro are $55,000 to $64,999 for men (115 | 12.1%) and $45,000 to $49,999 for women (136 | 15.9%).
| Income | Male | Female |
| $2,499 or less | 79 (8.3%) | 46 (5.4%) |
| $2,500 to $4,999 | 12 (1.3%) | 58 (6.8%) |
| $5,000 to $7,499 | 15 (1.6%) | 5 (0.6%) |
| $7,500 to $9,999 | 81 (8.5%) | 30 (3.5%) |
| $10,000 to $12,499 | 16 (1.7%) | 25 (2.9%) |
| $12,500 to $14,999 | 23 (2.4%) | 24 (2.8%) |
| $15,000 to $17,499 | 19 (2.0%) | 0 (0.0%) |
| $17,500 to $19,999 | 0 (0.0%) | 34 (4.0%) |
| $20,000 to $22,499 | 39 (4.1%) | 30 (3.5%) |
| $22,500 to $24,999 | 48 (5.0%) | 29 (3.4%) |
| $25,000 to $29,999 | 8 (0.8%) | 65 (7.6%) |
| $30,000 to $34,999 | 79 (8.3%) | 63 (7.3%) |
| $35,000 to $39,999 | 32 (3.4%) | 44 (5.1%) |
| $40,000 to $44,999 | 8 (0.8%) | 69 (8.0%) |
| $45,000 to $49,999 | 82 (8.6%) | 136 (15.9%) |
| $50,000 to $54,999 | 43 (4.5%) | 13 (1.5%) |
| $55,000 to $64,999 | 115 (12.1%) | 24 (2.8%) |
| $65,000 to $74,999 | 65 (6.8%) | 45 (5.2%) |
| $75,000 to $99,999 | 97 (10.2%) | 61 (7.1%) |
| $100,000+ | 91 (9.6%) | 57 (6.6%) |
| Total | 952 (100.0%) | 858 (100.0%) |
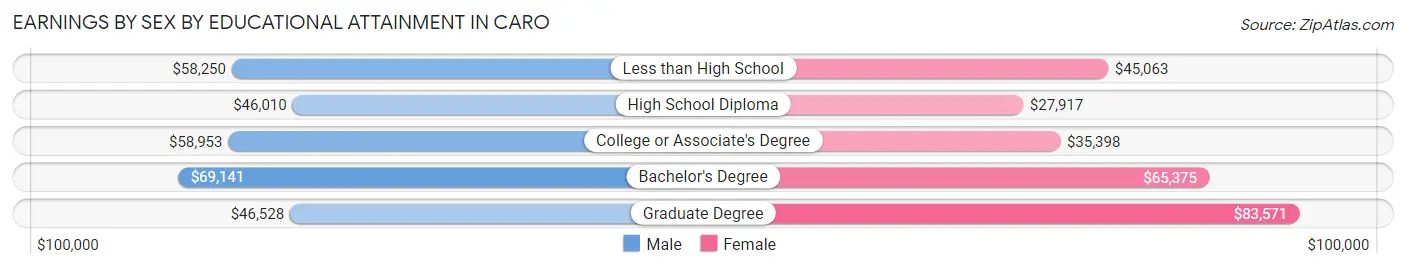
Earnings by Sex by Educational Attainment in Caro
Average earnings in Caro are $55,234 for men and $40,740 for women, a difference of 26.2%. Men with an educational attainment of bachelor's degree enjoy the highest average annual earnings of $69,141, while those with high school diploma education earn the least with $46,010. Women with an educational attainment of graduate degree earn the most with the average annual earnings of $83,571, while those with high school diploma education have the smallest earnings of $27,917.
| Educational Attainment | Male Income | Female Income |
| Less than High School | $58,250 | $45,063 |
| High School Diploma | $46,010 | $27,917 |
| College or Associate's Degree | $58,953 | $35,398 |
| Bachelor's Degree | $69,141 | $65,375 |
| Graduate Degree | $46,528 | $83,571 |
| Total | $55,234 | $40,740 |
Family Income in Caro
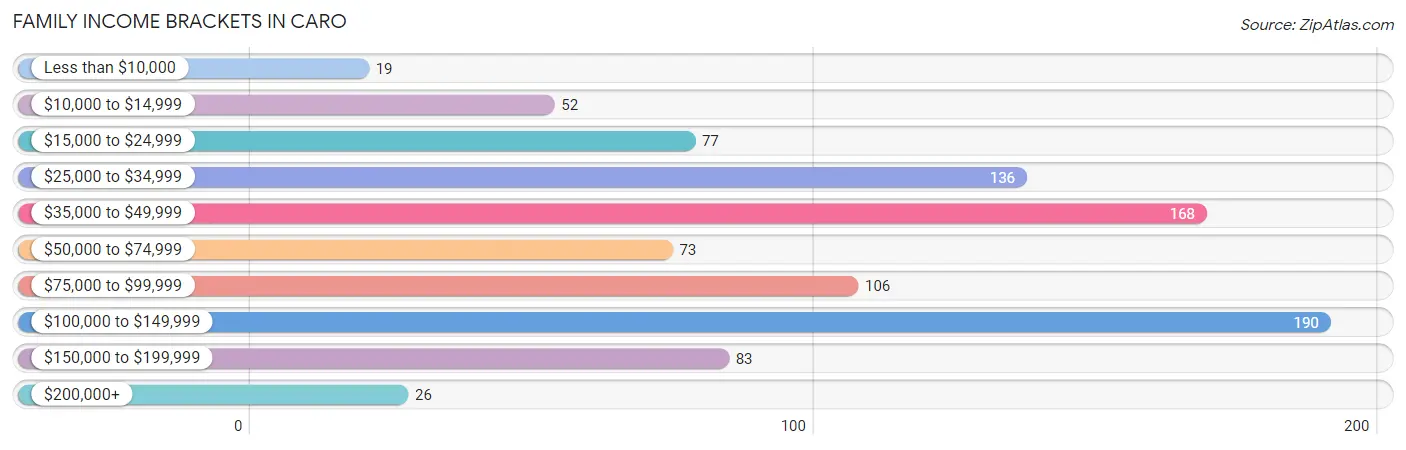
Family Income Brackets in Caro
According to the Caro family income data, there are 190 families falling into the $100,000 to $149,999 income range, which is the most common income bracket and makes up 20.4% of all families. Conversely, the less than $10,000 income bracket is the least frequent group with only 19 families (2.0%) belonging to this category.
| Income Bracket | # Families | % Families |
| Less than $10,000 | 19 | 2.0% |
| $10,000 to $14,999 | 52 | 5.6% |
| $15,000 to $24,999 | 77 | 8.3% |
| $25,000 to $34,999 | 136 | 14.6% |
| $35,000 to $49,999 | 168 | 18.1% |
| $50,000 to $74,999 | 73 | 7.8% |
| $75,000 to $99,999 | 106 | 11.4% |
| $100,000 to $149,999 | 190 | 20.4% |
| $150,000 to $199,999 | 83 | 8.9% |
| $200,000+ | 26 | 2.8% |
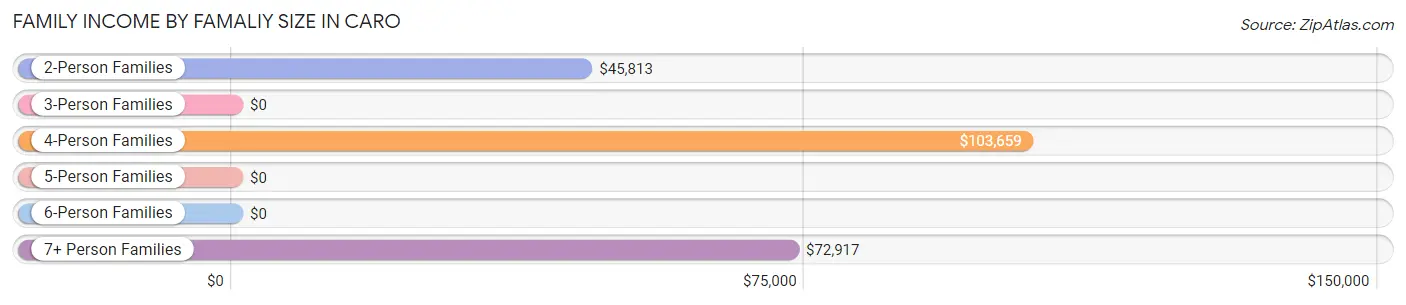
Family Income by Famaliy Size in Caro
4-person families (184 | 19.8%) account for the highest median family income in Caro with $103,659 per family, while 4-person families (184 | 19.8%) have the highest median income of $25,915 per family member.
| Income Bracket | # Families | Median Income |
| 2-Person Families | 464 (49.9%) | $45,813 |
| 3-Person Families | 215 (23.1%) | $0 |
| 4-Person Families | 184 (19.8%) | $103,659 |
| 5-Person Families | 33 (3.5%) | $0 |
| 6-Person Families | 0 (0.0%) | $0 |
| 7+ Person Families | 34 (3.7%) | $72,917 |
| Total | 930 (100.0%) | $53,929 |
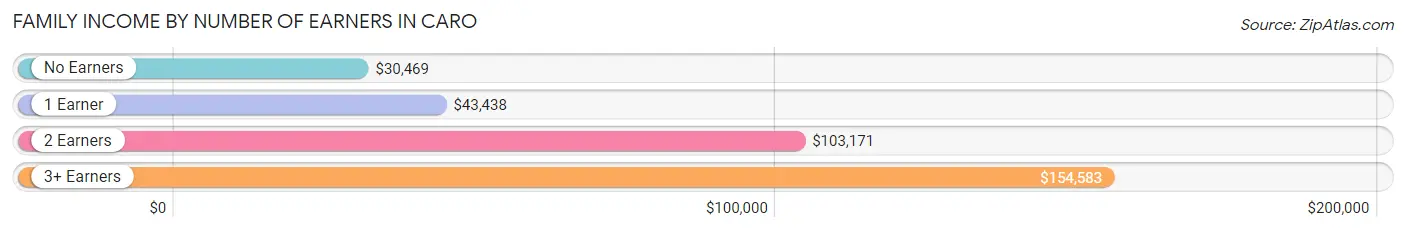
Family Income by Number of Earners in Caro
The median family income in Caro is $53,929, with families comprising 3+ earners (73) having the highest median family income of $154,583, while families with no earners (192) have the lowest median family income of $30,469, accounting for 7.9% and 20.6% of families, respectively.
| Number of Earners | # Families | Median Income |
| No Earners | 192 (20.6%) | $30,469 |
| 1 Earner | 371 (39.9%) | $43,438 |
| 2 Earners | 294 (31.6%) | $103,171 |
| 3+ Earners | 73 (7.9%) | $154,583 |
| Total | 930 (100.0%) | $53,929 |
Household Income in Caro
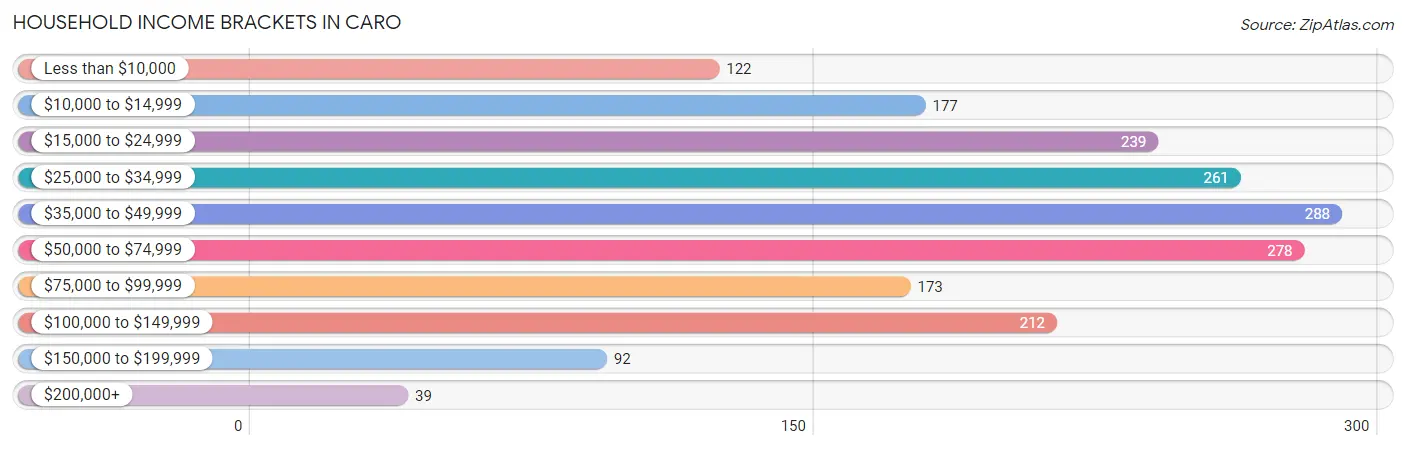
Household Income Brackets in Caro
With 288 households falling in the category, the $35,000 to $49,999 income range is the most frequent in Caro, accounting for 15.3% of all households. In contrast, only 39 households (2.1%) fall into the $200,000+ income bracket, making it the least populous group.
| Income Bracket | # Households | % Households |
| Less than $10,000 | 122 | 6.5% |
| $10,000 to $14,999 | 177 | 9.4% |
| $15,000 to $24,999 | 239 | 12.7% |
| $25,000 to $34,999 | 261 | 13.9% |
| $35,000 to $49,999 | 288 | 15.3% |
| $50,000 to $74,999 | 278 | 14.8% |
| $75,000 to $99,999 | 173 | 9.2% |
| $100,000 to $149,999 | 212 | 11.3% |
| $150,000 to $199,999 | 92 | 4.9% |
| $200,000+ | 39 | 2.1% |
Household Income by Householder Age in Caro
The median household income in Caro is $44,342, with the highest median household income of $72,632 found in the 25 to 44 years age bracket for the primary householder. A total of 542 households (28.8%) fall into this category. Meanwhile, the 65+ years age bracket for the primary householder has the lowest median household income of $31,546, with 637 households (33.9%) in this group.
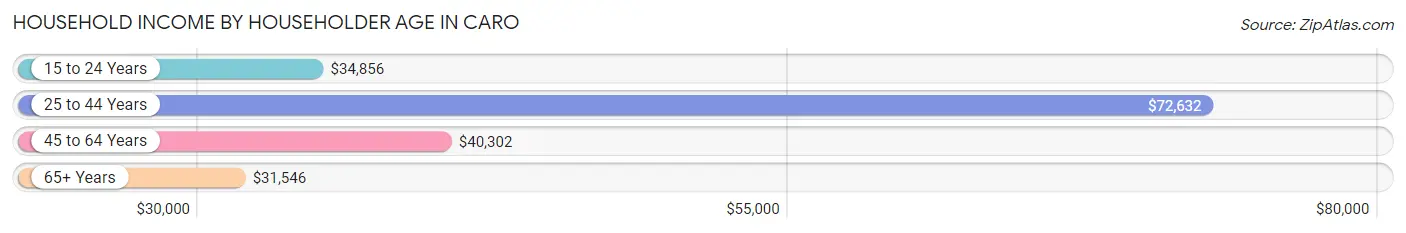
| Income Bracket | # Households | Median Income |
| 15 to 24 Years | 49 (2.6%) | $34,856 |
| 25 to 44 Years | 542 (28.8%) | $72,632 |
| 45 to 64 Years | 652 (34.7%) | $40,302 |
| 65+ Years | 637 (33.9%) | $31,546 |
| Total | 1,880 (100.0%) | $44,342 |
Poverty in Caro
Income Below Poverty by Sex and Age in Caro
With 18.8% poverty level for males and 19.7% for females among the residents of Caro, 55 to 64 year old males and 5 year old females are the most vulnerable to poverty, with 151 males (58.3%) and 16 females (59.3%) in their respective age groups living below the poverty level.
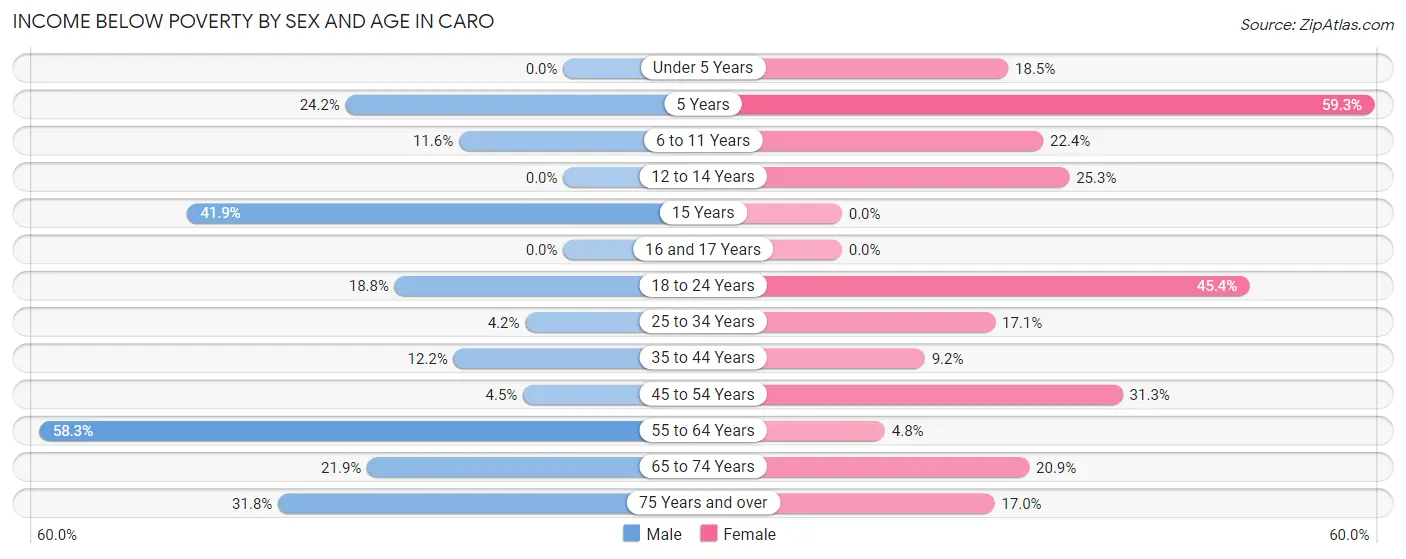
| Age Bracket | Male | Female |
| Under 5 Years | 0 (0.0%) | 15 (18.5%) |
| 5 Years | 8 (24.2%) | 16 (59.3%) |
| 6 to 11 Years | 28 (11.6%) | 39 (22.4%) |
| 12 to 14 Years | 0 (0.0%) | 19 (25.3%) |
| 15 Years | 18 (41.9%) | 0 (0.0%) |
| 16 and 17 Years | 0 (0.0%) | 0 (0.0%) |
| 18 to 24 Years | 52 (18.8%) | 44 (45.4%) |
| 25 to 34 Years | 8 (4.2%) | 49 (17.1%) |
| 35 to 44 Years | 33 (12.2%) | 23 (9.2%) |
| 45 to 54 Years | 11 (4.5%) | 71 (31.3%) |
| 55 to 64 Years | 151 (58.3%) | 7 (4.8%) |
| 65 to 74 Years | 52 (21.8%) | 68 (20.9%) |
| 75 Years and over | 27 (31.8%) | 42 (17.0%) |
| Total | 388 (18.8%) | 393 (19.7%) |
Income Above Poverty by Sex and Age in Caro
According to the poverty statistics in Caro, males aged under 5 years and females aged 15 years are the age groups that are most secure financially, with 100.0% of males and 100.0% of females in these age groups living above the poverty line.
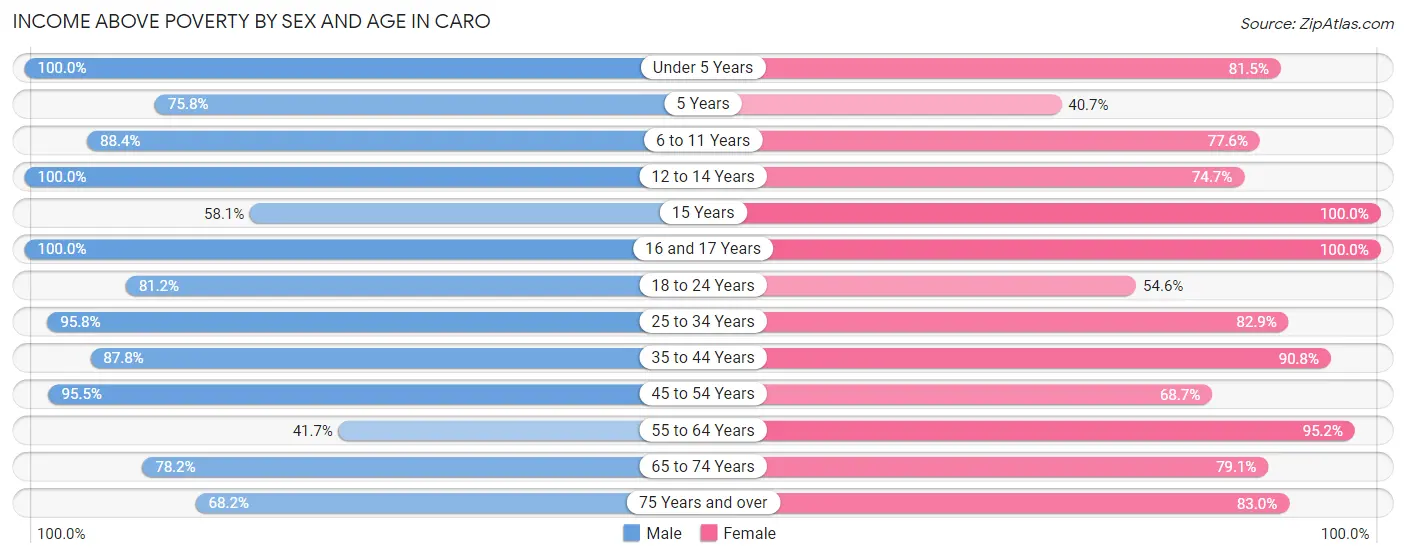
| Age Bracket | Male | Female |
| Under 5 Years | 141 (100.0%) | 66 (81.5%) |
| 5 Years | 25 (75.8%) | 11 (40.7%) |
| 6 to 11 Years | 213 (88.4%) | 135 (77.6%) |
| 12 to 14 Years | 15 (100.0%) | 56 (74.7%) |
| 15 Years | 25 (58.1%) | 20 (100.0%) |
| 16 and 17 Years | 27 (100.0%) | 39 (100.0%) |
| 18 to 24 Years | 225 (81.2%) | 53 (54.6%) |
| 25 to 34 Years | 181 (95.8%) | 238 (82.9%) |
| 35 to 44 Years | 237 (87.8%) | 226 (90.8%) |
| 45 to 54 Years | 235 (95.5%) | 156 (68.7%) |
| 55 to 64 Years | 108 (41.7%) | 139 (95.2%) |
| 65 to 74 Years | 186 (78.1%) | 258 (79.1%) |
| 75 Years and over | 58 (68.2%) | 205 (83.0%) |
| Total | 1,676 (81.2%) | 1,602 (80.3%) |
Income Below Poverty Among Married-Couple Families in Caro
The poverty statistics for married-couple families in Caro show that 3.7% or 20 of the total 534 families live below the poverty line. Families with no children have the highest poverty rate of 6.5%, comprising of 20 families. On the other hand, families with 1 or 2 children have the lowest poverty rate of 0.0%, which includes 0 families.
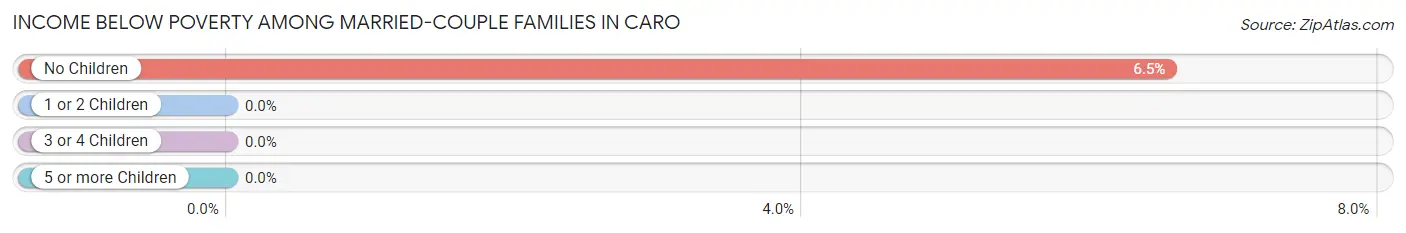
| Children | Above Poverty | Below Poverty |
| No Children | 286 (93.5%) | 20 (6.5%) |
| 1 or 2 Children | 192 (100.0%) | 0 (0.0%) |
| 3 or 4 Children | 21 (100.0%) | 0 (0.0%) |
| 5 or more Children | 15 (100.0%) | 0 (0.0%) |
| Total | 514 (96.3%) | 20 (3.7%) |
Income Below Poverty Among Single-Parent Households in Caro
According to the poverty data in Caro, 7.3% or 11 single-father households and 26.9% or 66 single-mother households are living below the poverty line. Among single-father households, those with 1 or 2 children have the highest poverty rate, with 11 households (14.5%) experiencing poverty. Likewise, among single-mother households, those with 3 or 4 children have the highest poverty rate, with 19 households (100.0%) falling below the poverty line.
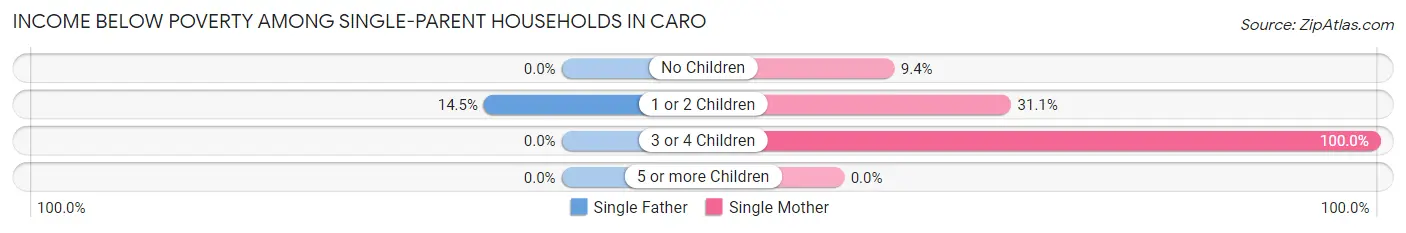
| Children | Single Father | Single Mother |
| No Children | 0 (0.0%) | 10 (9.3%) |
| 1 or 2 Children | 11 (14.5%) | 37 (31.1%) |
| 3 or 4 Children | 0 (0.0%) | 19 (100.0%) |
| 5 or more Children | 0 (0.0%) | 0 (0.0%) |
| Total | 11 (7.3%) | 66 (26.9%) |
Income Below Poverty Among Married-Couple vs Single-Parent Households in Caro
The poverty data for Caro shows that 20 of the married-couple family households (3.7%) and 77 of the single-parent households (19.4%) are living below the poverty level. Within the married-couple family households, those with no children have the highest poverty rate, with 20 households (6.5%) falling below the poverty line. Among the single-parent households, those with 3 or 4 children have the highest poverty rate, with 19 household (65.5%) living below poverty.
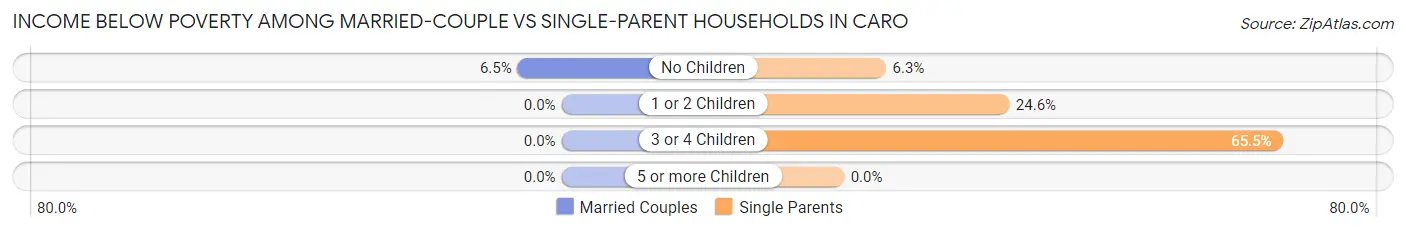
| Children | Married-Couple Families | Single-Parent Households |
| No Children | 20 (6.5%) | 10 (6.2%) |
| 1 or 2 Children | 0 (0.0%) | 48 (24.6%) |
| 3 or 4 Children | 0 (0.0%) | 19 (65.5%) |
| 5 or more Children | 0 (0.0%) | 0 (0.0%) |
| Total | 20 (3.7%) | 77 (19.4%) |
Race in Caro
The most populous races in Caro are White / Caucasian (4,114 | 95.8%), Hispanic or Latino (221 | 5.1%), and Black / African American (90 | 2.1%).
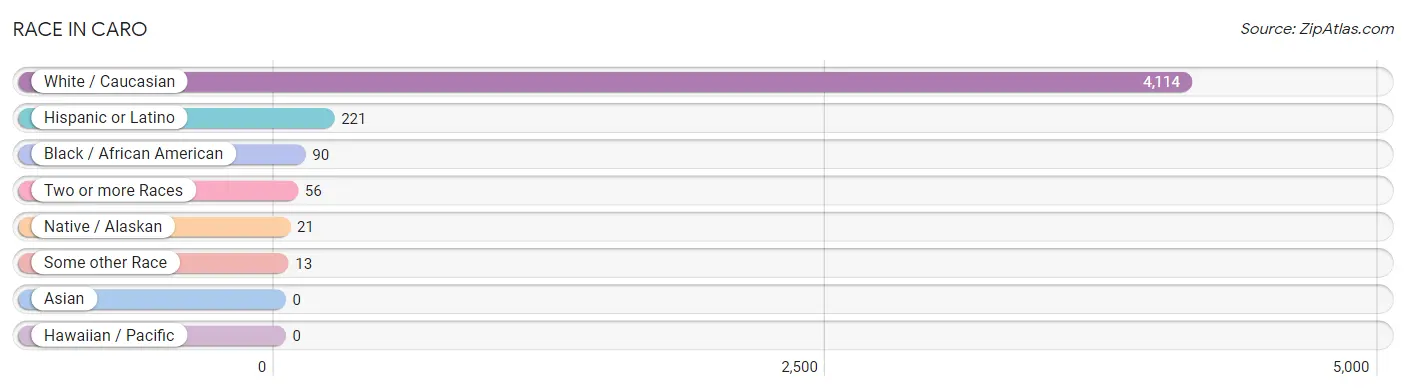
| Race | # Population | % Population |
| Asian | 0 | 0.0% |
| Black / African American | 90 | 2.1% |
| Hawaiian / Pacific | 0 | 0.0% |
| Hispanic or Latino | 221 | 5.1% |
| Native / Alaskan | 21 | 0.5% |
| White / Caucasian | 4,114 | 95.8% |
| Two or more Races | 56 | 1.3% |
| Some other Race | 13 | 0.3% |
| Total | 4,294 | 100.0% |
Ancestry in Caro
The most populous ancestries reported in Caro are German (693 | 16.1%), Irish (389 | 9.1%), French (257 | 6.0%), Polish (243 | 5.7%), and English (238 | 5.5%), together accounting for 42.4% of all Caro residents.
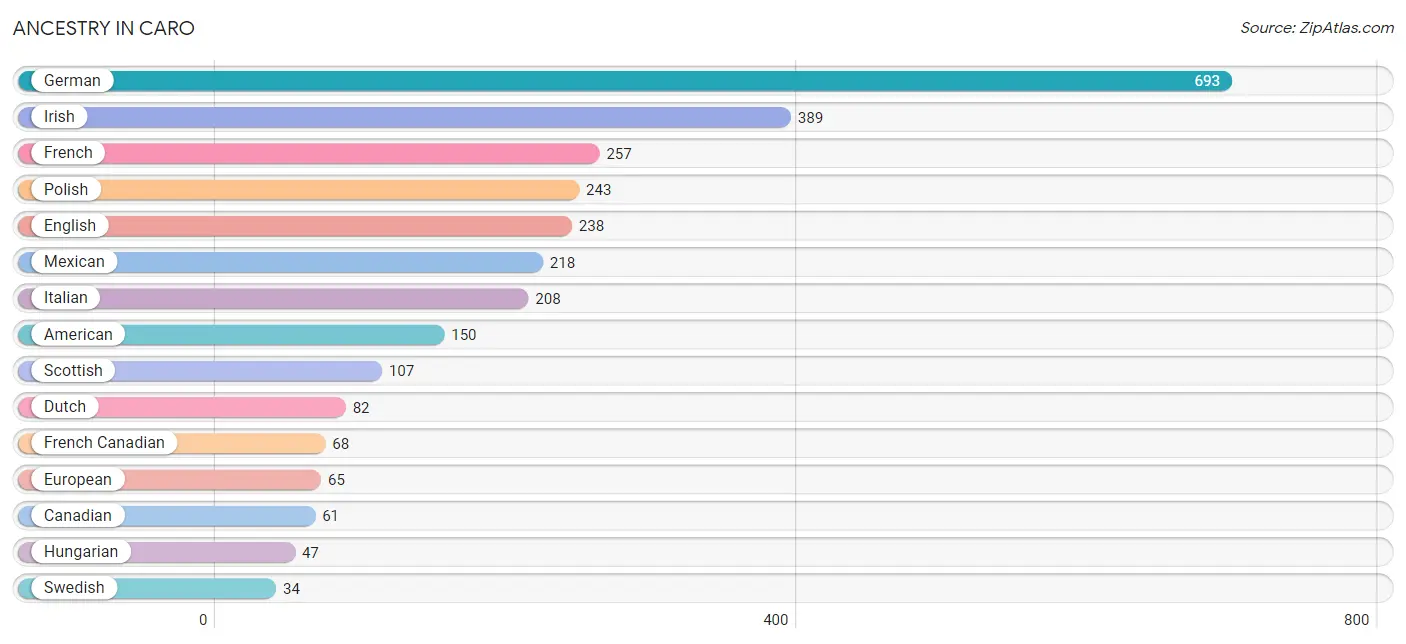
| Ancestry | # Population | % Population |
| American | 150 | 3.5% |
| Austrian | 25 | 0.6% |
| Belgian | 7 | 0.2% |
| Blackfeet | 11 | 0.3% |
| Canadian | 61 | 1.4% |
| Central American | 3 | 0.1% |
| Cherokee | 23 | 0.5% |
| Chippewa | 4 | 0.1% |
| Cree | 2 | 0.1% |
| Dutch | 82 | 1.9% |
| English | 238 | 5.5% |
| European | 65 | 1.5% |
| Finnish | 25 | 0.6% |
| French | 257 | 6.0% |
| French Canadian | 68 | 1.6% |
| German | 693 | 16.1% |
| Greek | 20 | 0.5% |
| Guatemalan | 3 | 0.1% |
| Hungarian | 47 | 1.1% |
| Irish | 389 | 9.1% |
| Italian | 208 | 4.8% |
| Mexican | 218 | 5.1% |
| Northern European | 25 | 0.6% |
| Ottawa | 1 | 0.0% |
| Polish | 243 | 5.7% |
| Scotch-Irish | 32 | 0.7% |
| Scottish | 107 | 2.5% |
| Swedish | 34 | 0.8% | View All 28 Rows |
Immigrants in Caro

| Immigration Origin | # Population | % Population | View All 0 Rows |
Sex and Age in Caro
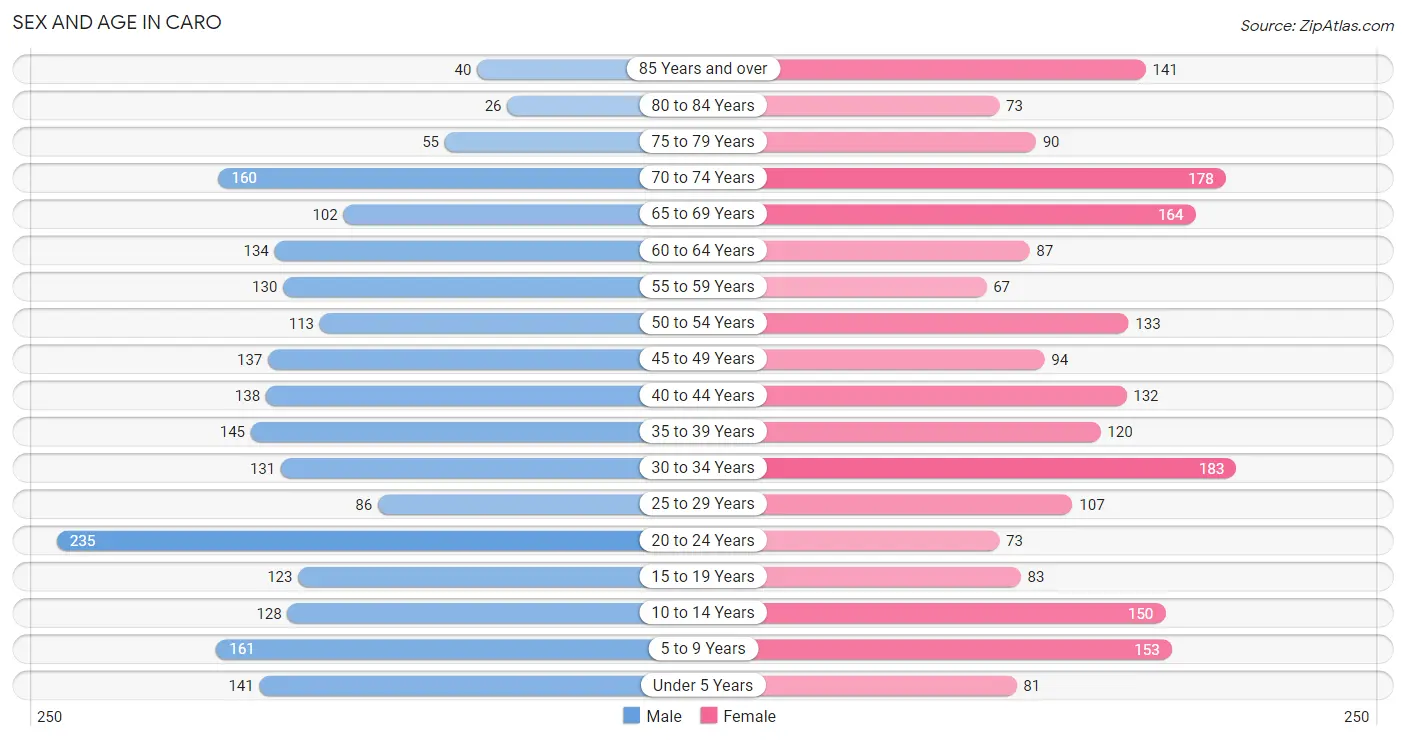
Sex and Age in Caro
The most populous age groups in Caro are 20 to 24 Years (235 | 10.8%) for men and 30 to 34 Years (183 | 8.7%) for women.
| Age Bracket | Male | Female |
| Under 5 Years | 141 (6.5%) | 81 (3.8%) |
| 5 to 9 Years | 161 (7.4%) | 153 (7.2%) |
| 10 to 14 Years | 128 (5.9%) | 150 (7.1%) |
| 15 to 19 Years | 123 (5.6%) | 83 (3.9%) |
| 20 to 24 Years | 235 (10.8%) | 73 (3.5%) |
| 25 to 29 Years | 86 (3.9%) | 107 (5.1%) |
| 30 to 34 Years | 131 (6.0%) | 183 (8.7%) |
| 35 to 39 Years | 145 (6.6%) | 120 (5.7%) |
| 40 to 44 Years | 138 (6.3%) | 132 (6.3%) |
| 45 to 49 Years | 137 (6.3%) | 94 (4.5%) |
| 50 to 54 Years | 113 (5.2%) | 133 (6.3%) |
| 55 to 59 Years | 130 (5.9%) | 67 (3.2%) |
| 60 to 64 Years | 134 (6.1%) | 87 (4.1%) |
| 65 to 69 Years | 102 (4.7%) | 164 (7.8%) |
| 70 to 74 Years | 160 (7.3%) | 178 (8.4%) |
| 75 to 79 Years | 55 (2.5%) | 90 (4.3%) |
| 80 to 84 Years | 26 (1.2%) | 73 (3.5%) |
| 85 Years and over | 40 (1.8%) | 141 (6.7%) |
| Total | 2,185 (100.0%) | 2,109 (100.0%) |
Families and Households in Caro
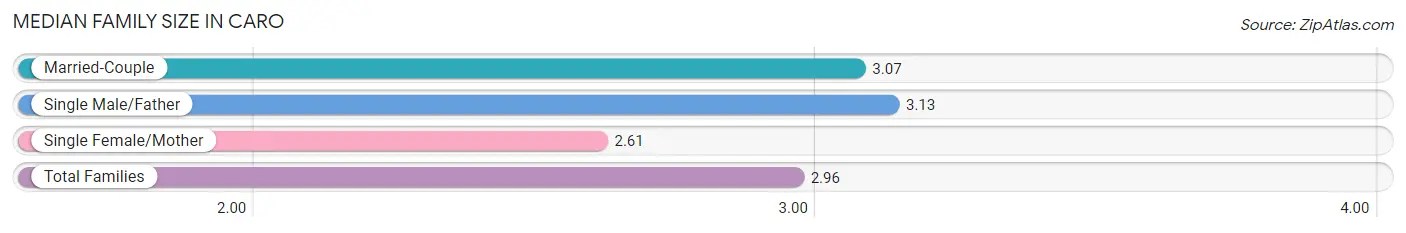
Median Family Size in Caro
The median family size in Caro is 2.96 persons per family, with single male/father families (151 | 16.2%) accounting for the largest median family size of 3.13 persons per family. On the other hand, single female/mother families (245 | 26.3%) represent the smallest median family size with 2.61 persons per family.
| Family Type | # Families | Family Size |
| Married-Couple | 534 (57.4%) | 3.07 |
| Single Male/Father | 151 (16.2%) | 3.13 |
| Single Female/Mother | 245 (26.3%) | 2.61 |
| Total Families | 930 (100.0%) | 2.96 |
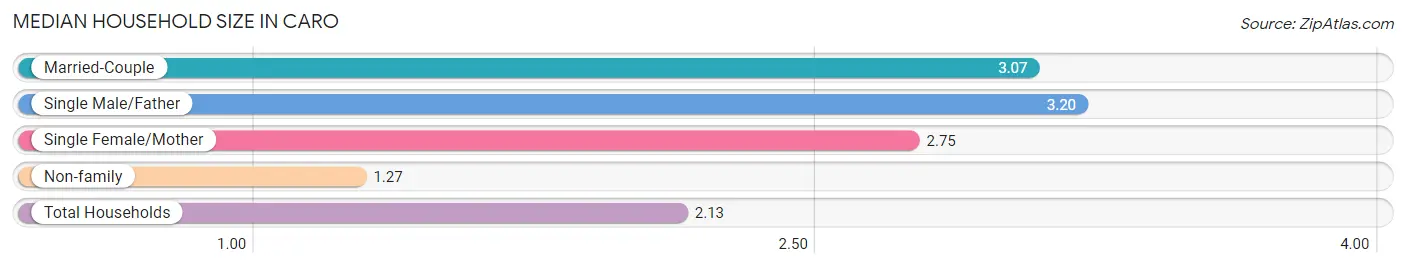
Median Household Size in Caro
The median household size in Caro is 2.13 persons per household, with single male/father households (151 | 8.0%) accounting for the largest median household size of 3.2 persons per household. non-family households (950 | 50.5%) represent the smallest median household size with 1.27 persons per household.
| Household Type | # Households | Household Size |
| Married-Couple | 534 (28.4%) | 3.07 |
| Single Male/Father | 151 (8.0%) | 3.20 |
| Single Female/Mother | 245 (13.0%) | 2.75 |
| Non-family | 950 (50.5%) | 1.27 |
| Total Households | 1,880 (100.0%) | 2.13 |
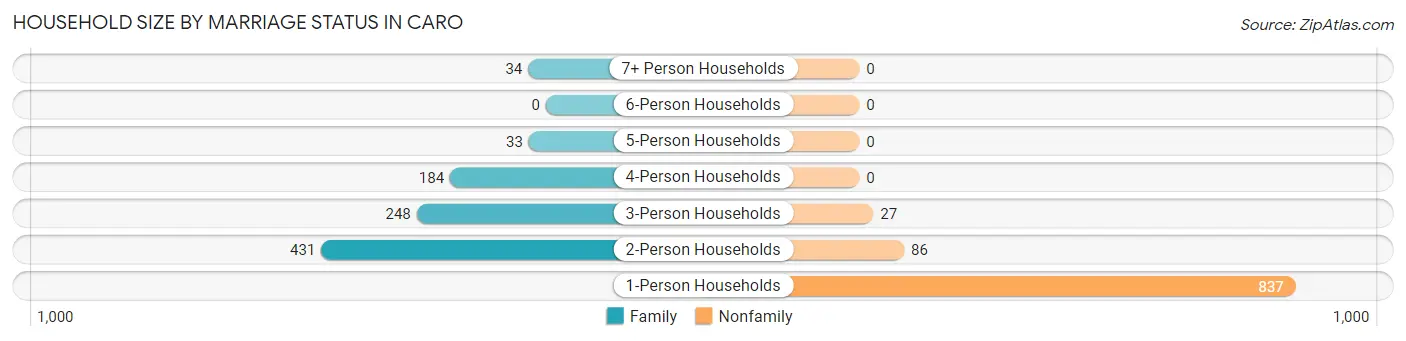
Household Size by Marriage Status in Caro
Out of a total of 1,880 households in Caro, 930 (49.5%) are family households, while 950 (50.5%) are nonfamily households. The most numerous type of family households are 2-person households, comprising 431, and the most common type of nonfamily households are 1-person households, comprising 837.
| Household Size | Family Households | Nonfamily Households |
| 1-Person Households | - | 837 (44.5%) |
| 2-Person Households | 431 (22.9%) | 86 (4.6%) |
| 3-Person Households | 248 (13.2%) | 27 (1.4%) |
| 4-Person Households | 184 (9.8%) | 0 (0.0%) |
| 5-Person Households | 33 (1.8%) | 0 (0.0%) |
| 6-Person Households | 0 (0.0%) | 0 (0.0%) |
| 7+ Person Households | 34 (1.8%) | 0 (0.0%) |
| Total | 930 (49.5%) | 950 (50.5%) |
Female Fertility in Caro
Fertility by Age in Caro
Average fertility rate in Caro is 16.0 births per 1,000 women. Women in the age bracket of 20 to 34 years have the highest fertility rate with 36.0 births per 1,000 women. Women in the age bracket of 20 to 34 years acount for 100.0% of all women with births.
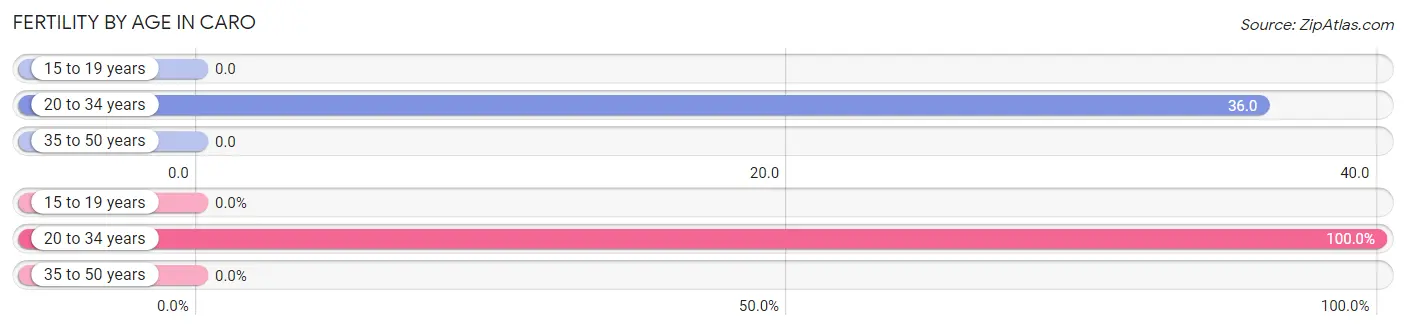
| Age Bracket | Women with Births | Births / 1,000 Women |
| 15 to 19 years | 0 (0.0%) | 0.0 |
| 20 to 34 years | 13 (100.0%) | 36.0 |
| 35 to 50 years | 0 (0.0%) | 0.0 |
| Total | 13 (100.0%) | 16.0 |
Fertility by Age by Marriage Status in Caro
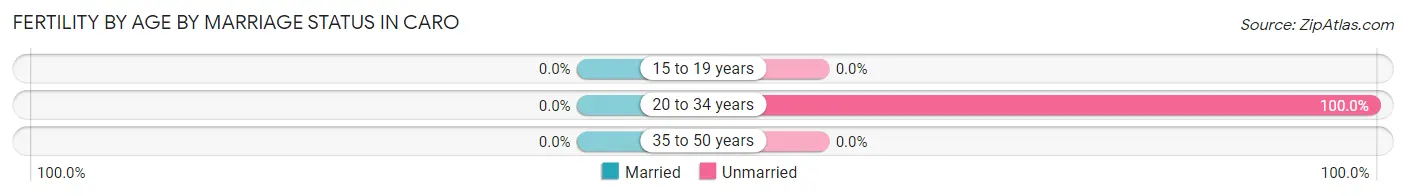
| Age Bracket | Married | Unmarried |
| 15 to 19 years | 0 (0.0%) | 0 (0.0%) |
| 20 to 34 years | 0 (0.0%) | 13 (100.0%) |
| 35 to 50 years | 0 (0.0%) | 0 (0.0%) |
| Total | 0 (0.0%) | 13 (100.0%) |
Fertility by Education in Caro
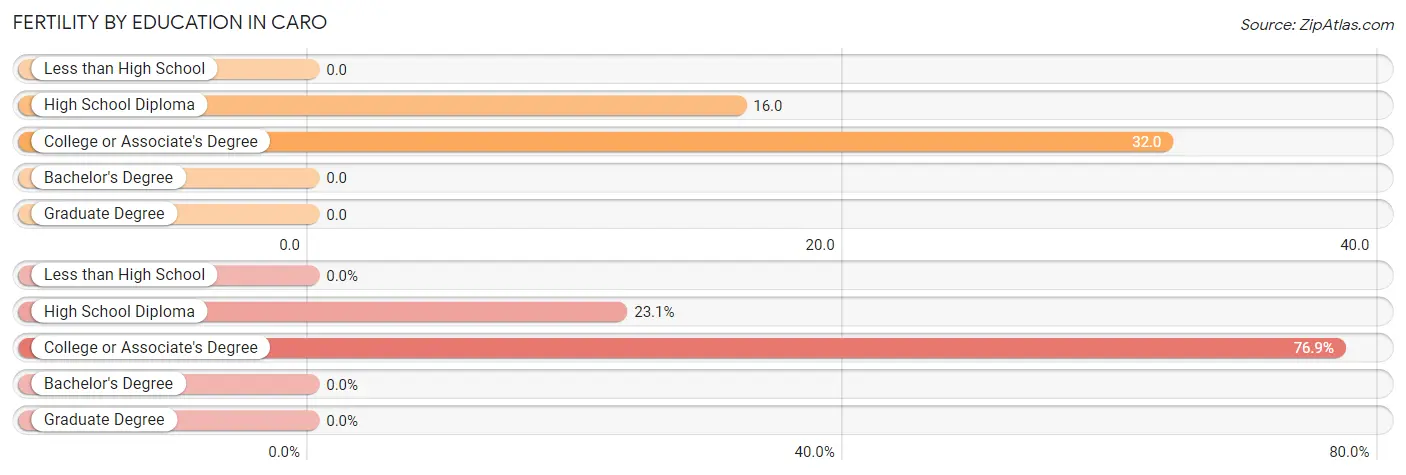
| Educational Attainment | Women with Births | Births / 1,000 Women |
| Less than High School | 0 (0.0%) | 0.0 |
| High School Diploma | 3 (23.1%) | 16.0 |
| College or Associate's Degree | 10 (76.9%) | 32.0 |
| Bachelor's Degree | 0 (0.0%) | 0.0 |
| Graduate Degree | 0 (0.0%) | 0.0 |
| Total | 13 (100.0%) | 16.0 |
Fertility by Education by Marriage Status in Caro
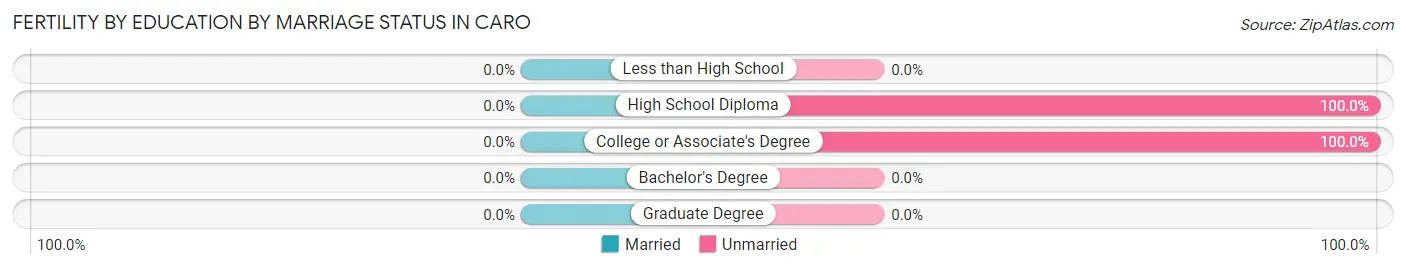
| Educational Attainment | Married | Unmarried |
| Less than High School | 0 (0.0%) | 0 (0.0%) |
| High School Diploma | 0 (0.0%) | 3 (100.0%) |
| College or Associate's Degree | 0 (0.0%) | 10 (100.0%) |
| Bachelor's Degree | 0 (0.0%) | 0 (0.0%) |
| Graduate Degree | 0 (0.0%) | 0 (0.0%) |
| Total | 0 (0.0%) | 13 (100.0%) |
Employment Characteristics in Caro
Employment by Class of Employer in Caro
Among the 1,552 employed individuals in Caro, private company employees (1,091 | 70.3%), not-for-profit organizations (163 | 10.5%), and self-employed (not incorporated) (157 | 10.1%) make up the most common classes of employment.
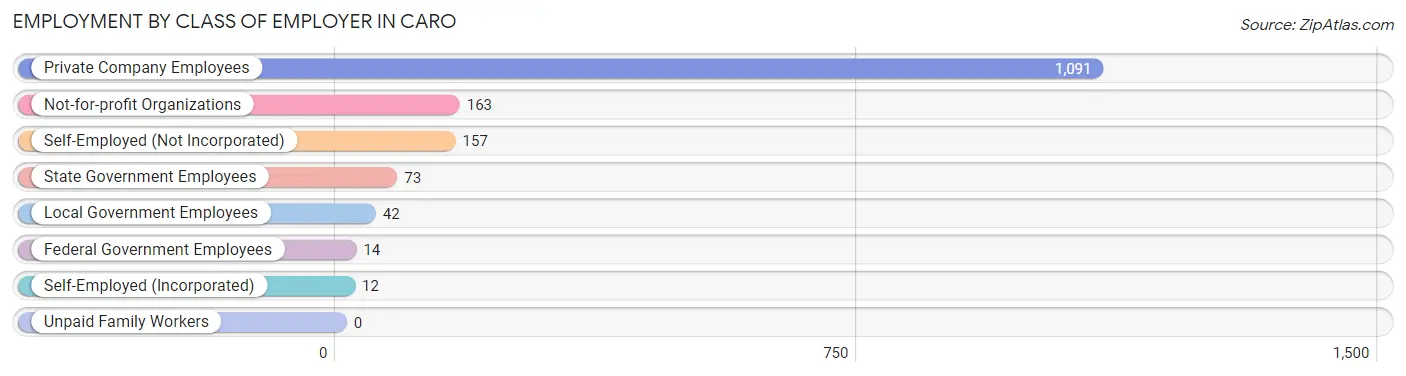
| Employer Class | # Employees | % Employees |
| Private Company Employees | 1,091 | 70.3% |
| Self-Employed (Incorporated) | 12 | 0.8% |
| Self-Employed (Not Incorporated) | 157 | 10.1% |
| Not-for-profit Organizations | 163 | 10.5% |
| Local Government Employees | 42 | 2.7% |
| State Government Employees | 73 | 4.7% |
| Federal Government Employees | 14 | 0.9% |
| Unpaid Family Workers | 0 | 0.0% |
| Total | 1,552 | 100.0% |
Employment Status by Age in Caro
According to the labor force statistics for Caro, out of the total population over 16 years of age (3,417), 51.0% or 1,743 individuals are in the labor force, with 10.3% or 180 of them unemployed. The age group with the highest labor force participation rate is 20 to 24 years, with 88.0% or 271 individuals in the labor force. Within the labor force, the 60 to 64 years age range has the highest percentage of unemployed individuals, with 53.6% or 90 of them being unemployed.
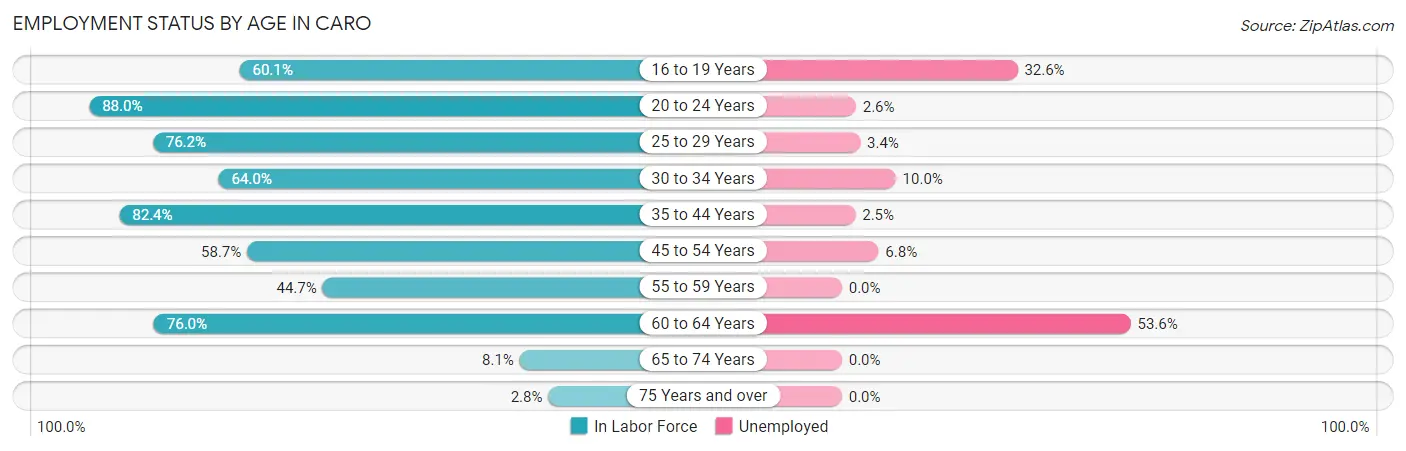
| Age Bracket | In Labor Force | Unemployed |
| 16 to 19 Years | 86 (60.1%) | 28 (32.6%) |
| 20 to 24 Years | 271 (88.0%) | 7 (2.6%) |
| 25 to 29 Years | 147 (76.2%) | 5 (3.4%) |
| 30 to 34 Years | 201 (64.0%) | 20 (10.0%) |
| 35 to 44 Years | 441 (82.4%) | 11 (2.5%) |
| 45 to 54 Years | 280 (58.7%) | 19 (6.8%) |
| 55 to 59 Years | 88 (44.7%) | 0 (0.0%) |
| 60 to 64 Years | 168 (76.0%) | 90 (53.6%) |
| 65 to 74 Years | 49 (8.1%) | 0 (0.0%) |
| 75 Years and over | 12 (2.8%) | 0 (0.0%) |
| Total | 1,743 (51.0%) | 180 (10.3%) |
Employment Status by Educational Attainment in Caro
According to labor force statistics for Caro, 68.4% of individuals (1,325) out of the total population between 25 and 64 years of age (1,937) are in the labor force, with 10.9% or 144 of them being unemployed. The group with the highest labor force participation rate are those with the educational attainment of bachelor's degree or higher, with 89.5% or 314 individuals in the labor force. Within the labor force, individuals with bachelor's degree or higher education have the highest percentage of unemployment, with 33.4% or 105 of them being unemployed.
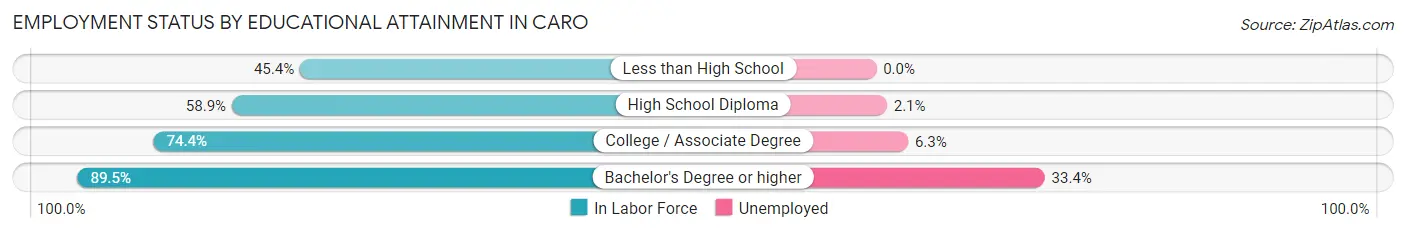
| Educational Attainment | In Labor Force | Unemployed |
| Less than High School | 84 (45.4%) | 0 (0.0%) |
| High School Diploma | 437 (58.9%) | 16 (2.1%) |
| College / Associate Degree | 490 (74.4%) | 42 (6.3%) |
| Bachelor's Degree or higher | 314 (89.5%) | 117 (33.4%) |
| Total | 1,325 (68.4%) | 211 (10.9%) |
Employment Occupations by Sex in Caro
Management, Business, Science and Arts Occupations
The most common Management, Business, Science and Arts occupations in Caro are Management (149 | 9.5%), Community & Social Service (109 | 7.0%), Education Instruction & Library (85 | 5.4%), Health Diagnosing & Treating (78 | 5.0%), and Business & Financial (77 | 4.9%).
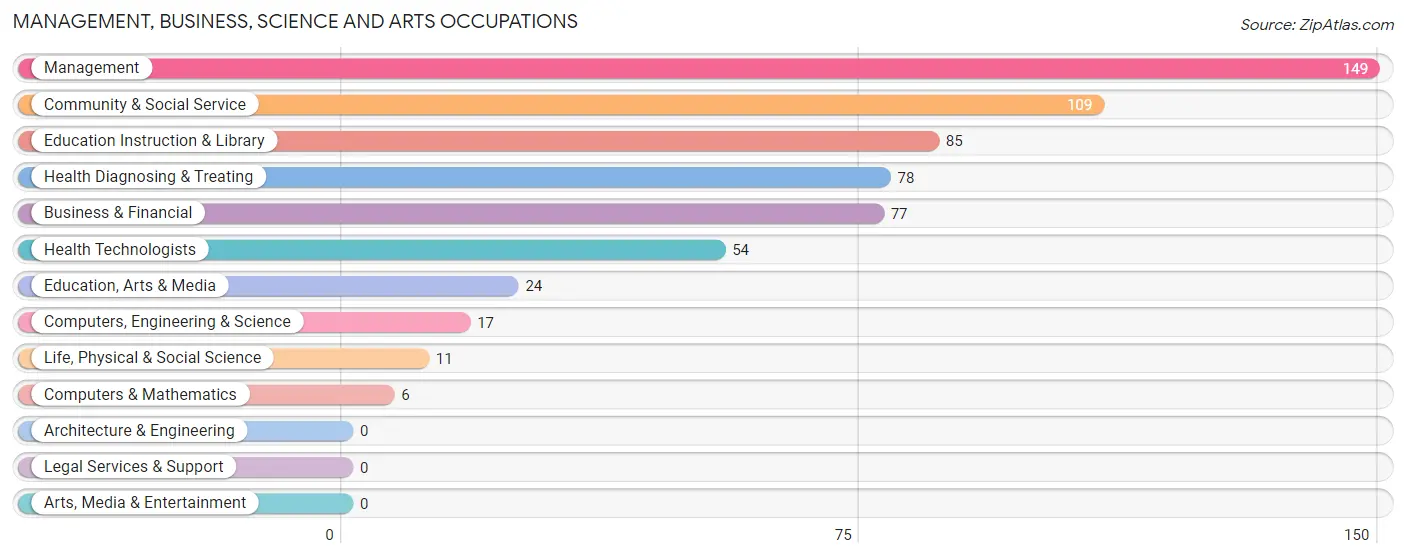
Management, Business, Science and Arts Occupations by Sex
Within the Management, Business, Science and Arts occupations in Caro, the most male-oriented occupations are Computers & Mathematics (100.0%), Management (86.6%), and Education, Arts & Media (75.0%), while the most female-oriented occupations are Health Diagnosing & Treating (100.0%), Health Technologists (100.0%), and Life, Physical & Social Science (81.8%).
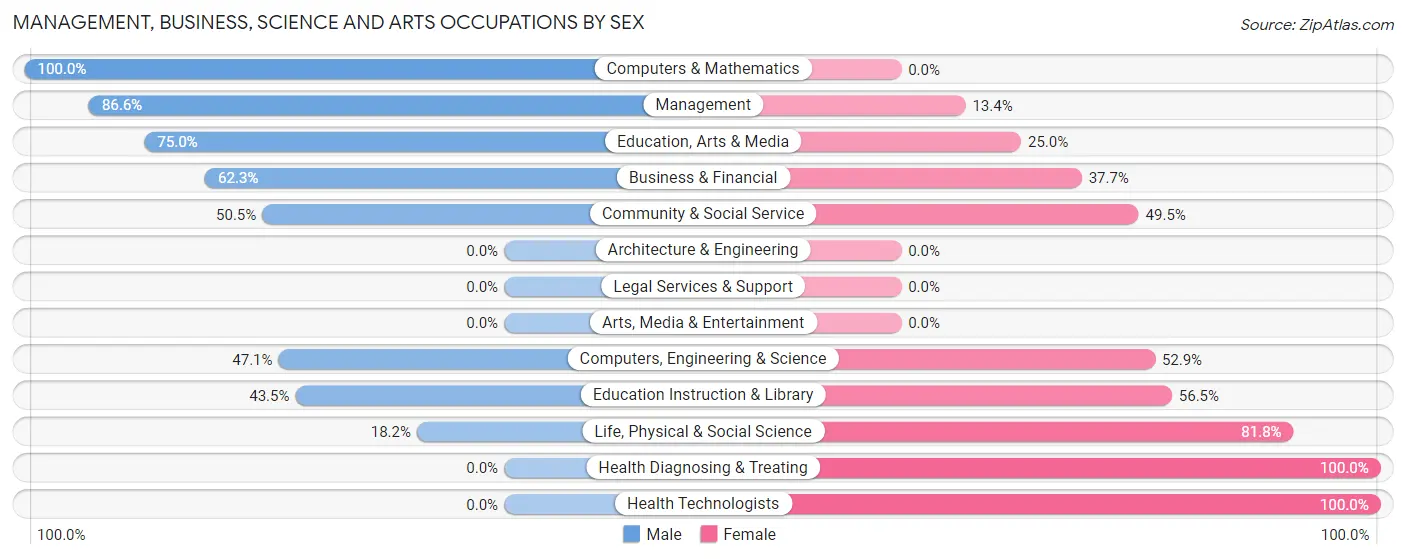
| Occupation | Male | Female |
| Management | 129 (86.6%) | 20 (13.4%) |
| Business & Financial | 48 (62.3%) | 29 (37.7%) |
| Computers, Engineering & Science | 8 (47.1%) | 9 (52.9%) |
| Computers & Mathematics | 6 (100.0%) | 0 (0.0%) |
| Architecture & Engineering | 0 (0.0%) | 0 (0.0%) |
| Life, Physical & Social Science | 2 (18.2%) | 9 (81.8%) |
| Community & Social Service | 55 (50.5%) | 54 (49.5%) |
| Education, Arts & Media | 18 (75.0%) | 6 (25.0%) |
| Legal Services & Support | 0 (0.0%) | 0 (0.0%) |
| Education Instruction & Library | 37 (43.5%) | 48 (56.5%) |
| Arts, Media & Entertainment | 0 (0.0%) | 0 (0.0%) |
| Health Diagnosing & Treating | 0 (0.0%) | 78 (100.0%) |
| Health Technologists | 0 (0.0%) | 54 (100.0%) |
| Total (Category) | 240 (55.8%) | 190 (44.2%) |
| Total (Overall) | 872 (55.8%) | 691 (44.2%) |
Services Occupations
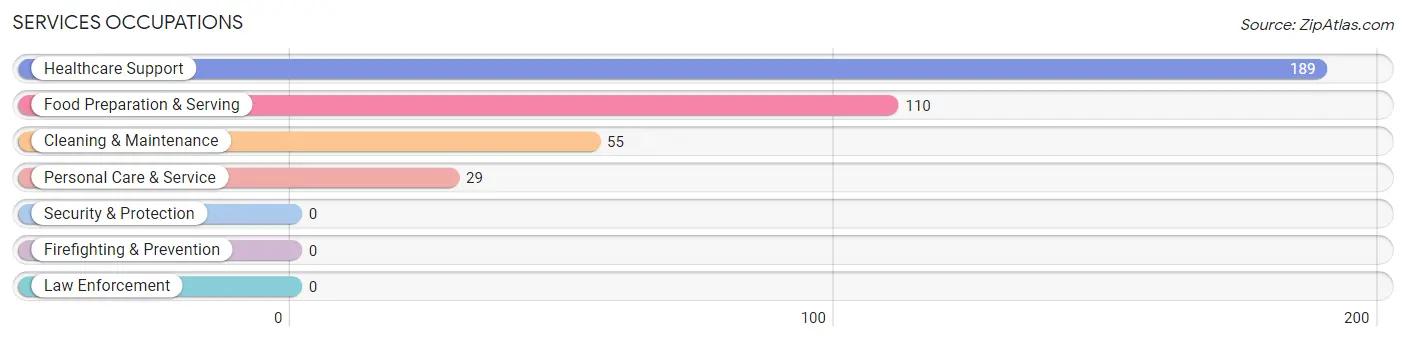
The most common Services occupations in Caro are Healthcare Support (189 | 12.1%), Food Preparation & Serving (110 | 7.0%), Cleaning & Maintenance (55 | 3.5%), and Personal Care & Service (29 | 1.9%).
Services Occupations by Sex
Within the Services occupations in Caro, the most male-oriented occupations are Cleaning & Maintenance (60.0%), Healthcare Support (46.6%), and Food Preparation & Serving (6.4%), while the most female-oriented occupations are Personal Care & Service (100.0%), Food Preparation & Serving (93.6%), and Healthcare Support (53.4%).
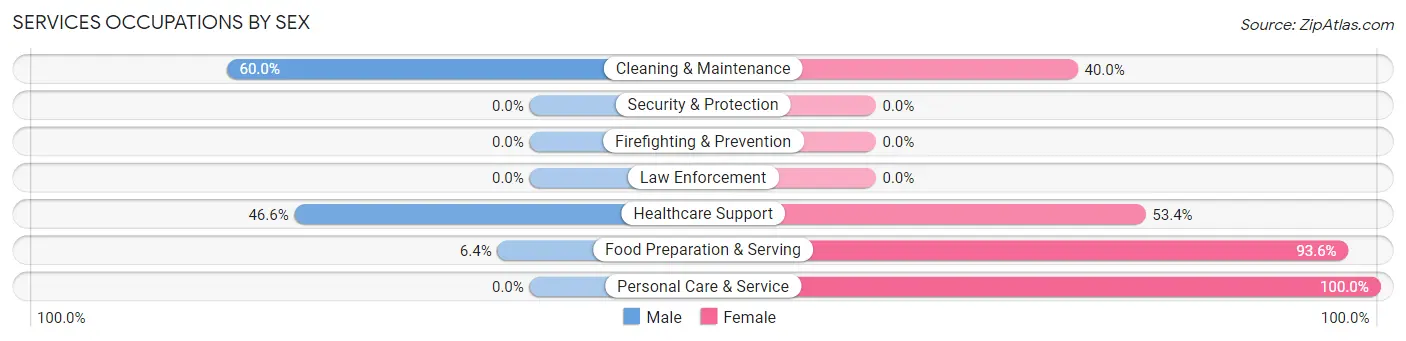
| Occupation | Male | Female |
| Healthcare Support | 88 (46.6%) | 101 (53.4%) |
| Security & Protection | 0 (0.0%) | 0 (0.0%) |
| Firefighting & Prevention | 0 (0.0%) | 0 (0.0%) |
| Law Enforcement | 0 (0.0%) | 0 (0.0%) |
| Food Preparation & Serving | 7 (6.4%) | 103 (93.6%) |
| Cleaning & Maintenance | 33 (60.0%) | 22 (40.0%) |
| Personal Care & Service | 0 (0.0%) | 29 (100.0%) |
| Total (Category) | 128 (33.4%) | 255 (66.6%) |
| Total (Overall) | 872 (55.8%) | 691 (44.2%) |
Sales and Office Occupations
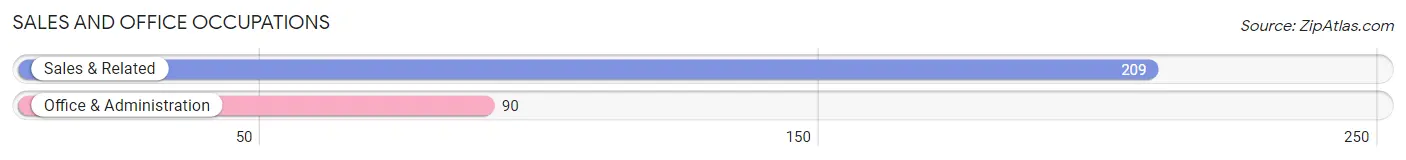
The most common Sales and Office occupations in Caro are Sales & Related (209 | 13.4%), and Office & Administration (90 | 5.8%).
Sales and Office Occupations by Sex
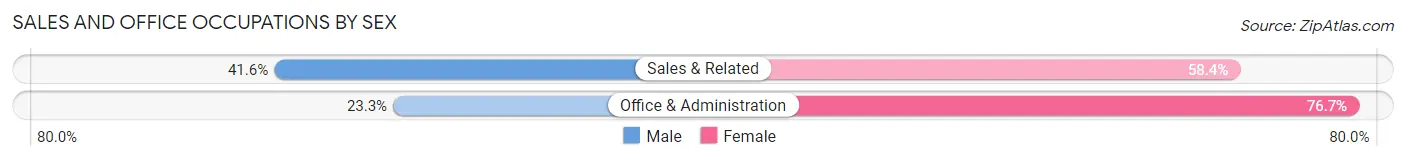
| Occupation | Male | Female |
| Sales & Related | 87 (41.6%) | 122 (58.4%) |
| Office & Administration | 21 (23.3%) | 69 (76.7%) |
| Total (Category) | 108 (36.1%) | 191 (63.9%) |
| Total (Overall) | 872 (55.8%) | 691 (44.2%) |
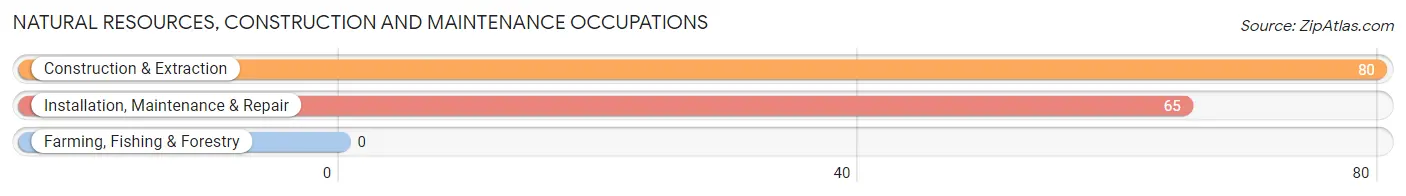
Natural Resources, Construction and Maintenance Occupations
The most common Natural Resources, Construction and Maintenance occupations in Caro are Construction & Extraction (80 | 5.1%), and Installation, Maintenance & Repair (65 | 4.2%).
Natural Resources, Construction and Maintenance Occupations by Sex
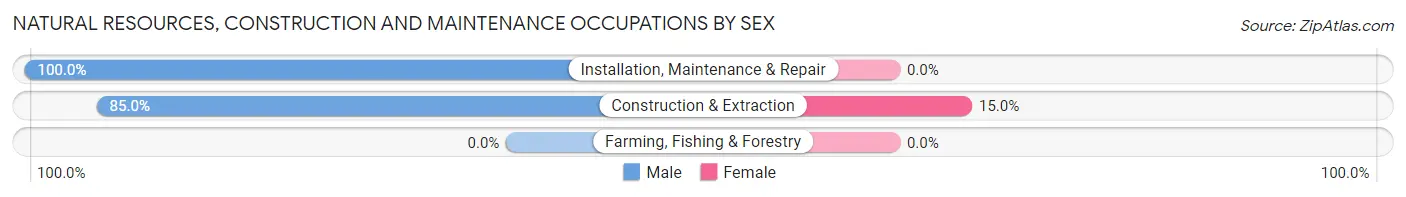
| Occupation | Male | Female |
| Farming, Fishing & Forestry | 0 (0.0%) | 0 (0.0%) |
| Construction & Extraction | 68 (85.0%) | 12 (15.0%) |
| Installation, Maintenance & Repair | 65 (100.0%) | 0 (0.0%) |
| Total (Category) | 133 (91.7%) | 12 (8.3%) |
| Total (Overall) | 872 (55.8%) | 691 (44.2%) |
Production, Transportation and Moving Occupations
The most common Production, Transportation and Moving occupations in Caro are Production (140 | 9.0%), Material Moving (111 | 7.1%), and Transportation (55 | 3.5%).
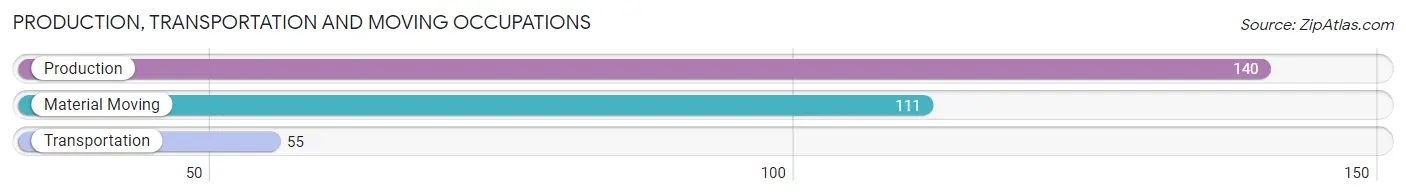
Production, Transportation and Moving Occupations by Sex
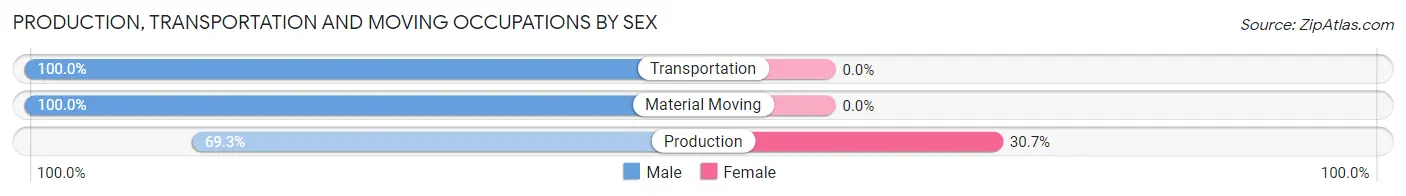
| Occupation | Male | Female |
| Production | 97 (69.3%) | 43 (30.7%) |
| Transportation | 55 (100.0%) | 0 (0.0%) |
| Material Moving | 111 (100.0%) | 0 (0.0%) |
| Total (Category) | 263 (86.0%) | 43 (14.1%) |
| Total (Overall) | 872 (55.8%) | 691 (44.2%) |
Employment Industries by Sex in Caro
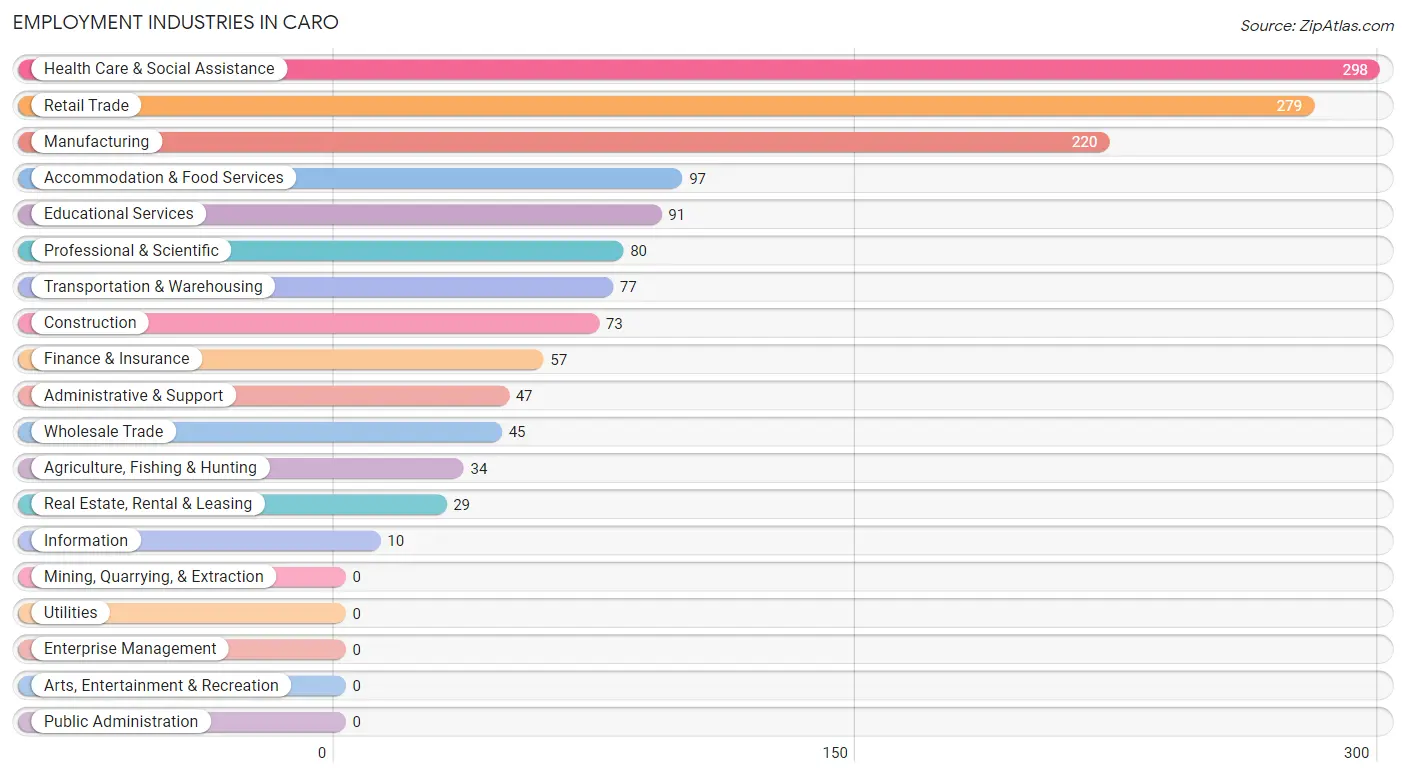
Employment Industries in Caro
The major employment industries in Caro include Health Care & Social Assistance (298 | 19.1%), Retail Trade (279 | 17.8%), Manufacturing (220 | 14.1%), Accommodation & Food Services (97 | 6.2%), and Educational Services (91 | 5.8%).
Employment Industries by Sex in Caro
The Caro industries that see more men than women are Agriculture, Fishing & Hunting (100.0%), Construction (100.0%), and Wholesale Trade (100.0%), whereas the industries that tend to have a higher number of women are Information (100.0%), Accommodation & Food Services (100.0%), and Retail Trade (60.2%).
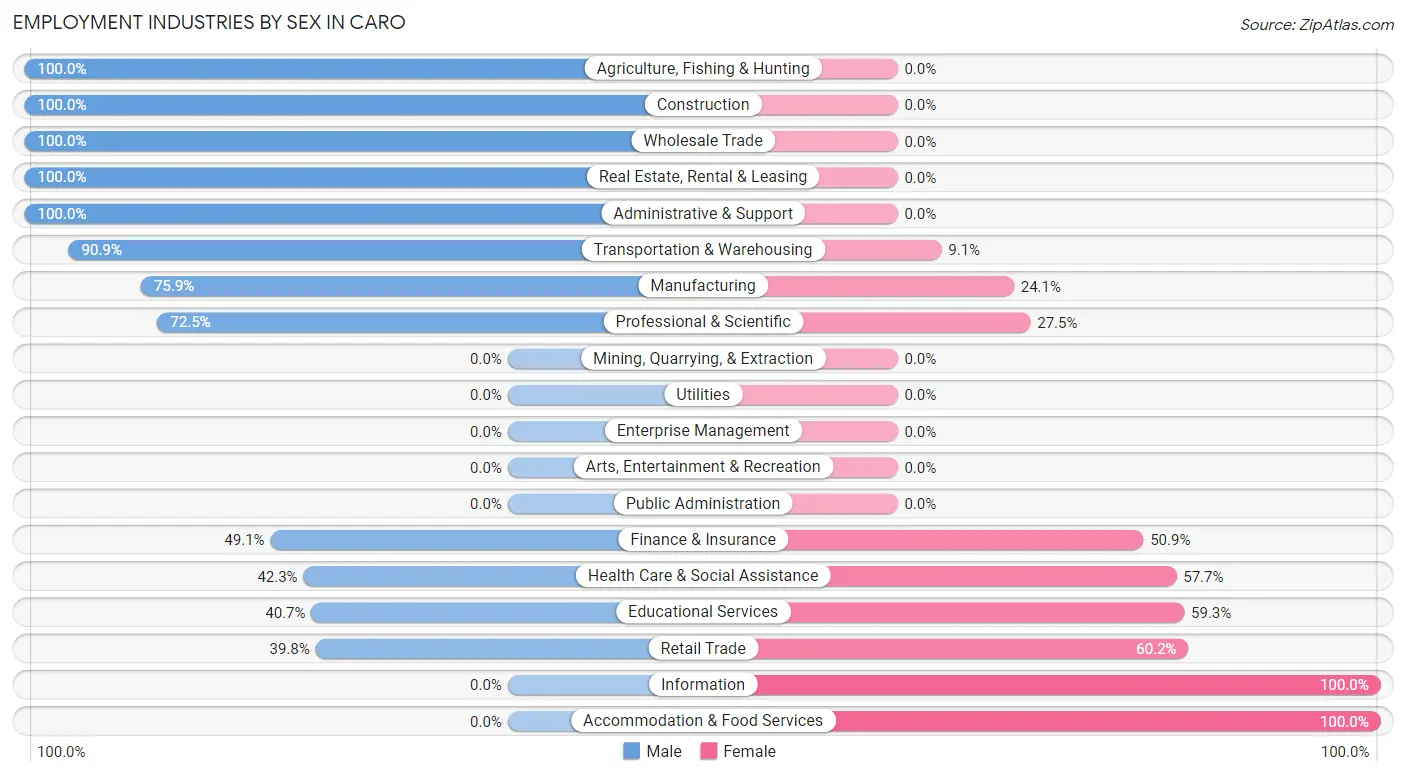
| Industry | Male | Female |
| Agriculture, Fishing & Hunting | 34 (100.0%) | 0 (0.0%) |
| Mining, Quarrying, & Extraction | 0 (0.0%) | 0 (0.0%) |
| Construction | 73 (100.0%) | 0 (0.0%) |
| Manufacturing | 167 (75.9%) | 53 (24.1%) |
| Wholesale Trade | 45 (100.0%) | 0 (0.0%) |
| Retail Trade | 111 (39.8%) | 168 (60.2%) |
| Transportation & Warehousing | 70 (90.9%) | 7 (9.1%) |
| Utilities | 0 (0.0%) | 0 (0.0%) |
| Information | 0 (0.0%) | 10 (100.0%) |
| Finance & Insurance | 28 (49.1%) | 29 (50.9%) |
| Real Estate, Rental & Leasing | 29 (100.0%) | 0 (0.0%) |
| Professional & Scientific | 58 (72.5%) | 22 (27.5%) |
| Enterprise Management | 0 (0.0%) | 0 (0.0%) |
| Administrative & Support | 47 (100.0%) | 0 (0.0%) |
| Educational Services | 37 (40.7%) | 54 (59.3%) |
| Health Care & Social Assistance | 126 (42.3%) | 172 (57.7%) |
| Arts, Entertainment & Recreation | 0 (0.0%) | 0 (0.0%) |
| Accommodation & Food Services | 0 (0.0%) | 97 (100.0%) |
| Public Administration | 0 (0.0%) | 0 (0.0%) |
| Total | 872 (55.8%) | 691 (44.2%) |
Education in Caro
School Enrollment in Caro
The most common levels of schooling among the 922 students in Caro are elementary school (321 | 34.8%), high school (175 | 19.0%), and middle school (169 | 18.3%).
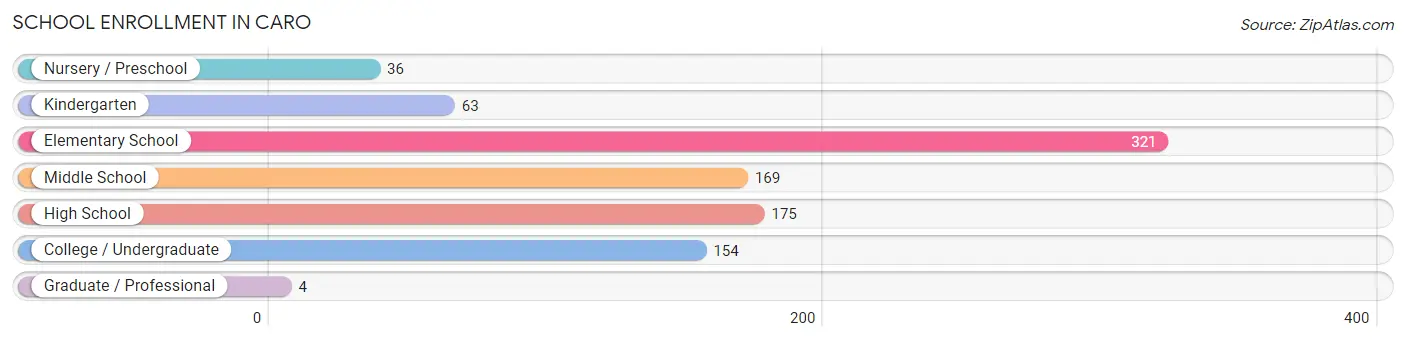
| School Level | # Students | % Students |
| Nursery / Preschool | 36 | 3.9% |
| Kindergarten | 63 | 6.8% |
| Elementary School | 321 | 34.8% |
| Middle School | 169 | 18.3% |
| High School | 175 | 19.0% |
| College / Undergraduate | 154 | 16.7% |
| Graduate / Professional | 4 | 0.4% |
| Total | 922 | 100.0% |
School Enrollment by Age by Funding Source in Caro
Out of a total of 922 students who are enrolled in schools in Caro, 121 (13.1%) attend a private institution, while the remaining 801 (86.9%) are enrolled in public schools. The age group of 15 to 17 year olds has the highest likelihood of being enrolled in private schools, with 50 (43.5% in the age bracket) enrolled. Conversely, the age group of 3 to 4 year olds has the lowest likelihood of being enrolled in a private school, with 28 (100.0% in the age bracket) attending a public institution.
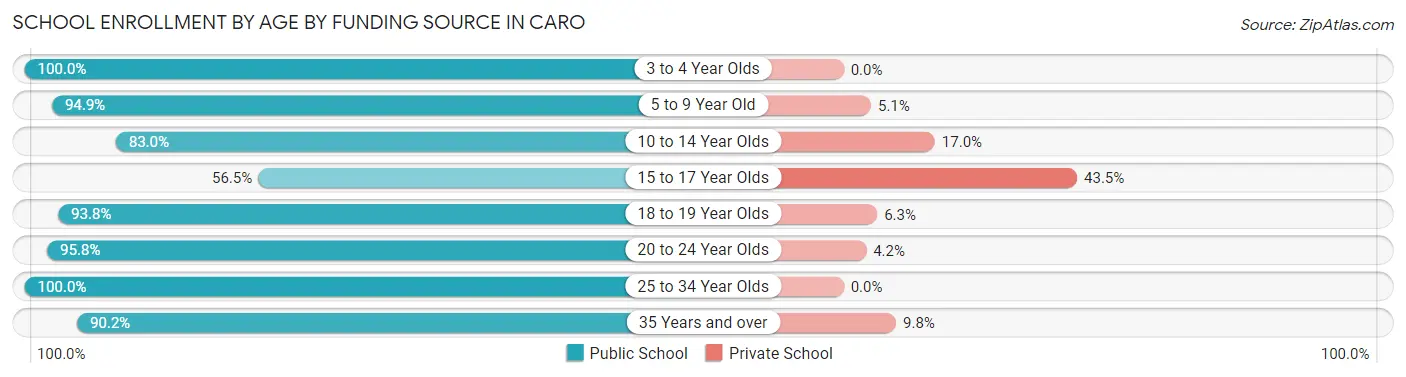
| Age Bracket | Public School | Private School |
| 3 to 4 Year Olds | 28 (100.0%) | 0 (0.0%) |
| 5 to 9 Year Old | 298 (94.9%) | 16 (5.1%) |
| 10 to 14 Year Olds | 215 (83.0%) | 44 (17.0%) |
| 15 to 17 Year Olds | 65 (56.5%) | 50 (43.5%) |
| 18 to 19 Year Olds | 30 (93.8%) | 2 (6.2%) |
| 20 to 24 Year Olds | 114 (95.8%) | 5 (4.2%) |
| 25 to 34 Year Olds | 14 (100.0%) | 0 (0.0%) |
| 35 Years and over | 37 (90.2%) | 4 (9.8%) |
| Total | 801 (86.9%) | 121 (13.1%) |
Educational Attainment by Field of Study in Caro
Business (200 | 34.3%), education (132 | 22.6%), communications (99 | 17.0%), engineering (39 | 6.7%), and science & technology (28 | 4.8%) are the most common fields of study among 584 individuals in Caro who have obtained a bachelor's degree or higher.
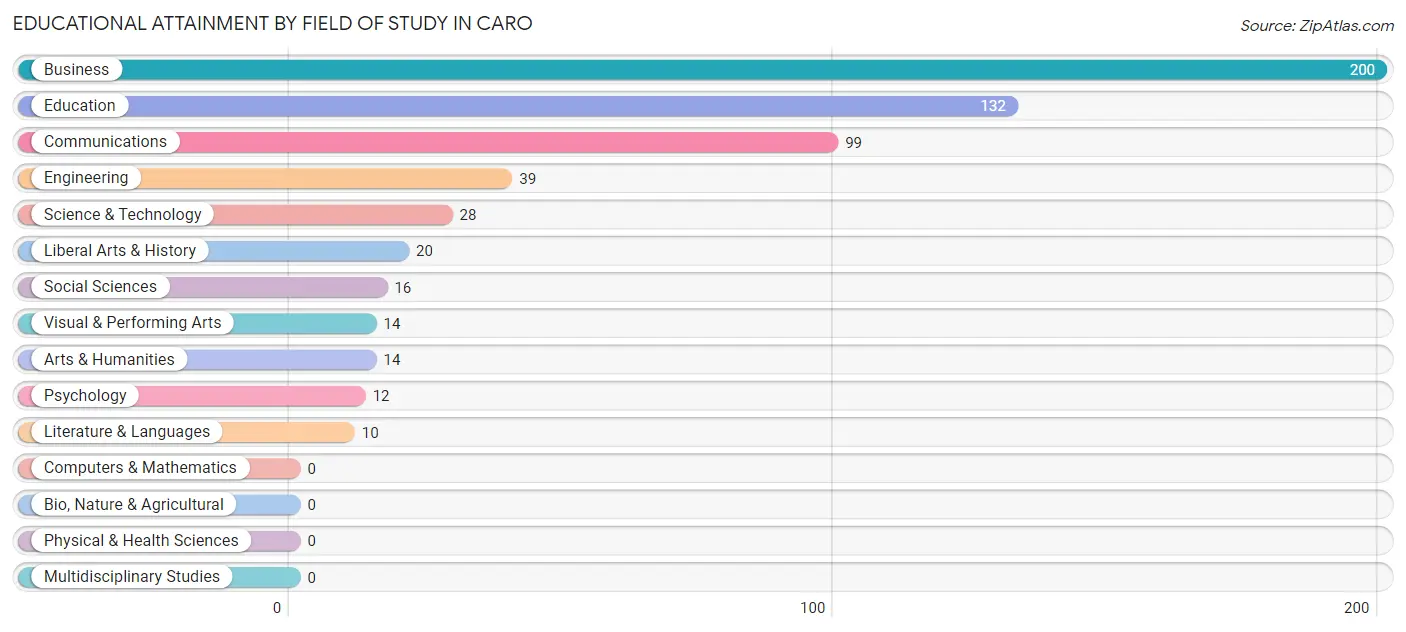
| Field of Study | # Graduates | % Graduates |
| Computers & Mathematics | 0 | 0.0% |
| Bio, Nature & Agricultural | 0 | 0.0% |
| Physical & Health Sciences | 0 | 0.0% |
| Psychology | 12 | 2.1% |
| Social Sciences | 16 | 2.7% |
| Engineering | 39 | 6.7% |
| Multidisciplinary Studies | 0 | 0.0% |
| Science & Technology | 28 | 4.8% |
| Business | 200 | 34.3% |
| Education | 132 | 22.6% |
| Literature & Languages | 10 | 1.7% |
| Liberal Arts & History | 20 | 3.4% |
| Visual & Performing Arts | 14 | 2.4% |
| Communications | 99 | 17.0% |
| Arts & Humanities | 14 | 2.4% |
| Total | 584 | 100.0% |
Transportation & Commute in Caro
Vehicle Availability by Sex in Caro
The most prevalent vehicle ownership categories in Caro are males with 2 vehicles (485, accounting for 55.6%) and females with 2 vehicles (366, making up 71.3%).
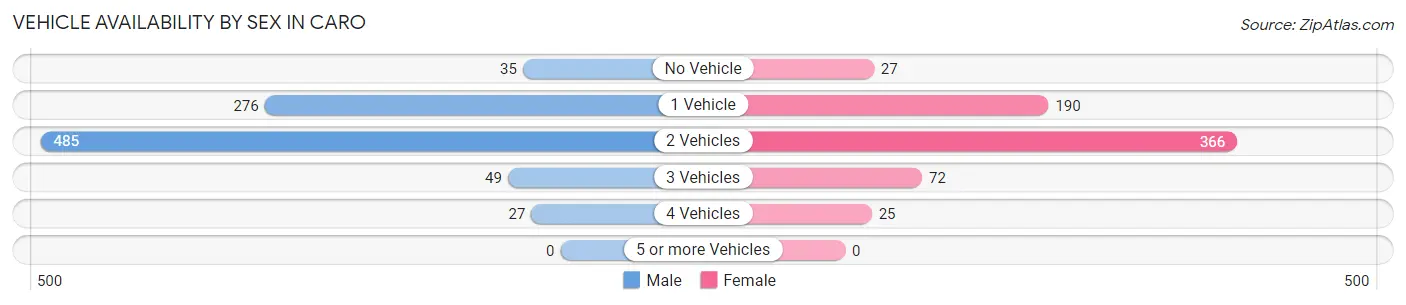
| Vehicles Available | Male | Female |
| No Vehicle | 35 (4.0%) | 27 (4.0%) |
| 1 Vehicle | 276 (31.7%) | 190 (27.9%) |
| 2 Vehicles | 485 (55.6%) | 366 (53.8%) |
| 3 Vehicles | 49 (5.6%) | 72 (10.6%) |
| 4 Vehicles | 27 (3.1%) | 25 (3.7%) |
| 5 or more Vehicles | 0 (0.0%) | 0 (0.0%) |
| Total | 872 (100.0%) | 680 (100.0%) |
Commute Time in Caro
The most frequently occuring commute durations in Caro are 5 to 9 minutes (457 commuters, 30.1%), 60 to 89 minutes (177 commuters, 11.7%), and 20 to 24 minutes (149 commuters, 9.8%).
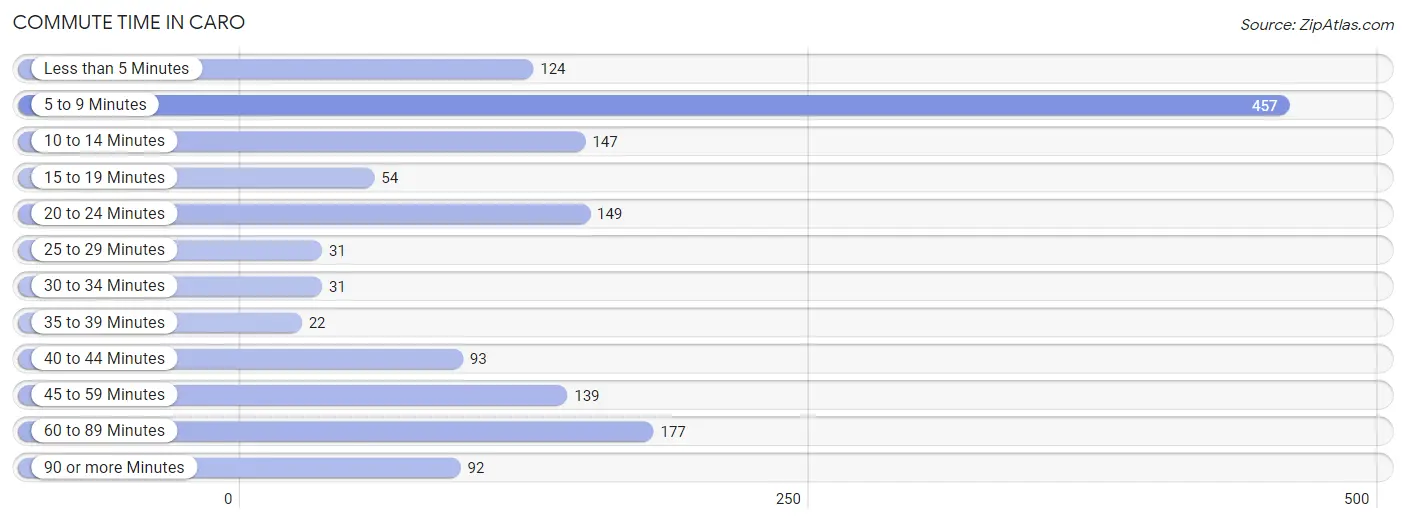
| Commute Time | # Commuters | % Commuters |
| Less than 5 Minutes | 124 | 8.2% |
| 5 to 9 Minutes | 457 | 30.1% |
| 10 to 14 Minutes | 147 | 9.7% |
| 15 to 19 Minutes | 54 | 3.6% |
| 20 to 24 Minutes | 149 | 9.8% |
| 25 to 29 Minutes | 31 | 2.0% |
| 30 to 34 Minutes | 31 | 2.0% |
| 35 to 39 Minutes | 22 | 1.5% |
| 40 to 44 Minutes | 93 | 6.1% |
| 45 to 59 Minutes | 139 | 9.2% |
| 60 to 89 Minutes | 177 | 11.7% |
| 90 or more Minutes | 92 | 6.1% |
Commute Time by Sex in Caro
The most common commute times in Caro are 5 to 9 minutes (215 commuters, 24.9%) for males and 5 to 9 minutes (242 commuters, 37.1%) for females.
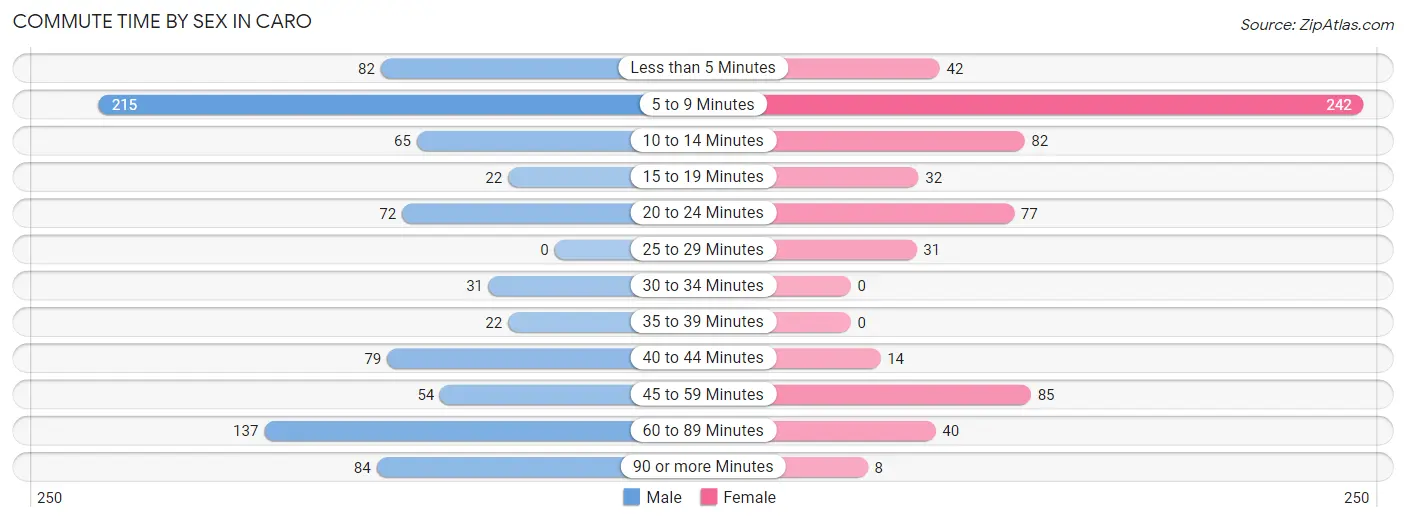
| Commute Time | Male | Female |
| Less than 5 Minutes | 82 (9.5%) | 42 (6.4%) |
| 5 to 9 Minutes | 215 (24.9%) | 242 (37.1%) |
| 10 to 14 Minutes | 65 (7.5%) | 82 (12.6%) |
| 15 to 19 Minutes | 22 (2.5%) | 32 (4.9%) |
| 20 to 24 Minutes | 72 (8.3%) | 77 (11.8%) |
| 25 to 29 Minutes | 0 (0.0%) | 31 (4.8%) |
| 30 to 34 Minutes | 31 (3.6%) | 0 (0.0%) |
| 35 to 39 Minutes | 22 (2.5%) | 0 (0.0%) |
| 40 to 44 Minutes | 79 (9.1%) | 14 (2.1%) |
| 45 to 59 Minutes | 54 (6.3%) | 85 (13.0%) |
| 60 to 89 Minutes | 137 (15.9%) | 40 (6.1%) |
| 90 or more Minutes | 84 (9.7%) | 8 (1.2%) |
Time of Departure to Work by Sex in Caro
The most frequent times of departure to work in Caro are 12:00 AM to 4:59 AM (176, 20.4%) for males and 7:30 AM to 7:59 AM (116, 17.8%) for females.
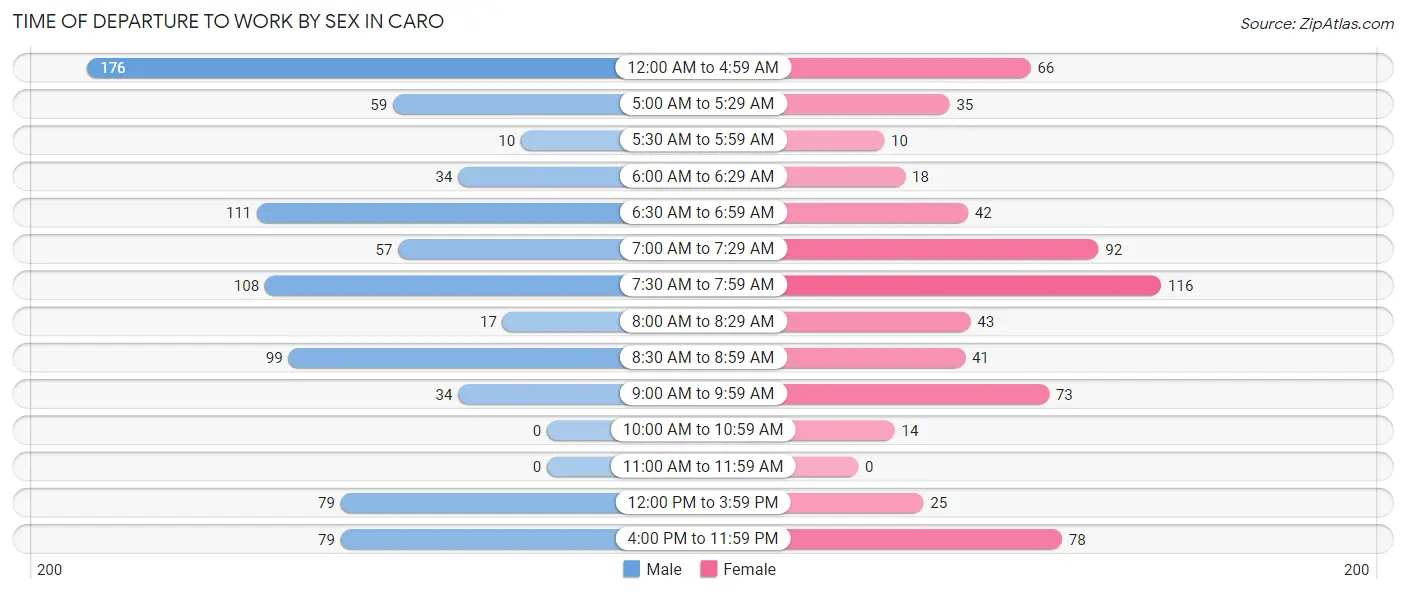
| Time of Departure | Male | Female |
| 12:00 AM to 4:59 AM | 176 (20.4%) | 66 (10.1%) |
| 5:00 AM to 5:29 AM | 59 (6.8%) | 35 (5.4%) |
| 5:30 AM to 5:59 AM | 10 (1.2%) | 10 (1.5%) |
| 6:00 AM to 6:29 AM | 34 (3.9%) | 18 (2.8%) |
| 6:30 AM to 6:59 AM | 111 (12.9%) | 42 (6.4%) |
| 7:00 AM to 7:29 AM | 57 (6.6%) | 92 (14.1%) |
| 7:30 AM to 7:59 AM | 108 (12.5%) | 116 (17.8%) |
| 8:00 AM to 8:29 AM | 17 (2.0%) | 43 (6.6%) |
| 8:30 AM to 8:59 AM | 99 (11.5%) | 41 (6.3%) |
| 9:00 AM to 9:59 AM | 34 (3.9%) | 73 (11.2%) |
| 10:00 AM to 10:59 AM | 0 (0.0%) | 14 (2.1%) |
| 11:00 AM to 11:59 AM | 0 (0.0%) | 0 (0.0%) |
| 12:00 PM to 3:59 PM | 79 (9.1%) | 25 (3.8%) |
| 4:00 PM to 11:59 PM | 79 (9.1%) | 78 (11.9%) |
| Total | 863 (100.0%) | 653 (100.0%) |
Housing Occupancy in Caro
Occupancy by Ownership in Caro
Of the total 1,880 dwellings in Caro, owner-occupied units account for 1,177 (62.6%), while renter-occupied units make up 703 (37.4%).
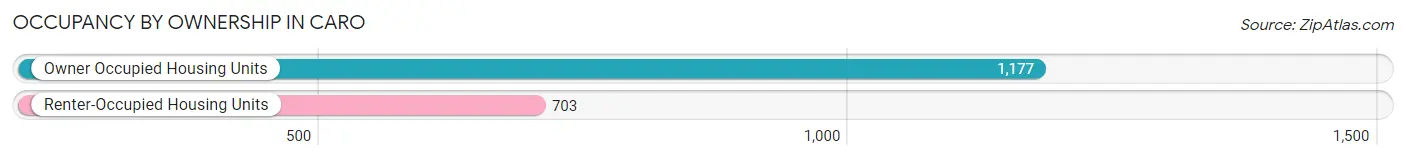
| Occupancy | # Housing Units | % Housing Units |
| Owner Occupied Housing Units | 1,177 | 62.6% |
| Renter-Occupied Housing Units | 703 | 37.4% |
| Total Occupied Housing Units | 1,880 | 100.0% |
Occupancy by Household Size in Caro
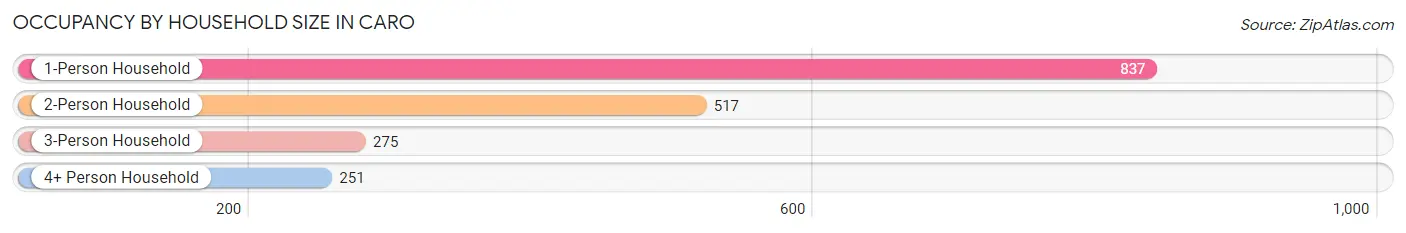
| Household Size | # Housing Units | % Housing Units |
| 1-Person Household | 837 | 44.5% |
| 2-Person Household | 517 | 27.5% |
| 3-Person Household | 275 | 14.6% |
| 4+ Person Household | 251 | 13.4% |
| Total Housing Units | 1,880 | 100.0% |
Occupancy by Ownership by Household Size in Caro
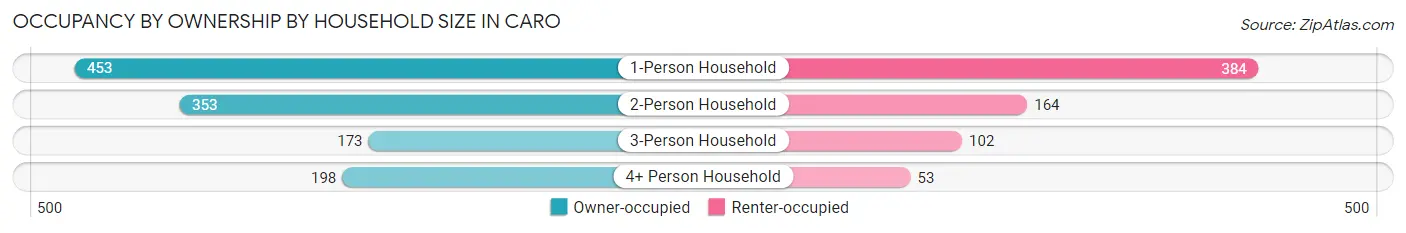
| Household Size | Owner-occupied | Renter-occupied |
| 1-Person Household | 453 (54.1%) | 384 (45.9%) |
| 2-Person Household | 353 (68.3%) | 164 (31.7%) |
| 3-Person Household | 173 (62.9%) | 102 (37.1%) |
| 4+ Person Household | 198 (78.9%) | 53 (21.1%) |
| Total Housing Units | 1,177 (62.6%) | 703 (37.4%) |
Occupancy by Educational Attainment in Caro
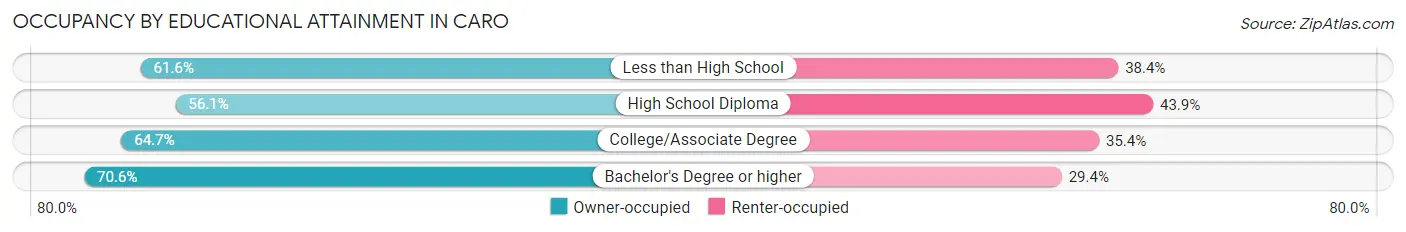
| Household Size | Owner-occupied | Renter-occupied |
| Less than High School | 191 (61.6%) | 119 (38.4%) |
| High School Diploma | 332 (56.1%) | 260 (43.9%) |
| College/Associate Degree | 395 (64.6%) | 216 (35.3%) |
| Bachelor's Degree or higher | 259 (70.6%) | 108 (29.4%) |
Occupancy by Age of Householder in Caro
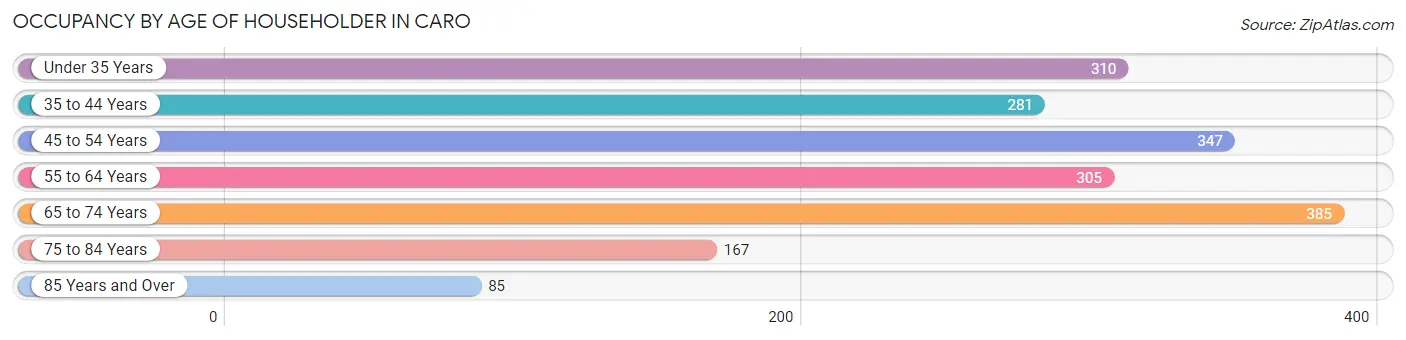
| Age Bracket | # Households | % Households |
| Under 35 Years | 310 | 16.5% |
| 35 to 44 Years | 281 | 14.9% |
| 45 to 54 Years | 347 | 18.5% |
| 55 to 64 Years | 305 | 16.2% |
| 65 to 74 Years | 385 | 20.5% |
| 75 to 84 Years | 167 | 8.9% |
| 85 Years and Over | 85 | 4.5% |
| Total | 1,880 | 100.0% |
Housing Finances in Caro
Median Income by Occupancy in Caro
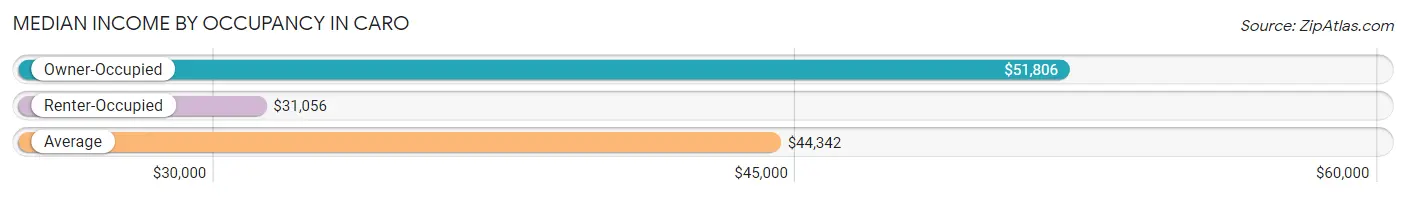
| Occupancy Type | # Households | Median Income |
| Owner-Occupied | 1,177 (62.6%) | $51,806 |
| Renter-Occupied | 703 (37.4%) | $31,056 |
| Average | 1,880 (100.0%) | $44,342 |
Occupancy by Householder Income Bracket in Caro
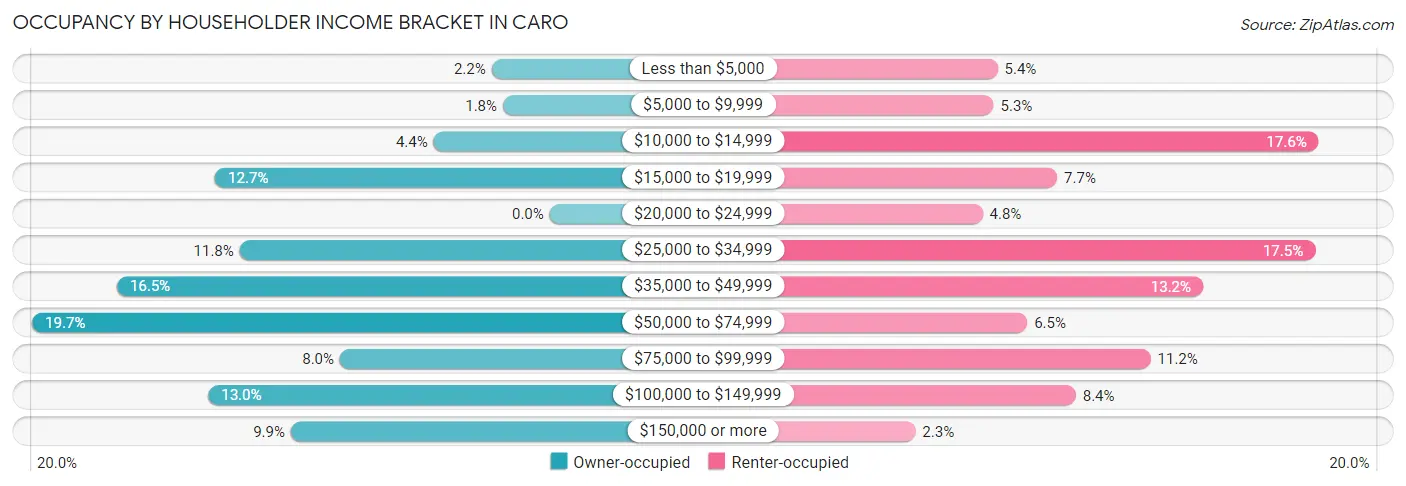
| Income Bracket | Owner-occupied | Renter-occupied |
| Less than $5,000 | 26 (2.2%) | 38 (5.4%) |
| $5,000 to $9,999 | 21 (1.8%) | 37 (5.3%) |
| $10,000 to $14,999 | 52 (4.4%) | 124 (17.6%) |
| $15,000 to $19,999 | 150 (12.7%) | 54 (7.7%) |
| $20,000 to $24,999 | 0 (0.0%) | 34 (4.8%) |
| $25,000 to $34,999 | 139 (11.8%) | 123 (17.5%) |
| $35,000 to $49,999 | 194 (16.5%) | 93 (13.2%) |
| $50,000 to $74,999 | 232 (19.7%) | 46 (6.5%) |
| $75,000 to $99,999 | 94 (8.0%) | 79 (11.2%) |
| $100,000 to $149,999 | 153 (13.0%) | 59 (8.4%) |
| $150,000 or more | 116 (9.9%) | 16 (2.3%) |
| Total | 1,177 (100.0%) | 703 (100.0%) |
Monthly Housing Cost Tiers in Caro
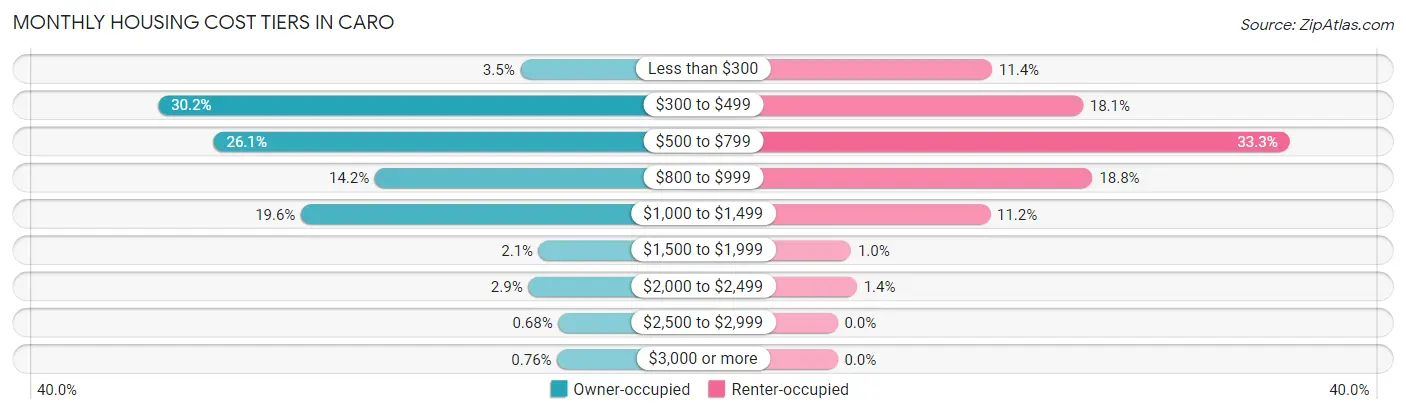
| Monthly Cost | Owner-occupied | Renter-occupied |
| Less than $300 | 41 (3.5%) | 80 (11.4%) |
| $300 to $499 | 355 (30.2%) | 127 (18.1%) |
| $500 to $799 | 307 (26.1%) | 234 (33.3%) |
| $800 to $999 | 167 (14.2%) | 132 (18.8%) |
| $1,000 to $1,499 | 231 (19.6%) | 79 (11.2%) |
| $1,500 to $1,999 | 25 (2.1%) | 7 (1.0%) |
| $2,000 to $2,499 | 34 (2.9%) | 10 (1.4%) |
| $2,500 to $2,999 | 8 (0.7%) | 0 (0.0%) |
| $3,000 or more | 9 (0.8%) | 0 (0.0%) |
| Total | 1,177 (100.0%) | 703 (100.0%) |
Physical Housing Characteristics in Caro
Housing Structures in Caro
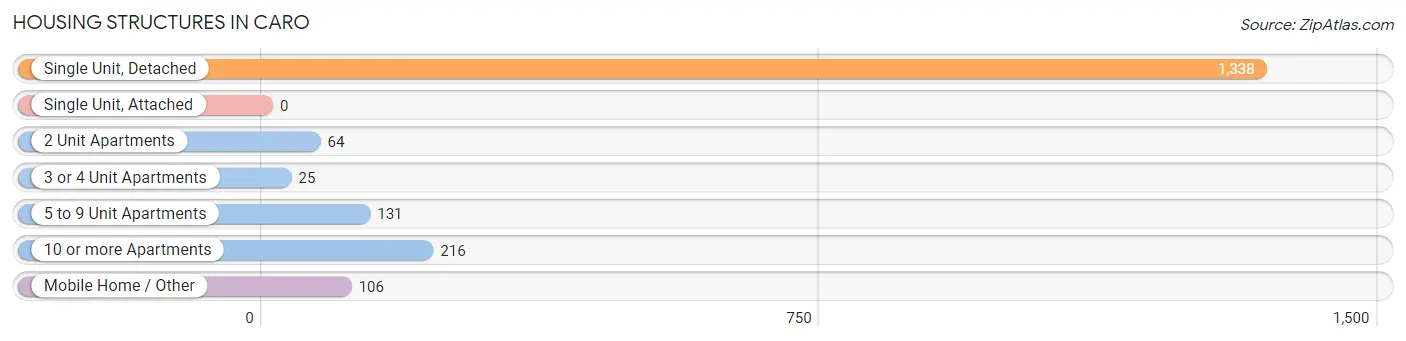
| Structure Type | # Housing Units | % Housing Units |
| Single Unit, Detached | 1,338 | 71.2% |
| Single Unit, Attached | 0 | 0.0% |
| 2 Unit Apartments | 64 | 3.4% |
| 3 or 4 Unit Apartments | 25 | 1.3% |
| 5 to 9 Unit Apartments | 131 | 7.0% |
| 10 or more Apartments | 216 | 11.5% |
| Mobile Home / Other | 106 | 5.6% |
| Total | 1,880 | 100.0% |
Housing Structures by Occupancy in Caro
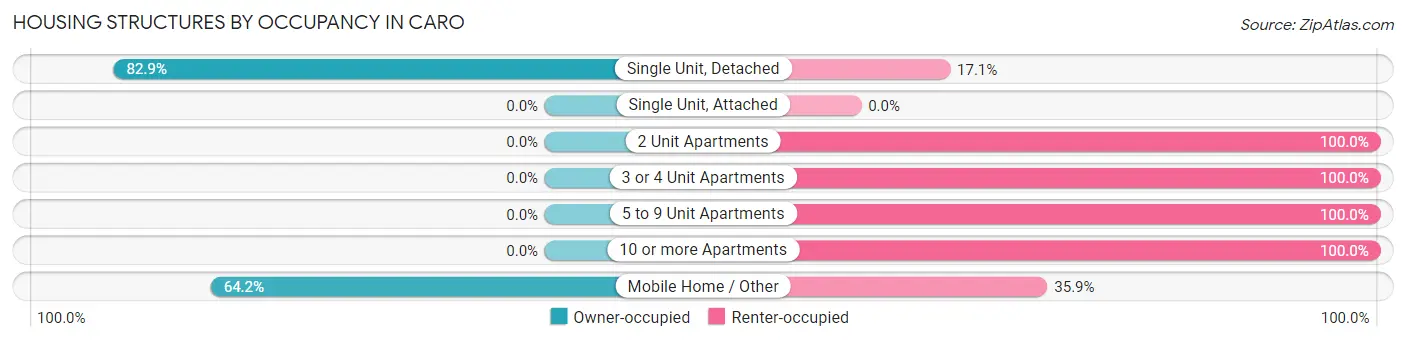
| Structure Type | Owner-occupied | Renter-occupied |
| Single Unit, Detached | 1,109 (82.9%) | 229 (17.1%) |
| Single Unit, Attached | 0 (0.0%) | 0 (0.0%) |
| 2 Unit Apartments | 0 (0.0%) | 64 (100.0%) |
| 3 or 4 Unit Apartments | 0 (0.0%) | 25 (100.0%) |
| 5 to 9 Unit Apartments | 0 (0.0%) | 131 (100.0%) |
| 10 or more Apartments | 0 (0.0%) | 216 (100.0%) |
| Mobile Home / Other | 68 (64.1%) | 38 (35.8%) |
| Total | 1,177 (62.6%) | 703 (37.4%) |
Housing Structures by Number of Rooms in Caro
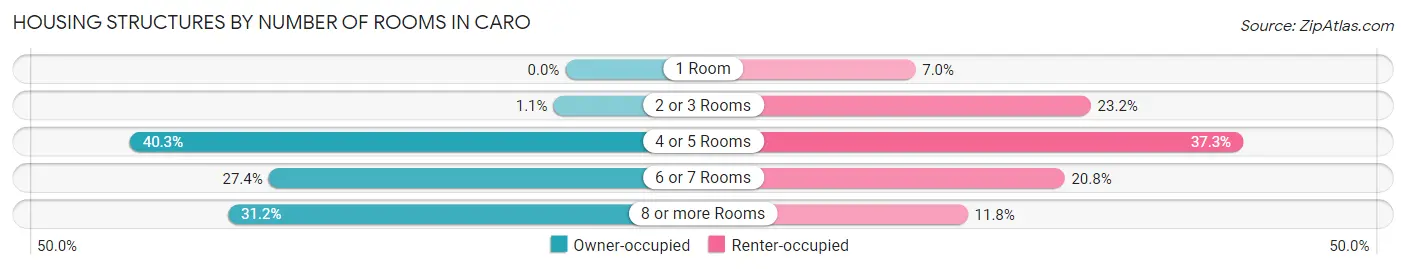
| Number of Rooms | Owner-occupied | Renter-occupied |
| 1 Room | 0 (0.0%) | 49 (7.0%) |
| 2 or 3 Rooms | 13 (1.1%) | 163 (23.2%) |
| 4 or 5 Rooms | 474 (40.3%) | 262 (37.3%) |
| 6 or 7 Rooms | 323 (27.4%) | 146 (20.8%) |
| 8 or more Rooms | 367 (31.2%) | 83 (11.8%) |
| Total | 1,177 (100.0%) | 703 (100.0%) |
Housing Structure by Heating Type in Caro
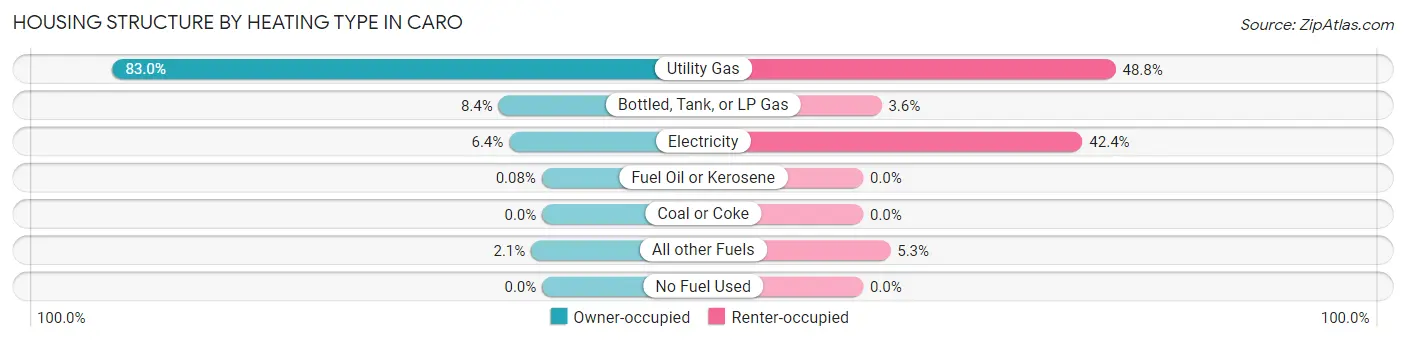
| Heating Type | Owner-occupied | Renter-occupied |
| Utility Gas | 977 (83.0%) | 343 (48.8%) |
| Bottled, Tank, or LP Gas | 99 (8.4%) | 25 (3.6%) |
| Electricity | 75 (6.4%) | 298 (42.4%) |
| Fuel Oil or Kerosene | 1 (0.1%) | 0 (0.0%) |
| Coal or Coke | 0 (0.0%) | 0 (0.0%) |
| All other Fuels | 25 (2.1%) | 37 (5.3%) |
| No Fuel Used | 0 (0.0%) | 0 (0.0%) |
| Total | 1,177 (100.0%) | 703 (100.0%) |
Household Vehicle Usage in Caro
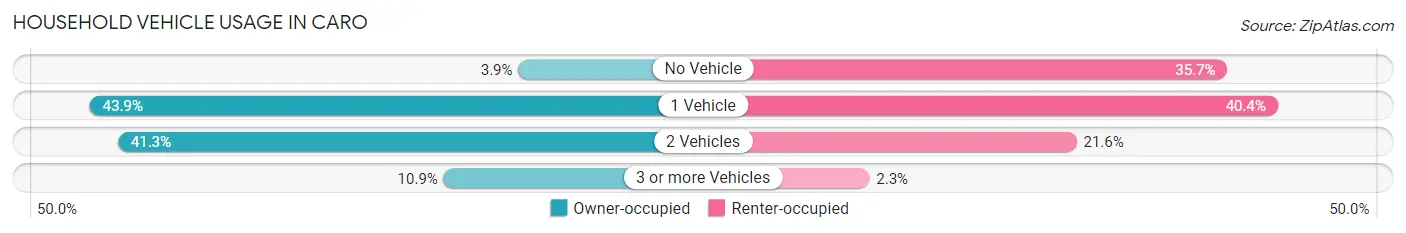
| Vehicles per Household | Owner-occupied | Renter-occupied |
| No Vehicle | 46 (3.9%) | 251 (35.7%) |
| 1 Vehicle | 517 (43.9%) | 284 (40.4%) |
| 2 Vehicles | 486 (41.3%) | 152 (21.6%) |
| 3 or more Vehicles | 128 (10.9%) | 16 (2.3%) |
| Total | 1,177 (100.0%) | 703 (100.0%) |
Real Estate & Mortgages in Caro
Real Estate and Mortgage Overview in Caro
| Characteristic | Without Mortgage | With Mortgage |
| Housing Units | 538 | 639 |
| Median Property Value | $90,800 | $87,600 |
| Median Household Income | $40,882 | $112 |
| Monthly Housing Costs | $459 | $9 |
| Real Estate Taxes | $1,646 | $12 |
Property Value by Mortgage Status in Caro
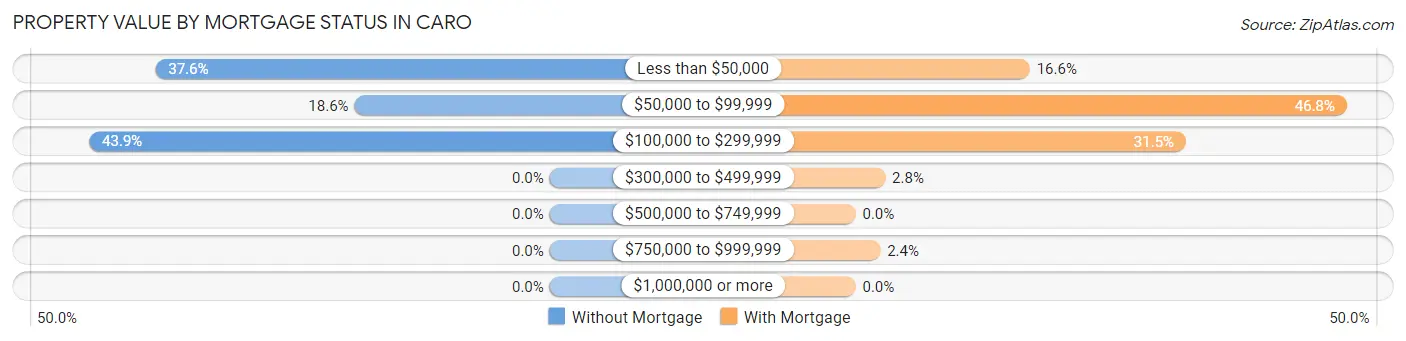
| Property Value | Without Mortgage | With Mortgage |
| Less than $50,000 | 202 (37.6%) | 106 (16.6%) |
| $50,000 to $99,999 | 100 (18.6%) | 299 (46.8%) |
| $100,000 to $299,999 | 236 (43.9%) | 201 (31.5%) |
| $300,000 to $499,999 | 0 (0.0%) | 18 (2.8%) |
| $500,000 to $749,999 | 0 (0.0%) | 0 (0.0%) |
| $750,000 to $999,999 | 0 (0.0%) | 15 (2.4%) |
| $1,000,000 or more | 0 (0.0%) | 0 (0.0%) |
| Total | 538 (100.0%) | 639 (100.0%) |
Household Income by Mortgage Status in Caro
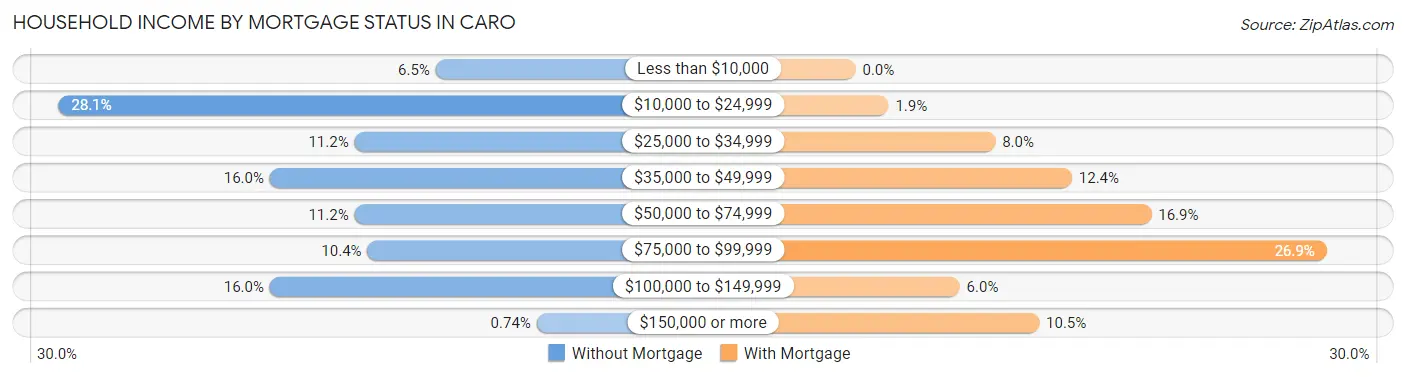
| Household Income | Without Mortgage | With Mortgage |
| Less than $10,000 | 35 (6.5%) | 0 (0.0%) |
| $10,000 to $24,999 | 151 (28.1%) | 12 (1.9%) |
| $25,000 to $34,999 | 60 (11.2%) | 51 (8.0%) |
| $35,000 to $49,999 | 86 (16.0%) | 79 (12.4%) |
| $50,000 to $74,999 | 60 (11.2%) | 108 (16.9%) |
| $75,000 to $99,999 | 56 (10.4%) | 172 (26.9%) |
| $100,000 to $149,999 | 86 (16.0%) | 38 (5.9%) |
| $150,000 or more | 4 (0.7%) | 67 (10.5%) |
| Total | 538 (100.0%) | 639 (100.0%) |
Property Value to Household Income Ratio in Caro
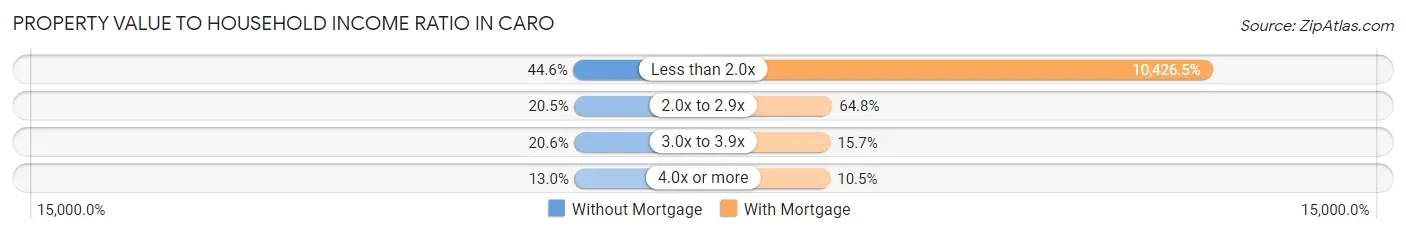
| Value-to-Income Ratio | Without Mortgage | With Mortgage |
| Less than 2.0x | 240 (44.6%) | 66,625 (10,426.4%) |
| 2.0x to 2.9x | 110 (20.4%) | 414 (64.8%) |
| 3.0x to 3.9x | 111 (20.6%) | 100 (15.7%) |
| 4.0x or more | 70 (13.0%) | 67 (10.5%) |
| Total | 538 (100.0%) | 639 (100.0%) |
Real Estate Taxes by Mortgage Status in Caro
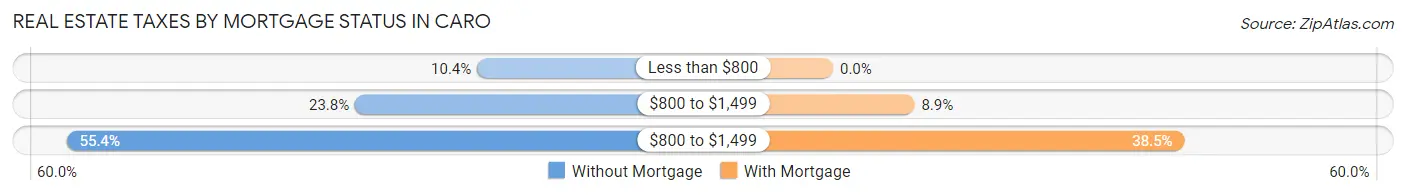
| Property Taxes | Without Mortgage | With Mortgage |
| Less than $800 | 56 (10.4%) | 0 (0.0%) |
| $800 to $1,499 | 128 (23.8%) | 57 (8.9%) |
| $800 to $1,499 | 298 (55.4%) | 246 (38.5%) |
| Total | 538 (100.0%) | 639 (100.0%) |
Health & Disability in Caro
Health Insurance Coverage by Age in Caro
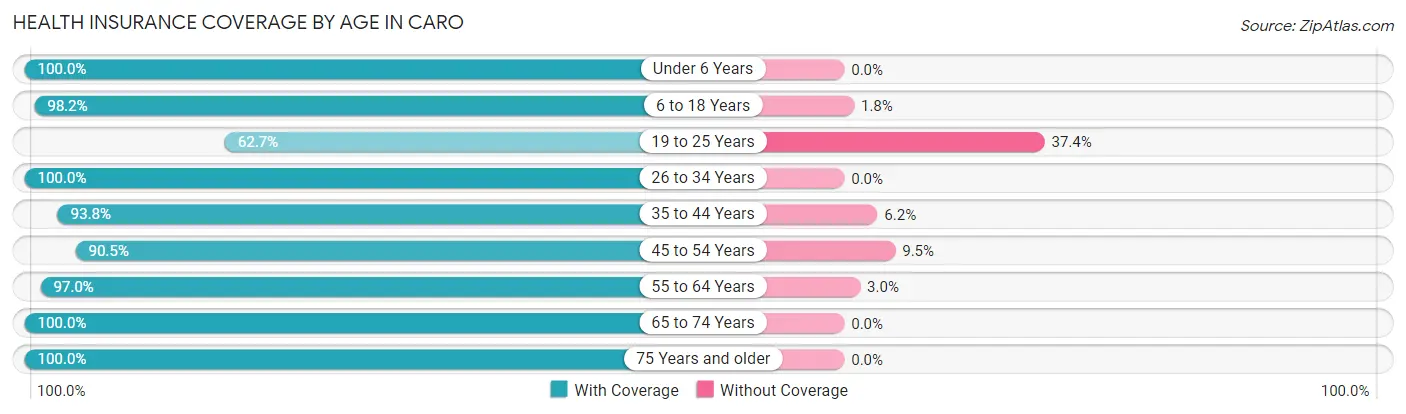
| Age Bracket | With Coverage | Without Coverage |
| Under 6 Years | 282 (100.0%) | 0 (0.0%) |
| 6 to 18 Years | 701 (98.2%) | 13 (1.8%) |
| 19 to 25 Years | 213 (62.6%) | 127 (37.3%) |
| 26 to 34 Years | 457 (100.0%) | 0 (0.0%) |
| 35 to 44 Years | 487 (93.8%) | 32 (6.2%) |
| 45 to 54 Years | 428 (90.5%) | 45 (9.5%) |
| 55 to 64 Years | 393 (97.0%) | 12 (3.0%) |
| 65 to 74 Years | 564 (100.0%) | 0 (0.0%) |
| 75 Years and older | 332 (100.0%) | 0 (0.0%) |
| Total | 3,857 (94.4%) | 229 (5.6%) |
Health Insurance Coverage by Citizenship Status in Caro
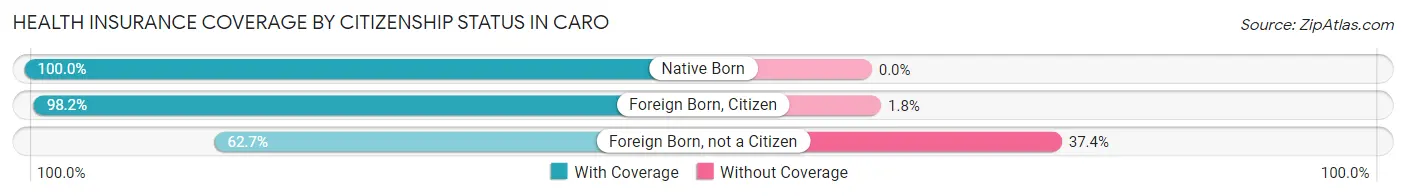
| Citizenship Status | With Coverage | Without Coverage |
| Native Born | 282 (100.0%) | 0 (0.0%) |
| Foreign Born, Citizen | 701 (98.2%) | 13 (1.8%) |
| Foreign Born, not a Citizen | 213 (62.6%) | 127 (37.3%) |
Health Insurance Coverage by Household Income in Caro
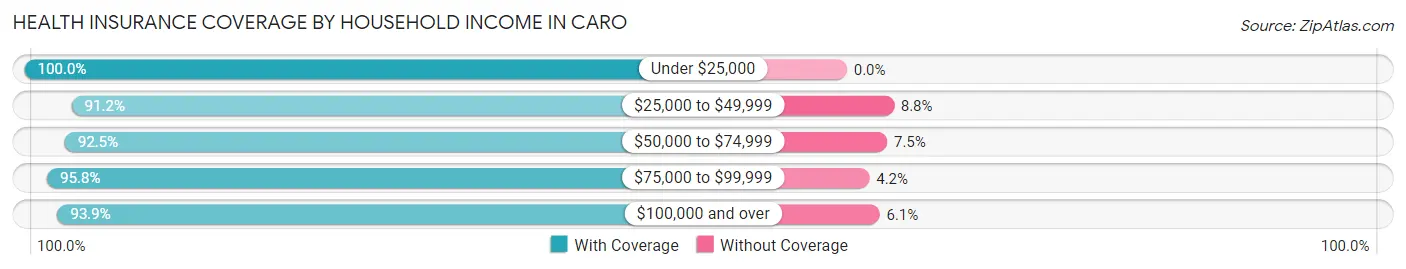
| Household Income | With Coverage | Without Coverage |
| Under $25,000 | 784 (100.0%) | 0 (0.0%) |
| $25,000 to $49,999 | 1,098 (91.2%) | 106 (8.8%) |
| $50,000 to $74,999 | 503 (92.5%) | 41 (7.5%) |
| $75,000 to $99,999 | 410 (95.8%) | 18 (4.2%) |
| $100,000 and over | 978 (93.9%) | 64 (6.1%) |
Public vs Private Health Insurance Coverage by Age in Caro
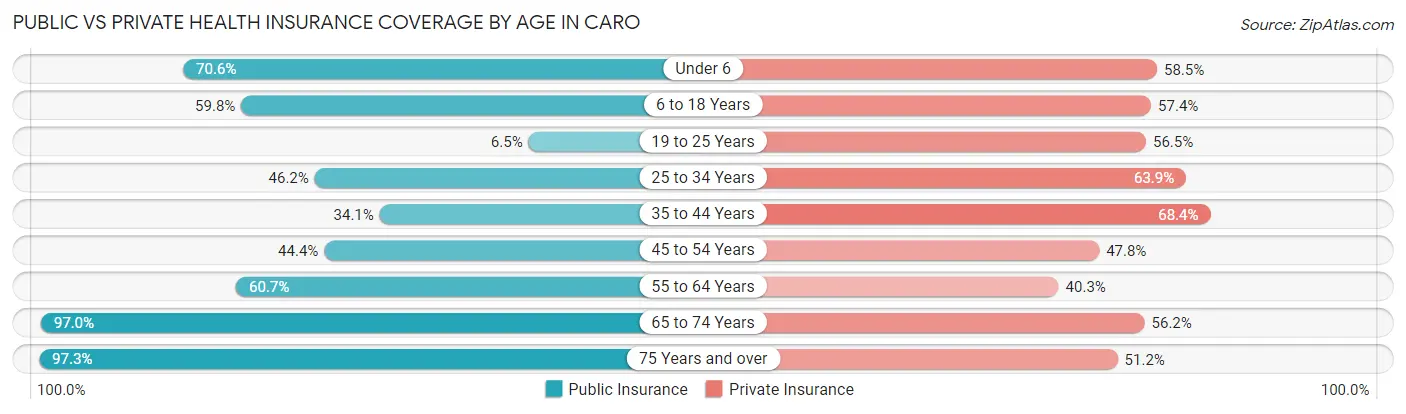
| Age Bracket | Public Insurance | Private Insurance |
| Under 6 | 199 (70.6%) | 165 (58.5%) |
| 6 to 18 Years | 427 (59.8%) | 410 (57.4%) |
| 19 to 25 Years | 22 (6.5%) | 192 (56.5%) |
| 25 to 34 Years | 211 (46.2%) | 292 (63.9%) |
| 35 to 44 Years | 177 (34.1%) | 355 (68.4%) |
| 45 to 54 Years | 210 (44.4%) | 226 (47.8%) |
| 55 to 64 Years | 246 (60.7%) | 163 (40.3%) |
| 65 to 74 Years | 547 (97.0%) | 317 (56.2%) |
| 75 Years and over | 323 (97.3%) | 170 (51.2%) |
| Total | 2,362 (57.8%) | 2,290 (56.0%) |
Disability Status by Sex by Age in Caro
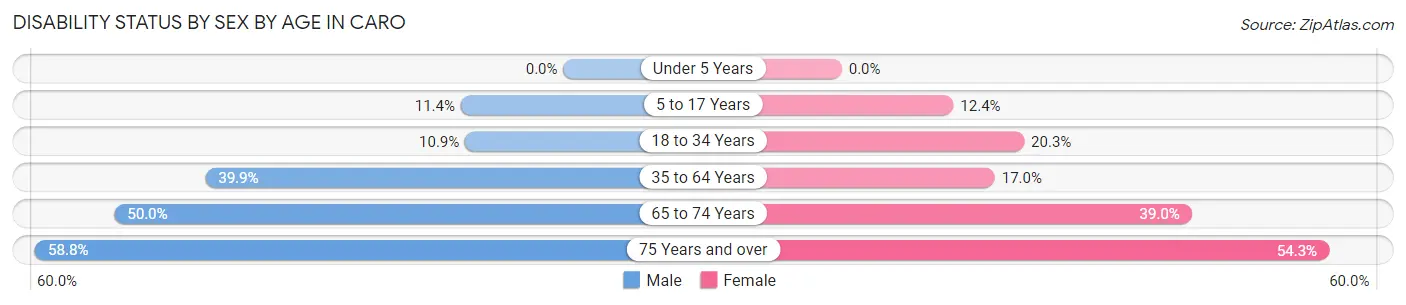
| Age Bracket | Male | Female |
| Under 5 Years | 0 (0.0%) | 0 (0.0%) |
| 5 to 17 Years | 41 (11.4%) | 45 (12.4%) |
| 18 to 34 Years | 51 (10.9%) | 78 (20.3%) |
| 35 to 64 Years | 309 (39.9%) | 106 (17.0%) |
| 65 to 74 Years | 119 (50.0%) | 127 (39.0%) |
| 75 Years and over | 50 (58.8%) | 134 (54.2%) |
Disability Class by Sex by Age in Caro
Disability Class: Hearing Difficulty
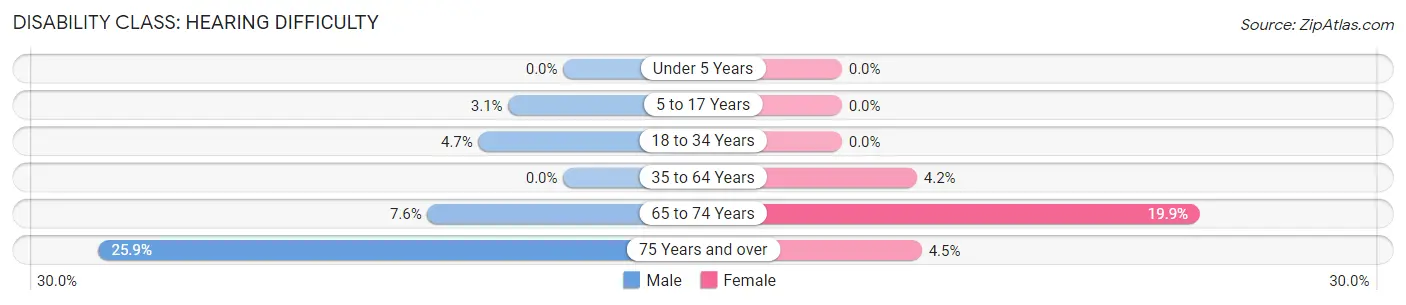
| Age Bracket | Male | Female |
| Under 5 Years | 0 (0.0%) | 0 (0.0%) |
| 5 to 17 Years | 11 (3.1%) | 0 (0.0%) |
| 18 to 34 Years | 22 (4.7%) | 0 (0.0%) |
| 35 to 64 Years | 0 (0.0%) | 26 (4.2%) |
| 65 to 74 Years | 18 (7.6%) | 65 (19.9%) |
| 75 Years and over | 22 (25.9%) | 11 (4.4%) |
Disability Class: Vision Difficulty
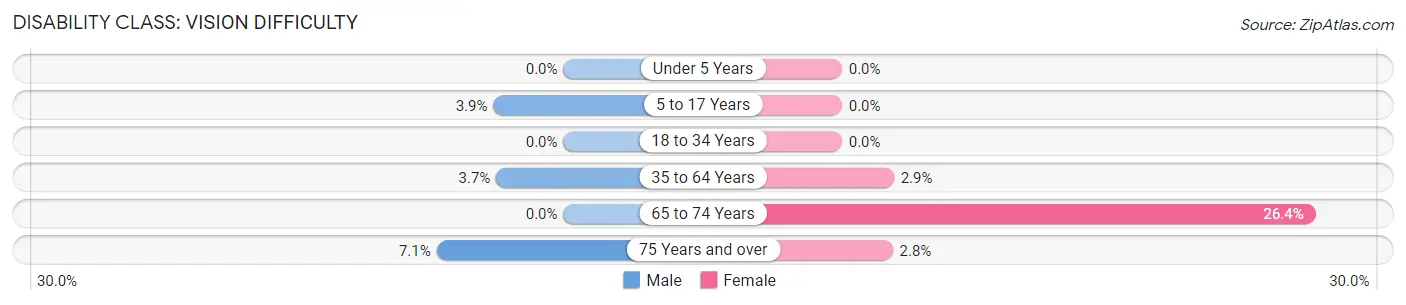
| Age Bracket | Male | Female |
| Under 5 Years | 0 (0.0%) | 0 (0.0%) |
| 5 to 17 Years | 14 (3.9%) | 0 (0.0%) |
| 18 to 34 Years | 0 (0.0%) | 0 (0.0%) |
| 35 to 64 Years | 29 (3.7%) | 18 (2.9%) |
| 65 to 74 Years | 0 (0.0%) | 86 (26.4%) |
| 75 Years and over | 6 (7.1%) | 7 (2.8%) |
Disability Class: Cognitive Difficulty
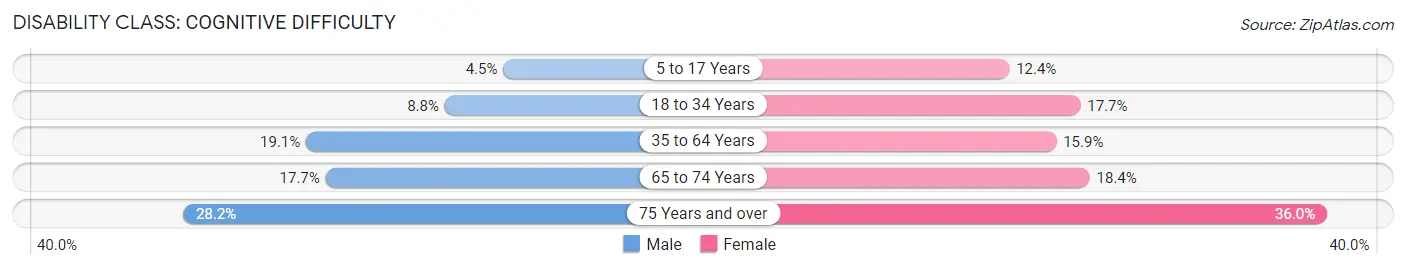
| Age Bracket | Male | Female |
| 5 to 17 Years | 16 (4.5%) | 45 (12.4%) |
| 18 to 34 Years | 41 (8.8%) | 68 (17.7%) |
| 35 to 64 Years | 148 (19.1%) | 99 (15.9%) |
| 65 to 74 Years | 42 (17.6%) | 60 (18.4%) |
| 75 Years and over | 24 (28.2%) | 89 (36.0%) |
Disability Class: Ambulatory Difficulty
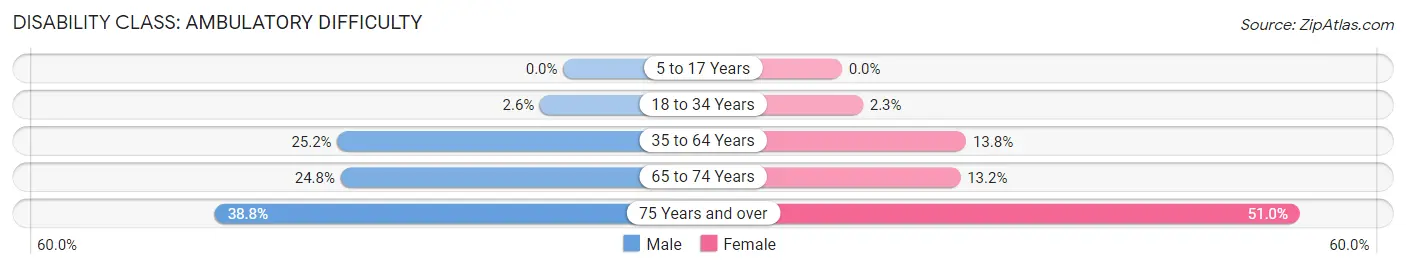
| Age Bracket | Male | Female |
| 5 to 17 Years | 0 (0.0%) | 0 (0.0%) |
| 18 to 34 Years | 12 (2.6%) | 9 (2.3%) |
| 35 to 64 Years | 195 (25.2%) | 86 (13.8%) |
| 65 to 74 Years | 59 (24.8%) | 43 (13.2%) |
| 75 Years and over | 33 (38.8%) | 126 (51.0%) |
Disability Class: Self-Care Difficulty
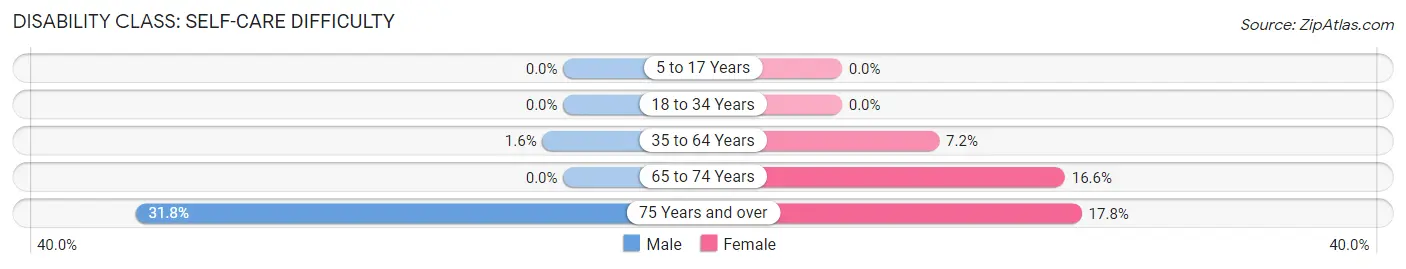
| Age Bracket | Male | Female |
| 5 to 17 Years | 0 (0.0%) | 0 (0.0%) |
| 18 to 34 Years | 0 (0.0%) | 0 (0.0%) |
| 35 to 64 Years | 12 (1.5%) | 45 (7.2%) |
| 65 to 74 Years | 0 (0.0%) | 54 (16.6%) |
| 75 Years and over | 27 (31.8%) | 44 (17.8%) |
Technology Access in Caro
Computing Device Access in Caro
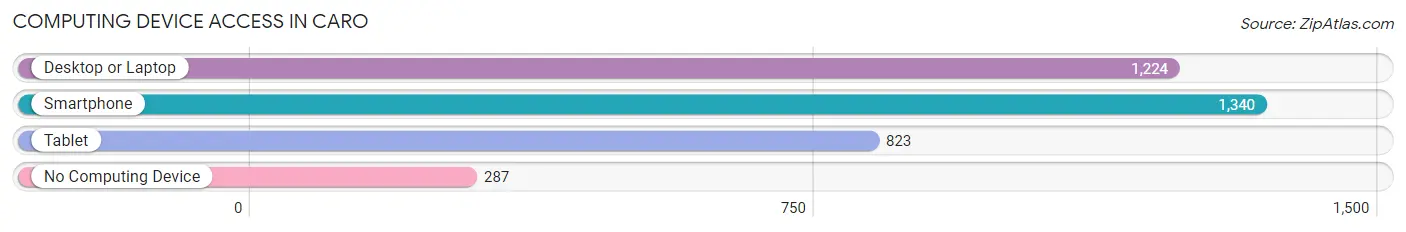
| Device Type | # Households | % Households |
| Desktop or Laptop | 1,224 | 65.1% |
| Smartphone | 1,340 | 71.3% |
| Tablet | 823 | 43.8% |
| No Computing Device | 287 | 15.3% |
| Total | 1,880 | 100.0% |
Internet Access in Caro
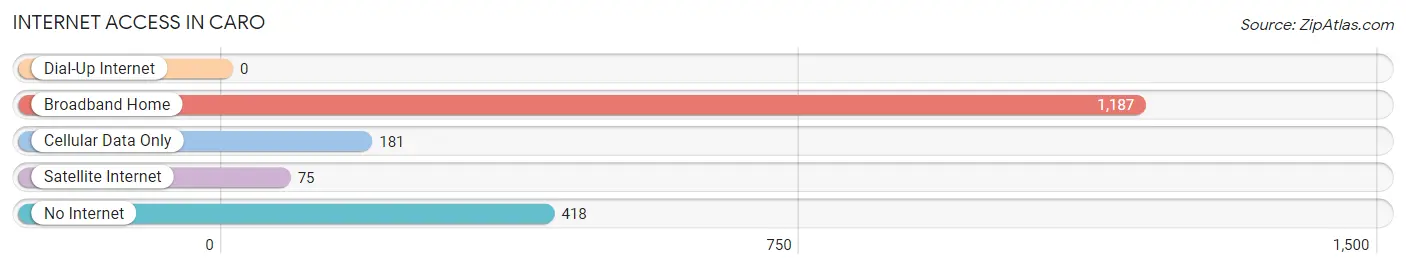
| Internet Type | # Households | % Households |
| Dial-Up Internet | 0 | 0.0% |
| Broadband Home | 1,187 | 63.1% |
| Cellular Data Only | 181 | 9.6% |
| Satellite Internet | 75 | 4.0% |
| No Internet | 418 | 22.2% |
| Total | 1,880 | 100.0% |
Caro Summary
Caro is a city located in the state of Michigan in the United States. It is the county seat of Tuscola County and is located in the Thumb region of the Lower Peninsula. The city is situated on the Cass River and is home to a population of 5,229 people as of the 2010 census.
Geography
Caro is located at 43°30'N 83°22'W (43.50, -83.37). According to the United States Census Bureau, the city has a total area of 3.2 square miles (8.3 km2), all land.
Caro is located in the Thumb region of Michigan, which is a subregion of the Lower Peninsula. The Thumb is known for its flat terrain and fertile soil, which makes it ideal for agriculture. The Cass River runs through the city and is a popular spot for fishing and other recreational activities.
History
Caro was founded in 1854 by a group of settlers from New York. The city was named after Caro, a Native American chief who lived in the area. The city was incorporated in 1871 and quickly became a hub for the lumber industry. The city was also home to a number of factories, including a paper mill, a furniture factory, and a canning factory.
The city experienced a period of growth in the late 19th and early 20th centuries, but the Great Depression and World War II caused a decline in the city’s population. The city’s economy began to recover in the 1950s and 1960s, and the population began to grow again.
Economy
Caro’s economy is largely based on agriculture and manufacturing. The city is home to a number of agricultural businesses, including a dairy farm, a vegetable farm, and a fruit farm. The city is also home to a number of manufacturing businesses, including a paper mill, a furniture factory, and a canning factory.
The city is also home to a number of retail businesses, including a grocery store, a hardware store, and a number of restaurants. The city is also home to a number of service businesses, including a bank, a post office, and a number of medical offices.
Demographics
As of the 2010 census, the population of Caro was 5,229. The racial makeup of the city was 95.2% White, 0.7% African American, 0.4% Native American, 0.3% Asian, 0.1% Pacific Islander, 1.3% from other races, and 2.1% from two or more races. Hispanic or Latino of any race were 3.2% of the population.
The median household income in Caro was $37,917, and the median family income was $45,938. The per capita income for the city was $19,845. About 14.2% of families and 17.2% of the population were below the poverty line, including 25.2% of those under age 18 and 8.2% of those age 65 or over.
Conclusion
Caro is a city located in the state of Michigan in the United States. It is the county seat of Tuscola County and is located in the Thumb region of the Lower Peninsula. The city is situated on the Cass River and is home to a population of 5,229 people as of the 2010 census. Caro’s economy is largely based on agriculture and manufacturing, and the city is home to a number of retail and service businesses. The racial makeup of the city is predominantly White, with a small percentage of African American, Native American, Asian, and Pacific Islander residents. The median household income in Caro is $37,917, and the median family income is $45,938.
Common Questions
What is Per Capita Income in Caro?
Per Capita income in Caro is $27,429.
What is the Median Family Income in Caro?
Median Family Income in Caro is $53,929.
What is the Median Household income in Caro?
Median Household Income in Caro is $44,342.
What is Income or Wage Gap in Caro?
Income or Wage Gap in Caro is 20.8%.
Women in Caro earn 79.2 cents for every dollar earned by a man.
What is Inequality or Gini Index in Caro?
Inequality or Gini Index in Caro is 0.45.
What is the Total Population of Caro?
Total Population of Caro is 4,294.
What is the Total Male Population of Caro?
Total Male Population of Caro is 2,185.
What is the Total Female Population of Caro?
Total Female Population of Caro is 2,109.
What is the Ratio of Males per 100 Females in Caro?
There are 103.60 Males per 100 Females in Caro.
What is the Ratio of Females per 100 Males in Caro?
There are 96.52 Females per 100 Males in Caro.
What is the Median Population Age in Caro?
Median Population Age in Caro is 40.5 Years.
What is the Average Family Size in Caro
Average Family Size in Caro is 3.0 People.
What is the Average Household Size in Caro
Average Household Size in Caro is 2.1 People.
How Large is the Labor Force in Caro?
There are 1,743 People in the Labor Forcein in Caro.
What is the Percentage of People in the Labor Force in Caro?
51.0% of People are in the Labor Force in Caro.
What is the Unemployment Rate in Caro?
Unemployment Rate in Caro is 10.3%.