Hudsonville, MI Map & Demographics
Hudsonville Map
Hudsonville Overview
$31,808
PER CAPITA INCOME
$92,000
AVG FAMILY INCOME
$86,000
AVG HOUSEHOLD INCOME
34.6%
WAGE / INCOME GAP [ % ]
65.4¢/ $1
WAGE / INCOME GAP [ $ ]
0.35
INEQUALITY / GINI INDEX
7,633
TOTAL POPULATION
3,820
MALE POPULATION
3,813
FEMALE POPULATION
100.18
MALES / 100 FEMALES
99.82
FEMALES / 100 MALES
32.1
MEDIAN AGE
3.2
AVG FAMILY SIZE
2.8
AVG HOUSEHOLD SIZE
3,837
LABOR FORCE [ PEOPLE ]
70.3%
PERCENT IN LABOR FORCE
6.0%
UNEMPLOYMENT RATE
Hudsonville Zip Codes
Hudsonville Area Codes
Income in Hudsonville
Income Overview in Hudsonville
Per Capita Income in Hudsonville is $31,808, while median incomes of families and households are $92,000 and $86,000 respectively.
| Characteristic | Number | Measure |
| Per Capita Income | 7,633 | $31,808 |
| Median Family Income | 2,044 | $92,000 |
| Mean Family Income | 2,044 | $104,272 |
| Median Household Income | 2,662 | $86,000 |
| Mean Household Income | 2,662 | $93,535 |
| Income Deficit | 2,044 | $0 |
| Wage / Income Gap (%) | 7,633 | 34.57% |
| Wage / Income Gap ($) | 7,633 | 65.43¢ per $1 |
| Gini / Inequality Index | 7,633 | 0.35 |
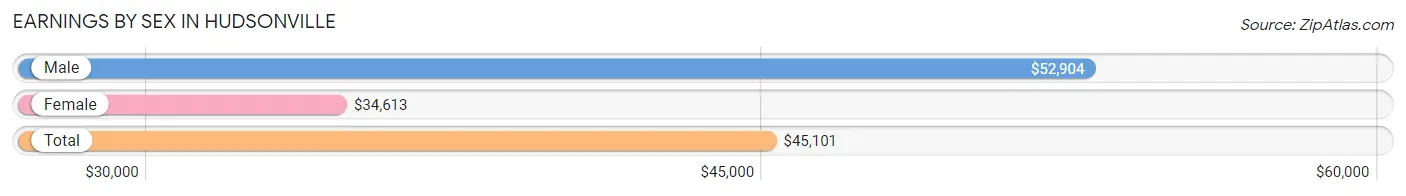
Earnings by Sex in Hudsonville
Average Earnings in Hudsonville are $45,101, $52,904 for men and $34,613 for women, a difference of 34.6%.
| Sex | Number | Average Earnings |
| Male | 2,216 (55.8%) | $52,904 |
| Female | 1,754 (44.2%) | $34,613 |
| Total | 3,970 (100.0%) | $45,101 |
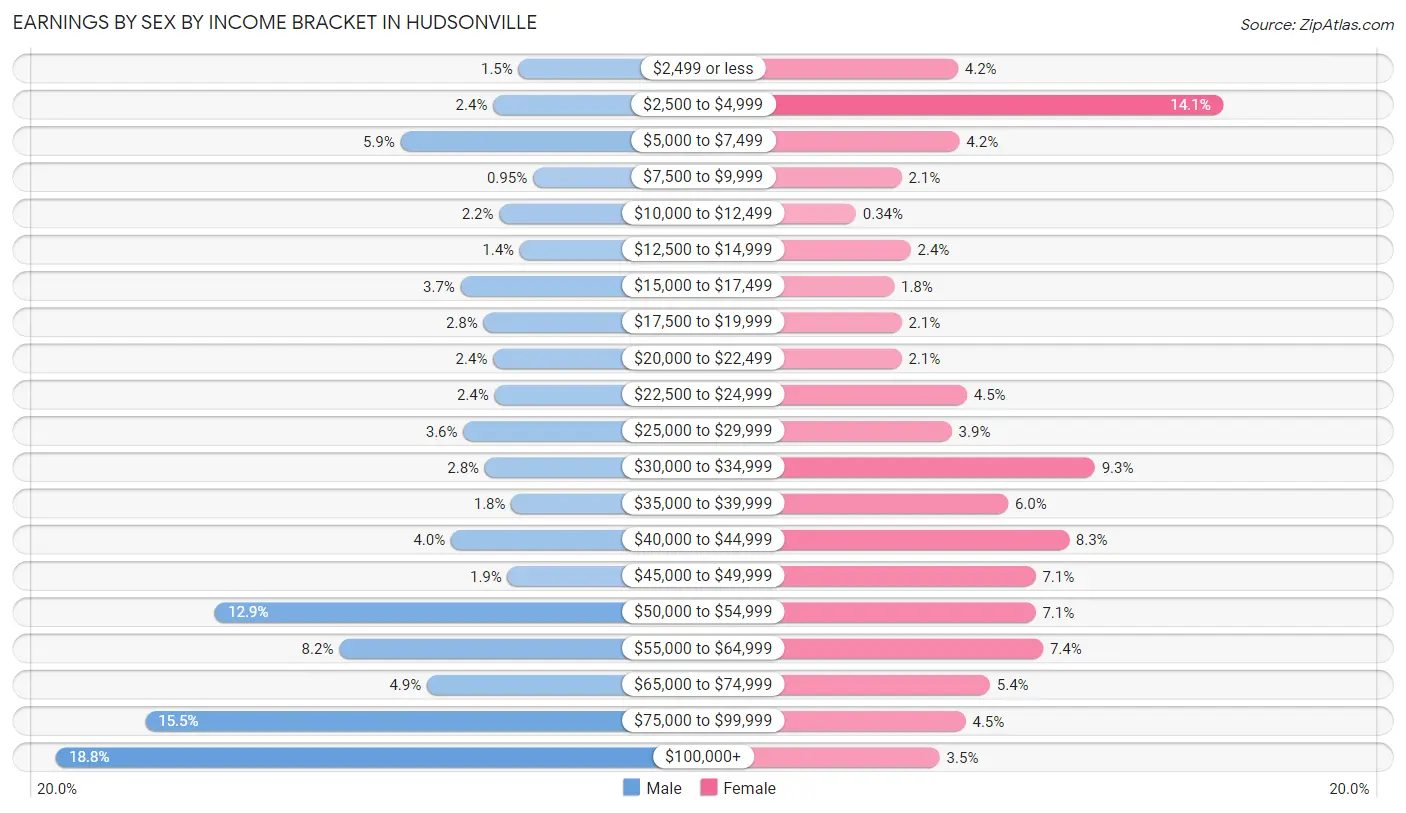
Earnings by Sex by Income Bracket in Hudsonville
The most common earnings brackets in Hudsonville are $100,000+ for men (417 | 18.8%) and $2,500 to $4,999 for women (247 | 14.1%).
| Income | Male | Female |
| $2,499 or less | 33 (1.5%) | 73 (4.2%) |
| $2,500 to $4,999 | 54 (2.4%) | 247 (14.1%) |
| $5,000 to $7,499 | 131 (5.9%) | 74 (4.2%) |
| $7,500 to $9,999 | 21 (0.9%) | 36 (2.1%) |
| $10,000 to $12,499 | 49 (2.2%) | 6 (0.3%) |
| $12,500 to $14,999 | 32 (1.4%) | 42 (2.4%) |
| $15,000 to $17,499 | 81 (3.7%) | 31 (1.8%) |
| $17,500 to $19,999 | 62 (2.8%) | 36 (2.1%) |
| $20,000 to $22,499 | 54 (2.4%) | 36 (2.1%) |
| $22,500 to $24,999 | 53 (2.4%) | 79 (4.5%) |
| $25,000 to $29,999 | 79 (3.6%) | 69 (3.9%) |
| $30,000 to $34,999 | 61 (2.8%) | 163 (9.3%) |
| $35,000 to $39,999 | 39 (1.8%) | 106 (6.0%) |
| $40,000 to $44,999 | 89 (4.0%) | 146 (8.3%) |
| $45,000 to $49,999 | 42 (1.9%) | 124 (7.1%) |
| $50,000 to $54,999 | 285 (12.9%) | 124 (7.1%) |
| $55,000 to $64,999 | 182 (8.2%) | 129 (7.3%) |
| $65,000 to $74,999 | 109 (4.9%) | 94 (5.4%) |
| $75,000 to $99,999 | 343 (15.5%) | 78 (4.4%) |
| $100,000+ | 417 (18.8%) | 61 (3.5%) |
| Total | 2,216 (100.0%) | 1,754 (100.0%) |
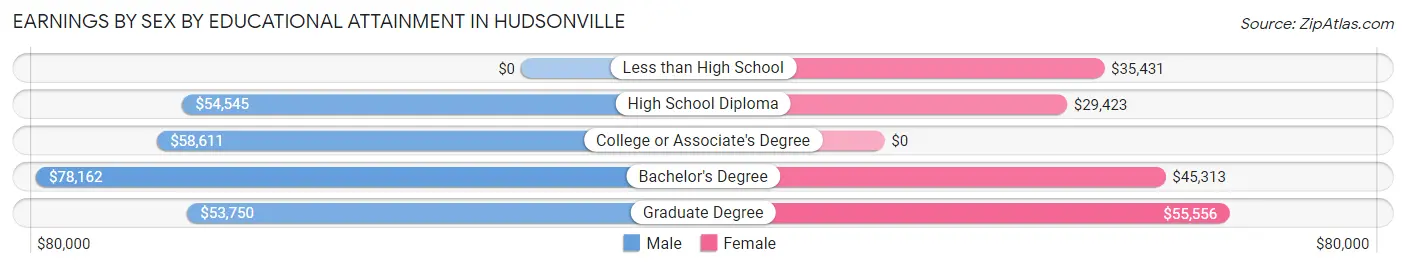
Earnings by Sex by Educational Attainment in Hudsonville
Average earnings in Hudsonville are $58,030 for men and $36,213 for women, a difference of 37.6%. Men with an educational attainment of bachelor's degree enjoy the highest average annual earnings of $78,162, while those with graduate degree education earn the least with $53,750. Women with an educational attainment of graduate degree earn the most with the average annual earnings of $55,556, while those with high school diploma education have the smallest earnings of $29,423.
| Educational Attainment | Male Income | Female Income |
| Less than High School | - | - |
| High School Diploma | $54,545 | $29,423 |
| College or Associate's Degree | $58,611 | $0 |
| Bachelor's Degree | $78,162 | $45,313 |
| Graduate Degree | $53,750 | $55,556 |
| Total | $58,030 | $36,213 |
Family Income in Hudsonville
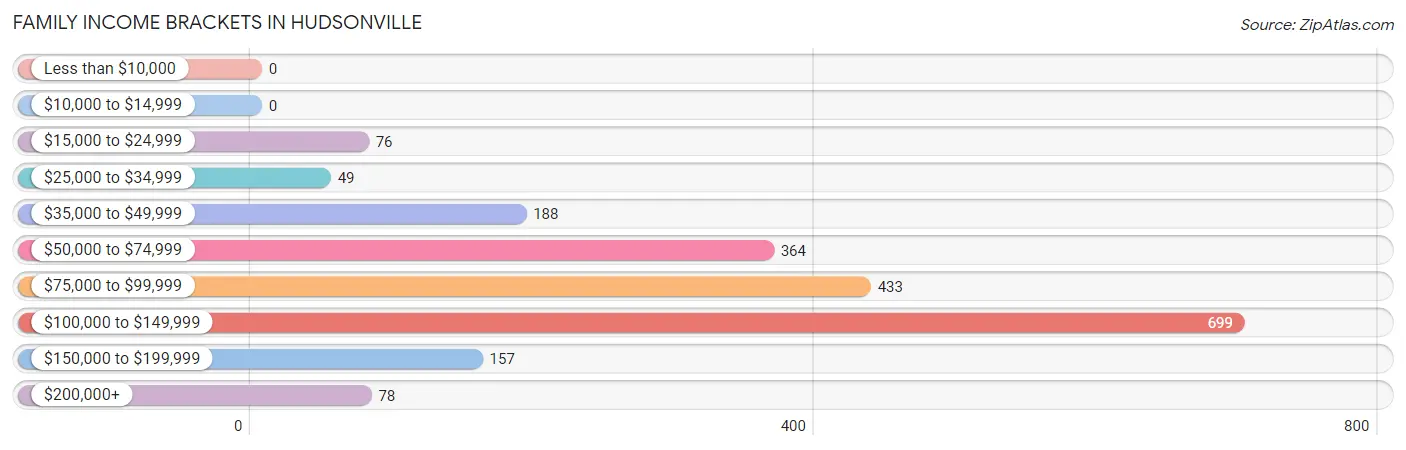
Family Income Brackets in Hudsonville
According to the Hudsonville family income data, there are 699 families falling into the $100,000 to $149,999 income range, which is the most common income bracket and makes up 34.2% of all families.
| Income Bracket | # Families | % Families |
| Less than $10,000 | 0 | 0.0% |
| $10,000 to $14,999 | 0 | 0.0% |
| $15,000 to $24,999 | 76 | 3.7% |
| $25,000 to $34,999 | 49 | 2.4% |
| $35,000 to $49,999 | 188 | 9.2% |
| $50,000 to $74,999 | 364 | 17.8% |
| $75,000 to $99,999 | 433 | 21.2% |
| $100,000 to $149,999 | 699 | 34.2% |
| $150,000 to $199,999 | 157 | 7.7% |
| $200,000+ | 78 | 3.8% |
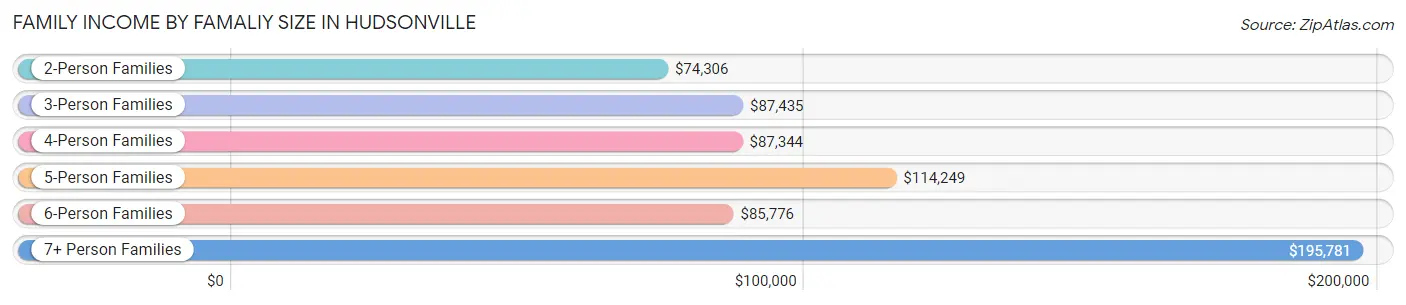
Family Income by Famaliy Size in Hudsonville
7+ person families (54 | 2.6%) account for the highest median family income in Hudsonville with $195,781 per family, while 2-person families (776 | 38.0%) have the highest median income of $37,153 per family member.
| Income Bracket | # Families | Median Income |
| 2-Person Families | 776 (38.0%) | $74,306 |
| 3-Person Families | 525 (25.7%) | $87,435 |
| 4-Person Families | 287 (14.0%) | $87,344 |
| 5-Person Families | 328 (16.1%) | $114,249 |
| 6-Person Families | 74 (3.6%) | $85,776 |
| 7+ Person Families | 54 (2.6%) | $195,781 |
| Total | 2,044 (100.0%) | $92,000 |
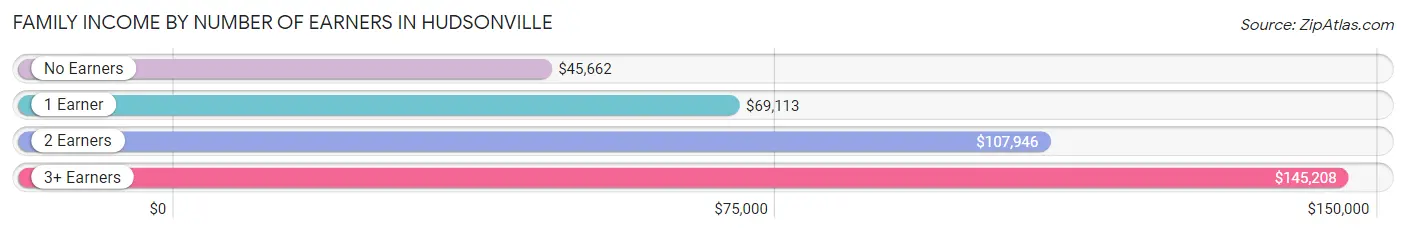
Family Income by Number of Earners in Hudsonville
The median family income in Hudsonville is $92,000, with families comprising 3+ earners (176) having the highest median family income of $145,208, while families with no earners (199) have the lowest median family income of $45,662, accounting for 8.6% and 9.7% of families, respectively.
| Number of Earners | # Families | Median Income |
| No Earners | 199 (9.7%) | $45,662 |
| 1 Earner | 494 (24.2%) | $69,113 |
| 2 Earners | 1,175 (57.5%) | $107,946 |
| 3+ Earners | 176 (8.6%) | $145,208 |
| Total | 2,044 (100.0%) | $92,000 |
Household Income in Hudsonville
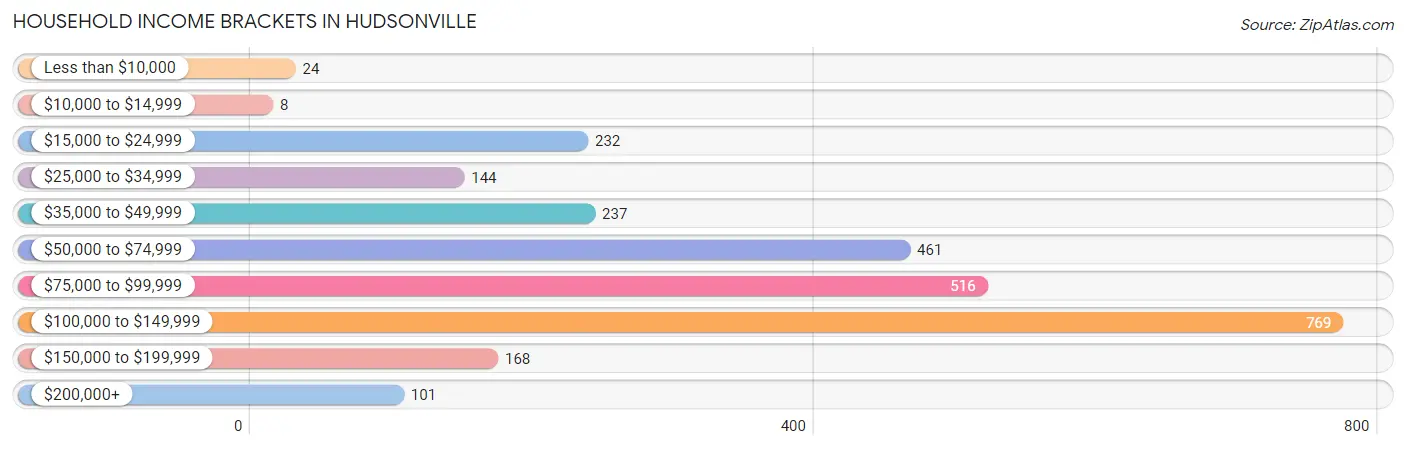
Household Income Brackets in Hudsonville
With 769 households falling in the category, the $100,000 to $149,999 income range is the most frequent in Hudsonville, accounting for 28.9% of all households. In contrast, only 8 households (0.3%) fall into the $10,000 to $14,999 income bracket, making it the least populous group.
| Income Bracket | # Households | % Households |
| Less than $10,000 | 24 | 0.9% |
| $10,000 to $14,999 | 8 | 0.3% |
| $15,000 to $24,999 | 232 | 8.7% |
| $25,000 to $34,999 | 144 | 5.4% |
| $35,000 to $49,999 | 237 | 8.9% |
| $50,000 to $74,999 | 461 | 17.3% |
| $75,000 to $99,999 | 516 | 19.4% |
| $100,000 to $149,999 | 769 | 28.9% |
| $150,000 to $199,999 | 168 | 6.3% |
| $200,000+ | 101 | 3.8% |
Household Income by Householder Age in Hudsonville
The median household income in Hudsonville is $86,000, with the highest median household income of $97,500 found in the 45 to 64 years age bracket for the primary householder. A total of 726 households (27.3%) fall into this category. Meanwhile, the 15 to 24 years age bracket for the primary householder has the lowest median household income of $0, with 44 households (1.7%) in this group.
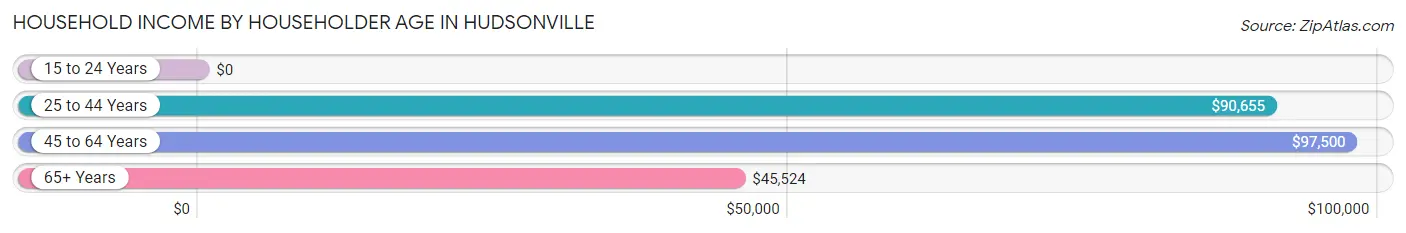
| Income Bracket | # Households | Median Income |
| 15 to 24 Years | 44 (1.7%) | $0 |
| 25 to 44 Years | 1,241 (46.6%) | $90,655 |
| 45 to 64 Years | 726 (27.3%) | $97,500 |
| 65+ Years | 651 (24.5%) | $45,524 |
| Total | 2,662 (100.0%) | $86,000 |
Poverty in Hudsonville
Income Below Poverty by Sex and Age in Hudsonville
With 4.8% poverty level for males and 3.9% for females among the residents of Hudsonville, 16 and 17 year old males and 55 to 64 year old females are the most vulnerable to poverty, with 16 males (25.0%) and 47 females (12.2%) in their respective age groups living below the poverty level.
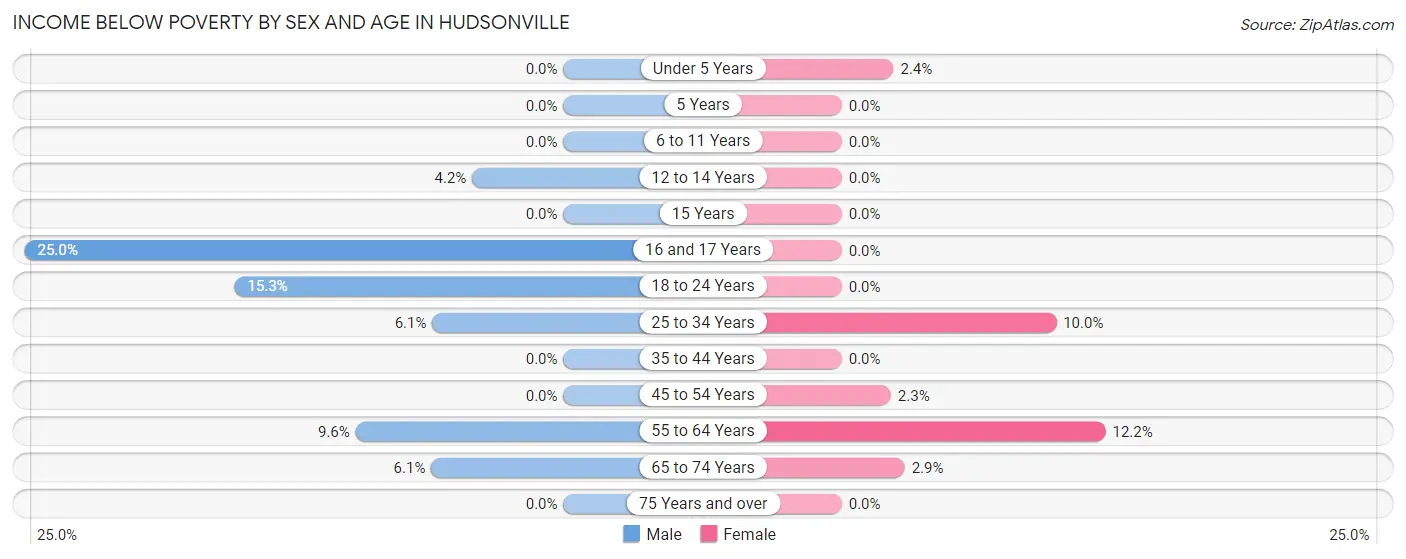
| Age Bracket | Male | Female |
| Under 5 Years | 0 (0.0%) | 8 (2.4%) |
| 5 Years | 0 (0.0%) | 0 (0.0%) |
| 6 to 11 Years | 0 (0.0%) | 0 (0.0%) |
| 12 to 14 Years | 16 (4.2%) | 0 (0.0%) |
| 15 Years | 0 (0.0%) | 0 (0.0%) |
| 16 and 17 Years | 16 (25.0%) | 0 (0.0%) |
| 18 to 24 Years | 38 (15.3%) | 0 (0.0%) |
| 25 to 34 Years | 56 (6.1%) | 74 (10.0%) |
| 35 to 44 Years | 0 (0.0%) | 0 (0.0%) |
| 45 to 54 Years | 0 (0.0%) | 7 (2.3%) |
| 55 to 64 Years | 37 (9.6%) | 47 (12.2%) |
| 65 to 74 Years | 16 (6.1%) | 8 (2.9%) |
| 75 Years and over | 0 (0.0%) | 0 (0.0%) |
| Total | 179 (4.8%) | 144 (3.9%) |
Income Above Poverty by Sex and Age in Hudsonville
According to the poverty statistics in Hudsonville, males aged under 5 years and females aged 5 years are the age groups that are most secure financially, with 100.0% of males and 100.0% of females in these age groups living above the poverty line.
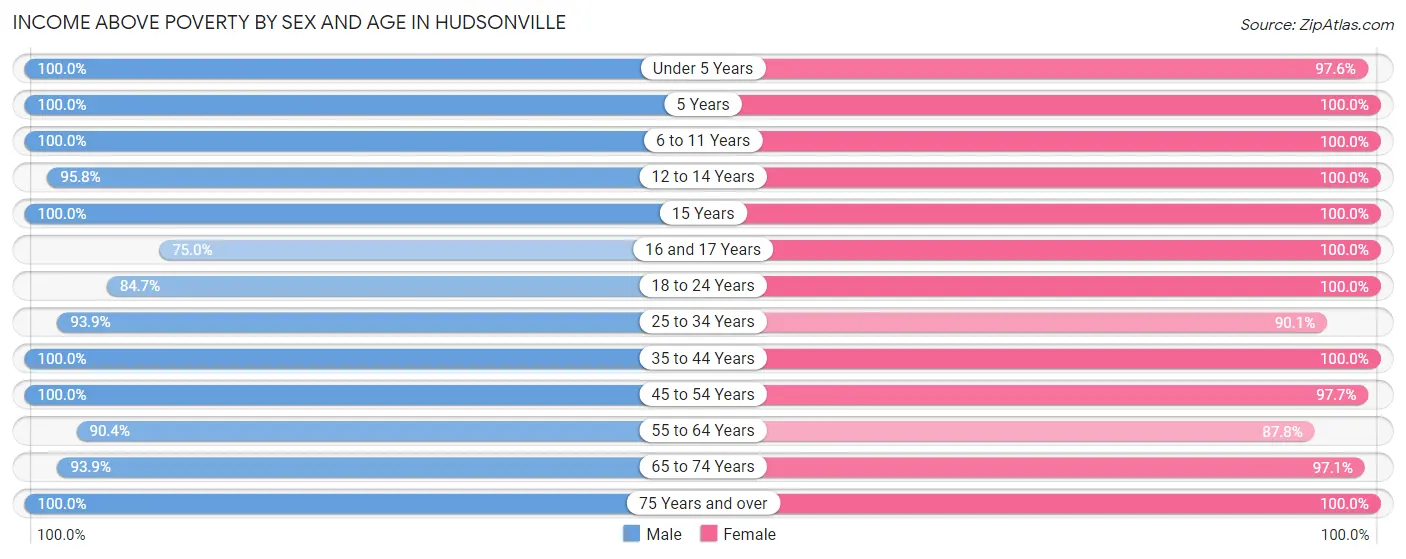
| Age Bracket | Male | Female |
| Under 5 Years | 246 (100.0%) | 326 (97.6%) |
| 5 Years | 32 (100.0%) | 50 (100.0%) |
| 6 to 11 Years | 353 (100.0%) | 505 (100.0%) |
| 12 to 14 Years | 362 (95.8%) | 144 (100.0%) |
| 15 Years | 9 (100.0%) | 48 (100.0%) |
| 16 and 17 Years | 48 (75.0%) | 35 (100.0%) |
| 18 to 24 Years | 211 (84.7%) | 217 (100.0%) |
| 25 to 34 Years | 865 (93.9%) | 670 (90.0%) |
| 35 to 44 Years | 379 (100.0%) | 387 (100.0%) |
| 45 to 54 Years | 283 (100.0%) | 300 (97.7%) |
| 55 to 64 Years | 347 (90.4%) | 337 (87.8%) |
| 65 to 74 Years | 245 (93.9%) | 266 (97.1%) |
| 75 Years and over | 211 (100.0%) | 258 (100.0%) |
| Total | 3,591 (95.3%) | 3,543 (96.1%) |
Income Below Poverty Among Married-Couple Families in Hudsonville
The poverty statistics for married-couple families in Hudsonville show that 0.4% or 7 of the total 1,676 families live below the poverty line. Families with no children have the highest poverty rate of 0.9%, comprising of 7 families. On the other hand, families with 1 or 2 children have the lowest poverty rate of 0.0%, which includes 0 families.
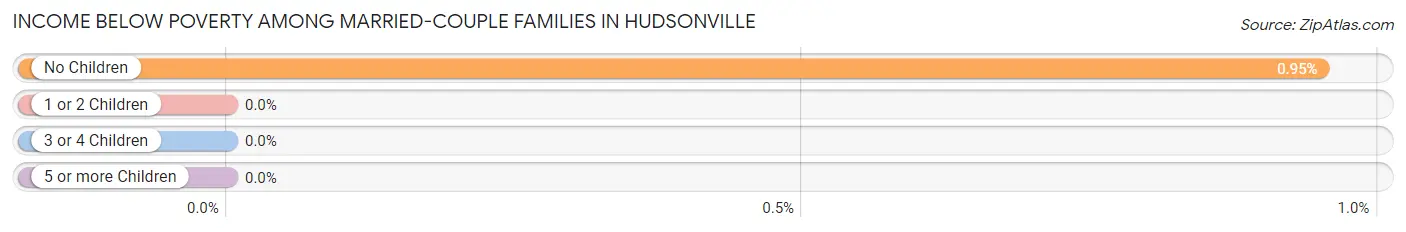
| Children | Above Poverty | Below Poverty |
| No Children | 726 (99.1%) | 7 (0.9%) |
| 1 or 2 Children | 597 (100.0%) | 0 (0.0%) |
| 3 or 4 Children | 346 (100.0%) | 0 (0.0%) |
| 5 or more Children | 0 (0.0%) | 0 (0.0%) |
| Total | 1,669 (99.6%) | 7 (0.4%) |
Income Below Poverty Among Single-Parent Households in Hudsonville
According to the poverty data in Hudsonville, 28.7% or 27 single-father households and 6.6% or 18 single-mother households are living below the poverty line. Among single-father households, those with no children have the highest poverty rate, with 27 households (38.6%) experiencing poverty. Likewise, among single-mother households, those with 3 or 4 children have the highest poverty rate, with 18 households (28.6%) falling below the poverty line.
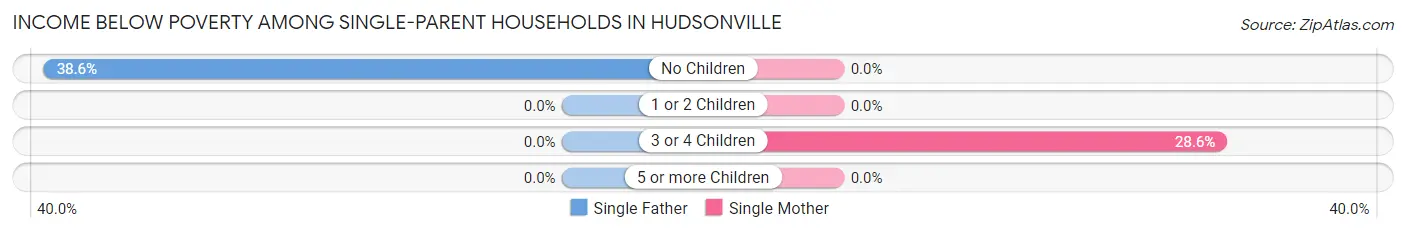
| Children | Single Father | Single Mother |
| No Children | 27 (38.6%) | 0 (0.0%) |
| 1 or 2 Children | 0 (0.0%) | 0 (0.0%) |
| 3 or 4 Children | 0 (0.0%) | 18 (28.6%) |
| 5 or more Children | 0 (0.0%) | 0 (0.0%) |
| Total | 27 (28.7%) | 18 (6.6%) |
Income Below Poverty Among Married-Couple vs Single-Parent Households in Hudsonville
The poverty data for Hudsonville shows that 7 of the married-couple family households (0.4%) and 45 of the single-parent households (12.2%) are living below the poverty level. Within the married-couple family households, those with no children have the highest poverty rate, with 7 households (0.9%) falling below the poverty line. Among the single-parent households, those with 3 or 4 children have the highest poverty rate, with 18 household (25.0%) living below poverty.
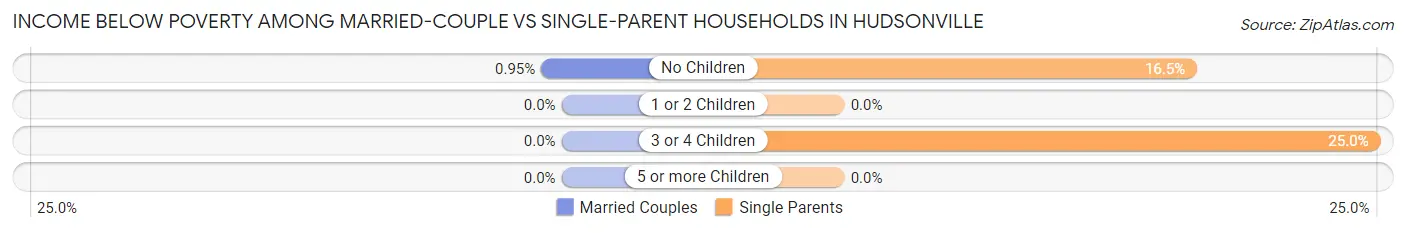
| Children | Married-Couple Families | Single-Parent Households |
| No Children | 7 (0.9%) | 27 (16.5%) |
| 1 or 2 Children | 0 (0.0%) | 0 (0.0%) |
| 3 or 4 Children | 0 (0.0%) | 18 (25.0%) |
| 5 or more Children | 0 (0.0%) | 0 (0.0%) |
| Total | 7 (0.4%) | 45 (12.2%) |
Race in Hudsonville
The most populous races in Hudsonville are White / Caucasian (7,053 | 92.4%), Two or more Races (290 | 3.8%), and Hispanic or Latino (270 | 3.5%).
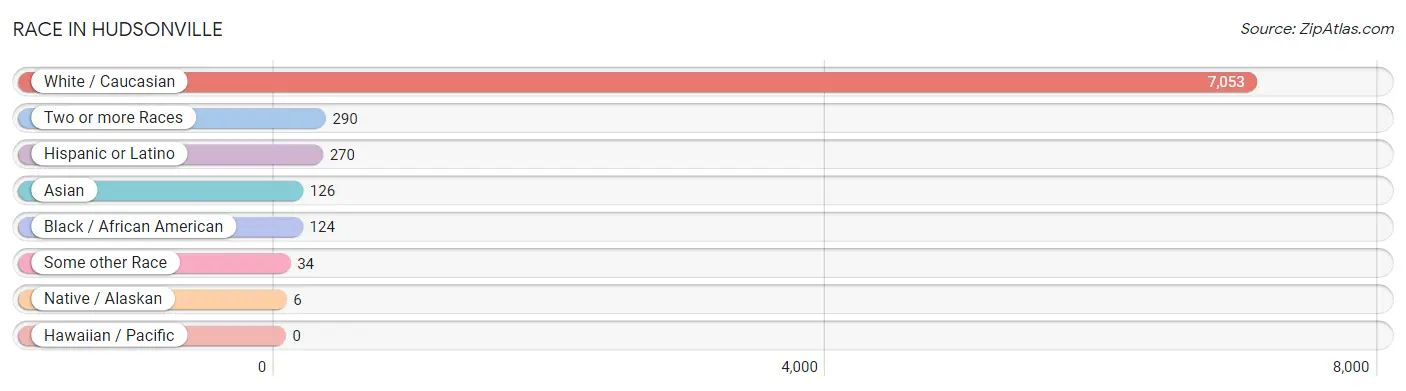
| Race | # Population | % Population |
| Asian | 126 | 1.7% |
| Black / African American | 124 | 1.6% |
| Hawaiian / Pacific | 0 | 0.0% |
| Hispanic or Latino | 270 | 3.5% |
| Native / Alaskan | 6 | 0.1% |
| White / Caucasian | 7,053 | 92.4% |
| Two or more Races | 290 | 3.8% |
| Some other Race | 34 | 0.4% |
| Total | 7,633 | 100.0% |
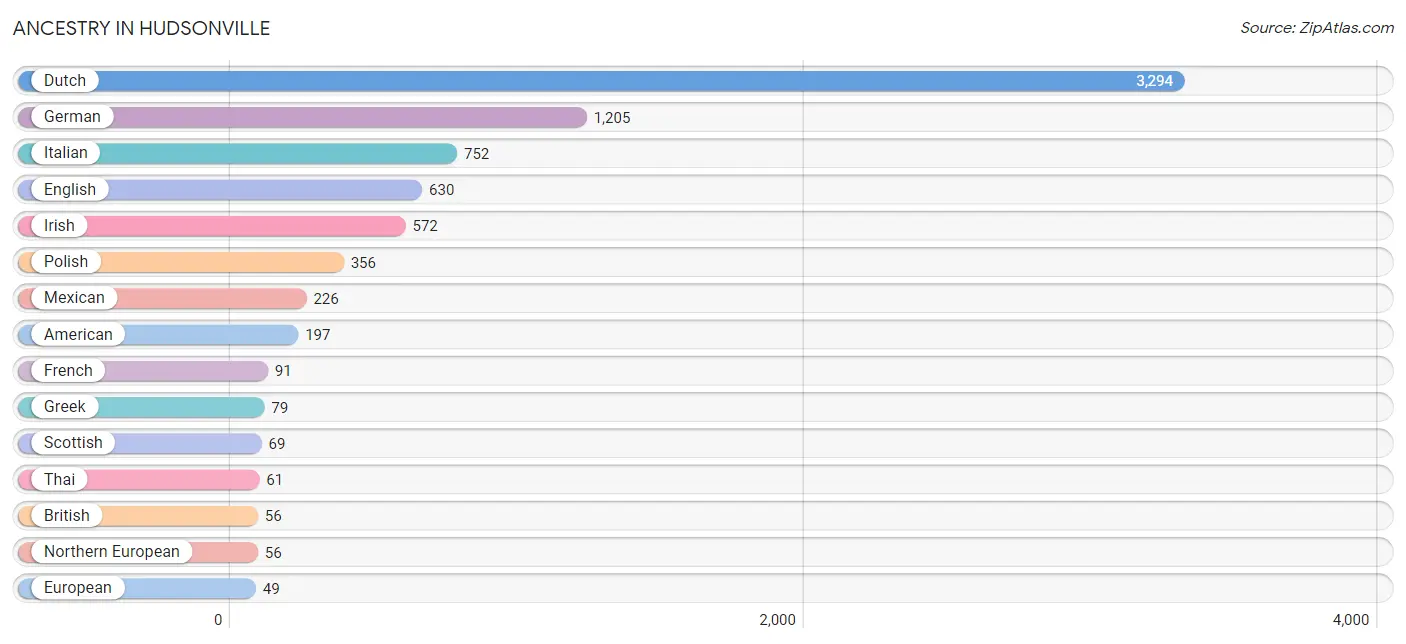
Ancestry in Hudsonville
The most populous ancestries reported in Hudsonville are Dutch (3,294 | 43.1%), German (1,205 | 15.8%), Italian (752 | 9.9%), English (630 | 8.3%), and Irish (572 | 7.5%), together accounting for 84.5% of all Hudsonville residents.
| Ancestry | # Population | % Population |
| American | 197 | 2.6% |
| British | 56 | 0.7% |
| Burmese | 27 | 0.4% |
| Czech | 39 | 0.5% |
| Czechoslovakian | 11 | 0.1% |
| Danish | 19 | 0.3% |
| Dutch | 3,294 | 43.1% |
| English | 630 | 8.3% |
| European | 49 | 0.6% |
| Finnish | 22 | 0.3% |
| French | 91 | 1.2% |
| French American Indian | 6 | 0.1% |
| French Canadian | 36 | 0.5% |
| German | 1,205 | 15.8% |
| Greek | 79 | 1.0% |
| Indian (Asian) | 38 | 0.5% |
| Irish | 572 | 7.5% |
| Iroquois | 42 | 0.5% |
| Italian | 752 | 9.9% |
| Latvian | 21 | 0.3% |
| Mexican | 226 | 3.0% |
| Northern European | 56 | 0.7% |
| Norwegian | 42 | 0.5% |
| Polish | 356 | 4.7% |
| Puerto Rican | 8 | 0.1% |
| Romanian | 15 | 0.2% |
| Scandinavian | 24 | 0.3% |
| Scotch-Irish | 47 | 0.6% |
| Scottish | 69 | 0.9% |
| South African | 8 | 0.1% |
| Spaniard | 28 | 0.4% |
| Spanish | 8 | 0.1% |
| Subsaharan African | 30 | 0.4% |
| Swedish | 31 | 0.4% |
| Swiss | 9 | 0.1% |
| Thai | 61 | 0.8% |
| Welsh | 7 | 0.1% |
| Yugoslavian | 10 | 0.1% | View All 38 Rows |
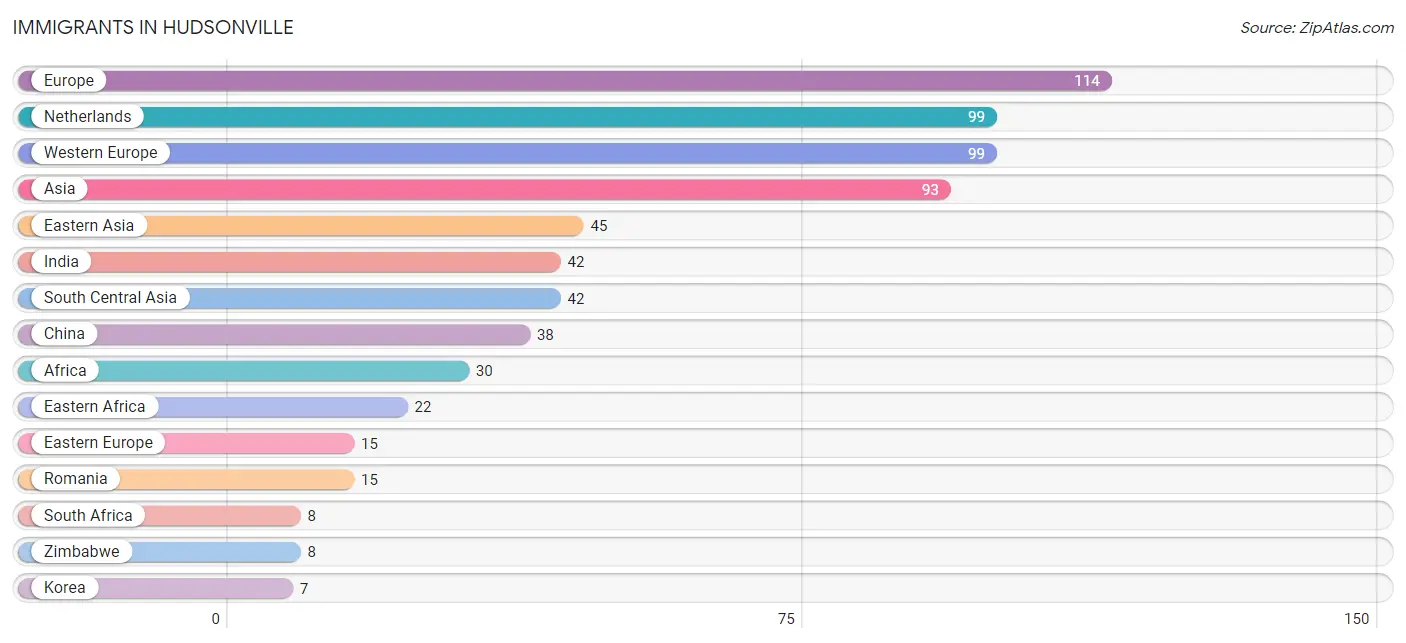
Immigrants in Hudsonville
The most numerous immigrant groups reported in Hudsonville came from Europe (114 | 1.5%), Netherlands (99 | 1.3%), Western Europe (99 | 1.3%), Asia (93 | 1.2%), and Eastern Asia (45 | 0.6%), together accounting for 5.9% of all Hudsonville residents.
| Immigration Origin | # Population | % Population |
| Africa | 30 | 0.4% |
| Asia | 93 | 1.2% |
| Central America | 2 | 0.0% |
| China | 38 | 0.5% |
| Eastern Africa | 22 | 0.3% |
| Eastern Asia | 45 | 0.6% |
| Eastern Europe | 15 | 0.2% |
| Europe | 114 | 1.5% |
| India | 42 | 0.5% |
| Korea | 7 | 0.1% |
| Latin America | 2 | 0.0% |
| Malaysia | 6 | 0.1% |
| Mexico | 2 | 0.0% |
| Netherlands | 99 | 1.3% |
| Romania | 15 | 0.2% |
| South Africa | 8 | 0.1% |
| South Central Asia | 42 | 0.5% |
| South Eastern Asia | 6 | 0.1% |
| Western Europe | 99 | 1.3% |
| Zimbabwe | 8 | 0.1% | View All 20 Rows |
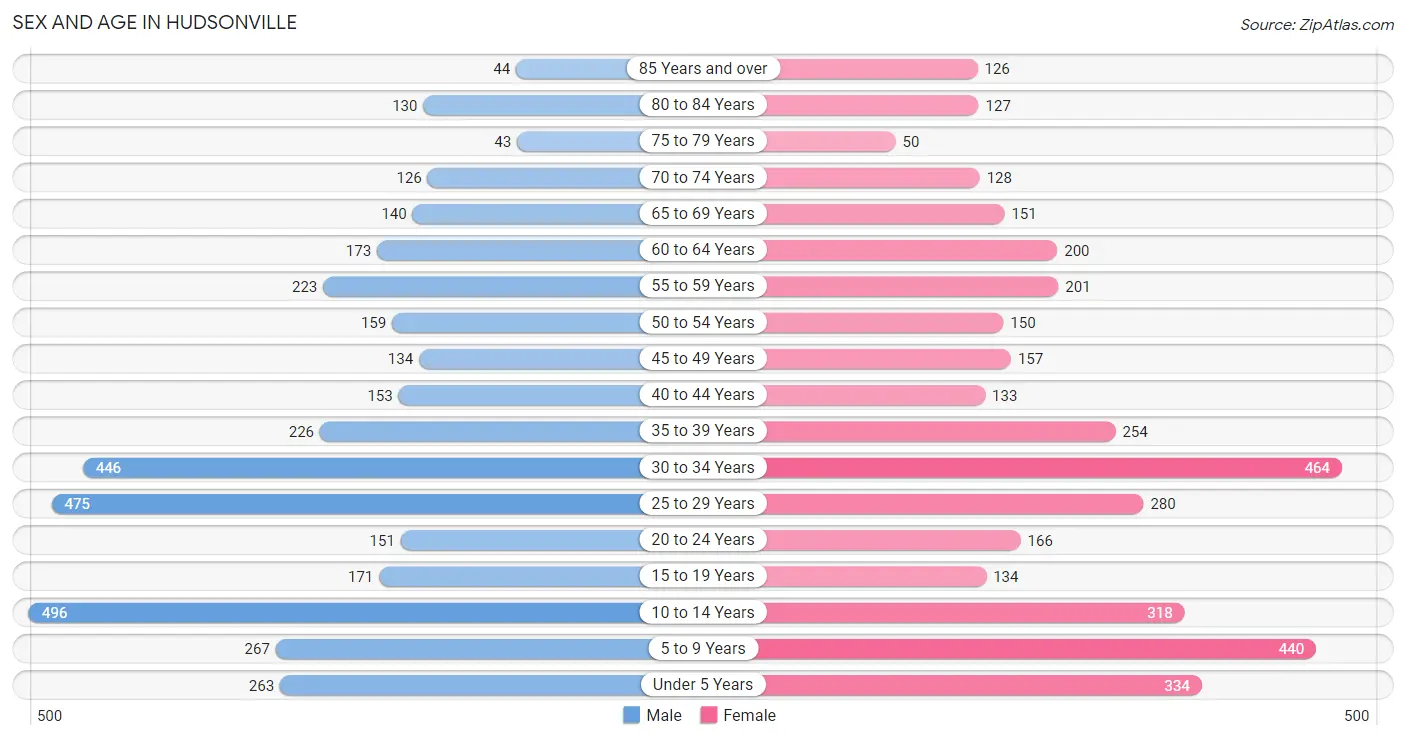
Sex and Age in Hudsonville
Sex and Age in Hudsonville
The most populous age groups in Hudsonville are 10 to 14 Years (496 | 13.0%) for men and 30 to 34 Years (464 | 12.2%) for women.
| Age Bracket | Male | Female |
| Under 5 Years | 263 (6.9%) | 334 (8.8%) |
| 5 to 9 Years | 267 (7.0%) | 440 (11.5%) |
| 10 to 14 Years | 496 (13.0%) | 318 (8.3%) |
| 15 to 19 Years | 171 (4.5%) | 134 (3.5%) |
| 20 to 24 Years | 151 (4.0%) | 166 (4.3%) |
| 25 to 29 Years | 475 (12.4%) | 280 (7.3%) |
| 30 to 34 Years | 446 (11.7%) | 464 (12.2%) |
| 35 to 39 Years | 226 (5.9%) | 254 (6.7%) |
| 40 to 44 Years | 153 (4.0%) | 133 (3.5%) |
| 45 to 49 Years | 134 (3.5%) | 157 (4.1%) |
| 50 to 54 Years | 159 (4.2%) | 150 (3.9%) |
| 55 to 59 Years | 223 (5.8%) | 201 (5.3%) |
| 60 to 64 Years | 173 (4.5%) | 200 (5.2%) |
| 65 to 69 Years | 140 (3.7%) | 151 (4.0%) |
| 70 to 74 Years | 126 (3.3%) | 128 (3.4%) |
| 75 to 79 Years | 43 (1.1%) | 50 (1.3%) |
| 80 to 84 Years | 130 (3.4%) | 127 (3.3%) |
| 85 Years and over | 44 (1.1%) | 126 (3.3%) |
| Total | 3,820 (100.0%) | 3,813 (100.0%) |
Families and Households in Hudsonville
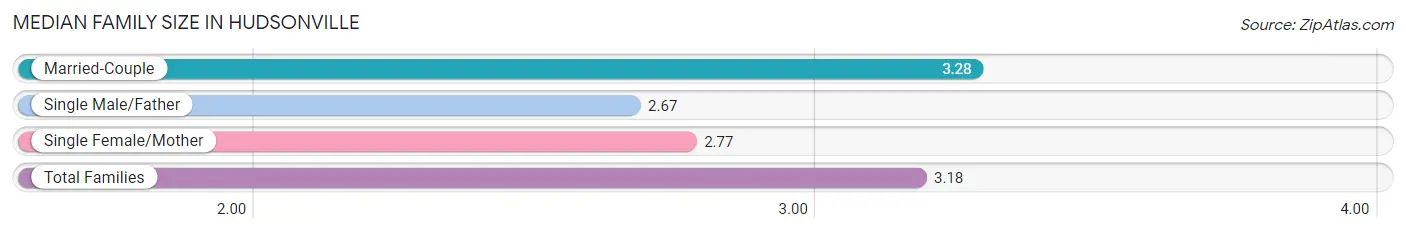
Median Family Size in Hudsonville
The median family size in Hudsonville is 3.18 persons per family, with married-couple families (1,676 | 82.0%) accounting for the largest median family size of 3.28 persons per family. On the other hand, single male/father families (94 | 4.6%) represent the smallest median family size with 2.67 persons per family.
| Family Type | # Families | Family Size |
| Married-Couple | 1,676 (82.0%) | 3.28 |
| Single Male/Father | 94 (4.6%) | 2.67 |
| Single Female/Mother | 274 (13.4%) | 2.77 |
| Total Families | 2,044 (100.0%) | 3.18 |
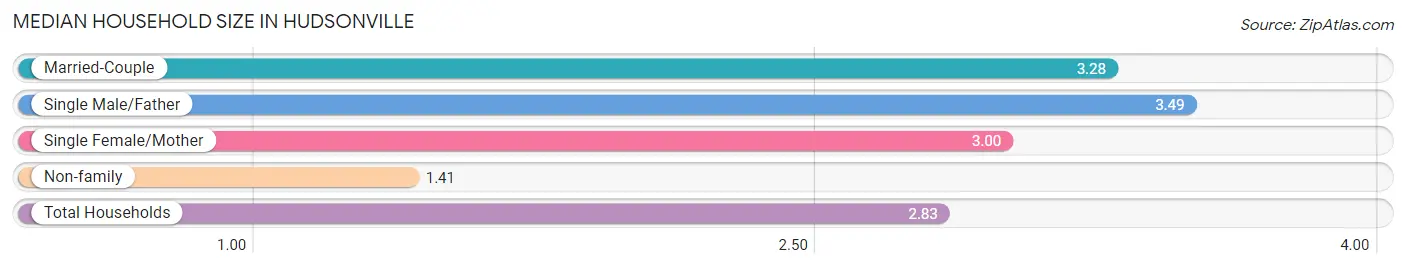
Median Household Size in Hudsonville
The median household size in Hudsonville is 2.83 persons per household, with single male/father households (94 | 3.5%) accounting for the largest median household size of 3.49 persons per household. non-family households (618 | 23.2%) represent the smallest median household size with 1.41 persons per household.
| Household Type | # Households | Household Size |
| Married-Couple | 1,676 (63.0%) | 3.28 |
| Single Male/Father | 94 (3.5%) | 3.49 |
| Single Female/Mother | 274 (10.3%) | 3.00 |
| Non-family | 618 (23.2%) | 1.41 |
| Total Households | 2,662 (100.0%) | 2.83 |
Household Size by Marriage Status in Hudsonville
Out of a total of 2,662 households in Hudsonville, 2,044 (76.8%) are family households, while 618 (23.2%) are nonfamily households. The most numerous type of family households are 2-person households, comprising 719, and the most common type of nonfamily households are 1-person households, comprising 458.
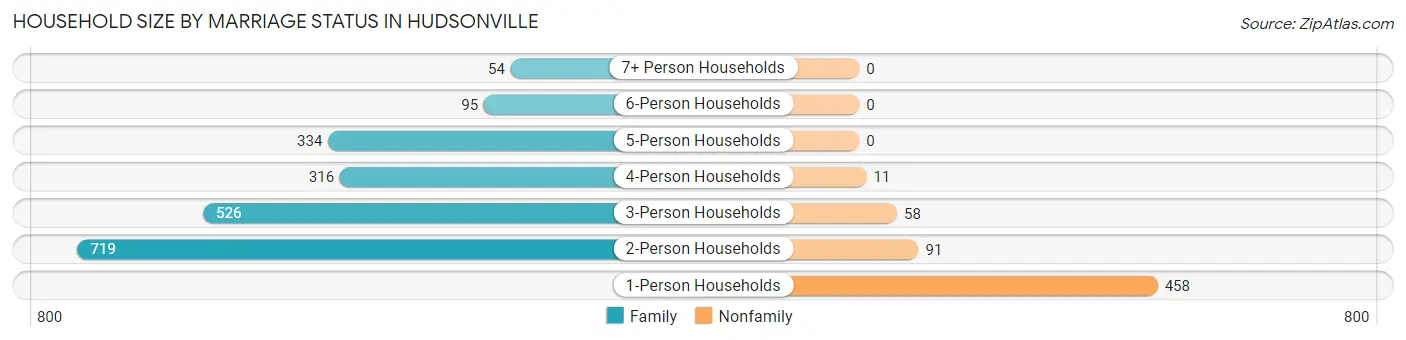
| Household Size | Family Households | Nonfamily Households |
| 1-Person Households | - | 458 (17.2%) |
| 2-Person Households | 719 (27.0%) | 91 (3.4%) |
| 3-Person Households | 526 (19.8%) | 58 (2.2%) |
| 4-Person Households | 316 (11.9%) | 11 (0.4%) |
| 5-Person Households | 334 (12.6%) | 0 (0.0%) |
| 6-Person Households | 95 (3.6%) | 0 (0.0%) |
| 7+ Person Households | 54 (2.0%) | 0 (0.0%) |
| Total | 2,044 (76.8%) | 618 (23.2%) |
Female Fertility in Hudsonville
Fertility by Age in Hudsonville
Average fertility rate in Hudsonville is 108.0 births per 1,000 women. Women in the age bracket of 20 to 34 years have the highest fertility rate with 186.0 births per 1,000 women. Women in the age bracket of 20 to 34 years acount for 96.0% of all women with births.
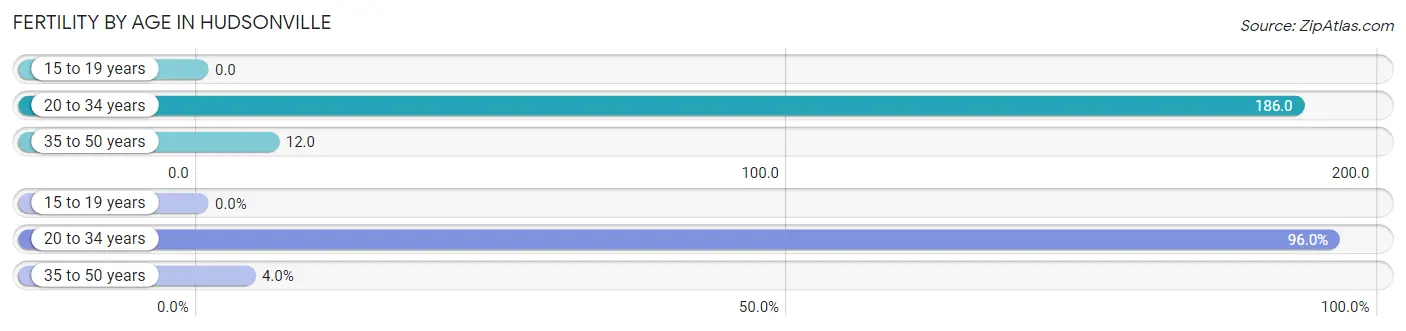
| Age Bracket | Women with Births | Births / 1,000 Women |
| 15 to 19 years | 0 (0.0%) | 0.0 |
| 20 to 34 years | 169 (96.0%) | 186.0 |
| 35 to 50 years | 7 (4.0%) | 12.0 |
| Total | 176 (100.0%) | 108.0 |
Fertility by Age by Marriage Status in Hudsonville
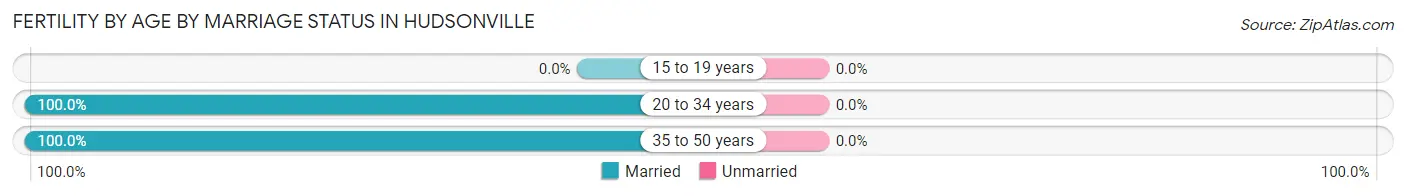
| Age Bracket | Married | Unmarried |
| 15 to 19 years | 0 (0.0%) | 0 (0.0%) |
| 20 to 34 years | 169 (100.0%) | 0 (0.0%) |
| 35 to 50 years | 7 (100.0%) | 0 (0.0%) |
| Total | 176 (100.0%) | 0 (0.0%) |
Fertility by Education in Hudsonville
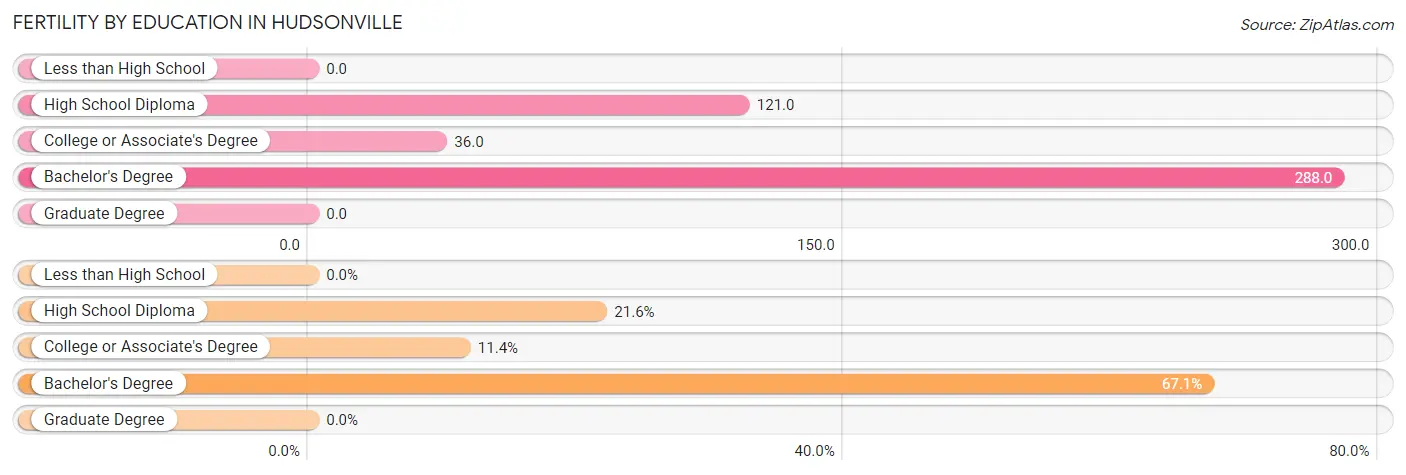
| Educational Attainment | Women with Births | Births / 1,000 Women |
| Less than High School | 0 (0.0%) | 0.0 |
| High School Diploma | 38 (21.6%) | 121.0 |
| College or Associate's Degree | 20 (11.4%) | 36.0 |
| Bachelor's Degree | 118 (67.0%) | 288.0 |
| Graduate Degree | 0 (0.0%) | 0.0 |
| Total | 176 (100.0%) | 108.0 |
Fertility by Education by Marriage Status in Hudsonville
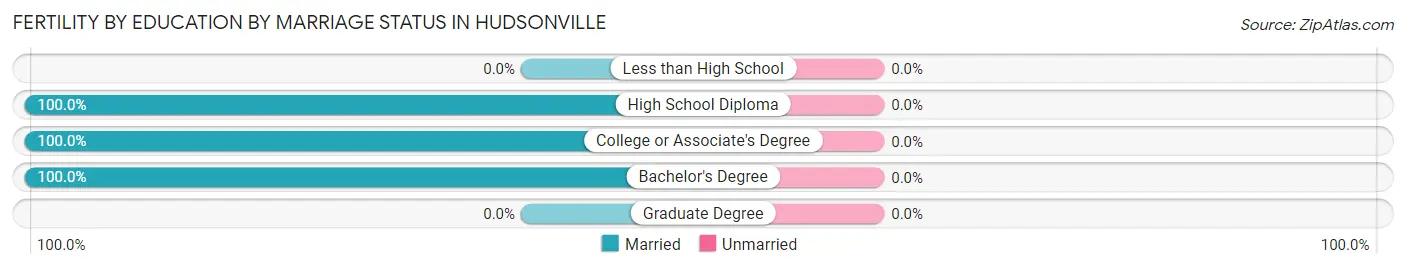
| Educational Attainment | Married | Unmarried |
| Less than High School | 0 (0.0%) | 0 (0.0%) |
| High School Diploma | 38 (100.0%) | 0 (0.0%) |
| College or Associate's Degree | 20 (100.0%) | 0 (0.0%) |
| Bachelor's Degree | 118 (100.0%) | 0 (0.0%) |
| Graduate Degree | 0 (0.0%) | 0 (0.0%) |
| Total | 176 (100.0%) | 0 (0.0%) |
Employment Characteristics in Hudsonville
Employment by Class of Employer in Hudsonville
Among the 3,541 employed individuals in Hudsonville, private company employees (2,572 | 72.6%), not-for-profit organizations (375 | 10.6%), and local government employees (302 | 8.5%) make up the most common classes of employment.
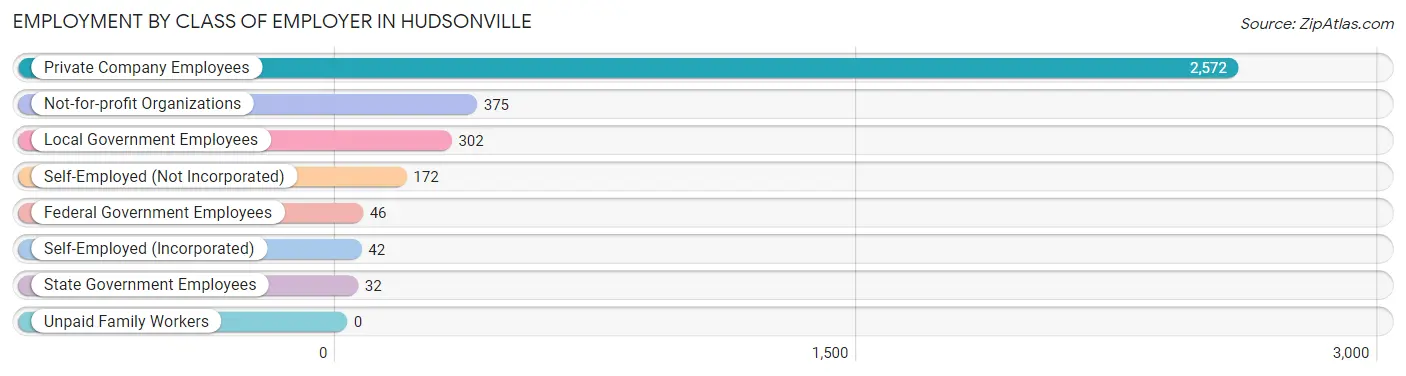
| Employer Class | # Employees | % Employees |
| Private Company Employees | 2,572 | 72.6% |
| Self-Employed (Incorporated) | 42 | 1.2% |
| Self-Employed (Not Incorporated) | 172 | 4.9% |
| Not-for-profit Organizations | 375 | 10.6% |
| Local Government Employees | 302 | 8.5% |
| State Government Employees | 32 | 0.9% |
| Federal Government Employees | 46 | 1.3% |
| Unpaid Family Workers | 0 | 0.0% |
| Total | 3,541 | 100.0% |
Employment Status by Age in Hudsonville
According to the labor force statistics for Hudsonville, out of the total population over 16 years of age (5,458), 70.3% or 3,837 individuals are in the labor force, with 6.0% or 230 of them unemployed. The age group with the highest labor force participation rate is 45 to 54 years, with 95.0% or 570 individuals in the labor force. Within the labor force, the 30 to 34 years age range has the highest percentage of unemployed individuals, with 18.4% or 145 of them being unemployed.
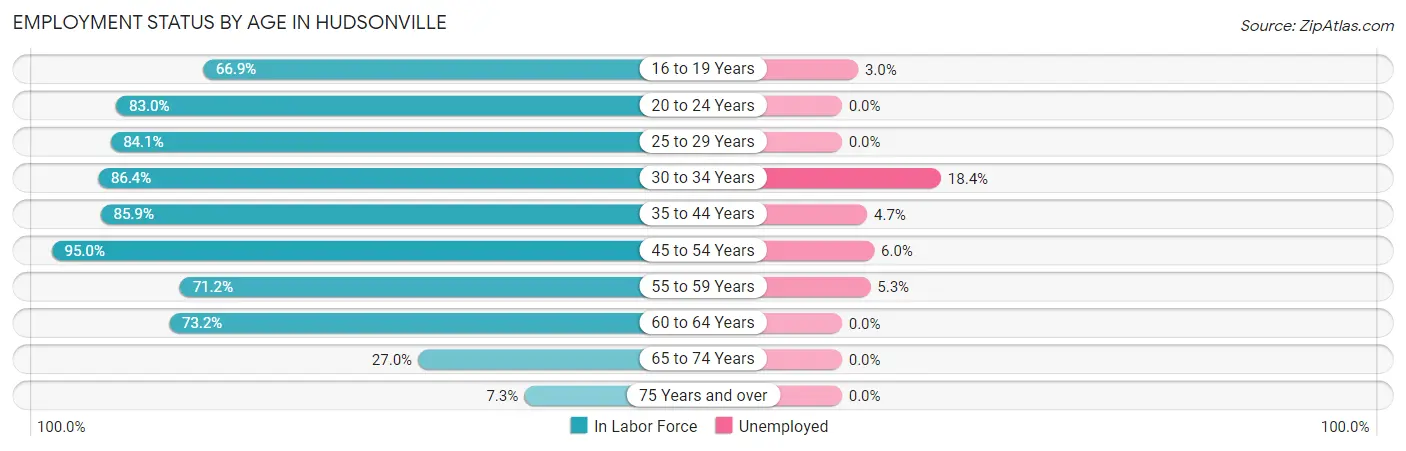
| Age Bracket | In Labor Force | Unemployed |
| 16 to 19 Years | 166 (66.9%) | 5 (3.0%) |
| 20 to 24 Years | 263 (83.0%) | 0 (0.0%) |
| 25 to 29 Years | 635 (84.1%) | 0 (0.0%) |
| 30 to 34 Years | 786 (86.4%) | 145 (18.4%) |
| 35 to 44 Years | 658 (85.9%) | 31 (4.7%) |
| 45 to 54 Years | 570 (95.0%) | 34 (6.0%) |
| 55 to 59 Years | 302 (71.2%) | 16 (5.3%) |
| 60 to 64 Years | 273 (73.2%) | 0 (0.0%) |
| 65 to 74 Years | 147 (27.0%) | 0 (0.0%) |
| 75 Years and over | 38 (7.3%) | 0 (0.0%) |
| Total | 3,837 (70.3%) | 230 (6.0%) |
Employment Status by Educational Attainment in Hudsonville
According to labor force statistics for Hudsonville, 84.2% of individuals (3,223) out of the total population between 25 and 64 years of age (3,828) are in the labor force, with 7.0% or 226 of them being unemployed. The group with the highest labor force participation rate are those with the educational attainment of bachelor's degree or higher, with 91.6% or 1,235 individuals in the labor force. Within the labor force, individuals with college / associate degree education have the highest percentage of unemployment, with 16.3% or 199 of them being unemployed.
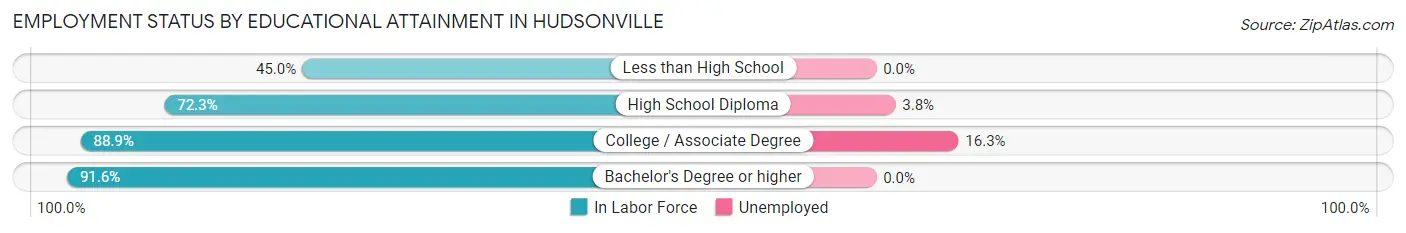
| Educational Attainment | In Labor Force | Unemployed |
| Less than High School | 54 (45.0%) | 0 (0.0%) |
| High School Diploma | 714 (72.3%) | 38 (3.8%) |
| College / Associate Degree | 1,221 (88.9%) | 224 (16.3%) |
| Bachelor's Degree or higher | 1,235 (91.6%) | 0 (0.0%) |
| Total | 3,223 (84.2%) | 268 (7.0%) |
Employment Occupations by Sex in Hudsonville
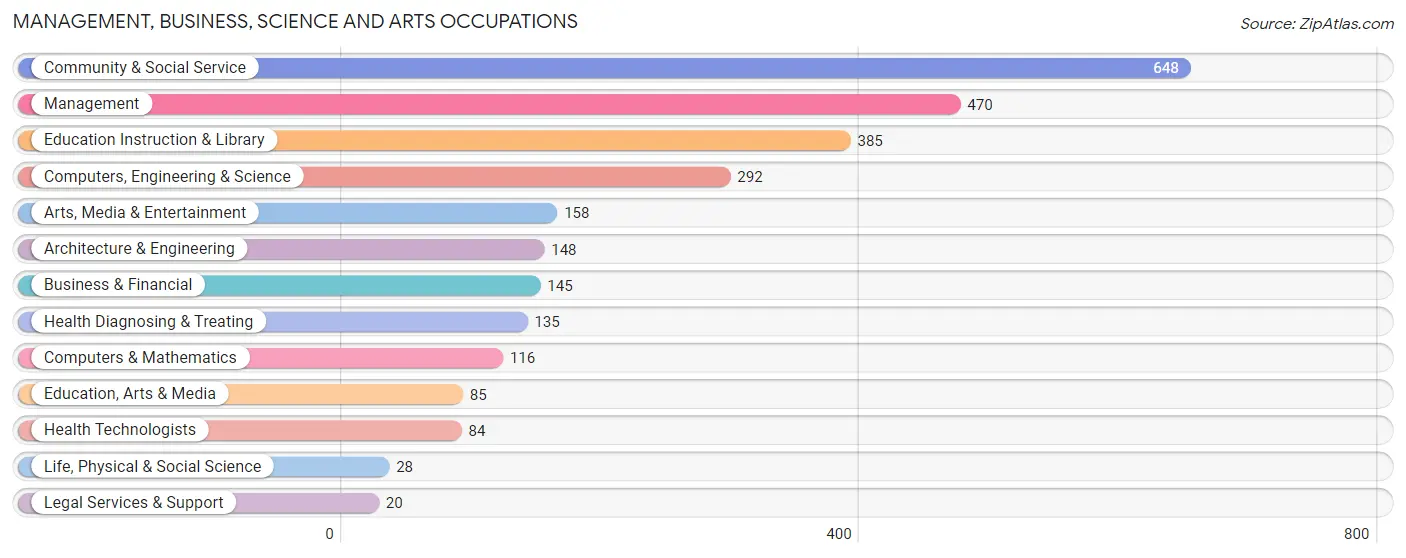
Management, Business, Science and Arts Occupations
The most common Management, Business, Science and Arts occupations in Hudsonville are Community & Social Service (648 | 18.0%), Management (470 | 13.0%), Education Instruction & Library (385 | 10.7%), Computers, Engineering & Science (292 | 8.1%), and Arts, Media & Entertainment (158 | 4.4%).
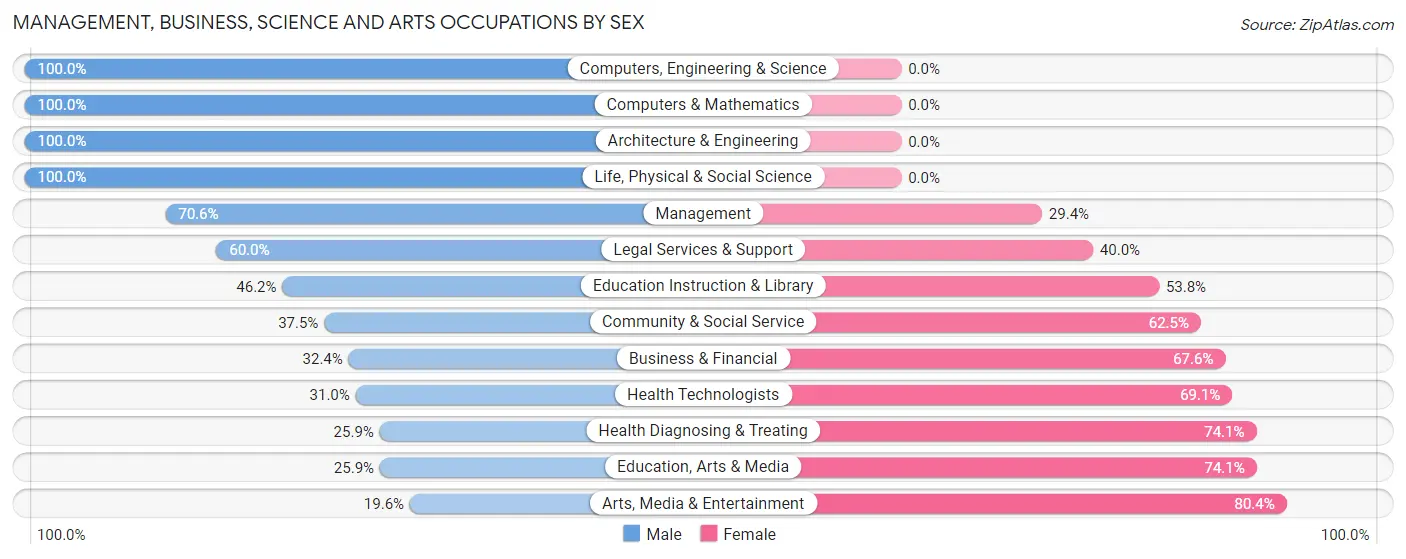
Management, Business, Science and Arts Occupations by Sex
Within the Management, Business, Science and Arts occupations in Hudsonville, the most male-oriented occupations are Computers, Engineering & Science (100.0%), Computers & Mathematics (100.0%), and Architecture & Engineering (100.0%), while the most female-oriented occupations are Arts, Media & Entertainment (80.4%), Education, Arts & Media (74.1%), and Health Diagnosing & Treating (74.1%).
| Occupation | Male | Female |
| Management | 332 (70.6%) | 138 (29.4%) |
| Business & Financial | 47 (32.4%) | 98 (67.6%) |
| Computers, Engineering & Science | 292 (100.0%) | 0 (0.0%) |
| Computers & Mathematics | 116 (100.0%) | 0 (0.0%) |
| Architecture & Engineering | 148 (100.0%) | 0 (0.0%) |
| Life, Physical & Social Science | 28 (100.0%) | 0 (0.0%) |
| Community & Social Service | 243 (37.5%) | 405 (62.5%) |
| Education, Arts & Media | 22 (25.9%) | 63 (74.1%) |
| Legal Services & Support | 12 (60.0%) | 8 (40.0%) |
| Education Instruction & Library | 178 (46.2%) | 207 (53.8%) |
| Arts, Media & Entertainment | 31 (19.6%) | 127 (80.4%) |
| Health Diagnosing & Treating | 35 (25.9%) | 100 (74.1%) |
| Health Technologists | 26 (30.9%) | 58 (69.1%) |
| Total (Category) | 949 (56.1%) | 741 (43.9%) |
| Total (Overall) | 2,066 (57.3%) | 1,541 (42.7%) |
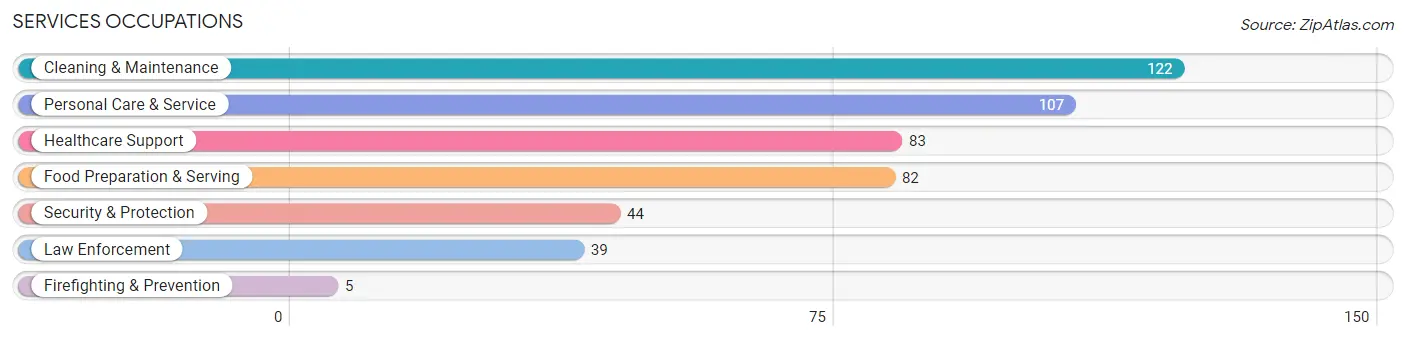
Services Occupations
The most common Services occupations in Hudsonville are Cleaning & Maintenance (122 | 3.4%), Personal Care & Service (107 | 3.0%), Healthcare Support (83 | 2.3%), Food Preparation & Serving (82 | 2.3%), and Security & Protection (44 | 1.2%).
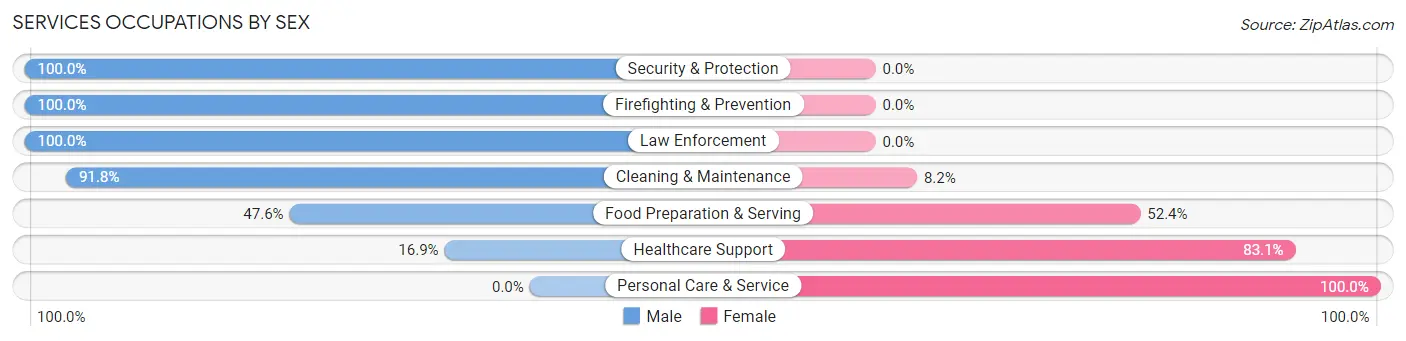
Services Occupations by Sex
Within the Services occupations in Hudsonville, the most male-oriented occupations are Security & Protection (100.0%), Firefighting & Prevention (100.0%), and Law Enforcement (100.0%), while the most female-oriented occupations are Personal Care & Service (100.0%), Healthcare Support (83.1%), and Food Preparation & Serving (52.4%).
| Occupation | Male | Female |
| Healthcare Support | 14 (16.9%) | 69 (83.1%) |
| Security & Protection | 44 (100.0%) | 0 (0.0%) |
| Firefighting & Prevention | 5 (100.0%) | 0 (0.0%) |
| Law Enforcement | 39 (100.0%) | 0 (0.0%) |
| Food Preparation & Serving | 39 (47.6%) | 43 (52.4%) |
| Cleaning & Maintenance | 112 (91.8%) | 10 (8.2%) |
| Personal Care & Service | 0 (0.0%) | 107 (100.0%) |
| Total (Category) | 209 (47.7%) | 229 (52.3%) |
| Total (Overall) | 2,066 (57.3%) | 1,541 (42.7%) |
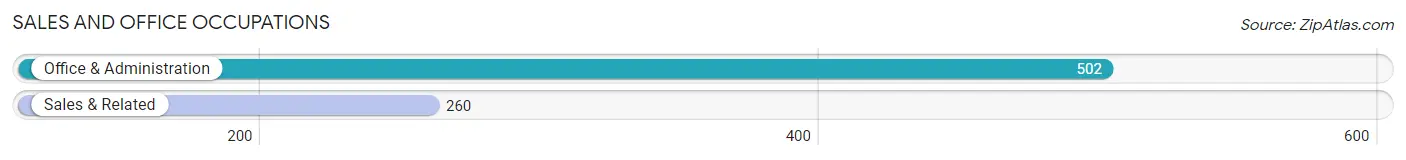
Sales and Office Occupations
The most common Sales and Office occupations in Hudsonville are Office & Administration (502 | 13.9%), and Sales & Related (260 | 7.2%).
Sales and Office Occupations by Sex
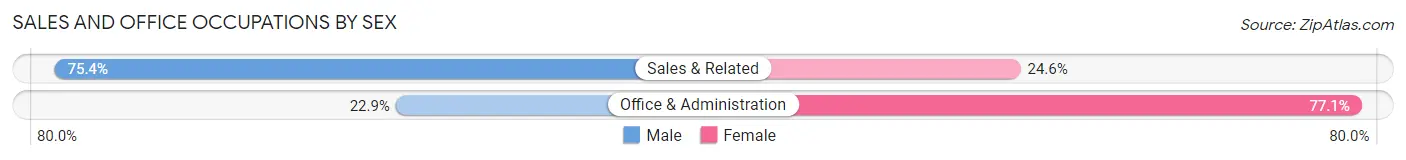
| Occupation | Male | Female |
| Sales & Related | 196 (75.4%) | 64 (24.6%) |
| Office & Administration | 115 (22.9%) | 387 (77.1%) |
| Total (Category) | 311 (40.8%) | 451 (59.2%) |
| Total (Overall) | 2,066 (57.3%) | 1,541 (42.7%) |
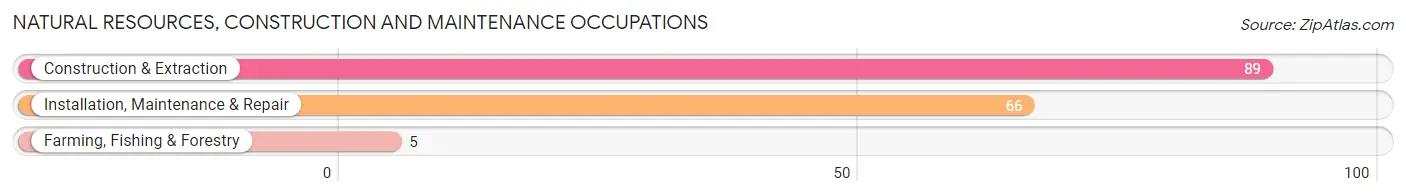
Natural Resources, Construction and Maintenance Occupations
The most common Natural Resources, Construction and Maintenance occupations in Hudsonville are Construction & Extraction (89 | 2.5%), Installation, Maintenance & Repair (66 | 1.8%), and Farming, Fishing & Forestry (5 | 0.1%).
Natural Resources, Construction and Maintenance Occupations by Sex
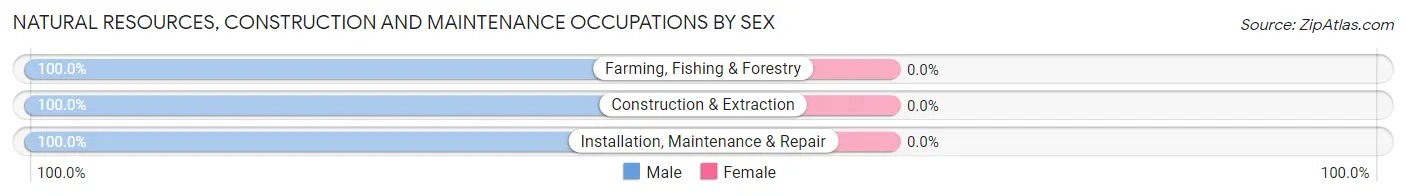
| Occupation | Male | Female |
| Farming, Fishing & Forestry | 5 (100.0%) | 0 (0.0%) |
| Construction & Extraction | 89 (100.0%) | 0 (0.0%) |
| Installation, Maintenance & Repair | 66 (100.0%) | 0 (0.0%) |
| Total (Category) | 160 (100.0%) | 0 (0.0%) |
| Total (Overall) | 2,066 (57.3%) | 1,541 (42.7%) |
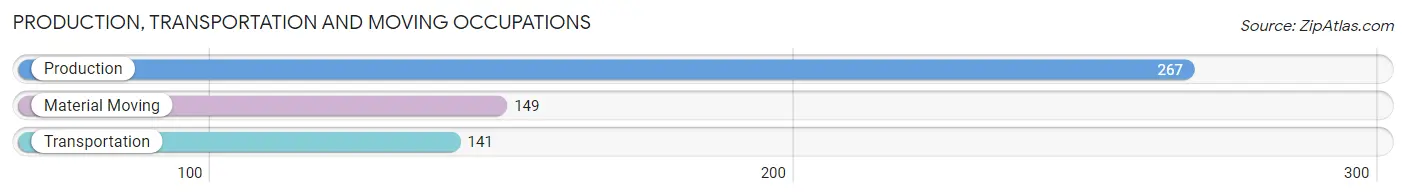
Production, Transportation and Moving Occupations
The most common Production, Transportation and Moving occupations in Hudsonville are Production (267 | 7.4%), Material Moving (149 | 4.1%), and Transportation (141 | 3.9%).
Production, Transportation and Moving Occupations by Sex
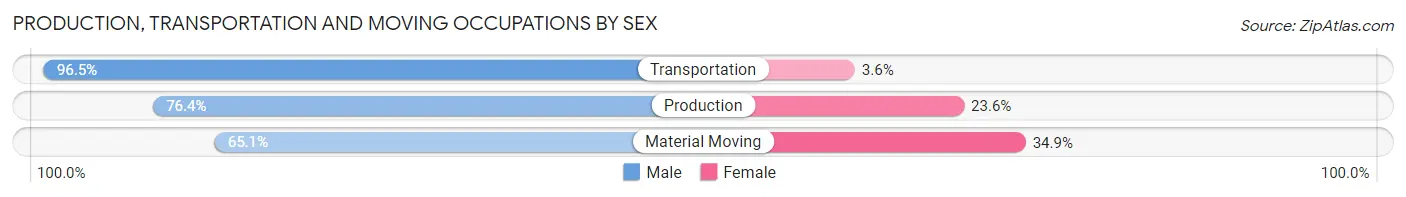
| Occupation | Male | Female |
| Production | 204 (76.4%) | 63 (23.6%) |
| Transportation | 136 (96.5%) | 5 (3.5%) |
| Material Moving | 97 (65.1%) | 52 (34.9%) |
| Total (Category) | 437 (78.5%) | 120 (21.5%) |
| Total (Overall) | 2,066 (57.3%) | 1,541 (42.7%) |
Employment Industries by Sex in Hudsonville
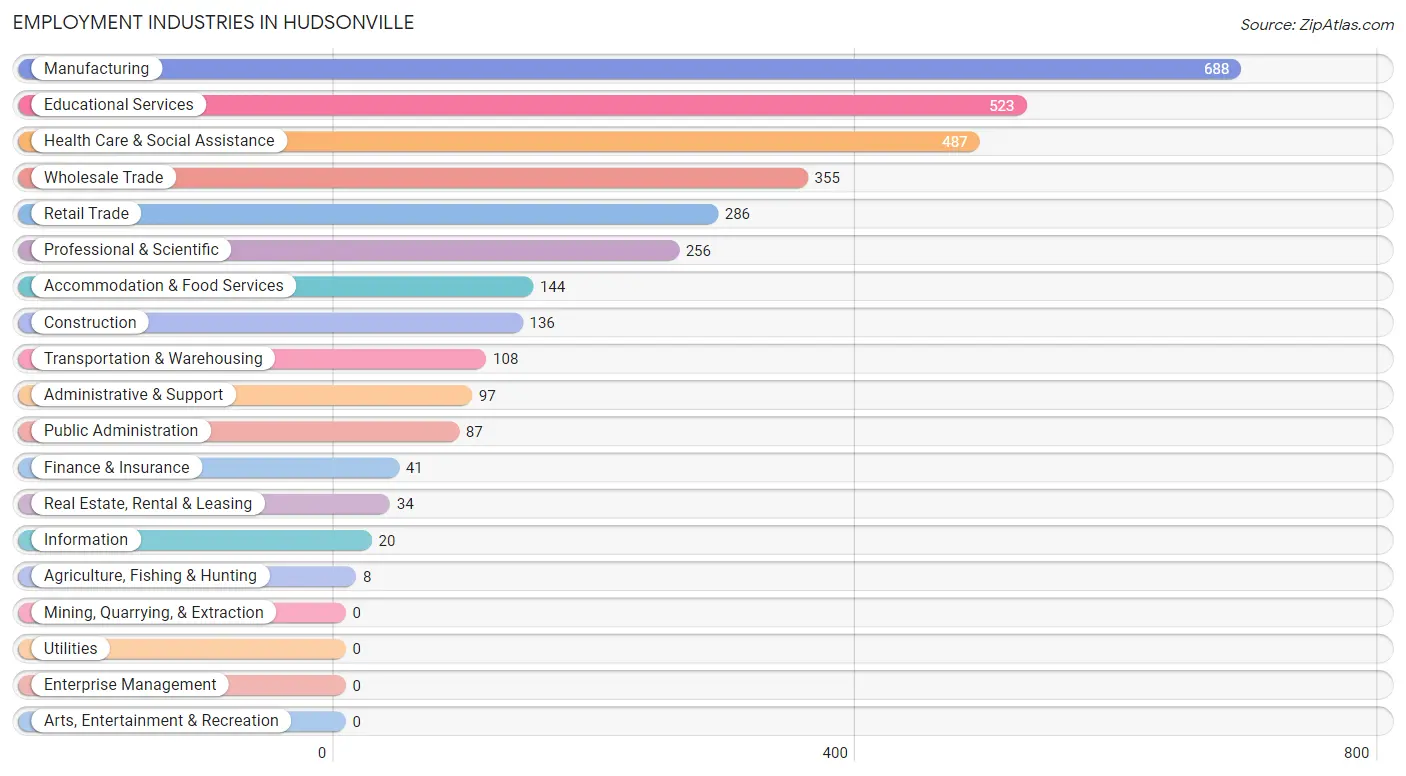
Employment Industries in Hudsonville
The major employment industries in Hudsonville include Manufacturing (688 | 19.1%), Educational Services (523 | 14.5%), Health Care & Social Assistance (487 | 13.5%), Wholesale Trade (355 | 9.8%), and Retail Trade (286 | 7.9%).
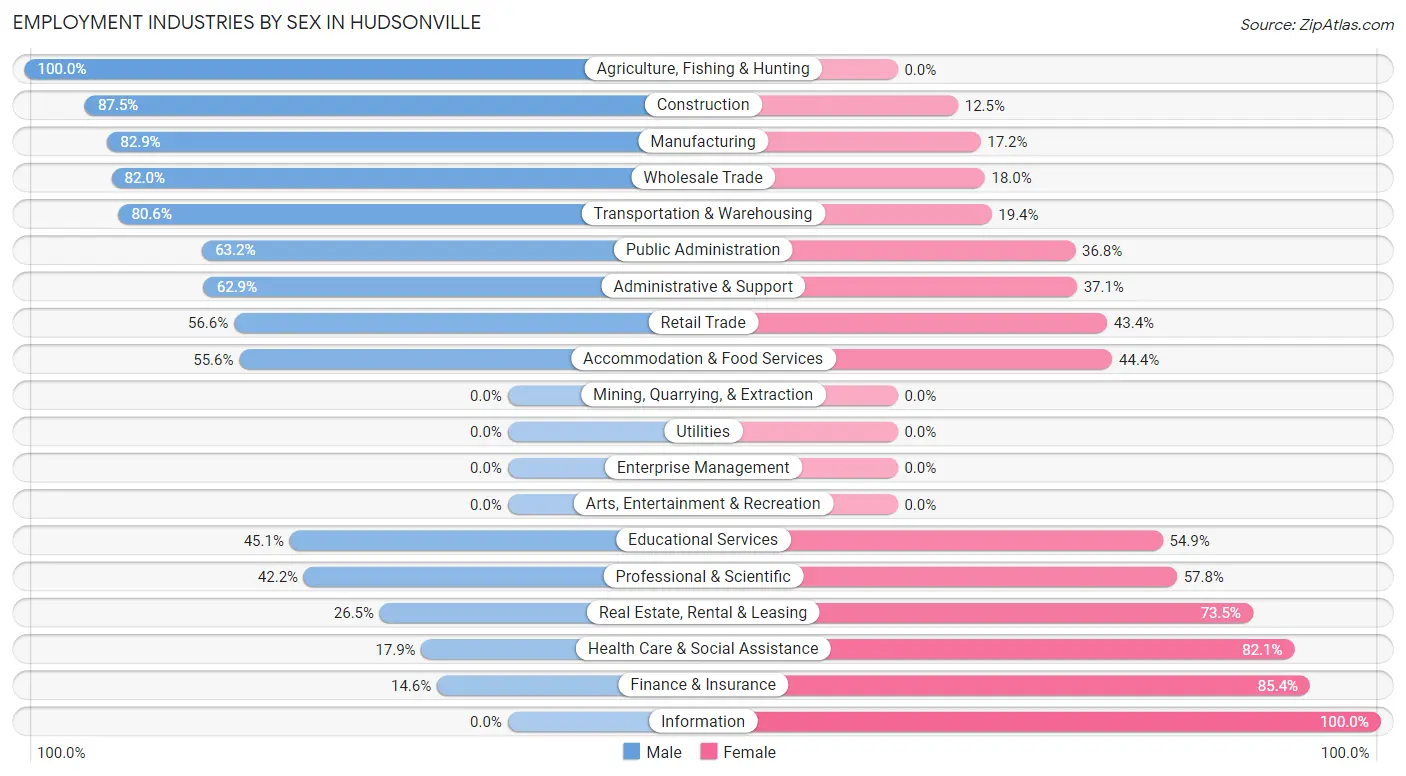
Employment Industries by Sex in Hudsonville
The Hudsonville industries that see more men than women are Agriculture, Fishing & Hunting (100.0%), Construction (87.5%), and Manufacturing (82.9%), whereas the industries that tend to have a higher number of women are Information (100.0%), Finance & Insurance (85.4%), and Health Care & Social Assistance (82.1%).
| Industry | Male | Female |
| Agriculture, Fishing & Hunting | 8 (100.0%) | 0 (0.0%) |
| Mining, Quarrying, & Extraction | 0 (0.0%) | 0 (0.0%) |
| Construction | 119 (87.5%) | 17 (12.5%) |
| Manufacturing | 570 (82.9%) | 118 (17.2%) |
| Wholesale Trade | 291 (82.0%) | 64 (18.0%) |
| Retail Trade | 162 (56.6%) | 124 (43.4%) |
| Transportation & Warehousing | 87 (80.6%) | 21 (19.4%) |
| Utilities | 0 (0.0%) | 0 (0.0%) |
| Information | 0 (0.0%) | 20 (100.0%) |
| Finance & Insurance | 6 (14.6%) | 35 (85.4%) |
| Real Estate, Rental & Leasing | 9 (26.5%) | 25 (73.5%) |
| Professional & Scientific | 108 (42.2%) | 148 (57.8%) |
| Enterprise Management | 0 (0.0%) | 0 (0.0%) |
| Administrative & Support | 61 (62.9%) | 36 (37.1%) |
| Educational Services | 236 (45.1%) | 287 (54.9%) |
| Health Care & Social Assistance | 87 (17.9%) | 400 (82.1%) |
| Arts, Entertainment & Recreation | 0 (0.0%) | 0 (0.0%) |
| Accommodation & Food Services | 80 (55.6%) | 64 (44.4%) |
| Public Administration | 55 (63.2%) | 32 (36.8%) |
| Total | 2,066 (57.3%) | 1,541 (42.7%) |
Education in Hudsonville
School Enrollment in Hudsonville
The most common levels of schooling among the 2,067 students in Hudsonville are middle school (649 | 31.4%), elementary school (556 | 26.9%), and high school (254 | 12.3%).
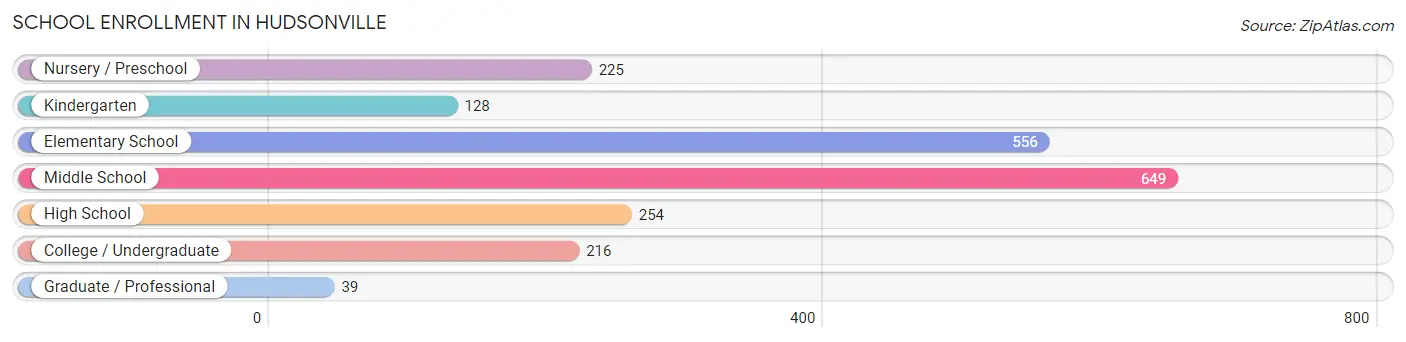
| School Level | # Students | % Students |
| Nursery / Preschool | 225 | 10.9% |
| Kindergarten | 128 | 6.2% |
| Elementary School | 556 | 26.9% |
| Middle School | 649 | 31.4% |
| High School | 254 | 12.3% |
| College / Undergraduate | 216 | 10.4% |
| Graduate / Professional | 39 | 1.9% |
| Total | 2,067 | 100.0% |
School Enrollment by Age by Funding Source in Hudsonville
Out of a total of 2,067 students who are enrolled in schools in Hudsonville, 356 (17.2%) attend a private institution, while the remaining 1,711 (82.8%) are enrolled in public schools. The age group of 3 to 4 year olds has the highest likelihood of being enrolled in private schools, with 60 (39.5% in the age bracket) enrolled. Conversely, the age group of 35 years and over has the lowest likelihood of being enrolled in a private school, with 34 (100.0% in the age bracket) attending a public institution.

| Age Bracket | Public School | Private School |
| 3 to 4 Year Olds | 92 (60.5%) | 60 (39.5%) |
| 5 to 9 Year Old | 545 (81.6%) | 123 (18.4%) |
| 10 to 14 Year Olds | 704 (92.0%) | 61 (8.0%) |
| 15 to 17 Year Olds | 126 (95.5%) | 6 (4.5%) |
| 18 to 19 Year Olds | 48 (85.7%) | 8 (14.3%) |
| 20 to 24 Year Olds | 81 (62.3%) | 49 (37.7%) |
| 25 to 34 Year Olds | 82 (63.1%) | 48 (36.9%) |
| 35 Years and over | 34 (100.0%) | 0 (0.0%) |
| Total | 1,711 (82.8%) | 356 (17.2%) |
Educational Attainment by Field of Study in Hudsonville
Business (353 | 20.4%), education (337 | 19.5%), science & technology (142 | 8.2%), arts & humanities (122 | 7.1%), and communications (117 | 6.8%) are the most common fields of study among 1,729 individuals in Hudsonville who have obtained a bachelor's degree or higher.
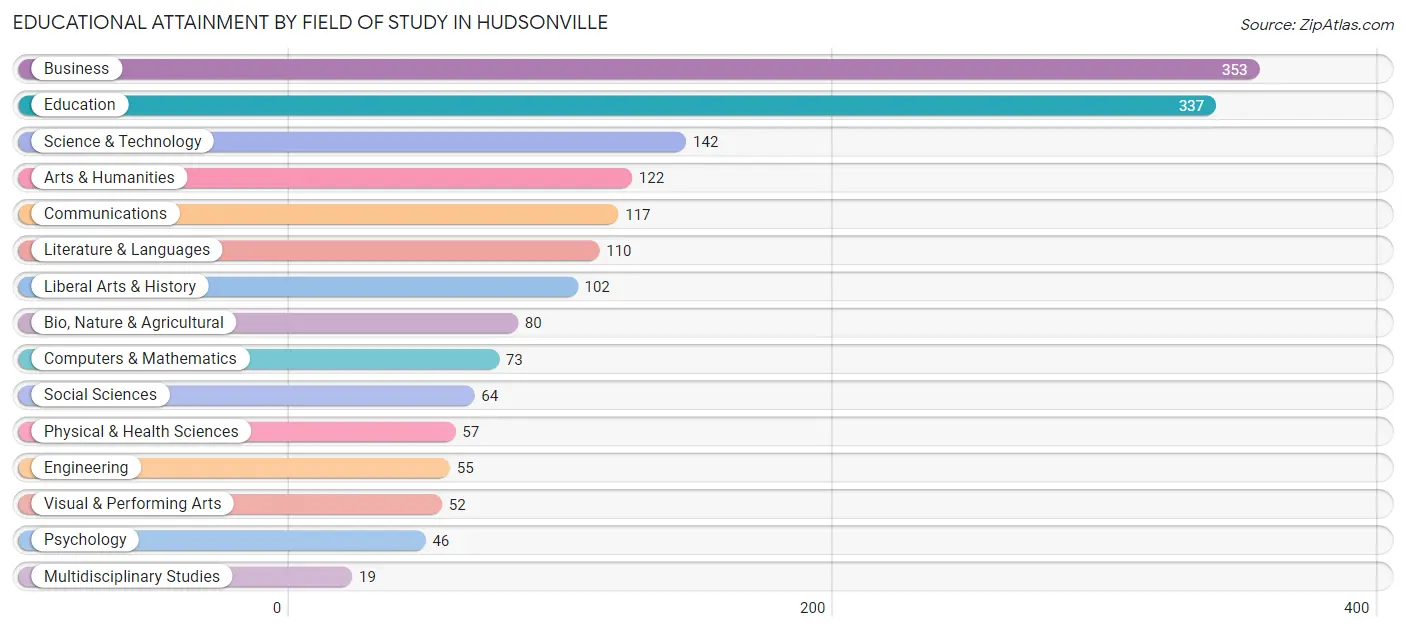
| Field of Study | # Graduates | % Graduates |
| Computers & Mathematics | 73 | 4.2% |
| Bio, Nature & Agricultural | 80 | 4.6% |
| Physical & Health Sciences | 57 | 3.3% |
| Psychology | 46 | 2.7% |
| Social Sciences | 64 | 3.7% |
| Engineering | 55 | 3.2% |
| Multidisciplinary Studies | 19 | 1.1% |
| Science & Technology | 142 | 8.2% |
| Business | 353 | 20.4% |
| Education | 337 | 19.5% |
| Literature & Languages | 110 | 6.4% |
| Liberal Arts & History | 102 | 5.9% |
| Visual & Performing Arts | 52 | 3.0% |
| Communications | 117 | 6.8% |
| Arts & Humanities | 122 | 7.1% |
| Total | 1,729 | 100.0% |
Transportation & Commute in Hudsonville
Vehicle Availability by Sex in Hudsonville
The most prevalent vehicle ownership categories in Hudsonville are males with 2 vehicles (1,144, accounting for 55.6%) and females with 2 vehicles (940, making up 77.1%).
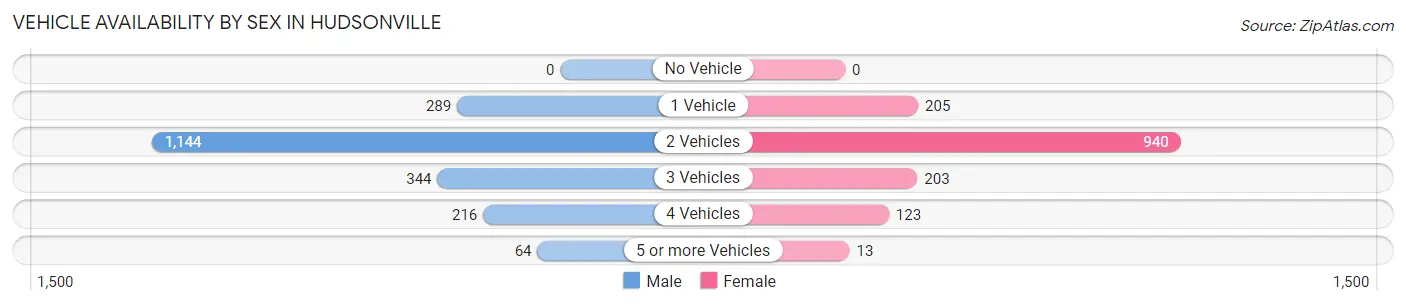
| Vehicles Available | Male | Female |
| No Vehicle | 0 (0.0%) | 0 (0.0%) |
| 1 Vehicle | 289 (14.1%) | 205 (13.8%) |
| 2 Vehicles | 1,144 (55.6%) | 940 (63.3%) |
| 3 Vehicles | 344 (16.7%) | 203 (13.7%) |
| 4 Vehicles | 216 (10.5%) | 123 (8.3%) |
| 5 or more Vehicles | 64 (3.1%) | 13 (0.9%) |
| Total | 2,057 (100.0%) | 1,484 (100.0%) |
Commute Time in Hudsonville
The most frequently occuring commute durations in Hudsonville are 20 to 24 minutes (621 commuters, 19.2%), 15 to 19 minutes (496 commuters, 15.3%), and 10 to 14 minutes (478 commuters, 14.8%).
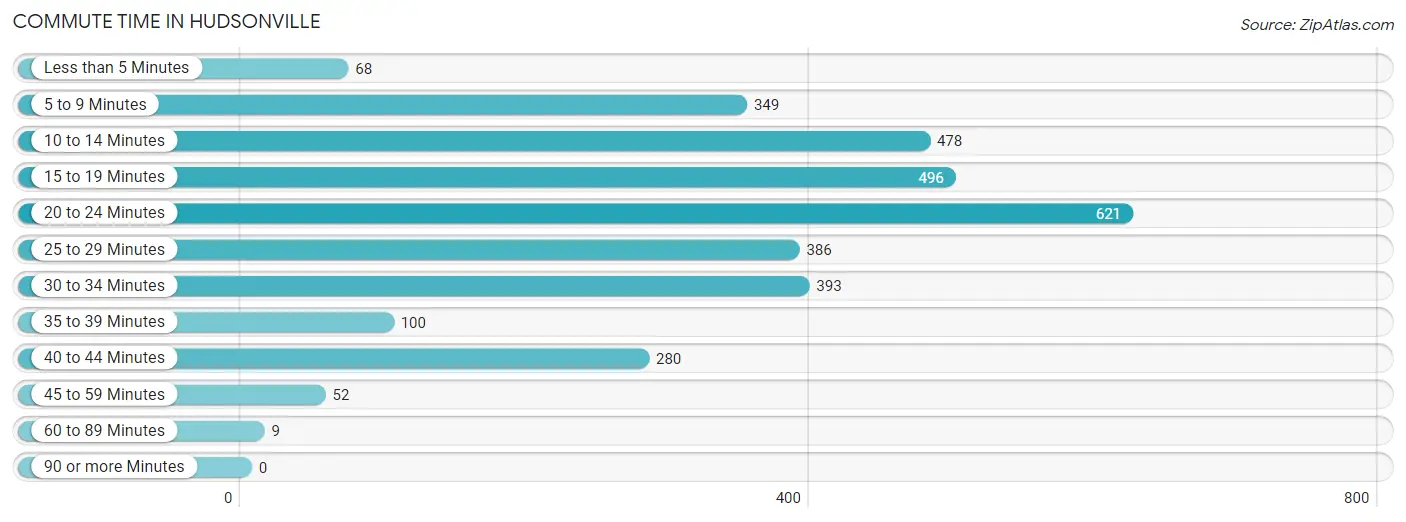
| Commute Time | # Commuters | % Commuters |
| Less than 5 Minutes | 68 | 2.1% |
| 5 to 9 Minutes | 349 | 10.8% |
| 10 to 14 Minutes | 478 | 14.8% |
| 15 to 19 Minutes | 496 | 15.3% |
| 20 to 24 Minutes | 621 | 19.2% |
| 25 to 29 Minutes | 386 | 11.9% |
| 30 to 34 Minutes | 393 | 12.2% |
| 35 to 39 Minutes | 100 | 3.1% |
| 40 to 44 Minutes | 280 | 8.7% |
| 45 to 59 Minutes | 52 | 1.6% |
| 60 to 89 Minutes | 9 | 0.3% |
| 90 or more Minutes | 0 | 0.0% |
Commute Time by Sex in Hudsonville
The most common commute times in Hudsonville are 20 to 24 minutes (324 commuters, 16.5%) for males and 20 to 24 minutes (297 commuters, 23.5%) for females.
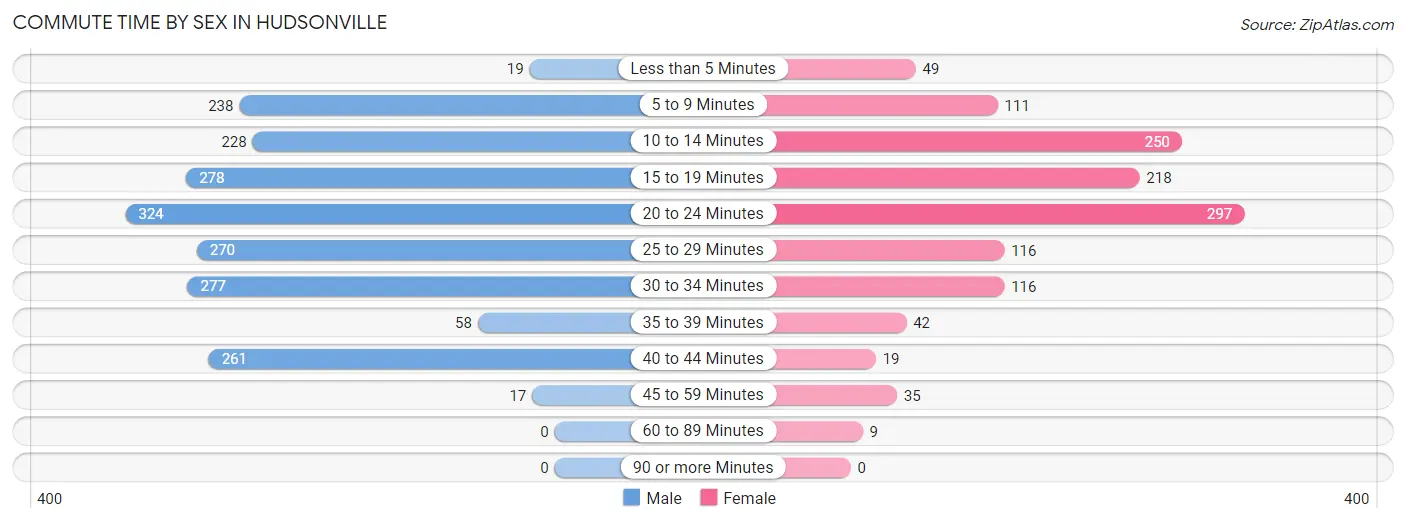
| Commute Time | Male | Female |
| Less than 5 Minutes | 19 (1.0%) | 49 (3.9%) |
| 5 to 9 Minutes | 238 (12.1%) | 111 (8.8%) |
| 10 to 14 Minutes | 228 (11.6%) | 250 (19.8%) |
| 15 to 19 Minutes | 278 (14.1%) | 218 (17.3%) |
| 20 to 24 Minutes | 324 (16.5%) | 297 (23.5%) |
| 25 to 29 Minutes | 270 (13.7%) | 116 (9.2%) |
| 30 to 34 Minutes | 277 (14.1%) | 116 (9.2%) |
| 35 to 39 Minutes | 58 (2.9%) | 42 (3.3%) |
| 40 to 44 Minutes | 261 (13.3%) | 19 (1.5%) |
| 45 to 59 Minutes | 17 (0.9%) | 35 (2.8%) |
| 60 to 89 Minutes | 0 (0.0%) | 9 (0.7%) |
| 90 or more Minutes | 0 (0.0%) | 0 (0.0%) |
Time of Departure to Work by Sex in Hudsonville
The most frequent times of departure to work in Hudsonville are 7:00 AM to 7:29 AM (351, 17.8%) for males and 7:30 AM to 7:59 AM (251, 19.9%) for females.
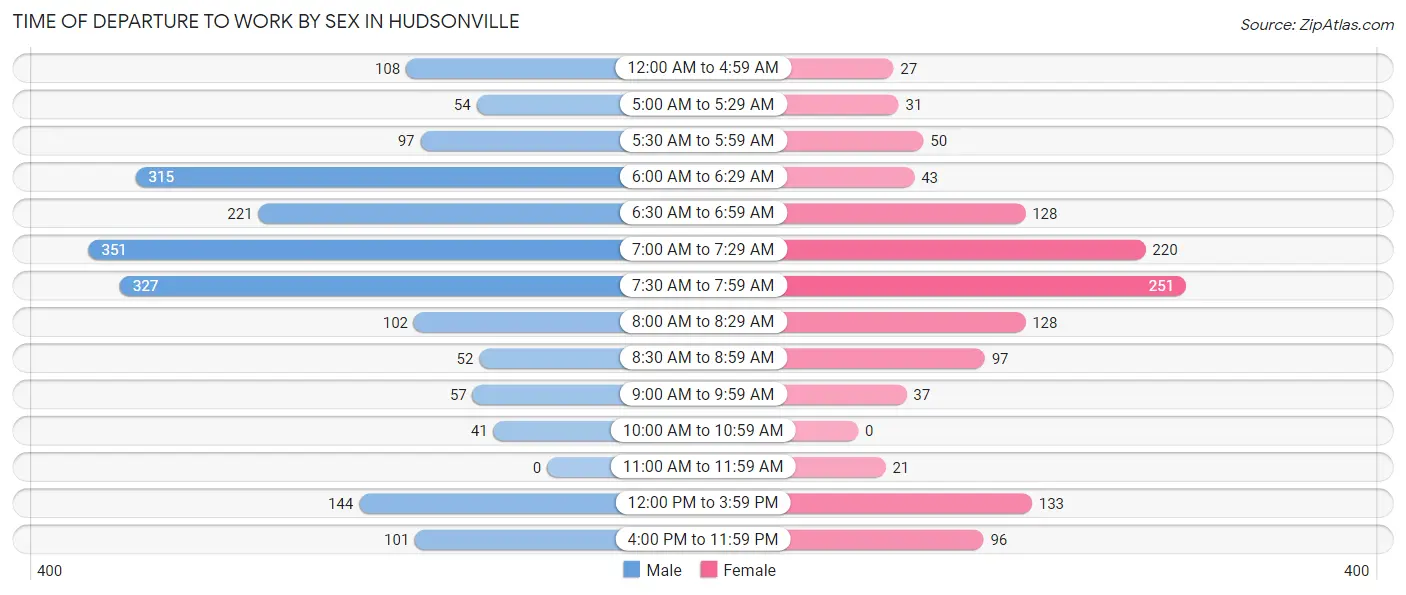
| Time of Departure | Male | Female |
| 12:00 AM to 4:59 AM | 108 (5.5%) | 27 (2.1%) |
| 5:00 AM to 5:29 AM | 54 (2.7%) | 31 (2.5%) |
| 5:30 AM to 5:59 AM | 97 (4.9%) | 50 (4.0%) |
| 6:00 AM to 6:29 AM | 315 (16.0%) | 43 (3.4%) |
| 6:30 AM to 6:59 AM | 221 (11.2%) | 128 (10.1%) |
| 7:00 AM to 7:29 AM | 351 (17.8%) | 220 (17.4%) |
| 7:30 AM to 7:59 AM | 327 (16.6%) | 251 (19.9%) |
| 8:00 AM to 8:29 AM | 102 (5.2%) | 128 (10.1%) |
| 8:30 AM to 8:59 AM | 52 (2.6%) | 97 (7.7%) |
| 9:00 AM to 9:59 AM | 57 (2.9%) | 37 (2.9%) |
| 10:00 AM to 10:59 AM | 41 (2.1%) | 0 (0.0%) |
| 11:00 AM to 11:59 AM | 0 (0.0%) | 21 (1.7%) |
| 12:00 PM to 3:59 PM | 144 (7.3%) | 133 (10.5%) |
| 4:00 PM to 11:59 PM | 101 (5.1%) | 96 (7.6%) |
| Total | 1,970 (100.0%) | 1,262 (100.0%) |
Housing Occupancy in Hudsonville
Occupancy by Ownership in Hudsonville
Of the total 2,662 dwellings in Hudsonville, owner-occupied units account for 2,279 (85.6%), while renter-occupied units make up 383 (14.4%).
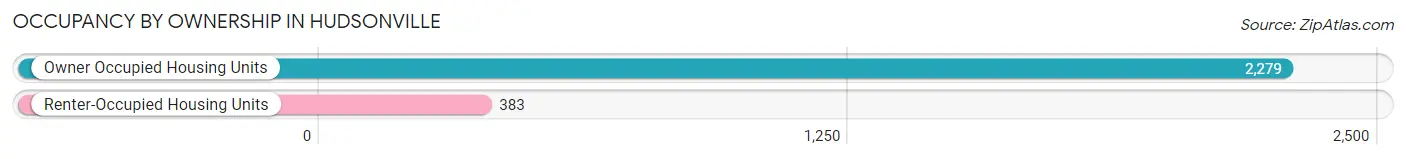
| Occupancy | # Housing Units | % Housing Units |
| Owner Occupied Housing Units | 2,279 | 85.6% |
| Renter-Occupied Housing Units | 383 | 14.4% |
| Total Occupied Housing Units | 2,662 | 100.0% |
Occupancy by Household Size in Hudsonville
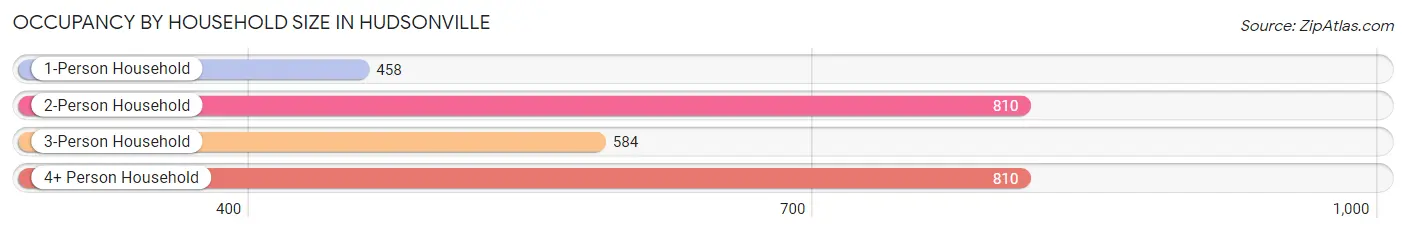
| Household Size | # Housing Units | % Housing Units |
| 1-Person Household | 458 | 17.2% |
| 2-Person Household | 810 | 30.4% |
| 3-Person Household | 584 | 21.9% |
| 4+ Person Household | 810 | 30.4% |
| Total Housing Units | 2,662 | 100.0% |
Occupancy by Ownership by Household Size in Hudsonville
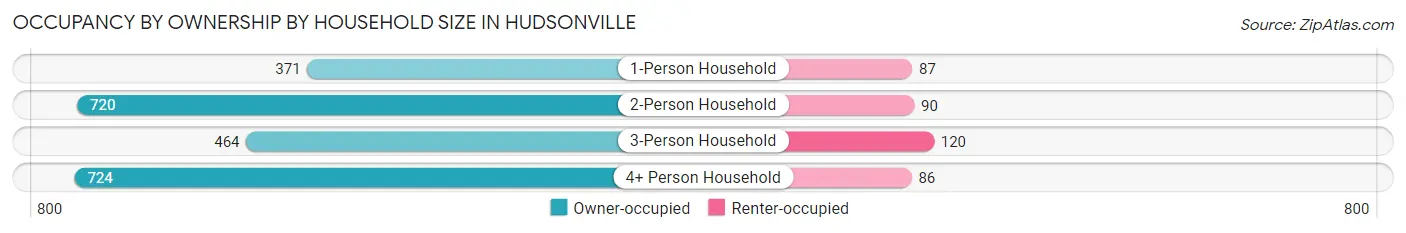
| Household Size | Owner-occupied | Renter-occupied |
| 1-Person Household | 371 (81.0%) | 87 (19.0%) |
| 2-Person Household | 720 (88.9%) | 90 (11.1%) |
| 3-Person Household | 464 (79.4%) | 120 (20.5%) |
| 4+ Person Household | 724 (89.4%) | 86 (10.6%) |
| Total Housing Units | 2,279 (85.6%) | 383 (14.4%) |
Occupancy by Educational Attainment in Hudsonville
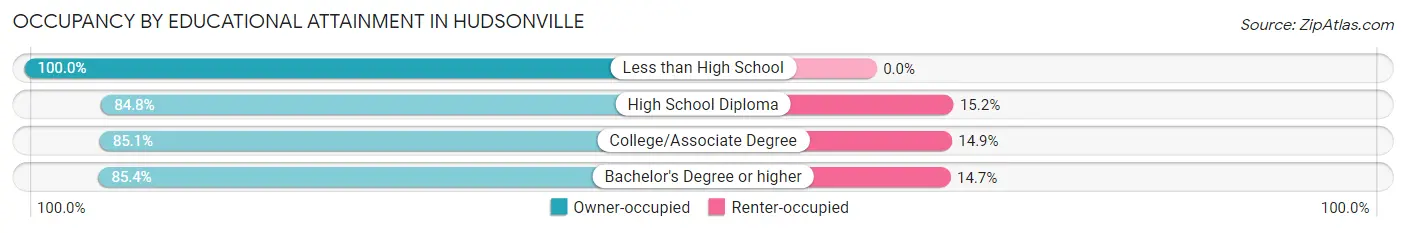
| Household Size | Owner-occupied | Renter-occupied |
| Less than High School | 88 (100.0%) | 0 (0.0%) |
| High School Diploma | 473 (84.8%) | 85 (15.2%) |
| College/Associate Degree | 850 (85.1%) | 149 (14.9%) |
| Bachelor's Degree or higher | 868 (85.4%) | 149 (14.6%) |
Occupancy by Age of Householder in Hudsonville
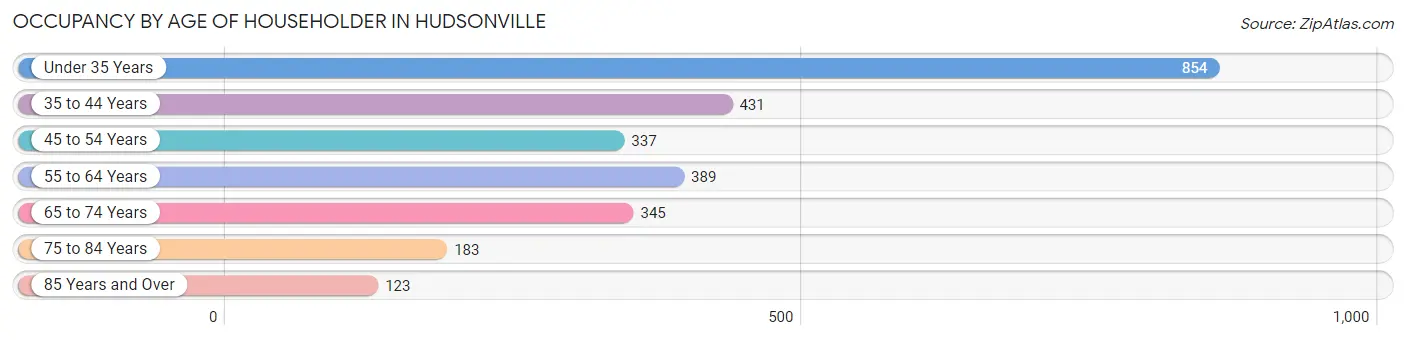
| Age Bracket | # Households | % Households |
| Under 35 Years | 854 | 32.1% |
| 35 to 44 Years | 431 | 16.2% |
| 45 to 54 Years | 337 | 12.7% |
| 55 to 64 Years | 389 | 14.6% |
| 65 to 74 Years | 345 | 13.0% |
| 75 to 84 Years | 183 | 6.9% |
| 85 Years and Over | 123 | 4.6% |
| Total | 2,662 | 100.0% |
Housing Finances in Hudsonville
Median Income by Occupancy in Hudsonville
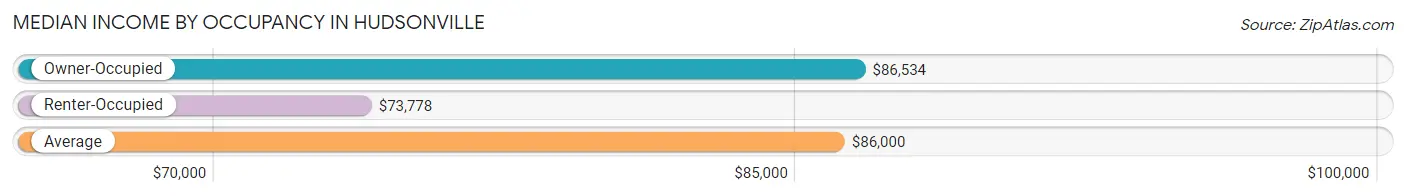
| Occupancy Type | # Households | Median Income |
| Owner-Occupied | 2,279 (85.6%) | $86,534 |
| Renter-Occupied | 383 (14.4%) | $73,778 |
| Average | 2,662 (100.0%) | $86,000 |
Occupancy by Householder Income Bracket in Hudsonville
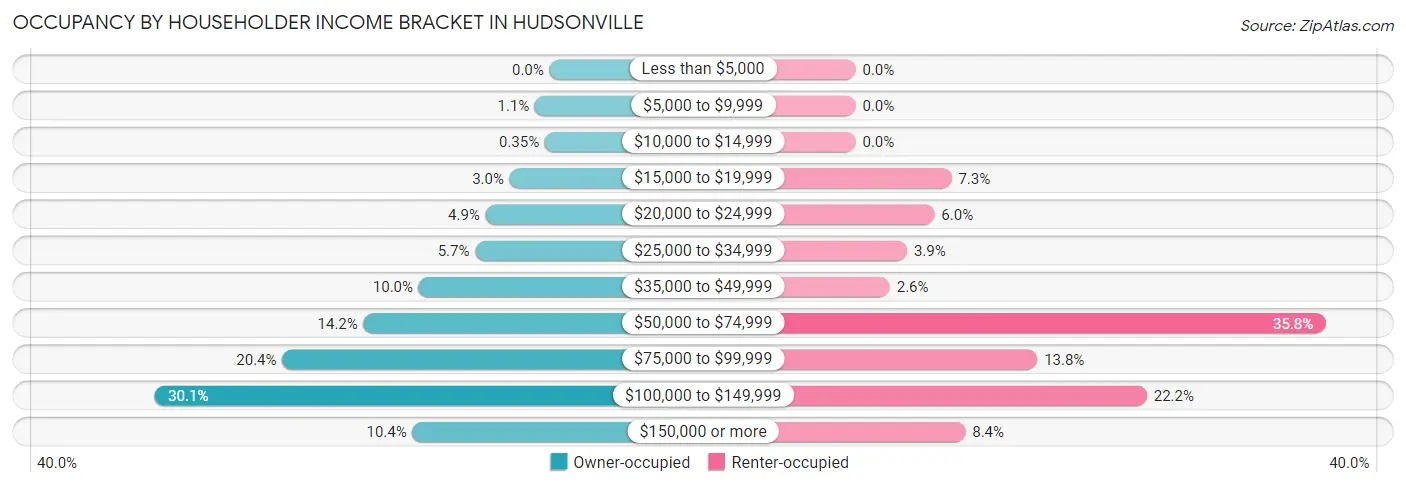
| Income Bracket | Owner-occupied | Renter-occupied |
| Less than $5,000 | 0 (0.0%) | 0 (0.0%) |
| $5,000 to $9,999 | 25 (1.1%) | 0 (0.0%) |
| $10,000 to $14,999 | 8 (0.4%) | 0 (0.0%) |
| $15,000 to $19,999 | 69 (3.0%) | 28 (7.3%) |
| $20,000 to $24,999 | 111 (4.9%) | 23 (6.0%) |
| $25,000 to $34,999 | 129 (5.7%) | 15 (3.9%) |
| $35,000 to $49,999 | 227 (10.0%) | 10 (2.6%) |
| $50,000 to $74,999 | 323 (14.2%) | 137 (35.8%) |
| $75,000 to $99,999 | 464 (20.4%) | 53 (13.8%) |
| $100,000 to $149,999 | 685 (30.1%) | 85 (22.2%) |
| $150,000 or more | 238 (10.4%) | 32 (8.4%) |
| Total | 2,279 (100.0%) | 383 (100.0%) |
Monthly Housing Cost Tiers in Hudsonville
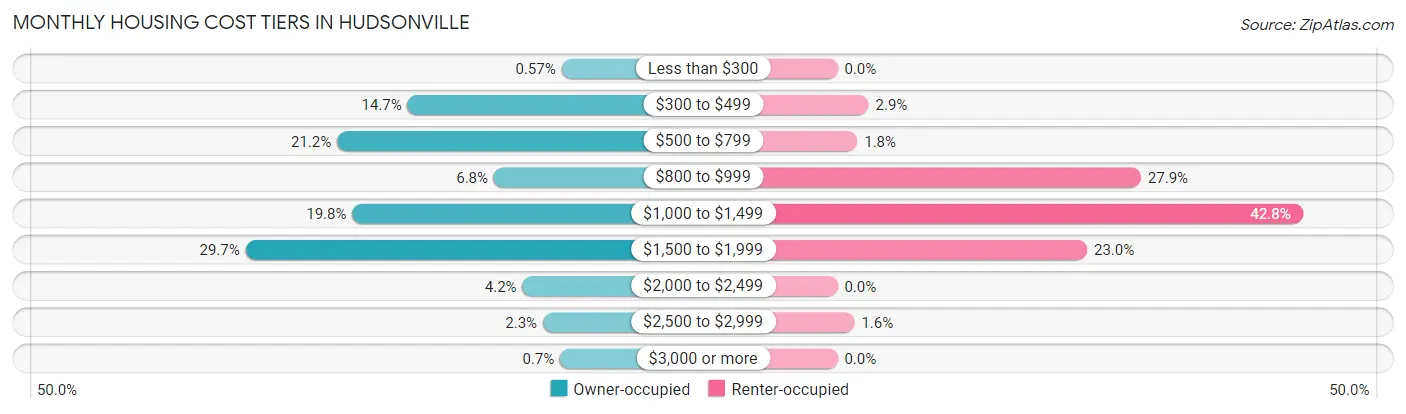
| Monthly Cost | Owner-occupied | Renter-occupied |
| Less than $300 | 13 (0.6%) | 0 (0.0%) |
| $300 to $499 | 336 (14.7%) | 11 (2.9%) |
| $500 to $799 | 484 (21.2%) | 7 (1.8%) |
| $800 to $999 | 155 (6.8%) | 107 (27.9%) |
| $1,000 to $1,499 | 452 (19.8%) | 164 (42.8%) |
| $1,500 to $1,999 | 676 (29.7%) | 88 (23.0%) |
| $2,000 to $2,499 | 95 (4.2%) | 0 (0.0%) |
| $2,500 to $2,999 | 52 (2.3%) | 6 (1.6%) |
| $3,000 or more | 16 (0.7%) | 0 (0.0%) |
| Total | 2,279 (100.0%) | 383 (100.0%) |
Physical Housing Characteristics in Hudsonville
Housing Structures in Hudsonville
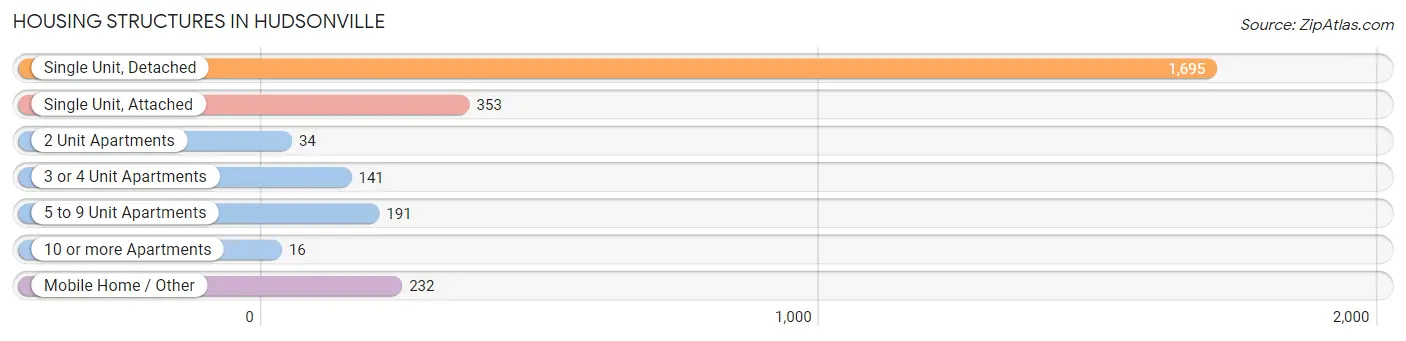
| Structure Type | # Housing Units | % Housing Units |
| Single Unit, Detached | 1,695 | 63.7% |
| Single Unit, Attached | 353 | 13.3% |
| 2 Unit Apartments | 34 | 1.3% |
| 3 or 4 Unit Apartments | 141 | 5.3% |
| 5 to 9 Unit Apartments | 191 | 7.2% |
| 10 or more Apartments | 16 | 0.6% |
| Mobile Home / Other | 232 | 8.7% |
| Total | 2,662 | 100.0% |
Housing Structures by Occupancy in Hudsonville
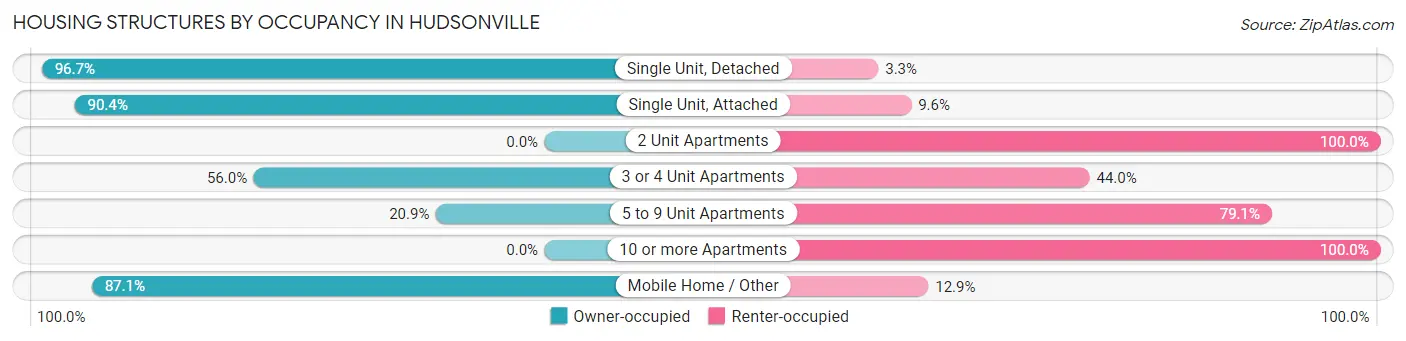
| Structure Type | Owner-occupied | Renter-occupied |
| Single Unit, Detached | 1,639 (96.7%) | 56 (3.3%) |
| Single Unit, Attached | 319 (90.4%) | 34 (9.6%) |
| 2 Unit Apartments | 0 (0.0%) | 34 (100.0%) |
| 3 or 4 Unit Apartments | 79 (56.0%) | 62 (44.0%) |
| 5 to 9 Unit Apartments | 40 (20.9%) | 151 (79.1%) |
| 10 or more Apartments | 0 (0.0%) | 16 (100.0%) |
| Mobile Home / Other | 202 (87.1%) | 30 (12.9%) |
| Total | 2,279 (85.6%) | 383 (14.4%) |
Housing Structures by Number of Rooms in Hudsonville
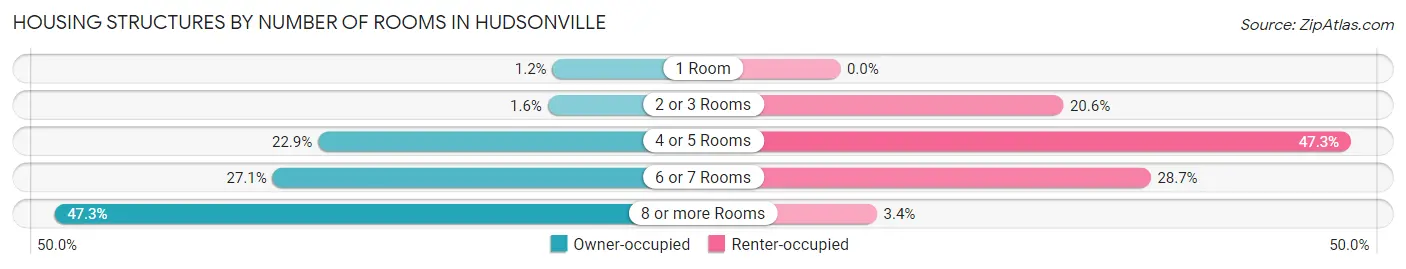
| Number of Rooms | Owner-occupied | Renter-occupied |
| 1 Room | 27 (1.2%) | 0 (0.0%) |
| 2 or 3 Rooms | 37 (1.6%) | 79 (20.6%) |
| 4 or 5 Rooms | 521 (22.9%) | 181 (47.3%) |
| 6 or 7 Rooms | 617 (27.1%) | 110 (28.7%) |
| 8 or more Rooms | 1,077 (47.3%) | 13 (3.4%) |
| Total | 2,279 (100.0%) | 383 (100.0%) |
Housing Structure by Heating Type in Hudsonville
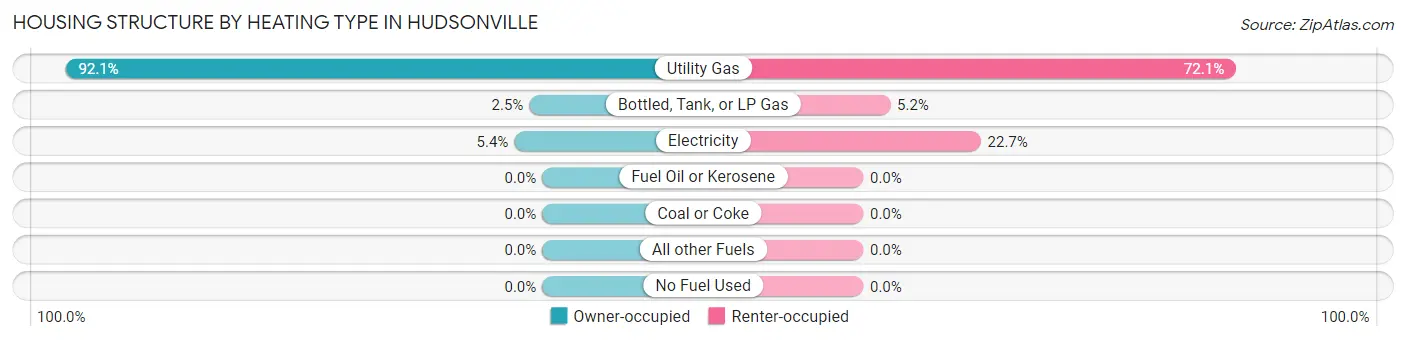
| Heating Type | Owner-occupied | Renter-occupied |
| Utility Gas | 2,099 (92.1%) | 276 (72.1%) |
| Bottled, Tank, or LP Gas | 57 (2.5%) | 20 (5.2%) |
| Electricity | 123 (5.4%) | 87 (22.7%) |
| Fuel Oil or Kerosene | 0 (0.0%) | 0 (0.0%) |
| Coal or Coke | 0 (0.0%) | 0 (0.0%) |
| All other Fuels | 0 (0.0%) | 0 (0.0%) |
| No Fuel Used | 0 (0.0%) | 0 (0.0%) |
| Total | 2,279 (100.0%) | 383 (100.0%) |
Household Vehicle Usage in Hudsonville
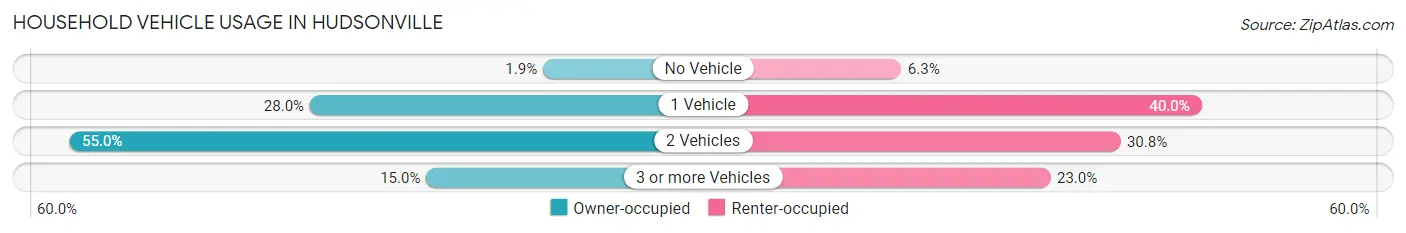
| Vehicles per Household | Owner-occupied | Renter-occupied |
| No Vehicle | 44 (1.9%) | 24 (6.3%) |
| 1 Vehicle | 639 (28.0%) | 153 (40.0%) |
| 2 Vehicles | 1,254 (55.0%) | 118 (30.8%) |
| 3 or more Vehicles | 342 (15.0%) | 88 (23.0%) |
| Total | 2,279 (100.0%) | 383 (100.0%) |
Real Estate & Mortgages in Hudsonville
Real Estate and Mortgage Overview in Hudsonville
| Characteristic | Without Mortgage | With Mortgage |
| Housing Units | 887 | 1,392 |
| Median Property Value | $211,600 | $264,200 |
| Median Household Income | $51,125 | $162 |
| Monthly Housing Costs | $553 | $0 |
| Real Estate Taxes | $2,468 | $150 |
Property Value by Mortgage Status in Hudsonville
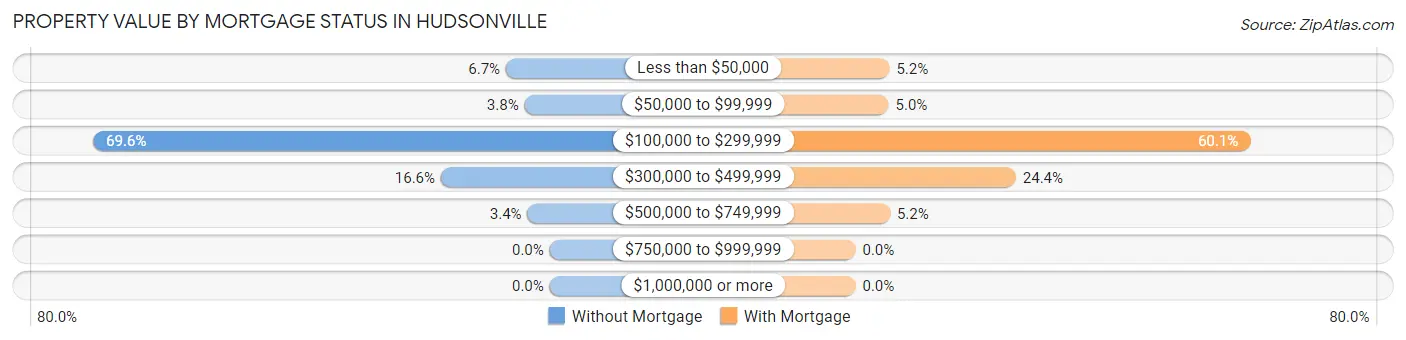
| Property Value | Without Mortgage | With Mortgage |
| Less than $50,000 | 59 (6.7%) | 72 (5.2%) |
| $50,000 to $99,999 | 34 (3.8%) | 70 (5.0%) |
| $100,000 to $299,999 | 617 (69.6%) | 837 (60.1%) |
| $300,000 to $499,999 | 147 (16.6%) | 340 (24.4%) |
| $500,000 to $749,999 | 30 (3.4%) | 73 (5.2%) |
| $750,000 to $999,999 | 0 (0.0%) | 0 (0.0%) |
| $1,000,000 or more | 0 (0.0%) | 0 (0.0%) |
| Total | 887 (100.0%) | 1,392 (100.0%) |
Household Income by Mortgage Status in Hudsonville
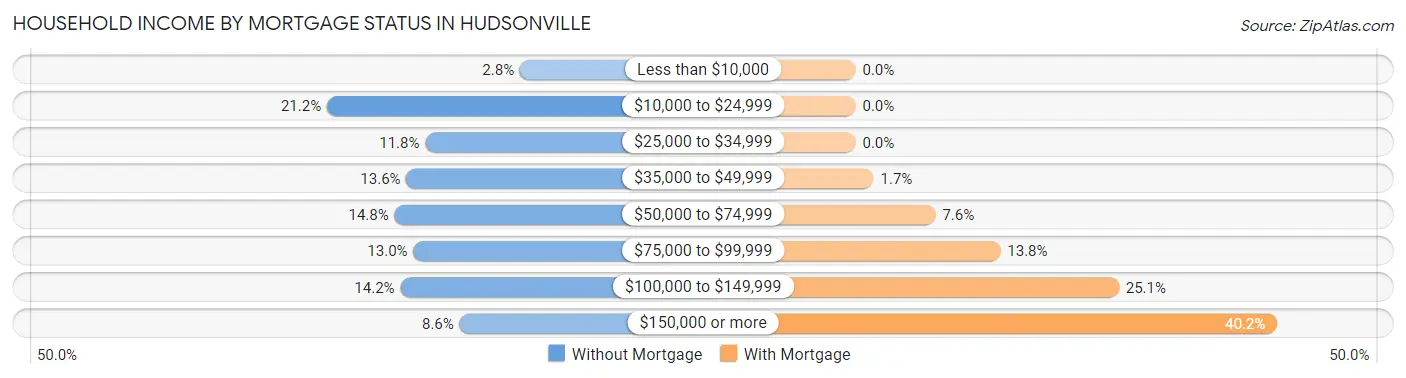
| Household Income | Without Mortgage | With Mortgage |
| Less than $10,000 | 25 (2.8%) | 0 (0.0%) |
| $10,000 to $24,999 | 188 (21.2%) | 0 (0.0%) |
| $25,000 to $34,999 | 105 (11.8%) | 0 (0.0%) |
| $35,000 to $49,999 | 121 (13.6%) | 24 (1.7%) |
| $50,000 to $74,999 | 131 (14.8%) | 106 (7.6%) |
| $75,000 to $99,999 | 115 (13.0%) | 192 (13.8%) |
| $100,000 to $149,999 | 126 (14.2%) | 349 (25.1%) |
| $150,000 or more | 76 (8.6%) | 559 (40.2%) |
| Total | 887 (100.0%) | 1,392 (100.0%) |
Property Value to Household Income Ratio in Hudsonville
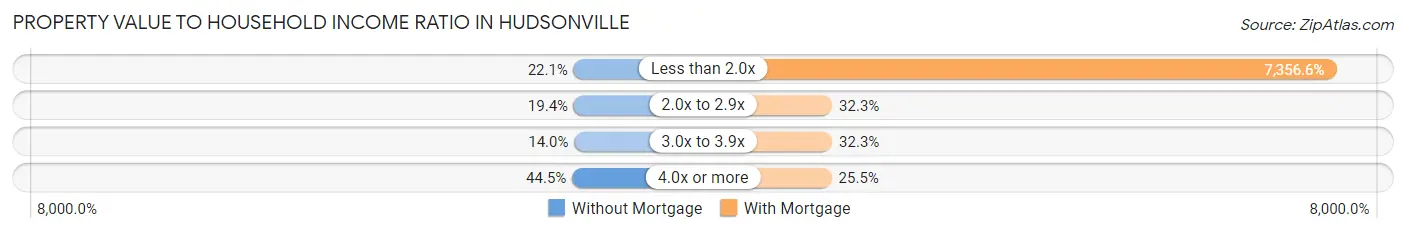
| Value-to-Income Ratio | Without Mortgage | With Mortgage |
| Less than 2.0x | 196 (22.1%) | 102,404 (7,356.6%) |
| 2.0x to 2.9x | 172 (19.4%) | 450 (32.3%) |
| 3.0x to 3.9x | 124 (14.0%) | 449 (32.3%) |
| 4.0x or more | 395 (44.5%) | 355 (25.5%) |
| Total | 887 (100.0%) | 1,392 (100.0%) |
Real Estate Taxes by Mortgage Status in Hudsonville
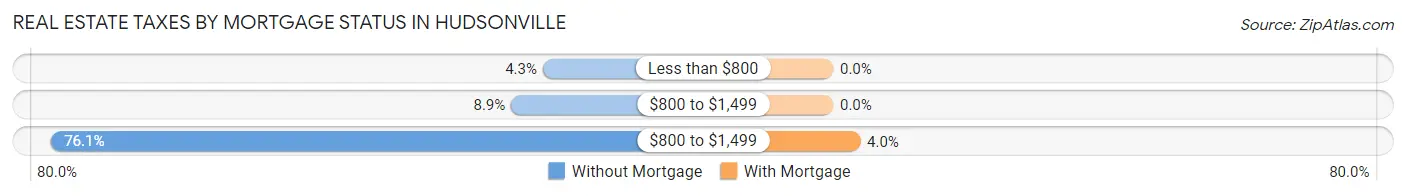
| Property Taxes | Without Mortgage | With Mortgage |
| Less than $800 | 38 (4.3%) | 0 (0.0%) |
| $800 to $1,499 | 79 (8.9%) | 0 (0.0%) |
| $800 to $1,499 | 675 (76.1%) | 55 (4.0%) |
| Total | 887 (100.0%) | 1,392 (100.0%) |
Health & Disability in Hudsonville
Health Insurance Coverage by Age in Hudsonville
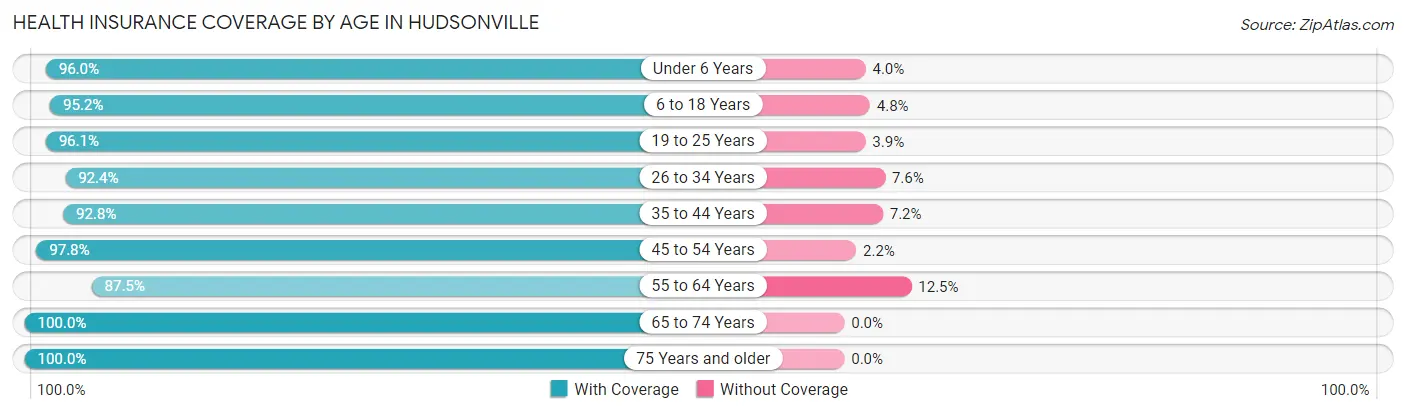
| Age Bracket | With Coverage | Without Coverage |
| Under 6 Years | 679 (96.0%) | 28 (4.0%) |
| 6 to 18 Years | 1,579 (95.2%) | 79 (4.8%) |
| 19 to 25 Years | 439 (96.1%) | 18 (3.9%) |
| 26 to 34 Years | 1,463 (92.4%) | 120 (7.6%) |
| 35 to 44 Years | 711 (92.8%) | 55 (7.2%) |
| 45 to 54 Years | 577 (97.8%) | 13 (2.2%) |
| 55 to 64 Years | 672 (87.5%) | 96 (12.5%) |
| 65 to 74 Years | 535 (100.0%) | 0 (0.0%) |
| 75 Years and older | 469 (100.0%) | 0 (0.0%) |
| Total | 7,124 (94.6%) | 409 (5.4%) |
Health Insurance Coverage by Citizenship Status in Hudsonville
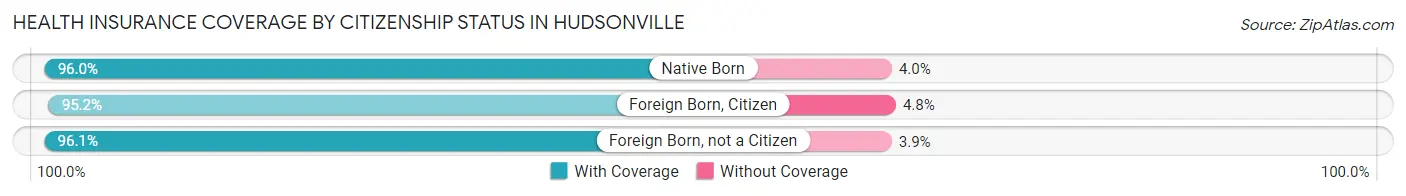
| Citizenship Status | With Coverage | Without Coverage |
| Native Born | 679 (96.0%) | 28 (4.0%) |
| Foreign Born, Citizen | 1,579 (95.2%) | 79 (4.8%) |
| Foreign Born, not a Citizen | 439 (96.1%) | 18 (3.9%) |
Health Insurance Coverage by Household Income in Hudsonville
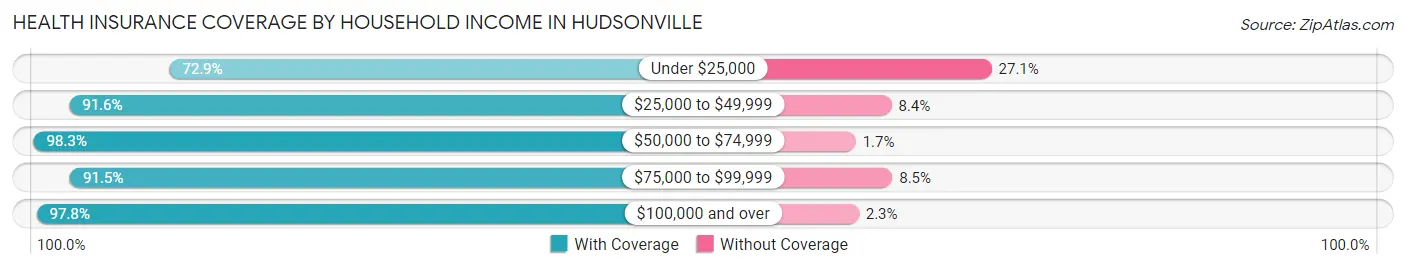
| Household Income | With Coverage | Without Coverage |
| Under $25,000 | 317 (72.9%) | 118 (27.1%) |
| $25,000 to $49,999 | 700 (91.6%) | 64 (8.4%) |
| $50,000 to $74,999 | 1,117 (98.3%) | 19 (1.7%) |
| $75,000 to $99,999 | 1,331 (91.5%) | 124 (8.5%) |
| $100,000 and over | 3,652 (97.8%) | 84 (2.2%) |
Public vs Private Health Insurance Coverage by Age in Hudsonville
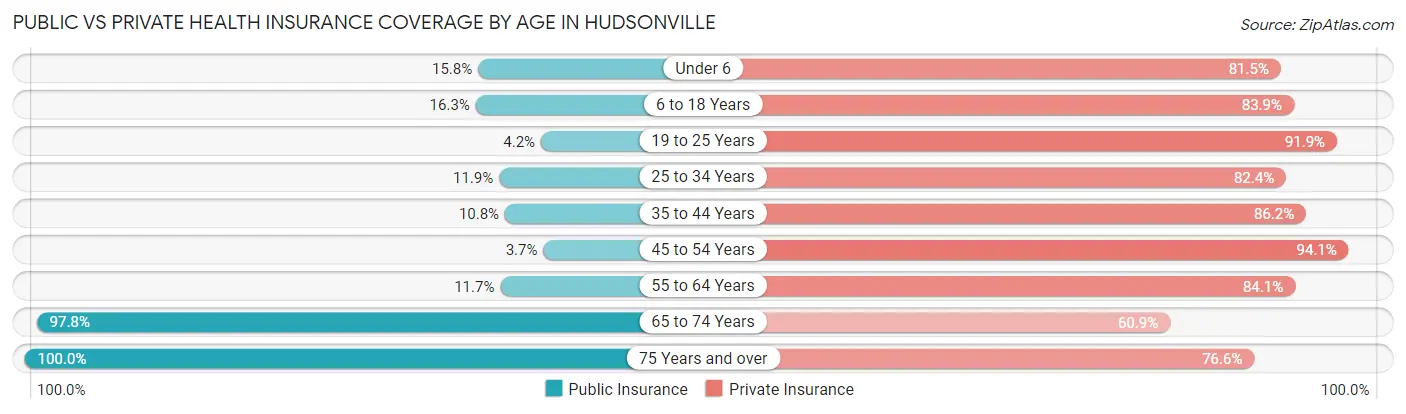
| Age Bracket | Public Insurance | Private Insurance |
| Under 6 | 112 (15.8%) | 576 (81.5%) |
| 6 to 18 Years | 270 (16.3%) | 1,391 (83.9%) |
| 19 to 25 Years | 19 (4.2%) | 420 (91.9%) |
| 25 to 34 Years | 189 (11.9%) | 1,305 (82.4%) |
| 35 to 44 Years | 83 (10.8%) | 660 (86.2%) |
| 45 to 54 Years | 22 (3.7%) | 555 (94.1%) |
| 55 to 64 Years | 90 (11.7%) | 646 (84.1%) |
| 65 to 74 Years | 523 (97.8%) | 326 (60.9%) |
| 75 Years and over | 469 (100.0%) | 359 (76.5%) |
| Total | 1,777 (23.6%) | 6,238 (82.8%) |
Disability Status by Sex by Age in Hudsonville
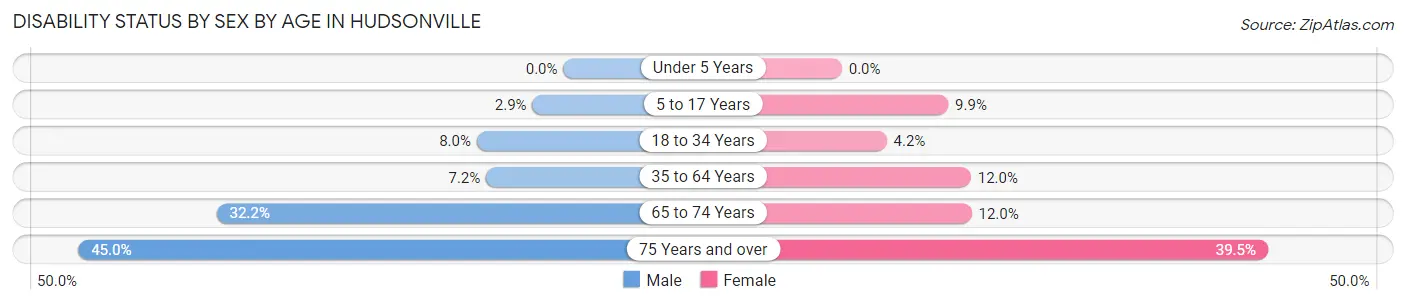
| Age Bracket | Male | Female |
| Under 5 Years | 0 (0.0%) | 0 (0.0%) |
| 5 to 17 Years | 24 (2.9%) | 83 (9.9%) |
| 18 to 34 Years | 94 (8.0%) | 40 (4.2%) |
| 35 to 64 Years | 75 (7.2%) | 129 (12.0%) |
| 65 to 74 Years | 84 (32.2%) | 33 (12.0%) |
| 75 Years and over | 95 (45.0%) | 102 (39.5%) |
Disability Class by Sex by Age in Hudsonville
Disability Class: Hearing Difficulty
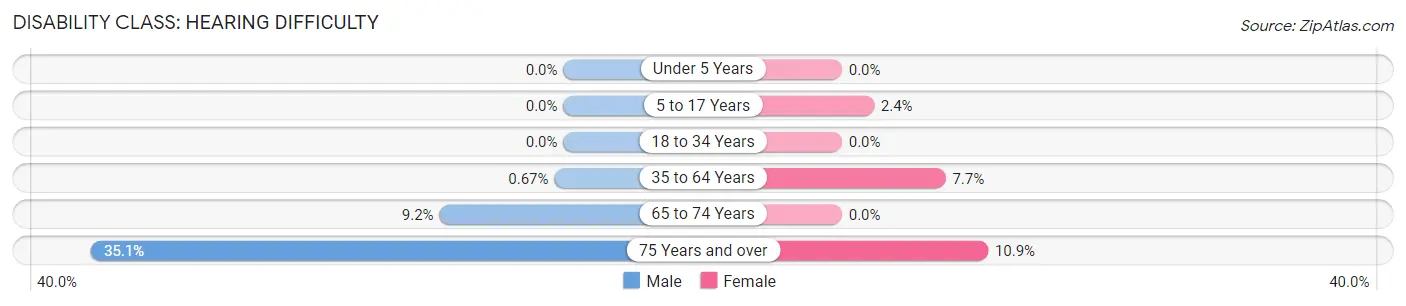
| Age Bracket | Male | Female |
| Under 5 Years | 0 (0.0%) | 0 (0.0%) |
| 5 to 17 Years | 0 (0.0%) | 20 (2.4%) |
| 18 to 34 Years | 0 (0.0%) | 0 (0.0%) |
| 35 to 64 Years | 7 (0.7%) | 83 (7.7%) |
| 65 to 74 Years | 24 (9.2%) | 0 (0.0%) |
| 75 Years and over | 74 (35.1%) | 28 (10.8%) |
Disability Class: Vision Difficulty
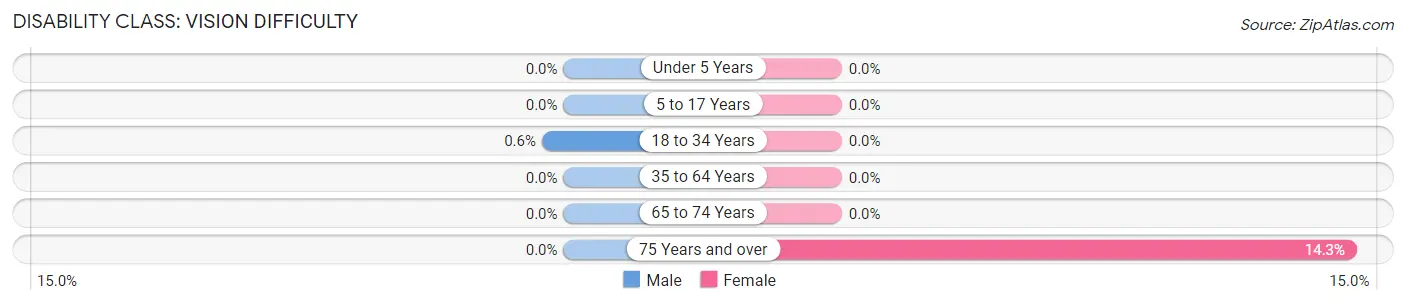
| Age Bracket | Male | Female |
| Under 5 Years | 0 (0.0%) | 0 (0.0%) |
| 5 to 17 Years | 0 (0.0%) | 0 (0.0%) |
| 18 to 34 Years | 7 (0.6%) | 0 (0.0%) |
| 35 to 64 Years | 0 (0.0%) | 0 (0.0%) |
| 65 to 74 Years | 0 (0.0%) | 0 (0.0%) |
| 75 Years and over | 0 (0.0%) | 37 (14.3%) |
Disability Class: Cognitive Difficulty
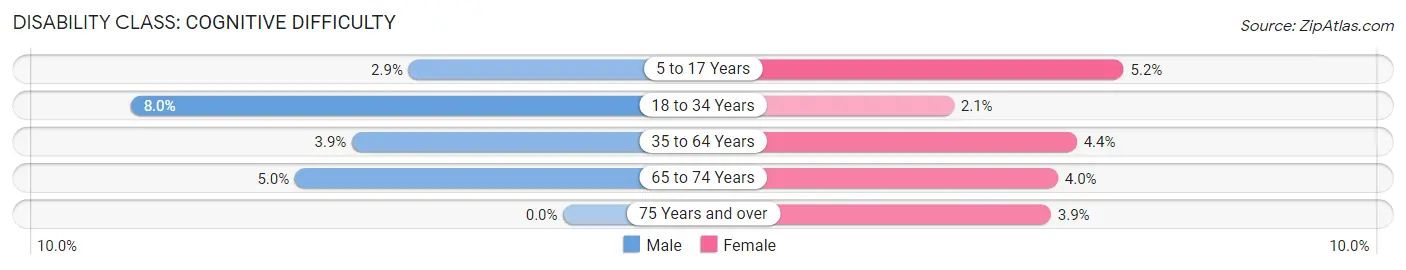
| Age Bracket | Male | Female |
| 5 to 17 Years | 24 (2.9%) | 44 (5.2%) |
| 18 to 34 Years | 94 (8.0%) | 20 (2.1%) |
| 35 to 64 Years | 41 (3.9%) | 47 (4.4%) |
| 65 to 74 Years | 13 (5.0%) | 11 (4.0%) |
| 75 Years and over | 0 (0.0%) | 10 (3.9%) |
Disability Class: Ambulatory Difficulty
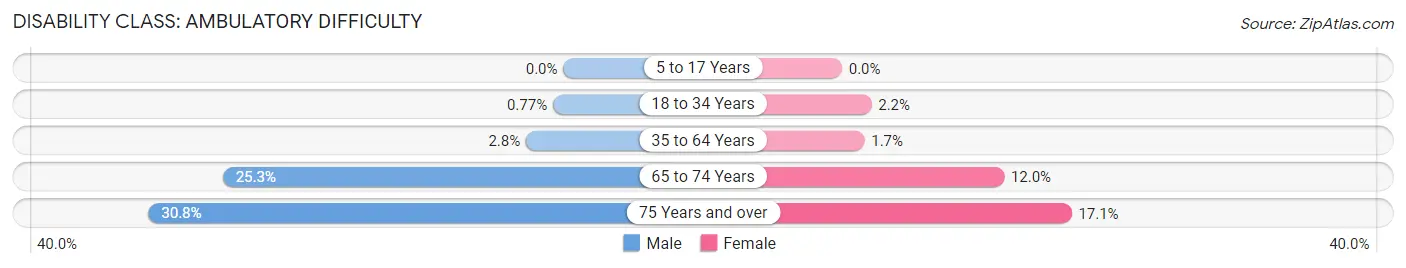
| Age Bracket | Male | Female |
| 5 to 17 Years | 0 (0.0%) | 0 (0.0%) |
| 18 to 34 Years | 9 (0.8%) | 21 (2.2%) |
| 35 to 64 Years | 29 (2.8%) | 18 (1.7%) |
| 65 to 74 Years | 66 (25.3%) | 33 (12.0%) |
| 75 Years and over | 65 (30.8%) | 44 (17.1%) |
Disability Class: Self-Care Difficulty
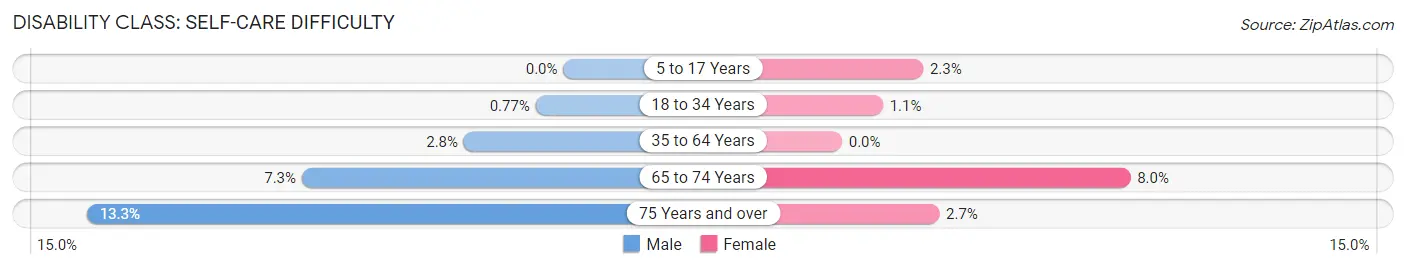
| Age Bracket | Male | Female |
| 5 to 17 Years | 0 (0.0%) | 19 (2.3%) |
| 18 to 34 Years | 9 (0.8%) | 11 (1.1%) |
| 35 to 64 Years | 29 (2.8%) | 0 (0.0%) |
| 65 to 74 Years | 19 (7.3%) | 22 (8.0%) |
| 75 Years and over | 28 (13.3%) | 7 (2.7%) |
Technology Access in Hudsonville
Computing Device Access in Hudsonville
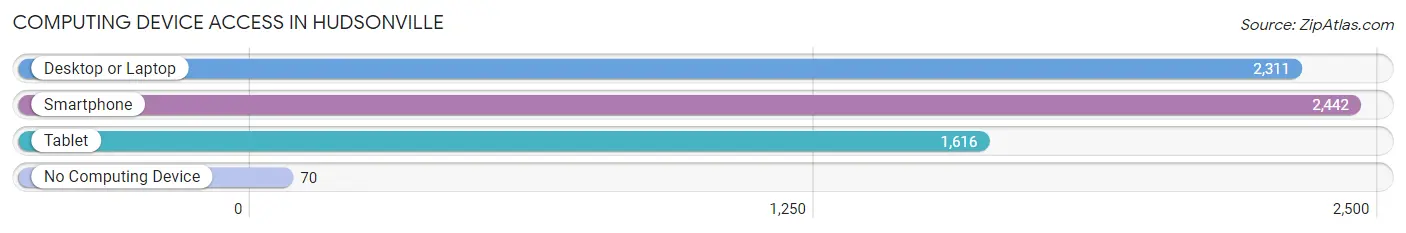
| Device Type | # Households | % Households |
| Desktop or Laptop | 2,311 | 86.8% |
| Smartphone | 2,442 | 91.7% |
| Tablet | 1,616 | 60.7% |
| No Computing Device | 70 | 2.6% |
| Total | 2,662 | 100.0% |
Internet Access in Hudsonville
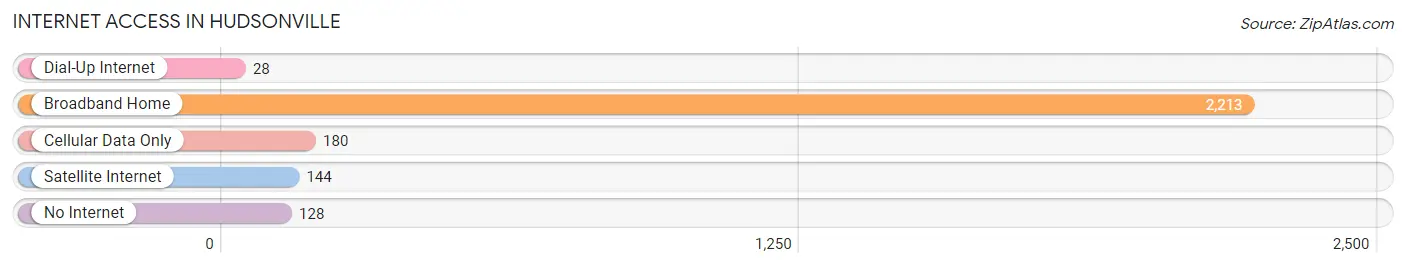
| Internet Type | # Households | % Households |
| Dial-Up Internet | 28 | 1.1% |
| Broadband Home | 2,213 | 83.1% |
| Cellular Data Only | 180 | 6.8% |
| Satellite Internet | 144 | 5.4% |
| No Internet | 128 | 4.8% |
| Total | 2,662 | 100.0% |
Hudsonville Summary
Hudsonville, Michigan is a small city located in Ottawa County, in the western part of the state. It is situated about 20 miles southwest of Grand Rapids, and is part of the Grand Rapids metropolitan area. The city has a population of around 7,000 people, and is known for its strong Dutch heritage.
History
Hudsonville was first settled in 1848 by a group of Dutch immigrants, led by Reverend Albertus Van Raalte. The settlers were looking for a place to practice their religion without persecution, and chose the area due to its proximity to Grand Rapids. The city was originally known as “Hudsonville Township”, and was officially incorporated as a village in 1867.
The city grew slowly over the next few decades, and by the early 1900s, it had become a popular destination for tourists. The city was known for its many Dutch-style windmills, which were used to grind grain and pump water. The city also had a thriving dairy industry, and was home to several cheese factories.
In the 1950s, the city began to experience rapid growth, as many people moved to the area from the nearby cities of Grand Rapids and Holland. This growth continued into the 1960s and 1970s, and by the 1980s, the city had become a popular suburb of Grand Rapids.
Geography
Hudsonville is located in western Michigan, in Ottawa County. It is situated about 20 miles southwest of Grand Rapids, and is part of the Grand Rapids metropolitan area. The city is located on the banks of the Grand River, and is surrounded by rolling hills and farmland.
The city has a total area of 4.3 square miles, of which 4.2 square miles is land and 0.1 square miles is water. The city is located at an elevation of 690 feet above sea level.
Economy
Hudsonville’s economy is largely based on agriculture and manufacturing. The city is home to several large dairy farms, as well as several cheese factories. The city is also home to several manufacturing companies, including a large furniture manufacturer and a plastics manufacturer.
The city is also home to several retail stores, restaurants, and other businesses. The city is served by several major highways, including Interstate 196 and US-31.
Demographics
As of the 2010 census, Hudsonville had a population of 7,116 people. The racial makeup of the city was 94.3% White, 1.2% African American, 0.4% Native American, 1.3% Asian, 0.1% Pacific Islander, 1.2% from other races, and 1.5% from two or more races. Hispanic or Latino of any race were 3.2% of the population.
The median household income in the city was $54,945, and the median family income was $63,917. The per capita income for the city was $25,945. About 5.2% of families and 6.7% of the population were below the poverty line, including 8.2% of those under age 18 and 4.2% of those age 65 or over.
Common Questions
What is Per Capita Income in Hudsonville?
Per Capita income in Hudsonville is $31,808.
What is the Median Family Income in Hudsonville?
Median Family Income in Hudsonville is $92,000.
What is the Median Household income in Hudsonville?
Median Household Income in Hudsonville is $86,000.
What is Income or Wage Gap in Hudsonville?
Income or Wage Gap in Hudsonville is 34.6%.
Women in Hudsonville earn 65.4 cents for every dollar earned by a man.
What is Inequality or Gini Index in Hudsonville?
Inequality or Gini Index in Hudsonville is 0.35.
What is the Total Population of Hudsonville?
Total Population of Hudsonville is 7,633.
What is the Total Male Population of Hudsonville?
Total Male Population of Hudsonville is 3,820.
What is the Total Female Population of Hudsonville?
Total Female Population of Hudsonville is 3,813.
What is the Ratio of Males per 100 Females in Hudsonville?
There are 100.18 Males per 100 Females in Hudsonville.
What is the Ratio of Females per 100 Males in Hudsonville?
There are 99.82 Females per 100 Males in Hudsonville.
What is the Median Population Age in Hudsonville?
Median Population Age in Hudsonville is 32.1 Years.
What is the Average Family Size in Hudsonville
Average Family Size in Hudsonville is 3.2 People.
What is the Average Household Size in Hudsonville
Average Household Size in Hudsonville is 2.8 People.
How Large is the Labor Force in Hudsonville?
There are 3,837 People in the Labor Forcein in Hudsonville.
What is the Percentage of People in the Labor Force in Hudsonville?
70.3% of People are in the Labor Force in Hudsonville.
What is the Unemployment Rate in Hudsonville?
Unemployment Rate in Hudsonville is 6.0%.