Ironwood, MI Map & Demographics
Ironwood Map
Ironwood Overview
$32,125
PER CAPITA INCOME
$55,400
AVG FAMILY INCOME
$35,722
AVG HOUSEHOLD INCOME
16.7%
WAGE / INCOME GAP [ % ]
83.3¢/ $1
WAGE / INCOME GAP [ $ ]
0.49
INEQUALITY / GINI INDEX
5,088
TOTAL POPULATION
2,526
MALE POPULATION
2,562
FEMALE POPULATION
98.59
MALES / 100 FEMALES
101.43
FEMALES / 100 MALES
51.1
MEDIAN AGE
2.7
AVG FAMILY SIZE
1.9
AVG HOUSEHOLD SIZE
2,310
LABOR FORCE [ PEOPLE ]
52.1%
PERCENT IN LABOR FORCE
10.8%
UNEMPLOYMENT RATE
Ironwood Zip Codes
Ironwood Area Codes
Income in Ironwood
Income Overview in Ironwood
Per Capita Income in Ironwood is $32,125, while median incomes of families and households are $55,400 and $35,722 respectively.
| Characteristic | Number | Measure |
| Per Capita Income | 5,088 | $32,125 |
| Median Family Income | 1,212 | $55,400 |
| Mean Family Income | 1,212 | $79,752 |
| Median Household Income | 2,636 | $35,722 |
| Mean Household Income | 2,636 | $59,185 |
| Income Deficit | 1,212 | $0 |
| Wage / Income Gap (%) | 5,088 | 16.70% |
| Wage / Income Gap ($) | 5,088 | 83.30¢ per $1 |
| Gini / Inequality Index | 5,088 | 0.49 |
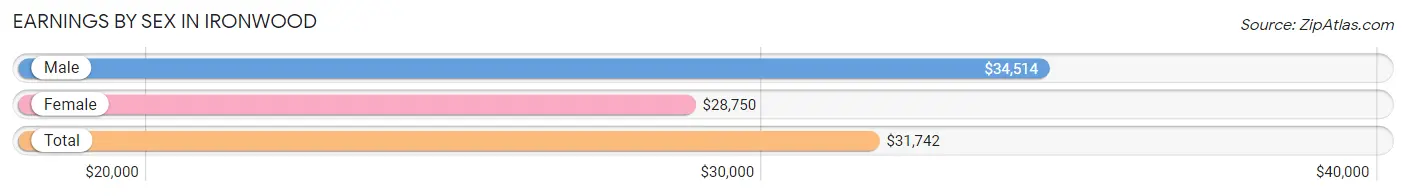
Earnings by Sex in Ironwood
Average Earnings in Ironwood are $31,742, $34,514 for men and $28,750 for women, a difference of 16.7%.
| Sex | Number | Average Earnings |
| Male | 1,209 (50.4%) | $34,514 |
| Female | 1,189 (49.6%) | $28,750 |
| Total | 2,398 (100.0%) | $31,742 |
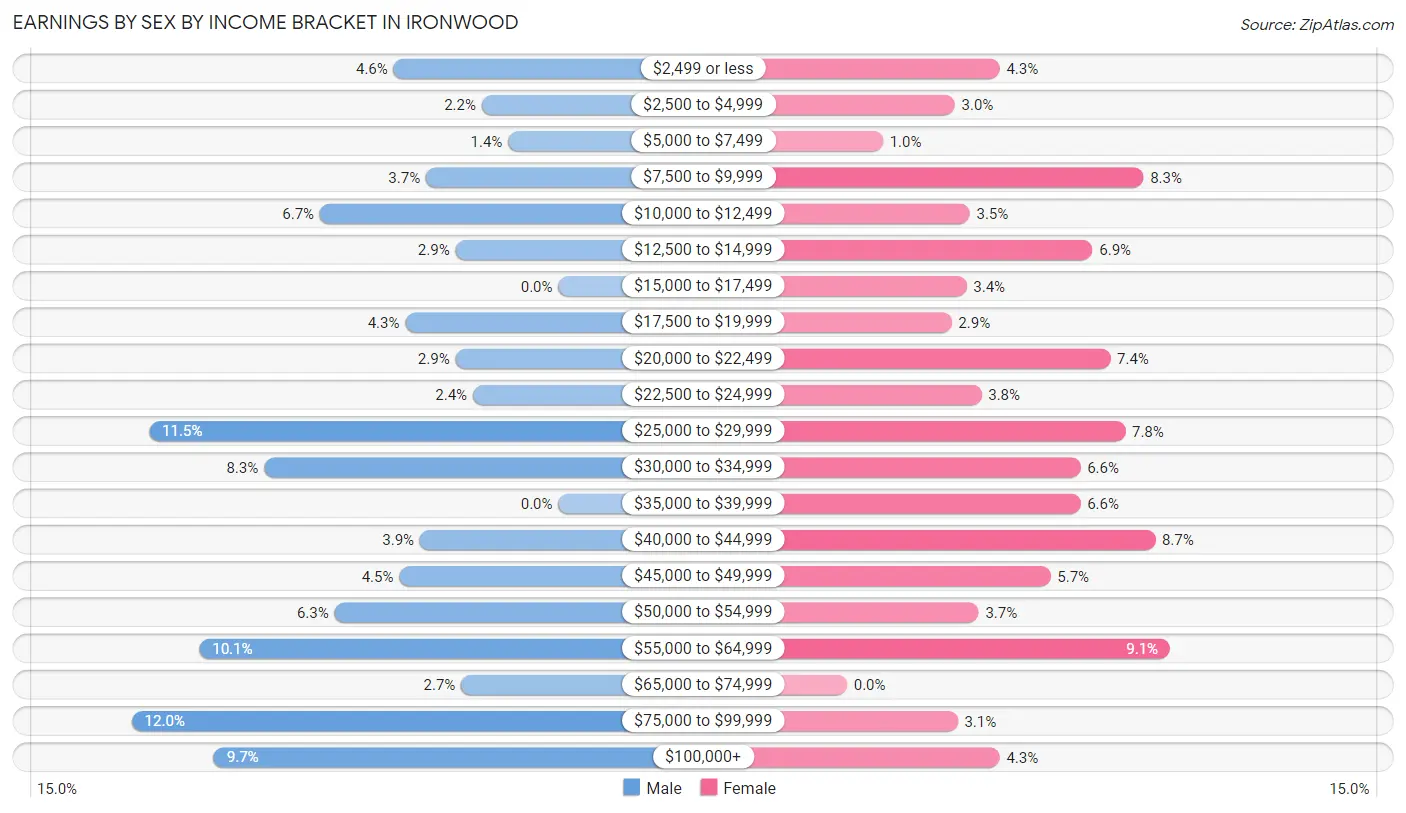
Earnings by Sex by Income Bracket in Ironwood
The most common earnings brackets in Ironwood are $75,000 to $99,999 for men (145 | 12.0%) and $55,000 to $64,999 for women (108 | 9.1%).
| Income | Male | Female |
| $2,499 or less | 56 (4.6%) | 51 (4.3%) |
| $2,500 to $4,999 | 26 (2.1%) | 36 (3.0%) |
| $5,000 to $7,499 | 17 (1.4%) | 12 (1.0%) |
| $7,500 to $9,999 | 45 (3.7%) | 99 (8.3%) |
| $10,000 to $12,499 | 81 (6.7%) | 41 (3.5%) |
| $12,500 to $14,999 | 35 (2.9%) | 82 (6.9%) |
| $15,000 to $17,499 | 0 (0.0%) | 40 (3.4%) |
| $17,500 to $19,999 | 52 (4.3%) | 35 (2.9%) |
| $20,000 to $22,499 | 35 (2.9%) | 88 (7.4%) |
| $22,500 to $24,999 | 29 (2.4%) | 45 (3.8%) |
| $25,000 to $29,999 | 139 (11.5%) | 93 (7.8%) |
| $30,000 to $34,999 | 100 (8.3%) | 78 (6.6%) |
| $35,000 to $39,999 | 0 (0.0%) | 78 (6.6%) |
| $40,000 to $44,999 | 47 (3.9%) | 103 (8.7%) |
| $45,000 to $49,999 | 54 (4.5%) | 68 (5.7%) |
| $50,000 to $54,999 | 76 (6.3%) | 44 (3.7%) |
| $55,000 to $64,999 | 122 (10.1%) | 108 (9.1%) |
| $65,000 to $74,999 | 33 (2.7%) | 0 (0.0%) |
| $75,000 to $99,999 | 145 (12.0%) | 37 (3.1%) |
| $100,000+ | 117 (9.7%) | 51 (4.3%) |
| Total | 1,209 (100.0%) | 1,189 (100.0%) |
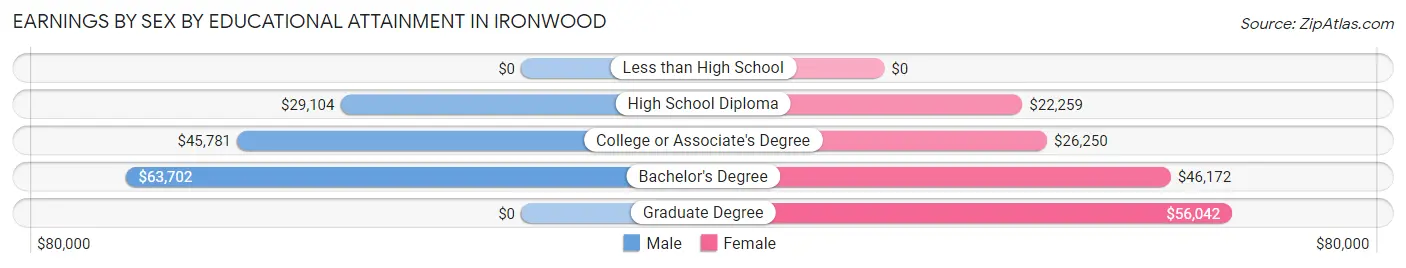
Earnings by Sex by Educational Attainment in Ironwood
Average earnings in Ironwood are $43,063 for men and $30,000 for women, a difference of 30.3%. Men with an educational attainment of bachelor's degree enjoy the highest average annual earnings of $63,702, while those with high school diploma education earn the least with $29,104. Women with an educational attainment of graduate degree earn the most with the average annual earnings of $56,042, while those with high school diploma education have the smallest earnings of $22,259.
| Educational Attainment | Male Income | Female Income |
| Less than High School | - | - |
| High School Diploma | $29,104 | $22,259 |
| College or Associate's Degree | $45,781 | $26,250 |
| Bachelor's Degree | $63,702 | $46,172 |
| Graduate Degree | - | - |
| Total | $43,063 | $30,000 |
Family Income in Ironwood
Family Income Brackets in Ironwood
According to the Ironwood family income data, there are 206 families falling into the $35,000 to $49,999 income range, which is the most common income bracket and makes up 17.0% of all families. Conversely, the less than $10,000 income bracket is the least frequent group with only 33 families (2.7%) belonging to this category.
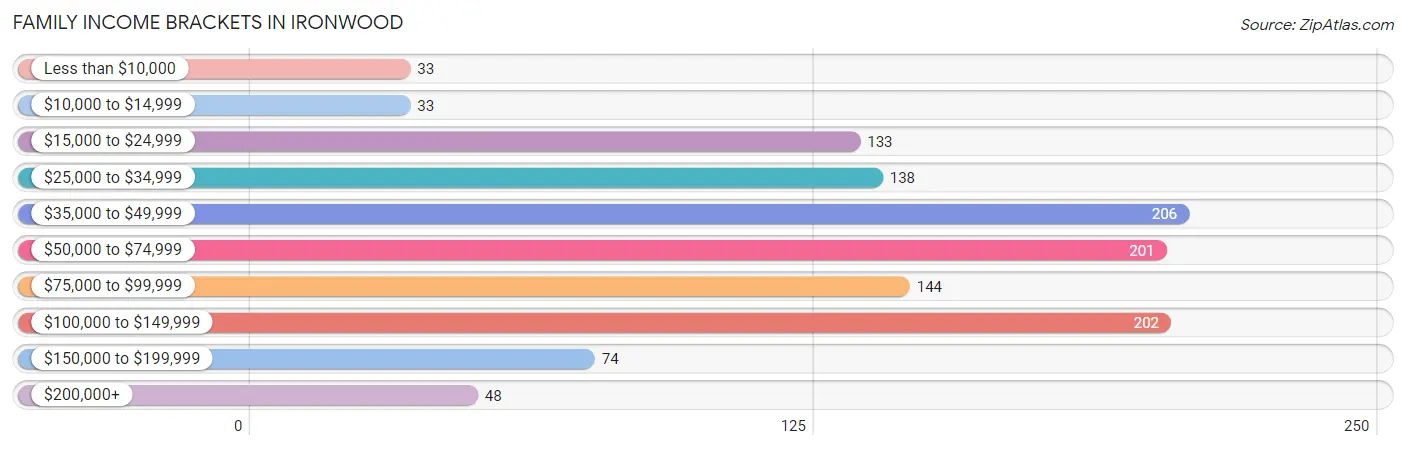
| Income Bracket | # Families | % Families |
| Less than $10,000 | 33 | 2.7% |
| $10,000 to $14,999 | 33 | 2.7% |
| $15,000 to $24,999 | 133 | 11.0% |
| $25,000 to $34,999 | 138 | 11.4% |
| $35,000 to $49,999 | 206 | 17.0% |
| $50,000 to $74,999 | 201 | 16.6% |
| $75,000 to $99,999 | 144 | 11.9% |
| $100,000 to $149,999 | 202 | 16.7% |
| $150,000 to $199,999 | 74 | 6.1% |
| $200,000+ | 48 | 4.0% |
Family Income by Famaliy Size in Ironwood
4-person families (128 | 10.6%) account for the highest median family income in Ironwood with $100,000 per family, while 3-person families (196 | 16.2%) have the highest median income of $27,659 per family member.
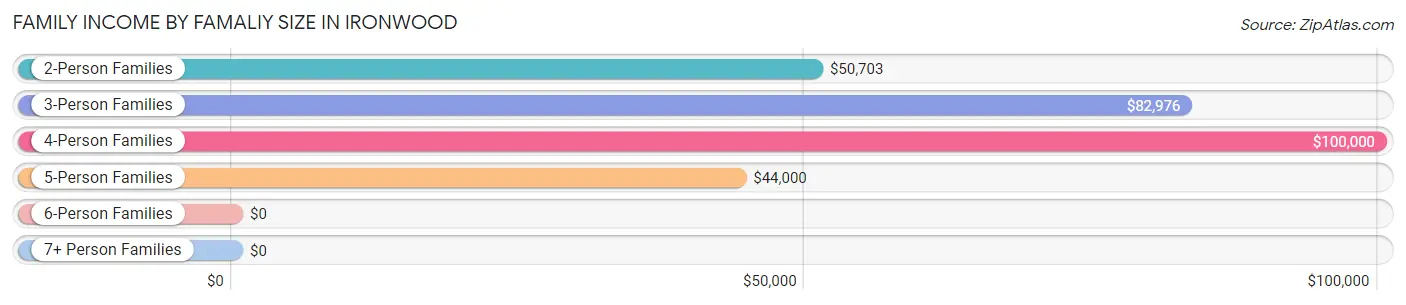
| Income Bracket | # Families | Median Income |
| 2-Person Families | 829 (68.4%) | $50,703 |
| 3-Person Families | 196 (16.2%) | $82,976 |
| 4-Person Families | 128 (10.6%) | $100,000 |
| 5-Person Families | 34 (2.8%) | $44,000 |
| 6-Person Families | 25 (2.1%) | $0 |
| 7+ Person Families | 0 (0.0%) | $0 |
| Total | 1,212 (100.0%) | $55,400 |
Family Income by Number of Earners in Ironwood
The median family income in Ironwood is $55,400, with families comprising 3+ earners (95) having the highest median family income of $129,464, while families with 1 earner (446) have the lowest median family income of $36,862, accounting for 7.8% and 36.8% of families, respectively.
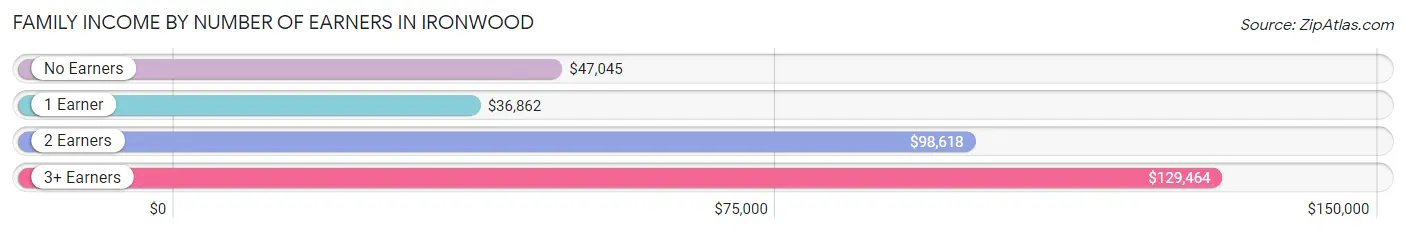
| Number of Earners | # Families | Median Income |
| No Earners | 300 (24.7%) | $47,045 |
| 1 Earner | 446 (36.8%) | $36,862 |
| 2 Earners | 371 (30.6%) | $98,618 |
| 3+ Earners | 95 (7.8%) | $129,464 |
| Total | 1,212 (100.0%) | $55,400 |
Household Income in Ironwood
Household Income Brackets in Ironwood
With 530 households falling in the category, the $25,000 to $34,999 income range is the most frequent in Ironwood, accounting for 20.1% of all households. In contrast, only 61 households (2.3%) fall into the $200,000+ income bracket, making it the least populous group.
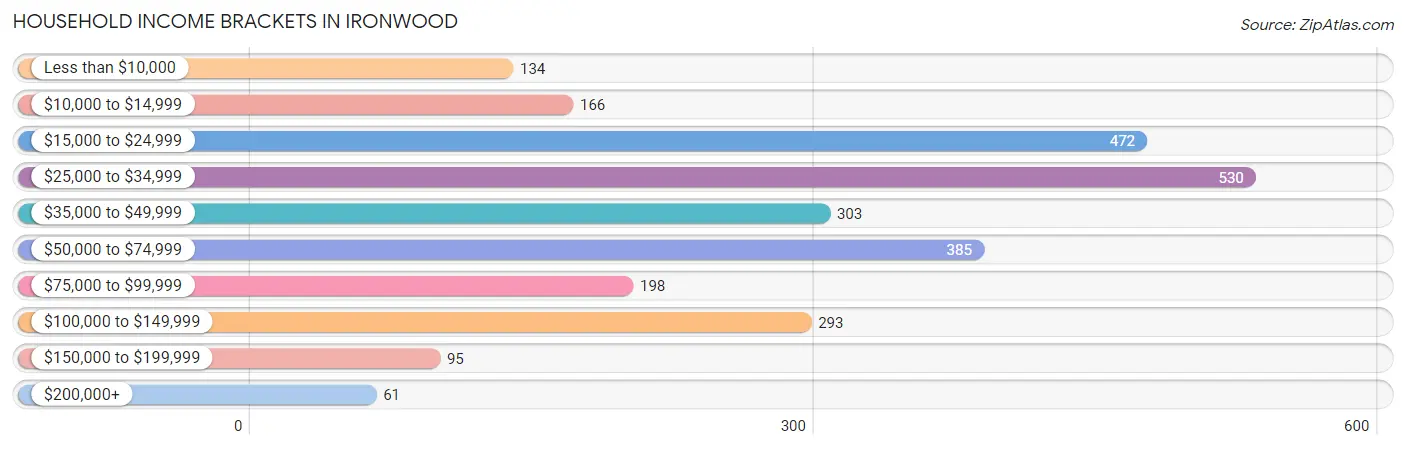
| Income Bracket | # Households | % Households |
| Less than $10,000 | 134 | 5.1% |
| $10,000 to $14,999 | 166 | 6.3% |
| $15,000 to $24,999 | 472 | 17.9% |
| $25,000 to $34,999 | 530 | 20.1% |
| $35,000 to $49,999 | 303 | 11.5% |
| $50,000 to $74,999 | 385 | 14.6% |
| $75,000 to $99,999 | 198 | 7.5% |
| $100,000 to $149,999 | 293 | 11.1% |
| $150,000 to $199,999 | 95 | 3.6% |
| $200,000+ | 61 | 2.3% |
Household Income by Householder Age in Ironwood
The median household income in Ironwood is $35,722, with the highest median household income of $53,750 found in the 45 to 64 years age bracket for the primary householder. A total of 923 households (35.0%) fall into this category. Meanwhile, the 15 to 24 years age bracket for the primary householder has the lowest median household income of $0, with 46 households (1.8%) in this group.
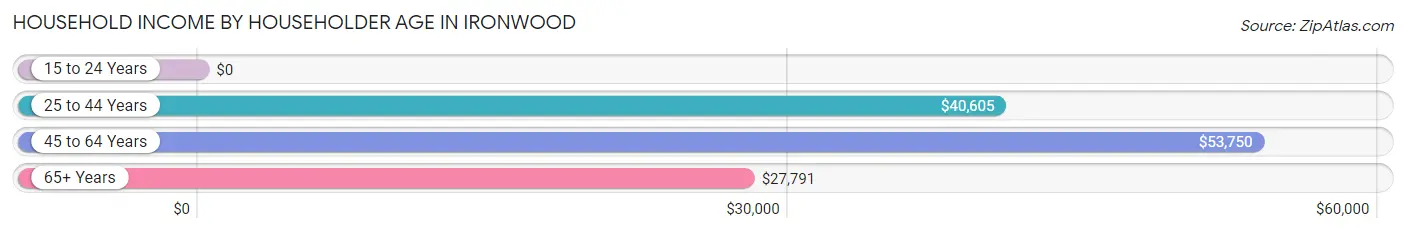
| Income Bracket | # Households | Median Income |
| 15 to 24 Years | 46 (1.8%) | $0 |
| 25 to 44 Years | 711 (27.0%) | $40,605 |
| 45 to 64 Years | 923 (35.0%) | $53,750 |
| 65+ Years | 956 (36.3%) | $27,791 |
| Total | 2,636 (100.0%) | $35,722 |
Poverty in Ironwood
Income Below Poverty by Sex and Age in Ironwood
With 12.6% poverty level for males and 14.6% for females among the residents of Ironwood, 25 to 34 year old males and 5 year old females are the most vulnerable to poverty, with 75 males (31.0%) and 27 females (49.1%) in their respective age groups living below the poverty level.
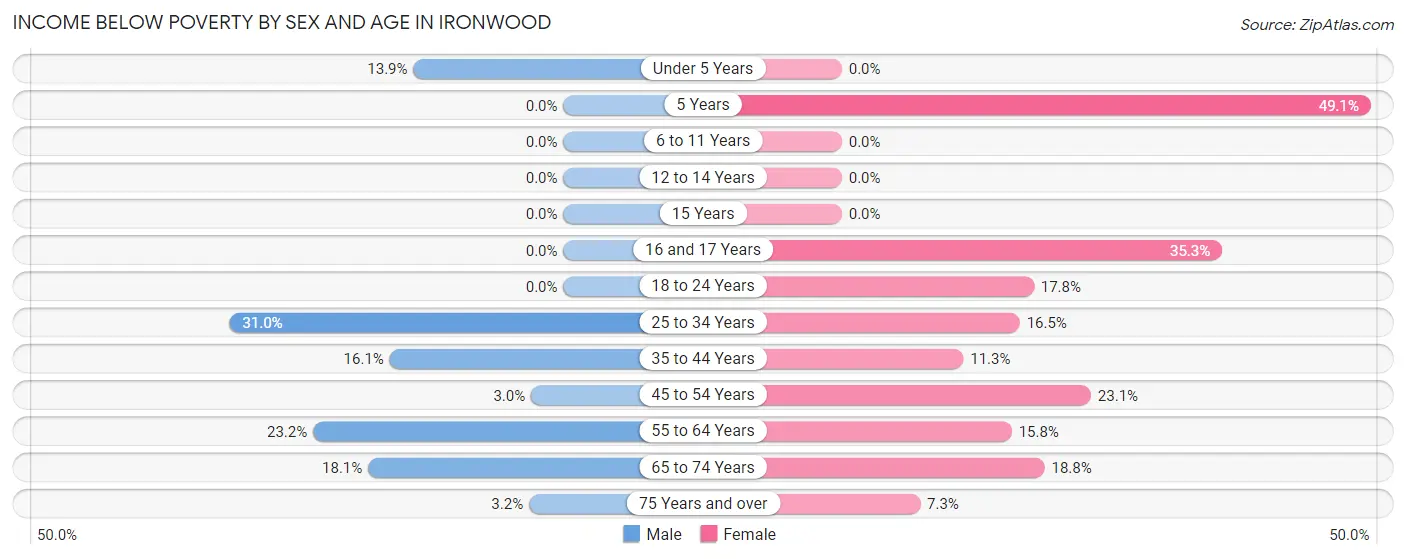
| Age Bracket | Male | Female |
| Under 5 Years | 11 (13.9%) | 0 (0.0%) |
| 5 Years | 0 (0.0%) | 27 (49.1%) |
| 6 to 11 Years | 0 (0.0%) | 0 (0.0%) |
| 12 to 14 Years | 0 (0.0%) | 0 (0.0%) |
| 15 Years | 0 (0.0%) | 0 (0.0%) |
| 16 and 17 Years | 0 (0.0%) | 12 (35.3%) |
| 18 to 24 Years | 0 (0.0%) | 18 (17.8%) |
| 25 to 34 Years | 75 (31.0%) | 71 (16.5%) |
| 35 to 44 Years | 49 (16.1%) | 29 (11.3%) |
| 45 to 54 Years | 10 (3.0%) | 46 (23.1%) |
| 55 to 64 Years | 105 (23.2%) | 76 (15.8%) |
| 65 to 74 Years | 52 (18.1%) | 54 (18.8%) |
| 75 Years and over | 8 (3.2%) | 33 (7.3%) |
| Total | 310 (12.6%) | 366 (14.6%) |
Income Above Poverty by Sex and Age in Ironwood
According to the poverty statistics in Ironwood, males aged 5 years and females aged under 5 years are the age groups that are most secure financially, with 100.0% of males and 100.0% of females in these age groups living above the poverty line.
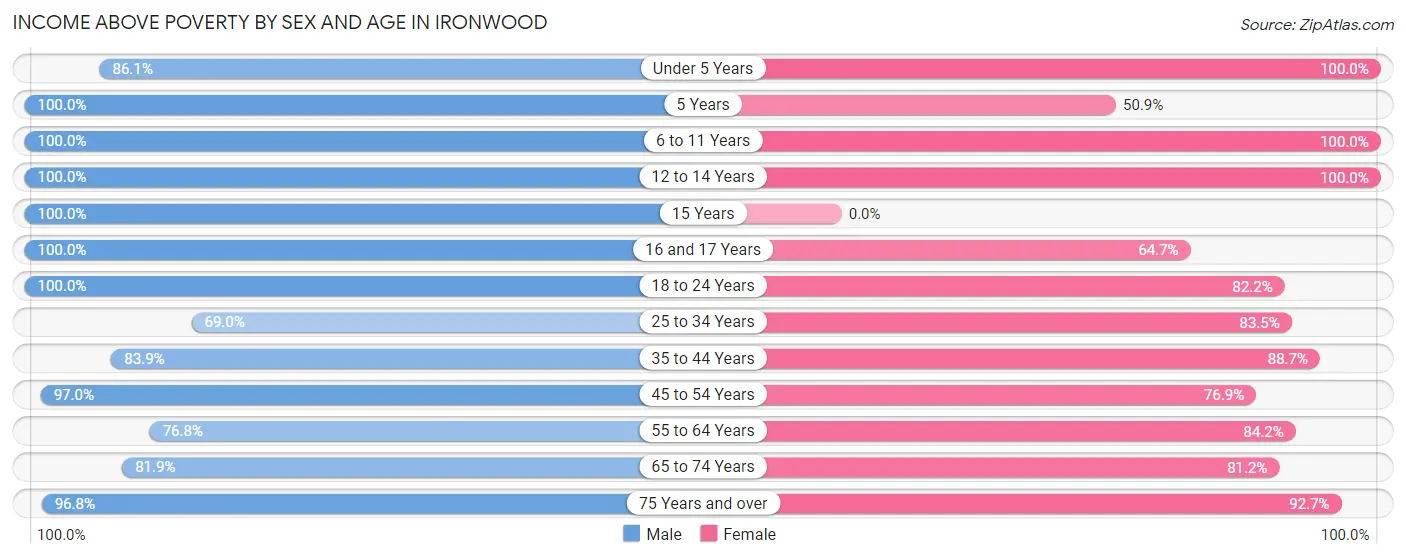
| Age Bracket | Male | Female |
| Under 5 Years | 68 (86.1%) | 57 (100.0%) |
| 5 Years | 40 (100.0%) | 28 (50.9%) |
| 6 to 11 Years | 140 (100.0%) | 102 (100.0%) |
| 12 to 14 Years | 72 (100.0%) | 56 (100.0%) |
| 15 Years | 51 (100.0%) | 0 (0.0%) |
| 16 and 17 Years | 36 (100.0%) | 22 (64.7%) |
| 18 to 24 Years | 182 (100.0%) | 83 (82.2%) |
| 25 to 34 Years | 167 (69.0%) | 359 (83.5%) |
| 35 to 44 Years | 255 (83.9%) | 228 (88.7%) |
| 45 to 54 Years | 323 (97.0%) | 153 (76.9%) |
| 55 to 64 Years | 347 (76.8%) | 406 (84.2%) |
| 65 to 74 Years | 235 (81.9%) | 233 (81.2%) |
| 75 Years and over | 243 (96.8%) | 421 (92.7%) |
| Total | 2,159 (87.4%) | 2,148 (85.4%) |
Income Below Poverty Among Married-Couple Families in Ironwood
The poverty statistics for married-couple families in Ironwood show that 5.6% or 50 of the total 896 families live below the poverty line. Families with 1 or 2 children have the highest poverty rate of 5.9%, comprising of 11 families. On the other hand, families with 3 or 4 children have the lowest poverty rate of 0.0%, which includes 0 families.
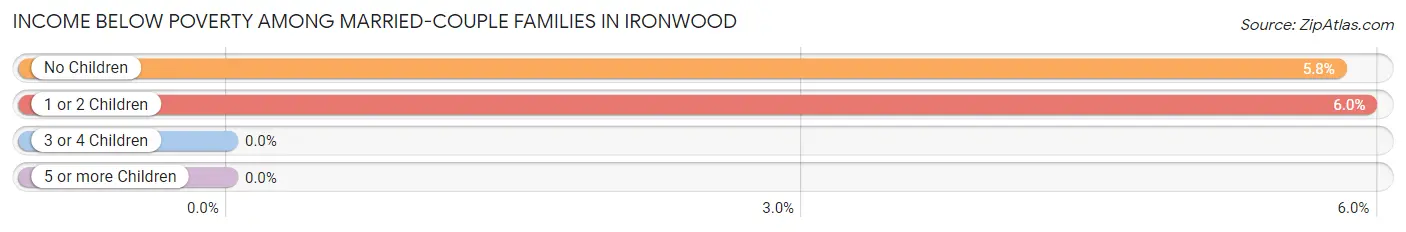
| Children | Above Poverty | Below Poverty |
| No Children | 635 (94.2%) | 39 (5.8%) |
| 1 or 2 Children | 174 (94.1%) | 11 (5.9%) |
| 3 or 4 Children | 37 (100.0%) | 0 (0.0%) |
| 5 or more Children | 0 (0.0%) | 0 (0.0%) |
| Total | 846 (94.4%) | 50 (5.6%) |
Income Below Poverty Among Single-Parent Households in Ironwood
According to the poverty data in Ironwood, 28.6% or 14 single-father households and 7.5% or 20 single-mother households are living below the poverty line. Among single-father households, those with no children have the highest poverty rate, with 8 households (100.0%) experiencing poverty. Likewise, among single-mother households, those with 1 or 2 children have the highest poverty rate, with 20 households (10.7%) falling below the poverty line.
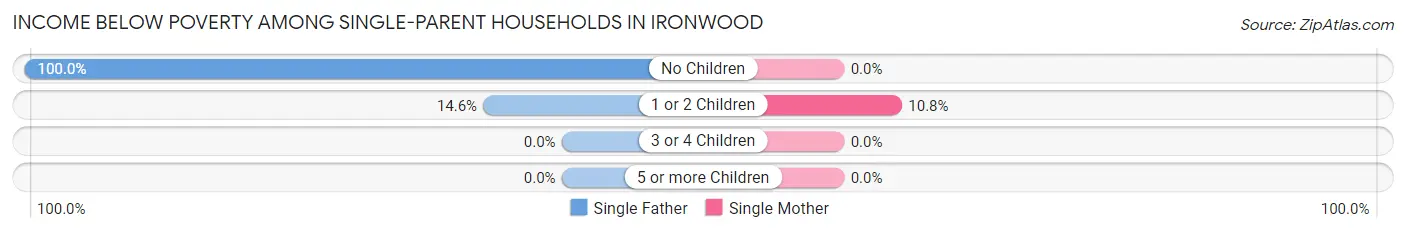
| Children | Single Father | Single Mother |
| No Children | 8 (100.0%) | 0 (0.0%) |
| 1 or 2 Children | 6 (14.6%) | 20 (10.7%) |
| 3 or 4 Children | 0 (0.0%) | 0 (0.0%) |
| 5 or more Children | 0 (0.0%) | 0 (0.0%) |
| Total | 14 (28.6%) | 20 (7.5%) |
Income Below Poverty Among Married-Couple vs Single-Parent Households in Ironwood
The poverty data for Ironwood shows that 50 of the married-couple family households (5.6%) and 34 of the single-parent households (10.8%) are living below the poverty level. Within the married-couple family households, those with 1 or 2 children have the highest poverty rate, with 11 households (5.9%) falling below the poverty line. Among the single-parent households, those with 1 or 2 children have the highest poverty rate, with 26 household (11.5%) living below poverty.
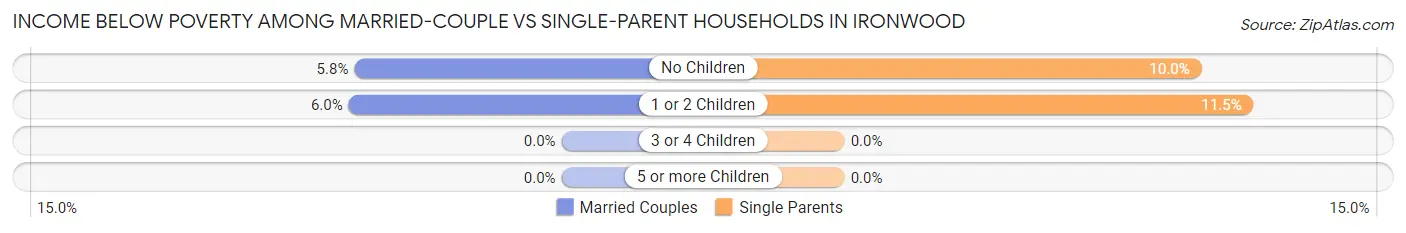
| Children | Married-Couple Families | Single-Parent Households |
| No Children | 39 (5.8%) | 8 (10.0%) |
| 1 or 2 Children | 11 (5.9%) | 26 (11.5%) |
| 3 or 4 Children | 0 (0.0%) | 0 (0.0%) |
| 5 or more Children | 0 (0.0%) | 0 (0.0%) |
| Total | 50 (5.6%) | 34 (10.8%) |
Race in Ironwood
The most populous races in Ironwood are White / Caucasian (4,892 | 96.2%), Hispanic or Latino (153 | 3.0%), and Two or more Races (71 | 1.4%).
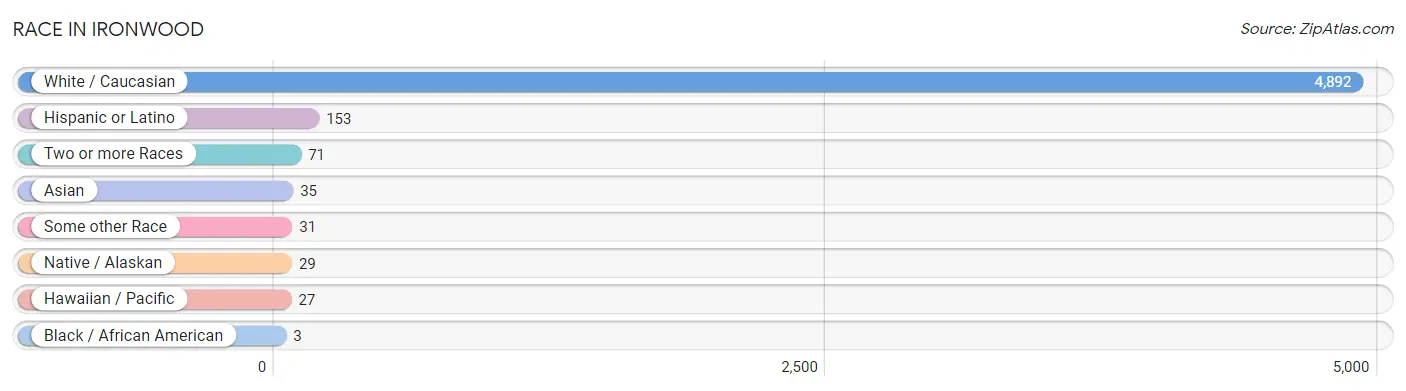
| Race | # Population | % Population |
| Asian | 35 | 0.7% |
| Black / African American | 3 | 0.1% |
| Hawaiian / Pacific | 27 | 0.5% |
| Hispanic or Latino | 153 | 3.0% |
| Native / Alaskan | 29 | 0.6% |
| White / Caucasian | 4,892 | 96.2% |
| Two or more Races | 71 | 1.4% |
| Some other Race | 31 | 0.6% |
| Total | 5,088 | 100.0% |
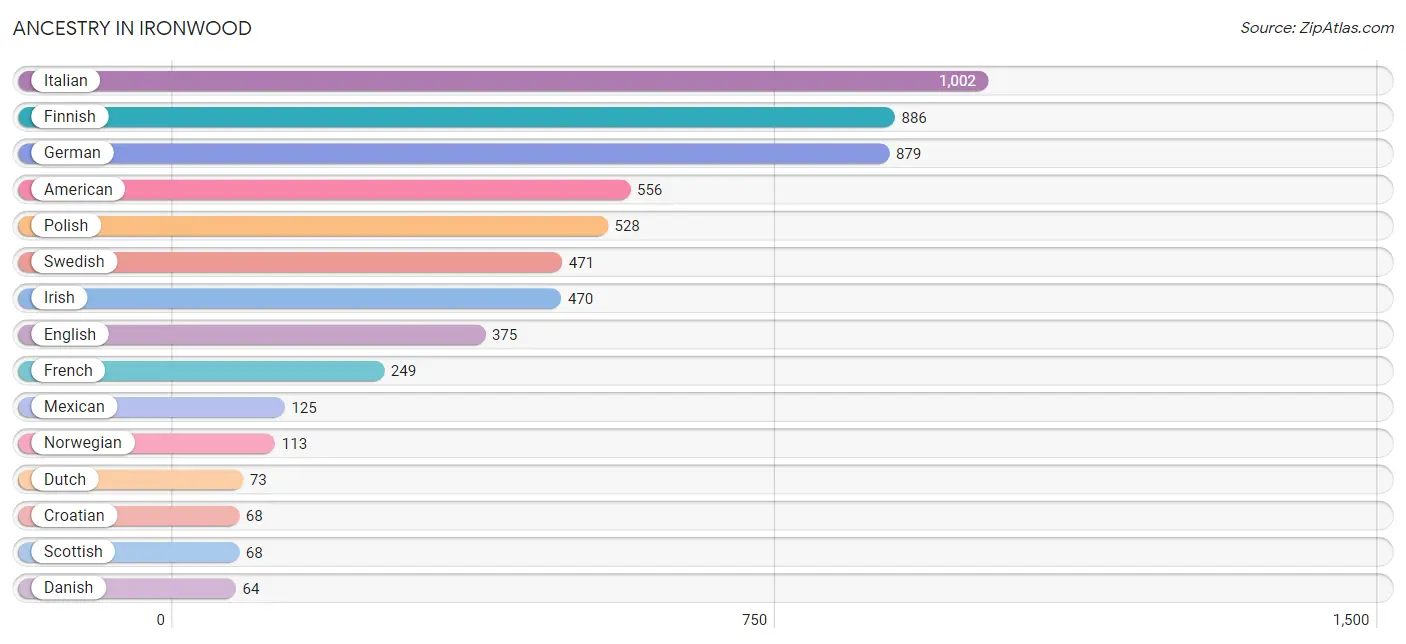
Ancestry in Ironwood
The most populous ancestries reported in Ironwood are Italian (1,002 | 19.7%), Finnish (886 | 17.4%), German (879 | 17.3%), American (556 | 10.9%), and Polish (528 | 10.4%), together accounting for 75.7% of all Ironwood residents.
| Ancestry | # Population | % Population |
| American | 556 | 10.9% |
| Austrian | 26 | 0.5% |
| Belgian | 34 | 0.7% |
| Burmese | 17 | 0.3% |
| Chippewa | 37 | 0.7% |
| Croatian | 68 | 1.3% |
| Cuban | 9 | 0.2% |
| Czech | 11 | 0.2% |
| Czechoslovakian | 13 | 0.3% |
| Danish | 64 | 1.3% |
| Dutch | 73 | 1.4% |
| Eastern European | 11 | 0.2% |
| English | 375 | 7.4% |
| European | 61 | 1.2% |
| Finnish | 886 | 17.4% |
| French | 249 | 4.9% |
| French Canadian | 23 | 0.4% |
| German | 879 | 17.3% |
| Irish | 470 | 9.2% |
| Iroquois | 17 | 0.3% |
| Italian | 1,002 | 19.7% |
| Mexican | 125 | 2.5% |
| Native Hawaiian | 29 | 0.6% |
| Northern European | 20 | 0.4% |
| Norwegian | 113 | 2.2% |
| Polish | 528 | 10.4% |
| Puerto Rican | 12 | 0.2% |
| Romanian | 9 | 0.2% |
| Samoan | 9 | 0.2% |
| Scandinavian | 5 | 0.1% |
| Scotch-Irish | 64 | 1.3% |
| Scottish | 68 | 1.3% |
| Serbian | 22 | 0.4% |
| Slavic | 6 | 0.1% |
| Slovak | 37 | 0.7% |
| Spaniard | 7 | 0.1% |
| Swedish | 471 | 9.3% |
| Swiss | 12 | 0.2% |
| Thai | 30 | 0.6% |
| Yugoslavian | 22 | 0.4% | View All 40 Rows |
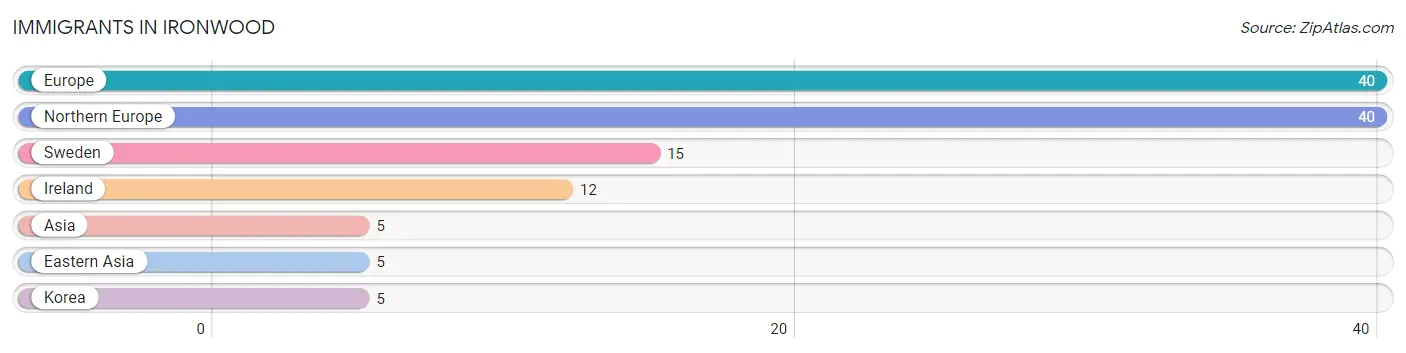
Immigrants in Ironwood
The most numerous immigrant groups reported in Ironwood came from Europe (40 | 0.8%), Northern Europe (40 | 0.8%), Sweden (15 | 0.3%), Ireland (12 | 0.2%), and Asia (5 | 0.1%), together accounting for 2.2% of all Ironwood residents.
| Immigration Origin | # Population | % Population |
| Asia | 5 | 0.1% |
| Eastern Asia | 5 | 0.1% |
| Europe | 40 | 0.8% |
| Ireland | 12 | 0.2% |
| Korea | 5 | 0.1% |
| Northern Europe | 40 | 0.8% |
| Sweden | 15 | 0.3% | View All 7 Rows |
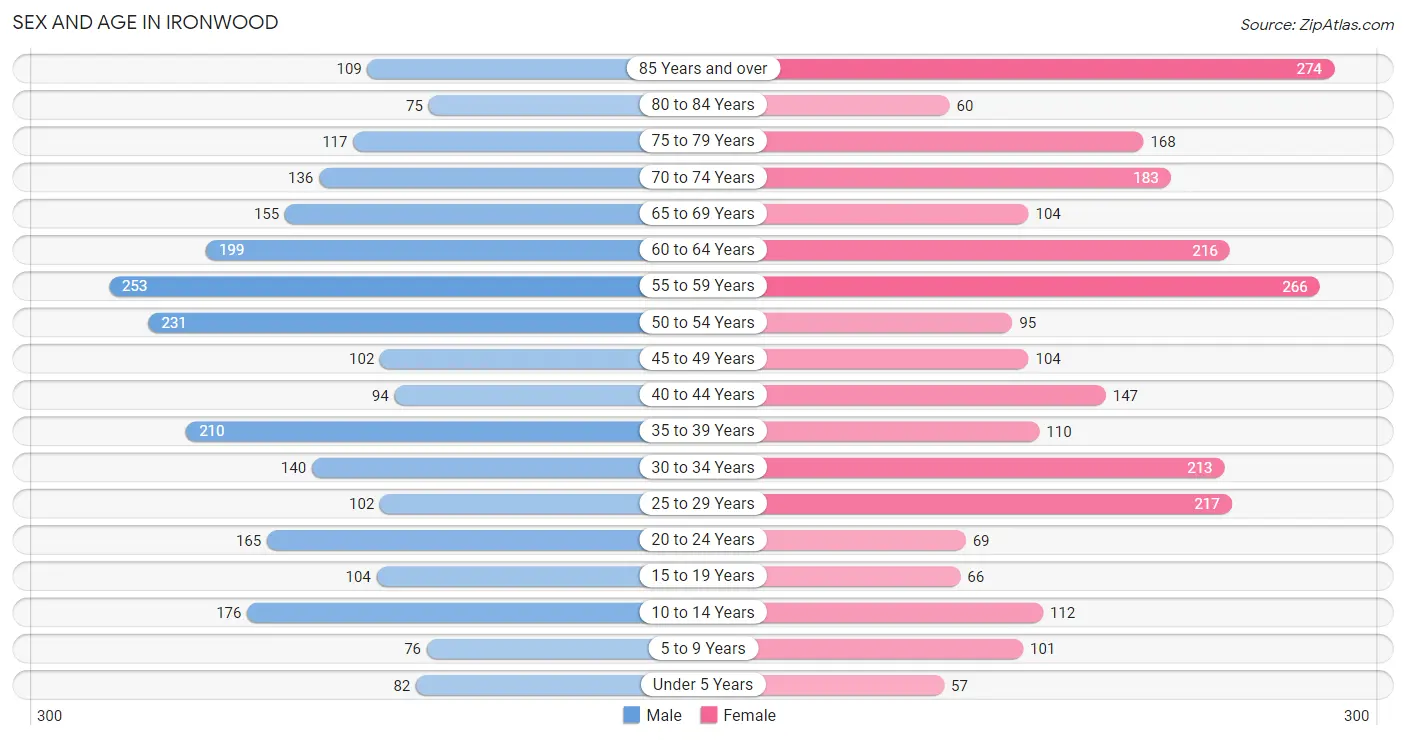
Sex and Age in Ironwood
Sex and Age in Ironwood
The most populous age groups in Ironwood are 55 to 59 Years (253 | 10.0%) for men and 85 Years and over (274 | 10.7%) for women.
| Age Bracket | Male | Female |
| Under 5 Years | 82 (3.3%) | 57 (2.2%) |
| 5 to 9 Years | 76 (3.0%) | 101 (3.9%) |
| 10 to 14 Years | 176 (7.0%) | 112 (4.4%) |
| 15 to 19 Years | 104 (4.1%) | 66 (2.6%) |
| 20 to 24 Years | 165 (6.5%) | 69 (2.7%) |
| 25 to 29 Years | 102 (4.0%) | 217 (8.5%) |
| 30 to 34 Years | 140 (5.5%) | 213 (8.3%) |
| 35 to 39 Years | 210 (8.3%) | 110 (4.3%) |
| 40 to 44 Years | 94 (3.7%) | 147 (5.7%) |
| 45 to 49 Years | 102 (4.0%) | 104 (4.1%) |
| 50 to 54 Years | 231 (9.1%) | 95 (3.7%) |
| 55 to 59 Years | 253 (10.0%) | 266 (10.4%) |
| 60 to 64 Years | 199 (7.9%) | 216 (8.4%) |
| 65 to 69 Years | 155 (6.1%) | 104 (4.1%) |
| 70 to 74 Years | 136 (5.4%) | 183 (7.1%) |
| 75 to 79 Years | 117 (4.6%) | 168 (6.6%) |
| 80 to 84 Years | 75 (3.0%) | 60 (2.3%) |
| 85 Years and over | 109 (4.3%) | 274 (10.7%) |
| Total | 2,526 (100.0%) | 2,562 (100.0%) |
Families and Households in Ironwood
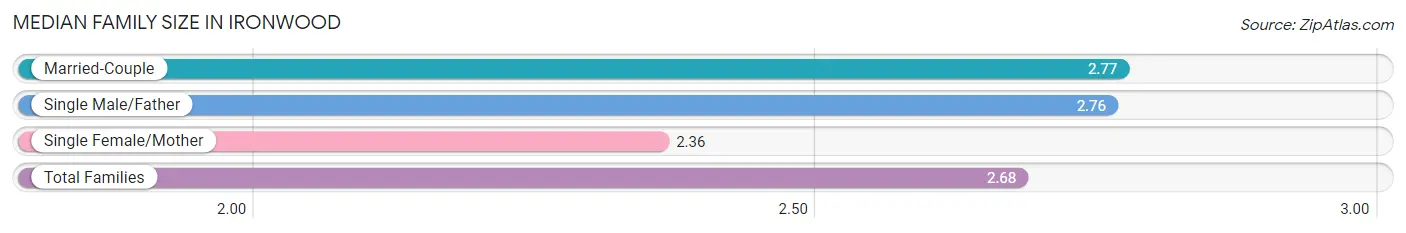
Median Family Size in Ironwood
The median family size in Ironwood is 2.68 persons per family, with married-couple families (896 | 73.9%) accounting for the largest median family size of 2.77 persons per family. On the other hand, single female/mother families (267 | 22.0%) represent the smallest median family size with 2.36 persons per family.
| Family Type | # Families | Family Size |
| Married-Couple | 896 (73.9%) | 2.77 |
| Single Male/Father | 49 (4.0%) | 2.76 |
| Single Female/Mother | 267 (22.0%) | 2.36 |
| Total Families | 1,212 (100.0%) | 2.68 |
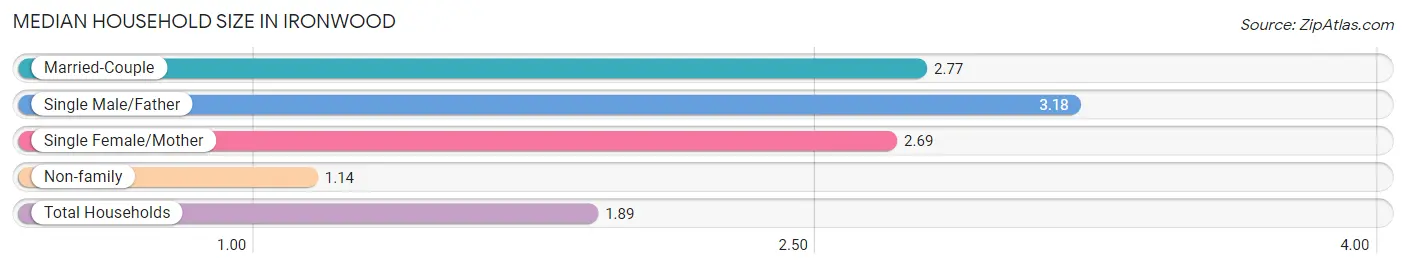
Median Household Size in Ironwood
The median household size in Ironwood is 1.89 persons per household, with single male/father households (49 | 1.9%) accounting for the largest median household size of 3.18 persons per household. non-family households (1,424 | 54.0%) represent the smallest median household size with 1.14 persons per household.
| Household Type | # Households | Household Size |
| Married-Couple | 896 (34.0%) | 2.77 |
| Single Male/Father | 49 (1.9%) | 3.18 |
| Single Female/Mother | 267 (10.1%) | 2.69 |
| Non-family | 1,424 (54.0%) | 1.14 |
| Total Households | 2,636 (100.0%) | 1.89 |
Household Size by Marriage Status in Ironwood
Out of a total of 2,636 households in Ironwood, 1,212 (46.0%) are family households, while 1,424 (54.0%) are nonfamily households. The most numerous type of family households are 2-person households, comprising 741, and the most common type of nonfamily households are 1-person households, comprising 1,233.
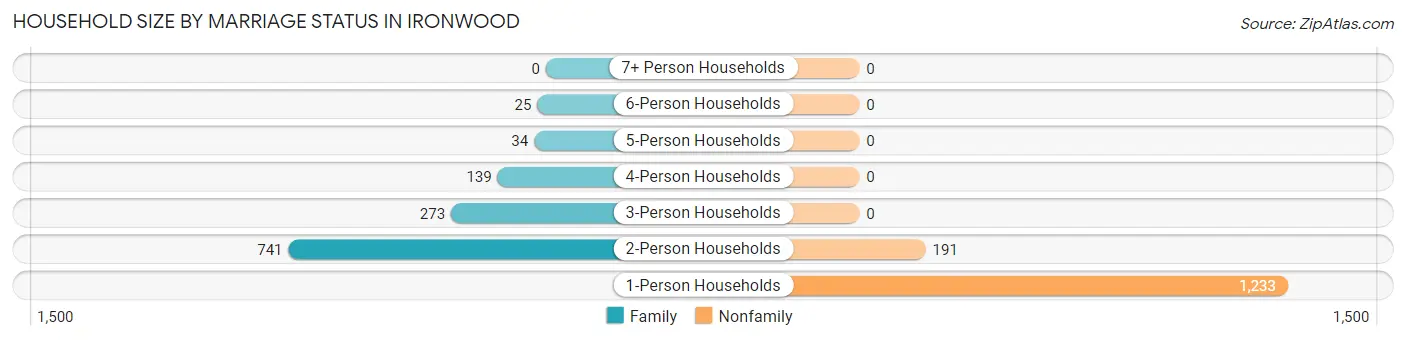
| Household Size | Family Households | Nonfamily Households |
| 1-Person Households | - | 1,233 (46.8%) |
| 2-Person Households | 741 (28.1%) | 191 (7.2%) |
| 3-Person Households | 273 (10.4%) | 0 (0.0%) |
| 4-Person Households | 139 (5.3%) | 0 (0.0%) |
| 5-Person Households | 34 (1.3%) | 0 (0.0%) |
| 6-Person Households | 25 (0.9%) | 0 (0.0%) |
| 7+ Person Households | 0 (0.0%) | 0 (0.0%) |
| Total | 1,212 (46.0%) | 1,424 (54.0%) |
Female Fertility in Ironwood
Fertility by Age in Ironwood
Average fertility rate in Ironwood is 54.0 births per 1,000 women. Women in the age bracket of 20 to 34 years have the highest fertility rate with 100.0 births per 1,000 women. Women in the age bracket of 20 to 34 years acount for 100.0% of all women with births.
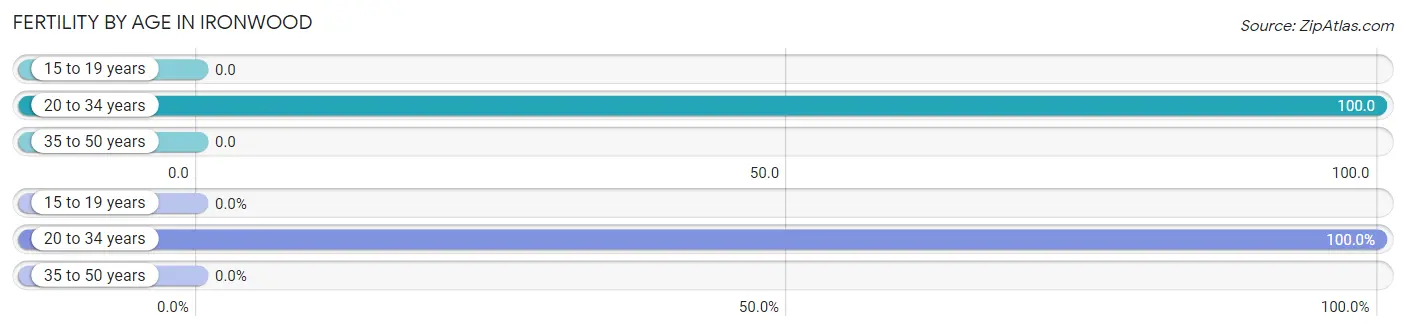
| Age Bracket | Women with Births | Births / 1,000 Women |
| 15 to 19 years | 0 (0.0%) | 0.0 |
| 20 to 34 years | 50 (100.0%) | 100.0 |
| 35 to 50 years | 0 (0.0%) | 0.0 |
| Total | 50 (100.0%) | 54.0 |
Fertility by Age by Marriage Status in Ironwood
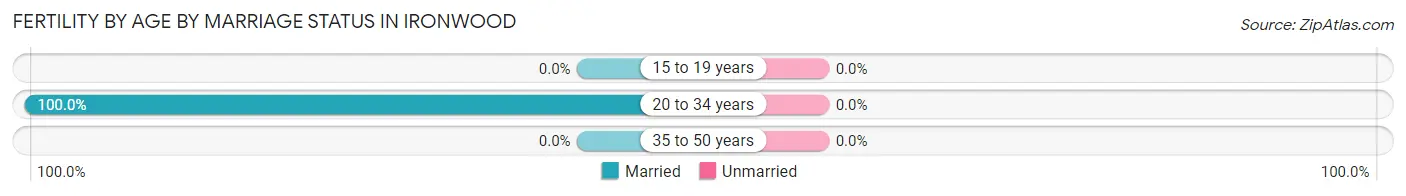
| Age Bracket | Married | Unmarried |
| 15 to 19 years | 0 (0.0%) | 0 (0.0%) |
| 20 to 34 years | 50 (100.0%) | 0 (0.0%) |
| 35 to 50 years | 0 (0.0%) | 0 (0.0%) |
| Total | 50 (100.0%) | 0 (0.0%) |
Fertility by Education in Ironwood
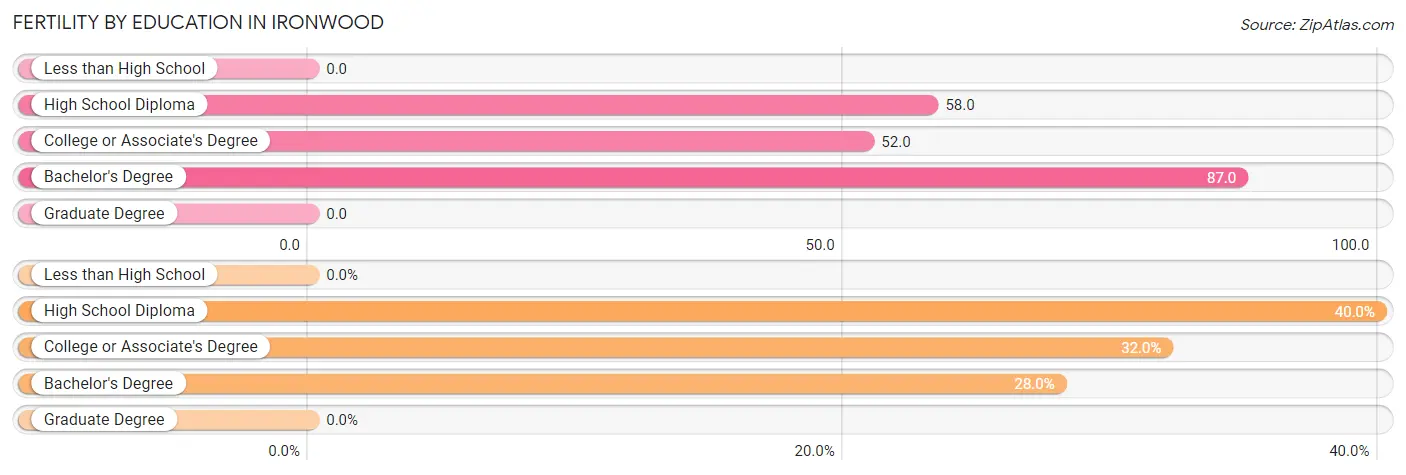
| Educational Attainment | Women with Births | Births / 1,000 Women |
| Less than High School | 0 (0.0%) | 0.0 |
| High School Diploma | 20 (40.0%) | 58.0 |
| College or Associate's Degree | 16 (32.0%) | 52.0 |
| Bachelor's Degree | 14 (28.0%) | 87.0 |
| Graduate Degree | 0 (0.0%) | 0.0 |
| Total | 50 (100.0%) | 54.0 |
Fertility by Education by Marriage Status in Ironwood
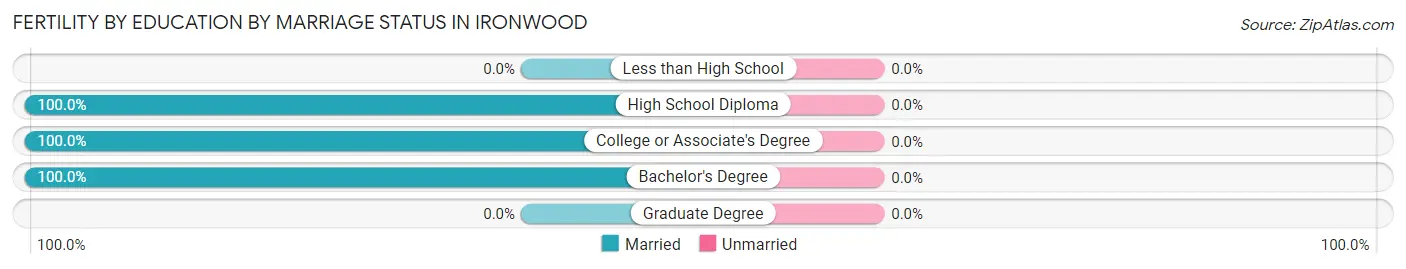
| Educational Attainment | Married | Unmarried |
| Less than High School | 0 (0.0%) | 0 (0.0%) |
| High School Diploma | 20 (100.0%) | 0 (0.0%) |
| College or Associate's Degree | 16 (100.0%) | 0 (0.0%) |
| Bachelor's Degree | 14 (100.0%) | 0 (0.0%) |
| Graduate Degree | 0 (0.0%) | 0 (0.0%) |
| Total | 50 (100.0%) | 0 (0.0%) |
Employment Characteristics in Ironwood
Employment by Class of Employer in Ironwood
Among the 2,036 employed individuals in Ironwood, private company employees (1,503 | 73.8%), local government employees (186 | 9.1%), and state government employees (104 | 5.1%) make up the most common classes of employment.
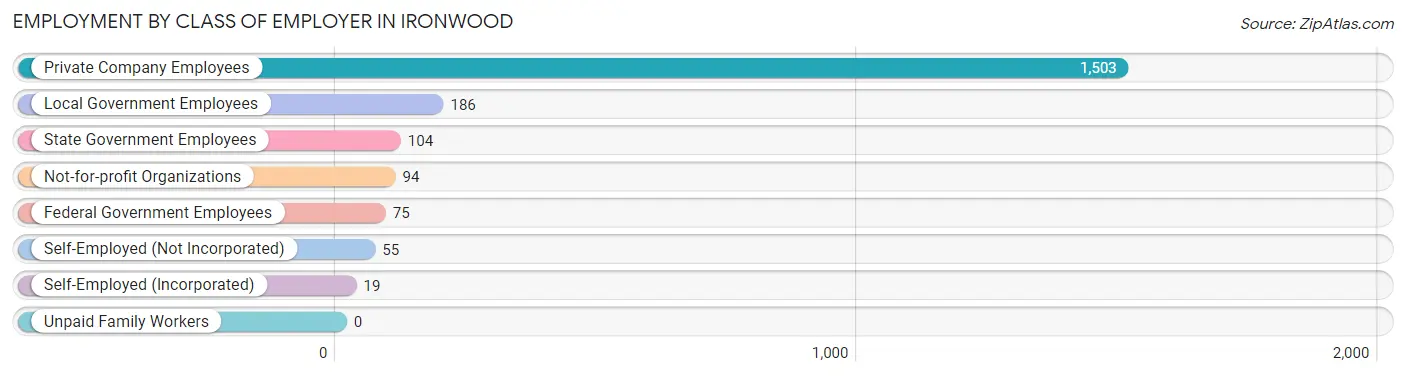
| Employer Class | # Employees | % Employees |
| Private Company Employees | 1,503 | 73.8% |
| Self-Employed (Incorporated) | 19 | 0.9% |
| Self-Employed (Not Incorporated) | 55 | 2.7% |
| Not-for-profit Organizations | 94 | 4.6% |
| Local Government Employees | 186 | 9.1% |
| State Government Employees | 104 | 5.1% |
| Federal Government Employees | 75 | 3.7% |
| Unpaid Family Workers | 0 | 0.0% |
| Total | 2,036 | 100.0% |
Employment Status by Age in Ironwood
According to the labor force statistics for Ironwood, out of the total population over 16 years of age (4,433), 52.1% or 2,310 individuals are in the labor force, with 10.8% or 249 of them unemployed. The age group with the highest labor force participation rate is 25 to 29 years, with 90.9% or 290 individuals in the labor force. Within the labor force, the 60 to 64 years age range has the highest percentage of unemployed individuals, with 26.0% or 56 of them being unemployed.
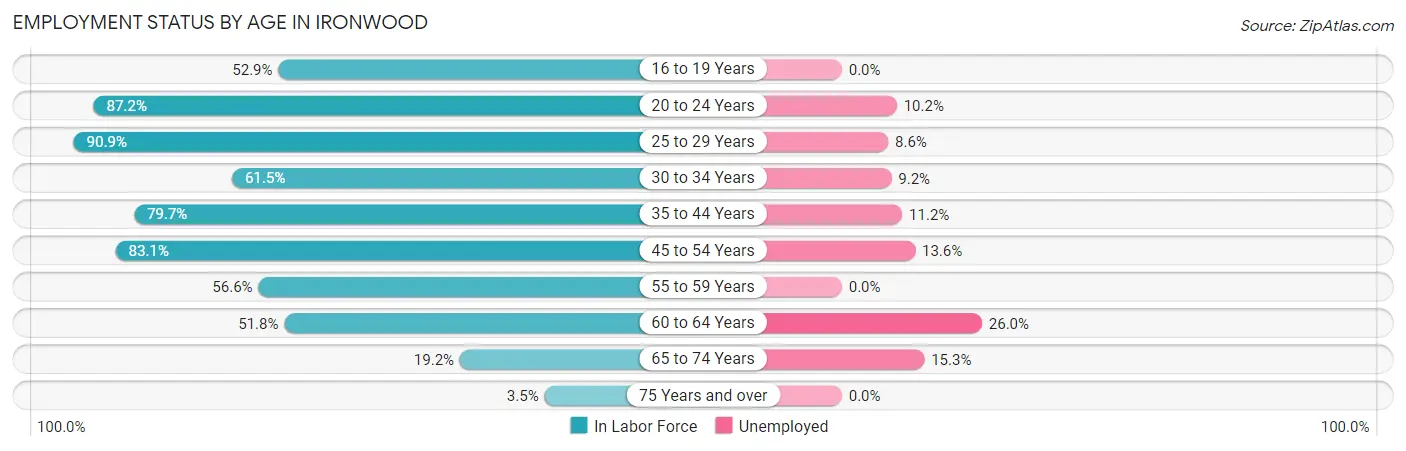
| Age Bracket | In Labor Force | Unemployed |
| 16 to 19 Years | 63 (52.9%) | 0 (0.0%) |
| 20 to 24 Years | 204 (87.2%) | 21 (10.2%) |
| 25 to 29 Years | 290 (90.9%) | 25 (8.6%) |
| 30 to 34 Years | 217 (61.5%) | 20 (9.2%) |
| 35 to 44 Years | 447 (79.7%) | 50 (11.2%) |
| 45 to 54 Years | 442 (83.1%) | 60 (13.6%) |
| 55 to 59 Years | 294 (56.6%) | 0 (0.0%) |
| 60 to 64 Years | 215 (51.8%) | 56 (26.0%) |
| 65 to 74 Years | 111 (19.2%) | 17 (15.3%) |
| 75 Years and over | 28 (3.5%) | 0 (0.0%) |
| Total | 2,310 (52.1%) | 249 (10.8%) |
Employment Status by Educational Attainment in Ironwood
According to labor force statistics for Ironwood, 70.6% of individuals (1,905) out of the total population between 25 and 64 years of age (2,699) are in the labor force, with 11.1% or 211 of them being unemployed. The group with the highest labor force participation rate are those with the educational attainment of bachelor's degree or higher, with 85.7% or 490 individuals in the labor force. Within the labor force, individuals with less than high school education have the highest percentage of unemployment, with 41.9% or 13 of them being unemployed.
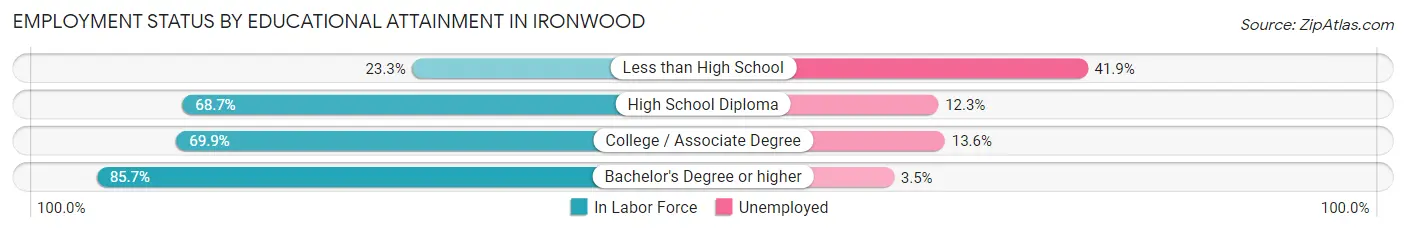
| Educational Attainment | In Labor Force | Unemployed |
| Less than High School | 31 (23.3%) | 56 (41.9%) |
| High School Diploma | 560 (68.7%) | 100 (12.3%) |
| College / Associate Degree | 824 (69.9%) | 160 (13.6%) |
| Bachelor's Degree or higher | 490 (85.7%) | 20 (3.5%) |
| Total | 1,905 (70.6%) | 300 (11.1%) |
Employment Occupations by Sex in Ironwood
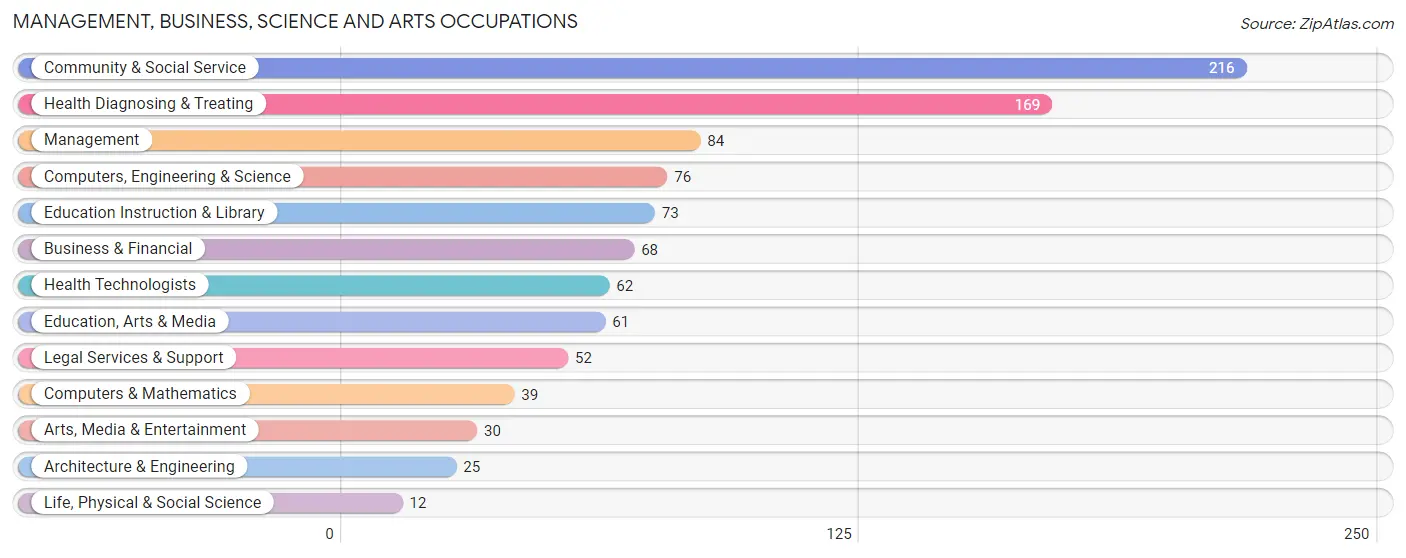
Management, Business, Science and Arts Occupations
The most common Management, Business, Science and Arts occupations in Ironwood are Community & Social Service (216 | 10.5%), Health Diagnosing & Treating (169 | 8.3%), Management (84 | 4.1%), Computers, Engineering & Science (76 | 3.7%), and Education Instruction & Library (73 | 3.6%).
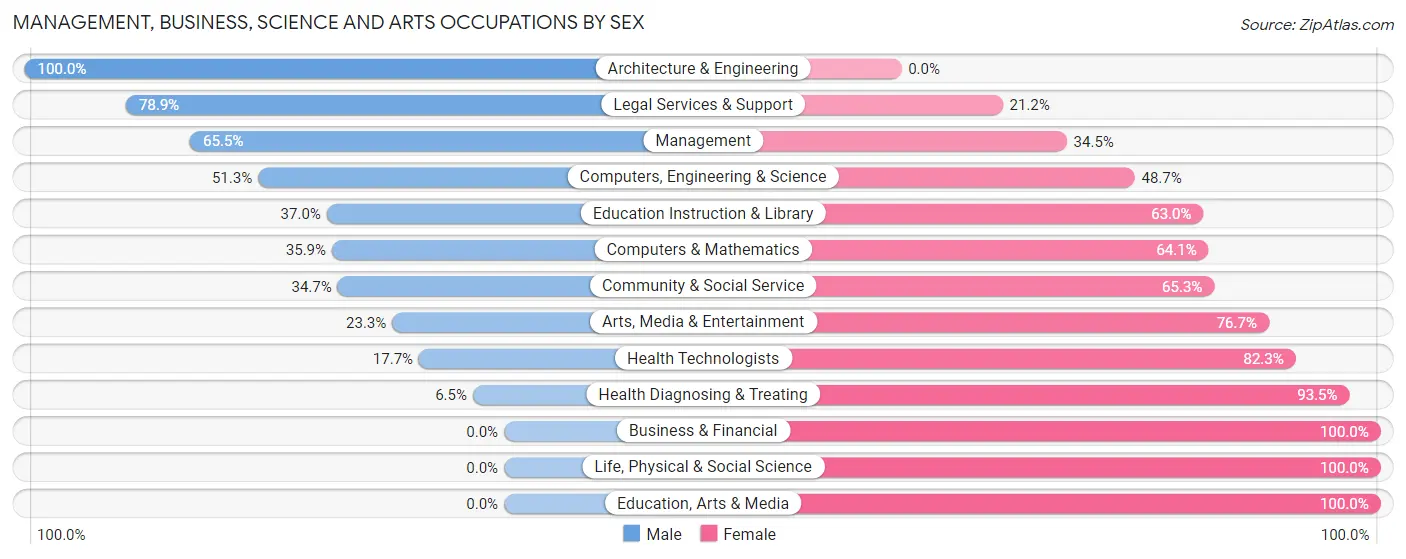
Management, Business, Science and Arts Occupations by Sex
Within the Management, Business, Science and Arts occupations in Ironwood, the most male-oriented occupations are Architecture & Engineering (100.0%), Legal Services & Support (78.8%), and Management (65.5%), while the most female-oriented occupations are Business & Financial (100.0%), Life, Physical & Social Science (100.0%), and Education, Arts & Media (100.0%).
| Occupation | Male | Female |
| Management | 55 (65.5%) | 29 (34.5%) |
| Business & Financial | 0 (0.0%) | 68 (100.0%) |
| Computers, Engineering & Science | 39 (51.3%) | 37 (48.7%) |
| Computers & Mathematics | 14 (35.9%) | 25 (64.1%) |
| Architecture & Engineering | 25 (100.0%) | 0 (0.0%) |
| Life, Physical & Social Science | 0 (0.0%) | 12 (100.0%) |
| Community & Social Service | 75 (34.7%) | 141 (65.3%) |
| Education, Arts & Media | 0 (0.0%) | 61 (100.0%) |
| Legal Services & Support | 41 (78.8%) | 11 (21.1%) |
| Education Instruction & Library | 27 (37.0%) | 46 (63.0%) |
| Arts, Media & Entertainment | 7 (23.3%) | 23 (76.7%) |
| Health Diagnosing & Treating | 11 (6.5%) | 158 (93.5%) |
| Health Technologists | 11 (17.7%) | 51 (82.3%) |
| Total (Category) | 180 (29.4%) | 433 (70.6%) |
| Total (Overall) | 997 (48.7%) | 1,050 (51.3%) |
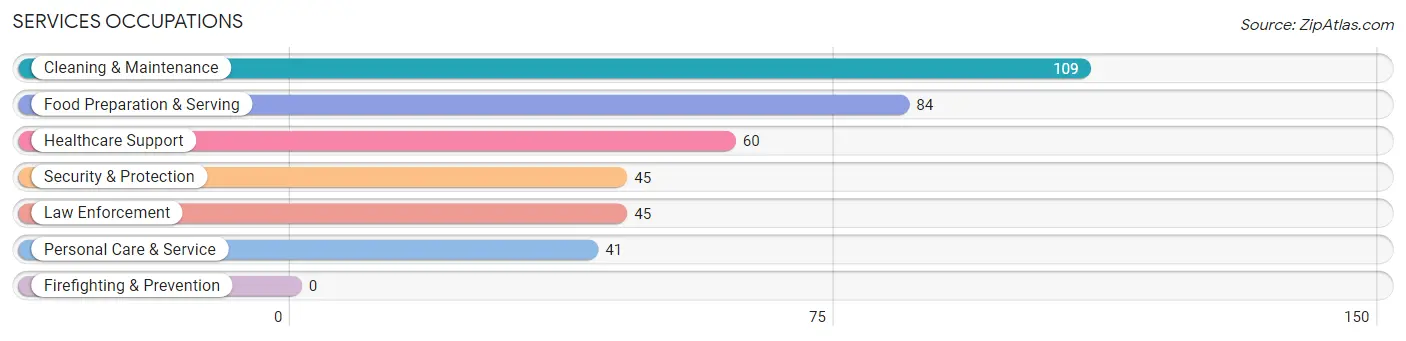
Services Occupations
The most common Services occupations in Ironwood are Cleaning & Maintenance (109 | 5.3%), Food Preparation & Serving (84 | 4.1%), Healthcare Support (60 | 2.9%), Security & Protection (45 | 2.2%), and Law Enforcement (45 | 2.2%).
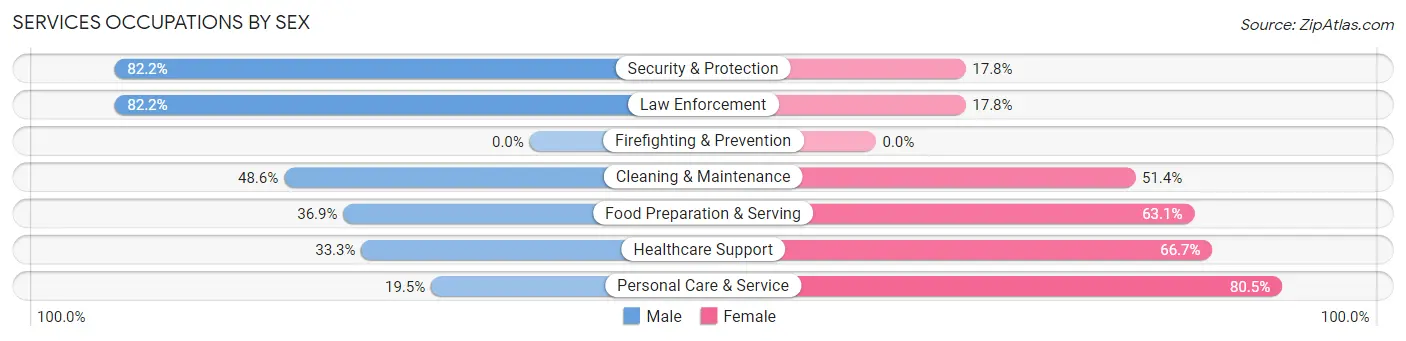
Services Occupations by Sex
Within the Services occupations in Ironwood, the most male-oriented occupations are Security & Protection (82.2%), Law Enforcement (82.2%), and Cleaning & Maintenance (48.6%), while the most female-oriented occupations are Personal Care & Service (80.5%), Healthcare Support (66.7%), and Food Preparation & Serving (63.1%).
| Occupation | Male | Female |
| Healthcare Support | 20 (33.3%) | 40 (66.7%) |
| Security & Protection | 37 (82.2%) | 8 (17.8%) |
| Firefighting & Prevention | 0 (0.0%) | 0 (0.0%) |
| Law Enforcement | 37 (82.2%) | 8 (17.8%) |
| Food Preparation & Serving | 31 (36.9%) | 53 (63.1%) |
| Cleaning & Maintenance | 53 (48.6%) | 56 (51.4%) |
| Personal Care & Service | 8 (19.5%) | 33 (80.5%) |
| Total (Category) | 149 (44.0%) | 190 (56.0%) |
| Total (Overall) | 997 (48.7%) | 1,050 (51.3%) |
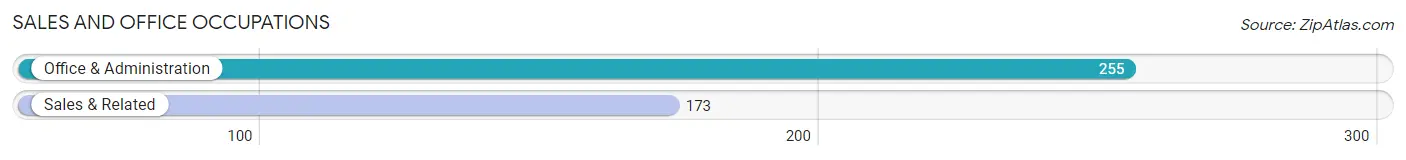
Sales and Office Occupations
The most common Sales and Office occupations in Ironwood are Office & Administration (255 | 12.5%), and Sales & Related (173 | 8.5%).
Sales and Office Occupations by Sex
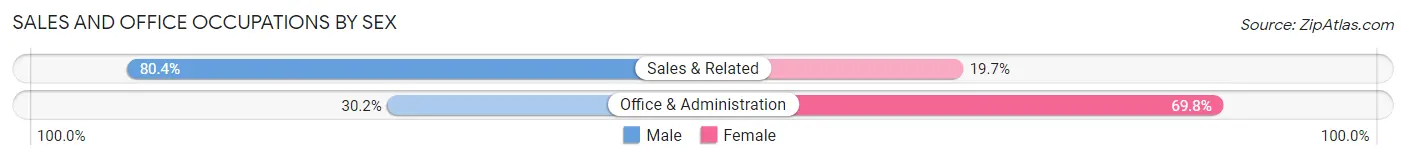
| Occupation | Male | Female |
| Sales & Related | 139 (80.3%) | 34 (19.7%) |
| Office & Administration | 77 (30.2%) | 178 (69.8%) |
| Total (Category) | 216 (50.5%) | 212 (49.5%) |
| Total (Overall) | 997 (48.7%) | 1,050 (51.3%) |
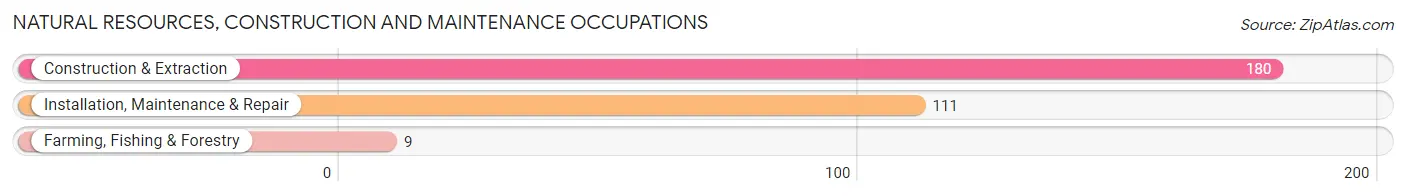
Natural Resources, Construction and Maintenance Occupations
The most common Natural Resources, Construction and Maintenance occupations in Ironwood are Construction & Extraction (180 | 8.8%), Installation, Maintenance & Repair (111 | 5.4%), and Farming, Fishing & Forestry (9 | 0.4%).
Natural Resources, Construction and Maintenance Occupations by Sex
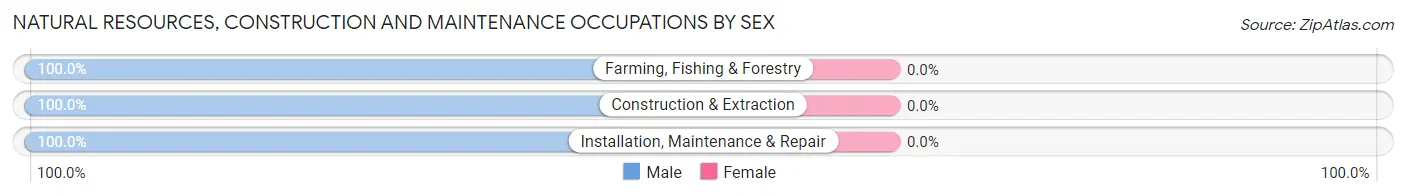
| Occupation | Male | Female |
| Farming, Fishing & Forestry | 9 (100.0%) | 0 (0.0%) |
| Construction & Extraction | 180 (100.0%) | 0 (0.0%) |
| Installation, Maintenance & Repair | 111 (100.0%) | 0 (0.0%) |
| Total (Category) | 300 (100.0%) | 0 (0.0%) |
| Total (Overall) | 997 (48.7%) | 1,050 (51.3%) |
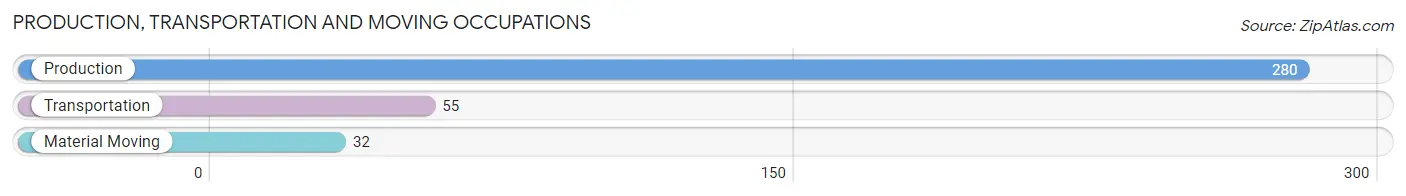
Production, Transportation and Moving Occupations
The most common Production, Transportation and Moving occupations in Ironwood are Production (280 | 13.7%), Transportation (55 | 2.7%), and Material Moving (32 | 1.6%).
Production, Transportation and Moving Occupations by Sex
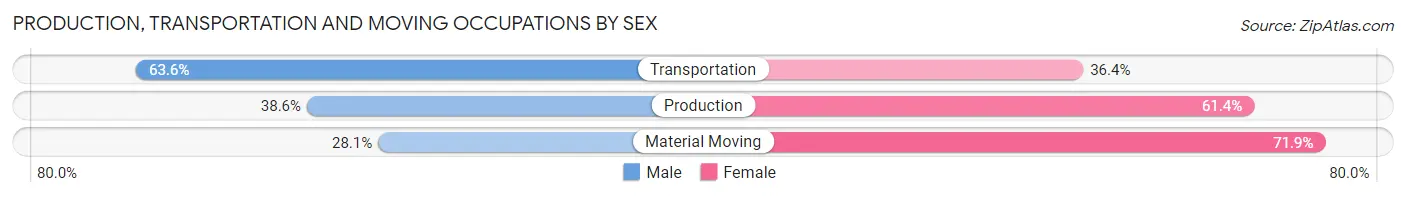
| Occupation | Male | Female |
| Production | 108 (38.6%) | 172 (61.4%) |
| Transportation | 35 (63.6%) | 20 (36.4%) |
| Material Moving | 9 (28.1%) | 23 (71.9%) |
| Total (Category) | 152 (41.4%) | 215 (58.6%) |
| Total (Overall) | 997 (48.7%) | 1,050 (51.3%) |
Employment Industries by Sex in Ironwood
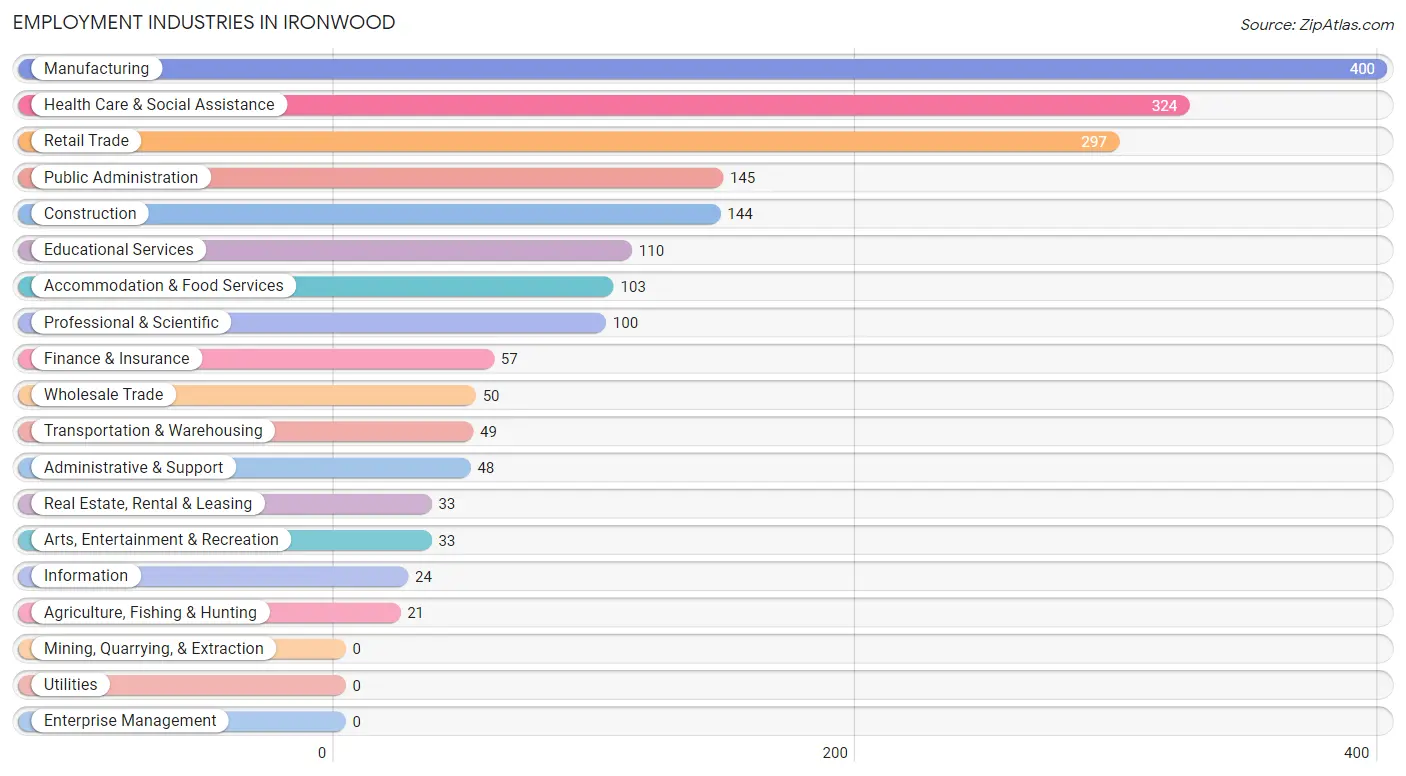
Employment Industries in Ironwood
The major employment industries in Ironwood include Manufacturing (400 | 19.5%), Health Care & Social Assistance (324 | 15.8%), Retail Trade (297 | 14.5%), Public Administration (145 | 7.1%), and Construction (144 | 7.0%).
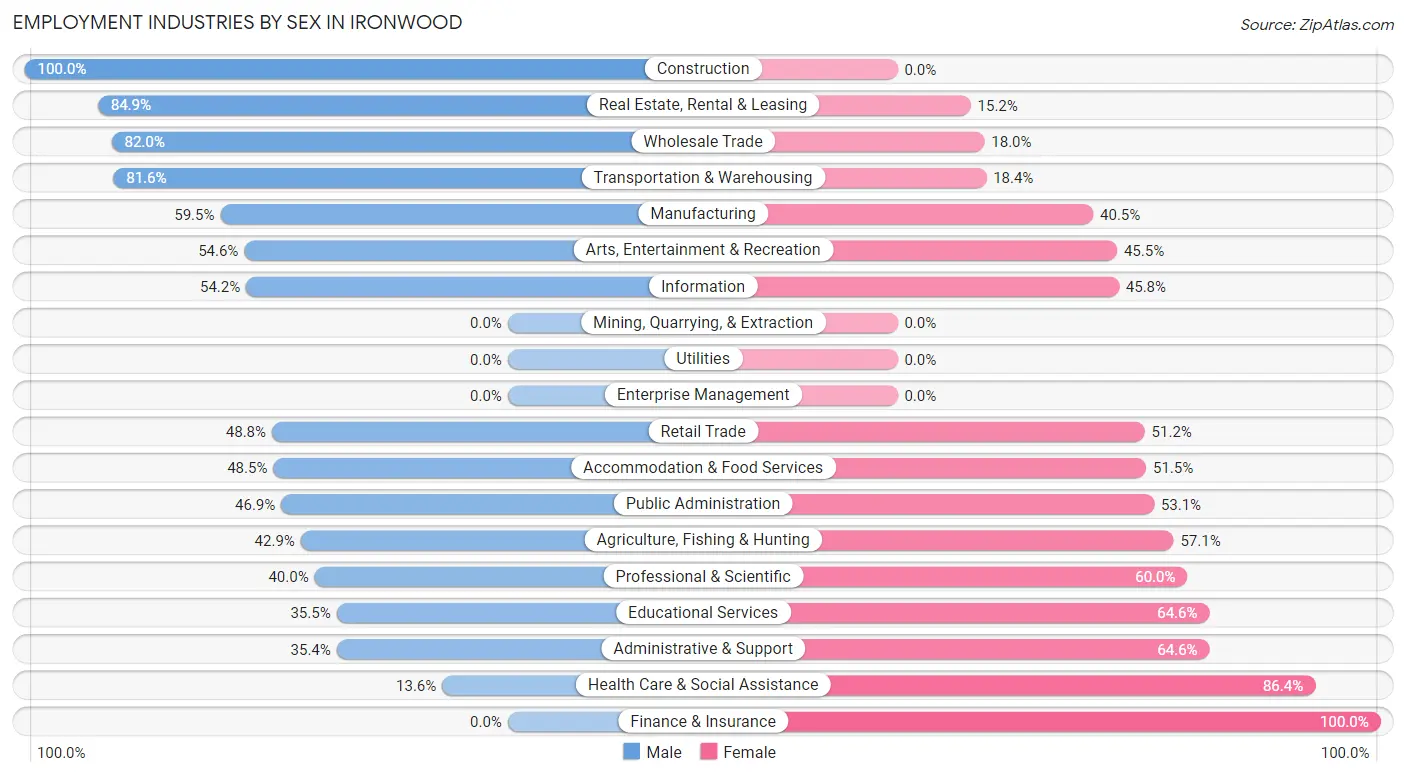
Employment Industries by Sex in Ironwood
The Ironwood industries that see more men than women are Construction (100.0%), Real Estate, Rental & Leasing (84.9%), and Wholesale Trade (82.0%), whereas the industries that tend to have a higher number of women are Finance & Insurance (100.0%), Health Care & Social Assistance (86.4%), and Administrative & Support (64.6%).
| Industry | Male | Female |
| Agriculture, Fishing & Hunting | 9 (42.9%) | 12 (57.1%) |
| Mining, Quarrying, & Extraction | 0 (0.0%) | 0 (0.0%) |
| Construction | 144 (100.0%) | 0 (0.0%) |
| Manufacturing | 238 (59.5%) | 162 (40.5%) |
| Wholesale Trade | 41 (82.0%) | 9 (18.0%) |
| Retail Trade | 145 (48.8%) | 152 (51.2%) |
| Transportation & Warehousing | 40 (81.6%) | 9 (18.4%) |
| Utilities | 0 (0.0%) | 0 (0.0%) |
| Information | 13 (54.2%) | 11 (45.8%) |
| Finance & Insurance | 0 (0.0%) | 57 (100.0%) |
| Real Estate, Rental & Leasing | 28 (84.9%) | 5 (15.1%) |
| Professional & Scientific | 40 (40.0%) | 60 (60.0%) |
| Enterprise Management | 0 (0.0%) | 0 (0.0%) |
| Administrative & Support | 17 (35.4%) | 31 (64.6%) |
| Educational Services | 39 (35.4%) | 71 (64.5%) |
| Health Care & Social Assistance | 44 (13.6%) | 280 (86.4%) |
| Arts, Entertainment & Recreation | 18 (54.5%) | 15 (45.5%) |
| Accommodation & Food Services | 50 (48.5%) | 53 (51.5%) |
| Public Administration | 68 (46.9%) | 77 (53.1%) |
| Total | 997 (48.7%) | 1,050 (51.3%) |
Education in Ironwood
School Enrollment in Ironwood
The most common levels of schooling among the 780 students in Ironwood are elementary school (198 | 25.4%), middle school (186 | 23.8%), and college / undergraduate (164 | 21.0%).
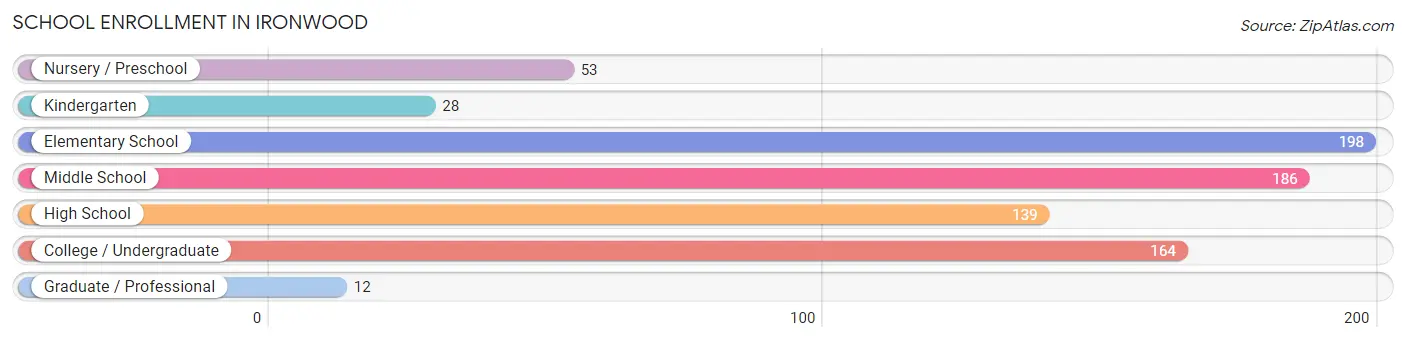
| School Level | # Students | % Students |
| Nursery / Preschool | 53 | 6.8% |
| Kindergarten | 28 | 3.6% |
| Elementary School | 198 | 25.4% |
| Middle School | 186 | 23.8% |
| High School | 139 | 17.8% |
| College / Undergraduate | 164 | 21.0% |
| Graduate / Professional | 12 | 1.5% |
| Total | 780 | 100.0% |
School Enrollment by Age by Funding Source in Ironwood
Out of a total of 780 students who are enrolled in schools in Ironwood, 112 (14.4%) attend a private institution, while the remaining 668 (85.6%) are enrolled in public schools. The age group of 3 to 4 year olds has the highest likelihood of being enrolled in private schools, with 10 (100.0% in the age bracket) enrolled. Conversely, the age group of 15 to 17 year olds has the lowest likelihood of being enrolled in a private school, with 121 (100.0% in the age bracket) attending a public institution.
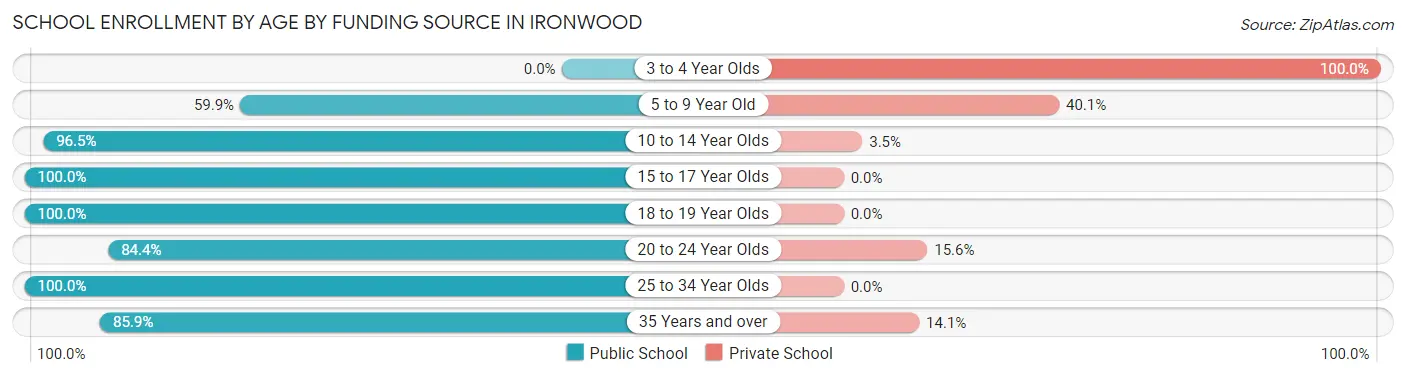
| Age Bracket | Public School | Private School |
| 3 to 4 Year Olds | 0 (0.0%) | 10 (100.0%) |
| 5 to 9 Year Old | 106 (59.9%) | 71 (40.1%) |
| 10 to 14 Year Olds | 278 (96.5%) | 10 (3.5%) |
| 15 to 17 Year Olds | 121 (100.0%) | 0 (0.0%) |
| 18 to 19 Year Olds | 35 (100.0%) | 0 (0.0%) |
| 20 to 24 Year Olds | 65 (84.4%) | 12 (15.6%) |
| 25 to 34 Year Olds | 8 (100.0%) | 0 (0.0%) |
| 35 Years and over | 55 (85.9%) | 9 (14.1%) |
| Total | 668 (85.6%) | 112 (14.4%) |
Educational Attainment by Field of Study in Ironwood
Education (204 | 23.2%), business (105 | 11.9%), engineering (80 | 9.1%), social sciences (72 | 8.2%), and arts & humanities (60 | 6.8%) are the most common fields of study among 880 individuals in Ironwood who have obtained a bachelor's degree or higher.
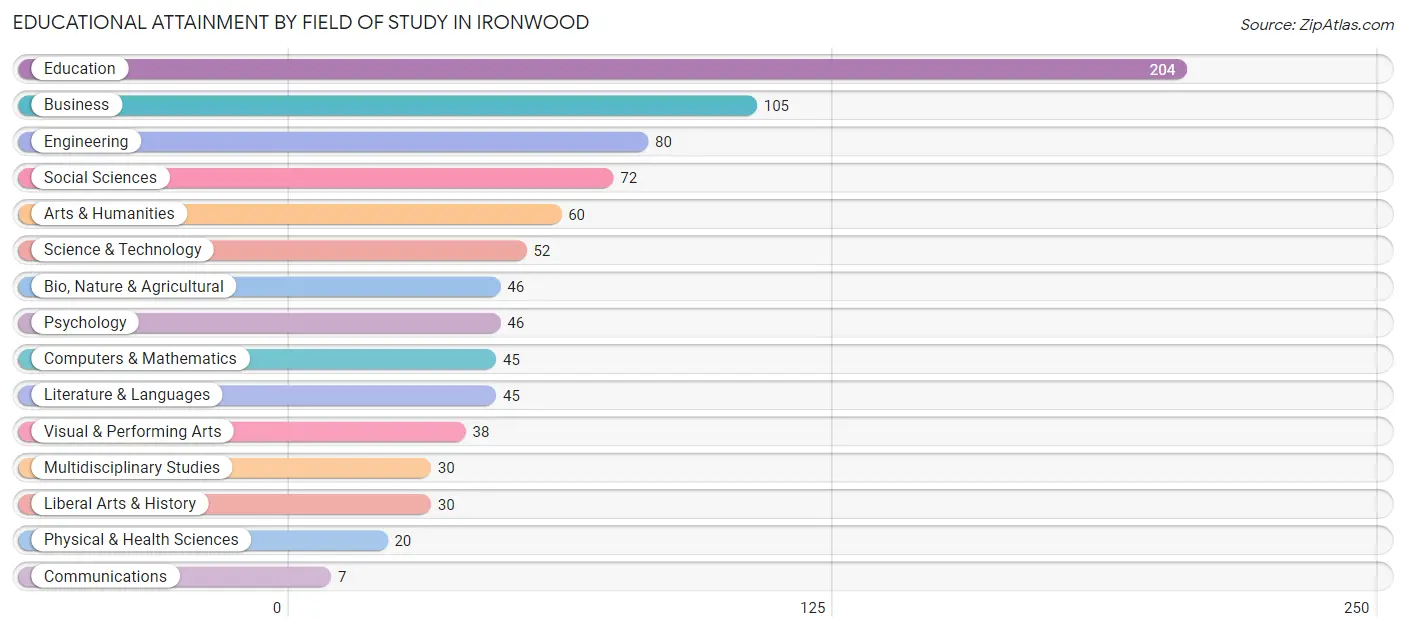
| Field of Study | # Graduates | % Graduates |
| Computers & Mathematics | 45 | 5.1% |
| Bio, Nature & Agricultural | 46 | 5.2% |
| Physical & Health Sciences | 20 | 2.3% |
| Psychology | 46 | 5.2% |
| Social Sciences | 72 | 8.2% |
| Engineering | 80 | 9.1% |
| Multidisciplinary Studies | 30 | 3.4% |
| Science & Technology | 52 | 5.9% |
| Business | 105 | 11.9% |
| Education | 204 | 23.2% |
| Literature & Languages | 45 | 5.1% |
| Liberal Arts & History | 30 | 3.4% |
| Visual & Performing Arts | 38 | 4.3% |
| Communications | 7 | 0.8% |
| Arts & Humanities | 60 | 6.8% |
| Total | 880 | 100.0% |
Transportation & Commute in Ironwood
Vehicle Availability by Sex in Ironwood
The most prevalent vehicle ownership categories in Ironwood are males with 2 vehicles (544, accounting for 55.2%) and females with 2 vehicles (443, making up 51.8%).
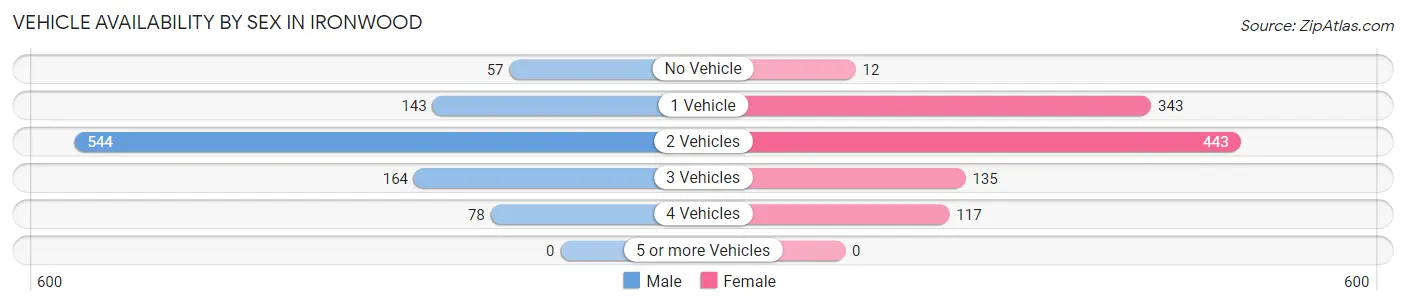
| Vehicles Available | Male | Female |
| No Vehicle | 57 (5.8%) | 12 (1.1%) |
| 1 Vehicle | 143 (14.5%) | 343 (32.7%) |
| 2 Vehicles | 544 (55.2%) | 443 (42.2%) |
| 3 Vehicles | 164 (16.6%) | 135 (12.9%) |
| 4 Vehicles | 78 (7.9%) | 117 (11.1%) |
| 5 or more Vehicles | 0 (0.0%) | 0 (0.0%) |
| Total | 986 (100.0%) | 1,050 (100.0%) |
Commute Time in Ironwood
The most frequently occuring commute durations in Ironwood are 5 to 9 minutes (650 commuters, 34.0%), 10 to 14 minutes (304 commuters, 15.9%), and less than 5 minutes (231 commuters, 12.1%).
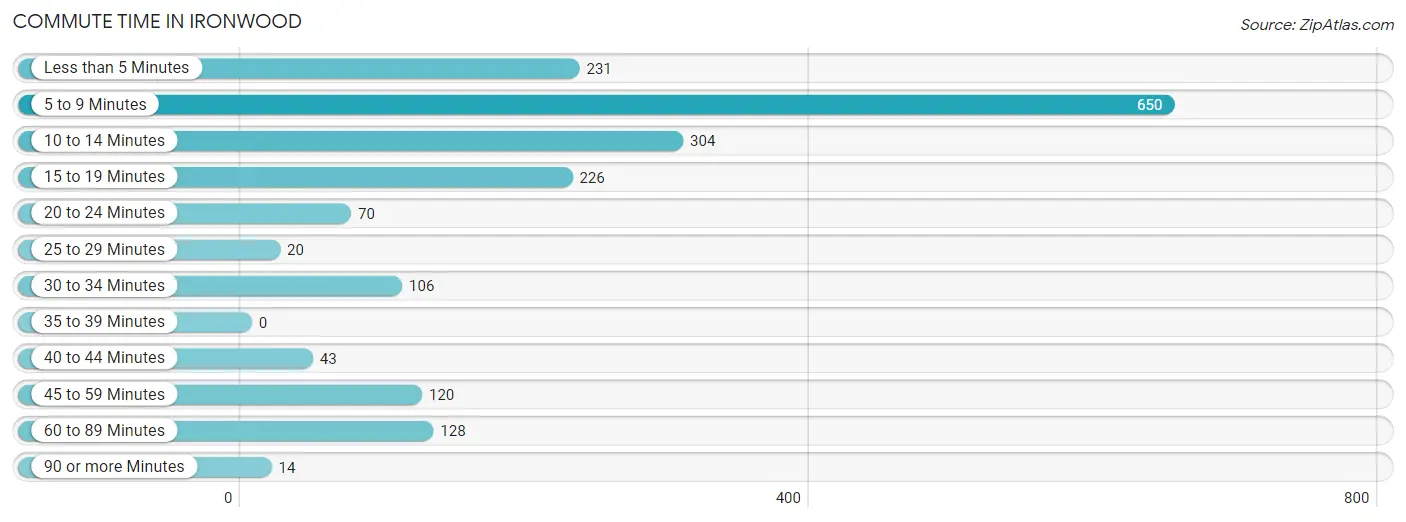
| Commute Time | # Commuters | % Commuters |
| Less than 5 Minutes | 231 | 12.1% |
| 5 to 9 Minutes | 650 | 34.0% |
| 10 to 14 Minutes | 304 | 15.9% |
| 15 to 19 Minutes | 226 | 11.8% |
| 20 to 24 Minutes | 70 | 3.7% |
| 25 to 29 Minutes | 20 | 1.1% |
| 30 to 34 Minutes | 106 | 5.5% |
| 35 to 39 Minutes | 0 | 0.0% |
| 40 to 44 Minutes | 43 | 2.2% |
| 45 to 59 Minutes | 120 | 6.3% |
| 60 to 89 Minutes | 128 | 6.7% |
| 90 or more Minutes | 14 | 0.7% |
Commute Time by Sex in Ironwood
The most common commute times in Ironwood are 5 to 9 minutes (265 commuters, 28.3%) for males and 5 to 9 minutes (385 commuters, 39.5%) for females.
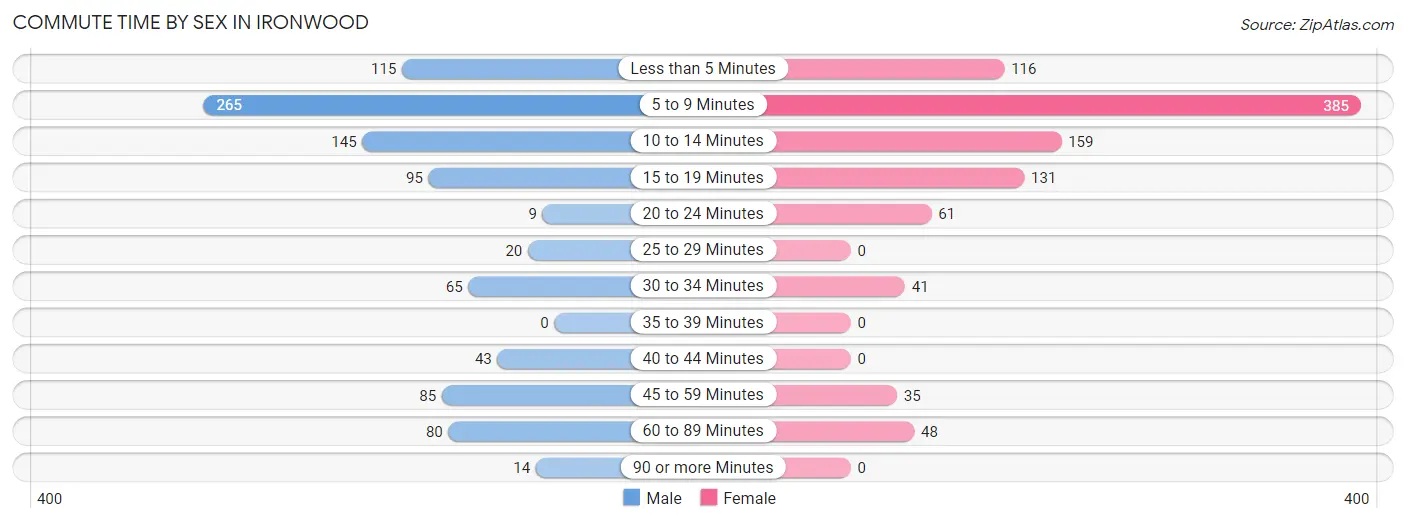
| Commute Time | Male | Female |
| Less than 5 Minutes | 115 (12.3%) | 116 (11.9%) |
| 5 to 9 Minutes | 265 (28.3%) | 385 (39.5%) |
| 10 to 14 Minutes | 145 (15.5%) | 159 (16.3%) |
| 15 to 19 Minutes | 95 (10.2%) | 131 (13.4%) |
| 20 to 24 Minutes | 9 (1.0%) | 61 (6.2%) |
| 25 to 29 Minutes | 20 (2.1%) | 0 (0.0%) |
| 30 to 34 Minutes | 65 (6.9%) | 41 (4.2%) |
| 35 to 39 Minutes | 0 (0.0%) | 0 (0.0%) |
| 40 to 44 Minutes | 43 (4.6%) | 0 (0.0%) |
| 45 to 59 Minutes | 85 (9.1%) | 35 (3.6%) |
| 60 to 89 Minutes | 80 (8.6%) | 48 (4.9%) |
| 90 or more Minutes | 14 (1.5%) | 0 (0.0%) |
Time of Departure to Work by Sex in Ironwood
The most frequent times of departure to work in Ironwood are 6:00 AM to 6:29 AM (163, 17.4%) for males and 6:00 AM to 6:29 AM (194, 19.9%) for females.
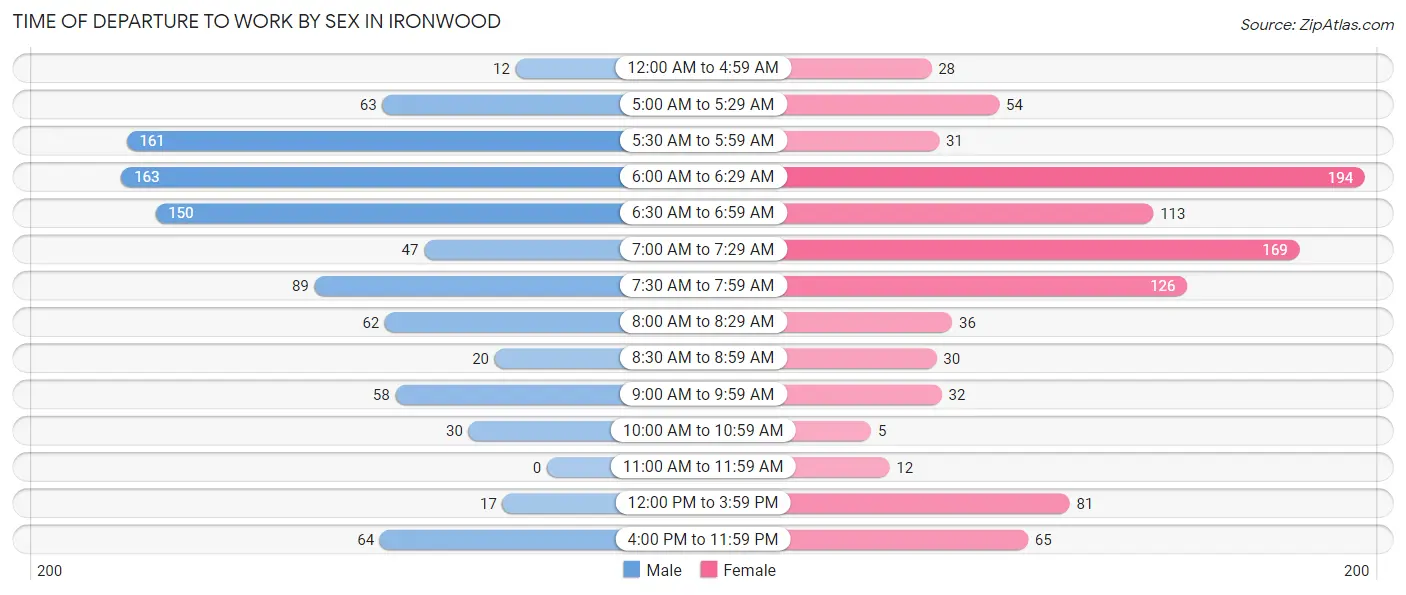
| Time of Departure | Male | Female |
| 12:00 AM to 4:59 AM | 12 (1.3%) | 28 (2.9%) |
| 5:00 AM to 5:29 AM | 63 (6.7%) | 54 (5.5%) |
| 5:30 AM to 5:59 AM | 161 (17.2%) | 31 (3.2%) |
| 6:00 AM to 6:29 AM | 163 (17.4%) | 194 (19.9%) |
| 6:30 AM to 6:59 AM | 150 (16.0%) | 113 (11.6%) |
| 7:00 AM to 7:29 AM | 47 (5.0%) | 169 (17.3%) |
| 7:30 AM to 7:59 AM | 89 (9.5%) | 126 (12.9%) |
| 8:00 AM to 8:29 AM | 62 (6.6%) | 36 (3.7%) |
| 8:30 AM to 8:59 AM | 20 (2.1%) | 30 (3.1%) |
| 9:00 AM to 9:59 AM | 58 (6.2%) | 32 (3.3%) |
| 10:00 AM to 10:59 AM | 30 (3.2%) | 5 (0.5%) |
| 11:00 AM to 11:59 AM | 0 (0.0%) | 12 (1.2%) |
| 12:00 PM to 3:59 PM | 17 (1.8%) | 81 (8.3%) |
| 4:00 PM to 11:59 PM | 64 (6.8%) | 65 (6.7%) |
| Total | 936 (100.0%) | 976 (100.0%) |
Housing Occupancy in Ironwood
Occupancy by Ownership in Ironwood
Of the total 2,636 dwellings in Ironwood, owner-occupied units account for 2,020 (76.6%), while renter-occupied units make up 616 (23.4%).
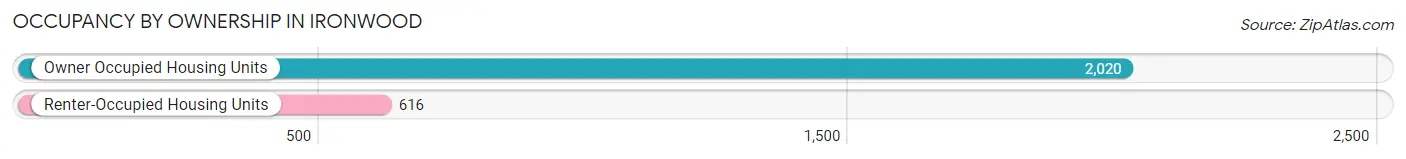
| Occupancy | # Housing Units | % Housing Units |
| Owner Occupied Housing Units | 2,020 | 76.6% |
| Renter-Occupied Housing Units | 616 | 23.4% |
| Total Occupied Housing Units | 2,636 | 100.0% |
Occupancy by Household Size in Ironwood
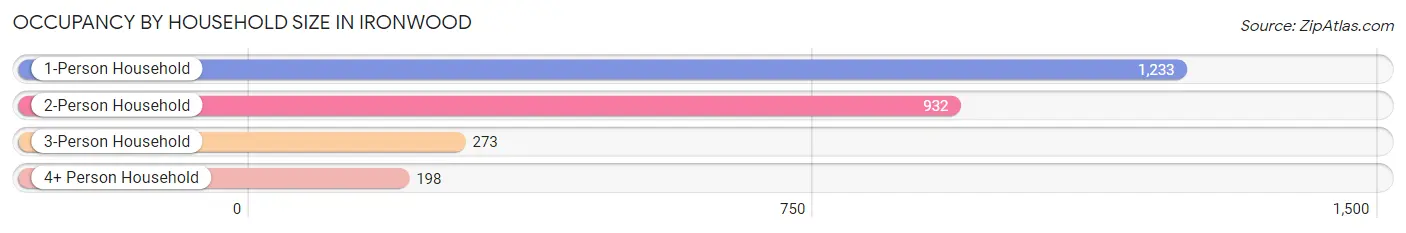
| Household Size | # Housing Units | % Housing Units |
| 1-Person Household | 1,233 | 46.8% |
| 2-Person Household | 932 | 35.4% |
| 3-Person Household | 273 | 10.4% |
| 4+ Person Household | 198 | 7.5% |
| Total Housing Units | 2,636 | 100.0% |
Occupancy by Ownership by Household Size in Ironwood
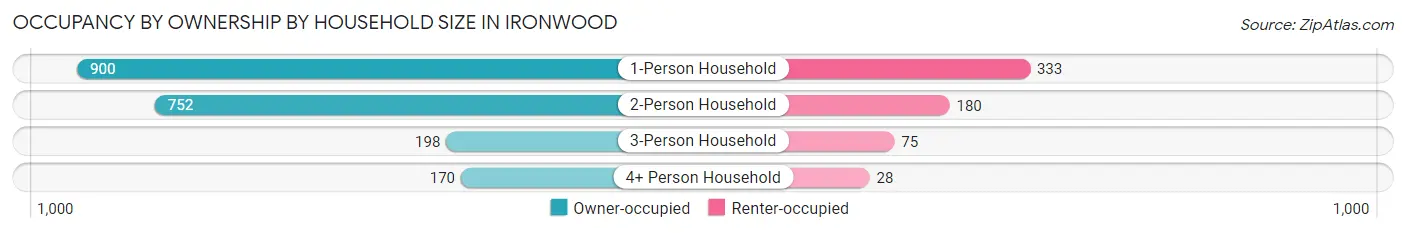
| Household Size | Owner-occupied | Renter-occupied |
| 1-Person Household | 900 (73.0%) | 333 (27.0%) |
| 2-Person Household | 752 (80.7%) | 180 (19.3%) |
| 3-Person Household | 198 (72.5%) | 75 (27.5%) |
| 4+ Person Household | 170 (85.9%) | 28 (14.1%) |
| Total Housing Units | 2,020 (76.6%) | 616 (23.4%) |
Occupancy by Educational Attainment in Ironwood
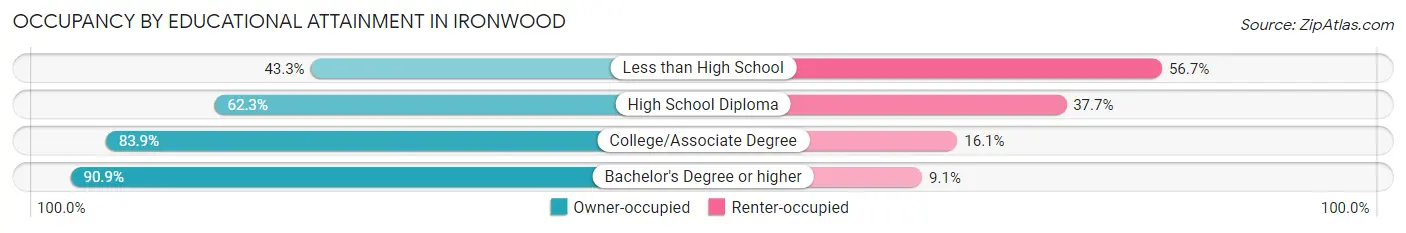
| Household Size | Owner-occupied | Renter-occupied |
| Less than High School | 52 (43.3%) | 68 (56.7%) |
| High School Diploma | 521 (62.3%) | 315 (37.7%) |
| College/Associate Degree | 959 (83.9%) | 184 (16.1%) |
| Bachelor's Degree or higher | 488 (90.9%) | 49 (9.1%) |
Occupancy by Age of Householder in Ironwood
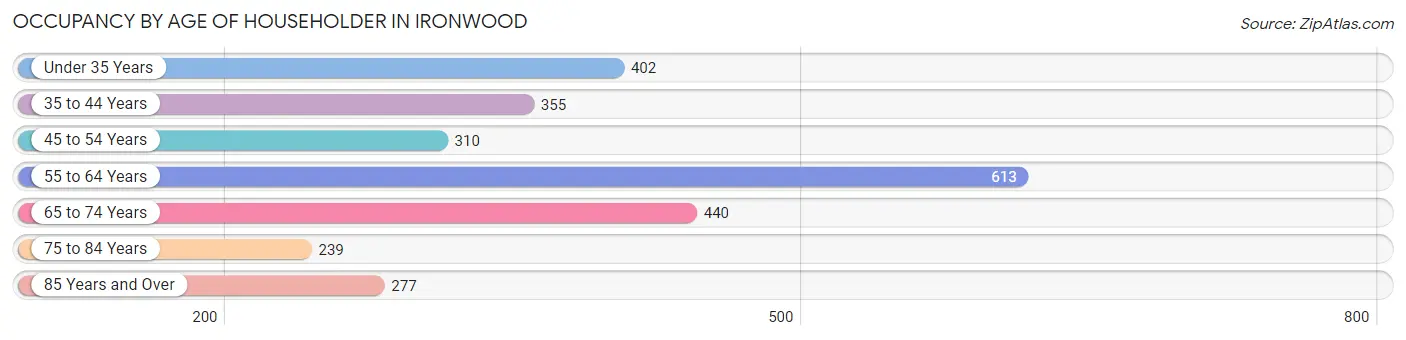
| Age Bracket | # Households | % Households |
| Under 35 Years | 402 | 15.2% |
| 35 to 44 Years | 355 | 13.5% |
| 45 to 54 Years | 310 | 11.8% |
| 55 to 64 Years | 613 | 23.3% |
| 65 to 74 Years | 440 | 16.7% |
| 75 to 84 Years | 239 | 9.1% |
| 85 Years and Over | 277 | 10.5% |
| Total | 2,636 | 100.0% |
Housing Finances in Ironwood
Median Income by Occupancy in Ironwood
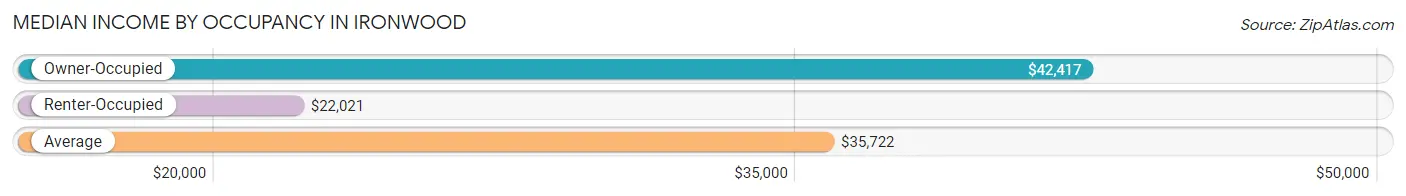
| Occupancy Type | # Households | Median Income |
| Owner-Occupied | 2,020 (76.6%) | $42,417 |
| Renter-Occupied | 616 (23.4%) | $22,021 |
| Average | 2,636 (100.0%) | $35,722 |
Occupancy by Householder Income Bracket in Ironwood
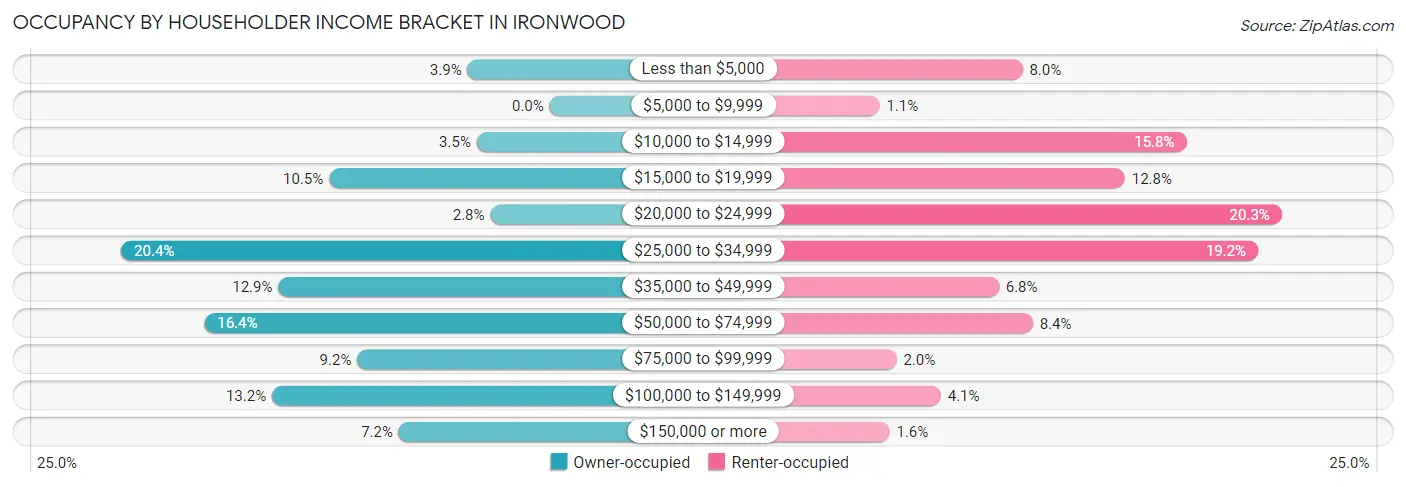
| Income Bracket | Owner-occupied | Renter-occupied |
| Less than $5,000 | 79 (3.9%) | 49 (8.0%) |
| $5,000 to $9,999 | 0 (0.0%) | 7 (1.1%) |
| $10,000 to $14,999 | 70 (3.5%) | 97 (15.8%) |
| $15,000 to $19,999 | 212 (10.5%) | 79 (12.8%) |
| $20,000 to $24,999 | 57 (2.8%) | 125 (20.3%) |
| $25,000 to $34,999 | 412 (20.4%) | 118 (19.2%) |
| $35,000 to $49,999 | 261 (12.9%) | 42 (6.8%) |
| $50,000 to $74,999 | 332 (16.4%) | 52 (8.4%) |
| $75,000 to $99,999 | 185 (9.2%) | 12 (1.9%) |
| $100,000 to $149,999 | 267 (13.2%) | 25 (4.1%) |
| $150,000 or more | 145 (7.2%) | 10 (1.6%) |
| Total | 2,020 (100.0%) | 616 (100.0%) |
Monthly Housing Cost Tiers in Ironwood
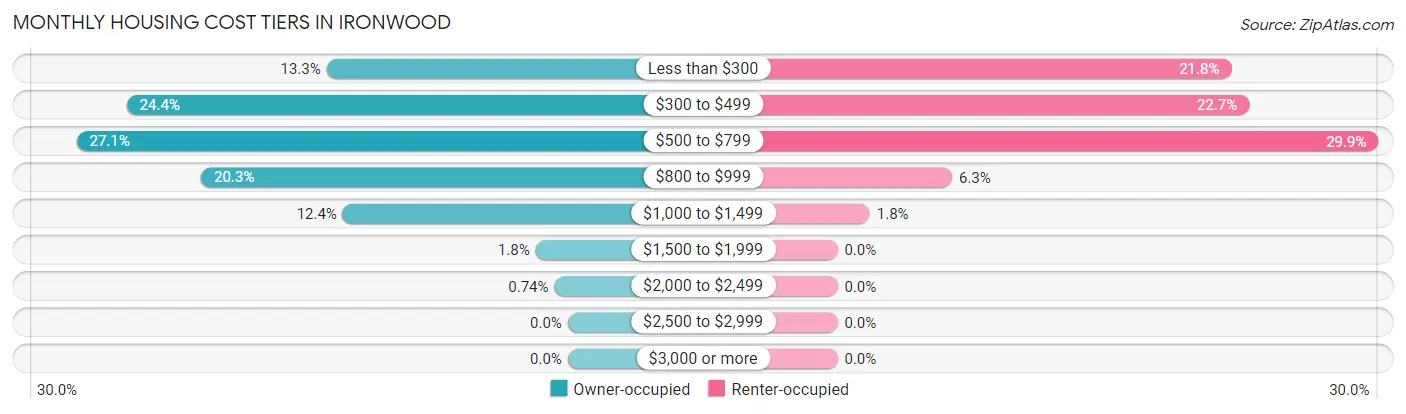
| Monthly Cost | Owner-occupied | Renter-occupied |
| Less than $300 | 269 (13.3%) | 134 (21.7%) |
| $300 to $499 | 492 (24.4%) | 140 (22.7%) |
| $500 to $799 | 548 (27.1%) | 184 (29.9%) |
| $800 to $999 | 409 (20.3%) | 39 (6.3%) |
| $1,000 to $1,499 | 251 (12.4%) | 11 (1.8%) |
| $1,500 to $1,999 | 36 (1.8%) | 0 (0.0%) |
| $2,000 to $2,499 | 15 (0.7%) | 0 (0.0%) |
| $2,500 to $2,999 | 0 (0.0%) | 0 (0.0%) |
| $3,000 or more | 0 (0.0%) | 0 (0.0%) |
| Total | 2,020 (100.0%) | 616 (100.0%) |
Physical Housing Characteristics in Ironwood
Housing Structures in Ironwood
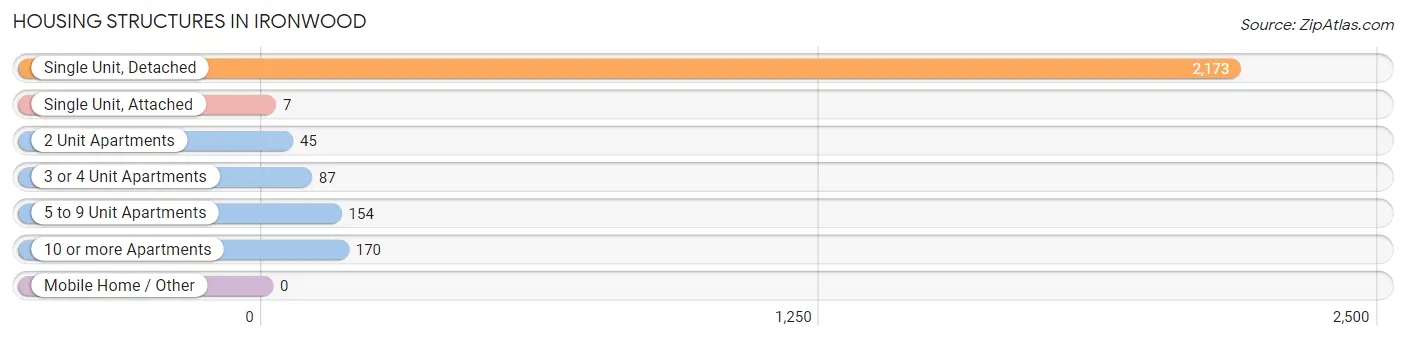
| Structure Type | # Housing Units | % Housing Units |
| Single Unit, Detached | 2,173 | 82.4% |
| Single Unit, Attached | 7 | 0.3% |
| 2 Unit Apartments | 45 | 1.7% |
| 3 or 4 Unit Apartments | 87 | 3.3% |
| 5 to 9 Unit Apartments | 154 | 5.8% |
| 10 or more Apartments | 170 | 6.5% |
| Mobile Home / Other | 0 | 0.0% |
| Total | 2,636 | 100.0% |
Housing Structures by Occupancy in Ironwood
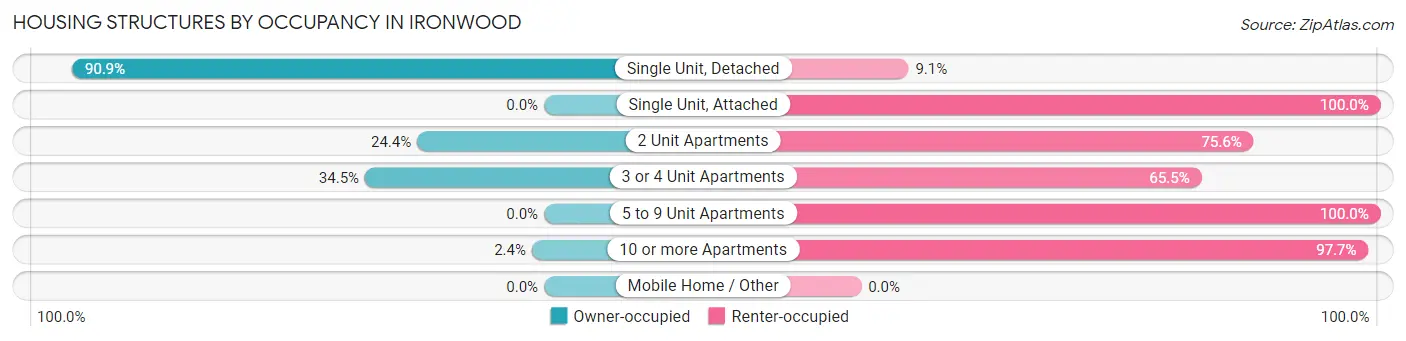
| Structure Type | Owner-occupied | Renter-occupied |
| Single Unit, Detached | 1,975 (90.9%) | 198 (9.1%) |
| Single Unit, Attached | 0 (0.0%) | 7 (100.0%) |
| 2 Unit Apartments | 11 (24.4%) | 34 (75.6%) |
| 3 or 4 Unit Apartments | 30 (34.5%) | 57 (65.5%) |
| 5 to 9 Unit Apartments | 0 (0.0%) | 154 (100.0%) |
| 10 or more Apartments | 4 (2.4%) | 166 (97.7%) |
| Mobile Home / Other | 0 (0.0%) | 0 (0.0%) |
| Total | 2,020 (76.6%) | 616 (23.4%) |
Housing Structures by Number of Rooms in Ironwood
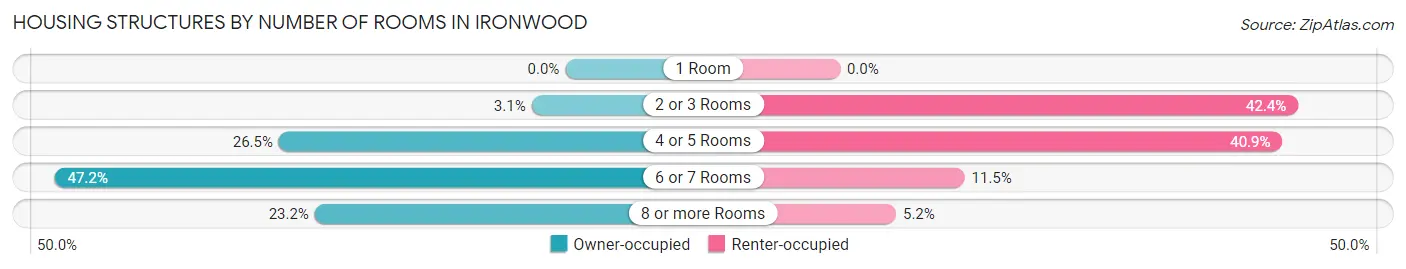
| Number of Rooms | Owner-occupied | Renter-occupied |
| 1 Room | 0 (0.0%) | 0 (0.0%) |
| 2 or 3 Rooms | 63 (3.1%) | 261 (42.4%) |
| 4 or 5 Rooms | 535 (26.5%) | 252 (40.9%) |
| 6 or 7 Rooms | 954 (47.2%) | 71 (11.5%) |
| 8 or more Rooms | 468 (23.2%) | 32 (5.2%) |
| Total | 2,020 (100.0%) | 616 (100.0%) |
Housing Structure by Heating Type in Ironwood
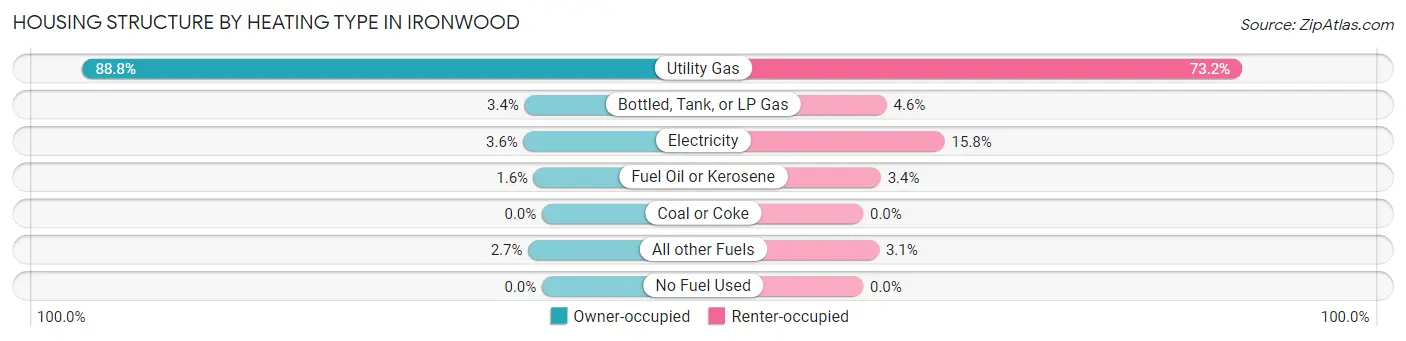
| Heating Type | Owner-occupied | Renter-occupied |
| Utility Gas | 1,794 (88.8%) | 451 (73.2%) |
| Bottled, Tank, or LP Gas | 68 (3.4%) | 28 (4.5%) |
| Electricity | 72 (3.6%) | 97 (15.8%) |
| Fuel Oil or Kerosene | 32 (1.6%) | 21 (3.4%) |
| Coal or Coke | 0 (0.0%) | 0 (0.0%) |
| All other Fuels | 54 (2.7%) | 19 (3.1%) |
| No Fuel Used | 0 (0.0%) | 0 (0.0%) |
| Total | 2,020 (100.0%) | 616 (100.0%) |
Household Vehicle Usage in Ironwood
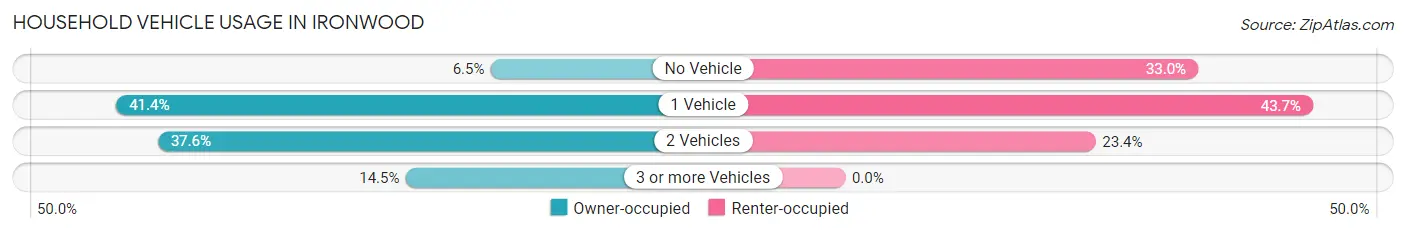
| Vehicles per Household | Owner-occupied | Renter-occupied |
| No Vehicle | 132 (6.5%) | 203 (33.0%) |
| 1 Vehicle | 837 (41.4%) | 269 (43.7%) |
| 2 Vehicles | 759 (37.6%) | 144 (23.4%) |
| 3 or more Vehicles | 292 (14.5%) | 0 (0.0%) |
| Total | 2,020 (100.0%) | 616 (100.0%) |
Real Estate & Mortgages in Ironwood
Real Estate and Mortgage Overview in Ironwood
| Characteristic | Without Mortgage | With Mortgage |
| Housing Units | 1,212 | 808 |
| Median Property Value | $56,500 | $89,600 |
| Median Household Income | $32,083 | $73 |
| Monthly Housing Costs | $449 | $0 |
| Real Estate Taxes | $1,118 | $0 |
Property Value by Mortgage Status in Ironwood
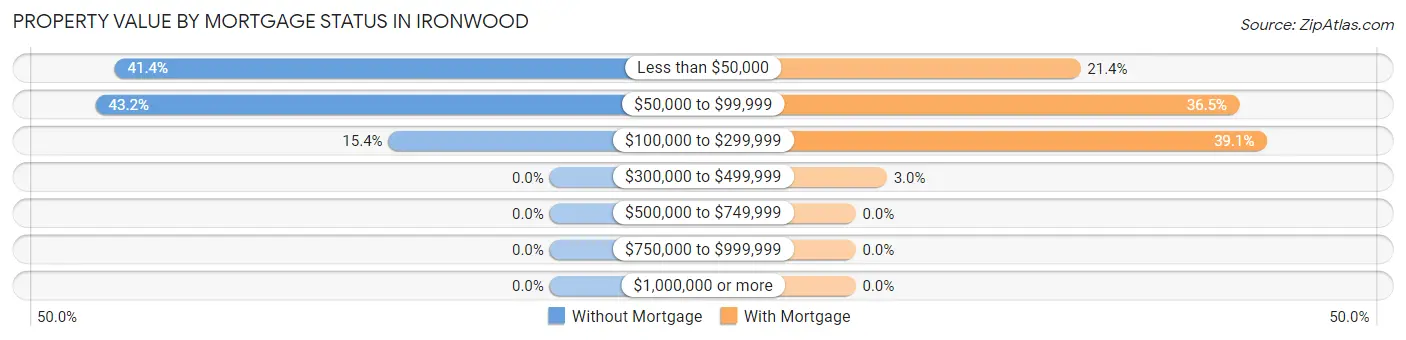
| Property Value | Without Mortgage | With Mortgage |
| Less than $50,000 | 502 (41.4%) | 173 (21.4%) |
| $50,000 to $99,999 | 524 (43.2%) | 295 (36.5%) |
| $100,000 to $299,999 | 186 (15.3%) | 316 (39.1%) |
| $300,000 to $499,999 | 0 (0.0%) | 24 (3.0%) |
| $500,000 to $749,999 | 0 (0.0%) | 0 (0.0%) |
| $750,000 to $999,999 | 0 (0.0%) | 0 (0.0%) |
| $1,000,000 or more | 0 (0.0%) | 0 (0.0%) |
| Total | 1,212 (100.0%) | 808 (100.0%) |
Household Income by Mortgage Status in Ironwood
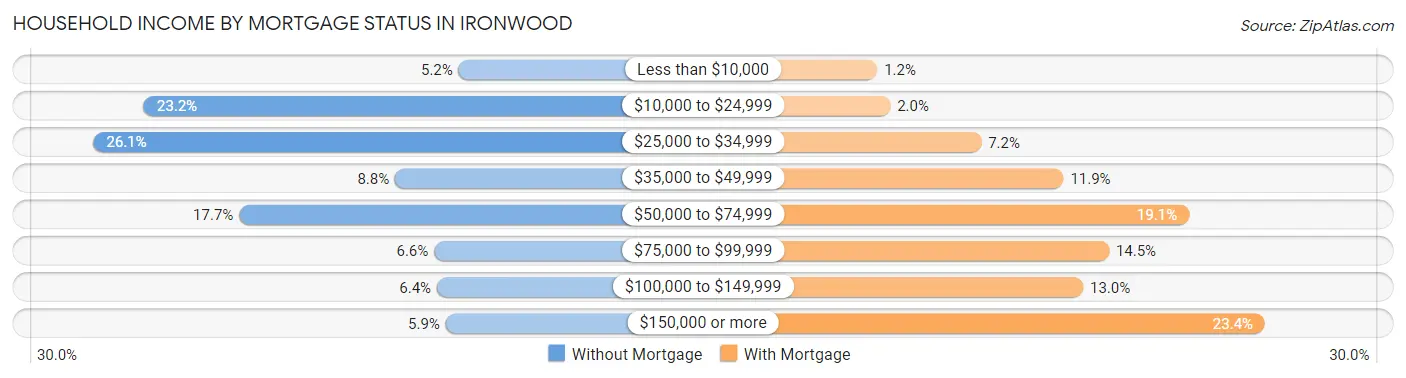
| Household Income | Without Mortgage | With Mortgage |
| Less than $10,000 | 63 (5.2%) | 10 (1.2%) |
| $10,000 to $24,999 | 281 (23.2%) | 16 (2.0%) |
| $25,000 to $34,999 | 316 (26.1%) | 58 (7.2%) |
| $35,000 to $49,999 | 107 (8.8%) | 96 (11.9%) |
| $50,000 to $74,999 | 215 (17.7%) | 154 (19.1%) |
| $75,000 to $99,999 | 80 (6.6%) | 117 (14.5%) |
| $100,000 to $149,999 | 78 (6.4%) | 105 (13.0%) |
| $150,000 or more | 72 (5.9%) | 189 (23.4%) |
| Total | 1,212 (100.0%) | 808 (100.0%) |
Property Value to Household Income Ratio in Ironwood
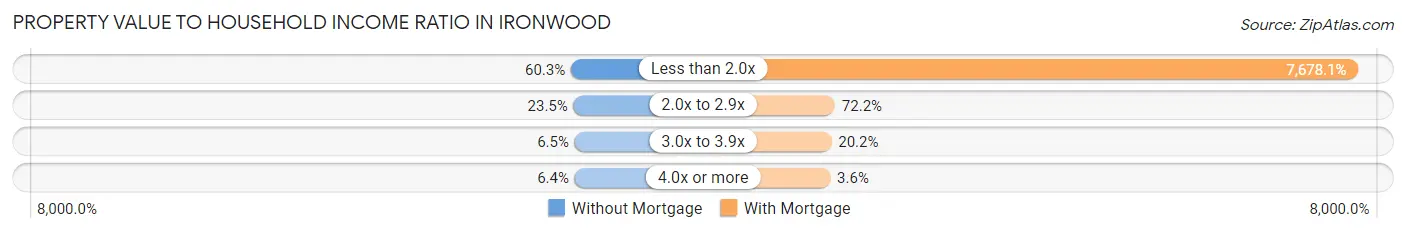
| Value-to-Income Ratio | Without Mortgage | With Mortgage |
| Less than 2.0x | 731 (60.3%) | 62,039 (7,678.1%) |
| 2.0x to 2.9x | 285 (23.5%) | 583 (72.2%) |
| 3.0x to 3.9x | 79 (6.5%) | 163 (20.2%) |
| 4.0x or more | 78 (6.4%) | 29 (3.6%) |
| Total | 1,212 (100.0%) | 808 (100.0%) |
Real Estate Taxes by Mortgage Status in Ironwood
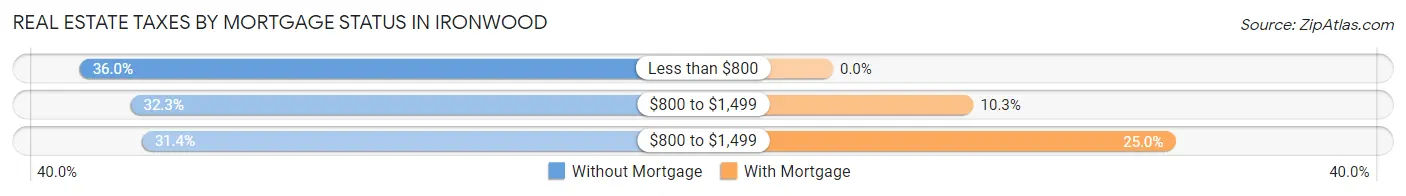
| Property Taxes | Without Mortgage | With Mortgage |
| Less than $800 | 436 (36.0%) | 0 (0.0%) |
| $800 to $1,499 | 391 (32.3%) | 83 (10.3%) |
| $800 to $1,499 | 381 (31.4%) | 202 (25.0%) |
| Total | 1,212 (100.0%) | 808 (100.0%) |
Health & Disability in Ironwood
Health Insurance Coverage by Age in Ironwood
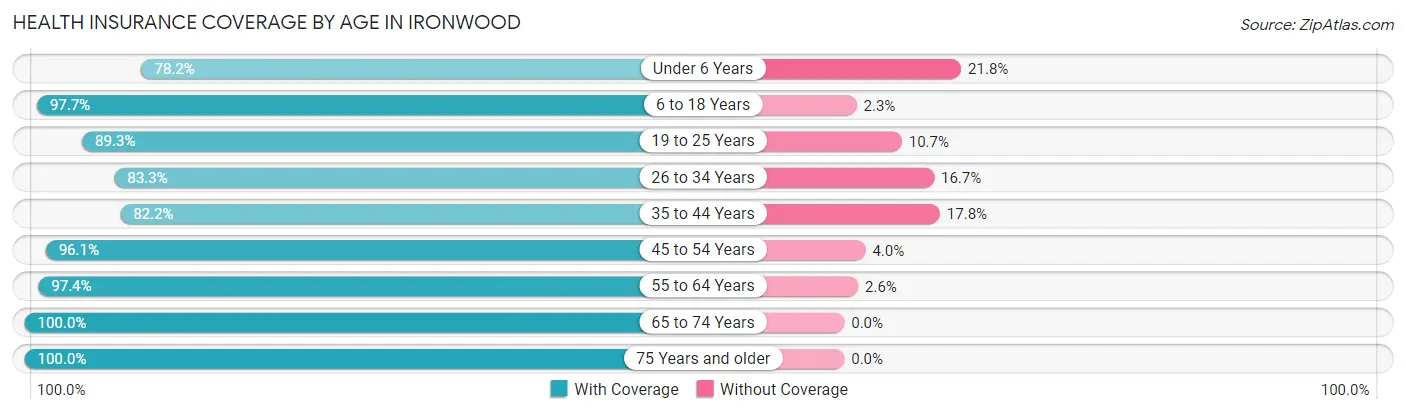
| Age Bracket | With Coverage | Without Coverage |
| Under 6 Years | 183 (78.2%) | 51 (21.8%) |
| 6 to 18 Years | 510 (97.7%) | 12 (2.3%) |
| 19 to 25 Years | 308 (89.3%) | 37 (10.7%) |
| 26 to 34 Years | 468 (83.3%) | 94 (16.7%) |
| 35 to 44 Years | 461 (82.2%) | 100 (17.8%) |
| 45 to 54 Years | 511 (96.1%) | 21 (4.0%) |
| 55 to 64 Years | 910 (97.4%) | 24 (2.6%) |
| 65 to 74 Years | 574 (100.0%) | 0 (0.0%) |
| 75 Years and older | 705 (100.0%) | 0 (0.0%) |
| Total | 4,630 (93.2%) | 339 (6.8%) |
Health Insurance Coverage by Citizenship Status in Ironwood
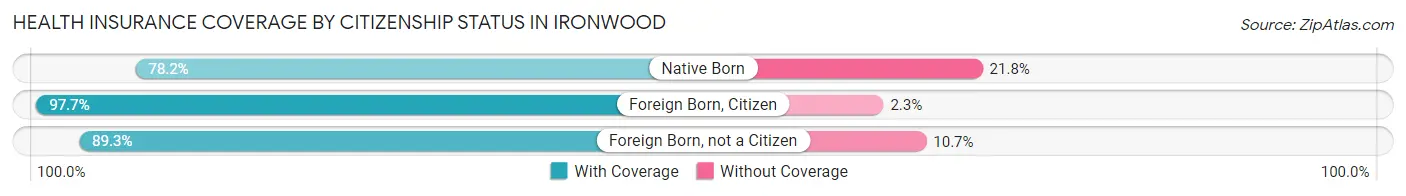
| Citizenship Status | With Coverage | Without Coverage |
| Native Born | 183 (78.2%) | 51 (21.8%) |
| Foreign Born, Citizen | 510 (97.7%) | 12 (2.3%) |
| Foreign Born, not a Citizen | 308 (89.3%) | 37 (10.7%) |
Health Insurance Coverage by Household Income in Ironwood
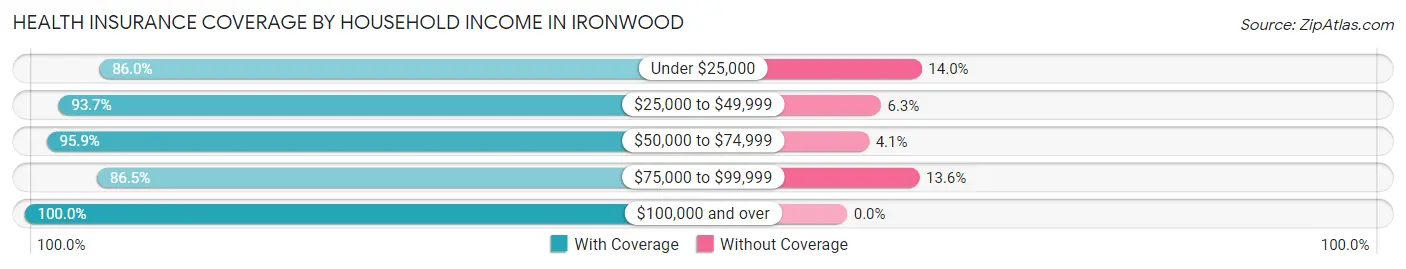
| Household Income | With Coverage | Without Coverage |
| Under $25,000 | 917 (86.0%) | 149 (14.0%) |
| $25,000 to $49,999 | 1,290 (93.7%) | 87 (6.3%) |
| $50,000 to $74,999 | 818 (95.9%) | 35 (4.1%) |
| $75,000 to $99,999 | 434 (86.5%) | 68 (13.6%) |
| $100,000 and over | 1,165 (100.0%) | 0 (0.0%) |
Public vs Private Health Insurance Coverage by Age in Ironwood
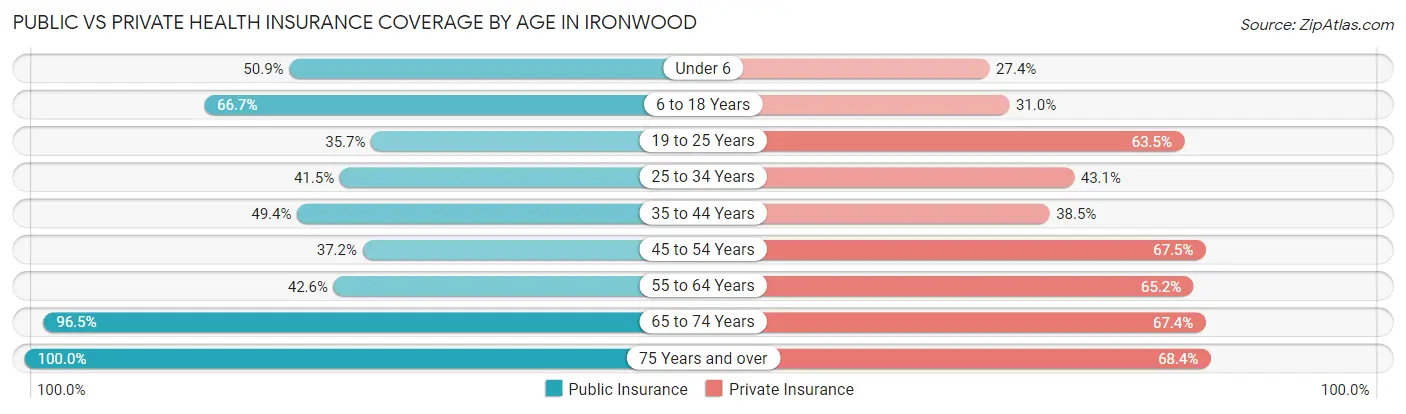
| Age Bracket | Public Insurance | Private Insurance |
| Under 6 | 119 (50.8%) | 64 (27.4%) |
| 6 to 18 Years | 348 (66.7%) | 162 (31.0%) |
| 19 to 25 Years | 123 (35.6%) | 219 (63.5%) |
| 25 to 34 Years | 233 (41.5%) | 242 (43.1%) |
| 35 to 44 Years | 277 (49.4%) | 216 (38.5%) |
| 45 to 54 Years | 198 (37.2%) | 359 (67.5%) |
| 55 to 64 Years | 398 (42.6%) | 609 (65.2%) |
| 65 to 74 Years | 554 (96.5%) | 387 (67.4%) |
| 75 Years and over | 705 (100.0%) | 482 (68.4%) |
| Total | 2,955 (59.5%) | 2,740 (55.1%) |
Disability Status by Sex by Age in Ironwood
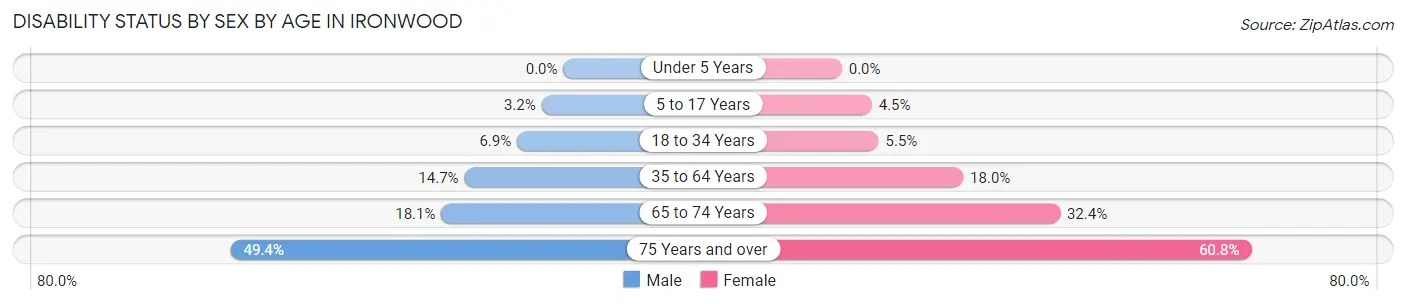
| Age Bracket | Male | Female |
| Under 5 Years | 0 (0.0%) | 0 (0.0%) |
| 5 to 17 Years | 11 (3.2%) | 11 (4.4%) |
| 18 to 34 Years | 28 (6.9%) | 29 (5.5%) |
| 35 to 64 Years | 160 (14.7%) | 169 (18.0%) |
| 65 to 74 Years | 52 (18.1%) | 93 (32.4%) |
| 75 Years and over | 124 (49.4%) | 276 (60.8%) |
Disability Class by Sex by Age in Ironwood
Disability Class: Hearing Difficulty
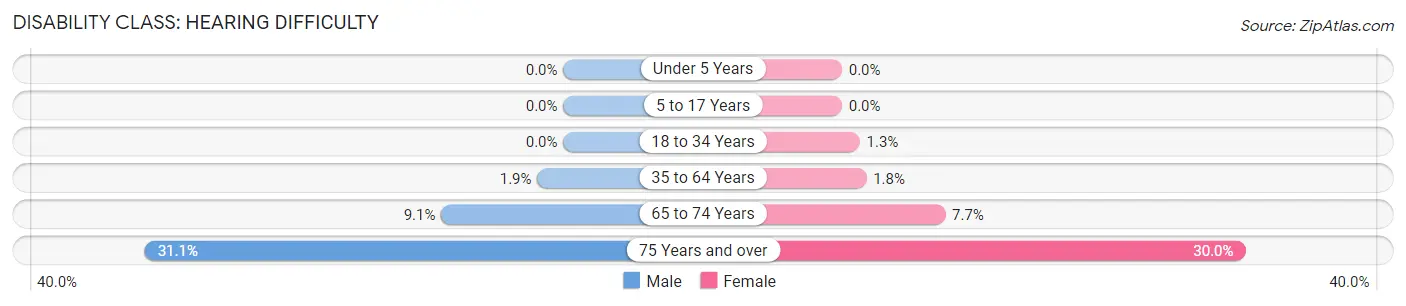
| Age Bracket | Male | Female |
| Under 5 Years | 0 (0.0%) | 0 (0.0%) |
| 5 to 17 Years | 0 (0.0%) | 0 (0.0%) |
| 18 to 34 Years | 0 (0.0%) | 7 (1.3%) |
| 35 to 64 Years | 21 (1.9%) | 17 (1.8%) |
| 65 to 74 Years | 26 (9.1%) | 22 (7.7%) |
| 75 Years and over | 78 (31.1%) | 136 (30.0%) |
Disability Class: Vision Difficulty
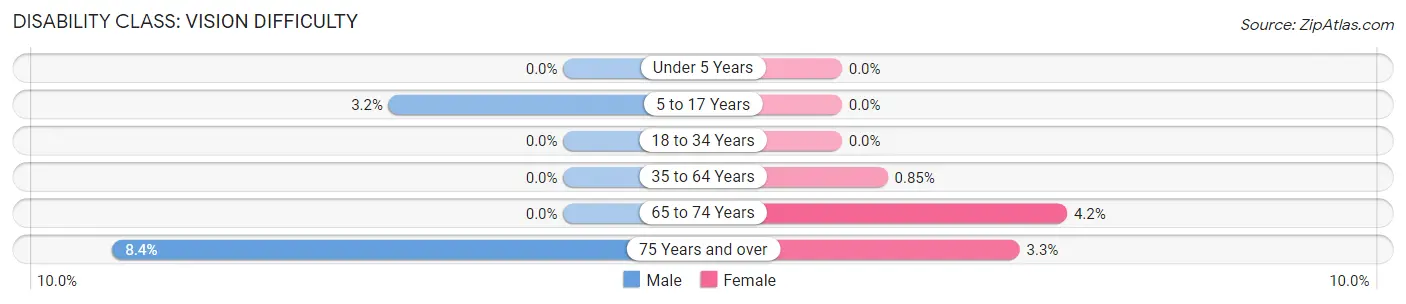
| Age Bracket | Male | Female |
| Under 5 Years | 0 (0.0%) | 0 (0.0%) |
| 5 to 17 Years | 11 (3.2%) | 0 (0.0%) |
| 18 to 34 Years | 0 (0.0%) | 0 (0.0%) |
| 35 to 64 Years | 0 (0.0%) | 8 (0.9%) |
| 65 to 74 Years | 0 (0.0%) | 12 (4.2%) |
| 75 Years and over | 21 (8.4%) | 15 (3.3%) |
Disability Class: Cognitive Difficulty
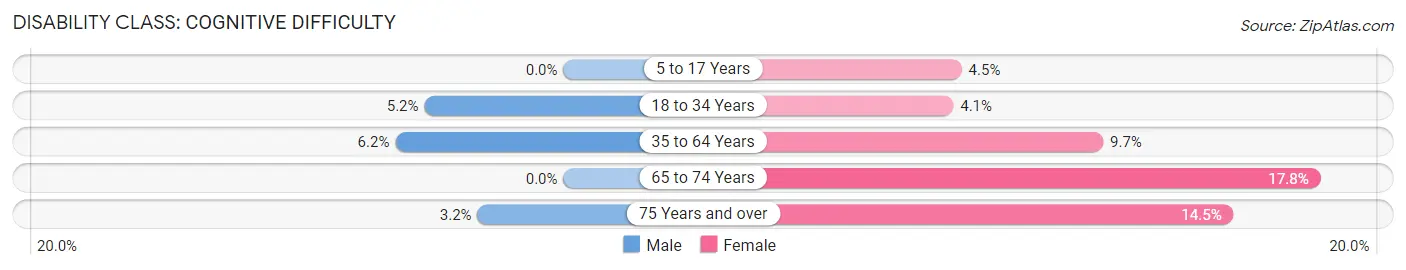
| Age Bracket | Male | Female |
| 5 to 17 Years | 0 (0.0%) | 11 (4.4%) |
| 18 to 34 Years | 21 (5.2%) | 22 (4.1%) |
| 35 to 64 Years | 68 (6.2%) | 91 (9.7%) |
| 65 to 74 Years | 0 (0.0%) | 51 (17.8%) |
| 75 Years and over | 8 (3.2%) | 66 (14.5%) |
Disability Class: Ambulatory Difficulty
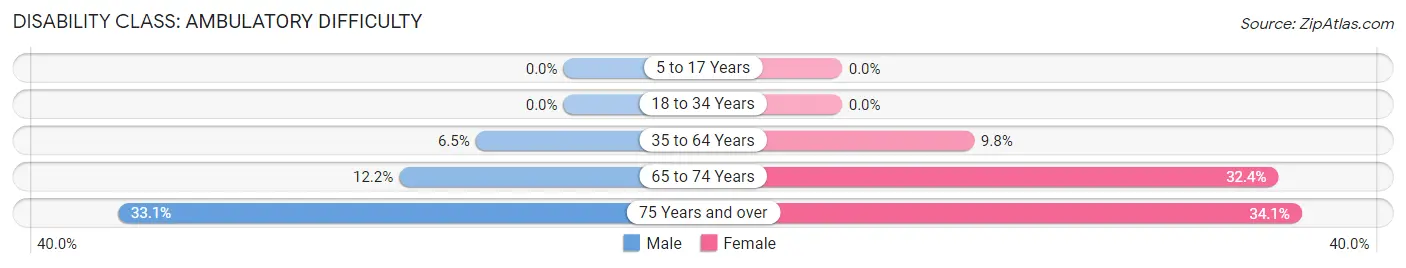
| Age Bracket | Male | Female |
| 5 to 17 Years | 0 (0.0%) | 0 (0.0%) |
| 18 to 34 Years | 0 (0.0%) | 0 (0.0%) |
| 35 to 64 Years | 71 (6.5%) | 92 (9.8%) |
| 65 to 74 Years | 35 (12.2%) | 93 (32.4%) |
| 75 Years and over | 83 (33.1%) | 155 (34.1%) |
Disability Class: Self-Care Difficulty
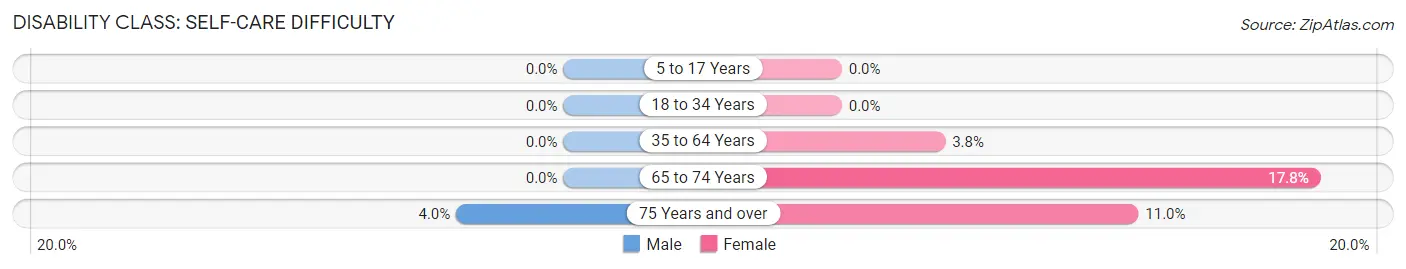
| Age Bracket | Male | Female |
| 5 to 17 Years | 0 (0.0%) | 0 (0.0%) |
| 18 to 34 Years | 0 (0.0%) | 0 (0.0%) |
| 35 to 64 Years | 0 (0.0%) | 36 (3.8%) |
| 65 to 74 Years | 0 (0.0%) | 51 (17.8%) |
| 75 Years and over | 10 (4.0%) | 50 (11.0%) |
Technology Access in Ironwood
Computing Device Access in Ironwood
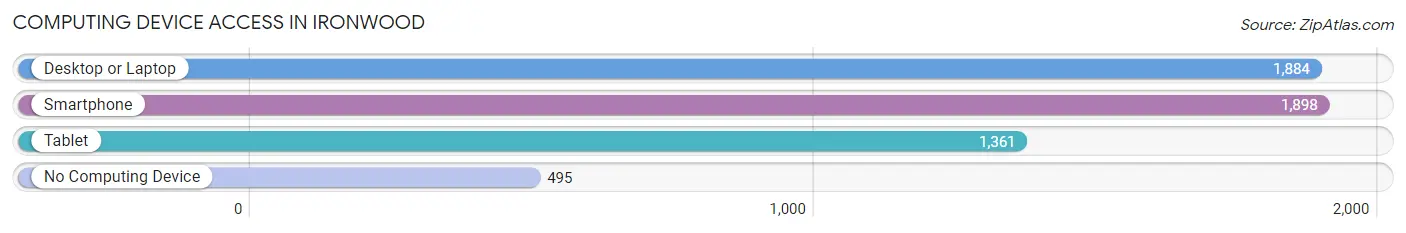
| Device Type | # Households | % Households |
| Desktop or Laptop | 1,884 | 71.5% |
| Smartphone | 1,898 | 72.0% |
| Tablet | 1,361 | 51.6% |
| No Computing Device | 495 | 18.8% |
| Total | 2,636 | 100.0% |
Internet Access in Ironwood
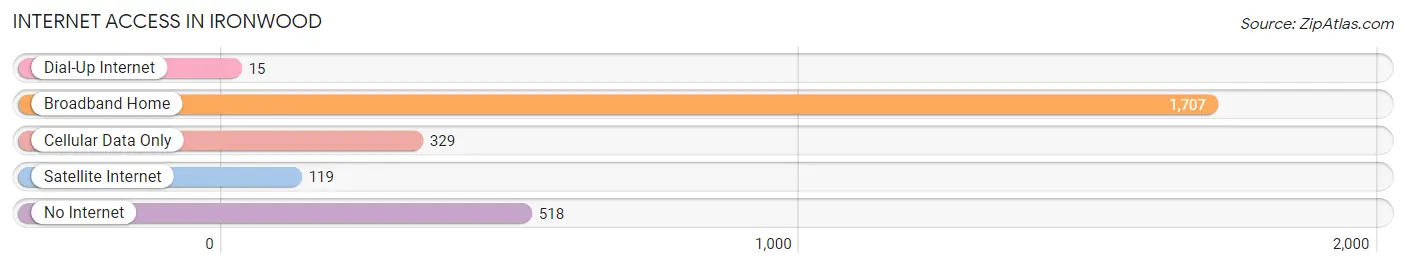
| Internet Type | # Households | % Households |
| Dial-Up Internet | 15 | 0.6% |
| Broadband Home | 1,707 | 64.8% |
| Cellular Data Only | 329 | 12.5% |
| Satellite Internet | 119 | 4.5% |
| No Internet | 518 | 19.7% |
| Total | 2,636 | 100.0% |
Ironwood Summary
Wood Ironwood is a city located in the Upper Peninsula of Michigan. It is the county seat of Gogebic County and is located on the Montreal River, which forms the border between Michigan and Wisconsin. The city is situated in the western part of the Upper Peninsula, near the Wisconsin border. As of the 2010 census, the city had a population of 5,387.
Geography
Ironwood is located at 46°25′N 90°10′W (46.4133, -90.1667). According to the United States Census Bureau, the city has a total area of 8.2 square miles (21.2 km2), of which 8.1 square miles (21.0 km2) is land and 0.1 square mile (0.2 km2) (1.17%) is water.
The city is located in the western part of the Upper Peninsula, near the Wisconsin border. It is situated on the Montreal River, which forms the border between Michigan and Wisconsin. The city is surrounded by the Ottawa National Forest.
History
Ironwood was founded in 1885 by the Ironwood Land and Improvement Company. The company was formed by a group of investors from Chicago, who were looking to capitalize on the area’s rich iron ore deposits. The city was named after the iron ore that was mined in the area.
The city quickly grew, and by the turn of the century, it had become a major industrial center. The city was home to several iron ore mines, as well as a number of other industries, including lumber, paper, and furniture manufacturing.
In the early 1900s, Ironwood was a major tourist destination. The city was home to several resorts, and it was a popular destination for outdoor activities, such as fishing, hunting, and skiing.
Economy
Ironwood’s economy is largely based on tourism and manufacturing. The city is home to several resorts, as well as a number of manufacturing companies. The city is also home to a number of small businesses, such as restaurants, retail stores, and service providers.
The city is also home to a number of educational institutions, including Gogebic Community College and the Ironwood Technical Center.
Demographics
As of the 2010 census, there were 5,387 people, 2,269 households, and 1,364 families residing in the city. The population density was 659.3 people per square mile (254.3/km2). There were 2,541 housing units at an average density of 312.7 per square mile (120.7/km2). The racial makeup of the city was 97.2% White, 0.3% African American, 0.7% Native American, 0.3% Asian, 0.1% Pacific Islander, 0.3% from other races, and 1.2% from two or more races. Hispanic or Latino of any race were 1.3% of the population.
There were 2,269 households, out of which 24.2% had children under the age of 18 living with them, 43.2% were married couples living together, 11.7% had a female householder with no husband present, and 40.3% were non-families. 35.2% of all households were made up of individuals, and 16.2% had someone living alone who was 65 years of age or older. The average household size was 2.25 and the average family size was 2.90.
In the city, the population was spread out, with 22.2% under the age of 18, 8.2% from 18 to 24, 24.2% from 25 to 44, 25.2% from 45 to 64, and 20.2% who were 65 years of age or older. The median age was 41 years. For every 100 females, there were 91.2 males. For every 100 females age 18 and over, there were 87.2 males.
The median income for a household in the city was $30,917, and the median income for a family was $40,917. Males had a median income of $31,917 versus $21,917 for females. The per capita income for the city was $17,917. About 11.2% of families and 14.2% of the population were below the poverty line, including 19.2% of those under age 18 and 8.2% of those age 65 or over.
Common Questions
What is Per Capita Income in Ironwood?
Per Capita income in Ironwood is $32,125.
What is the Median Family Income in Ironwood?
Median Family Income in Ironwood is $55,400.
What is the Median Household income in Ironwood?
Median Household Income in Ironwood is $35,722.
What is Income or Wage Gap in Ironwood?
Income or Wage Gap in Ironwood is 16.7%.
Women in Ironwood earn 83.3 cents for every dollar earned by a man.
What is Inequality or Gini Index in Ironwood?
Inequality or Gini Index in Ironwood is 0.49.
What is the Total Population of Ironwood?
Total Population of Ironwood is 5,088.
What is the Total Male Population of Ironwood?
Total Male Population of Ironwood is 2,526.
What is the Total Female Population of Ironwood?
Total Female Population of Ironwood is 2,562.
What is the Ratio of Males per 100 Females in Ironwood?
There are 98.59 Males per 100 Females in Ironwood.
What is the Ratio of Females per 100 Males in Ironwood?
There are 101.43 Females per 100 Males in Ironwood.
What is the Median Population Age in Ironwood?
Median Population Age in Ironwood is 51.1 Years.
What is the Average Family Size in Ironwood
Average Family Size in Ironwood is 2.7 People.
What is the Average Household Size in Ironwood
Average Household Size in Ironwood is 1.9 People.
How Large is the Labor Force in Ironwood?
There are 2,310 People in the Labor Forcein in Ironwood.
What is the Percentage of People in the Labor Force in Ironwood?
52.1% of People are in the Labor Force in Ironwood.
What is the Unemployment Rate in Ironwood?
Unemployment Rate in Ironwood is 10.8%.