Jenison, MI Map & Demographics
Jenison Map
Jenison Overview
$35,737
PER CAPITA INCOME
$94,137
AVG FAMILY INCOME
$80,043
AVG HOUSEHOLD INCOME
24.6%
WAGE / INCOME GAP [ % ]
75.4¢/ $1
WAGE / INCOME GAP [ $ ]
0.37
INEQUALITY / GINI INDEX
17,314
TOTAL POPULATION
8,365
MALE POPULATION
8,949
FEMALE POPULATION
93.47
MALES / 100 FEMALES
106.98
FEMALES / 100 MALES
38.6
MEDIAN AGE
3.1
AVG FAMILY SIZE
2.6
AVG HOUSEHOLD SIZE
8,414
LABOR FORCE [ PEOPLE ]
62.3%
PERCENT IN LABOR FORCE
2.1%
UNEMPLOYMENT RATE
Jenison Zip Codes
Jenison Area Codes
Income in Jenison
Income Overview in Jenison
Per Capita Income in Jenison is $35,737, while median incomes of families and households are $94,137 and $80,043 respectively.
| Characteristic | Number | Measure |
| Per Capita Income | 17,314 | $35,737 |
| Median Family Income | 4,802 | $94,137 |
| Mean Family Income | 4,802 | $105,128 |
| Median Household Income | 6,719 | $80,043 |
| Mean Household Income | 6,719 | $92,428 |
| Income Deficit | 4,802 | $0 |
| Wage / Income Gap (%) | 17,314 | 24.60% |
| Wage / Income Gap ($) | 17,314 | 75.40¢ per $1 |
| Gini / Inequality Index | 17,314 | 0.37 |
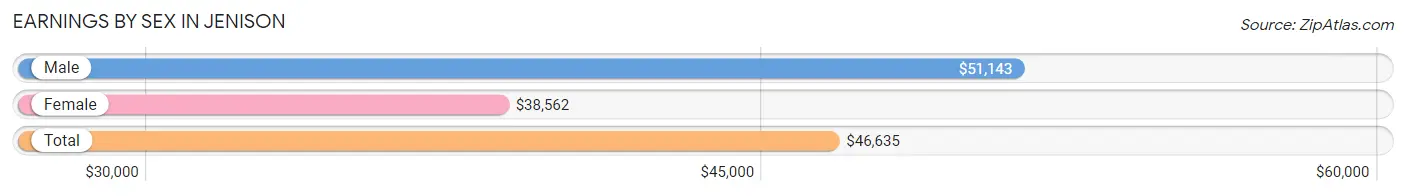
Earnings by Sex in Jenison
Average Earnings in Jenison are $46,635, $51,143 for men and $38,562 for women, a difference of 24.6%.
| Sex | Number | Average Earnings |
| Male | 5,139 (57.9%) | $51,143 |
| Female | 3,732 (42.1%) | $38,562 |
| Total | 8,871 (100.0%) | $46,635 |
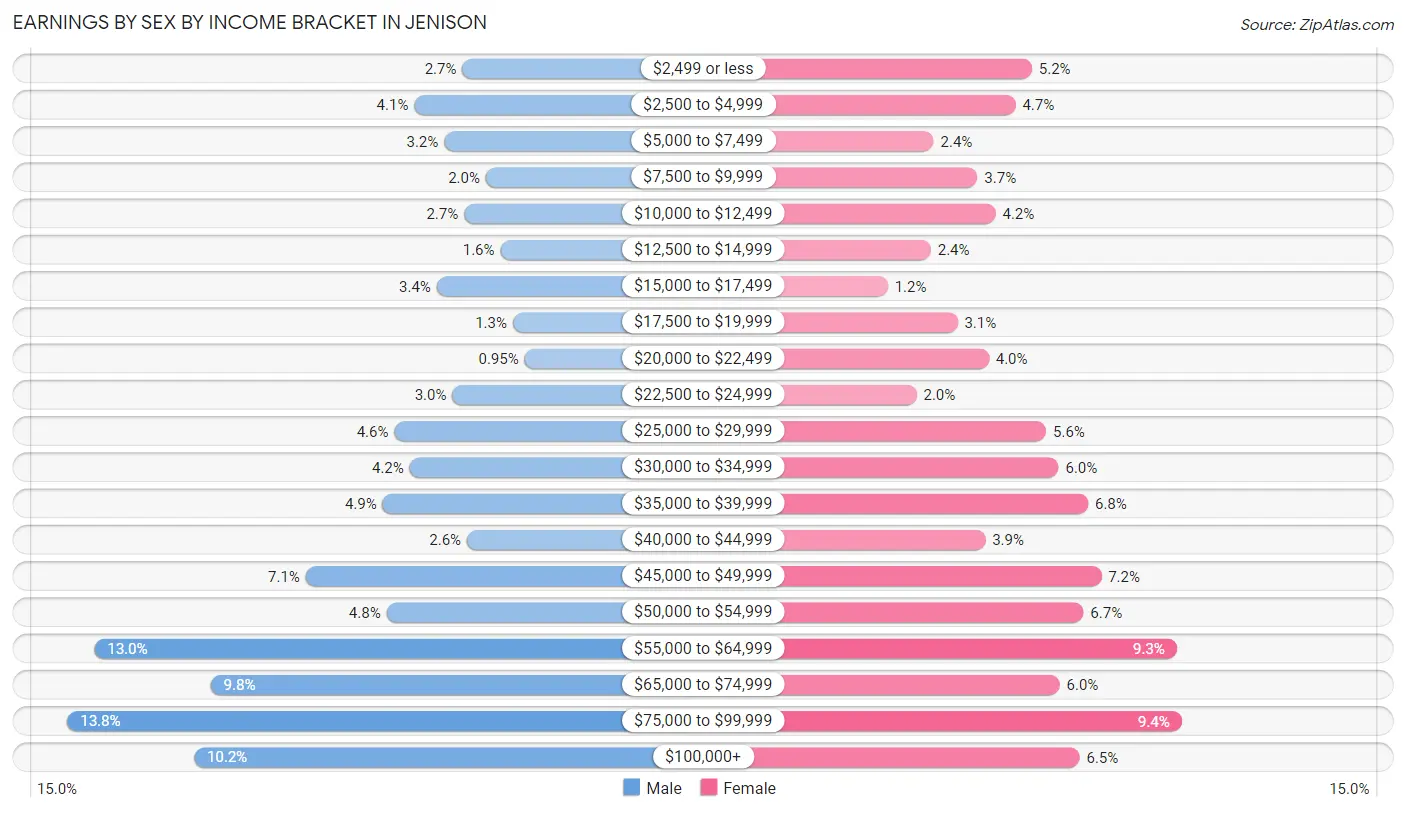
Earnings by Sex by Income Bracket in Jenison
The most common earnings brackets in Jenison are $75,000 to $99,999 for men (709 | 13.8%) and $75,000 to $99,999 for women (351 | 9.4%).
| Income | Male | Female |
| $2,499 or less | 139 (2.7%) | 194 (5.2%) |
| $2,500 to $4,999 | 208 (4.1%) | 177 (4.7%) |
| $5,000 to $7,499 | 165 (3.2%) | 91 (2.4%) |
| $7,500 to $9,999 | 105 (2.0%) | 137 (3.7%) |
| $10,000 to $12,499 | 136 (2.6%) | 156 (4.2%) |
| $12,500 to $14,999 | 84 (1.6%) | 88 (2.4%) |
| $15,000 to $17,499 | 176 (3.4%) | 43 (1.1%) |
| $17,500 to $19,999 | 66 (1.3%) | 116 (3.1%) |
| $20,000 to $22,499 | 49 (0.9%) | 149 (4.0%) |
| $22,500 to $24,999 | 153 (3.0%) | 73 (2.0%) |
| $25,000 to $29,999 | 237 (4.6%) | 209 (5.6%) |
| $30,000 to $34,999 | 215 (4.2%) | 222 (5.9%) |
| $35,000 to $39,999 | 254 (4.9%) | 253 (6.8%) |
| $40,000 to $44,999 | 132 (2.6%) | 145 (3.9%) |
| $45,000 to $49,999 | 365 (7.1%) | 267 (7.1%) |
| $50,000 to $54,999 | 248 (4.8%) | 248 (6.7%) |
| $55,000 to $64,999 | 670 (13.0%) | 346 (9.3%) |
| $65,000 to $74,999 | 502 (9.8%) | 223 (6.0%) |
| $75,000 to $99,999 | 709 (13.8%) | 351 (9.4%) |
| $100,000+ | 526 (10.2%) | 244 (6.5%) |
| Total | 5,139 (100.0%) | 3,732 (100.0%) |
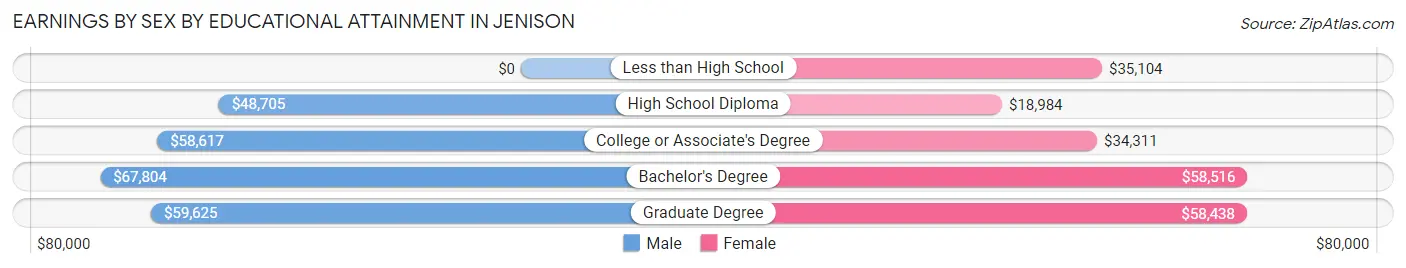
Earnings by Sex by Educational Attainment in Jenison
Average earnings in Jenison are $57,940 for men and $43,852 for women, a difference of 24.3%. Men with an educational attainment of bachelor's degree enjoy the highest average annual earnings of $67,804, while those with high school diploma education earn the least with $48,705. Women with an educational attainment of bachelor's degree earn the most with the average annual earnings of $58,516, while those with high school diploma education have the smallest earnings of $18,984.
| Educational Attainment | Male Income | Female Income |
| Less than High School | - | - |
| High School Diploma | $48,705 | $18,984 |
| College or Associate's Degree | $58,617 | $34,311 |
| Bachelor's Degree | $67,804 | $58,516 |
| Graduate Degree | $59,625 | $58,438 |
| Total | $57,940 | $43,852 |
Family Income in Jenison
Family Income Brackets in Jenison
According to the Jenison family income data, there are 1,460 families falling into the $100,000 to $149,999 income range, which is the most common income bracket and makes up 30.4% of all families. Conversely, the less than $10,000 income bracket is the least frequent group with only 10 families (0.2%) belonging to this category.
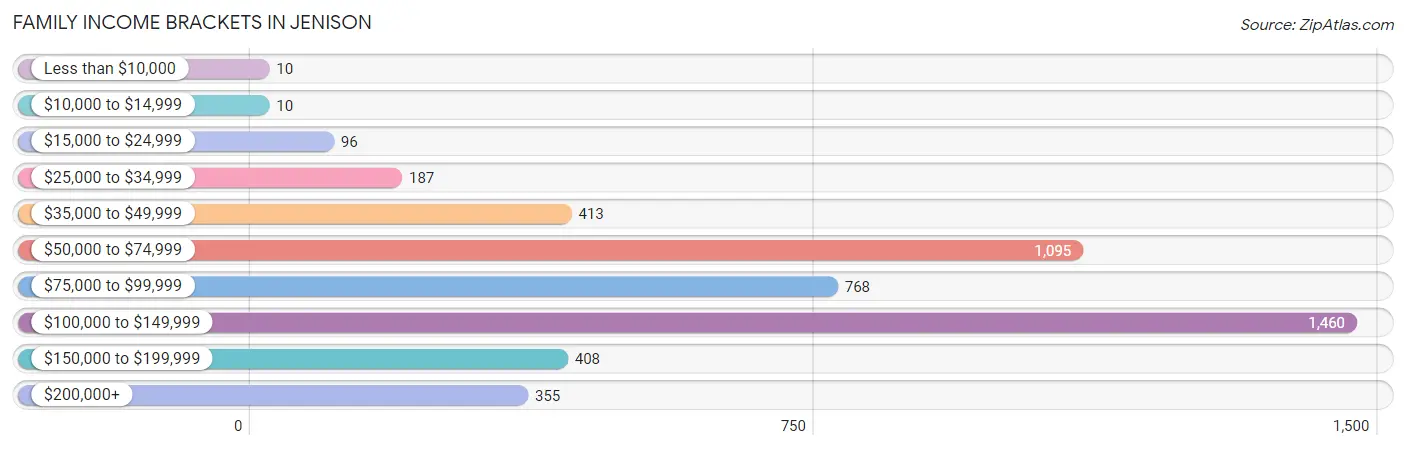
| Income Bracket | # Families | % Families |
| Less than $10,000 | 10 | 0.2% |
| $10,000 to $14,999 | 10 | 0.2% |
| $15,000 to $24,999 | 96 | 2.0% |
| $25,000 to $34,999 | 187 | 3.9% |
| $35,000 to $49,999 | 413 | 8.6% |
| $50,000 to $74,999 | 1,095 | 22.8% |
| $75,000 to $99,999 | 768 | 16.0% |
| $100,000 to $149,999 | 1,460 | 30.4% |
| $150,000 to $199,999 | 408 | 8.5% |
| $200,000+ | 355 | 7.4% |
Family Income by Famaliy Size in Jenison
5-person families (435 | 9.1%) account for the highest median family income in Jenison with $141,083 per family, while 2-person families (2,239 | 46.6%) have the highest median income of $36,834 per family member.
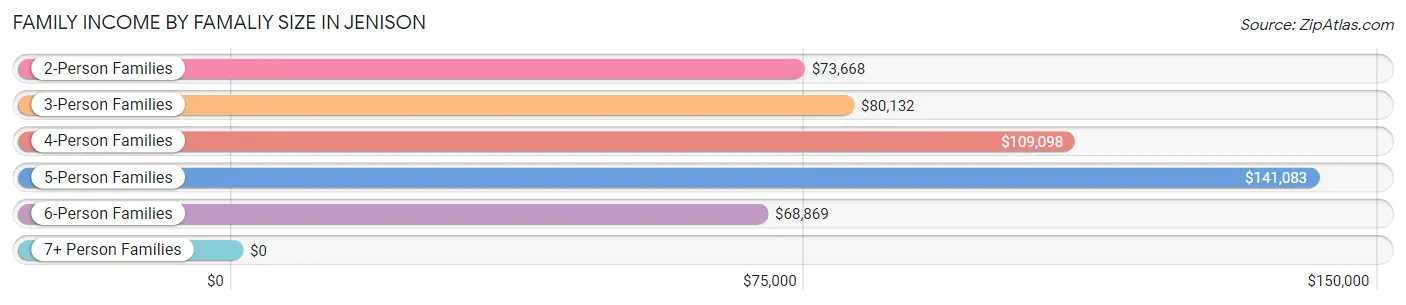
| Income Bracket | # Families | Median Income |
| 2-Person Families | 2,239 (46.6%) | $73,668 |
| 3-Person Families | 852 (17.7%) | $80,132 |
| 4-Person Families | 1,058 (22.0%) | $109,098 |
| 5-Person Families | 435 (9.1%) | $141,083 |
| 6-Person Families | 165 (3.4%) | $68,869 |
| 7+ Person Families | 53 (1.1%) | $0 |
| Total | 4,802 (100.0%) | $94,137 |
Family Income by Number of Earners in Jenison
The median family income in Jenison is $94,137, with families comprising 3+ earners (889) having the highest median family income of $132,538, while families with no earners (846) have the lowest median family income of $52,813, accounting for 18.5% and 17.6% of families, respectively.
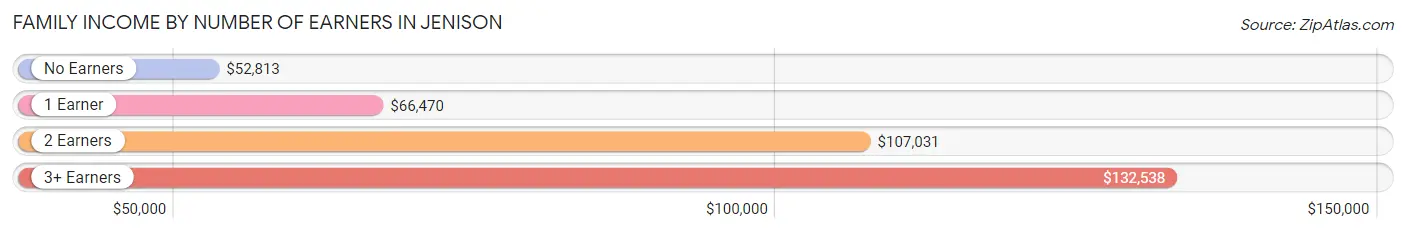
| Number of Earners | # Families | Median Income |
| No Earners | 846 (17.6%) | $52,813 |
| 1 Earner | 1,089 (22.7%) | $66,470 |
| 2 Earners | 1,978 (41.2%) | $107,031 |
| 3+ Earners | 889 (18.5%) | $132,538 |
| Total | 4,802 (100.0%) | $94,137 |
Household Income in Jenison
Household Income Brackets in Jenison
With 1,619 households falling in the category, the $100,000 to $149,999 income range is the most frequent in Jenison, accounting for 24.1% of all households. In contrast, only 74 households (1.1%) fall into the $10,000 to $14,999 income bracket, making it the least populous group.
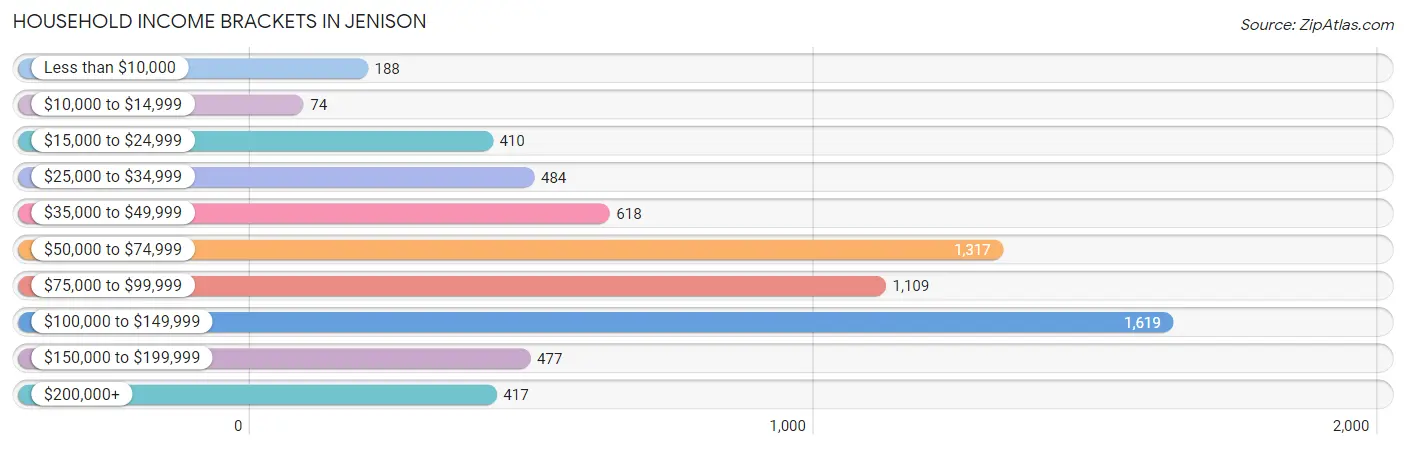
| Income Bracket | # Households | % Households |
| Less than $10,000 | 188 | 2.8% |
| $10,000 to $14,999 | 74 | 1.1% |
| $15,000 to $24,999 | 410 | 6.1% |
| $25,000 to $34,999 | 484 | 7.2% |
| $35,000 to $49,999 | 618 | 9.2% |
| $50,000 to $74,999 | 1,317 | 19.6% |
| $75,000 to $99,999 | 1,109 | 16.5% |
| $100,000 to $149,999 | 1,619 | 24.1% |
| $150,000 to $199,999 | 477 | 7.1% |
| $200,000+ | 417 | 6.2% |
Household Income by Householder Age in Jenison
The median household income in Jenison is $80,043, with the highest median household income of $116,220 found in the 45 to 64 years age bracket for the primary householder. A total of 1,793 households (26.7%) fall into this category. Meanwhile, the 65+ years age bracket for the primary householder has the lowest median household income of $49,491, with 2,713 households (40.4%) in this group.
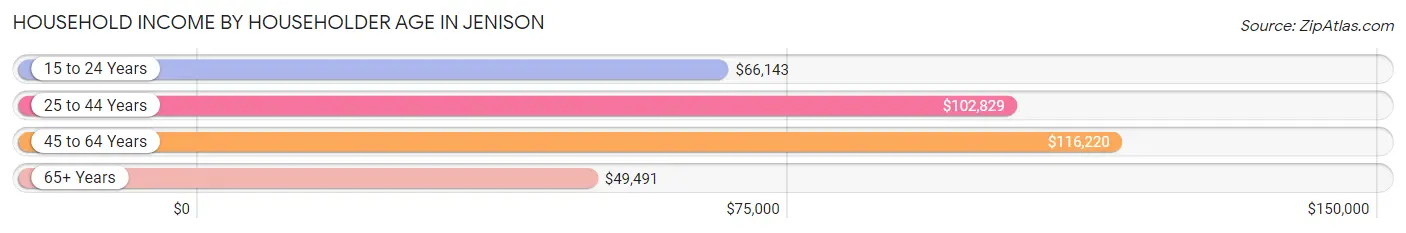
| Income Bracket | # Households | Median Income |
| 15 to 24 Years | 263 (3.9%) | $66,143 |
| 25 to 44 Years | 1,950 (29.0%) | $102,829 |
| 45 to 64 Years | 1,793 (26.7%) | $116,220 |
| 65+ Years | 2,713 (40.4%) | $49,491 |
| Total | 6,719 (100.0%) | $80,043 |
Poverty in Jenison
Income Below Poverty by Sex and Age in Jenison
With 5.5% poverty level for males and 4.5% for females among the residents of Jenison, 12 to 14 year old males and 6 to 11 year old females are the most vulnerable to poverty, with 51 males (27.0%) and 70 females (10.3%) in their respective age groups living below the poverty level.
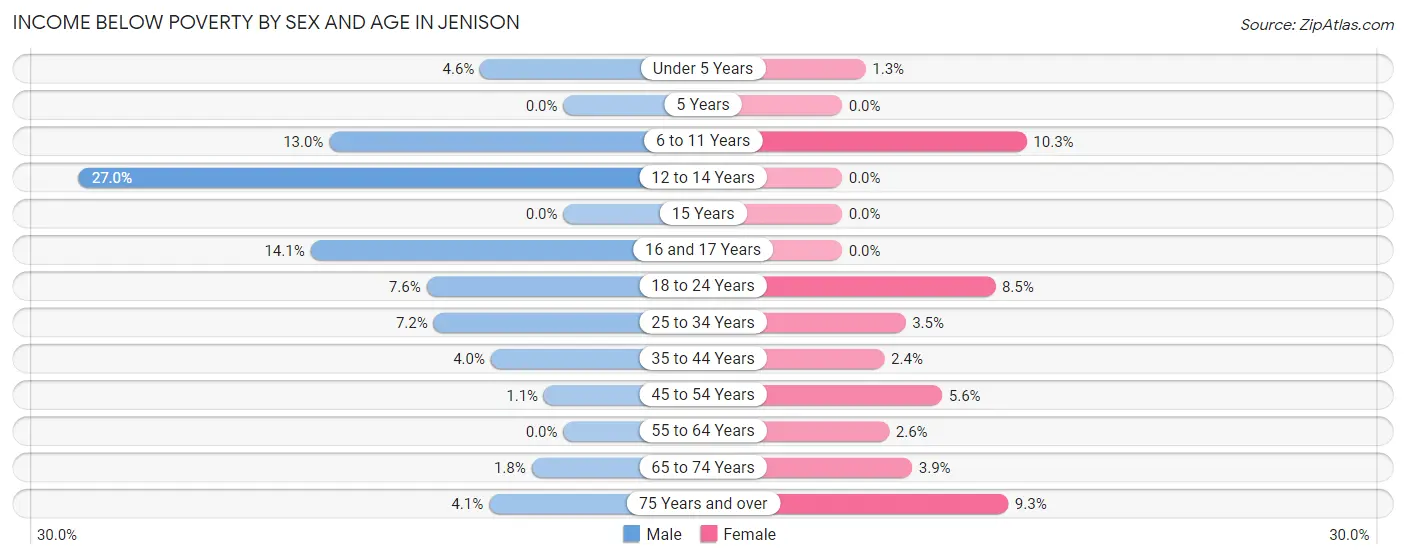
| Age Bracket | Male | Female |
| Under 5 Years | 26 (4.6%) | 9 (1.3%) |
| 5 Years | 0 (0.0%) | 0 (0.0%) |
| 6 to 11 Years | 96 (13.0%) | 70 (10.3%) |
| 12 to 14 Years | 51 (27.0%) | 0 (0.0%) |
| 15 Years | 0 (0.0%) | 0 (0.0%) |
| 16 and 17 Years | 40 (14.1%) | 0 (0.0%) |
| 18 to 24 Years | 63 (7.6%) | 33 (8.5%) |
| 25 to 34 Years | 79 (7.2%) | 39 (3.5%) |
| 35 to 44 Years | 46 (4.0%) | 26 (2.4%) |
| 45 to 54 Years | 8 (1.1%) | 38 (5.6%) |
| 55 to 64 Years | 0 (0.0%) | 28 (2.6%) |
| 65 to 74 Years | 16 (1.8%) | 39 (3.9%) |
| 75 Years and over | 30 (4.1%) | 123 (9.2%) |
| Total | 455 (5.5%) | 405 (4.5%) |
Income Above Poverty by Sex and Age in Jenison
According to the poverty statistics in Jenison, males aged 5 years and females aged 5 years are the age groups that are most secure financially, with 100.0% of males and 100.0% of females in these age groups living above the poverty line.
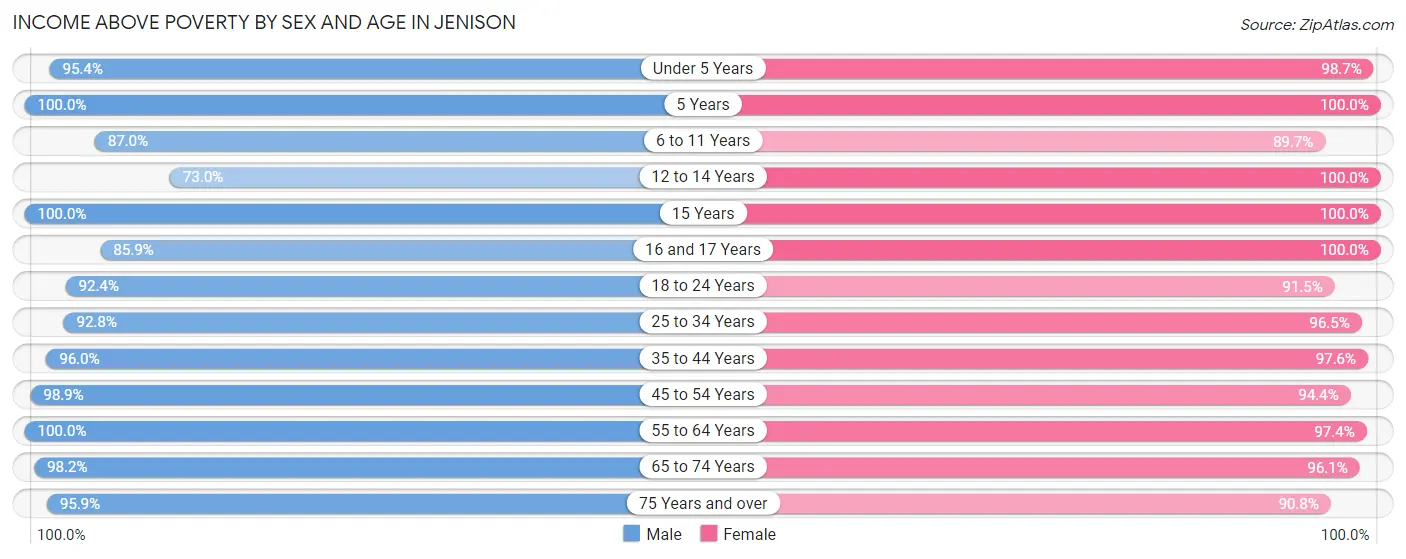
| Age Bracket | Male | Female |
| Under 5 Years | 535 (95.4%) | 676 (98.7%) |
| 5 Years | 85 (100.0%) | 142 (100.0%) |
| 6 to 11 Years | 640 (87.0%) | 611 (89.7%) |
| 12 to 14 Years | 138 (73.0%) | 393 (100.0%) |
| 15 Years | 59 (100.0%) | 186 (100.0%) |
| 16 and 17 Years | 244 (85.9%) | 170 (100.0%) |
| 18 to 24 Years | 764 (92.4%) | 354 (91.5%) |
| 25 to 34 Years | 1,014 (92.8%) | 1,067 (96.5%) |
| 35 to 44 Years | 1,093 (96.0%) | 1,078 (97.6%) |
| 45 to 54 Years | 735 (98.9%) | 644 (94.4%) |
| 55 to 64 Years | 927 (100.0%) | 1,039 (97.4%) |
| 65 to 74 Years | 889 (98.2%) | 961 (96.1%) |
| 75 Years and over | 695 (95.9%) | 1,207 (90.7%) |
| Total | 7,818 (94.5%) | 8,528 (95.5%) |
Income Below Poverty Among Married-Couple Families in Jenison
The poverty statistics for married-couple families in Jenison show that 1.4% or 60 of the total 4,307 families live below the poverty line. Families with 5 or more children have the highest poverty rate of 78.3%, comprising of 18 families. On the other hand, families with 3 or 4 children have the lowest poverty rate of 0.0%, which includes 0 families.
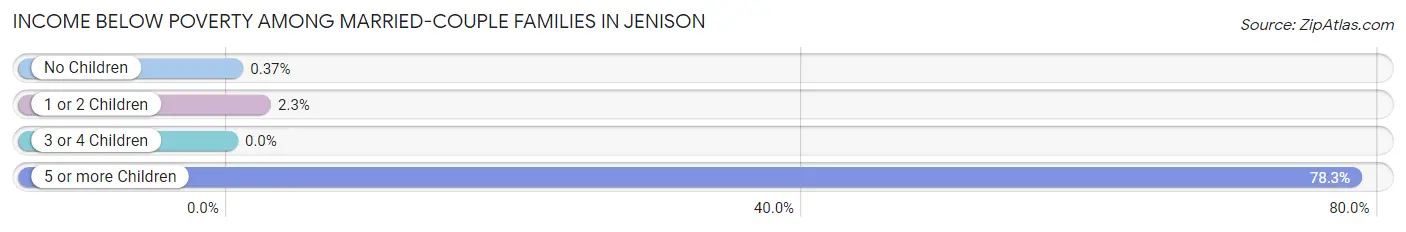
| Children | Above Poverty | Below Poverty |
| No Children | 2,415 (99.6%) | 9 (0.4%) |
| 1 or 2 Children | 1,401 (97.7%) | 33 (2.3%) |
| 3 or 4 Children | 426 (100.0%) | 0 (0.0%) |
| 5 or more Children | 5 (21.7%) | 18 (78.3%) |
| Total | 4,247 (98.6%) | 60 (1.4%) |
Income Below Poverty Among Single-Parent Households in Jenison
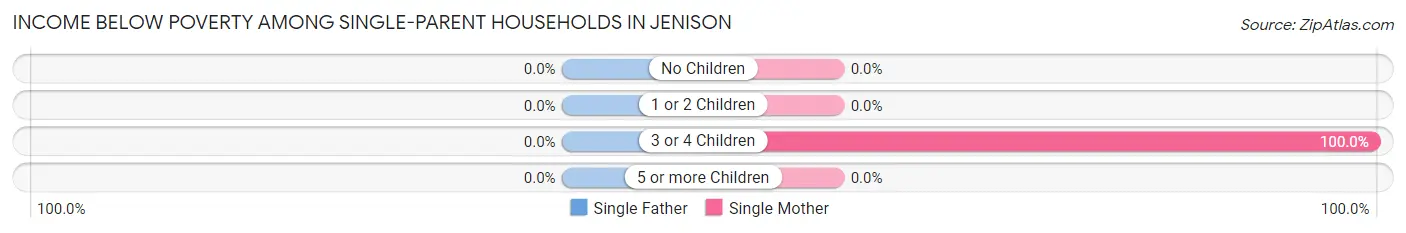
| Children | Single Father | Single Mother |
| No Children | 0 (0.0%) | 0 (0.0%) |
| 1 or 2 Children | 0 (0.0%) | 0 (0.0%) |
| 3 or 4 Children | 0 (0.0%) | 20 (100.0%) |
| 5 or more Children | 0 (0.0%) | 0 (0.0%) |
| Total | 0 (0.0%) | 20 (6.4%) |
Income Below Poverty Among Married-Couple vs Single-Parent Households in Jenison
The poverty data for Jenison shows that 60 of the married-couple family households (1.4%) and 20 of the single-parent households (4.0%) are living below the poverty level. Within the married-couple family households, those with 5 or more children have the highest poverty rate, with 18 households (78.3%) falling below the poverty line. Among the single-parent households, those with 3 or 4 children have the highest poverty rate, with 20 household (31.8%) living below poverty.
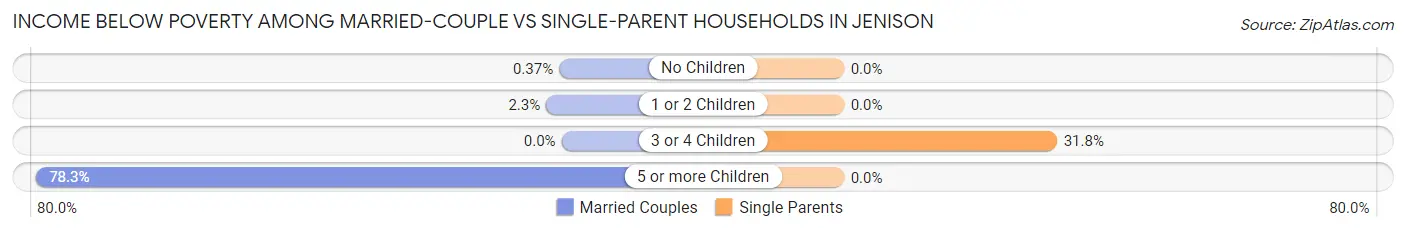
| Children | Married-Couple Families | Single-Parent Households |
| No Children | 9 (0.4%) | 0 (0.0%) |
| 1 or 2 Children | 33 (2.3%) | 0 (0.0%) |
| 3 or 4 Children | 0 (0.0%) | 20 (31.8%) |
| 5 or more Children | 18 (78.3%) | 0 (0.0%) |
| Total | 60 (1.4%) | 20 (4.0%) |
Race in Jenison
The most populous races in Jenison are White / Caucasian (16,673 | 96.3%), Hispanic or Latino (655 | 3.8%), and Two or more Races (236 | 1.4%).
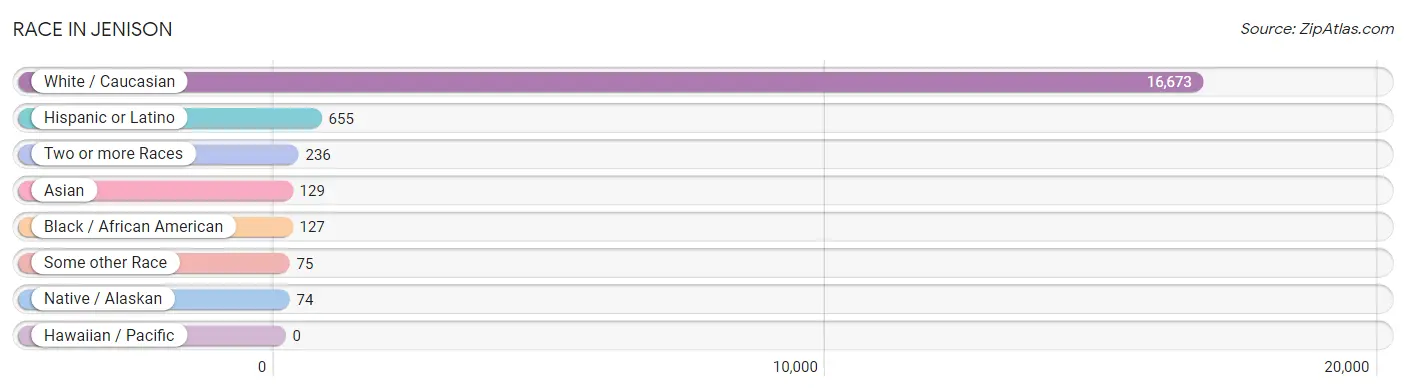
| Race | # Population | % Population |
| Asian | 129 | 0.7% |
| Black / African American | 127 | 0.7% |
| Hawaiian / Pacific | 0 | 0.0% |
| Hispanic or Latino | 655 | 3.8% |
| Native / Alaskan | 74 | 0.4% |
| White / Caucasian | 16,673 | 96.3% |
| Two or more Races | 236 | 1.4% |
| Some other Race | 75 | 0.4% |
| Total | 17,314 | 100.0% |
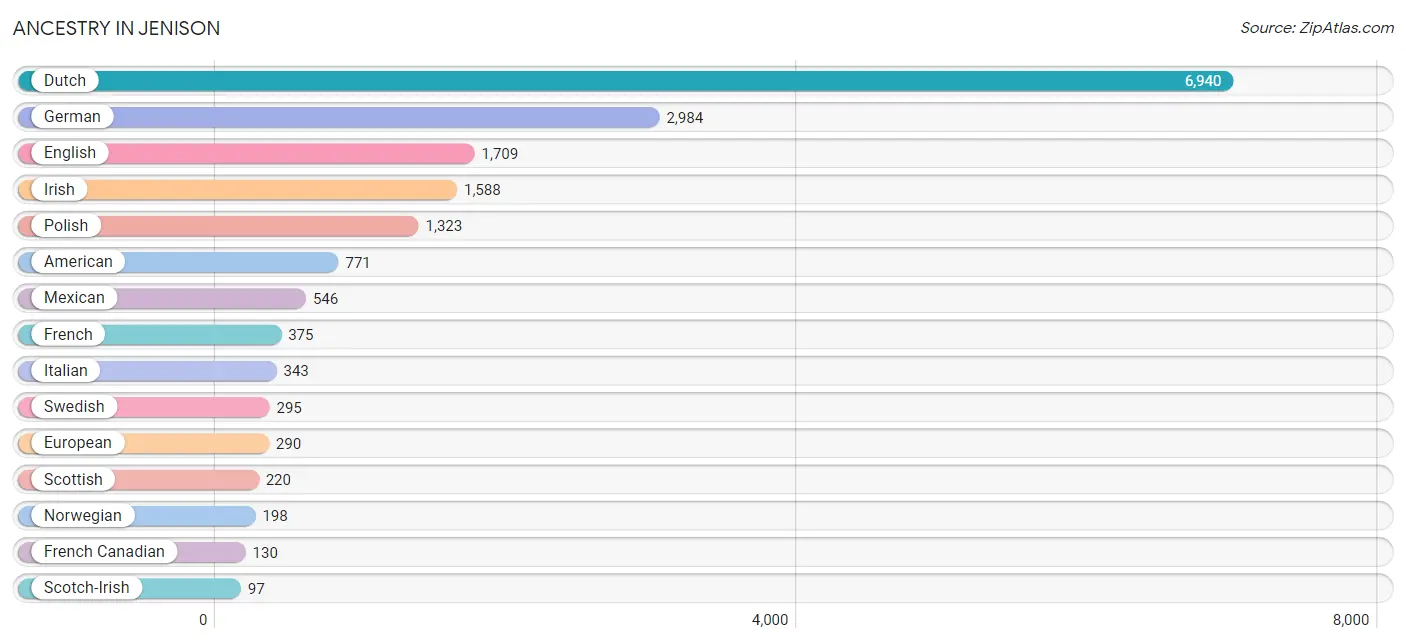
Ancestry in Jenison
The most populous ancestries reported in Jenison are Dutch (6,940 | 40.1%), German (2,984 | 17.2%), English (1,709 | 9.9%), Irish (1,588 | 9.2%), and Polish (1,323 | 7.6%), together accounting for 84.0% of all Jenison residents.
| Ancestry | # Population | % Population |
| American | 771 | 4.4% |
| Arab | 44 | 0.3% |
| Armenian | 35 | 0.2% |
| Austrian | 9 | 0.1% |
| Bhutanese | 30 | 0.2% |
| British | 92 | 0.5% |
| Bulgarian | 80 | 0.5% |
| Burmese | 21 | 0.1% |
| Canadian | 75 | 0.4% |
| Cheyenne | 3 | 0.0% |
| Chippewa | 10 | 0.1% |
| Czech | 61 | 0.4% |
| Czechoslovakian | 19 | 0.1% |
| Danish | 11 | 0.1% |
| Dutch | 6,940 | 40.1% |
| Eastern European | 23 | 0.1% |
| English | 1,709 | 9.9% |
| Ethiopian | 45 | 0.3% |
| European | 290 | 1.7% |
| French | 375 | 2.2% |
| French Canadian | 130 | 0.7% |
| German | 2,984 | 17.2% |
| Greek | 65 | 0.4% |
| Hungarian | 7 | 0.0% |
| Indian (Asian) | 19 | 0.1% |
| Irish | 1,588 | 9.2% |
| Italian | 343 | 2.0% |
| Japanese | 53 | 0.3% |
| Lebanese | 22 | 0.1% |
| Lithuanian | 62 | 0.4% |
| Macedonian | 21 | 0.1% |
| Mexican | 546 | 3.2% |
| Northern European | 8 | 0.1% |
| Norwegian | 198 | 1.1% |
| Ottawa | 24 | 0.1% |
| Pakistani | 50 | 0.3% |
| Peruvian | 85 | 0.5% |
| Polish | 1,323 | 7.6% |
| Scandinavian | 60 | 0.4% |
| Scotch-Irish | 97 | 0.6% |
| Scottish | 220 | 1.3% |
| Slavic | 15 | 0.1% |
| Slovak | 9 | 0.1% |
| South American | 85 | 0.5% |
| South American Indian | 85 | 0.5% |
| Subsaharan African | 45 | 0.3% |
| Swedish | 295 | 1.7% |
| Swiss | 46 | 0.3% |
| Syrian | 22 | 0.1% |
| Thai | 22 | 0.1% |
| Vietnamese | 17 | 0.1% |
| Welsh | 65 | 0.4% | View All 52 Rows |
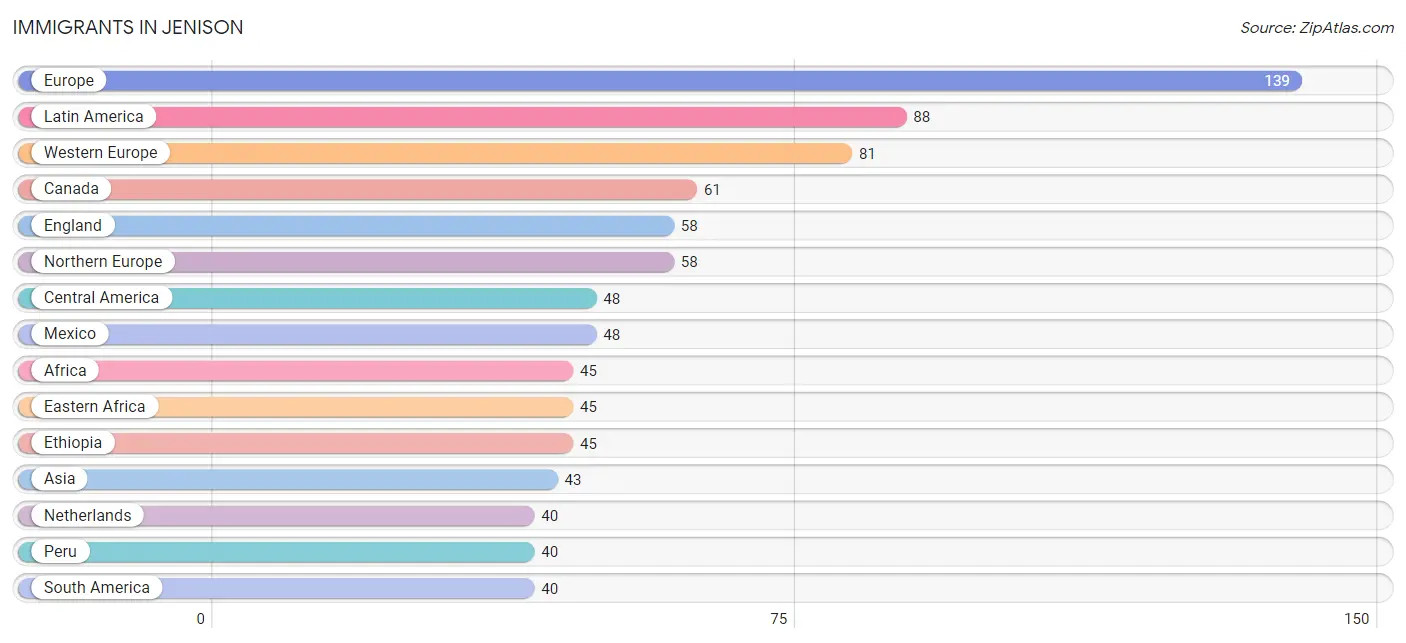
Immigrants in Jenison
The most numerous immigrant groups reported in Jenison came from Europe (139 | 0.8%), Latin America (88 | 0.5%), Western Europe (81 | 0.5%), Canada (61 | 0.4%), and England (58 | 0.3%), together accounting for 2.5% of all Jenison residents.
| Immigration Origin | # Population | % Population |
| Africa | 45 | 0.3% |
| Asia | 43 | 0.3% |
| Bangladesh | 8 | 0.1% |
| Canada | 61 | 0.4% |
| Central America | 48 | 0.3% |
| Eastern Africa | 45 | 0.3% |
| Eastern Asia | 11 | 0.1% |
| England | 58 | 0.3% |
| Ethiopia | 45 | 0.3% |
| Europe | 139 | 0.8% |
| France | 21 | 0.1% |
| Germany | 20 | 0.1% |
| Korea | 11 | 0.1% |
| Latin America | 88 | 0.5% |
| Mexico | 48 | 0.3% |
| Netherlands | 40 | 0.2% |
| Northern Europe | 58 | 0.3% |
| Peru | 40 | 0.2% |
| South America | 40 | 0.2% |
| South Central Asia | 8 | 0.1% |
| South Eastern Asia | 24 | 0.1% |
| Thailand | 24 | 0.1% |
| Western Europe | 81 | 0.5% | View All 23 Rows |
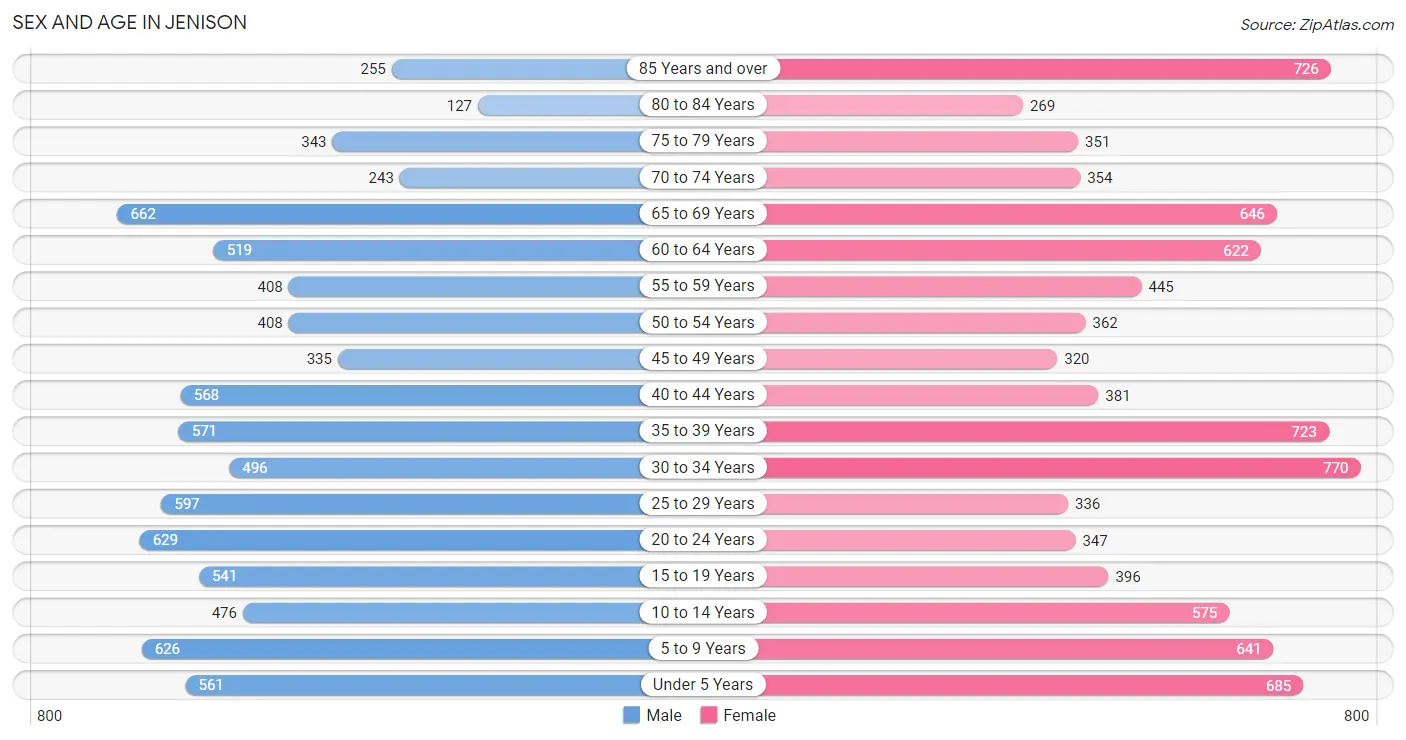
Sex and Age in Jenison
Sex and Age in Jenison
The most populous age groups in Jenison are 65 to 69 Years (662 | 7.9%) for men and 30 to 34 Years (770 | 8.6%) for women.
| Age Bracket | Male | Female |
| Under 5 Years | 561 (6.7%) | 685 (7.6%) |
| 5 to 9 Years | 626 (7.5%) | 641 (7.2%) |
| 10 to 14 Years | 476 (5.7%) | 575 (6.4%) |
| 15 to 19 Years | 541 (6.5%) | 396 (4.4%) |
| 20 to 24 Years | 629 (7.5%) | 347 (3.9%) |
| 25 to 29 Years | 597 (7.1%) | 336 (3.7%) |
| 30 to 34 Years | 496 (5.9%) | 770 (8.6%) |
| 35 to 39 Years | 571 (6.8%) | 723 (8.1%) |
| 40 to 44 Years | 568 (6.8%) | 381 (4.3%) |
| 45 to 49 Years | 335 (4.0%) | 320 (3.6%) |
| 50 to 54 Years | 408 (4.9%) | 362 (4.1%) |
| 55 to 59 Years | 408 (4.9%) | 445 (5.0%) |
| 60 to 64 Years | 519 (6.2%) | 622 (7.0%) |
| 65 to 69 Years | 662 (7.9%) | 646 (7.2%) |
| 70 to 74 Years | 243 (2.9%) | 354 (4.0%) |
| 75 to 79 Years | 343 (4.1%) | 351 (3.9%) |
| 80 to 84 Years | 127 (1.5%) | 269 (3.0%) |
| 85 Years and over | 255 (3.0%) | 726 (8.1%) |
| Total | 8,365 (100.0%) | 8,949 (100.0%) |
Families and Households in Jenison
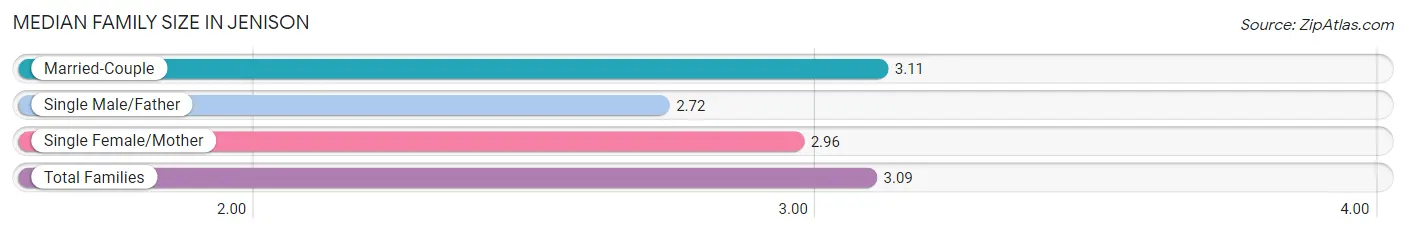
Median Family Size in Jenison
The median family size in Jenison is 3.09 persons per family, with married-couple families (4,307 | 89.7%) accounting for the largest median family size of 3.11 persons per family. On the other hand, single male/father families (184 | 3.8%) represent the smallest median family size with 2.72 persons per family.
| Family Type | # Families | Family Size |
| Married-Couple | 4,307 (89.7%) | 3.11 |
| Single Male/Father | 184 (3.8%) | 2.72 |
| Single Female/Mother | 311 (6.5%) | 2.96 |
| Total Families | 4,802 (100.0%) | 3.09 |
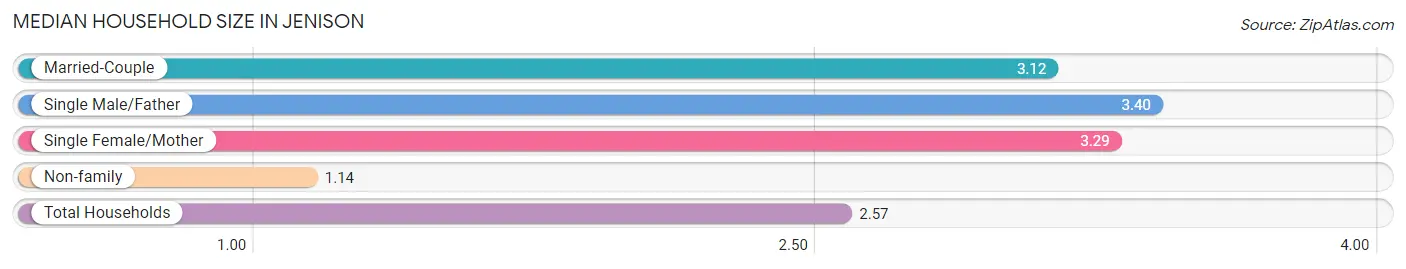
Median Household Size in Jenison
The median household size in Jenison is 2.57 persons per household, with single male/father households (184 | 2.7%) accounting for the largest median household size of 3.4 persons per household. non-family households (1,917 | 28.5%) represent the smallest median household size with 1.14 persons per household.
| Household Type | # Households | Household Size |
| Married-Couple | 4,307 (64.1%) | 3.12 |
| Single Male/Father | 184 (2.7%) | 3.40 |
| Single Female/Mother | 311 (4.6%) | 3.29 |
| Non-family | 1,917 (28.5%) | 1.14 |
| Total Households | 6,719 (100.0%) | 2.57 |
Household Size by Marriage Status in Jenison
Out of a total of 6,719 households in Jenison, 4,802 (71.5%) are family households, while 1,917 (28.5%) are nonfamily households. The most numerous type of family households are 2-person households, comprising 2,229, and the most common type of nonfamily households are 1-person households, comprising 1,737.
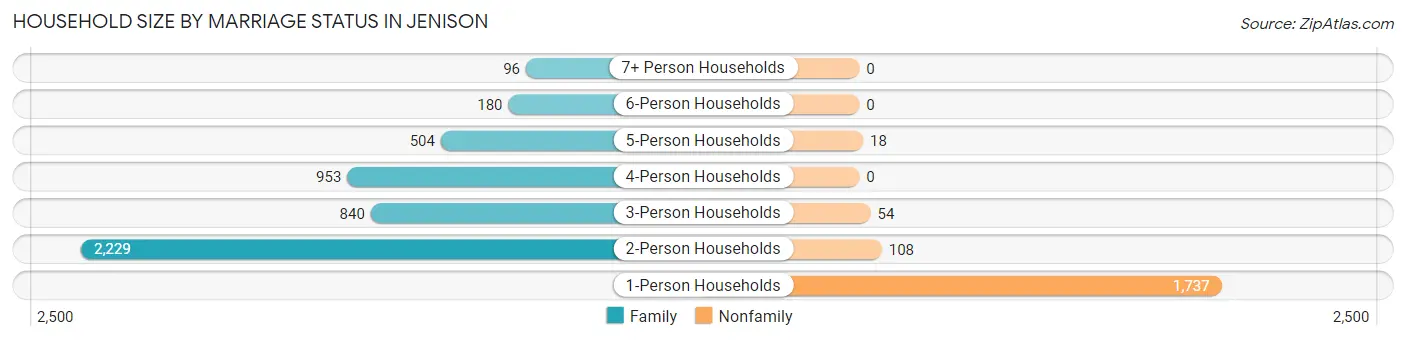
| Household Size | Family Households | Nonfamily Households |
| 1-Person Households | - | 1,737 (25.9%) |
| 2-Person Households | 2,229 (33.2%) | 108 (1.6%) |
| 3-Person Households | 840 (12.5%) | 54 (0.8%) |
| 4-Person Households | 953 (14.2%) | 0 (0.0%) |
| 5-Person Households | 504 (7.5%) | 18 (0.3%) |
| 6-Person Households | 180 (2.7%) | 0 (0.0%) |
| 7+ Person Households | 96 (1.4%) | 0 (0.0%) |
| Total | 4,802 (71.5%) | 1,917 (28.5%) |
Female Fertility in Jenison
Fertility by Age in Jenison
Average fertility rate in Jenison is 88.0 births per 1,000 women. Women in the age bracket of 20 to 34 years have the highest fertility rate with 178.0 births per 1,000 women. Women in the age bracket of 20 to 34 years acount for 87.5% of all women with births.
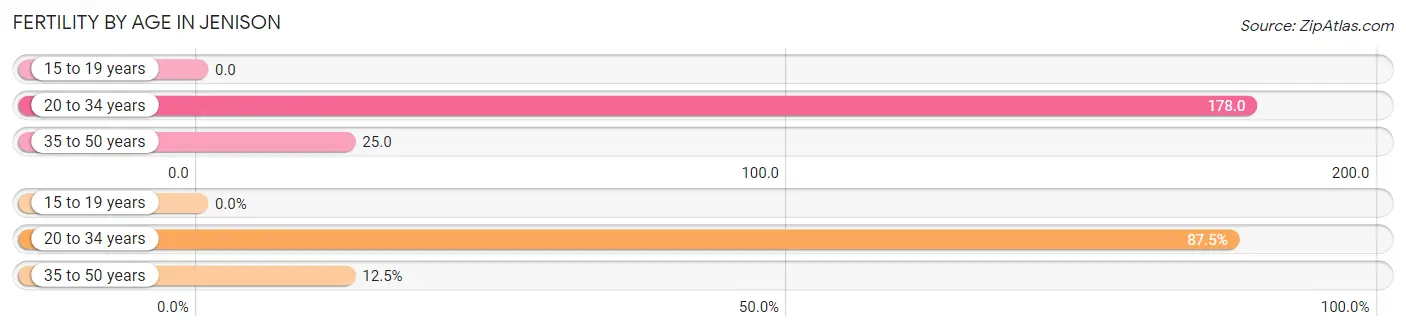
| Age Bracket | Women with Births | Births / 1,000 Women |
| 15 to 19 years | 0 (0.0%) | 0.0 |
| 20 to 34 years | 259 (87.5%) | 178.0 |
| 35 to 50 years | 37 (12.5%) | 25.0 |
| Total | 296 (100.0%) | 88.0 |
Fertility by Age by Marriage Status in Jenison
96.6% of women with births (296) in Jenison are married. The highest percentage of unmarried women with births falls into 35 to 50 years age bracket with 27.0% of them unmarried at the time of birth, while the lowest percentage of unmarried women with births belong to 20 to 34 years age bracket with 0.0% of them unmarried.
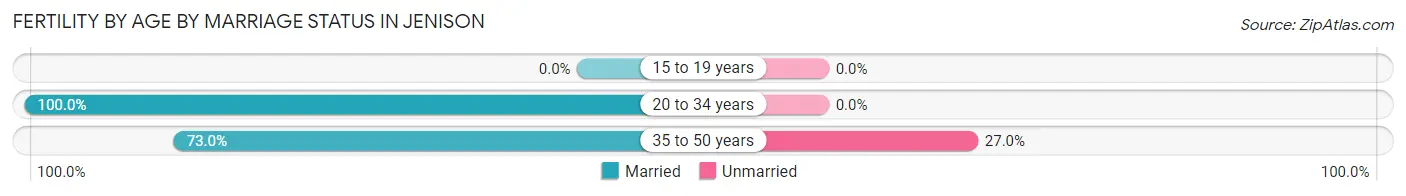
| Age Bracket | Married | Unmarried |
| 15 to 19 years | 0 (0.0%) | 0 (0.0%) |
| 20 to 34 years | 259 (100.0%) | 0 (0.0%) |
| 35 to 50 years | 27 (73.0%) | 10 (27.0%) |
| Total | 286 (96.6%) | 10 (3.4%) |
Fertility by Education in Jenison
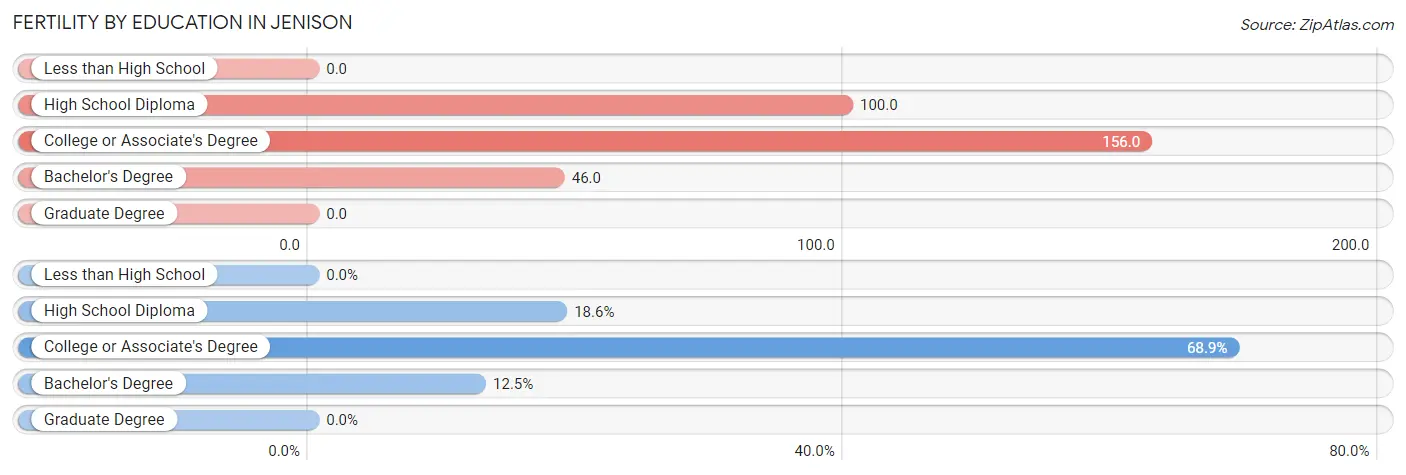
| Educational Attainment | Women with Births | Births / 1,000 Women |
| Less than High School | 0 (0.0%) | 0.0 |
| High School Diploma | 55 (18.6%) | 100.0 |
| College or Associate's Degree | 204 (68.9%) | 156.0 |
| Bachelor's Degree | 37 (12.5%) | 46.0 |
| Graduate Degree | 0 (0.0%) | 0.0 |
| Total | 296 (100.0%) | 88.0 |
Fertility by Education by Marriage Status in Jenison
3.4% of women with births in Jenison are unmarried. Women with the educational attainment of high school diploma are most likely to be married with 100.0% of them married at childbirth, while women with the educational attainment of college or associate's degree are least likely to be married with 4.9% of them unmarried at childbirth.
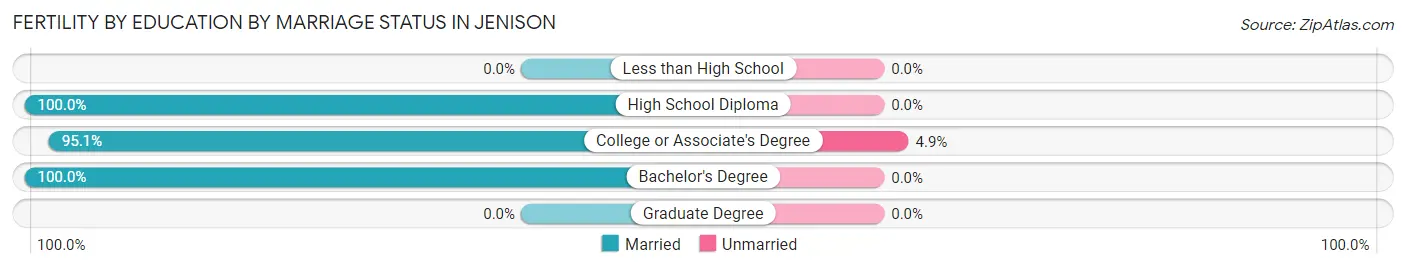
| Educational Attainment | Married | Unmarried |
| Less than High School | 0 (0.0%) | 0 (0.0%) |
| High School Diploma | 55 (100.0%) | 0 (0.0%) |
| College or Associate's Degree | 194 (95.1%) | 10 (4.9%) |
| Bachelor's Degree | 37 (100.0%) | 0 (0.0%) |
| Graduate Degree | 0 (0.0%) | 0 (0.0%) |
| Total | 286 (96.6%) | 10 (3.4%) |
Employment Characteristics in Jenison
Employment by Class of Employer in Jenison
Among the 8,110 employed individuals in Jenison, private company employees (5,750 | 70.9%), not-for-profit organizations (1,016 | 12.5%), and self-employed (not incorporated) (426 | 5.2%) make up the most common classes of employment.
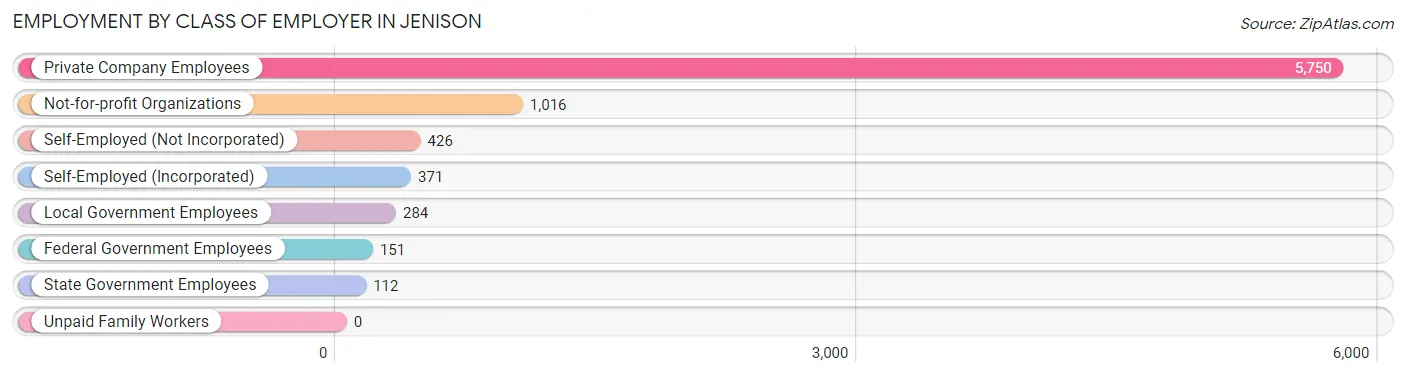
| Employer Class | # Employees | % Employees |
| Private Company Employees | 5,750 | 70.9% |
| Self-Employed (Incorporated) | 371 | 4.6% |
| Self-Employed (Not Incorporated) | 426 | 5.2% |
| Not-for-profit Organizations | 1,016 | 12.5% |
| Local Government Employees | 284 | 3.5% |
| State Government Employees | 112 | 1.4% |
| Federal Government Employees | 151 | 1.9% |
| Unpaid Family Workers | 0 | 0.0% |
| Total | 8,110 | 100.0% |
Employment Status by Age in Jenison
According to the labor force statistics for Jenison, out of the total population over 16 years of age (13,505), 62.3% or 8,414 individuals are in the labor force, with 2.1% or 177 of them unemployed. The age group with the highest labor force participation rate is 45 to 54 years, with 92.5% or 1,318 individuals in the labor force. Within the labor force, the 65 to 74 years age range has the highest percentage of unemployed individuals, with 9.7% or 43 of them being unemployed.
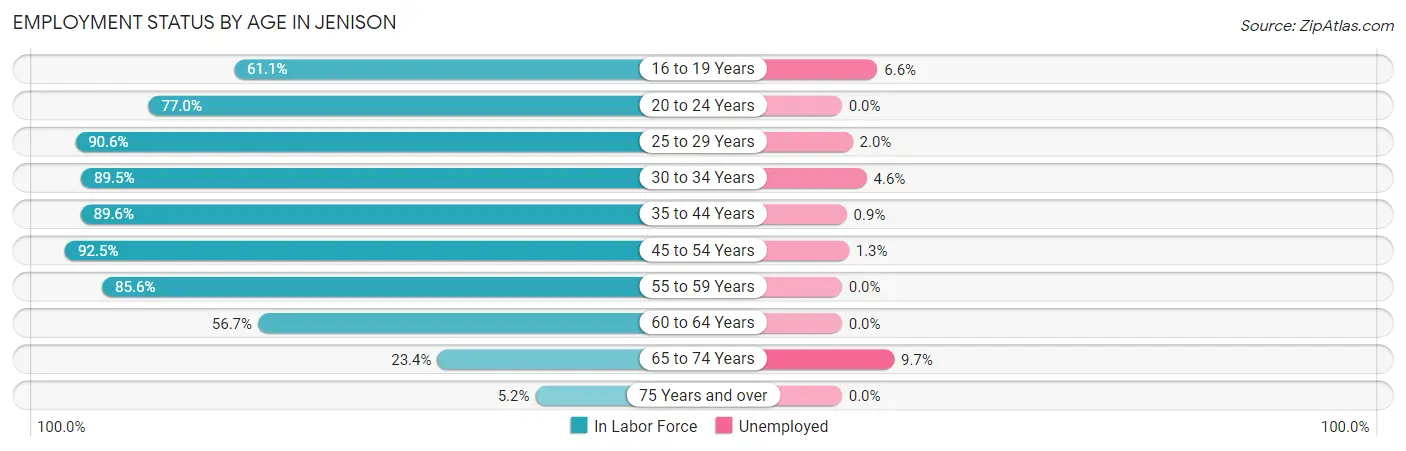
| Age Bracket | In Labor Force | Unemployed |
| 16 to 19 Years | 423 (61.1%) | 28 (6.6%) |
| 20 to 24 Years | 752 (77.0%) | 0 (0.0%) |
| 25 to 29 Years | 845 (90.6%) | 17 (2.0%) |
| 30 to 34 Years | 1,133 (89.5%) | 52 (4.6%) |
| 35 to 44 Years | 2,010 (89.6%) | 18 (0.9%) |
| 45 to 54 Years | 1,318 (92.5%) | 17 (1.3%) |
| 55 to 59 Years | 730 (85.6%) | 0 (0.0%) |
| 60 to 64 Years | 647 (56.7%) | 0 (0.0%) |
| 65 to 74 Years | 446 (23.4%) | 43 (9.7%) |
| 75 Years and over | 108 (5.2%) | 0 (0.0%) |
| Total | 8,414 (62.3%) | 177 (2.1%) |
Employment Status by Educational Attainment in Jenison
According to labor force statistics for Jenison, 85.0% of individuals (6,682) out of the total population between 25 and 64 years of age (7,861) are in the labor force, with 1.5% or 100 of them being unemployed. The group with the highest labor force participation rate are those with the educational attainment of less than high school, with 92.1% or 278 individuals in the labor force. Within the labor force, individuals with bachelor's degree or higher education have the highest percentage of unemployment, with 2.7% or 69 of them being unemployed.
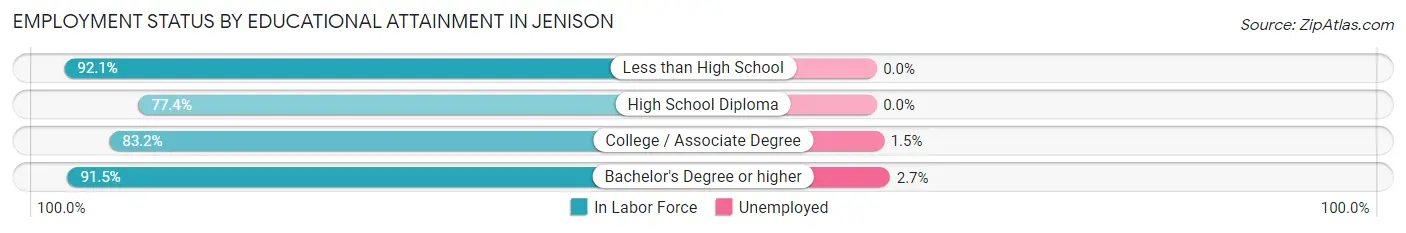
| Educational Attainment | In Labor Force | Unemployed |
| Less than High School | 278 (92.1%) | 0 (0.0%) |
| High School Diploma | 1,585 (77.4%) | 0 (0.0%) |
| College / Associate Degree | 2,264 (83.2%) | 41 (1.5%) |
| Bachelor's Degree or higher | 2,553 (91.5%) | 75 (2.7%) |
| Total | 6,682 (85.0%) | 118 (1.5%) |
Employment Occupations by Sex in Jenison
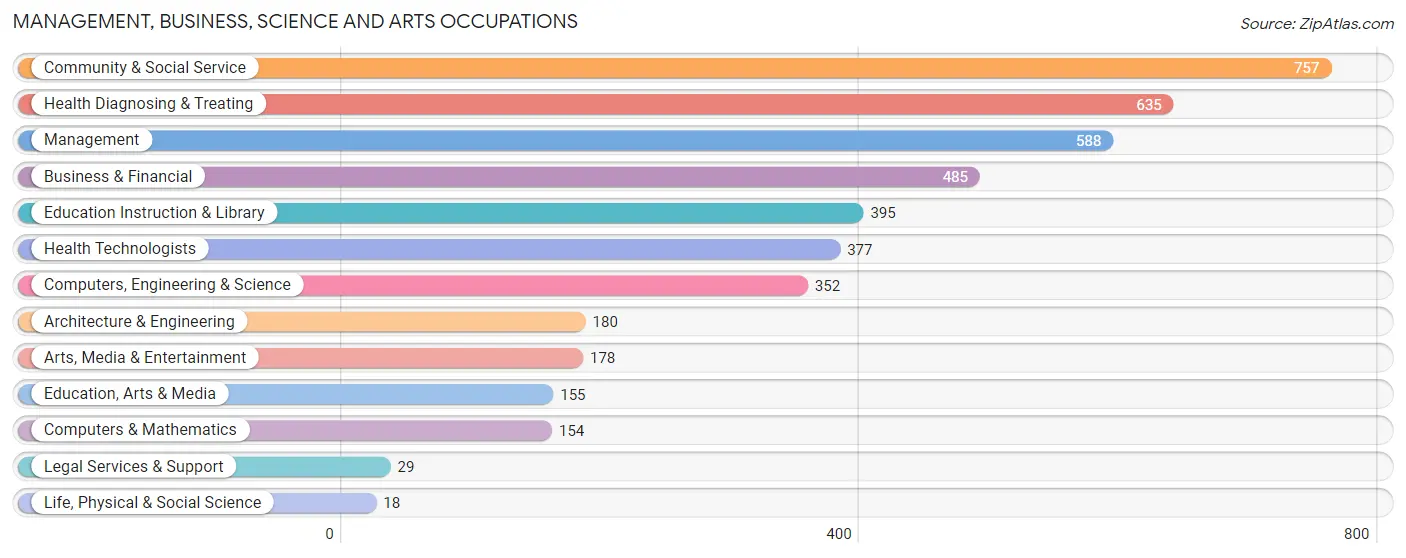
Management, Business, Science and Arts Occupations
The most common Management, Business, Science and Arts occupations in Jenison are Community & Social Service (757 | 9.2%), Health Diagnosing & Treating (635 | 7.7%), Management (588 | 7.2%), Business & Financial (485 | 5.9%), and Education Instruction & Library (395 | 4.8%).
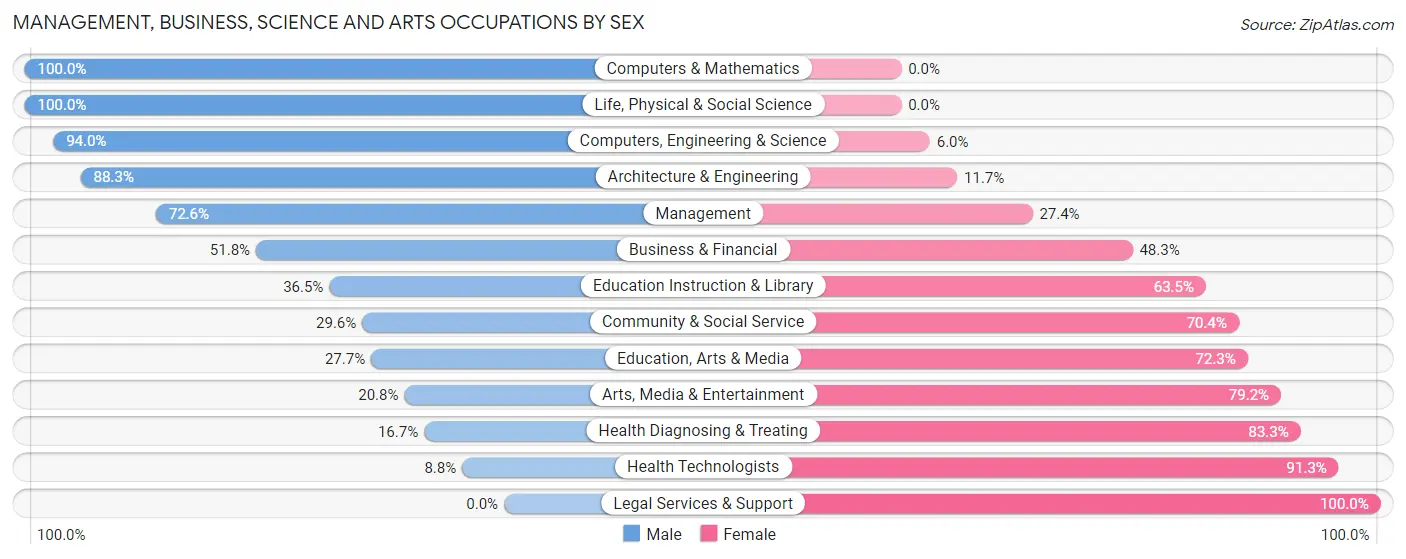
Management, Business, Science and Arts Occupations by Sex
Within the Management, Business, Science and Arts occupations in Jenison, the most male-oriented occupations are Computers & Mathematics (100.0%), Life, Physical & Social Science (100.0%), and Computers, Engineering & Science (94.0%), while the most female-oriented occupations are Legal Services & Support (100.0%), Health Technologists (91.2%), and Health Diagnosing & Treating (83.3%).
| Occupation | Male | Female |
| Management | 427 (72.6%) | 161 (27.4%) |
| Business & Financial | 251 (51.7%) | 234 (48.2%) |
| Computers, Engineering & Science | 331 (94.0%) | 21 (6.0%) |
| Computers & Mathematics | 154 (100.0%) | 0 (0.0%) |
| Architecture & Engineering | 159 (88.3%) | 21 (11.7%) |
| Life, Physical & Social Science | 18 (100.0%) | 0 (0.0%) |
| Community & Social Service | 224 (29.6%) | 533 (70.4%) |
| Education, Arts & Media | 43 (27.7%) | 112 (72.3%) |
| Legal Services & Support | 0 (0.0%) | 29 (100.0%) |
| Education Instruction & Library | 144 (36.5%) | 251 (63.5%) |
| Arts, Media & Entertainment | 37 (20.8%) | 141 (79.2%) |
| Health Diagnosing & Treating | 106 (16.7%) | 529 (83.3%) |
| Health Technologists | 33 (8.7%) | 344 (91.2%) |
| Total (Category) | 1,339 (47.5%) | 1,478 (52.5%) |
| Total (Overall) | 4,631 (56.5%) | 3,563 (43.5%) |
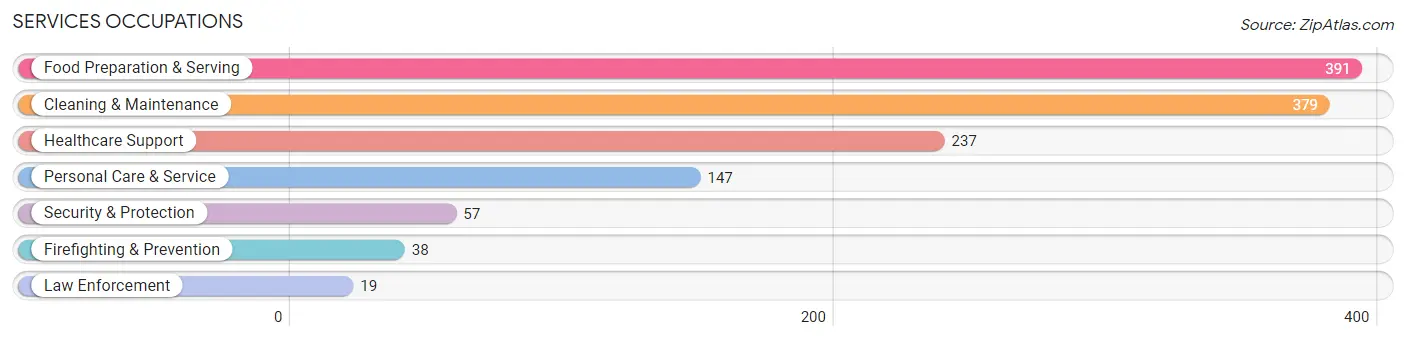
Services Occupations
The most common Services occupations in Jenison are Food Preparation & Serving (391 | 4.8%), Cleaning & Maintenance (379 | 4.6%), Healthcare Support (237 | 2.9%), Personal Care & Service (147 | 1.8%), and Security & Protection (57 | 0.7%).
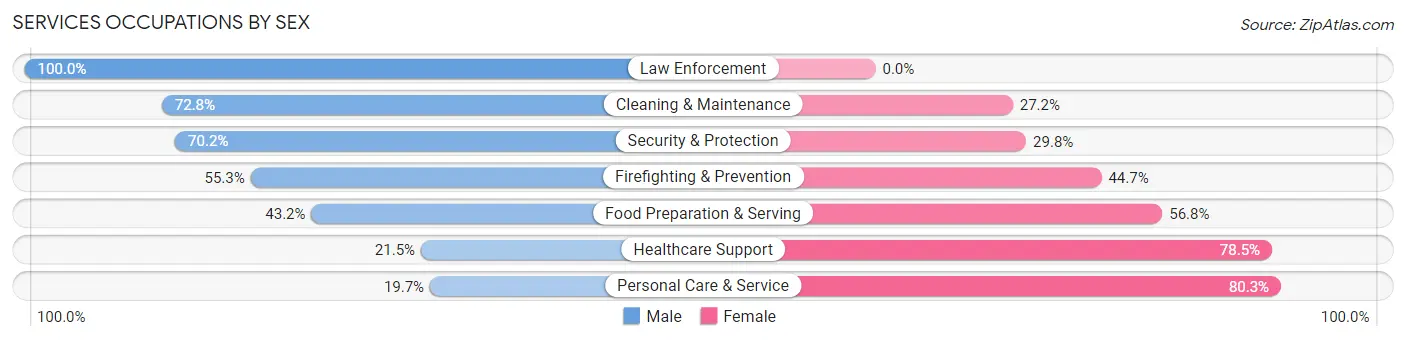
Services Occupations by Sex
Within the Services occupations in Jenison, the most male-oriented occupations are Law Enforcement (100.0%), Cleaning & Maintenance (72.8%), and Security & Protection (70.2%), while the most female-oriented occupations are Personal Care & Service (80.3%), Healthcare Support (78.5%), and Food Preparation & Serving (56.8%).
| Occupation | Male | Female |
| Healthcare Support | 51 (21.5%) | 186 (78.5%) |
| Security & Protection | 40 (70.2%) | 17 (29.8%) |
| Firefighting & Prevention | 21 (55.3%) | 17 (44.7%) |
| Law Enforcement | 19 (100.0%) | 0 (0.0%) |
| Food Preparation & Serving | 169 (43.2%) | 222 (56.8%) |
| Cleaning & Maintenance | 276 (72.8%) | 103 (27.2%) |
| Personal Care & Service | 29 (19.7%) | 118 (80.3%) |
| Total (Category) | 565 (46.7%) | 646 (53.3%) |
| Total (Overall) | 4,631 (56.5%) | 3,563 (43.5%) |
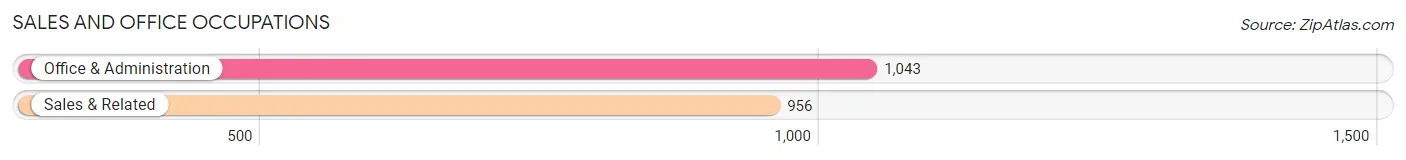
Sales and Office Occupations
The most common Sales and Office occupations in Jenison are Office & Administration (1,043 | 12.7%), and Sales & Related (956 | 11.7%).
Sales and Office Occupations by Sex
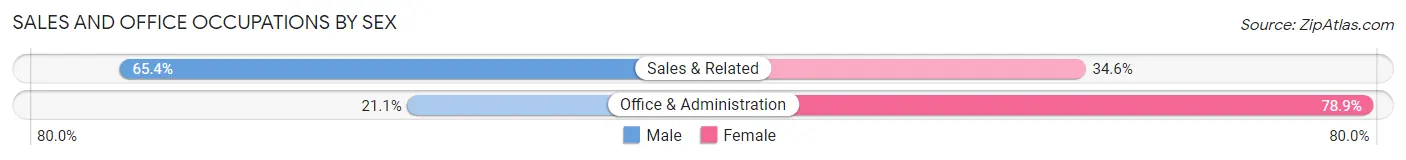
| Occupation | Male | Female |
| Sales & Related | 625 (65.4%) | 331 (34.6%) |
| Office & Administration | 220 (21.1%) | 823 (78.9%) |
| Total (Category) | 845 (42.3%) | 1,154 (57.7%) |
| Total (Overall) | 4,631 (56.5%) | 3,563 (43.5%) |
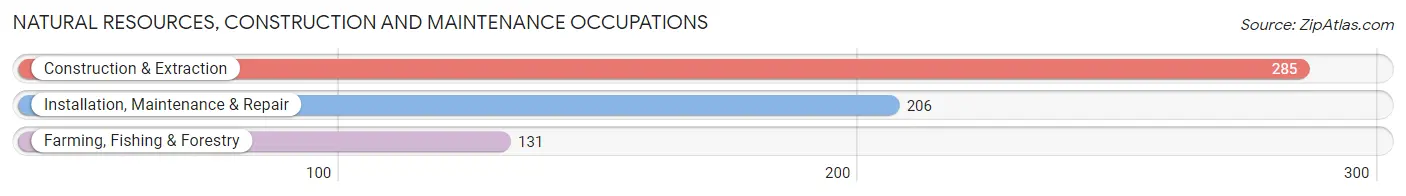
Natural Resources, Construction and Maintenance Occupations
The most common Natural Resources, Construction and Maintenance occupations in Jenison are Construction & Extraction (285 | 3.5%), Installation, Maintenance & Repair (206 | 2.5%), and Farming, Fishing & Forestry (131 | 1.6%).
Natural Resources, Construction and Maintenance Occupations by Sex
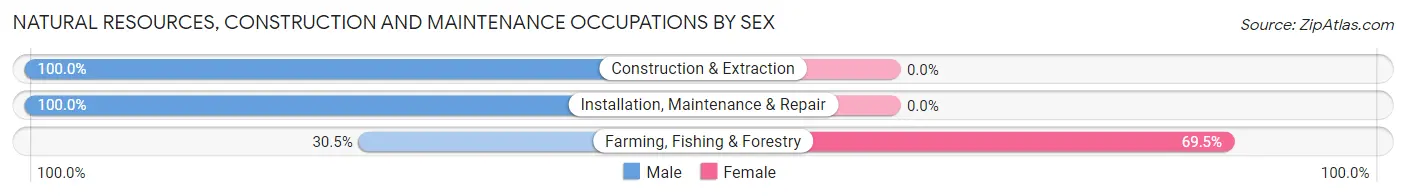
| Occupation | Male | Female |
| Farming, Fishing & Forestry | 40 (30.5%) | 91 (69.5%) |
| Construction & Extraction | 285 (100.0%) | 0 (0.0%) |
| Installation, Maintenance & Repair | 206 (100.0%) | 0 (0.0%) |
| Total (Category) | 531 (85.4%) | 91 (14.6%) |
| Total (Overall) | 4,631 (56.5%) | 3,563 (43.5%) |
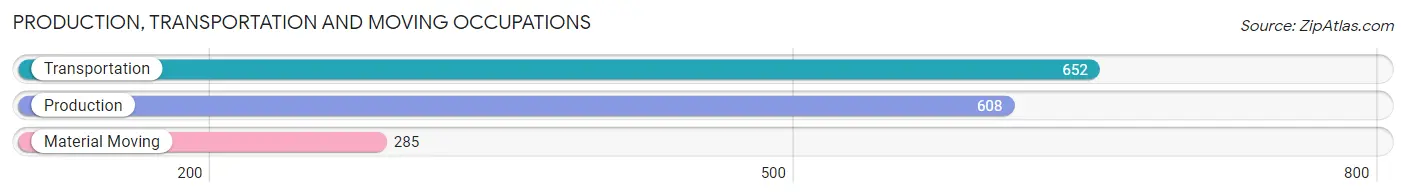
Production, Transportation and Moving Occupations
The most common Production, Transportation and Moving occupations in Jenison are Transportation (652 | 8.0%), Production (608 | 7.4%), and Material Moving (285 | 3.5%).
Production, Transportation and Moving Occupations by Sex
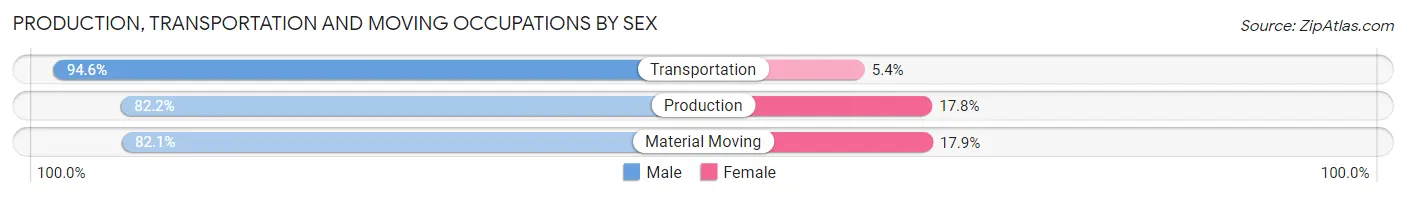
| Occupation | Male | Female |
| Production | 500 (82.2%) | 108 (17.8%) |
| Transportation | 617 (94.6%) | 35 (5.4%) |
| Material Moving | 234 (82.1%) | 51 (17.9%) |
| Total (Category) | 1,351 (87.4%) | 194 (12.6%) |
| Total (Overall) | 4,631 (56.5%) | 3,563 (43.5%) |
Employment Industries by Sex in Jenison
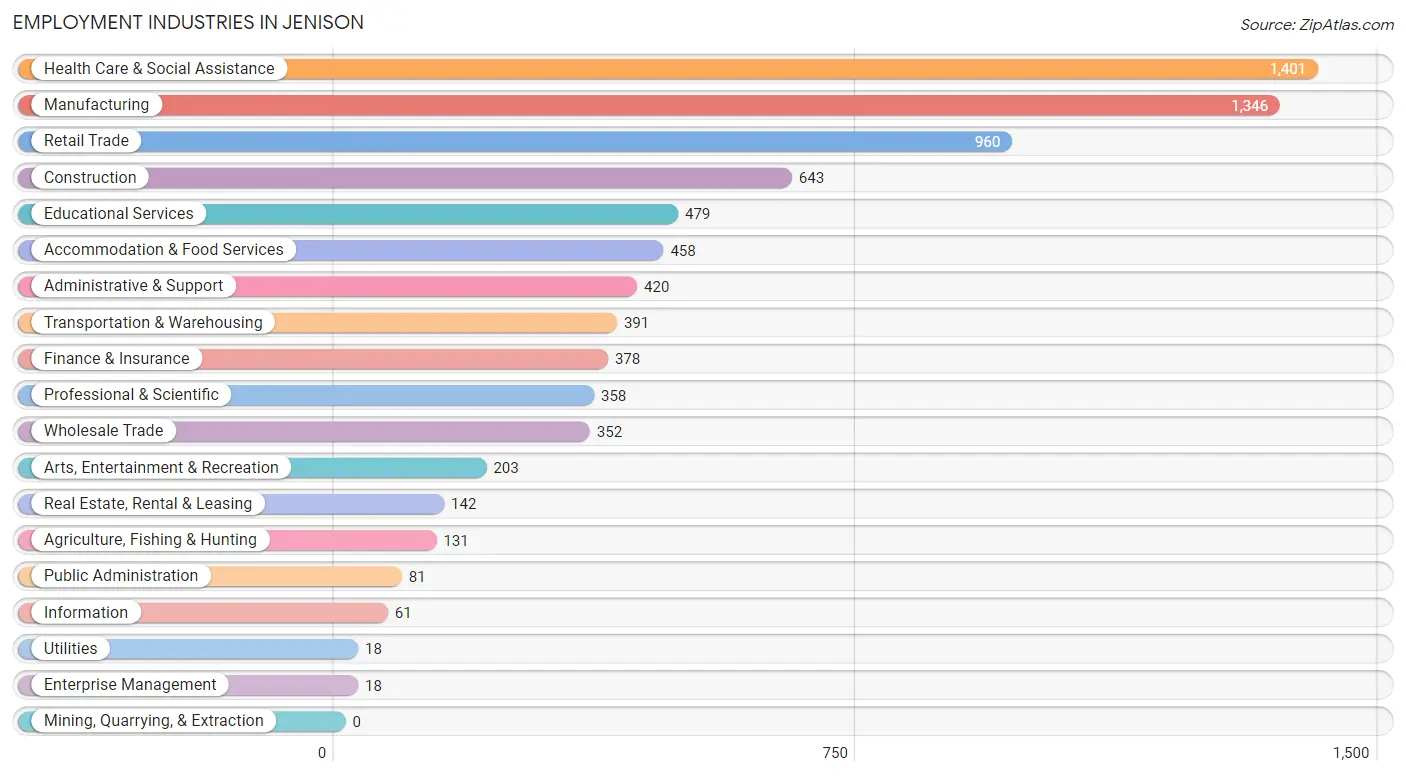
Employment Industries in Jenison
The major employment industries in Jenison include Health Care & Social Assistance (1,401 | 17.1%), Manufacturing (1,346 | 16.4%), Retail Trade (960 | 11.7%), Construction (643 | 7.9%), and Educational Services (479 | 5.9%).
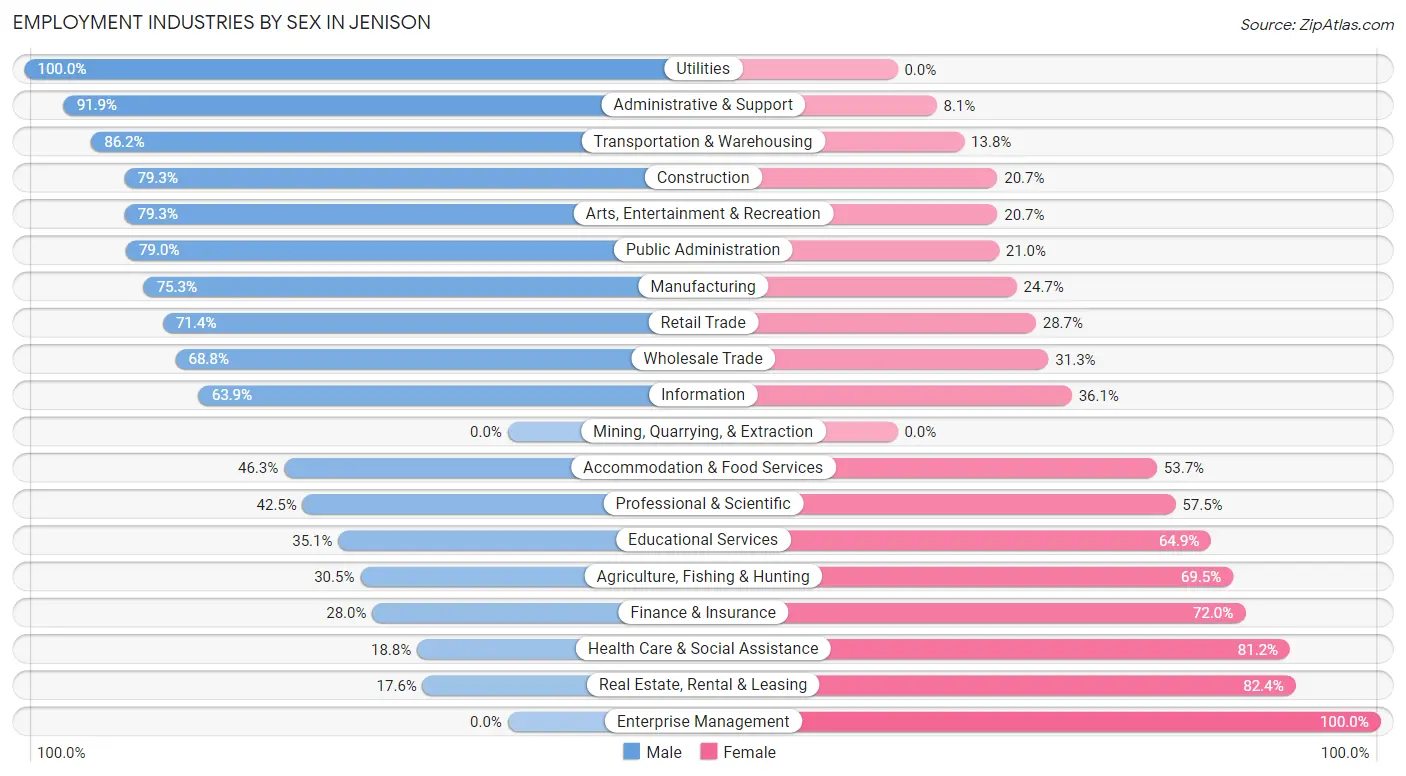
Employment Industries by Sex in Jenison
The Jenison industries that see more men than women are Utilities (100.0%), Administrative & Support (91.9%), and Transportation & Warehousing (86.2%), whereas the industries that tend to have a higher number of women are Enterprise Management (100.0%), Real Estate, Rental & Leasing (82.4%), and Health Care & Social Assistance (81.2%).
| Industry | Male | Female |
| Agriculture, Fishing & Hunting | 40 (30.5%) | 91 (69.5%) |
| Mining, Quarrying, & Extraction | 0 (0.0%) | 0 (0.0%) |
| Construction | 510 (79.3%) | 133 (20.7%) |
| Manufacturing | 1,014 (75.3%) | 332 (24.7%) |
| Wholesale Trade | 242 (68.8%) | 110 (31.2%) |
| Retail Trade | 685 (71.4%) | 275 (28.6%) |
| Transportation & Warehousing | 337 (86.2%) | 54 (13.8%) |
| Utilities | 18 (100.0%) | 0 (0.0%) |
| Information | 39 (63.9%) | 22 (36.1%) |
| Finance & Insurance | 106 (28.0%) | 272 (72.0%) |
| Real Estate, Rental & Leasing | 25 (17.6%) | 117 (82.4%) |
| Professional & Scientific | 152 (42.5%) | 206 (57.5%) |
| Enterprise Management | 0 (0.0%) | 18 (100.0%) |
| Administrative & Support | 386 (91.9%) | 34 (8.1%) |
| Educational Services | 168 (35.1%) | 311 (64.9%) |
| Health Care & Social Assistance | 263 (18.8%) | 1,138 (81.2%) |
| Arts, Entertainment & Recreation | 161 (79.3%) | 42 (20.7%) |
| Accommodation & Food Services | 212 (46.3%) | 246 (53.7%) |
| Public Administration | 64 (79.0%) | 17 (21.0%) |
| Total | 4,631 (56.5%) | 3,563 (43.5%) |
Education in Jenison
School Enrollment in Jenison
The most common levels of schooling among the 3,841 students in Jenison are elementary school (1,116 | 29.0%), high school (873 | 22.7%), and middle school (791 | 20.6%).

| School Level | # Students | % Students |
| Nursery / Preschool | 235 | 6.1% |
| Kindergarten | 233 | 6.1% |
| Elementary School | 1,116 | 29.0% |
| Middle School | 791 | 20.6% |
| High School | 873 | 22.7% |
| College / Undergraduate | 463 | 12.0% |
| Graduate / Professional | 130 | 3.4% |
| Total | 3,841 | 100.0% |
School Enrollment by Age by Funding Source in Jenison
Out of a total of 3,841 students who are enrolled in schools in Jenison, 833 (21.7%) attend a private institution, while the remaining 3,008 (78.3%) are enrolled in public schools. The age group of 3 to 4 year olds has the highest likelihood of being enrolled in private schools, with 78 (51.0% in the age bracket) enrolled. Conversely, the age group of 25 to 34 year olds has the lowest likelihood of being enrolled in a private school, with 182 (85.1% in the age bracket) attending a public institution.
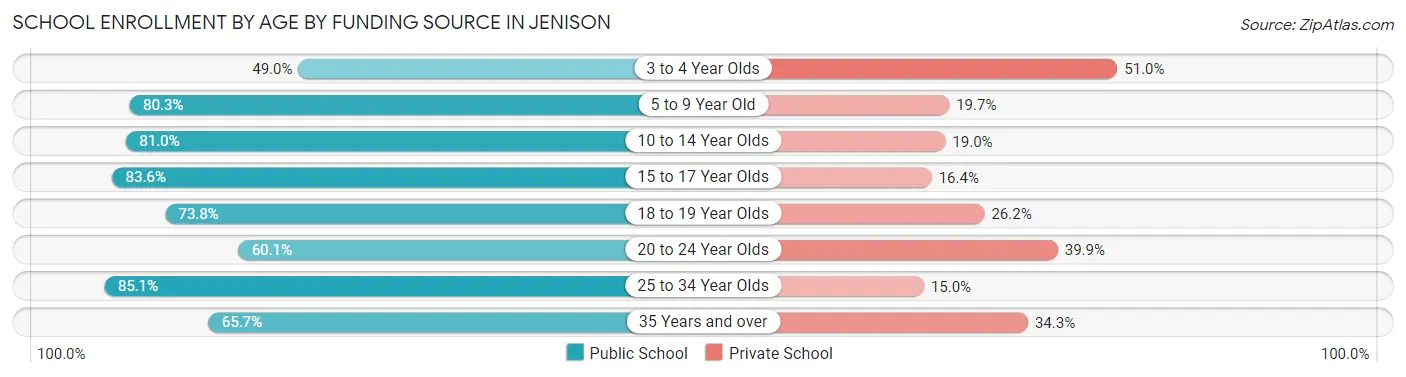
| Age Bracket | Public School | Private School |
| 3 to 4 Year Olds | 75 (49.0%) | 78 (51.0%) |
| 5 to 9 Year Old | 1,001 (80.3%) | 245 (19.7%) |
| 10 to 14 Year Olds | 842 (81.0%) | 197 (19.0%) |
| 15 to 17 Year Olds | 576 (83.6%) | 113 (16.4%) |
| 18 to 19 Year Olds | 135 (73.8%) | 48 (26.2%) |
| 20 to 24 Year Olds | 110 (60.1%) | 73 (39.9%) |
| 25 to 34 Year Olds | 182 (85.1%) | 32 (14.9%) |
| 35 Years and over | 88 (65.7%) | 46 (34.3%) |
| Total | 3,008 (78.3%) | 833 (21.7%) |
Educational Attainment by Field of Study in Jenison
Business (895 | 23.8%), education (629 | 16.8%), science & technology (511 | 13.6%), arts & humanities (284 | 7.6%), and psychology (281 | 7.5%) are the most common fields of study among 3,754 individuals in Jenison who have obtained a bachelor's degree or higher.
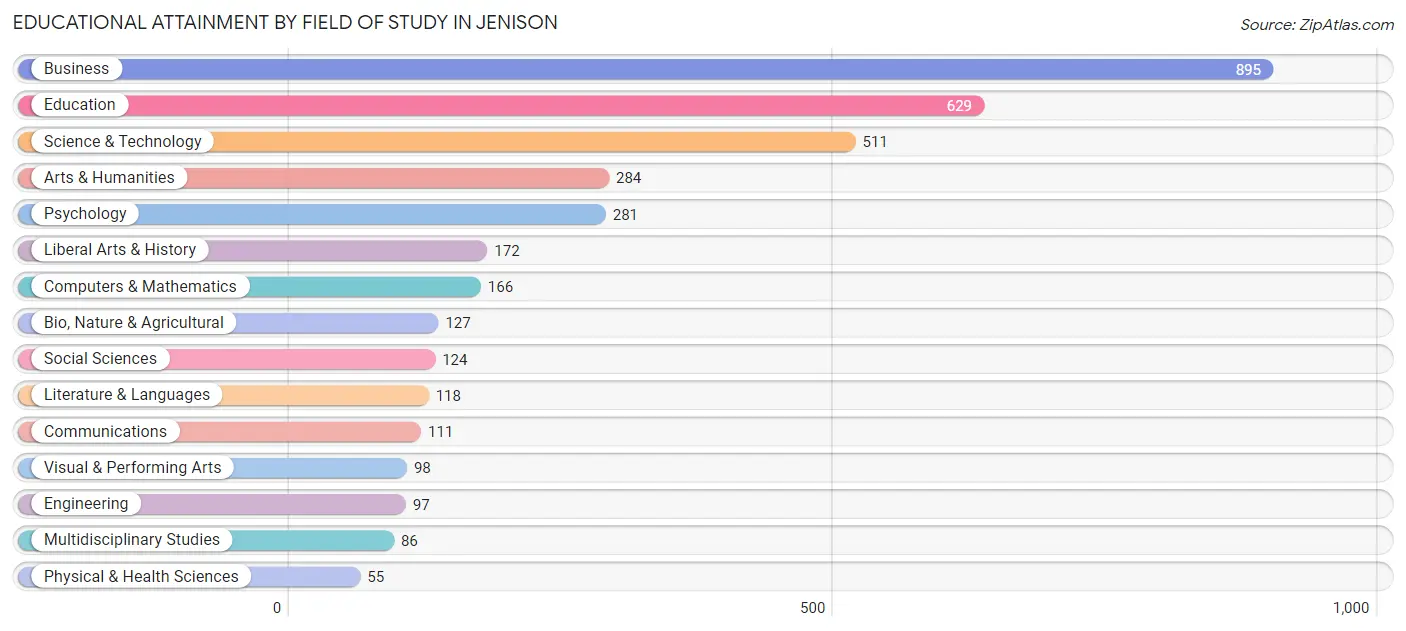
| Field of Study | # Graduates | % Graduates |
| Computers & Mathematics | 166 | 4.4% |
| Bio, Nature & Agricultural | 127 | 3.4% |
| Physical & Health Sciences | 55 | 1.5% |
| Psychology | 281 | 7.5% |
| Social Sciences | 124 | 3.3% |
| Engineering | 97 | 2.6% |
| Multidisciplinary Studies | 86 | 2.3% |
| Science & Technology | 511 | 13.6% |
| Business | 895 | 23.8% |
| Education | 629 | 16.8% |
| Literature & Languages | 118 | 3.1% |
| Liberal Arts & History | 172 | 4.6% |
| Visual & Performing Arts | 98 | 2.6% |
| Communications | 111 | 3.0% |
| Arts & Humanities | 284 | 7.6% |
| Total | 3,754 | 100.0% |
Transportation & Commute in Jenison
Vehicle Availability by Sex in Jenison
The most prevalent vehicle ownership categories in Jenison are males with 2 vehicles (2,245, accounting for 48.5%) and females with 2 vehicles (1,668, making up 64.4%).
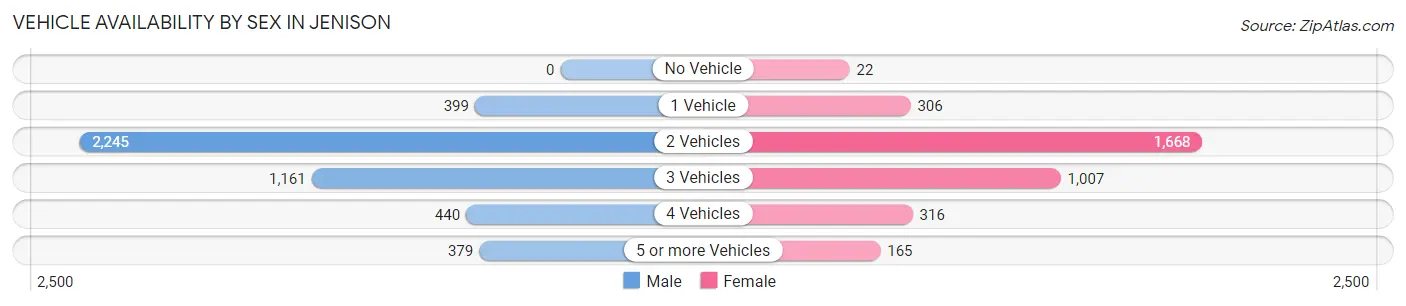
| Vehicles Available | Male | Female |
| No Vehicle | 0 (0.0%) | 22 (0.6%) |
| 1 Vehicle | 399 (8.6%) | 306 (8.8%) |
| 2 Vehicles | 2,245 (48.5%) | 1,668 (47.9%) |
| 3 Vehicles | 1,161 (25.1%) | 1,007 (28.9%) |
| 4 Vehicles | 440 (9.5%) | 316 (9.1%) |
| 5 or more Vehicles | 379 (8.2%) | 165 (4.7%) |
| Total | 4,624 (100.0%) | 3,484 (100.0%) |
Commute Time in Jenison
The most frequently occuring commute durations in Jenison are 20 to 24 minutes (1,694 commuters, 22.7%), 30 to 34 minutes (1,252 commuters, 16.8%), and 15 to 19 minutes (1,086 commuters, 14.5%).
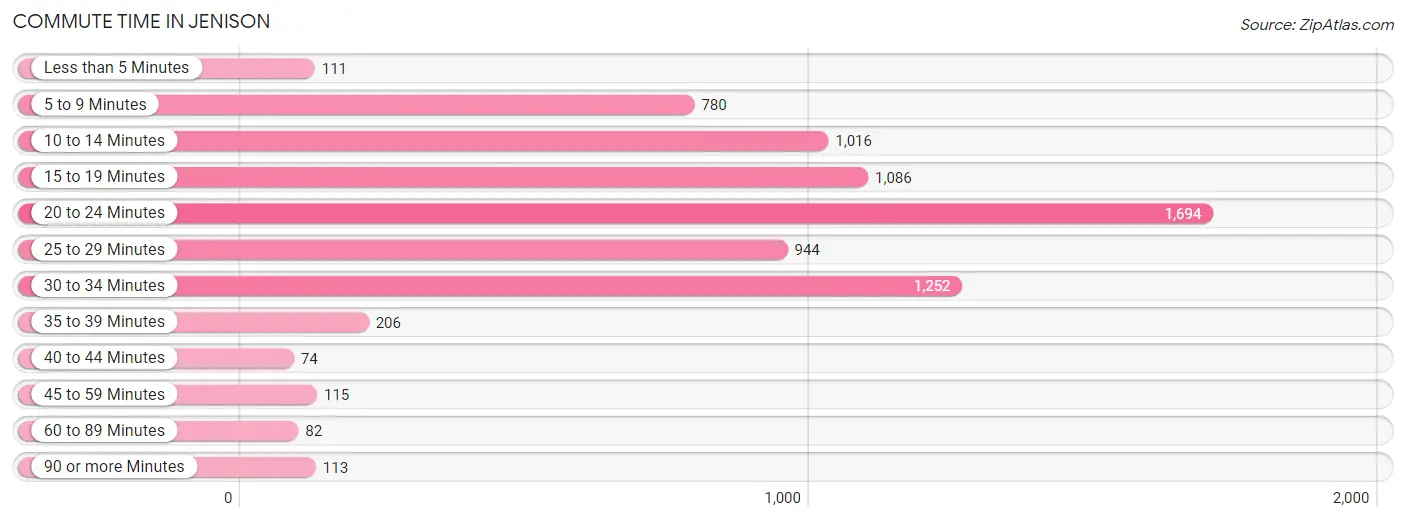
| Commute Time | # Commuters | % Commuters |
| Less than 5 Minutes | 111 | 1.5% |
| 5 to 9 Minutes | 780 | 10.4% |
| 10 to 14 Minutes | 1,016 | 13.6% |
| 15 to 19 Minutes | 1,086 | 14.5% |
| 20 to 24 Minutes | 1,694 | 22.7% |
| 25 to 29 Minutes | 944 | 12.6% |
| 30 to 34 Minutes | 1,252 | 16.8% |
| 35 to 39 Minutes | 206 | 2.8% |
| 40 to 44 Minutes | 74 | 1.0% |
| 45 to 59 Minutes | 115 | 1.5% |
| 60 to 89 Minutes | 82 | 1.1% |
| 90 or more Minutes | 113 | 1.5% |
Commute Time by Sex in Jenison
The most common commute times in Jenison are 20 to 24 minutes (1,065 commuters, 24.3%) for males and 20 to 24 minutes (629 commuters, 20.3%) for females.
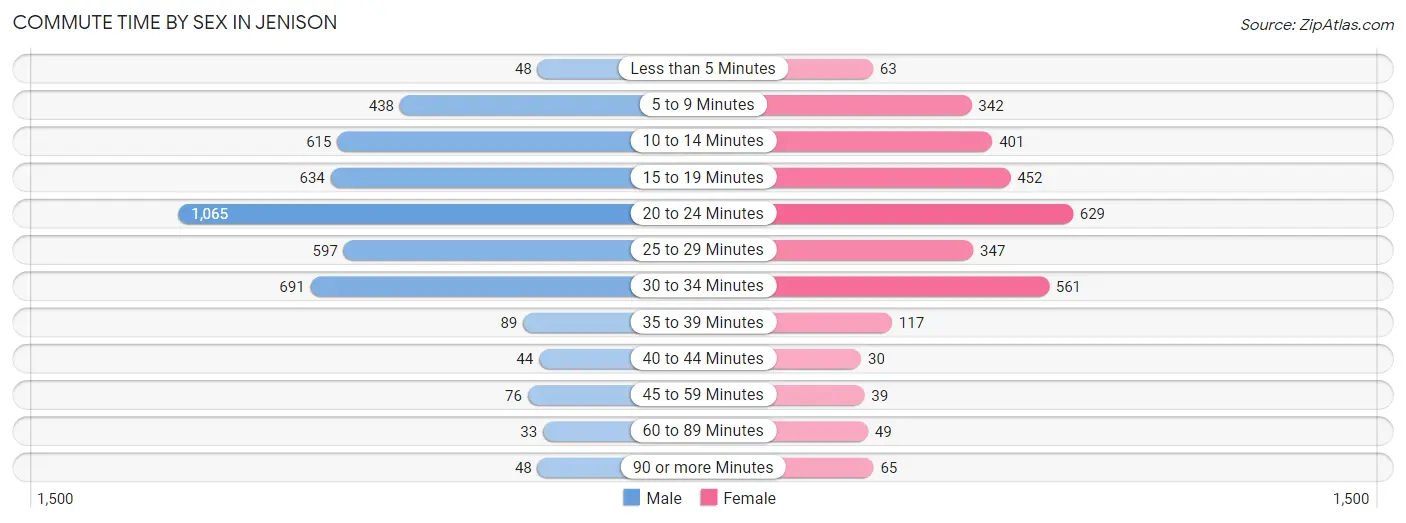
| Commute Time | Male | Female |
| Less than 5 Minutes | 48 (1.1%) | 63 (2.0%) |
| 5 to 9 Minutes | 438 (10.0%) | 342 (11.1%) |
| 10 to 14 Minutes | 615 (14.1%) | 401 (13.0%) |
| 15 to 19 Minutes | 634 (14.5%) | 452 (14.6%) |
| 20 to 24 Minutes | 1,065 (24.3%) | 629 (20.3%) |
| 25 to 29 Minutes | 597 (13.6%) | 347 (11.2%) |
| 30 to 34 Minutes | 691 (15.8%) | 561 (18.1%) |
| 35 to 39 Minutes | 89 (2.0%) | 117 (3.8%) |
| 40 to 44 Minutes | 44 (1.0%) | 30 (1.0%) |
| 45 to 59 Minutes | 76 (1.7%) | 39 (1.3%) |
| 60 to 89 Minutes | 33 (0.7%) | 49 (1.6%) |
| 90 or more Minutes | 48 (1.1%) | 65 (2.1%) |
Time of Departure to Work by Sex in Jenison
The most frequent times of departure to work in Jenison are 6:30 AM to 6:59 AM (749, 17.1%) for males and 7:30 AM to 7:59 AM (634, 20.5%) for females.
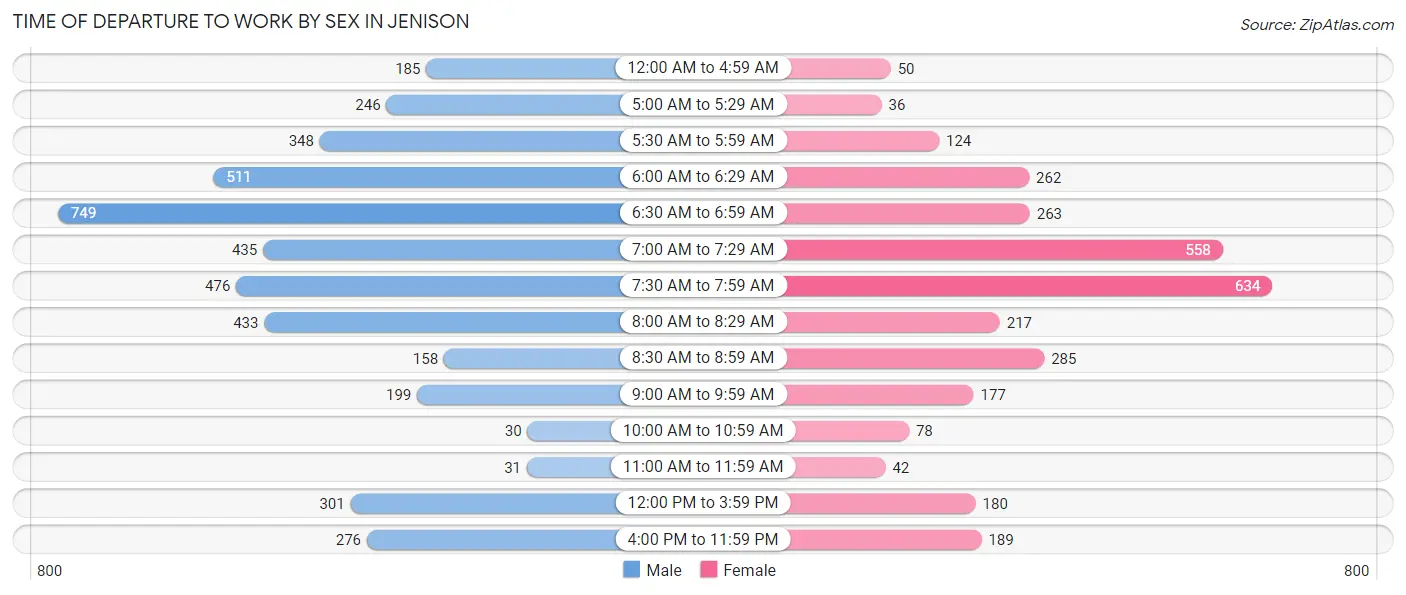
| Time of Departure | Male | Female |
| 12:00 AM to 4:59 AM | 185 (4.2%) | 50 (1.6%) |
| 5:00 AM to 5:29 AM | 246 (5.6%) | 36 (1.2%) |
| 5:30 AM to 5:59 AM | 348 (8.0%) | 124 (4.0%) |
| 6:00 AM to 6:29 AM | 511 (11.7%) | 262 (8.5%) |
| 6:30 AM to 6:59 AM | 749 (17.1%) | 263 (8.5%) |
| 7:00 AM to 7:29 AM | 435 (9.9%) | 558 (18.0%) |
| 7:30 AM to 7:59 AM | 476 (10.9%) | 634 (20.5%) |
| 8:00 AM to 8:29 AM | 433 (9.9%) | 217 (7.0%) |
| 8:30 AM to 8:59 AM | 158 (3.6%) | 285 (9.2%) |
| 9:00 AM to 9:59 AM | 199 (4.5%) | 177 (5.7%) |
| 10:00 AM to 10:59 AM | 30 (0.7%) | 78 (2.5%) |
| 11:00 AM to 11:59 AM | 31 (0.7%) | 42 (1.4%) |
| 12:00 PM to 3:59 PM | 301 (6.9%) | 180 (5.8%) |
| 4:00 PM to 11:59 PM | 276 (6.3%) | 189 (6.1%) |
| Total | 4,378 (100.0%) | 3,095 (100.0%) |
Housing Occupancy in Jenison
Occupancy by Ownership in Jenison
Of the total 6,719 dwellings in Jenison, owner-occupied units account for 5,685 (84.6%), while renter-occupied units make up 1,034 (15.4%).
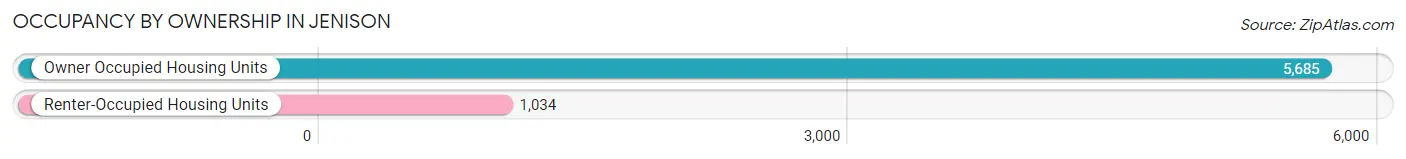
| Occupancy | # Housing Units | % Housing Units |
| Owner Occupied Housing Units | 5,685 | 84.6% |
| Renter-Occupied Housing Units | 1,034 | 15.4% |
| Total Occupied Housing Units | 6,719 | 100.0% |
Occupancy by Household Size in Jenison
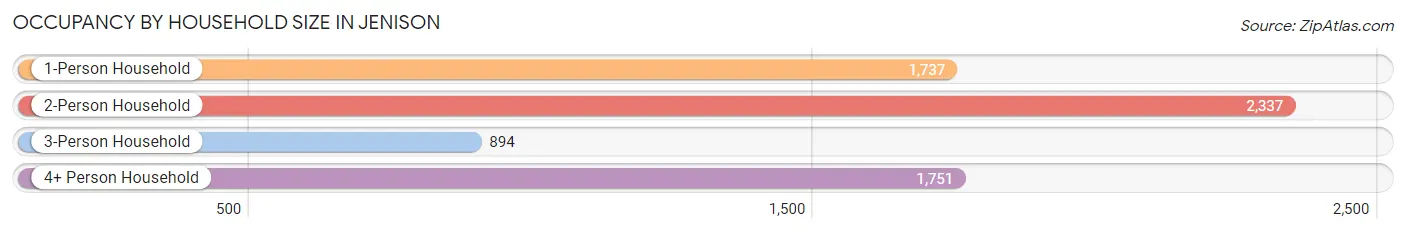
| Household Size | # Housing Units | % Housing Units |
| 1-Person Household | 1,737 | 25.9% |
| 2-Person Household | 2,337 | 34.8% |
| 3-Person Household | 894 | 13.3% |
| 4+ Person Household | 1,751 | 26.1% |
| Total Housing Units | 6,719 | 100.0% |
Occupancy by Ownership by Household Size in Jenison
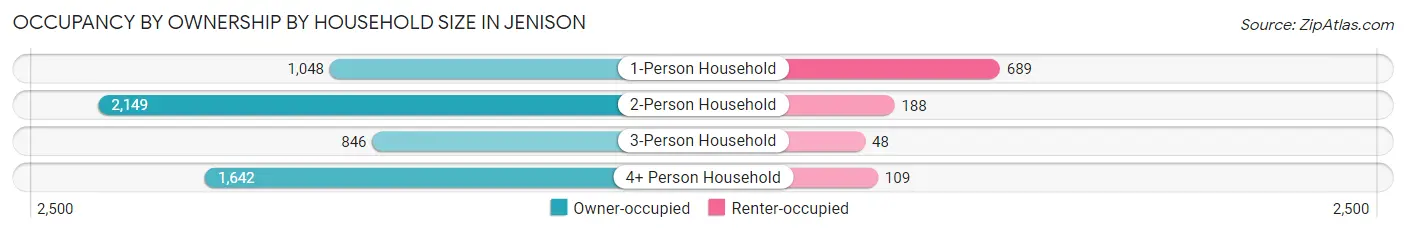
| Household Size | Owner-occupied | Renter-occupied |
| 1-Person Household | 1,048 (60.3%) | 689 (39.7%) |
| 2-Person Household | 2,149 (92.0%) | 188 (8.0%) |
| 3-Person Household | 846 (94.6%) | 48 (5.4%) |
| 4+ Person Household | 1,642 (93.8%) | 109 (6.2%) |
| Total Housing Units | 5,685 (84.6%) | 1,034 (15.4%) |
Occupancy by Educational Attainment in Jenison
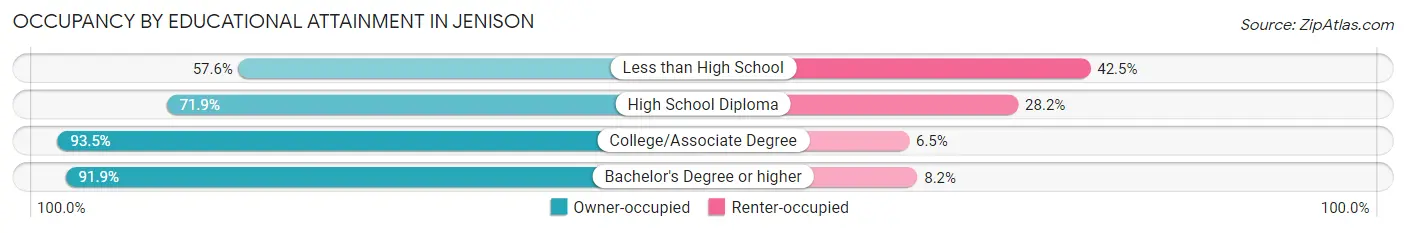
| Household Size | Owner-occupied | Renter-occupied |
| Less than High School | 183 (57.6%) | 135 (42.4%) |
| High School Diploma | 1,488 (71.9%) | 583 (28.1%) |
| College/Associate Degree | 2,097 (93.5%) | 146 (6.5%) |
| Bachelor's Degree or higher | 1,917 (91.8%) | 170 (8.2%) |
Occupancy by Age of Householder in Jenison
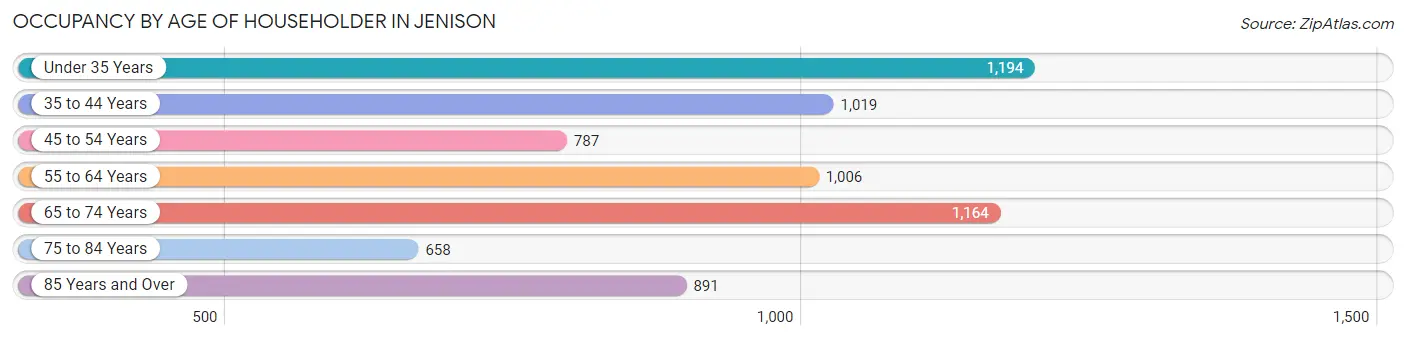
| Age Bracket | # Households | % Households |
| Under 35 Years | 1,194 | 17.8% |
| 35 to 44 Years | 1,019 | 15.2% |
| 45 to 54 Years | 787 | 11.7% |
| 55 to 64 Years | 1,006 | 15.0% |
| 65 to 74 Years | 1,164 | 17.3% |
| 75 to 84 Years | 658 | 9.8% |
| 85 Years and Over | 891 | 13.3% |
| Total | 6,719 | 100.0% |
Housing Finances in Jenison
Median Income by Occupancy in Jenison
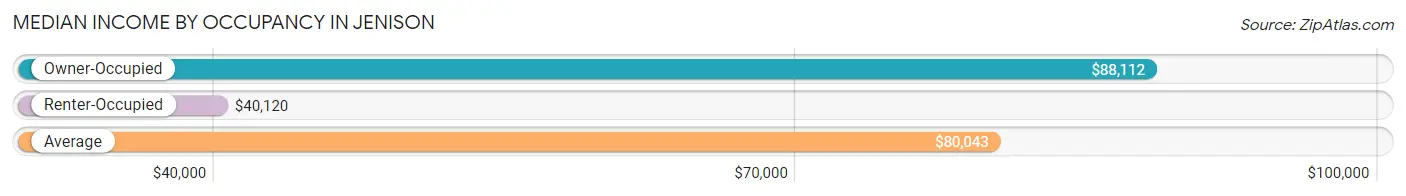
| Occupancy Type | # Households | Median Income |
| Owner-Occupied | 5,685 (84.6%) | $88,112 |
| Renter-Occupied | 1,034 (15.4%) | $40,120 |
| Average | 6,719 (100.0%) | $80,043 |
Occupancy by Householder Income Bracket in Jenison
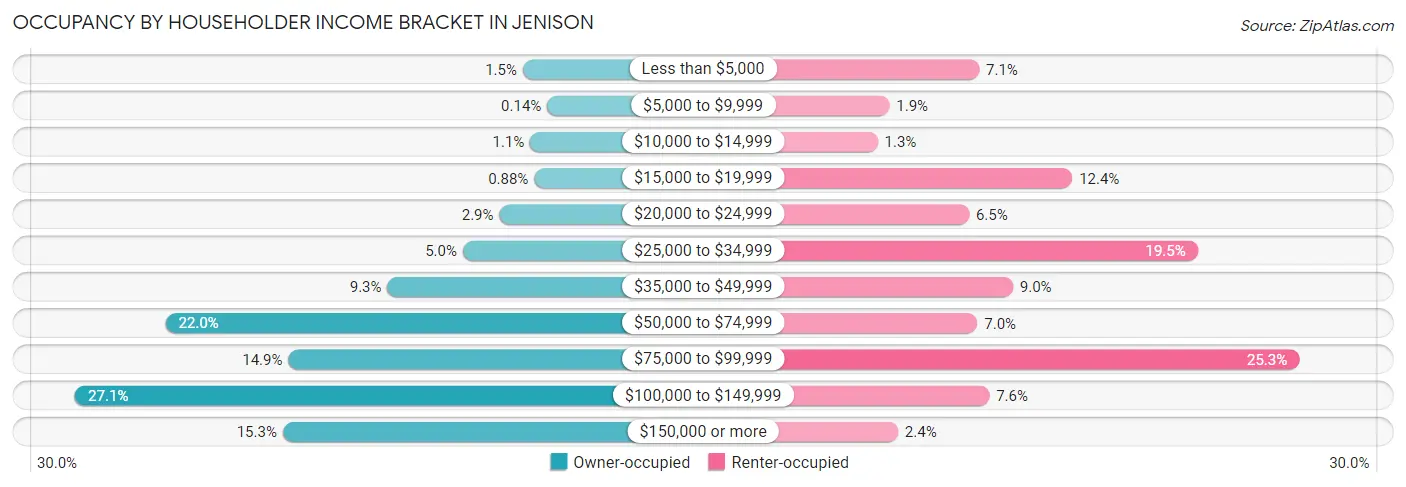
| Income Bracket | Owner-occupied | Renter-occupied |
| Less than $5,000 | 87 (1.5%) | 73 (7.1%) |
| $5,000 to $9,999 | 8 (0.1%) | 20 (1.9%) |
| $10,000 to $14,999 | 63 (1.1%) | 13 (1.3%) |
| $15,000 to $19,999 | 50 (0.9%) | 128 (12.4%) |
| $20,000 to $24,999 | 163 (2.9%) | 67 (6.5%) |
| $25,000 to $34,999 | 282 (5.0%) | 202 (19.5%) |
| $35,000 to $49,999 | 527 (9.3%) | 93 (9.0%) |
| $50,000 to $74,999 | 1,248 (22.0%) | 72 (7.0%) |
| $75,000 to $99,999 | 849 (14.9%) | 262 (25.3%) |
| $100,000 to $149,999 | 1,541 (27.1%) | 79 (7.6%) |
| $150,000 or more | 867 (15.2%) | 25 (2.4%) |
| Total | 5,685 (100.0%) | 1,034 (100.0%) |
Monthly Housing Cost Tiers in Jenison
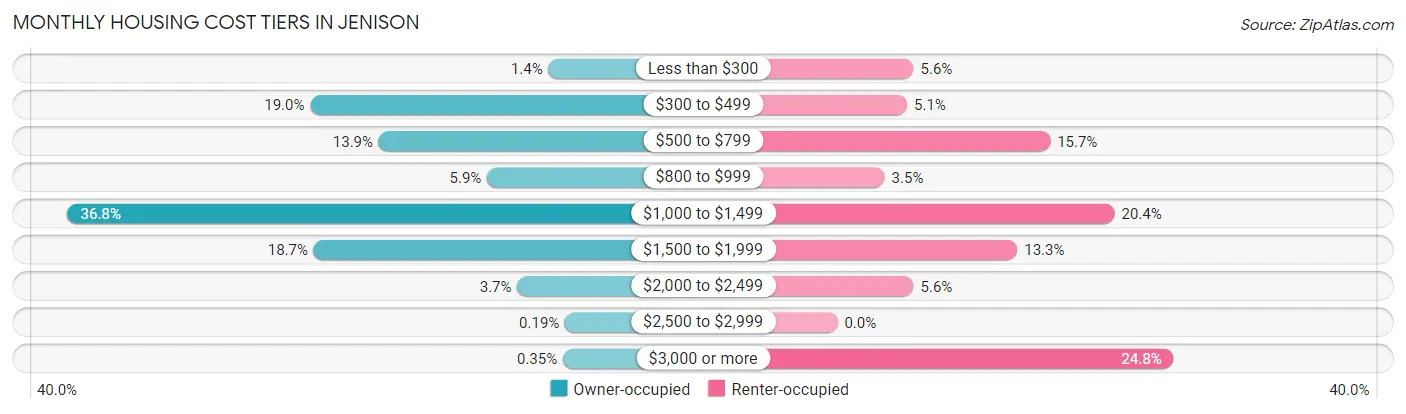
| Monthly Cost | Owner-occupied | Renter-occupied |
| Less than $300 | 80 (1.4%) | 58 (5.6%) |
| $300 to $499 | 1,078 (19.0%) | 53 (5.1%) |
| $500 to $799 | 791 (13.9%) | 162 (15.7%) |
| $800 to $999 | 337 (5.9%) | 36 (3.5%) |
| $1,000 to $1,499 | 2,094 (36.8%) | 211 (20.4%) |
| $1,500 to $1,999 | 1,063 (18.7%) | 137 (13.3%) |
| $2,000 to $2,499 | 211 (3.7%) | 58 (5.6%) |
| $2,500 to $2,999 | 11 (0.2%) | 0 (0.0%) |
| $3,000 or more | 20 (0.4%) | 256 (24.8%) |
| Total | 5,685 (100.0%) | 1,034 (100.0%) |
Physical Housing Characteristics in Jenison
Housing Structures in Jenison
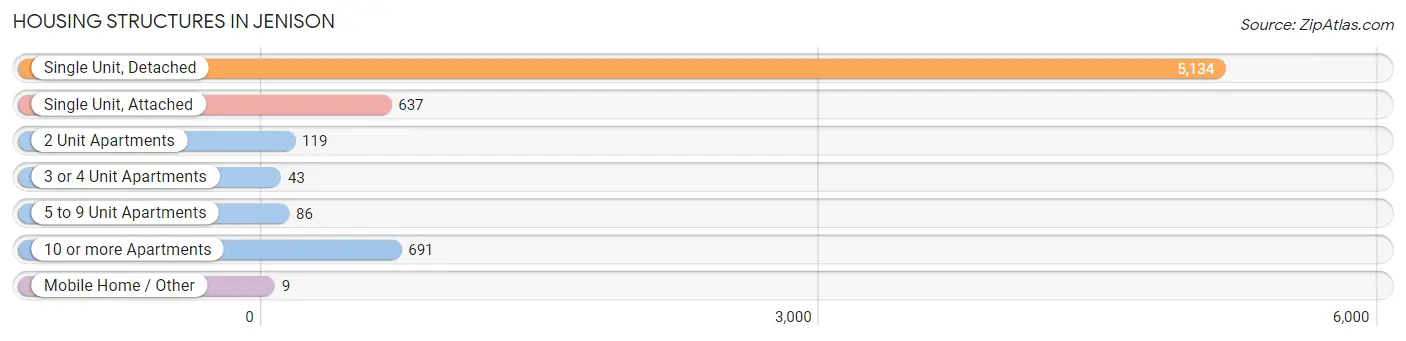
| Structure Type | # Housing Units | % Housing Units |
| Single Unit, Detached | 5,134 | 76.4% |
| Single Unit, Attached | 637 | 9.5% |
| 2 Unit Apartments | 119 | 1.8% |
| 3 or 4 Unit Apartments | 43 | 0.6% |
| 5 to 9 Unit Apartments | 86 | 1.3% |
| 10 or more Apartments | 691 | 10.3% |
| Mobile Home / Other | 9 | 0.1% |
| Total | 6,719 | 100.0% |
Housing Structures by Occupancy in Jenison
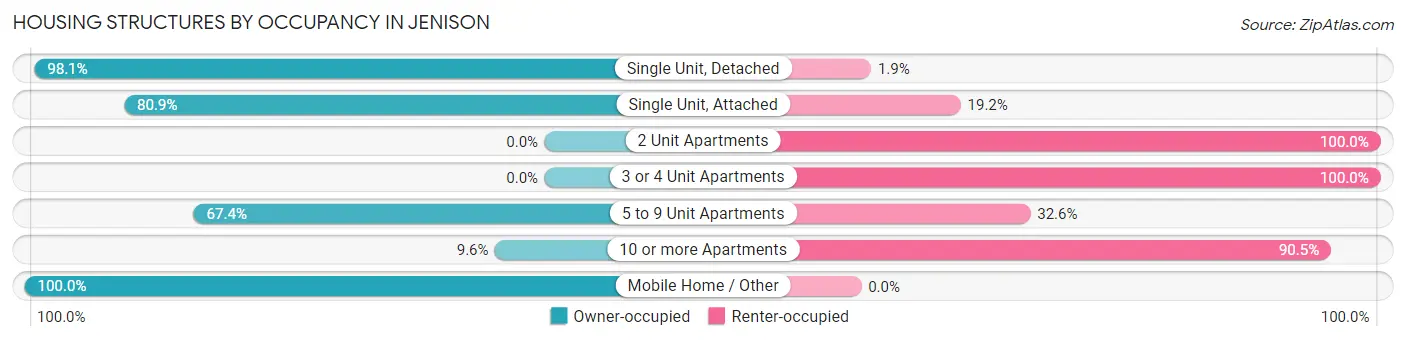
| Structure Type | Owner-occupied | Renter-occupied |
| Single Unit, Detached | 5,037 (98.1%) | 97 (1.9%) |
| Single Unit, Attached | 515 (80.8%) | 122 (19.2%) |
| 2 Unit Apartments | 0 (0.0%) | 119 (100.0%) |
| 3 or 4 Unit Apartments | 0 (0.0%) | 43 (100.0%) |
| 5 to 9 Unit Apartments | 58 (67.4%) | 28 (32.6%) |
| 10 or more Apartments | 66 (9.6%) | 625 (90.4%) |
| Mobile Home / Other | 9 (100.0%) | 0 (0.0%) |
| Total | 5,685 (84.6%) | 1,034 (15.4%) |
Housing Structures by Number of Rooms in Jenison
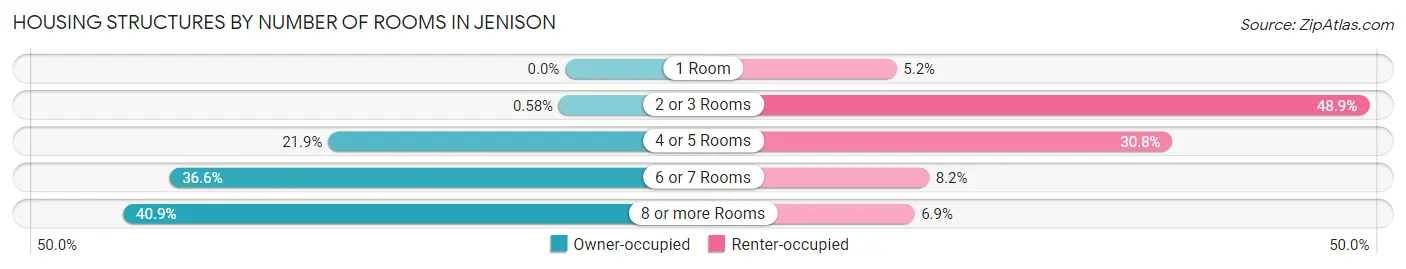
| Number of Rooms | Owner-occupied | Renter-occupied |
| 1 Room | 0 (0.0%) | 54 (5.2%) |
| 2 or 3 Rooms | 33 (0.6%) | 506 (48.9%) |
| 4 or 5 Rooms | 1,246 (21.9%) | 318 (30.7%) |
| 6 or 7 Rooms | 2,082 (36.6%) | 85 (8.2%) |
| 8 or more Rooms | 2,324 (40.9%) | 71 (6.9%) |
| Total | 5,685 (100.0%) | 1,034 (100.0%) |
Housing Structure by Heating Type in Jenison
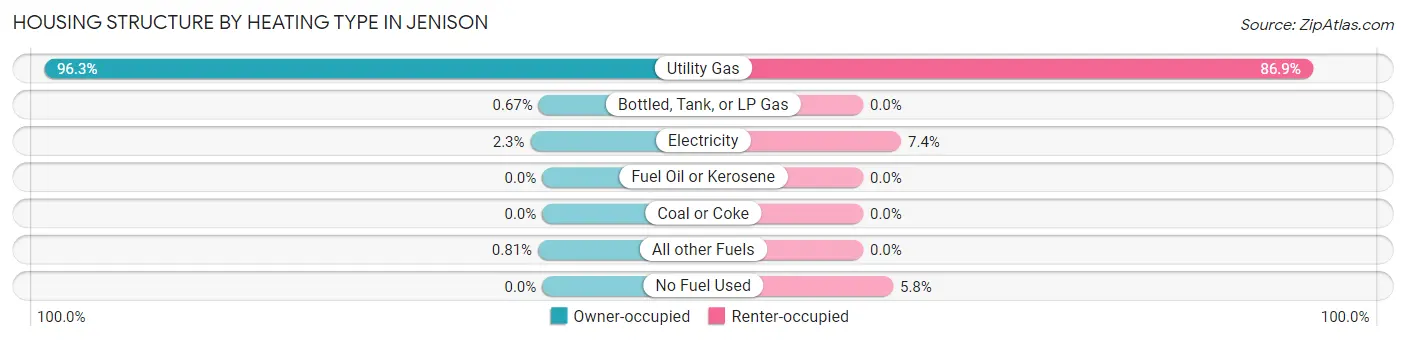
| Heating Type | Owner-occupied | Renter-occupied |
| Utility Gas | 5,472 (96.3%) | 898 (86.9%) |
| Bottled, Tank, or LP Gas | 38 (0.7%) | 0 (0.0%) |
| Electricity | 129 (2.3%) | 76 (7.3%) |
| Fuel Oil or Kerosene | 0 (0.0%) | 0 (0.0%) |
| Coal or Coke | 0 (0.0%) | 0 (0.0%) |
| All other Fuels | 46 (0.8%) | 0 (0.0%) |
| No Fuel Used | 0 (0.0%) | 60 (5.8%) |
| Total | 5,685 (100.0%) | 1,034 (100.0%) |
Household Vehicle Usage in Jenison
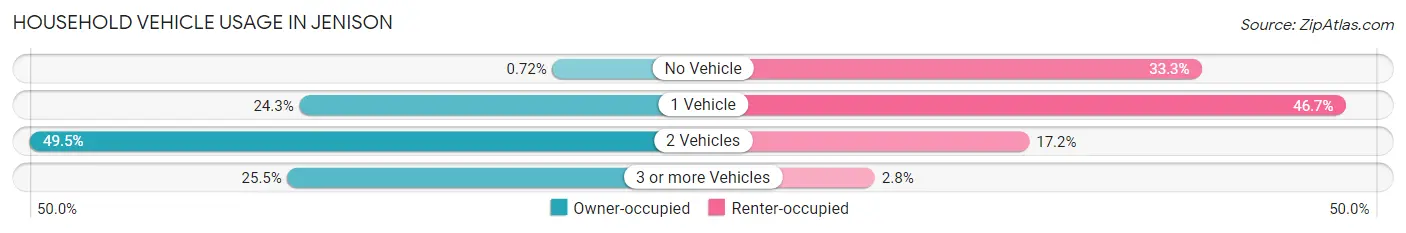
| Vehicles per Household | Owner-occupied | Renter-occupied |
| No Vehicle | 41 (0.7%) | 344 (33.3%) |
| 1 Vehicle | 1,384 (24.3%) | 483 (46.7%) |
| 2 Vehicles | 2,813 (49.5%) | 178 (17.2%) |
| 3 or more Vehicles | 1,447 (25.5%) | 29 (2.8%) |
| Total | 5,685 (100.0%) | 1,034 (100.0%) |
Real Estate & Mortgages in Jenison
Real Estate and Mortgage Overview in Jenison
| Characteristic | Without Mortgage | With Mortgage |
| Housing Units | 1,924 | 3,761 |
| Median Property Value | $222,700 | $239,200 |
| Median Household Income | $63,904 | $615 |
| Monthly Housing Costs | $479 | $20 |
| Real Estate Taxes | $2,350 | $20 |
Property Value by Mortgage Status in Jenison
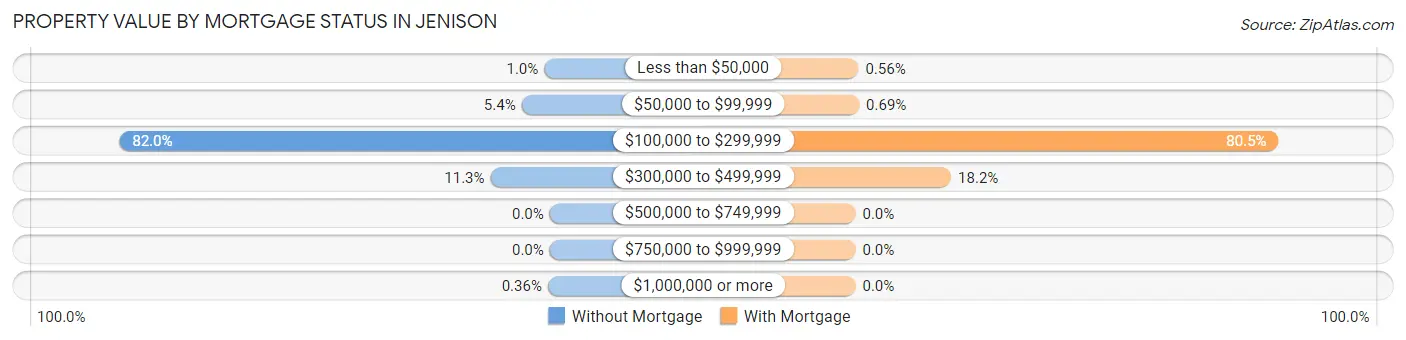
| Property Value | Without Mortgage | With Mortgage |
| Less than $50,000 | 20 (1.0%) | 21 (0.6%) |
| $50,000 to $99,999 | 103 (5.3%) | 26 (0.7%) |
| $100,000 to $299,999 | 1,577 (82.0%) | 3,029 (80.5%) |
| $300,000 to $499,999 | 217 (11.3%) | 685 (18.2%) |
| $500,000 to $749,999 | 0 (0.0%) | 0 (0.0%) |
| $750,000 to $999,999 | 0 (0.0%) | 0 (0.0%) |
| $1,000,000 or more | 7 (0.4%) | 0 (0.0%) |
| Total | 1,924 (100.0%) | 3,761 (100.0%) |
Household Income by Mortgage Status in Jenison
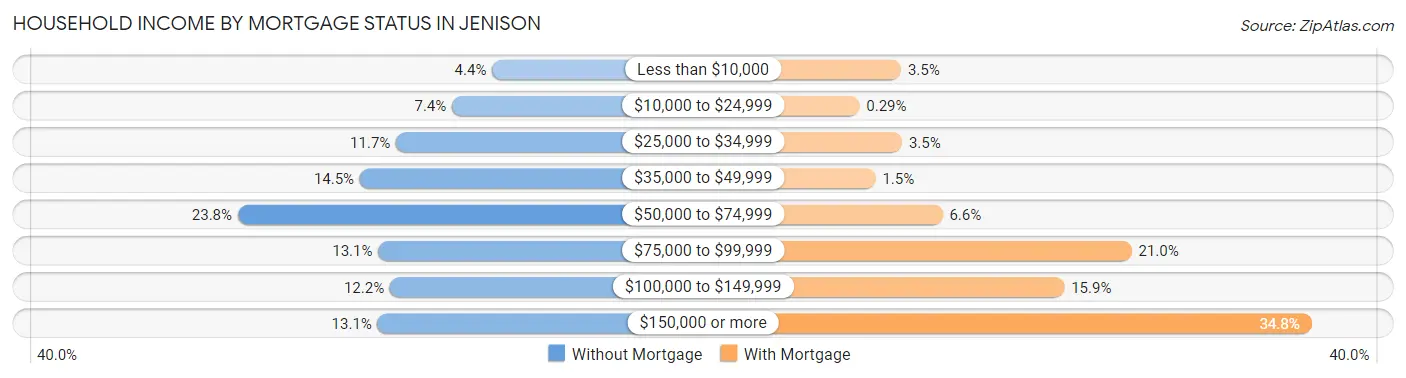
| Household Income | Without Mortgage | With Mortgage |
| Less than $10,000 | 84 (4.4%) | 130 (3.5%) |
| $10,000 to $24,999 | 143 (7.4%) | 11 (0.3%) |
| $25,000 to $34,999 | 225 (11.7%) | 133 (3.5%) |
| $35,000 to $49,999 | 278 (14.4%) | 57 (1.5%) |
| $50,000 to $74,999 | 457 (23.7%) | 249 (6.6%) |
| $75,000 to $99,999 | 251 (13.1%) | 791 (21.0%) |
| $100,000 to $149,999 | 234 (12.2%) | 598 (15.9%) |
| $150,000 or more | 252 (13.1%) | 1,307 (34.7%) |
| Total | 1,924 (100.0%) | 3,761 (100.0%) |
Property Value to Household Income Ratio in Jenison
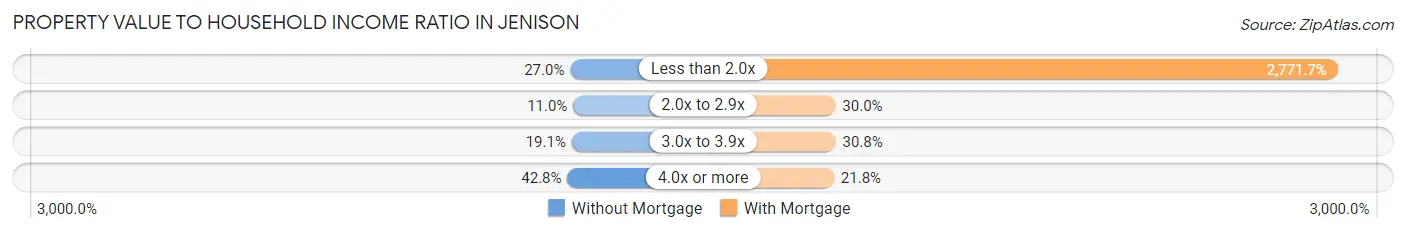
| Value-to-Income Ratio | Without Mortgage | With Mortgage |
| Less than 2.0x | 520 (27.0%) | 104,243 (2,771.7%) |
| 2.0x to 2.9x | 212 (11.0%) | 1,127 (30.0%) |
| 3.0x to 3.9x | 368 (19.1%) | 1,158 (30.8%) |
| 4.0x or more | 824 (42.8%) | 819 (21.8%) |
| Total | 1,924 (100.0%) | 3,761 (100.0%) |
Real Estate Taxes by Mortgage Status in Jenison
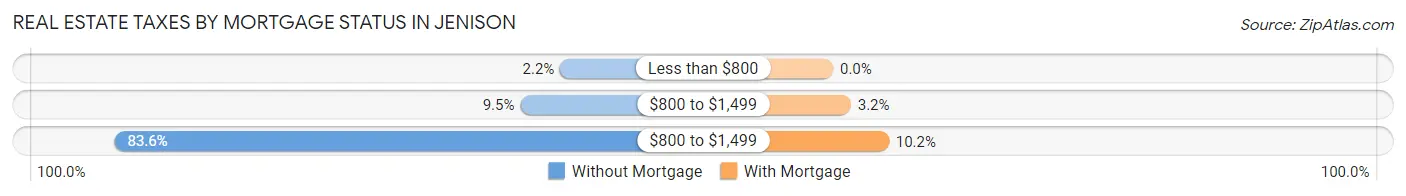
| Property Taxes | Without Mortgage | With Mortgage |
| Less than $800 | 42 (2.2%) | 0 (0.0%) |
| $800 to $1,499 | 182 (9.5%) | 122 (3.2%) |
| $800 to $1,499 | 1,608 (83.6%) | 383 (10.2%) |
| Total | 1,924 (100.0%) | 3,761 (100.0%) |
Health & Disability in Jenison
Health Insurance Coverage by Age in Jenison
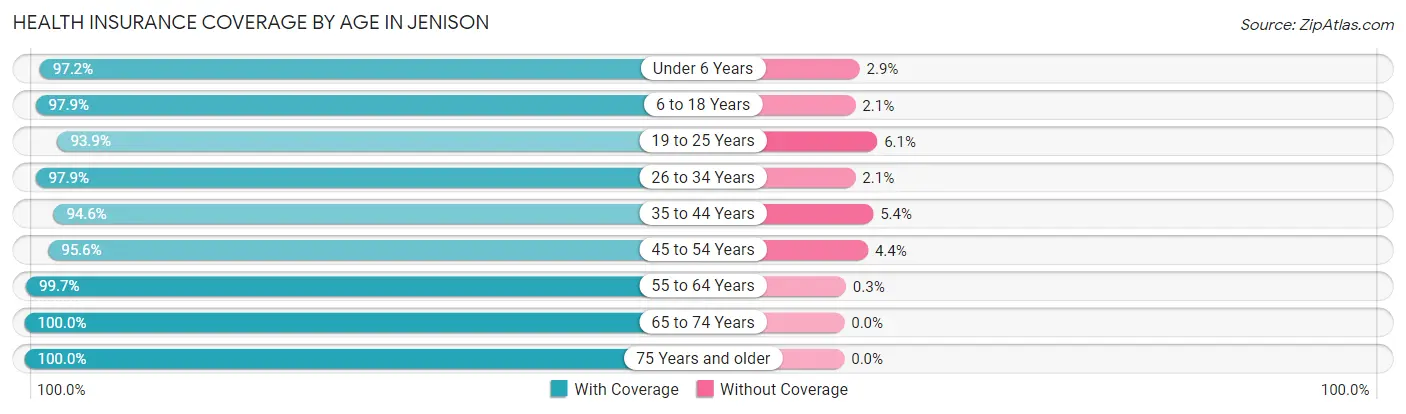
| Age Bracket | With Coverage | Without Coverage |
| Under 6 Years | 1,431 (97.2%) | 42 (2.9%) |
| 6 to 18 Years | 2,835 (97.9%) | 60 (2.1%) |
| 19 to 25 Years | 1,253 (93.9%) | 82 (6.1%) |
| 26 to 34 Years | 1,890 (97.9%) | 40 (2.1%) |
| 35 to 44 Years | 2,122 (94.6%) | 121 (5.4%) |
| 45 to 54 Years | 1,362 (95.6%) | 63 (4.4%) |
| 55 to 64 Years | 1,988 (99.7%) | 6 (0.3%) |
| 65 to 74 Years | 1,905 (100.0%) | 0 (0.0%) |
| 75 Years and older | 2,055 (100.0%) | 0 (0.0%) |
| Total | 16,841 (97.6%) | 414 (2.4%) |
Health Insurance Coverage by Citizenship Status in Jenison
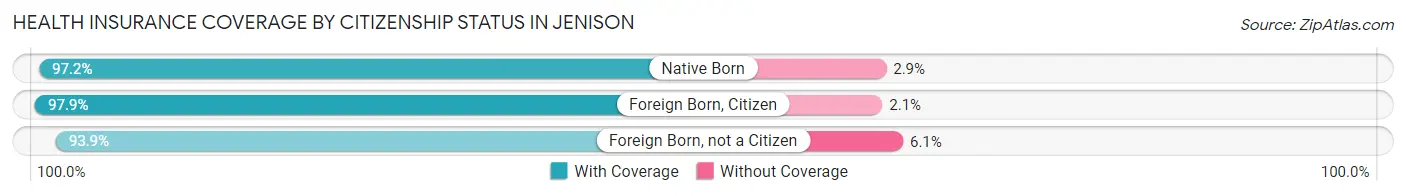
| Citizenship Status | With Coverage | Without Coverage |
| Native Born | 1,431 (97.2%) | 42 (2.9%) |
| Foreign Born, Citizen | 2,835 (97.9%) | 60 (2.1%) |
| Foreign Born, not a Citizen | 1,253 (93.9%) | 82 (6.1%) |
Health Insurance Coverage by Household Income in Jenison
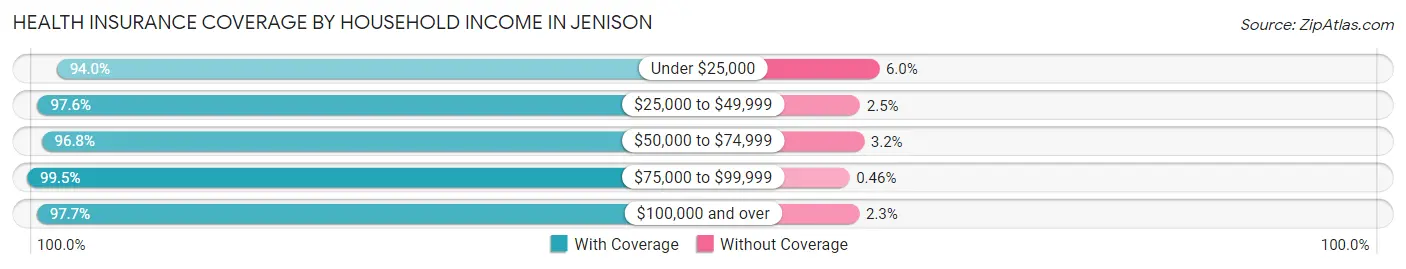
| Household Income | With Coverage | Without Coverage |
| Under $25,000 | 826 (94.0%) | 53 (6.0%) |
| $25,000 to $49,999 | 2,067 (97.6%) | 52 (2.5%) |
| $50,000 to $74,999 | 3,152 (96.8%) | 104 (3.2%) |
| $75,000 to $99,999 | 2,604 (99.5%) | 12 (0.5%) |
| $100,000 and over | 8,181 (97.7%) | 192 (2.3%) |
Public vs Private Health Insurance Coverage by Age in Jenison
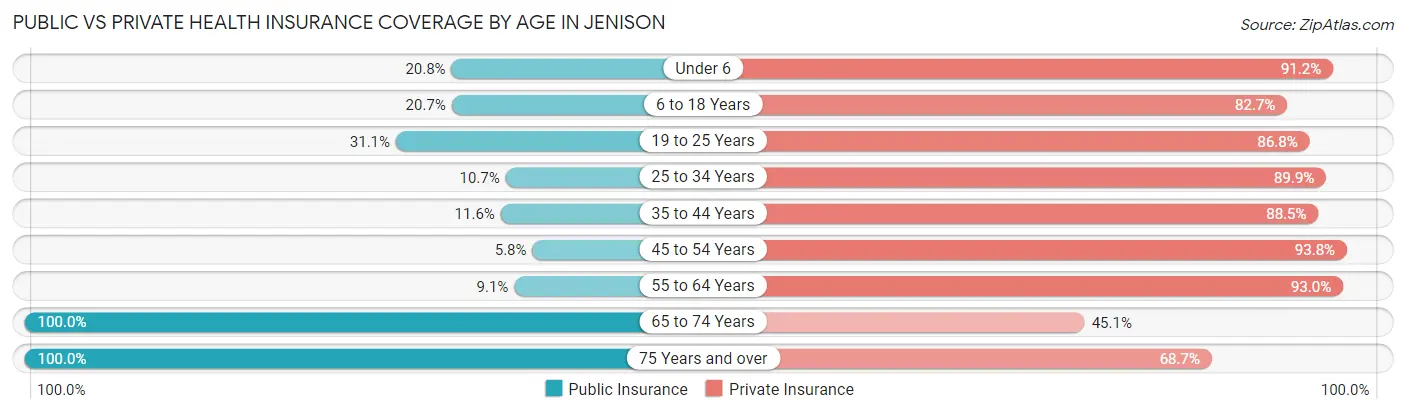
| Age Bracket | Public Insurance | Private Insurance |
| Under 6 | 306 (20.8%) | 1,343 (91.2%) |
| 6 to 18 Years | 600 (20.7%) | 2,393 (82.7%) |
| 19 to 25 Years | 415 (31.1%) | 1,159 (86.8%) |
| 25 to 34 Years | 207 (10.7%) | 1,735 (89.9%) |
| 35 to 44 Years | 261 (11.6%) | 1,984 (88.4%) |
| 45 to 54 Years | 82 (5.8%) | 1,336 (93.8%) |
| 55 to 64 Years | 182 (9.1%) | 1,855 (93.0%) |
| 65 to 74 Years | 1,905 (100.0%) | 859 (45.1%) |
| 75 Years and over | 2,055 (100.0%) | 1,411 (68.7%) |
| Total | 6,013 (34.8%) | 14,075 (81.6%) |
Disability Status by Sex by Age in Jenison
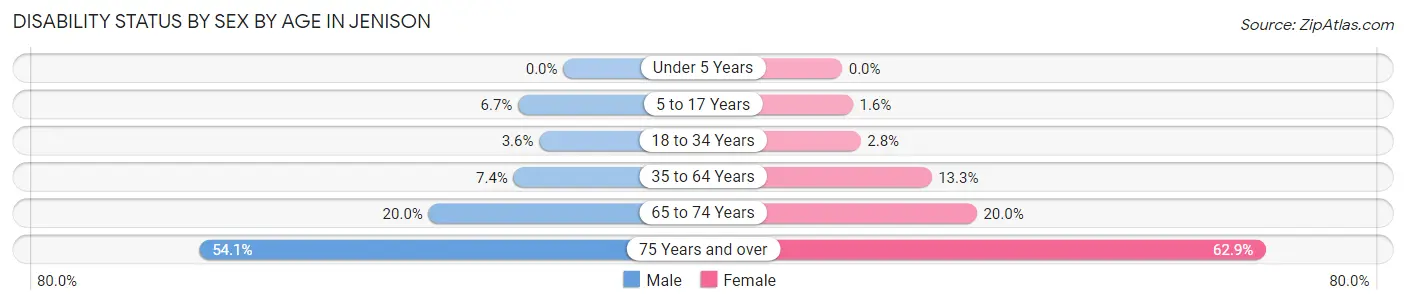
| Age Bracket | Male | Female |
| Under 5 Years | 0 (0.0%) | 0 (0.0%) |
| 5 to 17 Years | 97 (6.7%) | 25 (1.6%) |
| 18 to 34 Years | 67 (3.6%) | 41 (2.8%) |
| 35 to 64 Years | 207 (7.4%) | 379 (13.3%) |
| 65 to 74 Years | 181 (20.0%) | 200 (20.0%) |
| 75 Years and over | 392 (54.1%) | 836 (62.9%) |
Disability Class by Sex by Age in Jenison
Disability Class: Hearing Difficulty
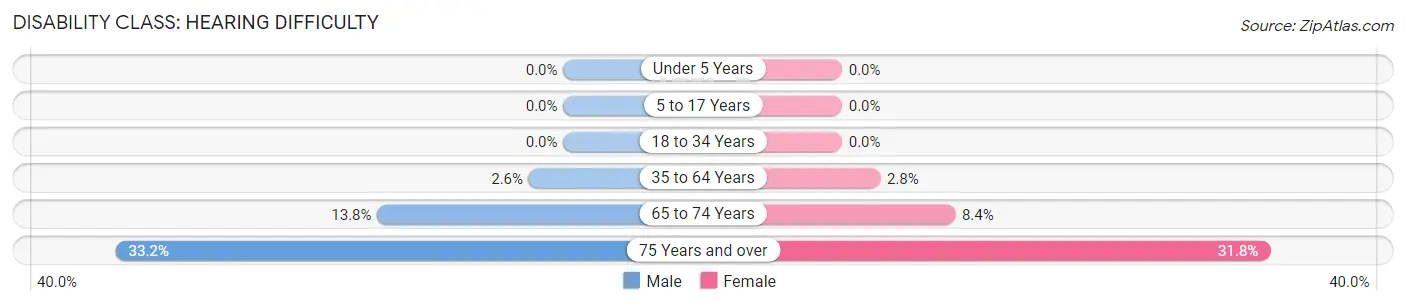
| Age Bracket | Male | Female |
| Under 5 Years | 0 (0.0%) | 0 (0.0%) |
| 5 to 17 Years | 0 (0.0%) | 0 (0.0%) |
| 18 to 34 Years | 0 (0.0%) | 0 (0.0%) |
| 35 to 64 Years | 72 (2.6%) | 81 (2.8%) |
| 65 to 74 Years | 125 (13.8%) | 84 (8.4%) |
| 75 Years and over | 241 (33.2%) | 423 (31.8%) |
Disability Class: Vision Difficulty
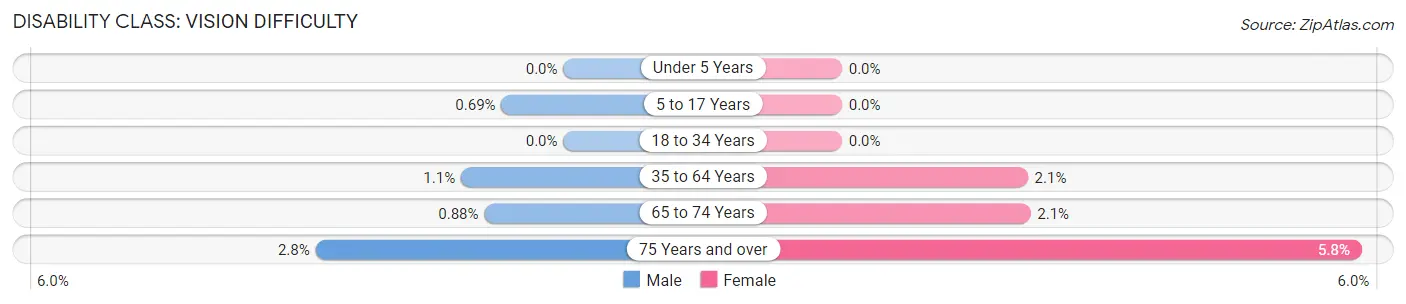
| Age Bracket | Male | Female |
| Under 5 Years | 0 (0.0%) | 0 (0.0%) |
| 5 to 17 Years | 10 (0.7%) | 0 (0.0%) |
| 18 to 34 Years | 0 (0.0%) | 0 (0.0%) |
| 35 to 64 Years | 32 (1.1%) | 59 (2.1%) |
| 65 to 74 Years | 8 (0.9%) | 21 (2.1%) |
| 75 Years and over | 20 (2.8%) | 77 (5.8%) |
Disability Class: Cognitive Difficulty
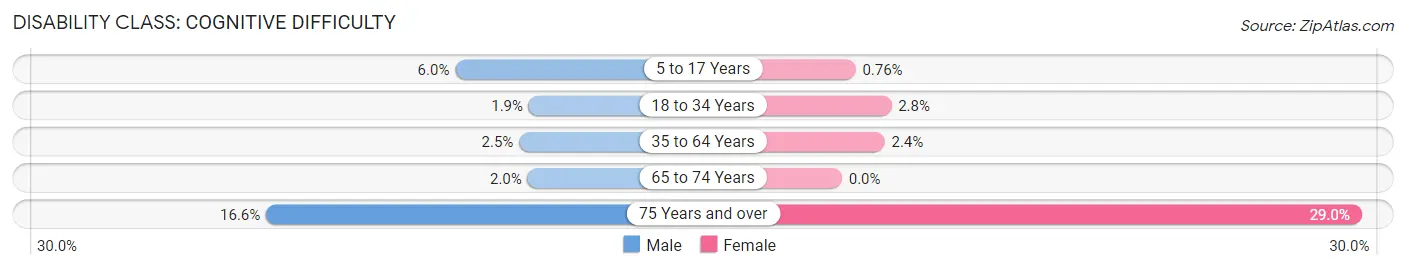
| Age Bracket | Male | Female |
| 5 to 17 Years | 87 (6.0%) | 12 (0.8%) |
| 18 to 34 Years | 36 (1.9%) | 41 (2.8%) |
| 35 to 64 Years | 69 (2.5%) | 68 (2.4%) |
| 65 to 74 Years | 18 (2.0%) | 0 (0.0%) |
| 75 Years and over | 120 (16.6%) | 385 (28.9%) |
Disability Class: Ambulatory Difficulty
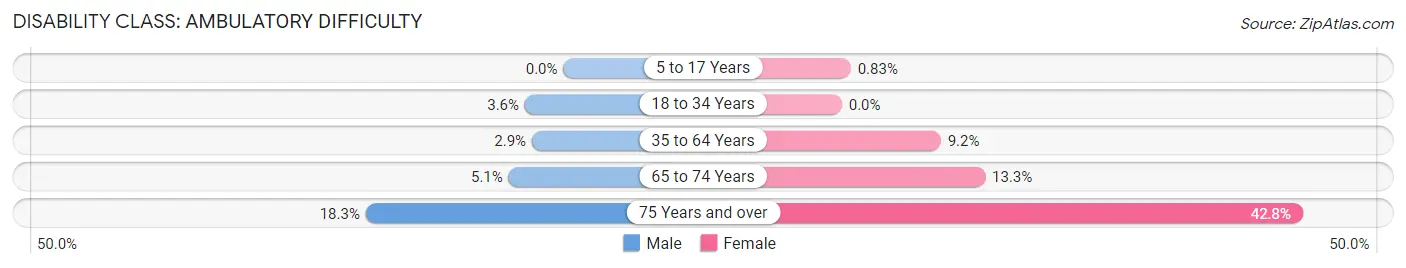
| Age Bracket | Male | Female |
| 5 to 17 Years | 0 (0.0%) | 13 (0.8%) |
| 18 to 34 Years | 67 (3.6%) | 0 (0.0%) |
| 35 to 64 Years | 82 (2.9%) | 262 (9.2%) |
| 65 to 74 Years | 46 (5.1%) | 133 (13.3%) |
| 75 Years and over | 133 (18.3%) | 569 (42.8%) |
Disability Class: Self-Care Difficulty
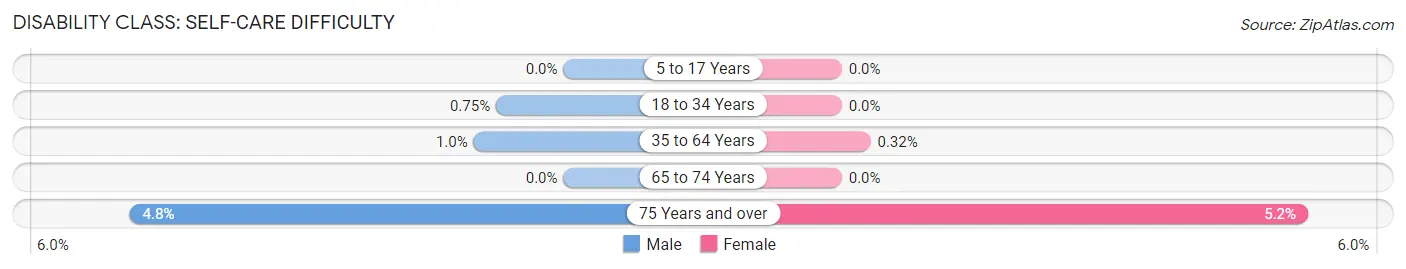
| Age Bracket | Male | Female |
| 5 to 17 Years | 0 (0.0%) | 0 (0.0%) |
| 18 to 34 Years | 14 (0.7%) | 0 (0.0%) |
| 35 to 64 Years | 28 (1.0%) | 9 (0.3%) |
| 65 to 74 Years | 0 (0.0%) | 0 (0.0%) |
| 75 Years and over | 35 (4.8%) | 69 (5.2%) |
Technology Access in Jenison
Computing Device Access in Jenison
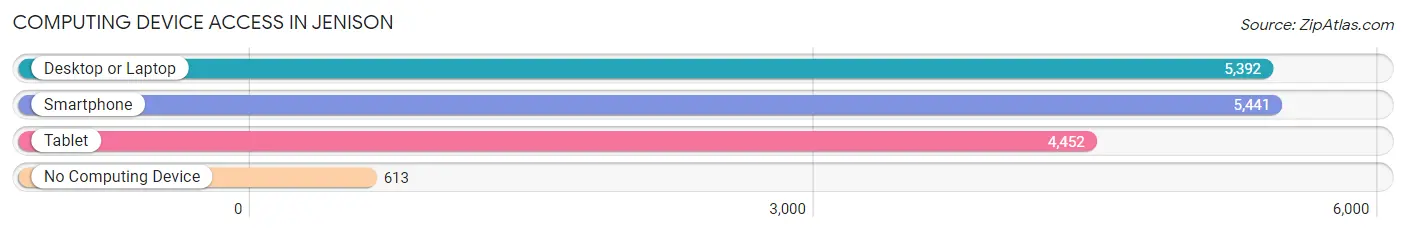
| Device Type | # Households | % Households |
| Desktop or Laptop | 5,392 | 80.2% |
| Smartphone | 5,441 | 81.0% |
| Tablet | 4,452 | 66.3% |
| No Computing Device | 613 | 9.1% |
| Total | 6,719 | 100.0% |
Internet Access in Jenison
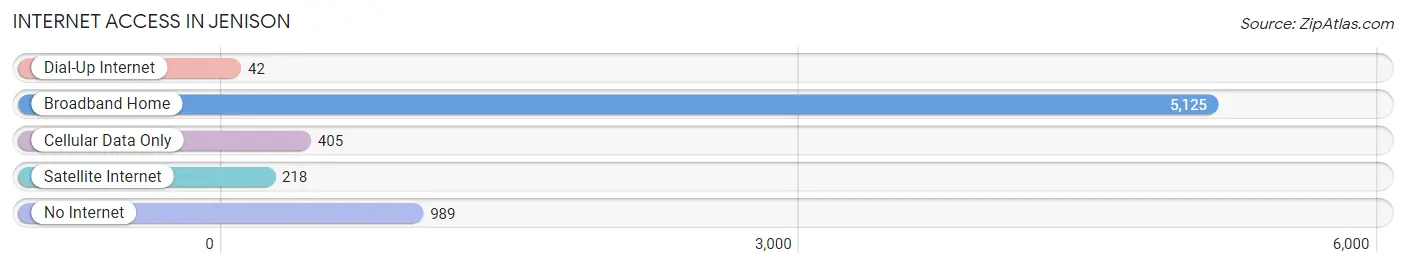
| Internet Type | # Households | % Households |
| Dial-Up Internet | 42 | 0.6% |
| Broadband Home | 5,125 | 76.3% |
| Cellular Data Only | 405 | 6.0% |
| Satellite Internet | 218 | 3.2% |
| No Internet | 989 | 14.7% |
| Total | 6,719 | 100.0% |
Jenison Summary
Jenison, Michigan is a small city located in Ottawa County, in the western part of the state. It is situated on the Grand River, about 15 miles west of Grand Rapids. The city has a population of about 10,000 people, and is part of the Grand Rapids metropolitan area.
History
Jenison was first settled in 1836 by a group of Dutch immigrants. The town was named after the Jenison family, who were among the first settlers. The town was incorporated in 1867, and the first mayor was elected in 1868.
In the late 19th century, Jenison was a thriving agricultural community. The town was known for its dairy farms, and the local economy was largely based on the production of butter and cheese. The town also had a number of small businesses, including a sawmill, a grist mill, and a brickyard.
In the early 20th century, Jenison began to experience a period of growth and development. The town was connected to Grand Rapids by a trolley line, and the local economy began to diversify. The town became home to a number of manufacturing companies, including a furniture factory, a canning factory, and a paper mill.
Geography
Jenison is located in western Michigan, in Ottawa County. The city is situated on the Grand River, about 15 miles west of Grand Rapids. The city is surrounded by the townships of Georgetown, Blendon, and Jamestown.
The city has a total area of 4.3 square miles, of which 4.2 square miles is land and 0.1 square miles is water. The terrain is mostly flat, with some rolling hills in the northern part of the city.
Economy
The economy of Jenison is largely based on manufacturing and services. The city is home to a number of manufacturing companies, including a furniture factory, a canning factory, and a paper mill. The city also has a number of retail stores, restaurants, and other businesses.
The city is also home to a number of educational institutions, including Jenison Public Schools, Grand Valley State University, and Davenport University.
Demographics
As of the 2010 census, the population of Jenison was 9,890. The racial makeup of the city was 94.3% White, 1.3% African American, 0.4% Native American, 1.2% Asian, 0.1% Pacific Islander, 1.2% from other races, and 1.5% from two or more races. Hispanic or Latino of any race were 3.2% of the population.
The median household income in Jenison was $60,945, and the median family income was $68,945. The per capita income was $27,845. About 4.3% of families and 5.7% of the population were below the poverty line.
Common Questions
What is Per Capita Income in Jenison?
Per Capita income in Jenison is $35,737.
What is the Median Family Income in Jenison?
Median Family Income in Jenison is $94,137.
What is the Median Household income in Jenison?
Median Household Income in Jenison is $80,043.
What is Income or Wage Gap in Jenison?
Income or Wage Gap in Jenison is 24.6%.
Women in Jenison earn 75.4 cents for every dollar earned by a man.
What is Inequality or Gini Index in Jenison?
Inequality or Gini Index in Jenison is 0.37.
What is the Total Population of Jenison?
Total Population of Jenison is 17,314.
What is the Total Male Population of Jenison?
Total Male Population of Jenison is 8,365.
What is the Total Female Population of Jenison?
Total Female Population of Jenison is 8,949.
What is the Ratio of Males per 100 Females in Jenison?
There are 93.47 Males per 100 Females in Jenison.
What is the Ratio of Females per 100 Males in Jenison?
There are 106.98 Females per 100 Males in Jenison.
What is the Median Population Age in Jenison?
Median Population Age in Jenison is 38.6 Years.
What is the Average Family Size in Jenison
Average Family Size in Jenison is 3.1 People.
What is the Average Household Size in Jenison
Average Household Size in Jenison is 2.6 People.
How Large is the Labor Force in Jenison?
There are 8,414 People in the Labor Forcein in Jenison.
What is the Percentage of People in the Labor Force in Jenison?
62.3% of People are in the Labor Force in Jenison.
What is the Unemployment Rate in Jenison?
Unemployment Rate in Jenison is 2.1%.