La Vale, MD Map & Demographics
La Vale Map
La Vale Overview
$40,573
PER CAPITA INCOME
$85,481
AVG FAMILY INCOME
$73,778
AVG HOUSEHOLD INCOME
7.3%
WAGE / INCOME GAP [ % ]
92.7¢/ $1
WAGE / INCOME GAP [ $ ]
0.39
INEQUALITY / GINI INDEX
4,351
TOTAL POPULATION
2,196
MALE POPULATION
2,155
FEMALE POPULATION
101.90
MALES / 100 FEMALES
98.13
FEMALES / 100 MALES
44.3
MEDIAN AGE
2.9
AVG FAMILY SIZE
2.3
AVG HOUSEHOLD SIZE
2,309
LABOR FORCE [ PEOPLE ]
65.0%
PERCENT IN LABOR FORCE
2.7%
UNEMPLOYMENT RATE
Income in La Vale
Income Overview in La Vale
Per Capita Income in La Vale is $40,573, while median incomes of families and households are $85,481 and $73,778 respectively.
| Characteristic | Number | Measure |
| Per Capita Income | 4,351 | $40,573 |
| Median Family Income | 1,123 | $85,481 |
| Mean Family Income | 1,123 | $104,855 |
| Median Household Income | 1,924 | $73,778 |
| Mean Household Income | 1,924 | $91,224 |
| Income Deficit | 1,123 | $0 |
| Wage / Income Gap (%) | 4,351 | 7.35% |
| Wage / Income Gap ($) | 4,351 | 92.65¢ per $1 |
| Gini / Inequality Index | 4,351 | 0.39 |
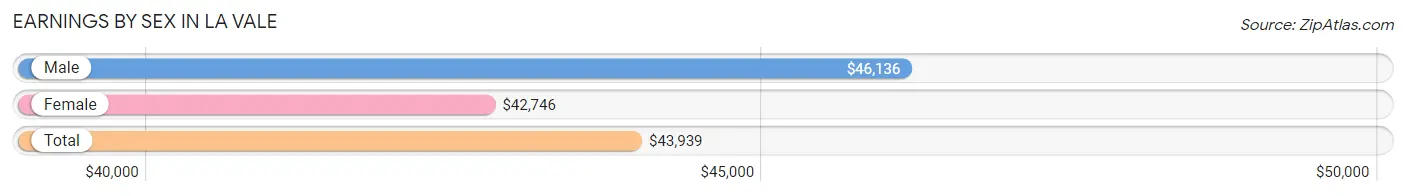
Earnings by Sex in La Vale
Average Earnings in La Vale are $43,939, $46,136 for men and $42,746 for women, a difference of 7.3%.
| Sex | Number | Average Earnings |
| Male | 1,180 (49.5%) | $46,136 |
| Female | 1,206 (50.5%) | $42,746 |
| Total | 2,386 (100.0%) | $43,939 |
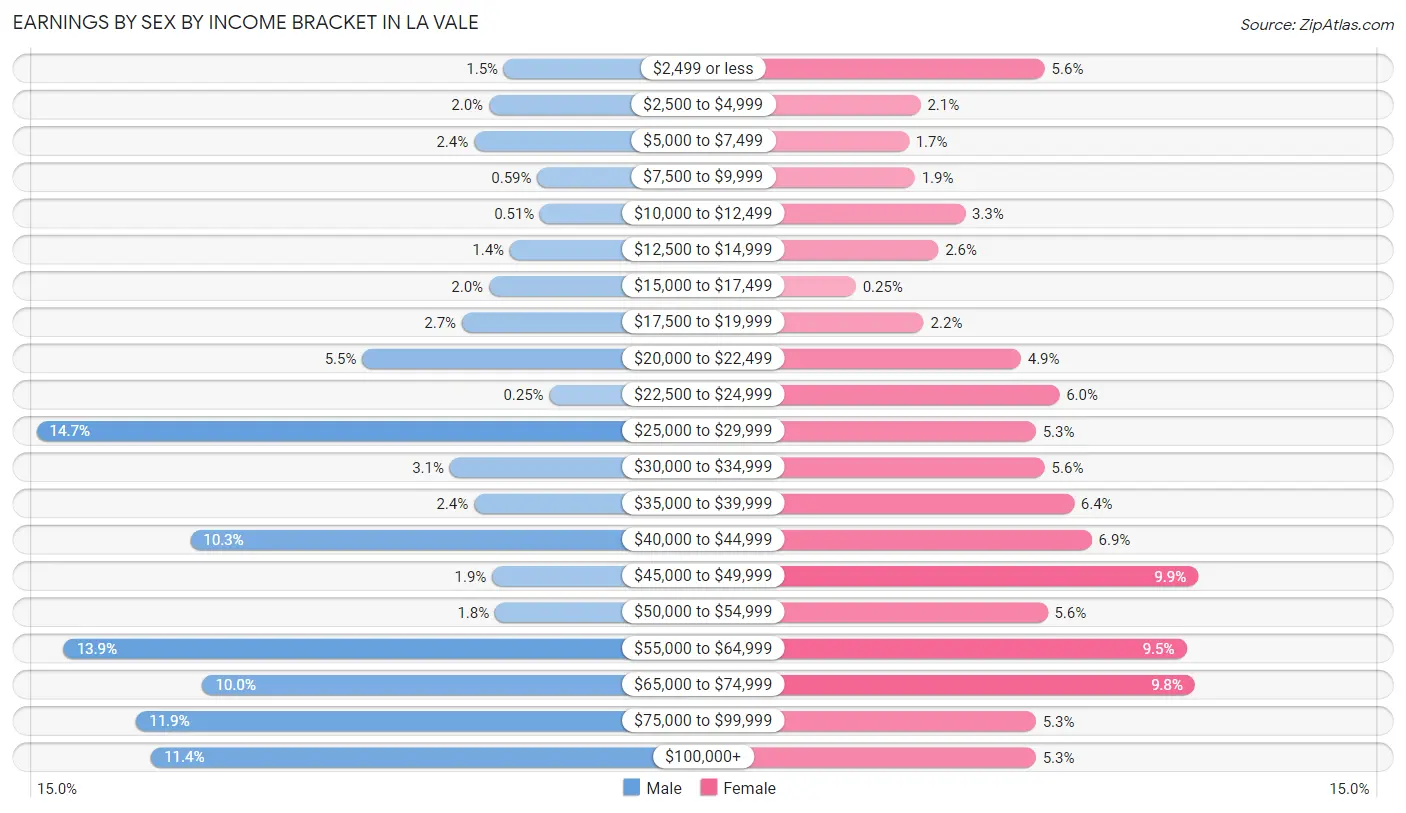
Earnings by Sex by Income Bracket in La Vale
The most common earnings brackets in La Vale are $25,000 to $29,999 for men (173 | 14.7%) and $45,000 to $49,999 for women (119 | 9.9%).
| Income | Male | Female |
| $2,499 or less | 18 (1.5%) | 67 (5.6%) |
| $2,500 to $4,999 | 23 (1.9%) | 25 (2.1%) |
| $5,000 to $7,499 | 28 (2.4%) | 21 (1.7%) |
| $7,500 to $9,999 | 7 (0.6%) | 23 (1.9%) |
| $10,000 to $12,499 | 6 (0.5%) | 40 (3.3%) |
| $12,500 to $14,999 | 16 (1.4%) | 31 (2.6%) |
| $15,000 to $17,499 | 23 (1.9%) | 3 (0.3%) |
| $17,500 to $19,999 | 32 (2.7%) | 26 (2.2%) |
| $20,000 to $22,499 | 65 (5.5%) | 59 (4.9%) |
| $22,500 to $24,999 | 3 (0.3%) | 72 (6.0%) |
| $25,000 to $29,999 | 173 (14.7%) | 64 (5.3%) |
| $30,000 to $34,999 | 36 (3.0%) | 67 (5.6%) |
| $35,000 to $39,999 | 28 (2.4%) | 77 (6.4%) |
| $40,000 to $44,999 | 122 (10.3%) | 83 (6.9%) |
| $45,000 to $49,999 | 22 (1.9%) | 119 (9.9%) |
| $50,000 to $54,999 | 21 (1.8%) | 68 (5.6%) |
| $55,000 to $64,999 | 164 (13.9%) | 115 (9.5%) |
| $65,000 to $74,999 | 118 (10.0%) | 118 (9.8%) |
| $75,000 to $99,999 | 140 (11.9%) | 64 (5.3%) |
| $100,000+ | 135 (11.4%) | 64 (5.3%) |
| Total | 1,180 (100.0%) | 1,206 (100.0%) |
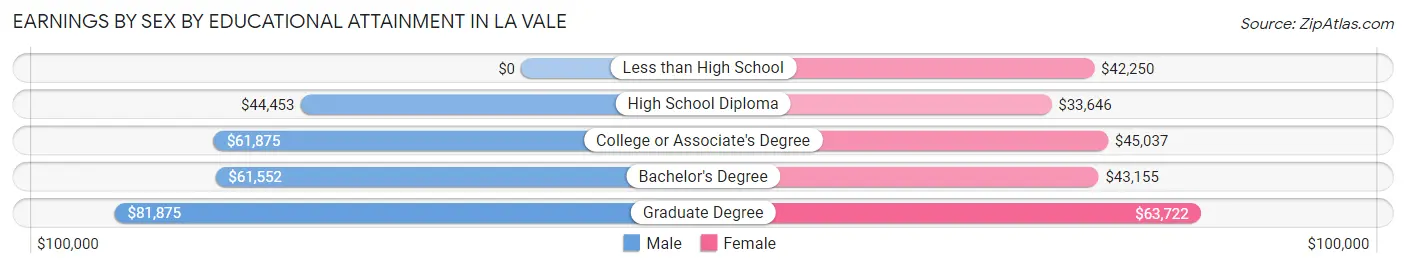
Earnings by Sex by Educational Attainment in La Vale
Average earnings in La Vale are $57,841 for men and $45,290 for women, a difference of 21.7%. Men with an educational attainment of graduate degree enjoy the highest average annual earnings of $81,875, while those with high school diploma education earn the least with $44,453. Women with an educational attainment of graduate degree earn the most with the average annual earnings of $63,722, while those with high school diploma education have the smallest earnings of $33,646.
| Educational Attainment | Male Income | Female Income |
| Less than High School | - | - |
| High School Diploma | $44,453 | $33,646 |
| College or Associate's Degree | $61,875 | $45,037 |
| Bachelor's Degree | $61,552 | $43,155 |
| Graduate Degree | $81,875 | $63,722 |
| Total | $57,841 | $45,290 |
Family Income in La Vale
Family Income Brackets in La Vale
According to the La Vale family income data, there are 305 families falling into the $50,000 to $74,999 income range, which is the most common income bracket and makes up 27.2% of all families. Conversely, the less than $10,000 income bracket is the least frequent group with only 6 families (0.5%) belonging to this category.
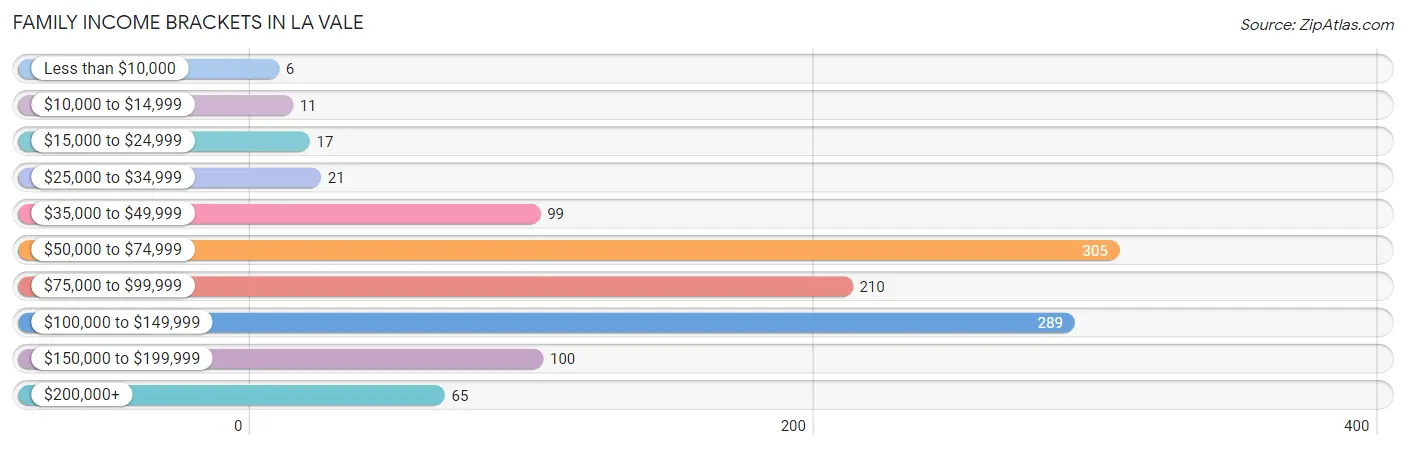
| Income Bracket | # Families | % Families |
| Less than $10,000 | 6 | 0.5% |
| $10,000 to $14,999 | 11 | 1.0% |
| $15,000 to $24,999 | 17 | 1.5% |
| $25,000 to $34,999 | 21 | 1.9% |
| $35,000 to $49,999 | 99 | 8.8% |
| $50,000 to $74,999 | 305 | 27.2% |
| $75,000 to $99,999 | 210 | 18.7% |
| $100,000 to $149,999 | 289 | 25.7% |
| $150,000 to $199,999 | 100 | 8.9% |
| $200,000+ | 65 | 5.8% |
Family Income by Famaliy Size in La Vale
5-person families (89 | 7.9%) account for the highest median family income in La Vale with $127,750 per family, while 2-person families (653 | 58.2%) have the highest median income of $38,125 per family member.
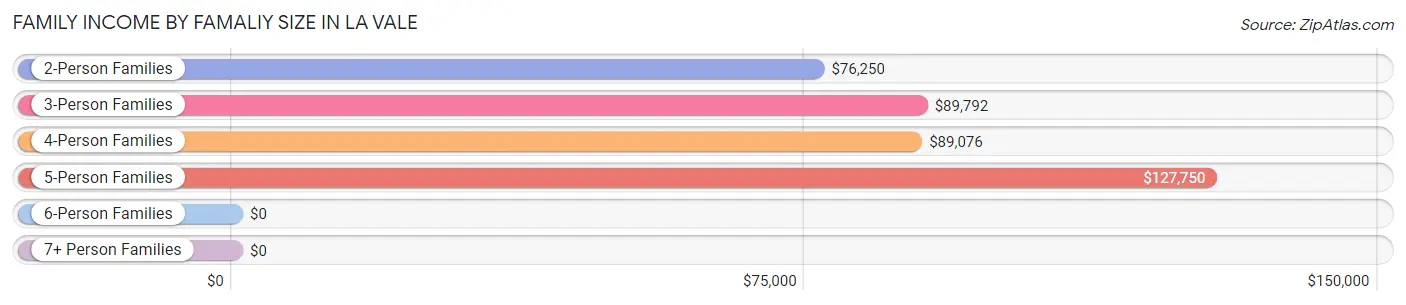
| Income Bracket | # Families | Median Income |
| 2-Person Families | 653 (58.2%) | $76,250 |
| 3-Person Families | 221 (19.7%) | $89,792 |
| 4-Person Families | 151 (13.5%) | $89,076 |
| 5-Person Families | 89 (7.9%) | $127,750 |
| 6-Person Families | 7 (0.6%) | $0 |
| 7+ Person Families | 2 (0.2%) | $0 |
| Total | 1,123 (100.0%) | $85,481 |
Family Income by Number of Earners in La Vale
The median family income in La Vale is $85,481, with families comprising 3+ earners (51) having the highest median family income of $133,194, while families with no earners (254) have the lowest median family income of $63,918, accounting for 4.5% and 22.6% of families, respectively.
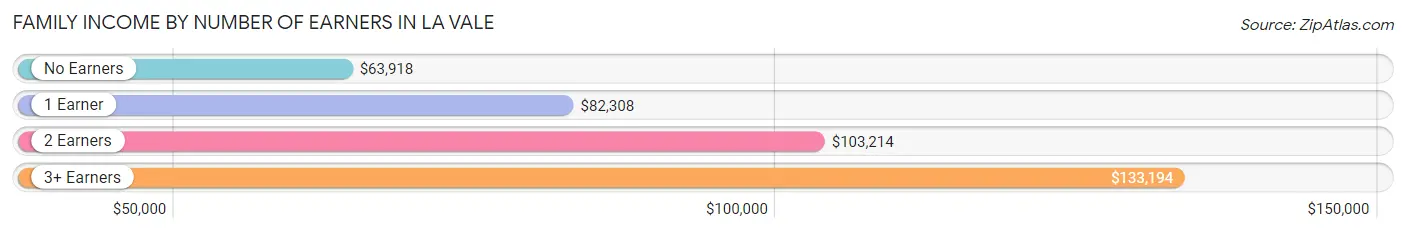
| Number of Earners | # Families | Median Income |
| No Earners | 254 (22.6%) | $63,918 |
| 1 Earner | 262 (23.3%) | $82,308 |
| 2 Earners | 556 (49.5%) | $103,214 |
| 3+ Earners | 51 (4.5%) | $133,194 |
| Total | 1,123 (100.0%) | $85,481 |
Household Income in La Vale
Household Income Brackets in La Vale
With 473 households falling in the category, the $50,000 to $74,999 income range is the most frequent in La Vale, accounting for 24.6% of all households. In contrast, only 38 households (2.0%) fall into the less than $10,000 income bracket, making it the least populous group.
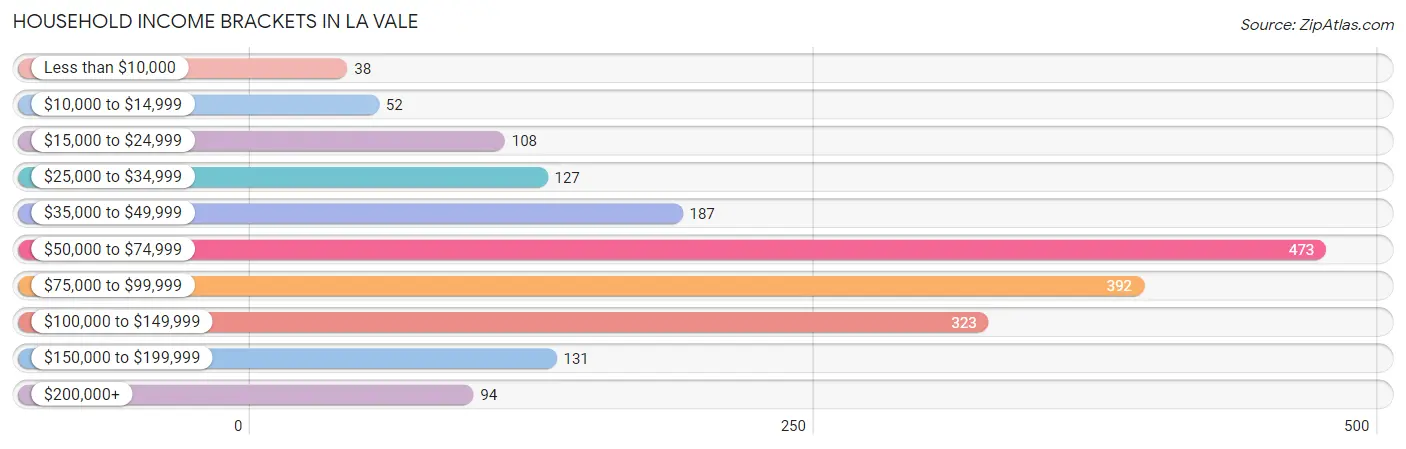
| Income Bracket | # Households | % Households |
| Less than $10,000 | 38 | 2.0% |
| $10,000 to $14,999 | 52 | 2.7% |
| $15,000 to $24,999 | 108 | 5.6% |
| $25,000 to $34,999 | 127 | 6.6% |
| $35,000 to $49,999 | 187 | 9.7% |
| $50,000 to $74,999 | 473 | 24.6% |
| $75,000 to $99,999 | 392 | 20.4% |
| $100,000 to $149,999 | 323 | 16.8% |
| $150,000 to $199,999 | 131 | 6.8% |
| $200,000+ | 94 | 4.9% |
Household Income by Householder Age in La Vale
The median household income in La Vale is $73,778, with the highest median household income of $87,106 found in the 25 to 44 years age bracket for the primary householder. A total of 575 households (29.9%) fall into this category. Meanwhile, the 15 to 24 years age bracket for the primary householder has the lowest median household income of $50,579, with 113 households (5.9%) in this group.
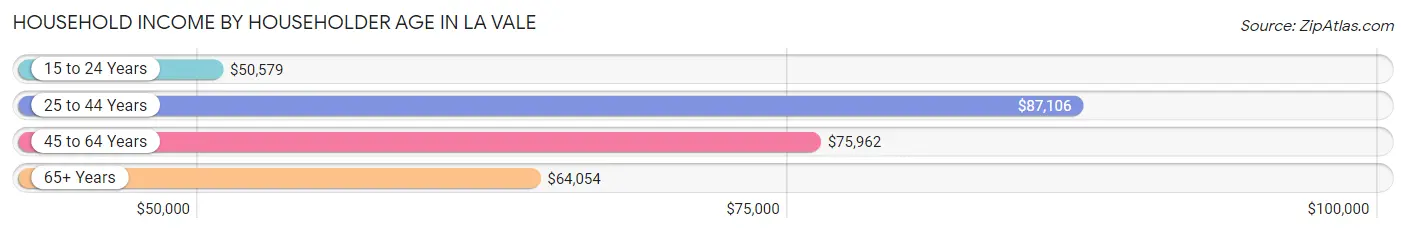
| Income Bracket | # Households | Median Income |
| 15 to 24 Years | 113 (5.9%) | $50,579 |
| 25 to 44 Years | 575 (29.9%) | $87,106 |
| 45 to 64 Years | 574 (29.8%) | $75,962 |
| 65+ Years | 662 (34.4%) | $64,054 |
| Total | 1,924 (100.0%) | $73,778 |
Poverty in La Vale
Income Below Poverty by Sex and Age in La Vale
With 2.6% poverty level for males and 3.4% for females among the residents of La Vale, 65 to 74 year old males and 55 to 64 year old females are the most vulnerable to poverty, with 22 males (7.5%) and 28 females (7.5%) in their respective age groups living below the poverty level.
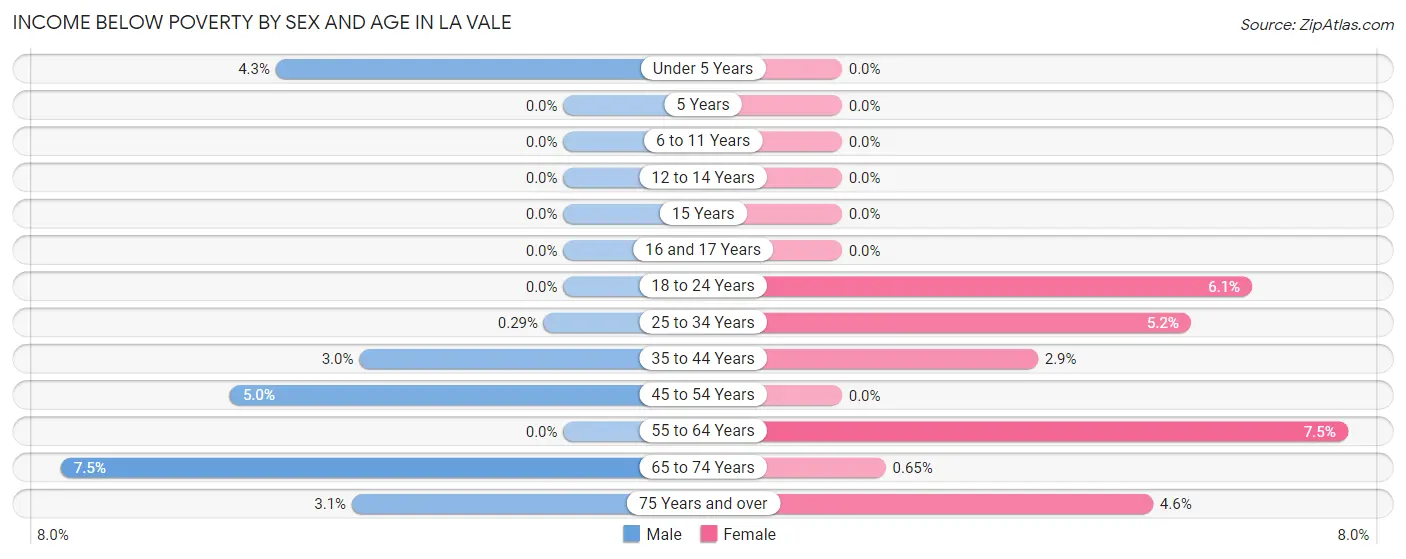
| Age Bracket | Male | Female |
| Under 5 Years | 10 (4.3%) | 0 (0.0%) |
| 5 Years | 0 (0.0%) | 0 (0.0%) |
| 6 to 11 Years | 0 (0.0%) | 0 (0.0%) |
| 12 to 14 Years | 0 (0.0%) | 0 (0.0%) |
| 15 Years | 0 (0.0%) | 0 (0.0%) |
| 16 and 17 Years | 0 (0.0%) | 0 (0.0%) |
| 18 to 24 Years | 0 (0.0%) | 7 (6.1%) |
| 25 to 34 Years | 1 (0.3%) | 19 (5.2%) |
| 35 to 44 Years | 6 (3.0%) | 5 (2.9%) |
| 45 to 54 Years | 11 (5.0%) | 0 (0.0%) |
| 55 to 64 Years | 0 (0.0%) | 28 (7.5%) |
| 65 to 74 Years | 22 (7.5%) | 2 (0.6%) |
| 75 Years and over | 6 (3.1%) | 12 (4.6%) |
| Total | 56 (2.6%) | 73 (3.4%) |
Income Above Poverty by Sex and Age in La Vale
According to the poverty statistics in La Vale, males aged 5 years and females aged under 5 years are the age groups that are most secure financially, with 100.0% of males and 100.0% of females in these age groups living above the poverty line.
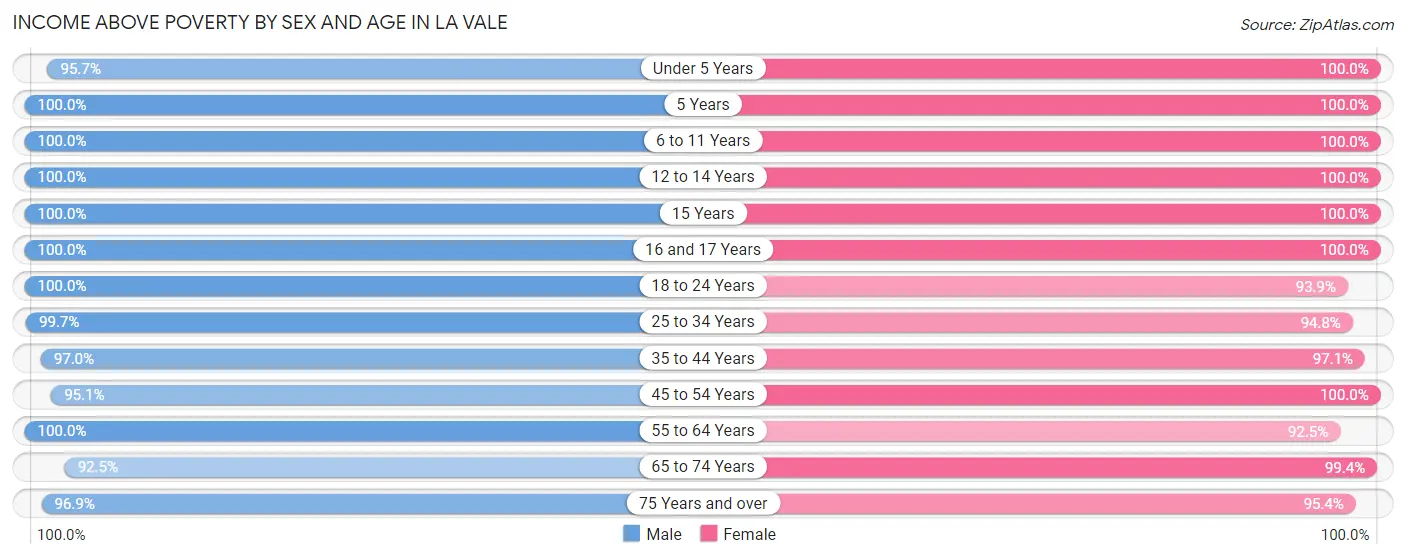
| Age Bracket | Male | Female |
| Under 5 Years | 224 (95.7%) | 95 (100.0%) |
| 5 Years | 16 (100.0%) | 55 (100.0%) |
| 6 to 11 Years | 173 (100.0%) | 121 (100.0%) |
| 12 to 14 Years | 8 (100.0%) | 48 (100.0%) |
| 15 Years | 15 (100.0%) | 18 (100.0%) |
| 16 and 17 Years | 64 (100.0%) | 22 (100.0%) |
| 18 to 24 Years | 157 (100.0%) | 108 (93.9%) |
| 25 to 34 Years | 346 (99.7%) | 348 (94.8%) |
| 35 to 44 Years | 192 (97.0%) | 167 (97.1%) |
| 45 to 54 Years | 211 (95.1%) | 191 (100.0%) |
| 55 to 64 Years | 270 (100.0%) | 345 (92.5%) |
| 65 to 74 Years | 273 (92.5%) | 307 (99.4%) |
| 75 Years and over | 185 (96.9%) | 248 (95.4%) |
| Total | 2,134 (97.4%) | 2,073 (96.6%) |
Income Below Poverty Among Married-Couple Families in La Vale
The poverty statistics for married-couple families in La Vale show that 1.1% or 11 of the total 961 families live below the poverty line. Families with no children have the highest poverty rate of 1.7%, comprising of 11 families. On the other hand, families with 1 or 2 children have the lowest poverty rate of 0.0%, which includes 0 families.
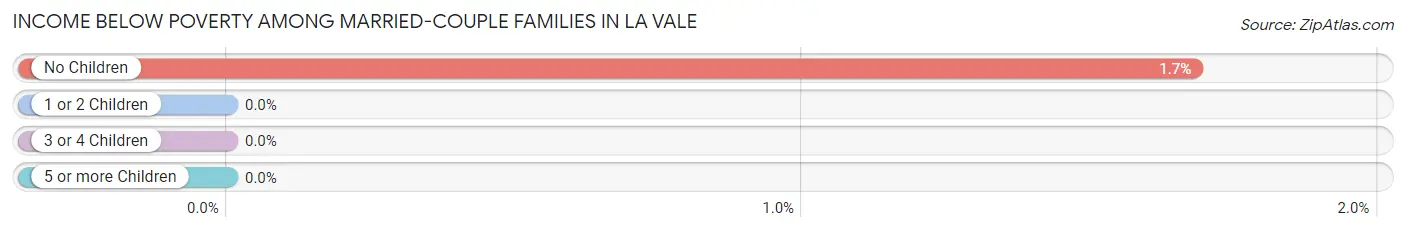
| Children | Above Poverty | Below Poverty |
| No Children | 644 (98.3%) | 11 (1.7%) |
| 1 or 2 Children | 219 (100.0%) | 0 (0.0%) |
| 3 or 4 Children | 85 (100.0%) | 0 (0.0%) |
| 5 or more Children | 2 (100.0%) | 0 (0.0%) |
| Total | 950 (98.9%) | 11 (1.1%) |
Income Below Poverty Among Single-Parent Households in La Vale
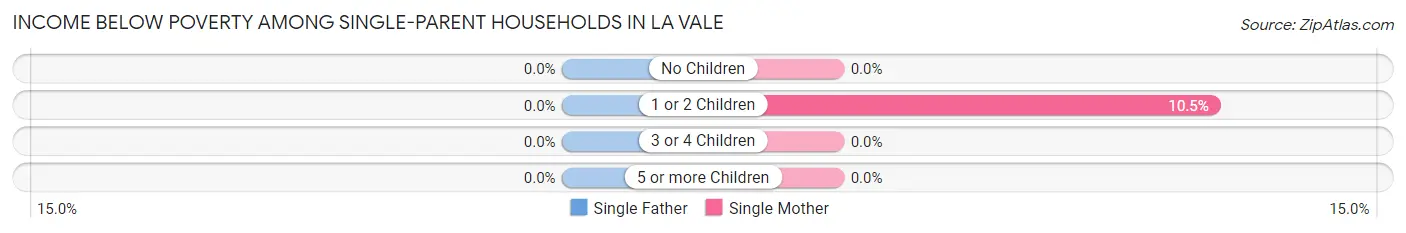
| Children | Single Father | Single Mother |
| No Children | 0 (0.0%) | 0 (0.0%) |
| 1 or 2 Children | 0 (0.0%) | 6 (10.5%) |
| 3 or 4 Children | 0 (0.0%) | 0 (0.0%) |
| 5 or more Children | 0 (0.0%) | 0 (0.0%) |
| Total | 0 (0.0%) | 6 (5.2%) |
Income Below Poverty Among Married-Couple vs Single-Parent Households in La Vale
The poverty data for La Vale shows that 11 of the married-couple family households (1.1%) and 6 of the single-parent households (3.7%) are living below the poverty level. Within the married-couple family households, those with no children have the highest poverty rate, with 11 households (1.7%) falling below the poverty line. Among the single-parent households, those with 1 or 2 children have the highest poverty rate, with 6 household (6.5%) living below poverty.
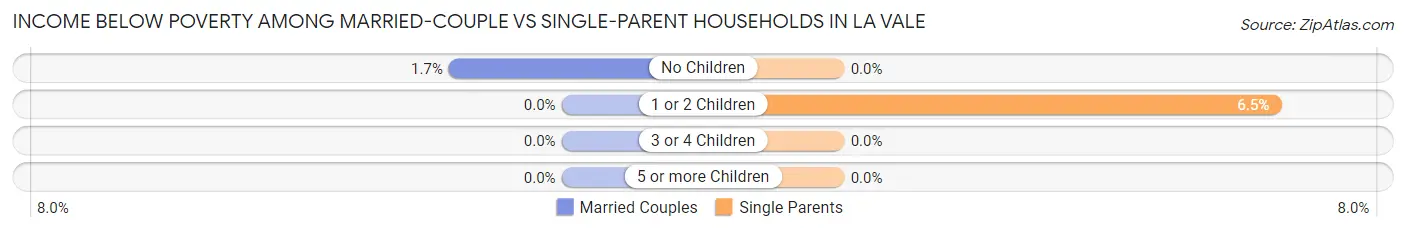
| Children | Married-Couple Families | Single-Parent Households |
| No Children | 11 (1.7%) | 0 (0.0%) |
| 1 or 2 Children | 0 (0.0%) | 6 (6.5%) |
| 3 or 4 Children | 0 (0.0%) | 0 (0.0%) |
| 5 or more Children | 0 (0.0%) | 0 (0.0%) |
| Total | 11 (1.1%) | 6 (3.7%) |
Race in La Vale
The most populous races in La Vale are White / Caucasian (3,896 | 89.5%), Two or more Races (271 | 6.2%), and Hispanic or Latino (179 | 4.1%).
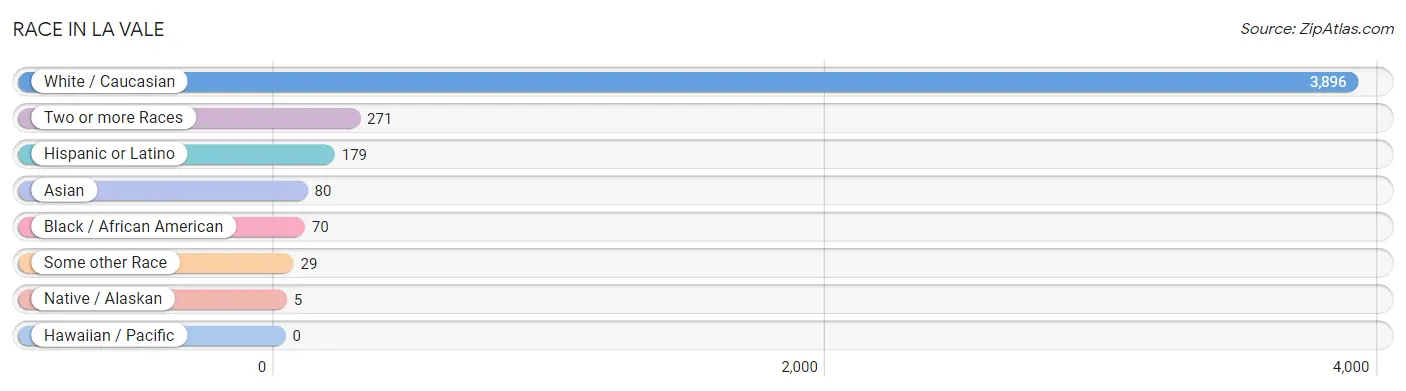
| Race | # Population | % Population |
| Asian | 80 | 1.8% |
| Black / African American | 70 | 1.6% |
| Hawaiian / Pacific | 0 | 0.0% |
| Hispanic or Latino | 179 | 4.1% |
| Native / Alaskan | 5 | 0.1% |
| White / Caucasian | 3,896 | 89.5% |
| Two or more Races | 271 | 6.2% |
| Some other Race | 29 | 0.7% |
| Total | 4,351 | 100.0% |
Ancestry in La Vale
The most populous ancestries reported in La Vale are German (1,285 | 29.5%), English (876 | 20.1%), Irish (475 | 10.9%), Italian (361 | 8.3%), and Scottish (228 | 5.2%), together accounting for 74.1% of all La Vale residents.
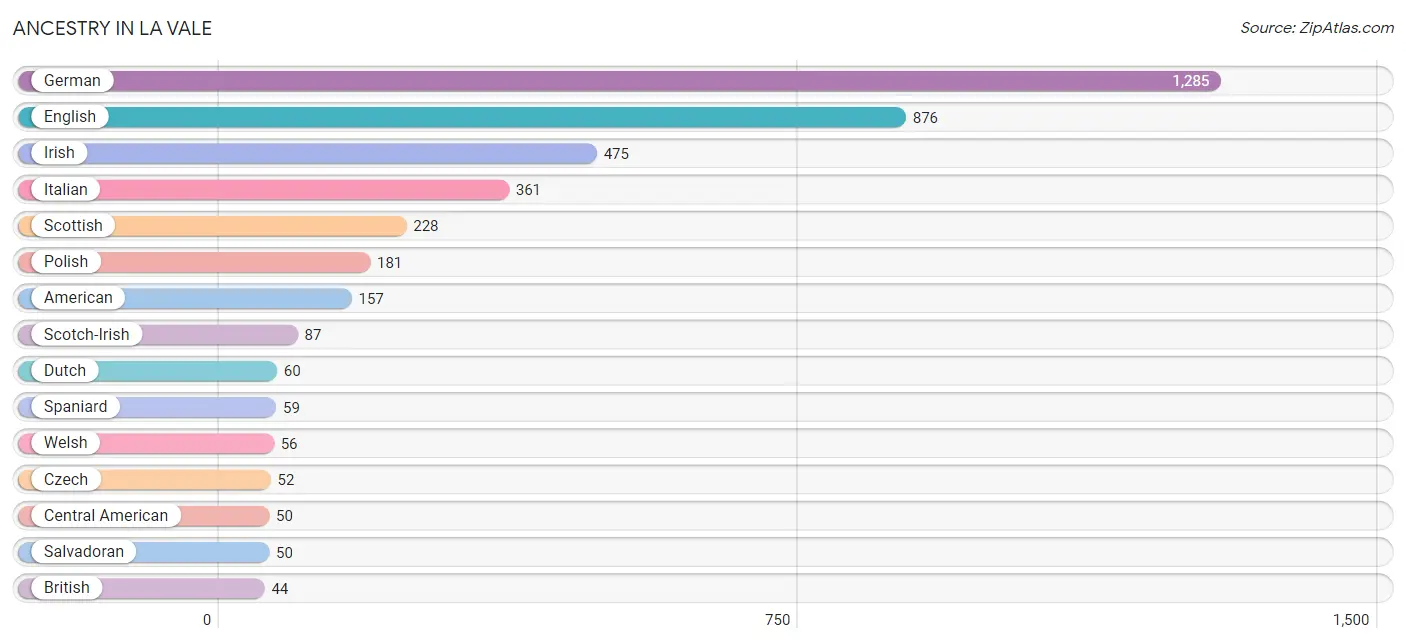
| Ancestry | # Population | % Population |
| American | 157 | 3.6% |
| Austrian | 11 | 0.3% |
| British | 44 | 1.0% |
| Central American | 50 | 1.1% |
| Colombian | 23 | 0.5% |
| Cuban | 8 | 0.2% |
| Czech | 52 | 1.2% |
| Dutch | 60 | 1.4% |
| English | 876 | 20.1% |
| European | 8 | 0.2% |
| Filipino | 17 | 0.4% |
| Finnish | 44 | 1.0% |
| French | 43 | 1.0% |
| French Canadian | 6 | 0.1% |
| German | 1,285 | 29.5% |
| Ghanaian | 8 | 0.2% |
| Hungarian | 43 | 1.0% |
| Indian (Asian) | 14 | 0.3% |
| Irish | 475 | 10.9% |
| Italian | 361 | 8.3% |
| Korean | 1 | 0.0% |
| Mexican | 32 | 0.7% |
| Norwegian | 7 | 0.2% |
| Peruvian | 7 | 0.2% |
| Polish | 181 | 4.2% |
| Portuguese | 12 | 0.3% |
| Russian | 26 | 0.6% |
| Salvadoran | 50 | 1.1% |
| Scandinavian | 12 | 0.3% |
| Scotch-Irish | 87 | 2.0% |
| Scottish | 228 | 5.2% |
| Slovak | 5 | 0.1% |
| Slovene | 44 | 1.0% |
| South American | 30 | 0.7% |
| Spaniard | 59 | 1.4% |
| Subsaharan African | 8 | 0.2% |
| Swedish | 7 | 0.2% |
| Welsh | 56 | 1.3% | View All 38 Rows |
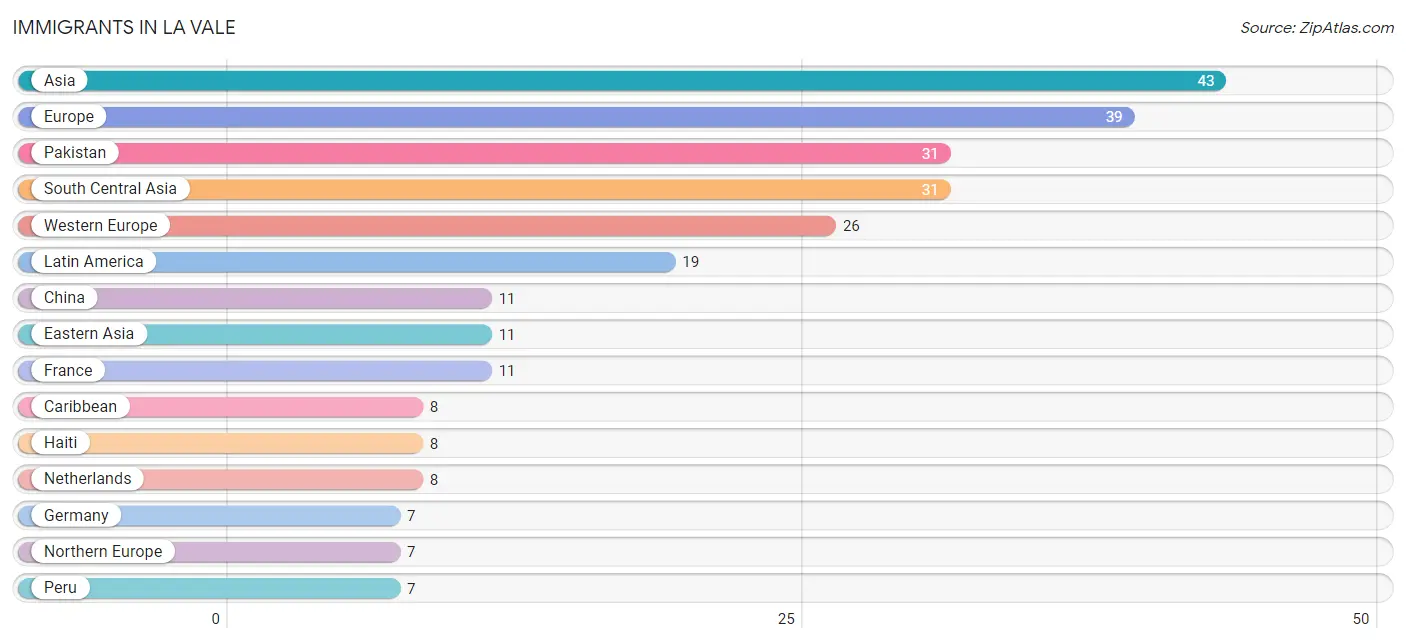
Immigrants in La Vale
The most numerous immigrant groups reported in La Vale came from Asia (43 | 1.0%), Europe (39 | 0.9%), Pakistan (31 | 0.7%), South Central Asia (31 | 0.7%), and Western Europe (26 | 0.6%), together accounting for 3.9% of all La Vale residents.
| Immigration Origin | # Population | % Population |
| Africa | 6 | 0.1% |
| Asia | 43 | 1.0% |
| Caribbean | 8 | 0.2% |
| Central America | 4 | 0.1% |
| China | 11 | 0.3% |
| Eastern Asia | 11 | 0.3% |
| El Salvador | 4 | 0.1% |
| Europe | 39 | 0.9% |
| France | 11 | 0.3% |
| Germany | 7 | 0.2% |
| Ghana | 6 | 0.1% |
| Haiti | 8 | 0.2% |
| Latin America | 19 | 0.4% |
| Netherlands | 8 | 0.2% |
| Northern Europe | 7 | 0.2% |
| Pakistan | 31 | 0.7% |
| Peru | 7 | 0.2% |
| Philippines | 1 | 0.0% |
| Portugal | 6 | 0.1% |
| South America | 7 | 0.2% |
| South Central Asia | 31 | 0.7% |
| South Eastern Asia | 1 | 0.0% |
| Southern Europe | 6 | 0.1% |
| Taiwan | 5 | 0.1% |
| Western Africa | 6 | 0.1% |
| Western Europe | 26 | 0.6% | View All 26 Rows |
Sex and Age in La Vale
Sex and Age in La Vale
The most populous age groups in La Vale are Under 5 Years (234 | 10.7%) for men and 25 to 29 Years (221 | 10.3%) for women.

| Age Bracket | Male | Female |
| Under 5 Years | 234 (10.7%) | 95 (4.4%) |
| 5 to 9 Years | 166 (7.6%) | 134 (6.2%) |
| 10 to 14 Years | 37 (1.7%) | 99 (4.6%) |
| 15 to 19 Years | 109 (5.0%) | 72 (3.3%) |
| 20 to 24 Years | 127 (5.8%) | 83 (3.8%) |
| 25 to 29 Years | 165 (7.5%) | 221 (10.3%) |
| 30 to 34 Years | 182 (8.3%) | 146 (6.8%) |
| 35 to 39 Years | 81 (3.7%) | 74 (3.4%) |
| 40 to 44 Years | 117 (5.3%) | 98 (4.5%) |
| 45 to 49 Years | 50 (2.3%) | 127 (5.9%) |
| 50 to 54 Years | 172 (7.8%) | 64 (3.0%) |
| 55 to 59 Years | 104 (4.7%) | 193 (9.0%) |
| 60 to 64 Years | 166 (7.6%) | 180 (8.4%) |
| 65 to 69 Years | 157 (7.1%) | 125 (5.8%) |
| 70 to 74 Years | 138 (6.3%) | 184 (8.5%) |
| 75 to 79 Years | 90 (4.1%) | 100 (4.6%) |
| 80 to 84 Years | 10 (0.5%) | 19 (0.9%) |
| 85 Years and over | 91 (4.1%) | 141 (6.5%) |
| Total | 2,196 (100.0%) | 2,155 (100.0%) |
Families and Households in La Vale
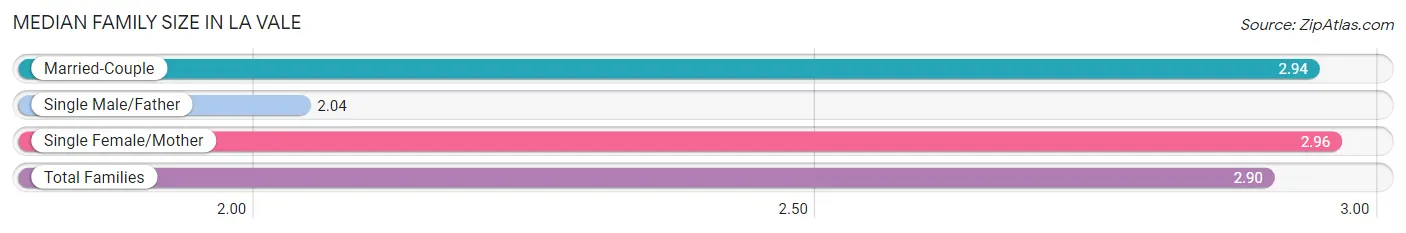
Median Family Size in La Vale
The median family size in La Vale is 2.90 persons per family, with single female/mother families (115 | 10.2%) accounting for the largest median family size of 2.96 persons per family. On the other hand, single male/father families (47 | 4.2%) represent the smallest median family size with 2.04 persons per family.
| Family Type | # Families | Family Size |
| Married-Couple | 961 (85.6%) | 2.94 |
| Single Male/Father | 47 (4.2%) | 2.04 |
| Single Female/Mother | 115 (10.2%) | 2.96 |
| Total Families | 1,123 (100.0%) | 2.90 |
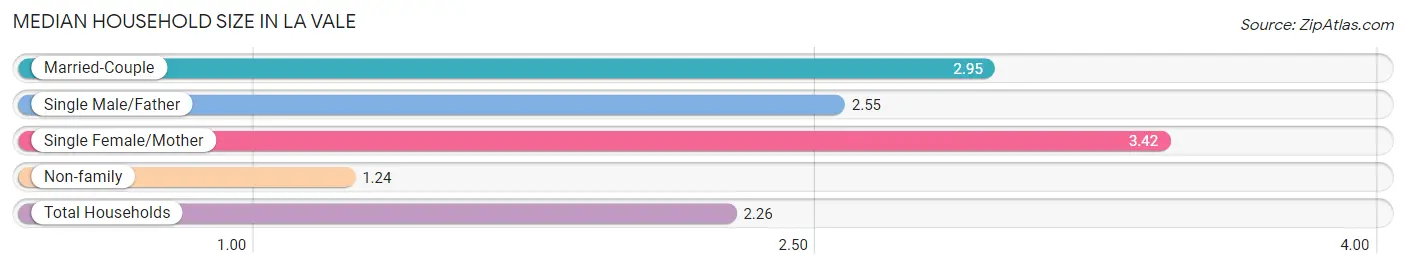
Median Household Size in La Vale
The median household size in La Vale is 2.26 persons per household, with single female/mother households (115 | 6.0%) accounting for the largest median household size of 3.42 persons per household. non-family households (801 | 41.6%) represent the smallest median household size with 1.24 persons per household.
| Household Type | # Households | Household Size |
| Married-Couple | 961 (49.9%) | 2.95 |
| Single Male/Father | 47 (2.4%) | 2.55 |
| Single Female/Mother | 115 (6.0%) | 3.42 |
| Non-family | 801 (41.6%) | 1.24 |
| Total Households | 1,924 (100.0%) | 2.26 |
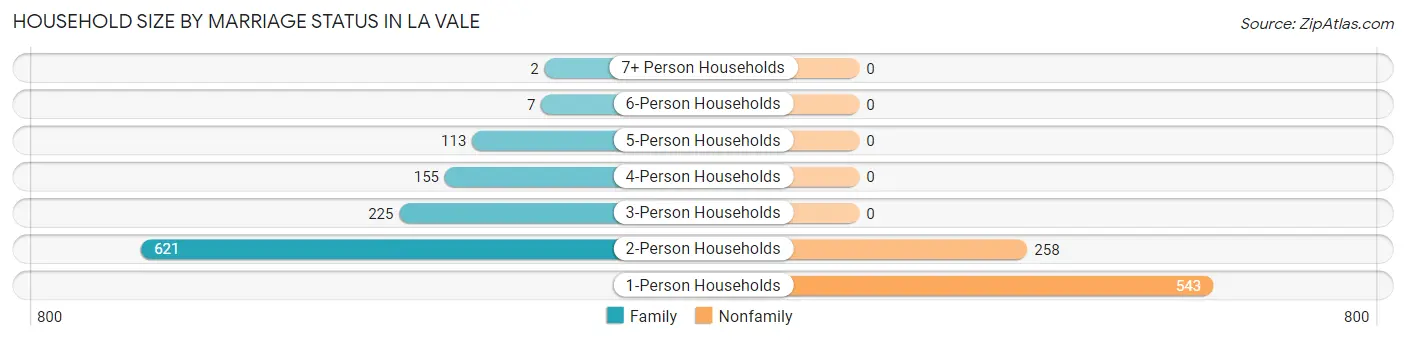
Household Size by Marriage Status in La Vale
Out of a total of 1,924 households in La Vale, 1,123 (58.4%) are family households, while 801 (41.6%) are nonfamily households. The most numerous type of family households are 2-person households, comprising 621, and the most common type of nonfamily households are 1-person households, comprising 543.
| Household Size | Family Households | Nonfamily Households |
| 1-Person Households | - | 543 (28.2%) |
| 2-Person Households | 621 (32.3%) | 258 (13.4%) |
| 3-Person Households | 225 (11.7%) | 0 (0.0%) |
| 4-Person Households | 155 (8.1%) | 0 (0.0%) |
| 5-Person Households | 113 (5.9%) | 0 (0.0%) |
| 6-Person Households | 7 (0.4%) | 0 (0.0%) |
| 7+ Person Households | 2 (0.1%) | 0 (0.0%) |
| Total | 1,123 (58.4%) | 801 (41.6%) |
Female Fertility in La Vale
Fertility by Age in La Vale
Average fertility rate in La Vale is 63.0 births per 1,000 women. Women in the age bracket of 20 to 34 years have the highest fertility rate with 116.0 births per 1,000 women. Women in the age bracket of 20 to 34 years acount for 100.0% of all women with births.
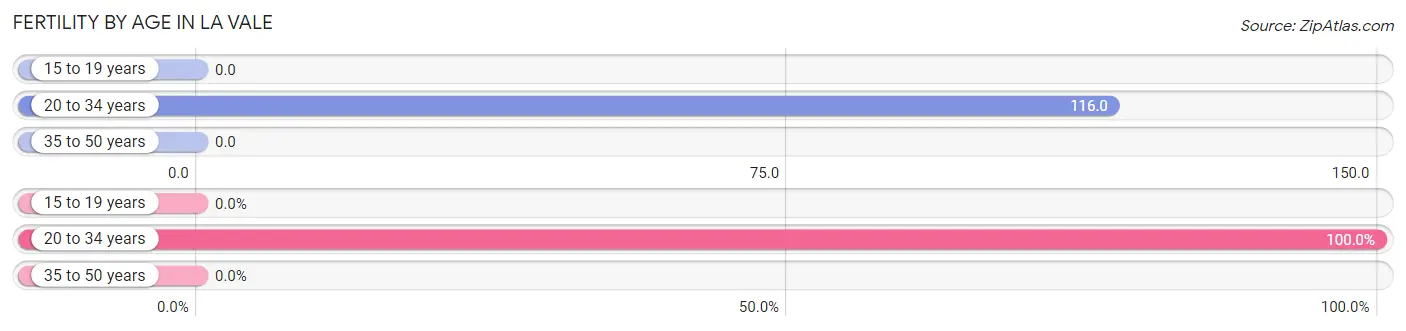
| Age Bracket | Women with Births | Births / 1,000 Women |
| 15 to 19 years | 0 (0.0%) | 0.0 |
| 20 to 34 years | 52 (100.0%) | 116.0 |
| 35 to 50 years | 0 (0.0%) | 0.0 |
| Total | 52 (100.0%) | 63.0 |
Fertility by Age by Marriage Status in La Vale
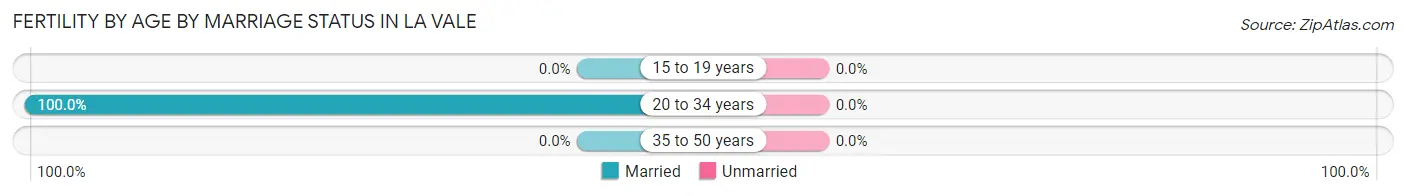
| Age Bracket | Married | Unmarried |
| 15 to 19 years | 0 (0.0%) | 0 (0.0%) |
| 20 to 34 years | 52 (100.0%) | 0 (0.0%) |
| 35 to 50 years | 0 (0.0%) | 0 (0.0%) |
| Total | 52 (100.0%) | 0 (0.0%) |
Fertility by Education in La Vale
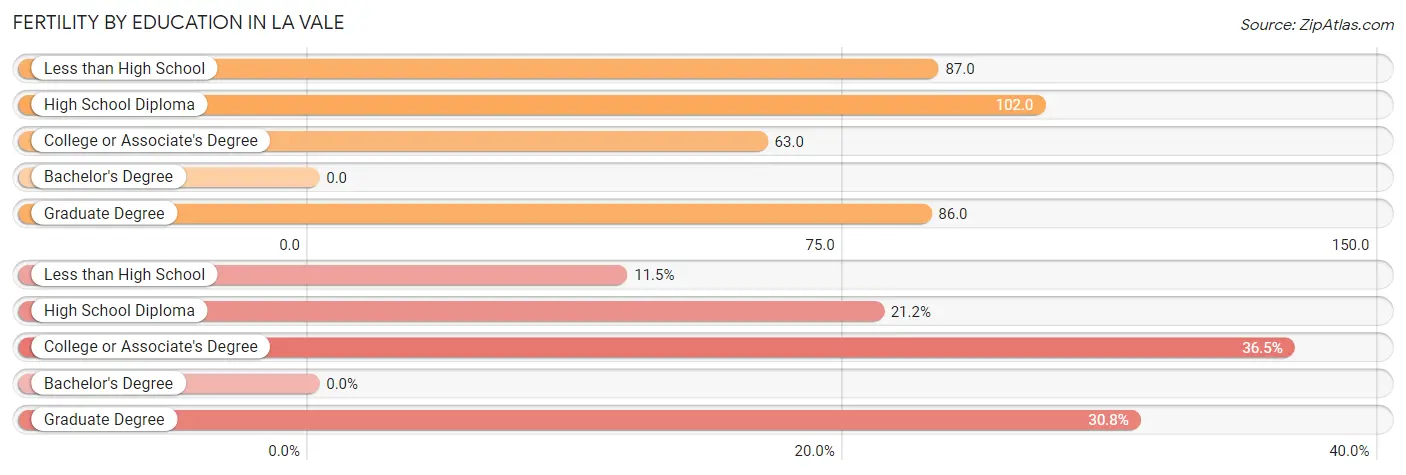
| Educational Attainment | Women with Births | Births / 1,000 Women |
| Less than High School | 6 (11.5%) | 87.0 |
| High School Diploma | 11 (21.1%) | 102.0 |
| College or Associate's Degree | 19 (36.5%) | 63.0 |
| Bachelor's Degree | 0 (0.0%) | 0.0 |
| Graduate Degree | 16 (30.8%) | 86.0 |
| Total | 52 (100.0%) | 63.0 |
Fertility by Education by Marriage Status in La Vale
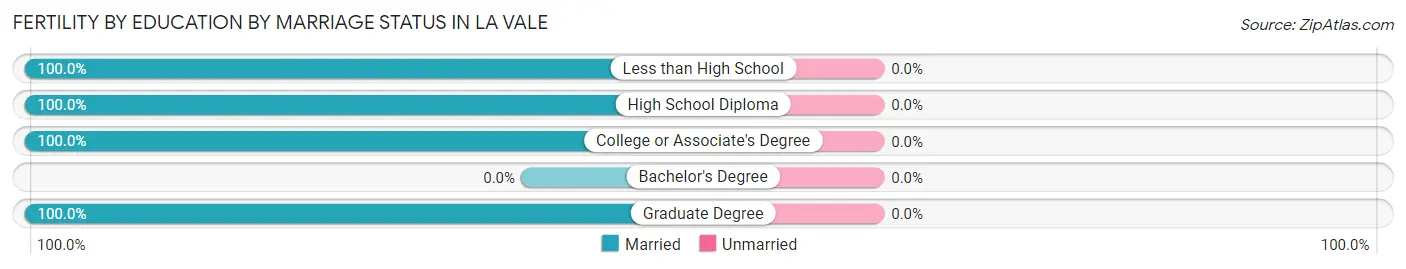
| Educational Attainment | Married | Unmarried |
| Less than High School | 6 (100.0%) | 0 (0.0%) |
| High School Diploma | 11 (100.0%) | 0 (0.0%) |
| College or Associate's Degree | 19 (100.0%) | 0 (0.0%) |
| Bachelor's Degree | 0 (0.0%) | 0 (0.0%) |
| Graduate Degree | 16 (100.0%) | 0 (0.0%) |
| Total | 52 (100.0%) | 0 (0.0%) |
Employment Characteristics in La Vale
Employment by Class of Employer in La Vale
Among the 2,207 employed individuals in La Vale, private company employees (1,231 | 55.8%), state government employees (208 | 9.4%), and not-for-profit organizations (206 | 9.3%) make up the most common classes of employment.
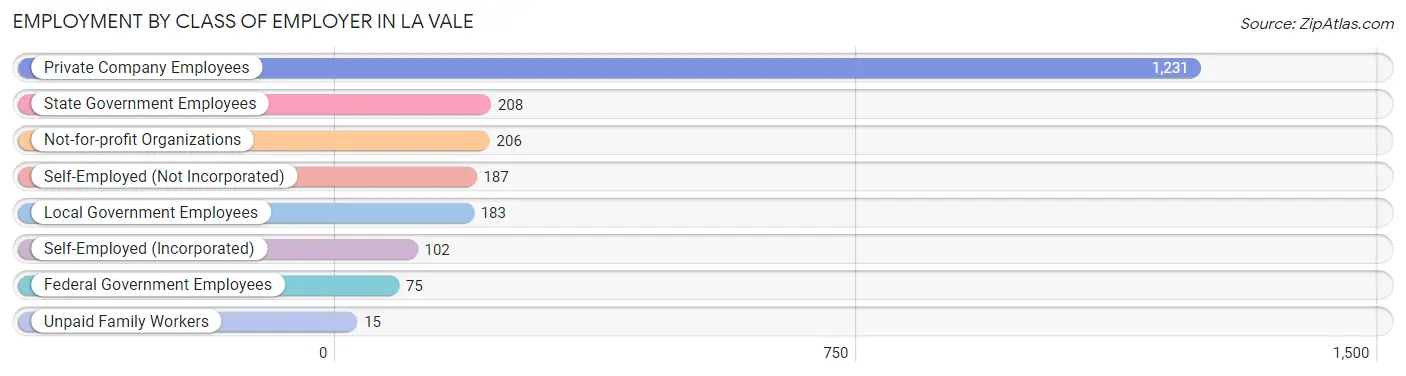
| Employer Class | # Employees | % Employees |
| Private Company Employees | 1,231 | 55.8% |
| Self-Employed (Incorporated) | 102 | 4.6% |
| Self-Employed (Not Incorporated) | 187 | 8.5% |
| Not-for-profit Organizations | 206 | 9.3% |
| Local Government Employees | 183 | 8.3% |
| State Government Employees | 208 | 9.4% |
| Federal Government Employees | 75 | 3.4% |
| Unpaid Family Workers | 15 | 0.7% |
| Total | 2,207 | 100.0% |
Employment Status by Age in La Vale
According to the labor force statistics for La Vale, out of the total population over 16 years of age (3,553), 65.0% or 2,309 individuals are in the labor force, with 2.7% or 62 of them unemployed. The age group with the highest labor force participation rate is 25 to 29 years, with 100.0% or 386 individuals in the labor force. Within the labor force, the 16 to 19 years age range has the highest percentage of unemployed individuals, with 24.3% or 18 of them being unemployed.
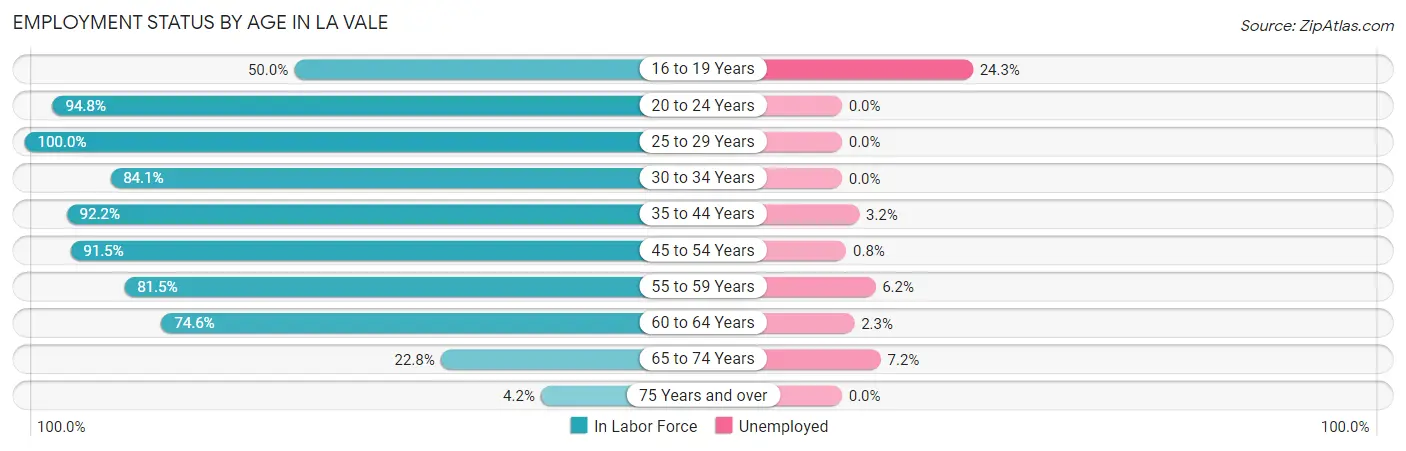
| Age Bracket | In Labor Force | Unemployed |
| 16 to 19 Years | 74 (50.0%) | 18 (24.3%) |
| 20 to 24 Years | 199 (94.8%) | 0 (0.0%) |
| 25 to 29 Years | 386 (100.0%) | 0 (0.0%) |
| 30 to 34 Years | 276 (84.1%) | 0 (0.0%) |
| 35 to 44 Years | 341 (92.2%) | 11 (3.2%) |
| 45 to 54 Years | 378 (91.5%) | 3 (0.8%) |
| 55 to 59 Years | 242 (81.5%) | 15 (6.2%) |
| 60 to 64 Years | 258 (74.6%) | 6 (2.3%) |
| 65 to 74 Years | 138 (22.8%) | 10 (7.2%) |
| 75 Years and over | 19 (4.2%) | 0 (0.0%) |
| Total | 2,309 (65.0%) | 62 (2.7%) |
Employment Status by Educational Attainment in La Vale
According to labor force statistics for La Vale, 87.9% of individuals (1,881) out of the total population between 25 and 64 years of age (2,140) are in the labor force, with 1.9% or 36 of them being unemployed. The group with the highest labor force participation rate are those with the educational attainment of college / associate degree, with 89.5% or 589 individuals in the labor force. Within the labor force, individuals with college / associate degree education have the highest percentage of unemployment, with 5.1% or 30 of them being unemployed.
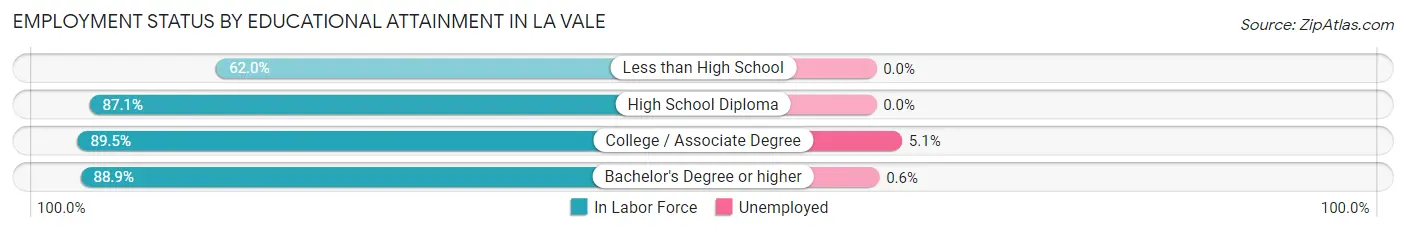
| Educational Attainment | In Labor Force | Unemployed |
| Less than High School | 44 (62.0%) | 0 (0.0%) |
| High School Diploma | 339 (87.1%) | 0 (0.0%) |
| College / Associate Degree | 589 (89.5%) | 34 (5.1%) |
| Bachelor's Degree or higher | 909 (88.9%) | 6 (0.6%) |
| Total | 1,881 (87.9%) | 41 (1.9%) |
Employment Occupations by Sex in La Vale
Management, Business, Science and Arts Occupations
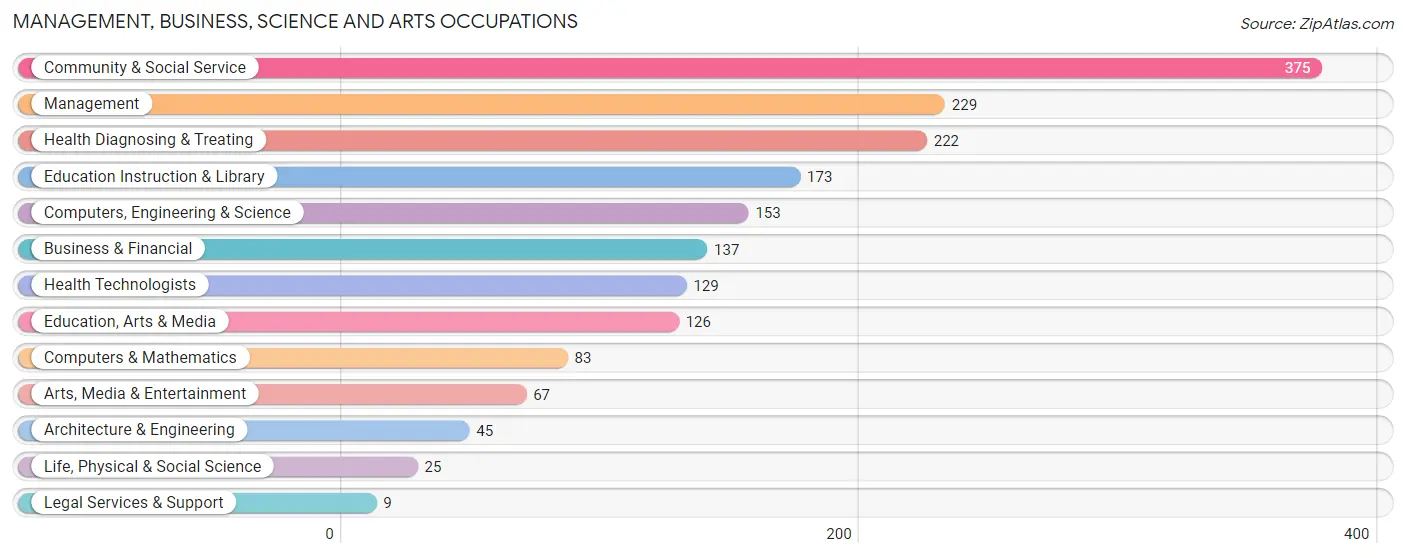
The most common Management, Business, Science and Arts occupations in La Vale are Community & Social Service (375 | 16.7%), Management (229 | 10.2%), Health Diagnosing & Treating (222 | 9.9%), Education Instruction & Library (173 | 7.7%), and Computers, Engineering & Science (153 | 6.8%).
Management, Business, Science and Arts Occupations by Sex
Within the Management, Business, Science and Arts occupations in La Vale, the most male-oriented occupations are Architecture & Engineering (100.0%), Legal Services & Support (100.0%), and Computers & Mathematics (94.0%), while the most female-oriented occupations are Health Diagnosing & Treating (75.7%), Health Technologists (72.9%), and Education, Arts & Media (68.2%).
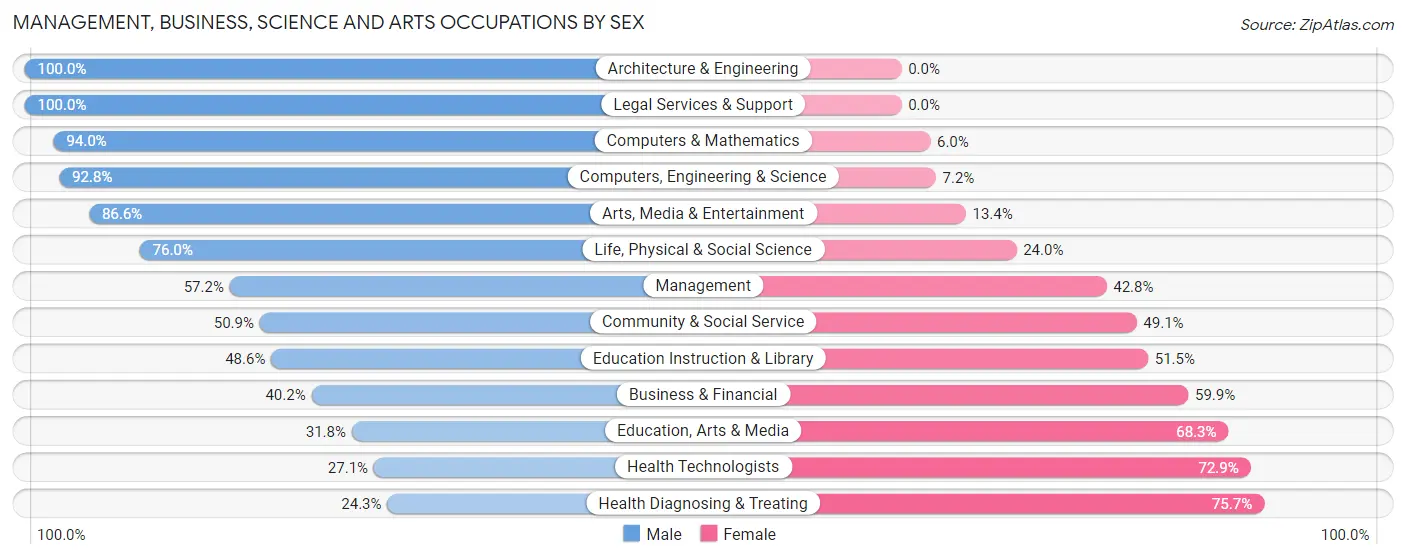
| Occupation | Male | Female |
| Management | 131 (57.2%) | 98 (42.8%) |
| Business & Financial | 55 (40.2%) | 82 (59.9%) |
| Computers, Engineering & Science | 142 (92.8%) | 11 (7.2%) |
| Computers & Mathematics | 78 (94.0%) | 5 (6.0%) |
| Architecture & Engineering | 45 (100.0%) | 0 (0.0%) |
| Life, Physical & Social Science | 19 (76.0%) | 6 (24.0%) |
| Community & Social Service | 191 (50.9%) | 184 (49.1%) |
| Education, Arts & Media | 40 (31.8%) | 86 (68.2%) |
| Legal Services & Support | 9 (100.0%) | 0 (0.0%) |
| Education Instruction & Library | 84 (48.5%) | 89 (51.4%) |
| Arts, Media & Entertainment | 58 (86.6%) | 9 (13.4%) |
| Health Diagnosing & Treating | 54 (24.3%) | 168 (75.7%) |
| Health Technologists | 35 (27.1%) | 94 (72.9%) |
| Total (Category) | 573 (51.3%) | 543 (48.7%) |
| Total (Overall) | 1,127 (50.1%) | 1,121 (49.9%) |
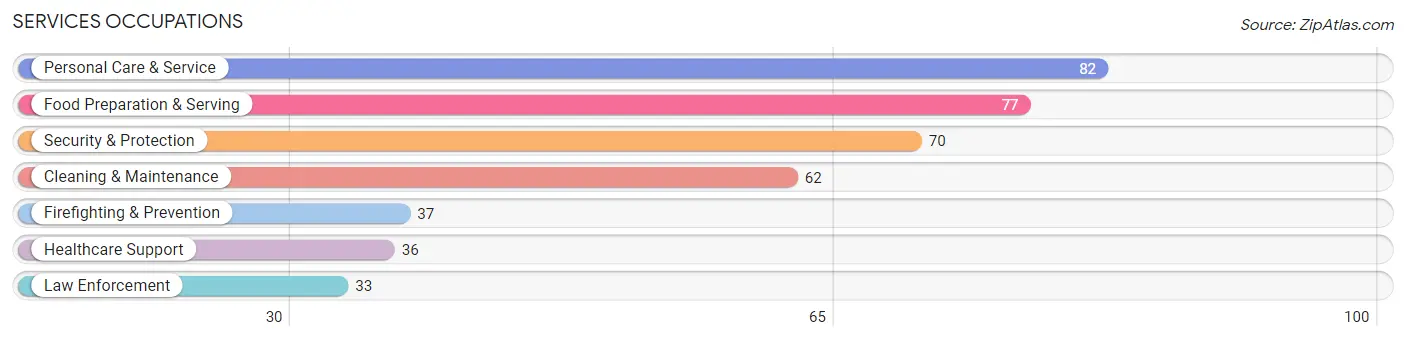
Services Occupations
The most common Services occupations in La Vale are Personal Care & Service (82 | 3.6%), Food Preparation & Serving (77 | 3.4%), Security & Protection (70 | 3.1%), Cleaning & Maintenance (62 | 2.8%), and Firefighting & Prevention (37 | 1.7%).
Services Occupations by Sex
Within the Services occupations in La Vale, the most male-oriented occupations are Security & Protection (100.0%), Firefighting & Prevention (100.0%), and Law Enforcement (100.0%), while the most female-oriented occupations are Personal Care & Service (92.7%), Cleaning & Maintenance (64.5%), and Healthcare Support (61.1%).
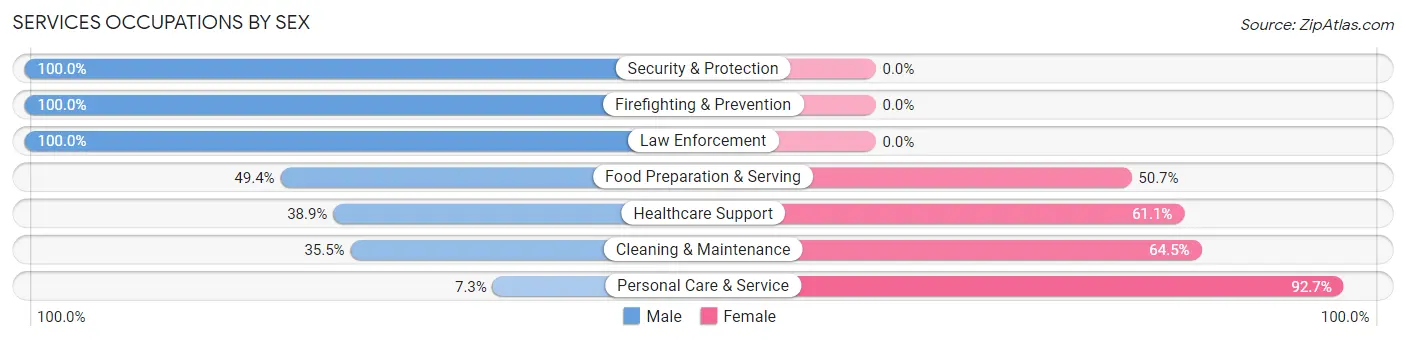
| Occupation | Male | Female |
| Healthcare Support | 14 (38.9%) | 22 (61.1%) |
| Security & Protection | 70 (100.0%) | 0 (0.0%) |
| Firefighting & Prevention | 37 (100.0%) | 0 (0.0%) |
| Law Enforcement | 33 (100.0%) | 0 (0.0%) |
| Food Preparation & Serving | 38 (49.3%) | 39 (50.6%) |
| Cleaning & Maintenance | 22 (35.5%) | 40 (64.5%) |
| Personal Care & Service | 6 (7.3%) | 76 (92.7%) |
| Total (Category) | 150 (45.9%) | 177 (54.1%) |
| Total (Overall) | 1,127 (50.1%) | 1,121 (49.9%) |
Sales and Office Occupations
The most common Sales and Office occupations in La Vale are Office & Administration (295 | 13.1%), and Sales & Related (118 | 5.2%).
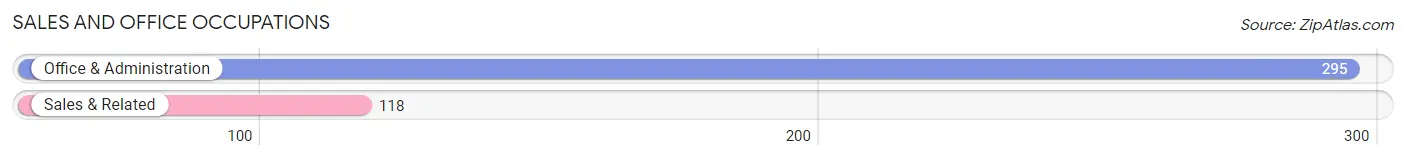
Sales and Office Occupations by Sex
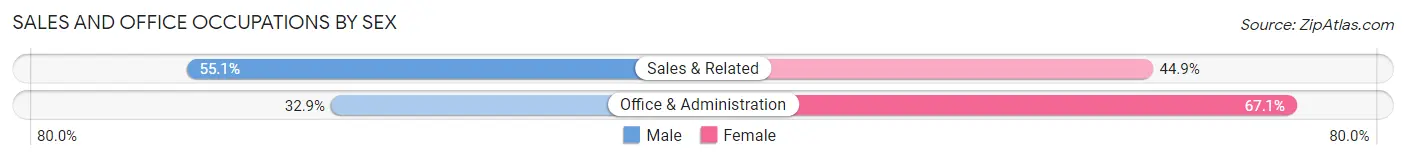
| Occupation | Male | Female |
| Sales & Related | 65 (55.1%) | 53 (44.9%) |
| Office & Administration | 97 (32.9%) | 198 (67.1%) |
| Total (Category) | 162 (39.2%) | 251 (60.8%) |
| Total (Overall) | 1,127 (50.1%) | 1,121 (49.9%) |
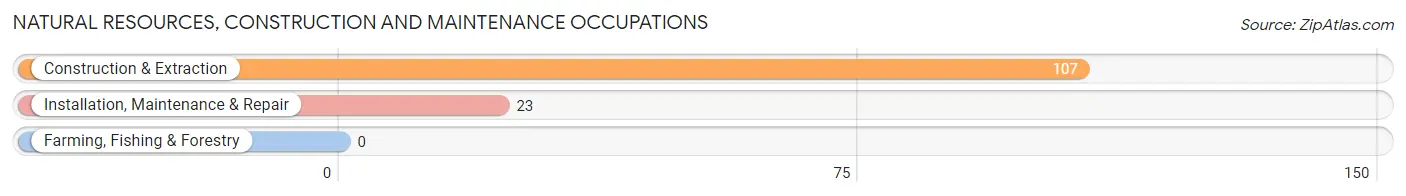
Natural Resources, Construction and Maintenance Occupations
The most common Natural Resources, Construction and Maintenance occupations in La Vale are Construction & Extraction (107 | 4.8%), and Installation, Maintenance & Repair (23 | 1.0%).
Natural Resources, Construction and Maintenance Occupations by Sex
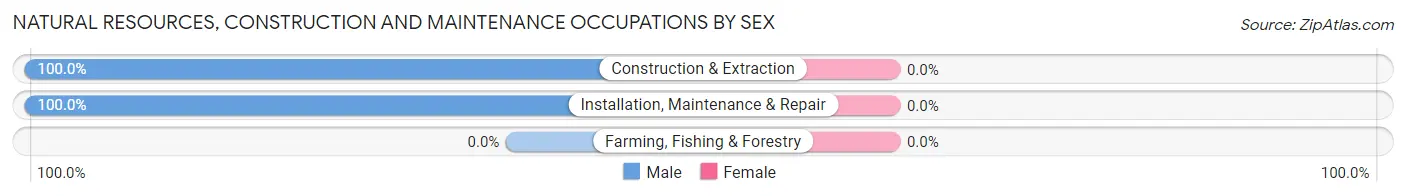
| Occupation | Male | Female |
| Farming, Fishing & Forestry | 0 (0.0%) | 0 (0.0%) |
| Construction & Extraction | 107 (100.0%) | 0 (0.0%) |
| Installation, Maintenance & Repair | 23 (100.0%) | 0 (0.0%) |
| Total (Category) | 130 (100.0%) | 0 (0.0%) |
| Total (Overall) | 1,127 (50.1%) | 1,121 (49.9%) |
Production, Transportation and Moving Occupations
The most common Production, Transportation and Moving occupations in La Vale are Production (114 | 5.1%), Material Moving (96 | 4.3%), and Transportation (52 | 2.3%).
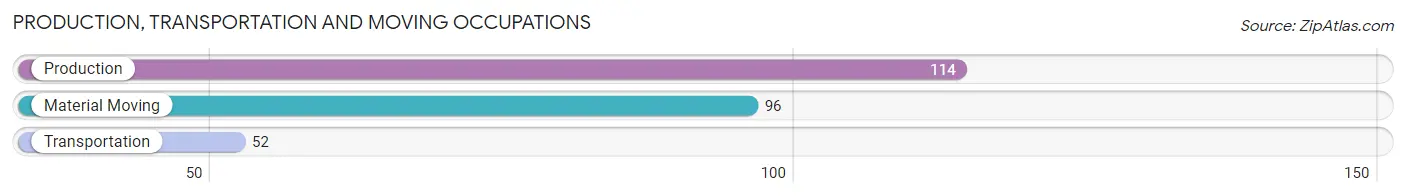
Production, Transportation and Moving Occupations by Sex
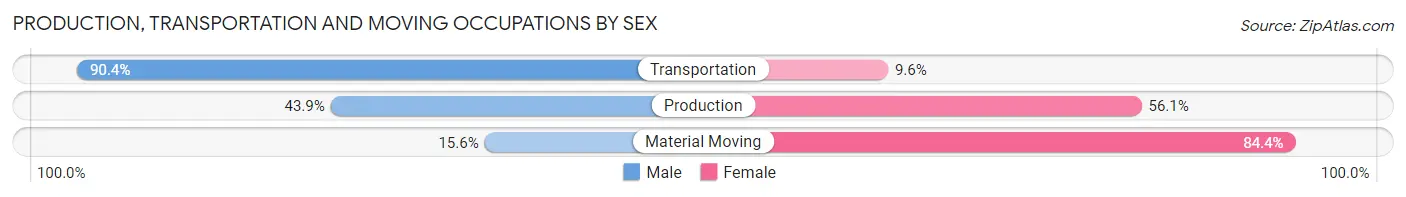
| Occupation | Male | Female |
| Production | 50 (43.9%) | 64 (56.1%) |
| Transportation | 47 (90.4%) | 5 (9.6%) |
| Material Moving | 15 (15.6%) | 81 (84.4%) |
| Total (Category) | 112 (42.7%) | 150 (57.3%) |
| Total (Overall) | 1,127 (50.1%) | 1,121 (49.9%) |
Employment Industries by Sex in La Vale
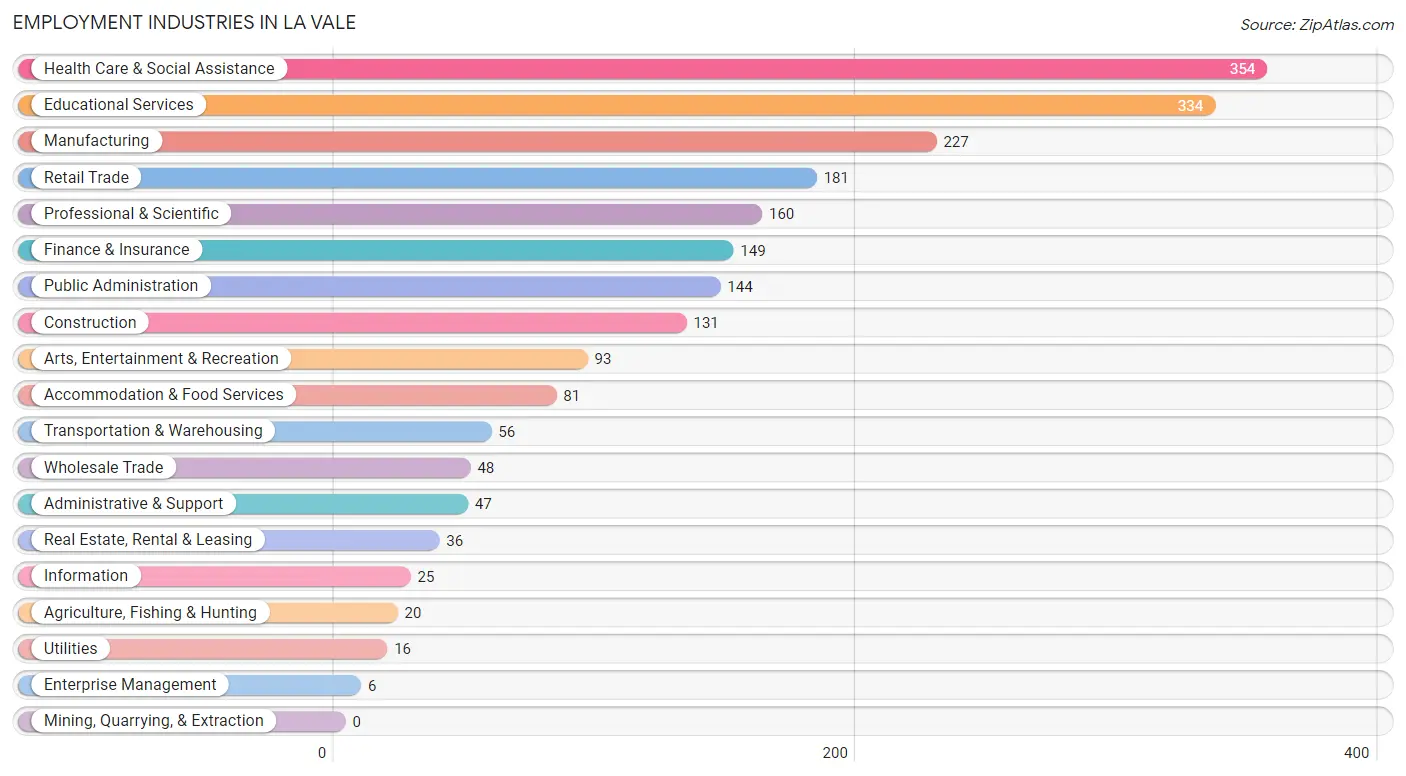
Employment Industries in La Vale
The major employment industries in La Vale include Health Care & Social Assistance (354 | 15.8%), Educational Services (334 | 14.9%), Manufacturing (227 | 10.1%), Retail Trade (181 | 8.1%), and Professional & Scientific (160 | 7.1%).
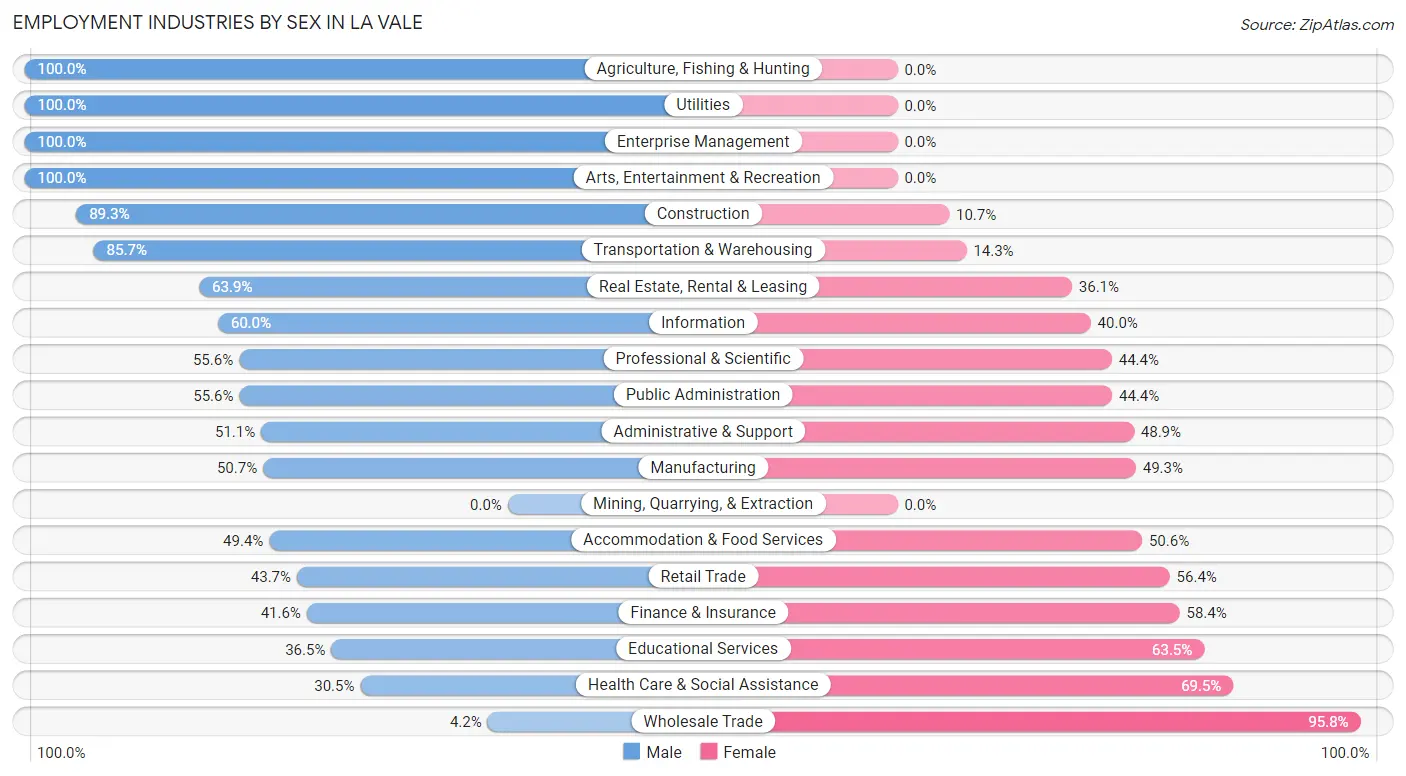
Employment Industries by Sex in La Vale
The La Vale industries that see more men than women are Agriculture, Fishing & Hunting (100.0%), Utilities (100.0%), and Enterprise Management (100.0%), whereas the industries that tend to have a higher number of women are Wholesale Trade (95.8%), Health Care & Social Assistance (69.5%), and Educational Services (63.5%).
| Industry | Male | Female |
| Agriculture, Fishing & Hunting | 20 (100.0%) | 0 (0.0%) |
| Mining, Quarrying, & Extraction | 0 (0.0%) | 0 (0.0%) |
| Construction | 117 (89.3%) | 14 (10.7%) |
| Manufacturing | 115 (50.7%) | 112 (49.3%) |
| Wholesale Trade | 2 (4.2%) | 46 (95.8%) |
| Retail Trade | 79 (43.6%) | 102 (56.4%) |
| Transportation & Warehousing | 48 (85.7%) | 8 (14.3%) |
| Utilities | 16 (100.0%) | 0 (0.0%) |
| Information | 15 (60.0%) | 10 (40.0%) |
| Finance & Insurance | 62 (41.6%) | 87 (58.4%) |
| Real Estate, Rental & Leasing | 23 (63.9%) | 13 (36.1%) |
| Professional & Scientific | 89 (55.6%) | 71 (44.4%) |
| Enterprise Management | 6 (100.0%) | 0 (0.0%) |
| Administrative & Support | 24 (51.1%) | 23 (48.9%) |
| Educational Services | 122 (36.5%) | 212 (63.5%) |
| Health Care & Social Assistance | 108 (30.5%) | 246 (69.5%) |
| Arts, Entertainment & Recreation | 93 (100.0%) | 0 (0.0%) |
| Accommodation & Food Services | 40 (49.4%) | 41 (50.6%) |
| Public Administration | 80 (55.6%) | 64 (44.4%) |
| Total | 1,127 (50.1%) | 1,121 (49.9%) |
Education in La Vale
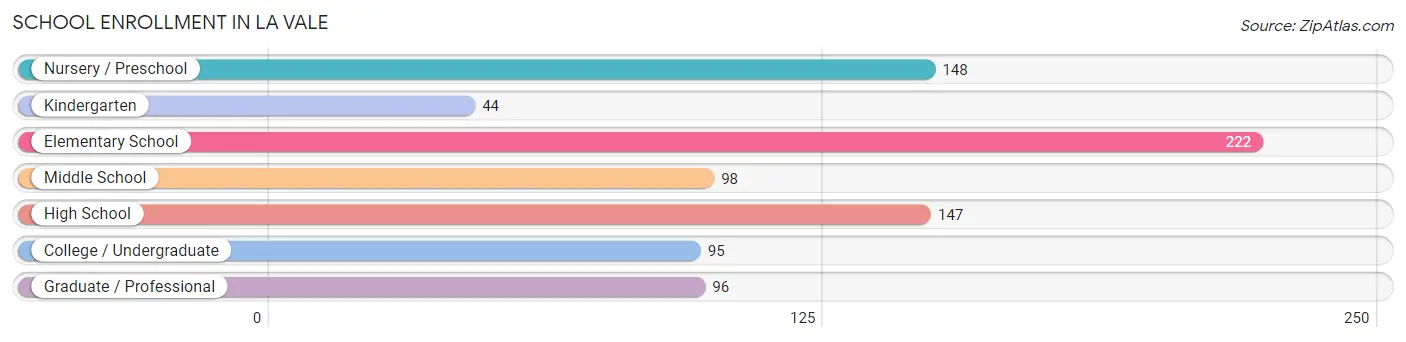
School Enrollment in La Vale
The most common levels of schooling among the 850 students in La Vale are elementary school (222 | 26.1%), nursery / preschool (148 | 17.4%), and high school (147 | 17.3%).
| School Level | # Students | % Students |
| Nursery / Preschool | 148 | 17.4% |
| Kindergarten | 44 | 5.2% |
| Elementary School | 222 | 26.1% |
| Middle School | 98 | 11.5% |
| High School | 147 | 17.3% |
| College / Undergraduate | 95 | 11.2% |
| Graduate / Professional | 96 | 11.3% |
| Total | 850 | 100.0% |
School Enrollment by Age by Funding Source in La Vale
Out of a total of 850 students who are enrolled in schools in La Vale, 233 (27.4%) attend a private institution, while the remaining 617 (72.6%) are enrolled in public schools. The age group of 3 to 4 year olds has the highest likelihood of being enrolled in private schools, with 104 (80.6% in the age bracket) enrolled. Conversely, the age group of 20 to 24 year olds has the lowest likelihood of being enrolled in a private school, with 12 (100.0% in the age bracket) attending a public institution.
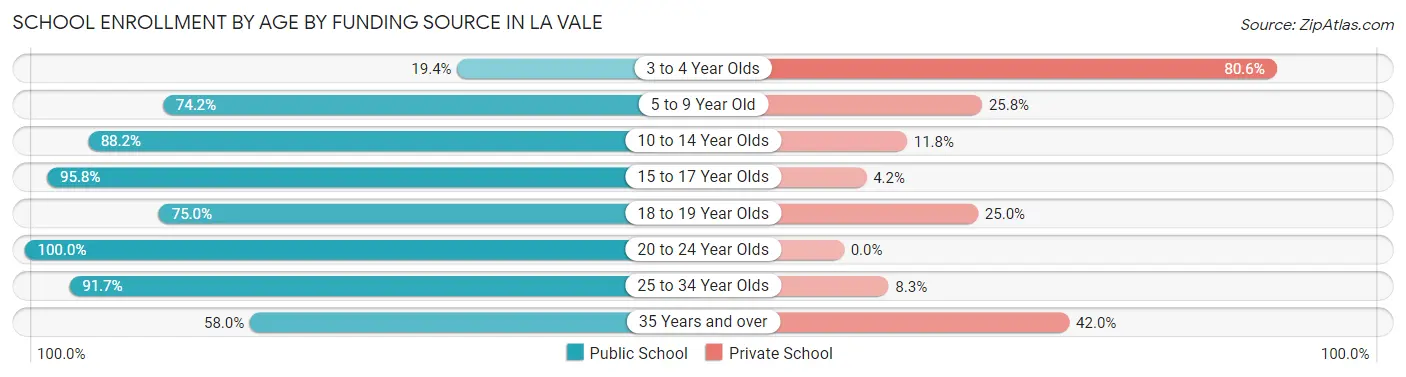
| Age Bracket | Public School | Private School |
| 3 to 4 Year Olds | 25 (19.4%) | 104 (80.6%) |
| 5 to 9 Year Old | 196 (74.2%) | 68 (25.8%) |
| 10 to 14 Year Olds | 120 (88.2%) | 16 (11.8%) |
| 15 to 17 Year Olds | 114 (95.8%) | 5 (4.2%) |
| 18 to 19 Year Olds | 33 (75.0%) | 11 (25.0%) |
| 20 to 24 Year Olds | 12 (100.0%) | 0 (0.0%) |
| 25 to 34 Year Olds | 88 (91.7%) | 8 (8.3%) |
| 35 Years and over | 29 (58.0%) | 21 (42.0%) |
| Total | 617 (72.6%) | 233 (27.4%) |
Educational Attainment by Field of Study in La Vale
Education (273 | 19.9%), business (213 | 15.5%), liberal arts & history (149 | 10.9%), science & technology (128 | 9.3%), and arts & humanities (112 | 8.2%) are the most common fields of study among 1,370 individuals in La Vale who have obtained a bachelor's degree or higher.
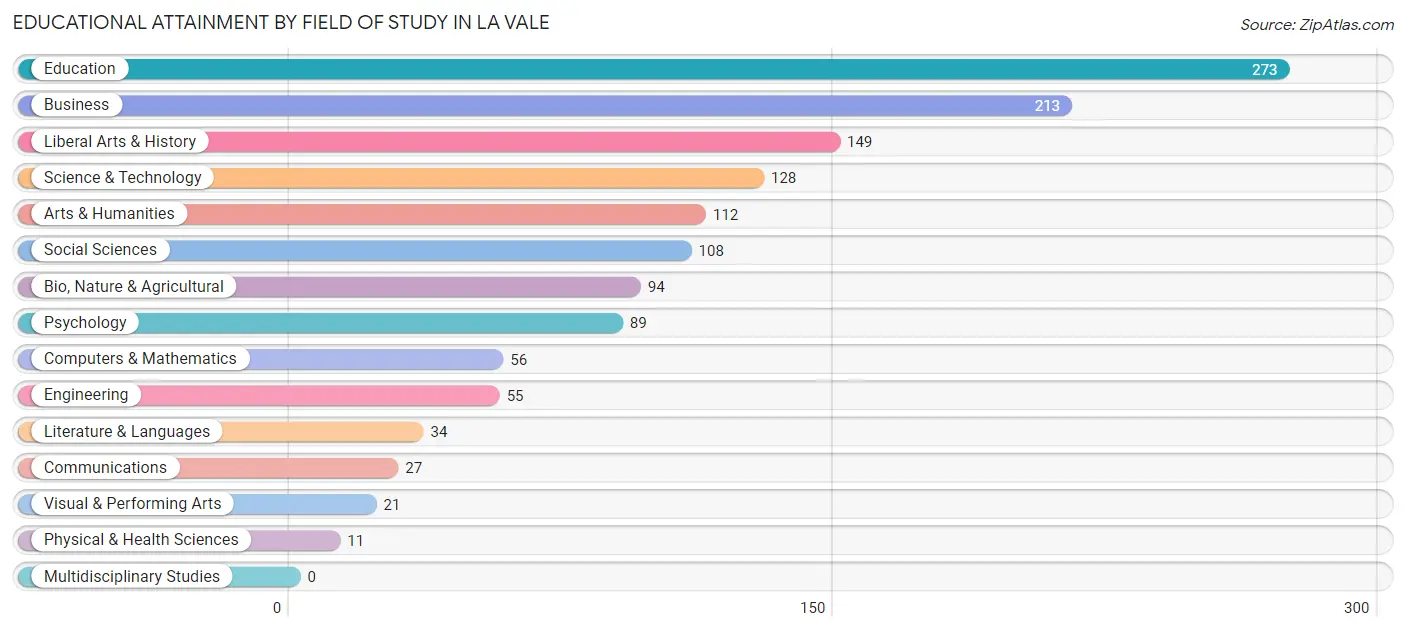
| Field of Study | # Graduates | % Graduates |
| Computers & Mathematics | 56 | 4.1% |
| Bio, Nature & Agricultural | 94 | 6.9% |
| Physical & Health Sciences | 11 | 0.8% |
| Psychology | 89 | 6.5% |
| Social Sciences | 108 | 7.9% |
| Engineering | 55 | 4.0% |
| Multidisciplinary Studies | 0 | 0.0% |
| Science & Technology | 128 | 9.3% |
| Business | 213 | 15.5% |
| Education | 273 | 19.9% |
| Literature & Languages | 34 | 2.5% |
| Liberal Arts & History | 149 | 10.9% |
| Visual & Performing Arts | 21 | 1.5% |
| Communications | 27 | 2.0% |
| Arts & Humanities | 112 | 8.2% |
| Total | 1,370 | 100.0% |
Transportation & Commute in La Vale
Vehicle Availability by Sex in La Vale
The most prevalent vehicle ownership categories in La Vale are males with 2 vehicles (535, accounting for 48.2%) and females with 2 vehicles (513, making up 48.7%).
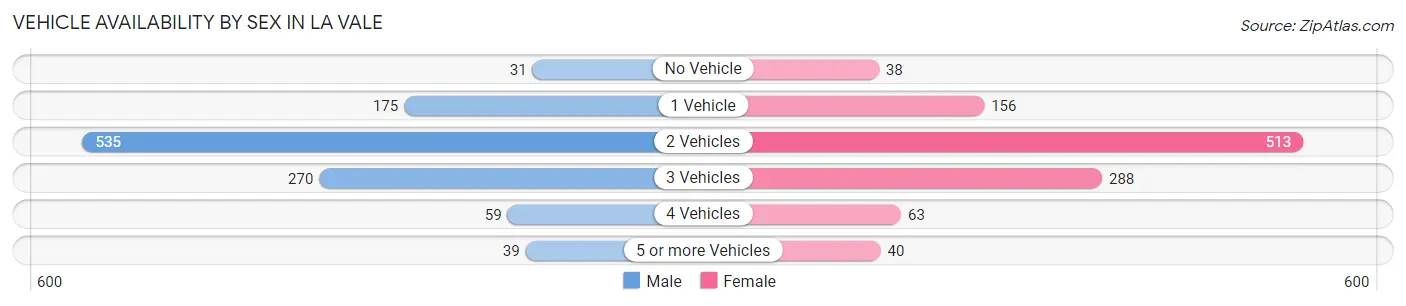
| Vehicles Available | Male | Female |
| No Vehicle | 31 (2.8%) | 38 (3.5%) |
| 1 Vehicle | 175 (15.8%) | 156 (14.2%) |
| 2 Vehicles | 535 (48.2%) | 513 (46.7%) |
| 3 Vehicles | 270 (24.3%) | 288 (26.2%) |
| 4 Vehicles | 59 (5.3%) | 63 (5.7%) |
| 5 or more Vehicles | 39 (3.5%) | 40 (3.6%) |
| Total | 1,109 (100.0%) | 1,098 (100.0%) |
Commute Time in La Vale
The most frequently occuring commute durations in La Vale are 15 to 19 minutes (664 commuters, 34.3%), 10 to 14 minutes (384 commuters, 19.8%), and 20 to 24 minutes (335 commuters, 17.3%).
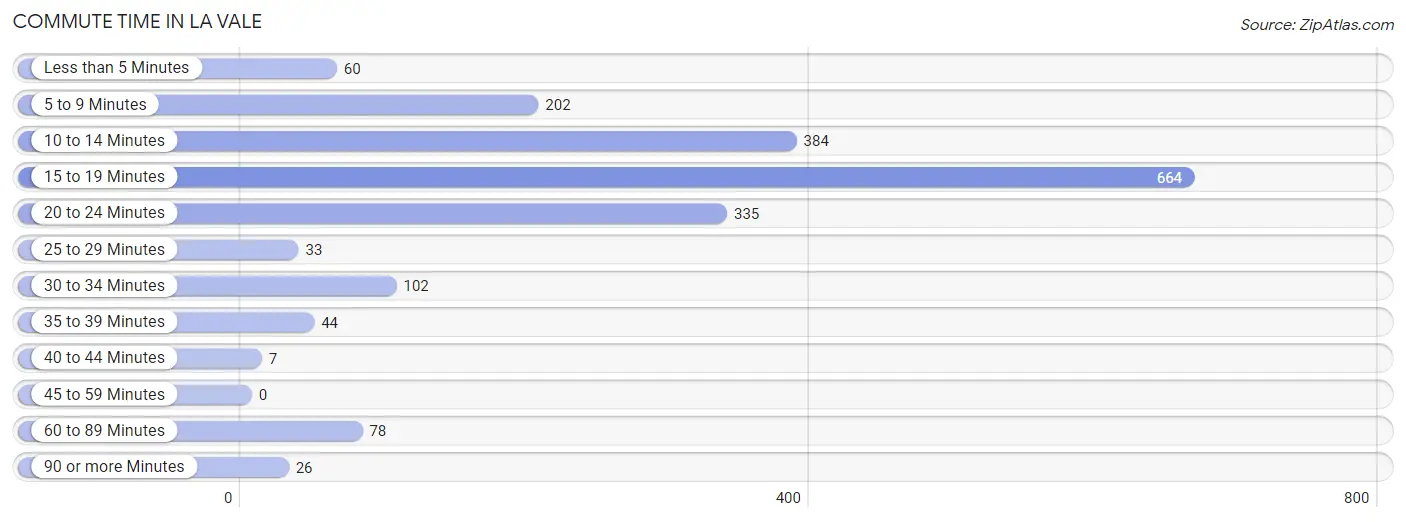
| Commute Time | # Commuters | % Commuters |
| Less than 5 Minutes | 60 | 3.1% |
| 5 to 9 Minutes | 202 | 10.4% |
| 10 to 14 Minutes | 384 | 19.8% |
| 15 to 19 Minutes | 664 | 34.3% |
| 20 to 24 Minutes | 335 | 17.3% |
| 25 to 29 Minutes | 33 | 1.7% |
| 30 to 34 Minutes | 102 | 5.3% |
| 35 to 39 Minutes | 44 | 2.3% |
| 40 to 44 Minutes | 7 | 0.4% |
| 45 to 59 Minutes | 0 | 0.0% |
| 60 to 89 Minutes | 78 | 4.0% |
| 90 or more Minutes | 26 | 1.3% |
Commute Time by Sex in La Vale
The most common commute times in La Vale are 15 to 19 minutes (321 commuters, 34.1%) for males and 15 to 19 minutes (343 commuters, 34.5%) for females.
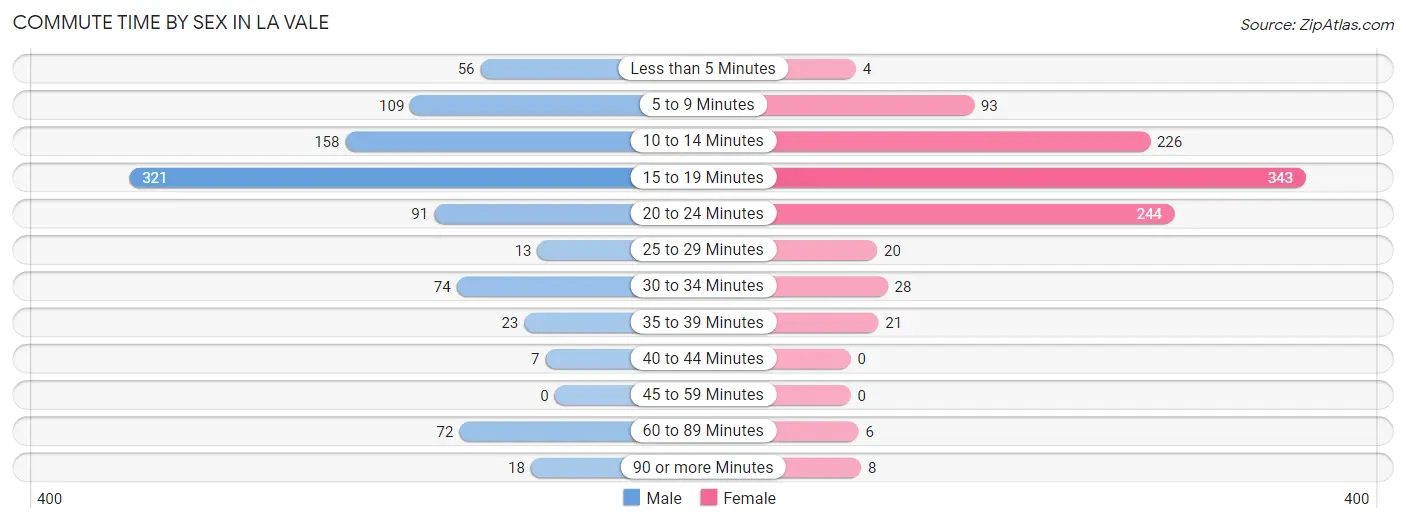
| Commute Time | Male | Female |
| Less than 5 Minutes | 56 (5.9%) | 4 (0.4%) |
| 5 to 9 Minutes | 109 (11.6%) | 93 (9.4%) |
| 10 to 14 Minutes | 158 (16.8%) | 226 (22.8%) |
| 15 to 19 Minutes | 321 (34.1%) | 343 (34.5%) |
| 20 to 24 Minutes | 91 (9.7%) | 244 (24.6%) |
| 25 to 29 Minutes | 13 (1.4%) | 20 (2.0%) |
| 30 to 34 Minutes | 74 (7.9%) | 28 (2.8%) |
| 35 to 39 Minutes | 23 (2.4%) | 21 (2.1%) |
| 40 to 44 Minutes | 7 (0.7%) | 0 (0.0%) |
| 45 to 59 Minutes | 0 (0.0%) | 0 (0.0%) |
| 60 to 89 Minutes | 72 (7.6%) | 6 (0.6%) |
| 90 or more Minutes | 18 (1.9%) | 8 (0.8%) |
Time of Departure to Work by Sex in La Vale
The most frequent times of departure to work in La Vale are 7:30 AM to 7:59 AM (157, 16.7%) for males and 7:30 AM to 7:59 AM (270, 27.2%) for females.
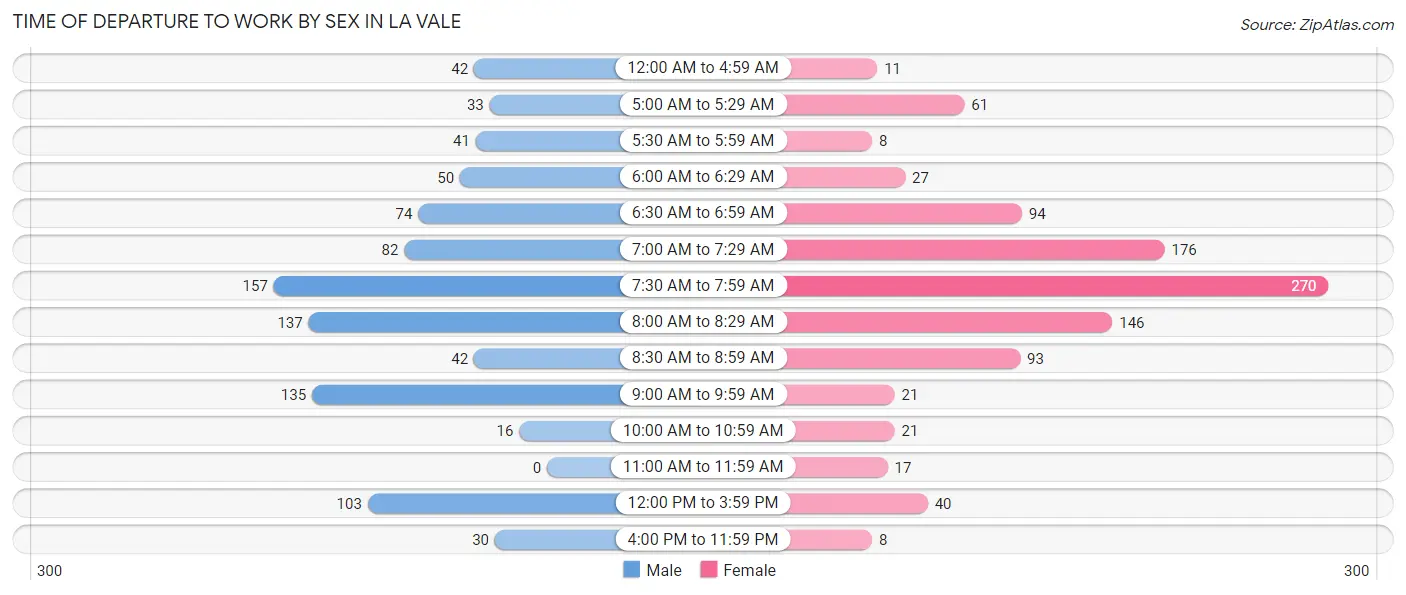
| Time of Departure | Male | Female |
| 12:00 AM to 4:59 AM | 42 (4.5%) | 11 (1.1%) |
| 5:00 AM to 5:29 AM | 33 (3.5%) | 61 (6.1%) |
| 5:30 AM to 5:59 AM | 41 (4.3%) | 8 (0.8%) |
| 6:00 AM to 6:29 AM | 50 (5.3%) | 27 (2.7%) |
| 6:30 AM to 6:59 AM | 74 (7.9%) | 94 (9.5%) |
| 7:00 AM to 7:29 AM | 82 (8.7%) | 176 (17.7%) |
| 7:30 AM to 7:59 AM | 157 (16.7%) | 270 (27.2%) |
| 8:00 AM to 8:29 AM | 137 (14.5%) | 146 (14.7%) |
| 8:30 AM to 8:59 AM | 42 (4.5%) | 93 (9.4%) |
| 9:00 AM to 9:59 AM | 135 (14.3%) | 21 (2.1%) |
| 10:00 AM to 10:59 AM | 16 (1.7%) | 21 (2.1%) |
| 11:00 AM to 11:59 AM | 0 (0.0%) | 17 (1.7%) |
| 12:00 PM to 3:59 PM | 103 (10.9%) | 40 (4.0%) |
| 4:00 PM to 11:59 PM | 30 (3.2%) | 8 (0.8%) |
| Total | 942 (100.0%) | 993 (100.0%) |
Housing Occupancy in La Vale
Occupancy by Ownership in La Vale
Of the total 1,924 dwellings in La Vale, owner-occupied units account for 1,628 (84.6%), while renter-occupied units make up 296 (15.4%).
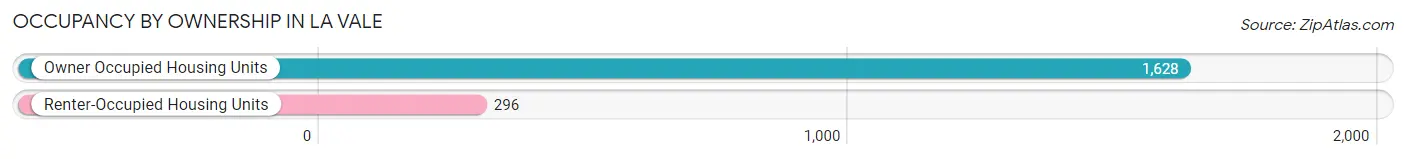
| Occupancy | # Housing Units | % Housing Units |
| Owner Occupied Housing Units | 1,628 | 84.6% |
| Renter-Occupied Housing Units | 296 | 15.4% |
| Total Occupied Housing Units | 1,924 | 100.0% |
Occupancy by Household Size in La Vale
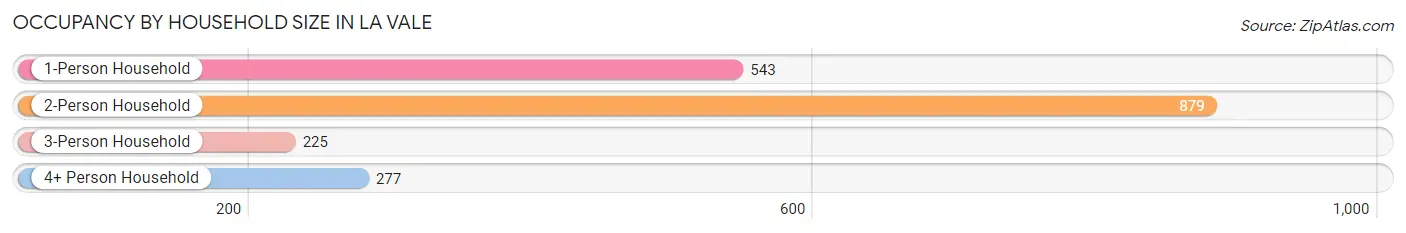
| Household Size | # Housing Units | % Housing Units |
| 1-Person Household | 543 | 28.2% |
| 2-Person Household | 879 | 45.7% |
| 3-Person Household | 225 | 11.7% |
| 4+ Person Household | 277 | 14.4% |
| Total Housing Units | 1,924 | 100.0% |
Occupancy by Ownership by Household Size in La Vale
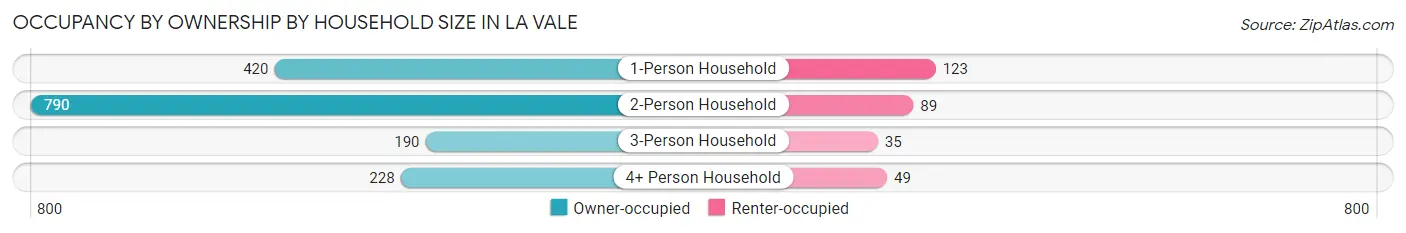
| Household Size | Owner-occupied | Renter-occupied |
| 1-Person Household | 420 (77.3%) | 123 (22.7%) |
| 2-Person Household | 790 (89.9%) | 89 (10.1%) |
| 3-Person Household | 190 (84.4%) | 35 (15.6%) |
| 4+ Person Household | 228 (82.3%) | 49 (17.7%) |
| Total Housing Units | 1,628 (84.6%) | 296 (15.4%) |
Occupancy by Educational Attainment in La Vale
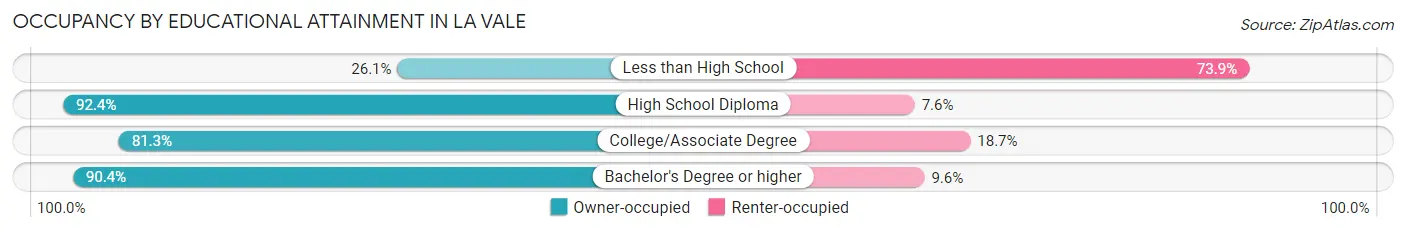
| Household Size | Owner-occupied | Renter-occupied |
| Less than High School | 24 (26.1%) | 68 (73.9%) |
| High School Diploma | 399 (92.4%) | 33 (7.6%) |
| College/Associate Degree | 544 (81.3%) | 125 (18.7%) |
| Bachelor's Degree or higher | 661 (90.4%) | 70 (9.6%) |
Occupancy by Age of Householder in La Vale
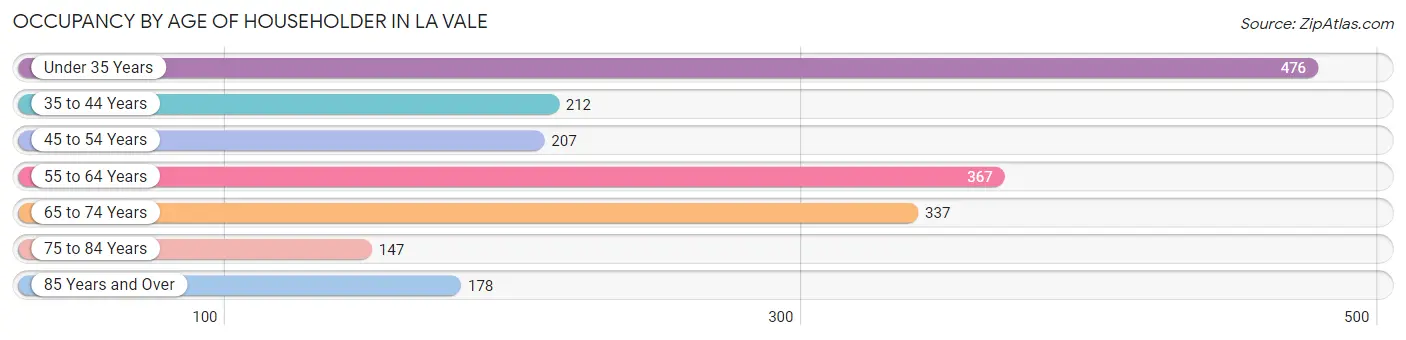
| Age Bracket | # Households | % Households |
| Under 35 Years | 476 | 24.7% |
| 35 to 44 Years | 212 | 11.0% |
| 45 to 54 Years | 207 | 10.8% |
| 55 to 64 Years | 367 | 19.1% |
| 65 to 74 Years | 337 | 17.5% |
| 75 to 84 Years | 147 | 7.6% |
| 85 Years and Over | 178 | 9.2% |
| Total | 1,924 | 100.0% |
Housing Finances in La Vale
Median Income by Occupancy in La Vale
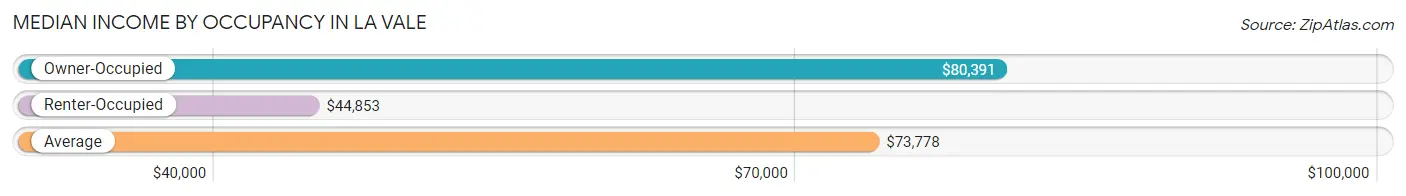
| Occupancy Type | # Households | Median Income |
| Owner-Occupied | 1,628 (84.6%) | $80,391 |
| Renter-Occupied | 296 (15.4%) | $44,853 |
| Average | 1,924 (100.0%) | $73,778 |
Occupancy by Householder Income Bracket in La Vale
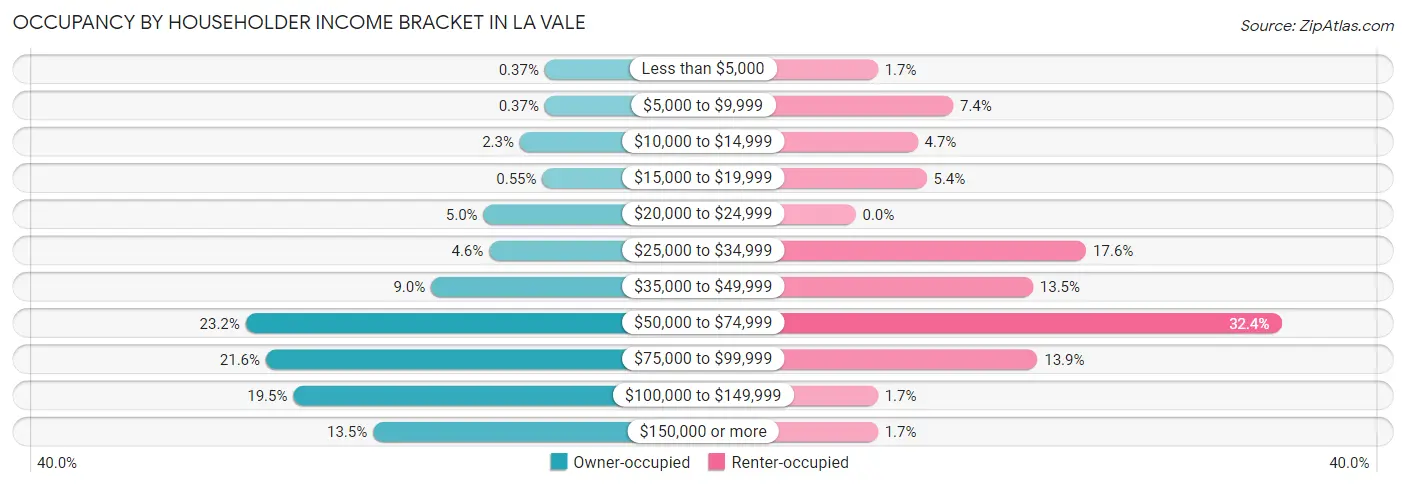
| Income Bracket | Owner-occupied | Renter-occupied |
| Less than $5,000 | 6 (0.4%) | 5 (1.7%) |
| $5,000 to $9,999 | 6 (0.4%) | 22 (7.4%) |
| $10,000 to $14,999 | 37 (2.3%) | 14 (4.7%) |
| $15,000 to $19,999 | 9 (0.5%) | 16 (5.4%) |
| $20,000 to $24,999 | 82 (5.0%) | 0 (0.0%) |
| $25,000 to $34,999 | 75 (4.6%) | 52 (17.6%) |
| $35,000 to $49,999 | 147 (9.0%) | 40 (13.5%) |
| $50,000 to $74,999 | 377 (23.2%) | 96 (32.4%) |
| $75,000 to $99,999 | 352 (21.6%) | 41 (13.9%) |
| $100,000 to $149,999 | 318 (19.5%) | 5 (1.7%) |
| $150,000 or more | 219 (13.5%) | 5 (1.7%) |
| Total | 1,628 (100.0%) | 296 (100.0%) |
Monthly Housing Cost Tiers in La Vale
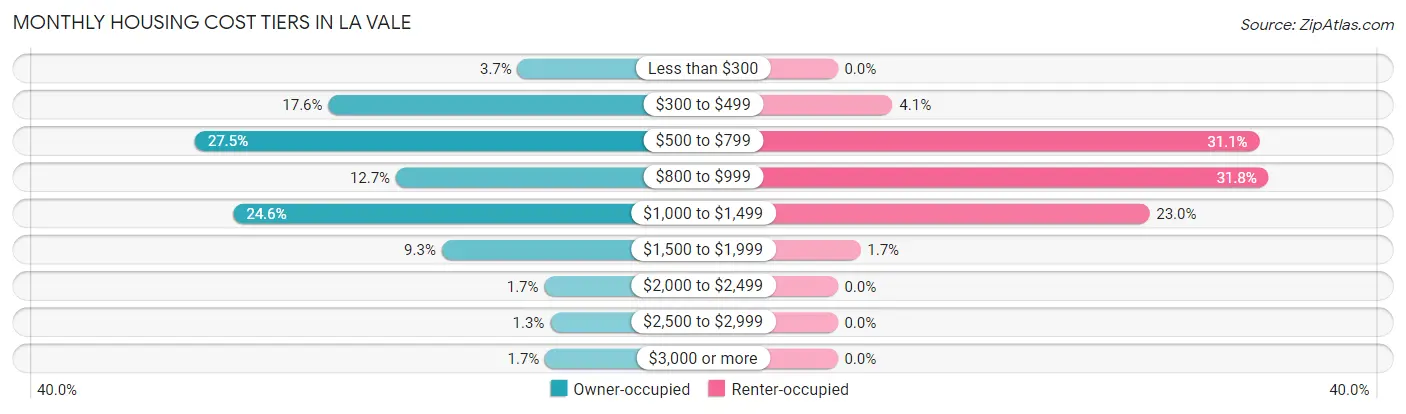
| Monthly Cost | Owner-occupied | Renter-occupied |
| Less than $300 | 60 (3.7%) | 0 (0.0%) |
| $300 to $499 | 287 (17.6%) | 12 (4.1%) |
| $500 to $799 | 447 (27.5%) | 92 (31.1%) |
| $800 to $999 | 206 (12.7%) | 94 (31.8%) |
| $1,000 to $1,499 | 401 (24.6%) | 68 (23.0%) |
| $1,500 to $1,999 | 151 (9.3%) | 5 (1.7%) |
| $2,000 to $2,499 | 28 (1.7%) | 0 (0.0%) |
| $2,500 to $2,999 | 21 (1.3%) | 0 (0.0%) |
| $3,000 or more | 27 (1.7%) | 0 (0.0%) |
| Total | 1,628 (100.0%) | 296 (100.0%) |
Physical Housing Characteristics in La Vale
Housing Structures in La Vale
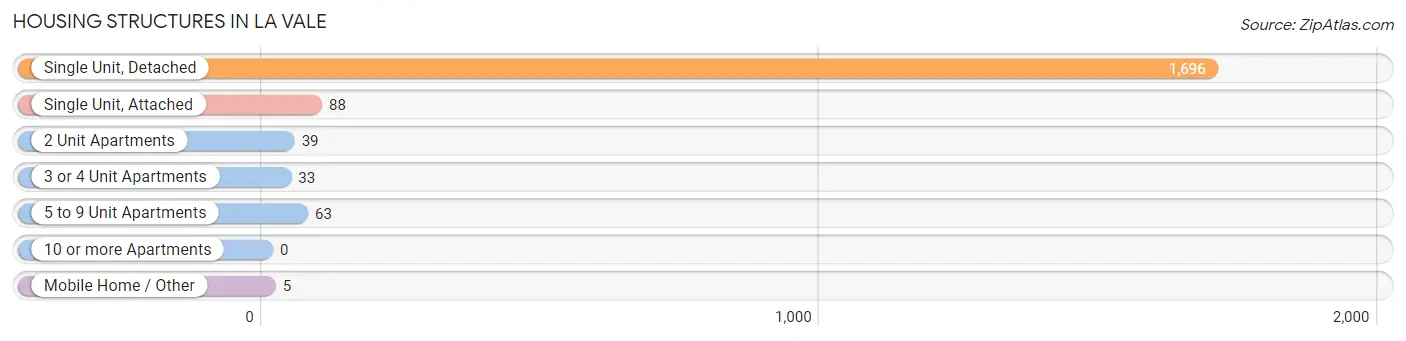
| Structure Type | # Housing Units | % Housing Units |
| Single Unit, Detached | 1,696 | 88.1% |
| Single Unit, Attached | 88 | 4.6% |
| 2 Unit Apartments | 39 | 2.0% |
| 3 or 4 Unit Apartments | 33 | 1.7% |
| 5 to 9 Unit Apartments | 63 | 3.3% |
| 10 or more Apartments | 0 | 0.0% |
| Mobile Home / Other | 5 | 0.3% |
| Total | 1,924 | 100.0% |
Housing Structures by Occupancy in La Vale
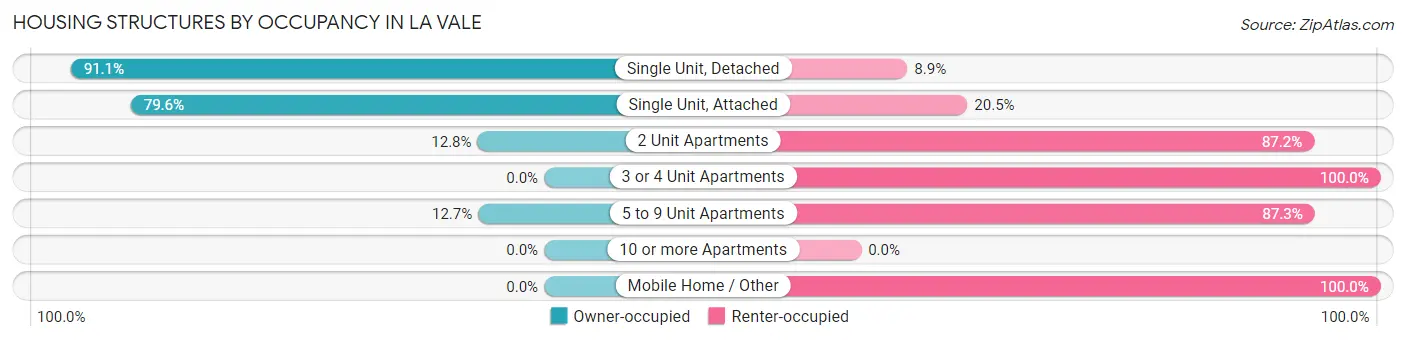
| Structure Type | Owner-occupied | Renter-occupied |
| Single Unit, Detached | 1,545 (91.1%) | 151 (8.9%) |
| Single Unit, Attached | 70 (79.5%) | 18 (20.4%) |
| 2 Unit Apartments | 5 (12.8%) | 34 (87.2%) |
| 3 or 4 Unit Apartments | 0 (0.0%) | 33 (100.0%) |
| 5 to 9 Unit Apartments | 8 (12.7%) | 55 (87.3%) |
| 10 or more Apartments | 0 (0.0%) | 0 (0.0%) |
| Mobile Home / Other | 0 (0.0%) | 5 (100.0%) |
| Total | 1,628 (84.6%) | 296 (15.4%) |
Housing Structures by Number of Rooms in La Vale
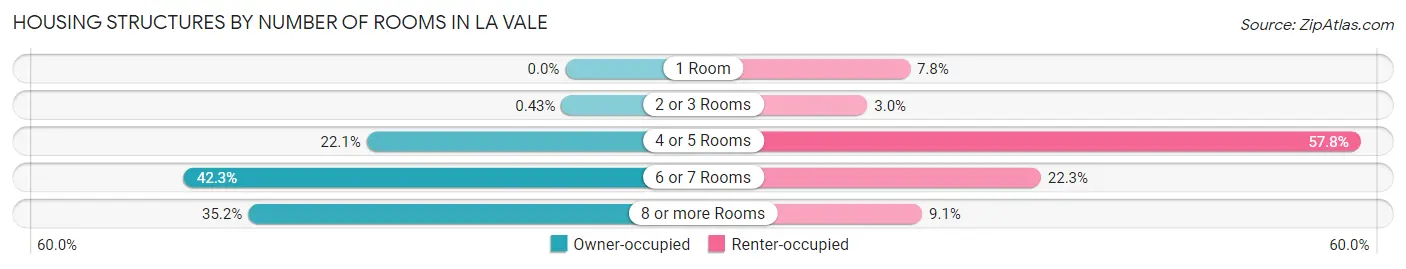
| Number of Rooms | Owner-occupied | Renter-occupied |
| 1 Room | 0 (0.0%) | 23 (7.8%) |
| 2 or 3 Rooms | 7 (0.4%) | 9 (3.0%) |
| 4 or 5 Rooms | 359 (22.1%) | 171 (57.8%) |
| 6 or 7 Rooms | 689 (42.3%) | 66 (22.3%) |
| 8 or more Rooms | 573 (35.2%) | 27 (9.1%) |
| Total | 1,628 (100.0%) | 296 (100.0%) |
Housing Structure by Heating Type in La Vale
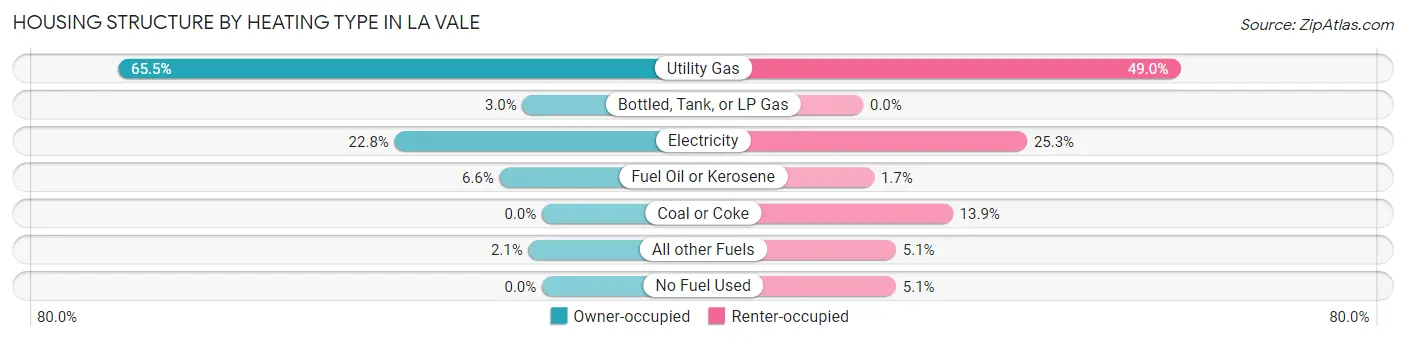
| Heating Type | Owner-occupied | Renter-occupied |
| Utility Gas | 1,067 (65.5%) | 145 (49.0%) |
| Bottled, Tank, or LP Gas | 49 (3.0%) | 0 (0.0%) |
| Electricity | 371 (22.8%) | 75 (25.3%) |
| Fuel Oil or Kerosene | 107 (6.6%) | 5 (1.7%) |
| Coal or Coke | 0 (0.0%) | 41 (13.9%) |
| All other Fuels | 34 (2.1%) | 15 (5.1%) |
| No Fuel Used | 0 (0.0%) | 15 (5.1%) |
| Total | 1,628 (100.0%) | 296 (100.0%) |
Household Vehicle Usage in La Vale
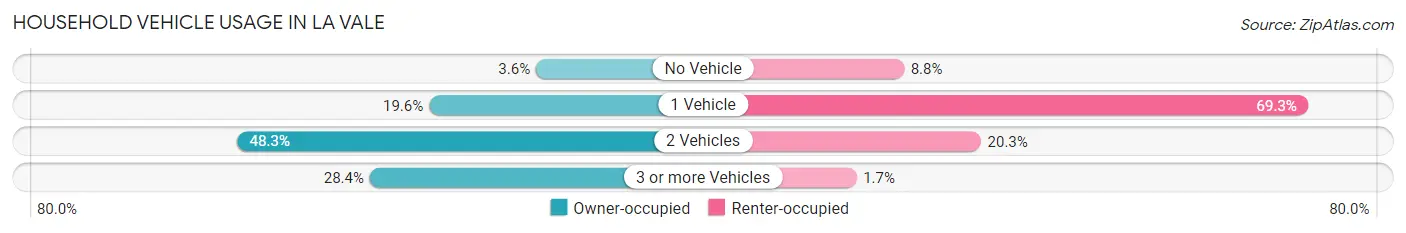
| Vehicles per Household | Owner-occupied | Renter-occupied |
| No Vehicle | 59 (3.6%) | 26 (8.8%) |
| 1 Vehicle | 319 (19.6%) | 205 (69.3%) |
| 2 Vehicles | 787 (48.3%) | 60 (20.3%) |
| 3 or more Vehicles | 463 (28.4%) | 5 (1.7%) |
| Total | 1,628 (100.0%) | 296 (100.0%) |
Real Estate & Mortgages in La Vale
Real Estate and Mortgage Overview in La Vale
| Characteristic | Without Mortgage | With Mortgage |
| Housing Units | 701 | 927 |
| Median Property Value | $164,500 | $171,100 |
| Median Household Income | $70,250 | $124 |
| Monthly Housing Costs | $502 | $21 |
| Real Estate Taxes | $1,767 | $7 |
Property Value by Mortgage Status in La Vale
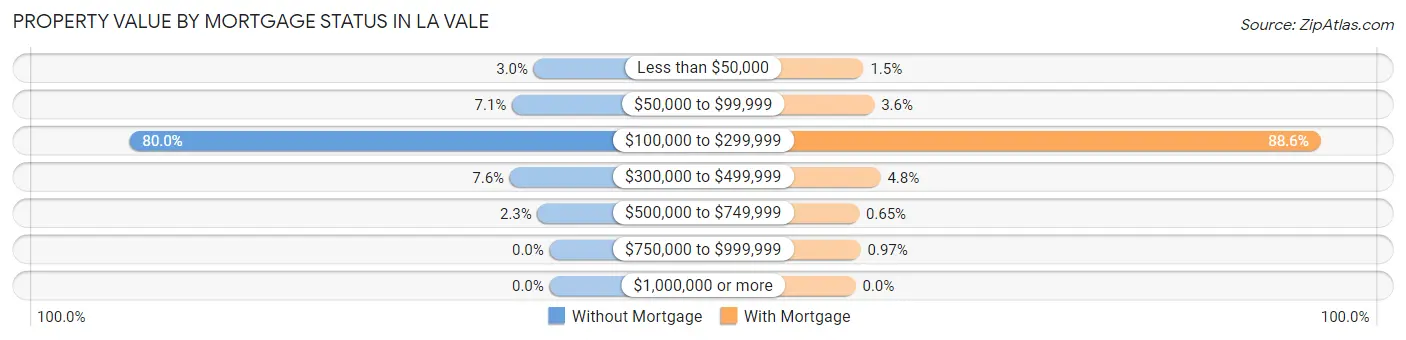
| Property Value | Without Mortgage | With Mortgage |
| Less than $50,000 | 21 (3.0%) | 14 (1.5%) |
| $50,000 to $99,999 | 50 (7.1%) | 33 (3.6%) |
| $100,000 to $299,999 | 561 (80.0%) | 821 (88.6%) |
| $300,000 to $499,999 | 53 (7.6%) | 44 (4.8%) |
| $500,000 to $749,999 | 16 (2.3%) | 6 (0.6%) |
| $750,000 to $999,999 | 0 (0.0%) | 9 (1.0%) |
| $1,000,000 or more | 0 (0.0%) | 0 (0.0%) |
| Total | 701 (100.0%) | 927 (100.0%) |
Household Income by Mortgage Status in La Vale
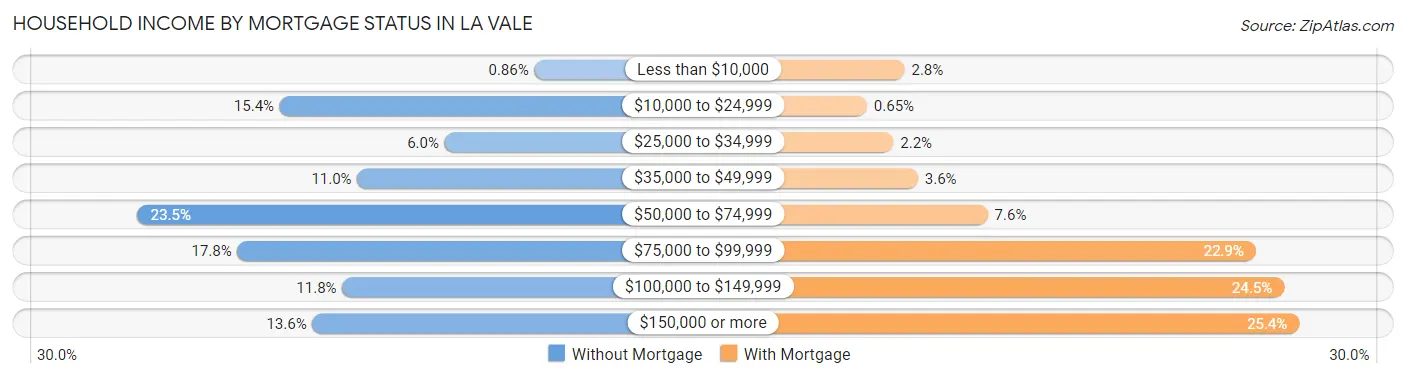
| Household Income | Without Mortgage | With Mortgage |
| Less than $10,000 | 6 (0.9%) | 26 (2.8%) |
| $10,000 to $24,999 | 108 (15.4%) | 6 (0.6%) |
| $25,000 to $34,999 | 42 (6.0%) | 20 (2.2%) |
| $35,000 to $49,999 | 77 (11.0%) | 33 (3.6%) |
| $50,000 to $74,999 | 165 (23.5%) | 70 (7.5%) |
| $75,000 to $99,999 | 125 (17.8%) | 212 (22.9%) |
| $100,000 to $149,999 | 83 (11.8%) | 227 (24.5%) |
| $150,000 or more | 95 (13.6%) | 235 (25.4%) |
| Total | 701 (100.0%) | 927 (100.0%) |
Property Value to Household Income Ratio in La Vale
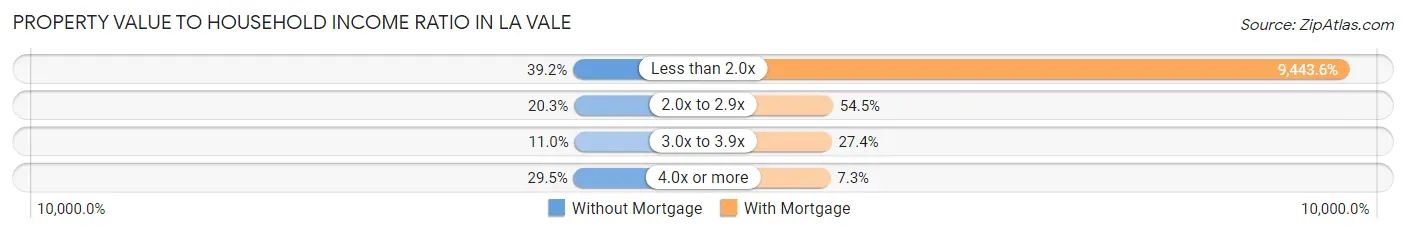
| Value-to-Income Ratio | Without Mortgage | With Mortgage |
| Less than 2.0x | 275 (39.2%) | 87,542 (9,443.6%) |
| 2.0x to 2.9x | 142 (20.3%) | 505 (54.5%) |
| 3.0x to 3.9x | 77 (11.0%) | 254 (27.4%) |
| 4.0x or more | 207 (29.5%) | 68 (7.3%) |
| Total | 701 (100.0%) | 927 (100.0%) |
Real Estate Taxes by Mortgage Status in La Vale
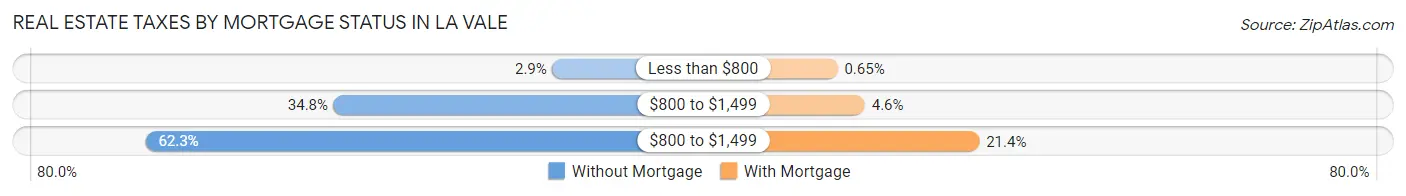
| Property Taxes | Without Mortgage | With Mortgage |
| Less than $800 | 20 (2.9%) | 6 (0.6%) |
| $800 to $1,499 | 244 (34.8%) | 43 (4.6%) |
| $800 to $1,499 | 437 (62.3%) | 198 (21.4%) |
| Total | 701 (100.0%) | 927 (100.0%) |
Health & Disability in La Vale
Health Insurance Coverage by Age in La Vale
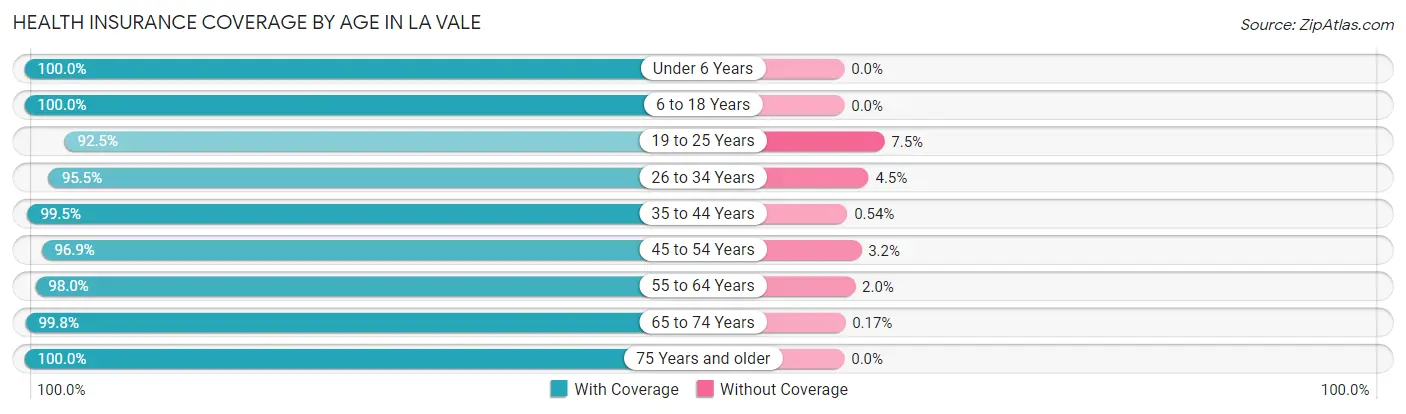
| Age Bracket | With Coverage | Without Coverage |
| Under 6 Years | 400 (100.0%) | 0 (0.0%) |
| 6 to 18 Years | 543 (100.0%) | 0 (0.0%) |
| 19 to 25 Years | 223 (92.5%) | 18 (7.5%) |
| 26 to 34 Years | 655 (95.5%) | 31 (4.5%) |
| 35 to 44 Years | 368 (99.5%) | 2 (0.5%) |
| 45 to 54 Years | 400 (96.9%) | 13 (3.2%) |
| 55 to 64 Years | 630 (98.0%) | 13 (2.0%) |
| 65 to 74 Years | 603 (99.8%) | 1 (0.2%) |
| 75 Years and older | 451 (100.0%) | 0 (0.0%) |
| Total | 4,273 (98.2%) | 78 (1.8%) |
Health Insurance Coverage by Citizenship Status in La Vale
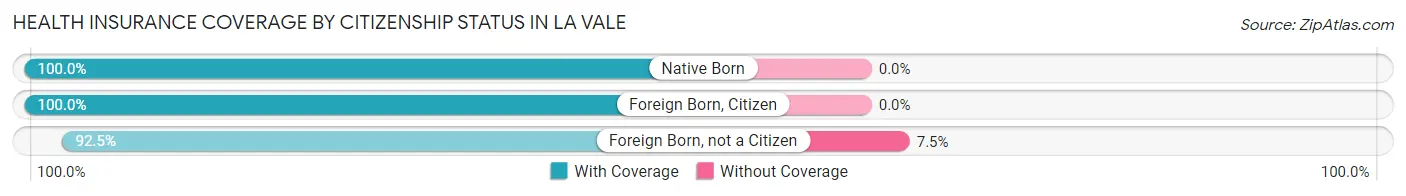
| Citizenship Status | With Coverage | Without Coverage |
| Native Born | 400 (100.0%) | 0 (0.0%) |
| Foreign Born, Citizen | 543 (100.0%) | 0 (0.0%) |
| Foreign Born, not a Citizen | 223 (92.5%) | 18 (7.5%) |
Health Insurance Coverage by Household Income in La Vale
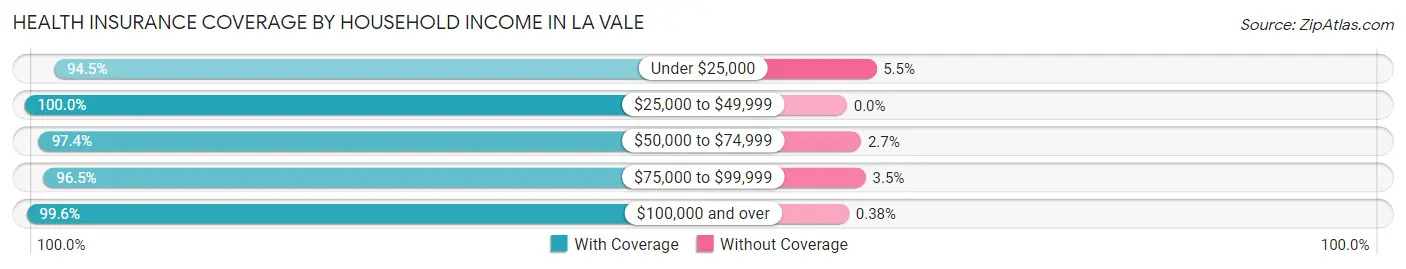
| Household Income | With Coverage | Without Coverage |
| Under $25,000 | 223 (94.5%) | 13 (5.5%) |
| $25,000 to $49,999 | 659 (100.0%) | 0 (0.0%) |
| $50,000 to $74,999 | 919 (97.4%) | 25 (2.6%) |
| $75,000 to $99,999 | 901 (96.5%) | 33 (3.5%) |
| $100,000 and over | 1,562 (99.6%) | 6 (0.4%) |
Public vs Private Health Insurance Coverage by Age in La Vale
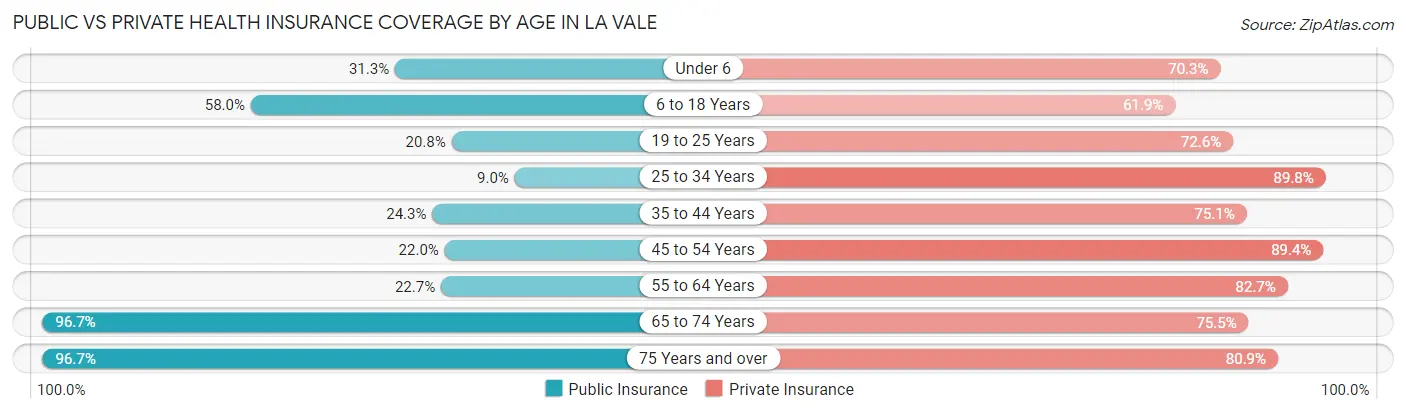
| Age Bracket | Public Insurance | Private Insurance |
| Under 6 | 125 (31.2%) | 281 (70.3%) |
| 6 to 18 Years | 315 (58.0%) | 336 (61.9%) |
| 19 to 25 Years | 50 (20.7%) | 175 (72.6%) |
| 25 to 34 Years | 62 (9.0%) | 616 (89.8%) |
| 35 to 44 Years | 90 (24.3%) | 278 (75.1%) |
| 45 to 54 Years | 91 (22.0%) | 369 (89.3%) |
| 55 to 64 Years | 146 (22.7%) | 532 (82.7%) |
| 65 to 74 Years | 584 (96.7%) | 456 (75.5%) |
| 75 Years and over | 436 (96.7%) | 365 (80.9%) |
| Total | 1,899 (43.6%) | 3,408 (78.3%) |
Disability Status by Sex by Age in La Vale
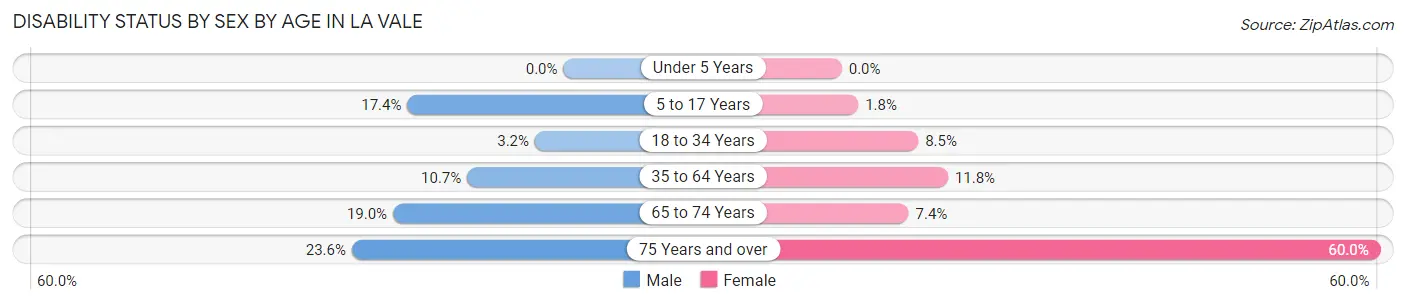
| Age Bracket | Male | Female |
| Under 5 Years | 0 (0.0%) | 0 (0.0%) |
| 5 to 17 Years | 49 (17.4%) | 5 (1.8%) |
| 18 to 34 Years | 16 (3.2%) | 41 (8.5%) |
| 35 to 64 Years | 74 (10.7%) | 87 (11.8%) |
| 65 to 74 Years | 56 (19.0%) | 23 (7.4%) |
| 75 Years and over | 45 (23.6%) | 156 (60.0%) |
Disability Class by Sex by Age in La Vale
Disability Class: Hearing Difficulty
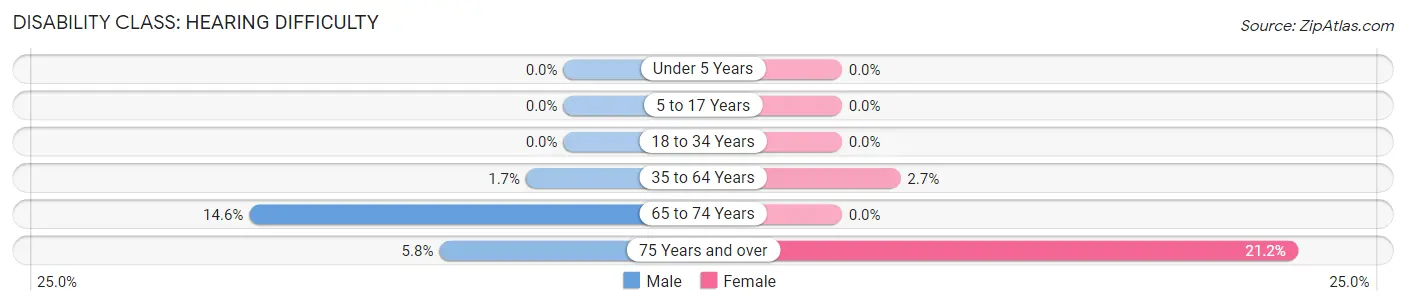
| Age Bracket | Male | Female |
| Under 5 Years | 0 (0.0%) | 0 (0.0%) |
| 5 to 17 Years | 0 (0.0%) | 0 (0.0%) |
| 18 to 34 Years | 0 (0.0%) | 0 (0.0%) |
| 35 to 64 Years | 12 (1.7%) | 20 (2.7%) |
| 65 to 74 Years | 43 (14.6%) | 0 (0.0%) |
| 75 Years and over | 11 (5.8%) | 55 (21.1%) |
Disability Class: Vision Difficulty
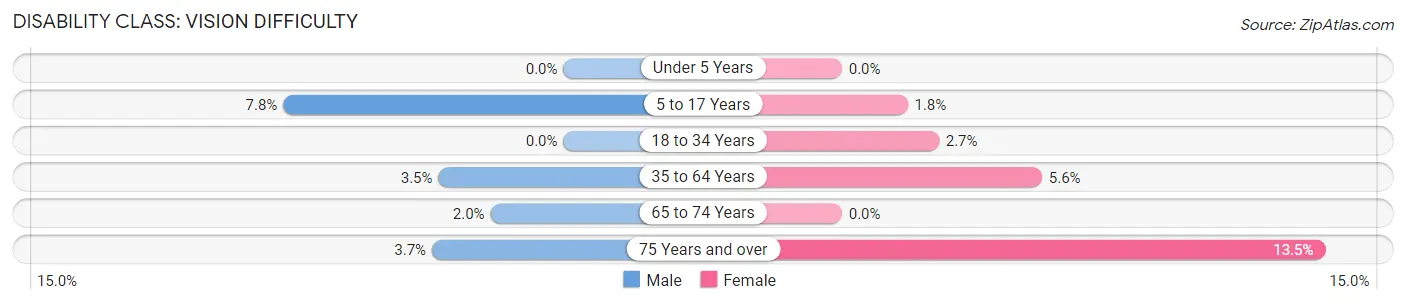
| Age Bracket | Male | Female |
| Under 5 Years | 0 (0.0%) | 0 (0.0%) |
| 5 to 17 Years | 22 (7.8%) | 5 (1.8%) |
| 18 to 34 Years | 0 (0.0%) | 13 (2.7%) |
| 35 to 64 Years | 24 (3.5%) | 41 (5.6%) |
| 65 to 74 Years | 6 (2.0%) | 0 (0.0%) |
| 75 Years and over | 7 (3.7%) | 35 (13.5%) |
Disability Class: Cognitive Difficulty
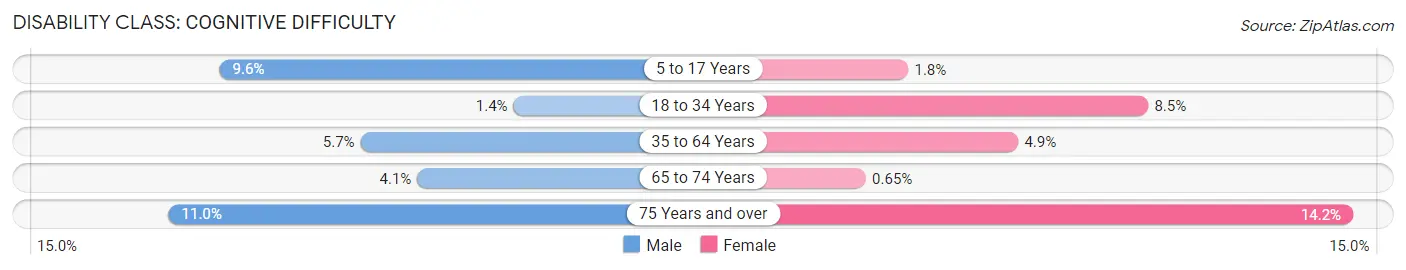
| Age Bracket | Male | Female |
| 5 to 17 Years | 27 (9.6%) | 5 (1.8%) |
| 18 to 34 Years | 7 (1.4%) | 41 (8.5%) |
| 35 to 64 Years | 39 (5.7%) | 36 (4.9%) |
| 65 to 74 Years | 12 (4.1%) | 2 (0.6%) |
| 75 Years and over | 21 (11.0%) | 37 (14.2%) |
Disability Class: Ambulatory Difficulty
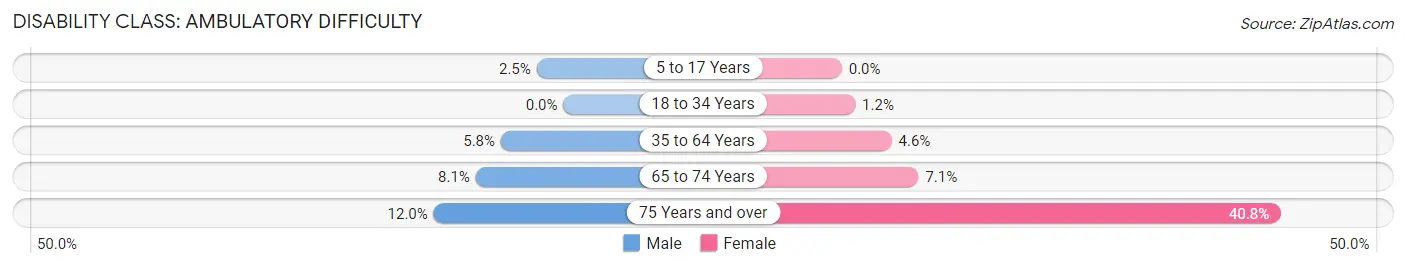
| Age Bracket | Male | Female |
| 5 to 17 Years | 7 (2.5%) | 0 (0.0%) |
| 18 to 34 Years | 0 (0.0%) | 6 (1.2%) |
| 35 to 64 Years | 40 (5.8%) | 34 (4.6%) |
| 65 to 74 Years | 24 (8.1%) | 22 (7.1%) |
| 75 Years and over | 23 (12.0%) | 106 (40.8%) |
Disability Class: Self-Care Difficulty
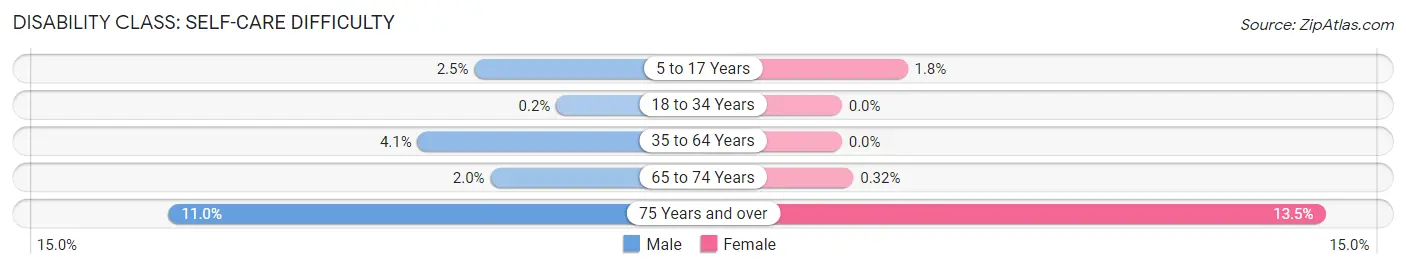
| Age Bracket | Male | Female |
| 5 to 17 Years | 7 (2.5%) | 5 (1.8%) |
| 18 to 34 Years | 1 (0.2%) | 0 (0.0%) |
| 35 to 64 Years | 28 (4.1%) | 0 (0.0%) |
| 65 to 74 Years | 6 (2.0%) | 1 (0.3%) |
| 75 Years and over | 21 (11.0%) | 35 (13.5%) |
Technology Access in La Vale
Computing Device Access in La Vale
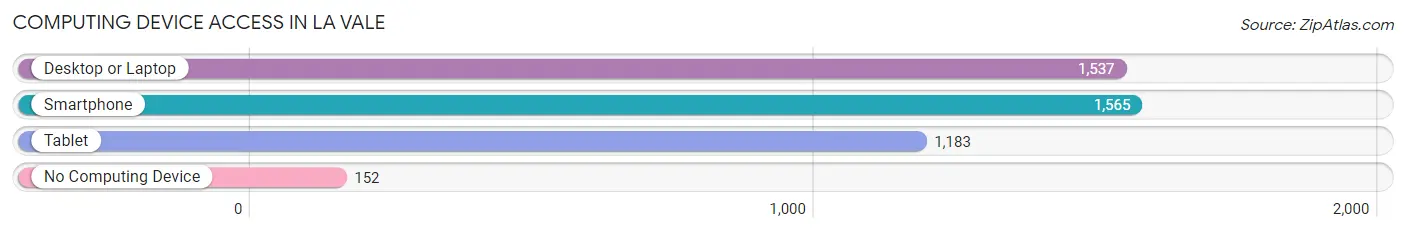
| Device Type | # Households | % Households |
| Desktop or Laptop | 1,537 | 79.9% |
| Smartphone | 1,565 | 81.3% |
| Tablet | 1,183 | 61.5% |
| No Computing Device | 152 | 7.9% |
| Total | 1,924 | 100.0% |
Internet Access in La Vale
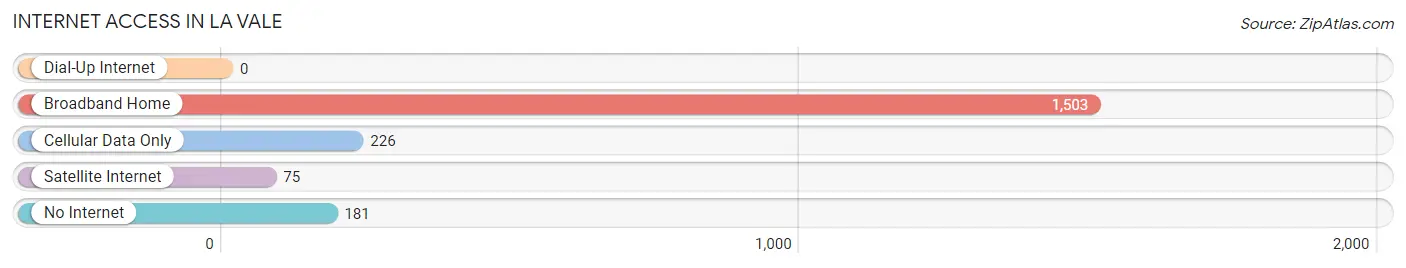
| Internet Type | # Households | % Households |
| Dial-Up Internet | 0 | 0.0% |
| Broadband Home | 1,503 | 78.1% |
| Cellular Data Only | 226 | 11.7% |
| Satellite Internet | 75 | 3.9% |
| No Internet | 181 | 9.4% |
| Total | 1,924 | 100.0% |
La Vale Summary
Vale, Maryland is a small town located in Allegany County, Maryland. It is situated in the Appalachian Mountains, and is part of the Cumberland Metropolitan Statistical Area. The town has a population of approximately 1,000 people, and is known for its rural charm and small-town atmosphere.
History
Vale, Maryland was first settled in the late 1700s by a group of German immigrants. The town was originally known as “Vale of the Pines” due to the abundance of pine trees in the area. The town was officially incorporated in 1872, and was named after the nearby Vale of Cashmere, a valley in the Appalachian Mountains.
In the late 1800s, Vale became a popular destination for tourists, who came to enjoy the scenic beauty of the area. The town was also known for its mineral springs, which were believed to have healing properties. In the early 1900s, Vale was home to several resorts, including the famous Hotel Vale.
Geography
Vale is located in the Appalachian Mountains, in the western part of Allegany County. The town is situated at an elevation of 1,890 feet, and is surrounded by rolling hills and forests. The town is located near the Potomac River, and is approximately 30 miles from Cumberland, Maryland.
The climate in Vale is humid continental, with hot summers and cold winters. The average annual temperature is around 50 degrees Fahrenheit, and the average annual precipitation is around 40 inches.
Economy
The economy of Vale is largely based on tourism and agriculture. The town is home to several small businesses, including restaurants, shops, and lodging. The town is also home to several farms, which produce a variety of crops, including corn, soybeans, and hay.
Demographics
As of the 2010 census, the population of Vale was 1,000 people. The racial makeup of the town was 97.2% White, 0.7% African American, 0.3% Native American, 0.3% Asian, and 1.5% from other races. The median household income was $37,500, and the median family income was $45,000.
Vale is a small, rural town with a strong sense of community. The town is known for its scenic beauty and rural charm, and is a popular destination for tourists and outdoor enthusiasts. The town is also home to several small businesses, farms, and resorts, which provide employment opportunities for the local population.
Common Questions
What is Per Capita Income in La Vale?
Per Capita income in La Vale is $40,573.
What is the Median Family Income in La Vale?
Median Family Income in La Vale is $85,481.
What is the Median Household income in La Vale?
Median Household Income in La Vale is $73,778.
What is Income or Wage Gap in La Vale?
Income or Wage Gap in La Vale is 7.3%.
Women in La Vale earn 92.7 cents for every dollar earned by a man.
What is Inequality or Gini Index in La Vale?
Inequality or Gini Index in La Vale is 0.39.
What is the Total Population of La Vale?
Total Population of La Vale is 4,351.
What is the Total Male Population of La Vale?
Total Male Population of La Vale is 2,196.
What is the Total Female Population of La Vale?
Total Female Population of La Vale is 2,155.
What is the Ratio of Males per 100 Females in La Vale?
There are 101.90 Males per 100 Females in La Vale.
What is the Ratio of Females per 100 Males in La Vale?
There are 98.13 Females per 100 Males in La Vale.
What is the Median Population Age in La Vale?
Median Population Age in La Vale is 44.3 Years.
What is the Average Family Size in La Vale
Average Family Size in La Vale is 2.9 People.
What is the Average Household Size in La Vale
Average Household Size in La Vale is 2.3 People.
How Large is the Labor Force in La Vale?
There are 2,309 People in the Labor Forcein in La Vale.
What is the Percentage of People in the Labor Force in La Vale?
65.0% of People are in the Labor Force in La Vale.
What is the Unemployment Rate in La Vale?
Unemployment Rate in La Vale is 2.7%.