Lake Shore, MD Map & Demographics
Lake Shore Map
Lake Shore Overview
$59,859
PER CAPITA INCOME
$145,100
AVG FAMILY INCOME
$125,740
AVG HOUSEHOLD INCOME
16.7%
WAGE / INCOME GAP [ % ]
83.3¢/ $1
WAGE / INCOME GAP [ $ ]
0.43
INEQUALITY / GINI INDEX
18,872
TOTAL POPULATION
9,262
MALE POPULATION
9,610
FEMALE POPULATION
96.38
MALES / 100 FEMALES
103.76
FEMALES / 100 MALES
40.7
MEDIAN AGE
3.1
AVG FAMILY SIZE
2.7
AVG HOUSEHOLD SIZE
10,523
LABOR FORCE [ PEOPLE ]
69.6%
PERCENT IN LABOR FORCE
4.0%
UNEMPLOYMENT RATE
Income in Lake Shore
Income Overview in Lake Shore
Per Capita Income in Lake Shore is $59,859, while median incomes of families and households are $145,100 and $125,740 respectively.
| Characteristic | Number | Measure |
| Per Capita Income | 18,872 | $59,859 |
| Median Family Income | 5,177 | $145,100 |
| Mean Family Income | 5,177 | $173,032 |
| Median Household Income | 7,083 | $125,740 |
| Mean Household Income | 7,083 | $160,186 |
| Income Deficit | 5,177 | $0 |
| Wage / Income Gap (%) | 18,872 | 16.66% |
| Wage / Income Gap ($) | 18,872 | 83.34¢ per $1 |
| Gini / Inequality Index | 18,872 | 0.43 |
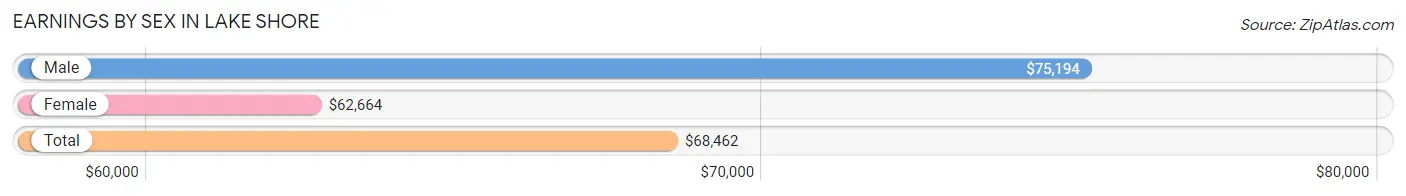
Earnings by Sex in Lake Shore
Average Earnings in Lake Shore are $68,462, $75,194 for men and $62,664 for women, a difference of 16.7%.
| Sex | Number | Average Earnings |
| Male | 5,699 (53.3%) | $75,194 |
| Female | 5,000 (46.7%) | $62,664 |
| Total | 10,699 (100.0%) | $68,462 |
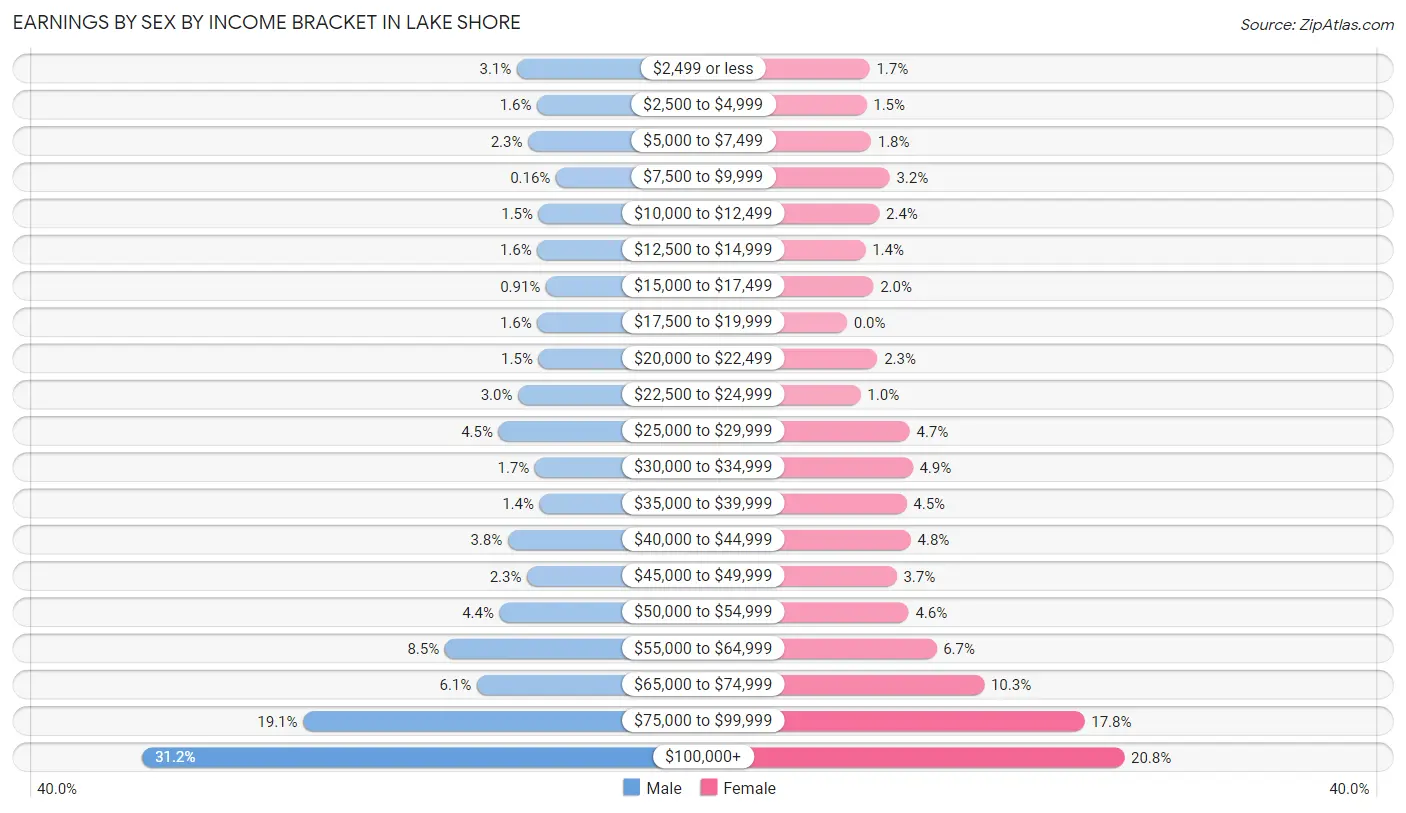
Earnings by Sex by Income Bracket in Lake Shore
The most common earnings brackets in Lake Shore are $100,000+ for men (1,778 | 31.2%) and $100,000+ for women (1,039 | 20.8%).
| Income | Male | Female |
| $2,499 or less | 176 (3.1%) | 85 (1.7%) |
| $2,500 to $4,999 | 90 (1.6%) | 73 (1.5%) |
| $5,000 to $7,499 | 128 (2.2%) | 90 (1.8%) |
| $7,500 to $9,999 | 9 (0.2%) | 160 (3.2%) |
| $10,000 to $12,499 | 83 (1.5%) | 121 (2.4%) |
| $12,500 to $14,999 | 89 (1.6%) | 69 (1.4%) |
| $15,000 to $17,499 | 52 (0.9%) | 99 (2.0%) |
| $17,500 to $19,999 | 89 (1.6%) | 0 (0.0%) |
| $20,000 to $22,499 | 84 (1.5%) | 114 (2.3%) |
| $22,500 to $24,999 | 171 (3.0%) | 51 (1.0%) |
| $25,000 to $29,999 | 254 (4.5%) | 235 (4.7%) |
| $30,000 to $34,999 | 99 (1.7%) | 246 (4.9%) |
| $35,000 to $39,999 | 79 (1.4%) | 223 (4.5%) |
| $40,000 to $44,999 | 215 (3.8%) | 239 (4.8%) |
| $45,000 to $49,999 | 133 (2.3%) | 186 (3.7%) |
| $50,000 to $54,999 | 250 (4.4%) | 231 (4.6%) |
| $55,000 to $64,999 | 484 (8.5%) | 335 (6.7%) |
| $65,000 to $74,999 | 347 (6.1%) | 514 (10.3%) |
| $75,000 to $99,999 | 1,089 (19.1%) | 890 (17.8%) |
| $100,000+ | 1,778 (31.2%) | 1,039 (20.8%) |
| Total | 5,699 (100.0%) | 5,000 (100.0%) |
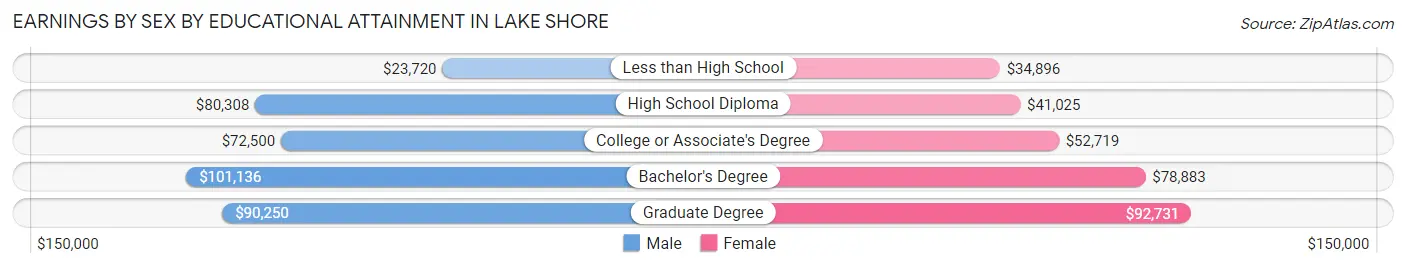
Earnings by Sex by Educational Attainment in Lake Shore
Average earnings in Lake Shore are $78,963 for men and $67,420 for women, a difference of 14.6%. Men with an educational attainment of bachelor's degree enjoy the highest average annual earnings of $101,136, while those with less than high school education earn the least with $23,720. Women with an educational attainment of graduate degree earn the most with the average annual earnings of $92,731, while those with less than high school education have the smallest earnings of $34,896.
| Educational Attainment | Male Income | Female Income |
| Less than High School | $23,720 | $34,896 |
| High School Diploma | $80,308 | $41,025 |
| College or Associate's Degree | $72,500 | $52,719 |
| Bachelor's Degree | $101,136 | $78,883 |
| Graduate Degree | $90,250 | $92,731 |
| Total | $78,963 | $67,420 |
Family Income in Lake Shore
Family Income Brackets in Lake Shore
According to the Lake Shore family income data, there are 1,279 families falling into the $200,000+ income range, which is the most common income bracket and makes up 24.7% of all families.
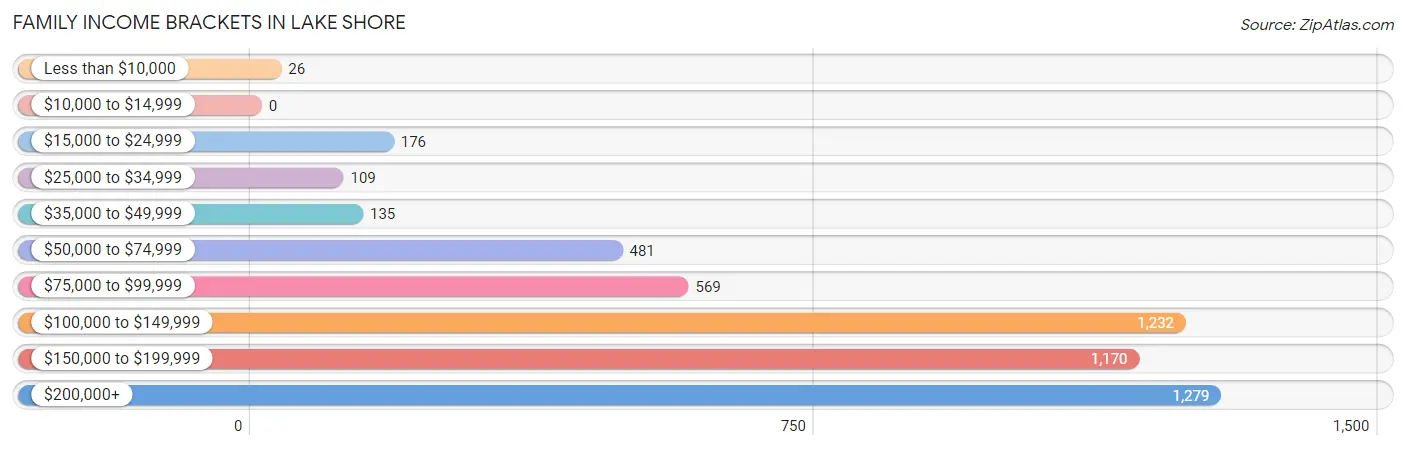
| Income Bracket | # Families | % Families |
| Less than $10,000 | 26 | 0.5% |
| $10,000 to $14,999 | 0 | 0.0% |
| $15,000 to $24,999 | 176 | 3.4% |
| $25,000 to $34,999 | 109 | 2.1% |
| $35,000 to $49,999 | 135 | 2.6% |
| $50,000 to $74,999 | 481 | 9.3% |
| $75,000 to $99,999 | 569 | 11.0% |
| $100,000 to $149,999 | 1,232 | 23.8% |
| $150,000 to $199,999 | 1,170 | 22.6% |
| $200,000+ | 1,279 | 24.7% |
Family Income by Famaliy Size in Lake Shore
7+ person families (89 | 1.7%) account for the highest median family income in Lake Shore with $200,742 per family, while 2-person families (2,281 | 44.1%) have the highest median income of $52,782 per family member.
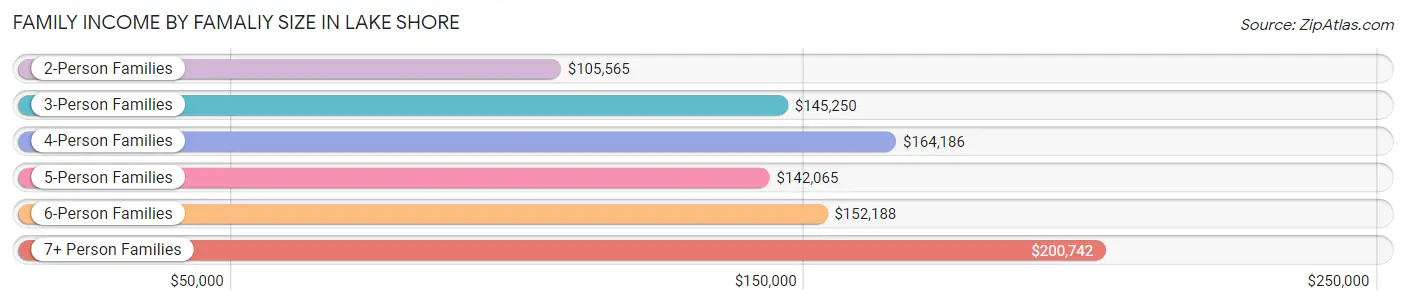
| Income Bracket | # Families | Median Income |
| 2-Person Families | 2,281 (44.1%) | $105,565 |
| 3-Person Families | 1,043 (20.2%) | $145,250 |
| 4-Person Families | 1,232 (23.8%) | $164,186 |
| 5-Person Families | 322 (6.2%) | $142,065 |
| 6-Person Families | 210 (4.1%) | $152,188 |
| 7+ Person Families | 89 (1.7%) | $200,742 |
| Total | 5,177 (100.0%) | $145,100 |
Family Income by Number of Earners in Lake Shore
The median family income in Lake Shore is $145,100, with families comprising 3+ earners (655) having the highest median family income of $201,992, while families with no earners (823) have the lowest median family income of $67,150, accounting for 12.7% and 15.9% of families, respectively.
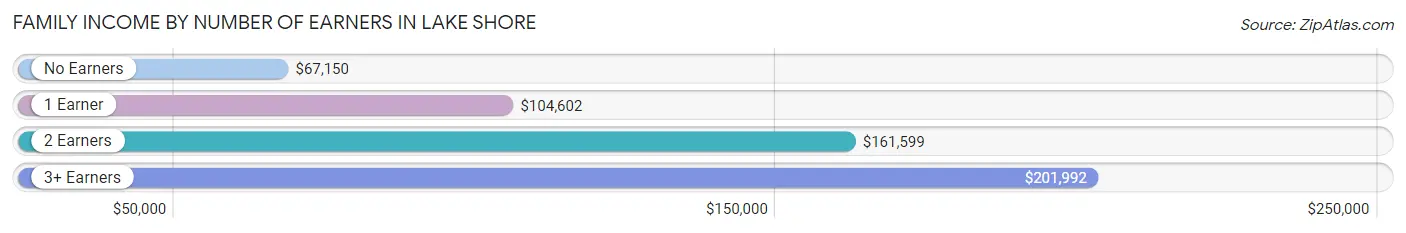
| Number of Earners | # Families | Median Income |
| No Earners | 823 (15.9%) | $67,150 |
| 1 Earner | 1,130 (21.8%) | $104,602 |
| 2 Earners | 2,569 (49.6%) | $161,599 |
| 3+ Earners | 655 (12.7%) | $201,992 |
| Total | 5,177 (100.0%) | $145,100 |
Household Income in Lake Shore
Household Income Brackets in Lake Shore
With 1,523 households falling in the category, the $200,000+ income range is the most frequent in Lake Shore, accounting for 21.5% of all households. In contrast, only 21 households (0.3%) fall into the $10,000 to $14,999 income bracket, making it the least populous group.
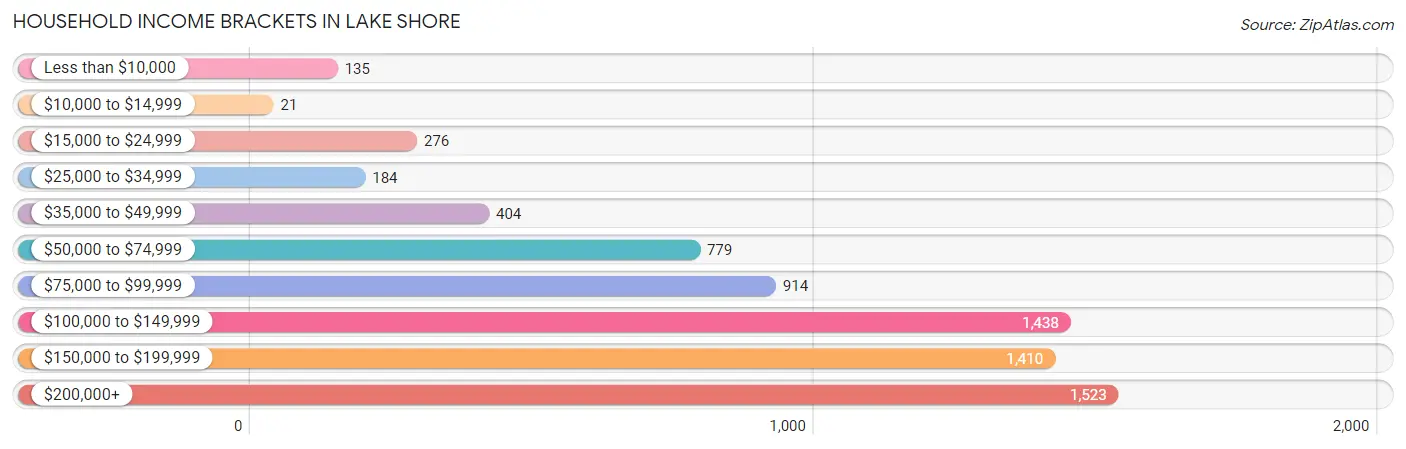
| Income Bracket | # Households | % Households |
| Less than $10,000 | 135 | 1.9% |
| $10,000 to $14,999 | 21 | 0.3% |
| $15,000 to $24,999 | 276 | 3.9% |
| $25,000 to $34,999 | 184 | 2.6% |
| $35,000 to $49,999 | 404 | 5.7% |
| $50,000 to $74,999 | 779 | 11.0% |
| $75,000 to $99,999 | 914 | 12.9% |
| $100,000 to $149,999 | 1,438 | 20.3% |
| $150,000 to $199,999 | 1,410 | 19.9% |
| $200,000+ | 1,523 | 21.5% |
Household Income by Householder Age in Lake Shore
The median household income in Lake Shore is $125,740, with the highest median household income of $157,152 found in the 45 to 64 years age bracket for the primary householder. A total of 3,046 households (43.0%) fall into this category.
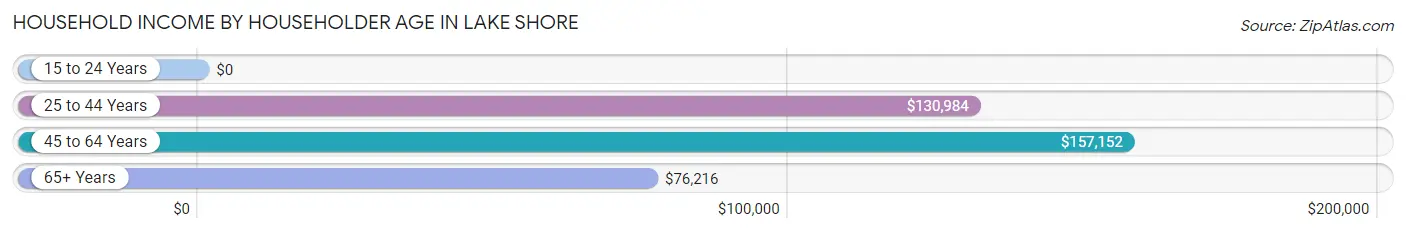
| Income Bracket | # Households | Median Income |
| 15 to 24 Years | 0 (0.0%) | $0 |
| 25 to 44 Years | 2,219 (31.3%) | $130,984 |
| 45 to 64 Years | 3,046 (43.0%) | $157,152 |
| 65+ Years | 1,818 (25.7%) | $76,216 |
| Total | 7,083 (100.0%) | $125,740 |
Poverty in Lake Shore
Income Below Poverty by Sex and Age in Lake Shore
With 3.4% poverty level for males and 3.1% for females among the residents of Lake Shore, 65 to 74 year old males and 25 to 34 year old females are the most vulnerable to poverty, with 92 males (8.2%) and 106 females (8.2%) in their respective age groups living below the poverty level.
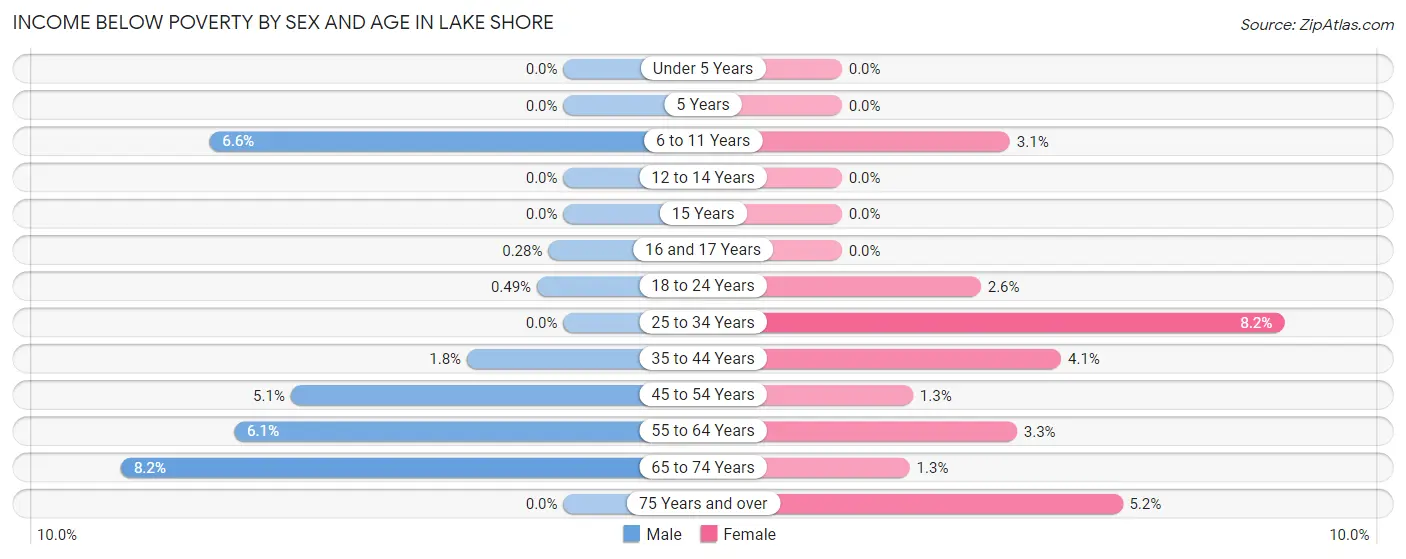
| Age Bracket | Male | Female |
| Under 5 Years | 0 (0.0%) | 0 (0.0%) |
| 5 Years | 0 (0.0%) | 0 (0.0%) |
| 6 to 11 Years | 45 (6.6%) | 25 (3.1%) |
| 12 to 14 Years | 0 (0.0%) | 0 (0.0%) |
| 15 Years | 0 (0.0%) | 0 (0.0%) |
| 16 and 17 Years | 1 (0.3%) | 0 (0.0%) |
| 18 to 24 Years | 2 (0.5%) | 13 (2.6%) |
| 25 to 34 Years | 0 (0.0%) | 106 (8.2%) |
| 35 to 44 Years | 26 (1.8%) | 51 (4.1%) |
| 45 to 54 Years | 67 (5.1%) | 16 (1.3%) |
| 55 to 64 Years | 84 (6.1%) | 44 (3.3%) |
| 65 to 74 Years | 92 (8.2%) | 12 (1.3%) |
| 75 Years and over | 0 (0.0%) | 34 (5.2%) |
| Total | 317 (3.4%) | 301 (3.1%) |
Income Above Poverty by Sex and Age in Lake Shore
According to the poverty statistics in Lake Shore, males aged under 5 years and females aged under 5 years are the age groups that are most secure financially, with 100.0% of males and 100.0% of females in these age groups living above the poverty line.
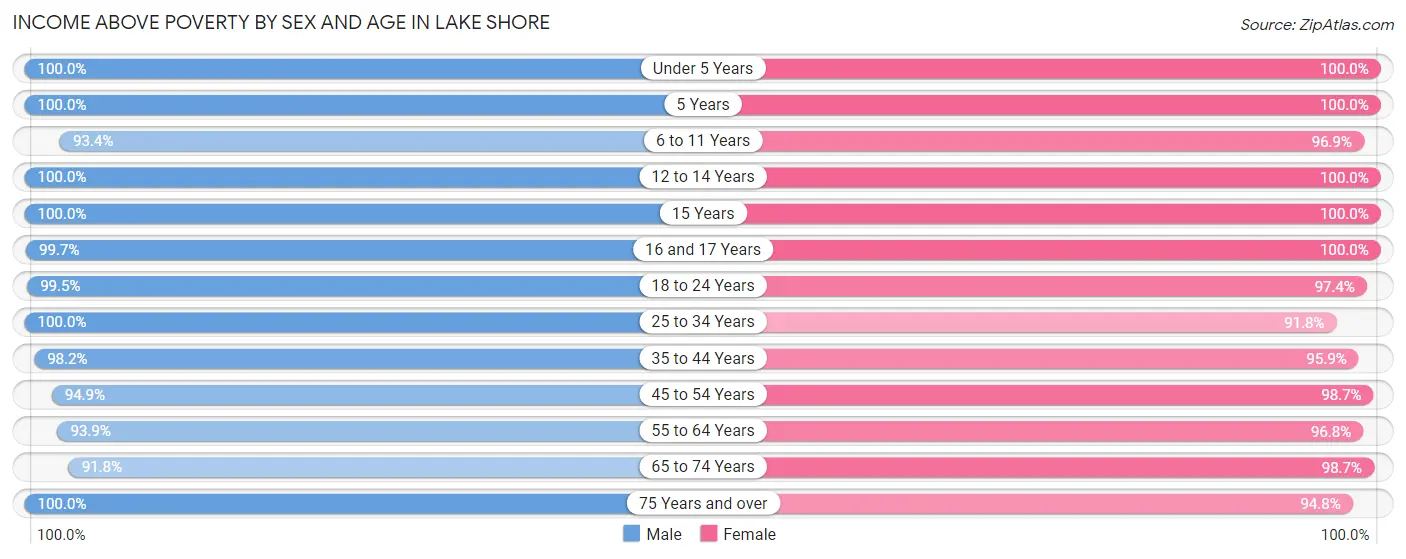
| Age Bracket | Male | Female |
| Under 5 Years | 428 (100.0%) | 616 (100.0%) |
| 5 Years | 70 (100.0%) | 102 (100.0%) |
| 6 to 11 Years | 640 (93.4%) | 775 (96.9%) |
| 12 to 14 Years | 320 (100.0%) | 389 (100.0%) |
| 15 Years | 102 (100.0%) | 180 (100.0%) |
| 16 and 17 Years | 353 (99.7%) | 280 (100.0%) |
| 18 to 24 Years | 407 (99.5%) | 490 (97.4%) |
| 25 to 34 Years | 1,129 (100.0%) | 1,185 (91.8%) |
| 35 to 44 Years | 1,426 (98.2%) | 1,201 (95.9%) |
| 45 to 54 Years | 1,256 (94.9%) | 1,195 (98.7%) |
| 55 to 64 Years | 1,291 (93.9%) | 1,308 (96.8%) |
| 65 to 74 Years | 1,028 (91.8%) | 944 (98.7%) |
| 75 Years and over | 450 (100.0%) | 618 (94.8%) |
| Total | 8,900 (96.6%) | 9,283 (96.9%) |
Income Below Poverty Among Married-Couple Families in Lake Shore
The poverty statistics for married-couple families in Lake Shore show that 0.8% or 36 of the total 4,407 families live below the poverty line. Families with no children have the highest poverty rate of 1.5%, comprising of 36 families. On the other hand, families with 1 or 2 children have the lowest poverty rate of 0.0%, which includes 0 families.
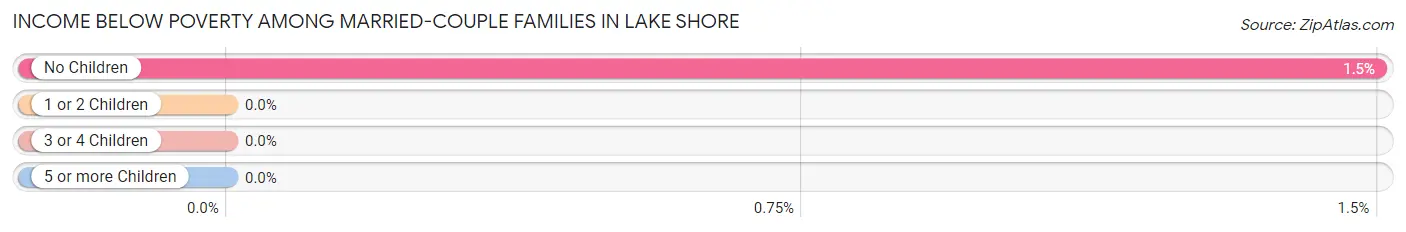
| Children | Above Poverty | Below Poverty |
| No Children | 2,358 (98.5%) | 36 (1.5%) |
| 1 or 2 Children | 1,736 (100.0%) | 0 (0.0%) |
| 3 or 4 Children | 277 (100.0%) | 0 (0.0%) |
| 5 or more Children | 0 (0.0%) | 0 (0.0%) |
| Total | 4,371 (99.2%) | 36 (0.8%) |
Income Below Poverty Among Single-Parent Households in Lake Shore
According to the poverty data in Lake Shore, 20.8% or 53 single-father households and 6.0% or 31 single-mother households are living below the poverty line. Among single-father households, those with no children have the highest poverty rate, with 53 households (35.6%) experiencing poverty. Likewise, among single-mother households, those with 1 or 2 children have the highest poverty rate, with 26 households (9.5%) falling below the poverty line.
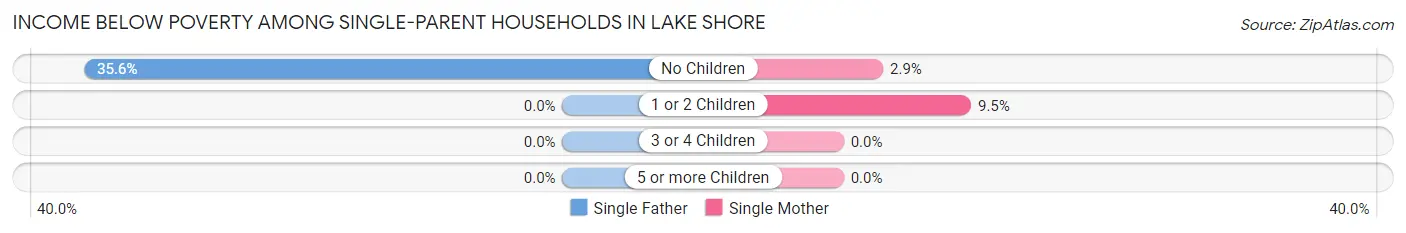
| Children | Single Father | Single Mother |
| No Children | 53 (35.6%) | 5 (2.9%) |
| 1 or 2 Children | 0 (0.0%) | 26 (9.5%) |
| 3 or 4 Children | 0 (0.0%) | 0 (0.0%) |
| 5 or more Children | 0 (0.0%) | 0 (0.0%) |
| Total | 53 (20.8%) | 31 (6.0%) |
Income Below Poverty Among Married-Couple vs Single-Parent Households in Lake Shore
The poverty data for Lake Shore shows that 36 of the married-couple family households (0.8%) and 84 of the single-parent households (10.9%) are living below the poverty level. Within the married-couple family households, those with no children have the highest poverty rate, with 36 households (1.5%) falling below the poverty line. Among the single-parent households, those with no children have the highest poverty rate, with 58 household (18.2%) living below poverty.
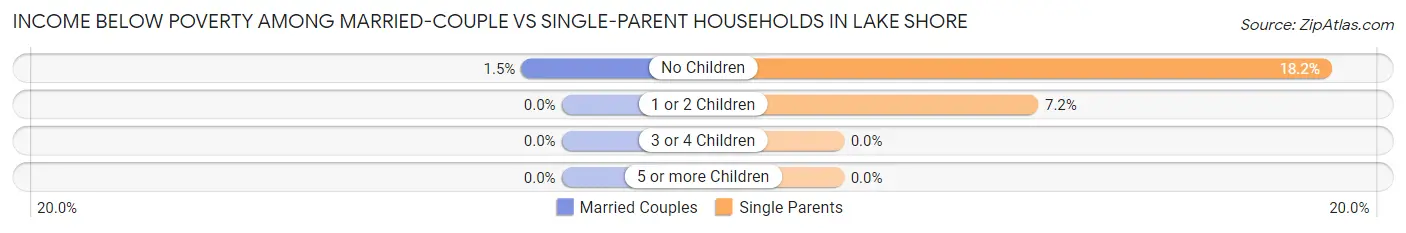
| Children | Married-Couple Families | Single-Parent Households |
| No Children | 36 (1.5%) | 58 (18.2%) |
| 1 or 2 Children | 0 (0.0%) | 26 (7.2%) |
| 3 or 4 Children | 0 (0.0%) | 0 (0.0%) |
| 5 or more Children | 0 (0.0%) | 0 (0.0%) |
| Total | 36 (0.8%) | 84 (10.9%) |
Race in Lake Shore
The most populous races in Lake Shore are White / Caucasian (16,342 | 86.6%), Two or more Races (1,268 | 6.7%), and Hispanic or Latino (882 | 4.7%).
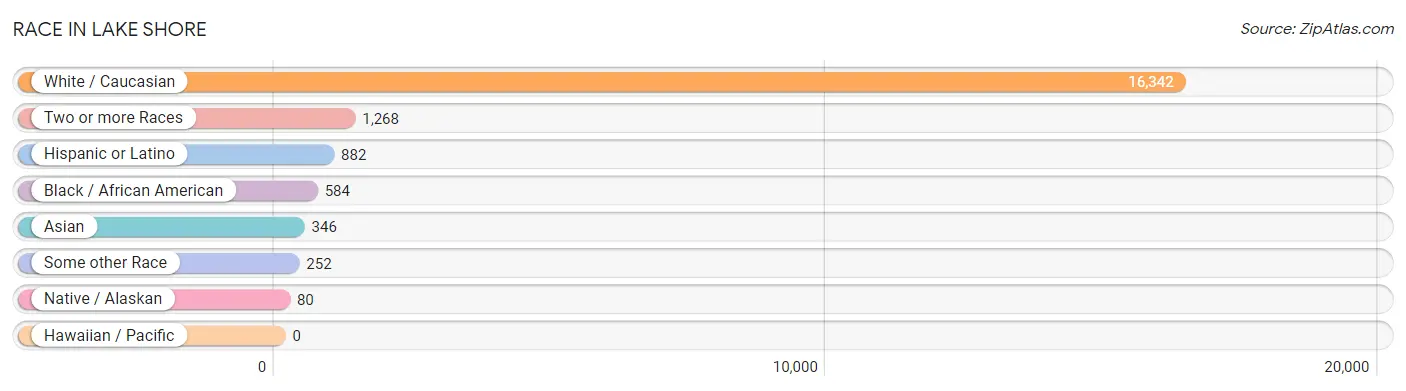
| Race | # Population | % Population |
| Asian | 346 | 1.8% |
| Black / African American | 584 | 3.1% |
| Hawaiian / Pacific | 0 | 0.0% |
| Hispanic or Latino | 882 | 4.7% |
| Native / Alaskan | 80 | 0.4% |
| White / Caucasian | 16,342 | 86.6% |
| Two or more Races | 1,268 | 6.7% |
| Some other Race | 252 | 1.3% |
| Total | 18,872 | 100.0% |
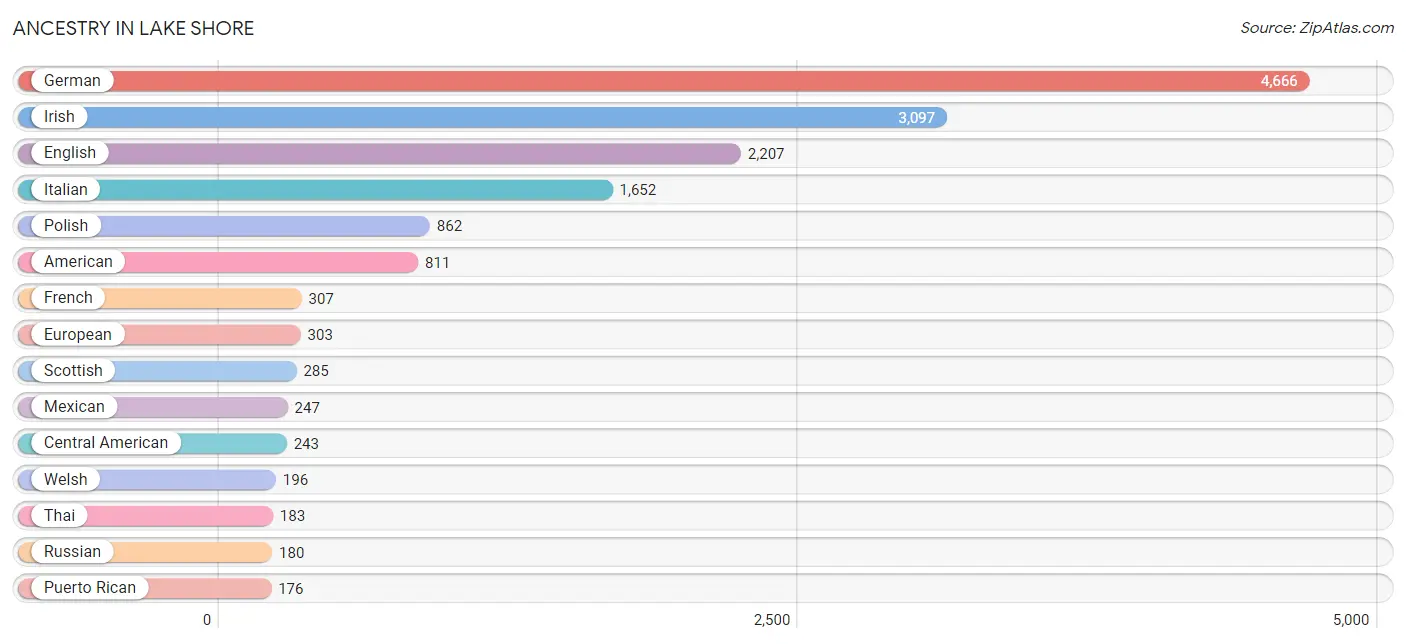
Ancestry in Lake Shore
The most populous ancestries reported in Lake Shore are German (4,666 | 24.7%), Irish (3,097 | 16.4%), English (2,207 | 11.7%), Italian (1,652 | 8.7%), and Polish (862 | 4.6%), together accounting for 66.1% of all Lake Shore residents.
| Ancestry | # Population | % Population |
| African | 2 | 0.0% |
| Albanian | 16 | 0.1% |
| American | 811 | 4.3% |
| Arab | 59 | 0.3% |
| Austrian | 148 | 0.8% |
| Bhutanese | 154 | 0.8% |
| Blackfeet | 12 | 0.1% |
| British | 161 | 0.9% |
| Bulgarian | 108 | 0.6% |
| Burmese | 55 | 0.3% |
| Canadian | 27 | 0.1% |
| Central American | 243 | 1.3% |
| Central American Indian | 21 | 0.1% |
| Cherokee | 142 | 0.7% |
| Choctaw | 27 | 0.1% |
| Costa Rican | 13 | 0.1% |
| Croatian | 38 | 0.2% |
| Czech | 28 | 0.2% |
| Czechoslovakian | 47 | 0.3% |
| Dutch | 80 | 0.4% |
| Eastern European | 8 | 0.0% |
| Ecuadorian | 6 | 0.0% |
| Egyptian | 46 | 0.2% |
| English | 2,207 | 11.7% |
| Estonian | 13 | 0.1% |
| European | 303 | 1.6% |
| Finnish | 17 | 0.1% |
| French | 307 | 1.6% |
| French Canadian | 17 | 0.1% |
| German | 4,666 | 24.7% |
| Greek | 16 | 0.1% |
| Guatemalan | 67 | 0.4% |
| Hungarian | 73 | 0.4% |
| Indian (Asian) | 94 | 0.5% |
| Irish | 3,097 | 16.4% |
| Italian | 1,652 | 8.7% |
| Korean | 136 | 0.7% |
| Latvian | 17 | 0.1% |
| Lebanese | 13 | 0.1% |
| Lithuanian | 88 | 0.5% |
| Mexican | 247 | 1.3% |
| Nicaraguan | 163 | 0.9% |
| Norwegian | 10 | 0.1% |
| Pakistani | 29 | 0.2% |
| Pennsylvania German | 29 | 0.2% |
| Peruvian | 9 | 0.1% |
| Polish | 862 | 4.6% |
| Portuguese | 8 | 0.0% |
| Puerto Rican | 176 | 0.9% |
| Romanian | 36 | 0.2% |
| Russian | 180 | 0.9% |
| Scandinavian | 46 | 0.2% |
| Scotch-Irish | 117 | 0.6% |
| Scottish | 285 | 1.5% |
| Slovak | 125 | 0.7% |
| South American | 58 | 0.3% |
| Spaniard | 68 | 0.4% |
| Sri Lankan | 10 | 0.1% |
| Subsaharan African | 2 | 0.0% |
| Swedish | 51 | 0.3% |
| Swiss | 33 | 0.2% |
| Thai | 183 | 1.0% |
| Trinidadian and Tobagonian | 9 | 0.1% |
| Ukrainian | 76 | 0.4% |
| Venezuelan | 43 | 0.2% |
| Welsh | 196 | 1.0% |
| Yugoslavian | 24 | 0.1% | View All 67 Rows |
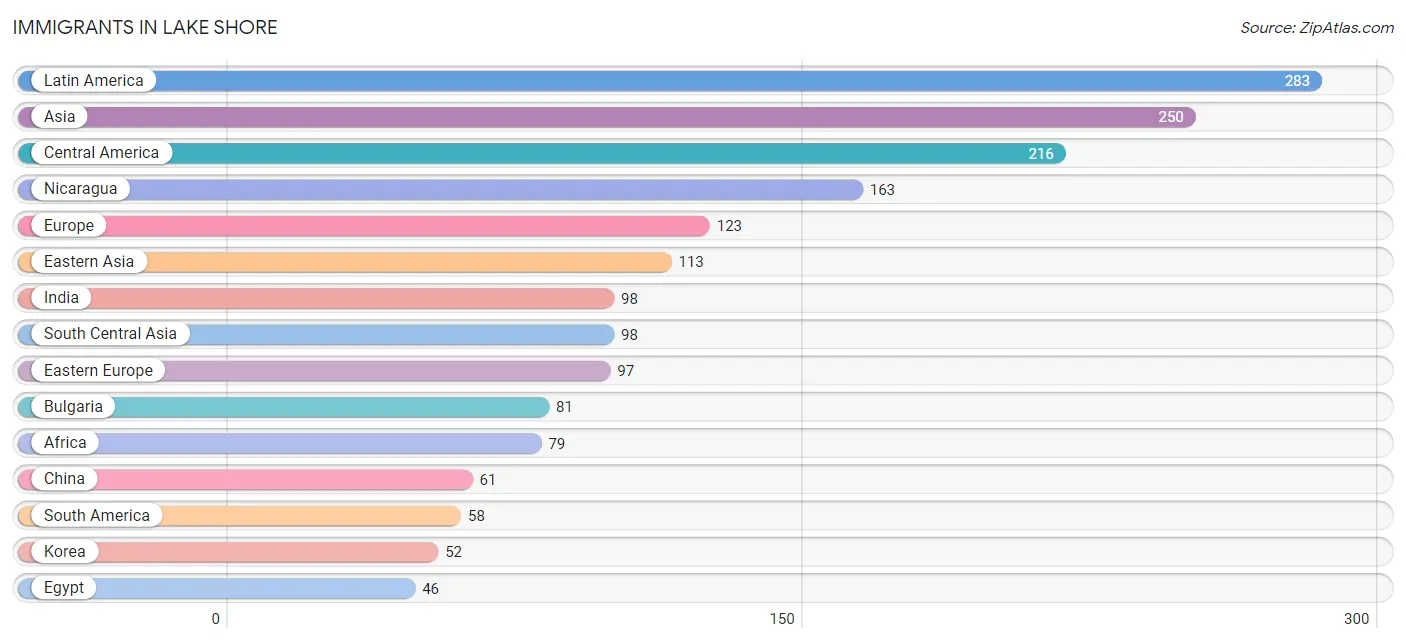
Immigrants in Lake Shore
The most numerous immigrant groups reported in Lake Shore came from Latin America (283 | 1.5%), Asia (250 | 1.3%), Central America (216 | 1.1%), Nicaragua (163 | 0.9%), and Europe (123 | 0.6%), together accounting for 5.5% of all Lake Shore residents.
| Immigration Origin | # Population | % Population |
| Africa | 79 | 0.4% |
| Asia | 250 | 1.3% |
| Bulgaria | 81 | 0.4% |
| Canada | 14 | 0.1% |
| Caribbean | 9 | 0.1% |
| Central America | 216 | 1.1% |
| China | 61 | 0.3% |
| Eastern Africa | 31 | 0.2% |
| Eastern Asia | 113 | 0.6% |
| Eastern Europe | 97 | 0.5% |
| Ecuador | 6 | 0.0% |
| Egypt | 46 | 0.2% |
| Europe | 123 | 0.6% |
| Germany | 13 | 0.1% |
| Guatemala | 18 | 0.1% |
| Hong Kong | 10 | 0.1% |
| India | 98 | 0.5% |
| Israel | 26 | 0.1% |
| Italy | 13 | 0.1% |
| Kenya | 31 | 0.2% |
| Korea | 52 | 0.3% |
| Latin America | 283 | 1.5% |
| Mexico | 35 | 0.2% |
| Nicaragua | 163 | 0.9% |
| Nigeria | 2 | 0.0% |
| Northern Africa | 46 | 0.2% |
| Peru | 9 | 0.1% |
| Philippines | 13 | 0.1% |
| Poland | 15 | 0.1% |
| Russia | 1 | 0.0% |
| South America | 58 | 0.3% |
| South Central Asia | 98 | 0.5% |
| South Eastern Asia | 13 | 0.1% |
| Southern Europe | 13 | 0.1% |
| Trinidad and Tobago | 9 | 0.1% |
| Venezuela | 43 | 0.2% |
| Western Africa | 2 | 0.0% |
| Western Asia | 26 | 0.1% |
| Western Europe | 13 | 0.1% | View All 39 Rows |
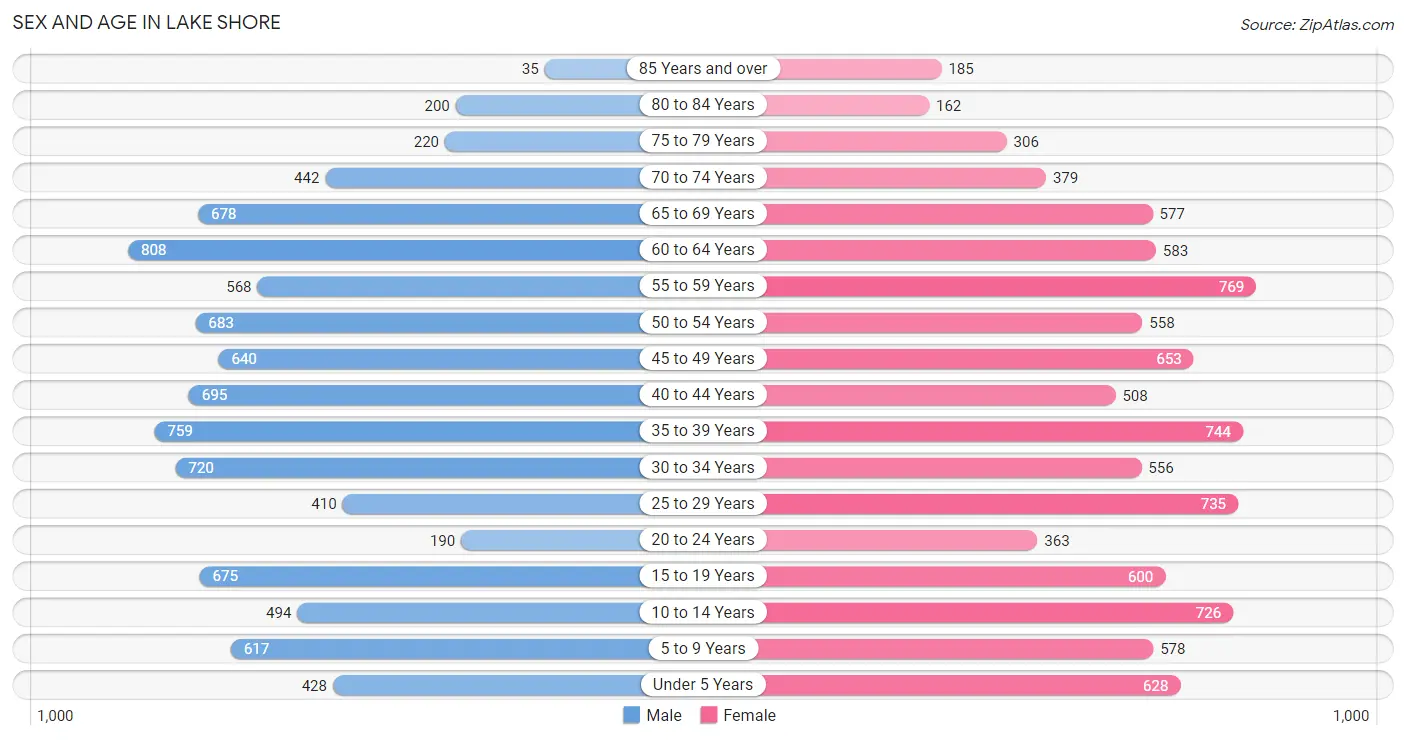
Sex and Age in Lake Shore
Sex and Age in Lake Shore
The most populous age groups in Lake Shore are 60 to 64 Years (808 | 8.7%) for men and 55 to 59 Years (769 | 8.0%) for women.
| Age Bracket | Male | Female |
| Under 5 Years | 428 (4.6%) | 628 (6.5%) |
| 5 to 9 Years | 617 (6.7%) | 578 (6.0%) |
| 10 to 14 Years | 494 (5.3%) | 726 (7.5%) |
| 15 to 19 Years | 675 (7.3%) | 600 (6.2%) |
| 20 to 24 Years | 190 (2.1%) | 363 (3.8%) |
| 25 to 29 Years | 410 (4.4%) | 735 (7.6%) |
| 30 to 34 Years | 720 (7.8%) | 556 (5.8%) |
| 35 to 39 Years | 759 (8.2%) | 744 (7.7%) |
| 40 to 44 Years | 695 (7.5%) | 508 (5.3%) |
| 45 to 49 Years | 640 (6.9%) | 653 (6.8%) |
| 50 to 54 Years | 683 (7.4%) | 558 (5.8%) |
| 55 to 59 Years | 568 (6.1%) | 769 (8.0%) |
| 60 to 64 Years | 808 (8.7%) | 583 (6.1%) |
| 65 to 69 Years | 678 (7.3%) | 577 (6.0%) |
| 70 to 74 Years | 442 (4.8%) | 379 (3.9%) |
| 75 to 79 Years | 220 (2.4%) | 306 (3.2%) |
| 80 to 84 Years | 200 (2.2%) | 162 (1.7%) |
| 85 Years and over | 35 (0.4%) | 185 (1.9%) |
| Total | 9,262 (100.0%) | 9,610 (100.0%) |
Families and Households in Lake Shore
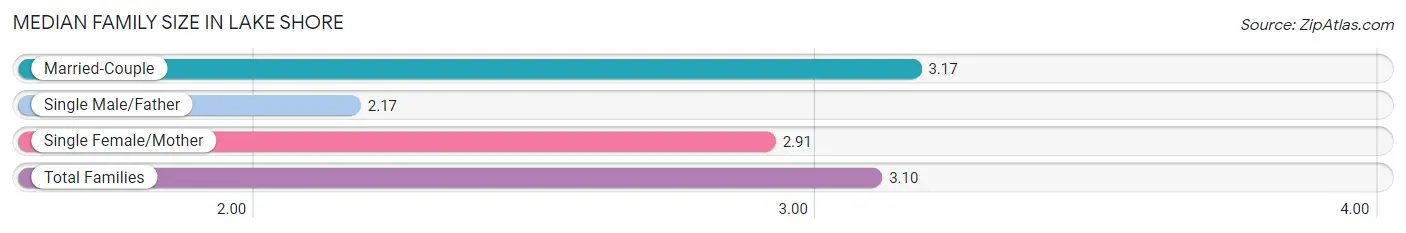
Median Family Size in Lake Shore
The median family size in Lake Shore is 3.10 persons per family, with married-couple families (4,407 | 85.1%) accounting for the largest median family size of 3.17 persons per family. On the other hand, single male/father families (255 | 4.9%) represent the smallest median family size with 2.17 persons per family.
| Family Type | # Families | Family Size |
| Married-Couple | 4,407 (85.1%) | 3.17 |
| Single Male/Father | 255 (4.9%) | 2.17 |
| Single Female/Mother | 515 (10.0%) | 2.91 |
| Total Families | 5,177 (100.0%) | 3.10 |
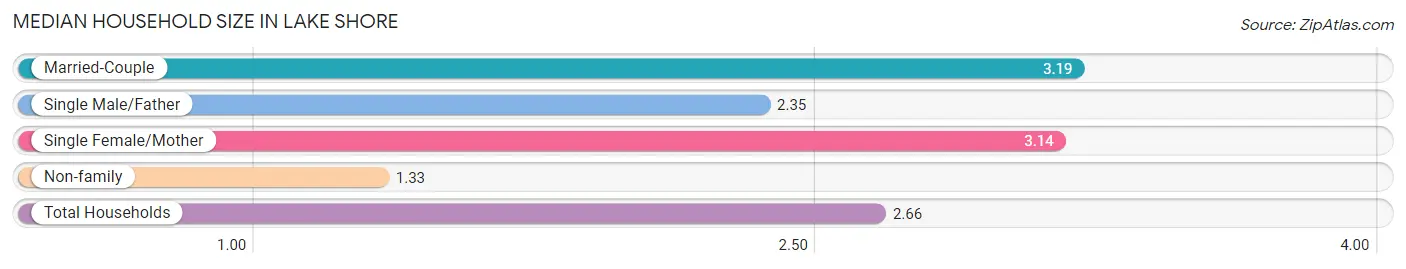
Median Household Size in Lake Shore
The median household size in Lake Shore is 2.66 persons per household, with married-couple households (4,407 | 62.2%) accounting for the largest median household size of 3.19 persons per household. non-family households (1,906 | 26.9%) represent the smallest median household size with 1.33 persons per household.
| Household Type | # Households | Household Size |
| Married-Couple | 4,407 (62.2%) | 3.19 |
| Single Male/Father | 255 (3.6%) | 2.35 |
| Single Female/Mother | 515 (7.3%) | 3.14 |
| Non-family | 1,906 (26.9%) | 1.33 |
| Total Households | 7,083 (100.0%) | 2.66 |
Household Size by Marriage Status in Lake Shore
Out of a total of 7,083 households in Lake Shore, 5,177 (73.1%) are family households, while 1,906 (26.9%) are nonfamily households. The most numerous type of family households are 2-person households, comprising 2,209, and the most common type of nonfamily households are 1-person households, comprising 1,391.
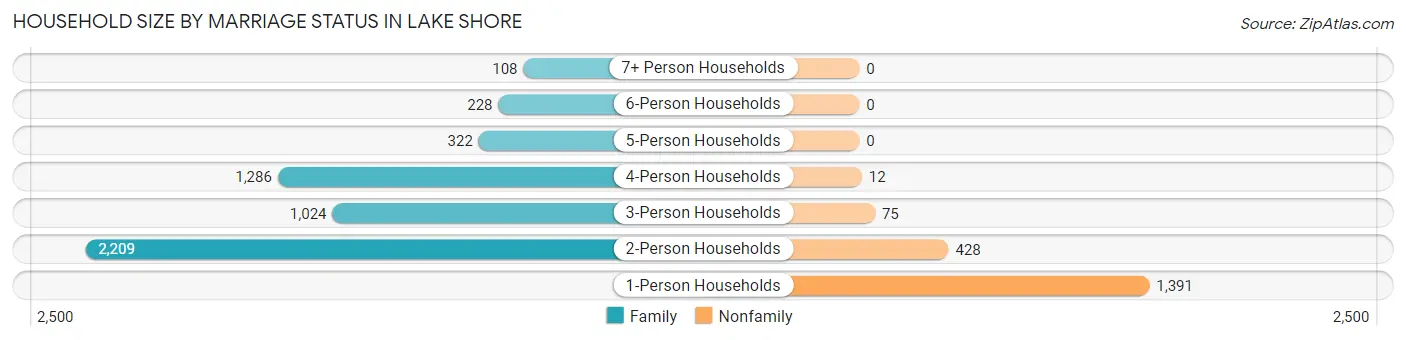
| Household Size | Family Households | Nonfamily Households |
| 1-Person Households | - | 1,391 (19.6%) |
| 2-Person Households | 2,209 (31.2%) | 428 (6.0%) |
| 3-Person Households | 1,024 (14.5%) | 75 (1.1%) |
| 4-Person Households | 1,286 (18.2%) | 12 (0.2%) |
| 5-Person Households | 322 (4.5%) | 0 (0.0%) |
| 6-Person Households | 228 (3.2%) | 0 (0.0%) |
| 7+ Person Households | 108 (1.5%) | 0 (0.0%) |
| Total | 5,177 (73.1%) | 1,906 (26.9%) |
Female Fertility in Lake Shore
Fertility by Age in Lake Shore
Average fertility rate in Lake Shore is 34.0 births per 1,000 women. Women in the age bracket of 20 to 34 years have the highest fertility rate with 56.0 births per 1,000 women. Women in the age bracket of 20 to 34 years acount for 64.8% of all women with births.
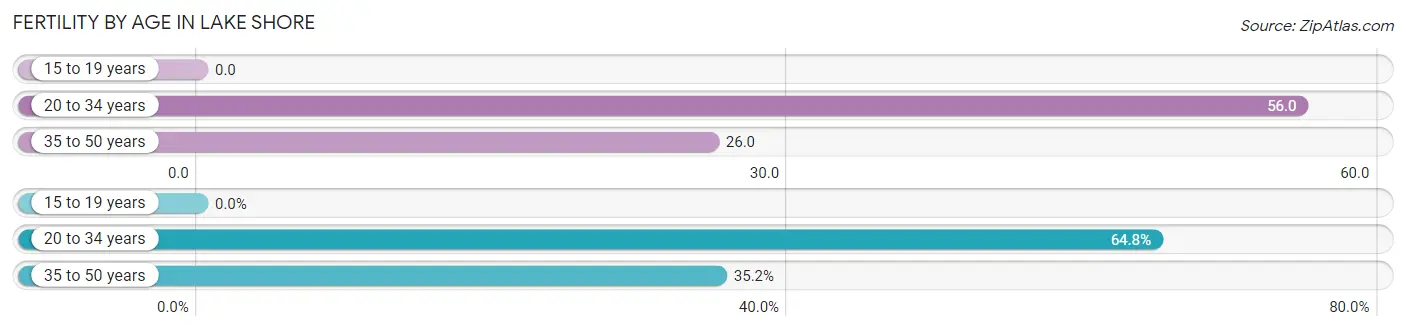
| Age Bracket | Women with Births | Births / 1,000 Women |
| 15 to 19 years | 0 (0.0%) | 0.0 |
| 20 to 34 years | 92 (64.8%) | 56.0 |
| 35 to 50 years | 50 (35.2%) | 26.0 |
| Total | 142 (100.0%) | 34.0 |
Fertility by Age by Marriage Status in Lake Shore
73.9% of women with births (142) in Lake Shore are married. The highest percentage of unmarried women with births falls into 35 to 50 years age bracket with 38.0% of them unmarried at the time of birth, while the lowest percentage of unmarried women with births belong to 20 to 34 years age bracket with 19.6% of them unmarried.
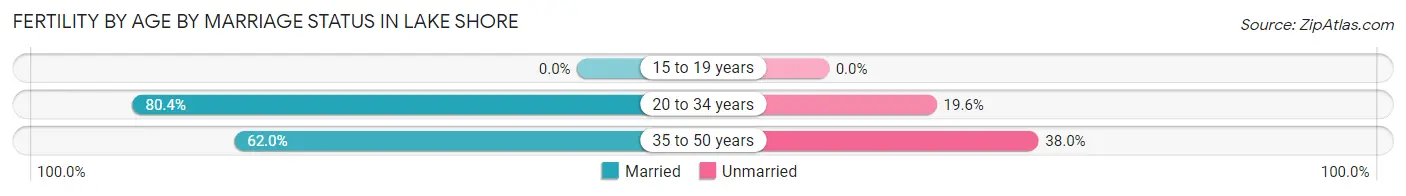
| Age Bracket | Married | Unmarried |
| 15 to 19 years | 0 (0.0%) | 0 (0.0%) |
| 20 to 34 years | 74 (80.4%) | 18 (19.6%) |
| 35 to 50 years | 31 (62.0%) | 19 (38.0%) |
| Total | 105 (73.9%) | 37 (26.1%) |
Fertility by Education in Lake Shore
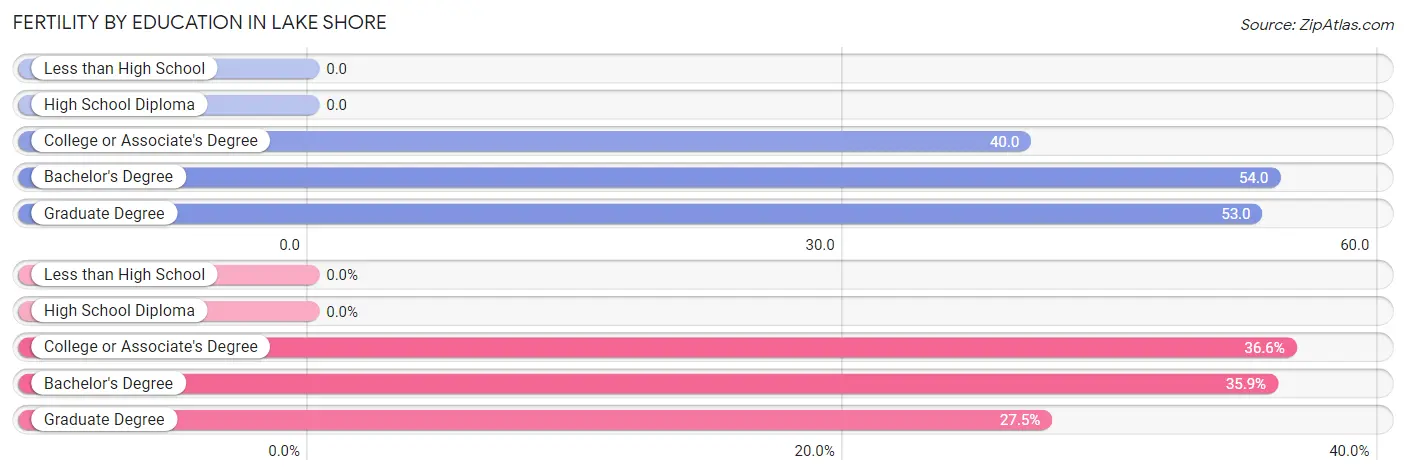
| Educational Attainment | Women with Births | Births / 1,000 Women |
| Less than High School | 0 (0.0%) | 0.0 |
| High School Diploma | 0 (0.0%) | 0.0 |
| College or Associate's Degree | 52 (36.6%) | 40.0 |
| Bachelor's Degree | 51 (35.9%) | 54.0 |
| Graduate Degree | 39 (27.5%) | 53.0 |
| Total | 142 (100.0%) | 34.0 |
Fertility by Education by Marriage Status in Lake Shore
26.1% of women with births in Lake Shore are unmarried. Women with the educational attainment of bachelor's degree are most likely to be married with 100.0% of them married at childbirth, while women with the educational attainment of graduate degree are least likely to be married with 46.2% of them unmarried at childbirth.
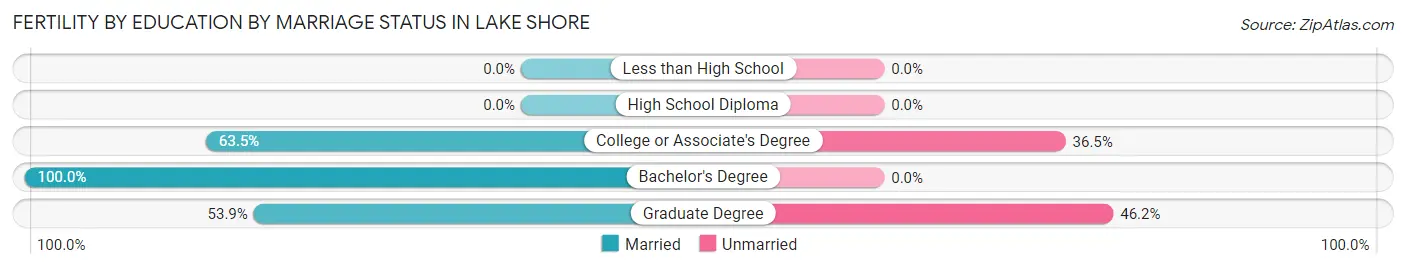
| Educational Attainment | Married | Unmarried |
| Less than High School | 0 (0.0%) | 0 (0.0%) |
| High School Diploma | 0 (0.0%) | 0 (0.0%) |
| College or Associate's Degree | 33 (63.5%) | 19 (36.5%) |
| Bachelor's Degree | 51 (100.0%) | 0 (0.0%) |
| Graduate Degree | 21 (53.8%) | 18 (46.2%) |
| Total | 105 (73.9%) | 37 (26.1%) |
Employment Characteristics in Lake Shore
Employment by Class of Employer in Lake Shore
Among the 10,012 employed individuals in Lake Shore, private company employees (6,089 | 60.8%), federal government employees (996 | 10.0%), and local government employees (952 | 9.5%) make up the most common classes of employment.
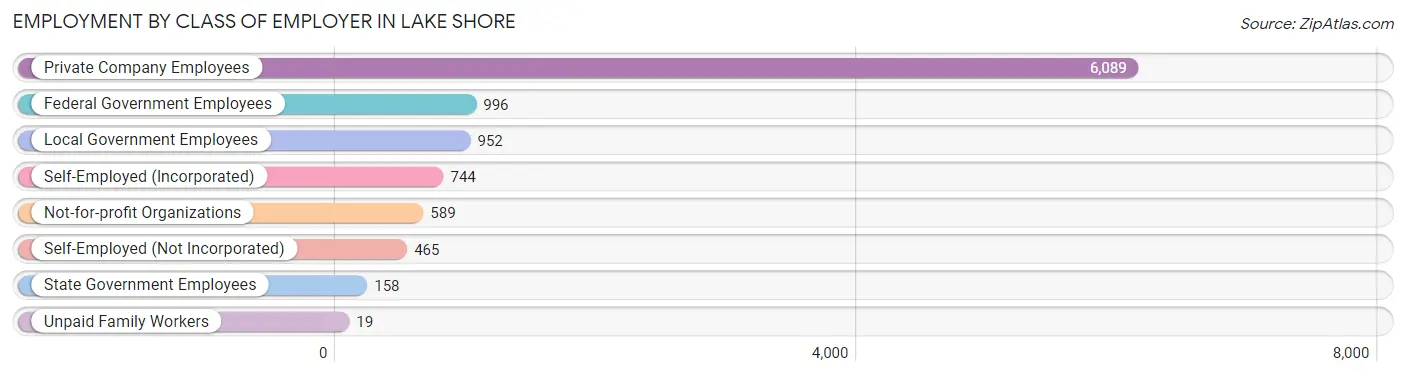
| Employer Class | # Employees | % Employees |
| Private Company Employees | 6,089 | 60.8% |
| Self-Employed (Incorporated) | 744 | 7.4% |
| Self-Employed (Not Incorporated) | 465 | 4.6% |
| Not-for-profit Organizations | 589 | 5.9% |
| Local Government Employees | 952 | 9.5% |
| State Government Employees | 158 | 1.6% |
| Federal Government Employees | 996 | 10.0% |
| Unpaid Family Workers | 19 | 0.2% |
| Total | 10,012 | 100.0% |
Employment Status by Age in Lake Shore
According to the labor force statistics for Lake Shore, out of the total population over 16 years of age (15,119), 69.6% or 10,523 individuals are in the labor force, with 4.0% or 421 of them unemployed. The age group with the highest labor force participation rate is 25 to 29 years, with 94.9% or 1,087 individuals in the labor force. Within the labor force, the 25 to 29 years age range has the highest percentage of unemployed individuals, with 11.7% or 127 of them being unemployed.
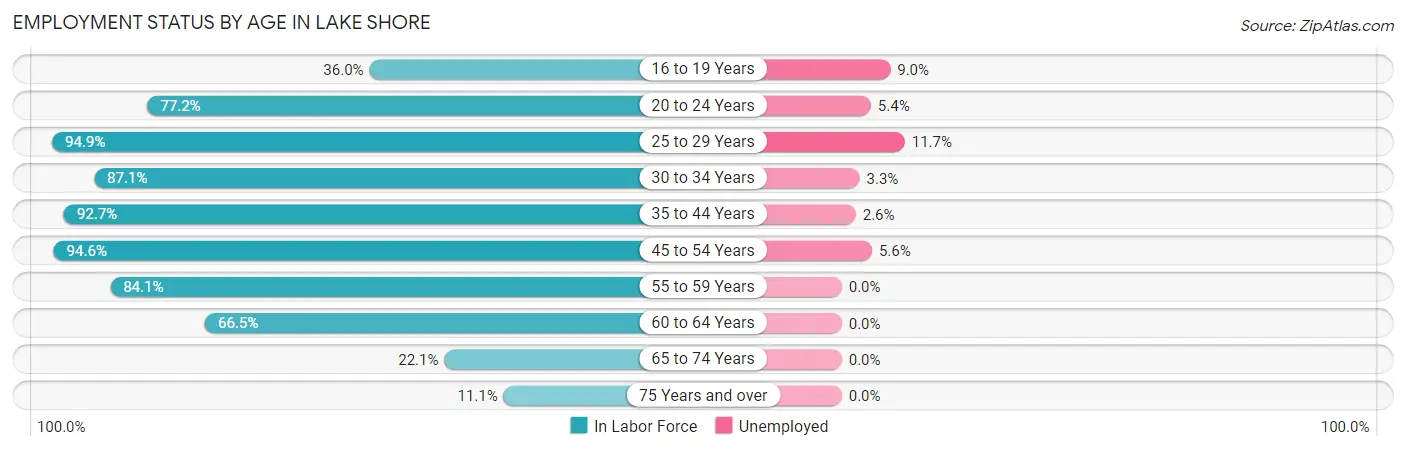
| Age Bracket | In Labor Force | Unemployed |
| 16 to 19 Years | 357 (36.0%) | 32 (9.0%) |
| 20 to 24 Years | 427 (77.2%) | 23 (5.4%) |
| 25 to 29 Years | 1,087 (94.9%) | 127 (11.7%) |
| 30 to 34 Years | 1,111 (87.1%) | 37 (3.3%) |
| 35 to 44 Years | 2,508 (92.7%) | 65 (2.6%) |
| 45 to 54 Years | 2,397 (94.6%) | 134 (5.6%) |
| 55 to 59 Years | 1,124 (84.1%) | 0 (0.0%) |
| 60 to 64 Years | 925 (66.5%) | 0 (0.0%) |
| 65 to 74 Years | 459 (22.1%) | 0 (0.0%) |
| 75 Years and over | 123 (11.1%) | 0 (0.0%) |
| Total | 10,523 (69.6%) | 421 (4.0%) |
Employment Status by Educational Attainment in Lake Shore
According to labor force statistics for Lake Shore, 88.1% of individuals (9,153) out of the total population between 25 and 64 years of age (10,389) are in the labor force, with 4.0% or 366 of them being unemployed. The group with the highest labor force participation rate are those with the educational attainment of bachelor's degree or higher, with 91.8% or 3,637 individuals in the labor force. Within the labor force, individuals with less than high school education have the highest percentage of unemployment, with 47.4% or 156 of them being unemployed.
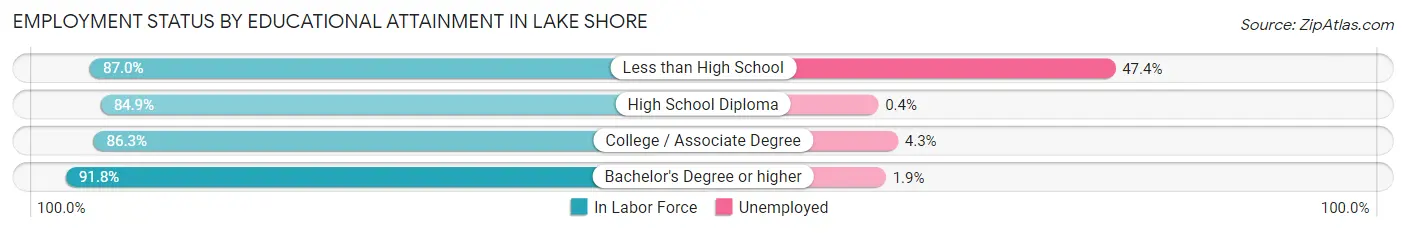
| Educational Attainment | In Labor Force | Unemployed |
| Less than High School | 329 (87.0%) | 179 (47.4%) |
| High School Diploma | 2,201 (84.9%) | 10 (0.4%) |
| College / Associate Degree | 2,983 (86.3%) | 149 (4.3%) |
| Bachelor's Degree or higher | 3,637 (91.8%) | 75 (1.9%) |
| Total | 9,153 (88.1%) | 416 (4.0%) |
Employment Occupations by Sex in Lake Shore
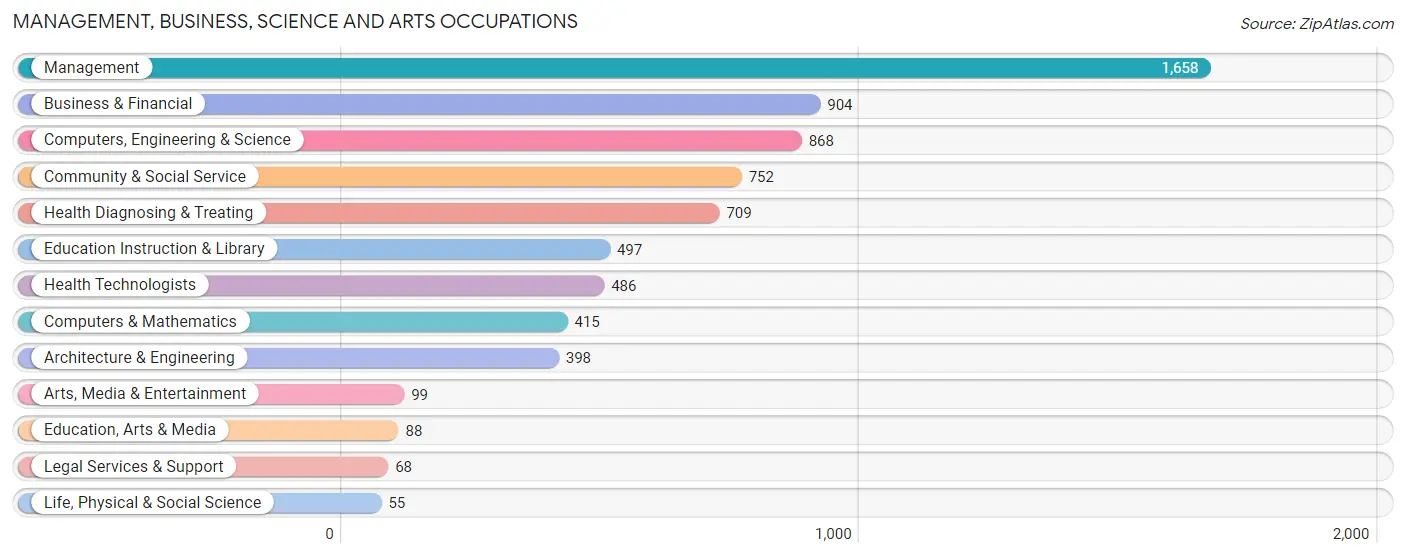
Management, Business, Science and Arts Occupations
The most common Management, Business, Science and Arts occupations in Lake Shore are Management (1,658 | 16.6%), Business & Financial (904 | 9.0%), Computers, Engineering & Science (868 | 8.7%), Community & Social Service (752 | 7.5%), and Health Diagnosing & Treating (709 | 7.1%).
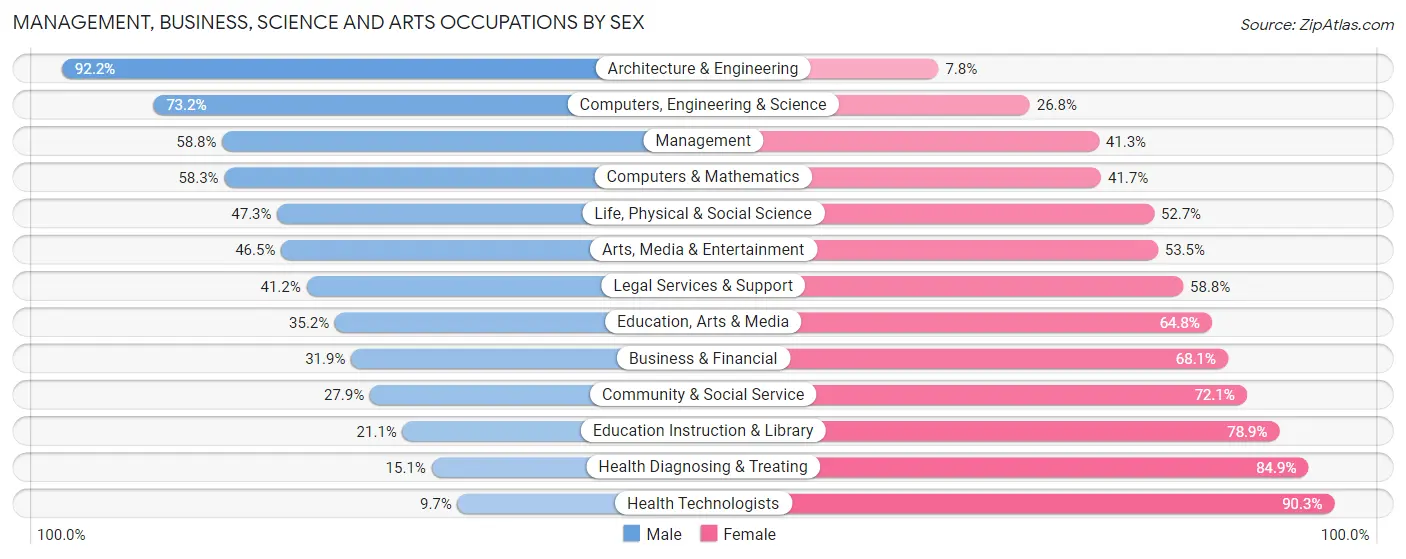
Management, Business, Science and Arts Occupations by Sex
Within the Management, Business, Science and Arts occupations in Lake Shore, the most male-oriented occupations are Architecture & Engineering (92.2%), Computers, Engineering & Science (73.2%), and Management (58.8%), while the most female-oriented occupations are Health Technologists (90.3%), Health Diagnosing & Treating (84.9%), and Education Instruction & Library (78.9%).
| Occupation | Male | Female |
| Management | 974 (58.8%) | 684 (41.2%) |
| Business & Financial | 288 (31.9%) | 616 (68.1%) |
| Computers, Engineering & Science | 635 (73.2%) | 233 (26.8%) |
| Computers & Mathematics | 242 (58.3%) | 173 (41.7%) |
| Architecture & Engineering | 367 (92.2%) | 31 (7.8%) |
| Life, Physical & Social Science | 26 (47.3%) | 29 (52.7%) |
| Community & Social Service | 210 (27.9%) | 542 (72.1%) |
| Education, Arts & Media | 31 (35.2%) | 57 (64.8%) |
| Legal Services & Support | 28 (41.2%) | 40 (58.8%) |
| Education Instruction & Library | 105 (21.1%) | 392 (78.9%) |
| Arts, Media & Entertainment | 46 (46.5%) | 53 (53.5%) |
| Health Diagnosing & Treating | 107 (15.1%) | 602 (84.9%) |
| Health Technologists | 47 (9.7%) | 439 (90.3%) |
| Total (Category) | 2,214 (45.3%) | 2,677 (54.7%) |
| Total (Overall) | 5,230 (52.4%) | 4,759 (47.6%) |
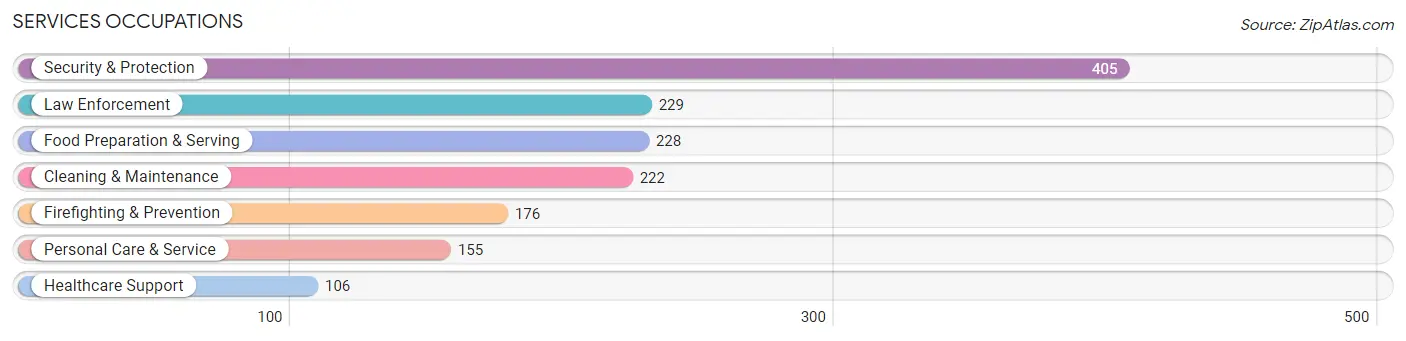
Services Occupations
The most common Services occupations in Lake Shore are Security & Protection (405 | 4.1%), Law Enforcement (229 | 2.3%), Food Preparation & Serving (228 | 2.3%), Cleaning & Maintenance (222 | 2.2%), and Firefighting & Prevention (176 | 1.8%).
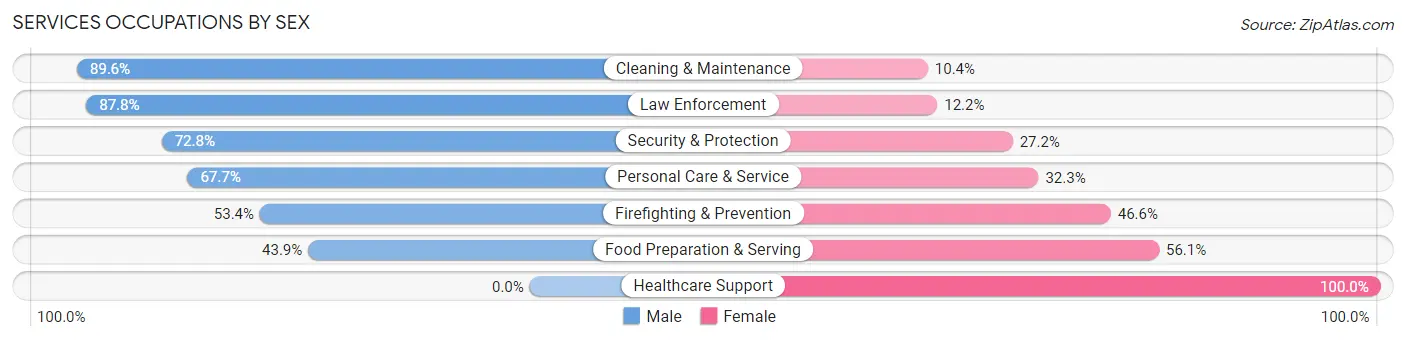
Services Occupations by Sex
Within the Services occupations in Lake Shore, the most male-oriented occupations are Cleaning & Maintenance (89.6%), Law Enforcement (87.8%), and Security & Protection (72.8%), while the most female-oriented occupations are Healthcare Support (100.0%), Food Preparation & Serving (56.1%), and Firefighting & Prevention (46.6%).
| Occupation | Male | Female |
| Healthcare Support | 0 (0.0%) | 106 (100.0%) |
| Security & Protection | 295 (72.8%) | 110 (27.2%) |
| Firefighting & Prevention | 94 (53.4%) | 82 (46.6%) |
| Law Enforcement | 201 (87.8%) | 28 (12.2%) |
| Food Preparation & Serving | 100 (43.9%) | 128 (56.1%) |
| Cleaning & Maintenance | 199 (89.6%) | 23 (10.4%) |
| Personal Care & Service | 105 (67.7%) | 50 (32.3%) |
| Total (Category) | 699 (62.6%) | 417 (37.4%) |
| Total (Overall) | 5,230 (52.4%) | 4,759 (47.6%) |
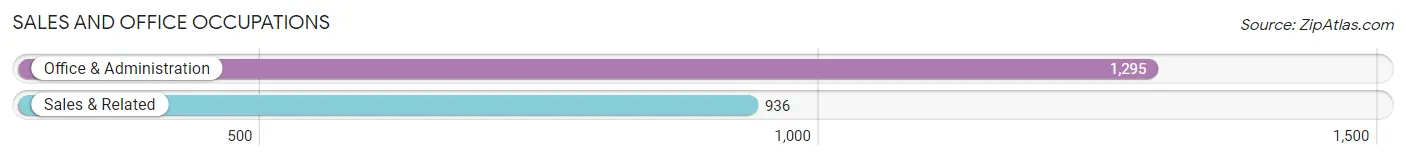
Sales and Office Occupations
The most common Sales and Office occupations in Lake Shore are Office & Administration (1,295 | 13.0%), and Sales & Related (936 | 9.4%).
Sales and Office Occupations by Sex
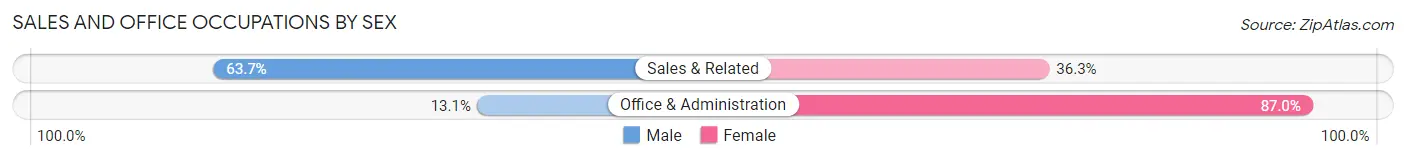
| Occupation | Male | Female |
| Sales & Related | 596 (63.7%) | 340 (36.3%) |
| Office & Administration | 169 (13.1%) | 1,126 (87.0%) |
| Total (Category) | 765 (34.3%) | 1,466 (65.7%) |
| Total (Overall) | 5,230 (52.4%) | 4,759 (47.6%) |
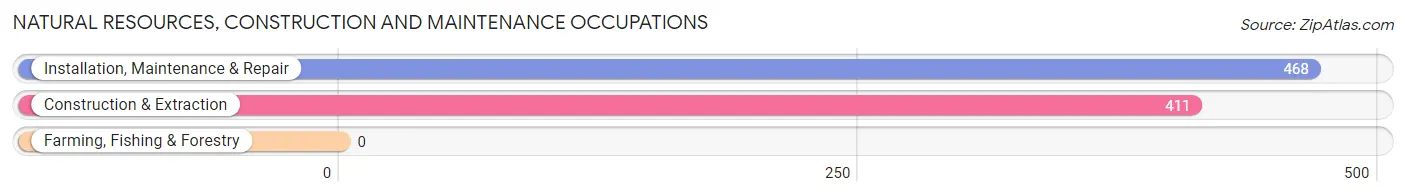
Natural Resources, Construction and Maintenance Occupations
The most common Natural Resources, Construction and Maintenance occupations in Lake Shore are Installation, Maintenance & Repair (468 | 4.7%), and Construction & Extraction (411 | 4.1%).
Natural Resources, Construction and Maintenance Occupations by Sex
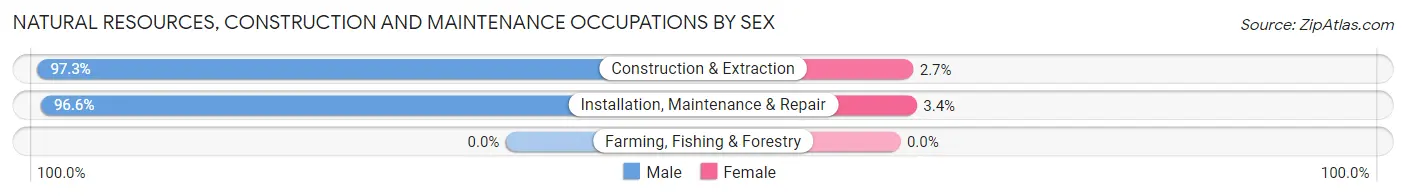
| Occupation | Male | Female |
| Farming, Fishing & Forestry | 0 (0.0%) | 0 (0.0%) |
| Construction & Extraction | 400 (97.3%) | 11 (2.7%) |
| Installation, Maintenance & Repair | 452 (96.6%) | 16 (3.4%) |
| Total (Category) | 852 (96.9%) | 27 (3.1%) |
| Total (Overall) | 5,230 (52.4%) | 4,759 (47.6%) |
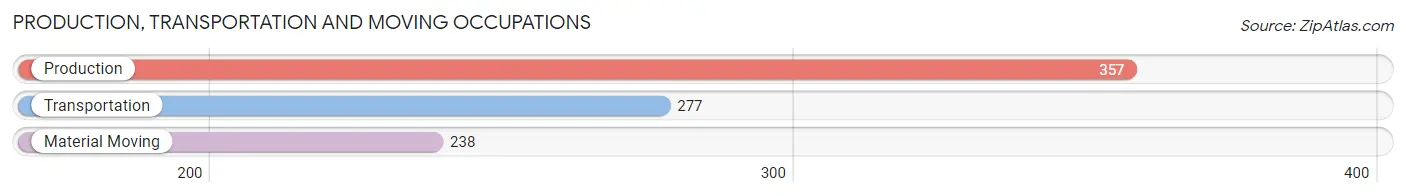
Production, Transportation and Moving Occupations
The most common Production, Transportation and Moving occupations in Lake Shore are Production (357 | 3.6%), Transportation (277 | 2.8%), and Material Moving (238 | 2.4%).
Production, Transportation and Moving Occupations by Sex
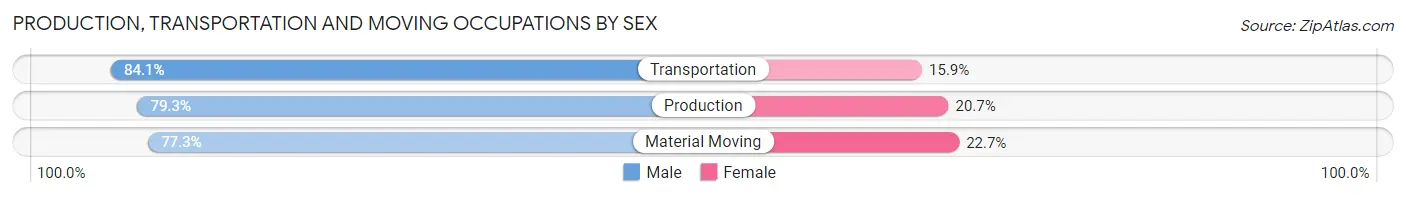
| Occupation | Male | Female |
| Production | 283 (79.3%) | 74 (20.7%) |
| Transportation | 233 (84.1%) | 44 (15.9%) |
| Material Moving | 184 (77.3%) | 54 (22.7%) |
| Total (Category) | 700 (80.3%) | 172 (19.7%) |
| Total (Overall) | 5,230 (52.4%) | 4,759 (47.6%) |
Employment Industries by Sex in Lake Shore
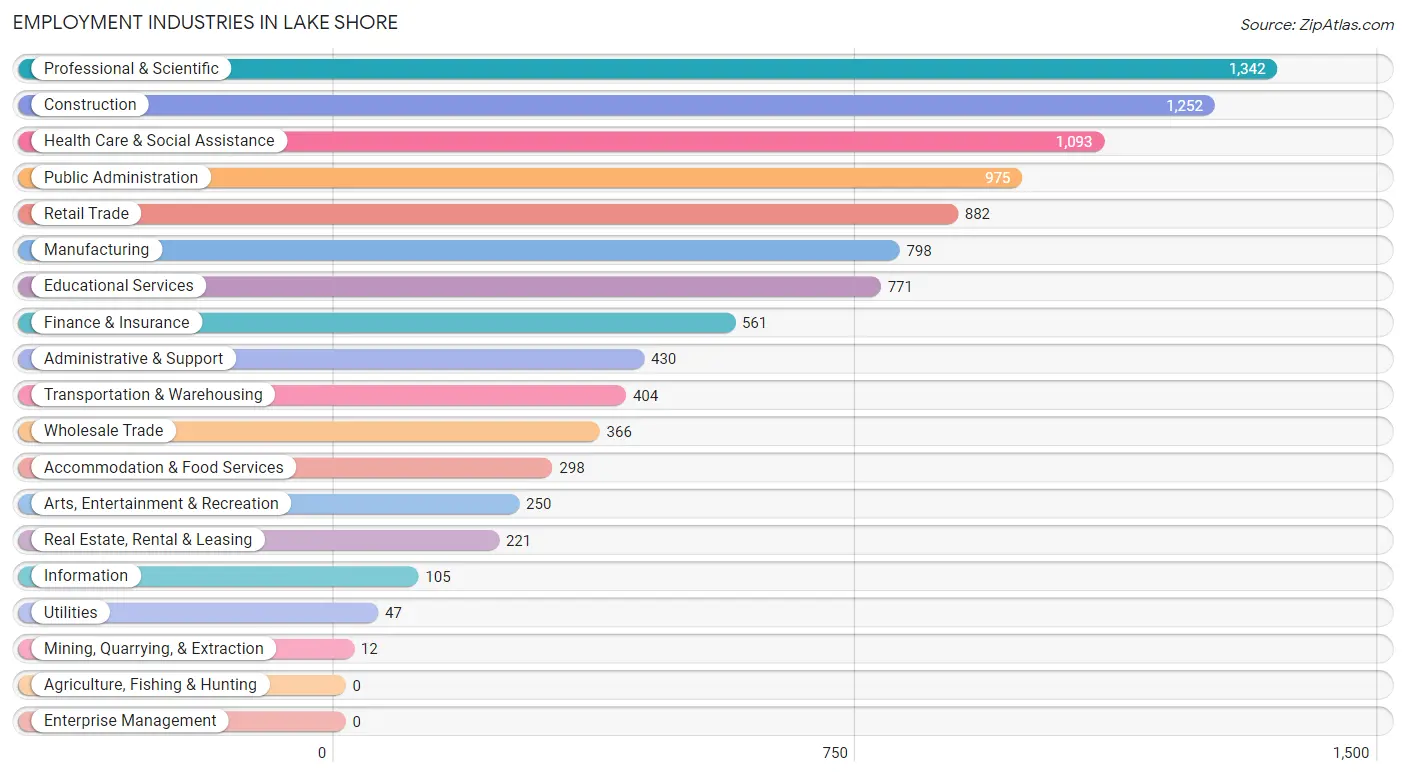
Employment Industries in Lake Shore
The major employment industries in Lake Shore include Professional & Scientific (1,342 | 13.4%), Construction (1,252 | 12.5%), Health Care & Social Assistance (1,093 | 10.9%), Public Administration (975 | 9.8%), and Retail Trade (882 | 8.8%).
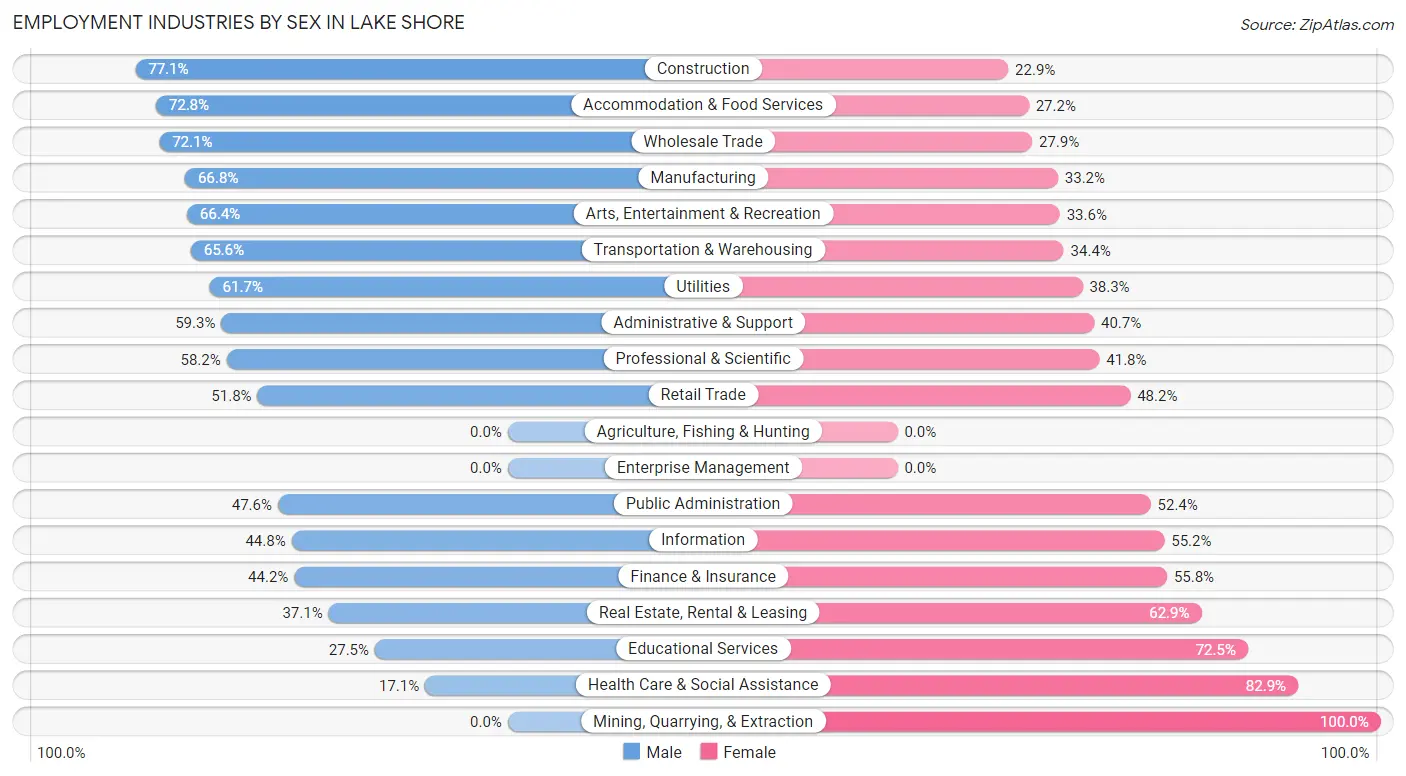
Employment Industries by Sex in Lake Shore
The Lake Shore industries that see more men than women are Construction (77.1%), Accommodation & Food Services (72.8%), and Wholesale Trade (72.1%), whereas the industries that tend to have a higher number of women are Mining, Quarrying, & Extraction (100.0%), Health Care & Social Assistance (82.9%), and Educational Services (72.5%).
| Industry | Male | Female |
| Agriculture, Fishing & Hunting | 0 (0.0%) | 0 (0.0%) |
| Mining, Quarrying, & Extraction | 0 (0.0%) | 12 (100.0%) |
| Construction | 965 (77.1%) | 287 (22.9%) |
| Manufacturing | 533 (66.8%) | 265 (33.2%) |
| Wholesale Trade | 264 (72.1%) | 102 (27.9%) |
| Retail Trade | 457 (51.8%) | 425 (48.2%) |
| Transportation & Warehousing | 265 (65.6%) | 139 (34.4%) |
| Utilities | 29 (61.7%) | 18 (38.3%) |
| Information | 47 (44.8%) | 58 (55.2%) |
| Finance & Insurance | 248 (44.2%) | 313 (55.8%) |
| Real Estate, Rental & Leasing | 82 (37.1%) | 139 (62.9%) |
| Professional & Scientific | 781 (58.2%) | 561 (41.8%) |
| Enterprise Management | 0 (0.0%) | 0 (0.0%) |
| Administrative & Support | 255 (59.3%) | 175 (40.7%) |
| Educational Services | 212 (27.5%) | 559 (72.5%) |
| Health Care & Social Assistance | 187 (17.1%) | 906 (82.9%) |
| Arts, Entertainment & Recreation | 166 (66.4%) | 84 (33.6%) |
| Accommodation & Food Services | 217 (72.8%) | 81 (27.2%) |
| Public Administration | 464 (47.6%) | 511 (52.4%) |
| Total | 5,230 (52.4%) | 4,759 (47.6%) |
Education in Lake Shore
School Enrollment in Lake Shore
The most common levels of schooling among the 4,491 students in Lake Shore are high school (1,079 | 24.0%), middle school (983 | 21.9%), and elementary school (928 | 20.7%).
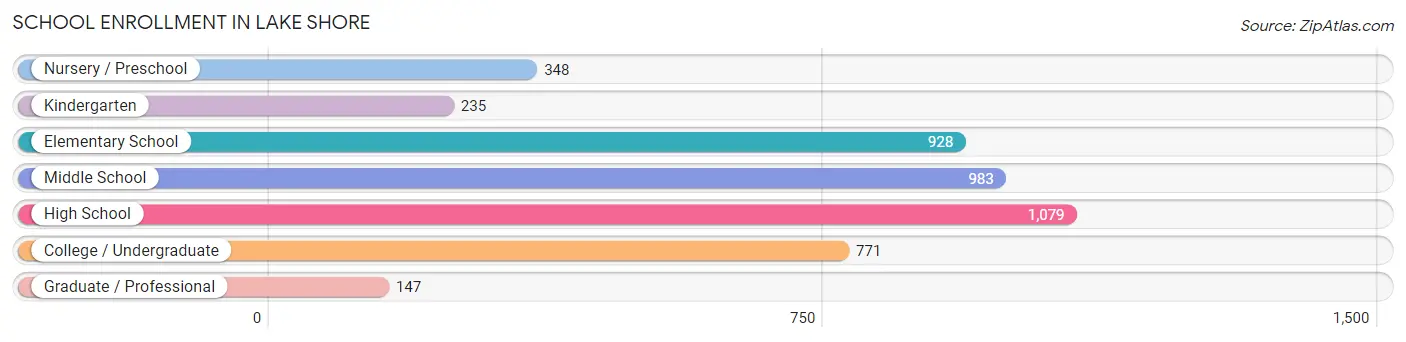
| School Level | # Students | % Students |
| Nursery / Preschool | 348 | 7.7% |
| Kindergarten | 235 | 5.2% |
| Elementary School | 928 | 20.7% |
| Middle School | 983 | 21.9% |
| High School | 1,079 | 24.0% |
| College / Undergraduate | 771 | 17.2% |
| Graduate / Professional | 147 | 3.3% |
| Total | 4,491 | 100.0% |
School Enrollment by Age by Funding Source in Lake Shore
Out of a total of 4,491 students who are enrolled in schools in Lake Shore, 701 (15.6%) attend a private institution, while the remaining 3,790 (84.4%) are enrolled in public schools. The age group of 3 to 4 year olds has the highest likelihood of being enrolled in private schools, with 198 (76.1% in the age bracket) enrolled. Conversely, the age group of 15 to 17 year olds has the lowest likelihood of being enrolled in a private school, with 870 (96.4% in the age bracket) attending a public institution.
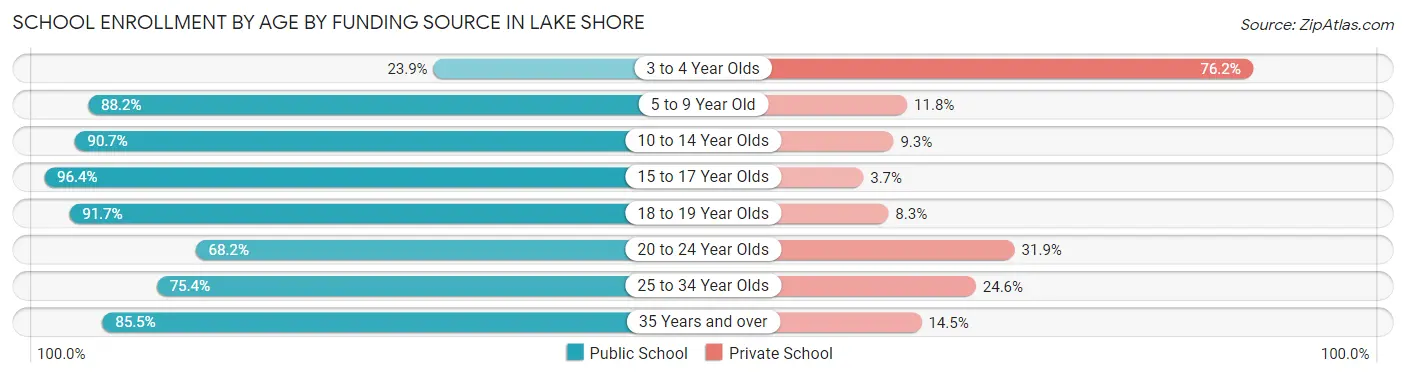
| Age Bracket | Public School | Private School |
| 3 to 4 Year Olds | 62 (23.8%) | 198 (76.1%) |
| 5 to 9 Year Old | 1,029 (88.2%) | 138 (11.8%) |
| 10 to 14 Year Olds | 1,017 (90.7%) | 104 (9.3%) |
| 15 to 17 Year Olds | 870 (96.4%) | 33 (3.6%) |
| 18 to 19 Year Olds | 198 (91.7%) | 18 (8.3%) |
| 20 to 24 Year Olds | 199 (68.1%) | 93 (31.9%) |
| 25 to 34 Year Olds | 297 (75.4%) | 97 (24.6%) |
| 35 Years and over | 118 (85.5%) | 20 (14.5%) |
| Total | 3,790 (84.4%) | 701 (15.6%) |
Educational Attainment by Field of Study in Lake Shore
Business (967 | 18.5%), science & technology (560 | 10.7%), social sciences (543 | 10.4%), education (537 | 10.3%), and bio, nature & agricultural (464 | 8.9%) are the most common fields of study among 5,222 individuals in Lake Shore who have obtained a bachelor's degree or higher.
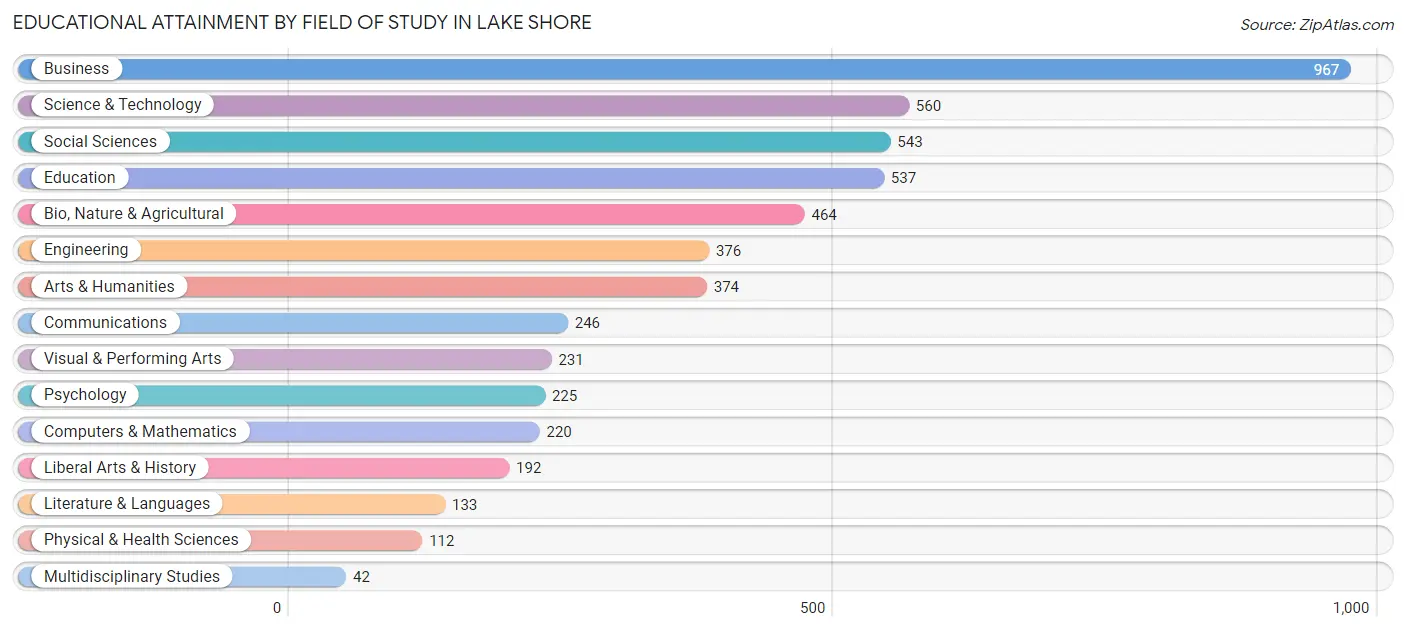
| Field of Study | # Graduates | % Graduates |
| Computers & Mathematics | 220 | 4.2% |
| Bio, Nature & Agricultural | 464 | 8.9% |
| Physical & Health Sciences | 112 | 2.1% |
| Psychology | 225 | 4.3% |
| Social Sciences | 543 | 10.4% |
| Engineering | 376 | 7.2% |
| Multidisciplinary Studies | 42 | 0.8% |
| Science & Technology | 560 | 10.7% |
| Business | 967 | 18.5% |
| Education | 537 | 10.3% |
| Literature & Languages | 133 | 2.5% |
| Liberal Arts & History | 192 | 3.7% |
| Visual & Performing Arts | 231 | 4.4% |
| Communications | 246 | 4.7% |
| Arts & Humanities | 374 | 7.2% |
| Total | 5,222 | 100.0% |
Transportation & Commute in Lake Shore
Vehicle Availability by Sex in Lake Shore
The most prevalent vehicle ownership categories in Lake Shore are males with 3 vehicles (1,804, accounting for 34.3%) and females with 3 vehicles (1,640, making up 38.0%).
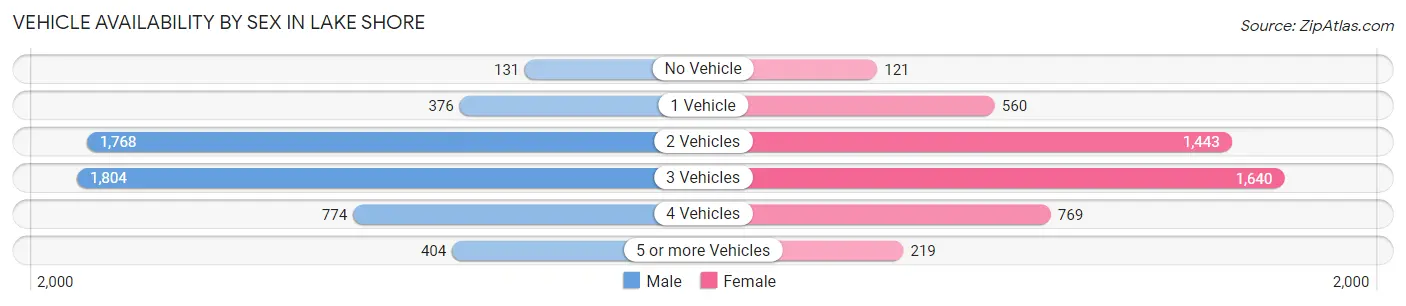
| Vehicles Available | Male | Female |
| No Vehicle | 131 (2.5%) | 121 (2.5%) |
| 1 Vehicle | 376 (7.1%) | 560 (11.8%) |
| 2 Vehicles | 1,768 (33.6%) | 1,443 (30.4%) |
| 3 Vehicles | 1,804 (34.3%) | 1,640 (34.5%) |
| 4 Vehicles | 774 (14.7%) | 769 (16.2%) |
| 5 or more Vehicles | 404 (7.7%) | 219 (4.6%) |
| Total | 5,257 (100.0%) | 4,752 (100.0%) |
Commute Time in Lake Shore
The most frequently occuring commute durations in Lake Shore are 20 to 24 minutes (1,374 commuters, 15.7%), 30 to 34 minutes (1,371 commuters, 15.6%), and 45 to 59 minutes (1,319 commuters, 15.0%).
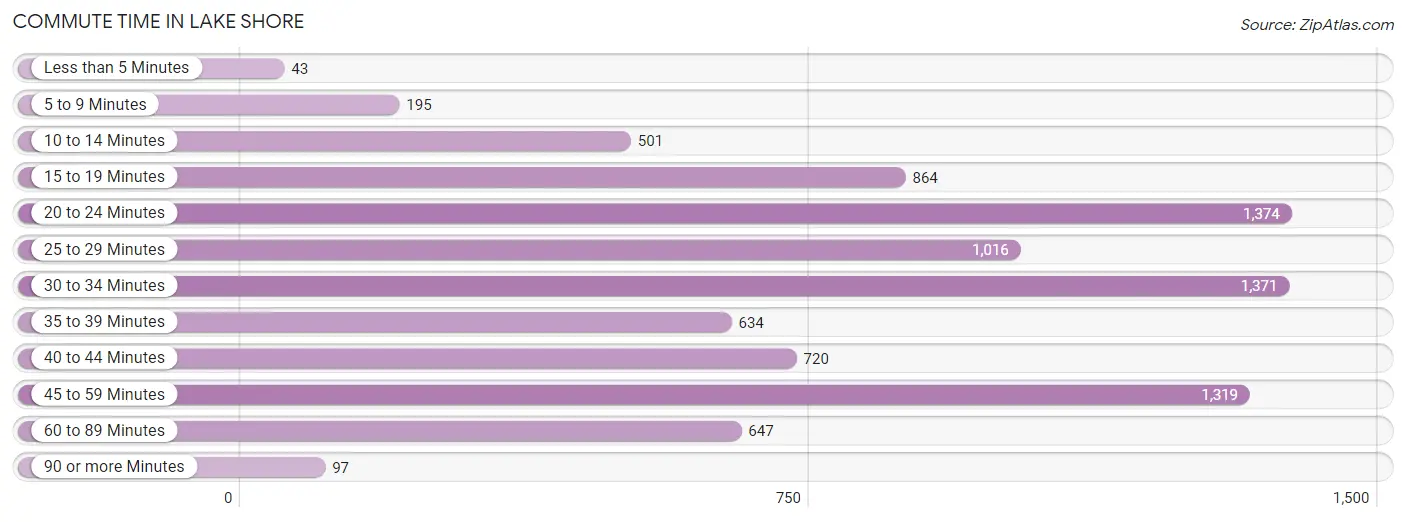
| Commute Time | # Commuters | % Commuters |
| Less than 5 Minutes | 43 | 0.5% |
| 5 to 9 Minutes | 195 | 2.2% |
| 10 to 14 Minutes | 501 | 5.7% |
| 15 to 19 Minutes | 864 | 9.8% |
| 20 to 24 Minutes | 1,374 | 15.7% |
| 25 to 29 Minutes | 1,016 | 11.6% |
| 30 to 34 Minutes | 1,371 | 15.6% |
| 35 to 39 Minutes | 634 | 7.2% |
| 40 to 44 Minutes | 720 | 8.2% |
| 45 to 59 Minutes | 1,319 | 15.0% |
| 60 to 89 Minutes | 647 | 7.4% |
| 90 or more Minutes | 97 | 1.1% |
Commute Time by Sex in Lake Shore
The most common commute times in Lake Shore are 30 to 34 minutes (897 commuters, 19.8%) for males and 45 to 59 minutes (802 commuters, 18.9%) for females.
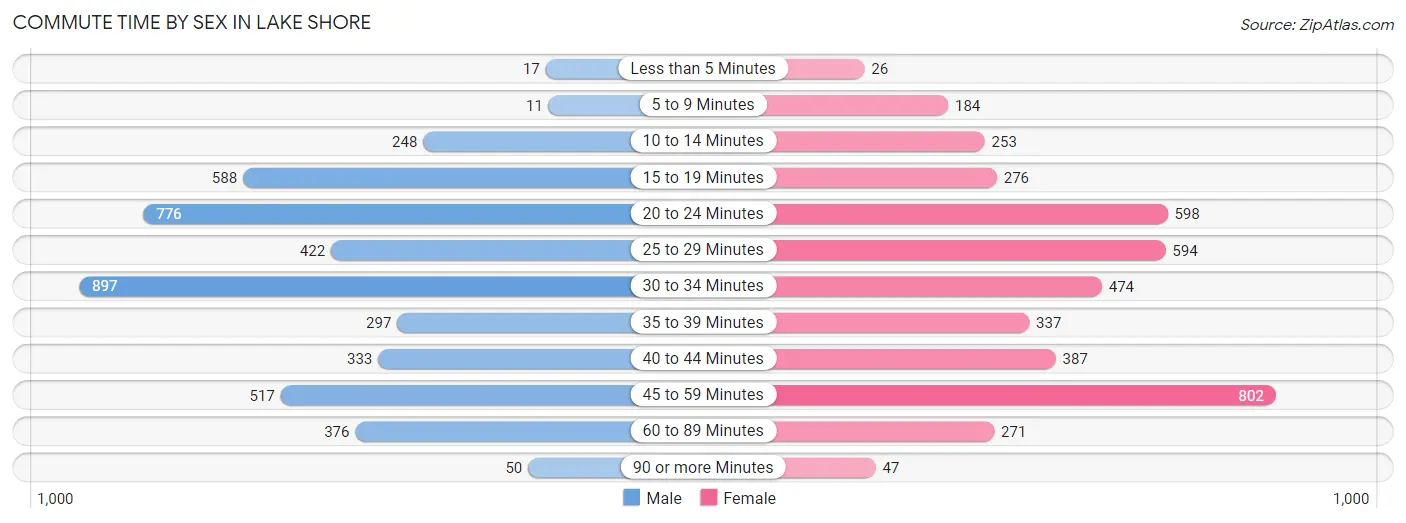
| Commute Time | Male | Female |
| Less than 5 Minutes | 17 (0.4%) | 26 (0.6%) |
| 5 to 9 Minutes | 11 (0.2%) | 184 (4.3%) |
| 10 to 14 Minutes | 248 (5.5%) | 253 (5.9%) |
| 15 to 19 Minutes | 588 (13.0%) | 276 (6.5%) |
| 20 to 24 Minutes | 776 (17.1%) | 598 (14.1%) |
| 25 to 29 Minutes | 422 (9.3%) | 594 (14.0%) |
| 30 to 34 Minutes | 897 (19.8%) | 474 (11.2%) |
| 35 to 39 Minutes | 297 (6.6%) | 337 (7.9%) |
| 40 to 44 Minutes | 333 (7.3%) | 387 (9.1%) |
| 45 to 59 Minutes | 517 (11.4%) | 802 (18.9%) |
| 60 to 89 Minutes | 376 (8.3%) | 271 (6.4%) |
| 90 or more Minutes | 50 (1.1%) | 47 (1.1%) |
Time of Departure to Work by Sex in Lake Shore
The most frequent times of departure to work in Lake Shore are 6:00 AM to 6:29 AM (518, 11.4%) for males and 8:00 AM to 8:29 AM (735, 17.3%) for females.
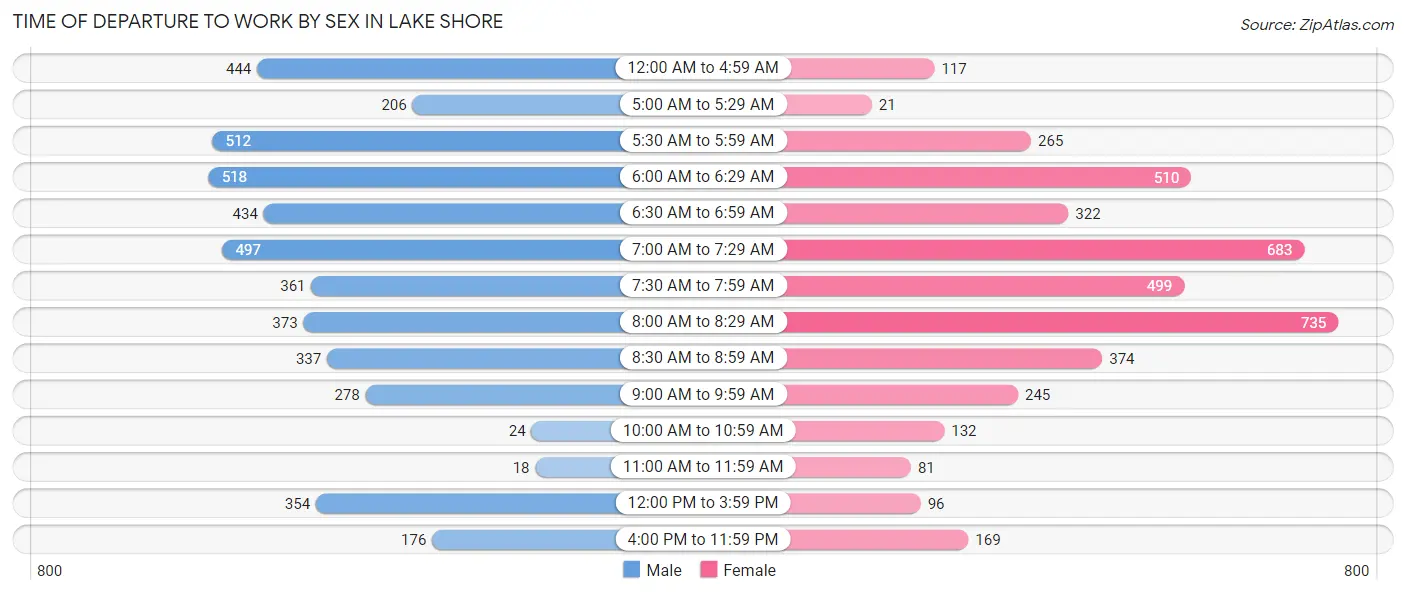
| Time of Departure | Male | Female |
| 12:00 AM to 4:59 AM | 444 (9.8%) | 117 (2.8%) |
| 5:00 AM to 5:29 AM | 206 (4.5%) | 21 (0.5%) |
| 5:30 AM to 5:59 AM | 512 (11.3%) | 265 (6.2%) |
| 6:00 AM to 6:29 AM | 518 (11.4%) | 510 (12.0%) |
| 6:30 AM to 6:59 AM | 434 (9.6%) | 322 (7.6%) |
| 7:00 AM to 7:29 AM | 497 (11.0%) | 683 (16.1%) |
| 7:30 AM to 7:59 AM | 361 (8.0%) | 499 (11.7%) |
| 8:00 AM to 8:29 AM | 373 (8.2%) | 735 (17.3%) |
| 8:30 AM to 8:59 AM | 337 (7.4%) | 374 (8.8%) |
| 9:00 AM to 9:59 AM | 278 (6.1%) | 245 (5.8%) |
| 10:00 AM to 10:59 AM | 24 (0.5%) | 132 (3.1%) |
| 11:00 AM to 11:59 AM | 18 (0.4%) | 81 (1.9%) |
| 12:00 PM to 3:59 PM | 354 (7.8%) | 96 (2.3%) |
| 4:00 PM to 11:59 PM | 176 (3.9%) | 169 (4.0%) |
| Total | 4,532 (100.0%) | 4,249 (100.0%) |
Housing Occupancy in Lake Shore
Occupancy by Ownership in Lake Shore
Of the total 7,083 dwellings in Lake Shore, owner-occupied units account for 6,358 (89.8%), while renter-occupied units make up 725 (10.2%).
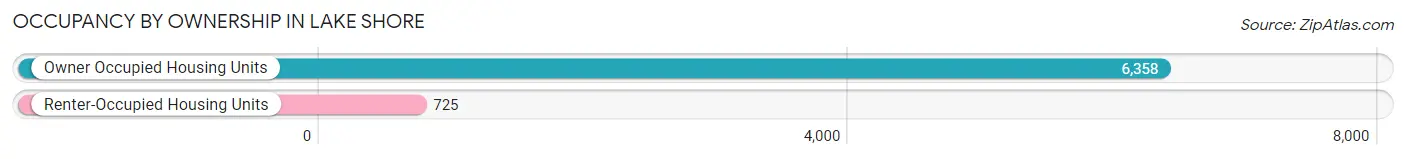
| Occupancy | # Housing Units | % Housing Units |
| Owner Occupied Housing Units | 6,358 | 89.8% |
| Renter-Occupied Housing Units | 725 | 10.2% |
| Total Occupied Housing Units | 7,083 | 100.0% |
Occupancy by Household Size in Lake Shore
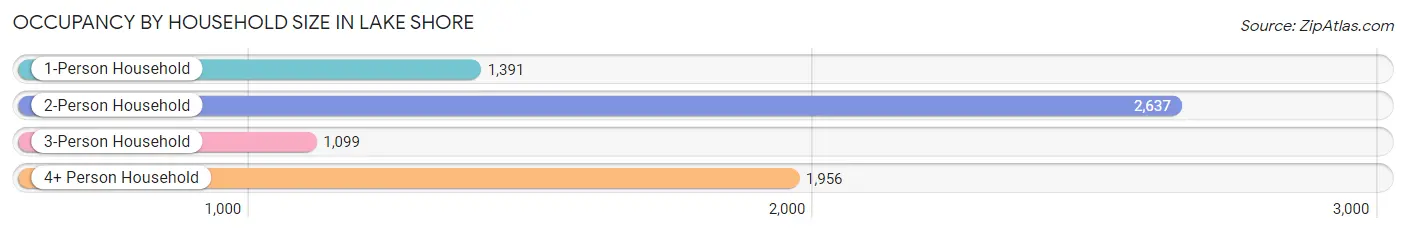
| Household Size | # Housing Units | % Housing Units |
| 1-Person Household | 1,391 | 19.6% |
| 2-Person Household | 2,637 | 37.2% |
| 3-Person Household | 1,099 | 15.5% |
| 4+ Person Household | 1,956 | 27.6% |
| Total Housing Units | 7,083 | 100.0% |
Occupancy by Ownership by Household Size in Lake Shore
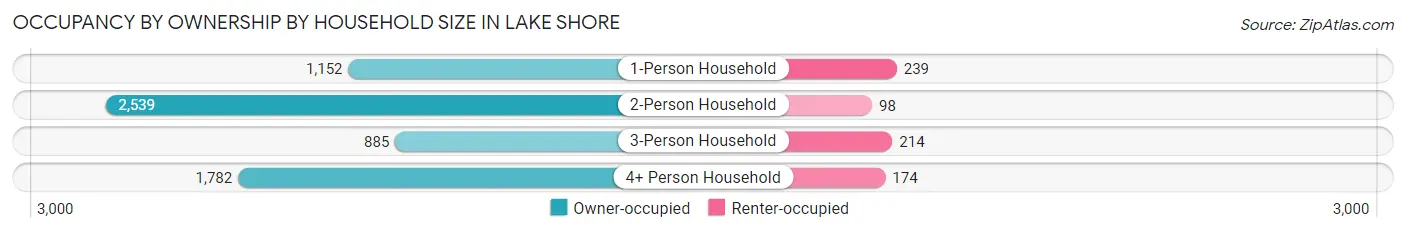
| Household Size | Owner-occupied | Renter-occupied |
| 1-Person Household | 1,152 (82.8%) | 239 (17.2%) |
| 2-Person Household | 2,539 (96.3%) | 98 (3.7%) |
| 3-Person Household | 885 (80.5%) | 214 (19.5%) |
| 4+ Person Household | 1,782 (91.1%) | 174 (8.9%) |
| Total Housing Units | 6,358 (89.8%) | 725 (10.2%) |
Occupancy by Educational Attainment in Lake Shore
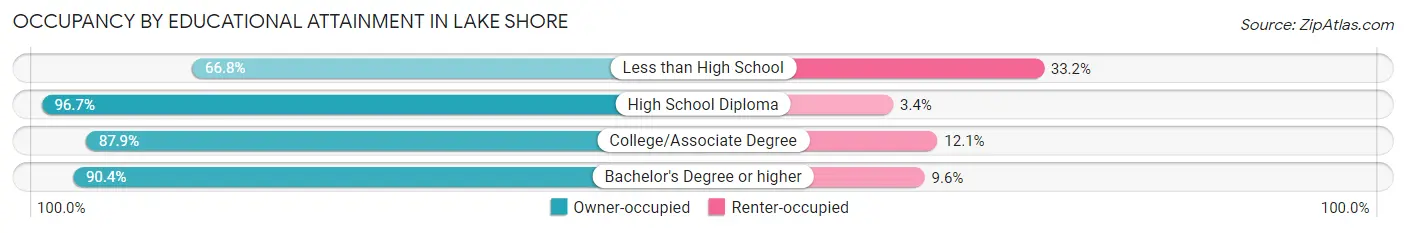
| Household Size | Owner-occupied | Renter-occupied |
| Less than High School | 217 (66.8%) | 108 (33.2%) |
| High School Diploma | 1,528 (96.7%) | 53 (3.4%) |
| College/Associate Degree | 2,324 (87.9%) | 321 (12.1%) |
| Bachelor's Degree or higher | 2,289 (90.4%) | 243 (9.6%) |
Occupancy by Age of Householder in Lake Shore
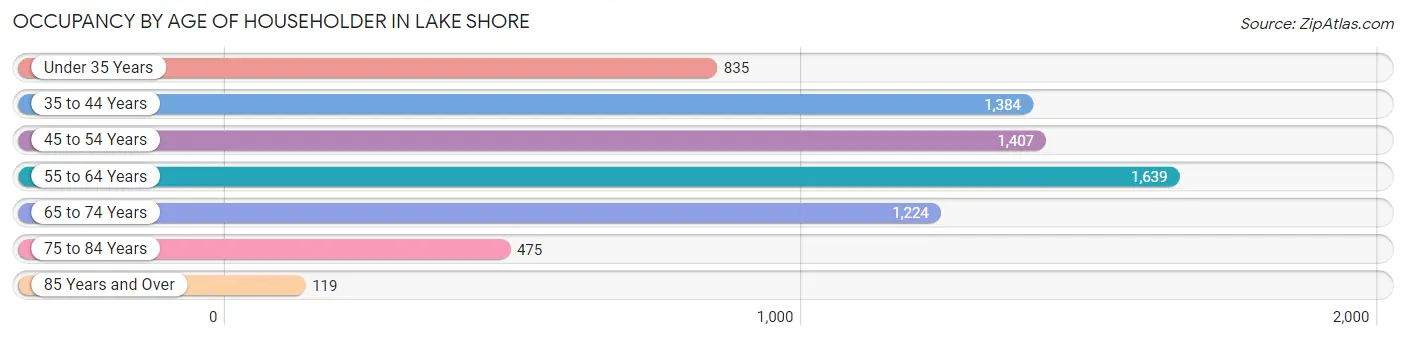
| Age Bracket | # Households | % Households |
| Under 35 Years | 835 | 11.8% |
| 35 to 44 Years | 1,384 | 19.5% |
| 45 to 54 Years | 1,407 | 19.9% |
| 55 to 64 Years | 1,639 | 23.1% |
| 65 to 74 Years | 1,224 | 17.3% |
| 75 to 84 Years | 475 | 6.7% |
| 85 Years and Over | 119 | 1.7% |
| Total | 7,083 | 100.0% |
Housing Finances in Lake Shore
Median Income by Occupancy in Lake Shore
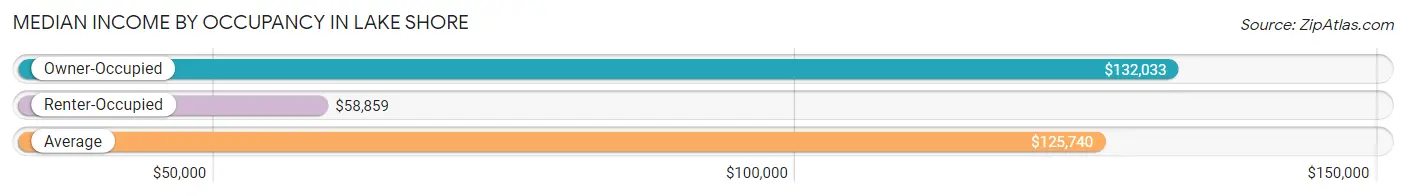
| Occupancy Type | # Households | Median Income |
| Owner-Occupied | 6,358 (89.8%) | $132,033 |
| Renter-Occupied | 725 (10.2%) | $58,859 |
| Average | 7,083 (100.0%) | $125,740 |
Occupancy by Householder Income Bracket in Lake Shore
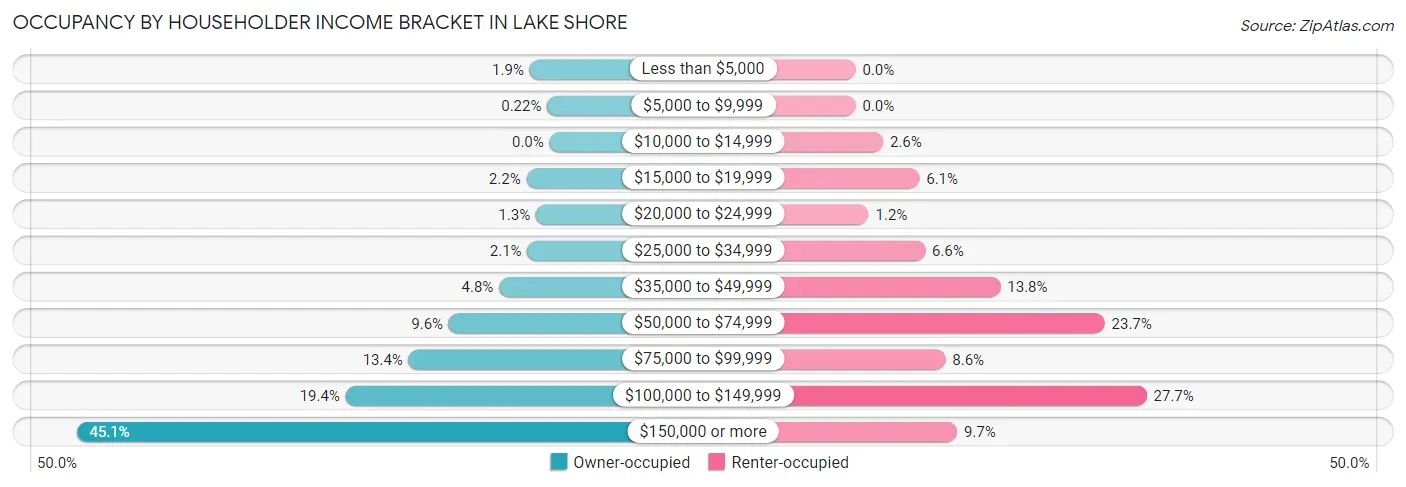
| Income Bracket | Owner-occupied | Renter-occupied |
| Less than $5,000 | 120 (1.9%) | 0 (0.0%) |
| $5,000 to $9,999 | 14 (0.2%) | 0 (0.0%) |
| $10,000 to $14,999 | 0 (0.0%) | 19 (2.6%) |
| $15,000 to $19,999 | 140 (2.2%) | 44 (6.1%) |
| $20,000 to $24,999 | 82 (1.3%) | 9 (1.2%) |
| $25,000 to $34,999 | 134 (2.1%) | 48 (6.6%) |
| $35,000 to $49,999 | 305 (4.8%) | 100 (13.8%) |
| $50,000 to $74,999 | 610 (9.6%) | 172 (23.7%) |
| $75,000 to $99,999 | 853 (13.4%) | 62 (8.6%) |
| $100,000 to $149,999 | 1,235 (19.4%) | 201 (27.7%) |
| $150,000 or more | 2,865 (45.1%) | 70 (9.7%) |
| Total | 6,358 (100.0%) | 725 (100.0%) |
Monthly Housing Cost Tiers in Lake Shore
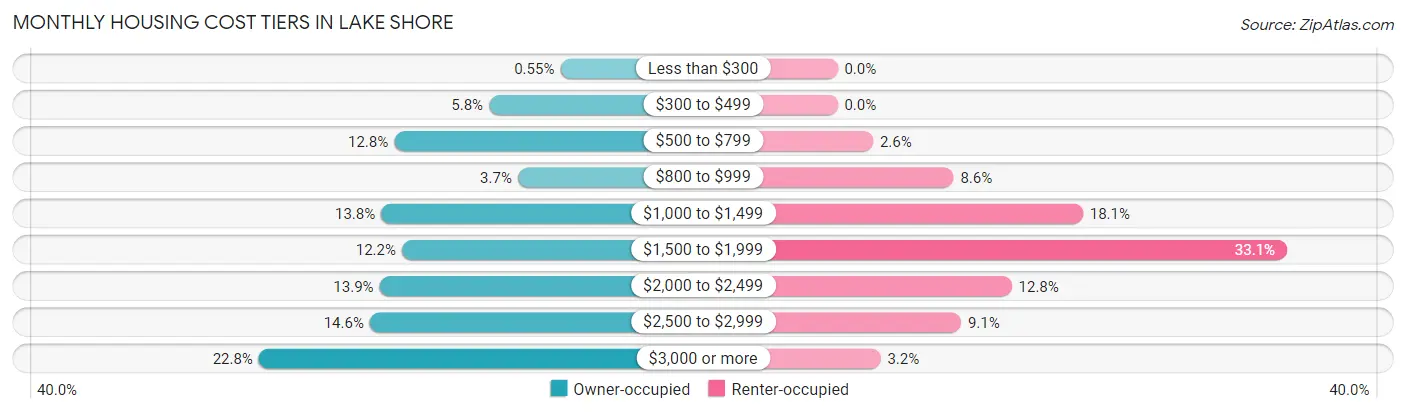
| Monthly Cost | Owner-occupied | Renter-occupied |
| Less than $300 | 35 (0.5%) | 0 (0.0%) |
| $300 to $499 | 369 (5.8%) | 0 (0.0%) |
| $500 to $799 | 813 (12.8%) | 19 (2.6%) |
| $800 to $999 | 234 (3.7%) | 62 (8.6%) |
| $1,000 to $1,499 | 874 (13.8%) | 131 (18.1%) |
| $1,500 to $1,999 | 777 (12.2%) | 240 (33.1%) |
| $2,000 to $2,499 | 882 (13.9%) | 93 (12.8%) |
| $2,500 to $2,999 | 927 (14.6%) | 66 (9.1%) |
| $3,000 or more | 1,447 (22.8%) | 23 (3.2%) |
| Total | 6,358 (100.0%) | 725 (100.0%) |
Physical Housing Characteristics in Lake Shore
Housing Structures in Lake Shore
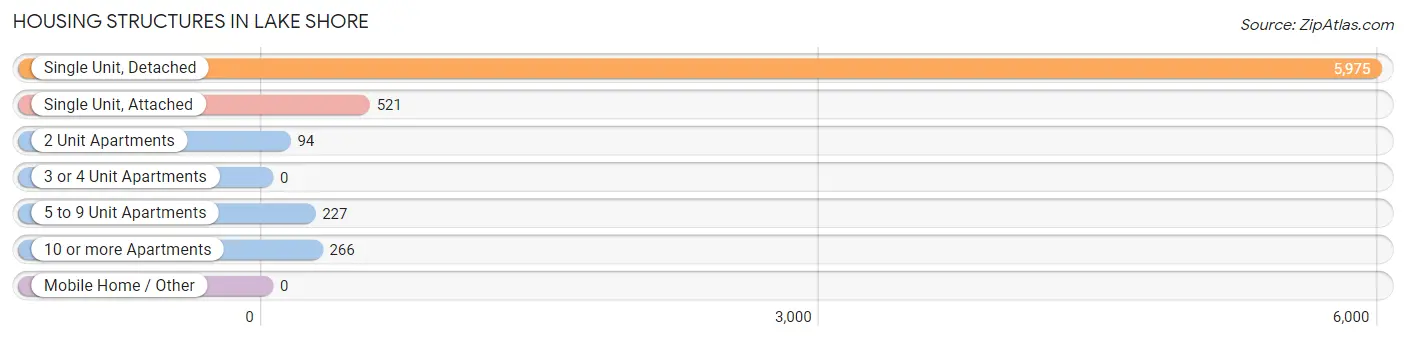
| Structure Type | # Housing Units | % Housing Units |
| Single Unit, Detached | 5,975 | 84.4% |
| Single Unit, Attached | 521 | 7.4% |
| 2 Unit Apartments | 94 | 1.3% |
| 3 or 4 Unit Apartments | 0 | 0.0% |
| 5 to 9 Unit Apartments | 227 | 3.2% |
| 10 or more Apartments | 266 | 3.8% |
| Mobile Home / Other | 0 | 0.0% |
| Total | 7,083 | 100.0% |
Housing Structures by Occupancy in Lake Shore
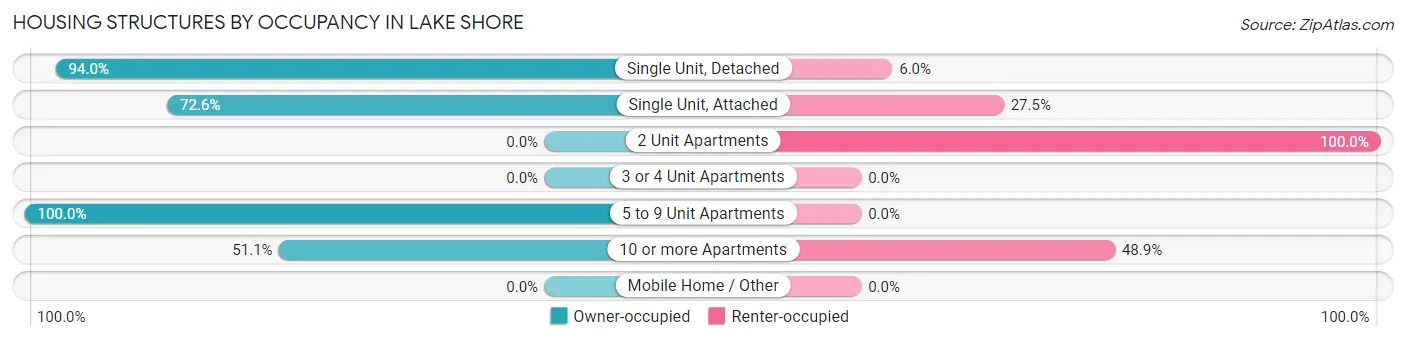
| Structure Type | Owner-occupied | Renter-occupied |
| Single Unit, Detached | 5,617 (94.0%) | 358 (6.0%) |
| Single Unit, Attached | 378 (72.6%) | 143 (27.5%) |
| 2 Unit Apartments | 0 (0.0%) | 94 (100.0%) |
| 3 or 4 Unit Apartments | 0 (0.0%) | 0 (0.0%) |
| 5 to 9 Unit Apartments | 227 (100.0%) | 0 (0.0%) |
| 10 or more Apartments | 136 (51.1%) | 130 (48.9%) |
| Mobile Home / Other | 0 (0.0%) | 0 (0.0%) |
| Total | 6,358 (89.8%) | 725 (10.2%) |
Housing Structures by Number of Rooms in Lake Shore
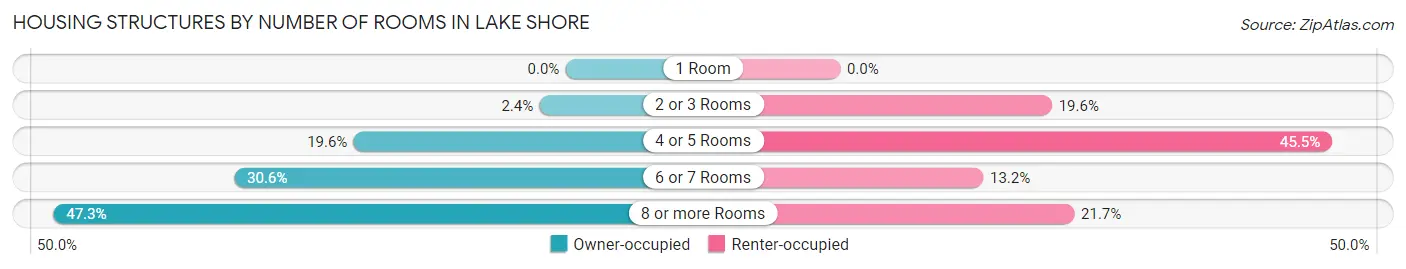
| Number of Rooms | Owner-occupied | Renter-occupied |
| 1 Room | 0 (0.0%) | 0 (0.0%) |
| 2 or 3 Rooms | 154 (2.4%) | 142 (19.6%) |
| 4 or 5 Rooms | 1,247 (19.6%) | 330 (45.5%) |
| 6 or 7 Rooms | 1,947 (30.6%) | 96 (13.2%) |
| 8 or more Rooms | 3,010 (47.3%) | 157 (21.7%) |
| Total | 6,358 (100.0%) | 725 (100.0%) |
Housing Structure by Heating Type in Lake Shore
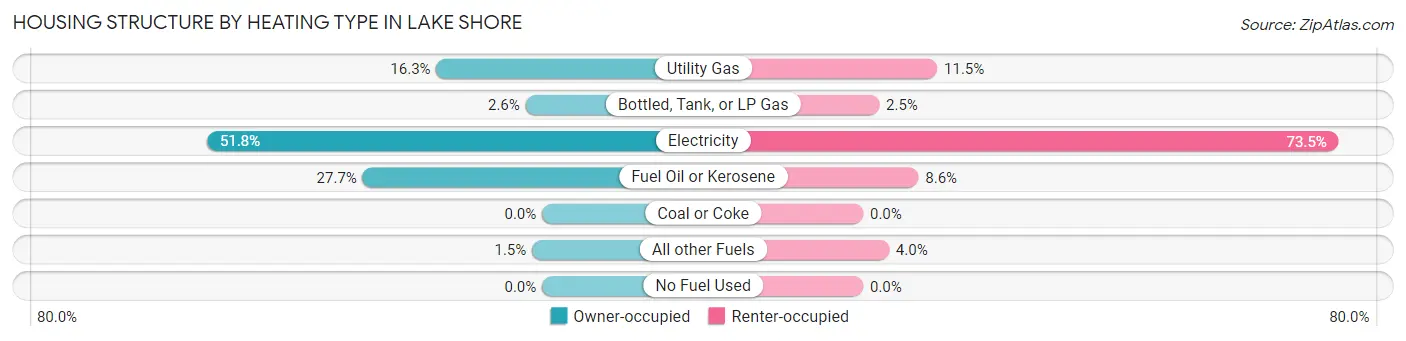
| Heating Type | Owner-occupied | Renter-occupied |
| Utility Gas | 1,039 (16.3%) | 83 (11.5%) |
| Bottled, Tank, or LP Gas | 162 (2.5%) | 18 (2.5%) |
| Electricity | 3,295 (51.8%) | 533 (73.5%) |
| Fuel Oil or Kerosene | 1,764 (27.7%) | 62 (8.6%) |
| Coal or Coke | 0 (0.0%) | 0 (0.0%) |
| All other Fuels | 98 (1.5%) | 29 (4.0%) |
| No Fuel Used | 0 (0.0%) | 0 (0.0%) |
| Total | 6,358 (100.0%) | 725 (100.0%) |
Household Vehicle Usage in Lake Shore
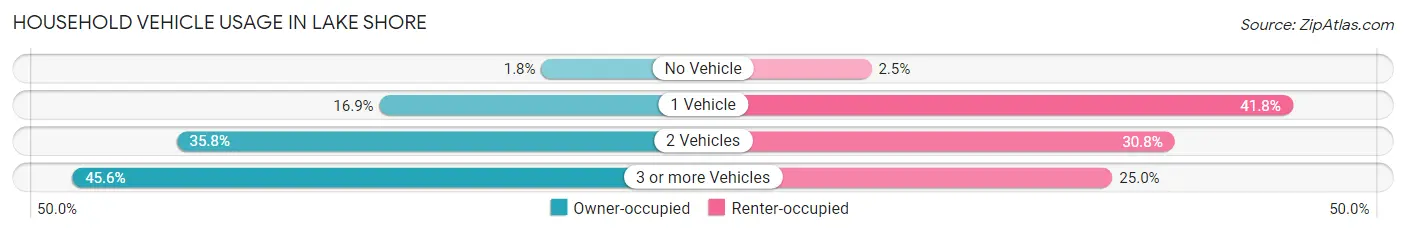
| Vehicles per Household | Owner-occupied | Renter-occupied |
| No Vehicle | 112 (1.8%) | 18 (2.5%) |
| 1 Vehicle | 1,073 (16.9%) | 303 (41.8%) |
| 2 Vehicles | 2,277 (35.8%) | 223 (30.8%) |
| 3 or more Vehicles | 2,896 (45.6%) | 181 (25.0%) |
| Total | 6,358 (100.0%) | 725 (100.0%) |
Real Estate & Mortgages in Lake Shore
Real Estate and Mortgage Overview in Lake Shore
| Characteristic | Without Mortgage | With Mortgage |
| Housing Units | 1,573 | 4,785 |
| Median Property Value | $443,700 | $465,000 |
| Median Household Income | $82,420 | $2,419 |
| Monthly Housing Costs | $636 | $1,447 |
| Real Estate Taxes | $3,561 | $34 |
Property Value by Mortgage Status in Lake Shore
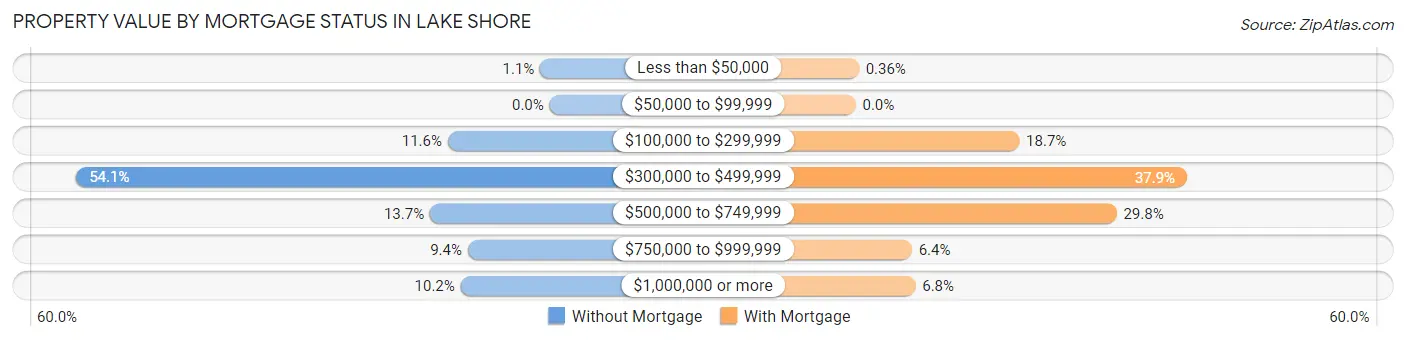
| Property Value | Without Mortgage | With Mortgage |
| Less than $50,000 | 17 (1.1%) | 17 (0.4%) |
| $50,000 to $99,999 | 0 (0.0%) | 0 (0.0%) |
| $100,000 to $299,999 | 183 (11.6%) | 895 (18.7%) |
| $300,000 to $499,999 | 851 (54.1%) | 1,812 (37.9%) |
| $500,000 to $749,999 | 215 (13.7%) | 1,427 (29.8%) |
| $750,000 to $999,999 | 147 (9.3%) | 307 (6.4%) |
| $1,000,000 or more | 160 (10.2%) | 327 (6.8%) |
| Total | 1,573 (100.0%) | 4,785 (100.0%) |
Household Income by Mortgage Status in Lake Shore
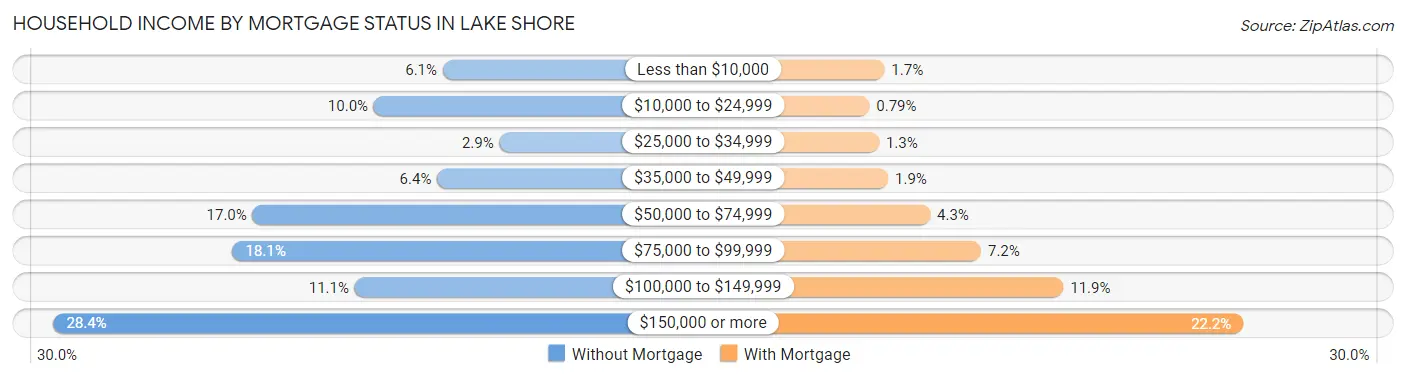
| Household Income | Without Mortgage | With Mortgage |
| Less than $10,000 | 96 (6.1%) | 79 (1.7%) |
| $10,000 to $24,999 | 158 (10.0%) | 38 (0.8%) |
| $25,000 to $34,999 | 45 (2.9%) | 64 (1.3%) |
| $35,000 to $49,999 | 101 (6.4%) | 89 (1.9%) |
| $50,000 to $74,999 | 267 (17.0%) | 204 (4.3%) |
| $75,000 to $99,999 | 285 (18.1%) | 343 (7.2%) |
| $100,000 to $149,999 | 175 (11.1%) | 568 (11.9%) |
| $150,000 or more | 446 (28.3%) | 1,060 (22.2%) |
| Total | 1,573 (100.0%) | 4,785 (100.0%) |
Property Value to Household Income Ratio in Lake Shore
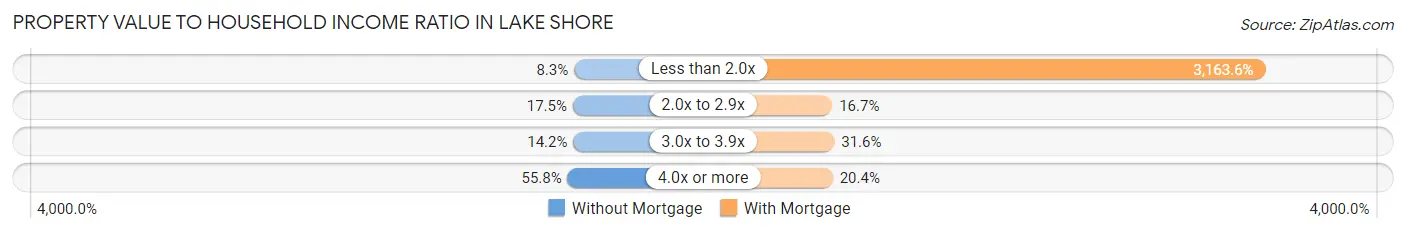
| Value-to-Income Ratio | Without Mortgage | With Mortgage |
| Less than 2.0x | 130 (8.3%) | 151,380 (3,163.6%) |
| 2.0x to 2.9x | 275 (17.5%) | 799 (16.7%) |
| 3.0x to 3.9x | 223 (14.2%) | 1,511 (31.6%) |
| 4.0x or more | 878 (55.8%) | 974 (20.4%) |
| Total | 1,573 (100.0%) | 4,785 (100.0%) |
Real Estate Taxes by Mortgage Status in Lake Shore
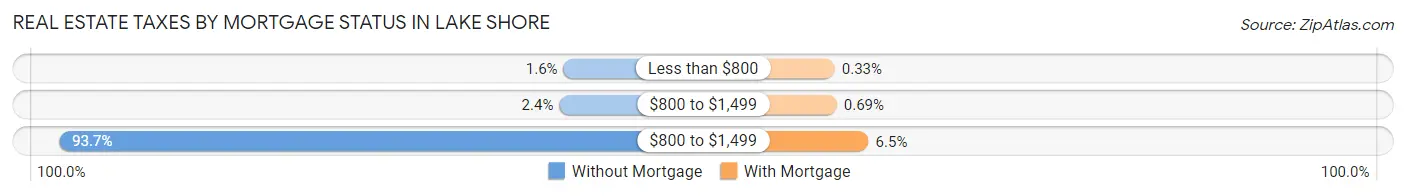
| Property Taxes | Without Mortgage | With Mortgage |
| Less than $800 | 25 (1.6%) | 16 (0.3%) |
| $800 to $1,499 | 37 (2.4%) | 33 (0.7%) |
| $800 to $1,499 | 1,474 (93.7%) | 311 (6.5%) |
| Total | 1,573 (100.0%) | 4,785 (100.0%) |
Health & Disability in Lake Shore
Health Insurance Coverage by Age in Lake Shore
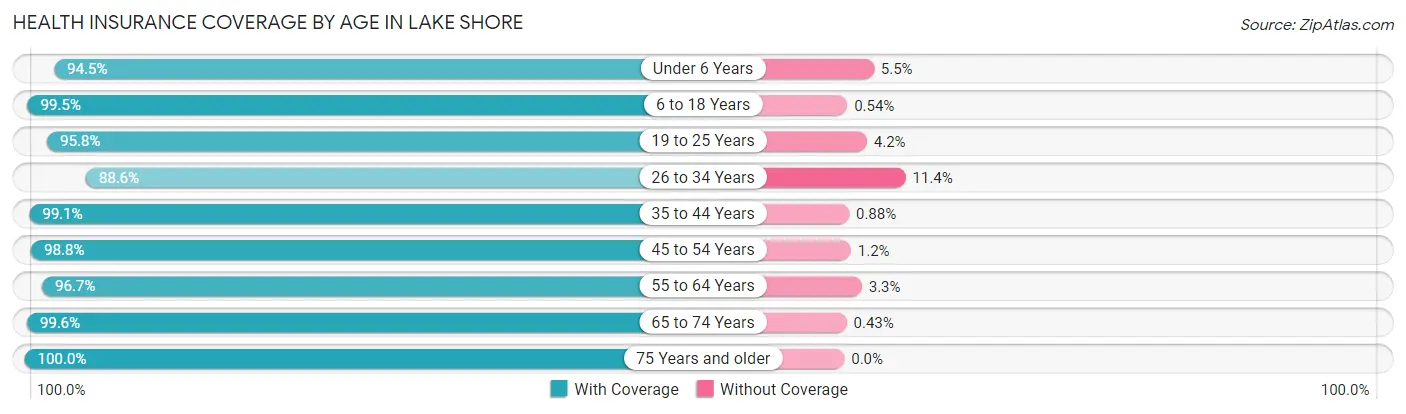
| Age Bracket | With Coverage | Without Coverage |
| Under 6 Years | 1,183 (94.5%) | 69 (5.5%) |
| 6 to 18 Years | 3,290 (99.5%) | 18 (0.5%) |
| 19 to 25 Years | 845 (95.8%) | 37 (4.2%) |
| 26 to 34 Years | 2,000 (88.6%) | 258 (11.4%) |
| 35 to 44 Years | 2,585 (99.1%) | 23 (0.9%) |
| 45 to 54 Years | 2,503 (98.8%) | 31 (1.2%) |
| 55 to 64 Years | 2,638 (96.7%) | 89 (3.3%) |
| 65 to 74 Years | 2,067 (99.6%) | 9 (0.4%) |
| 75 Years and older | 1,102 (100.0%) | 0 (0.0%) |
| Total | 18,213 (97.2%) | 534 (2.9%) |
Health Insurance Coverage by Citizenship Status in Lake Shore
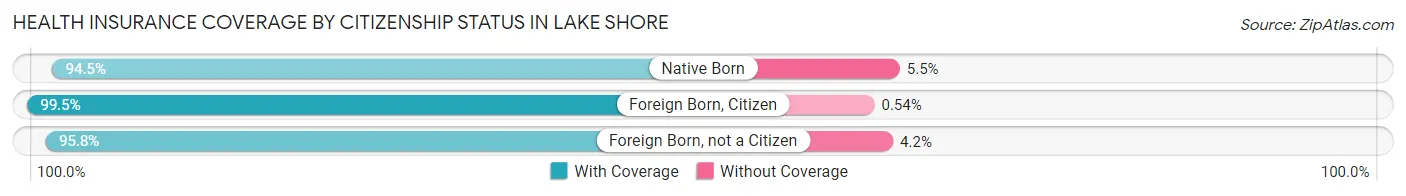
| Citizenship Status | With Coverage | Without Coverage |
| Native Born | 1,183 (94.5%) | 69 (5.5%) |
| Foreign Born, Citizen | 3,290 (99.5%) | 18 (0.5%) |
| Foreign Born, not a Citizen | 845 (95.8%) | 37 (4.2%) |
Health Insurance Coverage by Household Income in Lake Shore
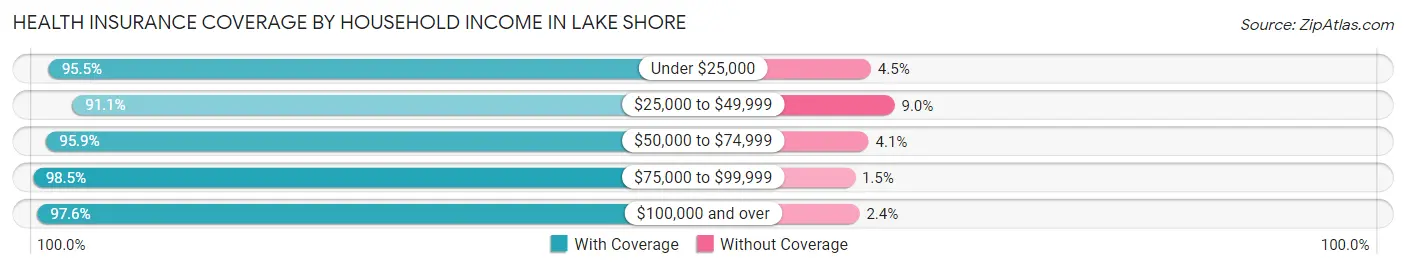
| Household Income | With Coverage | Without Coverage |
| Under $25,000 | 613 (95.5%) | 29 (4.5%) |
| $25,000 to $49,999 | 844 (91.0%) | 83 (8.9%) |
| $50,000 to $74,999 | 1,551 (95.9%) | 66 (4.1%) |
| $75,000 to $99,999 | 2,001 (98.5%) | 31 (1.5%) |
| $100,000 and over | 13,181 (97.6%) | 321 (2.4%) |
Public vs Private Health Insurance Coverage by Age in Lake Shore
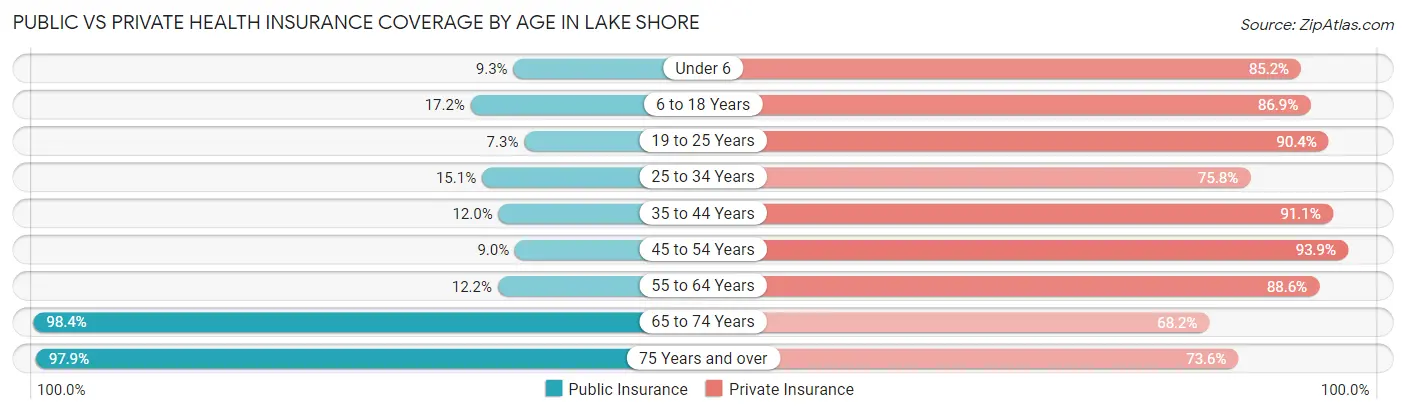
| Age Bracket | Public Insurance | Private Insurance |
| Under 6 | 116 (9.3%) | 1,067 (85.2%) |
| 6 to 18 Years | 569 (17.2%) | 2,875 (86.9%) |
| 19 to 25 Years | 64 (7.3%) | 797 (90.4%) |
| 25 to 34 Years | 341 (15.1%) | 1,711 (75.8%) |
| 35 to 44 Years | 314 (12.0%) | 2,375 (91.1%) |
| 45 to 54 Years | 227 (9.0%) | 2,380 (93.9%) |
| 55 to 64 Years | 332 (12.2%) | 2,415 (88.6%) |
| 65 to 74 Years | 2,042 (98.4%) | 1,416 (68.2%) |
| 75 Years and over | 1,079 (97.9%) | 811 (73.6%) |
| Total | 5,084 (27.1%) | 15,847 (84.5%) |
Disability Status by Sex by Age in Lake Shore
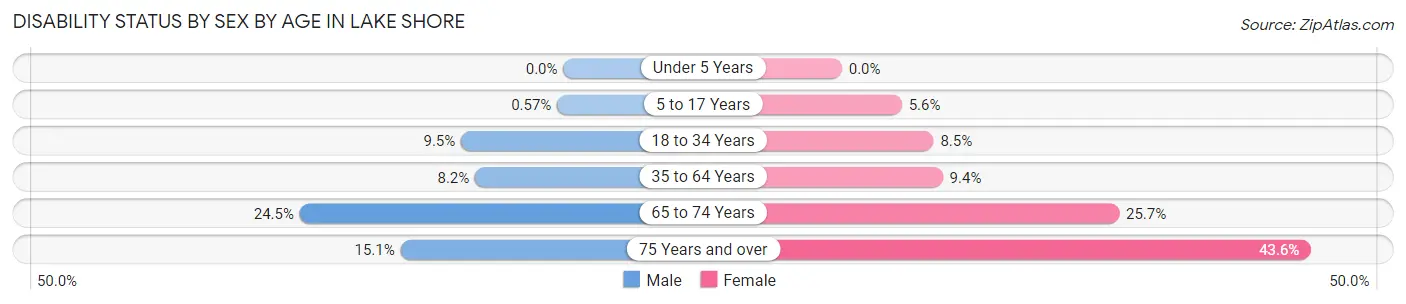
| Age Bracket | Male | Female |
| Under 5 Years | 0 (0.0%) | 0 (0.0%) |
| 5 to 17 Years | 9 (0.6%) | 98 (5.6%) |
| 18 to 34 Years | 146 (9.5%) | 151 (8.5%) |
| 35 to 64 Years | 332 (8.2%) | 357 (9.4%) |
| 65 to 74 Years | 274 (24.5%) | 246 (25.7%) |
| 75 Years and over | 68 (15.1%) | 284 (43.6%) |
Disability Class by Sex by Age in Lake Shore
Disability Class: Hearing Difficulty
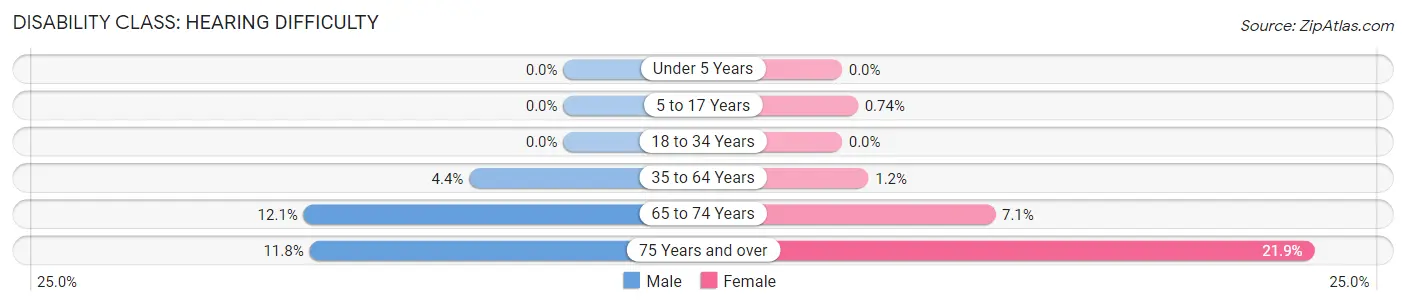
| Age Bracket | Male | Female |
| Under 5 Years | 0 (0.0%) | 0 (0.0%) |
| 5 to 17 Years | 0 (0.0%) | 13 (0.7%) |
| 18 to 34 Years | 0 (0.0%) | 0 (0.0%) |
| 35 to 64 Years | 177 (4.4%) | 47 (1.2%) |
| 65 to 74 Years | 135 (12.0%) | 68 (7.1%) |
| 75 Years and over | 53 (11.8%) | 143 (21.9%) |
Disability Class: Vision Difficulty
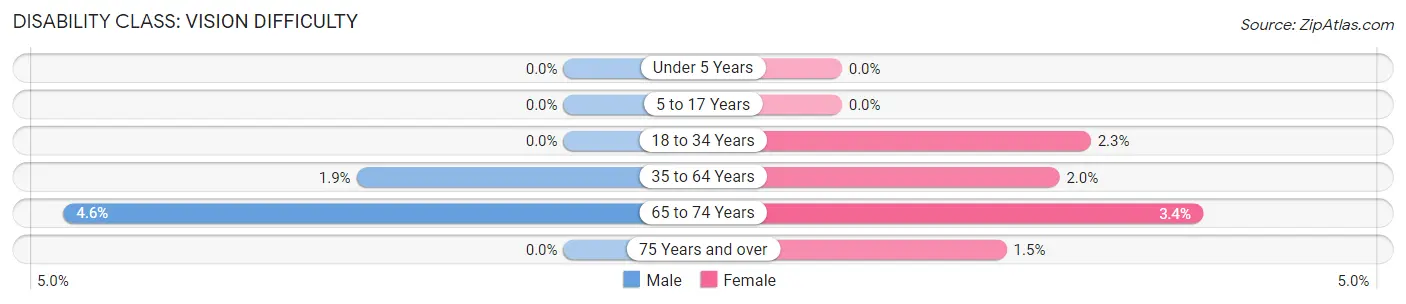
| Age Bracket | Male | Female |
| Under 5 Years | 0 (0.0%) | 0 (0.0%) |
| 5 to 17 Years | 0 (0.0%) | 0 (0.0%) |
| 18 to 34 Years | 0 (0.0%) | 41 (2.3%) |
| 35 to 64 Years | 78 (1.9%) | 77 (2.0%) |
| 65 to 74 Years | 52 (4.6%) | 32 (3.4%) |
| 75 Years and over | 0 (0.0%) | 10 (1.5%) |
Disability Class: Cognitive Difficulty
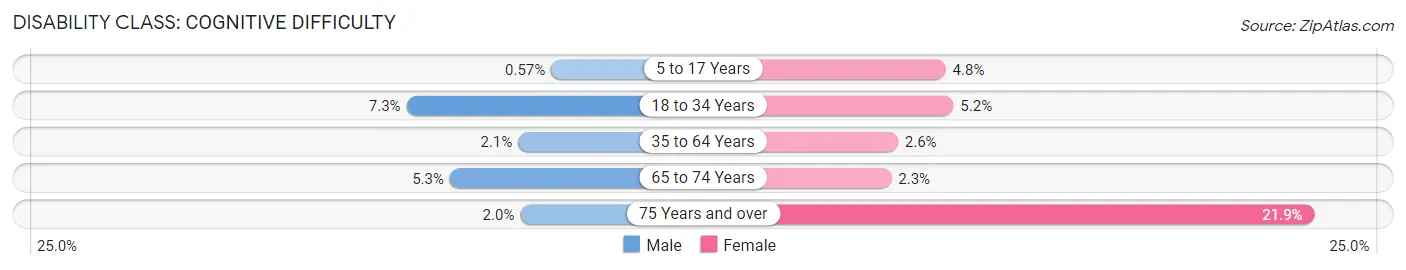
| Age Bracket | Male | Female |
| 5 to 17 Years | 9 (0.6%) | 85 (4.8%) |
| 18 to 34 Years | 112 (7.3%) | 92 (5.2%) |
| 35 to 64 Years | 85 (2.1%) | 99 (2.6%) |
| 65 to 74 Years | 59 (5.3%) | 22 (2.3%) |
| 75 Years and over | 9 (2.0%) | 143 (21.9%) |
Disability Class: Ambulatory Difficulty
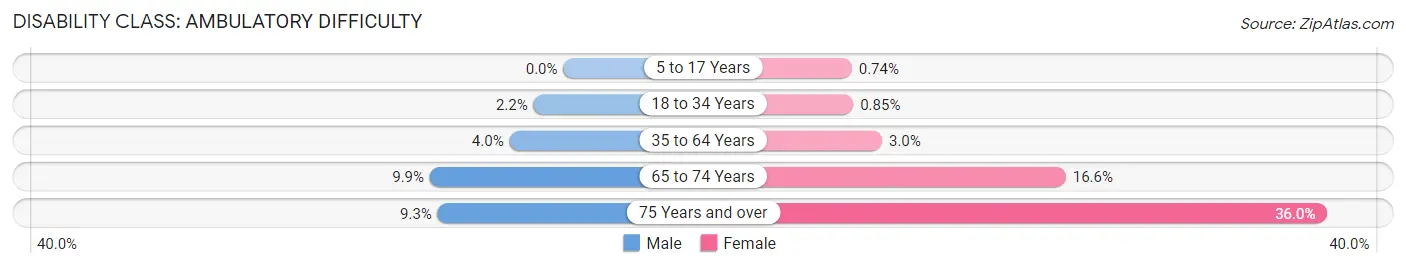
| Age Bracket | Male | Female |
| 5 to 17 Years | 0 (0.0%) | 13 (0.7%) |
| 18 to 34 Years | 34 (2.2%) | 15 (0.9%) |
| 35 to 64 Years | 162 (4.0%) | 114 (3.0%) |
| 65 to 74 Years | 111 (9.9%) | 159 (16.6%) |
| 75 Years and over | 42 (9.3%) | 235 (36.0%) |
Disability Class: Self-Care Difficulty
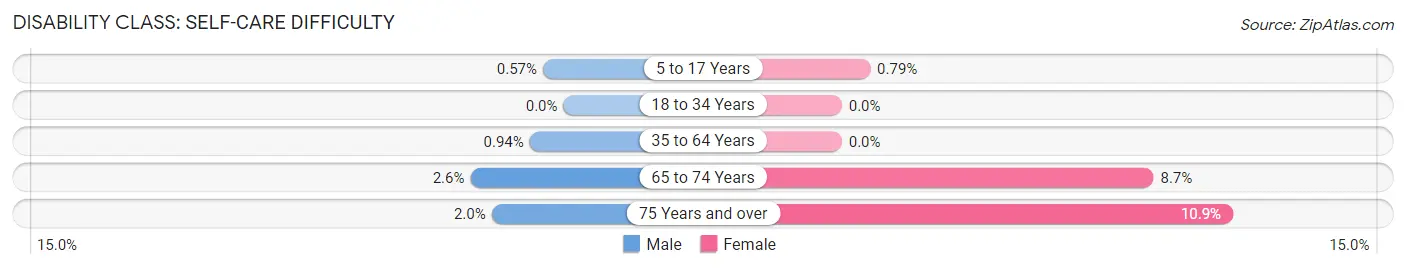
| Age Bracket | Male | Female |
| 5 to 17 Years | 9 (0.6%) | 14 (0.8%) |
| 18 to 34 Years | 0 (0.0%) | 0 (0.0%) |
| 35 to 64 Years | 38 (0.9%) | 0 (0.0%) |
| 65 to 74 Years | 29 (2.6%) | 83 (8.7%) |
| 75 Years and over | 9 (2.0%) | 71 (10.9%) |
Technology Access in Lake Shore
Computing Device Access in Lake Shore
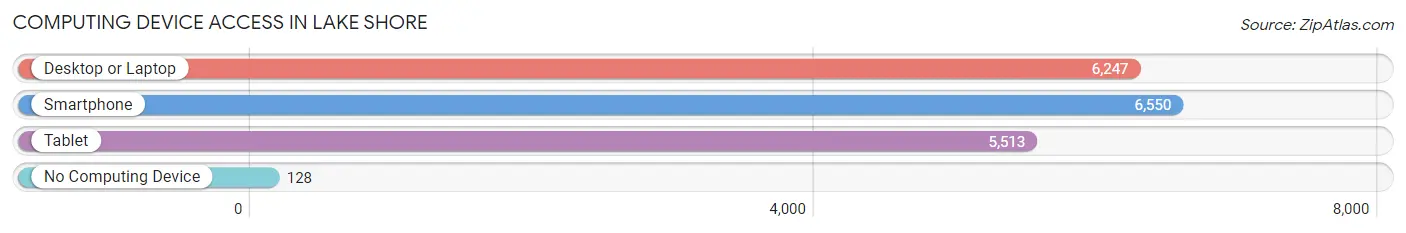
| Device Type | # Households | % Households |
| Desktop or Laptop | 6,247 | 88.2% |
| Smartphone | 6,550 | 92.5% |
| Tablet | 5,513 | 77.8% |
| No Computing Device | 128 | 1.8% |
| Total | 7,083 | 100.0% |
Internet Access in Lake Shore
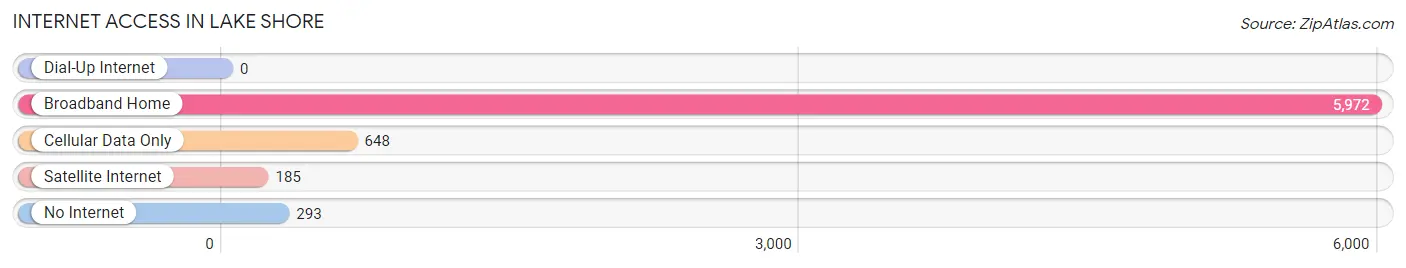
| Internet Type | # Households | % Households |
| Dial-Up Internet | 0 | 0.0% |
| Broadband Home | 5,972 | 84.3% |
| Cellular Data Only | 648 | 9.1% |
| Satellite Internet | 185 | 2.6% |
| No Internet | 293 | 4.1% |
| Total | 7,083 | 100.0% |
Lake Shore Summary
Lake Shore is a small town located in Anne Arundel County, Maryland. It is situated on the western shore of the Chesapeake Bay, approximately 25 miles south of Baltimore and 40 miles east of Washington, D.C. The town has a population of approximately 4,000 people and covers an area of 1.2 square miles.
History
The area that is now Lake Shore was originally inhabited by the Piscataway Indians. The first European settlers arrived in the area in the late 1600s and established a small fishing village. The town was officially incorporated in 1887 and was named after the nearby lake.
In the early 1900s, the town began to grow as a popular summer resort destination. The town was home to several large hotels and resorts, as well as a boardwalk and amusement park. The town also became a popular destination for fishing and boating.
In the 1950s, the town began to decline as a resort destination. The hotels and resorts closed and the boardwalk and amusement park were demolished. The town began to focus on residential development and today is primarily a bedroom community for nearby cities.
Geography
Lake Shore is located on the western shore of the Chesapeake Bay. The town is bordered by the Patuxent River to the north and the Chesapeake Bay to the east. The town is located in a flat, low-lying area and is surrounded by wetlands and marshland.
The town is located in a temperate climate zone and experiences hot, humid summers and mild winters. The average annual temperature is around 60 degrees Fahrenheit and the average annual precipitation is around 40 inches.
Economy
The economy of Lake Shore is primarily based on tourism and retail. The town is home to several small businesses, including restaurants, shops, and marinas. The town also has a small commercial fishing industry.
The town is also home to several government agencies, including the U.S. Coast Guard and the Maryland Department of Natural Resources. The town is also home to a small naval base.
Demographics
As of the 2010 census, the population of Lake Shore was 4,000. The racial makeup of the town was 94.3% White, 2.2% African American, 0.7% Asian, 0.3% Native American, and 2.5% from other races. The median household income was $50,000 and the median family income was $60,000.
The town is home to a diverse population, with a variety of religious and cultural backgrounds. The town is home to a large Catholic population, as well as a small Jewish community. The town is also home to a large number of retirees.
Common Questions
What is Per Capita Income in Lake Shore?
Per Capita income in Lake Shore is $59,859.
What is the Median Family Income in Lake Shore?
Median Family Income in Lake Shore is $145,100.
What is the Median Household income in Lake Shore?
Median Household Income in Lake Shore is $125,740.
What is Income or Wage Gap in Lake Shore?
Income or Wage Gap in Lake Shore is 16.7%.
Women in Lake Shore earn 83.3 cents for every dollar earned by a man.
What is Inequality or Gini Index in Lake Shore?
Inequality or Gini Index in Lake Shore is 0.43.
What is the Total Population of Lake Shore?
Total Population of Lake Shore is 18,872.
What is the Total Male Population of Lake Shore?
Total Male Population of Lake Shore is 9,262.
What is the Total Female Population of Lake Shore?
Total Female Population of Lake Shore is 9,610.
What is the Ratio of Males per 100 Females in Lake Shore?
There are 96.38 Males per 100 Females in Lake Shore.
What is the Ratio of Females per 100 Males in Lake Shore?
There are 103.76 Females per 100 Males in Lake Shore.
What is the Median Population Age in Lake Shore?
Median Population Age in Lake Shore is 40.7 Years.
What is the Average Family Size in Lake Shore
Average Family Size in Lake Shore is 3.1 People.
What is the Average Household Size in Lake Shore
Average Household Size in Lake Shore is 2.7 People.
How Large is the Labor Force in Lake Shore?
There are 10,523 People in the Labor Forcein in Lake Shore.
What is the Percentage of People in the Labor Force in Lake Shore?
69.6% of People are in the Labor Force in Lake Shore.
What is the Unemployment Rate in Lake Shore?
Unemployment Rate in Lake Shore is 4.0%.