Bel Air North, MD Map & Demographics
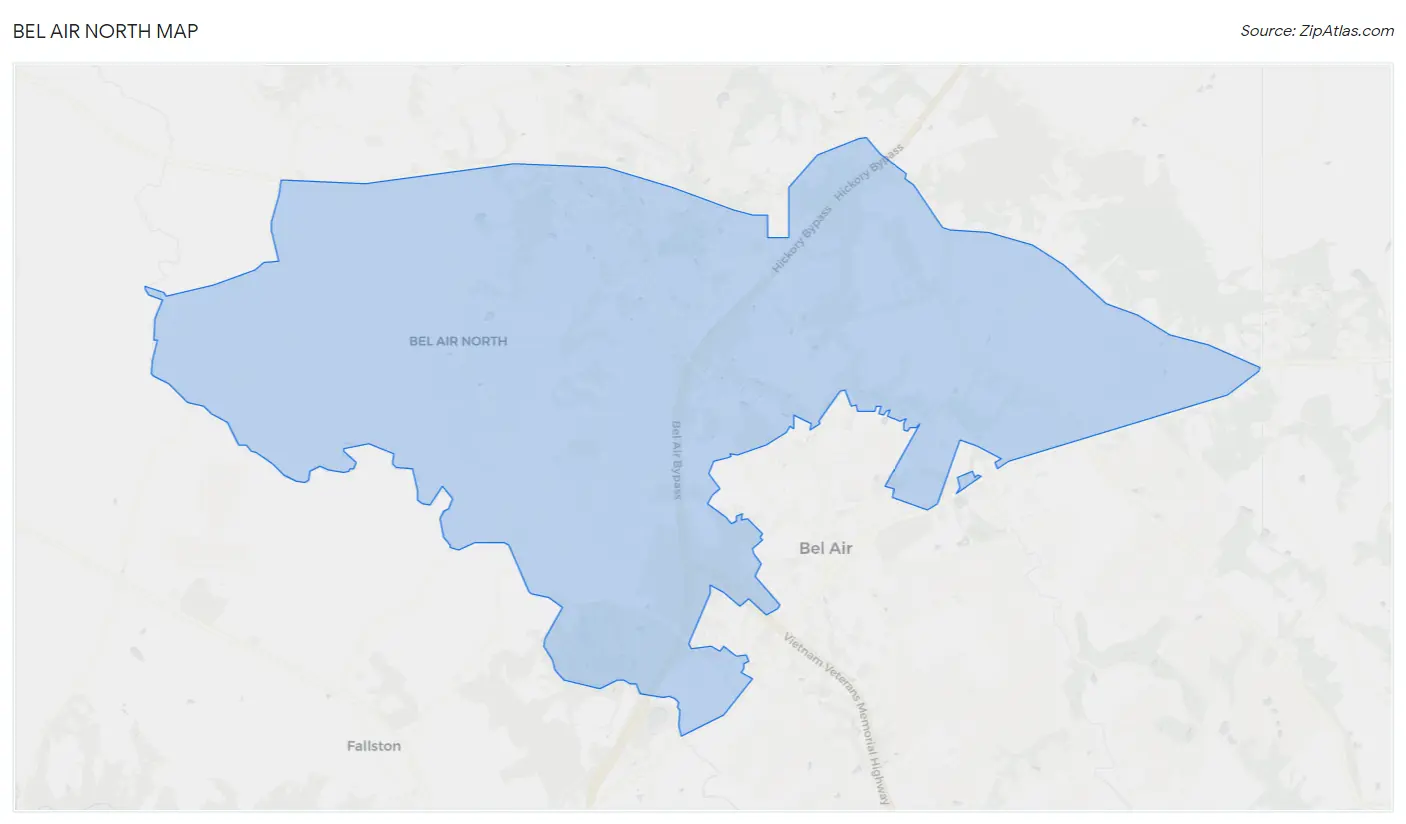
Bel Air North Map
Bel Air North Overview
$52,250
PER CAPITA INCOME
$157,372
AVG FAMILY INCOME
$133,613
AVG HOUSEHOLD INCOME
36.3%
WAGE / INCOME GAP [ % ]
63.7¢/ $1
WAGE / INCOME GAP [ $ ]
$10,588
FAMILY INCOME DEFICIT
0.36
INEQUALITY / GINI INDEX
31,308
TOTAL POPULATION
15,055
MALE POPULATION
16,253
FEMALE POPULATION
92.63
MALES / 100 FEMALES
107.96
FEMALES / 100 MALES
40.4
MEDIAN AGE
3.2
AVG FAMILY SIZE
2.8
AVG HOUSEHOLD SIZE
16,574
LABOR FORCE [ PEOPLE ]
68.5%
PERCENT IN LABOR FORCE
2.5%
UNEMPLOYMENT RATE
Income in Bel Air North
Income Overview in Bel Air North
Per Capita Income in Bel Air North is $52,250, while median incomes of families and households are $157,372 and $133,613 respectively.
| Characteristic | Number | Measure |
| Per Capita Income | 31,308 | $52,250 |
| Median Family Income | 8,674 | $157,372 |
| Mean Family Income | 8,674 | $168,286 |
| Median Household Income | 10,929 | $133,613 |
| Mean Household Income | 10,929 | $149,442 |
| Income Deficit | 8,674 | $10,588 |
| Wage / Income Gap (%) | 31,308 | 36.34% |
| Wage / Income Gap ($) | 31,308 | 63.66¢ per $1 |
| Gini / Inequality Index | 31,308 | 0.36 |
Earnings by Sex in Bel Air North
Average Earnings in Bel Air North are $67,046, $81,250 for men and $51,721 for women, a difference of 36.3%.
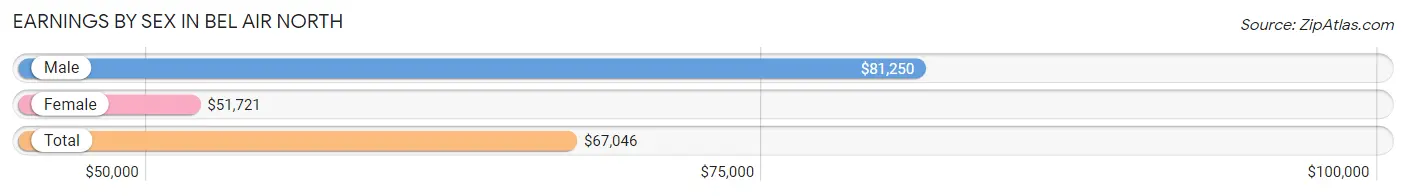
| Sex | Number | Average Earnings |
| Male | 9,254 (52.5%) | $81,250 |
| Female | 8,365 (47.5%) | $51,721 |
| Total | 17,619 (100.0%) | $67,046 |
Earnings by Sex by Income Bracket in Bel Air North
The most common earnings brackets in Bel Air North are $100,000+ for men (3,431 | 37.1%) and $100,000+ for women (1,642 | 19.6%).
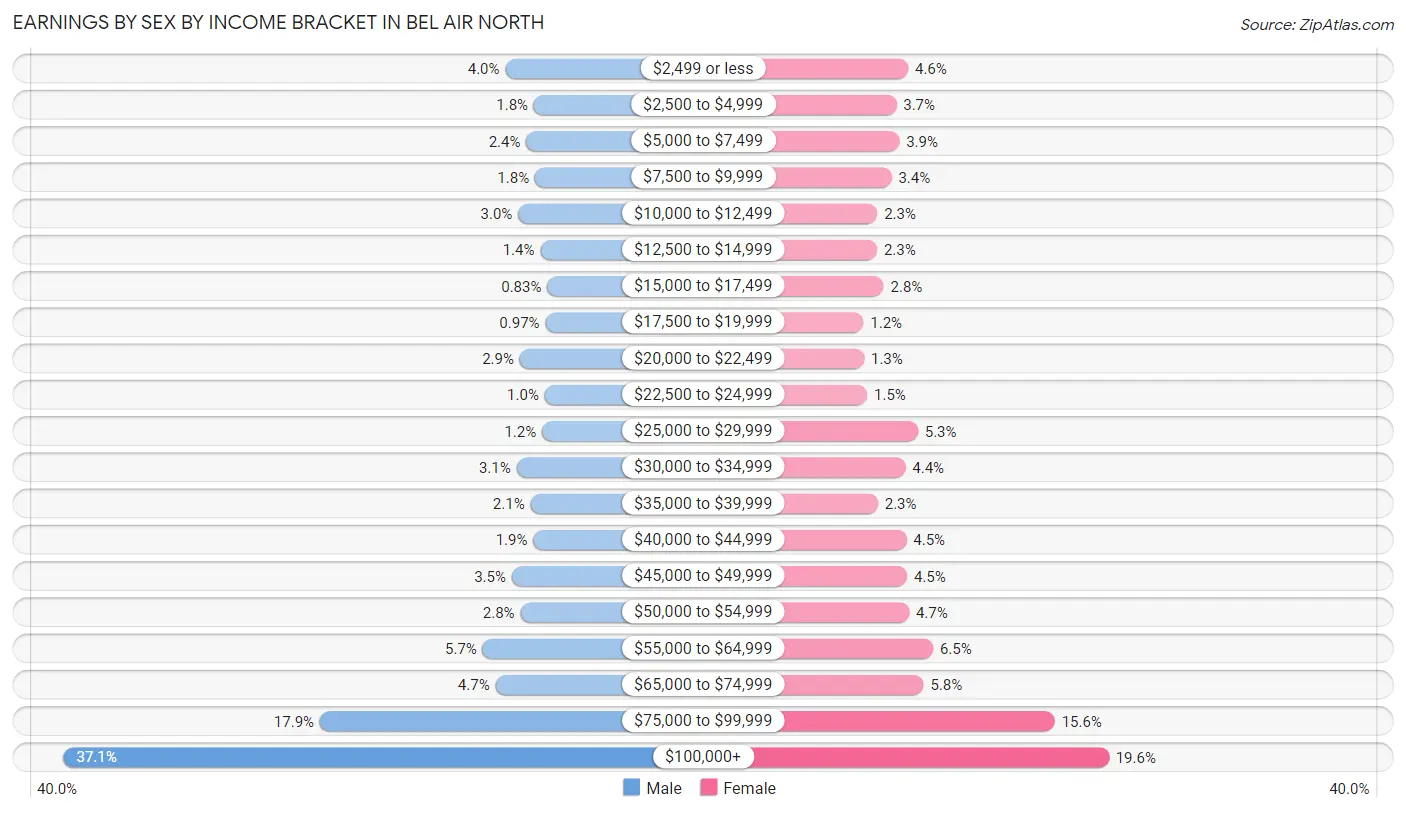
| Income | Male | Female |
| $2,499 or less | 367 (4.0%) | 384 (4.6%) |
| $2,500 to $4,999 | 169 (1.8%) | 310 (3.7%) |
| $5,000 to $7,499 | 222 (2.4%) | 329 (3.9%) |
| $7,500 to $9,999 | 162 (1.8%) | 280 (3.4%) |
| $10,000 to $12,499 | 279 (3.0%) | 191 (2.3%) |
| $12,500 to $14,999 | 125 (1.3%) | 189 (2.3%) |
| $15,000 to $17,499 | 77 (0.8%) | 231 (2.8%) |
| $17,500 to $19,999 | 90 (1.0%) | 104 (1.2%) |
| $20,000 to $22,499 | 267 (2.9%) | 108 (1.3%) |
| $22,500 to $24,999 | 94 (1.0%) | 127 (1.5%) |
| $25,000 to $29,999 | 113 (1.2%) | 445 (5.3%) |
| $30,000 to $34,999 | 290 (3.1%) | 367 (4.4%) |
| $35,000 to $39,999 | 193 (2.1%) | 194 (2.3%) |
| $40,000 to $44,999 | 174 (1.9%) | 373 (4.5%) |
| $45,000 to $49,999 | 323 (3.5%) | 377 (4.5%) |
| $50,000 to $54,999 | 263 (2.8%) | 390 (4.7%) |
| $55,000 to $64,999 | 525 (5.7%) | 540 (6.5%) |
| $65,000 to $74,999 | 436 (4.7%) | 481 (5.8%) |
| $75,000 to $99,999 | 1,654 (17.9%) | 1,303 (15.6%) |
| $100,000+ | 3,431 (37.1%) | 1,642 (19.6%) |
| Total | 9,254 (100.0%) | 8,365 (100.0%) |
Earnings by Sex by Educational Attainment in Bel Air North
Average earnings in Bel Air North are $90,720 for men and $59,863 for women, a difference of 34.0%. Men with an educational attainment of graduate degree enjoy the highest average annual earnings of $133,462, while those with high school diploma education earn the least with $72,554. Women with an educational attainment of graduate degree earn the most with the average annual earnings of $83,789, while those with high school diploma education have the smallest earnings of $44,564.
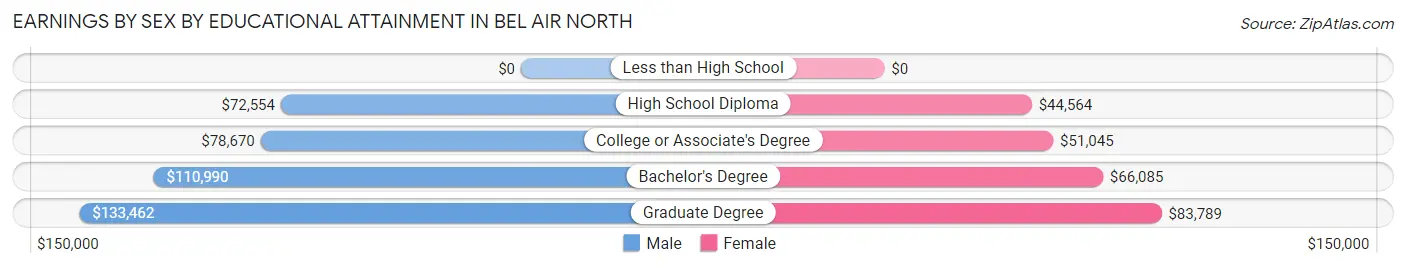
| Educational Attainment | Male Income | Female Income |
| Less than High School | - | - |
| High School Diploma | $72,554 | $44,564 |
| College or Associate's Degree | $78,670 | $51,045 |
| Bachelor's Degree | $110,990 | $66,085 |
| Graduate Degree | $133,462 | $83,789 |
| Total | $90,720 | $59,863 |
Family Income in Bel Air North
Family Income Brackets in Bel Air North
According to the Bel Air North family income data, there are 2,724 families falling into the $200,000+ income range, which is the most common income bracket and makes up 31.4% of all families. Conversely, the $15,000 to $24,999 income bracket is the least frequent group with only 43 families (0.5%) belonging to this category.
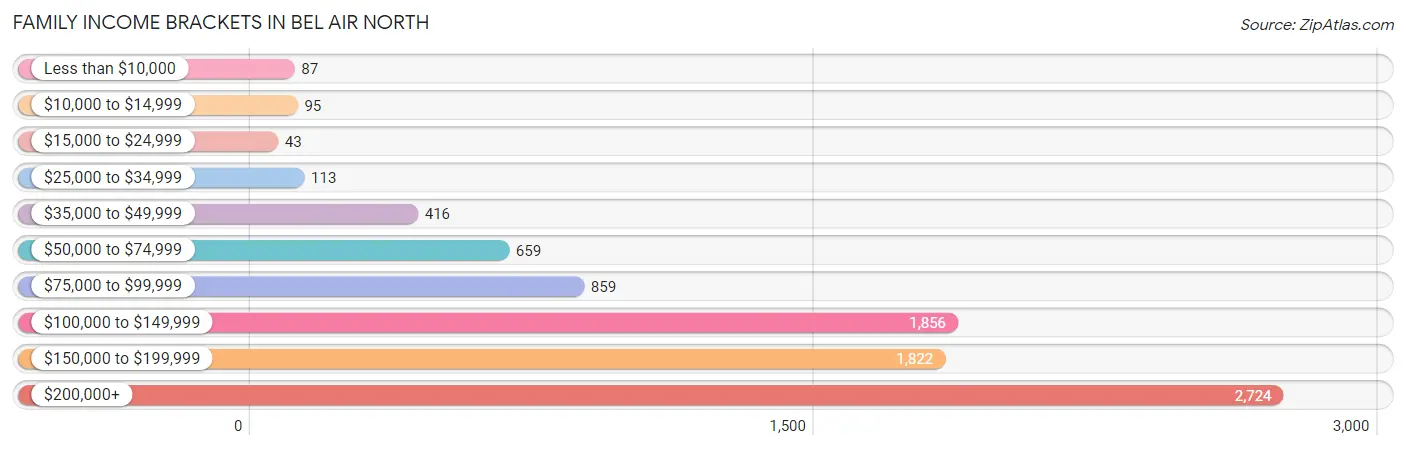
| Income Bracket | # Families | % Families |
| Less than $10,000 | 87 | 1.0% |
| $10,000 to $14,999 | 95 | 1.1% |
| $15,000 to $24,999 | 43 | 0.5% |
| $25,000 to $34,999 | 113 | 1.3% |
| $35,000 to $49,999 | 416 | 4.8% |
| $50,000 to $74,999 | 659 | 7.6% |
| $75,000 to $99,999 | 859 | 9.9% |
| $100,000 to $149,999 | 1,856 | 21.4% |
| $150,000 to $199,999 | 1,822 | 21.0% |
| $200,000+ | 2,724 | 31.4% |
Family Income by Famaliy Size in Bel Air North
5-person families (864 | 10.0%) account for the highest median family income in Bel Air North with $202,500 per family, while 3-person families (2,157 | 24.9%) have the highest median income of $54,398 per family member.
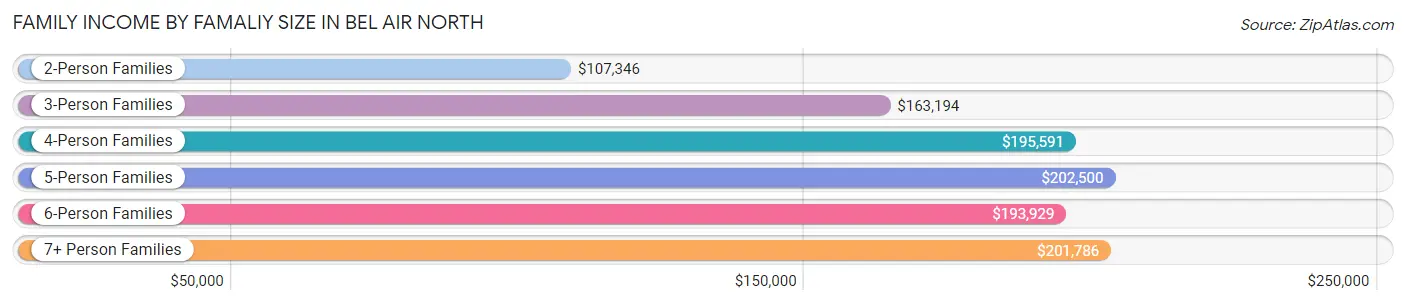
| Income Bracket | # Families | Median Income |
| 2-Person Families | 3,323 (38.3%) | $107,346 |
| 3-Person Families | 2,157 (24.9%) | $163,194 |
| 4-Person Families | 2,026 (23.4%) | $195,591 |
| 5-Person Families | 864 (10.0%) | $202,500 |
| 6-Person Families | 242 (2.8%) | $193,929 |
| 7+ Person Families | 62 (0.7%) | $201,786 |
| Total | 8,674 (100.0%) | $157,372 |
Family Income by Number of Earners in Bel Air North
The median family income in Bel Air North is $157,372, with families comprising 3+ earners (1,437) having the highest median family income of $212,524, while families with no earners (964) have the lowest median family income of $63,378, accounting for 16.6% and 11.1% of families, respectively.
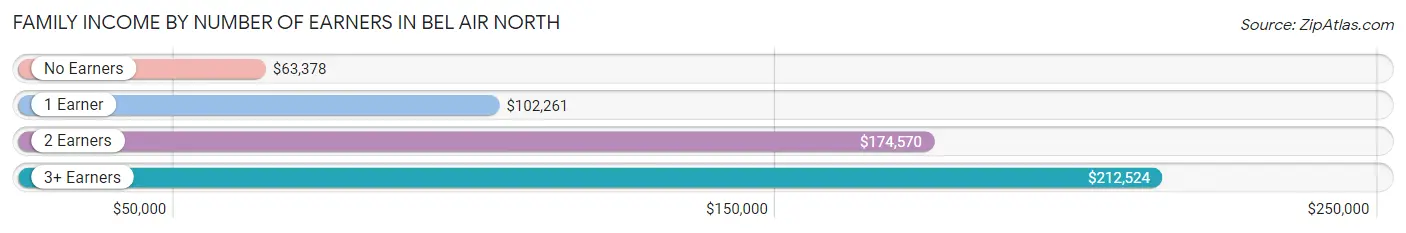
| Number of Earners | # Families | Median Income |
| No Earners | 964 (11.1%) | $63,378 |
| 1 Earner | 1,615 (18.6%) | $102,261 |
| 2 Earners | 4,658 (53.7%) | $174,570 |
| 3+ Earners | 1,437 (16.6%) | $212,524 |
| Total | 8,674 (100.0%) | $157,372 |
Household Income in Bel Air North
Household Income Brackets in Bel Air North
With 2,798 households falling in the category, the $200,000+ income range is the most frequent in Bel Air North, accounting for 25.6% of all households. In contrast, only 131 households (1.2%) fall into the $10,000 to $14,999 income bracket, making it the least populous group.
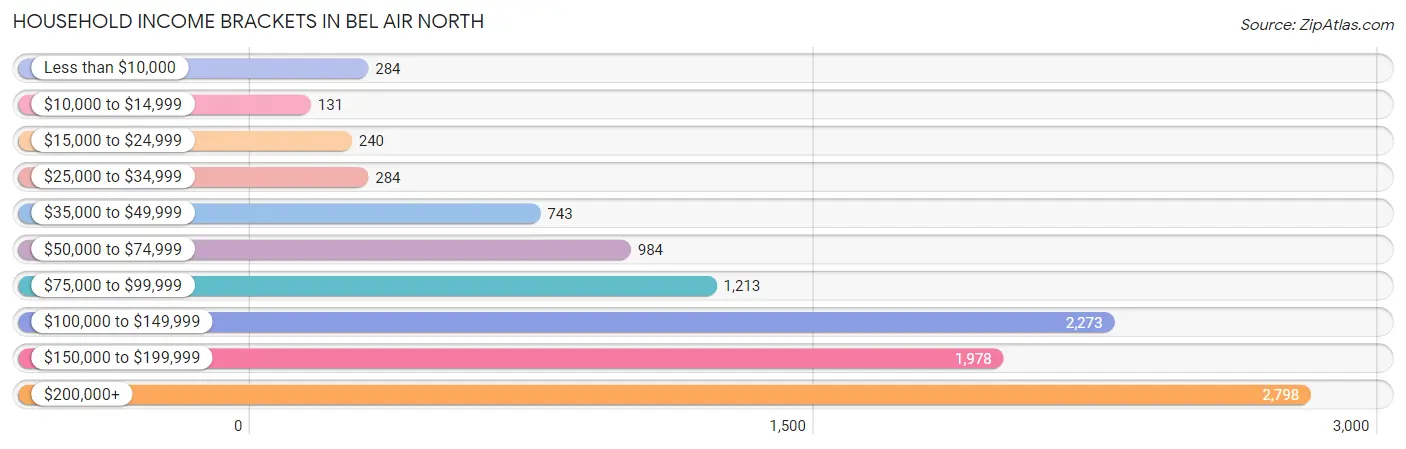
| Income Bracket | # Households | % Households |
| Less than $10,000 | 284 | 2.6% |
| $10,000 to $14,999 | 131 | 1.2% |
| $15,000 to $24,999 | 240 | 2.2% |
| $25,000 to $34,999 | 284 | 2.6% |
| $35,000 to $49,999 | 743 | 6.8% |
| $50,000 to $74,999 | 984 | 9.0% |
| $75,000 to $99,999 | 1,213 | 11.1% |
| $100,000 to $149,999 | 2,273 | 20.8% |
| $150,000 to $199,999 | 1,978 | 18.1% |
| $200,000+ | 2,798 | 25.6% |
Household Income by Householder Age in Bel Air North
The median household income in Bel Air North is $133,613, with the highest median household income of $171,141 found in the 45 to 64 years age bracket for the primary householder. A total of 4,609 households (42.2%) fall into this category. Meanwhile, the 65+ years age bracket for the primary householder has the lowest median household income of $66,610, with 2,944 households (26.9%) in this group.
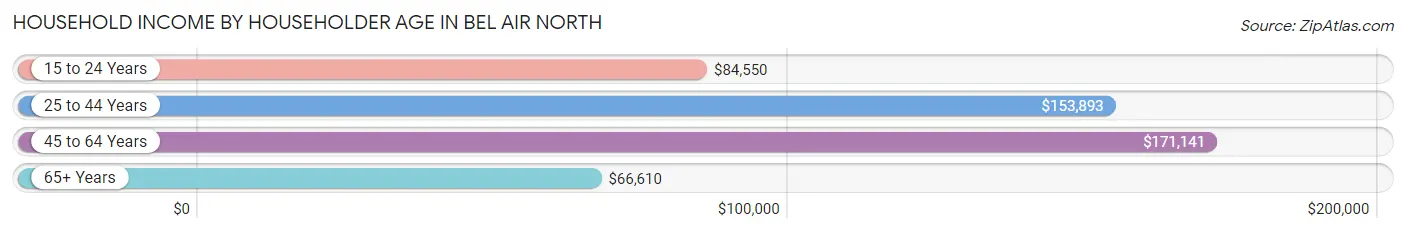
| Income Bracket | # Households | Median Income |
| 15 to 24 Years | 153 (1.4%) | $84,550 |
| 25 to 44 Years | 3,223 (29.5%) | $153,893 |
| 45 to 64 Years | 4,609 (42.2%) | $171,141 |
| 65+ Years | 2,944 (26.9%) | $66,610 |
| Total | 10,929 (100.0%) | $133,613 |
Poverty in Bel Air North
Income Below Poverty by Sex and Age in Bel Air North
With 2.3% poverty level for males and 4.0% for females among the residents of Bel Air North, 65 to 74 year old males and 55 to 64 year old females are the most vulnerable to poverty, with 117 males (10.1%) and 170 females (8.0%) in their respective age groups living below the poverty level.
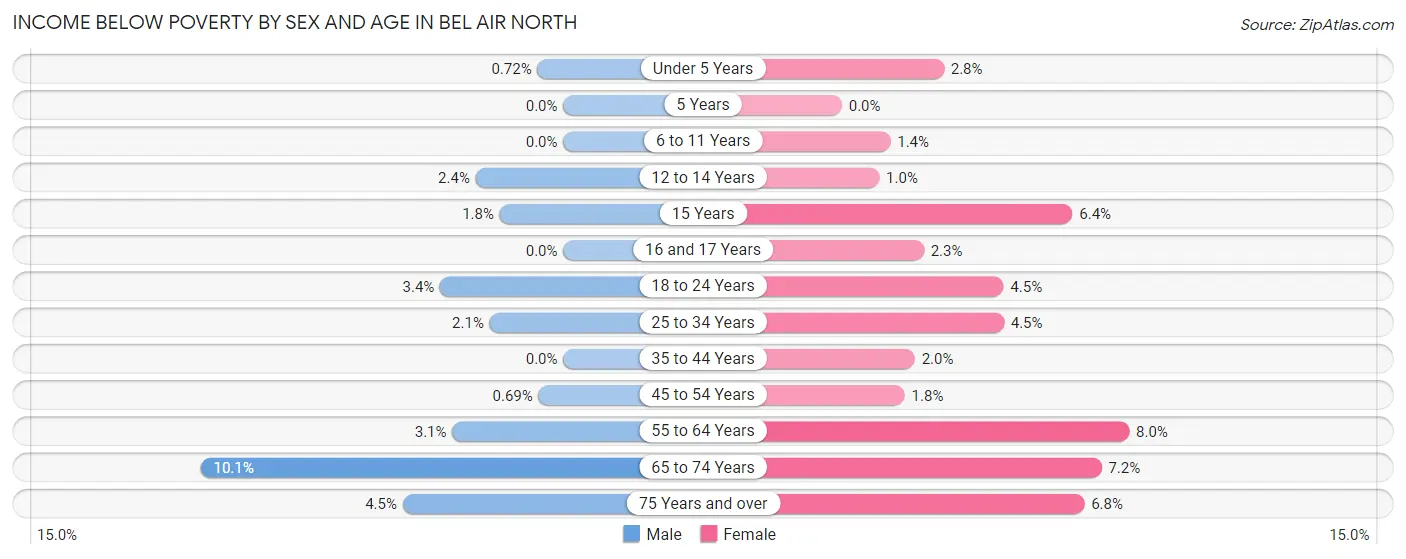
| Age Bracket | Male | Female |
| Under 5 Years | 6 (0.7%) | 29 (2.8%) |
| 5 Years | 0 (0.0%) | 0 (0.0%) |
| 6 to 11 Years | 0 (0.0%) | 19 (1.3%) |
| 12 to 14 Years | 15 (2.4%) | 9 (1.0%) |
| 15 Years | 6 (1.8%) | 17 (6.4%) |
| 16 and 17 Years | 0 (0.0%) | 12 (2.3%) |
| 18 to 24 Years | 40 (3.4%) | 44 (4.5%) |
| 25 to 34 Years | 29 (2.1%) | 69 (4.5%) |
| 35 to 44 Years | 0 (0.0%) | 44 (2.0%) |
| 45 to 54 Years | 16 (0.7%) | 40 (1.8%) |
| 55 to 64 Years | 61 (3.1%) | 170 (8.0%) |
| 65 to 74 Years | 117 (10.1%) | 105 (7.2%) |
| 75 Years and over | 43 (4.5%) | 89 (6.8%) |
| Total | 333 (2.3%) | 647 (4.0%) |
Income Above Poverty by Sex and Age in Bel Air North
According to the poverty statistics in Bel Air North, males aged 5 years and females aged 5 years are the age groups that are most secure financially, with 100.0% of males and 100.0% of females in these age groups living above the poverty line.
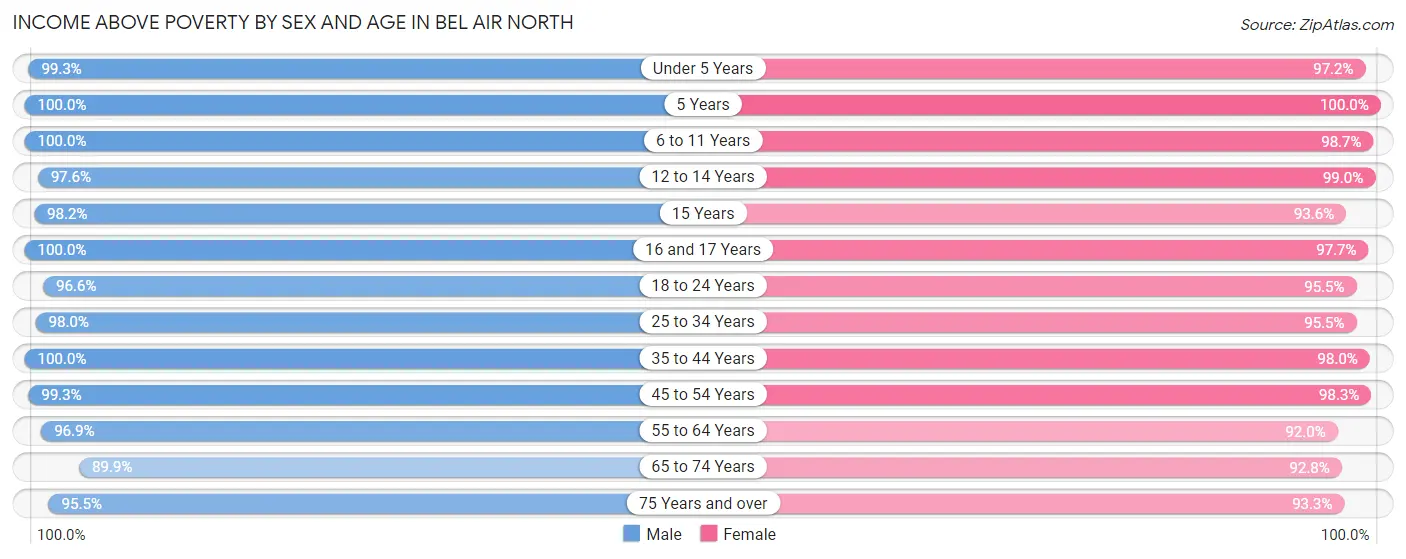
| Age Bracket | Male | Female |
| Under 5 Years | 832 (99.3%) | 993 (97.2%) |
| 5 Years | 101 (100.0%) | 144 (100.0%) |
| 6 to 11 Years | 1,496 (100.0%) | 1,389 (98.7%) |
| 12 to 14 Years | 599 (97.6%) | 854 (99.0%) |
| 15 Years | 333 (98.2%) | 248 (93.6%) |
| 16 and 17 Years | 281 (100.0%) | 514 (97.7%) |
| 18 to 24 Years | 1,125 (96.6%) | 934 (95.5%) |
| 25 to 34 Years | 1,389 (98.0%) | 1,462 (95.5%) |
| 35 to 44 Years | 2,080 (100.0%) | 2,121 (98.0%) |
| 45 to 54 Years | 2,295 (99.3%) | 2,242 (98.3%) |
| 55 to 64 Years | 1,914 (96.9%) | 1,954 (92.0%) |
| 65 to 74 Years | 1,041 (89.9%) | 1,347 (92.8%) |
| 75 Years and over | 918 (95.5%) | 1,230 (93.2%) |
| Total | 14,404 (97.7%) | 15,432 (96.0%) |
Income Below Poverty Among Married-Couple Families in Bel Air North
The poverty statistics for married-couple families in Bel Air North show that 1.7% or 131 of the total 7,707 families live below the poverty line. Families with no children have the highest poverty rate of 3.2%, comprising of 131 families. On the other hand, families with 1 or 2 children have the lowest poverty rate of 0.0%, which includes 0 families.
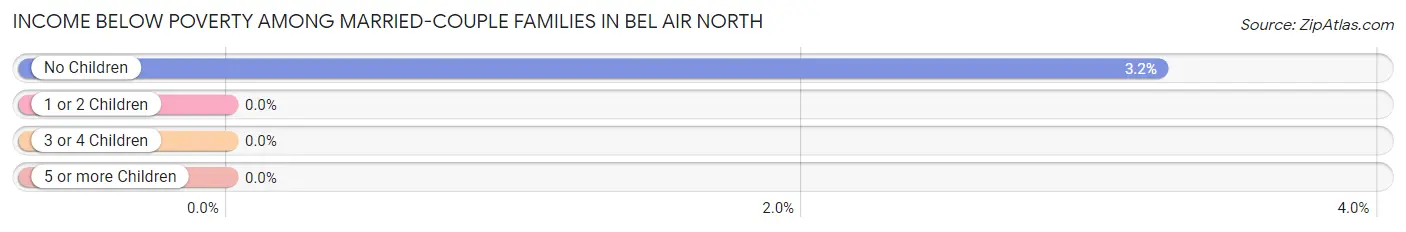
| Children | Above Poverty | Below Poverty |
| No Children | 3,909 (96.8%) | 131 (3.2%) |
| 1 or 2 Children | 2,864 (100.0%) | 0 (0.0%) |
| 3 or 4 Children | 768 (100.0%) | 0 (0.0%) |
| 5 or more Children | 35 (100.0%) | 0 (0.0%) |
| Total | 7,576 (98.3%) | 131 (1.7%) |
Income Below Poverty Among Single-Parent Households in Bel Air North
According to the poverty data in Bel Air North, 10.6% or 37 single-father households and 6.0% or 37 single-mother households are living below the poverty line. Among single-father households, those with 3 or 4 children have the highest poverty rate, with 6 households (33.3%) experiencing poverty. Likewise, among single-mother households, those with 3 or 4 children have the highest poverty rate, with 6 households (42.9%) falling below the poverty line.
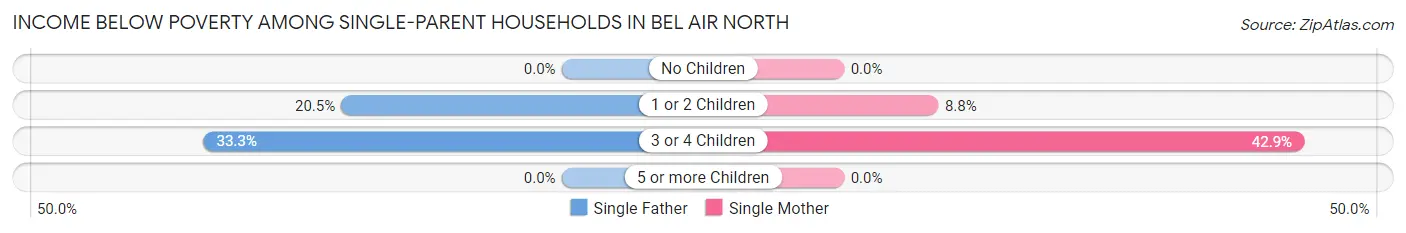
| Children | Single Father | Single Mother |
| No Children | 0 (0.0%) | 0 (0.0%) |
| 1 or 2 Children | 31 (20.5%) | 31 (8.8%) |
| 3 or 4 Children | 6 (33.3%) | 6 (42.9%) |
| 5 or more Children | 0 (0.0%) | 0 (0.0%) |
| Total | 37 (10.6%) | 37 (6.0%) |
Income Below Poverty Among Married-Couple vs Single-Parent Households in Bel Air North
The poverty data for Bel Air North shows that 131 of the married-couple family households (1.7%) and 74 of the single-parent households (7.6%) are living below the poverty level. Within the married-couple family households, those with no children have the highest poverty rate, with 131 households (3.2%) falling below the poverty line. Among the single-parent households, those with 3 or 4 children have the highest poverty rate, with 12 household (37.5%) living below poverty.
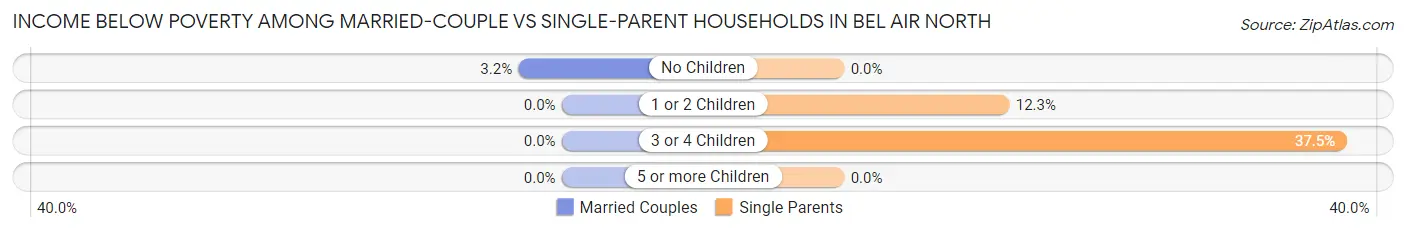
| Children | Married-Couple Families | Single-Parent Households |
| No Children | 131 (3.2%) | 0 (0.0%) |
| 1 or 2 Children | 0 (0.0%) | 62 (12.3%) |
| 3 or 4 Children | 0 (0.0%) | 12 (37.5%) |
| 5 or more Children | 0 (0.0%) | 0 (0.0%) |
| Total | 131 (1.7%) | 74 (7.6%) |
Race in Bel Air North
The most populous races in Bel Air North are White / Caucasian (27,979 | 89.4%), Two or more Races (1,466 | 4.7%), and Black / African American (1,103 | 3.5%).
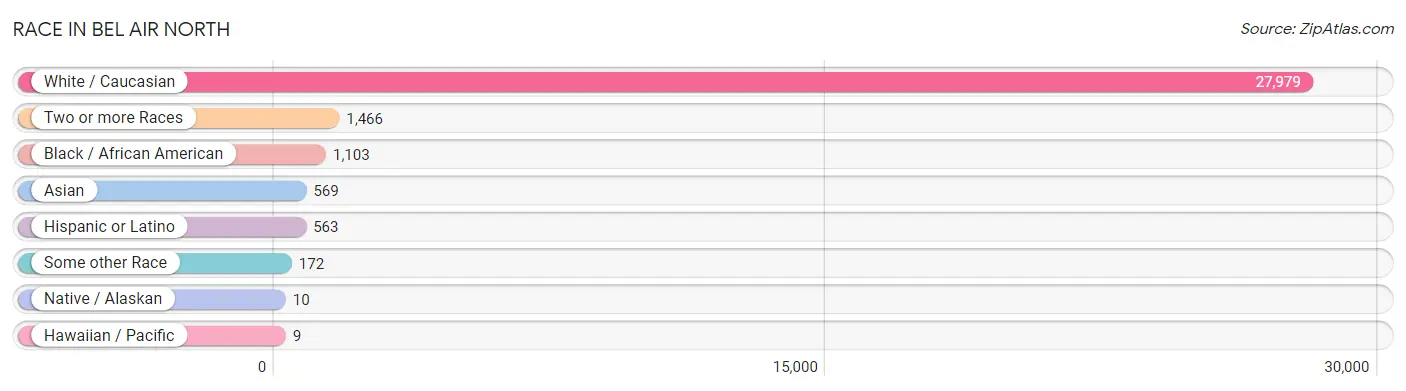
| Race | # Population | % Population |
| Asian | 569 | 1.8% |
| Black / African American | 1,103 | 3.5% |
| Hawaiian / Pacific | 9 | 0.0% |
| Hispanic or Latino | 563 | 1.8% |
| Native / Alaskan | 10 | 0.0% |
| White / Caucasian | 27,979 | 89.4% |
| Two or more Races | 1,466 | 4.7% |
| Some other Race | 172 | 0.5% |
| Total | 31,308 | 100.0% |
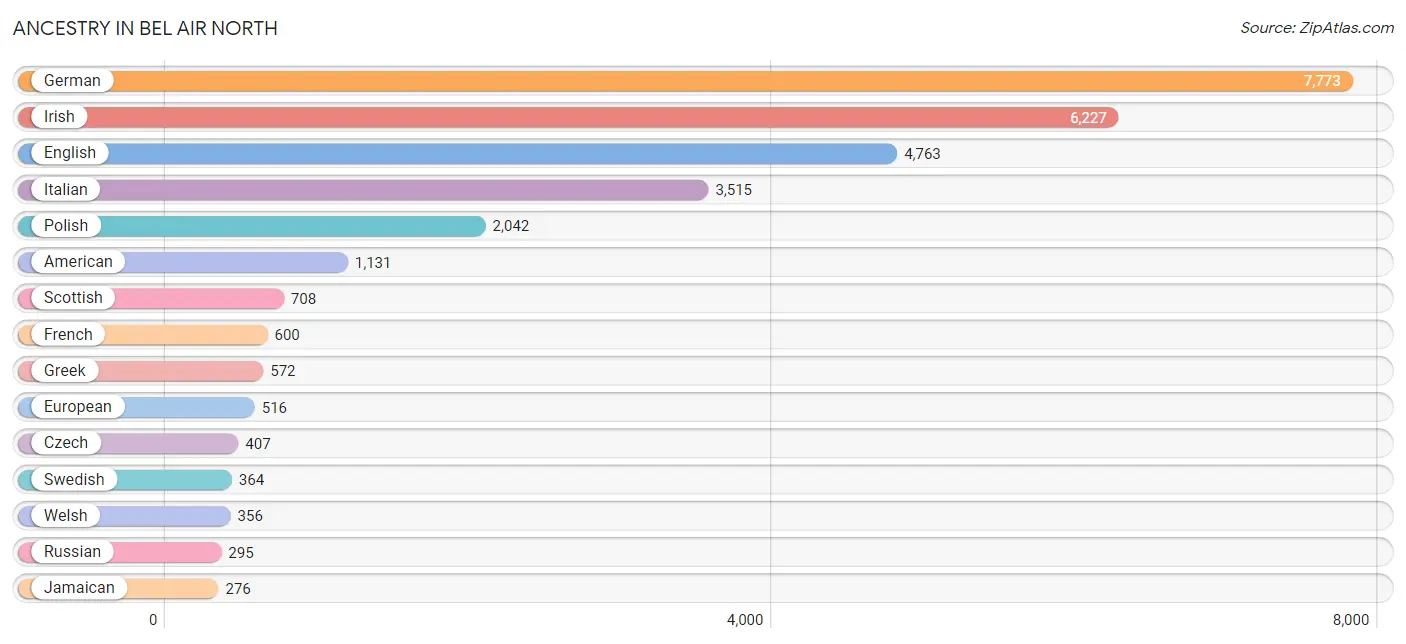
Ancestry in Bel Air North
The most populous ancestries reported in Bel Air North are German (7,773 | 24.8%), Irish (6,227 | 19.9%), English (4,763 | 15.2%), Italian (3,515 | 11.2%), and Polish (2,042 | 6.5%), together accounting for 77.7% of all Bel Air North residents.
| Ancestry | # Population | % Population |
| African | 11 | 0.0% |
| Albanian | 58 | 0.2% |
| American | 1,131 | 3.6% |
| Apache | 6 | 0.0% |
| Arab | 95 | 0.3% |
| Argentinean | 54 | 0.2% |
| Armenian | 17 | 0.1% |
| Austrian | 196 | 0.6% |
| Barbadian | 19 | 0.1% |
| Belgian | 11 | 0.0% |
| Bhutanese | 144 | 0.5% |
| Brazilian | 22 | 0.1% |
| British | 258 | 0.8% |
| Burmese | 77 | 0.3% |
| Canadian | 13 | 0.0% |
| Central American | 75 | 0.2% |
| Cherokee | 37 | 0.1% |
| Chinese | 28 | 0.1% |
| Choctaw | 15 | 0.1% |
| Colombian | 86 | 0.3% |
| Croatian | 15 | 0.1% |
| Cuban | 80 | 0.3% |
| Czech | 407 | 1.3% |
| Czechoslovakian | 64 | 0.2% |
| Danish | 21 | 0.1% |
| Dutch | 260 | 0.8% |
| Eastern European | 146 | 0.5% |
| Egyptian | 14 | 0.0% |
| English | 4,763 | 15.2% |
| European | 516 | 1.7% |
| Finnish | 57 | 0.2% |
| French | 600 | 1.9% |
| French Canadian | 85 | 0.3% |
| German | 7,773 | 24.8% |
| Ghanaian | 39 | 0.1% |
| Greek | 572 | 1.8% |
| Guatemalan | 20 | 0.1% |
| Guyanese | 13 | 0.0% |
| Honduran | 16 | 0.1% |
| Hungarian | 248 | 0.8% |
| Indian (Asian) | 103 | 0.3% |
| Irish | 6,227 | 19.9% |
| Iroquois | 8 | 0.0% |
| Italian | 3,515 | 11.2% |
| Jamaican | 276 | 0.9% |
| Korean | 231 | 0.7% |
| Latvian | 14 | 0.0% |
| Lithuanian | 165 | 0.5% |
| Lumbee | 40 | 0.1% |
| Mexican | 123 | 0.4% |
| Native Hawaiian | 24 | 0.1% |
| Norwegian | 115 | 0.4% |
| Pakistani | 39 | 0.1% |
| Palestinian | 10 | 0.0% |
| Panamanian | 5 | 0.0% |
| Pennsylvania German | 48 | 0.2% |
| Peruvian | 18 | 0.1% |
| Polish | 2,042 | 6.5% |
| Portuguese | 47 | 0.2% |
| Puerto Rican | 127 | 0.4% |
| Romanian | 26 | 0.1% |
| Russian | 295 | 0.9% |
| Salvadoran | 34 | 0.1% |
| Samoan | 9 | 0.0% |
| Scandinavian | 17 | 0.1% |
| Scotch-Irish | 190 | 0.6% |
| Scottish | 708 | 2.3% |
| Serbian | 66 | 0.2% |
| Slovak | 23 | 0.1% |
| South American | 158 | 0.5% |
| Sri Lankan | 16 | 0.1% |
| Subsaharan African | 101 | 0.3% |
| Swedish | 364 | 1.2% |
| Swiss | 64 | 0.2% |
| Syrian | 14 | 0.0% |
| Thai | 259 | 0.8% |
| Trinidadian and Tobagonian | 259 | 0.8% |
| Ukrainian | 86 | 0.3% |
| Welsh | 356 | 1.1% |
| West Indian | 8 | 0.0% |
| Yugoslavian | 5 | 0.0% |
| Zimbabwean | 38 | 0.1% | View All 82 Rows |
Immigrants in Bel Air North
The most numerous immigrant groups reported in Bel Air North came from Asia (358 | 1.1%), Europe (227 | 0.7%), Latin America (198 | 0.6%), South Central Asia (155 | 0.5%), and Eastern Asia (110 | 0.4%), together accounting for 3.4% of all Bel Air North residents.
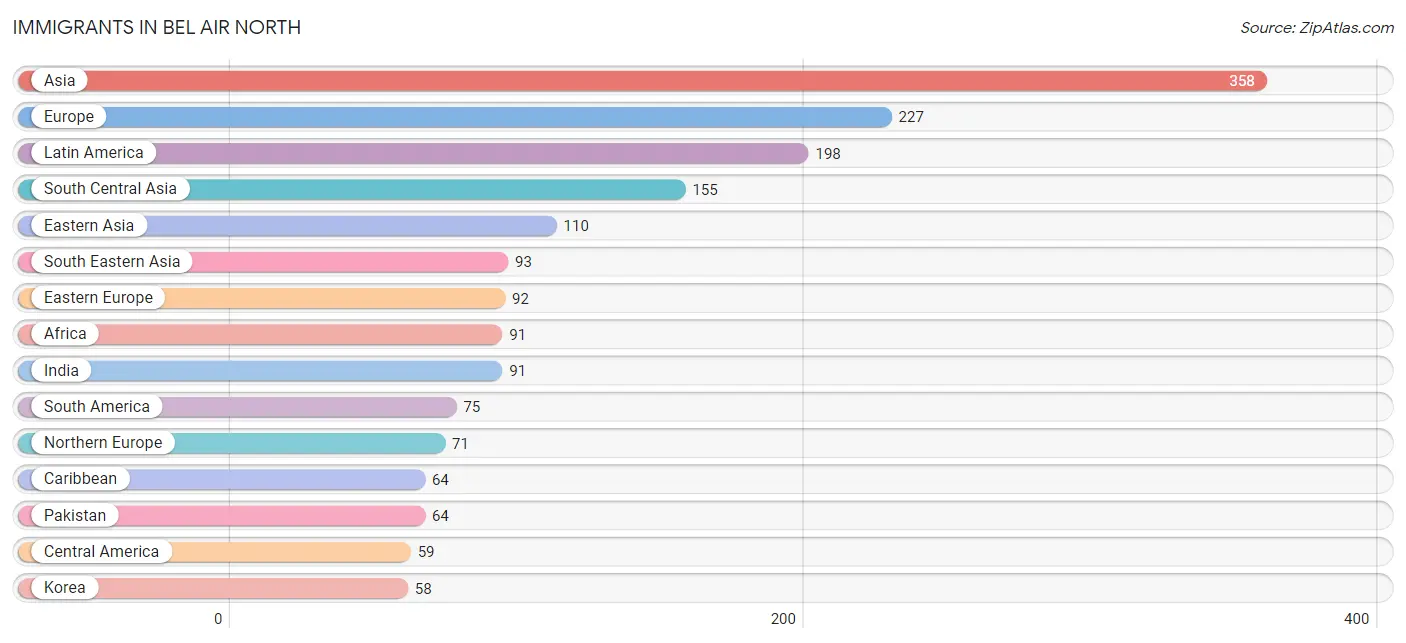
| Immigration Origin | # Population | % Population |
| Africa | 91 | 0.3% |
| Albania | 43 | 0.1% |
| Argentina | 16 | 0.1% |
| Asia | 358 | 1.1% |
| Barbados | 19 | 0.1% |
| Canada | 18 | 0.1% |
| Caribbean | 64 | 0.2% |
| Central America | 59 | 0.2% |
| China | 27 | 0.1% |
| Colombia | 28 | 0.1% |
| Eastern Africa | 38 | 0.1% |
| Eastern Asia | 110 | 0.4% |
| Eastern Europe | 92 | 0.3% |
| Egypt | 14 | 0.0% |
| El Salvador | 9 | 0.0% |
| England | 19 | 0.1% |
| Europe | 227 | 0.7% |
| France | 22 | 0.1% |
| Germany | 8 | 0.0% |
| Ghana | 39 | 0.1% |
| Guatemala | 32 | 0.1% |
| Guyana | 13 | 0.0% |
| Hong Kong | 4 | 0.0% |
| India | 91 | 0.3% |
| Ireland | 7 | 0.0% |
| Italy | 20 | 0.1% |
| Jamaica | 30 | 0.1% |
| Japan | 25 | 0.1% |
| Korea | 58 | 0.2% |
| Latin America | 198 | 0.6% |
| Mexico | 13 | 0.0% |
| Northern Africa | 14 | 0.0% |
| Northern Europe | 71 | 0.2% |
| Oceania | 9 | 0.0% |
| Pakistan | 64 | 0.2% |
| Panama | 5 | 0.0% |
| Peru | 18 | 0.1% |
| Philippines | 38 | 0.1% |
| Portugal | 14 | 0.0% |
| Russia | 43 | 0.1% |
| South America | 75 | 0.2% |
| South Central Asia | 155 | 0.5% |
| South Eastern Asia | 93 | 0.3% |
| Southern Europe | 34 | 0.1% |
| Sweden | 8 | 0.0% |
| Taiwan | 8 | 0.0% |
| Thailand | 39 | 0.1% |
| Trinidad and Tobago | 15 | 0.1% |
| Ukraine | 6 | 0.0% |
| Vietnam | 16 | 0.1% |
| Western Africa | 39 | 0.1% |
| Western Europe | 30 | 0.1% |
| Zimbabwe | 38 | 0.1% | View All 53 Rows |
Sex and Age in Bel Air North
Sex and Age in Bel Air North
The most populous age groups in Bel Air North are 5 to 9 Years (1,211 | 8.0%) for men and 10 to 14 Years (1,379 | 8.5%) for women.
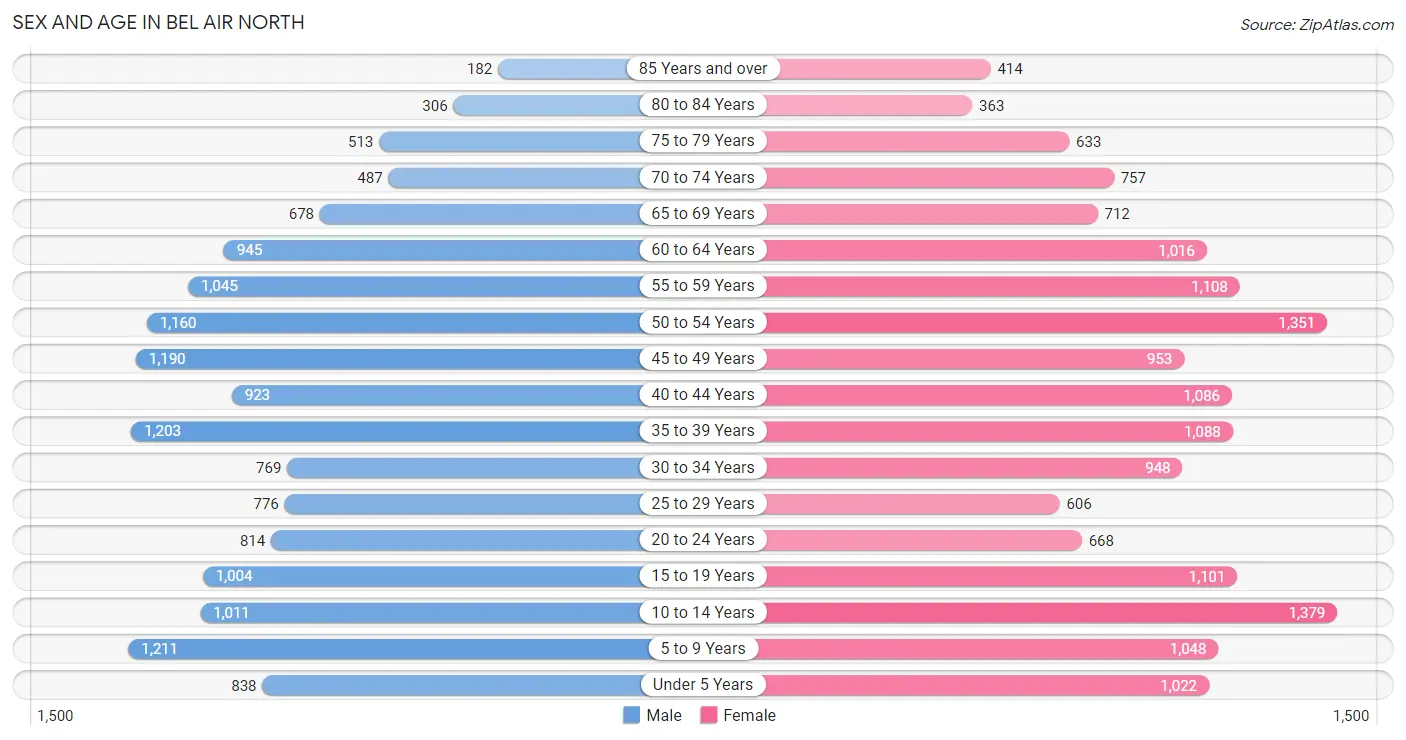
| Age Bracket | Male | Female |
| Under 5 Years | 838 (5.6%) | 1,022 (6.3%) |
| 5 to 9 Years | 1,211 (8.0%) | 1,048 (6.5%) |
| 10 to 14 Years | 1,011 (6.7%) | 1,379 (8.5%) |
| 15 to 19 Years | 1,004 (6.7%) | 1,101 (6.8%) |
| 20 to 24 Years | 814 (5.4%) | 668 (4.1%) |
| 25 to 29 Years | 776 (5.1%) | 606 (3.7%) |
| 30 to 34 Years | 769 (5.1%) | 948 (5.8%) |
| 35 to 39 Years | 1,203 (8.0%) | 1,088 (6.7%) |
| 40 to 44 Years | 923 (6.1%) | 1,086 (6.7%) |
| 45 to 49 Years | 1,190 (7.9%) | 953 (5.9%) |
| 50 to 54 Years | 1,160 (7.7%) | 1,351 (8.3%) |
| 55 to 59 Years | 1,045 (6.9%) | 1,108 (6.8%) |
| 60 to 64 Years | 945 (6.3%) | 1,016 (6.2%) |
| 65 to 69 Years | 678 (4.5%) | 712 (4.4%) |
| 70 to 74 Years | 487 (3.2%) | 757 (4.7%) |
| 75 to 79 Years | 513 (3.4%) | 633 (3.9%) |
| 80 to 84 Years | 306 (2.0%) | 363 (2.2%) |
| 85 Years and over | 182 (1.2%) | 414 (2.5%) |
| Total | 15,055 (100.0%) | 16,253 (100.0%) |
Families and Households in Bel Air North
Median Family Size in Bel Air North
The median family size in Bel Air North is 3.21 persons per family, with married-couple families (7,707 | 88.8%) accounting for the largest median family size of 3.28 persons per family. On the other hand, single female/mother families (617 | 7.1%) represent the smallest median family size with 2.65 persons per family.
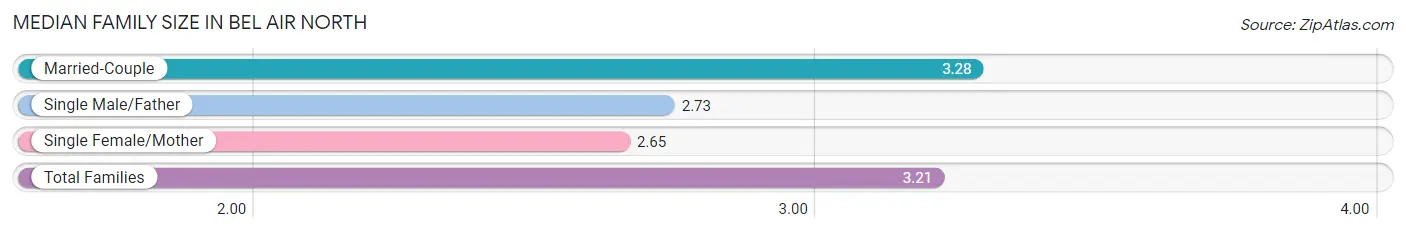
| Family Type | # Families | Family Size |
| Married-Couple | 7,707 (88.8%) | 3.28 |
| Single Male/Father | 350 (4.0%) | 2.73 |
| Single Female/Mother | 617 (7.1%) | 2.65 |
| Total Families | 8,674 (100.0%) | 3.21 |
Median Household Size in Bel Air North
The median household size in Bel Air North is 2.82 persons per household, with married-couple households (7,707 | 70.5%) accounting for the largest median household size of 3.29 persons per household. non-family households (2,255 | 20.6%) represent the smallest median household size with 1.14 persons per household.
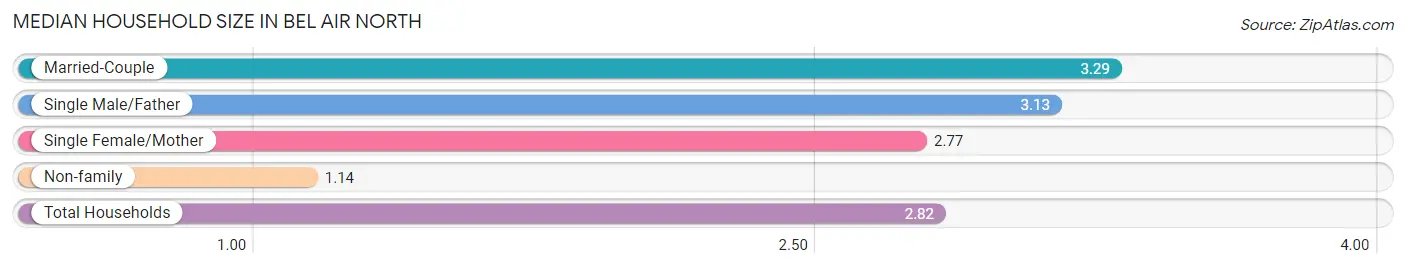
| Household Type | # Households | Household Size |
| Married-Couple | 7,707 (70.5%) | 3.29 |
| Single Male/Father | 350 (3.2%) | 3.13 |
| Single Female/Mother | 617 (5.7%) | 2.77 |
| Non-family | 2,255 (20.6%) | 1.14 |
| Total Households | 10,929 (100.0%) | 2.82 |
Household Size by Marriage Status in Bel Air North
Out of a total of 10,929 households in Bel Air North, 8,674 (79.4%) are family households, while 2,255 (20.6%) are nonfamily households. The most numerous type of family households are 2-person households, comprising 3,174, and the most common type of nonfamily households are 1-person households, comprising 1,967.
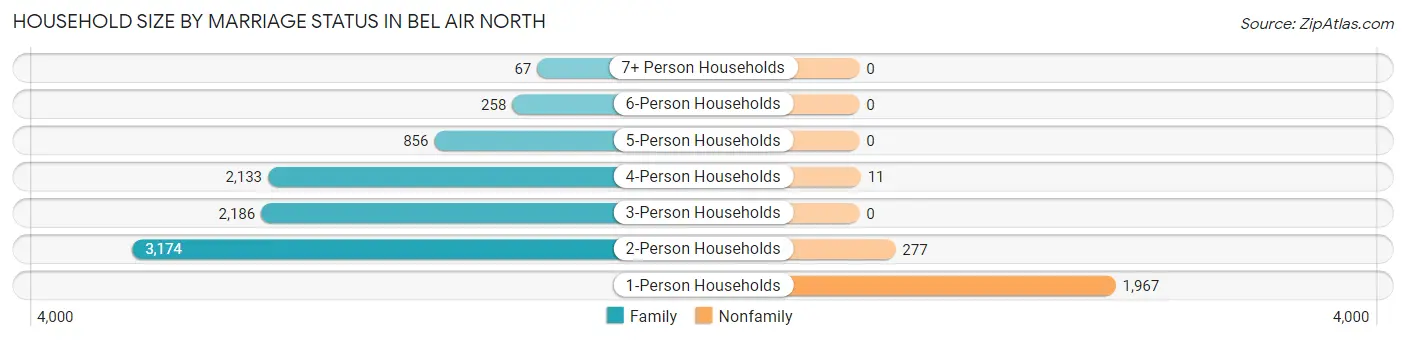
| Household Size | Family Households | Nonfamily Households |
| 1-Person Households | - | 1,967 (18.0%) |
| 2-Person Households | 3,174 (29.0%) | 277 (2.5%) |
| 3-Person Households | 2,186 (20.0%) | 0 (0.0%) |
| 4-Person Households | 2,133 (19.5%) | 11 (0.1%) |
| 5-Person Households | 856 (7.8%) | 0 (0.0%) |
| 6-Person Households | 258 (2.4%) | 0 (0.0%) |
| 7+ Person Households | 67 (0.6%) | 0 (0.0%) |
| Total | 8,674 (79.4%) | 2,255 (20.6%) |
Female Fertility in Bel Air North
Fertility by Age in Bel Air North
Average fertility rate in Bel Air North is 72.0 births per 1,000 women. Women in the age bracket of 20 to 34 years have the highest fertility rate with 125.0 births per 1,000 women. Women in the age bracket of 20 to 34 years acount for 57.1% of all women with births.
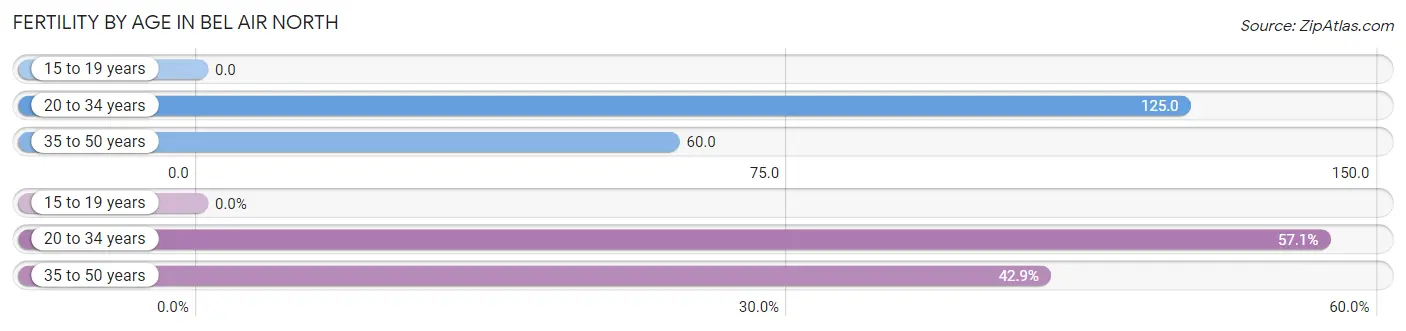
| Age Bracket | Women with Births | Births / 1,000 Women |
| 15 to 19 years | 0 (0.0%) | 0.0 |
| 20 to 34 years | 277 (57.1%) | 125.0 |
| 35 to 50 years | 208 (42.9%) | 60.0 |
| Total | 485 (100.0%) | 72.0 |
Fertility by Age by Marriage Status in Bel Air North
91.3% of women with births (485) in Bel Air North are married. The highest percentage of unmarried women with births falls into 35 to 50 years age bracket with 16.8% of them unmarried at the time of birth, while the lowest percentage of unmarried women with births belong to 20 to 34 years age bracket with 2.5% of them unmarried.
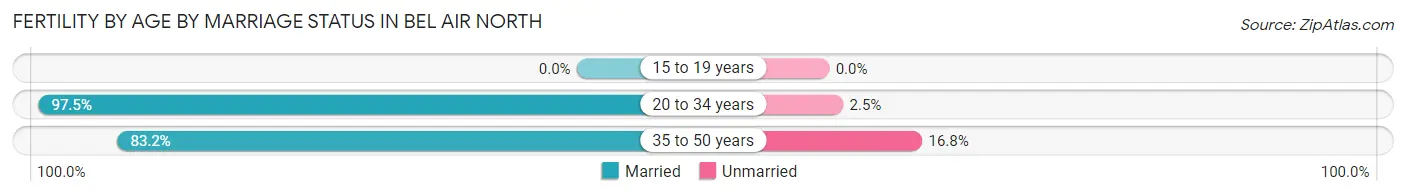
| Age Bracket | Married | Unmarried |
| 15 to 19 years | 0 (0.0%) | 0 (0.0%) |
| 20 to 34 years | 270 (97.5%) | 7 (2.5%) |
| 35 to 50 years | 173 (83.2%) | 35 (16.8%) |
| Total | 443 (91.3%) | 42 (8.7%) |
Fertility by Education in Bel Air North
Average fertility rate in Bel Air North is 72.0 births per 1,000 women. Women with the education attainment of high school diploma have the highest fertility rate of 117.0 births per 1,000 women, while women with the education attainment of less than high school have the lowest fertility at 7.0 births per 1,000 women. Women with the education attainment of bachelor's degree represent 42.5% of all women with births.
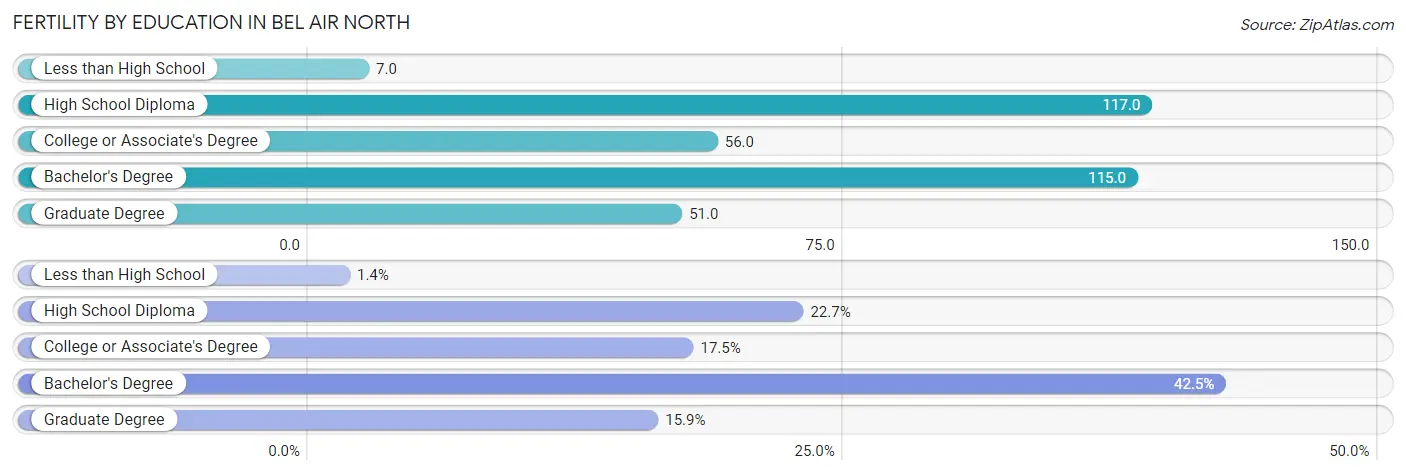
| Educational Attainment | Women with Births | Births / 1,000 Women |
| Less than High School | 7 (1.4%) | 7.0 |
| High School Diploma | 110 (22.7%) | 117.0 |
| College or Associate's Degree | 85 (17.5%) | 56.0 |
| Bachelor's Degree | 206 (42.5%) | 115.0 |
| Graduate Degree | 77 (15.9%) | 51.0 |
| Total | 485 (100.0%) | 72.0 |
Fertility by Education by Marriage Status in Bel Air North
8.7% of women with births in Bel Air North are unmarried. Women with the educational attainment of college or associate's degree are most likely to be married with 100.0% of them married at childbirth, while women with the educational attainment of less than high school are least likely to be married with 100.0% of them unmarried at childbirth.
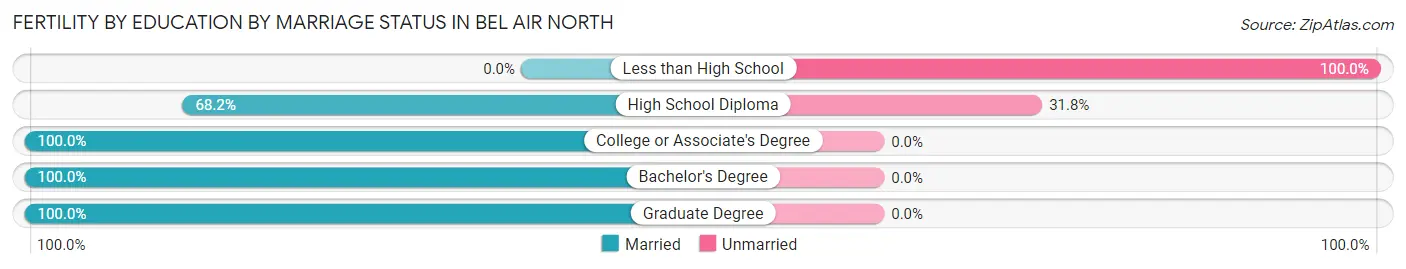
| Educational Attainment | Married | Unmarried |
| Less than High School | 0 (0.0%) | 7 (100.0%) |
| High School Diploma | 75 (68.2%) | 35 (31.8%) |
| College or Associate's Degree | 85 (100.0%) | 0 (0.0%) |
| Bachelor's Degree | 206 (100.0%) | 0 (0.0%) |
| Graduate Degree | 77 (100.0%) | 0 (0.0%) |
| Total | 443 (91.3%) | 42 (8.7%) |
Employment Characteristics in Bel Air North
Employment by Class of Employer in Bel Air North
Among the 15,925 employed individuals in Bel Air North, private company employees (9,859 | 61.9%), federal government employees (1,576 | 9.9%), and local government employees (1,567 | 9.8%) make up the most common classes of employment.
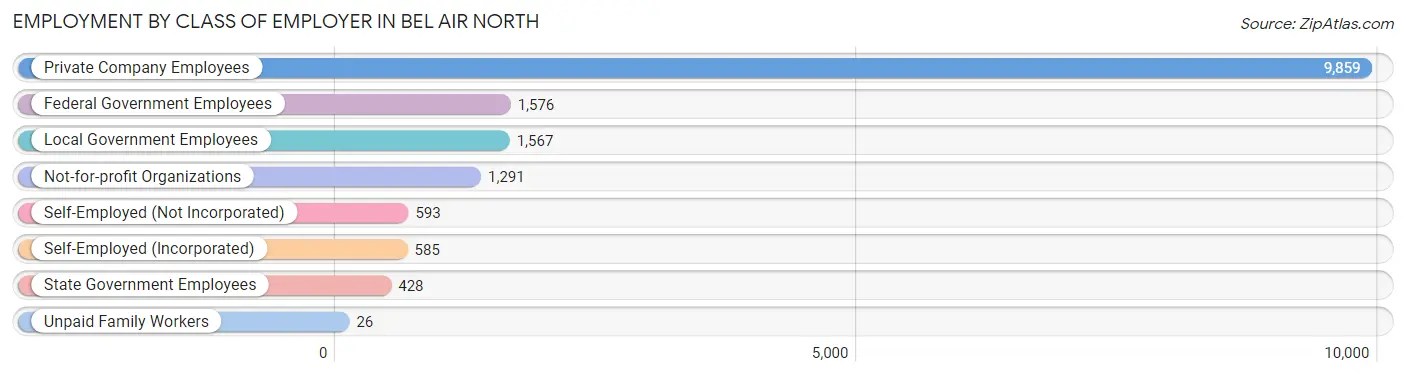
| Employer Class | # Employees | % Employees |
| Private Company Employees | 9,859 | 61.9% |
| Self-Employed (Incorporated) | 585 | 3.7% |
| Self-Employed (Not Incorporated) | 593 | 3.7% |
| Not-for-profit Organizations | 1,291 | 8.1% |
| Local Government Employees | 1,567 | 9.8% |
| State Government Employees | 428 | 2.7% |
| Federal Government Employees | 1,576 | 9.9% |
| Unpaid Family Workers | 26 | 0.2% |
| Total | 15,925 | 100.0% |
Employment Status by Age in Bel Air North
According to the labor force statistics for Bel Air North, out of the total population over 16 years of age (24,195), 68.5% or 16,574 individuals are in the labor force, with 2.5% or 414 of them unemployed. The age group with the highest labor force participation rate is 35 to 44 years, with 90.9% or 3,909 individuals in the labor force. Within the labor force, the 20 to 24 years age range has the highest percentage of unemployed individuals, with 6.9% or 78 of them being unemployed.
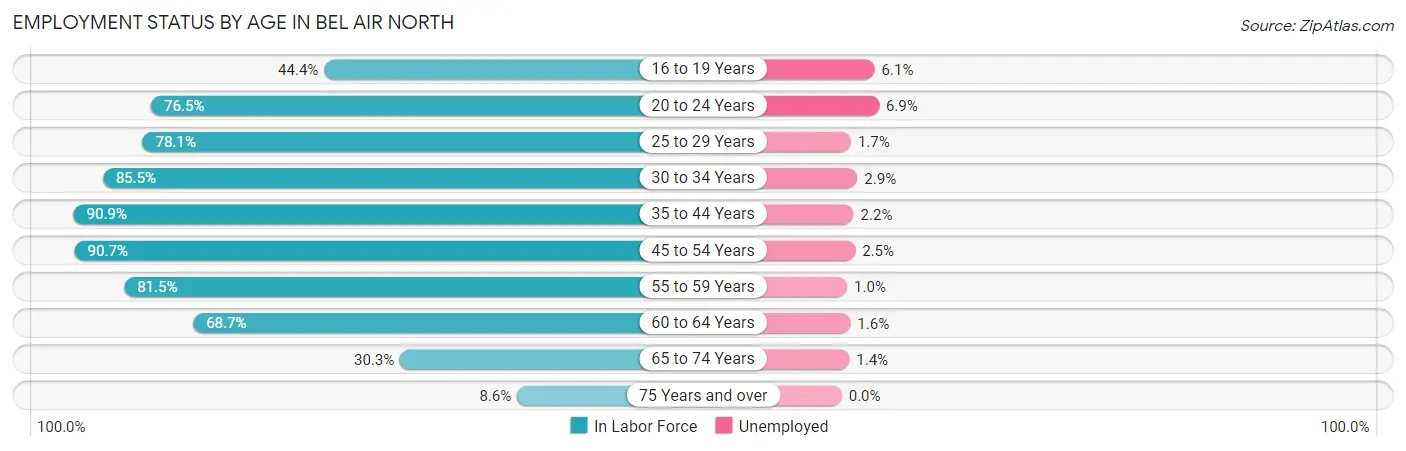
| Age Bracket | In Labor Force | Unemployed |
| 16 to 19 Years | 666 (44.4%) | 41 (6.1%) |
| 20 to 24 Years | 1,134 (76.5%) | 78 (6.9%) |
| 25 to 29 Years | 1,079 (78.1%) | 18 (1.7%) |
| 30 to 34 Years | 1,468 (85.5%) | 43 (2.9%) |
| 35 to 44 Years | 3,909 (90.9%) | 86 (2.2%) |
| 45 to 54 Years | 4,221 (90.7%) | 106 (2.5%) |
| 55 to 59 Years | 1,755 (81.5%) | 18 (1.0%) |
| 60 to 64 Years | 1,347 (68.7%) | 22 (1.6%) |
| 65 to 74 Years | 798 (30.3%) | 11 (1.4%) |
| 75 Years and over | 207 (8.6%) | 0 (0.0%) |
| Total | 16,574 (68.5%) | 414 (2.5%) |
Employment Status by Educational Attainment in Bel Air North
According to labor force statistics for Bel Air North, 85.2% of individuals (13,774) out of the total population between 25 and 64 years of age (16,167) are in the labor force, with 2.1% or 289 of them being unemployed. The group with the highest labor force participation rate are those with the educational attainment of bachelor's degree or higher, with 88.6% or 7,442 individuals in the labor force. Within the labor force, individuals with less than high school education have the highest percentage of unemployment, with 12.5% or 30 of them being unemployed.
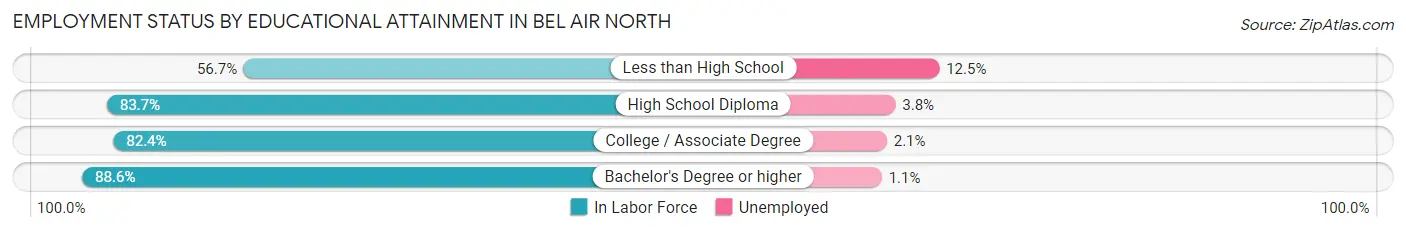
| Educational Attainment | In Labor Force | Unemployed |
| Less than High School | 240 (56.7%) | 53 (12.5%) |
| High School Diploma | 2,638 (83.7%) | 120 (3.8%) |
| College / Associate Degree | 3,454 (82.4%) | 88 (2.1%) |
| Bachelor's Degree or higher | 7,442 (88.6%) | 92 (1.1%) |
| Total | 13,774 (85.2%) | 340 (2.1%) |
Employment Occupations by Sex in Bel Air North
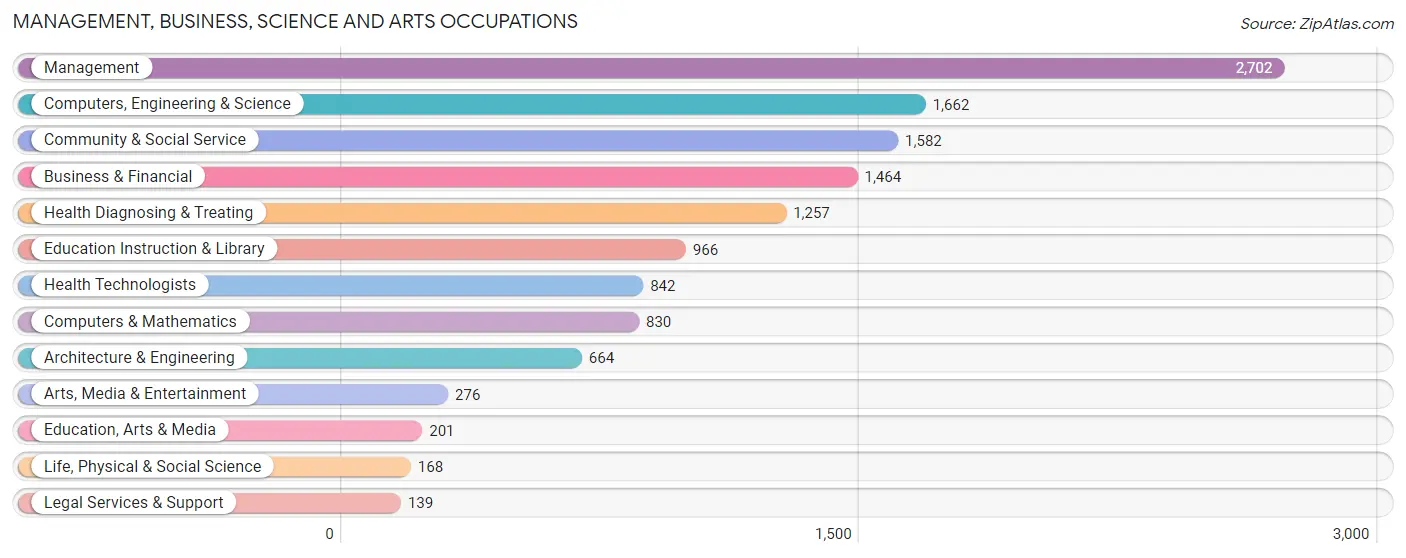
Management, Business, Science and Arts Occupations
The most common Management, Business, Science and Arts occupations in Bel Air North are Management (2,702 | 16.8%), Computers, Engineering & Science (1,662 | 10.3%), Community & Social Service (1,582 | 9.8%), Business & Financial (1,464 | 9.1%), and Health Diagnosing & Treating (1,257 | 7.8%).
Management, Business, Science and Arts Occupations by Sex
Within the Management, Business, Science and Arts occupations in Bel Air North, the most male-oriented occupations are Architecture & Engineering (78.9%), Computers & Mathematics (73.6%), and Computers, Engineering & Science (73.0%), while the most female-oriented occupations are Health Technologists (91.9%), Education, Arts & Media (85.1%), and Health Diagnosing & Treating (81.6%).
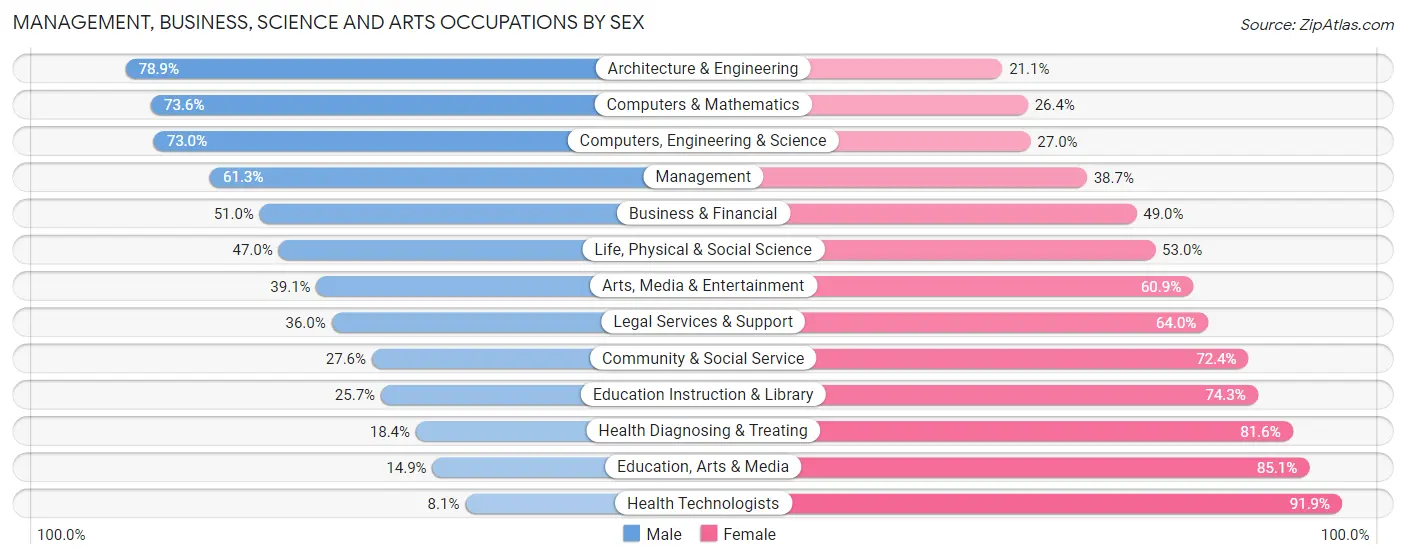
| Occupation | Male | Female |
| Management | 1,656 (61.3%) | 1,046 (38.7%) |
| Business & Financial | 746 (51.0%) | 718 (49.0%) |
| Computers, Engineering & Science | 1,214 (73.0%) | 448 (27.0%) |
| Computers & Mathematics | 611 (73.6%) | 219 (26.4%) |
| Architecture & Engineering | 524 (78.9%) | 140 (21.1%) |
| Life, Physical & Social Science | 79 (47.0%) | 89 (53.0%) |
| Community & Social Service | 436 (27.6%) | 1,146 (72.4%) |
| Education, Arts & Media | 30 (14.9%) | 171 (85.1%) |
| Legal Services & Support | 50 (36.0%) | 89 (64.0%) |
| Education Instruction & Library | 248 (25.7%) | 718 (74.3%) |
| Arts, Media & Entertainment | 108 (39.1%) | 168 (60.9%) |
| Health Diagnosing & Treating | 231 (18.4%) | 1,026 (81.6%) |
| Health Technologists | 68 (8.1%) | 774 (91.9%) |
| Total (Category) | 4,283 (49.4%) | 4,384 (50.6%) |
| Total (Overall) | 8,411 (52.2%) | 7,709 (47.8%) |
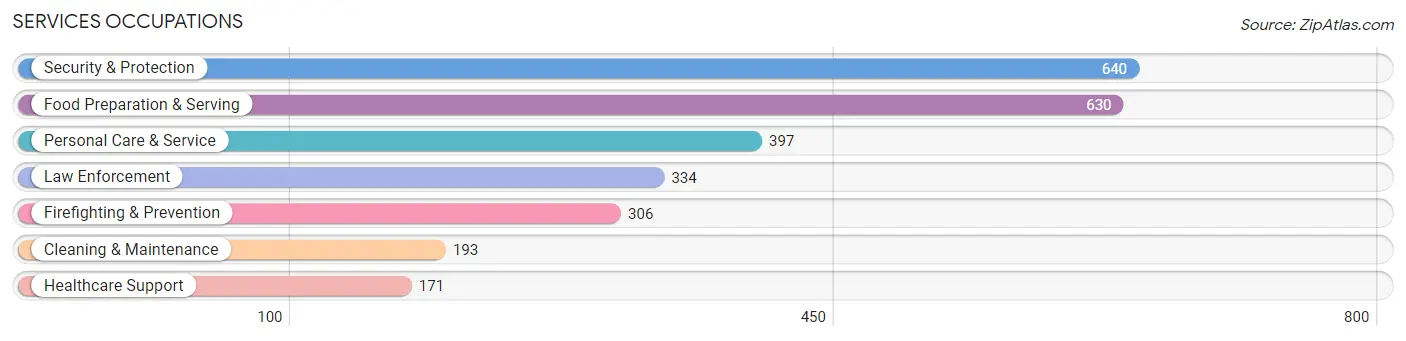
Services Occupations
The most common Services occupations in Bel Air North are Security & Protection (640 | 4.0%), Food Preparation & Serving (630 | 3.9%), Personal Care & Service (397 | 2.5%), Law Enforcement (334 | 2.1%), and Firefighting & Prevention (306 | 1.9%).
Services Occupations by Sex
Within the Services occupations in Bel Air North, the most male-oriented occupations are Law Enforcement (75.1%), Security & Protection (69.5%), and Firefighting & Prevention (63.4%), while the most female-oriented occupations are Healthcare Support (75.4%), Personal Care & Service (75.1%), and Food Preparation & Serving (63.0%).
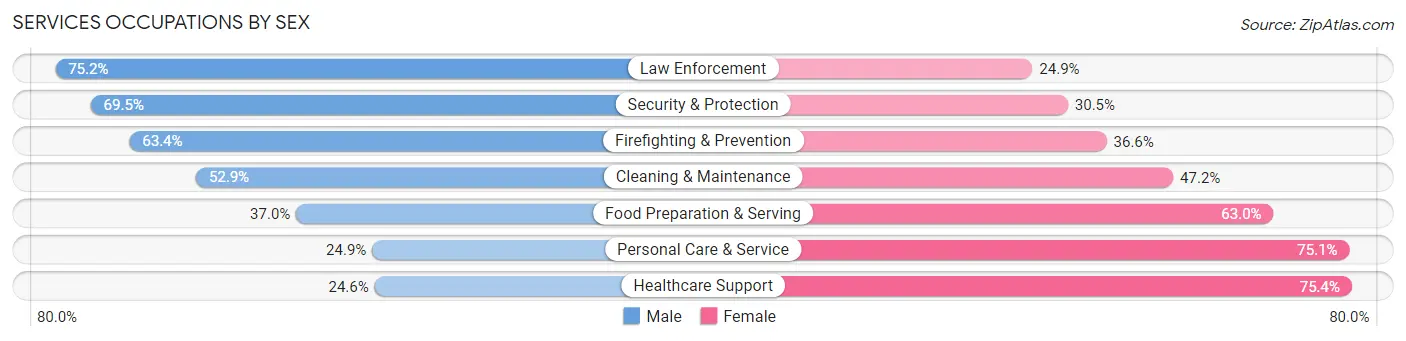
| Occupation | Male | Female |
| Healthcare Support | 42 (24.6%) | 129 (75.4%) |
| Security & Protection | 445 (69.5%) | 195 (30.5%) |
| Firefighting & Prevention | 194 (63.4%) | 112 (36.6%) |
| Law Enforcement | 251 (75.1%) | 83 (24.8%) |
| Food Preparation & Serving | 233 (37.0%) | 397 (63.0%) |
| Cleaning & Maintenance | 102 (52.8%) | 91 (47.1%) |
| Personal Care & Service | 99 (24.9%) | 298 (75.1%) |
| Total (Category) | 921 (45.4%) | 1,110 (54.6%) |
| Total (Overall) | 8,411 (52.2%) | 7,709 (47.8%) |
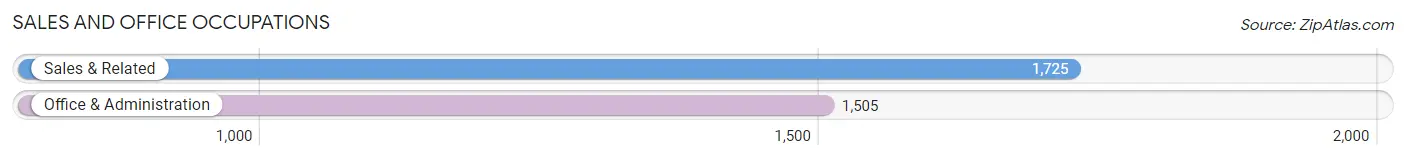
Sales and Office Occupations
The most common Sales and Office occupations in Bel Air North are Sales & Related (1,725 | 10.7%), and Office & Administration (1,505 | 9.3%).
Sales and Office Occupations by Sex
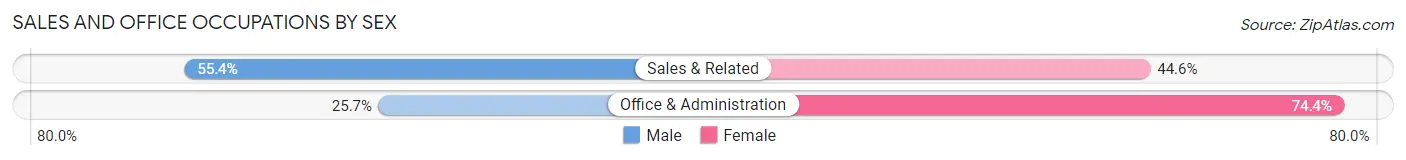
| Occupation | Male | Female |
| Sales & Related | 956 (55.4%) | 769 (44.6%) |
| Office & Administration | 386 (25.7%) | 1,119 (74.4%) |
| Total (Category) | 1,342 (41.5%) | 1,888 (58.5%) |
| Total (Overall) | 8,411 (52.2%) | 7,709 (47.8%) |
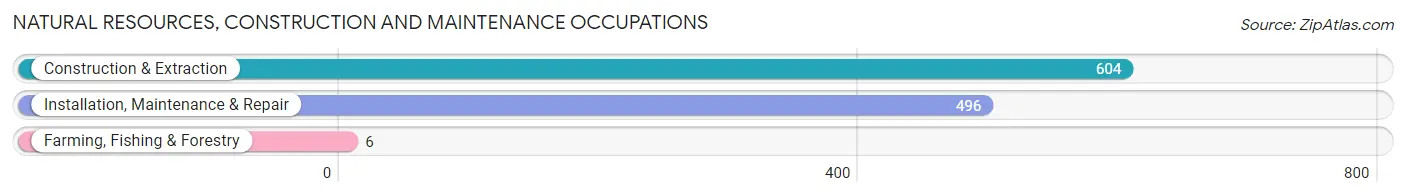
Natural Resources, Construction and Maintenance Occupations
The most common Natural Resources, Construction and Maintenance occupations in Bel Air North are Construction & Extraction (604 | 3.7%), Installation, Maintenance & Repair (496 | 3.1%), and Farming, Fishing & Forestry (6 | 0.0%).
Natural Resources, Construction and Maintenance Occupations by Sex
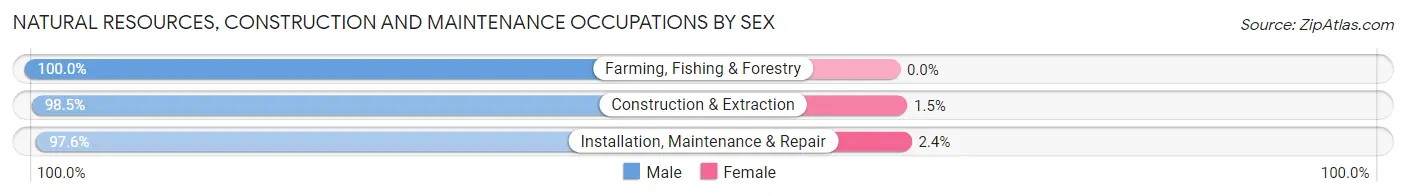
| Occupation | Male | Female |
| Farming, Fishing & Forestry | 6 (100.0%) | 0 (0.0%) |
| Construction & Extraction | 595 (98.5%) | 9 (1.5%) |
| Installation, Maintenance & Repair | 484 (97.6%) | 12 (2.4%) |
| Total (Category) | 1,085 (98.1%) | 21 (1.9%) |
| Total (Overall) | 8,411 (52.2%) | 7,709 (47.8%) |
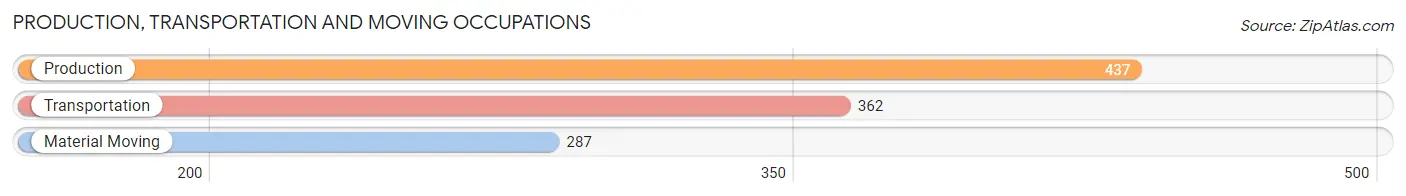
Production, Transportation and Moving Occupations
The most common Production, Transportation and Moving occupations in Bel Air North are Production (437 | 2.7%), Transportation (362 | 2.2%), and Material Moving (287 | 1.8%).
Production, Transportation and Moving Occupations by Sex
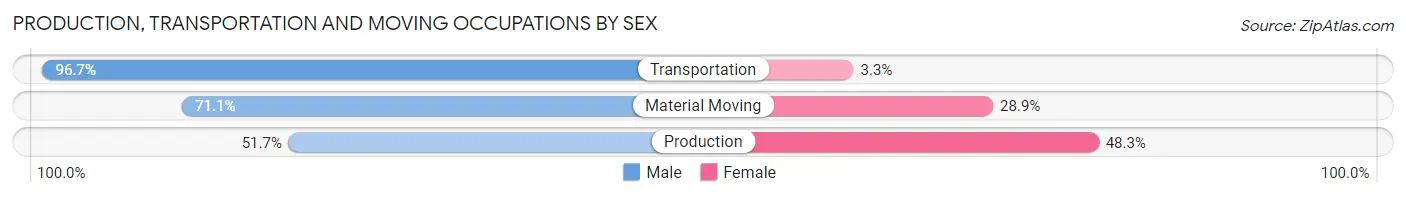
| Occupation | Male | Female |
| Production | 226 (51.7%) | 211 (48.3%) |
| Transportation | 350 (96.7%) | 12 (3.3%) |
| Material Moving | 204 (71.1%) | 83 (28.9%) |
| Total (Category) | 780 (71.8%) | 306 (28.2%) |
| Total (Overall) | 8,411 (52.2%) | 7,709 (47.8%) |
Employment Industries by Sex in Bel Air North
Employment Industries in Bel Air North
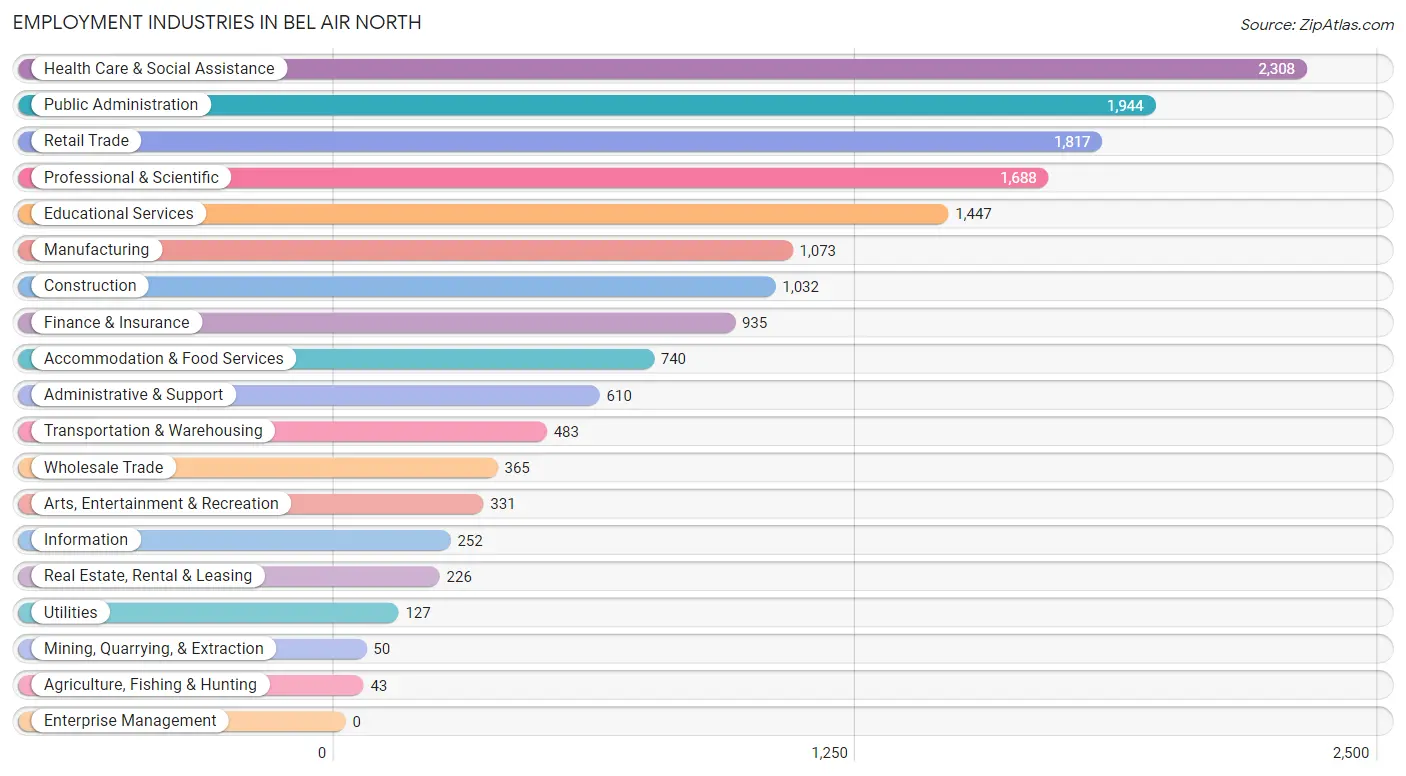
The major employment industries in Bel Air North include Health Care & Social Assistance (2,308 | 14.3%), Public Administration (1,944 | 12.1%), Retail Trade (1,817 | 11.3%), Professional & Scientific (1,688 | 10.5%), and Educational Services (1,447 | 9.0%).
Employment Industries by Sex in Bel Air North
The Bel Air North industries that see more men than women are Mining, Quarrying, & Extraction (100.0%), Construction (91.8%), and Transportation & Warehousing (87.8%), whereas the industries that tend to have a higher number of women are Health Care & Social Assistance (76.8%), Educational Services (74.0%), and Real Estate, Rental & Leasing (60.6%).
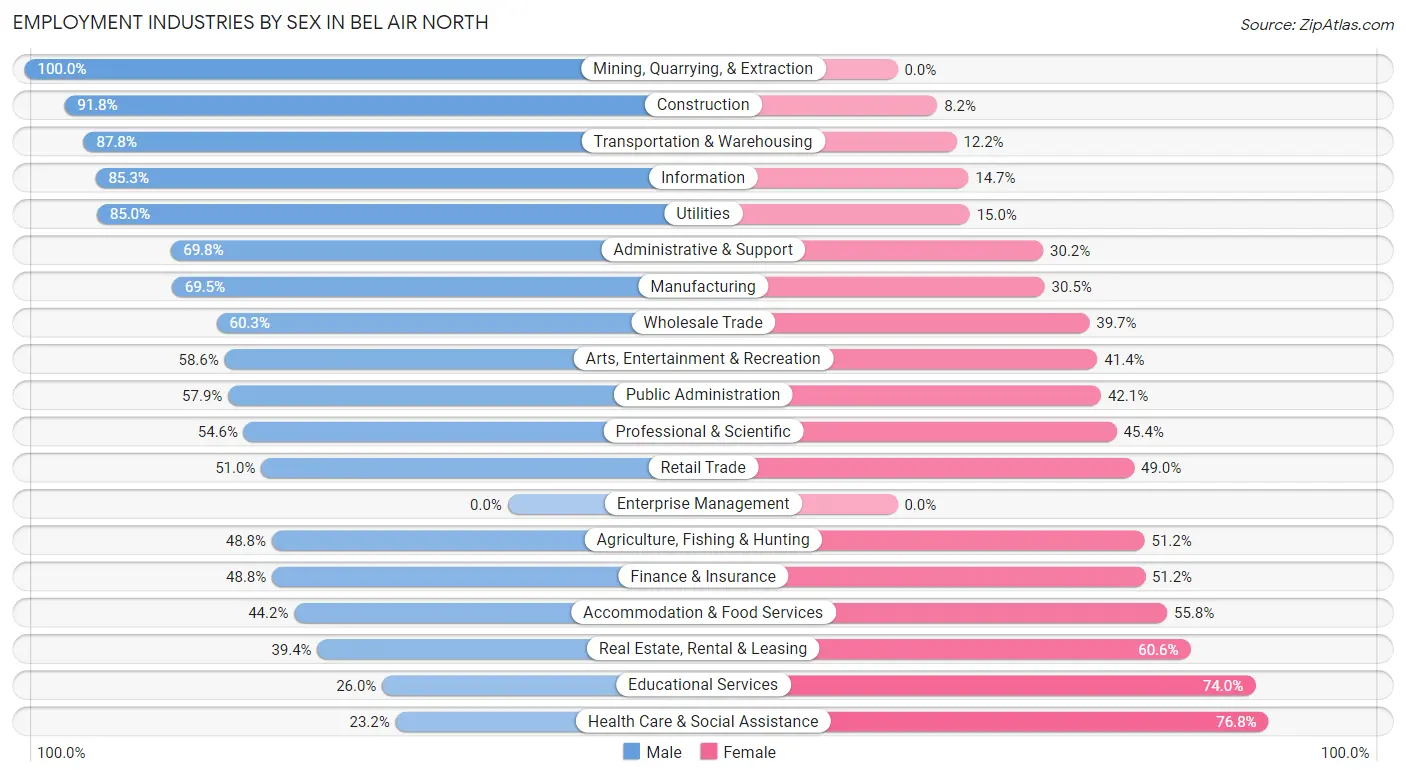
| Industry | Male | Female |
| Agriculture, Fishing & Hunting | 21 (48.8%) | 22 (51.2%) |
| Mining, Quarrying, & Extraction | 50 (100.0%) | 0 (0.0%) |
| Construction | 947 (91.8%) | 85 (8.2%) |
| Manufacturing | 746 (69.5%) | 327 (30.5%) |
| Wholesale Trade | 220 (60.3%) | 145 (39.7%) |
| Retail Trade | 927 (51.0%) | 890 (49.0%) |
| Transportation & Warehousing | 424 (87.8%) | 59 (12.2%) |
| Utilities | 108 (85.0%) | 19 (15.0%) |
| Information | 215 (85.3%) | 37 (14.7%) |
| Finance & Insurance | 456 (48.8%) | 479 (51.2%) |
| Real Estate, Rental & Leasing | 89 (39.4%) | 137 (60.6%) |
| Professional & Scientific | 922 (54.6%) | 766 (45.4%) |
| Enterprise Management | 0 (0.0%) | 0 (0.0%) |
| Administrative & Support | 426 (69.8%) | 184 (30.2%) |
| Educational Services | 376 (26.0%) | 1,071 (74.0%) |
| Health Care & Social Assistance | 536 (23.2%) | 1,772 (76.8%) |
| Arts, Entertainment & Recreation | 194 (58.6%) | 137 (41.4%) |
| Accommodation & Food Services | 327 (44.2%) | 413 (55.8%) |
| Public Administration | 1,125 (57.9%) | 819 (42.1%) |
| Total | 8,411 (52.2%) | 7,709 (47.8%) |
Education in Bel Air North
School Enrollment in Bel Air North
The most common levels of schooling among the 8,174 students in Bel Air North are middle school (2,030 | 24.8%), elementary school (1,880 | 23.0%), and high school (1,870 | 22.9%).
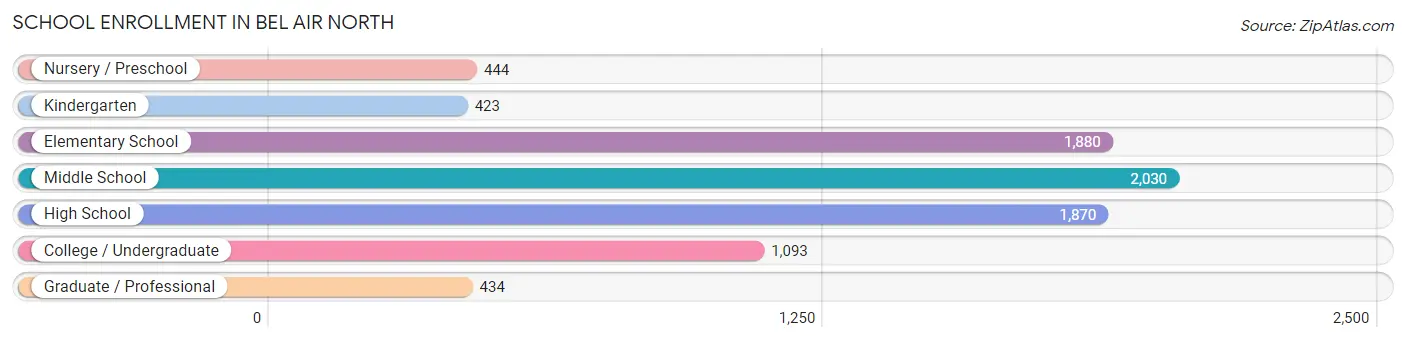
| School Level | # Students | % Students |
| Nursery / Preschool | 444 | 5.4% |
| Kindergarten | 423 | 5.2% |
| Elementary School | 1,880 | 23.0% |
| Middle School | 2,030 | 24.8% |
| High School | 1,870 | 22.9% |
| College / Undergraduate | 1,093 | 13.4% |
| Graduate / Professional | 434 | 5.3% |
| Total | 8,174 | 100.0% |
School Enrollment by Age by Funding Source in Bel Air North
Out of a total of 8,174 students who are enrolled in schools in Bel Air North, 1,185 (14.5%) attend a private institution, while the remaining 6,989 (85.5%) are enrolled in public schools. The age group of 3 to 4 year olds has the highest likelihood of being enrolled in private schools, with 216 (59.3% in the age bracket) enrolled. Conversely, the age group of 18 to 19 year olds has the lowest likelihood of being enrolled in a private school, with 523 (93.6% in the age bracket) attending a public institution.
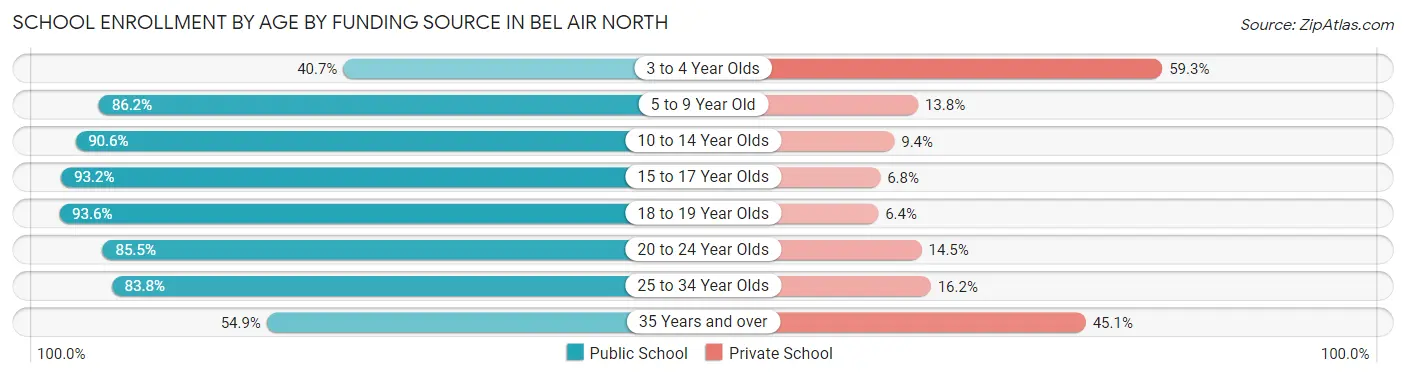
| Age Bracket | Public School | Private School |
| 3 to 4 Year Olds | 148 (40.7%) | 216 (59.3%) |
| 5 to 9 Year Old | 1,912 (86.2%) | 307 (13.8%) |
| 10 to 14 Year Olds | 2,142 (90.6%) | 223 (9.4%) |
| 15 to 17 Year Olds | 1,247 (93.2%) | 91 (6.8%) |
| 18 to 19 Year Olds | 523 (93.6%) | 36 (6.4%) |
| 20 to 24 Year Olds | 524 (85.5%) | 89 (14.5%) |
| 25 to 34 Year Olds | 284 (83.8%) | 55 (16.2%) |
| 35 Years and over | 207 (54.9%) | 170 (45.1%) |
| Total | 6,989 (85.5%) | 1,185 (14.5%) |
Educational Attainment by Field of Study in Bel Air North
Business (2,309 | 21.9%), education (1,431 | 13.6%), science & technology (1,194 | 11.3%), engineering (887 | 8.4%), and social sciences (747 | 7.1%) are the most common fields of study among 10,552 individuals in Bel Air North who have obtained a bachelor's degree or higher.
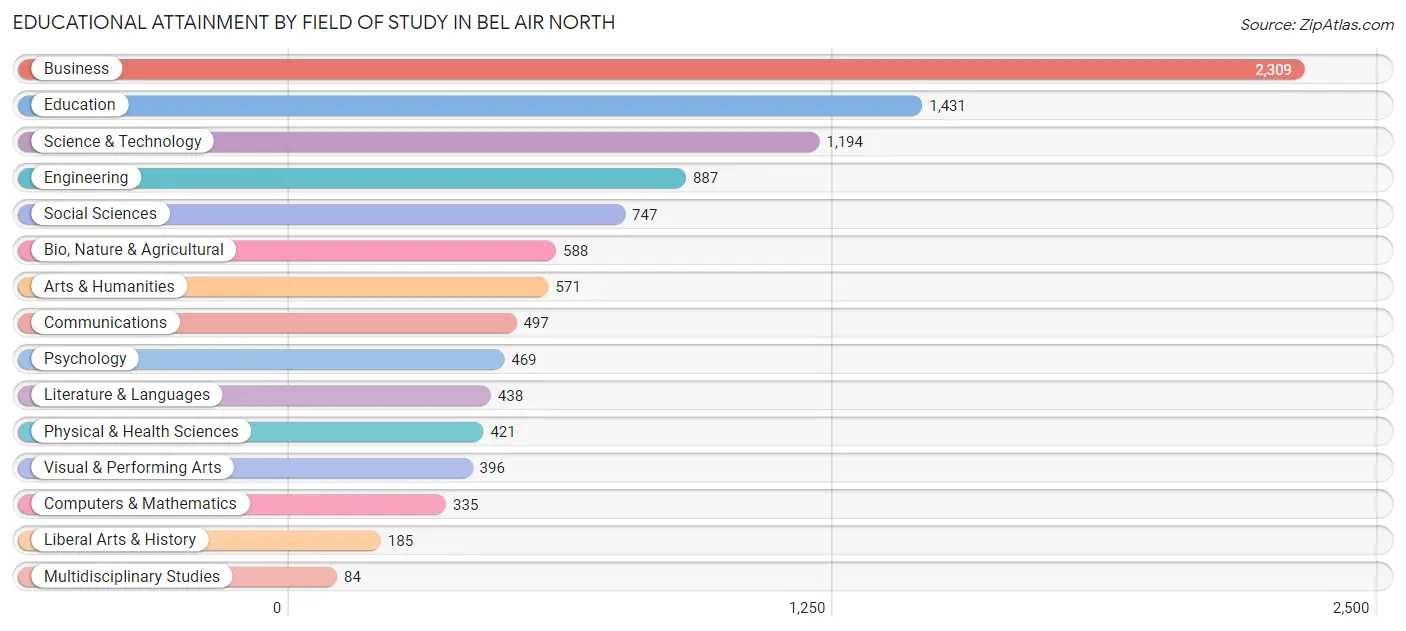
| Field of Study | # Graduates | % Graduates |
| Computers & Mathematics | 335 | 3.2% |
| Bio, Nature & Agricultural | 588 | 5.6% |
| Physical & Health Sciences | 421 | 4.0% |
| Psychology | 469 | 4.4% |
| Social Sciences | 747 | 7.1% |
| Engineering | 887 | 8.4% |
| Multidisciplinary Studies | 84 | 0.8% |
| Science & Technology | 1,194 | 11.3% |
| Business | 2,309 | 21.9% |
| Education | 1,431 | 13.6% |
| Literature & Languages | 438 | 4.2% |
| Liberal Arts & History | 185 | 1.8% |
| Visual & Performing Arts | 396 | 3.7% |
| Communications | 497 | 4.7% |
| Arts & Humanities | 571 | 5.4% |
| Total | 10,552 | 100.0% |
Transportation & Commute in Bel Air North
Vehicle Availability by Sex in Bel Air North
The most prevalent vehicle ownership categories in Bel Air North are males with 2 vehicles (4,005, accounting for 48.0%) and females with 2 vehicles (3,506, making up 52.9%).
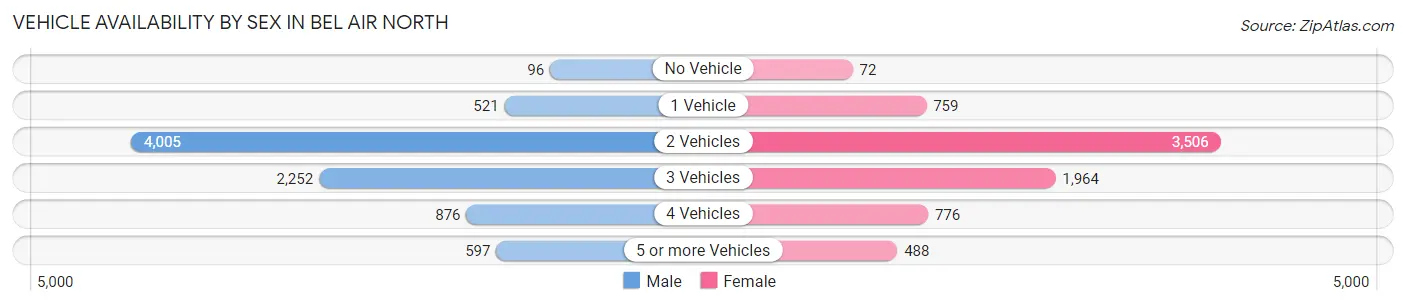
| Vehicles Available | Male | Female |
| No Vehicle | 96 (1.1%) | 72 (0.9%) |
| 1 Vehicle | 521 (6.2%) | 759 (10.0%) |
| 2 Vehicles | 4,005 (48.0%) | 3,506 (46.4%) |
| 3 Vehicles | 2,252 (27.0%) | 1,964 (26.0%) |
| 4 Vehicles | 876 (10.5%) | 776 (10.3%) |
| 5 or more Vehicles | 597 (7.1%) | 488 (6.5%) |
| Total | 8,347 (100.0%) | 7,565 (100.0%) |
Commute Time in Bel Air North
The most frequently occuring commute durations in Bel Air North are 45 to 59 minutes (2,366 commuters, 17.2%), 30 to 34 minutes (1,708 commuters, 12.4%), and 10 to 14 minutes (1,670 commuters, 12.1%).
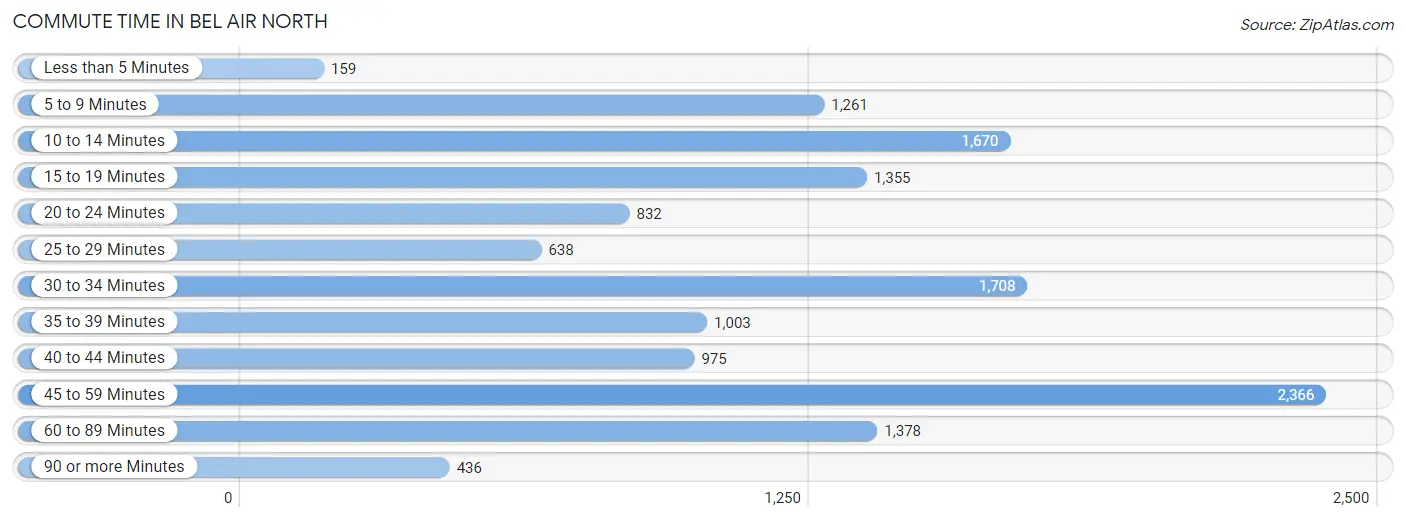
| Commute Time | # Commuters | % Commuters |
| Less than 5 Minutes | 159 | 1.1% |
| 5 to 9 Minutes | 1,261 | 9.1% |
| 10 to 14 Minutes | 1,670 | 12.1% |
| 15 to 19 Minutes | 1,355 | 9.8% |
| 20 to 24 Minutes | 832 | 6.0% |
| 25 to 29 Minutes | 638 | 4.6% |
| 30 to 34 Minutes | 1,708 | 12.4% |
| 35 to 39 Minutes | 1,003 | 7.3% |
| 40 to 44 Minutes | 975 | 7.1% |
| 45 to 59 Minutes | 2,366 | 17.2% |
| 60 to 89 Minutes | 1,378 | 10.0% |
| 90 or more Minutes | 436 | 3.2% |
Commute Time by Sex in Bel Air North
The most common commute times in Bel Air North are 45 to 59 minutes (1,451 commuters, 19.8%) for males and 10 to 14 minutes (1,158 commuters, 17.9%) for females.
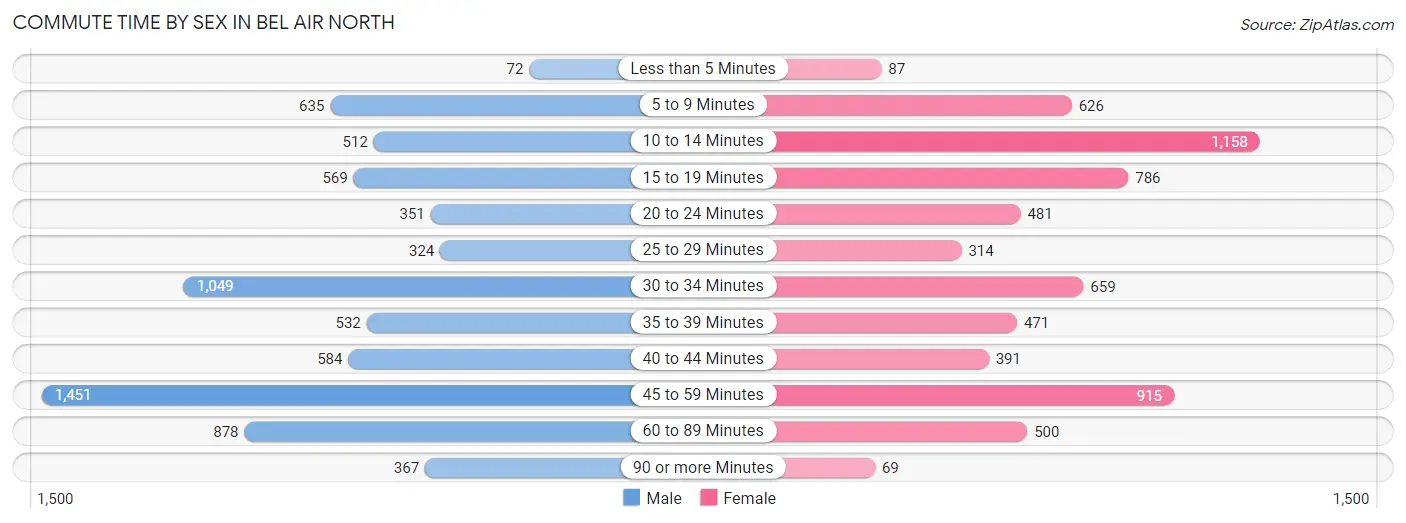
| Commute Time | Male | Female |
| Less than 5 Minutes | 72 (1.0%) | 87 (1.3%) |
| 5 to 9 Minutes | 635 (8.7%) | 626 (9.7%) |
| 10 to 14 Minutes | 512 (7.0%) | 1,158 (17.9%) |
| 15 to 19 Minutes | 569 (7.8%) | 786 (12.2%) |
| 20 to 24 Minutes | 351 (4.8%) | 481 (7.4%) |
| 25 to 29 Minutes | 324 (4.4%) | 314 (4.9%) |
| 30 to 34 Minutes | 1,049 (14.3%) | 659 (10.2%) |
| 35 to 39 Minutes | 532 (7.3%) | 471 (7.3%) |
| 40 to 44 Minutes | 584 (8.0%) | 391 (6.1%) |
| 45 to 59 Minutes | 1,451 (19.8%) | 915 (14.2%) |
| 60 to 89 Minutes | 878 (12.0%) | 500 (7.7%) |
| 90 or more Minutes | 367 (5.0%) | 69 (1.1%) |
Time of Departure to Work by Sex in Bel Air North
The most frequent times of departure to work in Bel Air North are 7:00 AM to 7:29 AM (1,534, 20.9%) for males and 7:00 AM to 7:29 AM (1,096, 17.0%) for females.
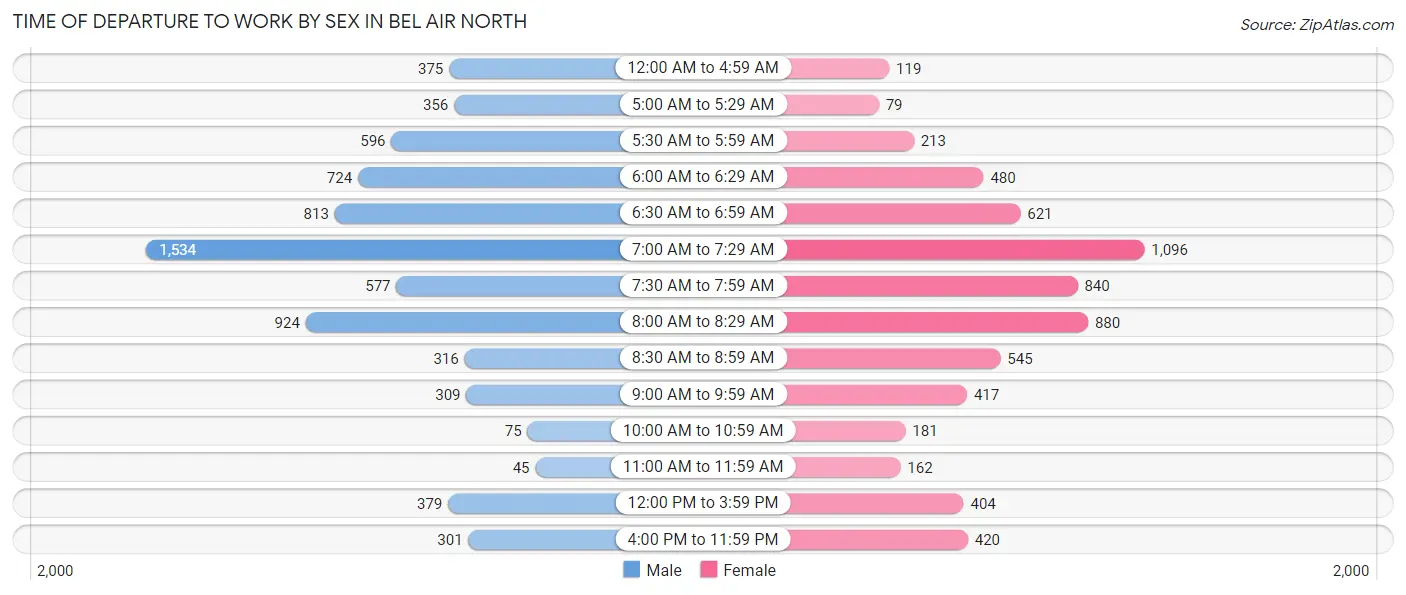
| Time of Departure | Male | Female |
| 12:00 AM to 4:59 AM | 375 (5.1%) | 119 (1.8%) |
| 5:00 AM to 5:29 AM | 356 (4.9%) | 79 (1.2%) |
| 5:30 AM to 5:59 AM | 596 (8.1%) | 213 (3.3%) |
| 6:00 AM to 6:29 AM | 724 (9.9%) | 480 (7.4%) |
| 6:30 AM to 6:59 AM | 813 (11.1%) | 621 (9.6%) |
| 7:00 AM to 7:29 AM | 1,534 (20.9%) | 1,096 (17.0%) |
| 7:30 AM to 7:59 AM | 577 (7.9%) | 840 (13.0%) |
| 8:00 AM to 8:29 AM | 924 (12.6%) | 880 (13.6%) |
| 8:30 AM to 8:59 AM | 316 (4.3%) | 545 (8.4%) |
| 9:00 AM to 9:59 AM | 309 (4.2%) | 417 (6.5%) |
| 10:00 AM to 10:59 AM | 75 (1.0%) | 181 (2.8%) |
| 11:00 AM to 11:59 AM | 45 (0.6%) | 162 (2.5%) |
| 12:00 PM to 3:59 PM | 379 (5.2%) | 404 (6.3%) |
| 4:00 PM to 11:59 PM | 301 (4.1%) | 420 (6.5%) |
| Total | 7,324 (100.0%) | 6,457 (100.0%) |
Housing Occupancy in Bel Air North
Occupancy by Ownership in Bel Air North
Of the total 10,929 dwellings in Bel Air North, owner-occupied units account for 9,955 (91.1%), while renter-occupied units make up 974 (8.9%).
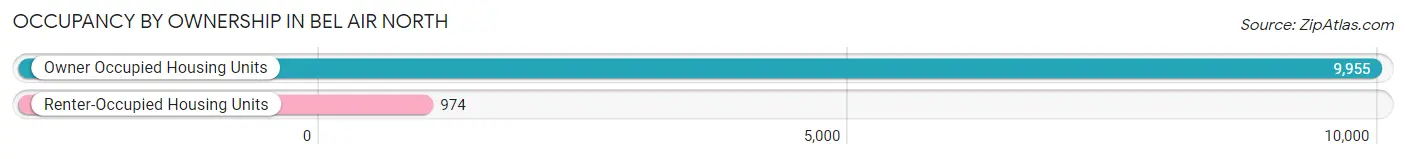
| Occupancy | # Housing Units | % Housing Units |
| Owner Occupied Housing Units | 9,955 | 91.1% |
| Renter-Occupied Housing Units | 974 | 8.9% |
| Total Occupied Housing Units | 10,929 | 100.0% |
Occupancy by Household Size in Bel Air North
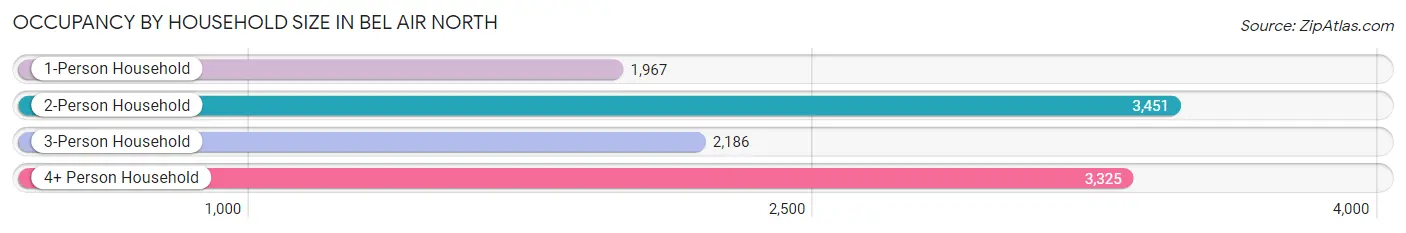
| Household Size | # Housing Units | % Housing Units |
| 1-Person Household | 1,967 | 18.0% |
| 2-Person Household | 3,451 | 31.6% |
| 3-Person Household | 2,186 | 20.0% |
| 4+ Person Household | 3,325 | 30.4% |
| Total Housing Units | 10,929 | 100.0% |
Occupancy by Ownership by Household Size in Bel Air North
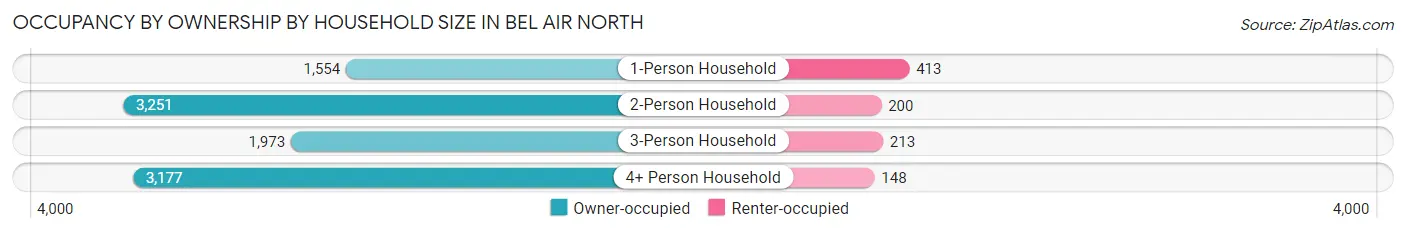
| Household Size | Owner-occupied | Renter-occupied |
| 1-Person Household | 1,554 (79.0%) | 413 (21.0%) |
| 2-Person Household | 3,251 (94.2%) | 200 (5.8%) |
| 3-Person Household | 1,973 (90.3%) | 213 (9.7%) |
| 4+ Person Household | 3,177 (95.6%) | 148 (4.4%) |
| Total Housing Units | 9,955 (91.1%) | 974 (8.9%) |
Occupancy by Educational Attainment in Bel Air North
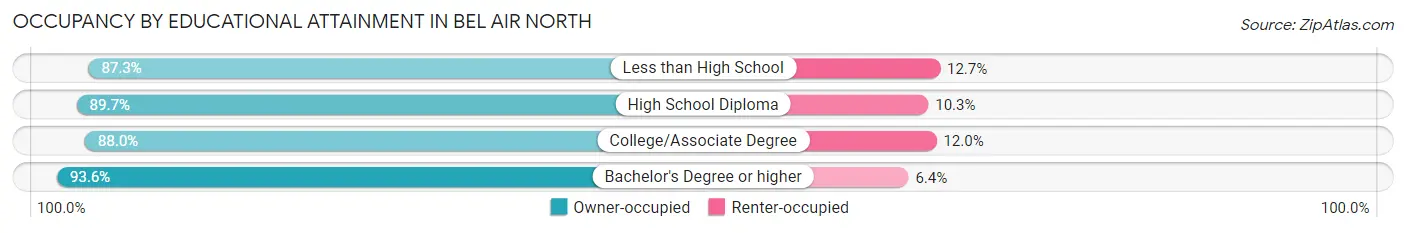
| Household Size | Owner-occupied | Renter-occupied |
| Less than High School | 317 (87.3%) | 46 (12.7%) |
| High School Diploma | 1,763 (89.7%) | 203 (10.3%) |
| College/Associate Degree | 2,753 (88.0%) | 374 (12.0%) |
| Bachelor's Degree or higher | 5,122 (93.6%) | 351 (6.4%) |
Occupancy by Age of Householder in Bel Air North
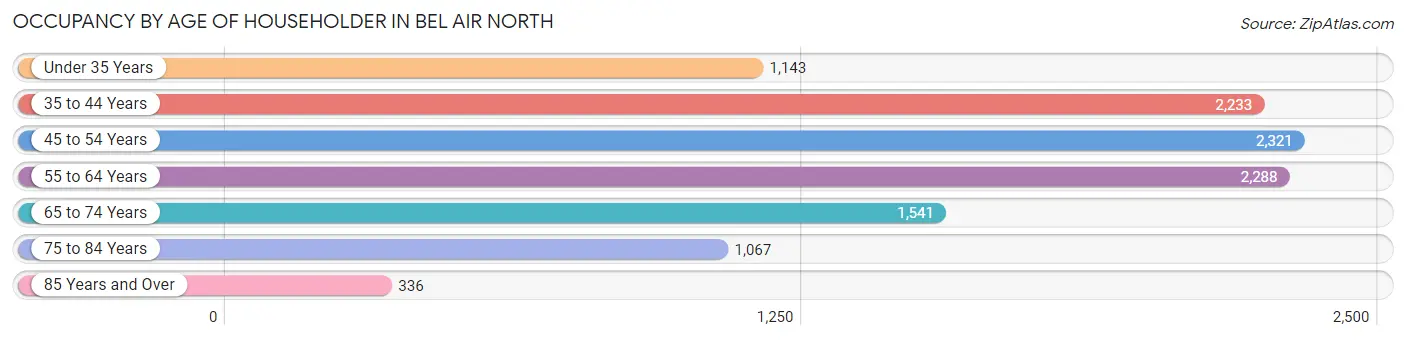
| Age Bracket | # Households | % Households |
| Under 35 Years | 1,143 | 10.5% |
| 35 to 44 Years | 2,233 | 20.4% |
| 45 to 54 Years | 2,321 | 21.2% |
| 55 to 64 Years | 2,288 | 20.9% |
| 65 to 74 Years | 1,541 | 14.1% |
| 75 to 84 Years | 1,067 | 9.8% |
| 85 Years and Over | 336 | 3.1% |
| Total | 10,929 | 100.0% |
Housing Finances in Bel Air North
Median Income by Occupancy in Bel Air North
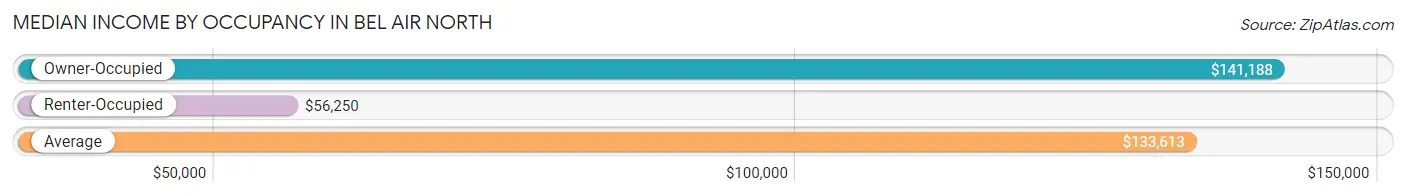
| Occupancy Type | # Households | Median Income |
| Owner-Occupied | 9,955 (91.1%) | $141,188 |
| Renter-Occupied | 974 (8.9%) | $56,250 |
| Average | 10,929 (100.0%) | $133,613 |
Occupancy by Householder Income Bracket in Bel Air North
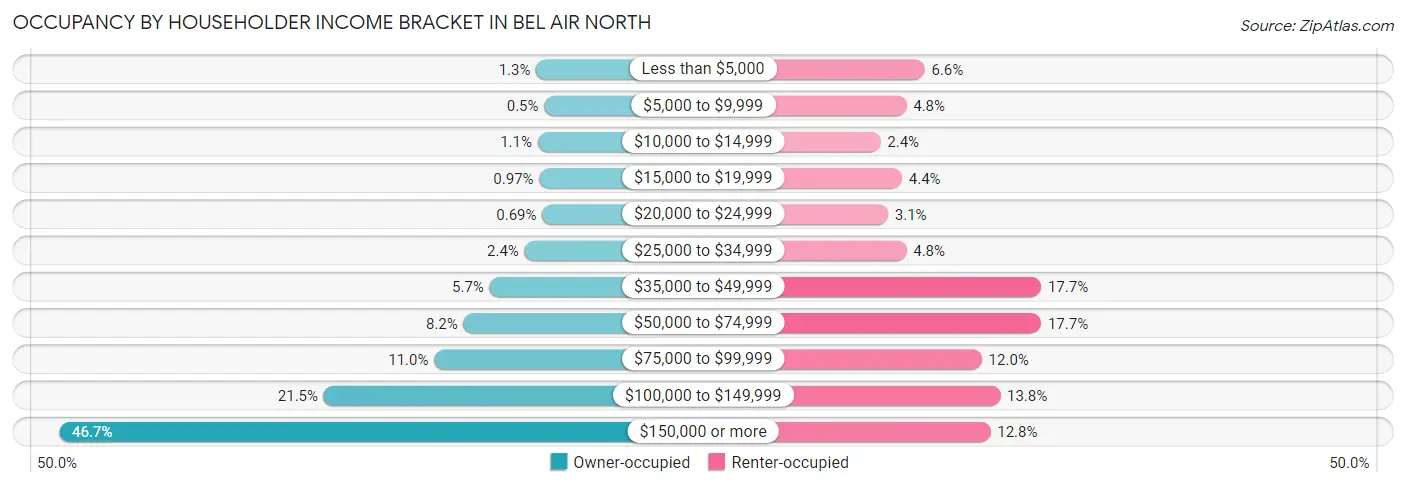
| Income Bracket | Owner-occupied | Renter-occupied |
| Less than $5,000 | 126 (1.3%) | 64 (6.6%) |
| $5,000 to $9,999 | 50 (0.5%) | 47 (4.8%) |
| $10,000 to $14,999 | 111 (1.1%) | 23 (2.4%) |
| $15,000 to $19,999 | 97 (1.0%) | 43 (4.4%) |
| $20,000 to $24,999 | 69 (0.7%) | 30 (3.1%) |
| $25,000 to $34,999 | 236 (2.4%) | 47 (4.8%) |
| $35,000 to $49,999 | 568 (5.7%) | 172 (17.7%) |
| $50,000 to $74,999 | 815 (8.2%) | 172 (17.7%) |
| $75,000 to $99,999 | 1,093 (11.0%) | 117 (12.0%) |
| $100,000 to $149,999 | 2,140 (21.5%) | 134 (13.8%) |
| $150,000 or more | 4,650 (46.7%) | 125 (12.8%) |
| Total | 9,955 (100.0%) | 974 (100.0%) |
Monthly Housing Cost Tiers in Bel Air North
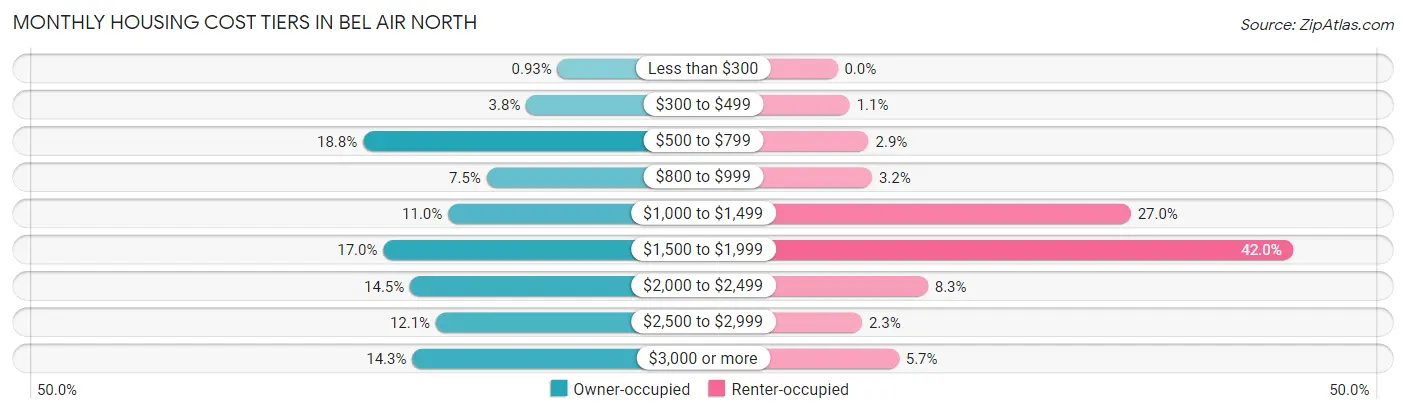
| Monthly Cost | Owner-occupied | Renter-occupied |
| Less than $300 | 93 (0.9%) | 0 (0.0%) |
| $300 to $499 | 380 (3.8%) | 11 (1.1%) |
| $500 to $799 | 1,876 (18.8%) | 28 (2.9%) |
| $800 to $999 | 743 (7.5%) | 31 (3.2%) |
| $1,000 to $1,499 | 1,096 (11.0%) | 263 (27.0%) |
| $1,500 to $1,999 | 1,690 (17.0%) | 409 (42.0%) |
| $2,000 to $2,499 | 1,444 (14.5%) | 81 (8.3%) |
| $2,500 to $2,999 | 1,208 (12.1%) | 22 (2.3%) |
| $3,000 or more | 1,425 (14.3%) | 55 (5.7%) |
| Total | 9,955 (100.0%) | 974 (100.0%) |
Physical Housing Characteristics in Bel Air North
Housing Structures in Bel Air North
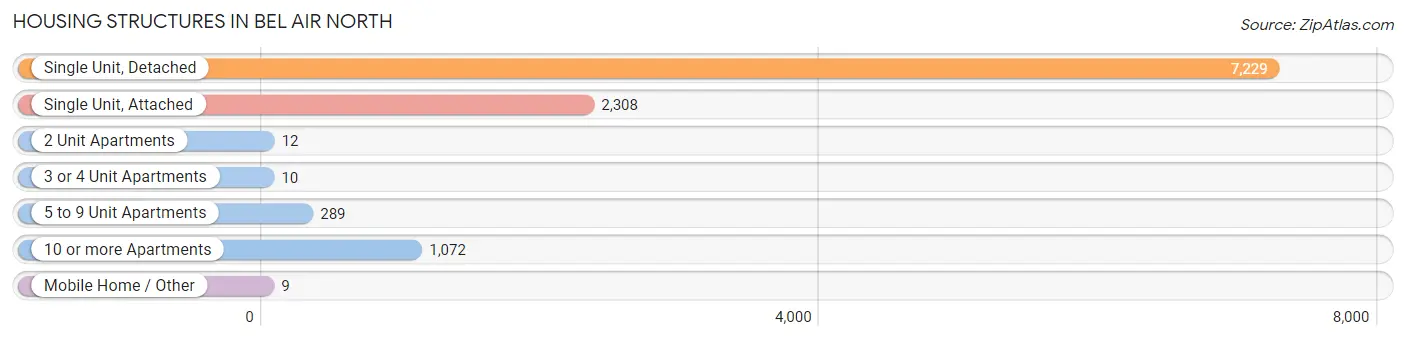
| Structure Type | # Housing Units | % Housing Units |
| Single Unit, Detached | 7,229 | 66.1% |
| Single Unit, Attached | 2,308 | 21.1% |
| 2 Unit Apartments | 12 | 0.1% |
| 3 or 4 Unit Apartments | 10 | 0.1% |
| 5 to 9 Unit Apartments | 289 | 2.6% |
| 10 or more Apartments | 1,072 | 9.8% |
| Mobile Home / Other | 9 | 0.1% |
| Total | 10,929 | 100.0% |
Housing Structures by Occupancy in Bel Air North
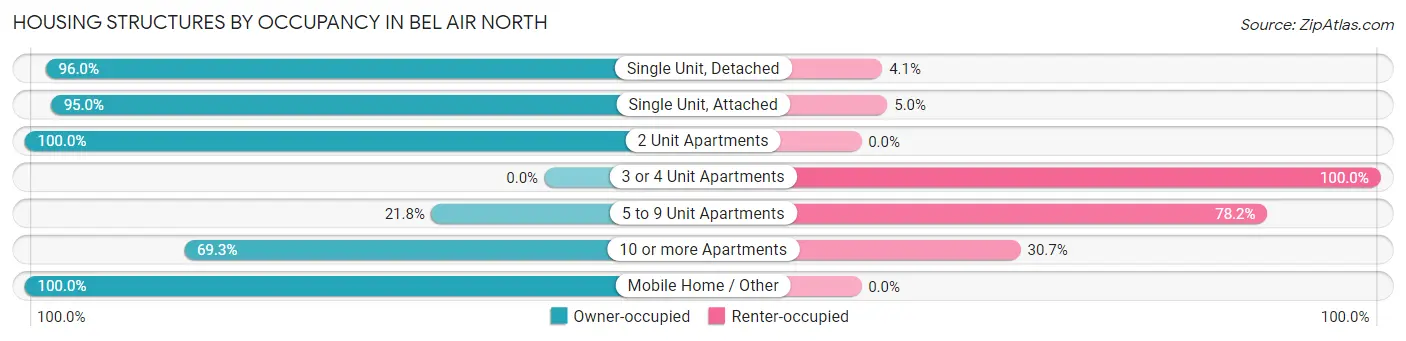
| Structure Type | Owner-occupied | Renter-occupied |
| Single Unit, Detached | 6,936 (96.0%) | 293 (4.1%) |
| Single Unit, Attached | 2,192 (95.0%) | 116 (5.0%) |
| 2 Unit Apartments | 12 (100.0%) | 0 (0.0%) |
| 3 or 4 Unit Apartments | 0 (0.0%) | 10 (100.0%) |
| 5 to 9 Unit Apartments | 63 (21.8%) | 226 (78.2%) |
| 10 or more Apartments | 743 (69.3%) | 329 (30.7%) |
| Mobile Home / Other | 9 (100.0%) | 0 (0.0%) |
| Total | 9,955 (91.1%) | 974 (8.9%) |
Housing Structures by Number of Rooms in Bel Air North
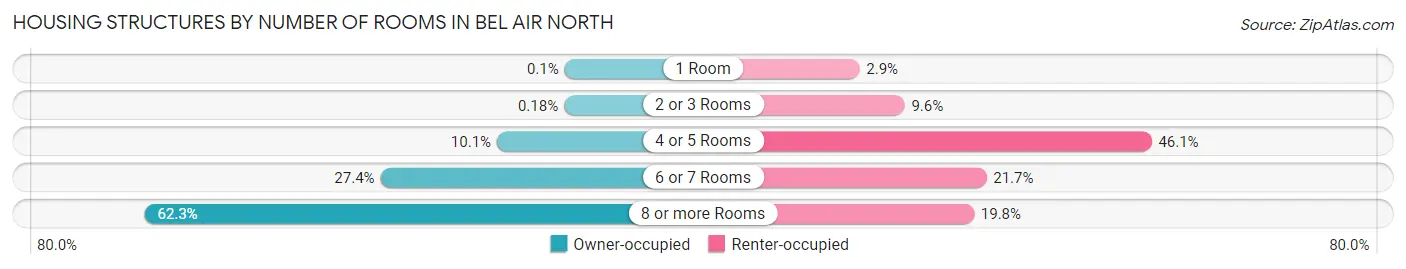
| Number of Rooms | Owner-occupied | Renter-occupied |
| 1 Room | 10 (0.1%) | 28 (2.9%) |
| 2 or 3 Rooms | 18 (0.2%) | 93 (9.6%) |
| 4 or 5 Rooms | 1,006 (10.1%) | 449 (46.1%) |
| 6 or 7 Rooms | 2,723 (27.4%) | 211 (21.7%) |
| 8 or more Rooms | 6,198 (62.3%) | 193 (19.8%) |
| Total | 9,955 (100.0%) | 974 (100.0%) |
Housing Structure by Heating Type in Bel Air North
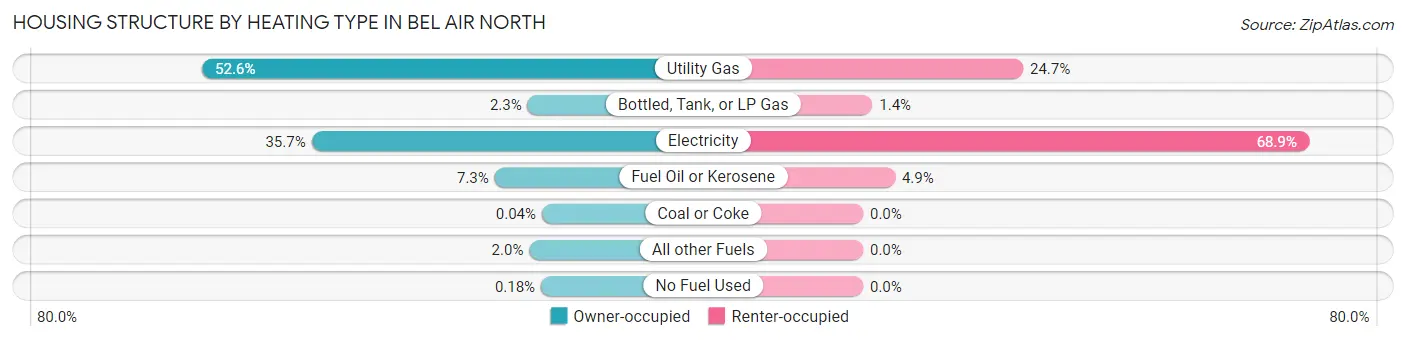
| Heating Type | Owner-occupied | Renter-occupied |
| Utility Gas | 5,231 (52.5%) | 241 (24.7%) |
| Bottled, Tank, or LP Gas | 224 (2.2%) | 14 (1.4%) |
| Electricity | 3,549 (35.6%) | 671 (68.9%) |
| Fuel Oil or Kerosene | 731 (7.3%) | 48 (4.9%) |
| Coal or Coke | 4 (0.0%) | 0 (0.0%) |
| All other Fuels | 198 (2.0%) | 0 (0.0%) |
| No Fuel Used | 18 (0.2%) | 0 (0.0%) |
| Total | 9,955 (100.0%) | 974 (100.0%) |
Household Vehicle Usage in Bel Air North
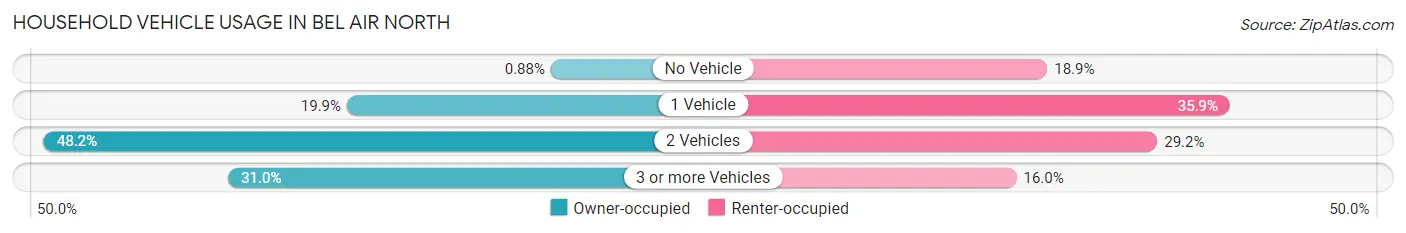
| Vehicles per Household | Owner-occupied | Renter-occupied |
| No Vehicle | 88 (0.9%) | 184 (18.9%) |
| 1 Vehicle | 1,983 (19.9%) | 350 (35.9%) |
| 2 Vehicles | 4,798 (48.2%) | 284 (29.2%) |
| 3 or more Vehicles | 3,086 (31.0%) | 156 (16.0%) |
| Total | 9,955 (100.0%) | 974 (100.0%) |
Real Estate & Mortgages in Bel Air North
Real Estate and Mortgage Overview in Bel Air North
| Characteristic | Without Mortgage | With Mortgage |
| Housing Units | 3,025 | 6,930 |
| Median Property Value | $357,500 | $427,500 |
| Median Household Income | $94,284 | $3,860 |
| Monthly Housing Costs | $664 | $1,414 |
| Real Estate Taxes | $3,456 | $93 |
Property Value by Mortgage Status in Bel Air North
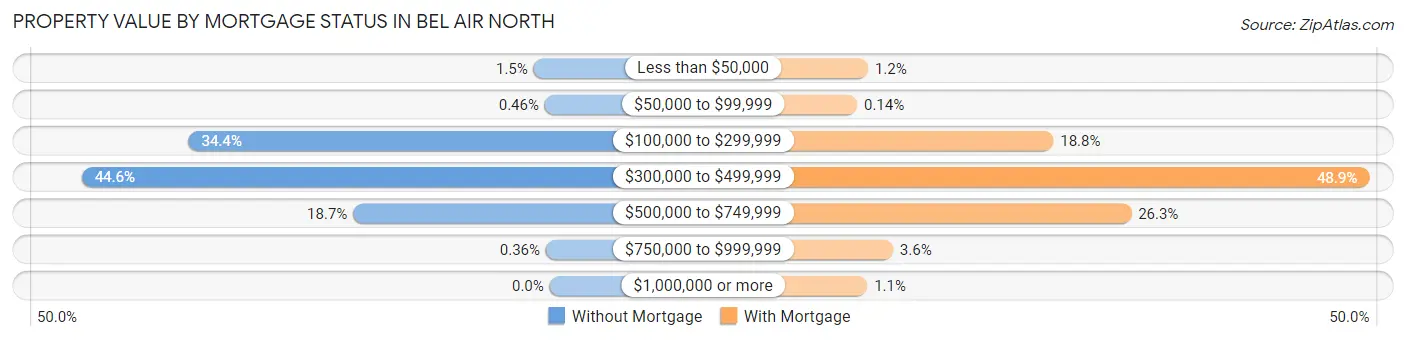
| Property Value | Without Mortgage | With Mortgage |
| Less than $50,000 | 46 (1.5%) | 82 (1.2%) |
| $50,000 to $99,999 | 14 (0.5%) | 10 (0.1%) |
| $100,000 to $299,999 | 1,040 (34.4%) | 1,305 (18.8%) |
| $300,000 to $499,999 | 1,348 (44.6%) | 3,390 (48.9%) |
| $500,000 to $749,999 | 566 (18.7%) | 1,819 (26.3%) |
| $750,000 to $999,999 | 11 (0.4%) | 247 (3.6%) |
| $1,000,000 or more | 0 (0.0%) | 77 (1.1%) |
| Total | 3,025 (100.0%) | 6,930 (100.0%) |
Household Income by Mortgage Status in Bel Air North
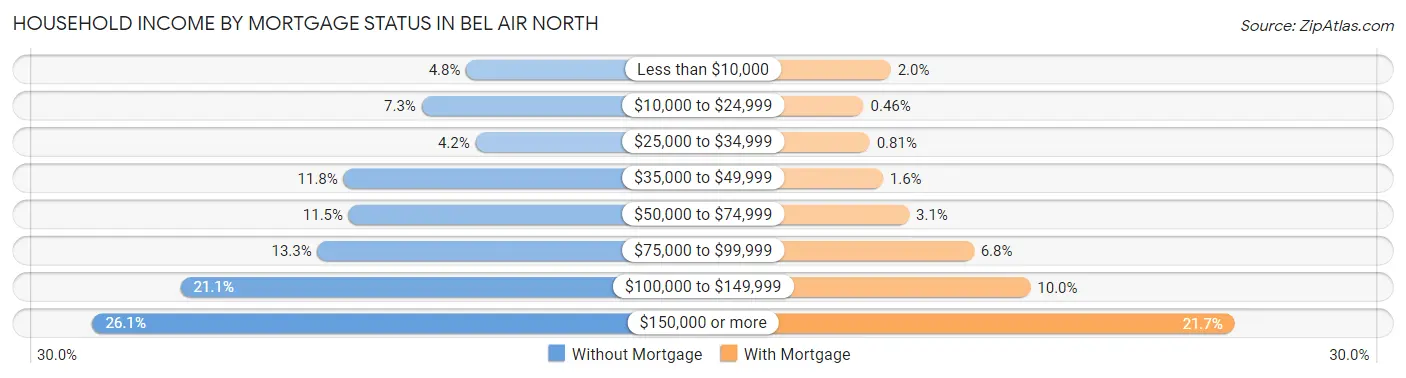
| Household Income | Without Mortgage | With Mortgage |
| Less than $10,000 | 144 (4.8%) | 139 (2.0%) |
| $10,000 to $24,999 | 221 (7.3%) | 32 (0.5%) |
| $25,000 to $34,999 | 128 (4.2%) | 56 (0.8%) |
| $35,000 to $49,999 | 356 (11.8%) | 108 (1.6%) |
| $50,000 to $74,999 | 347 (11.5%) | 212 (3.1%) |
| $75,000 to $99,999 | 401 (13.3%) | 468 (6.8%) |
| $100,000 to $149,999 | 638 (21.1%) | 692 (10.0%) |
| $150,000 or more | 790 (26.1%) | 1,502 (21.7%) |
| Total | 3,025 (100.0%) | 6,930 (100.0%) |
Property Value to Household Income Ratio in Bel Air North
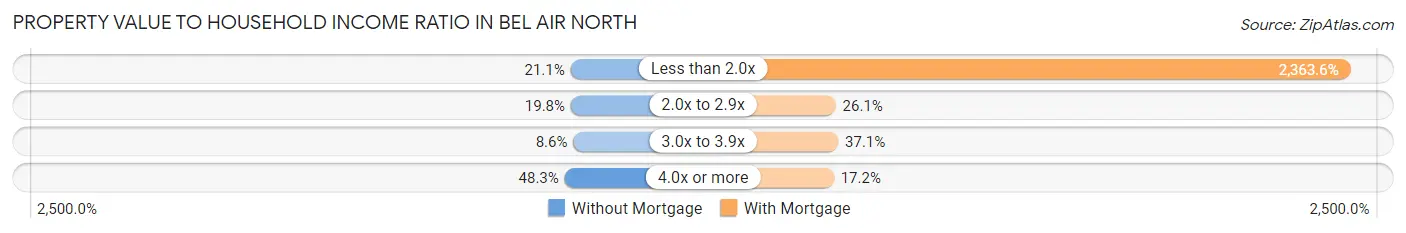
| Value-to-Income Ratio | Without Mortgage | With Mortgage |
| Less than 2.0x | 639 (21.1%) | 163,799 (2,363.6%) |
| 2.0x to 2.9x | 599 (19.8%) | 1,811 (26.1%) |
| 3.0x to 3.9x | 261 (8.6%) | 2,572 (37.1%) |
| 4.0x or more | 1,461 (48.3%) | 1,193 (17.2%) |
| Total | 3,025 (100.0%) | 6,930 (100.0%) |
Real Estate Taxes by Mortgage Status in Bel Air North
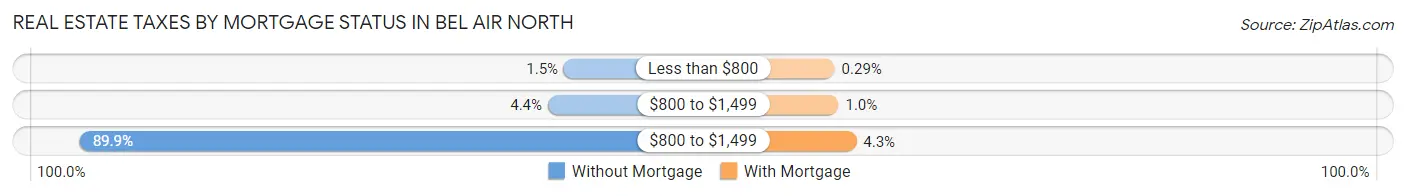
| Property Taxes | Without Mortgage | With Mortgage |
| Less than $800 | 45 (1.5%) | 20 (0.3%) |
| $800 to $1,499 | 134 (4.4%) | 69 (1.0%) |
| $800 to $1,499 | 2,720 (89.9%) | 295 (4.3%) |
| Total | 3,025 (100.0%) | 6,930 (100.0%) |
Health & Disability in Bel Air North
Health Insurance Coverage by Age in Bel Air North

| Age Bracket | With Coverage | Without Coverage |
| Under 6 Years | 2,036 (96.7%) | 69 (3.3%) |
| 6 to 18 Years | 5,940 (95.4%) | 290 (4.6%) |
| 19 to 25 Years | 1,893 (95.9%) | 81 (4.1%) |
| 26 to 34 Years | 2,652 (98.1%) | 51 (1.9%) |
| 35 to 44 Years | 4,111 (97.4%) | 109 (2.6%) |
| 45 to 54 Years | 4,520 (98.5%) | 67 (1.5%) |
| 55 to 64 Years | 4,054 (99.1%) | 35 (0.9%) |
| 65 to 74 Years | 2,526 (96.8%) | 84 (3.2%) |
| 75 Years and older | 2,273 (99.7%) | 7 (0.3%) |
| Total | 30,005 (97.4%) | 793 (2.6%) |
Health Insurance Coverage by Citizenship Status in Bel Air North
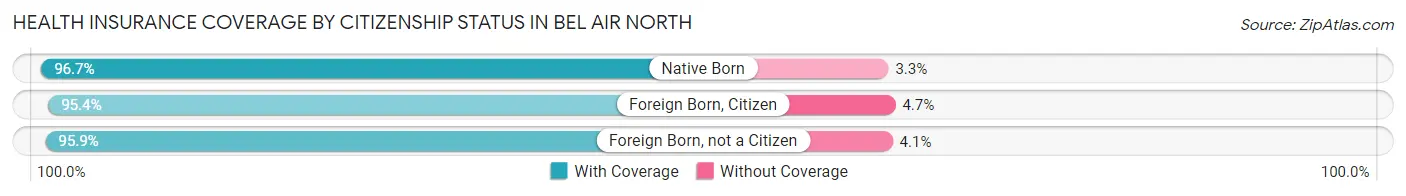
| Citizenship Status | With Coverage | Without Coverage |
| Native Born | 2,036 (96.7%) | 69 (3.3%) |
| Foreign Born, Citizen | 5,940 (95.4%) | 290 (4.6%) |
| Foreign Born, not a Citizen | 1,893 (95.9%) | 81 (4.1%) |
Health Insurance Coverage by Household Income in Bel Air North
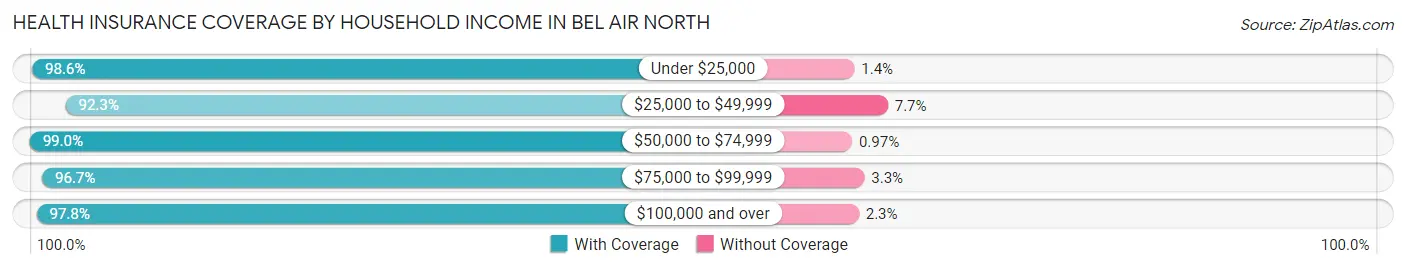
| Household Income | With Coverage | Without Coverage |
| Under $25,000 | 910 (98.6%) | 13 (1.4%) |
| $25,000 to $49,999 | 1,780 (92.3%) | 148 (7.7%) |
| $50,000 to $74,999 | 1,844 (99.0%) | 18 (1.0%) |
| $75,000 to $99,999 | 2,762 (96.7%) | 94 (3.3%) |
| $100,000 and over | 22,637 (97.8%) | 520 (2.2%) |
Public vs Private Health Insurance Coverage by Age in Bel Air North
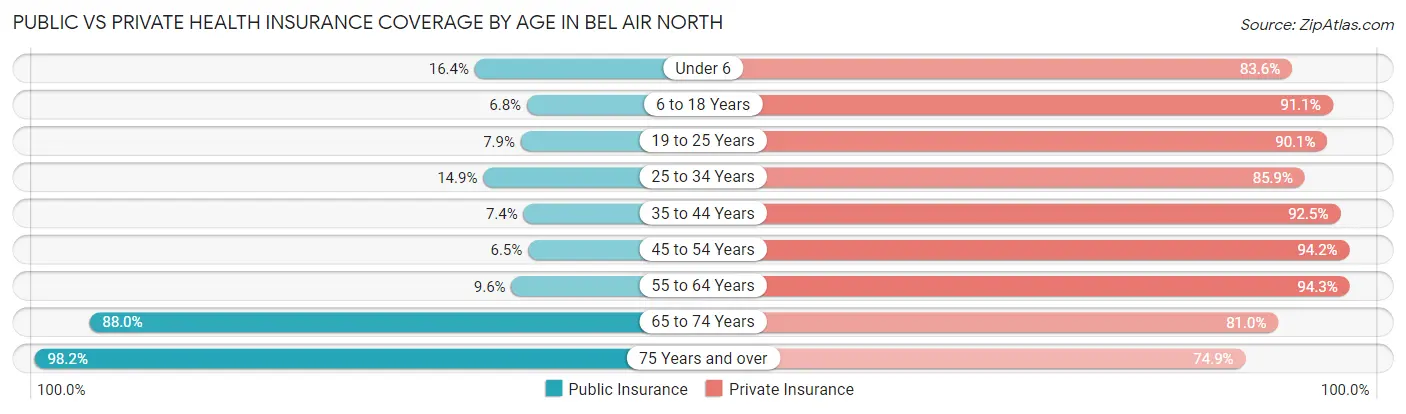
| Age Bracket | Public Insurance | Private Insurance |
| Under 6 | 346 (16.4%) | 1,759 (83.6%) |
| 6 to 18 Years | 421 (6.8%) | 5,675 (91.1%) |
| 19 to 25 Years | 156 (7.9%) | 1,779 (90.1%) |
| 25 to 34 Years | 402 (14.9%) | 2,323 (85.9%) |
| 35 to 44 Years | 312 (7.4%) | 3,904 (92.5%) |
| 45 to 54 Years | 300 (6.5%) | 4,322 (94.2%) |
| 55 to 64 Years | 394 (9.6%) | 3,854 (94.3%) |
| 65 to 74 Years | 2,296 (88.0%) | 2,114 (81.0%) |
| 75 Years and over | 2,238 (98.2%) | 1,708 (74.9%) |
| Total | 6,865 (22.3%) | 27,438 (89.1%) |
Disability Status by Sex by Age in Bel Air North
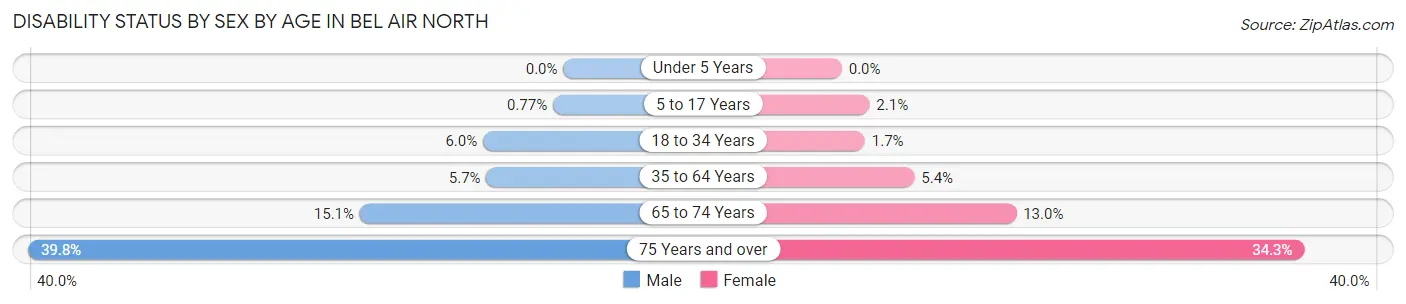
| Age Bracket | Male | Female |
| Under 5 Years | 0 (0.0%) | 0 (0.0%) |
| 5 to 17 Years | 22 (0.8%) | 66 (2.1%) |
| 18 to 34 Years | 154 (6.0%) | 43 (1.7%) |
| 35 to 64 Years | 361 (5.7%) | 354 (5.4%) |
| 65 to 74 Years | 175 (15.1%) | 188 (13.0%) |
| 75 Years and over | 382 (39.8%) | 453 (34.3%) |
Disability Class by Sex by Age in Bel Air North
Disability Class: Hearing Difficulty
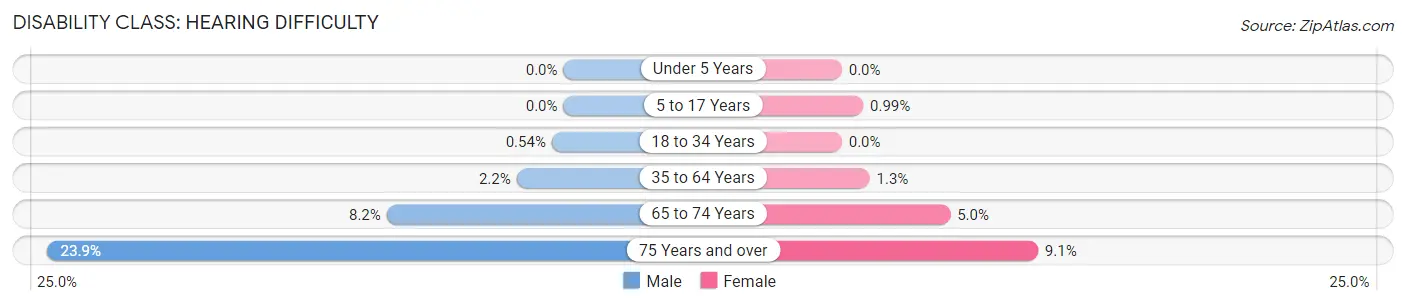
| Age Bracket | Male | Female |
| Under 5 Years | 0 (0.0%) | 0 (0.0%) |
| 5 to 17 Years | 0 (0.0%) | 32 (1.0%) |
| 18 to 34 Years | 14 (0.5%) | 0 (0.0%) |
| 35 to 64 Years | 137 (2.2%) | 85 (1.3%) |
| 65 to 74 Years | 95 (8.2%) | 73 (5.0%) |
| 75 Years and over | 230 (23.9%) | 120 (9.1%) |
Disability Class: Vision Difficulty
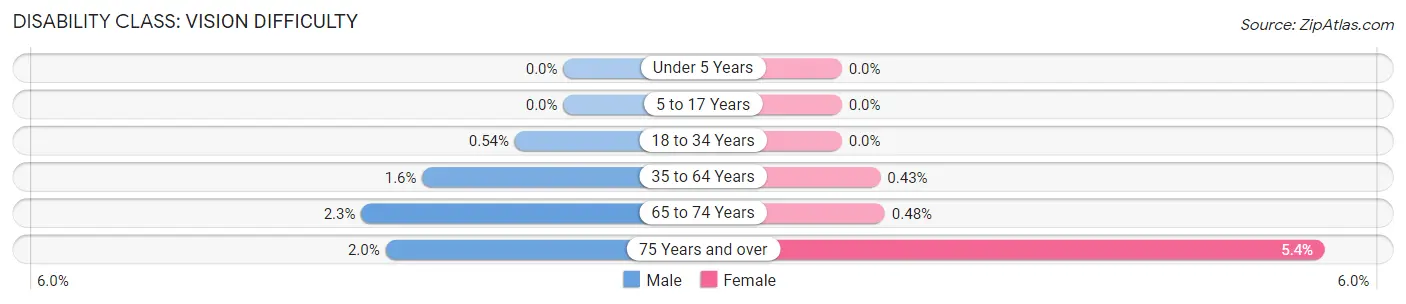
| Age Bracket | Male | Female |
| Under 5 Years | 0 (0.0%) | 0 (0.0%) |
| 5 to 17 Years | 0 (0.0%) | 0 (0.0%) |
| 18 to 34 Years | 14 (0.5%) | 0 (0.0%) |
| 35 to 64 Years | 99 (1.6%) | 28 (0.4%) |
| 65 to 74 Years | 26 (2.2%) | 7 (0.5%) |
| 75 Years and over | 19 (2.0%) | 71 (5.4%) |
Disability Class: Cognitive Difficulty
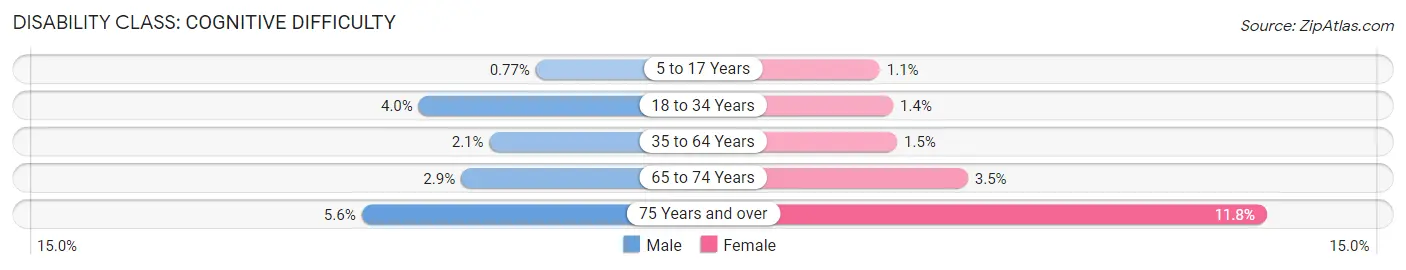
| Age Bracket | Male | Female |
| 5 to 17 Years | 22 (0.8%) | 34 (1.1%) |
| 18 to 34 Years | 104 (4.0%) | 36 (1.4%) |
| 35 to 64 Years | 130 (2.1%) | 101 (1.5%) |
| 65 to 74 Years | 33 (2.9%) | 51 (3.5%) |
| 75 Years and over | 54 (5.6%) | 156 (11.8%) |
Disability Class: Ambulatory Difficulty
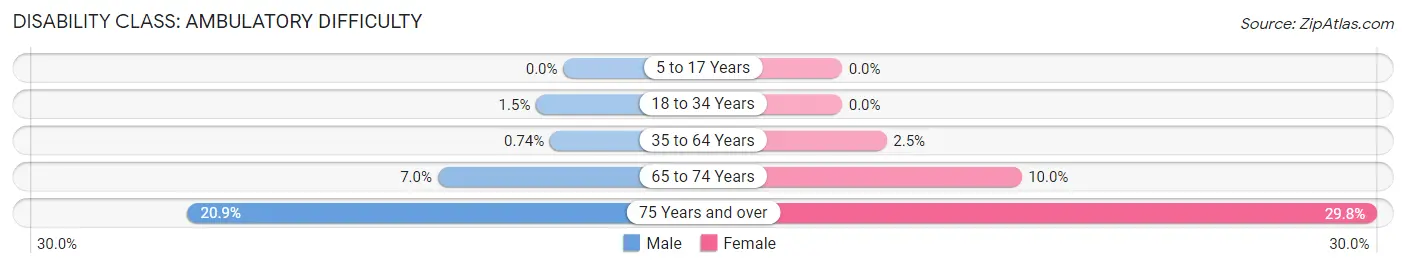
| Age Bracket | Male | Female |
| 5 to 17 Years | 0 (0.0%) | 0 (0.0%) |
| 18 to 34 Years | 39 (1.5%) | 0 (0.0%) |
| 35 to 64 Years | 47 (0.7%) | 163 (2.5%) |
| 65 to 74 Years | 81 (7.0%) | 145 (10.0%) |
| 75 Years and over | 201 (20.9%) | 393 (29.8%) |
Disability Class: Self-Care Difficulty
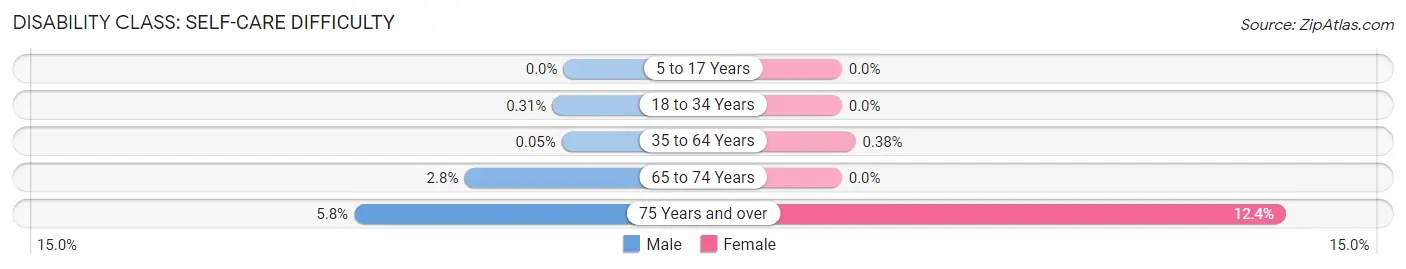
| Age Bracket | Male | Female |
| 5 to 17 Years | 0 (0.0%) | 0 (0.0%) |
| 18 to 34 Years | 8 (0.3%) | 0 (0.0%) |
| 35 to 64 Years | 3 (0.1%) | 25 (0.4%) |
| 65 to 74 Years | 32 (2.8%) | 0 (0.0%) |
| 75 Years and over | 56 (5.8%) | 163 (12.4%) |
Technology Access in Bel Air North
Computing Device Access in Bel Air North
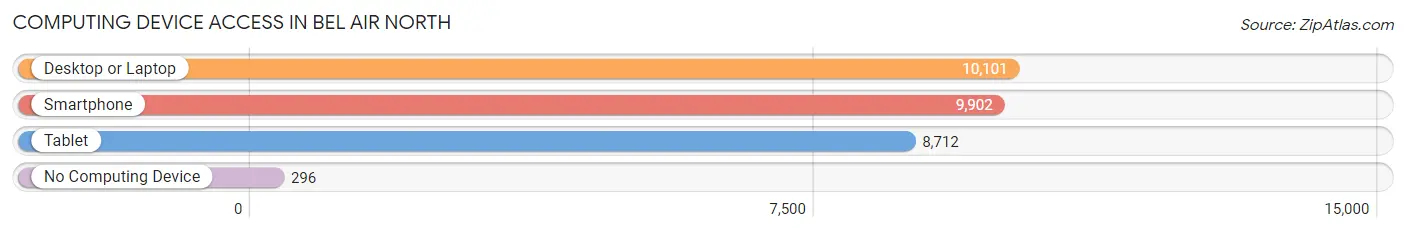
| Device Type | # Households | % Households |
| Desktop or Laptop | 10,101 | 92.4% |
| Smartphone | 9,902 | 90.6% |
| Tablet | 8,712 | 79.7% |
| No Computing Device | 296 | 2.7% |
| Total | 10,929 | 100.0% |
Internet Access in Bel Air North
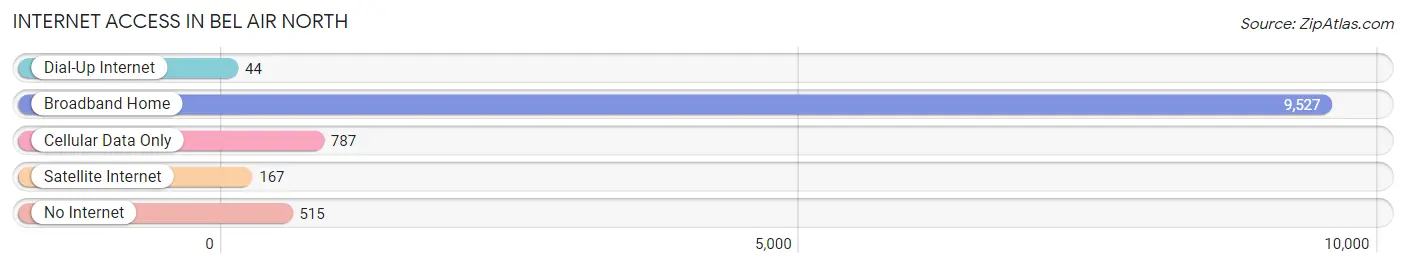
| Internet Type | # Households | % Households |
| Dial-Up Internet | 44 | 0.4% |
| Broadband Home | 9,527 | 87.2% |
| Cellular Data Only | 787 | 7.2% |
| Satellite Internet | 167 | 1.5% |
| No Internet | 515 | 4.7% |
| Total | 10,929 | 100.0% |
Bel Air North Summary
Bel Air North, MD is a census-designated place (CDP) located in Harford County, Maryland. It is situated in the northern part of the county, just south of the city of Bel Air. The CDP has a total area of 4.3 square miles, all of which is land. As of the 2010 census, the population of Bel Air North was 8,919.
History
Bel Air North was first settled in the late 1700s. The area was originally part of a larger tract of land known as “The Forest of Harford”, which was owned by the Calvert family. In 1773, the Calverts sold the land to a group of Quakers, who established a settlement in the area. The settlement was known as “Quaker Meeting House”, and it was the first Quaker settlement in Harford County.
In the early 1800s, the area was known as “Bel Air”, after the nearby town of Bel Air. The area was primarily agricultural, and the main crops were corn, wheat, and tobacco. In the late 1800s, the area began to develop as a residential community. The first post office was established in 1891, and the first school was built in 1895.
Geography
Bel Air North is located in northern Harford County, just south of the city of Bel Air. It is situated at an elevation of approximately 200 feet above sea level. The CDP has a total area of 4.3 square miles, all of which is land. The terrain is mostly flat, with some rolling hills. The climate is humid subtropical, with hot, humid summers and mild winters.
Economy
The economy of Bel Air North is primarily based on retail and services. The area is home to several shopping centers, including the Festival at Bel Air, the Harford Mall, and the Constant Friendship Shopping Center. There are also several restaurants and other businesses in the area.
The largest employer in Bel Air North is the Harford County Public Schools system, which employs over 1,000 people. Other major employers include the University of Maryland Upper Chesapeake Medical Center, the Harford County government, and the Aberdeen Proving Ground.
Demographics
As of the 2010 census, the population of Bel Air North was 8,919. The racial makeup of the CDP was 79.3% White, 11.3% African American, 0.3% Native American, 4.2% Asian, 0.1% Pacific Islander, 2.2% from other races, and 2.6% from two or more races. Hispanic or Latino of any race were 5.2% of the population.
The median household income in Bel Air North was $76,945, and the median family income was $86,945. The per capita income was $32,945. About 4.2% of families and 5.3% of the population were below the poverty line, including 6.2% of those under age 18 and 4.2% of those age 65 or over.
Common Questions
What is Per Capita Income in Bel Air North?
Per Capita income in Bel Air North is $52,250.
What is the Median Family Income in Bel Air North?
Median Family Income in Bel Air North is $157,372.
What is the Median Household income in Bel Air North?
Median Household Income in Bel Air North is $133,613.
What is Income or Wage Gap in Bel Air North?
Income or Wage Gap in Bel Air North is 36.3%.
Women in Bel Air North earn 63.7 cents for every dollar earned by a man.
What is Family Income Deficit in Bel Air North?
Family Income Deficit in Bel Air North is $10,588.
Families that are below poverty line in Bel Air North earn $10,588 less on average than the poverty threshold level.
What is Inequality or Gini Index in Bel Air North?
Inequality or Gini Index in Bel Air North is 0.36.
What is the Total Population of Bel Air North?
Total Population of Bel Air North is 31,308.
What is the Total Male Population of Bel Air North?
Total Male Population of Bel Air North is 15,055.
What is the Total Female Population of Bel Air North?
Total Female Population of Bel Air North is 16,253.
What is the Ratio of Males per 100 Females in Bel Air North?
There are 92.63 Males per 100 Females in Bel Air North.
What is the Ratio of Females per 100 Males in Bel Air North?
There are 107.96 Females per 100 Males in Bel Air North.
What is the Median Population Age in Bel Air North?
Median Population Age in Bel Air North is 40.4 Years.
What is the Average Family Size in Bel Air North
Average Family Size in Bel Air North is 3.2 People.
What is the Average Household Size in Bel Air North
Average Household Size in Bel Air North is 2.8 People.
How Large is the Labor Force in Bel Air North?
There are 16,574 People in the Labor Forcein in Bel Air North.
What is the Percentage of People in the Labor Force in Bel Air North?
68.5% of People are in the Labor Force in Bel Air North.
What is the Unemployment Rate in Bel Air North?
Unemployment Rate in Bel Air North is 2.5%.