Chesapeake Beach, MD Map & Demographics
Chesapeake Beach Map
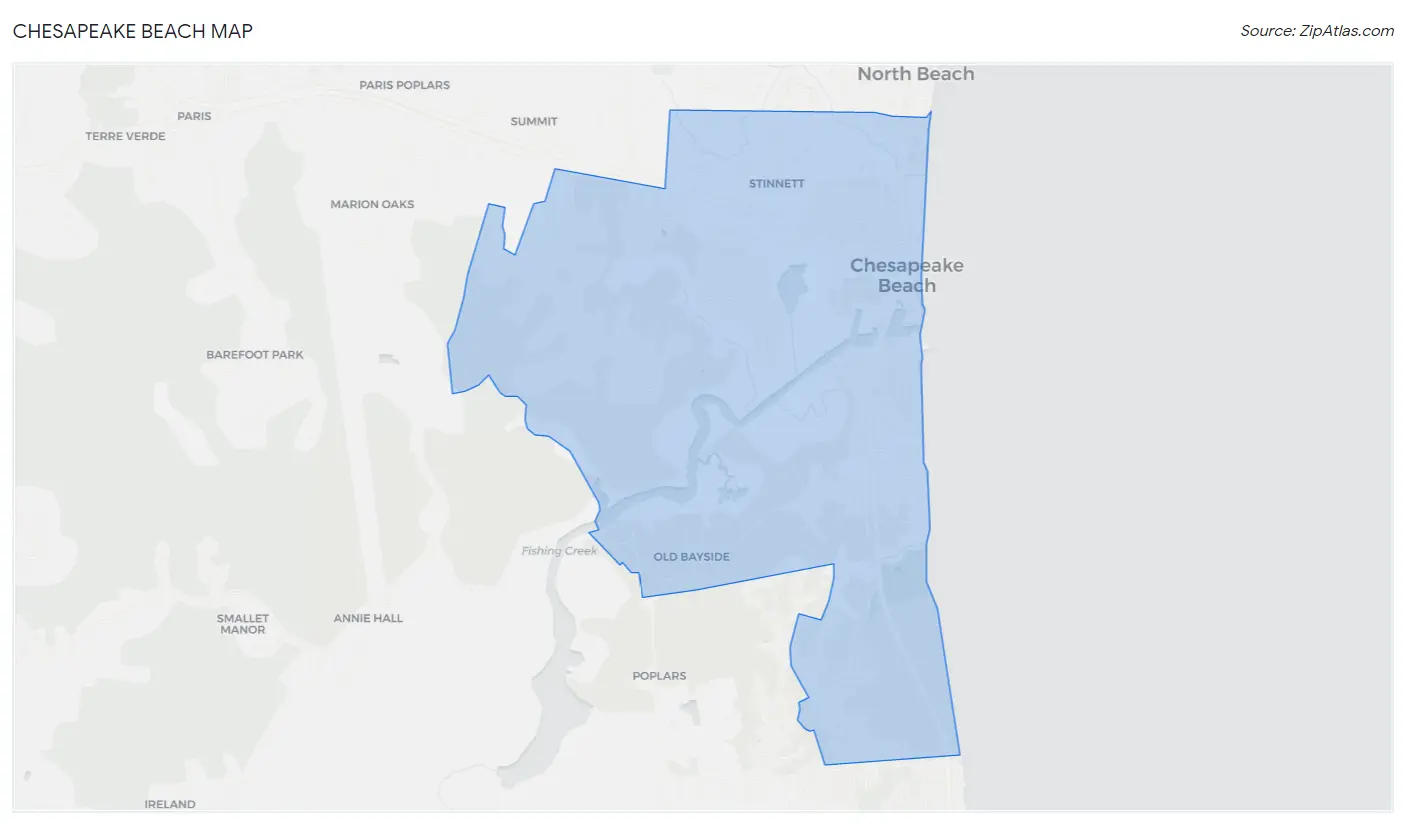
Chesapeake Beach Overview
$58,774
PER CAPITA INCOME
$149,529
AVG FAMILY INCOME
$130,175
AVG HOUSEHOLD INCOME
26.9%
WAGE / INCOME GAP [ % ]
73.1¢/ $1
WAGE / INCOME GAP [ $ ]
0.39
INEQUALITY / GINI INDEX
6,358
TOTAL POPULATION
2,904
MALE POPULATION
3,454
FEMALE POPULATION
84.08
MALES / 100 FEMALES
118.94
FEMALES / 100 MALES
42.5
MEDIAN AGE
3.2
AVG FAMILY SIZE
2.5
AVG HOUSEHOLD SIZE
3,367
LABOR FORCE [ PEOPLE ]
68.4%
PERCENT IN LABOR FORCE
1.2%
UNEMPLOYMENT RATE
Chesapeake Beach Zip Codes
Chesapeake Beach Area Codes
Income in Chesapeake Beach
Income Overview in Chesapeake Beach
Per Capita Income in Chesapeake Beach is $58,774, while median incomes of families and households are $149,529 and $130,175 respectively.
| Characteristic | Number | Measure |
| Per Capita Income | 6,358 | $58,774 |
| Median Family Income | 1,673 | $149,529 |
| Mean Family Income | 1,673 | $160,920 |
| Median Household Income | 2,582 | $130,175 |
| Mean Household Income | 2,582 | $141,721 |
| Income Deficit | 1,673 | $0 |
| Wage / Income Gap (%) | 6,358 | 26.87% |
| Wage / Income Gap ($) | 6,358 | 73.13¢ per $1 |
| Gini / Inequality Index | 6,358 | 0.39 |
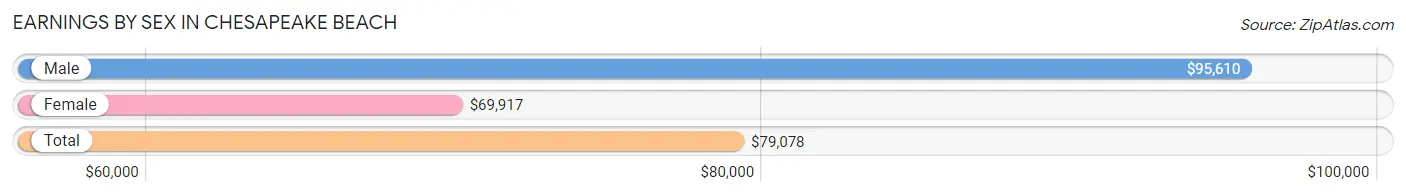
Earnings by Sex in Chesapeake Beach
Average Earnings in Chesapeake Beach are $79,078, $95,610 for men and $69,917 for women, a difference of 26.9%.
| Sex | Number | Average Earnings |
| Male | 1,616 (45.8%) | $95,610 |
| Female | 1,913 (54.2%) | $69,917 |
| Total | 3,529 (100.0%) | $79,078 |
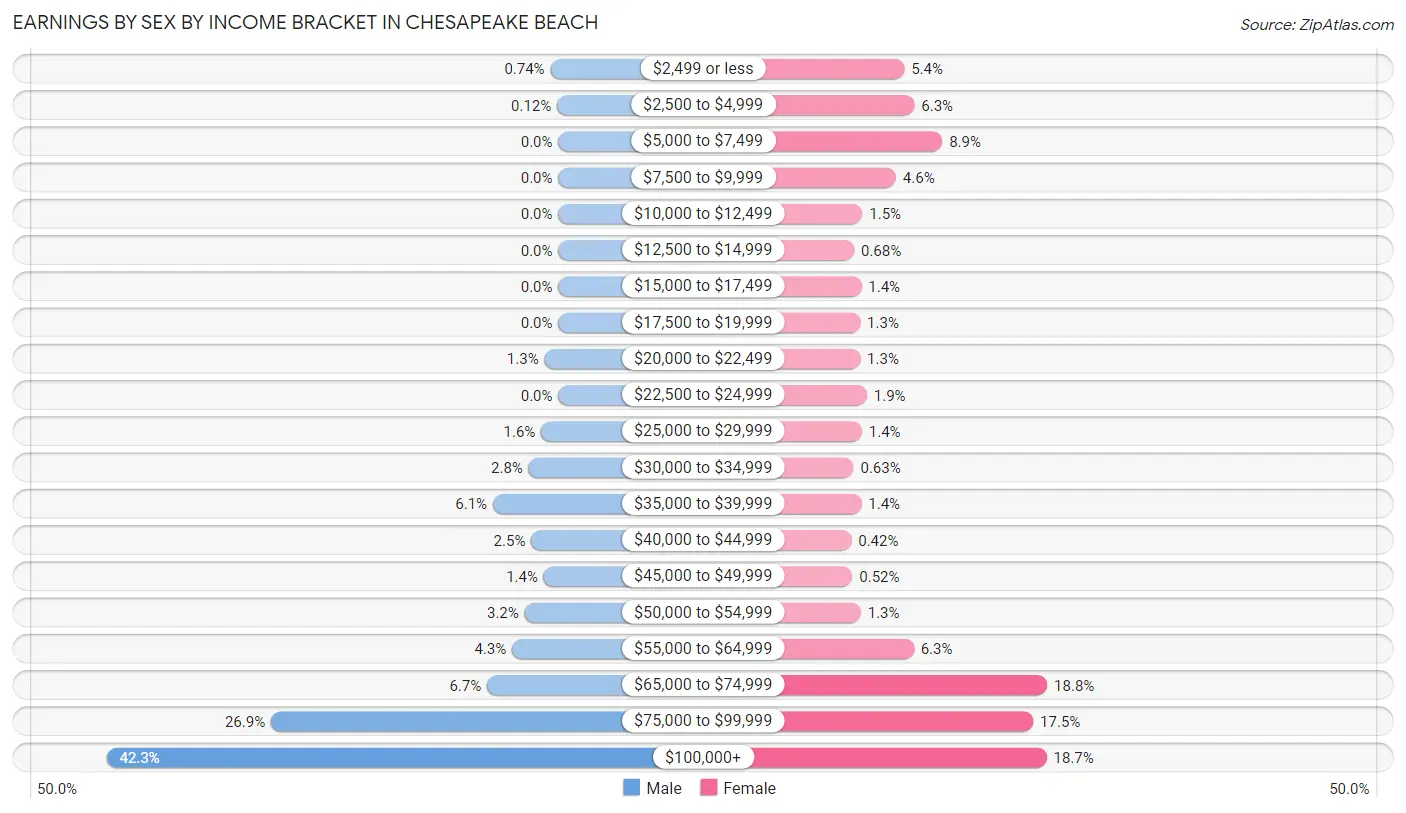
Earnings by Sex by Income Bracket in Chesapeake Beach
The most common earnings brackets in Chesapeake Beach are $100,000+ for men (684 | 42.3%) and $65,000 to $74,999 for women (359 | 18.8%).
| Income | Male | Female |
| $2,499 or less | 12 (0.7%) | 103 (5.4%) |
| $2,500 to $4,999 | 2 (0.1%) | 121 (6.3%) |
| $5,000 to $7,499 | 0 (0.0%) | 171 (8.9%) |
| $7,500 to $9,999 | 0 (0.0%) | 88 (4.6%) |
| $10,000 to $12,499 | 0 (0.0%) | 28 (1.5%) |
| $12,500 to $14,999 | 0 (0.0%) | 13 (0.7%) |
| $15,000 to $17,499 | 0 (0.0%) | 26 (1.4%) |
| $17,500 to $19,999 | 0 (0.0%) | 24 (1.3%) |
| $20,000 to $22,499 | 21 (1.3%) | 24 (1.3%) |
| $22,500 to $24,999 | 0 (0.0%) | 36 (1.9%) |
| $25,000 to $29,999 | 26 (1.6%) | 27 (1.4%) |
| $30,000 to $34,999 | 45 (2.8%) | 12 (0.6%) |
| $35,000 to $39,999 | 99 (6.1%) | 26 (1.4%) |
| $40,000 to $44,999 | 41 (2.5%) | 8 (0.4%) |
| $45,000 to $49,999 | 22 (1.4%) | 10 (0.5%) |
| $50,000 to $54,999 | 51 (3.2%) | 25 (1.3%) |
| $55,000 to $64,999 | 70 (4.3%) | 120 (6.3%) |
| $65,000 to $74,999 | 108 (6.7%) | 359 (18.8%) |
| $75,000 to $99,999 | 435 (26.9%) | 334 (17.5%) |
| $100,000+ | 684 (42.3%) | 358 (18.7%) |
| Total | 1,616 (100.0%) | 1,913 (100.0%) |
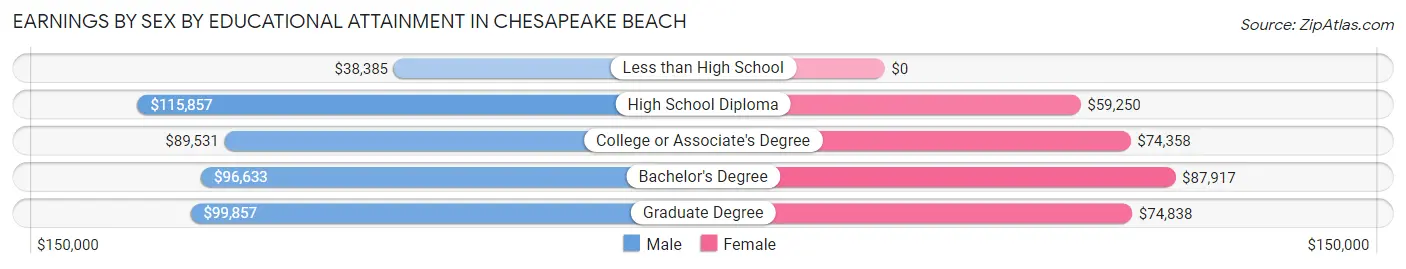
Earnings by Sex by Educational Attainment in Chesapeake Beach
Average earnings in Chesapeake Beach are $97,340 for men and $72,706 for women, a difference of 25.3%. Men with an educational attainment of high school diploma enjoy the highest average annual earnings of $115,857, while those with less than high school education earn the least with $38,385. Women with an educational attainment of bachelor's degree earn the most with the average annual earnings of $87,917, while those with high school diploma education have the smallest earnings of $59,250.
| Educational Attainment | Male Income | Female Income |
| Less than High School | $38,385 | $0 |
| High School Diploma | $115,857 | $59,250 |
| College or Associate's Degree | $89,531 | $74,358 |
| Bachelor's Degree | $96,633 | $87,917 |
| Graduate Degree | $99,857 | $74,838 |
| Total | $97,340 | $72,706 |
Family Income in Chesapeake Beach
Family Income Brackets in Chesapeake Beach
According to the Chesapeake Beach family income data, there are 420 families falling into the $200,000+ income range, which is the most common income bracket and makes up 25.1% of all families.
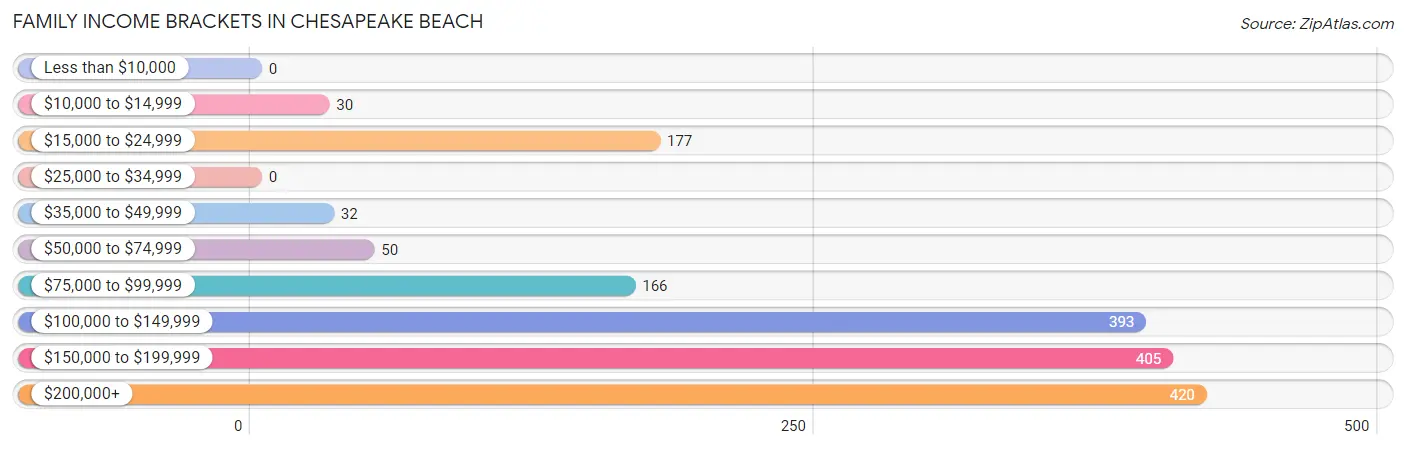
| Income Bracket | # Families | % Families |
| Less than $10,000 | 0 | 0.0% |
| $10,000 to $14,999 | 30 | 1.8% |
| $15,000 to $24,999 | 177 | 10.6% |
| $25,000 to $34,999 | 0 | 0.0% |
| $35,000 to $49,999 | 32 | 1.9% |
| $50,000 to $74,999 | 50 | 3.0% |
| $75,000 to $99,999 | 166 | 9.9% |
| $100,000 to $149,999 | 393 | 23.5% |
| $150,000 to $199,999 | 405 | 24.2% |
| $200,000+ | 420 | 25.1% |
Family Income by Famaliy Size in Chesapeake Beach
6-person families (69 | 4.1%) account for the highest median family income in Chesapeake Beach with $250,001 per family, while 2-person families (635 | 38.0%) have the highest median income of $65,287 per family member.
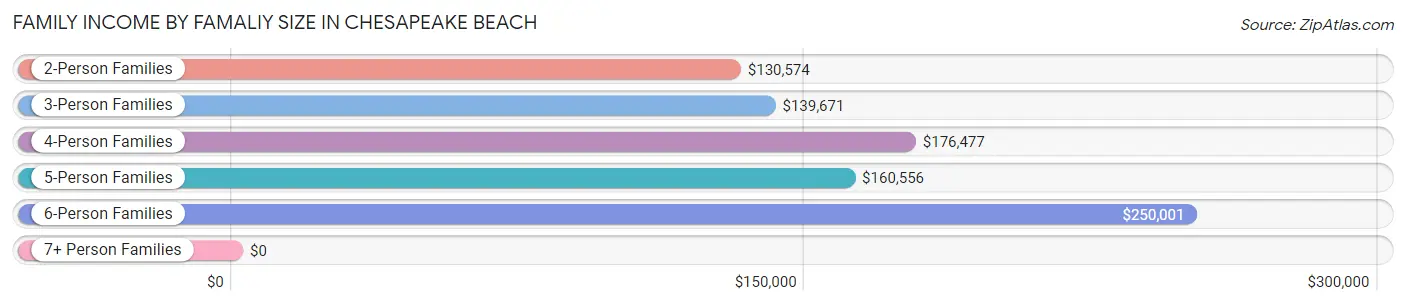
| Income Bracket | # Families | Median Income |
| 2-Person Families | 635 (38.0%) | $130,574 |
| 3-Person Families | 443 (26.5%) | $139,671 |
| 4-Person Families | 391 (23.4%) | $176,477 |
| 5-Person Families | 98 (5.9%) | $160,556 |
| 6-Person Families | 69 (4.1%) | $250,001 |
| 7+ Person Families | 37 (2.2%) | $0 |
| Total | 1,673 (100.0%) | $149,529 |
Family Income by Number of Earners in Chesapeake Beach
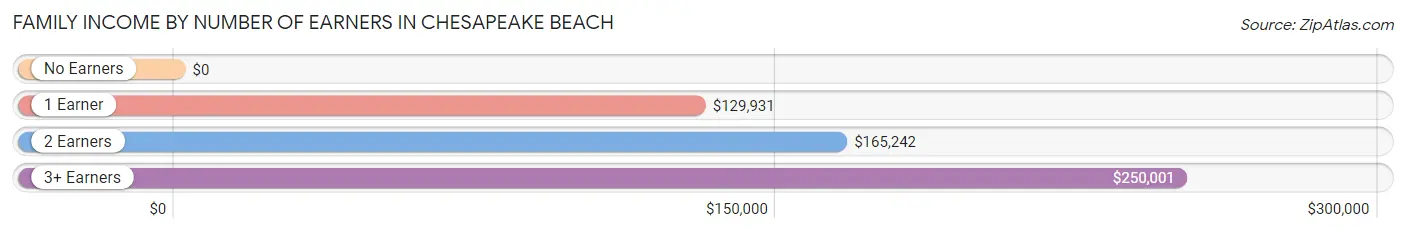
| Number of Earners | # Families | Median Income |
| No Earners | 293 (17.5%) | $0 |
| 1 Earner | 265 (15.8%) | $129,931 |
| 2 Earners | 866 (51.8%) | $165,242 |
| 3+ Earners | 249 (14.9%) | $250,001 |
| Total | 1,673 (100.0%) | $149,529 |
Household Income in Chesapeake Beach
Household Income Brackets in Chesapeake Beach
With 749 households falling in the category, the $100,000 to $149,999 income range is the most frequent in Chesapeake Beach, accounting for 29.0% of all households.
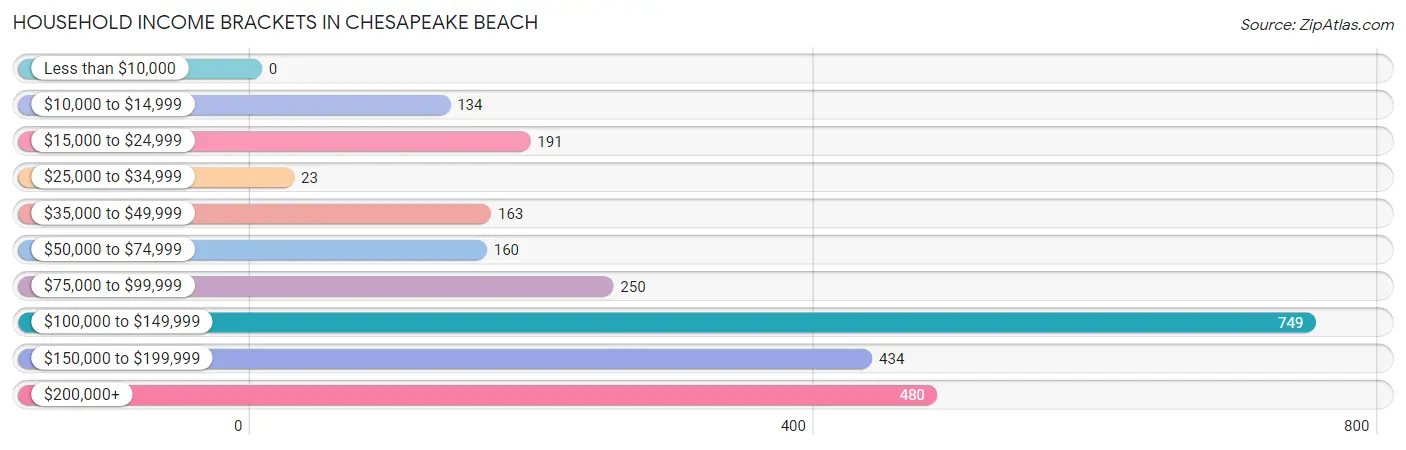
| Income Bracket | # Households | % Households |
| Less than $10,000 | 0 | 0.0% |
| $10,000 to $14,999 | 134 | 5.2% |
| $15,000 to $24,999 | 191 | 7.4% |
| $25,000 to $34,999 | 23 | 0.9% |
| $35,000 to $49,999 | 163 | 6.3% |
| $50,000 to $74,999 | 160 | 6.2% |
| $75,000 to $99,999 | 250 | 9.7% |
| $100,000 to $149,999 | 749 | 29.0% |
| $150,000 to $199,999 | 434 | 16.8% |
| $200,000+ | 480 | 18.6% |
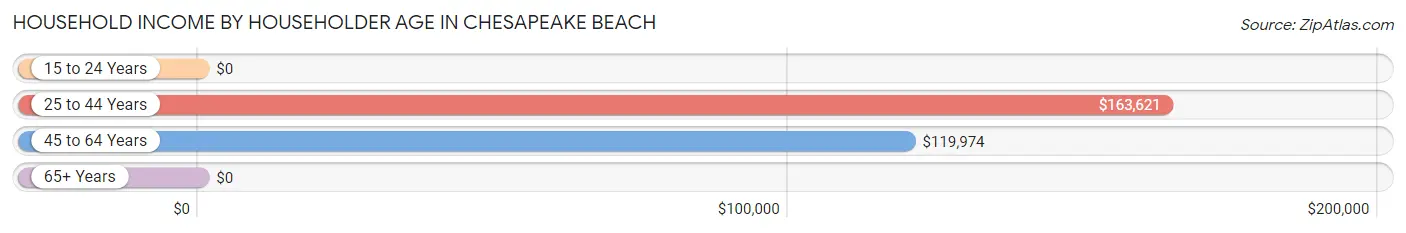
Household Income by Householder Age in Chesapeake Beach
The median household income in Chesapeake Beach is $130,175, with the highest median household income of $163,621 found in the 25 to 44 years age bracket for the primary householder. A total of 752 households (29.1%) fall into this category. Meanwhile, the 15 to 24 years age bracket for the primary householder has the lowest median household income of $0, with 12 households (0.5%) in this group.
| Income Bracket | # Households | Median Income |
| 15 to 24 Years | 12 (0.5%) | $0 |
| 25 to 44 Years | 752 (29.1%) | $163,621 |
| 45 to 64 Years | 1,079 (41.8%) | $119,974 |
| 65+ Years | 739 (28.6%) | $0 |
| Total | 2,582 (100.0%) | $130,175 |
Poverty in Chesapeake Beach
Income Below Poverty by Sex and Age in Chesapeake Beach
With 3.6% poverty level for males and 2.8% for females among the residents of Chesapeake Beach, 55 to 64 year old males and 15 year old females are the most vulnerable to poverty, with 104 males (23.8%) and 23 females (30.7%) in their respective age groups living below the poverty level.
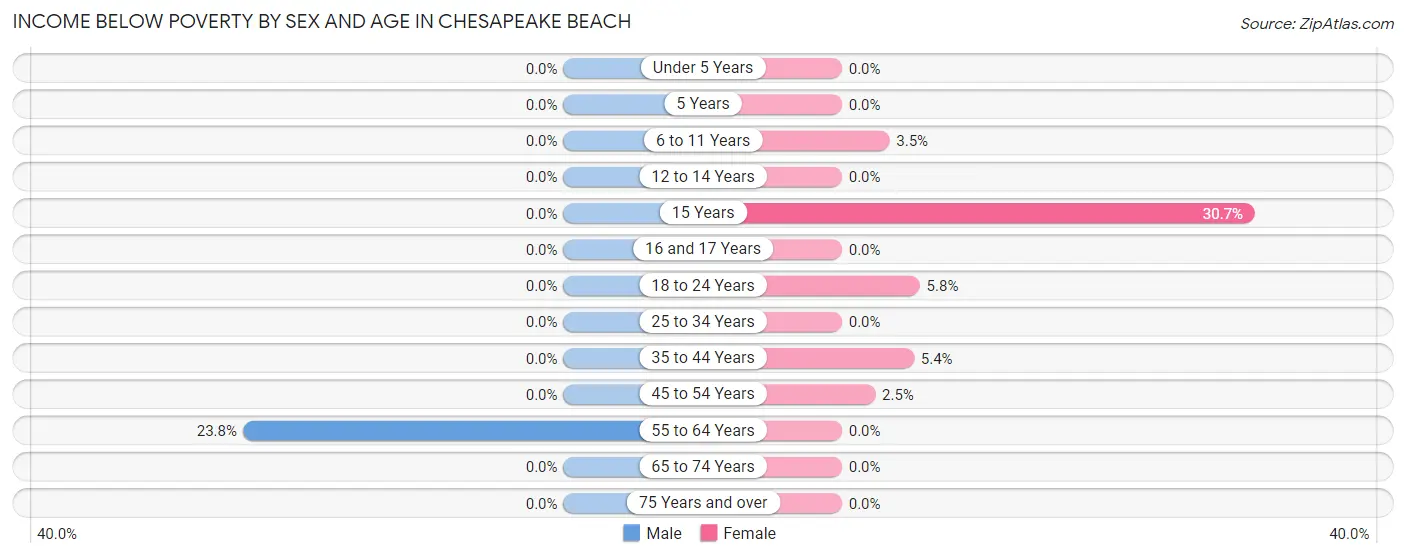
| Age Bracket | Male | Female |
| Under 5 Years | 0 (0.0%) | 0 (0.0%) |
| 5 Years | 0 (0.0%) | 0 (0.0%) |
| 6 to 11 Years | 0 (0.0%) | 12 (3.5%) |
| 12 to 14 Years | 0 (0.0%) | 0 (0.0%) |
| 15 Years | 0 (0.0%) | 23 (30.7%) |
| 16 and 17 Years | 0 (0.0%) | 0 (0.0%) |
| 18 to 24 Years | 0 (0.0%) | 13 (5.8%) |
| 25 to 34 Years | 0 (0.0%) | 0 (0.0%) |
| 35 to 44 Years | 0 (0.0%) | 30 (5.3%) |
| 45 to 54 Years | 0 (0.0%) | 19 (2.5%) |
| 55 to 64 Years | 104 (23.8%) | 0 (0.0%) |
| 65 to 74 Years | 0 (0.0%) | 0 (0.0%) |
| 75 Years and over | 0 (0.0%) | 0 (0.0%) |
| Total | 104 (3.6%) | 97 (2.8%) |
Income Above Poverty by Sex and Age in Chesapeake Beach
According to the poverty statistics in Chesapeake Beach, males aged under 5 years and females aged under 5 years are the age groups that are most secure financially, with 100.0% of males and 100.0% of females in these age groups living above the poverty line.
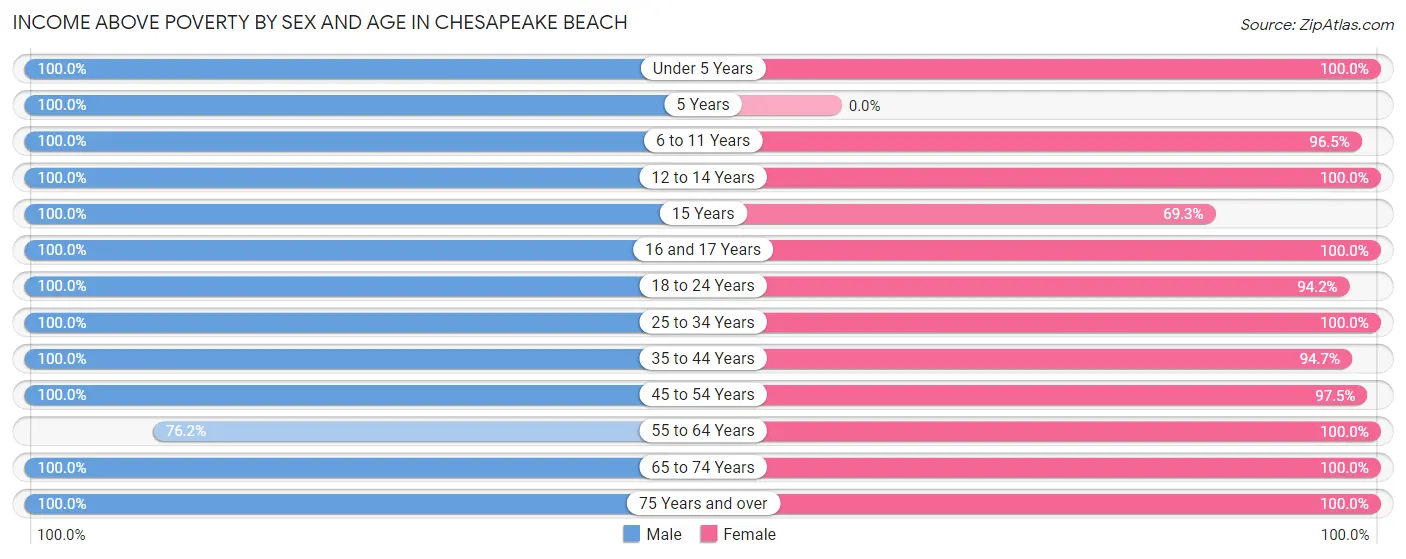
| Age Bracket | Male | Female |
| Under 5 Years | 184 (100.0%) | 59 (100.0%) |
| 5 Years | 104 (100.0%) | 0 (0.0%) |
| 6 to 11 Years | 297 (100.0%) | 328 (96.5%) |
| 12 to 14 Years | 92 (100.0%) | 239 (100.0%) |
| 15 Years | 46 (100.0%) | 52 (69.3%) |
| 16 and 17 Years | 37 (100.0%) | 162 (100.0%) |
| 18 to 24 Years | 141 (100.0%) | 212 (94.2%) |
| 25 to 34 Years | 280 (100.0%) | 285 (100.0%) |
| 35 to 44 Years | 324 (100.0%) | 531 (94.7%) |
| 45 to 54 Years | 482 (100.0%) | 749 (97.5%) |
| 55 to 64 Years | 333 (76.2%) | 174 (100.0%) |
| 65 to 74 Years | 239 (100.0%) | 423 (100.0%) |
| 75 Years and over | 241 (100.0%) | 143 (100.0%) |
| Total | 2,800 (96.4%) | 3,357 (97.2%) |
Income Below Poverty Among Married-Couple Families in Chesapeake Beach
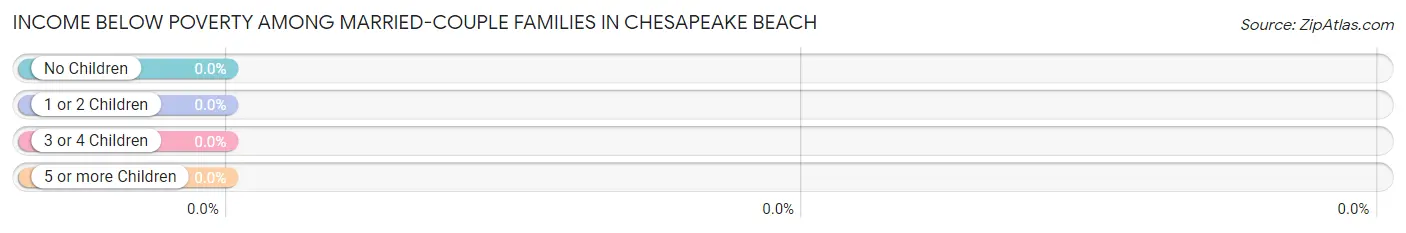
| Children | Above Poverty | Below Poverty |
| No Children | 497 (100.0%) | 0 (0.0%) |
| 1 or 2 Children | 663 (100.0%) | 0 (0.0%) |
| 3 or 4 Children | 145 (100.0%) | 0 (0.0%) |
| 5 or more Children | 14 (100.0%) | 0 (0.0%) |
| Total | 1,319 (100.0%) | 0 (0.0%) |
Income Below Poverty Among Single-Parent Households in Chesapeake Beach
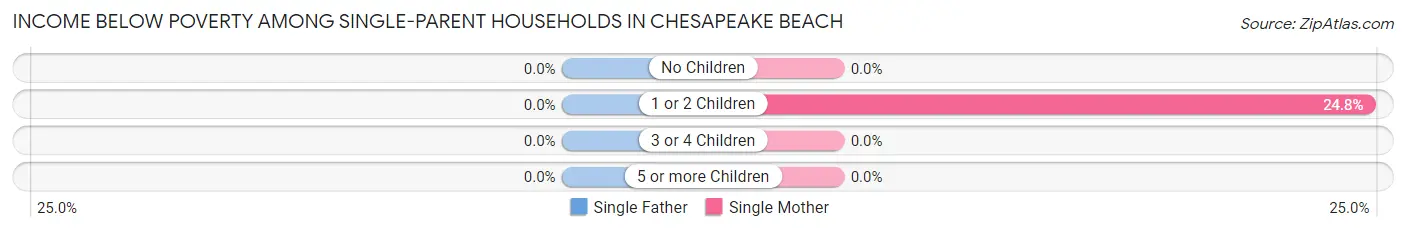
| Children | Single Father | Single Mother |
| No Children | 0 (0.0%) | 0 (0.0%) |
| 1 or 2 Children | 0 (0.0%) | 49 (24.7%) |
| 3 or 4 Children | 0 (0.0%) | 0 (0.0%) |
| 5 or more Children | 0 (0.0%) | 0 (0.0%) |
| Total | 0 (0.0%) | 49 (14.5%) |
Income Below Poverty Among Married-Couple vs Single-Parent Households in Chesapeake Beach
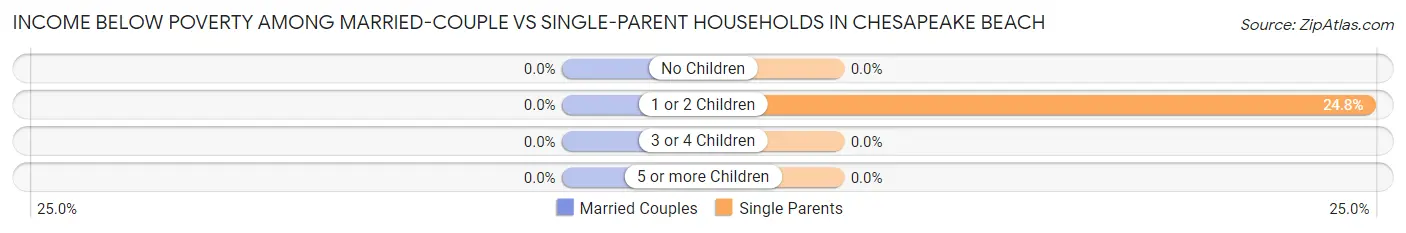
| Children | Married-Couple Families | Single-Parent Households |
| No Children | 0 (0.0%) | 0 (0.0%) |
| 1 or 2 Children | 0 (0.0%) | 49 (24.7%) |
| 3 or 4 Children | 0 (0.0%) | 0 (0.0%) |
| 5 or more Children | 0 (0.0%) | 0 (0.0%) |
| Total | 0 (0.0%) | 49 (13.8%) |
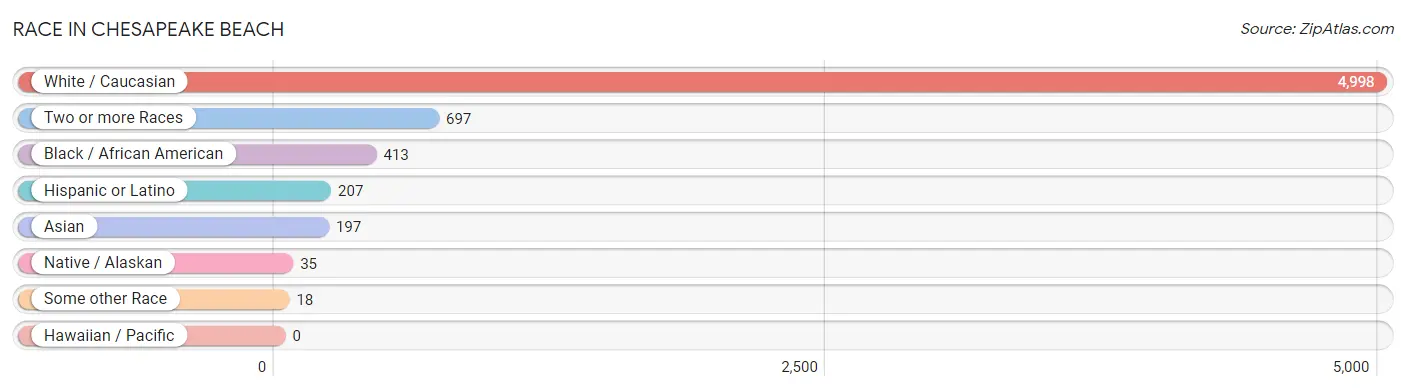
Race in Chesapeake Beach
The most populous races in Chesapeake Beach are White / Caucasian (4,998 | 78.6%), Two or more Races (697 | 11.0%), and Black / African American (413 | 6.5%).
| Race | # Population | % Population |
| Asian | 197 | 3.1% |
| Black / African American | 413 | 6.5% |
| Hawaiian / Pacific | 0 | 0.0% |
| Hispanic or Latino | 207 | 3.3% |
| Native / Alaskan | 35 | 0.5% |
| White / Caucasian | 4,998 | 78.6% |
| Two or more Races | 697 | 11.0% |
| Some other Race | 18 | 0.3% |
| Total | 6,358 | 100.0% |
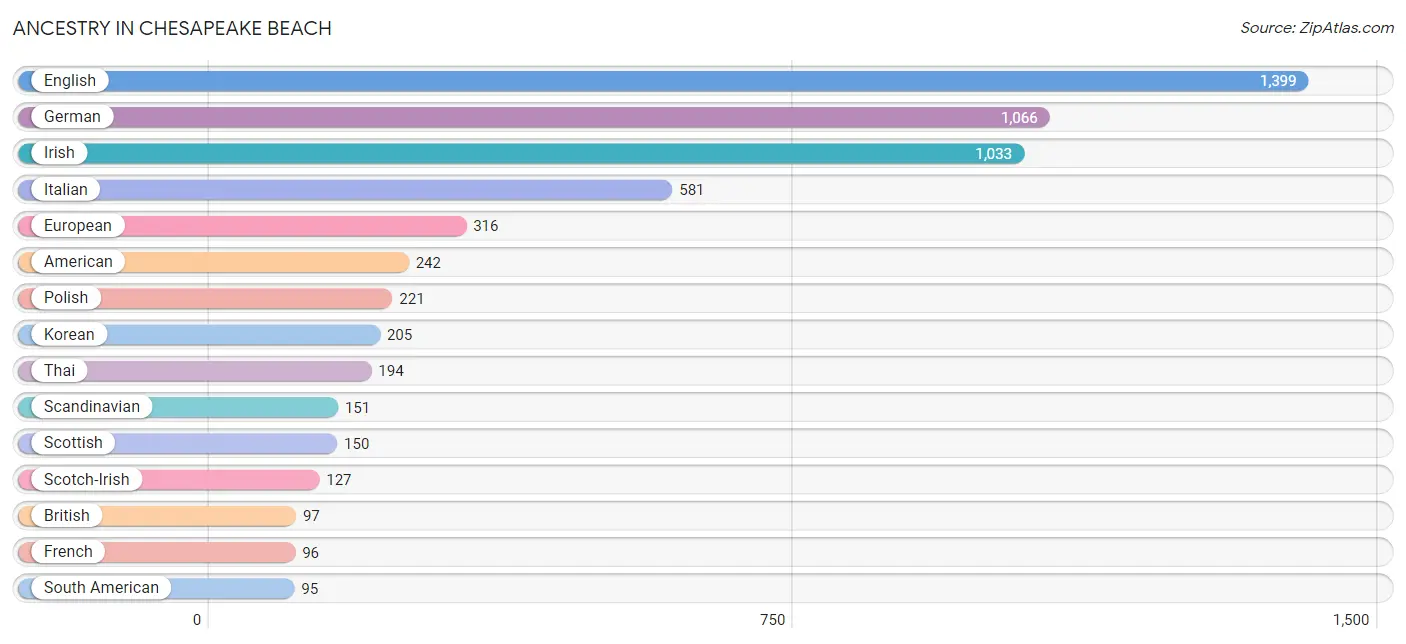
Ancestry in Chesapeake Beach
The most populous ancestries reported in Chesapeake Beach are English (1,399 | 22.0%), German (1,066 | 16.8%), Irish (1,033 | 16.3%), Italian (581 | 9.1%), and European (316 | 5.0%), together accounting for 69.1% of all Chesapeake Beach residents.
| Ancestry | # Population | % Population |
| African | 16 | 0.3% |
| American | 242 | 3.8% |
| Austrian | 26 | 0.4% |
| British | 97 | 1.5% |
| Central American | 36 | 0.6% |
| Central American Indian | 36 | 0.6% |
| Cherokee | 24 | 0.4% |
| Chilean | 15 | 0.2% |
| Colombian | 27 | 0.4% |
| Czech | 70 | 1.1% |
| Czechoslovakian | 7 | 0.1% |
| Dutch | 30 | 0.5% |
| Ecuadorian | 53 | 0.8% |
| English | 1,399 | 22.0% |
| European | 316 | 5.0% |
| French | 96 | 1.5% |
| French Canadian | 9 | 0.1% |
| German | 1,066 | 16.8% |
| Greek | 21 | 0.3% |
| Guatemalan | 36 | 0.6% |
| Guyanese | 23 | 0.4% |
| Hungarian | 31 | 0.5% |
| Irish | 1,033 | 16.3% |
| Italian | 581 | 9.1% |
| Korean | 205 | 3.2% |
| Lithuanian | 7 | 0.1% |
| Mexican | 12 | 0.2% |
| Northern European | 21 | 0.3% |
| Norwegian | 10 | 0.2% |
| Pakistani | 15 | 0.2% |
| Polish | 221 | 3.5% |
| Puerto Rican | 64 | 1.0% |
| Romanian | 12 | 0.2% |
| Russian | 9 | 0.1% |
| Scandinavian | 151 | 2.4% |
| Scotch-Irish | 127 | 2.0% |
| Scottish | 150 | 2.4% |
| Serbian | 15 | 0.2% |
| South American | 95 | 1.5% |
| Subsaharan African | 26 | 0.4% |
| Swedish | 41 | 0.6% |
| Thai | 194 | 3.0% |
| Ukrainian | 21 | 0.3% |
| Yugoslavian | 40 | 0.6% | View All 44 Rows |
Immigrants in Chesapeake Beach
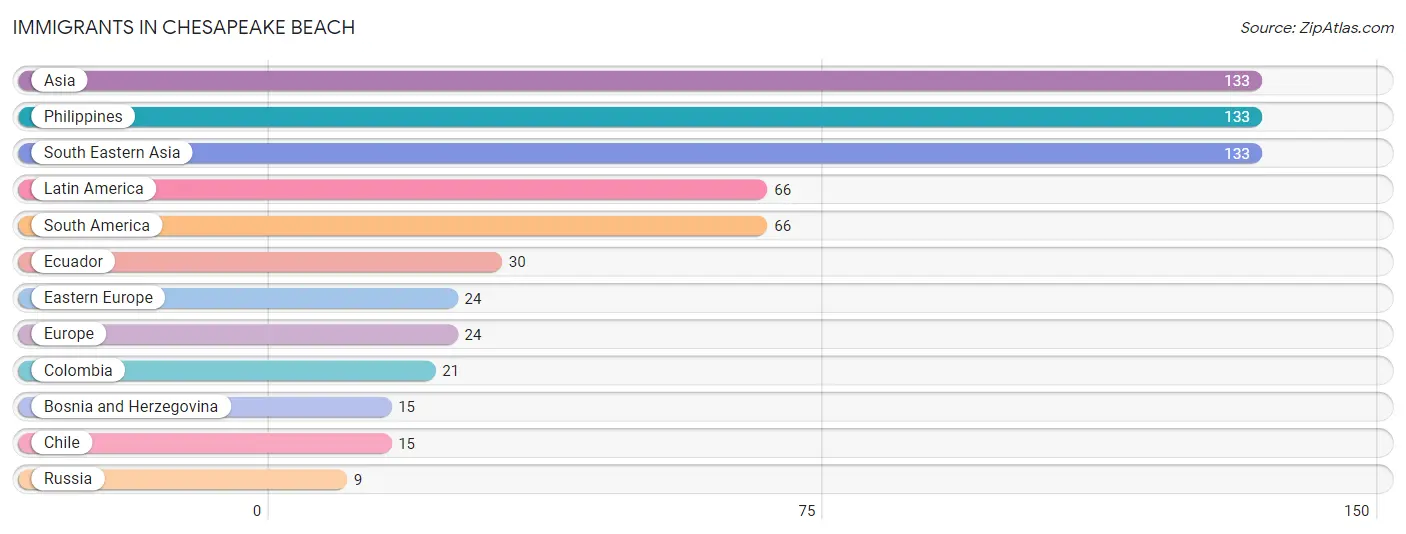
The most numerous immigrant groups reported in Chesapeake Beach came from Asia (133 | 2.1%), Philippines (133 | 2.1%), South Eastern Asia (133 | 2.1%), Latin America (66 | 1.0%), and South America (66 | 1.0%), together accounting for 8.3% of all Chesapeake Beach residents.
| Immigration Origin | # Population | % Population |
| Asia | 133 | 2.1% |
| Bosnia and Herzegovina | 15 | 0.2% |
| Chile | 15 | 0.2% |
| Colombia | 21 | 0.3% |
| Eastern Europe | 24 | 0.4% |
| Ecuador | 30 | 0.5% |
| Europe | 24 | 0.4% |
| Latin America | 66 | 1.0% |
| Philippines | 133 | 2.1% |
| Russia | 9 | 0.1% |
| South America | 66 | 1.0% |
| South Eastern Asia | 133 | 2.1% | View All 12 Rows |
Sex and Age in Chesapeake Beach
Sex and Age in Chesapeake Beach
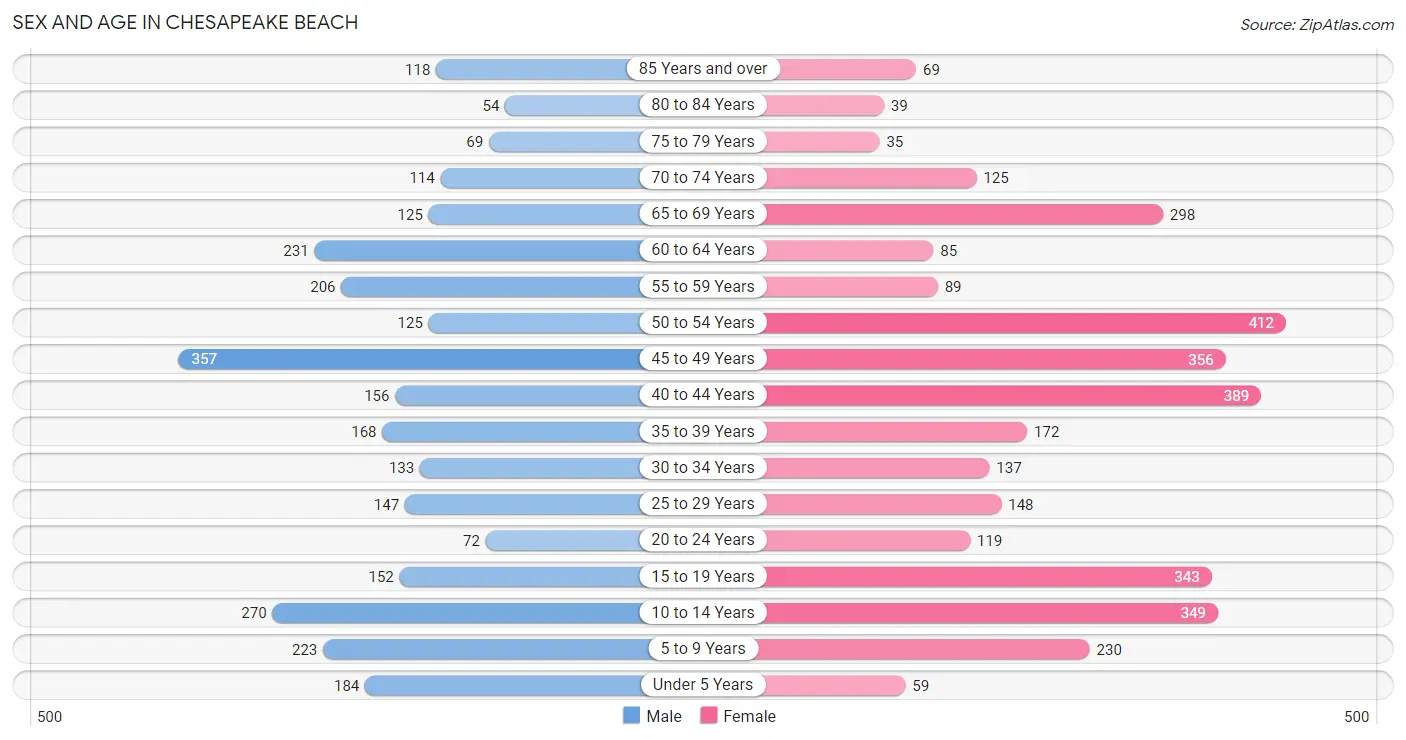
The most populous age groups in Chesapeake Beach are 45 to 49 Years (357 | 12.3%) for men and 50 to 54 Years (412 | 11.9%) for women.
| Age Bracket | Male | Female |
| Under 5 Years | 184 (6.3%) | 59 (1.7%) |
| 5 to 9 Years | 223 (7.7%) | 230 (6.7%) |
| 10 to 14 Years | 270 (9.3%) | 349 (10.1%) |
| 15 to 19 Years | 152 (5.2%) | 343 (9.9%) |
| 20 to 24 Years | 72 (2.5%) | 119 (3.5%) |
| 25 to 29 Years | 147 (5.1%) | 148 (4.3%) |
| 30 to 34 Years | 133 (4.6%) | 137 (4.0%) |
| 35 to 39 Years | 168 (5.8%) | 172 (5.0%) |
| 40 to 44 Years | 156 (5.4%) | 389 (11.3%) |
| 45 to 49 Years | 357 (12.3%) | 356 (10.3%) |
| 50 to 54 Years | 125 (4.3%) | 412 (11.9%) |
| 55 to 59 Years | 206 (7.1%) | 89 (2.6%) |
| 60 to 64 Years | 231 (8.0%) | 85 (2.5%) |
| 65 to 69 Years | 125 (4.3%) | 298 (8.6%) |
| 70 to 74 Years | 114 (3.9%) | 125 (3.6%) |
| 75 to 79 Years | 69 (2.4%) | 35 (1.0%) |
| 80 to 84 Years | 54 (1.9%) | 39 (1.1%) |
| 85 Years and over | 118 (4.1%) | 69 (2.0%) |
| Total | 2,904 (100.0%) | 3,454 (100.0%) |
Families and Households in Chesapeake Beach
Median Family Size in Chesapeake Beach
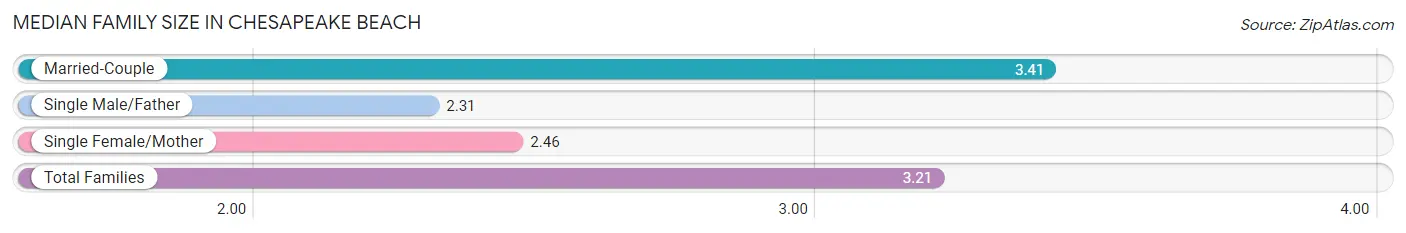
The median family size in Chesapeake Beach is 3.21 persons per family, with married-couple families (1,319 | 78.8%) accounting for the largest median family size of 3.41 persons per family. On the other hand, single male/father families (16 | 1.0%) represent the smallest median family size with 2.31 persons per family.
| Family Type | # Families | Family Size |
| Married-Couple | 1,319 (78.8%) | 3.41 |
| Single Male/Father | 16 (1.0%) | 2.31 |
| Single Female/Mother | 338 (20.2%) | 2.46 |
| Total Families | 1,673 (100.0%) | 3.21 |
Median Household Size in Chesapeake Beach
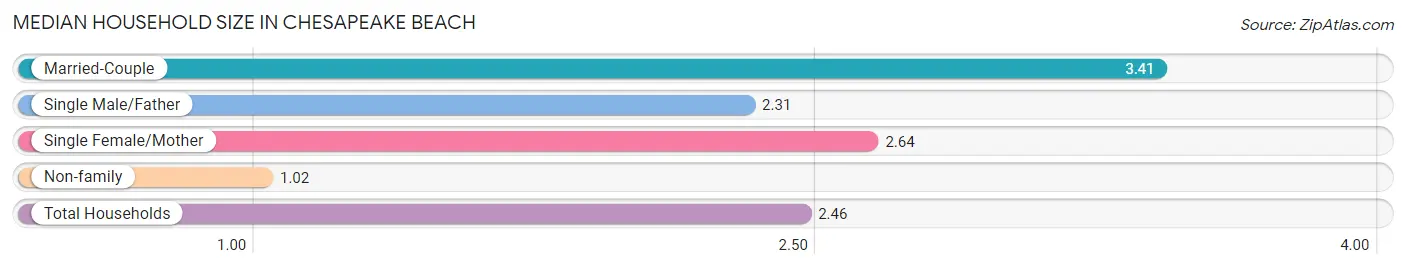
The median household size in Chesapeake Beach is 2.46 persons per household, with married-couple households (1,319 | 51.1%) accounting for the largest median household size of 3.41 persons per household. non-family households (909 | 35.2%) represent the smallest median household size with 1.02 persons per household.
| Household Type | # Households | Household Size |
| Married-Couple | 1,319 (51.1%) | 3.41 |
| Single Male/Father | 16 (0.6%) | 2.31 |
| Single Female/Mother | 338 (13.1%) | 2.64 |
| Non-family | 909 (35.2%) | 1.02 |
| Total Households | 2,582 (100.0%) | 2.46 |
Household Size by Marriage Status in Chesapeake Beach
Out of a total of 2,582 households in Chesapeake Beach, 1,673 (64.8%) are family households, while 909 (35.2%) are nonfamily households. The most numerous type of family households are 2-person households, comprising 608, and the most common type of nonfamily households are 1-person households, comprising 888.
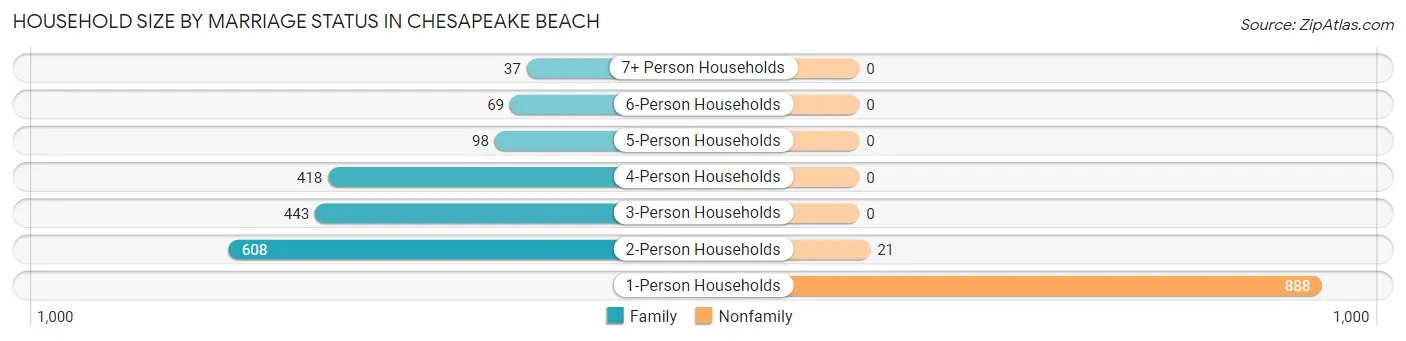
| Household Size | Family Households | Nonfamily Households |
| 1-Person Households | - | 888 (34.4%) |
| 2-Person Households | 608 (23.5%) | 21 (0.8%) |
| 3-Person Households | 443 (17.2%) | 0 (0.0%) |
| 4-Person Households | 418 (16.2%) | 0 (0.0%) |
| 5-Person Households | 98 (3.8%) | 0 (0.0%) |
| 6-Person Households | 69 (2.7%) | 0 (0.0%) |
| 7+ Person Households | 37 (1.4%) | 0 (0.0%) |
| Total | 1,673 (64.8%) | 909 (35.2%) |
Female Fertility in Chesapeake Beach
Fertility by Age in Chesapeake Beach
Average fertility rate in Chesapeake Beach is 30.0 births per 1,000 women. Women in the age bracket of 20 to 34 years have the highest fertility rate with 79.0 births per 1,000 women. Women in the age bracket of 20 to 34 years acount for 57.1% of all women with births.
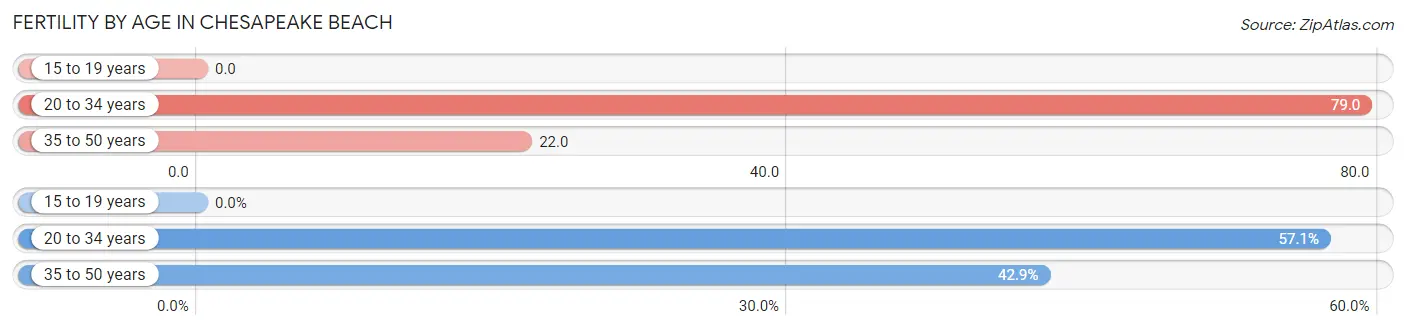
| Age Bracket | Women with Births | Births / 1,000 Women |
| 15 to 19 years | 0 (0.0%) | 0.0 |
| 20 to 34 years | 32 (57.1%) | 79.0 |
| 35 to 50 years | 24 (42.9%) | 22.0 |
| Total | 56 (100.0%) | 30.0 |
Fertility by Age by Marriage Status in Chesapeake Beach
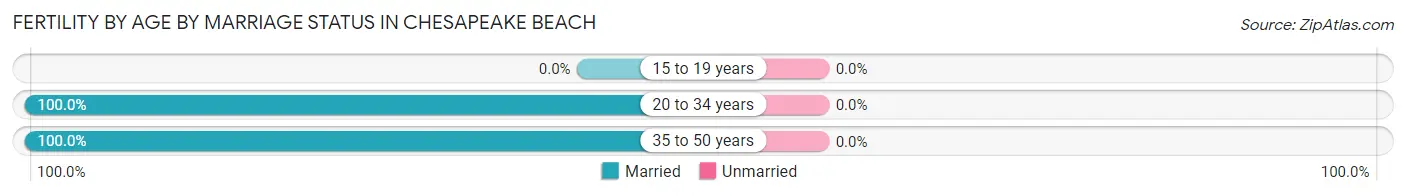
| Age Bracket | Married | Unmarried |
| 15 to 19 years | 0 (0.0%) | 0 (0.0%) |
| 20 to 34 years | 32 (100.0%) | 0 (0.0%) |
| 35 to 50 years | 24 (100.0%) | 0 (0.0%) |
| Total | 56 (100.0%) | 0 (0.0%) |
Fertility by Education in Chesapeake Beach
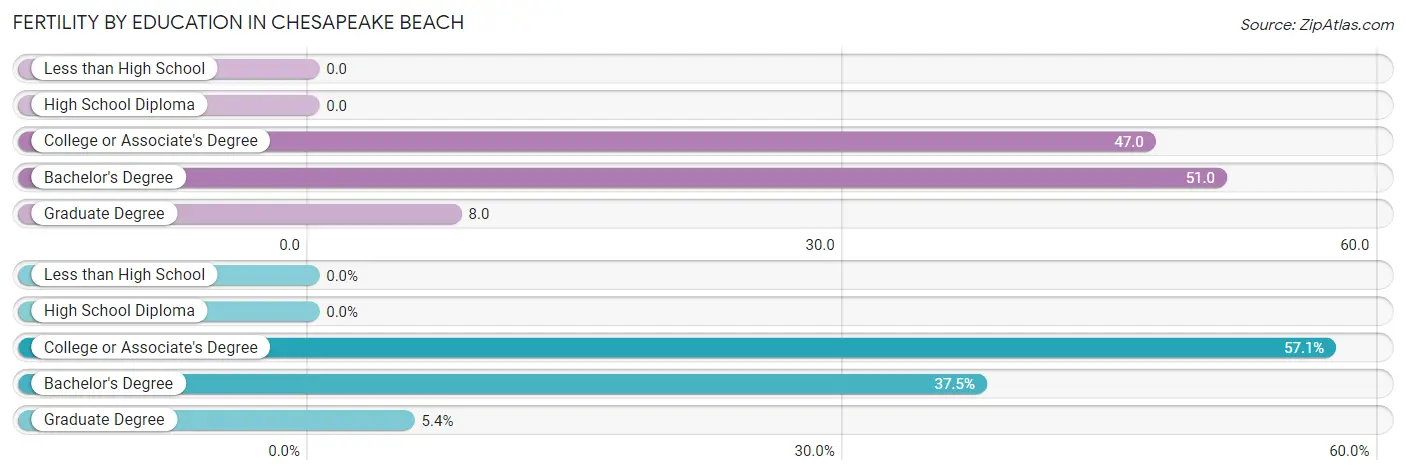
| Educational Attainment | Women with Births | Births / 1,000 Women |
| Less than High School | 0 (0.0%) | 0.0 |
| High School Diploma | 0 (0.0%) | 0.0 |
| College or Associate's Degree | 32 (57.1%) | 47.0 |
| Bachelor's Degree | 21 (37.5%) | 51.0 |
| Graduate Degree | 3 (5.4%) | 8.0 |
| Total | 56 (100.0%) | 30.0 |
Fertility by Education by Marriage Status in Chesapeake Beach
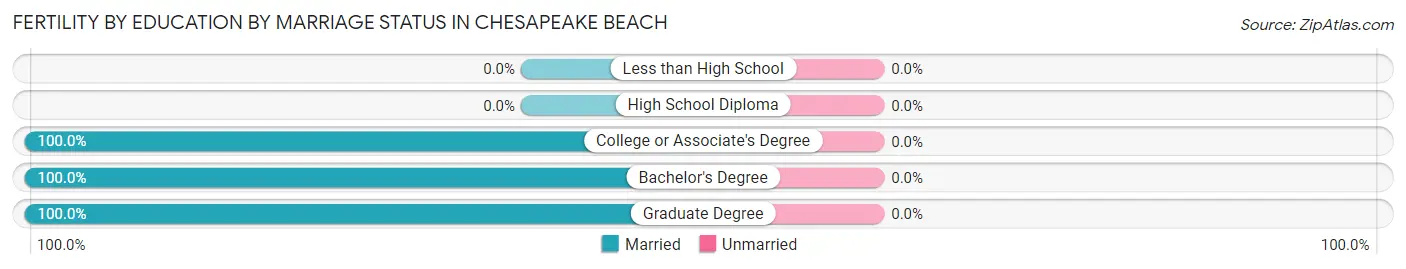
| Educational Attainment | Married | Unmarried |
| Less than High School | 0 (0.0%) | 0 (0.0%) |
| High School Diploma | 0 (0.0%) | 0 (0.0%) |
| College or Associate's Degree | 32 (100.0%) | 0 (0.0%) |
| Bachelor's Degree | 21 (100.0%) | 0 (0.0%) |
| Graduate Degree | 3 (100.0%) | 0 (0.0%) |
| Total | 56 (100.0%) | 0 (0.0%) |
Employment Characteristics in Chesapeake Beach
Employment by Class of Employer in Chesapeake Beach
Among the 3,323 employed individuals in Chesapeake Beach, private company employees (1,623 | 48.8%), federal government employees (523 | 15.7%), and local government employees (473 | 14.2%) make up the most common classes of employment.
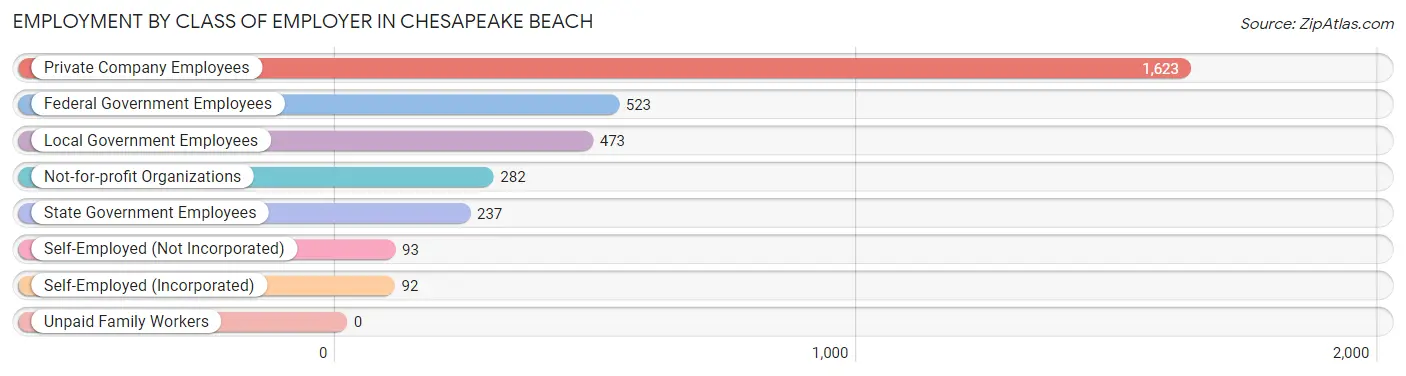
| Employer Class | # Employees | % Employees |
| Private Company Employees | 1,623 | 48.8% |
| Self-Employed (Incorporated) | 92 | 2.8% |
| Self-Employed (Not Incorporated) | 93 | 2.8% |
| Not-for-profit Organizations | 282 | 8.5% |
| Local Government Employees | 473 | 14.2% |
| State Government Employees | 237 | 7.1% |
| Federal Government Employees | 523 | 15.7% |
| Unpaid Family Workers | 0 | 0.0% |
| Total | 3,323 | 100.0% |
Employment Status by Age in Chesapeake Beach
According to the labor force statistics for Chesapeake Beach, out of the total population over 16 years of age (4,922), 68.4% or 3,367 individuals are in the labor force, with 1.2% or 40 of them unemployed. The age group with the highest labor force participation rate is 20 to 24 years, with 95.3% or 182 individuals in the labor force. Within the labor force, the 25 to 29 years age range has the highest percentage of unemployed individuals, with 7.1% or 20 of them being unemployed.
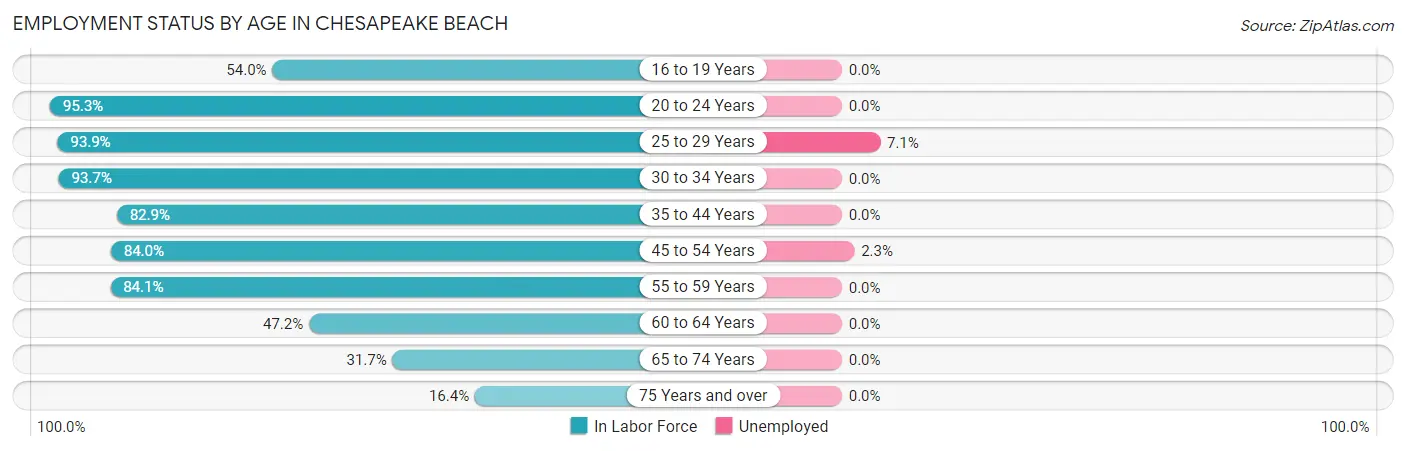
| Age Bracket | In Labor Force | Unemployed |
| 16 to 19 Years | 202 (54.0%) | 0 (0.0%) |
| 20 to 24 Years | 182 (95.3%) | 0 (0.0%) |
| 25 to 29 Years | 277 (93.9%) | 20 (7.1%) |
| 30 to 34 Years | 253 (93.7%) | 0 (0.0%) |
| 35 to 44 Years | 734 (82.9%) | 0 (0.0%) |
| 45 to 54 Years | 1,050 (84.0%) | 24 (2.3%) |
| 55 to 59 Years | 248 (84.1%) | 0 (0.0%) |
| 60 to 64 Years | 149 (47.2%) | 0 (0.0%) |
| 65 to 74 Years | 210 (31.7%) | 0 (0.0%) |
| 75 Years and over | 63 (16.4%) | 0 (0.0%) |
| Total | 3,367 (68.4%) | 40 (1.2%) |
Employment Status by Educational Attainment in Chesapeake Beach
According to labor force statistics for Chesapeake Beach, 81.9% of individuals (2,712) out of the total population between 25 and 64 years of age (3,311) are in the labor force, with 1.5% or 41 of them being unemployed. The group with the highest labor force participation rate are those with the educational attainment of high school diploma, with 93.6% or 393 individuals in the labor force. Within the labor force, individuals with high school diploma education have the highest percentage of unemployment, with 3.8% or 15 of them being unemployed.
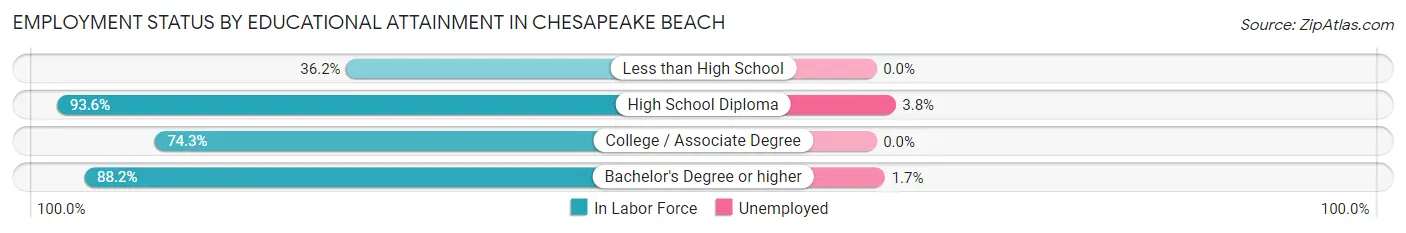
| Educational Attainment | In Labor Force | Unemployed |
| Less than High School | 59 (36.2%) | 0 (0.0%) |
| High School Diploma | 393 (93.6%) | 16 (3.8%) |
| College / Associate Degree | 791 (74.3%) | 0 (0.0%) |
| Bachelor's Degree or higher | 1,468 (88.2%) | 28 (1.7%) |
| Total | 2,712 (81.9%) | 50 (1.5%) |
Employment Occupations by Sex in Chesapeake Beach
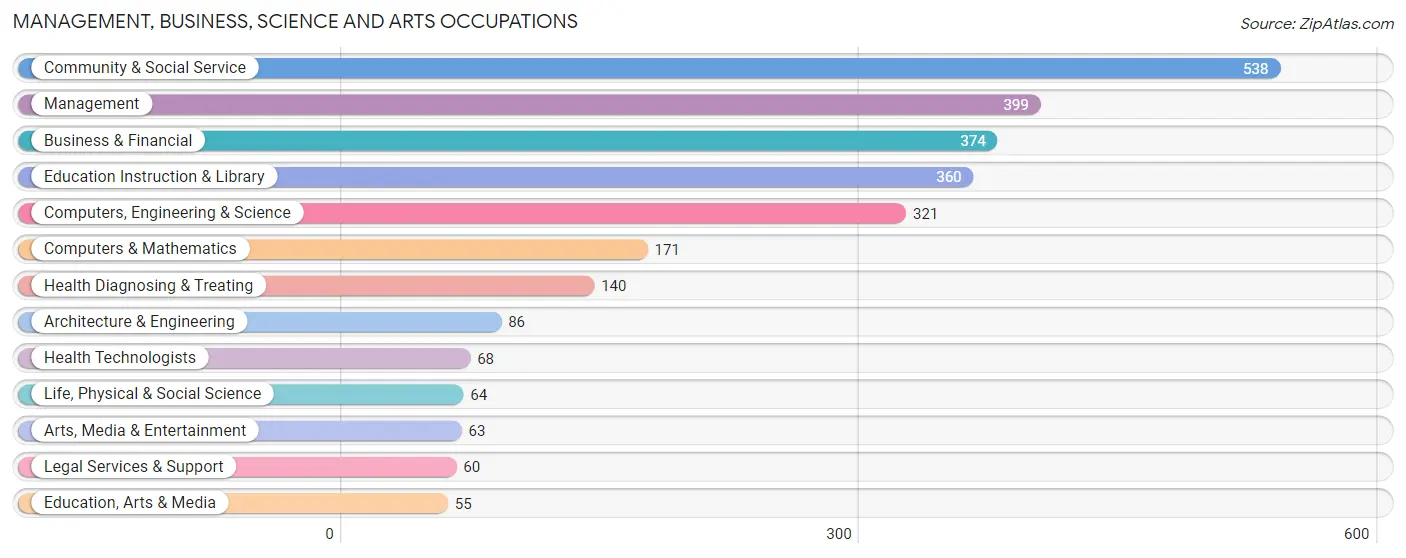
Management, Business, Science and Arts Occupations
The most common Management, Business, Science and Arts occupations in Chesapeake Beach are Community & Social Service (538 | 17.1%), Management (399 | 12.7%), Business & Financial (374 | 11.9%), Education Instruction & Library (360 | 11.4%), and Computers, Engineering & Science (321 | 10.2%).
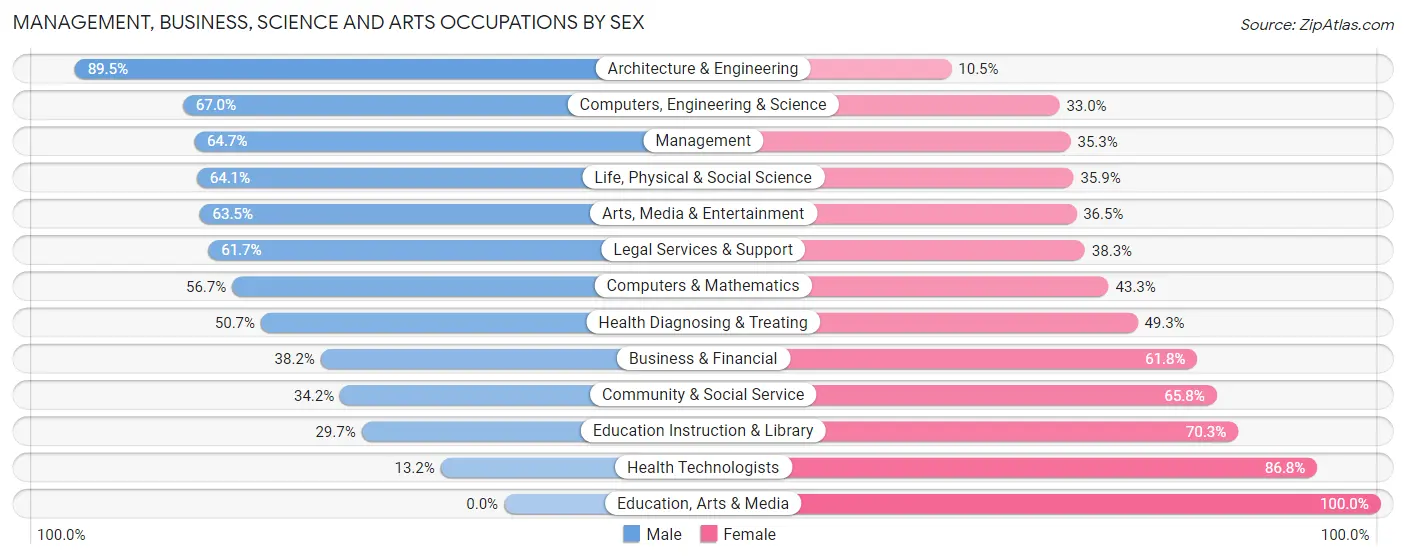
Management, Business, Science and Arts Occupations by Sex
Within the Management, Business, Science and Arts occupations in Chesapeake Beach, the most male-oriented occupations are Architecture & Engineering (89.5%), Computers, Engineering & Science (67.0%), and Management (64.7%), while the most female-oriented occupations are Education, Arts & Media (100.0%), Health Technologists (86.8%), and Education Instruction & Library (70.3%).
| Occupation | Male | Female |
| Management | 258 (64.7%) | 141 (35.3%) |
| Business & Financial | 143 (38.2%) | 231 (61.8%) |
| Computers, Engineering & Science | 215 (67.0%) | 106 (33.0%) |
| Computers & Mathematics | 97 (56.7%) | 74 (43.3%) |
| Architecture & Engineering | 77 (89.5%) | 9 (10.5%) |
| Life, Physical & Social Science | 41 (64.1%) | 23 (35.9%) |
| Community & Social Service | 184 (34.2%) | 354 (65.8%) |
| Education, Arts & Media | 0 (0.0%) | 55 (100.0%) |
| Legal Services & Support | 37 (61.7%) | 23 (38.3%) |
| Education Instruction & Library | 107 (29.7%) | 253 (70.3%) |
| Arts, Media & Entertainment | 40 (63.5%) | 23 (36.5%) |
| Health Diagnosing & Treating | 71 (50.7%) | 69 (49.3%) |
| Health Technologists | 9 (13.2%) | 59 (86.8%) |
| Total (Category) | 871 (49.1%) | 901 (50.8%) |
| Total (Overall) | 1,485 (47.2%) | 1,664 (52.8%) |
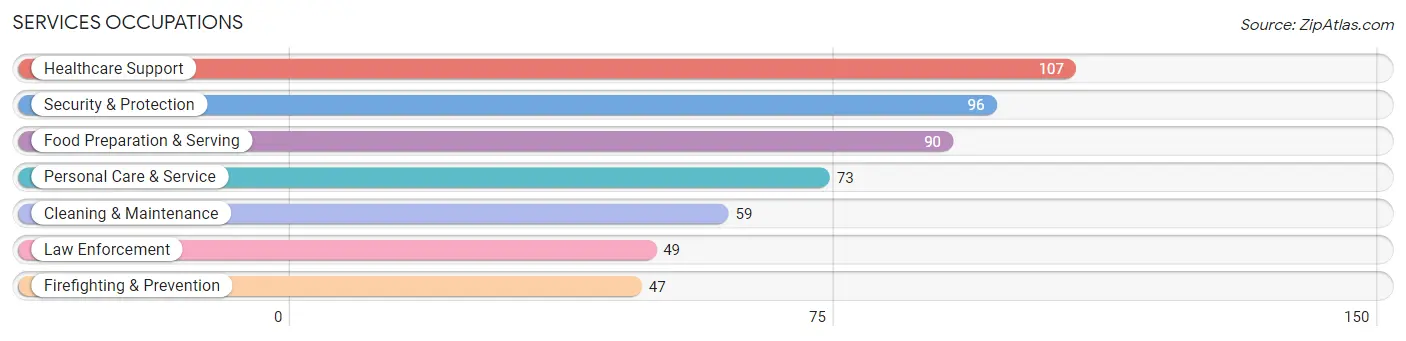
Services Occupations
The most common Services occupations in Chesapeake Beach are Healthcare Support (107 | 3.4%), Security & Protection (96 | 3.0%), Food Preparation & Serving (90 | 2.9%), Personal Care & Service (73 | 2.3%), and Cleaning & Maintenance (59 | 1.9%).
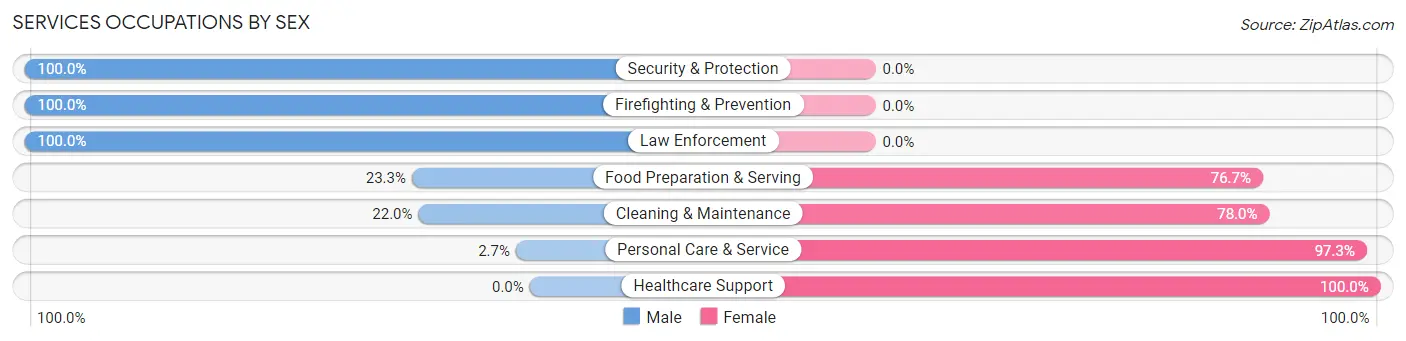
Services Occupations by Sex
Within the Services occupations in Chesapeake Beach, the most male-oriented occupations are Security & Protection (100.0%), Firefighting & Prevention (100.0%), and Law Enforcement (100.0%), while the most female-oriented occupations are Healthcare Support (100.0%), Personal Care & Service (97.3%), and Cleaning & Maintenance (78.0%).
| Occupation | Male | Female |
| Healthcare Support | 0 (0.0%) | 107 (100.0%) |
| Security & Protection | 96 (100.0%) | 0 (0.0%) |
| Firefighting & Prevention | 47 (100.0%) | 0 (0.0%) |
| Law Enforcement | 49 (100.0%) | 0 (0.0%) |
| Food Preparation & Serving | 21 (23.3%) | 69 (76.7%) |
| Cleaning & Maintenance | 13 (22.0%) | 46 (78.0%) |
| Personal Care & Service | 2 (2.7%) | 71 (97.3%) |
| Total (Category) | 132 (31.1%) | 293 (68.9%) |
| Total (Overall) | 1,485 (47.2%) | 1,664 (52.8%) |
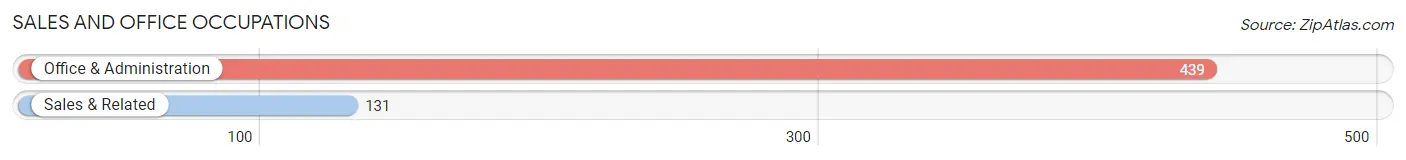
Sales and Office Occupations
The most common Sales and Office occupations in Chesapeake Beach are Office & Administration (439 | 13.9%), and Sales & Related (131 | 4.2%).
Sales and Office Occupations by Sex
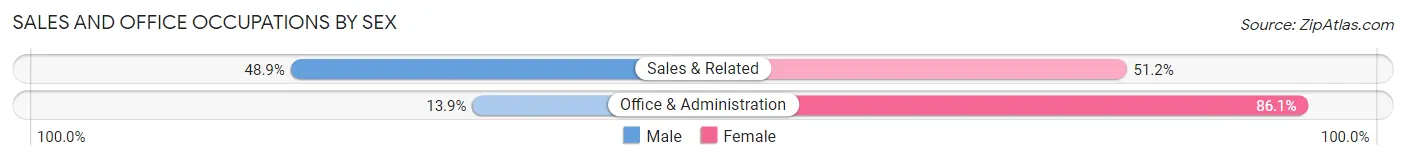
| Occupation | Male | Female |
| Sales & Related | 64 (48.8%) | 67 (51.1%) |
| Office & Administration | 61 (13.9%) | 378 (86.1%) |
| Total (Category) | 125 (21.9%) | 445 (78.1%) |
| Total (Overall) | 1,485 (47.2%) | 1,664 (52.8%) |
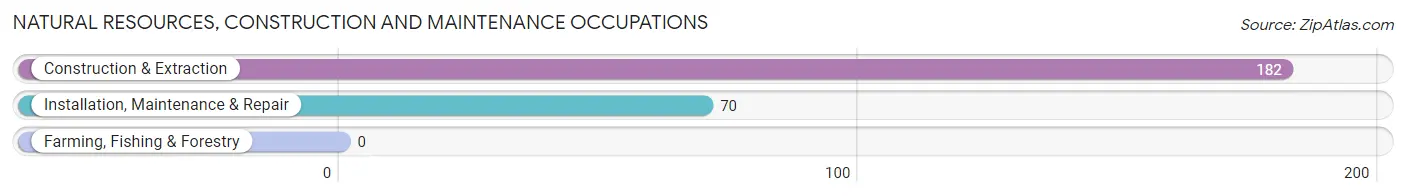
Natural Resources, Construction and Maintenance Occupations
The most common Natural Resources, Construction and Maintenance occupations in Chesapeake Beach are Construction & Extraction (182 | 5.8%), and Installation, Maintenance & Repair (70 | 2.2%).
Natural Resources, Construction and Maintenance Occupations by Sex
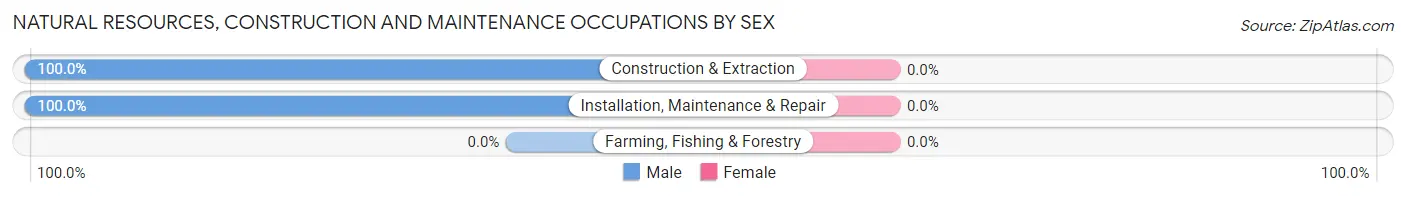
| Occupation | Male | Female |
| Farming, Fishing & Forestry | 0 (0.0%) | 0 (0.0%) |
| Construction & Extraction | 182 (100.0%) | 0 (0.0%) |
| Installation, Maintenance & Repair | 70 (100.0%) | 0 (0.0%) |
| Total (Category) | 252 (100.0%) | 0 (0.0%) |
| Total (Overall) | 1,485 (47.2%) | 1,664 (52.8%) |
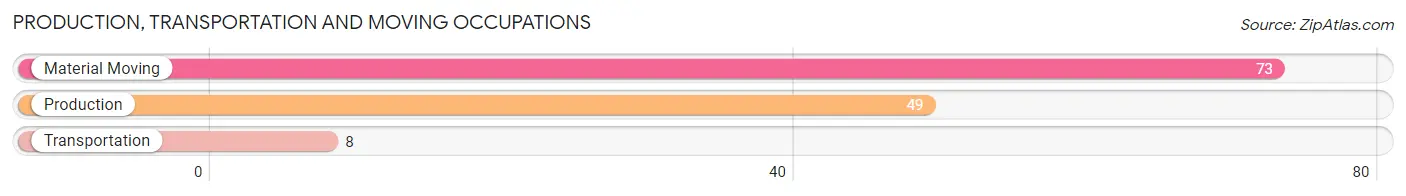
Production, Transportation and Moving Occupations
The most common Production, Transportation and Moving occupations in Chesapeake Beach are Material Moving (73 | 2.3%), Production (49 | 1.6%), and Transportation (8 | 0.3%).
Production, Transportation and Moving Occupations by Sex
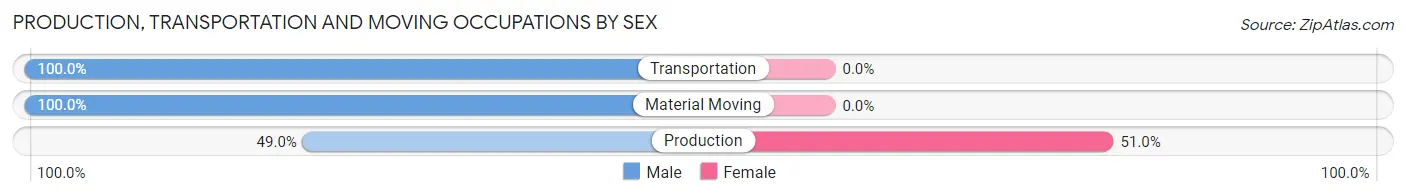
| Occupation | Male | Female |
| Production | 24 (49.0%) | 25 (51.0%) |
| Transportation | 8 (100.0%) | 0 (0.0%) |
| Material Moving | 73 (100.0%) | 0 (0.0%) |
| Total (Category) | 105 (80.8%) | 25 (19.2%) |
| Total (Overall) | 1,485 (47.2%) | 1,664 (52.8%) |
Employment Industries by Sex in Chesapeake Beach
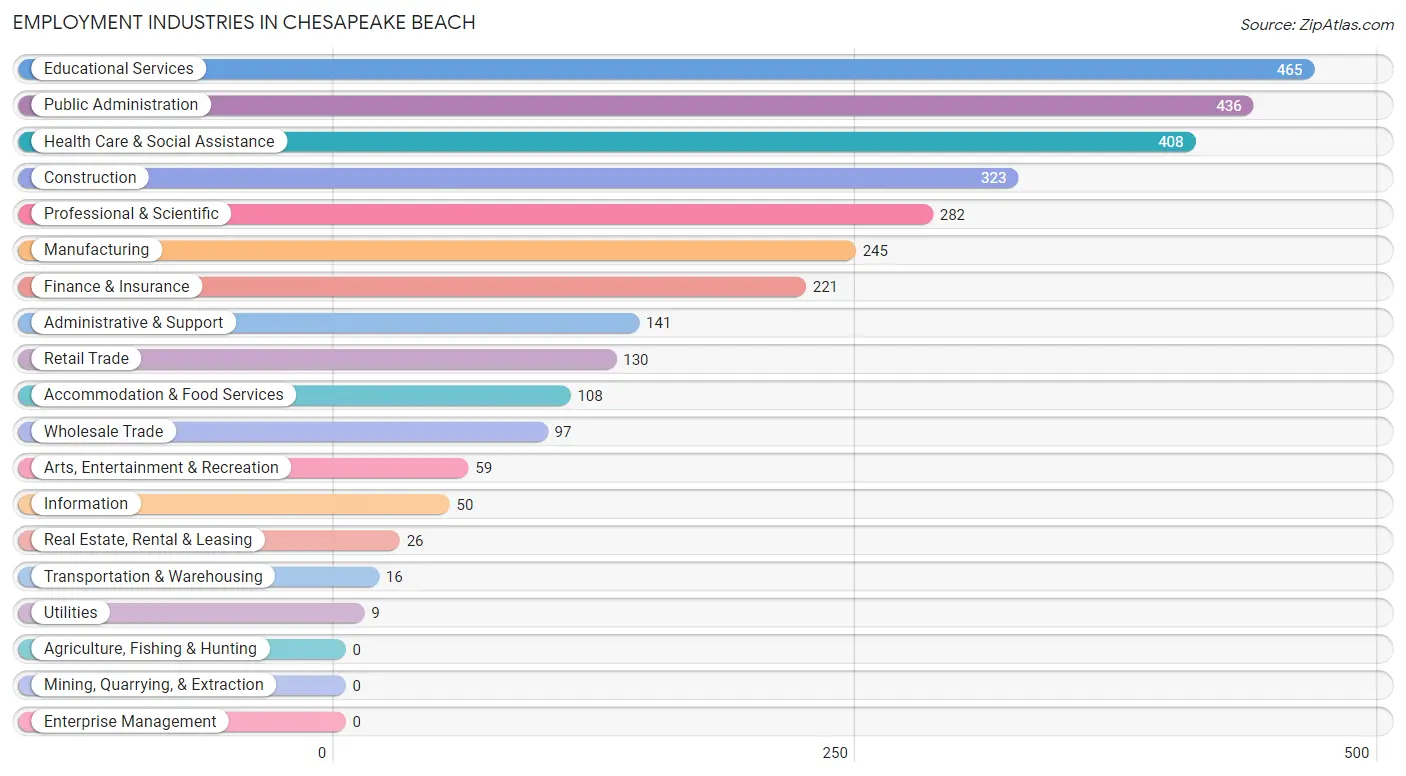
Employment Industries in Chesapeake Beach
The major employment industries in Chesapeake Beach include Educational Services (465 | 14.8%), Public Administration (436 | 13.9%), Health Care & Social Assistance (408 | 13.0%), Construction (323 | 10.3%), and Professional & Scientific (282 | 9.0%).
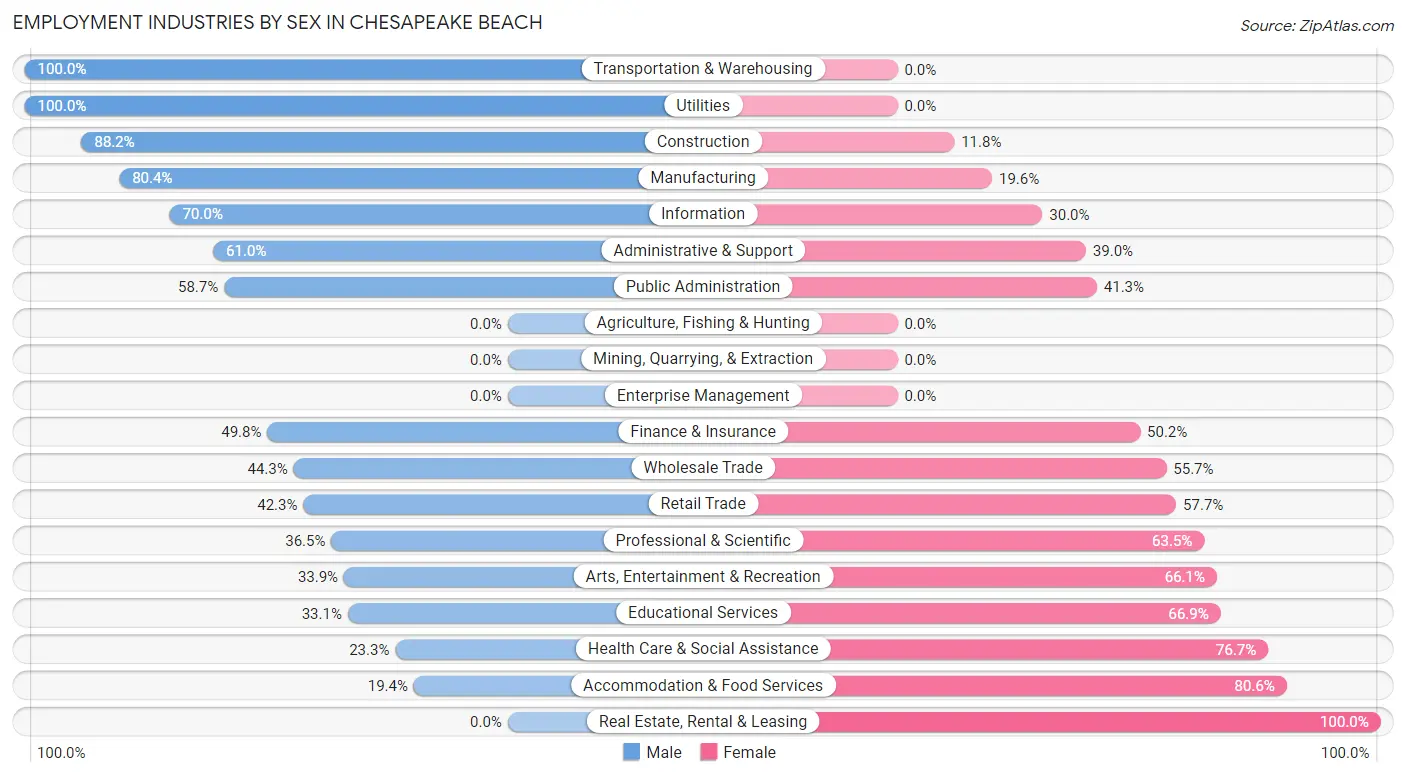
Employment Industries by Sex in Chesapeake Beach
The Chesapeake Beach industries that see more men than women are Transportation & Warehousing (100.0%), Utilities (100.0%), and Construction (88.2%), whereas the industries that tend to have a higher number of women are Real Estate, Rental & Leasing (100.0%), Accommodation & Food Services (80.6%), and Health Care & Social Assistance (76.7%).
| Industry | Male | Female |
| Agriculture, Fishing & Hunting | 0 (0.0%) | 0 (0.0%) |
| Mining, Quarrying, & Extraction | 0 (0.0%) | 0 (0.0%) |
| Construction | 285 (88.2%) | 38 (11.8%) |
| Manufacturing | 197 (80.4%) | 48 (19.6%) |
| Wholesale Trade | 43 (44.3%) | 54 (55.7%) |
| Retail Trade | 55 (42.3%) | 75 (57.7%) |
| Transportation & Warehousing | 16 (100.0%) | 0 (0.0%) |
| Utilities | 9 (100.0%) | 0 (0.0%) |
| Information | 35 (70.0%) | 15 (30.0%) |
| Finance & Insurance | 110 (49.8%) | 111 (50.2%) |
| Real Estate, Rental & Leasing | 0 (0.0%) | 26 (100.0%) |
| Professional & Scientific | 103 (36.5%) | 179 (63.5%) |
| Enterprise Management | 0 (0.0%) | 0 (0.0%) |
| Administrative & Support | 86 (61.0%) | 55 (39.0%) |
| Educational Services | 154 (33.1%) | 311 (66.9%) |
| Health Care & Social Assistance | 95 (23.3%) | 313 (76.7%) |
| Arts, Entertainment & Recreation | 20 (33.9%) | 39 (66.1%) |
| Accommodation & Food Services | 21 (19.4%) | 87 (80.6%) |
| Public Administration | 256 (58.7%) | 180 (41.3%) |
| Total | 1,485 (47.2%) | 1,664 (52.8%) |
Education in Chesapeake Beach
School Enrollment in Chesapeake Beach
The most common levels of schooling among the 1,846 students in Chesapeake Beach are high school (478 | 25.9%), middle school (400 | 21.7%), and elementary school (386 | 20.9%).
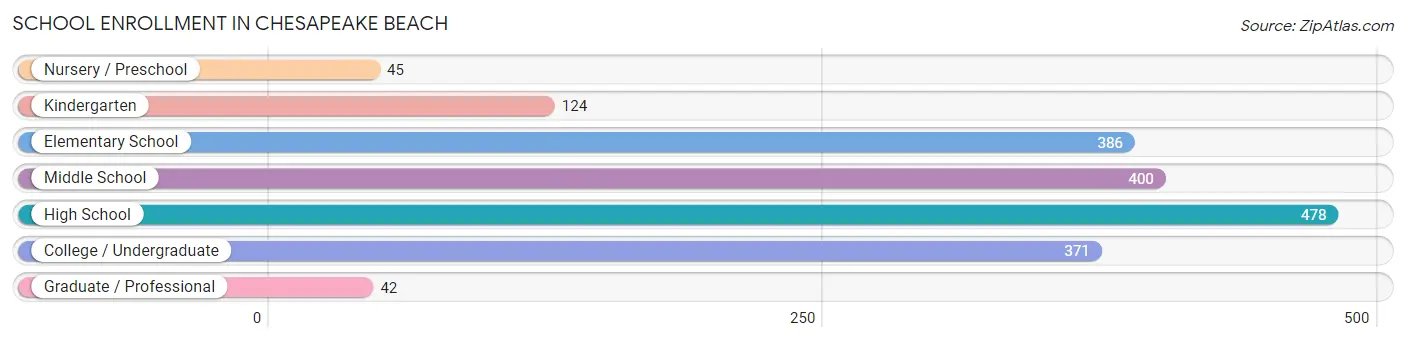
| School Level | # Students | % Students |
| Nursery / Preschool | 45 | 2.4% |
| Kindergarten | 124 | 6.7% |
| Elementary School | 386 | 20.9% |
| Middle School | 400 | 21.7% |
| High School | 478 | 25.9% |
| College / Undergraduate | 371 | 20.1% |
| Graduate / Professional | 42 | 2.3% |
| Total | 1,846 | 100.0% |
School Enrollment by Age by Funding Source in Chesapeake Beach
Out of a total of 1,846 students who are enrolled in schools in Chesapeake Beach, 183 (9.9%) attend a private institution, while the remaining 1,663 (90.1%) are enrolled in public schools. The age group of 3 to 4 year olds has the highest likelihood of being enrolled in private schools, with 27 (100.0% in the age bracket) enrolled. Conversely, the age group of 18 to 19 year olds has the lowest likelihood of being enrolled in a private school, with 128 (100.0% in the age bracket) attending a public institution.
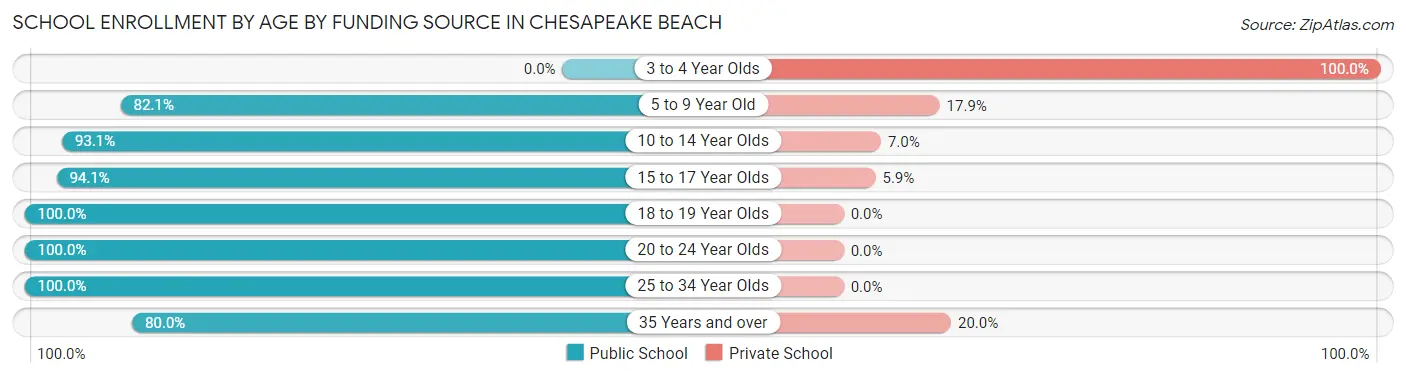
| Age Bracket | Public School | Private School |
| 3 to 4 Year Olds | 0 (0.0%) | 27 (100.0%) |
| 5 to 9 Year Old | 372 (82.1%) | 81 (17.9%) |
| 10 to 14 Year Olds | 576 (93.0%) | 43 (7.0%) |
| 15 to 17 Year Olds | 301 (94.1%) | 19 (5.9%) |
| 18 to 19 Year Olds | 128 (100.0%) | 0 (0.0%) |
| 20 to 24 Year Olds | 67 (100.0%) | 0 (0.0%) |
| 25 to 34 Year Olds | 172 (100.0%) | 0 (0.0%) |
| 35 Years and over | 48 (80.0%) | 12 (20.0%) |
| Total | 1,663 (90.1%) | 183 (9.9%) |
Educational Attainment by Field of Study in Chesapeake Beach
Education (354 | 15.0%), business (289 | 12.3%), liberal arts & history (229 | 9.7%), psychology (225 | 9.6%), and science & technology (224 | 9.5%) are the most common fields of study among 2,355 individuals in Chesapeake Beach who have obtained a bachelor's degree or higher.
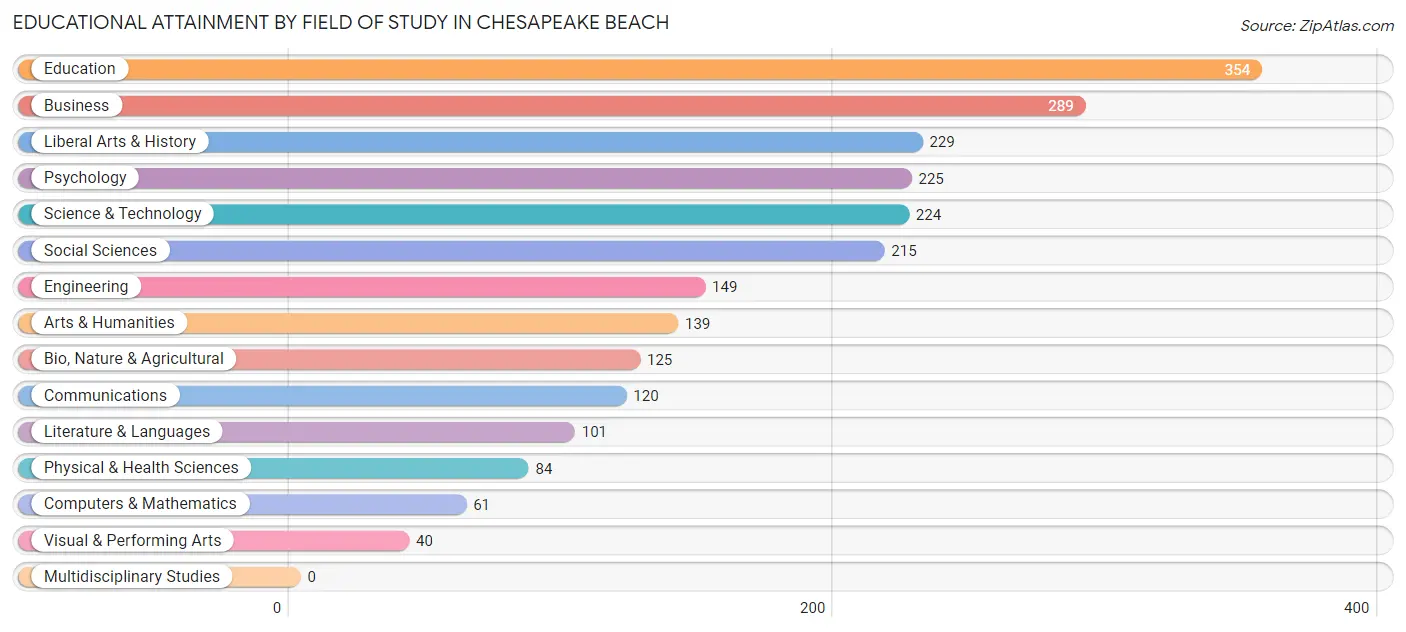
| Field of Study | # Graduates | % Graduates |
| Computers & Mathematics | 61 | 2.6% |
| Bio, Nature & Agricultural | 125 | 5.3% |
| Physical & Health Sciences | 84 | 3.6% |
| Psychology | 225 | 9.6% |
| Social Sciences | 215 | 9.1% |
| Engineering | 149 | 6.3% |
| Multidisciplinary Studies | 0 | 0.0% |
| Science & Technology | 224 | 9.5% |
| Business | 289 | 12.3% |
| Education | 354 | 15.0% |
| Literature & Languages | 101 | 4.3% |
| Liberal Arts & History | 229 | 9.7% |
| Visual & Performing Arts | 40 | 1.7% |
| Communications | 120 | 5.1% |
| Arts & Humanities | 139 | 5.9% |
| Total | 2,355 | 100.0% |
Transportation & Commute in Chesapeake Beach
Vehicle Availability by Sex in Chesapeake Beach
The most prevalent vehicle ownership categories in Chesapeake Beach are males with 2 vehicles (741, accounting for 46.4%) and females with 2 vehicles (602, making up 43.0%).
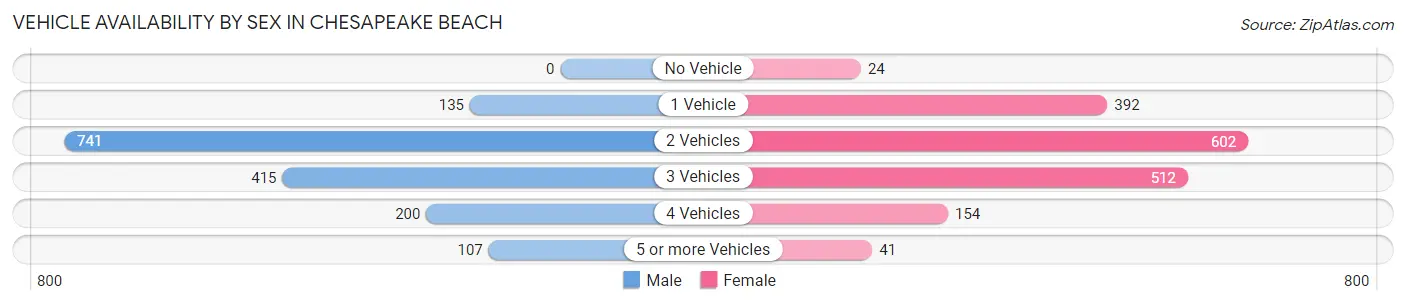
| Vehicles Available | Male | Female |
| No Vehicle | 0 (0.0%) | 24 (1.4%) |
| 1 Vehicle | 135 (8.5%) | 392 (22.7%) |
| 2 Vehicles | 741 (46.4%) | 602 (34.9%) |
| 3 Vehicles | 415 (26.0%) | 512 (29.7%) |
| 4 Vehicles | 200 (12.5%) | 154 (8.9%) |
| 5 or more Vehicles | 107 (6.7%) | 41 (2.4%) |
| Total | 1,598 (100.0%) | 1,725 (100.0%) |
Commute Time in Chesapeake Beach
The most frequently occuring commute durations in Chesapeake Beach are 45 to 59 minutes (872 commuters, 31.0%), 60 to 89 minutes (464 commuters, 16.5%), and 35 to 39 minutes (241 commuters, 8.6%).
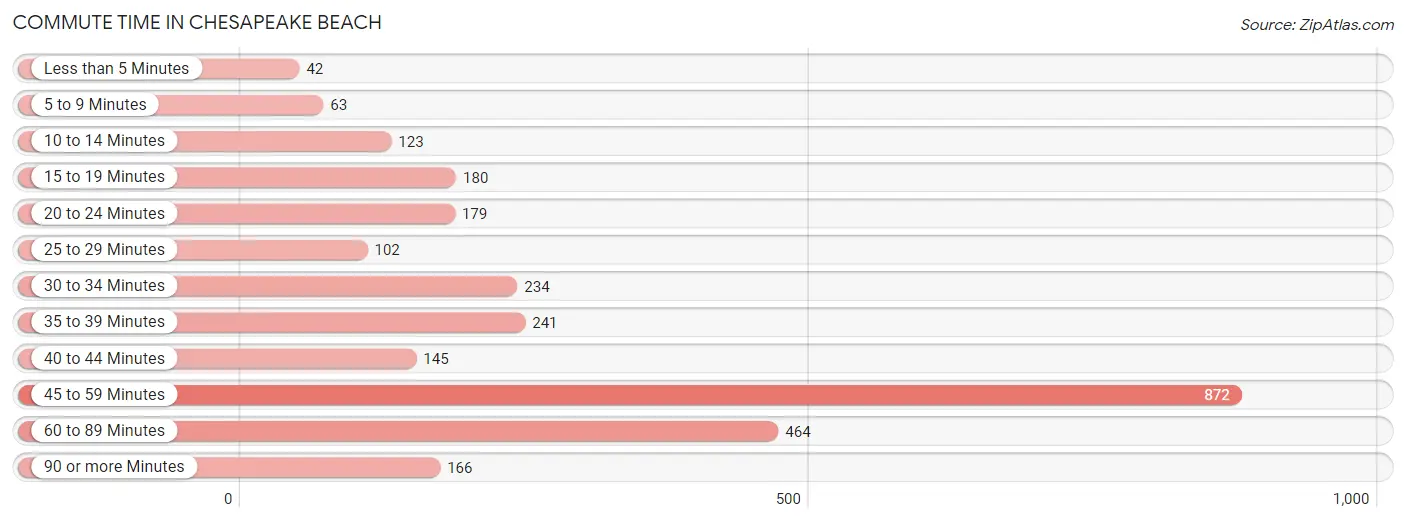
| Commute Time | # Commuters | % Commuters |
| Less than 5 Minutes | 42 | 1.5% |
| 5 to 9 Minutes | 63 | 2.2% |
| 10 to 14 Minutes | 123 | 4.4% |
| 15 to 19 Minutes | 180 | 6.4% |
| 20 to 24 Minutes | 179 | 6.4% |
| 25 to 29 Minutes | 102 | 3.6% |
| 30 to 34 Minutes | 234 | 8.3% |
| 35 to 39 Minutes | 241 | 8.6% |
| 40 to 44 Minutes | 145 | 5.2% |
| 45 to 59 Minutes | 872 | 31.0% |
| 60 to 89 Minutes | 464 | 16.5% |
| 90 or more Minutes | 166 | 5.9% |
Commute Time by Sex in Chesapeake Beach
The most common commute times in Chesapeake Beach are 45 to 59 minutes (486 commuters, 34.7%) for males and 45 to 59 minutes (386 commuters, 27.4%) for females.
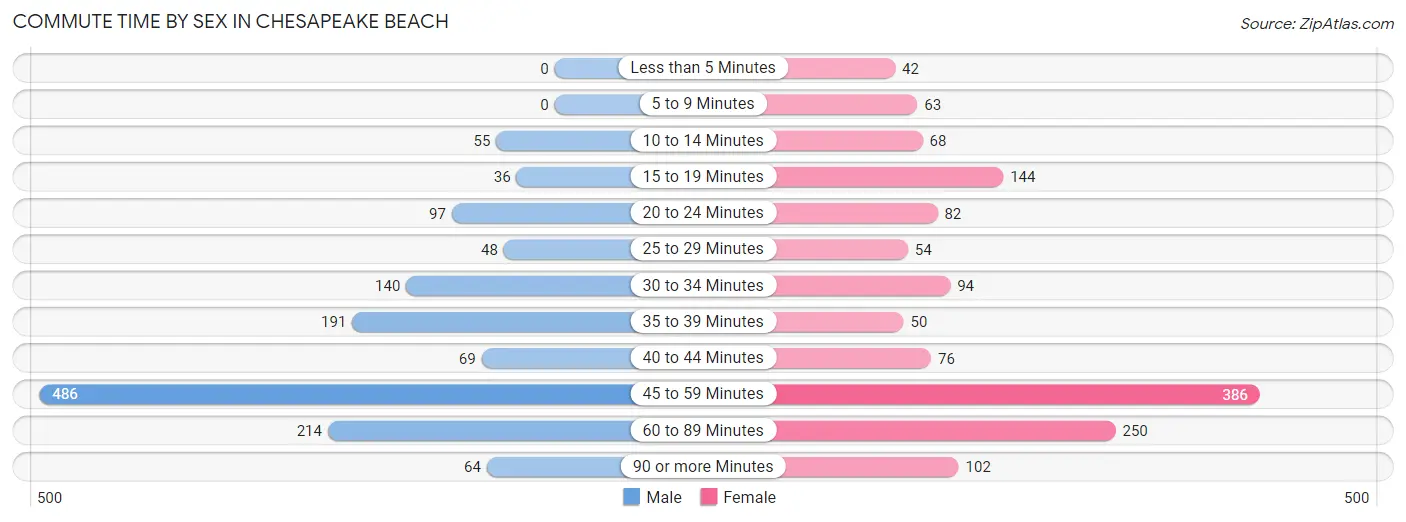
| Commute Time | Male | Female |
| Less than 5 Minutes | 0 (0.0%) | 42 (3.0%) |
| 5 to 9 Minutes | 0 (0.0%) | 63 (4.5%) |
| 10 to 14 Minutes | 55 (3.9%) | 68 (4.8%) |
| 15 to 19 Minutes | 36 (2.6%) | 144 (10.2%) |
| 20 to 24 Minutes | 97 (6.9%) | 82 (5.8%) |
| 25 to 29 Minutes | 48 (3.4%) | 54 (3.8%) |
| 30 to 34 Minutes | 140 (10.0%) | 94 (6.7%) |
| 35 to 39 Minutes | 191 (13.6%) | 50 (3.5%) |
| 40 to 44 Minutes | 69 (4.9%) | 76 (5.4%) |
| 45 to 59 Minutes | 486 (34.7%) | 386 (27.4%) |
| 60 to 89 Minutes | 214 (15.3%) | 250 (17.7%) |
| 90 or more Minutes | 64 (4.6%) | 102 (7.2%) |
Time of Departure to Work by Sex in Chesapeake Beach
The most frequent times of departure to work in Chesapeake Beach are 6:00 AM to 6:29 AM (263, 18.8%) for males and 6:00 AM to 6:29 AM (299, 21.2%) for females.
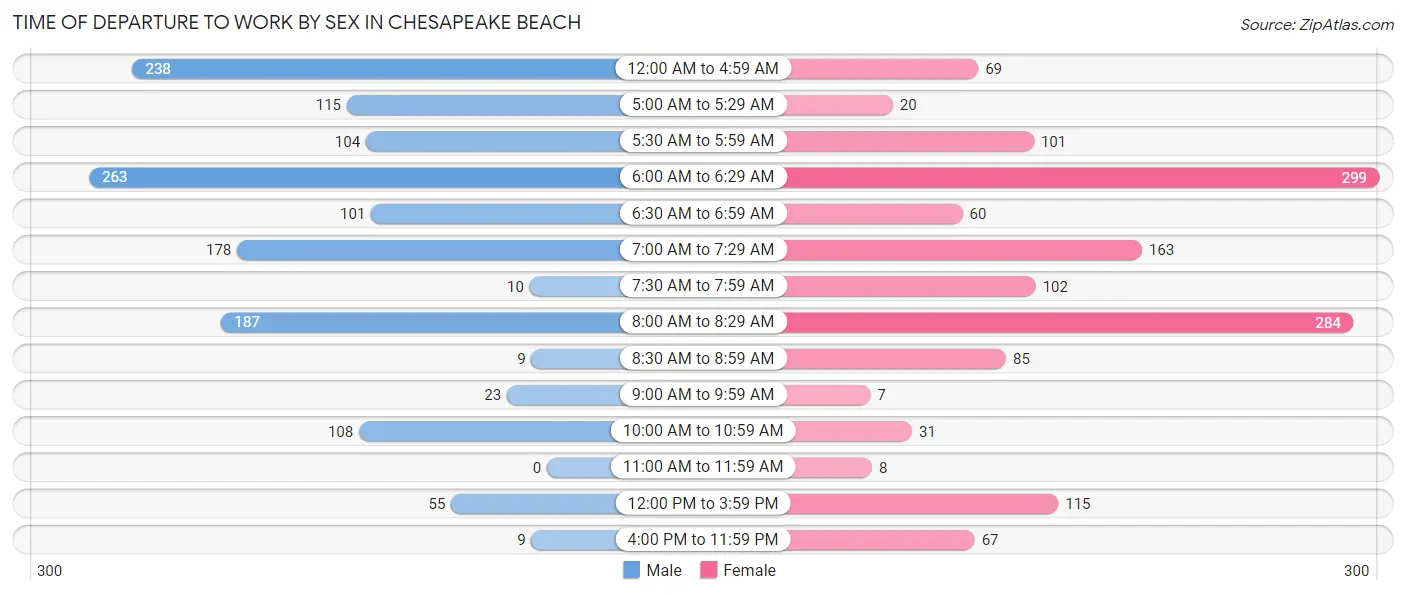
| Time of Departure | Male | Female |
| 12:00 AM to 4:59 AM | 238 (17.0%) | 69 (4.9%) |
| 5:00 AM to 5:29 AM | 115 (8.2%) | 20 (1.4%) |
| 5:30 AM to 5:59 AM | 104 (7.4%) | 101 (7.2%) |
| 6:00 AM to 6:29 AM | 263 (18.8%) | 299 (21.2%) |
| 6:30 AM to 6:59 AM | 101 (7.2%) | 60 (4.3%) |
| 7:00 AM to 7:29 AM | 178 (12.7%) | 163 (11.6%) |
| 7:30 AM to 7:59 AM | 10 (0.7%) | 102 (7.2%) |
| 8:00 AM to 8:29 AM | 187 (13.4%) | 284 (20.1%) |
| 8:30 AM to 8:59 AM | 9 (0.6%) | 85 (6.0%) |
| 9:00 AM to 9:59 AM | 23 (1.6%) | 7 (0.5%) |
| 10:00 AM to 10:59 AM | 108 (7.7%) | 31 (2.2%) |
| 11:00 AM to 11:59 AM | 0 (0.0%) | 8 (0.6%) |
| 12:00 PM to 3:59 PM | 55 (3.9%) | 115 (8.2%) |
| 4:00 PM to 11:59 PM | 9 (0.6%) | 67 (4.8%) |
| Total | 1,400 (100.0%) | 1,411 (100.0%) |
Housing Occupancy in Chesapeake Beach
Occupancy by Ownership in Chesapeake Beach
Of the total 2,582 dwellings in Chesapeake Beach, owner-occupied units account for 2,017 (78.1%), while renter-occupied units make up 565 (21.9%).
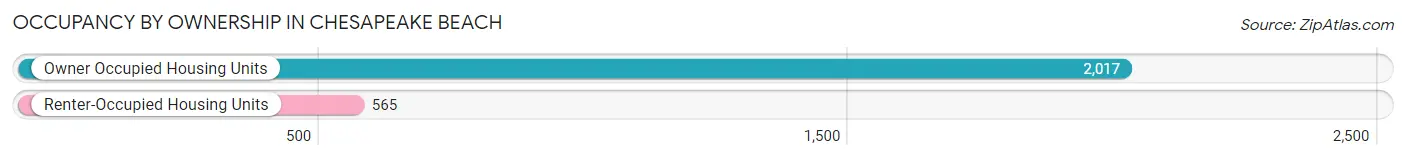
| Occupancy | # Housing Units | % Housing Units |
| Owner Occupied Housing Units | 2,017 | 78.1% |
| Renter-Occupied Housing Units | 565 | 21.9% |
| Total Occupied Housing Units | 2,582 | 100.0% |
Occupancy by Household Size in Chesapeake Beach
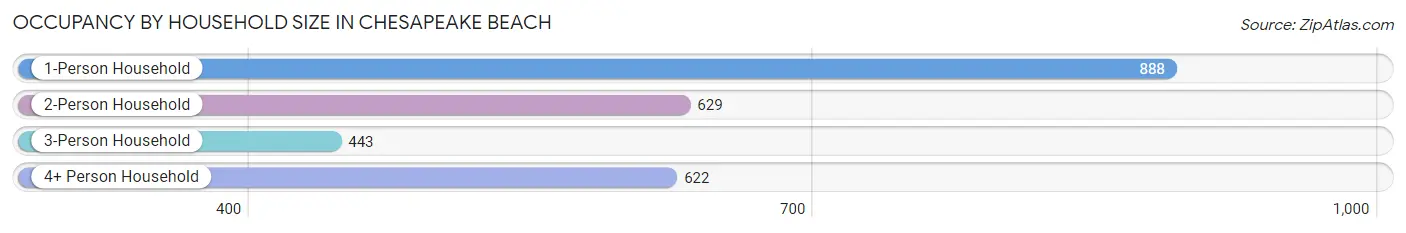
| Household Size | # Housing Units | % Housing Units |
| 1-Person Household | 888 | 34.4% |
| 2-Person Household | 629 | 24.4% |
| 3-Person Household | 443 | 17.2% |
| 4+ Person Household | 622 | 24.1% |
| Total Housing Units | 2,582 | 100.0% |
Occupancy by Ownership by Household Size in Chesapeake Beach
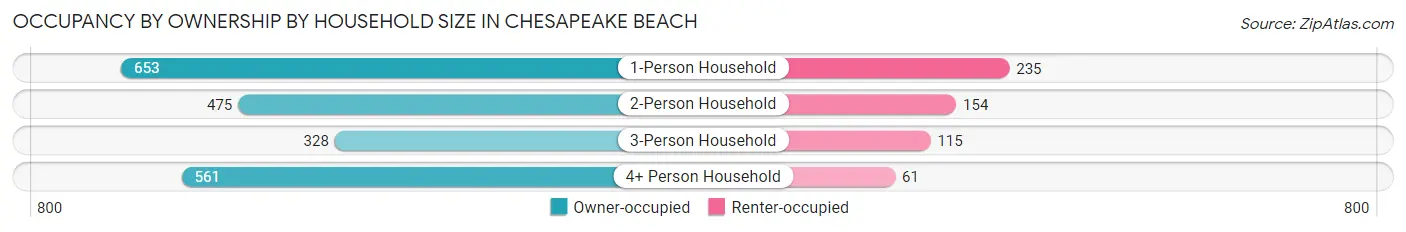
| Household Size | Owner-occupied | Renter-occupied |
| 1-Person Household | 653 (73.5%) | 235 (26.5%) |
| 2-Person Household | 475 (75.5%) | 154 (24.5%) |
| 3-Person Household | 328 (74.0%) | 115 (26.0%) |
| 4+ Person Household | 561 (90.2%) | 61 (9.8%) |
| Total Housing Units | 2,017 (78.1%) | 565 (21.9%) |
Occupancy by Educational Attainment in Chesapeake Beach
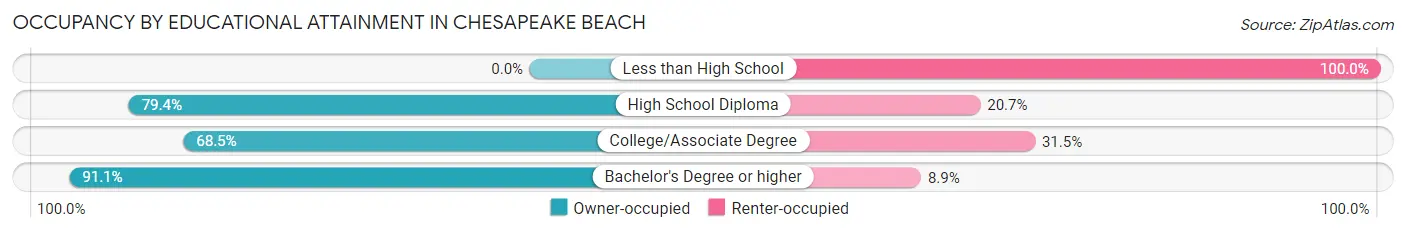
| Household Size | Owner-occupied | Renter-occupied |
| Less than High School | 0 (0.0%) | 146 (100.0%) |
| High School Diploma | 292 (79.3%) | 76 (20.6%) |
| College/Associate Degree | 483 (68.5%) | 222 (31.5%) |
| Bachelor's Degree or higher | 1,242 (91.1%) | 121 (8.9%) |
Occupancy by Age of Householder in Chesapeake Beach
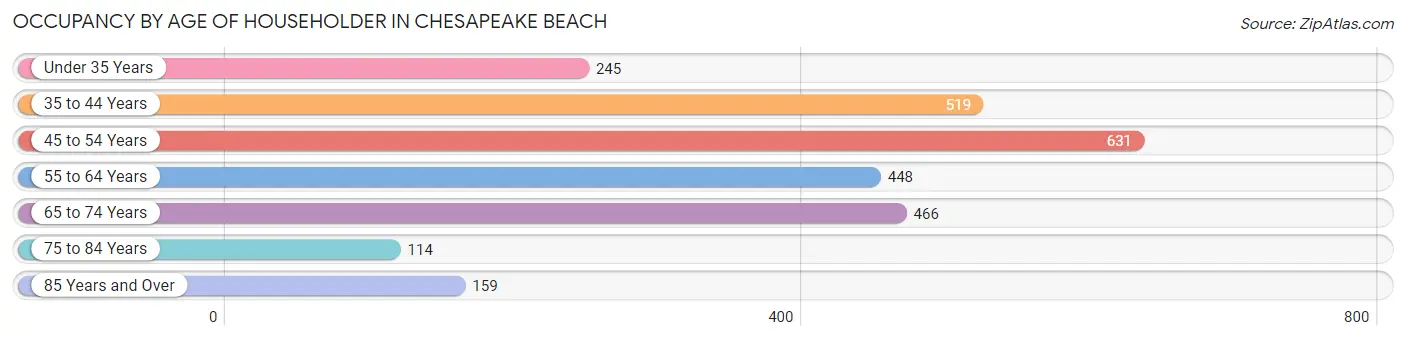
| Age Bracket | # Households | % Households |
| Under 35 Years | 245 | 9.5% |
| 35 to 44 Years | 519 | 20.1% |
| 45 to 54 Years | 631 | 24.4% |
| 55 to 64 Years | 448 | 17.3% |
| 65 to 74 Years | 466 | 18.0% |
| 75 to 84 Years | 114 | 4.4% |
| 85 Years and Over | 159 | 6.2% |
| Total | 2,582 | 100.0% |
Housing Finances in Chesapeake Beach
Median Income by Occupancy in Chesapeake Beach
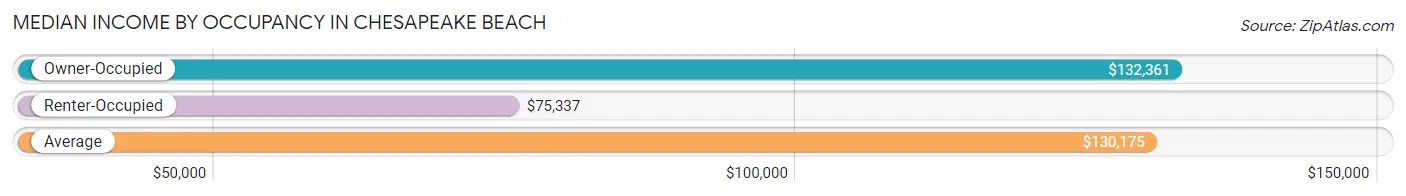
| Occupancy Type | # Households | Median Income |
| Owner-Occupied | 2,017 (78.1%) | $132,361 |
| Renter-Occupied | 565 (21.9%) | $75,337 |
| Average | 2,582 (100.0%) | $130,175 |
Occupancy by Householder Income Bracket in Chesapeake Beach
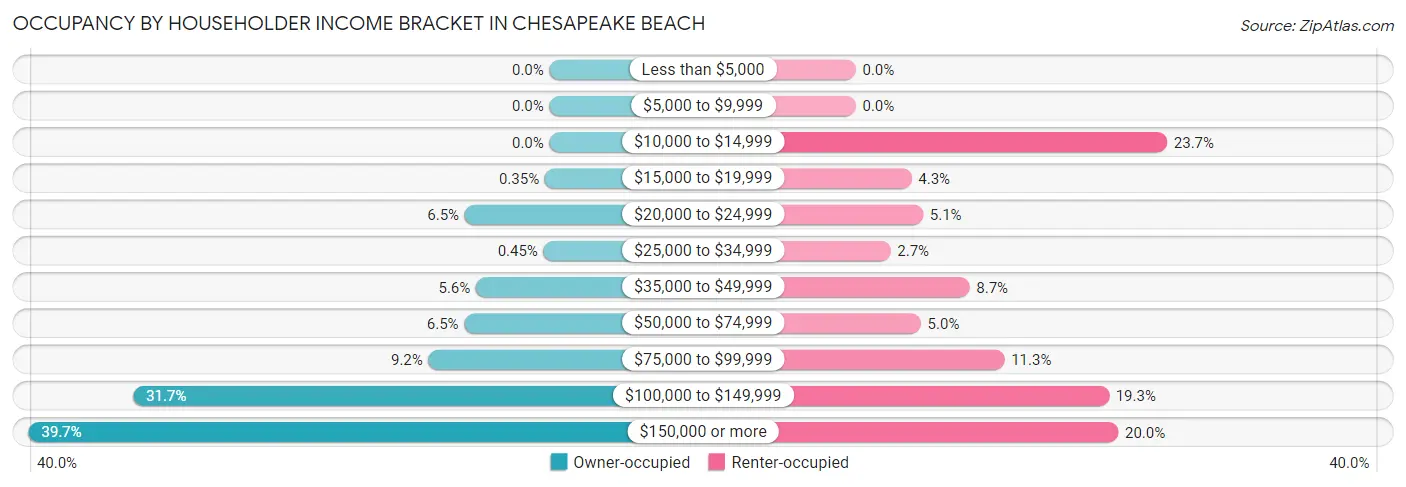
| Income Bracket | Owner-occupied | Renter-occupied |
| Less than $5,000 | 0 (0.0%) | 0 (0.0%) |
| $5,000 to $9,999 | 0 (0.0%) | 0 (0.0%) |
| $10,000 to $14,999 | 0 (0.0%) | 134 (23.7%) |
| $15,000 to $19,999 | 7 (0.4%) | 24 (4.3%) |
| $20,000 to $24,999 | 130 (6.5%) | 29 (5.1%) |
| $25,000 to $34,999 | 9 (0.4%) | 15 (2.6%) |
| $35,000 to $49,999 | 113 (5.6%) | 49 (8.7%) |
| $50,000 to $74,999 | 131 (6.5%) | 28 (5.0%) |
| $75,000 to $99,999 | 186 (9.2%) | 64 (11.3%) |
| $100,000 to $149,999 | 640 (31.7%) | 109 (19.3%) |
| $150,000 or more | 801 (39.7%) | 113 (20.0%) |
| Total | 2,017 (100.0%) | 565 (100.0%) |
Monthly Housing Cost Tiers in Chesapeake Beach
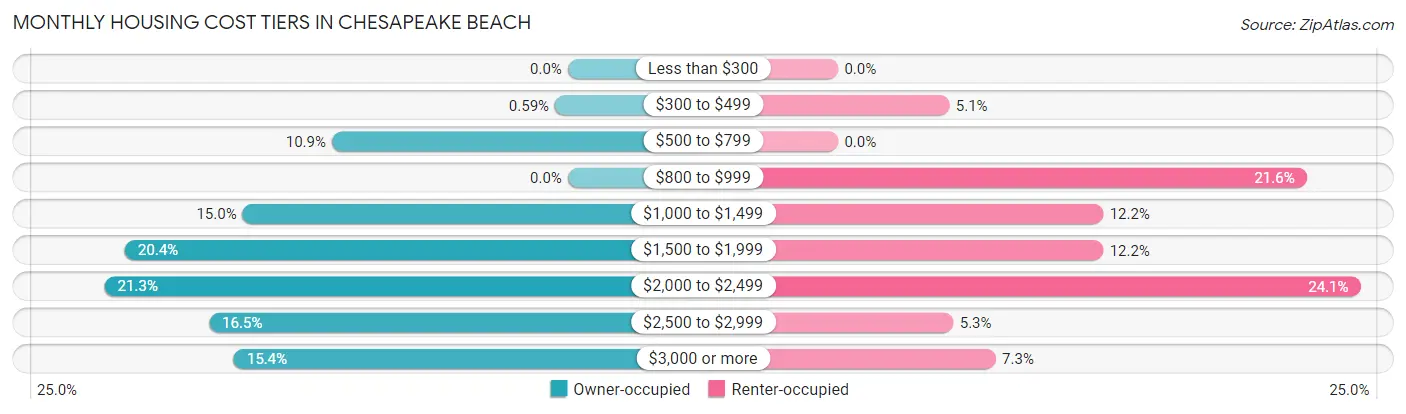
| Monthly Cost | Owner-occupied | Renter-occupied |
| Less than $300 | 0 (0.0%) | 0 (0.0%) |
| $300 to $499 | 12 (0.6%) | 29 (5.1%) |
| $500 to $799 | 219 (10.9%) | 0 (0.0%) |
| $800 to $999 | 0 (0.0%) | 122 (21.6%) |
| $1,000 to $1,499 | 302 (15.0%) | 69 (12.2%) |
| $1,500 to $1,999 | 411 (20.4%) | 69 (12.2%) |
| $2,000 to $2,499 | 430 (21.3%) | 136 (24.1%) |
| $2,500 to $2,999 | 333 (16.5%) | 30 (5.3%) |
| $3,000 or more | 310 (15.4%) | 41 (7.3%) |
| Total | 2,017 (100.0%) | 565 (100.0%) |
Physical Housing Characteristics in Chesapeake Beach
Housing Structures in Chesapeake Beach
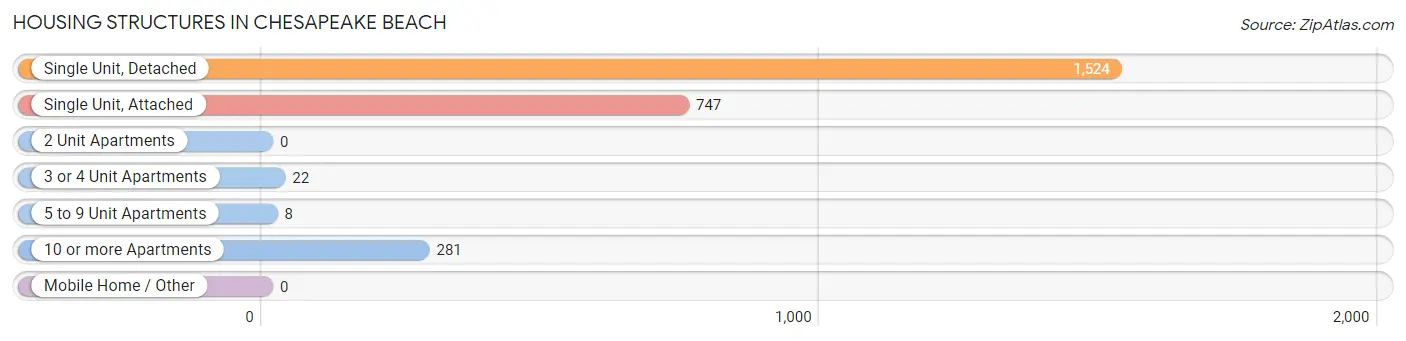
| Structure Type | # Housing Units | % Housing Units |
| Single Unit, Detached | 1,524 | 59.0% |
| Single Unit, Attached | 747 | 28.9% |
| 2 Unit Apartments | 0 | 0.0% |
| 3 or 4 Unit Apartments | 22 | 0.9% |
| 5 to 9 Unit Apartments | 8 | 0.3% |
| 10 or more Apartments | 281 | 10.9% |
| Mobile Home / Other | 0 | 0.0% |
| Total | 2,582 | 100.0% |
Housing Structures by Occupancy in Chesapeake Beach
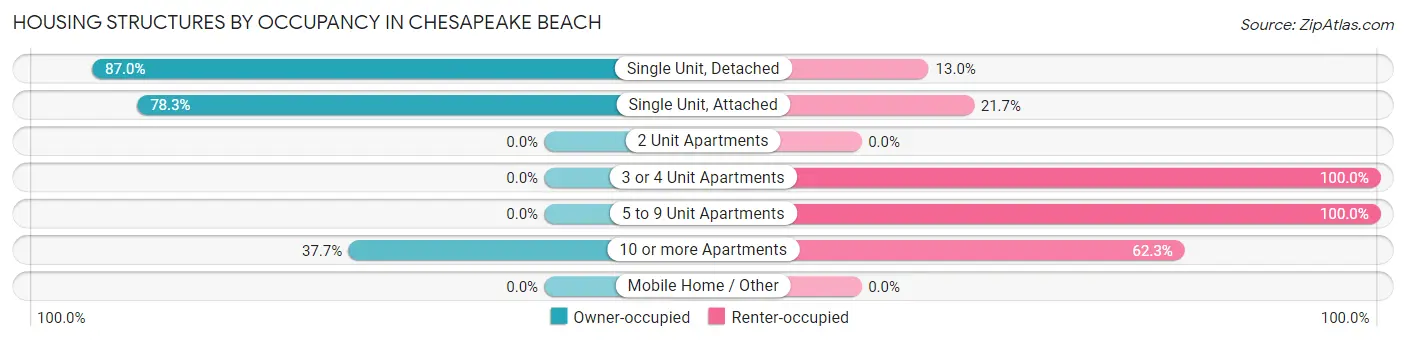
| Structure Type | Owner-occupied | Renter-occupied |
| Single Unit, Detached | 1,326 (87.0%) | 198 (13.0%) |
| Single Unit, Attached | 585 (78.3%) | 162 (21.7%) |
| 2 Unit Apartments | 0 (0.0%) | 0 (0.0%) |
| 3 or 4 Unit Apartments | 0 (0.0%) | 22 (100.0%) |
| 5 to 9 Unit Apartments | 0 (0.0%) | 8 (100.0%) |
| 10 or more Apartments | 106 (37.7%) | 175 (62.3%) |
| Mobile Home / Other | 0 (0.0%) | 0 (0.0%) |
| Total | 2,017 (78.1%) | 565 (21.9%) |
Housing Structures by Number of Rooms in Chesapeake Beach
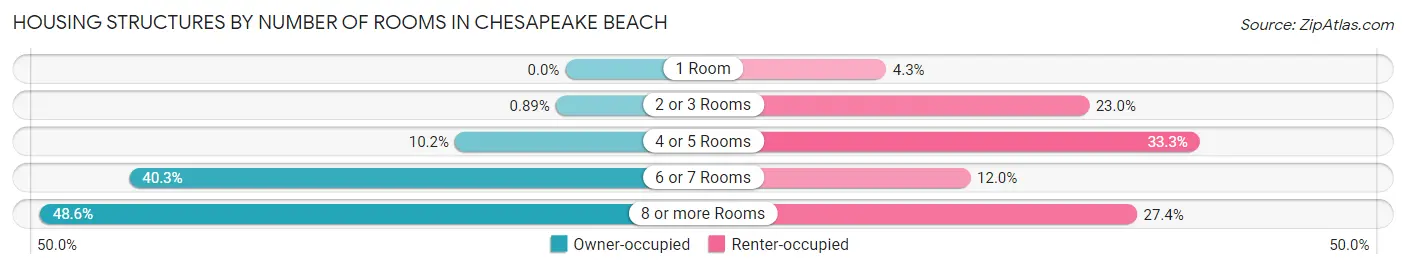
| Number of Rooms | Owner-occupied | Renter-occupied |
| 1 Room | 0 (0.0%) | 24 (4.3%) |
| 2 or 3 Rooms | 18 (0.9%) | 130 (23.0%) |
| 4 or 5 Rooms | 206 (10.2%) | 188 (33.3%) |
| 6 or 7 Rooms | 813 (40.3%) | 68 (12.0%) |
| 8 or more Rooms | 980 (48.6%) | 155 (27.4%) |
| Total | 2,017 (100.0%) | 565 (100.0%) |
Housing Structure by Heating Type in Chesapeake Beach
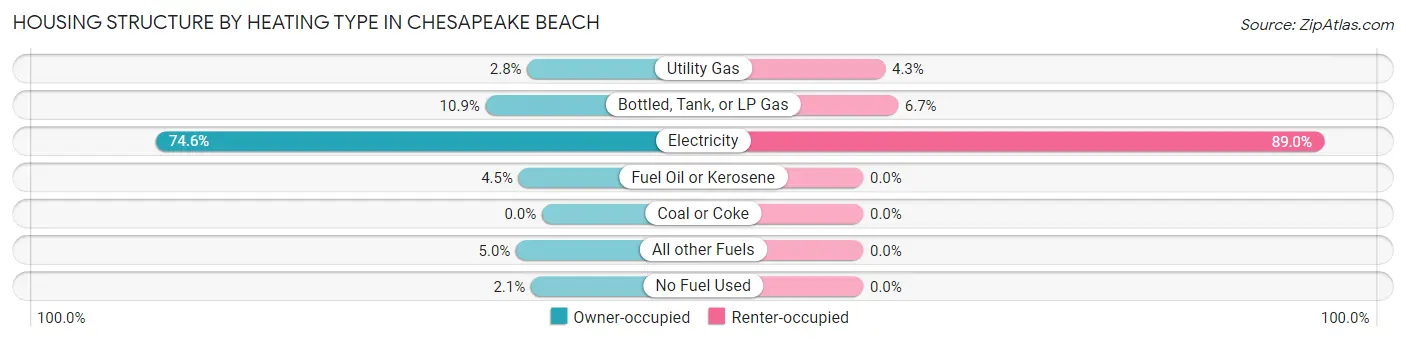
| Heating Type | Owner-occupied | Renter-occupied |
| Utility Gas | 57 (2.8%) | 24 (4.3%) |
| Bottled, Tank, or LP Gas | 220 (10.9%) | 38 (6.7%) |
| Electricity | 1,505 (74.6%) | 503 (89.0%) |
| Fuel Oil or Kerosene | 91 (4.5%) | 0 (0.0%) |
| Coal or Coke | 0 (0.0%) | 0 (0.0%) |
| All other Fuels | 101 (5.0%) | 0 (0.0%) |
| No Fuel Used | 43 (2.1%) | 0 (0.0%) |
| Total | 2,017 (100.0%) | 565 (100.0%) |
Household Vehicle Usage in Chesapeake Beach
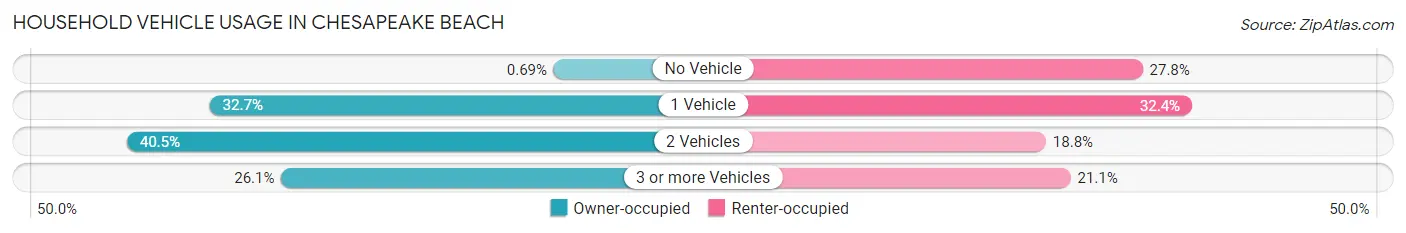
| Vehicles per Household | Owner-occupied | Renter-occupied |
| No Vehicle | 14 (0.7%) | 157 (27.8%) |
| 1 Vehicle | 660 (32.7%) | 183 (32.4%) |
| 2 Vehicles | 816 (40.5%) | 106 (18.8%) |
| 3 or more Vehicles | 527 (26.1%) | 119 (21.1%) |
| Total | 2,017 (100.0%) | 565 (100.0%) |
Real Estate & Mortgages in Chesapeake Beach
Real Estate and Mortgage Overview in Chesapeake Beach
| Characteristic | Without Mortgage | With Mortgage |
| Housing Units | 380 | 1,637 |
| Median Property Value | $438,000 | $402,700 |
| Median Household Income | $130,148 | $737 |
| Monthly Housing Costs | $750 | $310 |
| Real Estate Taxes | $5,273 | $19 |
Property Value by Mortgage Status in Chesapeake Beach
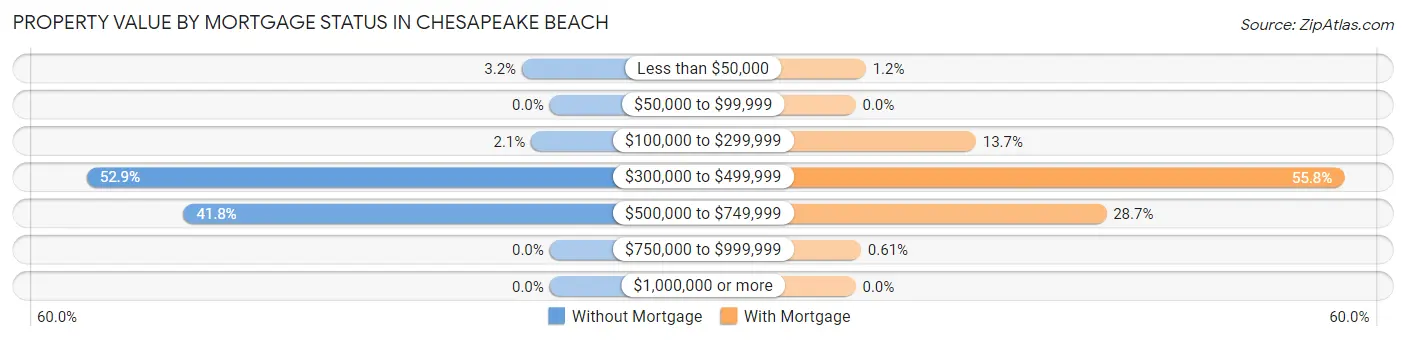
| Property Value | Without Mortgage | With Mortgage |
| Less than $50,000 | 12 (3.2%) | 19 (1.2%) |
| $50,000 to $99,999 | 0 (0.0%) | 0 (0.0%) |
| $100,000 to $299,999 | 8 (2.1%) | 225 (13.7%) |
| $300,000 to $499,999 | 201 (52.9%) | 914 (55.8%) |
| $500,000 to $749,999 | 159 (41.8%) | 469 (28.6%) |
| $750,000 to $999,999 | 0 (0.0%) | 10 (0.6%) |
| $1,000,000 or more | 0 (0.0%) | 0 (0.0%) |
| Total | 380 (100.0%) | 1,637 (100.0%) |
Household Income by Mortgage Status in Chesapeake Beach
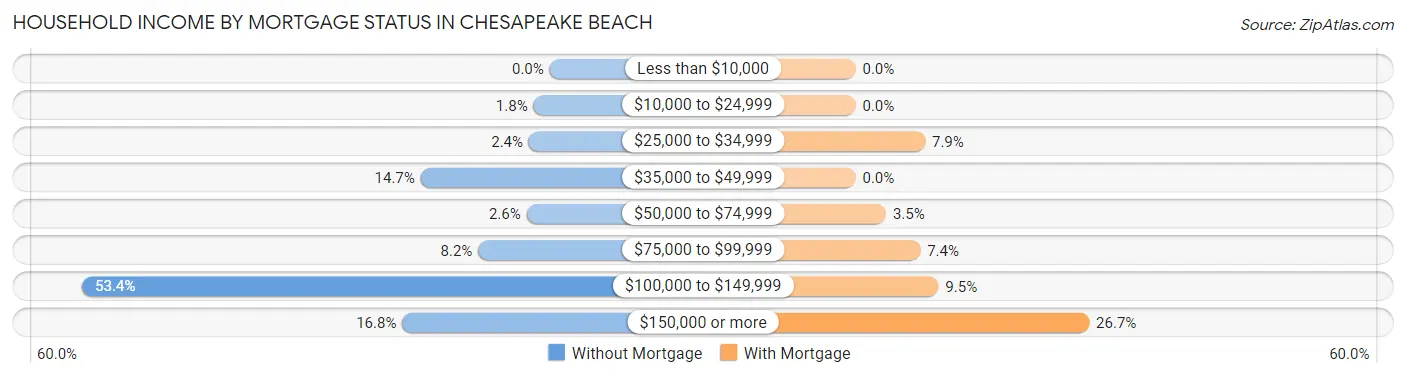
| Household Income | Without Mortgage | With Mortgage |
| Less than $10,000 | 0 (0.0%) | 0 (0.0%) |
| $10,000 to $24,999 | 7 (1.8%) | 0 (0.0%) |
| $25,000 to $34,999 | 9 (2.4%) | 130 (7.9%) |
| $35,000 to $49,999 | 56 (14.7%) | 0 (0.0%) |
| $50,000 to $74,999 | 10 (2.6%) | 57 (3.5%) |
| $75,000 to $99,999 | 31 (8.2%) | 121 (7.4%) |
| $100,000 to $149,999 | 203 (53.4%) | 155 (9.5%) |
| $150,000 or more | 64 (16.8%) | 437 (26.7%) |
| Total | 380 (100.0%) | 1,637 (100.0%) |
Property Value to Household Income Ratio in Chesapeake Beach
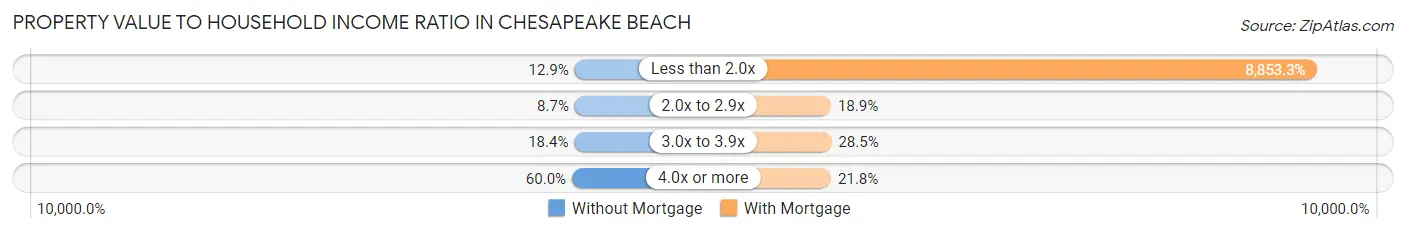
| Value-to-Income Ratio | Without Mortgage | With Mortgage |
| Less than 2.0x | 49 (12.9%) | 144,928 (8,853.3%) |
| 2.0x to 2.9x | 33 (8.7%) | 310 (18.9%) |
| 3.0x to 3.9x | 70 (18.4%) | 466 (28.5%) |
| 4.0x or more | 228 (60.0%) | 356 (21.7%) |
| Total | 380 (100.0%) | 1,637 (100.0%) |
Real Estate Taxes by Mortgage Status in Chesapeake Beach
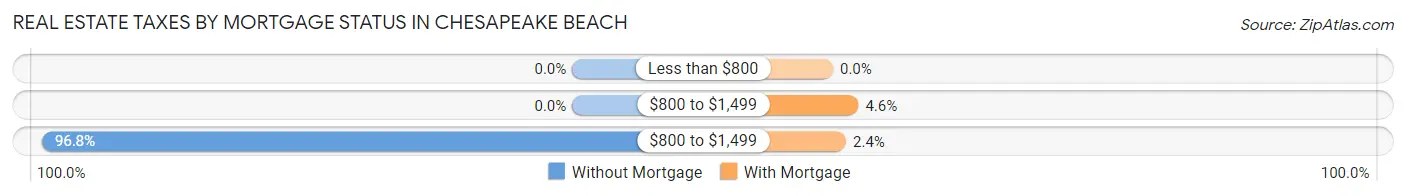
| Property Taxes | Without Mortgage | With Mortgage |
| Less than $800 | 0 (0.0%) | 0 (0.0%) |
| $800 to $1,499 | 0 (0.0%) | 76 (4.6%) |
| $800 to $1,499 | 368 (96.8%) | 39 (2.4%) |
| Total | 380 (100.0%) | 1,637 (100.0%) |
Health & Disability in Chesapeake Beach
Health Insurance Coverage by Age in Chesapeake Beach
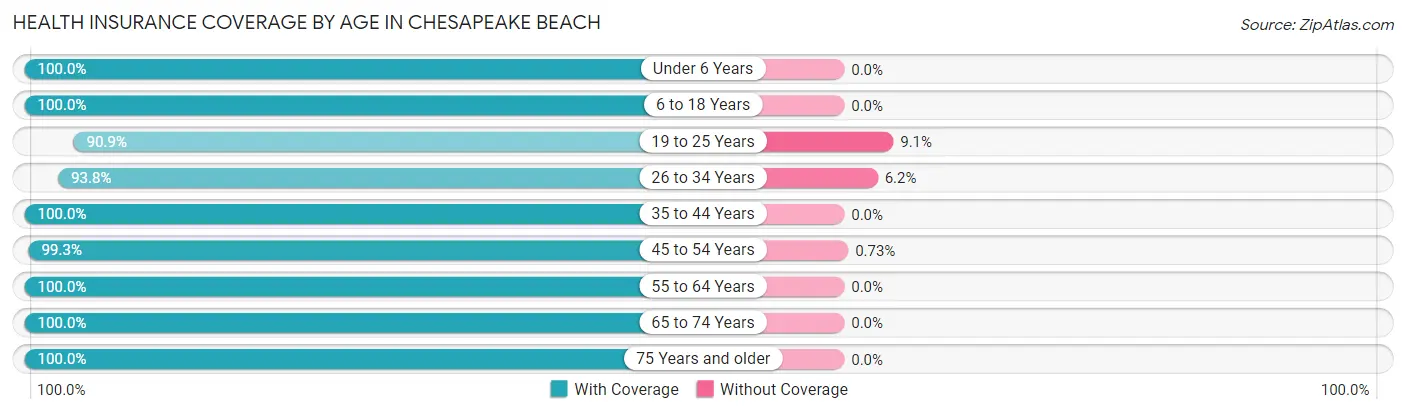
| Age Bracket | With Coverage | Without Coverage |
| Under 6 Years | 347 (100.0%) | 0 (0.0%) |
| 6 to 18 Years | 1,350 (100.0%) | 0 (0.0%) |
| 19 to 25 Years | 308 (90.9%) | 31 (9.1%) |
| 26 to 34 Years | 361 (93.8%) | 24 (6.2%) |
| 35 to 44 Years | 866 (100.0%) | 0 (0.0%) |
| 45 to 54 Years | 1,225 (99.3%) | 9 (0.7%) |
| 55 to 64 Years | 611 (100.0%) | 0 (0.0%) |
| 65 to 74 Years | 662 (100.0%) | 0 (0.0%) |
| 75 Years and older | 384 (100.0%) | 0 (0.0%) |
| Total | 6,114 (99.0%) | 64 (1.0%) |
Health Insurance Coverage by Citizenship Status in Chesapeake Beach
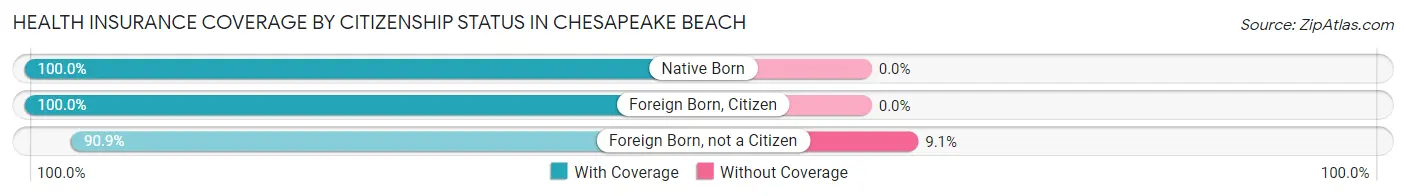
| Citizenship Status | With Coverage | Without Coverage |
| Native Born | 347 (100.0%) | 0 (0.0%) |
| Foreign Born, Citizen | 1,350 (100.0%) | 0 (0.0%) |
| Foreign Born, not a Citizen | 308 (90.9%) | 31 (9.1%) |
Health Insurance Coverage by Household Income in Chesapeake Beach
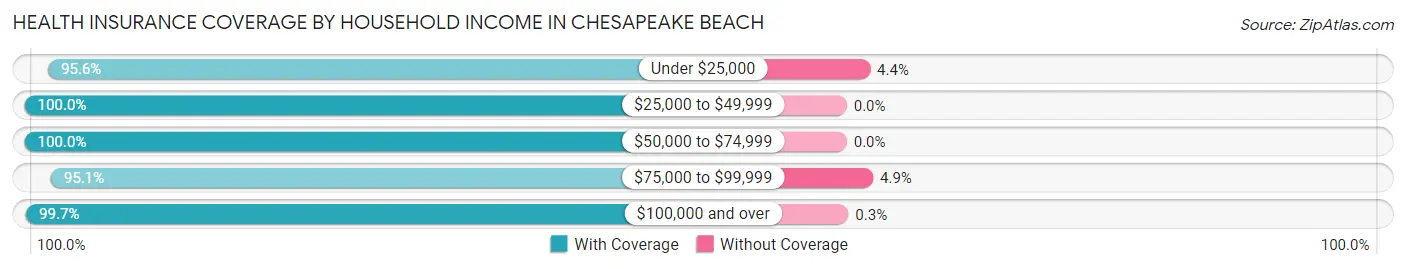
| Household Income | With Coverage | Without Coverage |
| Under $25,000 | 524 (95.6%) | 24 (4.4%) |
| $25,000 to $49,999 | 243 (100.0%) | 0 (0.0%) |
| $50,000 to $74,999 | 205 (100.0%) | 0 (0.0%) |
| $75,000 to $99,999 | 501 (95.1%) | 26 (4.9%) |
| $100,000 and over | 4,641 (99.7%) | 14 (0.3%) |
Public vs Private Health Insurance Coverage by Age in Chesapeake Beach
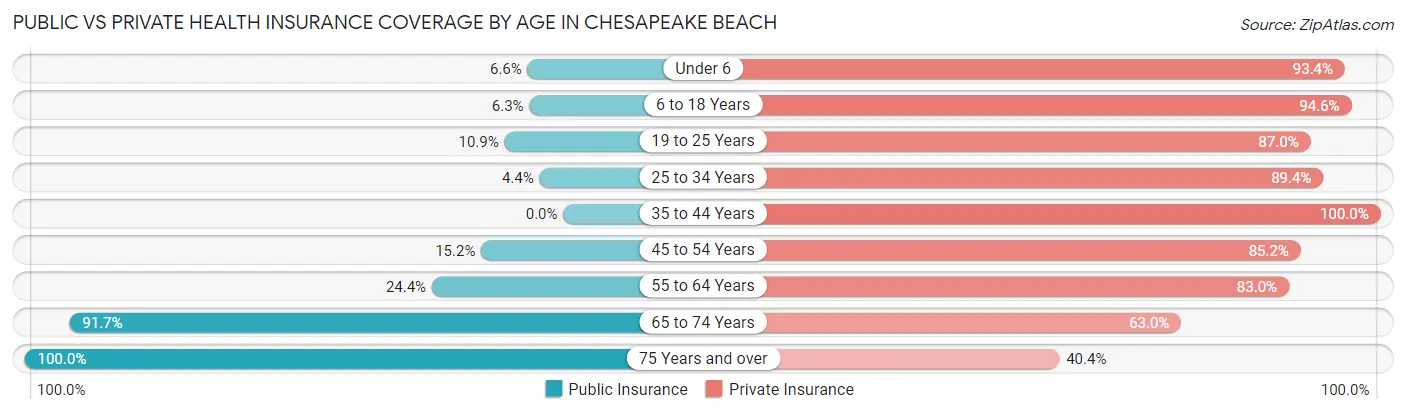
| Age Bracket | Public Insurance | Private Insurance |
| Under 6 | 23 (6.6%) | 324 (93.4%) |
| 6 to 18 Years | 85 (6.3%) | 1,277 (94.6%) |
| 19 to 25 Years | 37 (10.9%) | 295 (87.0%) |
| 25 to 34 Years | 17 (4.4%) | 344 (89.3%) |
| 35 to 44 Years | 0 (0.0%) | 866 (100.0%) |
| 45 to 54 Years | 188 (15.2%) | 1,051 (85.2%) |
| 55 to 64 Years | 149 (24.4%) | 507 (83.0%) |
| 65 to 74 Years | 607 (91.7%) | 417 (63.0%) |
| 75 Years and over | 384 (100.0%) | 155 (40.4%) |
| Total | 1,490 (24.1%) | 5,236 (84.8%) |
Disability Status by Sex by Age in Chesapeake Beach
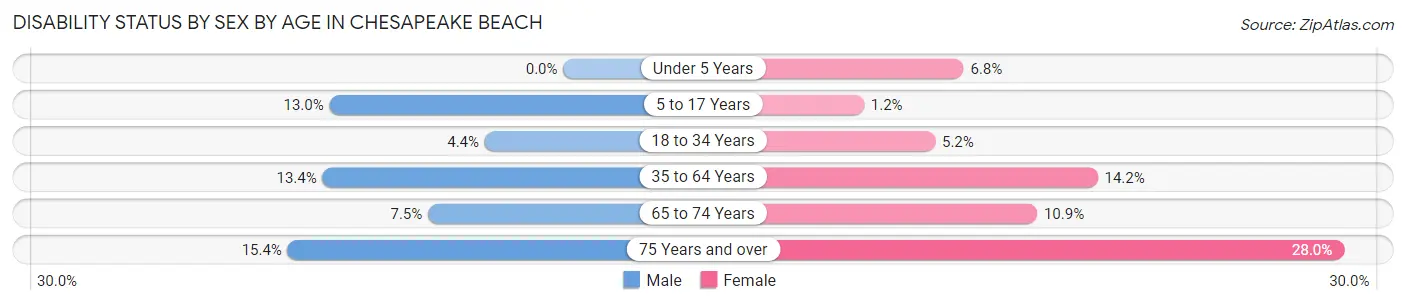
| Age Bracket | Male | Female |
| Under 5 Years | 0 (0.0%) | 4 (6.8%) |
| 5 to 17 Years | 75 (13.0%) | 10 (1.2%) |
| 18 to 34 Years | 15 (4.4%) | 23 (5.2%) |
| 35 to 64 Years | 162 (13.4%) | 214 (14.2%) |
| 65 to 74 Years | 18 (7.5%) | 46 (10.9%) |
| 75 Years and over | 37 (15.3%) | 40 (28.0%) |
Disability Class by Sex by Age in Chesapeake Beach
Disability Class: Hearing Difficulty
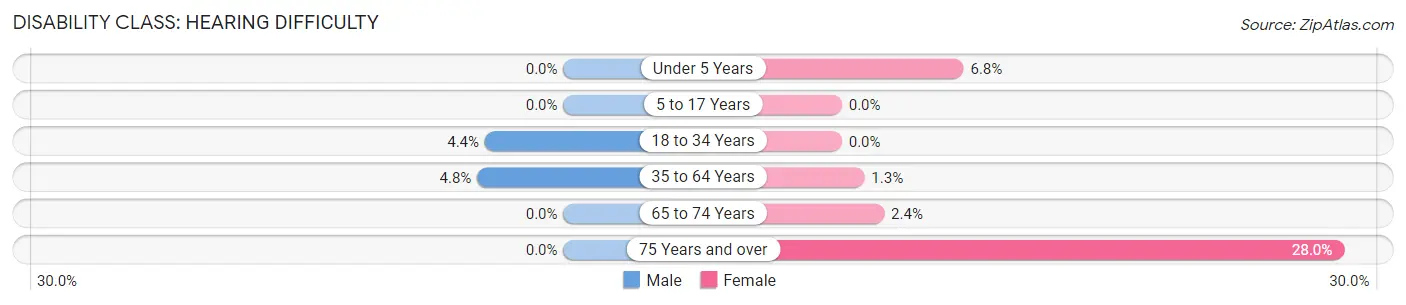
| Age Bracket | Male | Female |
| Under 5 Years | 0 (0.0%) | 4 (6.8%) |
| 5 to 17 Years | 0 (0.0%) | 0 (0.0%) |
| 18 to 34 Years | 15 (4.4%) | 0 (0.0%) |
| 35 to 64 Years | 58 (4.8%) | 19 (1.3%) |
| 65 to 74 Years | 0 (0.0%) | 10 (2.4%) |
| 75 Years and over | 0 (0.0%) | 40 (28.0%) |
Disability Class: Vision Difficulty
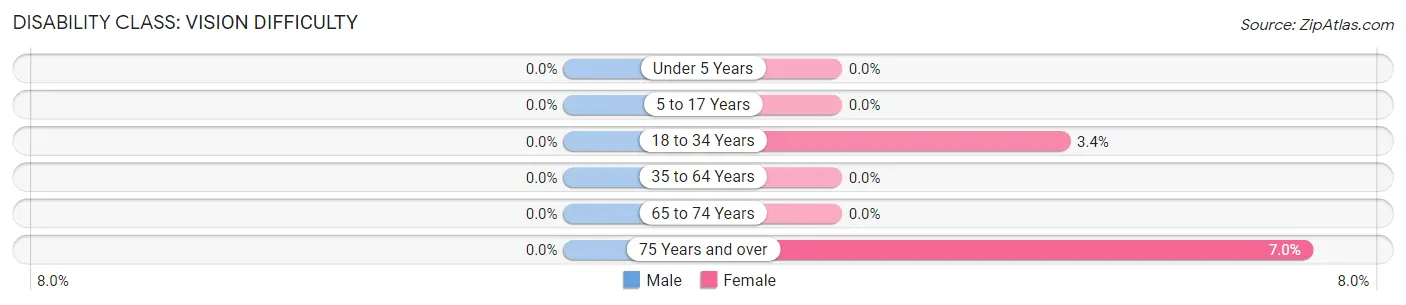
| Age Bracket | Male | Female |
| Under 5 Years | 0 (0.0%) | 0 (0.0%) |
| 5 to 17 Years | 0 (0.0%) | 0 (0.0%) |
| 18 to 34 Years | 0 (0.0%) | 15 (3.4%) |
| 35 to 64 Years | 0 (0.0%) | 0 (0.0%) |
| 65 to 74 Years | 0 (0.0%) | 0 (0.0%) |
| 75 Years and over | 0 (0.0%) | 10 (7.0%) |
Disability Class: Cognitive Difficulty
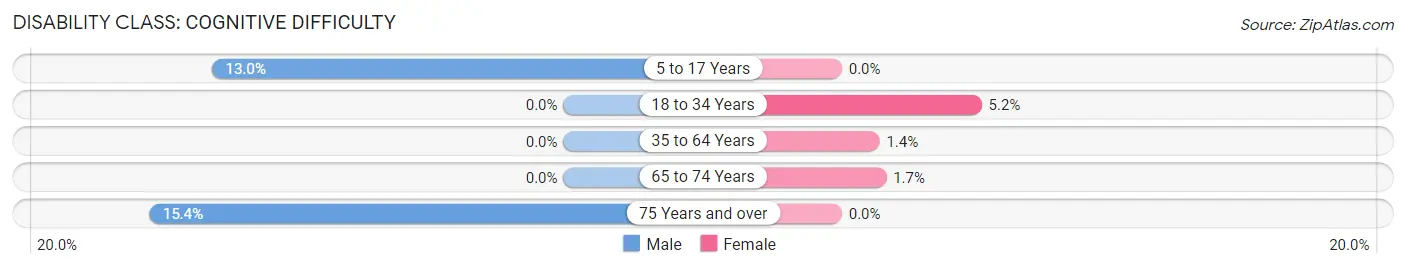
| Age Bracket | Male | Female |
| 5 to 17 Years | 75 (13.0%) | 0 (0.0%) |
| 18 to 34 Years | 0 (0.0%) | 23 (5.2%) |
| 35 to 64 Years | 0 (0.0%) | 21 (1.4%) |
| 65 to 74 Years | 0 (0.0%) | 7 (1.7%) |
| 75 Years and over | 37 (15.3%) | 0 (0.0%) |
Disability Class: Ambulatory Difficulty
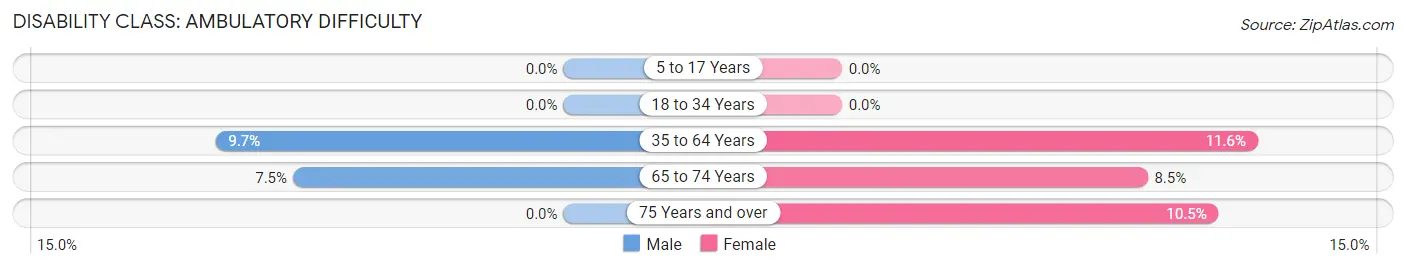
| Age Bracket | Male | Female |
| 5 to 17 Years | 0 (0.0%) | 0 (0.0%) |
| 18 to 34 Years | 0 (0.0%) | 0 (0.0%) |
| 35 to 64 Years | 117 (9.7%) | 174 (11.6%) |
| 65 to 74 Years | 18 (7.5%) | 36 (8.5%) |
| 75 Years and over | 0 (0.0%) | 15 (10.5%) |
Disability Class: Self-Care Difficulty
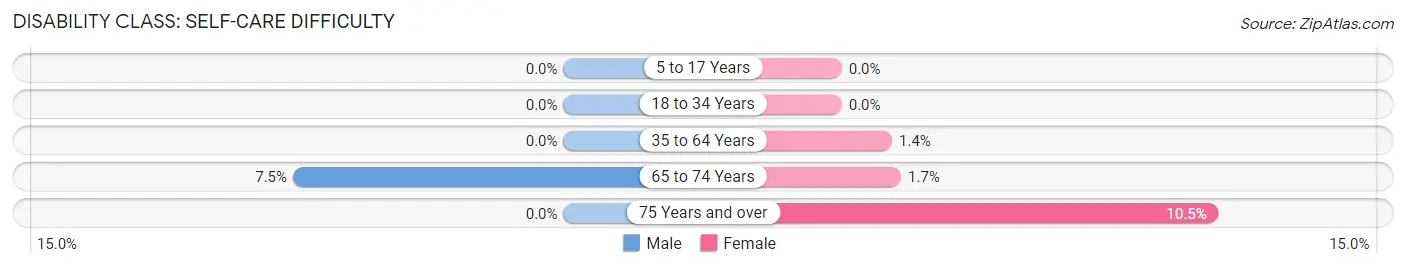
| Age Bracket | Male | Female |
| 5 to 17 Years | 0 (0.0%) | 0 (0.0%) |
| 18 to 34 Years | 0 (0.0%) | 0 (0.0%) |
| 35 to 64 Years | 0 (0.0%) | 21 (1.4%) |
| 65 to 74 Years | 18 (7.5%) | 7 (1.7%) |
| 75 Years and over | 0 (0.0%) | 15 (10.5%) |
Technology Access in Chesapeake Beach
Computing Device Access in Chesapeake Beach
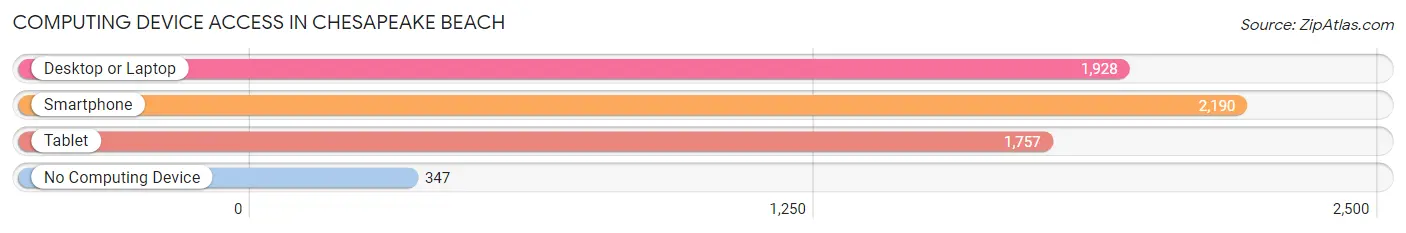
| Device Type | # Households | % Households |
| Desktop or Laptop | 1,928 | 74.7% |
| Smartphone | 2,190 | 84.8% |
| Tablet | 1,757 | 68.0% |
| No Computing Device | 347 | 13.4% |
| Total | 2,582 | 100.0% |
Internet Access in Chesapeake Beach
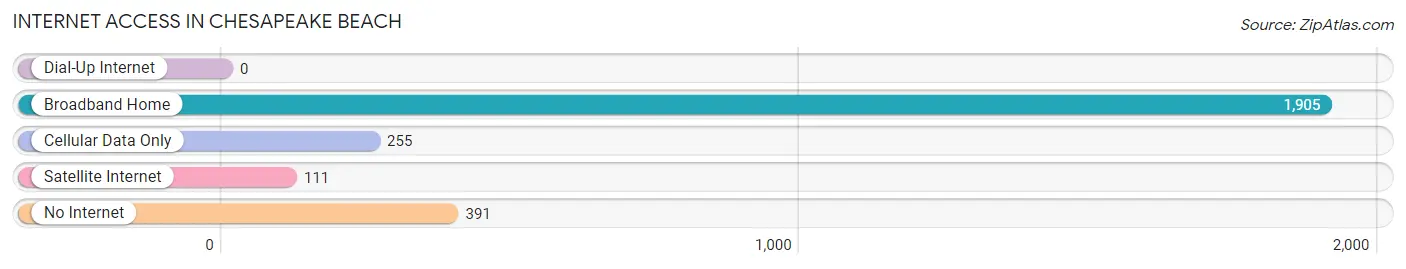
| Internet Type | # Households | % Households |
| Dial-Up Internet | 0 | 0.0% |
| Broadband Home | 1,905 | 73.8% |
| Cellular Data Only | 255 | 9.9% |
| Satellite Internet | 111 | 4.3% |
| No Internet | 391 | 15.1% |
| Total | 2,582 | 100.0% |
Chesapeake Beach Summary
Chesapeake Beach is a town located in Calvert County, Maryland, United States. It is situated on the western shore of the Chesapeake Bay, approximately 25 miles south of Annapolis and 40 miles east of Washington, D.C. The town has a population of approximately 4,000 people and covers an area of 2.2 square miles.
History
Chesapeake Beach was founded in 1894 by the Chesapeake Beach Railway Company. The company was formed to build a resort town on the Chesapeake Bay. The town was designed to be a destination for tourists and vacationers from the Washington, D.C. area. The town was built around a large amusement park, which included a roller coaster, a dance hall, a carousel, and a boardwalk. The town also had a hotel, a casino, and a large pier.
The town flourished in the early 20th century, and by the 1920s it was a popular destination for tourists and vacationers. However, the Great Depression and World War II caused a decline in tourism and the town’s economy. In the 1950s, the amusement park closed and the town’s economy suffered further.
In the late 20th century, the town began to experience a resurgence. The town was revitalized with the construction of a new marina and the development of a new residential community. The town also began to attract new businesses, including restaurants, shops, and a movie theater.
Geography
Chesapeake Beach is located on the western shore of the Chesapeake Bay. The town is bordered by the Patuxent River to the north and the Chesapeake Bay to the east. The town is located approximately 25 miles south of Annapolis and 40 miles east of Washington, D.C.
The town has a total area of 2.2 square miles, of which 0.7 square miles is land and 1.5 square miles is water. The town is located at an elevation of 10 feet above sea level.
Economy
The economy of Chesapeake Beach is largely based on tourism and recreation. The town is home to a number of restaurants, shops, and other businesses catering to tourists and vacationers. The town also has a marina, which provides services to boaters and fishermen.
The town is also home to a number of government and military facilities, including the Naval Air Station Patuxent River and the Chesapeake Beach Railway Museum.
Demographics
As of the 2010 census, the population of Chesapeake Beach was 4,206. The racial makeup of the town was 87.3% White, 8.2% African American, 0.7% Native American, 0.7% Asian, 0.1% Pacific Islander, 1.2% from other races, and 2.0% from two or more races. Hispanic or Latino of any race were 3.2% of the population.
The median household income in the town was $63,958, and the median family income was $76,944. The per capita income in the town was $30,945. About 8.2% of the population was below the poverty line.
Common Questions
What is Per Capita Income in Chesapeake Beach?
Per Capita income in Chesapeake Beach is $58,774.
What is the Median Family Income in Chesapeake Beach?
Median Family Income in Chesapeake Beach is $149,529.
What is the Median Household income in Chesapeake Beach?
Median Household Income in Chesapeake Beach is $130,175.
What is Income or Wage Gap in Chesapeake Beach?
Income or Wage Gap in Chesapeake Beach is 26.9%.
Women in Chesapeake Beach earn 73.1 cents for every dollar earned by a man.
What is Inequality or Gini Index in Chesapeake Beach?
Inequality or Gini Index in Chesapeake Beach is 0.39.
What is the Total Population of Chesapeake Beach?
Total Population of Chesapeake Beach is 6,358.
What is the Total Male Population of Chesapeake Beach?
Total Male Population of Chesapeake Beach is 2,904.
What is the Total Female Population of Chesapeake Beach?
Total Female Population of Chesapeake Beach is 3,454.
What is the Ratio of Males per 100 Females in Chesapeake Beach?
There are 84.08 Males per 100 Females in Chesapeake Beach.
What is the Ratio of Females per 100 Males in Chesapeake Beach?
There are 118.94 Females per 100 Males in Chesapeake Beach.
What is the Median Population Age in Chesapeake Beach?
Median Population Age in Chesapeake Beach is 42.5 Years.
What is the Average Family Size in Chesapeake Beach
Average Family Size in Chesapeake Beach is 3.2 People.
What is the Average Household Size in Chesapeake Beach
Average Household Size in Chesapeake Beach is 2.5 People.
How Large is the Labor Force in Chesapeake Beach?
There are 3,367 People in the Labor Forcein in Chesapeake Beach.
What is the Percentage of People in the Labor Force in Chesapeake Beach?
68.4% of People are in the Labor Force in Chesapeake Beach.
What is the Unemployment Rate in Chesapeake Beach?
Unemployment Rate in Chesapeake Beach is 1.2%.