Seneca Gardens, KY Map & Demographics
Seneca Gardens Map
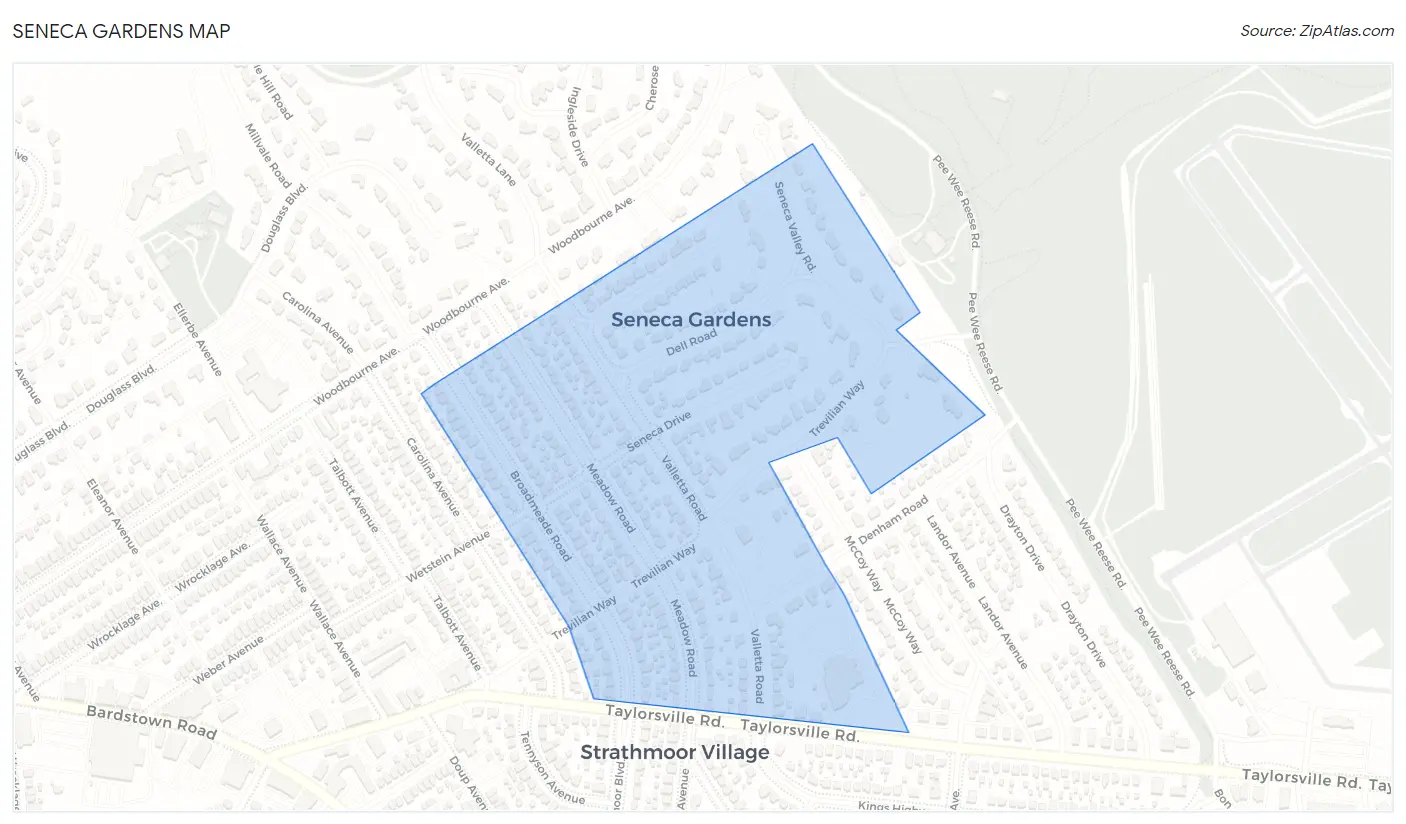
Seneca Gardens Overview
$75,578
PER CAPITA INCOME
$136,875
AVG FAMILY INCOME
$118,929
AVG HOUSEHOLD INCOME
5.5%
WAGE / INCOME GAP [ % ]
94.5¢/ $1
WAGE / INCOME GAP [ $ ]
0.44
INEQUALITY / GINI INDEX
570
TOTAL POPULATION
288
MALE POPULATION
282
FEMALE POPULATION
102.13
MALES / 100 FEMALES
97.92
FEMALES / 100 MALES
49.2
MEDIAN AGE
2.8
AVG FAMILY SIZE
2.4
AVG HOUSEHOLD SIZE
288
LABOR FORCE [ PEOPLE ]
60.8%
PERCENT IN LABOR FORCE
0.3%
UNEMPLOYMENT RATE
Seneca Gardens Area Codes
Income in Seneca Gardens
Income Overview in Seneca Gardens
Per Capita Income in Seneca Gardens is $75,578, while median incomes of families and households are $136,875 and $118,929 respectively.
| Characteristic | Number | Measure |
| Per Capita Income | 570 | $75,578 |
| Median Family Income | 173 | $136,875 |
| Mean Family Income | 173 | $177,086 |
| Median Household Income | 238 | $118,929 |
| Mean Household Income | 238 | $172,767 |
| Income Deficit | 173 | $0 |
| Wage / Income Gap (%) | 570 | 5.47% |
| Wage / Income Gap ($) | 570 | 94.53¢ per $1 |
| Gini / Inequality Index | 570 | 0.44 |
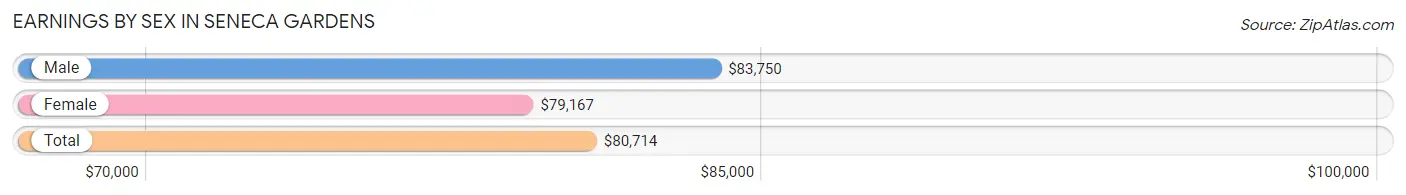
Earnings by Sex in Seneca Gardens
Average Earnings in Seneca Gardens are $80,714, $83,750 for men and $79,167 for women, a difference of 5.5%.
| Sex | Number | Average Earnings |
| Male | 162 (52.6%) | $83,750 |
| Female | 146 (47.4%) | $79,167 |
| Total | 308 (100.0%) | $80,714 |
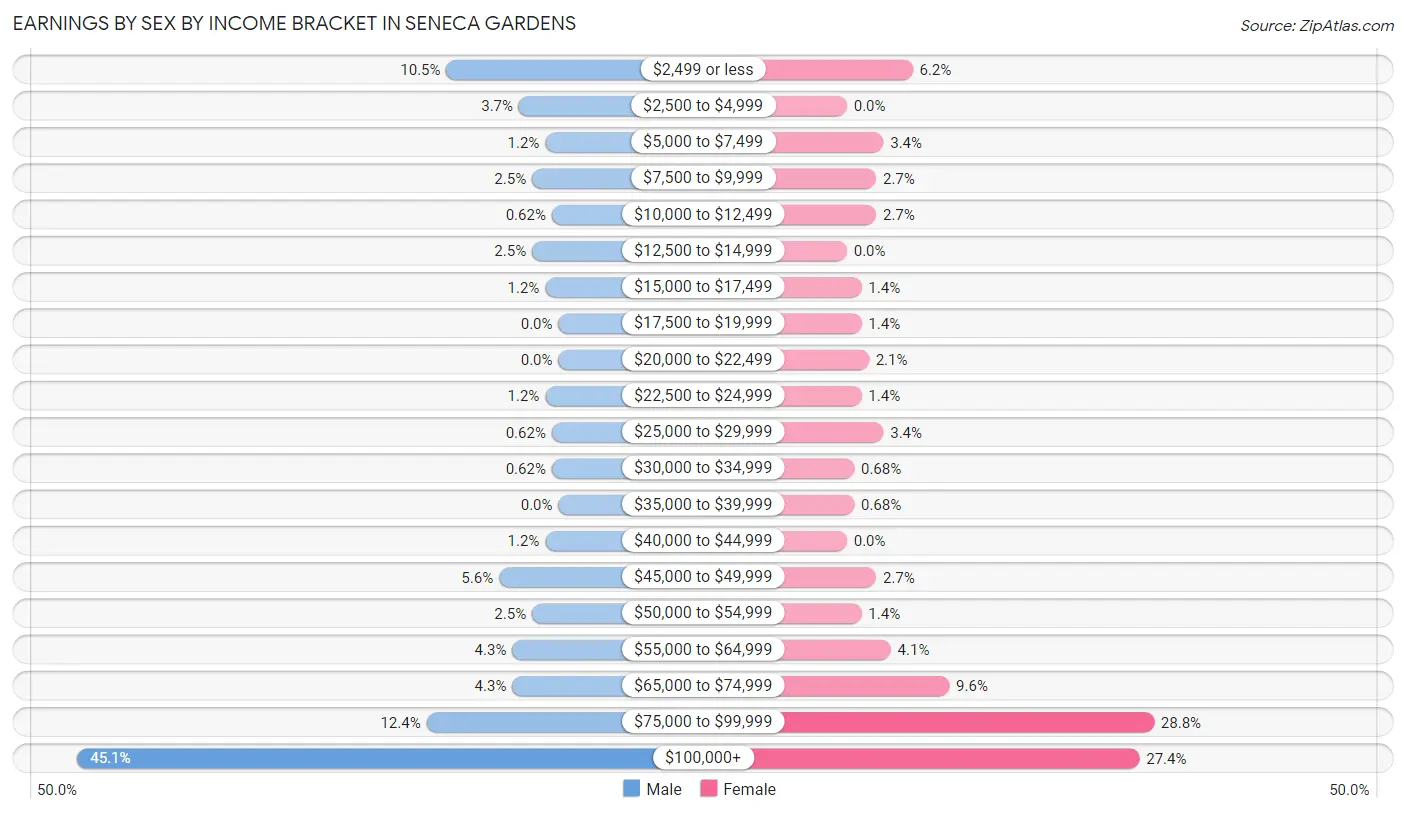
Earnings by Sex by Income Bracket in Seneca Gardens
The most common earnings brackets in Seneca Gardens are $100,000+ for men (73 | 45.1%) and $75,000 to $99,999 for women (42 | 28.8%).
| Income | Male | Female |
| $2,499 or less | 17 (10.5%) | 9 (6.2%) |
| $2,500 to $4,999 | 6 (3.7%) | 0 (0.0%) |
| $5,000 to $7,499 | 2 (1.2%) | 5 (3.4%) |
| $7,500 to $9,999 | 4 (2.5%) | 4 (2.7%) |
| $10,000 to $12,499 | 1 (0.6%) | 4 (2.7%) |
| $12,500 to $14,999 | 4 (2.5%) | 0 (0.0%) |
| $15,000 to $17,499 | 2 (1.2%) | 2 (1.4%) |
| $17,500 to $19,999 | 0 (0.0%) | 2 (1.4%) |
| $20,000 to $22,499 | 0 (0.0%) | 3 (2.1%) |
| $22,500 to $24,999 | 2 (1.2%) | 2 (1.4%) |
| $25,000 to $29,999 | 1 (0.6%) | 5 (3.4%) |
| $30,000 to $34,999 | 1 (0.6%) | 1 (0.7%) |
| $35,000 to $39,999 | 0 (0.0%) | 1 (0.7%) |
| $40,000 to $44,999 | 2 (1.2%) | 0 (0.0%) |
| $45,000 to $49,999 | 9 (5.6%) | 4 (2.7%) |
| $50,000 to $54,999 | 4 (2.5%) | 2 (1.4%) |
| $55,000 to $64,999 | 7 (4.3%) | 6 (4.1%) |
| $65,000 to $74,999 | 7 (4.3%) | 14 (9.6%) |
| $75,000 to $99,999 | 20 (12.3%) | 42 (28.8%) |
| $100,000+ | 73 (45.1%) | 40 (27.4%) |
| Total | 162 (100.0%) | 146 (100.0%) |
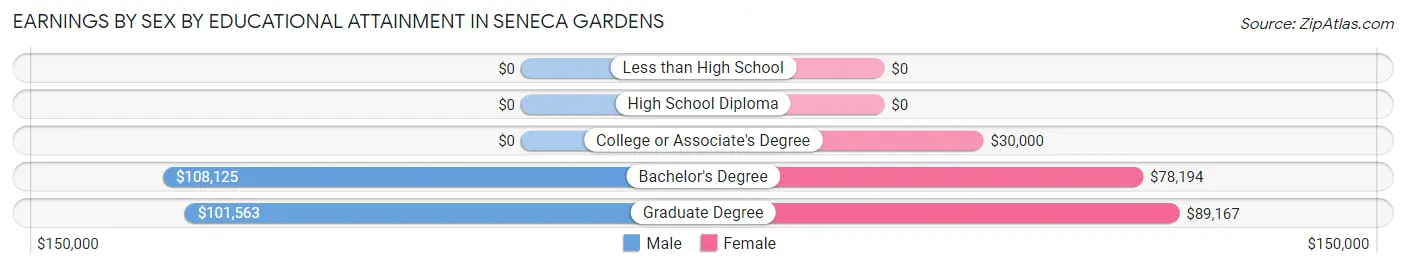
Earnings by Sex by Educational Attainment in Seneca Gardens
Average earnings in Seneca Gardens are $101,875 for men and $79,306 for women, a difference of 22.2%. Men with an educational attainment of bachelor's degree enjoy the highest average annual earnings of $108,125, while those with graduate degree education earn the least with $101,563. Women with an educational attainment of graduate degree earn the most with the average annual earnings of $89,167, while those with college or associate's degree education have the smallest earnings of $30,000.
| Educational Attainment | Male Income | Female Income |
| Less than High School | - | - |
| High School Diploma | - | - |
| College or Associate's Degree | - | - |
| Bachelor's Degree | $108,125 | $78,194 |
| Graduate Degree | $101,563 | $89,167 |
| Total | $101,875 | $79,306 |
Family Income in Seneca Gardens
Family Income Brackets in Seneca Gardens
According to the Seneca Gardens family income data, there are 62 families falling into the $200,000+ income range, which is the most common income bracket and makes up 35.8% of all families.
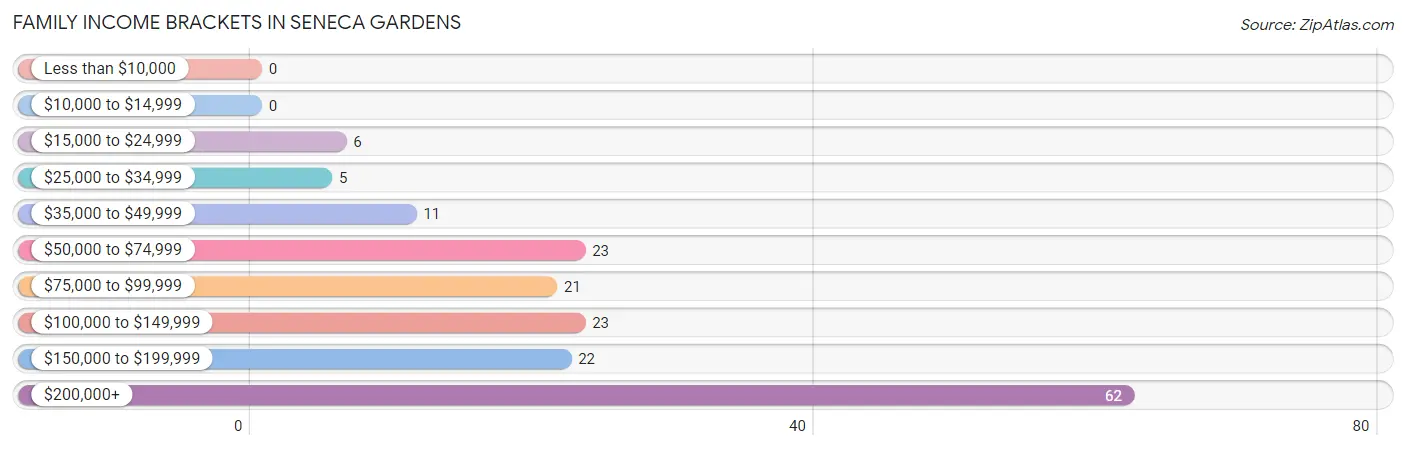
| Income Bracket | # Families | % Families |
| Less than $10,000 | 0 | 0.0% |
| $10,000 to $14,999 | 0 | 0.0% |
| $15,000 to $24,999 | 6 | 3.5% |
| $25,000 to $34,999 | 5 | 2.9% |
| $35,000 to $49,999 | 11 | 6.4% |
| $50,000 to $74,999 | 23 | 13.3% |
| $75,000 to $99,999 | 21 | 12.1% |
| $100,000 to $149,999 | 23 | 13.3% |
| $150,000 to $199,999 | 22 | 12.7% |
| $200,000+ | 62 | 35.8% |
Family Income by Famaliy Size in Seneca Gardens
3-person families (12 | 6.9%) account for the highest median family income in Seneca Gardens with $218,750 per family, while 3-person families (12 | 6.9%) have the highest median income of $72,917 per family member.
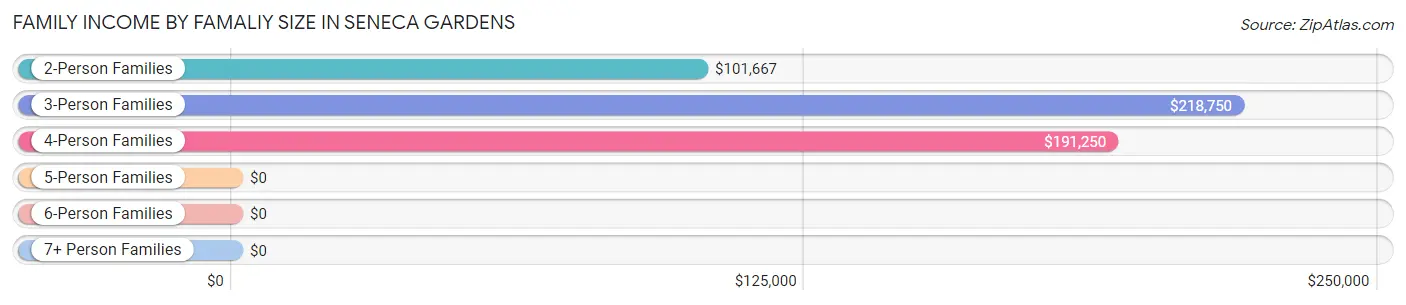
| Income Bracket | # Families | Median Income |
| 2-Person Families | 114 (65.9%) | $101,667 |
| 3-Person Families | 12 (6.9%) | $218,750 |
| 4-Person Families | 28 (16.2%) | $191,250 |
| 5-Person Families | 19 (11.0%) | $0 |
| 6-Person Families | 0 (0.0%) | $0 |
| 7+ Person Families | 0 (0.0%) | $0 |
| Total | 173 (100.0%) | $136,875 |
Family Income by Number of Earners in Seneca Gardens
The median family income in Seneca Gardens is $136,875, with families comprising 3+ earners (18) having the highest median family income of $202,500, while families with no earners (30) have the lowest median family income of $62,500, accounting for 10.4% and 17.3% of families, respectively.
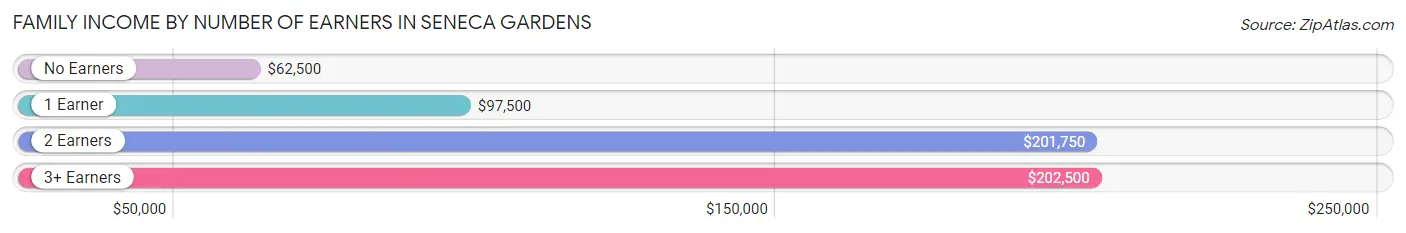
| Number of Earners | # Families | Median Income |
| No Earners | 30 (17.3%) | $62,500 |
| 1 Earner | 58 (33.5%) | $97,500 |
| 2 Earners | 67 (38.7%) | $201,750 |
| 3+ Earners | 18 (10.4%) | $202,500 |
| Total | 173 (100.0%) | $136,875 |
Household Income in Seneca Gardens
Household Income Brackets in Seneca Gardens
With 73 households falling in the category, the $200,000+ income range is the most frequent in Seneca Gardens, accounting for 30.7% of all households.
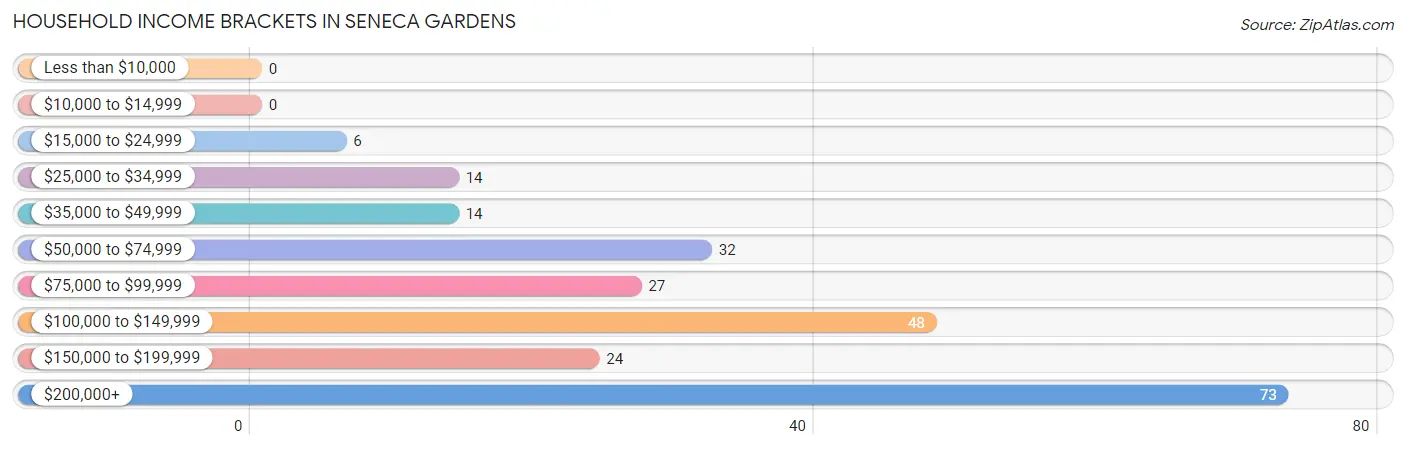
| Income Bracket | # Households | % Households |
| Less than $10,000 | 0 | 0.0% |
| $10,000 to $14,999 | 0 | 0.0% |
| $15,000 to $24,999 | 6 | 2.5% |
| $25,000 to $34,999 | 14 | 5.9% |
| $35,000 to $49,999 | 14 | 5.9% |
| $50,000 to $74,999 | 32 | 13.4% |
| $75,000 to $99,999 | 27 | 11.3% |
| $100,000 to $149,999 | 48 | 20.2% |
| $150,000 to $199,999 | 24 | 10.1% |
| $200,000+ | 73 | 30.7% |
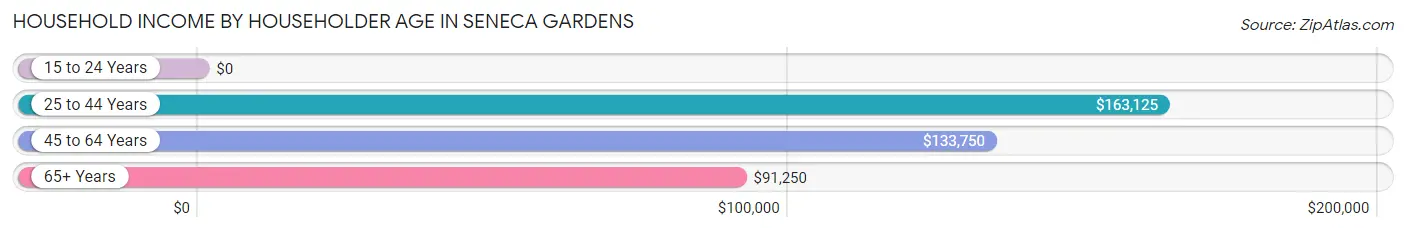
Household Income by Householder Age in Seneca Gardens
The median household income in Seneca Gardens is $118,929, with the highest median household income of $163,125 found in the 25 to 44 years age bracket for the primary householder. A total of 53 households (22.3%) fall into this category.
| Income Bracket | # Households | Median Income |
| 15 to 24 Years | 0 (0.0%) | $0 |
| 25 to 44 Years | 53 (22.3%) | $163,125 |
| 45 to 64 Years | 94 (39.5%) | $133,750 |
| 65+ Years | 91 (38.2%) | $91,250 |
| Total | 238 (100.0%) | $118,929 |
Poverty in Seneca Gardens
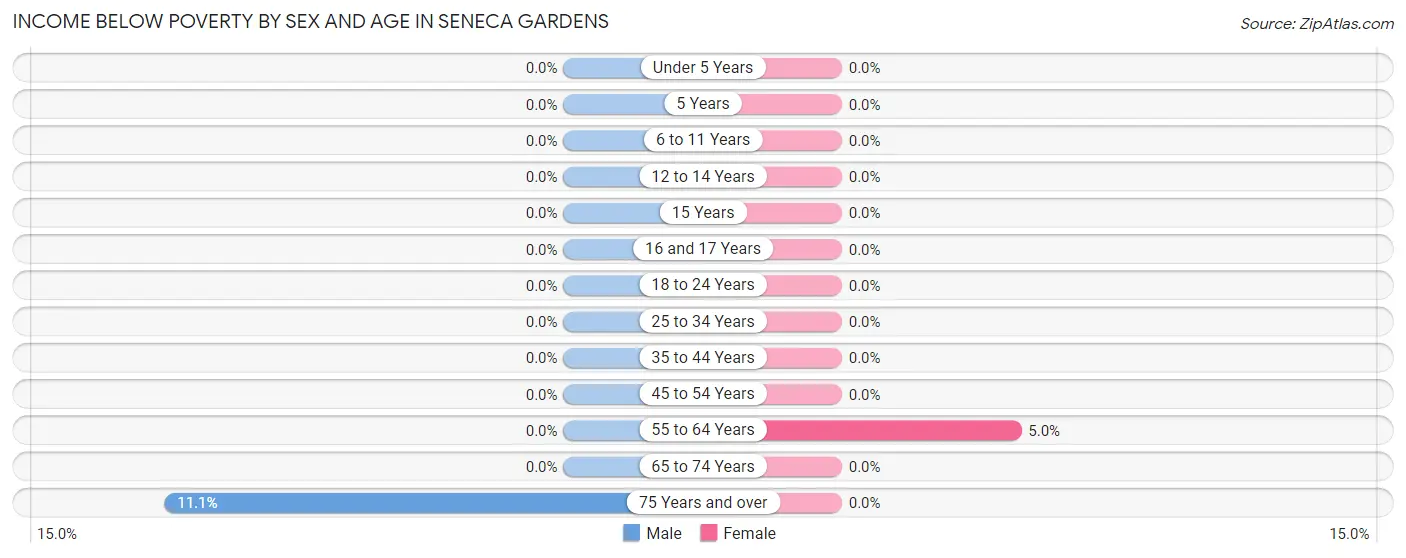
Income Below Poverty by Sex and Age in Seneca Gardens
With 0.7% poverty level for males and 0.7% for females among the residents of Seneca Gardens, 75 year old and over males and 55 to 64 year old females are the most vulnerable to poverty, with 2 males (11.1%) and 2 females (5.0%) in their respective age groups living below the poverty level.
| Age Bracket | Male | Female |
| Under 5 Years | 0 (0.0%) | 0 (0.0%) |
| 5 Years | 0 (0.0%) | 0 (0.0%) |
| 6 to 11 Years | 0 (0.0%) | 0 (0.0%) |
| 12 to 14 Years | 0 (0.0%) | 0 (0.0%) |
| 15 Years | 0 (0.0%) | 0 (0.0%) |
| 16 and 17 Years | 0 (0.0%) | 0 (0.0%) |
| 18 to 24 Years | 0 (0.0%) | 0 (0.0%) |
| 25 to 34 Years | 0 (0.0%) | 0 (0.0%) |
| 35 to 44 Years | 0 (0.0%) | 0 (0.0%) |
| 45 to 54 Years | 0 (0.0%) | 0 (0.0%) |
| 55 to 64 Years | 0 (0.0%) | 2 (5.0%) |
| 65 to 74 Years | 0 (0.0%) | 0 (0.0%) |
| 75 Years and over | 2 (11.1%) | 0 (0.0%) |
| Total | 2 (0.7%) | 2 (0.7%) |
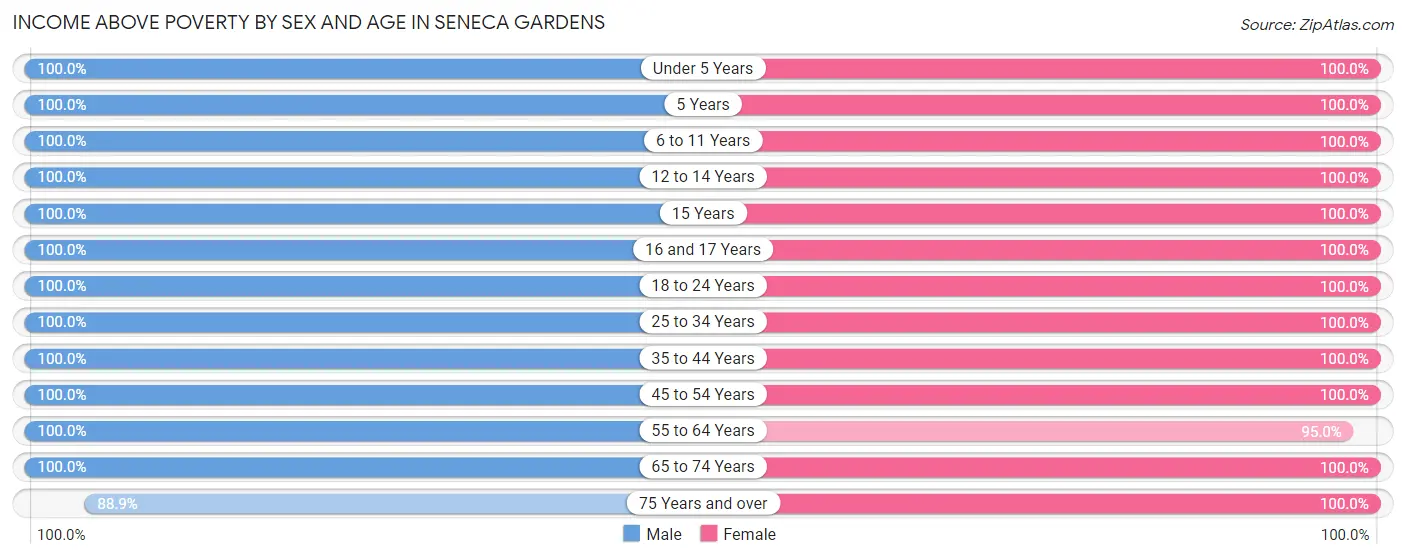
Income Above Poverty by Sex and Age in Seneca Gardens
According to the poverty statistics in Seneca Gardens, males aged under 5 years and females aged under 5 years are the age groups that are most secure financially, with 100.0% of males and 100.0% of females in these age groups living above the poverty line.
| Age Bracket | Male | Female |
| Under 5 Years | 13 (100.0%) | 14 (100.0%) |
| 5 Years | 3 (100.0%) | 3 (100.0%) |
| 6 to 11 Years | 27 (100.0%) | 16 (100.0%) |
| 12 to 14 Years | 8 (100.0%) | 7 (100.0%) |
| 15 Years | 3 (100.0%) | 2 (100.0%) |
| 16 and 17 Years | 26 (100.0%) | 5 (100.0%) |
| 18 to 24 Years | 14 (100.0%) | 6 (100.0%) |
| 25 to 34 Years | 17 (100.0%) | 20 (100.0%) |
| 35 to 44 Years | 44 (100.0%) | 27 (100.0%) |
| 45 to 54 Years | 31 (100.0%) | 56 (100.0%) |
| 55 to 64 Years | 35 (100.0%) | 38 (95.0%) |
| 65 to 74 Years | 49 (100.0%) | 62 (100.0%) |
| 75 Years and over | 16 (88.9%) | 24 (100.0%) |
| Total | 286 (99.3%) | 280 (99.3%) |
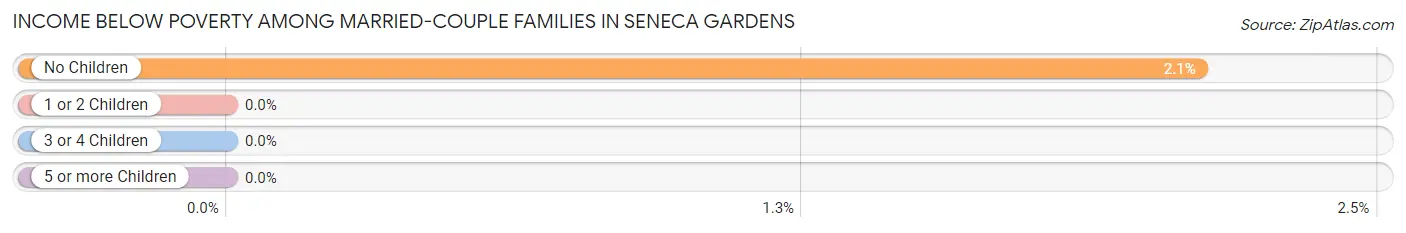
Income Below Poverty Among Married-Couple Families in Seneca Gardens
The poverty statistics for married-couple families in Seneca Gardens show that 1.4% or 2 of the total 146 families live below the poverty line. Families with no children have the highest poverty rate of 2.1%, comprising of 2 families. On the other hand, families with 1 or 2 children have the lowest poverty rate of 0.0%, which includes 0 families.
| Children | Above Poverty | Below Poverty |
| No Children | 93 (97.9%) | 2 (2.1%) |
| 1 or 2 Children | 44 (100.0%) | 0 (0.0%) |
| 3 or 4 Children | 7 (100.0%) | 0 (0.0%) |
| 5 or more Children | 0 (0.0%) | 0 (0.0%) |
| Total | 144 (98.6%) | 2 (1.4%) |
Income Below Poverty Among Single-Parent Households in Seneca Gardens
| Children | Single Father | Single Mother |
| No Children | 0 (0.0%) | 0 (0.0%) |
| 1 or 2 Children | 0 (0.0%) | 0 (0.0%) |
| 3 or 4 Children | 0 (0.0%) | 0 (0.0%) |
| 5 or more Children | 0 (0.0%) | 0 (0.0%) |
| Total | 0 (0.0%) | 0 (0.0%) |
Income Below Poverty Among Married-Couple vs Single-Parent Households in Seneca Gardens
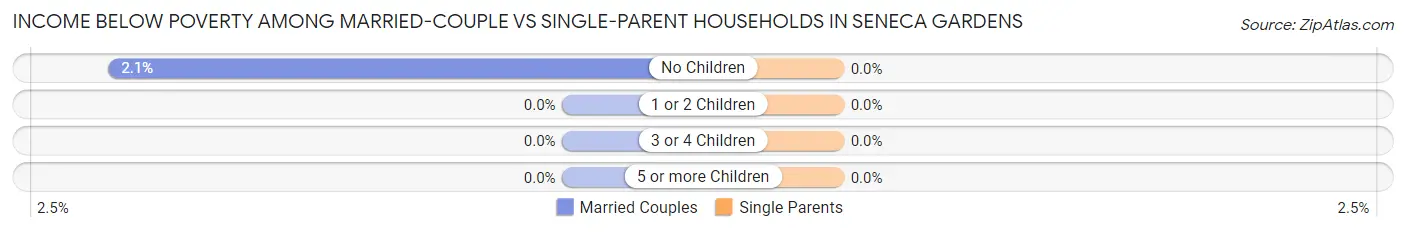
| Children | Married-Couple Families | Single-Parent Households |
| No Children | 2 (2.1%) | 0 (0.0%) |
| 1 or 2 Children | 0 (0.0%) | 0 (0.0%) |
| 3 or 4 Children | 0 (0.0%) | 0 (0.0%) |
| 5 or more Children | 0 (0.0%) | 0 (0.0%) |
| Total | 2 (1.4%) | 0 (0.0%) |
Race in Seneca Gardens
The most populous races in Seneca Gardens are White / Caucasian (528 | 92.6%), Two or more Races (25 | 4.4%), and Hispanic or Latino (24 | 4.2%).
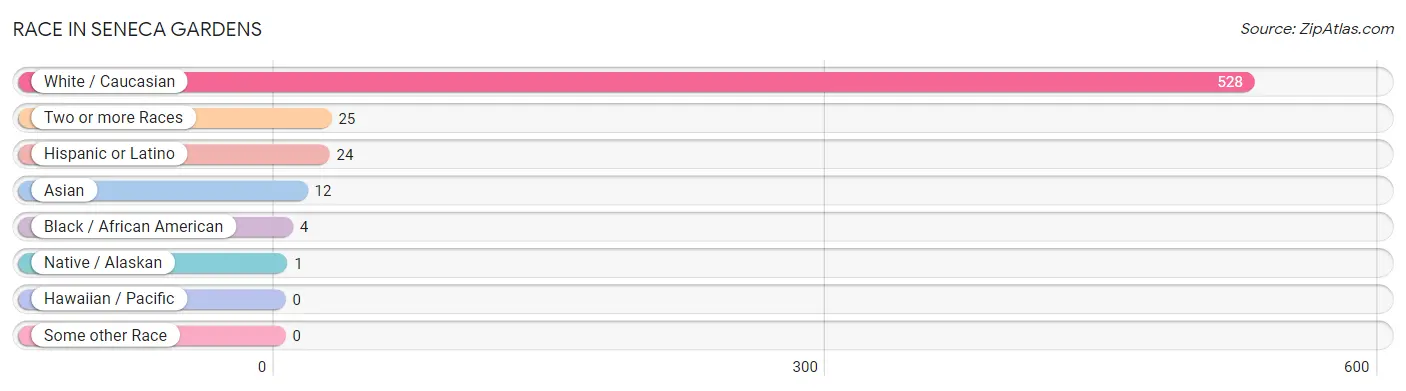
| Race | # Population | % Population |
| Asian | 12 | 2.1% |
| Black / African American | 4 | 0.7% |
| Hawaiian / Pacific | 0 | 0.0% |
| Hispanic or Latino | 24 | 4.2% |
| Native / Alaskan | 1 | 0.2% |
| White / Caucasian | 528 | 92.6% |
| Two or more Races | 25 | 4.4% |
| Some other Race | 0 | 0.0% |
| Total | 570 | 100.0% |
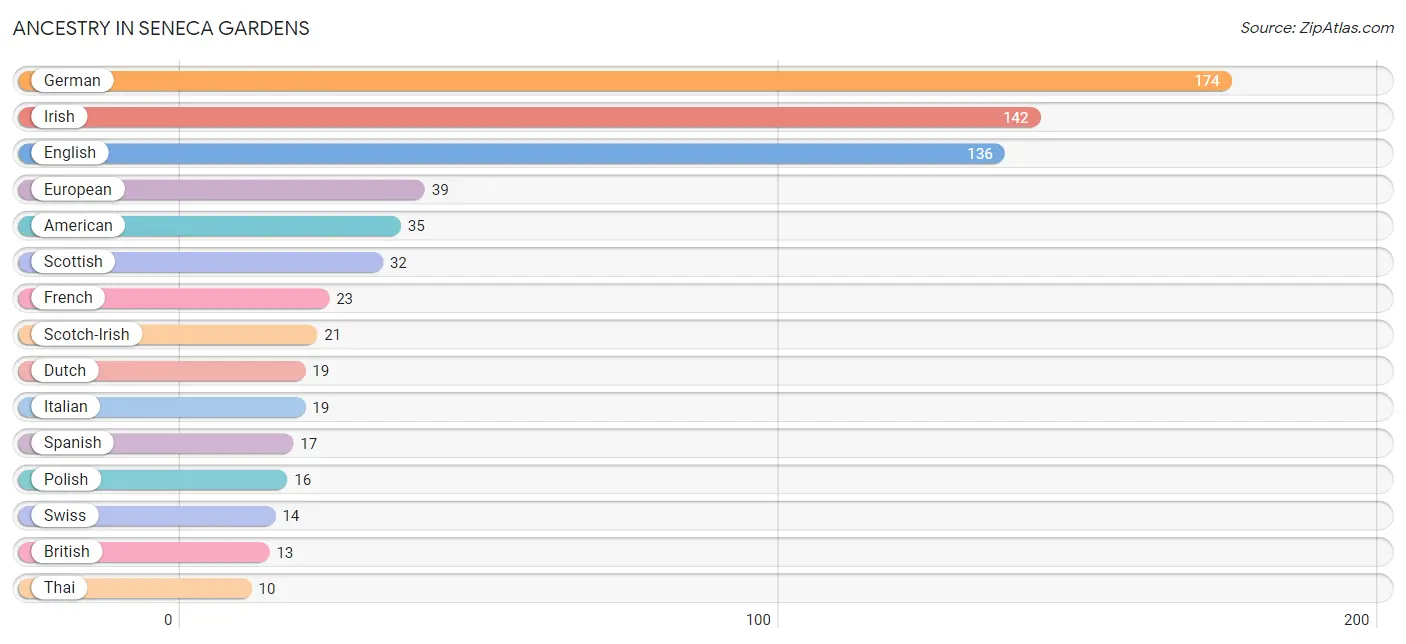
Ancestry in Seneca Gardens
The most populous ancestries reported in Seneca Gardens are German (174 | 30.5%), Irish (142 | 24.9%), English (136 | 23.9%), European (39 | 6.8%), and American (35 | 6.1%), together accounting for 92.3% of all Seneca Gardens residents.
| Ancestry | # Population | % Population |
| American | 35 | 6.1% |
| Austrian | 1 | 0.2% |
| British | 13 | 2.3% |
| Canadian | 2 | 0.4% |
| Cherokee | 2 | 0.4% |
| Colombian | 6 | 1.1% |
| Czech | 2 | 0.4% |
| Dutch | 19 | 3.3% |
| Eastern European | 5 | 0.9% |
| English | 136 | 23.9% |
| European | 39 | 6.8% |
| French | 23 | 4.0% |
| German | 174 | 30.5% |
| Hungarian | 1 | 0.2% |
| Irish | 142 | 24.9% |
| Italian | 19 | 3.3% |
| Mexican | 1 | 0.2% |
| Mexican American Indian | 1 | 0.2% |
| Northern European | 2 | 0.4% |
| Polish | 16 | 2.8% |
| Russian | 4 | 0.7% |
| Scandinavian | 2 | 0.4% |
| Scotch-Irish | 21 | 3.7% |
| Scottish | 32 | 5.6% |
| Slovene | 2 | 0.4% |
| South American | 6 | 1.1% |
| Spanish | 17 | 3.0% |
| Sri Lankan | 2 | 0.4% |
| Swedish | 5 | 0.9% |
| Swiss | 14 | 2.5% |
| Thai | 10 | 1.8% |
| Ukrainian | 1 | 0.2% |
| Welsh | 10 | 1.8% | View All 33 Rows |
Immigrants in Seneca Gardens
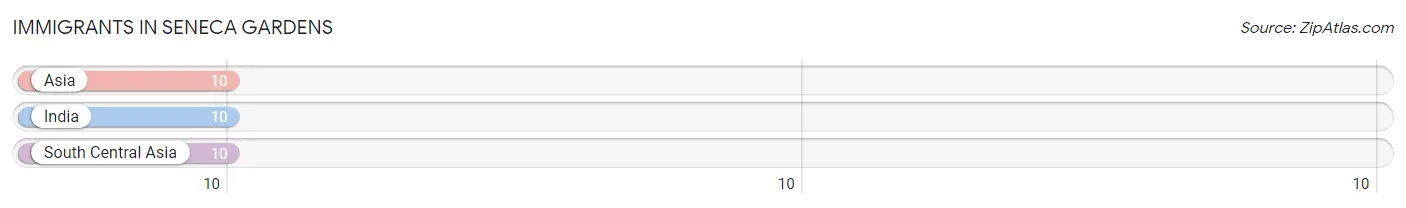
The most numerous immigrant groups reported in Seneca Gardens came from Asia (10 | 1.8%), India (10 | 1.8%), and South Central Asia (10 | 1.8%), together accounting for 5.3% of all Seneca Gardens residents.
| Immigration Origin | # Population | % Population |
| Asia | 10 | 1.8% |
| India | 10 | 1.8% |
| South Central Asia | 10 | 1.8% | View All 3 Rows |
Sex and Age in Seneca Gardens
Sex and Age in Seneca Gardens
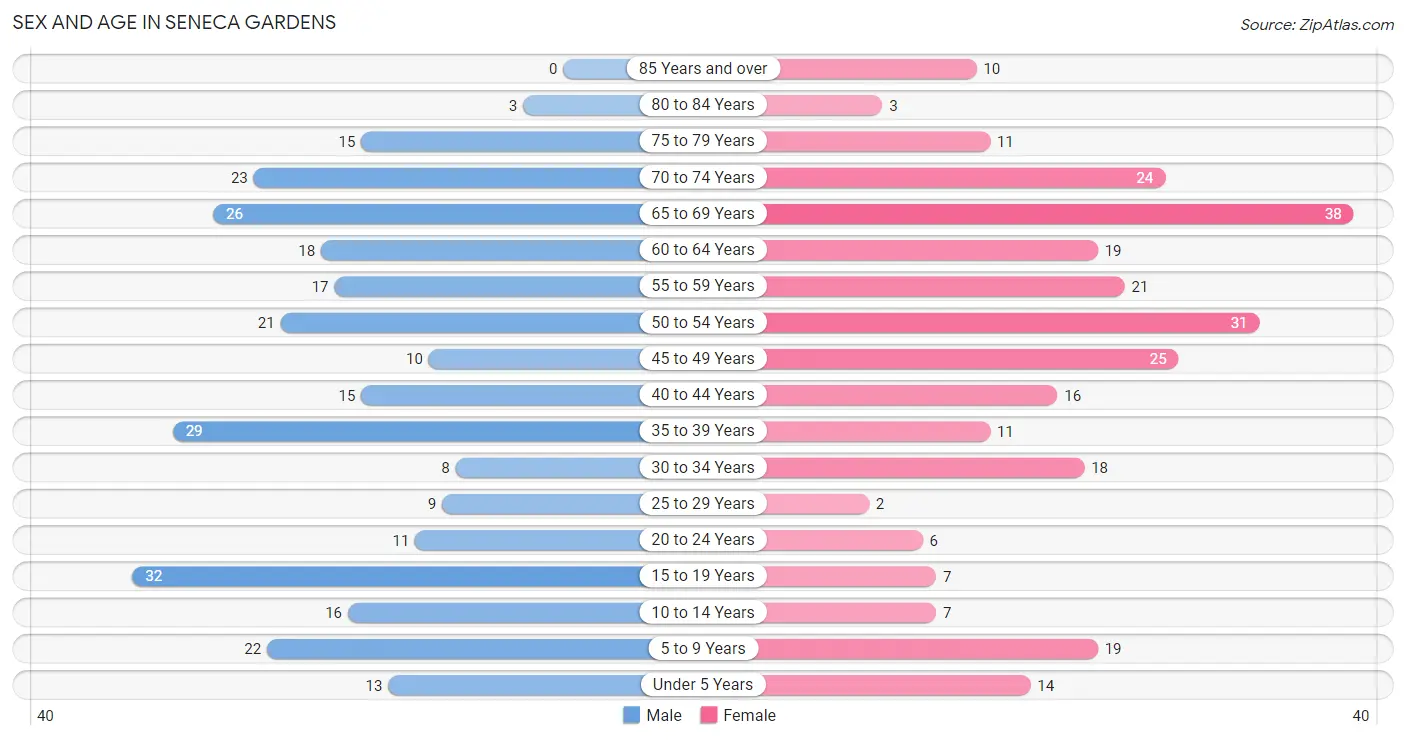
The most populous age groups in Seneca Gardens are 15 to 19 Years (32 | 11.1%) for men and 65 to 69 Years (38 | 13.5%) for women.
| Age Bracket | Male | Female |
| Under 5 Years | 13 (4.5%) | 14 (5.0%) |
| 5 to 9 Years | 22 (7.6%) | 19 (6.7%) |
| 10 to 14 Years | 16 (5.6%) | 7 (2.5%) |
| 15 to 19 Years | 32 (11.1%) | 7 (2.5%) |
| 20 to 24 Years | 11 (3.8%) | 6 (2.1%) |
| 25 to 29 Years | 9 (3.1%) | 2 (0.7%) |
| 30 to 34 Years | 8 (2.8%) | 18 (6.4%) |
| 35 to 39 Years | 29 (10.1%) | 11 (3.9%) |
| 40 to 44 Years | 15 (5.2%) | 16 (5.7%) |
| 45 to 49 Years | 10 (3.5%) | 25 (8.9%) |
| 50 to 54 Years | 21 (7.3%) | 31 (11.0%) |
| 55 to 59 Years | 17 (5.9%) | 21 (7.4%) |
| 60 to 64 Years | 18 (6.2%) | 19 (6.7%) |
| 65 to 69 Years | 26 (9.0%) | 38 (13.5%) |
| 70 to 74 Years | 23 (8.0%) | 24 (8.5%) |
| 75 to 79 Years | 15 (5.2%) | 11 (3.9%) |
| 80 to 84 Years | 3 (1.0%) | 3 (1.1%) |
| 85 Years and over | 0 (0.0%) | 10 (3.5%) |
| Total | 288 (100.0%) | 282 (100.0%) |
Families and Households in Seneca Gardens
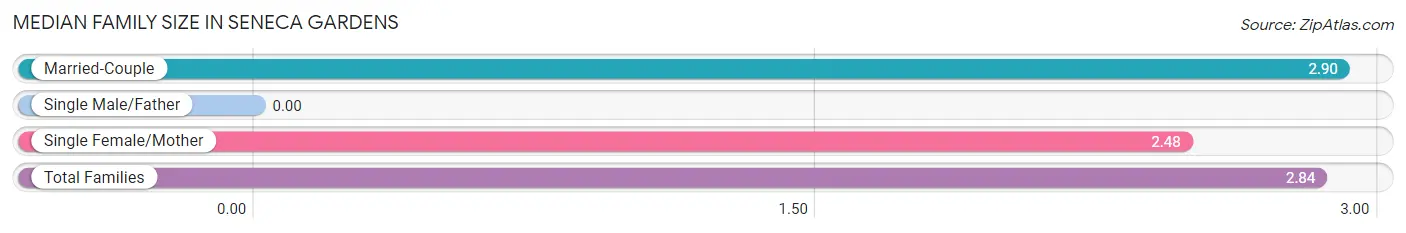
Median Family Size in Seneca Gardens
| Family Type | # Families | Family Size |
| Married-Couple | 146 (84.4%) | 2.90 |
| Single Male/Father | 0 (0.0%) | - |
| Single Female/Mother | 27 (15.6%) | 2.48 |
| Total Families | 173 (100.0%) | 2.84 |
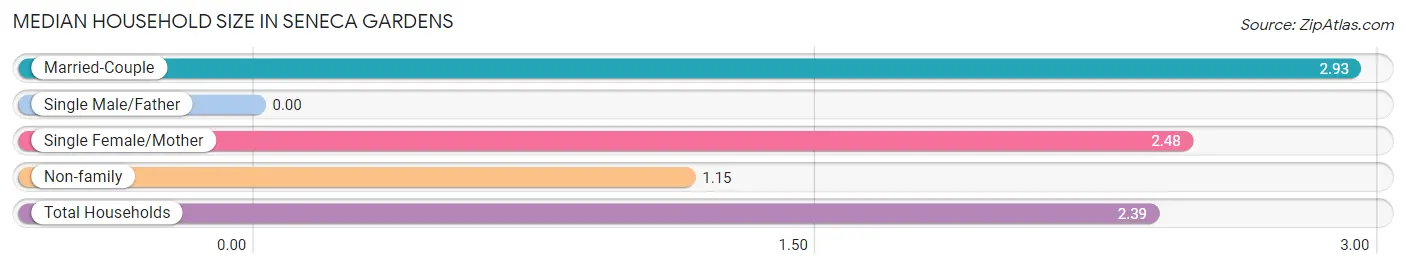
Median Household Size in Seneca Gardens
| Household Type | # Households | Household Size |
| Married-Couple | 146 (61.3%) | 2.93 |
| Single Male/Father | 0 (0.0%) | - |
| Single Female/Mother | 27 (11.3%) | 2.48 |
| Non-family | 65 (27.3%) | 1.15 |
| Total Households | 238 (100.0%) | 2.39 |
Household Size by Marriage Status in Seneca Gardens
Out of a total of 238 households in Seneca Gardens, 173 (72.7%) are family households, while 65 (27.3%) are nonfamily households. The most numerous type of family households are 2-person households, comprising 112, and the most common type of nonfamily households are 1-person households, comprising 54.
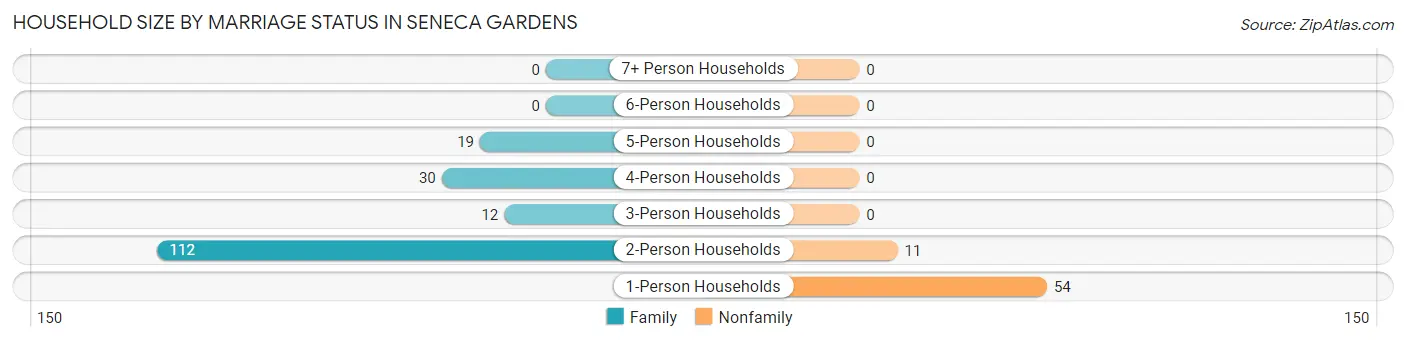
| Household Size | Family Households | Nonfamily Households |
| 1-Person Households | - | 54 (22.7%) |
| 2-Person Households | 112 (47.1%) | 11 (4.6%) |
| 3-Person Households | 12 (5.0%) | 0 (0.0%) |
| 4-Person Households | 30 (12.6%) | 0 (0.0%) |
| 5-Person Households | 19 (8.0%) | 0 (0.0%) |
| 6-Person Households | 0 (0.0%) | 0 (0.0%) |
| 7+ Person Households | 0 (0.0%) | 0 (0.0%) |
| Total | 173 (72.7%) | 65 (27.3%) |
Female Fertility in Seneca Gardens
Fertility by Age in Seneca Gardens
Average fertility rate in Seneca Gardens is 57.0 births per 1,000 women. Women in the age bracket of 20 to 34 years have the highest fertility rate with 192.0 births per 1,000 women. Women in the age bracket of 20 to 34 years acount for 100.0% of all women with births.
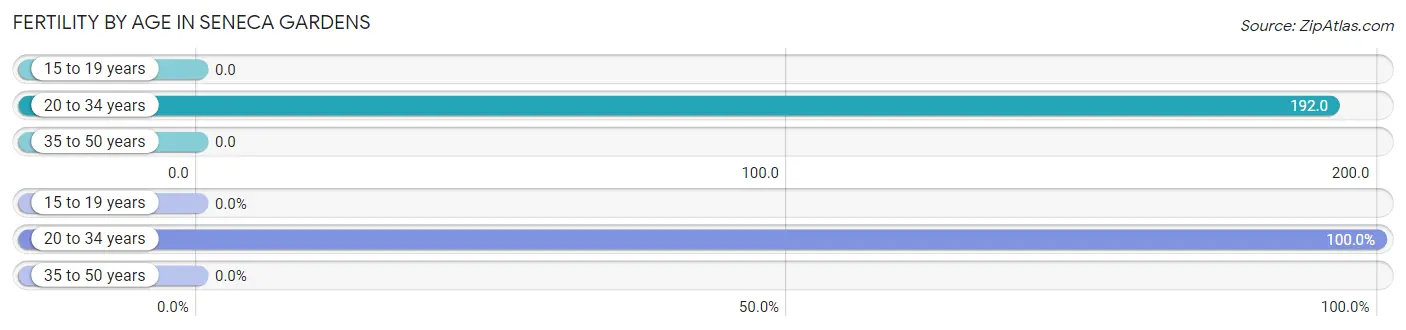
| Age Bracket | Women with Births | Births / 1,000 Women |
| 15 to 19 years | 0 (0.0%) | 0.0 |
| 20 to 34 years | 5 (100.0%) | 192.0 |
| 35 to 50 years | 0 (0.0%) | 0.0 |
| Total | 5 (100.0%) | 57.0 |
Fertility by Age by Marriage Status in Seneca Gardens
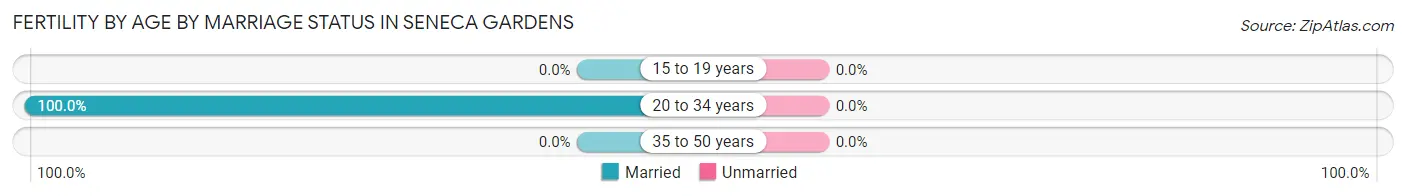
| Age Bracket | Married | Unmarried |
| 15 to 19 years | 0 (0.0%) | 0 (0.0%) |
| 20 to 34 years | 5 (100.0%) | 0 (0.0%) |
| 35 to 50 years | 0 (0.0%) | 0 (0.0%) |
| Total | 5 (100.0%) | 0 (0.0%) |
Fertility by Education in Seneca Gardens
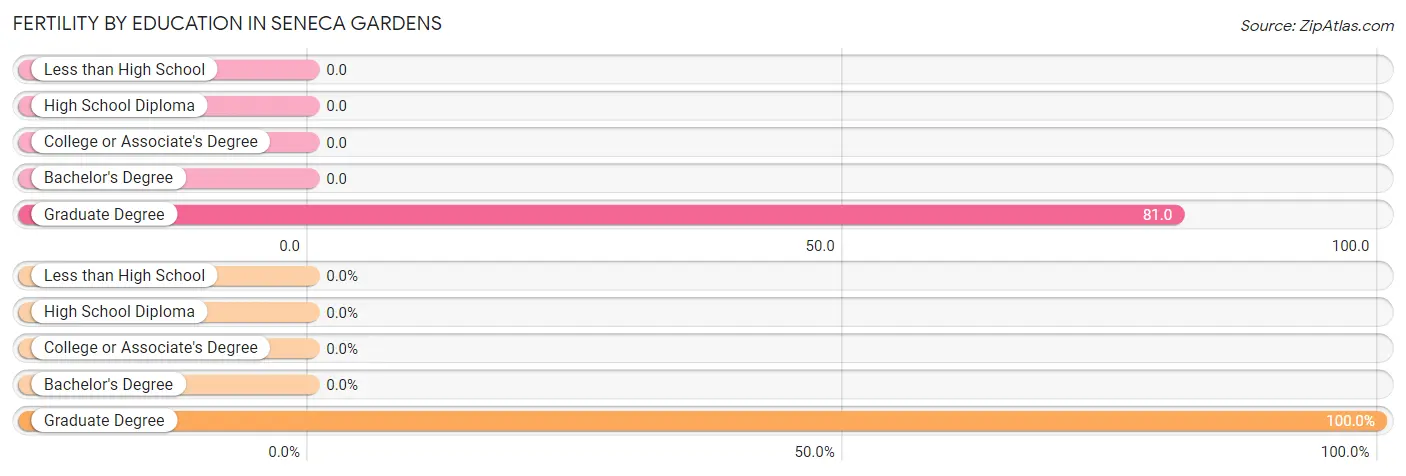
| Educational Attainment | Women with Births | Births / 1,000 Women |
| Less than High School | 0 (0.0%) | 0.0 |
| High School Diploma | 0 (0.0%) | 0.0 |
| College or Associate's Degree | 0 (0.0%) | 0.0 |
| Bachelor's Degree | 0 (0.0%) | 0.0 |
| Graduate Degree | 5 (100.0%) | 81.0 |
| Total | 5 (100.0%) | 57.0 |
Fertility by Education by Marriage Status in Seneca Gardens
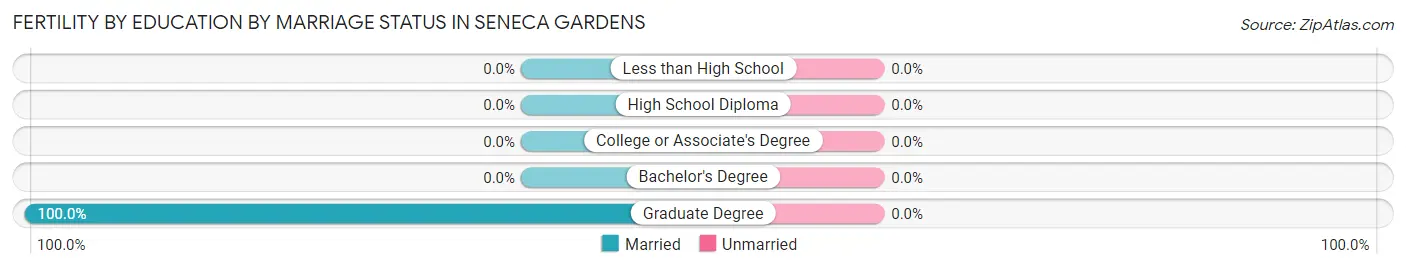
| Educational Attainment | Married | Unmarried |
| Less than High School | 0 (0.0%) | 0 (0.0%) |
| High School Diploma | 0 (0.0%) | 0 (0.0%) |
| College or Associate's Degree | 0 (0.0%) | 0 (0.0%) |
| Bachelor's Degree | 0 (0.0%) | 0 (0.0%) |
| Graduate Degree | 5 (100.0%) | 0 (0.0%) |
| Total | 5 (100.0%) | 0 (0.0%) |
Employment Characteristics in Seneca Gardens
Employment by Class of Employer in Seneca Gardens
Among the 279 employed individuals in Seneca Gardens, private company employees (155 | 55.6%), not-for-profit organizations (39 | 14.0%), and local government employees (25 | 9.0%) make up the most common classes of employment.
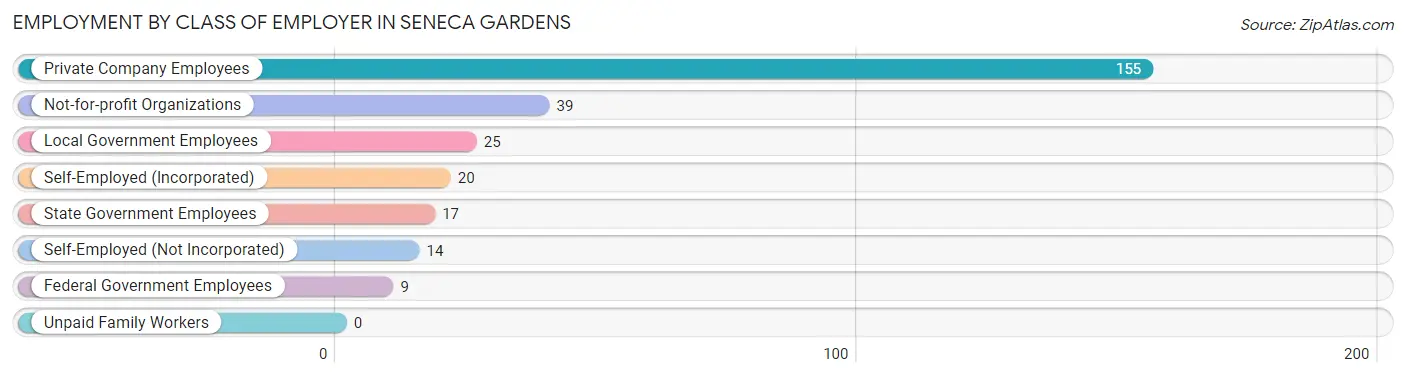
| Employer Class | # Employees | % Employees |
| Private Company Employees | 155 | 55.6% |
| Self-Employed (Incorporated) | 20 | 7.2% |
| Self-Employed (Not Incorporated) | 14 | 5.0% |
| Not-for-profit Organizations | 39 | 14.0% |
| Local Government Employees | 25 | 9.0% |
| State Government Employees | 17 | 6.1% |
| Federal Government Employees | 9 | 3.2% |
| Unpaid Family Workers | 0 | 0.0% |
| Total | 279 | 100.0% |
Employment Status by Age in Seneca Gardens
According to the labor force statistics for Seneca Gardens, out of the total population over 16 years of age (474), 60.8% or 288 individuals are in the labor force, with 0.3% or 1 of them unemployed. The age group with the highest labor force participation rate is 45 to 54 years, with 96.6% or 84 individuals in the labor force. Within the labor force, the 16 to 19 years age range has the highest percentage of unemployed individuals, with 5.0% or 1 of them being unemployed.
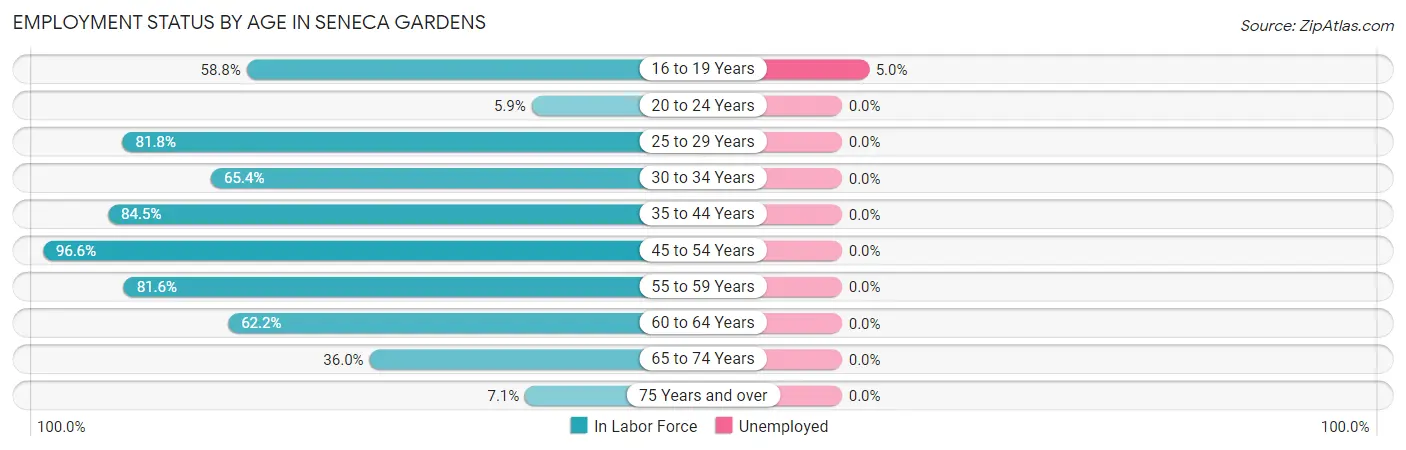
| Age Bracket | In Labor Force | Unemployed |
| 16 to 19 Years | 20 (58.8%) | 1 (5.0%) |
| 20 to 24 Years | 1 (5.9%) | 0 (0.0%) |
| 25 to 29 Years | 9 (81.8%) | 0 (0.0%) |
| 30 to 34 Years | 17 (65.4%) | 0 (0.0%) |
| 35 to 44 Years | 60 (84.5%) | 0 (0.0%) |
| 45 to 54 Years | 84 (96.6%) | 0 (0.0%) |
| 55 to 59 Years | 31 (81.6%) | 0 (0.0%) |
| 60 to 64 Years | 23 (62.2%) | 0 (0.0%) |
| 65 to 74 Years | 40 (36.0%) | 0 (0.0%) |
| 75 Years and over | 3 (7.1%) | 0 (0.0%) |
| Total | 288 (60.8%) | 1 (0.3%) |
Employment Status by Educational Attainment in Seneca Gardens
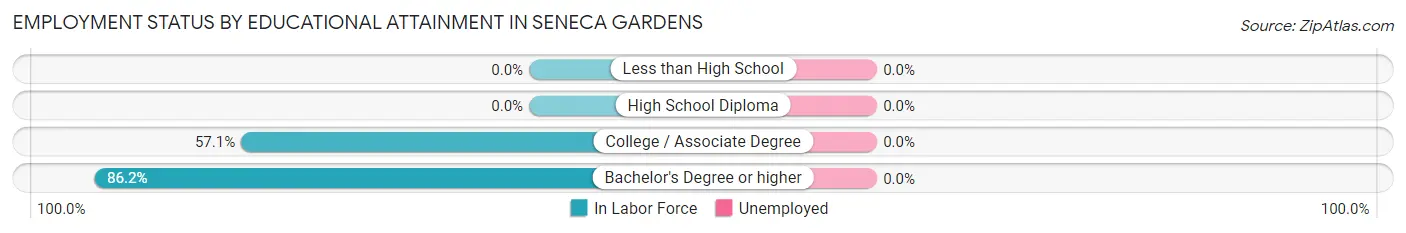
| Educational Attainment | In Labor Force | Unemployed |
| Less than High School | 0 (0.0%) | 0 (0.0%) |
| High School Diploma | 0 (0.0%) | 0 (0.0%) |
| College / Associate Degree | 12 (57.1%) | 0 (0.0%) |
| Bachelor's Degree or higher | 212 (86.2%) | 0 (0.0%) |
| Total | 224 (83.0%) | 0 (0.0%) |
Employment Occupations by Sex in Seneca Gardens
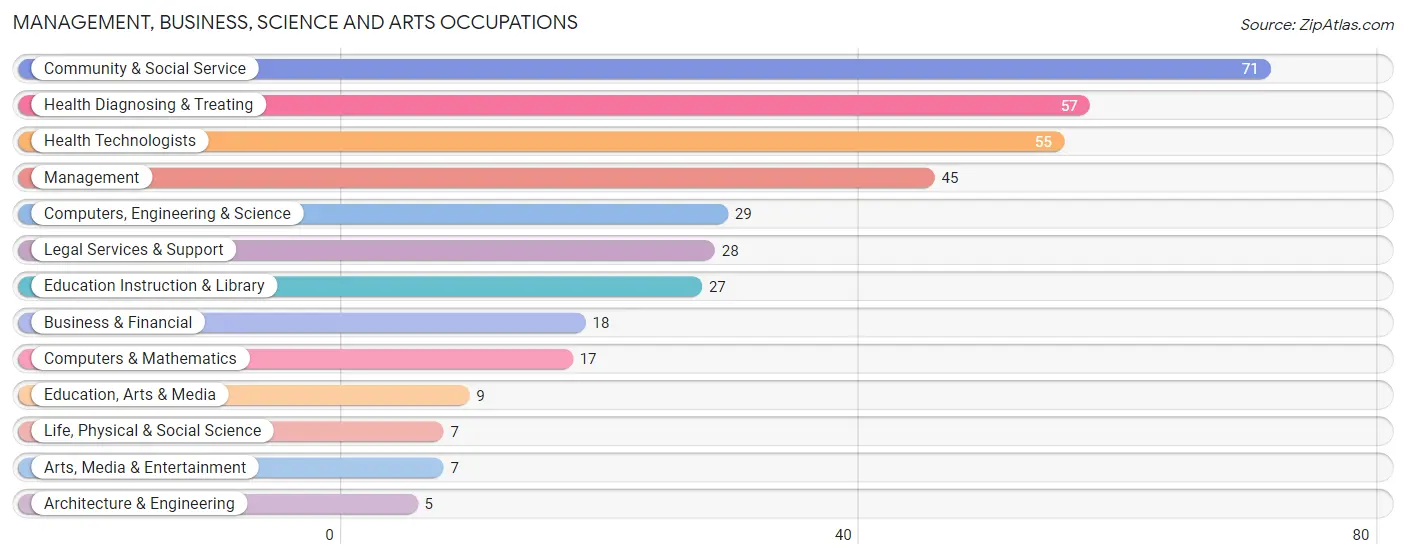
Management, Business, Science and Arts Occupations
The most common Management, Business, Science and Arts occupations in Seneca Gardens are Community & Social Service (71 | 24.7%), Health Diagnosing & Treating (57 | 19.9%), Health Technologists (55 | 19.2%), Management (45 | 15.7%), and Computers, Engineering & Science (29 | 10.1%).
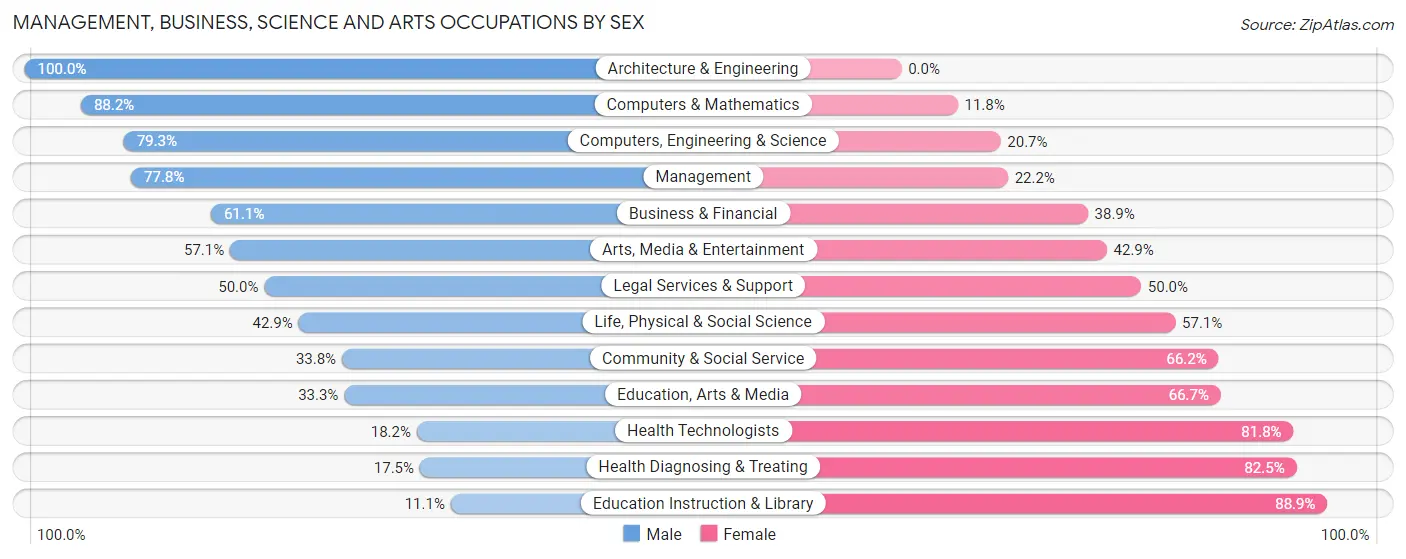
Management, Business, Science and Arts Occupations by Sex
Within the Management, Business, Science and Arts occupations in Seneca Gardens, the most male-oriented occupations are Architecture & Engineering (100.0%), Computers & Mathematics (88.2%), and Computers, Engineering & Science (79.3%), while the most female-oriented occupations are Education Instruction & Library (88.9%), Health Diagnosing & Treating (82.5%), and Health Technologists (81.8%).
| Occupation | Male | Female |
| Management | 35 (77.8%) | 10 (22.2%) |
| Business & Financial | 11 (61.1%) | 7 (38.9%) |
| Computers, Engineering & Science | 23 (79.3%) | 6 (20.7%) |
| Computers & Mathematics | 15 (88.2%) | 2 (11.8%) |
| Architecture & Engineering | 5 (100.0%) | 0 (0.0%) |
| Life, Physical & Social Science | 3 (42.9%) | 4 (57.1%) |
| Community & Social Service | 24 (33.8%) | 47 (66.2%) |
| Education, Arts & Media | 3 (33.3%) | 6 (66.7%) |
| Legal Services & Support | 14 (50.0%) | 14 (50.0%) |
| Education Instruction & Library | 3 (11.1%) | 24 (88.9%) |
| Arts, Media & Entertainment | 4 (57.1%) | 3 (42.9%) |
| Health Diagnosing & Treating | 10 (17.5%) | 47 (82.5%) |
| Health Technologists | 10 (18.2%) | 45 (81.8%) |
| Total (Category) | 103 (46.8%) | 117 (53.2%) |
| Total (Overall) | 147 (51.2%) | 140 (48.8%) |
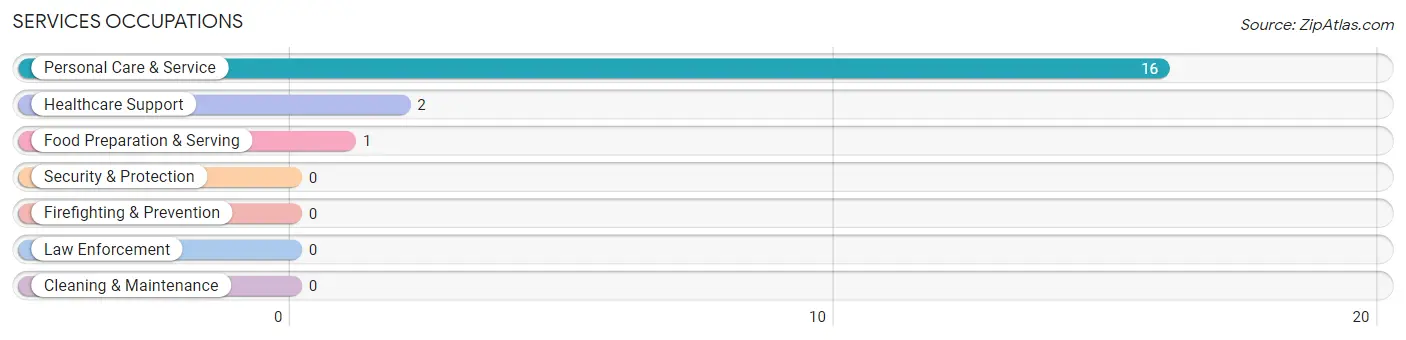
Services Occupations
The most common Services occupations in Seneca Gardens are Personal Care & Service (16 | 5.6%), Healthcare Support (2 | 0.7%), and Food Preparation & Serving (1 | 0.4%).
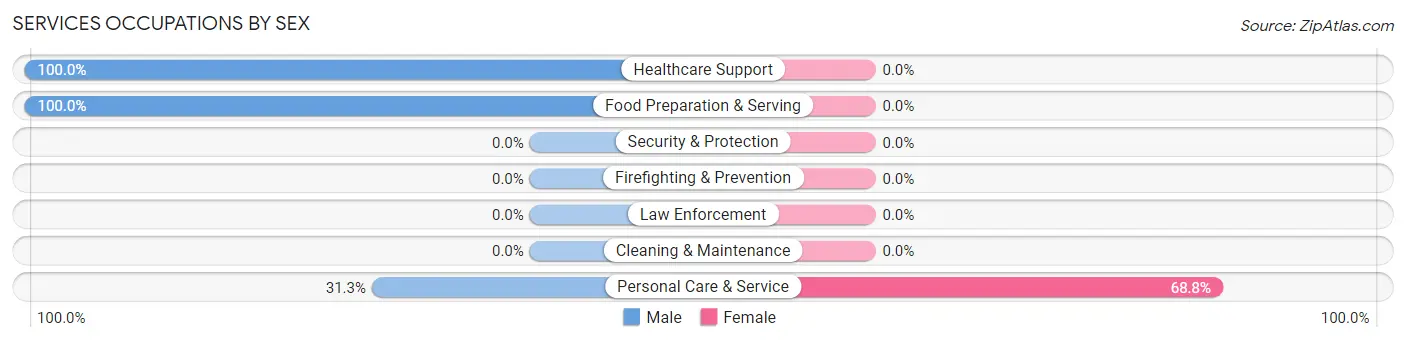
Services Occupations by Sex
| Occupation | Male | Female |
| Healthcare Support | 2 (100.0%) | 0 (0.0%) |
| Security & Protection | 0 (0.0%) | 0 (0.0%) |
| Firefighting & Prevention | 0 (0.0%) | 0 (0.0%) |
| Law Enforcement | 0 (0.0%) | 0 (0.0%) |
| Food Preparation & Serving | 1 (100.0%) | 0 (0.0%) |
| Cleaning & Maintenance | 0 (0.0%) | 0 (0.0%) |
| Personal Care & Service | 5 (31.2%) | 11 (68.8%) |
| Total (Category) | 8 (42.1%) | 11 (57.9%) |
| Total (Overall) | 147 (51.2%) | 140 (48.8%) |
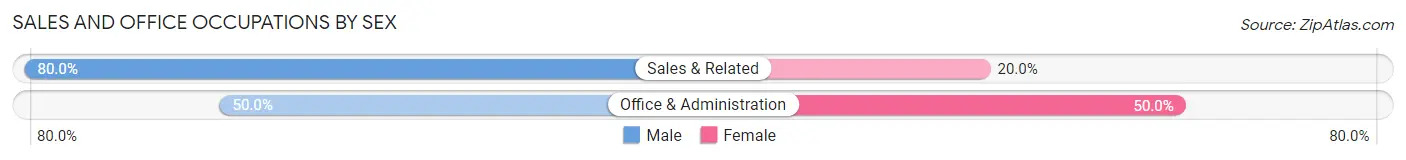
Sales and Office Occupations
The most common Sales and Office occupations in Seneca Gardens are Sales & Related (25 | 8.7%), and Office & Administration (12 | 4.2%).
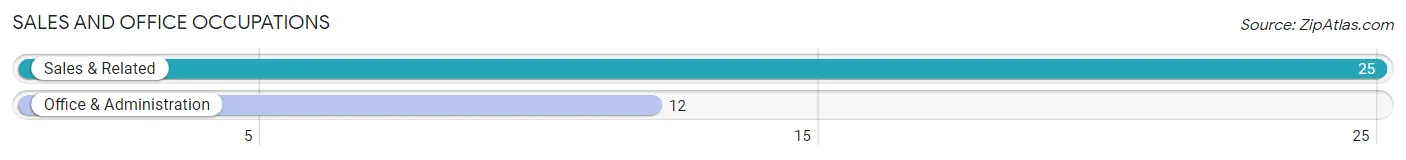
Sales and Office Occupations by Sex
| Occupation | Male | Female |
| Sales & Related | 20 (80.0%) | 5 (20.0%) |
| Office & Administration | 6 (50.0%) | 6 (50.0%) |
| Total (Category) | 26 (70.3%) | 11 (29.7%) |
| Total (Overall) | 147 (51.2%) | 140 (48.8%) |
Natural Resources, Construction and Maintenance Occupations
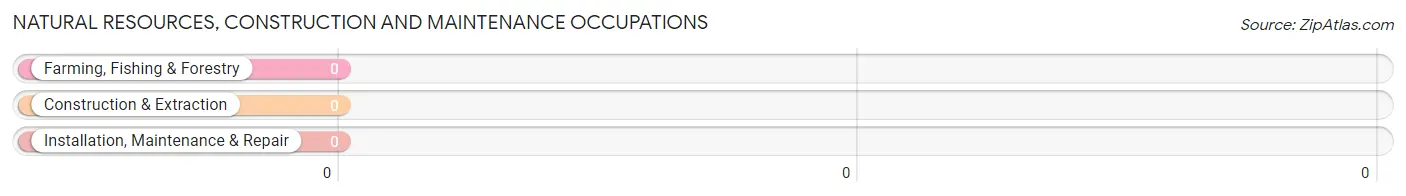
Natural Resources, Construction and Maintenance Occupations by Sex
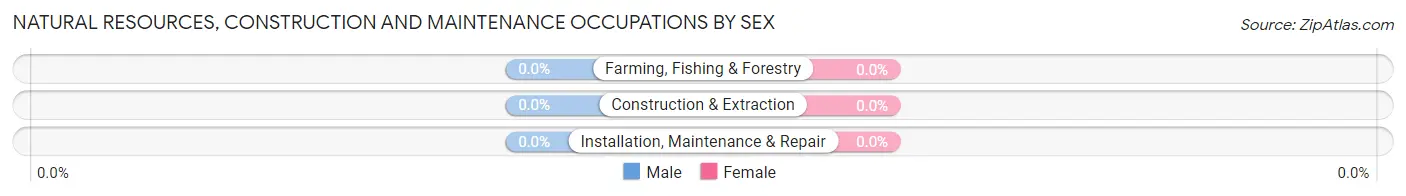
| Occupation | Male | Female |
| Farming, Fishing & Forestry | 0 (0.0%) | 0 (0.0%) |
| Construction & Extraction | 0 (0.0%) | 0 (0.0%) |
| Installation, Maintenance & Repair | 0 (0.0%) | 0 (0.0%) |
| Total (Category) | 0 (0.0%) | 0 (0.0%) |
| Total (Overall) | 147 (51.2%) | 140 (48.8%) |
Production, Transportation and Moving Occupations
The most common Production, Transportation and Moving occupations in Seneca Gardens are Transportation (8 | 2.8%), Production (2 | 0.7%), and Material Moving (1 | 0.4%).
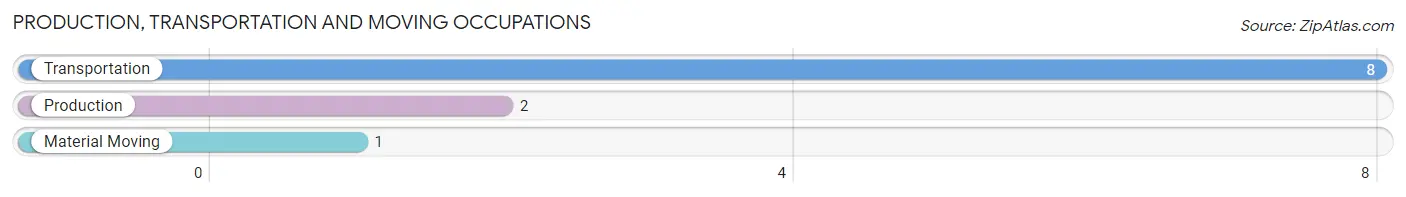
Production, Transportation and Moving Occupations by Sex
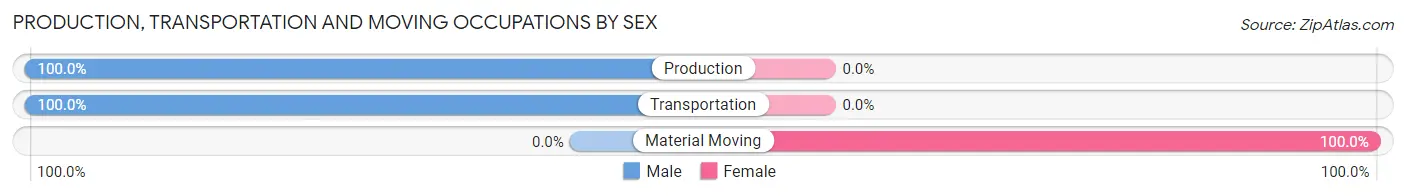
| Occupation | Male | Female |
| Production | 2 (100.0%) | 0 (0.0%) |
| Transportation | 8 (100.0%) | 0 (0.0%) |
| Material Moving | 0 (0.0%) | 1 (100.0%) |
| Total (Category) | 10 (90.9%) | 1 (9.1%) |
| Total (Overall) | 147 (51.2%) | 140 (48.8%) |
Employment Industries by Sex in Seneca Gardens
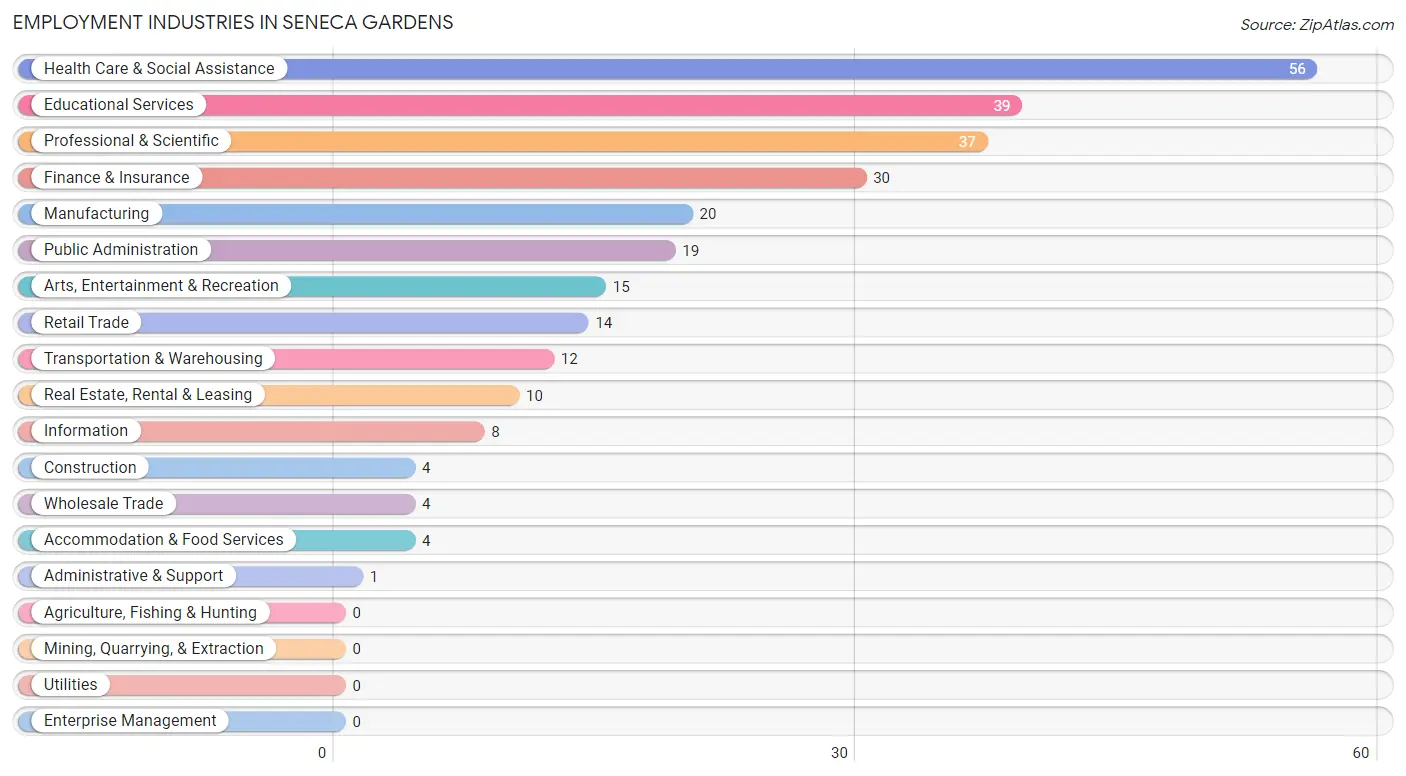
Employment Industries in Seneca Gardens
The major employment industries in Seneca Gardens include Health Care & Social Assistance (56 | 19.5%), Educational Services (39 | 13.6%), Professional & Scientific (37 | 12.9%), Finance & Insurance (30 | 10.4%), and Manufacturing (20 | 7.0%).
Employment Industries by Sex in Seneca Gardens
The Seneca Gardens industries that see more men than women are Wholesale Trade (100.0%), Retail Trade (100.0%), and Transportation & Warehousing (100.0%), whereas the industries that tend to have a higher number of women are Administrative & Support (100.0%), Educational Services (92.3%), and Health Care & Social Assistance (76.8%).
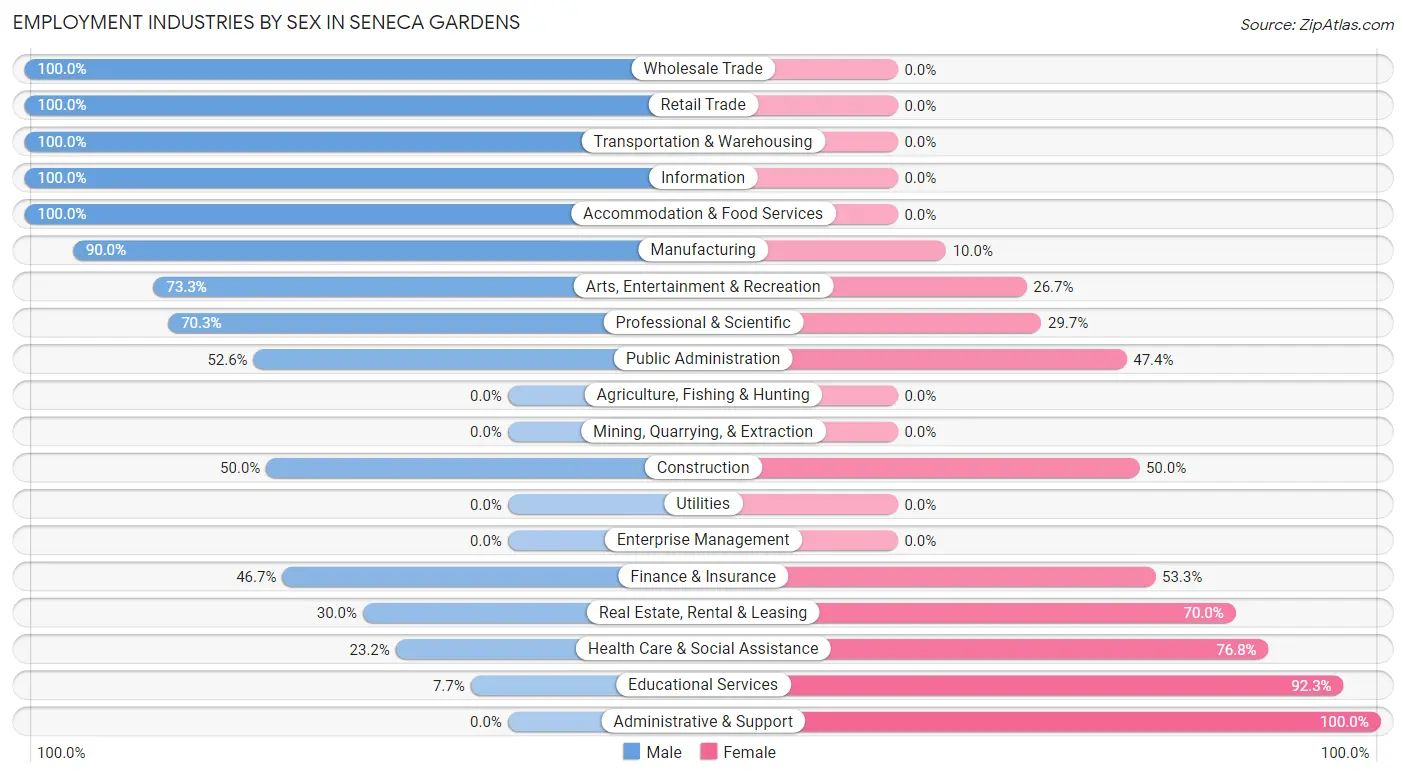
| Industry | Male | Female |
| Agriculture, Fishing & Hunting | 0 (0.0%) | 0 (0.0%) |
| Mining, Quarrying, & Extraction | 0 (0.0%) | 0 (0.0%) |
| Construction | 2 (50.0%) | 2 (50.0%) |
| Manufacturing | 18 (90.0%) | 2 (10.0%) |
| Wholesale Trade | 4 (100.0%) | 0 (0.0%) |
| Retail Trade | 14 (100.0%) | 0 (0.0%) |
| Transportation & Warehousing | 12 (100.0%) | 0 (0.0%) |
| Utilities | 0 (0.0%) | 0 (0.0%) |
| Information | 8 (100.0%) | 0 (0.0%) |
| Finance & Insurance | 14 (46.7%) | 16 (53.3%) |
| Real Estate, Rental & Leasing | 3 (30.0%) | 7 (70.0%) |
| Professional & Scientific | 26 (70.3%) | 11 (29.7%) |
| Enterprise Management | 0 (0.0%) | 0 (0.0%) |
| Administrative & Support | 0 (0.0%) | 1 (100.0%) |
| Educational Services | 3 (7.7%) | 36 (92.3%) |
| Health Care & Social Assistance | 13 (23.2%) | 43 (76.8%) |
| Arts, Entertainment & Recreation | 11 (73.3%) | 4 (26.7%) |
| Accommodation & Food Services | 4 (100.0%) | 0 (0.0%) |
| Public Administration | 10 (52.6%) | 9 (47.4%) |
| Total | 147 (51.2%) | 140 (48.8%) |
Education in Seneca Gardens
School Enrollment in Seneca Gardens
The most common levels of schooling among the 141 students in Seneca Gardens are high school (39 | 27.7%), elementary school (38 | 27.0%), and college / undergraduate (21 | 14.9%).
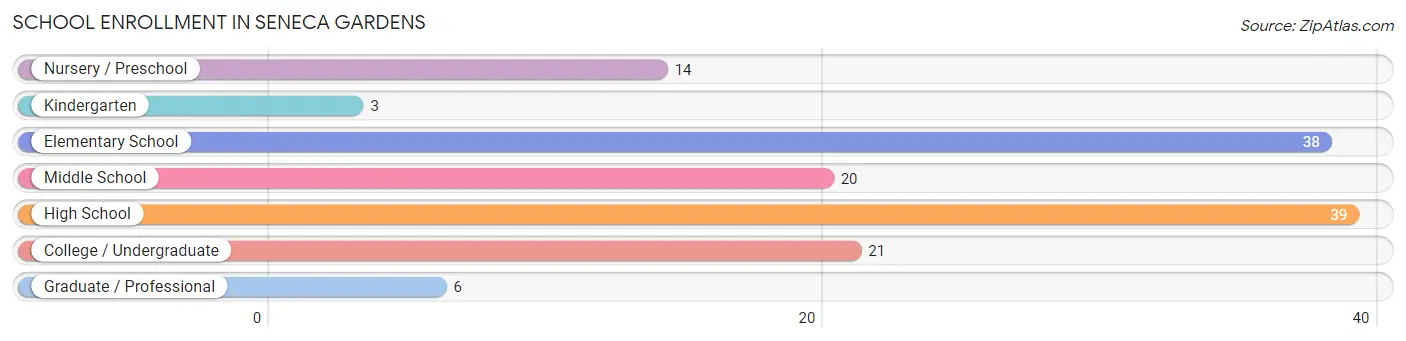
| School Level | # Students | % Students |
| Nursery / Preschool | 14 | 9.9% |
| Kindergarten | 3 | 2.1% |
| Elementary School | 38 | 27.0% |
| Middle School | 20 | 14.2% |
| High School | 39 | 27.7% |
| College / Undergraduate | 21 | 14.9% |
| Graduate / Professional | 6 | 4.3% |
| Total | 141 | 100.0% |
School Enrollment by Age by Funding Source in Seneca Gardens
Out of a total of 141 students who are enrolled in schools in Seneca Gardens, 94 (66.7%) attend a private institution, while the remaining 47 (33.3%) are enrolled in public schools. The age group of 3 to 4 year olds has the highest likelihood of being enrolled in private schools, with 11 (100.0% in the age bracket) enrolled. Conversely, the age group of 25 to 34 year olds has the lowest likelihood of being enrolled in a private school, with 2 (100.0% in the age bracket) attending a public institution.
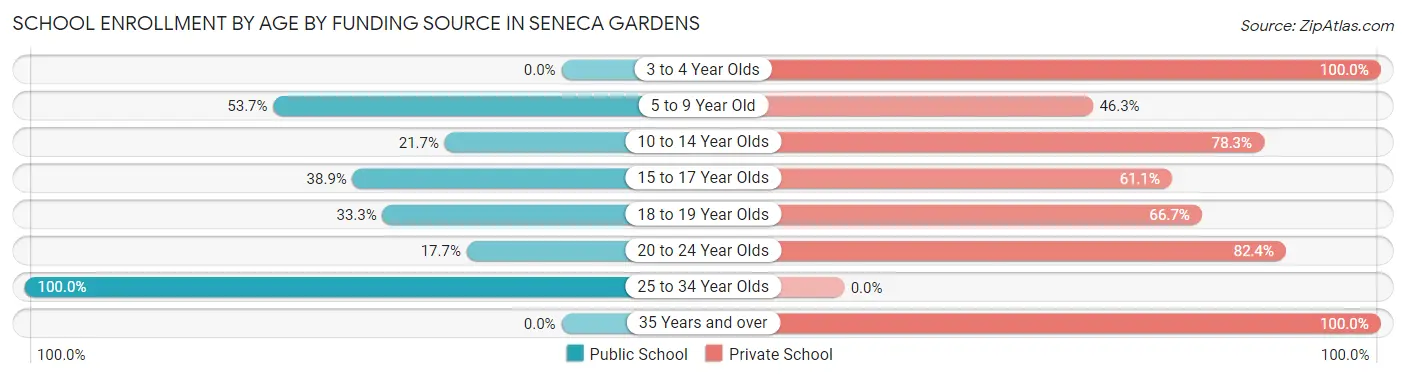
| Age Bracket | Public School | Private School |
| 3 to 4 Year Olds | 0 (0.0%) | 11 (100.0%) |
| 5 to 9 Year Old | 22 (53.7%) | 19 (46.3%) |
| 10 to 14 Year Olds | 5 (21.7%) | 18 (78.3%) |
| 15 to 17 Year Olds | 14 (38.9%) | 22 (61.1%) |
| 18 to 19 Year Olds | 1 (33.3%) | 2 (66.7%) |
| 20 to 24 Year Olds | 3 (17.6%) | 14 (82.4%) |
| 25 to 34 Year Olds | 2 (100.0%) | 0 (0.0%) |
| 35 Years and over | 0 (0.0%) | 8 (100.0%) |
| Total | 47 (33.3%) | 94 (66.7%) |
Educational Attainment by Field of Study in Seneca Gardens
Science & technology (70 | 18.3%), business (52 | 13.6%), social sciences (29 | 7.6%), engineering (29 | 7.6%), and education (28 | 7.3%) are the most common fields of study among 382 individuals in Seneca Gardens who have obtained a bachelor's degree or higher.
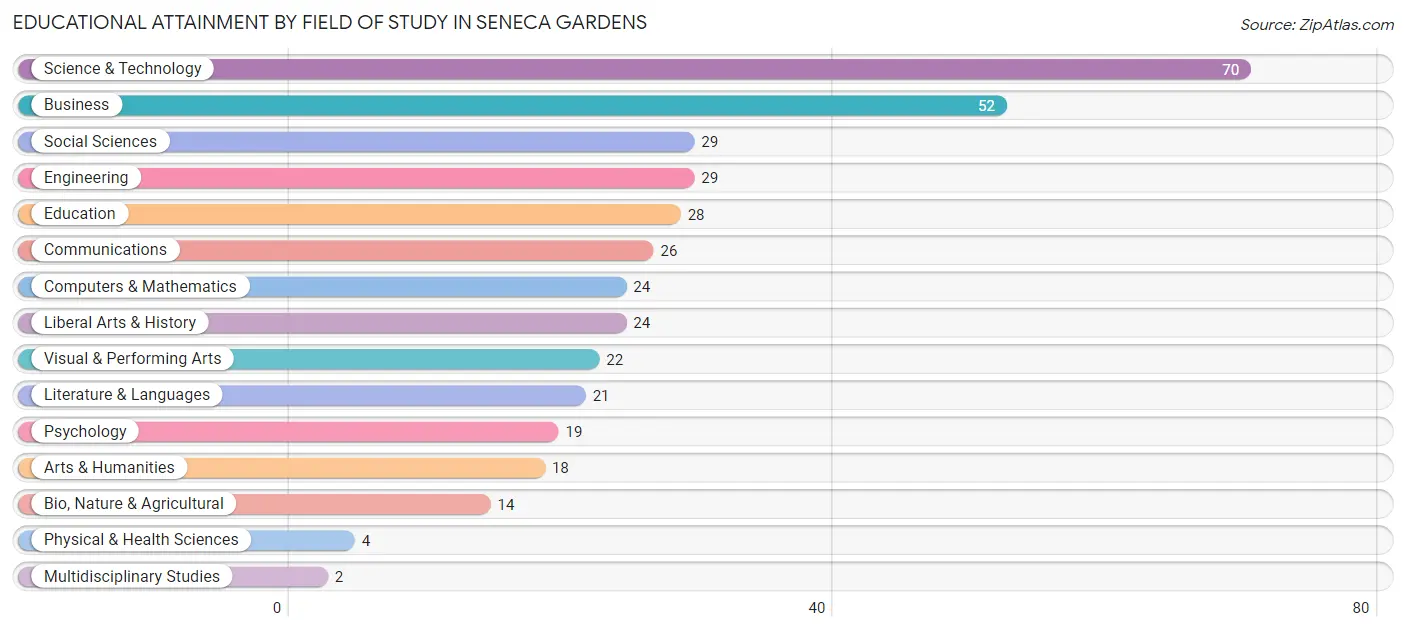
| Field of Study | # Graduates | % Graduates |
| Computers & Mathematics | 24 | 6.3% |
| Bio, Nature & Agricultural | 14 | 3.7% |
| Physical & Health Sciences | 4 | 1.1% |
| Psychology | 19 | 5.0% |
| Social Sciences | 29 | 7.6% |
| Engineering | 29 | 7.6% |
| Multidisciplinary Studies | 2 | 0.5% |
| Science & Technology | 70 | 18.3% |
| Business | 52 | 13.6% |
| Education | 28 | 7.3% |
| Literature & Languages | 21 | 5.5% |
| Liberal Arts & History | 24 | 6.3% |
| Visual & Performing Arts | 22 | 5.8% |
| Communications | 26 | 6.8% |
| Arts & Humanities | 18 | 4.7% |
| Total | 382 | 100.0% |
Transportation & Commute in Seneca Gardens
Vehicle Availability by Sex in Seneca Gardens
The most prevalent vehicle ownership categories in Seneca Gardens are males with 2 vehicles (72, accounting for 49.3%) and females with 2 vehicles (64, making up 54.1%).
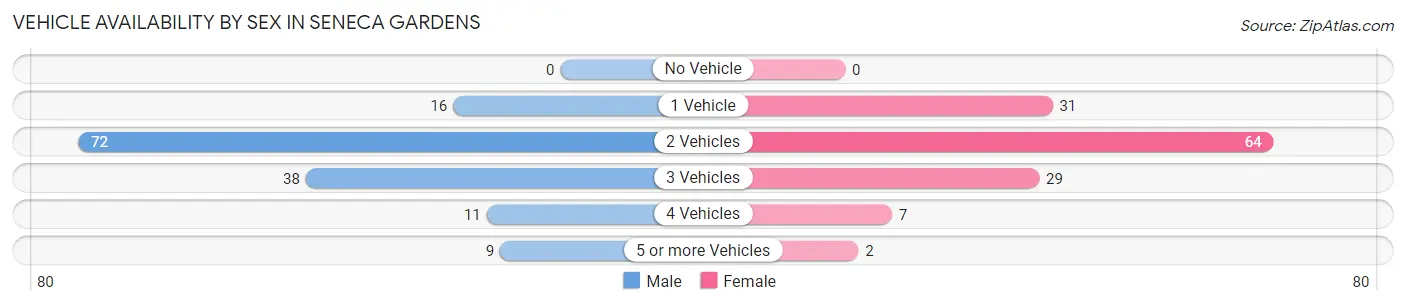
| Vehicles Available | Male | Female |
| No Vehicle | 0 (0.0%) | 0 (0.0%) |
| 1 Vehicle | 16 (11.0%) | 31 (23.3%) |
| 2 Vehicles | 72 (49.3%) | 64 (48.1%) |
| 3 Vehicles | 38 (26.0%) | 29 (21.8%) |
| 4 Vehicles | 11 (7.5%) | 7 (5.3%) |
| 5 or more Vehicles | 9 (6.2%) | 2 (1.5%) |
| Total | 146 (100.0%) | 133 (100.0%) |
Commute Time in Seneca Gardens
The most frequently occuring commute durations in Seneca Gardens are 15 to 19 minutes (76 commuters, 31.5%), 20 to 24 minutes (71 commuters, 29.5%), and 10 to 14 minutes (42 commuters, 17.4%).
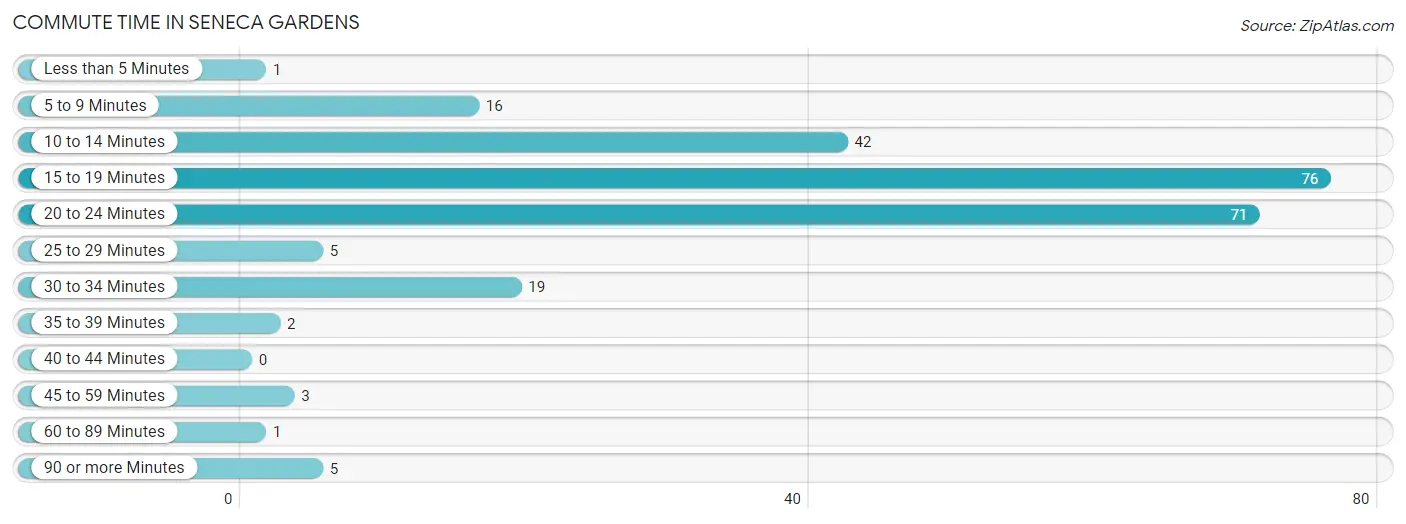
| Commute Time | # Commuters | % Commuters |
| Less than 5 Minutes | 1 | 0.4% |
| 5 to 9 Minutes | 16 | 6.6% |
| 10 to 14 Minutes | 42 | 17.4% |
| 15 to 19 Minutes | 76 | 31.5% |
| 20 to 24 Minutes | 71 | 29.5% |
| 25 to 29 Minutes | 5 | 2.1% |
| 30 to 34 Minutes | 19 | 7.9% |
| 35 to 39 Minutes | 2 | 0.8% |
| 40 to 44 Minutes | 0 | 0.0% |
| 45 to 59 Minutes | 3 | 1.2% |
| 60 to 89 Minutes | 1 | 0.4% |
| 90 or more Minutes | 5 | 2.1% |
Commute Time by Sex in Seneca Gardens
The most common commute times in Seneca Gardens are 15 to 19 minutes (42 commuters, 34.7%) for males and 20 to 24 minutes (41 commuters, 34.2%) for females.
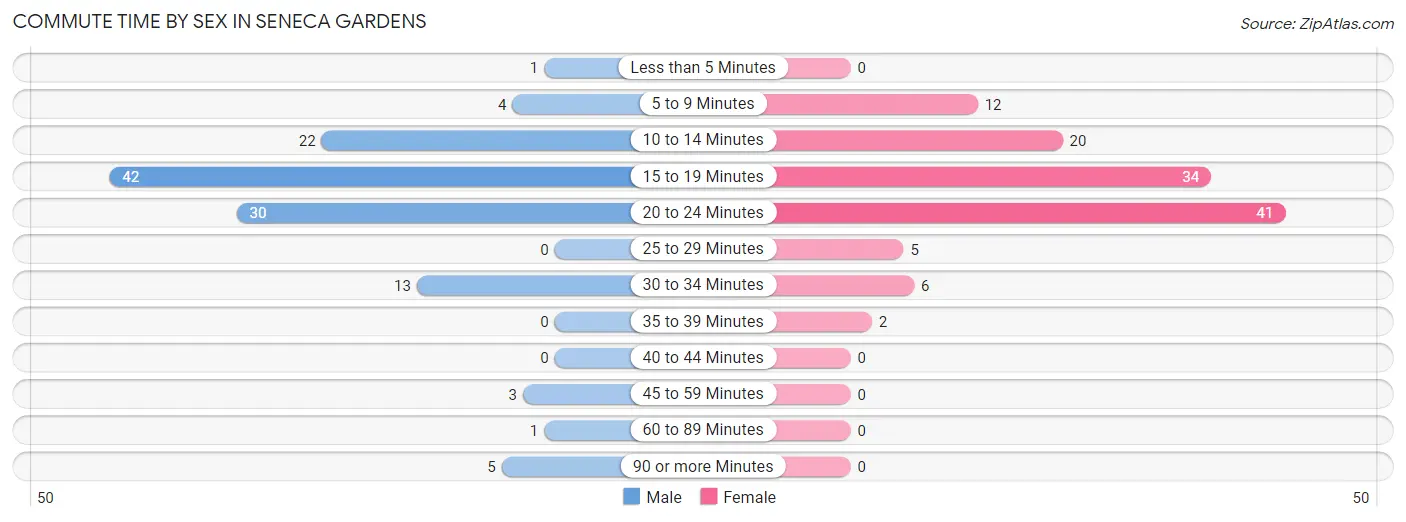
| Commute Time | Male | Female |
| Less than 5 Minutes | 1 (0.8%) | 0 (0.0%) |
| 5 to 9 Minutes | 4 (3.3%) | 12 (10.0%) |
| 10 to 14 Minutes | 22 (18.2%) | 20 (16.7%) |
| 15 to 19 Minutes | 42 (34.7%) | 34 (28.3%) |
| 20 to 24 Minutes | 30 (24.8%) | 41 (34.2%) |
| 25 to 29 Minutes | 0 (0.0%) | 5 (4.2%) |
| 30 to 34 Minutes | 13 (10.7%) | 6 (5.0%) |
| 35 to 39 Minutes | 0 (0.0%) | 2 (1.7%) |
| 40 to 44 Minutes | 0 (0.0%) | 0 (0.0%) |
| 45 to 59 Minutes | 3 (2.5%) | 0 (0.0%) |
| 60 to 89 Minutes | 1 (0.8%) | 0 (0.0%) |
| 90 or more Minutes | 5 (4.1%) | 0 (0.0%) |
Time of Departure to Work by Sex in Seneca Gardens
The most frequent times of departure to work in Seneca Gardens are 8:30 AM to 8:59 AM (23, 19.0%) for males and 7:00 AM to 7:29 AM (24, 20.0%) for females.
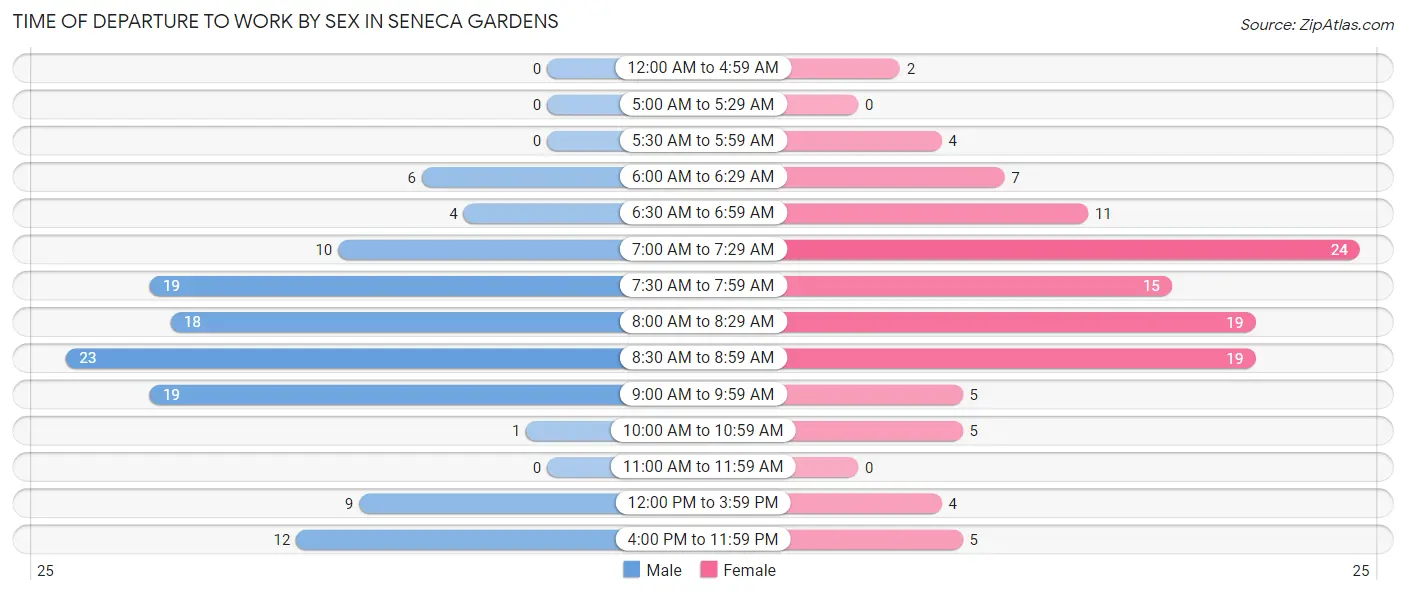
| Time of Departure | Male | Female |
| 12:00 AM to 4:59 AM | 0 (0.0%) | 2 (1.7%) |
| 5:00 AM to 5:29 AM | 0 (0.0%) | 0 (0.0%) |
| 5:30 AM to 5:59 AM | 0 (0.0%) | 4 (3.3%) |
| 6:00 AM to 6:29 AM | 6 (5.0%) | 7 (5.8%) |
| 6:30 AM to 6:59 AM | 4 (3.3%) | 11 (9.2%) |
| 7:00 AM to 7:29 AM | 10 (8.3%) | 24 (20.0%) |
| 7:30 AM to 7:59 AM | 19 (15.7%) | 15 (12.5%) |
| 8:00 AM to 8:29 AM | 18 (14.9%) | 19 (15.8%) |
| 8:30 AM to 8:59 AM | 23 (19.0%) | 19 (15.8%) |
| 9:00 AM to 9:59 AM | 19 (15.7%) | 5 (4.2%) |
| 10:00 AM to 10:59 AM | 1 (0.8%) | 5 (4.2%) |
| 11:00 AM to 11:59 AM | 0 (0.0%) | 0 (0.0%) |
| 12:00 PM to 3:59 PM | 9 (7.4%) | 4 (3.3%) |
| 4:00 PM to 11:59 PM | 12 (9.9%) | 5 (4.2%) |
| Total | 121 (100.0%) | 120 (100.0%) |
Housing Occupancy in Seneca Gardens
Occupancy by Ownership in Seneca Gardens
Of the total 238 dwellings in Seneca Gardens, owner-occupied units account for 216 (90.8%), while renter-occupied units make up 22 (9.2%).
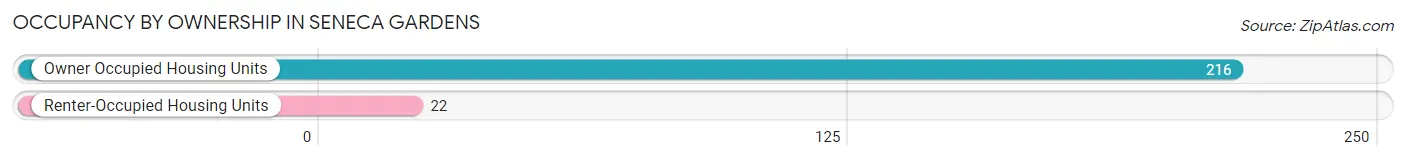
| Occupancy | # Housing Units | % Housing Units |
| Owner Occupied Housing Units | 216 | 90.8% |
| Renter-Occupied Housing Units | 22 | 9.2% |
| Total Occupied Housing Units | 238 | 100.0% |
Occupancy by Household Size in Seneca Gardens
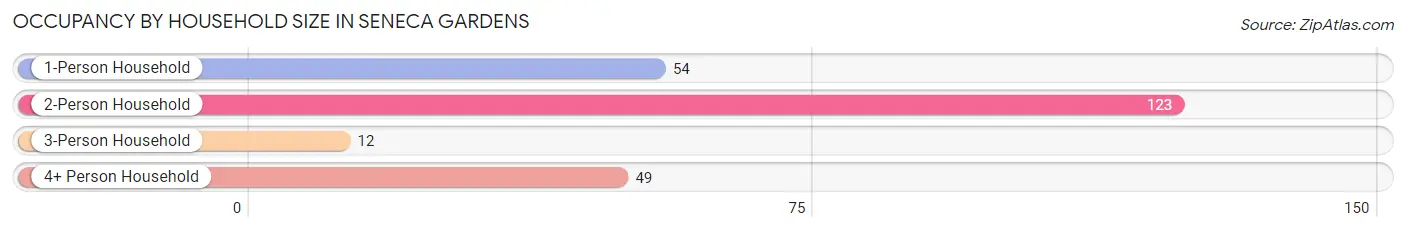
| Household Size | # Housing Units | % Housing Units |
| 1-Person Household | 54 | 22.7% |
| 2-Person Household | 123 | 51.7% |
| 3-Person Household | 12 | 5.0% |
| 4+ Person Household | 49 | 20.6% |
| Total Housing Units | 238 | 100.0% |
Occupancy by Ownership by Household Size in Seneca Gardens
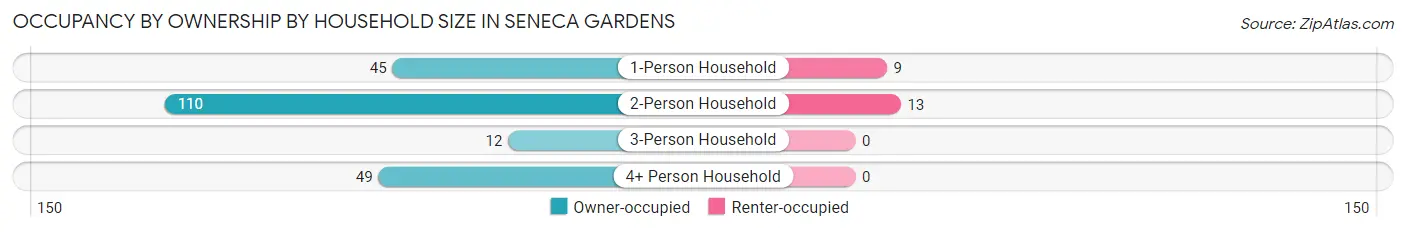
| Household Size | Owner-occupied | Renter-occupied |
| 1-Person Household | 45 (83.3%) | 9 (16.7%) |
| 2-Person Household | 110 (89.4%) | 13 (10.6%) |
| 3-Person Household | 12 (100.0%) | 0 (0.0%) |
| 4+ Person Household | 49 (100.0%) | 0 (0.0%) |
| Total Housing Units | 216 (90.8%) | 22 (9.2%) |
Occupancy by Educational Attainment in Seneca Gardens
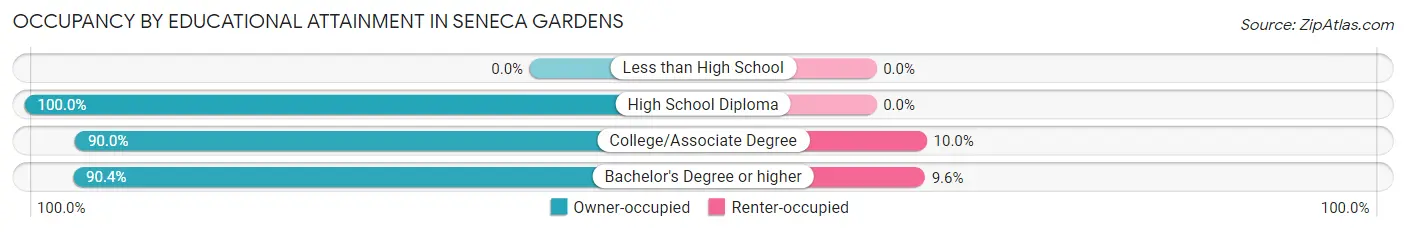
| Household Size | Owner-occupied | Renter-occupied |
| Less than High School | 0 (0.0%) | 0 (0.0%) |
| High School Diploma | 10 (100.0%) | 0 (0.0%) |
| College/Associate Degree | 18 (90.0%) | 2 (10.0%) |
| Bachelor's Degree or higher | 188 (90.4%) | 20 (9.6%) |
Occupancy by Age of Householder in Seneca Gardens
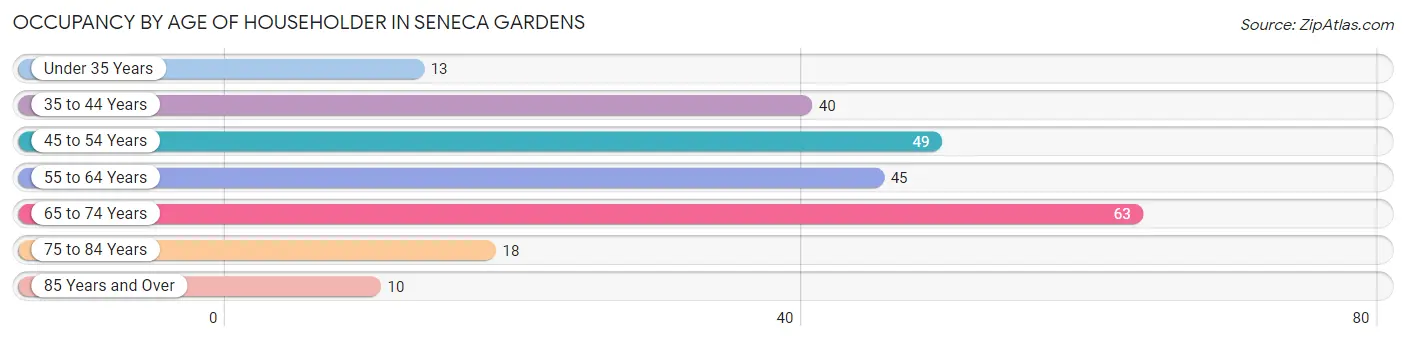
| Age Bracket | # Households | % Households |
| Under 35 Years | 13 | 5.5% |
| 35 to 44 Years | 40 | 16.8% |
| 45 to 54 Years | 49 | 20.6% |
| 55 to 64 Years | 45 | 18.9% |
| 65 to 74 Years | 63 | 26.5% |
| 75 to 84 Years | 18 | 7.6% |
| 85 Years and Over | 10 | 4.2% |
| Total | 238 | 100.0% |
Housing Finances in Seneca Gardens
Median Income by Occupancy in Seneca Gardens
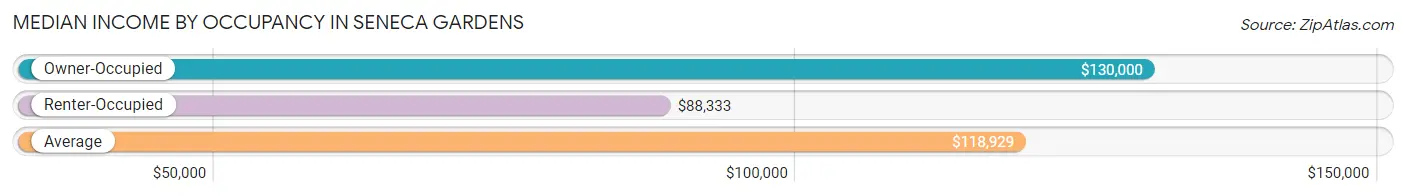
| Occupancy Type | # Households | Median Income |
| Owner-Occupied | 216 (90.8%) | $130,000 |
| Renter-Occupied | 22 (9.2%) | $88,333 |
| Average | 238 (100.0%) | $118,929 |
Occupancy by Householder Income Bracket in Seneca Gardens
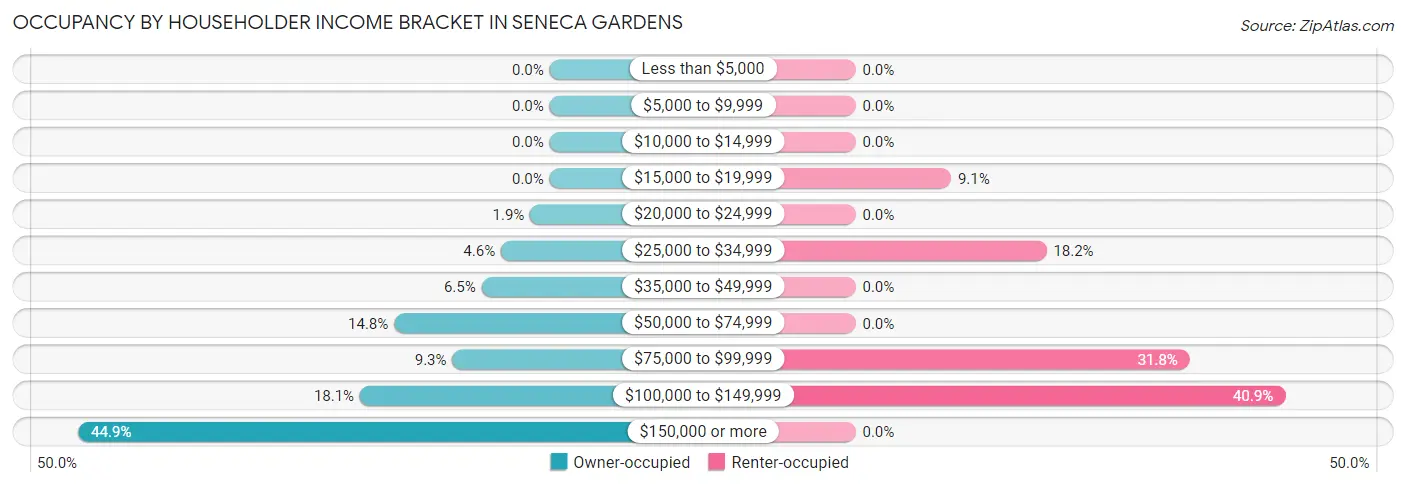
| Income Bracket | Owner-occupied | Renter-occupied |
| Less than $5,000 | 0 (0.0%) | 0 (0.0%) |
| $5,000 to $9,999 | 0 (0.0%) | 0 (0.0%) |
| $10,000 to $14,999 | 0 (0.0%) | 0 (0.0%) |
| $15,000 to $19,999 | 0 (0.0%) | 2 (9.1%) |
| $20,000 to $24,999 | 4 (1.8%) | 0 (0.0%) |
| $25,000 to $34,999 | 10 (4.6%) | 4 (18.2%) |
| $35,000 to $49,999 | 14 (6.5%) | 0 (0.0%) |
| $50,000 to $74,999 | 32 (14.8%) | 0 (0.0%) |
| $75,000 to $99,999 | 20 (9.3%) | 7 (31.8%) |
| $100,000 to $149,999 | 39 (18.1%) | 9 (40.9%) |
| $150,000 or more | 97 (44.9%) | 0 (0.0%) |
| Total | 216 (100.0%) | 22 (100.0%) |
Monthly Housing Cost Tiers in Seneca Gardens
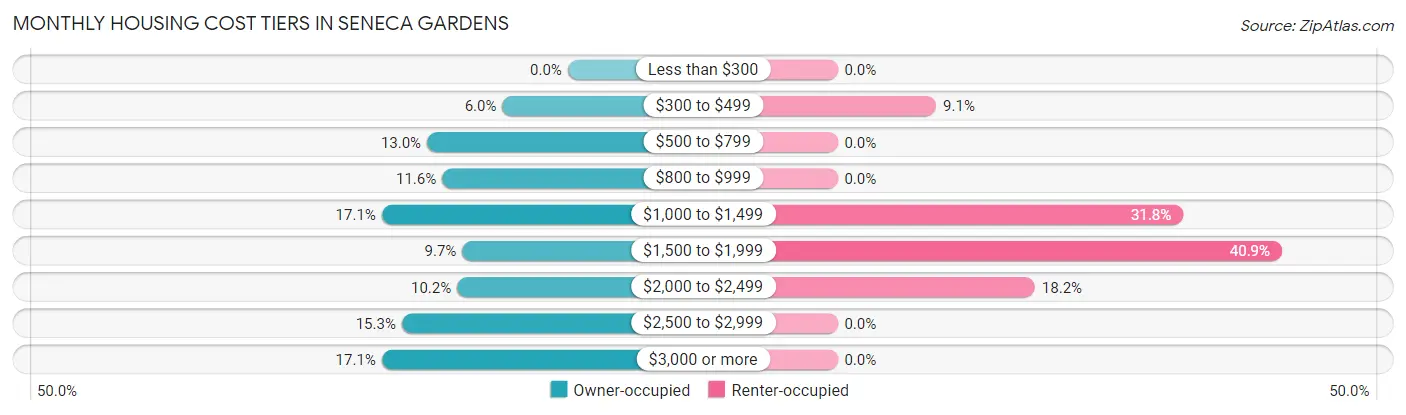
| Monthly Cost | Owner-occupied | Renter-occupied |
| Less than $300 | 0 (0.0%) | 0 (0.0%) |
| $300 to $499 | 13 (6.0%) | 2 (9.1%) |
| $500 to $799 | 28 (13.0%) | 0 (0.0%) |
| $800 to $999 | 25 (11.6%) | 0 (0.0%) |
| $1,000 to $1,499 | 37 (17.1%) | 7 (31.8%) |
| $1,500 to $1,999 | 21 (9.7%) | 9 (40.9%) |
| $2,000 to $2,499 | 22 (10.2%) | 4 (18.2%) |
| $2,500 to $2,999 | 33 (15.3%) | 0 (0.0%) |
| $3,000 or more | 37 (17.1%) | 0 (0.0%) |
| Total | 216 (100.0%) | 22 (100.0%) |
Physical Housing Characteristics in Seneca Gardens
Housing Structures in Seneca Gardens
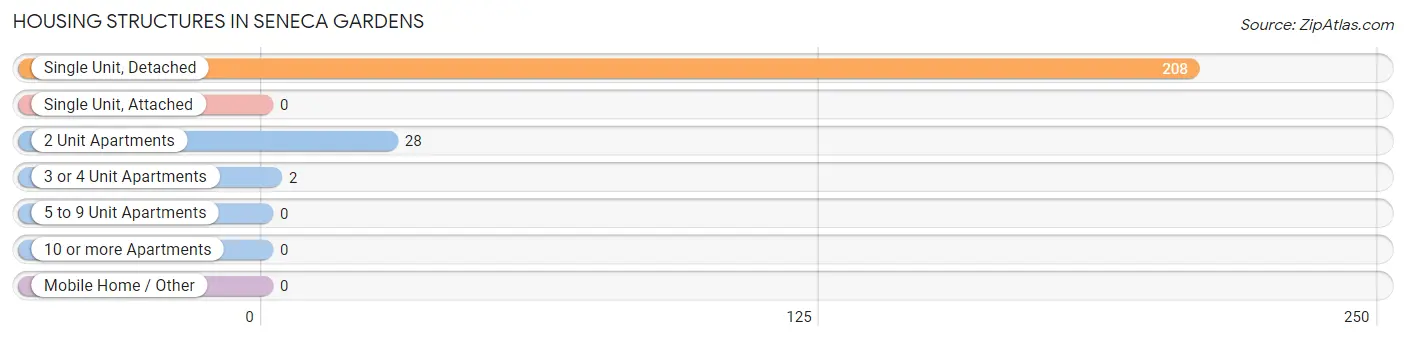
| Structure Type | # Housing Units | % Housing Units |
| Single Unit, Detached | 208 | 87.4% |
| Single Unit, Attached | 0 | 0.0% |
| 2 Unit Apartments | 28 | 11.8% |
| 3 or 4 Unit Apartments | 2 | 0.8% |
| 5 to 9 Unit Apartments | 0 | 0.0% |
| 10 or more Apartments | 0 | 0.0% |
| Mobile Home / Other | 0 | 0.0% |
| Total | 238 | 100.0% |
Housing Structures by Occupancy in Seneca Gardens
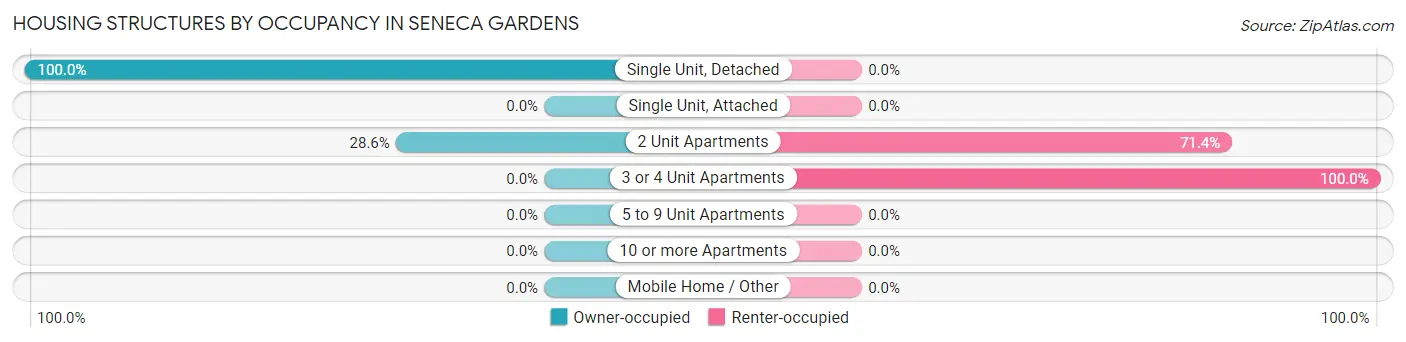
| Structure Type | Owner-occupied | Renter-occupied |
| Single Unit, Detached | 208 (100.0%) | 0 (0.0%) |
| Single Unit, Attached | 0 (0.0%) | 0 (0.0%) |
| 2 Unit Apartments | 8 (28.6%) | 20 (71.4%) |
| 3 or 4 Unit Apartments | 0 (0.0%) | 2 (100.0%) |
| 5 to 9 Unit Apartments | 0 (0.0%) | 0 (0.0%) |
| 10 or more Apartments | 0 (0.0%) | 0 (0.0%) |
| Mobile Home / Other | 0 (0.0%) | 0 (0.0%) |
| Total | 216 (90.8%) | 22 (9.2%) |
Housing Structures by Number of Rooms in Seneca Gardens
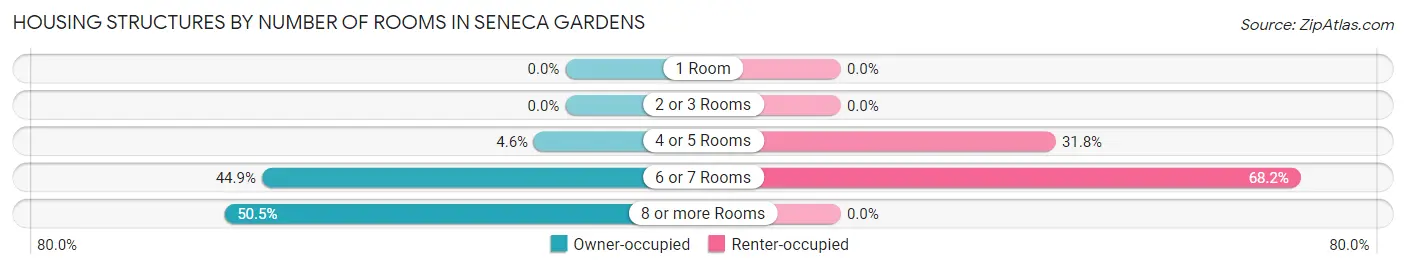
| Number of Rooms | Owner-occupied | Renter-occupied |
| 1 Room | 0 (0.0%) | 0 (0.0%) |
| 2 or 3 Rooms | 0 (0.0%) | 0 (0.0%) |
| 4 or 5 Rooms | 10 (4.6%) | 7 (31.8%) |
| 6 or 7 Rooms | 97 (44.9%) | 15 (68.2%) |
| 8 or more Rooms | 109 (50.5%) | 0 (0.0%) |
| Total | 216 (100.0%) | 22 (100.0%) |
Housing Structure by Heating Type in Seneca Gardens
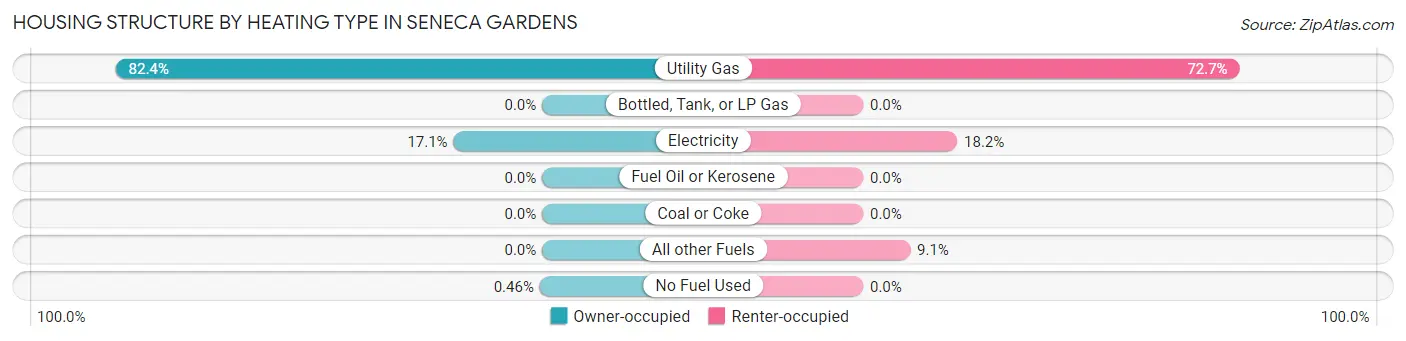
| Heating Type | Owner-occupied | Renter-occupied |
| Utility Gas | 178 (82.4%) | 16 (72.7%) |
| Bottled, Tank, or LP Gas | 0 (0.0%) | 0 (0.0%) |
| Electricity | 37 (17.1%) | 4 (18.2%) |
| Fuel Oil or Kerosene | 0 (0.0%) | 0 (0.0%) |
| Coal or Coke | 0 (0.0%) | 0 (0.0%) |
| All other Fuels | 0 (0.0%) | 2 (9.1%) |
| No Fuel Used | 1 (0.5%) | 0 (0.0%) |
| Total | 216 (100.0%) | 22 (100.0%) |
Household Vehicle Usage in Seneca Gardens
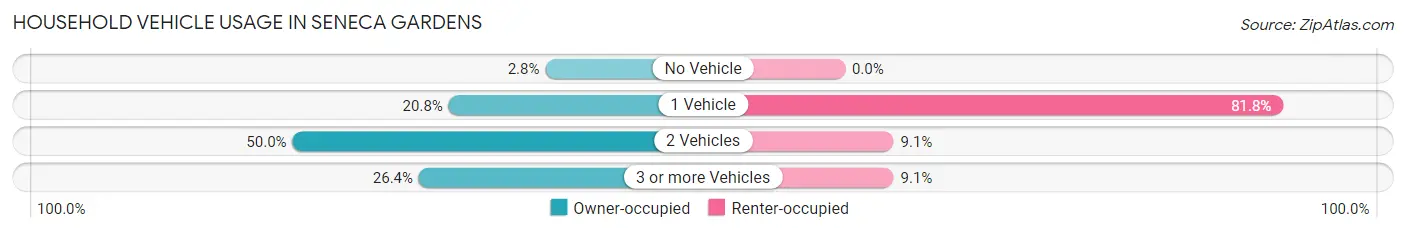
| Vehicles per Household | Owner-occupied | Renter-occupied |
| No Vehicle | 6 (2.8%) | 0 (0.0%) |
| 1 Vehicle | 45 (20.8%) | 18 (81.8%) |
| 2 Vehicles | 108 (50.0%) | 2 (9.1%) |
| 3 or more Vehicles | 57 (26.4%) | 2 (9.1%) |
| Total | 216 (100.0%) | 22 (100.0%) |
Real Estate & Mortgages in Seneca Gardens
Real Estate and Mortgage Overview in Seneca Gardens
| Characteristic | Without Mortgage | With Mortgage |
| Housing Units | 82 | 134 |
| Median Property Value | $390,000 | $562,500 |
| Median Household Income | $98,750 | $71 |
| Monthly Housing Costs | $836 | $37 |
| Real Estate Taxes | $3,905 | $0 |
Property Value by Mortgage Status in Seneca Gardens
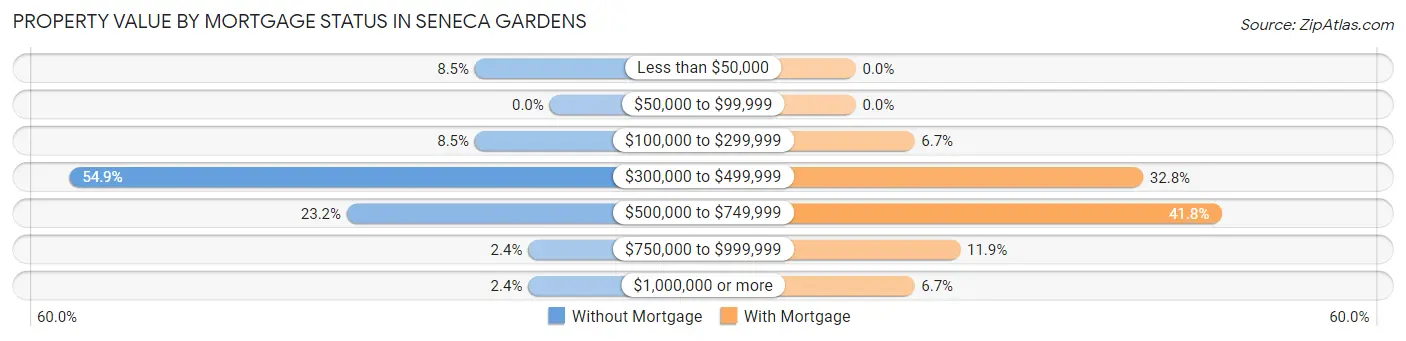
| Property Value | Without Mortgage | With Mortgage |
| Less than $50,000 | 7 (8.5%) | 0 (0.0%) |
| $50,000 to $99,999 | 0 (0.0%) | 0 (0.0%) |
| $100,000 to $299,999 | 7 (8.5%) | 9 (6.7%) |
| $300,000 to $499,999 | 45 (54.9%) | 44 (32.8%) |
| $500,000 to $749,999 | 19 (23.2%) | 56 (41.8%) |
| $750,000 to $999,999 | 2 (2.4%) | 16 (11.9%) |
| $1,000,000 or more | 2 (2.4%) | 9 (6.7%) |
| Total | 82 (100.0%) | 134 (100.0%) |
Household Income by Mortgage Status in Seneca Gardens
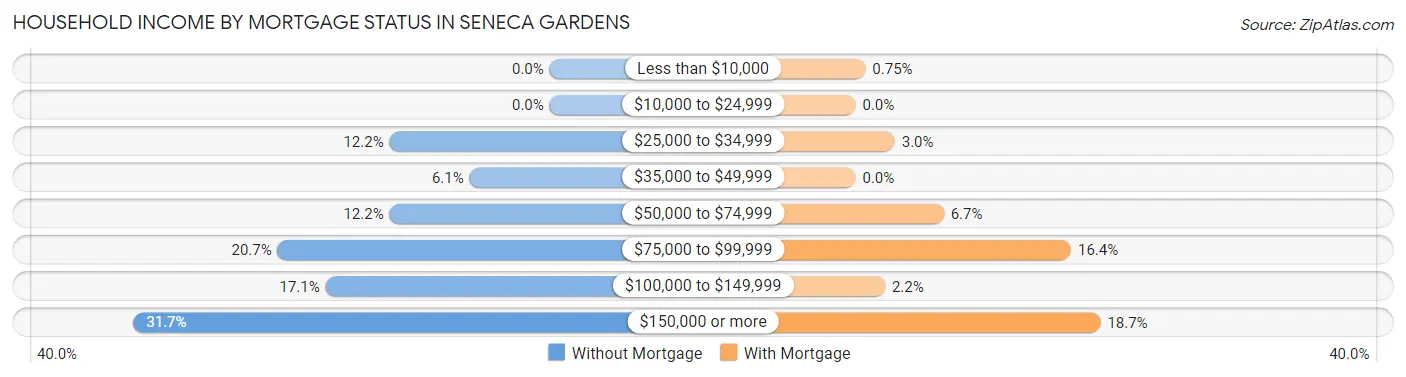
| Household Income | Without Mortgage | With Mortgage |
| Less than $10,000 | 0 (0.0%) | 1 (0.7%) |
| $10,000 to $24,999 | 0 (0.0%) | 0 (0.0%) |
| $25,000 to $34,999 | 10 (12.2%) | 4 (3.0%) |
| $35,000 to $49,999 | 5 (6.1%) | 0 (0.0%) |
| $50,000 to $74,999 | 10 (12.2%) | 9 (6.7%) |
| $75,000 to $99,999 | 17 (20.7%) | 22 (16.4%) |
| $100,000 to $149,999 | 14 (17.1%) | 3 (2.2%) |
| $150,000 or more | 26 (31.7%) | 25 (18.7%) |
| Total | 82 (100.0%) | 134 (100.0%) |
Property Value to Household Income Ratio in Seneca Gardens
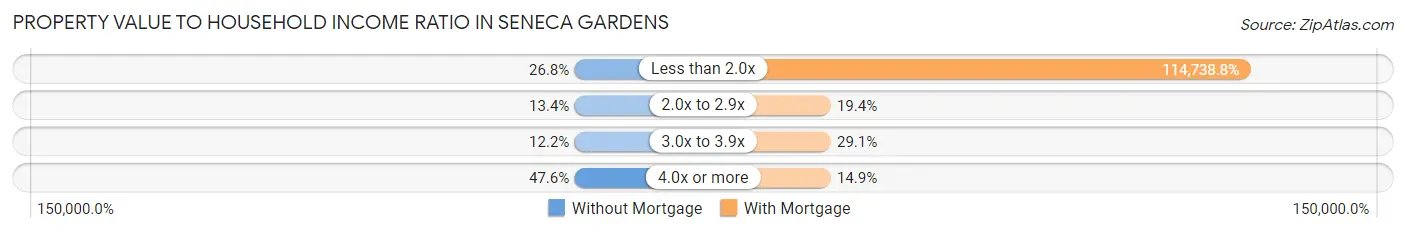
| Value-to-Income Ratio | Without Mortgage | With Mortgage |
| Less than 2.0x | 22 (26.8%) | 153,750 (114,738.8%) |
| 2.0x to 2.9x | 11 (13.4%) | 26 (19.4%) |
| 3.0x to 3.9x | 10 (12.2%) | 39 (29.1%) |
| 4.0x or more | 39 (47.6%) | 20 (14.9%) |
| Total | 82 (100.0%) | 134 (100.0%) |
Real Estate Taxes by Mortgage Status in Seneca Gardens
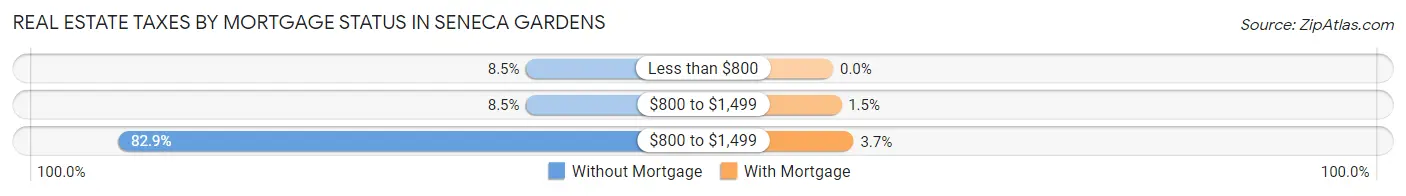
| Property Taxes | Without Mortgage | With Mortgage |
| Less than $800 | 7 (8.5%) | 0 (0.0%) |
| $800 to $1,499 | 7 (8.5%) | 2 (1.5%) |
| $800 to $1,499 | 68 (82.9%) | 5 (3.7%) |
| Total | 82 (100.0%) | 134 (100.0%) |
Health & Disability in Seneca Gardens
Health Insurance Coverage by Age in Seneca Gardens
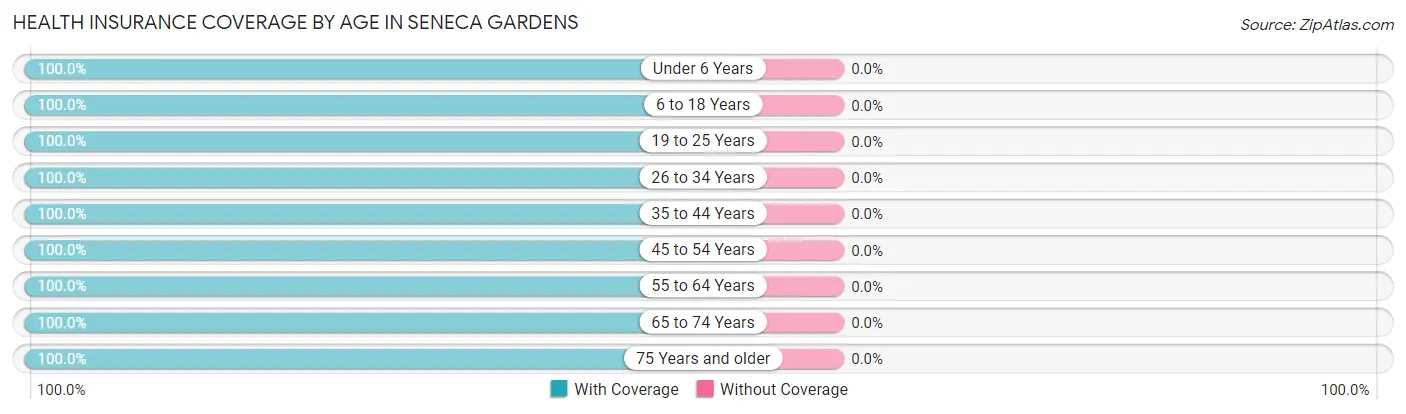
| Age Bracket | With Coverage | Without Coverage |
| Under 6 Years | 33 (100.0%) | 0 (0.0%) |
| 6 to 18 Years | 97 (100.0%) | 0 (0.0%) |
| 19 to 25 Years | 19 (100.0%) | 0 (0.0%) |
| 26 to 34 Years | 35 (100.0%) | 0 (0.0%) |
| 35 to 44 Years | 71 (100.0%) | 0 (0.0%) |
| 45 to 54 Years | 87 (100.0%) | 0 (0.0%) |
| 55 to 64 Years | 75 (100.0%) | 0 (0.0%) |
| 65 to 74 Years | 111 (100.0%) | 0 (0.0%) |
| 75 Years and older | 42 (100.0%) | 0 (0.0%) |
| Total | 570 (100.0%) | 0 (0.0%) |
Health Insurance Coverage by Citizenship Status in Seneca Gardens
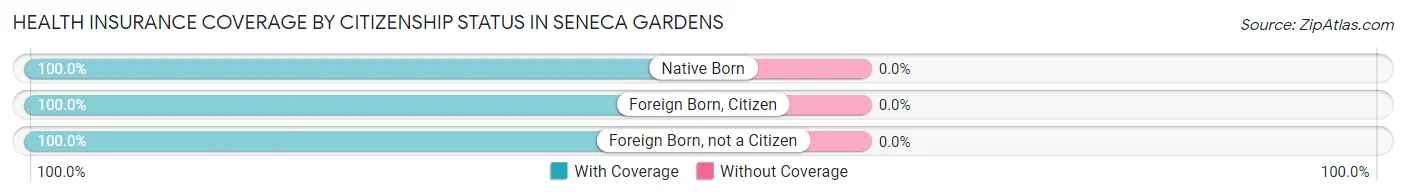
| Citizenship Status | With Coverage | Without Coverage |
| Native Born | 33 (100.0%) | 0 (0.0%) |
| Foreign Born, Citizen | 97 (100.0%) | 0 (0.0%) |
| Foreign Born, not a Citizen | 19 (100.0%) | 0 (0.0%) |
Health Insurance Coverage by Household Income in Seneca Gardens
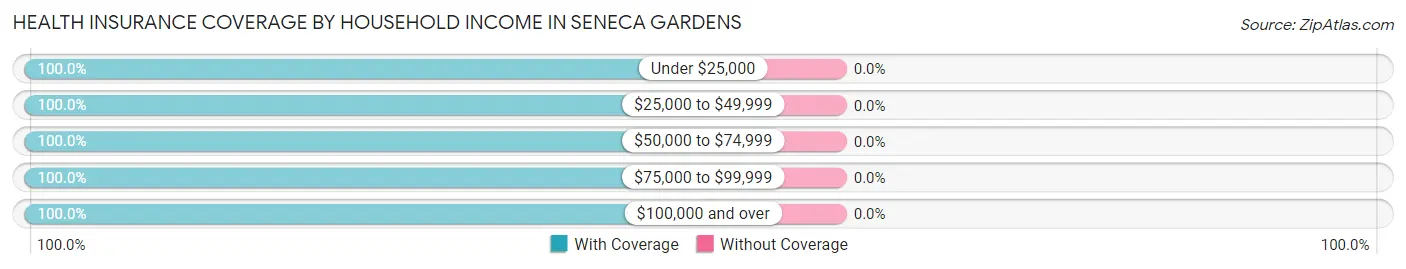
| Household Income | With Coverage | Without Coverage |
| Under $25,000 | 13 (100.0%) | 0 (0.0%) |
| $25,000 to $49,999 | 74 (100.0%) | 0 (0.0%) |
| $50,000 to $74,999 | 64 (100.0%) | 0 (0.0%) |
| $75,000 to $99,999 | 49 (100.0%) | 0 (0.0%) |
| $100,000 and over | 370 (100.0%) | 0 (0.0%) |
Public vs Private Health Insurance Coverage by Age in Seneca Gardens
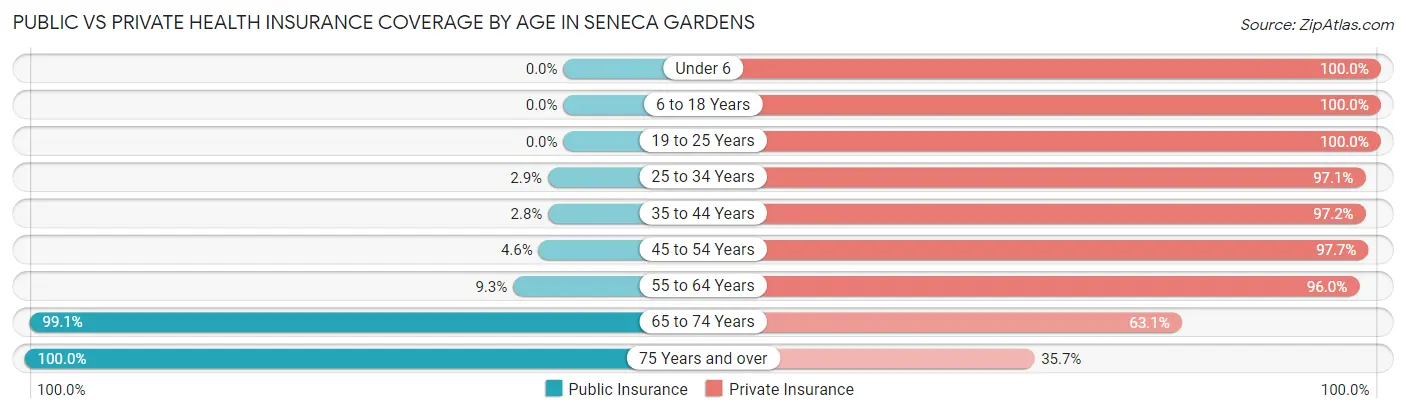
| Age Bracket | Public Insurance | Private Insurance |
| Under 6 | 0 (0.0%) | 33 (100.0%) |
| 6 to 18 Years | 0 (0.0%) | 97 (100.0%) |
| 19 to 25 Years | 0 (0.0%) | 19 (100.0%) |
| 25 to 34 Years | 1 (2.9%) | 34 (97.1%) |
| 35 to 44 Years | 2 (2.8%) | 69 (97.2%) |
| 45 to 54 Years | 4 (4.6%) | 85 (97.7%) |
| 55 to 64 Years | 7 (9.3%) | 72 (96.0%) |
| 65 to 74 Years | 110 (99.1%) | 70 (63.1%) |
| 75 Years and over | 42 (100.0%) | 15 (35.7%) |
| Total | 166 (29.1%) | 494 (86.7%) |
Disability Status by Sex by Age in Seneca Gardens
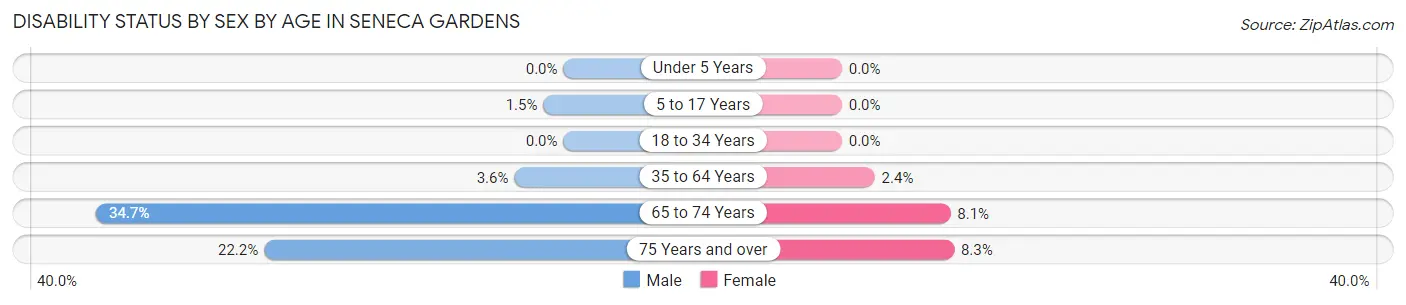
| Age Bracket | Male | Female |
| Under 5 Years | 0 (0.0%) | 0 (0.0%) |
| 5 to 17 Years | 1 (1.5%) | 0 (0.0%) |
| 18 to 34 Years | 0 (0.0%) | 0 (0.0%) |
| 35 to 64 Years | 4 (3.6%) | 3 (2.4%) |
| 65 to 74 Years | 17 (34.7%) | 5 (8.1%) |
| 75 Years and over | 4 (22.2%) | 2 (8.3%) |
Disability Class by Sex by Age in Seneca Gardens
Disability Class: Hearing Difficulty
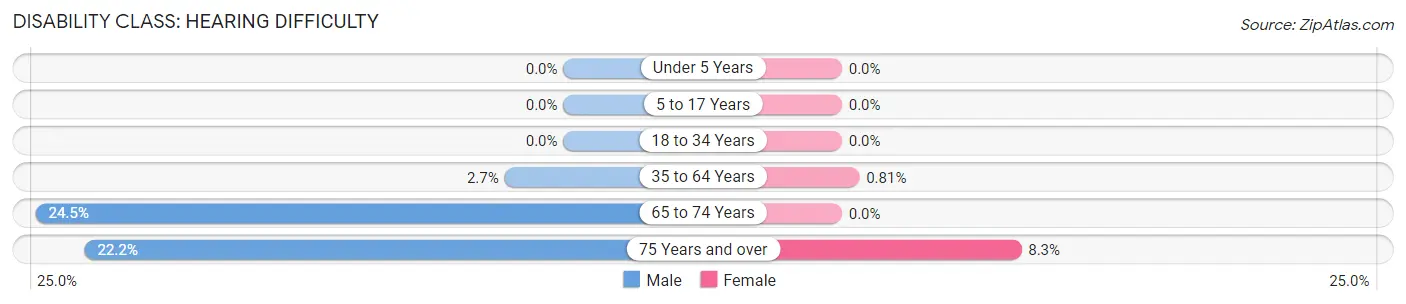
| Age Bracket | Male | Female |
| Under 5 Years | 0 (0.0%) | 0 (0.0%) |
| 5 to 17 Years | 0 (0.0%) | 0 (0.0%) |
| 18 to 34 Years | 0 (0.0%) | 0 (0.0%) |
| 35 to 64 Years | 3 (2.7%) | 1 (0.8%) |
| 65 to 74 Years | 12 (24.5%) | 0 (0.0%) |
| 75 Years and over | 4 (22.2%) | 2 (8.3%) |
Disability Class: Vision Difficulty
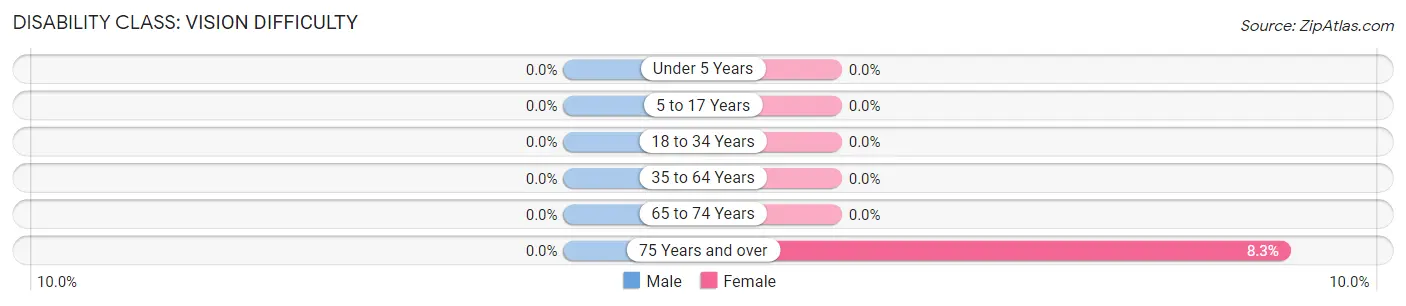
| Age Bracket | Male | Female |
| Under 5 Years | 0 (0.0%) | 0 (0.0%) |
| 5 to 17 Years | 0 (0.0%) | 0 (0.0%) |
| 18 to 34 Years | 0 (0.0%) | 0 (0.0%) |
| 35 to 64 Years | 0 (0.0%) | 0 (0.0%) |
| 65 to 74 Years | 0 (0.0%) | 0 (0.0%) |
| 75 Years and over | 0 (0.0%) | 2 (8.3%) |
Disability Class: Cognitive Difficulty
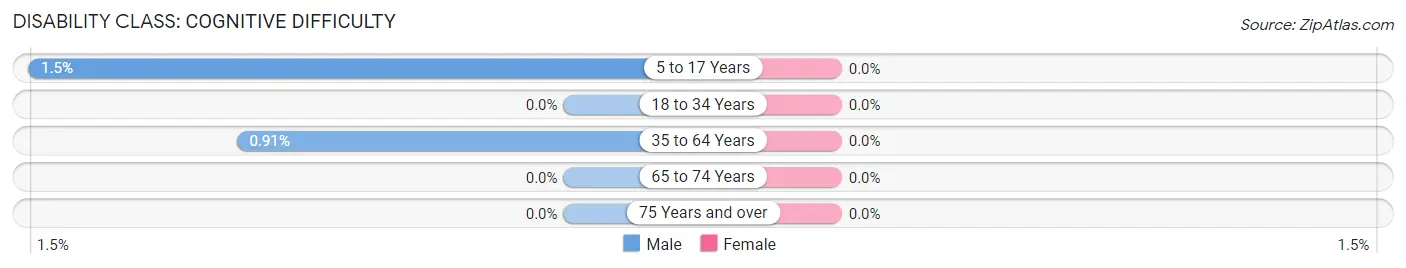
| Age Bracket | Male | Female |
| 5 to 17 Years | 1 (1.5%) | 0 (0.0%) |
| 18 to 34 Years | 0 (0.0%) | 0 (0.0%) |
| 35 to 64 Years | 1 (0.9%) | 0 (0.0%) |
| 65 to 74 Years | 0 (0.0%) | 0 (0.0%) |
| 75 Years and over | 0 (0.0%) | 0 (0.0%) |
Disability Class: Ambulatory Difficulty
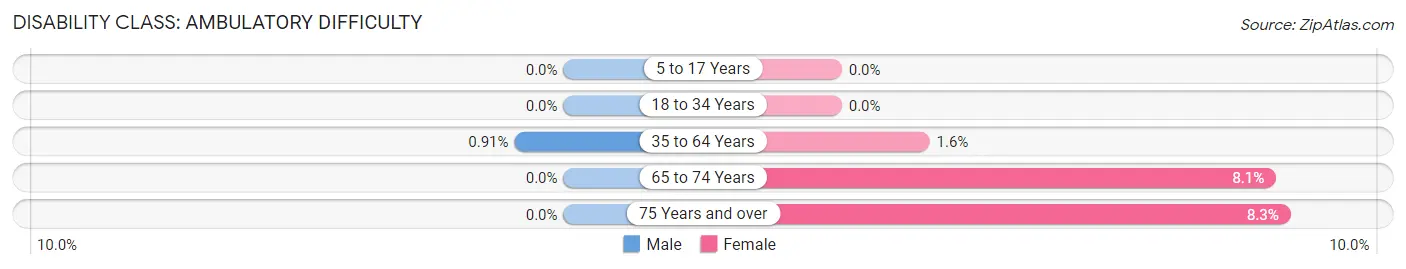
| Age Bracket | Male | Female |
| 5 to 17 Years | 0 (0.0%) | 0 (0.0%) |
| 18 to 34 Years | 0 (0.0%) | 0 (0.0%) |
| 35 to 64 Years | 1 (0.9%) | 2 (1.6%) |
| 65 to 74 Years | 0 (0.0%) | 5 (8.1%) |
| 75 Years and over | 0 (0.0%) | 2 (8.3%) |
Disability Class: Self-Care Difficulty
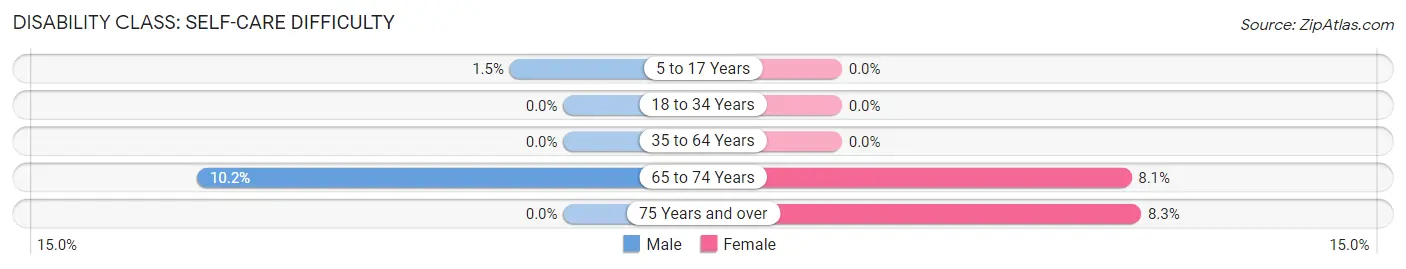
| Age Bracket | Male | Female |
| 5 to 17 Years | 1 (1.5%) | 0 (0.0%) |
| 18 to 34 Years | 0 (0.0%) | 0 (0.0%) |
| 35 to 64 Years | 0 (0.0%) | 0 (0.0%) |
| 65 to 74 Years | 5 (10.2%) | 5 (8.1%) |
| 75 Years and over | 0 (0.0%) | 2 (8.3%) |
Technology Access in Seneca Gardens
Computing Device Access in Seneca Gardens
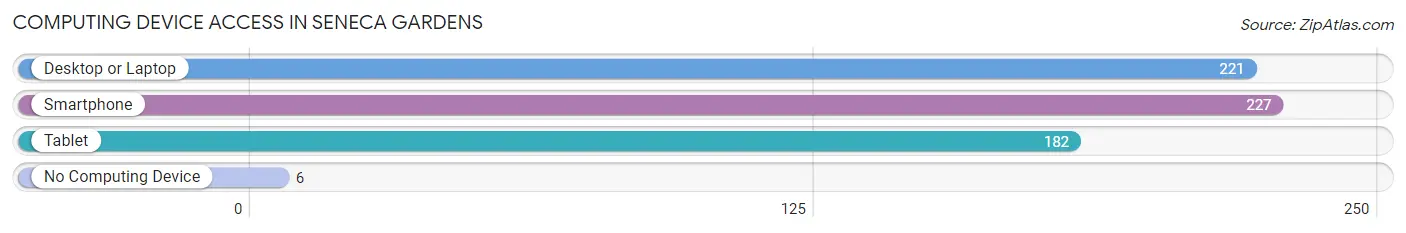
| Device Type | # Households | % Households |
| Desktop or Laptop | 221 | 92.9% |
| Smartphone | 227 | 95.4% |
| Tablet | 182 | 76.5% |
| No Computing Device | 6 | 2.5% |
| Total | 238 | 100.0% |
Internet Access in Seneca Gardens
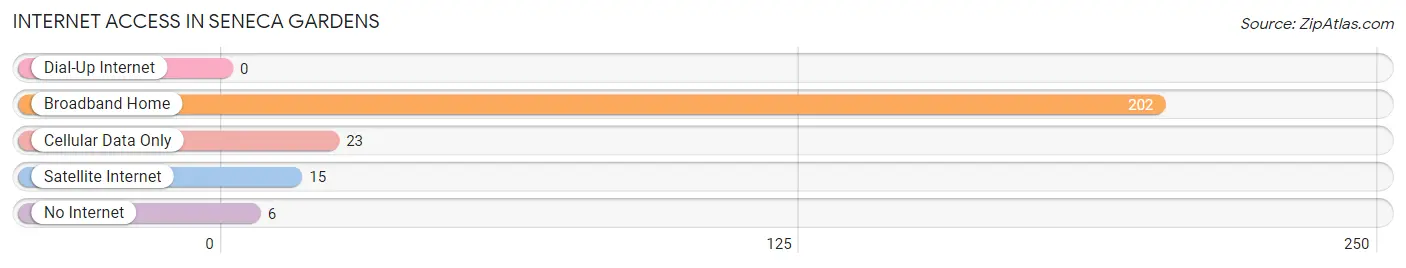
| Internet Type | # Households | % Households |
| Dial-Up Internet | 0 | 0.0% |
| Broadband Home | 202 | 84.9% |
| Cellular Data Only | 23 | 9.7% |
| Satellite Internet | 15 | 6.3% |
| No Internet | 6 | 2.5% |
| Total | 238 | 100.0% |
Seneca Gardens Summary
Seneca Gardens is a small, unincorporated community located in Jefferson County, Kentucky. It is situated just east of the city of Louisville and is bordered by the cities of St. Matthews and Lyndon. The community is home to approximately 1,000 people and is part of the Louisville Metro area.
History
Seneca Gardens was founded in the early 1900s by a group of German immigrants who had settled in the area. The community was named after the Seneca Indians, who had once lived in the area. The original settlers were farmers and the community was largely agricultural until the 1950s.
In the 1950s, the area began to experience rapid growth as the city of Louisville expanded. This growth was fueled by the construction of the Watterson Expressway, which connected Louisville to the suburbs. As a result, Seneca Gardens began to experience an influx of new residents.
The community was officially incorporated in 1959 and has since become a popular residential area. The population of Seneca Gardens has grown steadily over the years and is now home to approximately 1,000 people.
Geography
Seneca Gardens is located in Jefferson County, Kentucky. It is situated just east of the city of Louisville and is bordered by the cities of St. Matthews and Lyndon. The community is located in the heart of the Louisville Metro area and is just a few miles from downtown Louisville.
The area is characterized by rolling hills and lush green spaces. The community is home to several parks, including Seneca Park, which is located just south of the community. The park features a lake, walking trails, and a variety of recreational activities.
Economy
Seneca Gardens is primarily a residential community, but it does have a few businesses. The community is home to a variety of small businesses, including restaurants, retail stores, and professional services. The community is also home to a number of medical facilities, including a hospital and several clinics.
The community is served by the Louisville Metro area, which has a strong economy and a diverse range of industries. The city of Louisville is home to several Fortune 500 companies, including Brown-Forman, Humana, and Yum! Brands. The city is also home to a number of universities and colleges, including the University of Louisville and Bellarmine University.
Demographics
As of the 2010 census, the population of Seneca Gardens was 1,000. The racial makeup of the community was 94.2% White, 2.2% African American, 0.7% Asian, 0.3% Native American, and 2.6% from other races. The median household income was $50,000 and the median home value was $150,000.
Seneca Gardens is a diverse community with a variety of cultures and backgrounds. The community is home to a large number of immigrants, including those from Mexico, India, and China. The community is also home to a large number of young professionals and families.
Conclusion
Seneca Gardens is a small, unincorporated community located in Jefferson County, Kentucky. It is situated just east of the city of Louisville and is bordered by the cities of St. Matthews and Lyndon. The community is home to approximately 1,000 people and is part of the Louisville Metro area. The area is characterized by rolling hills and lush green spaces and is home to several parks. The community is primarily residential, but it does have a few businesses. The population of Seneca Gardens is diverse and is home to a variety of cultures and backgrounds. The median household income is $50,000 and the median home value is $150,000.
Common Questions
What is Per Capita Income in Seneca Gardens?
Per Capita income in Seneca Gardens is $75,578.
What is the Median Family Income in Seneca Gardens?
Median Family Income in Seneca Gardens is $136,875.
What is the Median Household income in Seneca Gardens?
Median Household Income in Seneca Gardens is $118,929.
What is Income or Wage Gap in Seneca Gardens?
Income or Wage Gap in Seneca Gardens is 5.5%.
Women in Seneca Gardens earn 94.5 cents for every dollar earned by a man.
What is Inequality or Gini Index in Seneca Gardens?
Inequality or Gini Index in Seneca Gardens is 0.44.
What is the Total Population of Seneca Gardens?
Total Population of Seneca Gardens is 570.
What is the Total Male Population of Seneca Gardens?
Total Male Population of Seneca Gardens is 288.
What is the Total Female Population of Seneca Gardens?
Total Female Population of Seneca Gardens is 282.
What is the Ratio of Males per 100 Females in Seneca Gardens?
There are 102.13 Males per 100 Females in Seneca Gardens.
What is the Ratio of Females per 100 Males in Seneca Gardens?
There are 97.92 Females per 100 Males in Seneca Gardens.
What is the Median Population Age in Seneca Gardens?
Median Population Age in Seneca Gardens is 49.2 Years.
What is the Average Family Size in Seneca Gardens
Average Family Size in Seneca Gardens is 2.8 People.
What is the Average Household Size in Seneca Gardens
Average Household Size in Seneca Gardens is 2.4 People.
How Large is the Labor Force in Seneca Gardens?
There are 288 People in the Labor Forcein in Seneca Gardens.
What is the Percentage of People in the Labor Force in Seneca Gardens?
60.8% of People are in the Labor Force in Seneca Gardens.
What is the Unemployment Rate in Seneca Gardens?
Unemployment Rate in Seneca Gardens is 0.3%.