Middletown, KY Map & Demographics
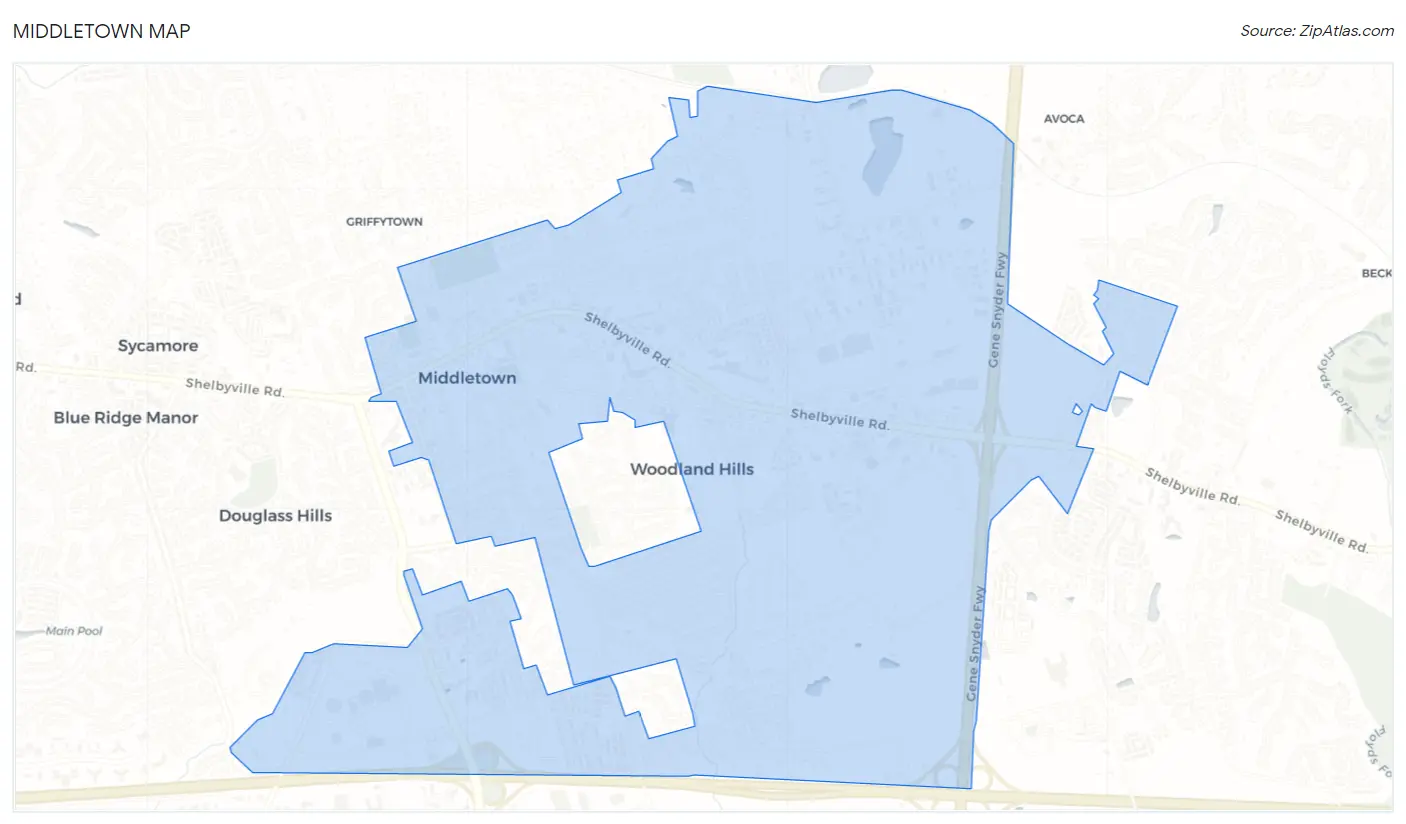
Middletown Map
Middletown Overview
$48,054
PER CAPITA INCOME
$106,828
AVG FAMILY INCOME
$81,881
AVG HOUSEHOLD INCOME
35.6%
WAGE / INCOME GAP [ % ]
64.4¢/ $1
WAGE / INCOME GAP [ $ ]
0.44
INEQUALITY / GINI INDEX
9,594
TOTAL POPULATION
4,632
MALE POPULATION
4,962
FEMALE POPULATION
93.35
MALES / 100 FEMALES
107.12
FEMALES / 100 MALES
46.4
MEDIAN AGE
2.8
AVG FAMILY SIZE
2.2
AVG HOUSEHOLD SIZE
4,930
LABOR FORCE [ PEOPLE ]
62.3%
PERCENT IN LABOR FORCE
5.6%
UNEMPLOYMENT RATE
Middletown Area Codes
Income in Middletown
Income Overview in Middletown
Per Capita Income in Middletown is $48,054, while median incomes of families and households are $106,828 and $81,881 respectively.
| Characteristic | Number | Measure |
| Per Capita Income | 9,594 | $48,054 |
| Median Family Income | 2,720 | $106,828 |
| Mean Family Income | 2,720 | $131,167 |
| Median Household Income | 4,307 | $81,881 |
| Mean Household Income | 4,307 | $105,695 |
| Income Deficit | 2,720 | $0 |
| Wage / Income Gap (%) | 9,594 | 35.58% |
| Wage / Income Gap ($) | 9,594 | 64.42¢ per $1 |
| Gini / Inequality Index | 9,594 | 0.44 |
Earnings by Sex in Middletown
Average Earnings in Middletown are $51,833, $64,155 for men and $41,326 for women, a difference of 35.6%.
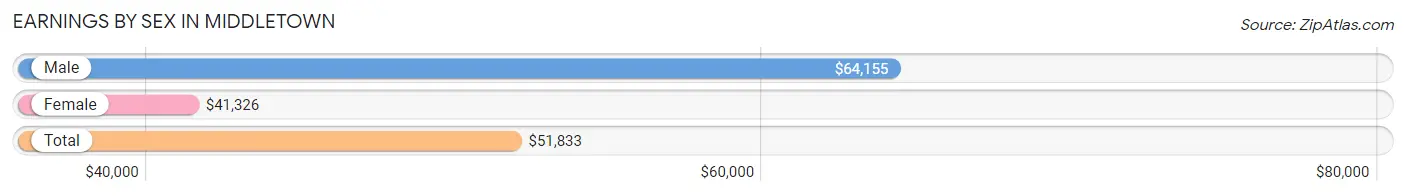
| Sex | Number | Average Earnings |
| Male | 2,851 (53.1%) | $64,155 |
| Female | 2,513 (46.9%) | $41,326 |
| Total | 5,364 (100.0%) | $51,833 |
Earnings by Sex by Income Bracket in Middletown
The most common earnings brackets in Middletown are $100,000+ for men (684 | 24.0%) and $100,000+ for women (342 | 13.6%).
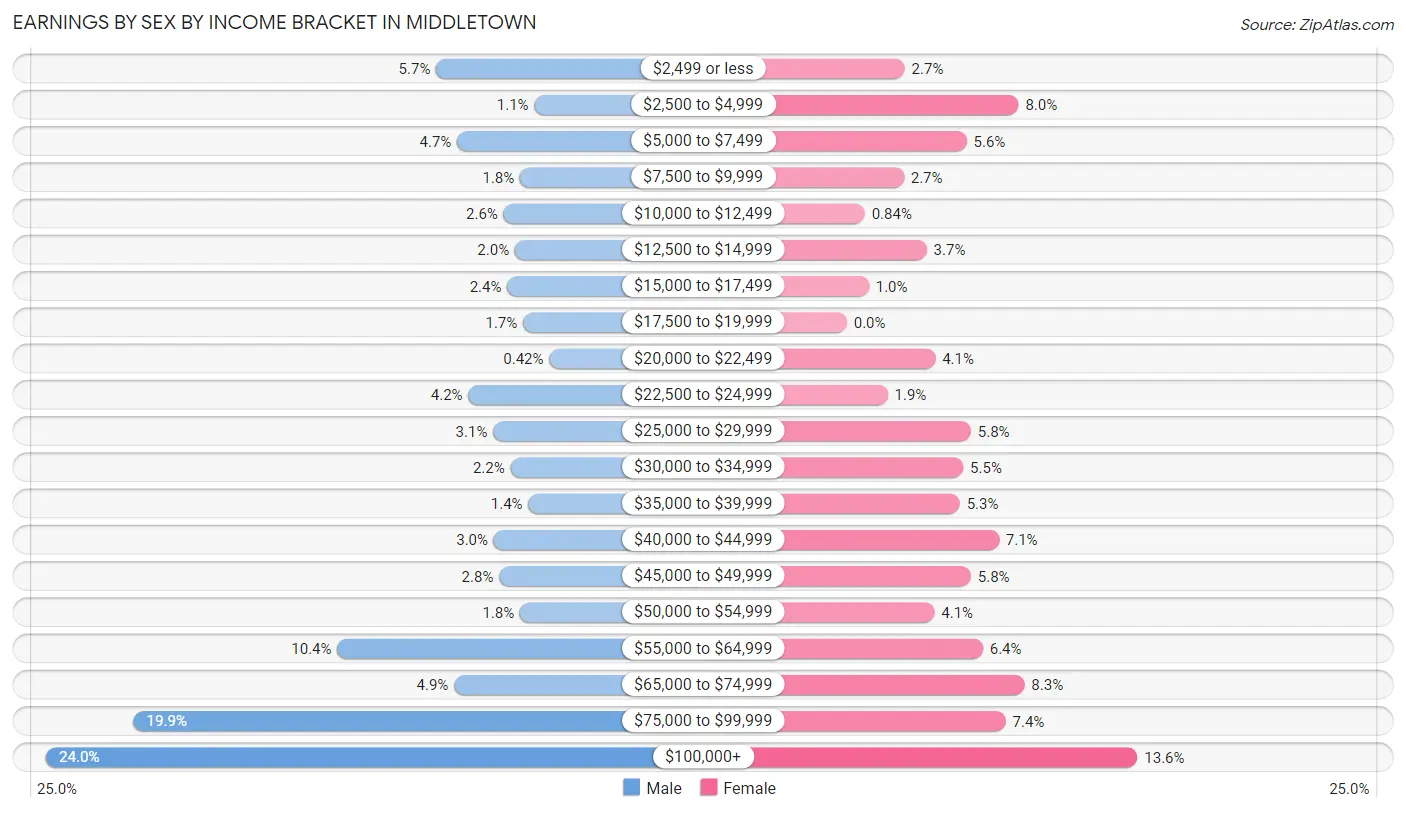
| Income | Male | Female |
| $2,499 or less | 163 (5.7%) | 68 (2.7%) |
| $2,500 to $4,999 | 32 (1.1%) | 202 (8.0%) |
| $5,000 to $7,499 | 135 (4.7%) | 141 (5.6%) |
| $7,500 to $9,999 | 51 (1.8%) | 67 (2.7%) |
| $10,000 to $12,499 | 73 (2.6%) | 21 (0.8%) |
| $12,500 to $14,999 | 58 (2.0%) | 94 (3.7%) |
| $15,000 to $17,499 | 68 (2.4%) | 26 (1.0%) |
| $17,500 to $19,999 | 47 (1.7%) | 0 (0.0%) |
| $20,000 to $22,499 | 12 (0.4%) | 104 (4.1%) |
| $22,500 to $24,999 | 120 (4.2%) | 48 (1.9%) |
| $25,000 to $29,999 | 87 (3.0%) | 146 (5.8%) |
| $30,000 to $34,999 | 64 (2.2%) | 137 (5.4%) |
| $35,000 to $39,999 | 40 (1.4%) | 133 (5.3%) |
| $40,000 to $44,999 | 86 (3.0%) | 179 (7.1%) |
| $45,000 to $49,999 | 79 (2.8%) | 146 (5.8%) |
| $50,000 to $54,999 | 51 (1.8%) | 103 (4.1%) |
| $55,000 to $64,999 | 295 (10.3%) | 160 (6.4%) |
| $65,000 to $74,999 | 139 (4.9%) | 209 (8.3%) |
| $75,000 to $99,999 | 567 (19.9%) | 187 (7.4%) |
| $100,000+ | 684 (24.0%) | 342 (13.6%) |
| Total | 2,851 (100.0%) | 2,513 (100.0%) |
Earnings by Sex by Educational Attainment in Middletown
Average earnings in Middletown are $72,411 for men and $47,021 for women, a difference of 35.1%. Men with an educational attainment of graduate degree enjoy the highest average annual earnings of $95,110, while those with college or associate's degree education earn the least with $46,184. Women with an educational attainment of bachelor's degree earn the most with the average annual earnings of $64,167, while those with high school diploma education have the smallest earnings of $24,792.
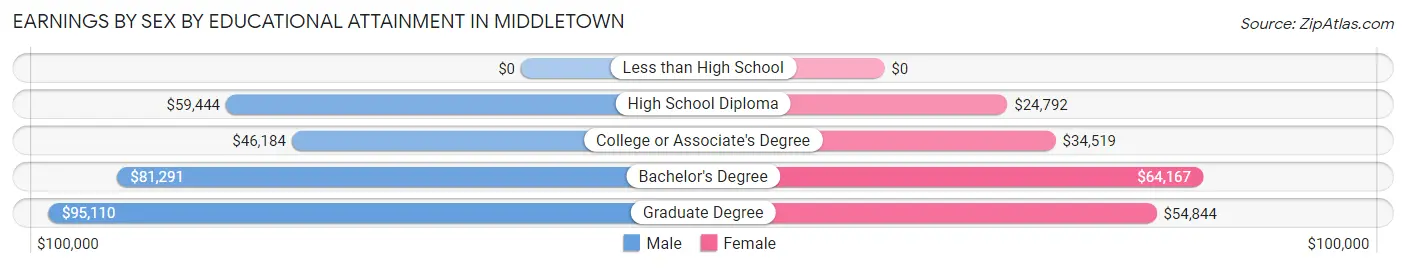
| Educational Attainment | Male Income | Female Income |
| Less than High School | - | - |
| High School Diploma | $59,444 | $24,792 |
| College or Associate's Degree | $46,184 | $34,519 |
| Bachelor's Degree | $81,291 | $64,167 |
| Graduate Degree | $95,110 | $54,844 |
| Total | $72,411 | $47,021 |
Family Income in Middletown
Family Income Brackets in Middletown
According to the Middletown family income data, there are 666 families falling into the $100,000 to $149,999 income range, which is the most common income bracket and makes up 24.5% of all families. Conversely, the $10,000 to $14,999 income bracket is the least frequent group with only 30 families (1.1%) belonging to this category.
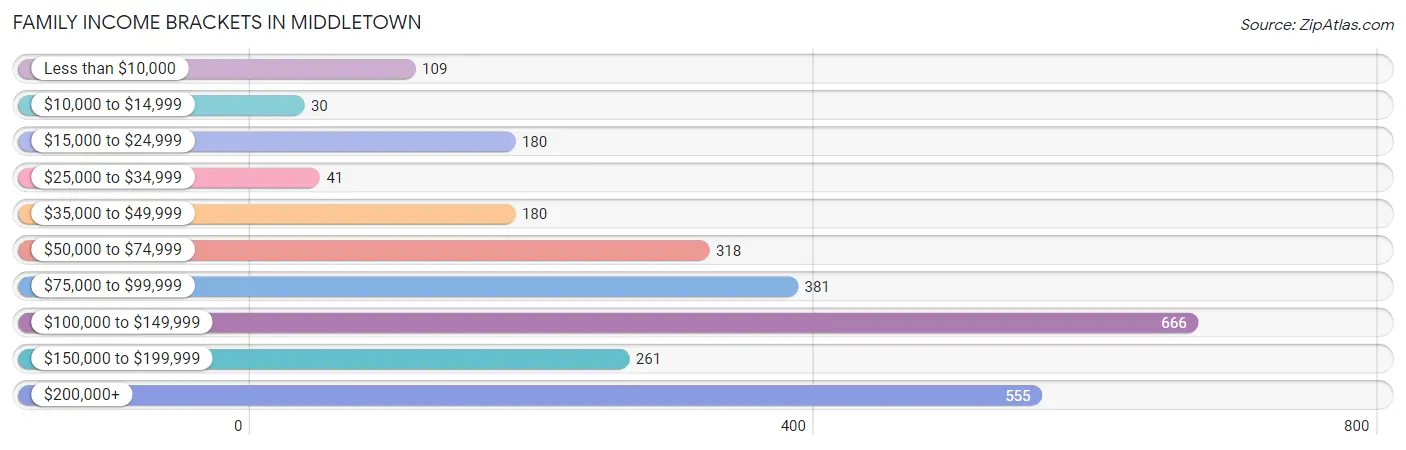
| Income Bracket | # Families | % Families |
| Less than $10,000 | 109 | 4.0% |
| $10,000 to $14,999 | 30 | 1.1% |
| $15,000 to $24,999 | 180 | 6.6% |
| $25,000 to $34,999 | 41 | 1.5% |
| $35,000 to $49,999 | 180 | 6.6% |
| $50,000 to $74,999 | 318 | 11.7% |
| $75,000 to $99,999 | 381 | 14.0% |
| $100,000 to $149,999 | 666 | 24.5% |
| $150,000 to $199,999 | 261 | 9.6% |
| $200,000+ | 555 | 20.4% |
Family Income by Famaliy Size in Middletown
6-person families (39 | 1.4%) account for the highest median family income in Middletown with $178,365 per family, while 2-person families (1,495 | 55.0%) have the highest median income of $47,196 per family member.
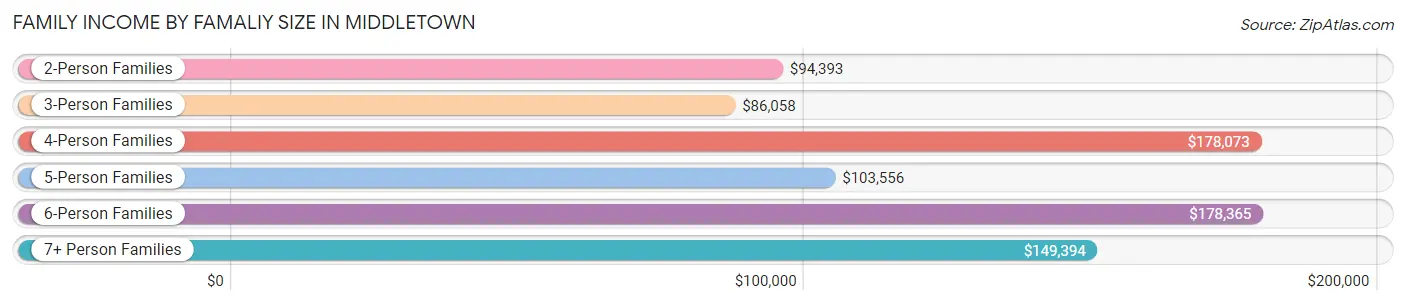
| Income Bracket | # Families | Median Income |
| 2-Person Families | 1,495 (55.0%) | $94,393 |
| 3-Person Families | 635 (23.4%) | $86,058 |
| 4-Person Families | 375 (13.8%) | $178,073 |
| 5-Person Families | 126 (4.6%) | $103,556 |
| 6-Person Families | 39 (1.4%) | $178,365 |
| 7+ Person Families | 50 (1.8%) | $149,394 |
| Total | 2,720 (100.0%) | $106,828 |
Family Income by Number of Earners in Middletown
The median family income in Middletown is $106,828, with families comprising 3+ earners (265) having the highest median family income of $149,361, while families with no earners (425) have the lowest median family income of $65,038, accounting for 9.7% and 15.6% of families, respectively.
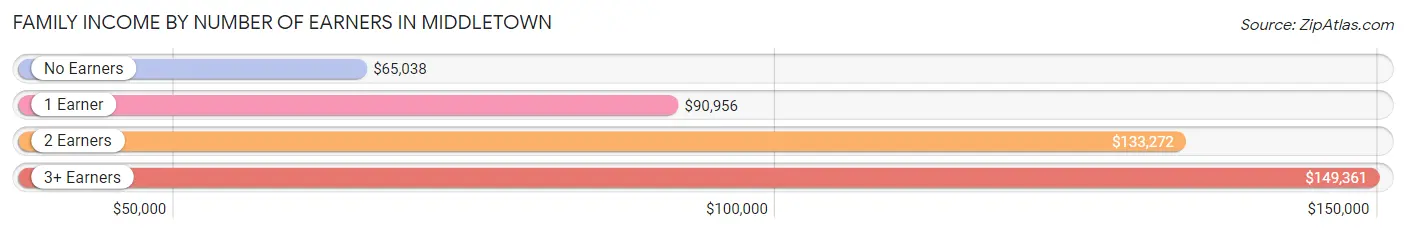
| Number of Earners | # Families | Median Income |
| No Earners | 425 (15.6%) | $65,038 |
| 1 Earner | 727 (26.7%) | $90,956 |
| 2 Earners | 1,303 (47.9%) | $133,272 |
| 3+ Earners | 265 (9.7%) | $149,361 |
| Total | 2,720 (100.0%) | $106,828 |
Household Income in Middletown
Household Income Brackets in Middletown
With 814 households falling in the category, the $100,000 to $149,999 income range is the most frequent in Middletown, accounting for 18.9% of all households. In contrast, only 90 households (2.1%) fall into the $10,000 to $14,999 income bracket, making it the least populous group.
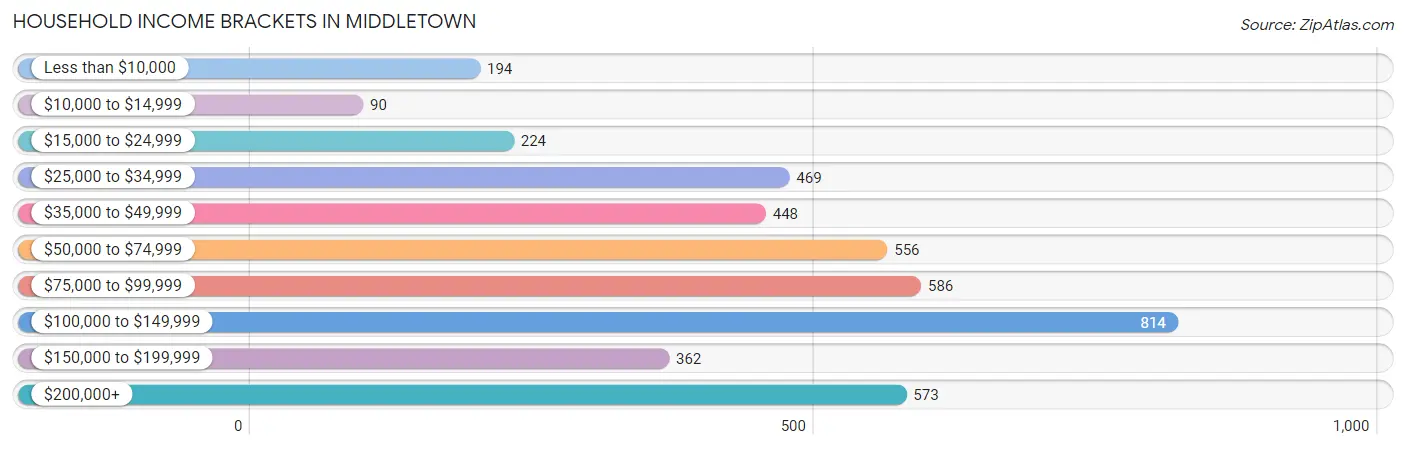
| Income Bracket | # Households | % Households |
| Less than $10,000 | 194 | 4.5% |
| $10,000 to $14,999 | 90 | 2.1% |
| $15,000 to $24,999 | 224 | 5.2% |
| $25,000 to $34,999 | 469 | 10.9% |
| $35,000 to $49,999 | 448 | 10.4% |
| $50,000 to $74,999 | 556 | 12.9% |
| $75,000 to $99,999 | 586 | 13.6% |
| $100,000 to $149,999 | 814 | 18.9% |
| $150,000 to $199,999 | 362 | 8.4% |
| $200,000+ | 573 | 13.3% |
Household Income by Householder Age in Middletown
The median household income in Middletown is $81,881, with the highest median household income of $98,669 found in the 25 to 44 years age bracket for the primary householder. A total of 1,214 households (28.2%) fall into this category. Meanwhile, the 15 to 24 years age bracket for the primary householder has the lowest median household income of $34,655, with 72 households (1.7%) in this group.
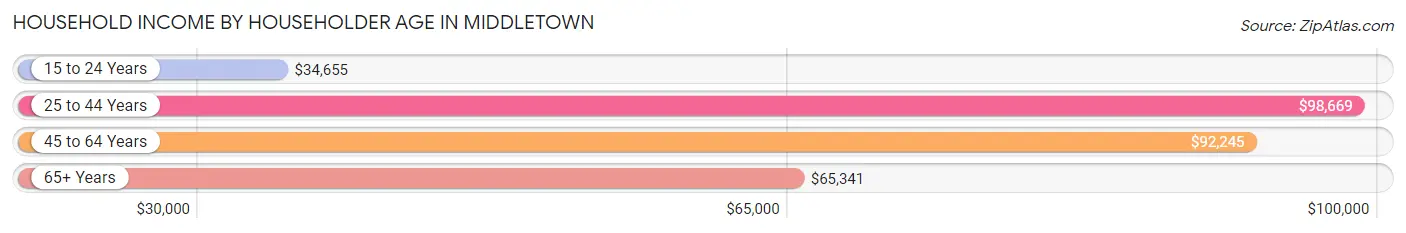
| Income Bracket | # Households | Median Income |
| 15 to 24 Years | 72 (1.7%) | $34,655 |
| 25 to 44 Years | 1,214 (28.2%) | $98,669 |
| 45 to 64 Years | 1,692 (39.3%) | $92,245 |
| 65+ Years | 1,329 (30.9%) | $65,341 |
| Total | 4,307 (100.0%) | $81,881 |
Poverty in Middletown
Income Below Poverty by Sex and Age in Middletown
With 6.0% poverty level for males and 11.1% for females among the residents of Middletown, under 5 year old males and 5 year old females are the most vulnerable to poverty, with 67 males (20.0%) and 68 females (73.1%) in their respective age groups living below the poverty level.
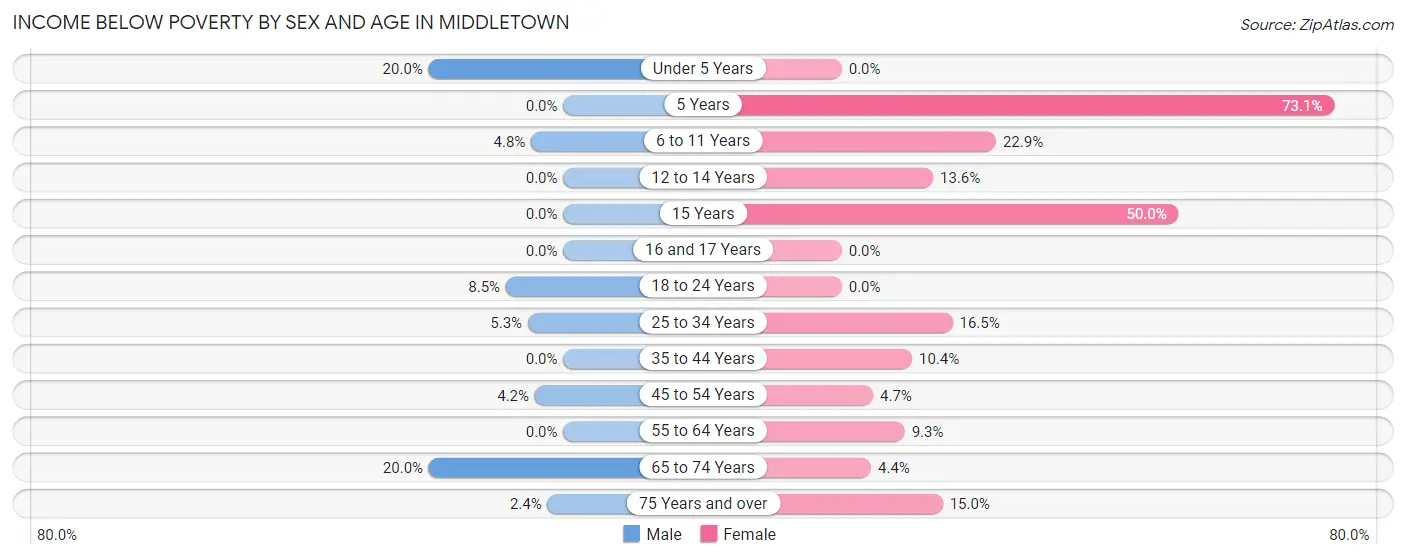
| Age Bracket | Male | Female |
| Under 5 Years | 67 (20.0%) | 0 (0.0%) |
| 5 Years | 0 (0.0%) | 68 (73.1%) |
| 6 to 11 Years | 12 (4.8%) | 71 (22.9%) |
| 12 to 14 Years | 0 (0.0%) | 16 (13.6%) |
| 15 Years | 0 (0.0%) | 17 (50.0%) |
| 16 and 17 Years | 0 (0.0%) | 0 (0.0%) |
| 18 to 24 Years | 29 (8.5%) | 0 (0.0%) |
| 25 to 34 Years | 25 (5.3%) | 125 (16.5%) |
| 35 to 44 Years | 0 (0.0%) | 39 (10.4%) |
| 45 to 54 Years | 26 (4.2%) | 33 (4.6%) |
| 55 to 64 Years | 0 (0.0%) | 59 (9.3%) |
| 65 to 74 Years | 105 (20.0%) | 29 (4.3%) |
| 75 Years and over | 11 (2.4%) | 92 (15.0%) |
| Total | 275 (6.0%) | 549 (11.1%) |
Income Above Poverty by Sex and Age in Middletown
According to the poverty statistics in Middletown, males aged 5 years and females aged under 5 years are the age groups that are most secure financially, with 100.0% of males and 100.0% of females in these age groups living above the poverty line.
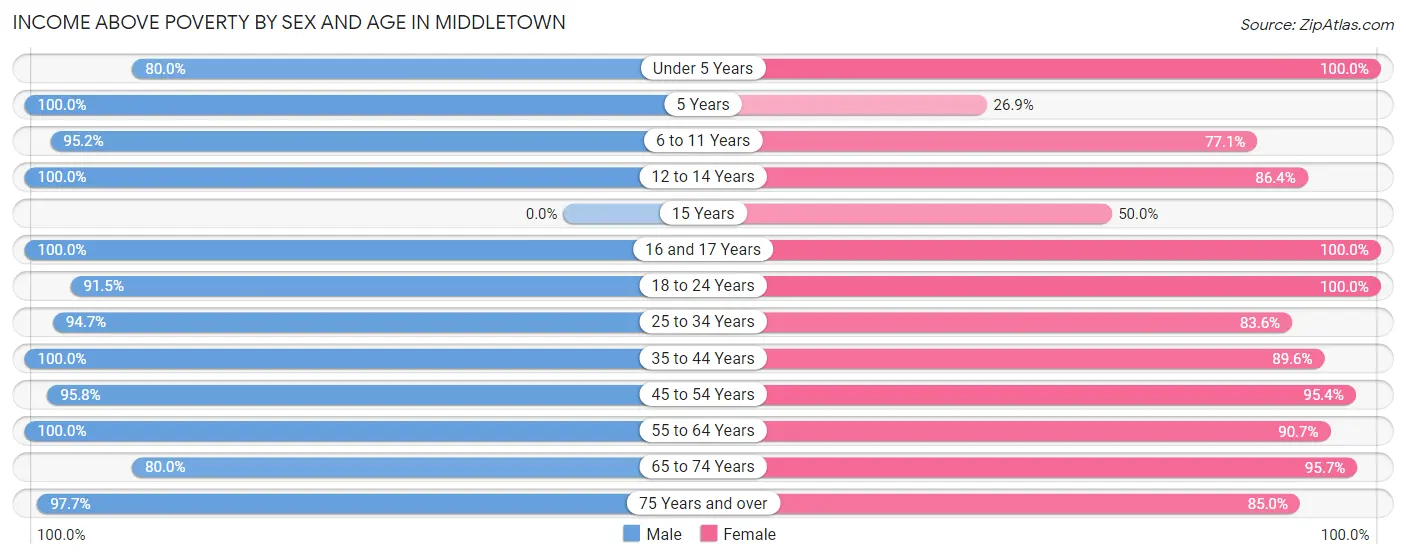
| Age Bracket | Male | Female |
| Under 5 Years | 268 (80.0%) | 176 (100.0%) |
| 5 Years | 42 (100.0%) | 25 (26.9%) |
| 6 to 11 Years | 239 (95.2%) | 239 (77.1%) |
| 12 to 14 Years | 265 (100.0%) | 102 (86.4%) |
| 15 Years | 0 (0.0%) | 17 (50.0%) |
| 16 and 17 Years | 74 (100.0%) | 104 (100.0%) |
| 18 to 24 Years | 311 (91.5%) | 358 (100.0%) |
| 25 to 34 Years | 450 (94.7%) | 635 (83.6%) |
| 35 to 44 Years | 533 (100.0%) | 335 (89.6%) |
| 45 to 54 Years | 588 (95.8%) | 676 (95.4%) |
| 55 to 64 Years | 667 (100.0%) | 573 (90.7%) |
| 65 to 74 Years | 421 (80.0%) | 637 (95.7%) |
| 75 Years and over | 457 (97.7%) | 522 (85.0%) |
| Total | 4,315 (94.0%) | 4,399 (88.9%) |
Income Below Poverty Among Married-Couple Families in Middletown
The poverty statistics for married-couple families in Middletown show that 3.0% or 59 of the total 1,989 families live below the poverty line. Families with no children have the highest poverty rate of 4.5%, comprising of 59 families. On the other hand, families with 1 or 2 children have the lowest poverty rate of 0.0%, which includes 0 families.
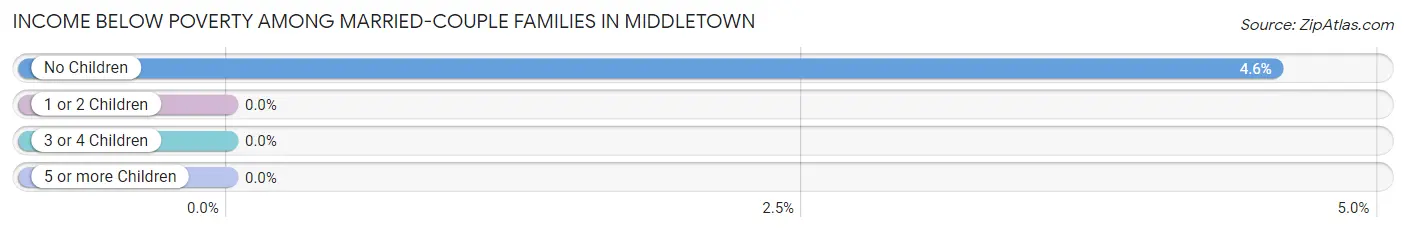
| Children | Above Poverty | Below Poverty |
| No Children | 1,238 (95.5%) | 59 (4.5%) |
| 1 or 2 Children | 500 (100.0%) | 0 (0.0%) |
| 3 or 4 Children | 192 (100.0%) | 0 (0.0%) |
| 5 or more Children | 0 (0.0%) | 0 (0.0%) |
| Total | 1,930 (97.0%) | 59 (3.0%) |
Income Below Poverty Among Single-Parent Households in Middletown
According to the poverty data in Middletown, 14.0% or 27 single-father households and 23.6% or 127 single-mother households are living below the poverty line. Among single-father households, those with 1 or 2 children have the highest poverty rate, with 16 households (50.0%) experiencing poverty. Likewise, among single-mother households, those with 1 or 2 children have the highest poverty rate, with 127 households (54.7%) falling below the poverty line.
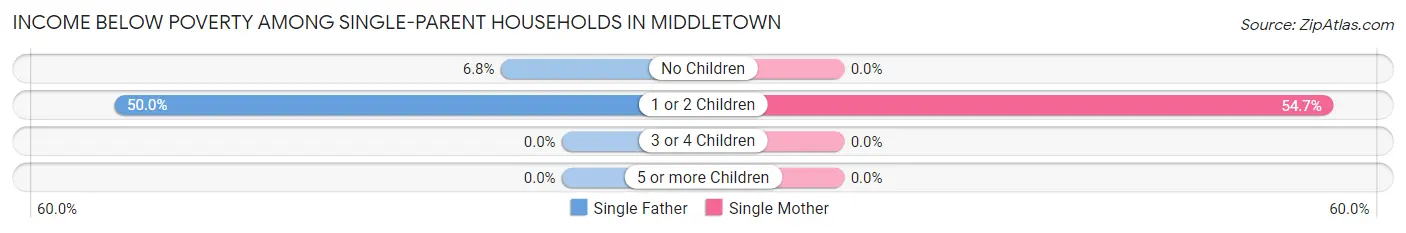
| Children | Single Father | Single Mother |
| No Children | 11 (6.8%) | 0 (0.0%) |
| 1 or 2 Children | 16 (50.0%) | 127 (54.7%) |
| 3 or 4 Children | 0 (0.0%) | 0 (0.0%) |
| 5 or more Children | 0 (0.0%) | 0 (0.0%) |
| Total | 27 (14.0%) | 127 (23.6%) |
Income Below Poverty Among Married-Couple vs Single-Parent Households in Middletown
The poverty data for Middletown shows that 59 of the married-couple family households (3.0%) and 154 of the single-parent households (21.1%) are living below the poverty level. Within the married-couple family households, those with no children have the highest poverty rate, with 59 households (4.5%) falling below the poverty line. Among the single-parent households, those with 1 or 2 children have the highest poverty rate, with 143 household (54.2%) living below poverty.
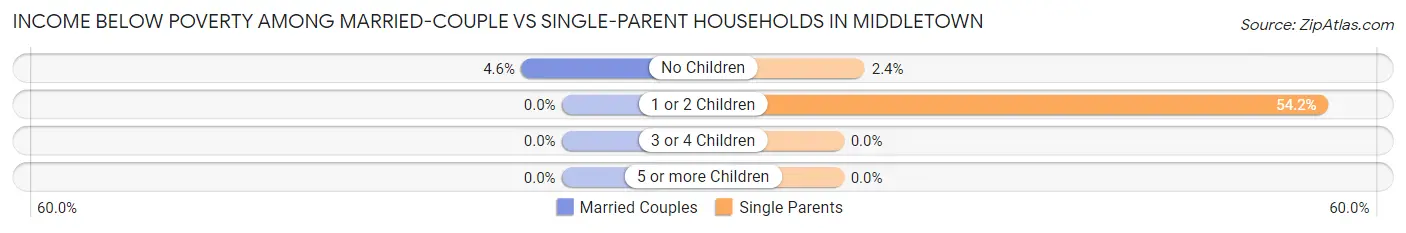
| Children | Married-Couple Families | Single-Parent Households |
| No Children | 59 (4.5%) | 11 (2.4%) |
| 1 or 2 Children | 0 (0.0%) | 143 (54.2%) |
| 3 or 4 Children | 0 (0.0%) | 0 (0.0%) |
| 5 or more Children | 0 (0.0%) | 0 (0.0%) |
| Total | 59 (3.0%) | 154 (21.1%) |
Race in Middletown
The most populous races in Middletown are White / Caucasian (7,762 | 80.9%), Black / African American (779 | 8.1%), and Asian (660 | 6.9%).
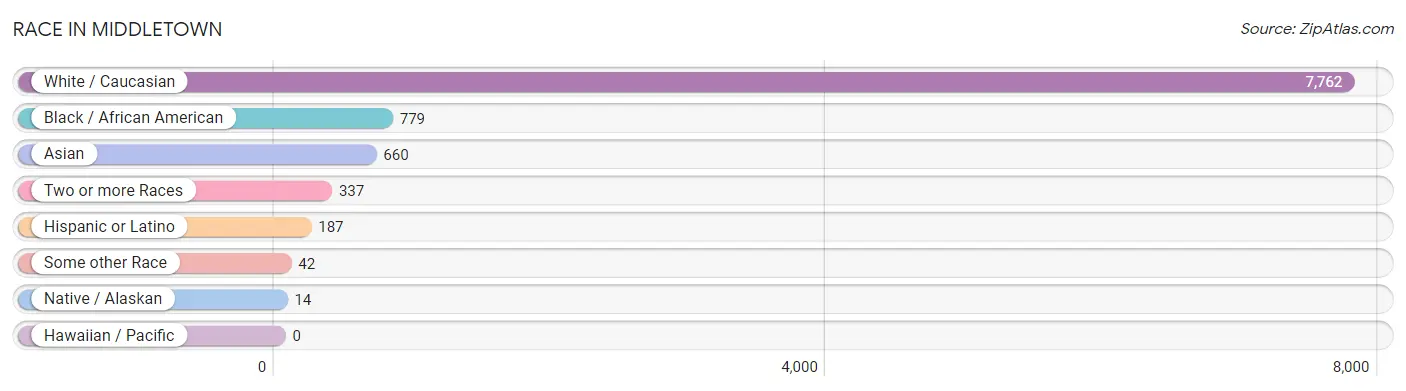
| Race | # Population | % Population |
| Asian | 660 | 6.9% |
| Black / African American | 779 | 8.1% |
| Hawaiian / Pacific | 0 | 0.0% |
| Hispanic or Latino | 187 | 1.9% |
| Native / Alaskan | 14 | 0.2% |
| White / Caucasian | 7,762 | 80.9% |
| Two or more Races | 337 | 3.5% |
| Some other Race | 42 | 0.4% |
| Total | 9,594 | 100.0% |
Ancestry in Middletown
The most populous ancestries reported in Middletown are English (1,853 | 19.3%), German (1,610 | 16.8%), Irish (1,423 | 14.8%), American (1,002 | 10.4%), and Thai (359 | 3.7%), together accounting for 65.1% of all Middletown residents.
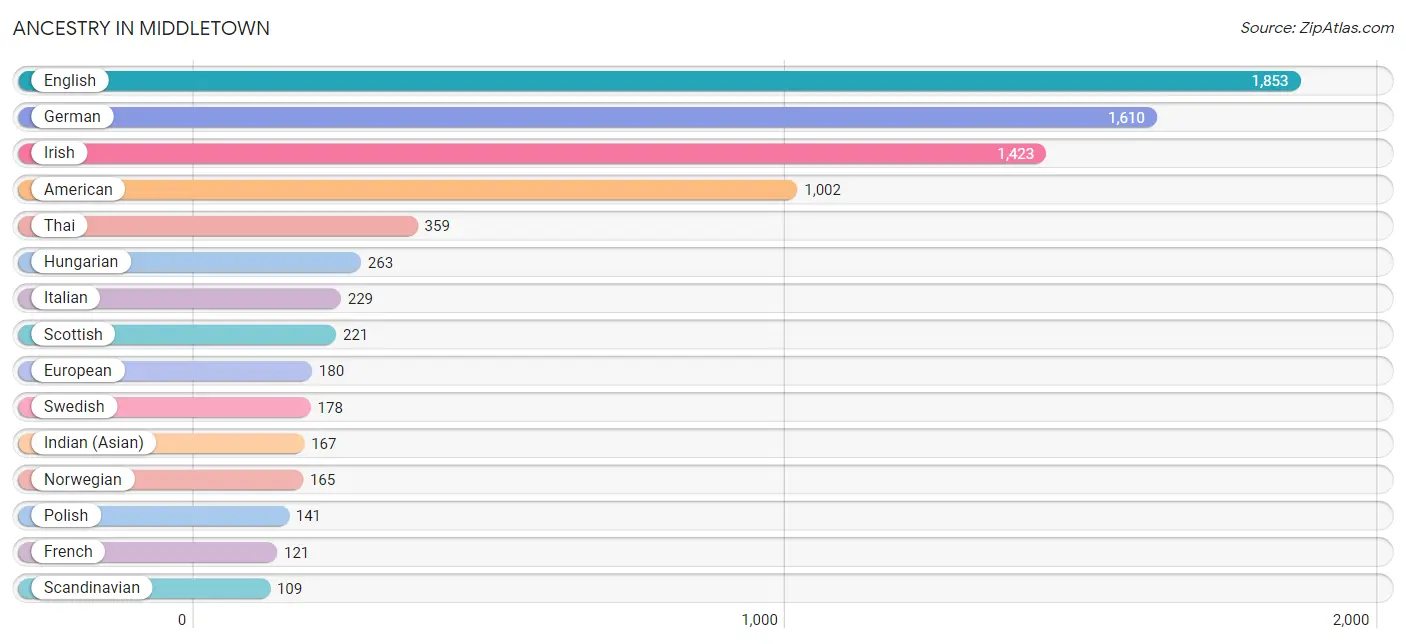
| Ancestry | # Population | % Population |
| Afghan | 19 | 0.2% |
| American | 1,002 | 10.4% |
| Arab | 101 | 1.1% |
| Austrian | 16 | 0.2% |
| Belgian | 9 | 0.1% |
| British | 69 | 0.7% |
| British West Indian | 21 | 0.2% |
| Burmese | 101 | 1.1% |
| Canadian | 10 | 0.1% |
| Central American Indian | 29 | 0.3% |
| Cherokee | 14 | 0.2% |
| Croatian | 53 | 0.5% |
| Cuban | 44 | 0.5% |
| Dutch | 94 | 1.0% |
| Eastern European | 11 | 0.1% |
| English | 1,853 | 19.3% |
| European | 180 | 1.9% |
| French | 121 | 1.3% |
| French Canadian | 18 | 0.2% |
| German | 1,610 | 16.8% |
| Hungarian | 263 | 2.7% |
| Indian (Asian) | 167 | 1.7% |
| Iranian | 16 | 0.2% |
| Iraqi | 10 | 0.1% |
| Irish | 1,423 | 14.8% |
| Italian | 229 | 2.4% |
| Korean | 27 | 0.3% |
| Lithuanian | 14 | 0.2% |
| Mexican | 15 | 0.2% |
| Nigerian | 59 | 0.6% |
| Northern European | 44 | 0.5% |
| Norwegian | 165 | 1.7% |
| Peruvian | 52 | 0.5% |
| Polish | 141 | 1.5% |
| Puerto Rican | 76 | 0.8% |
| Scandinavian | 109 | 1.1% |
| Scotch-Irish | 82 | 0.9% |
| Scottish | 221 | 2.3% |
| Slovene | 26 | 0.3% |
| South American | 52 | 0.5% |
| Sri Lankan | 70 | 0.7% |
| Subsaharan African | 59 | 0.6% |
| Swedish | 178 | 1.9% |
| Swiss | 102 | 1.1% |
| Thai | 359 | 3.7% |
| Welsh | 34 | 0.4% |
| West Indian | 14 | 0.2% | View All 47 Rows |
Immigrants in Middletown
The most numerous immigrant groups reported in Middletown came from Asia (596 | 6.2%), South Central Asia (284 | 3.0%), India (249 | 2.6%), South Eastern Asia (136 | 1.4%), and Vietnam (124 | 1.3%), together accounting for 14.5% of all Middletown residents.
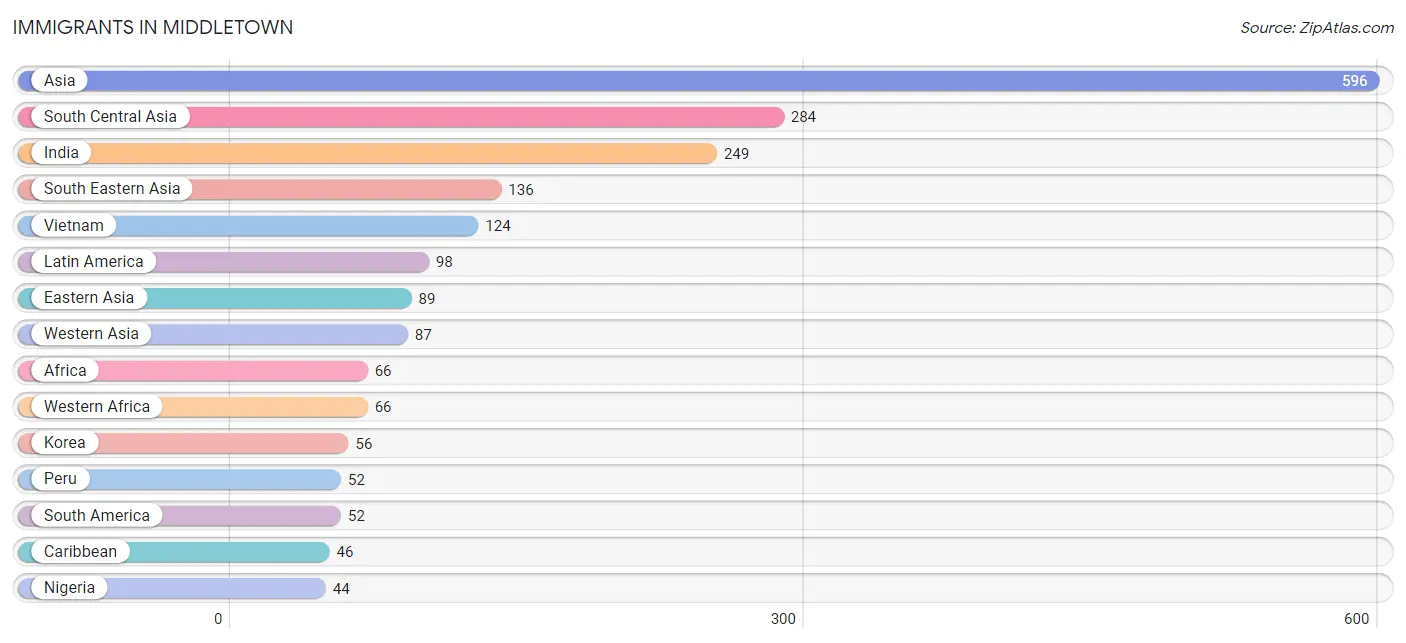
| Immigration Origin | # Population | % Population |
| Afghanistan | 19 | 0.2% |
| Africa | 66 | 0.7% |
| Asia | 596 | 6.2% |
| Caribbean | 46 | 0.5% |
| China | 33 | 0.3% |
| Cuba | 10 | 0.1% |
| Czechoslovakia | 9 | 0.1% |
| Dominican Republic | 15 | 0.2% |
| Eastern Asia | 89 | 0.9% |
| Eastern Europe | 23 | 0.2% |
| Europe | 34 | 0.4% |
| Germany | 11 | 0.1% |
| India | 249 | 2.6% |
| Iran | 16 | 0.2% |
| Iraq | 41 | 0.4% |
| Korea | 56 | 0.6% |
| Latin America | 98 | 1.0% |
| Liberia | 15 | 0.2% |
| Lithuania | 14 | 0.2% |
| Nigeria | 44 | 0.5% |
| Peru | 52 | 0.5% |
| Philippines | 12 | 0.1% |
| South America | 52 | 0.5% |
| South Central Asia | 284 | 3.0% |
| South Eastern Asia | 136 | 1.4% |
| Vietnam | 124 | 1.3% |
| Western Africa | 66 | 0.7% |
| Western Asia | 87 | 0.9% |
| Western Europe | 11 | 0.1% | View All 29 Rows |
Sex and Age in Middletown
Sex and Age in Middletown
The most populous age groups in Middletown are 10 to 14 Years (436 | 9.4%) for men and 25 to 29 Years (460 | 9.3%) for women.
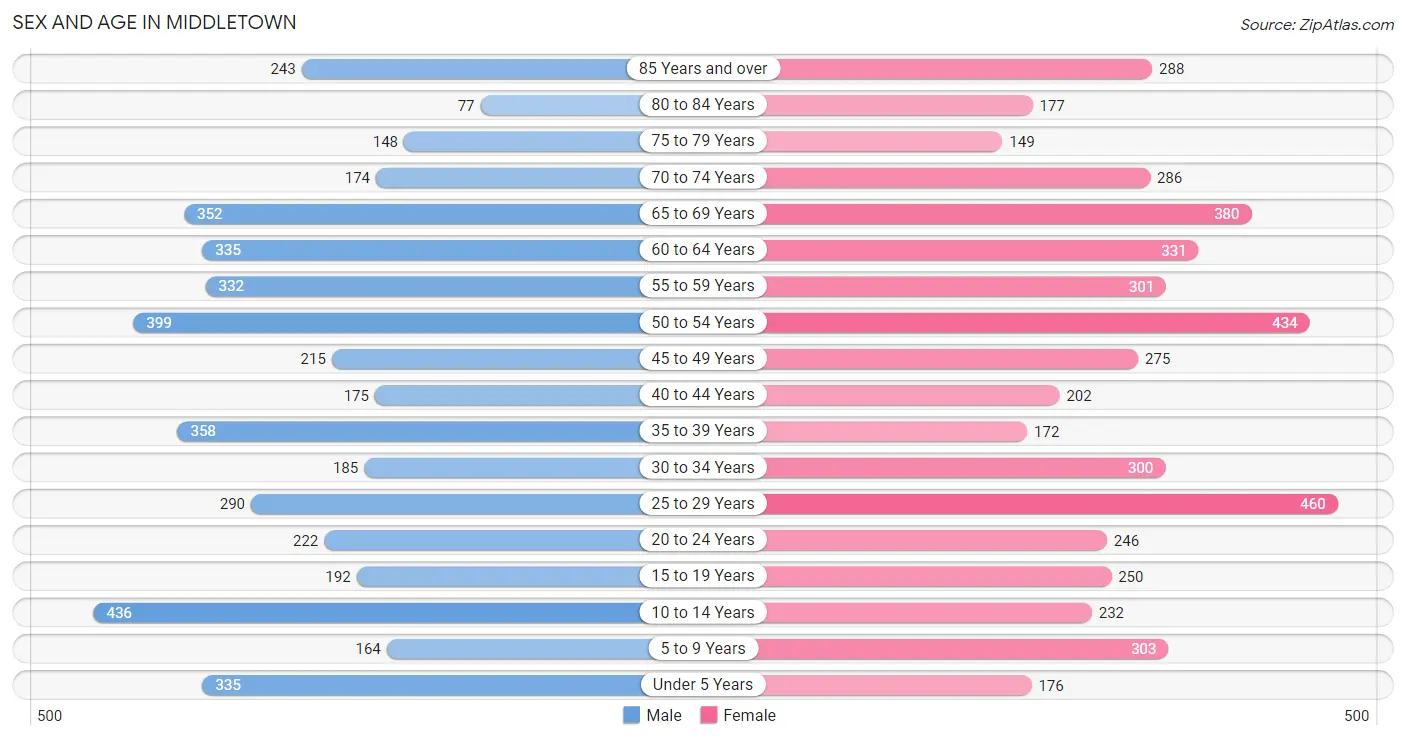
| Age Bracket | Male | Female |
| Under 5 Years | 335 (7.2%) | 176 (3.5%) |
| 5 to 9 Years | 164 (3.5%) | 303 (6.1%) |
| 10 to 14 Years | 436 (9.4%) | 232 (4.7%) |
| 15 to 19 Years | 192 (4.2%) | 250 (5.0%) |
| 20 to 24 Years | 222 (4.8%) | 246 (5.0%) |
| 25 to 29 Years | 290 (6.3%) | 460 (9.3%) |
| 30 to 34 Years | 185 (4.0%) | 300 (6.0%) |
| 35 to 39 Years | 358 (7.7%) | 172 (3.5%) |
| 40 to 44 Years | 175 (3.8%) | 202 (4.1%) |
| 45 to 49 Years | 215 (4.6%) | 275 (5.5%) |
| 50 to 54 Years | 399 (8.6%) | 434 (8.7%) |
| 55 to 59 Years | 332 (7.2%) | 301 (6.1%) |
| 60 to 64 Years | 335 (7.2%) | 331 (6.7%) |
| 65 to 69 Years | 352 (7.6%) | 380 (7.7%) |
| 70 to 74 Years | 174 (3.8%) | 286 (5.8%) |
| 75 to 79 Years | 148 (3.2%) | 149 (3.0%) |
| 80 to 84 Years | 77 (1.7%) | 177 (3.6%) |
| 85 Years and over | 243 (5.2%) | 288 (5.8%) |
| Total | 4,632 (100.0%) | 4,962 (100.0%) |
Families and Households in Middletown
Median Family Size in Middletown
The median family size in Middletown is 2.80 persons per family, with married-couple families (1,989 | 73.1%) accounting for the largest median family size of 2.94 persons per family. On the other hand, single male/father families (193 | 7.1%) represent the smallest median family size with 2.28 persons per family.
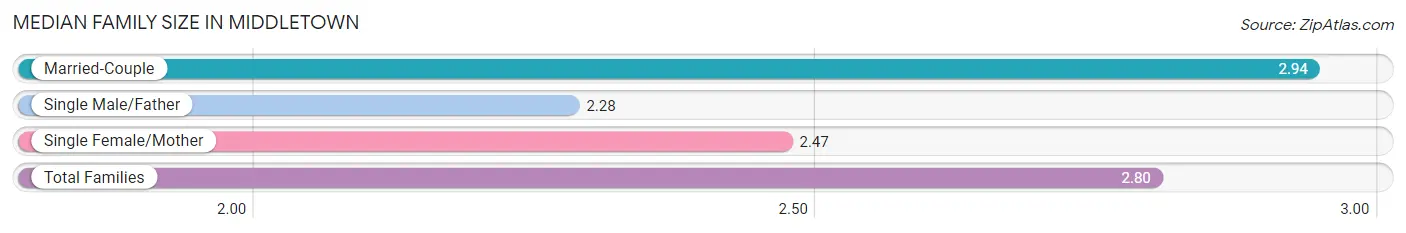
| Family Type | # Families | Family Size |
| Married-Couple | 1,989 (73.1%) | 2.94 |
| Single Male/Father | 193 (7.1%) | 2.28 |
| Single Female/Mother | 538 (19.8%) | 2.47 |
| Total Families | 2,720 (100.0%) | 2.80 |
Median Household Size in Middletown
The median household size in Middletown is 2.22 persons per household, with married-couple households (1,989 | 46.2%) accounting for the largest median household size of 2.97 persons per household. non-family households (1,587 | 36.8%) represent the smallest median household size with 1.17 persons per household.
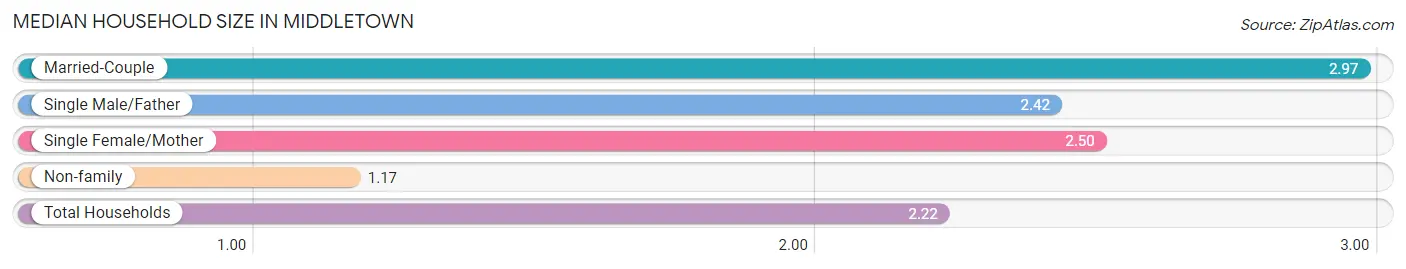
| Household Type | # Households | Household Size |
| Married-Couple | 1,989 (46.2%) | 2.97 |
| Single Male/Father | 193 (4.5%) | 2.42 |
| Single Female/Mother | 538 (12.5%) | 2.50 |
| Non-family | 1,587 (36.8%) | 1.17 |
| Total Households | 4,307 (100.0%) | 2.22 |
Household Size by Marriage Status in Middletown
Out of a total of 4,307 households in Middletown, 2,720 (63.1%) are family households, while 1,587 (36.8%) are nonfamily households. The most numerous type of family households are 2-person households, comprising 1,429, and the most common type of nonfamily households are 1-person households, comprising 1,342.
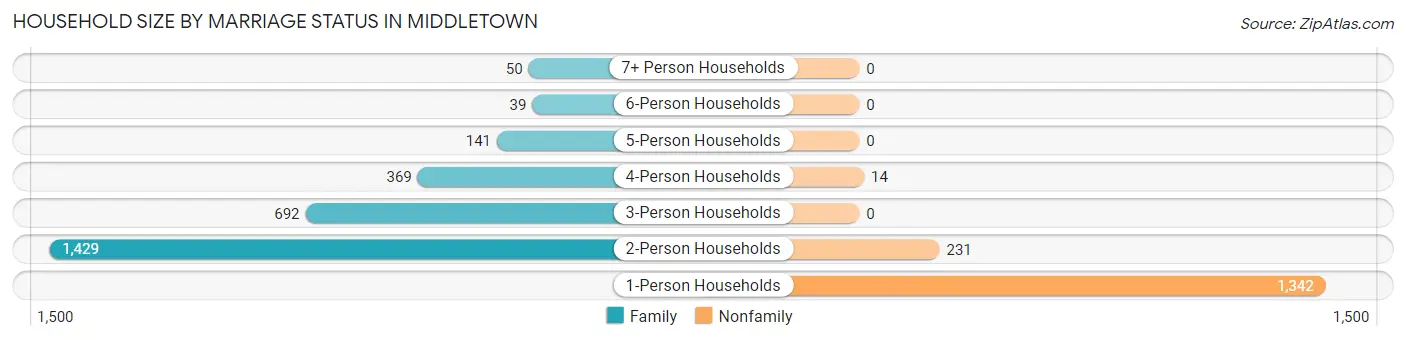
| Household Size | Family Households | Nonfamily Households |
| 1-Person Households | - | 1,342 (31.2%) |
| 2-Person Households | 1,429 (33.2%) | 231 (5.4%) |
| 3-Person Households | 692 (16.1%) | 0 (0.0%) |
| 4-Person Households | 369 (8.6%) | 14 (0.3%) |
| 5-Person Households | 141 (3.3%) | 0 (0.0%) |
| 6-Person Households | 39 (0.9%) | 0 (0.0%) |
| 7+ Person Households | 50 (1.2%) | 0 (0.0%) |
| Total | 2,720 (63.1%) | 1,587 (36.8%) |
Female Fertility in Middletown
Fertility by Age in Middletown
Average fertility rate in Middletown is 52.0 births per 1,000 women. Women in the age bracket of 20 to 34 years have the highest fertility rate with 81.0 births per 1,000 women. Women in the age bracket of 20 to 34 years acount for 75.0% of all women with births.
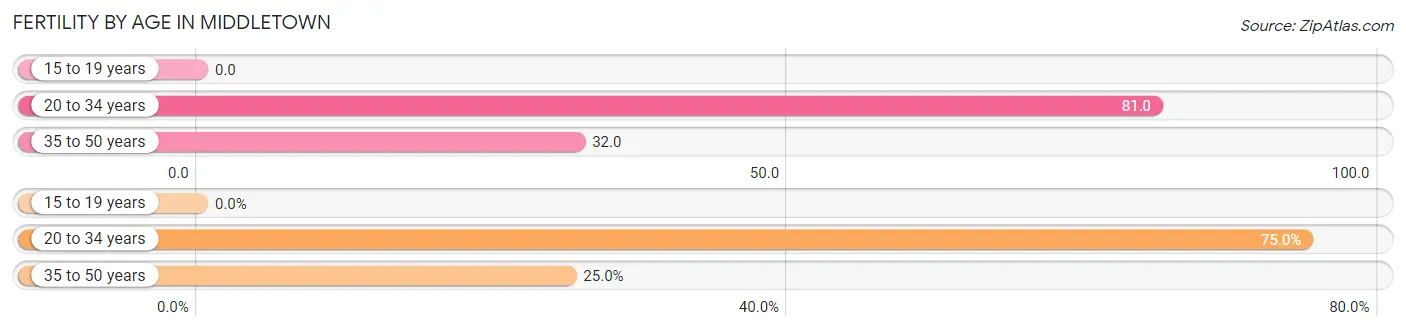
| Age Bracket | Women with Births | Births / 1,000 Women |
| 15 to 19 years | 0 (0.0%) | 0.0 |
| 20 to 34 years | 81 (75.0%) | 81.0 |
| 35 to 50 years | 27 (25.0%) | 32.0 |
| Total | 108 (100.0%) | 52.0 |
Fertility by Age by Marriage Status in Middletown
89.8% of women with births (108) in Middletown are married. The highest percentage of unmarried women with births falls into 35 to 50 years age bracket with 40.7% of them unmarried at the time of birth, while the lowest percentage of unmarried women with births belong to 20 to 34 years age bracket with 0.0% of them unmarried.
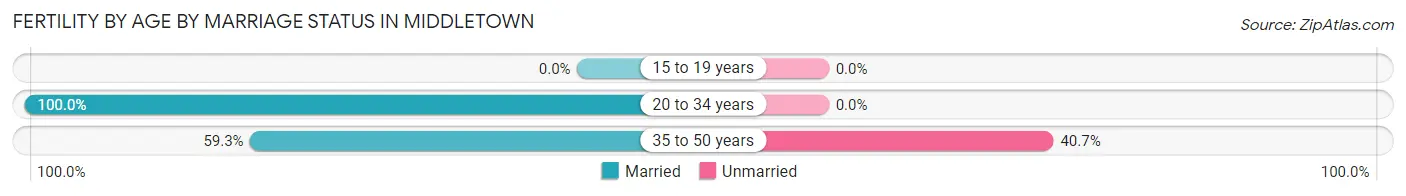
| Age Bracket | Married | Unmarried |
| 15 to 19 years | 0 (0.0%) | 0 (0.0%) |
| 20 to 34 years | 81 (100.0%) | 0 (0.0%) |
| 35 to 50 years | 16 (59.3%) | 11 (40.7%) |
| Total | 97 (89.8%) | 11 (10.2%) |
Fertility by Education in Middletown
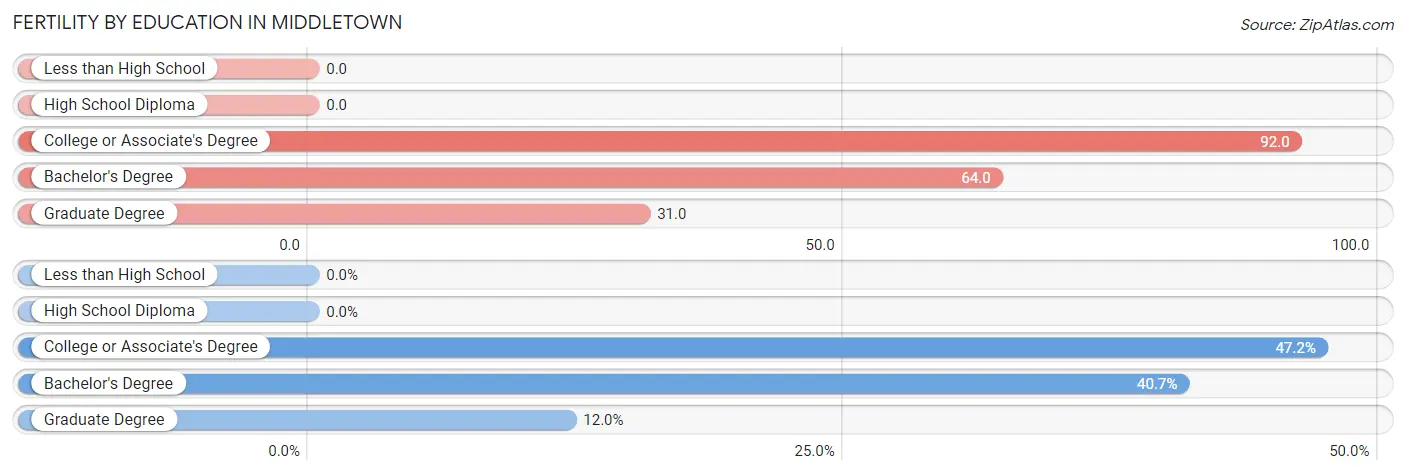
| Educational Attainment | Women with Births | Births / 1,000 Women |
| Less than High School | 0 (0.0%) | 0.0 |
| High School Diploma | 0 (0.0%) | 0.0 |
| College or Associate's Degree | 51 (47.2%) | 92.0 |
| Bachelor's Degree | 44 (40.7%) | 64.0 |
| Graduate Degree | 13 (12.0%) | 31.0 |
| Total | 108 (100.0%) | 52.0 |
Fertility by Education by Marriage Status in Middletown
10.2% of women with births in Middletown are unmarried. Women with the educational attainment of bachelor's degree are most likely to be married with 100.0% of them married at childbirth, while women with the educational attainment of college or associate's degree are least likely to be married with 21.6% of them unmarried at childbirth.
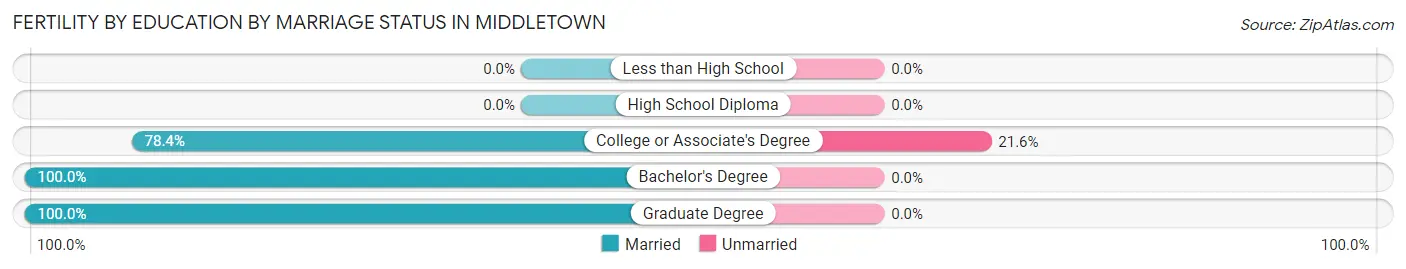
| Educational Attainment | Married | Unmarried |
| Less than High School | 0 (0.0%) | 0 (0.0%) |
| High School Diploma | 0 (0.0%) | 0 (0.0%) |
| College or Associate's Degree | 40 (78.4%) | 11 (21.6%) |
| Bachelor's Degree | 44 (100.0%) | 0 (0.0%) |
| Graduate Degree | 13 (100.0%) | 0 (0.0%) |
| Total | 97 (89.8%) | 11 (10.2%) |
Employment Characteristics in Middletown
Employment by Class of Employer in Middletown
Among the 4,612 employed individuals in Middletown, private company employees (3,172 | 68.8%), not-for-profit organizations (535 | 11.6%), and state government employees (281 | 6.1%) make up the most common classes of employment.
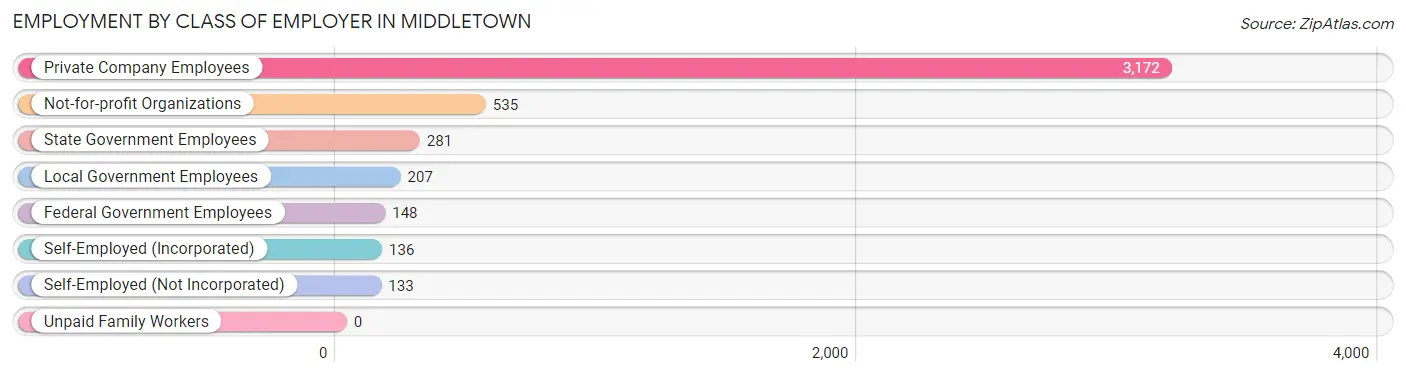
| Employer Class | # Employees | % Employees |
| Private Company Employees | 3,172 | 68.8% |
| Self-Employed (Incorporated) | 136 | 2.9% |
| Self-Employed (Not Incorporated) | 133 | 2.9% |
| Not-for-profit Organizations | 535 | 11.6% |
| Local Government Employees | 207 | 4.5% |
| State Government Employees | 281 | 6.1% |
| Federal Government Employees | 148 | 3.2% |
| Unpaid Family Workers | 0 | 0.0% |
| Total | 4,612 | 100.0% |
Employment Status by Age in Middletown
According to the labor force statistics for Middletown, out of the total population over 16 years of age (7,914), 62.3% or 4,930 individuals are in the labor force, with 5.6% or 276 of them unemployed. The age group with the highest labor force participation rate is 35 to 44 years, with 95.0% or 862 individuals in the labor force. Within the labor force, the 20 to 24 years age range has the highest percentage of unemployed individuals, with 15.0% or 61 of them being unemployed.
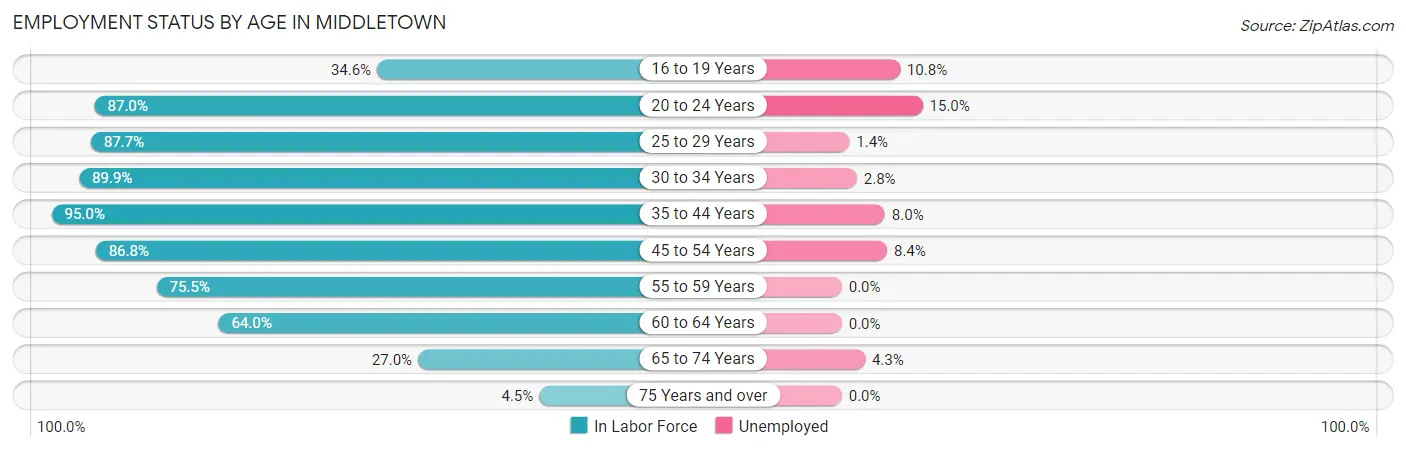
| Age Bracket | In Labor Force | Unemployed |
| 16 to 19 Years | 141 (34.6%) | 15 (10.8%) |
| 20 to 24 Years | 407 (87.0%) | 61 (15.0%) |
| 25 to 29 Years | 658 (87.7%) | 9 (1.4%) |
| 30 to 34 Years | 436 (89.9%) | 12 (2.8%) |
| 35 to 44 Years | 862 (95.0%) | 69 (8.0%) |
| 45 to 54 Years | 1,148 (86.8%) | 96 (8.4%) |
| 55 to 59 Years | 478 (75.5%) | 0 (0.0%) |
| 60 to 64 Years | 426 (64.0%) | 0 (0.0%) |
| 65 to 74 Years | 322 (27.0%) | 14 (4.3%) |
| 75 Years and over | 49 (4.5%) | 0 (0.0%) |
| Total | 4,930 (62.3%) | 276 (5.6%) |
Employment Status by Educational Attainment in Middletown
According to labor force statistics for Middletown, 84.2% of individuals (4,011) out of the total population between 25 and 64 years of age (4,764) are in the labor force, with 4.7% or 189 of them being unemployed. The group with the highest labor force participation rate are those with the educational attainment of bachelor's degree or higher, with 90.0% or 2,680 individuals in the labor force. Within the labor force, individuals with college / associate degree education have the highest percentage of unemployment, with 8.1% or 69 of them being unemployed.
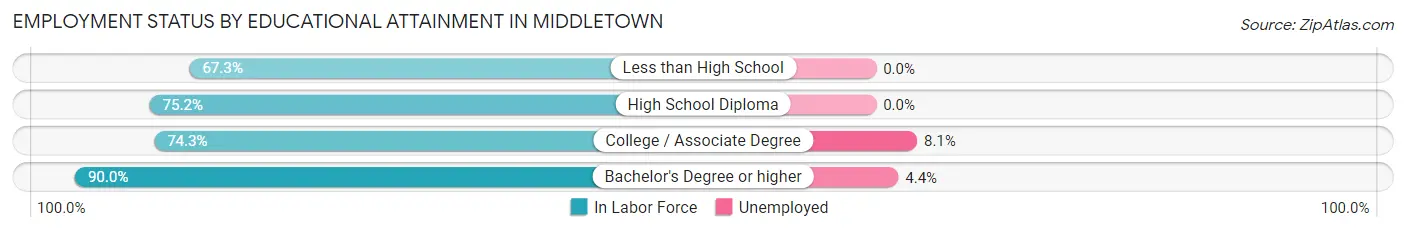
| Educational Attainment | In Labor Force | Unemployed |
| Less than High School | 37 (67.3%) | 0 (0.0%) |
| High School Diploma | 440 (75.2%) | 0 (0.0%) |
| College / Associate Degree | 851 (74.3%) | 93 (8.1%) |
| Bachelor's Degree or higher | 2,680 (90.0%) | 131 (4.4%) |
| Total | 4,011 (84.2%) | 224 (4.7%) |
Employment Occupations by Sex in Middletown
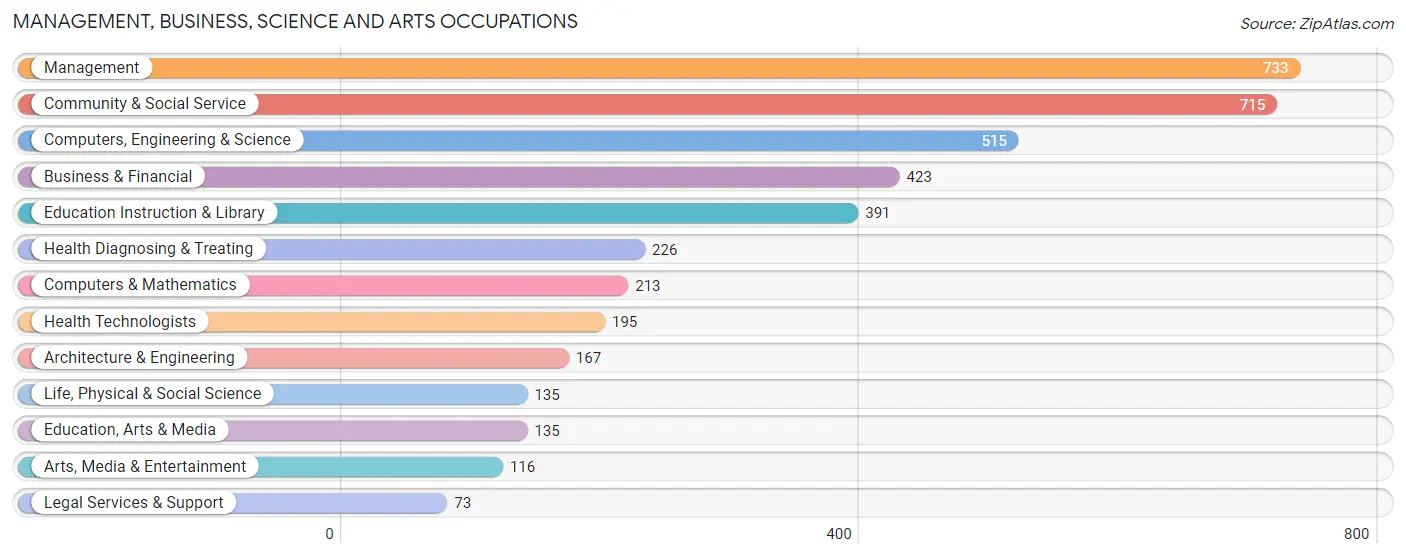
Management, Business, Science and Arts Occupations
The most common Management, Business, Science and Arts occupations in Middletown are Management (733 | 15.8%), Community & Social Service (715 | 15.4%), Computers, Engineering & Science (515 | 11.1%), Business & Financial (423 | 9.1%), and Education Instruction & Library (391 | 8.4%).
Management, Business, Science and Arts Occupations by Sex
Within the Management, Business, Science and Arts occupations in Middletown, the most male-oriented occupations are Architecture & Engineering (90.4%), Computers, Engineering & Science (72.4%), and Computers & Mathematics (69.5%), while the most female-oriented occupations are Education Instruction & Library (70.8%), Health Diagnosing & Treating (66.4%), and Health Technologists (61.0%).
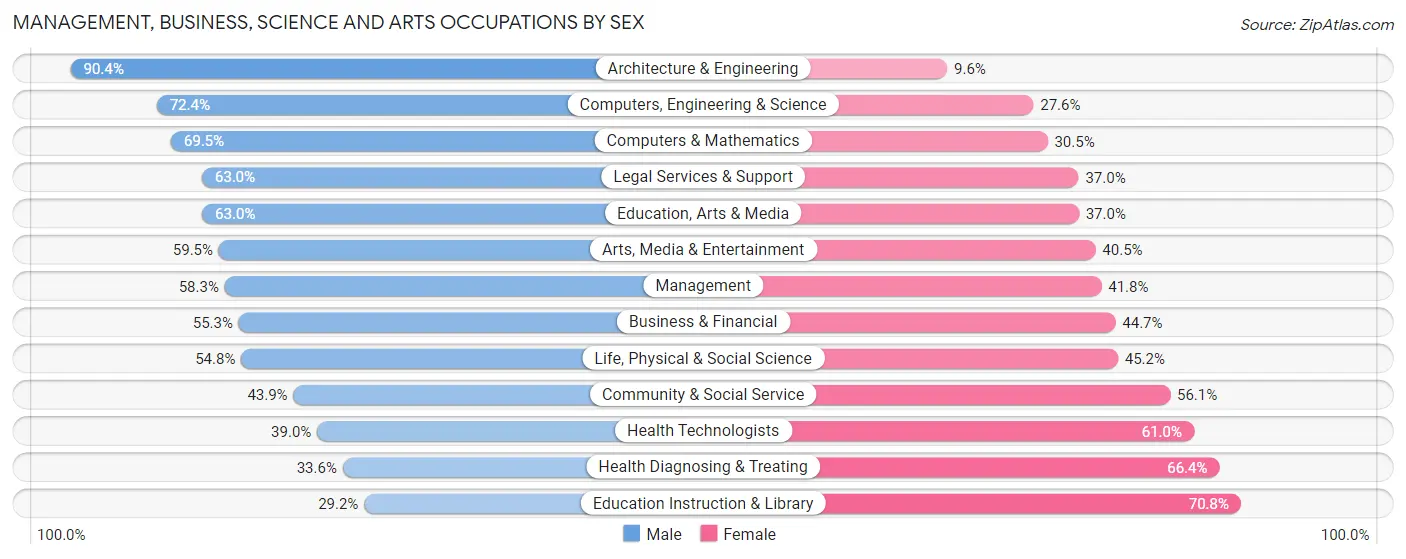
| Occupation | Male | Female |
| Management | 427 (58.3%) | 306 (41.7%) |
| Business & Financial | 234 (55.3%) | 189 (44.7%) |
| Computers, Engineering & Science | 373 (72.4%) | 142 (27.6%) |
| Computers & Mathematics | 148 (69.5%) | 65 (30.5%) |
| Architecture & Engineering | 151 (90.4%) | 16 (9.6%) |
| Life, Physical & Social Science | 74 (54.8%) | 61 (45.2%) |
| Community & Social Service | 314 (43.9%) | 401 (56.1%) |
| Education, Arts & Media | 85 (63.0%) | 50 (37.0%) |
| Legal Services & Support | 46 (63.0%) | 27 (37.0%) |
| Education Instruction & Library | 114 (29.2%) | 277 (70.8%) |
| Arts, Media & Entertainment | 69 (59.5%) | 47 (40.5%) |
| Health Diagnosing & Treating | 76 (33.6%) | 150 (66.4%) |
| Health Technologists | 76 (39.0%) | 119 (61.0%) |
| Total (Category) | 1,424 (54.5%) | 1,188 (45.5%) |
| Total (Overall) | 2,536 (54.6%) | 2,108 (45.4%) |
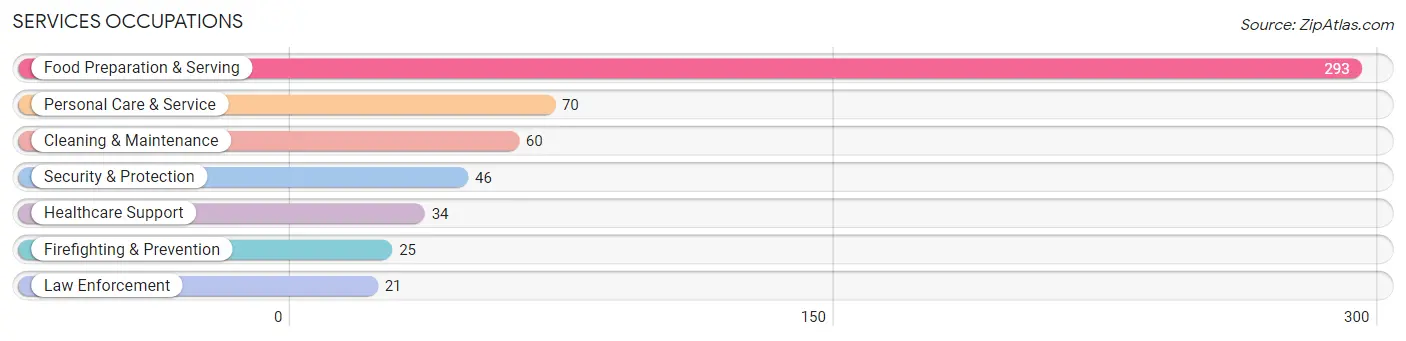
Services Occupations
The most common Services occupations in Middletown are Food Preparation & Serving (293 | 6.3%), Personal Care & Service (70 | 1.5%), Cleaning & Maintenance (60 | 1.3%), Security & Protection (46 | 1.0%), and Healthcare Support (34 | 0.7%).
Services Occupations by Sex
Within the Services occupations in Middletown, the most male-oriented occupations are Security & Protection (100.0%), Firefighting & Prevention (100.0%), and Law Enforcement (100.0%), while the most female-oriented occupations are Personal Care & Service (78.6%), Food Preparation & Serving (74.7%), and Healthcare Support (55.9%).
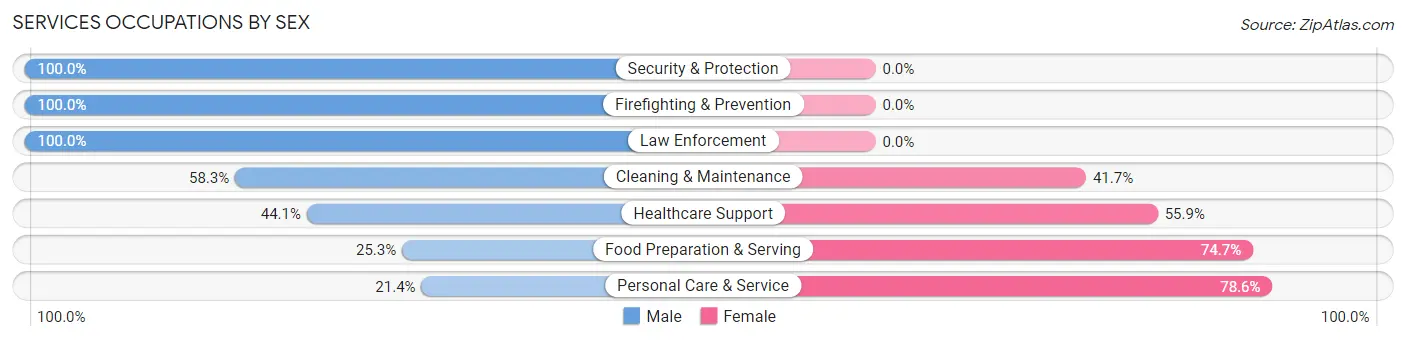
| Occupation | Male | Female |
| Healthcare Support | 15 (44.1%) | 19 (55.9%) |
| Security & Protection | 46 (100.0%) | 0 (0.0%) |
| Firefighting & Prevention | 25 (100.0%) | 0 (0.0%) |
| Law Enforcement | 21 (100.0%) | 0 (0.0%) |
| Food Preparation & Serving | 74 (25.3%) | 219 (74.7%) |
| Cleaning & Maintenance | 35 (58.3%) | 25 (41.7%) |
| Personal Care & Service | 15 (21.4%) | 55 (78.6%) |
| Total (Category) | 185 (36.8%) | 318 (63.2%) |
| Total (Overall) | 2,536 (54.6%) | 2,108 (45.4%) |
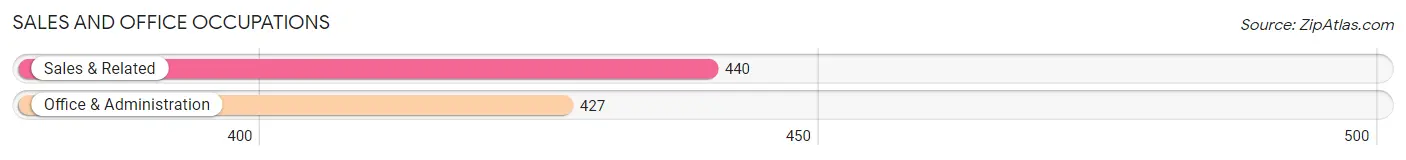
Sales and Office Occupations
The most common Sales and Office occupations in Middletown are Sales & Related (440 | 9.5%), and Office & Administration (427 | 9.2%).
Sales and Office Occupations by Sex
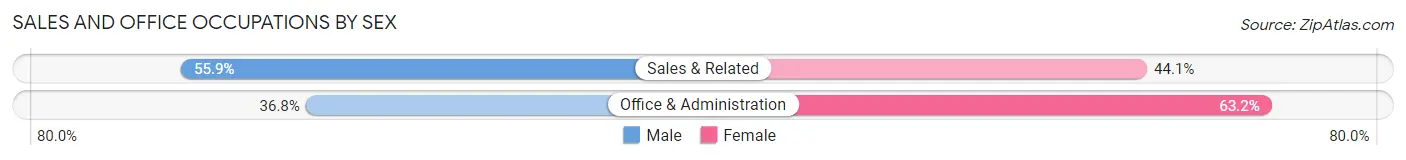
| Occupation | Male | Female |
| Sales & Related | 246 (55.9%) | 194 (44.1%) |
| Office & Administration | 157 (36.8%) | 270 (63.2%) |
| Total (Category) | 403 (46.5%) | 464 (53.5%) |
| Total (Overall) | 2,536 (54.6%) | 2,108 (45.4%) |
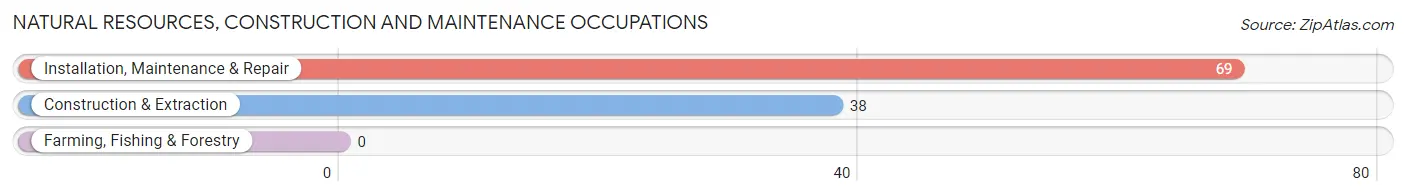
Natural Resources, Construction and Maintenance Occupations
The most common Natural Resources, Construction and Maintenance occupations in Middletown are Installation, Maintenance & Repair (69 | 1.5%), and Construction & Extraction (38 | 0.8%).
Natural Resources, Construction and Maintenance Occupations by Sex
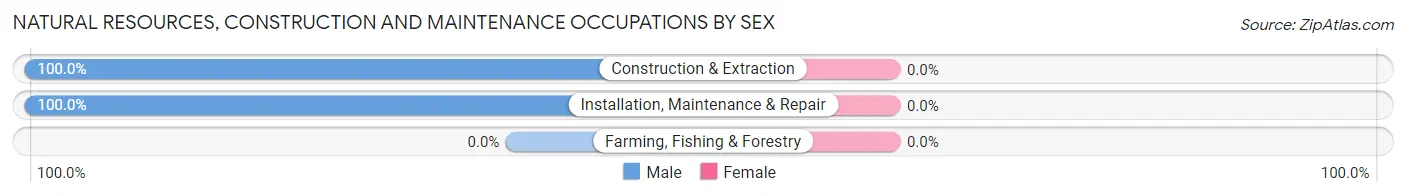
| Occupation | Male | Female |
| Farming, Fishing & Forestry | 0 (0.0%) | 0 (0.0%) |
| Construction & Extraction | 38 (100.0%) | 0 (0.0%) |
| Installation, Maintenance & Repair | 69 (100.0%) | 0 (0.0%) |
| Total (Category) | 107 (100.0%) | 0 (0.0%) |
| Total (Overall) | 2,536 (54.6%) | 2,108 (45.4%) |
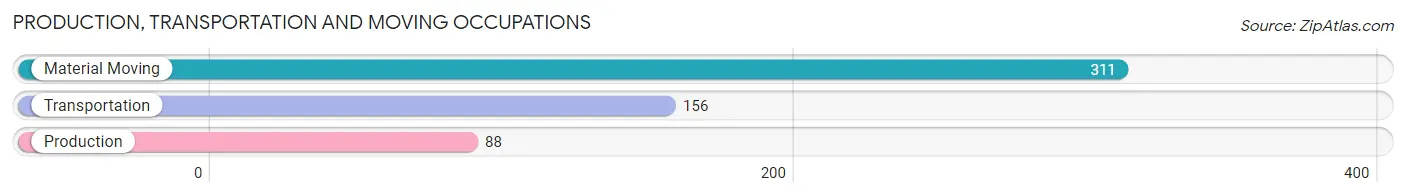
Production, Transportation and Moving Occupations
The most common Production, Transportation and Moving occupations in Middletown are Material Moving (311 | 6.7%), Transportation (156 | 3.4%), and Production (88 | 1.9%).
Production, Transportation and Moving Occupations by Sex
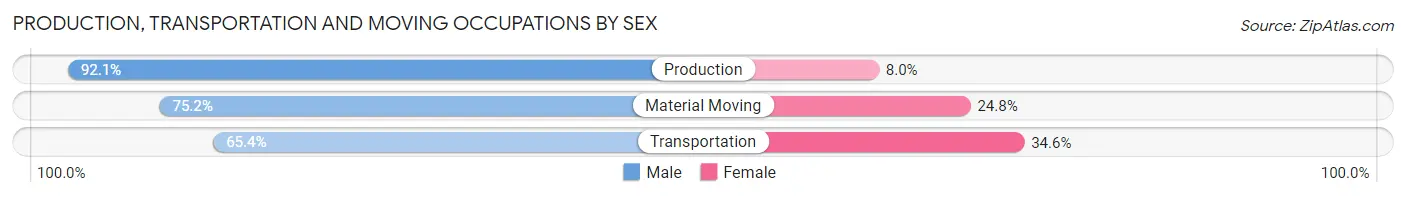
| Occupation | Male | Female |
| Production | 81 (92.0%) | 7 (8.0%) |
| Transportation | 102 (65.4%) | 54 (34.6%) |
| Material Moving | 234 (75.2%) | 77 (24.8%) |
| Total (Category) | 417 (75.1%) | 138 (24.9%) |
| Total (Overall) | 2,536 (54.6%) | 2,108 (45.4%) |
Employment Industries by Sex in Middletown
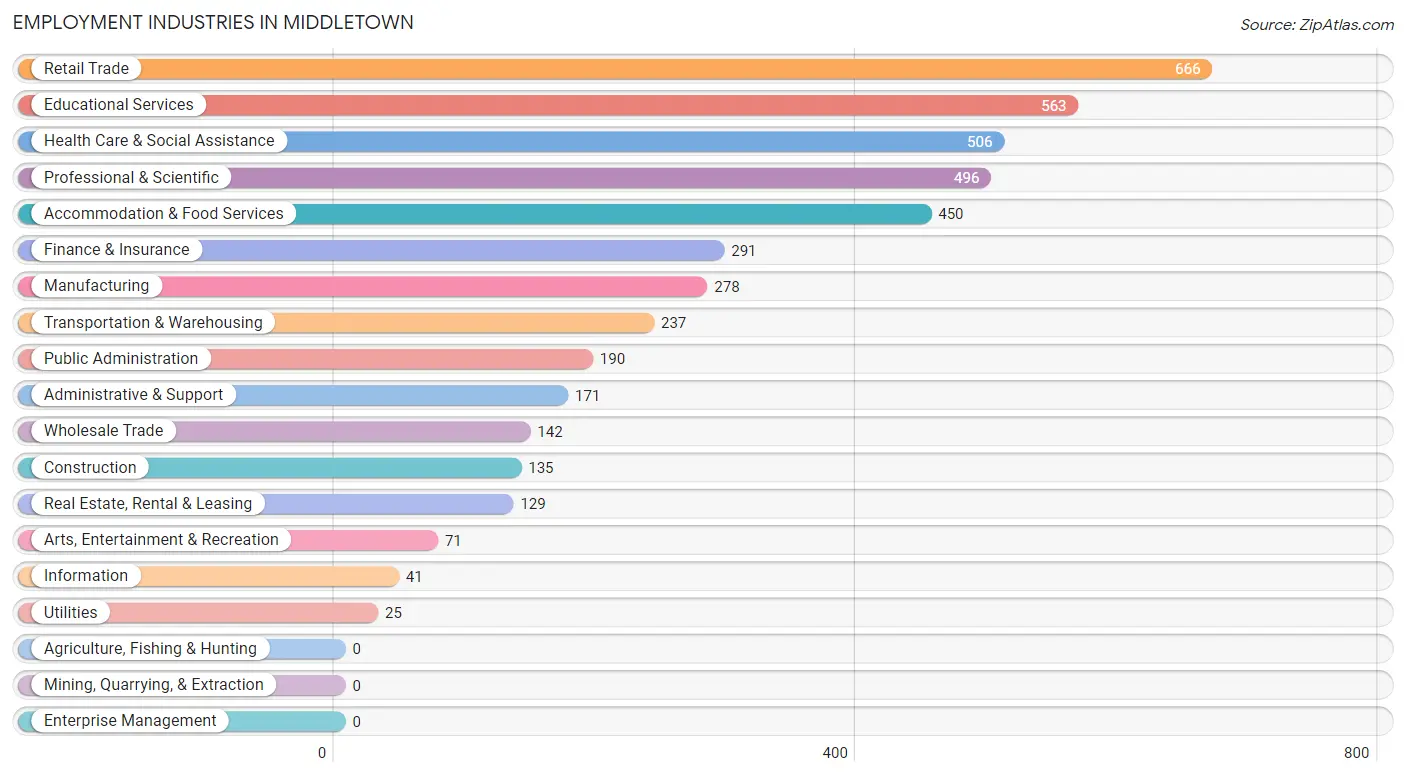
Employment Industries in Middletown
The major employment industries in Middletown include Retail Trade (666 | 14.3%), Educational Services (563 | 12.1%), Health Care & Social Assistance (506 | 10.9%), Professional & Scientific (496 | 10.7%), and Accommodation & Food Services (450 | 9.7%).
Employment Industries by Sex in Middletown
The Middletown industries that see more men than women are Information (100.0%), Manufacturing (81.3%), and Construction (72.6%), whereas the industries that tend to have a higher number of women are Arts, Entertainment & Recreation (78.9%), Health Care & Social Assistance (69.2%), and Educational Services (65.0%).
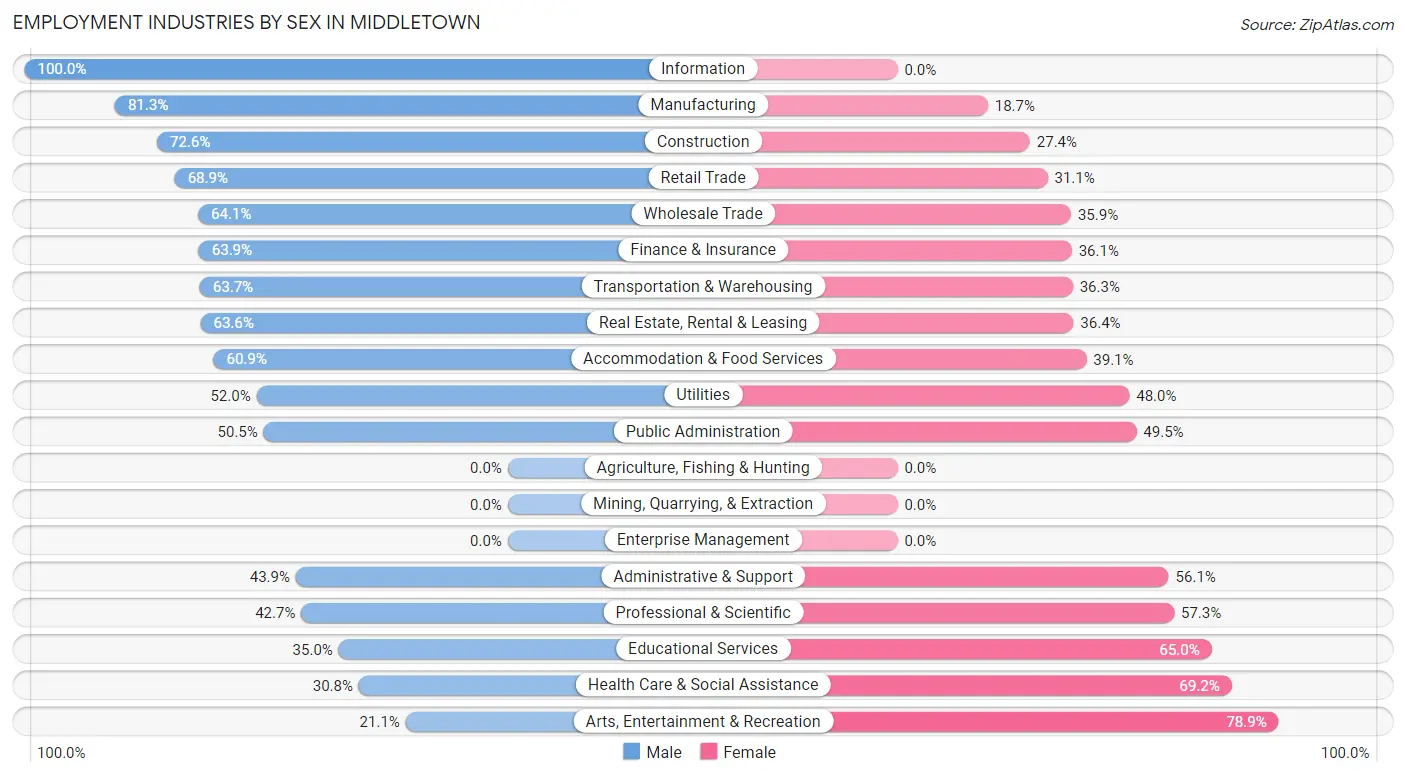
| Industry | Male | Female |
| Agriculture, Fishing & Hunting | 0 (0.0%) | 0 (0.0%) |
| Mining, Quarrying, & Extraction | 0 (0.0%) | 0 (0.0%) |
| Construction | 98 (72.6%) | 37 (27.4%) |
| Manufacturing | 226 (81.3%) | 52 (18.7%) |
| Wholesale Trade | 91 (64.1%) | 51 (35.9%) |
| Retail Trade | 459 (68.9%) | 207 (31.1%) |
| Transportation & Warehousing | 151 (63.7%) | 86 (36.3%) |
| Utilities | 13 (52.0%) | 12 (48.0%) |
| Information | 41 (100.0%) | 0 (0.0%) |
| Finance & Insurance | 186 (63.9%) | 105 (36.1%) |
| Real Estate, Rental & Leasing | 82 (63.6%) | 47 (36.4%) |
| Professional & Scientific | 212 (42.7%) | 284 (57.3%) |
| Enterprise Management | 0 (0.0%) | 0 (0.0%) |
| Administrative & Support | 75 (43.9%) | 96 (56.1%) |
| Educational Services | 197 (35.0%) | 366 (65.0%) |
| Health Care & Social Assistance | 156 (30.8%) | 350 (69.2%) |
| Arts, Entertainment & Recreation | 15 (21.1%) | 56 (78.9%) |
| Accommodation & Food Services | 274 (60.9%) | 176 (39.1%) |
| Public Administration | 96 (50.5%) | 94 (49.5%) |
| Total | 2,536 (54.6%) | 2,108 (45.4%) |
Education in Middletown
School Enrollment in Middletown
The most common levels of schooling among the 2,090 students in Middletown are middle school (456 | 21.8%), high school (435 | 20.8%), and elementary school (350 | 16.8%).
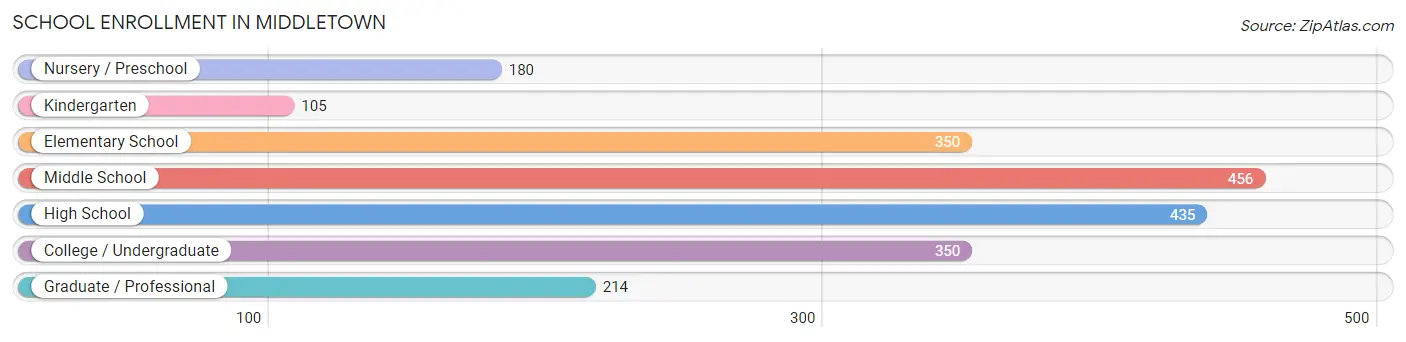
| School Level | # Students | % Students |
| Nursery / Preschool | 180 | 8.6% |
| Kindergarten | 105 | 5.0% |
| Elementary School | 350 | 16.8% |
| Middle School | 456 | 21.8% |
| High School | 435 | 20.8% |
| College / Undergraduate | 350 | 16.8% |
| Graduate / Professional | 214 | 10.2% |
| Total | 2,090 | 100.0% |
School Enrollment by Age by Funding Source in Middletown
Out of a total of 2,090 students who are enrolled in schools in Middletown, 479 (22.9%) attend a private institution, while the remaining 1,611 (77.1%) are enrolled in public schools. The age group of 3 to 4 year olds has the highest likelihood of being enrolled in private schools, with 70 (62.5% in the age bracket) enrolled. Conversely, the age group of 18 to 19 year olds has the lowest likelihood of being enrolled in a private school, with 189 (94.0% in the age bracket) attending a public institution.
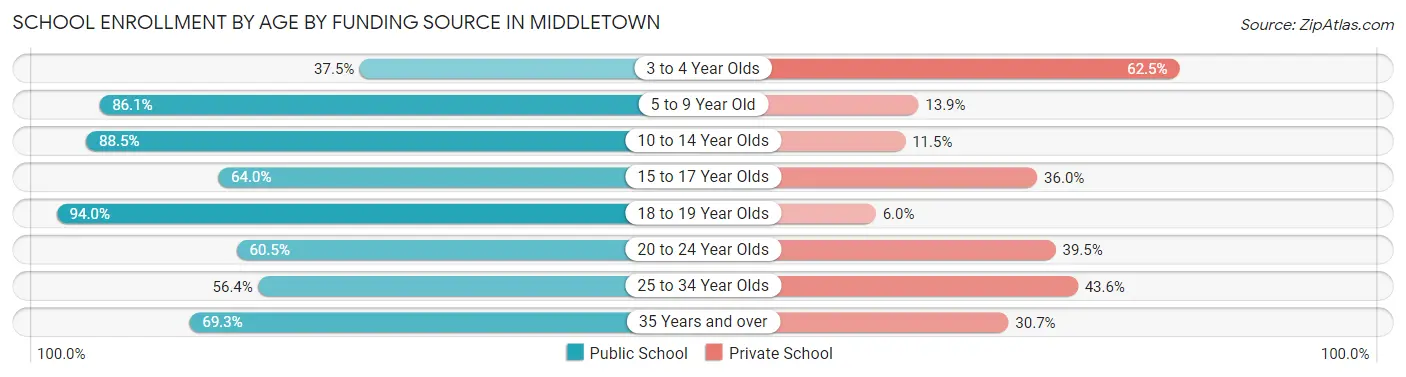
| Age Bracket | Public School | Private School |
| 3 to 4 Year Olds | 42 (37.5%) | 70 (62.5%) |
| 5 to 9 Year Old | 390 (86.1%) | 63 (13.9%) |
| 10 to 14 Year Olds | 579 (88.5%) | 75 (11.5%) |
| 15 to 17 Year Olds | 126 (64.0%) | 71 (36.0%) |
| 18 to 19 Year Olds | 189 (94.0%) | 12 (6.0%) |
| 20 to 24 Year Olds | 115 (60.5%) | 75 (39.5%) |
| 25 to 34 Year Olds | 110 (56.4%) | 85 (43.6%) |
| 35 Years and over | 61 (69.3%) | 27 (30.7%) |
| Total | 1,611 (77.1%) | 479 (22.9%) |
Educational Attainment by Field of Study in Middletown
Business (696 | 16.7%), science & technology (520 | 12.4%), education (454 | 10.9%), engineering (390 | 9.3%), and psychology (360 | 8.6%) are the most common fields of study among 4,178 individuals in Middletown who have obtained a bachelor's degree or higher.
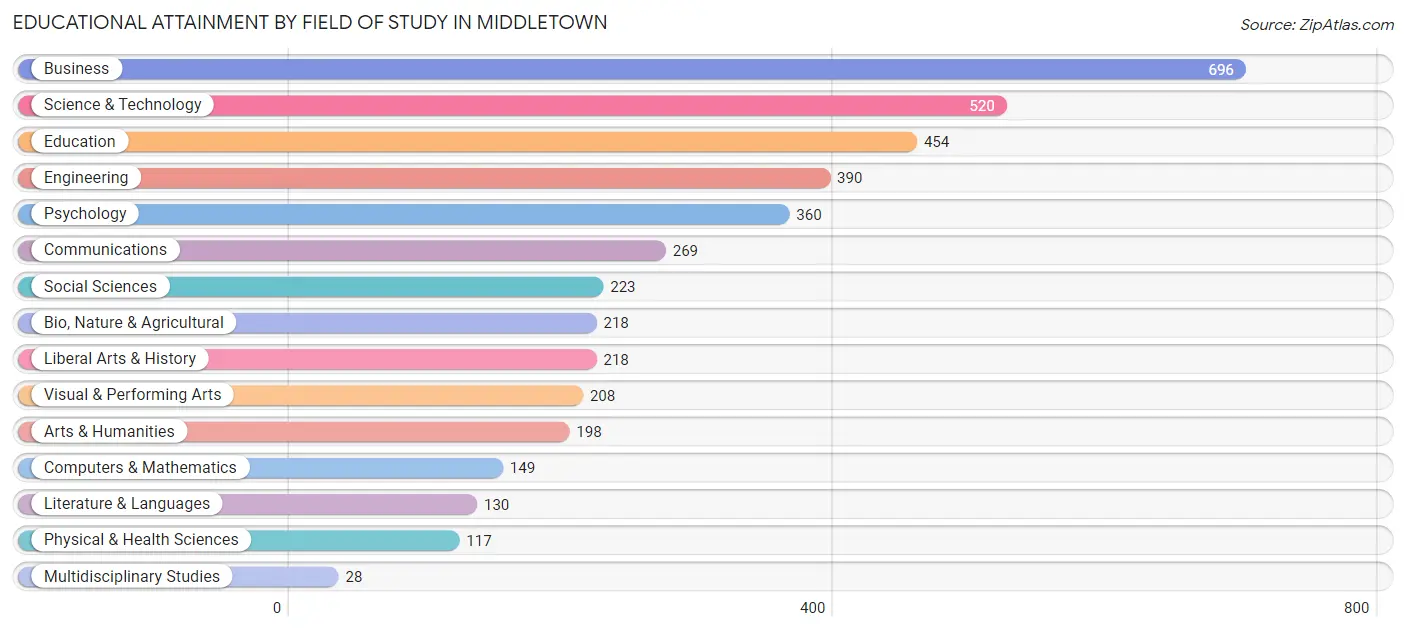
| Field of Study | # Graduates | % Graduates |
| Computers & Mathematics | 149 | 3.6% |
| Bio, Nature & Agricultural | 218 | 5.2% |
| Physical & Health Sciences | 117 | 2.8% |
| Psychology | 360 | 8.6% |
| Social Sciences | 223 | 5.3% |
| Engineering | 390 | 9.3% |
| Multidisciplinary Studies | 28 | 0.7% |
| Science & Technology | 520 | 12.4% |
| Business | 696 | 16.7% |
| Education | 454 | 10.9% |
| Literature & Languages | 130 | 3.1% |
| Liberal Arts & History | 218 | 5.2% |
| Visual & Performing Arts | 208 | 5.0% |
| Communications | 269 | 6.4% |
| Arts & Humanities | 198 | 4.7% |
| Total | 4,178 | 100.0% |
Transportation & Commute in Middletown
Vehicle Availability by Sex in Middletown
The most prevalent vehicle ownership categories in Middletown are males with 2 vehicles (1,335, accounting for 52.7%) and females with 2 vehicles (925, making up 64.3%).
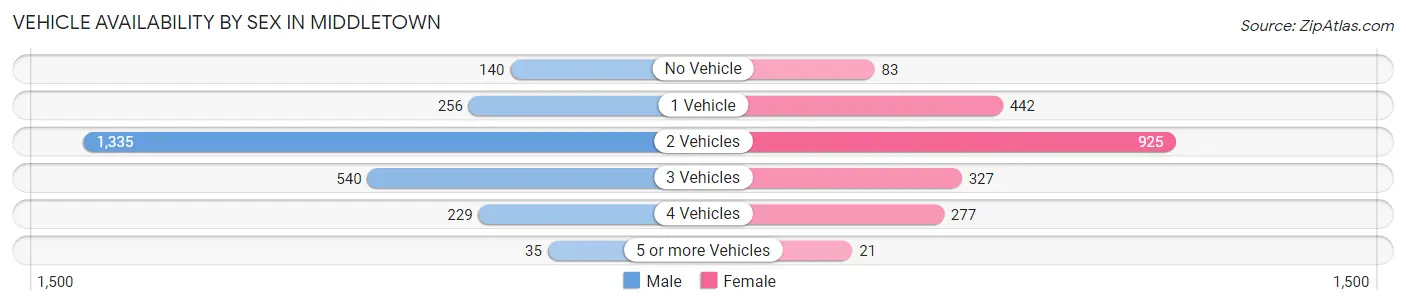
| Vehicles Available | Male | Female |
| No Vehicle | 140 (5.5%) | 83 (4.0%) |
| 1 Vehicle | 256 (10.1%) | 442 (21.3%) |
| 2 Vehicles | 1,335 (52.7%) | 925 (44.6%) |
| 3 Vehicles | 540 (21.3%) | 327 (15.8%) |
| 4 Vehicles | 229 (9.0%) | 277 (13.4%) |
| 5 or more Vehicles | 35 (1.4%) | 21 (1.0%) |
| Total | 2,535 (100.0%) | 2,075 (100.0%) |
Commute Time in Middletown
The most frequently occuring commute durations in Middletown are 15 to 19 minutes (900 commuters, 22.1%), 20 to 24 minutes (680 commuters, 16.7%), and 10 to 14 minutes (646 commuters, 15.9%).
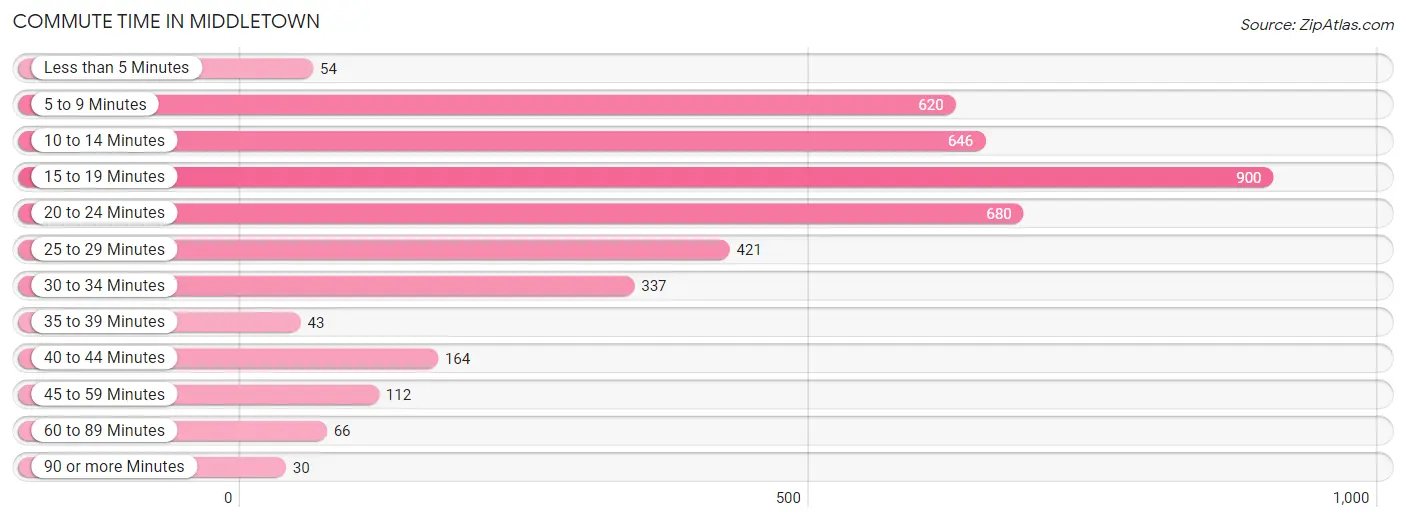
| Commute Time | # Commuters | % Commuters |
| Less than 5 Minutes | 54 | 1.3% |
| 5 to 9 Minutes | 620 | 15.2% |
| 10 to 14 Minutes | 646 | 15.9% |
| 15 to 19 Minutes | 900 | 22.1% |
| 20 to 24 Minutes | 680 | 16.7% |
| 25 to 29 Minutes | 421 | 10.3% |
| 30 to 34 Minutes | 337 | 8.3% |
| 35 to 39 Minutes | 43 | 1.1% |
| 40 to 44 Minutes | 164 | 4.0% |
| 45 to 59 Minutes | 112 | 2.8% |
| 60 to 89 Minutes | 66 | 1.6% |
| 90 or more Minutes | 30 | 0.7% |
Commute Time by Sex in Middletown
The most common commute times in Middletown are 15 to 19 minutes (455 commuters, 21.0%) for males and 15 to 19 minutes (445 commuters, 23.3%) for females.
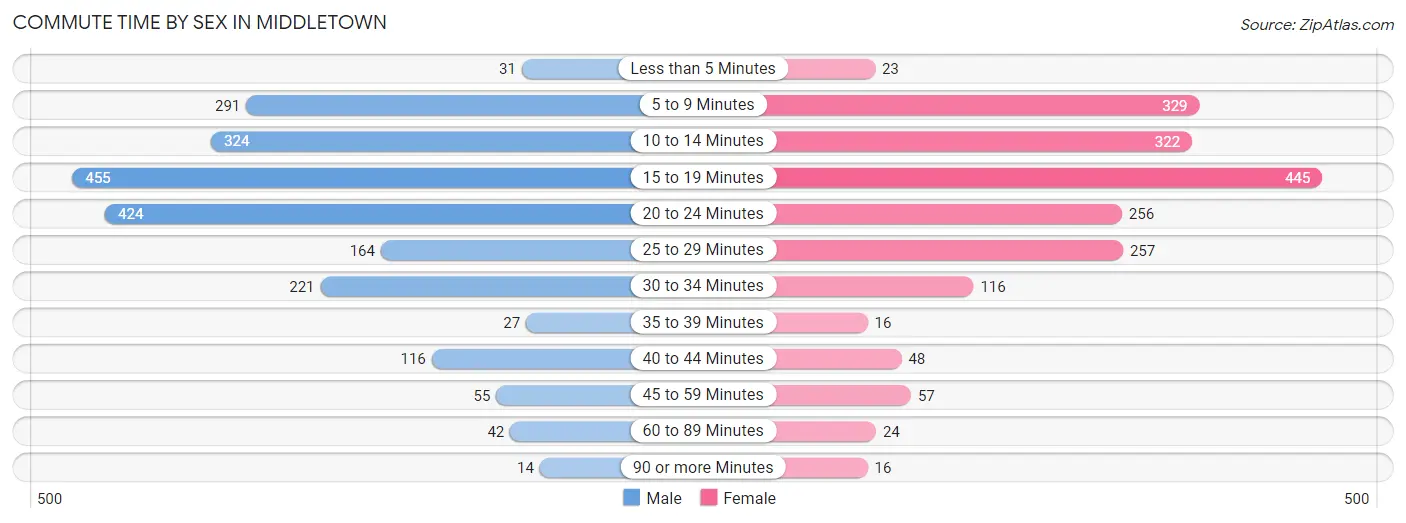
| Commute Time | Male | Female |
| Less than 5 Minutes | 31 (1.4%) | 23 (1.2%) |
| 5 to 9 Minutes | 291 (13.5%) | 329 (17.2%) |
| 10 to 14 Minutes | 324 (15.0%) | 322 (16.9%) |
| 15 to 19 Minutes | 455 (21.0%) | 445 (23.3%) |
| 20 to 24 Minutes | 424 (19.6%) | 256 (13.4%) |
| 25 to 29 Minutes | 164 (7.6%) | 257 (13.5%) |
| 30 to 34 Minutes | 221 (10.2%) | 116 (6.1%) |
| 35 to 39 Minutes | 27 (1.3%) | 16 (0.8%) |
| 40 to 44 Minutes | 116 (5.4%) | 48 (2.5%) |
| 45 to 59 Minutes | 55 (2.5%) | 57 (3.0%) |
| 60 to 89 Minutes | 42 (1.9%) | 24 (1.3%) |
| 90 or more Minutes | 14 (0.6%) | 16 (0.8%) |
Time of Departure to Work by Sex in Middletown
The most frequent times of departure to work in Middletown are 6:30 AM to 6:59 AM (319, 14.7%) for males and 8:00 AM to 8:29 AM (351, 18.4%) for females.
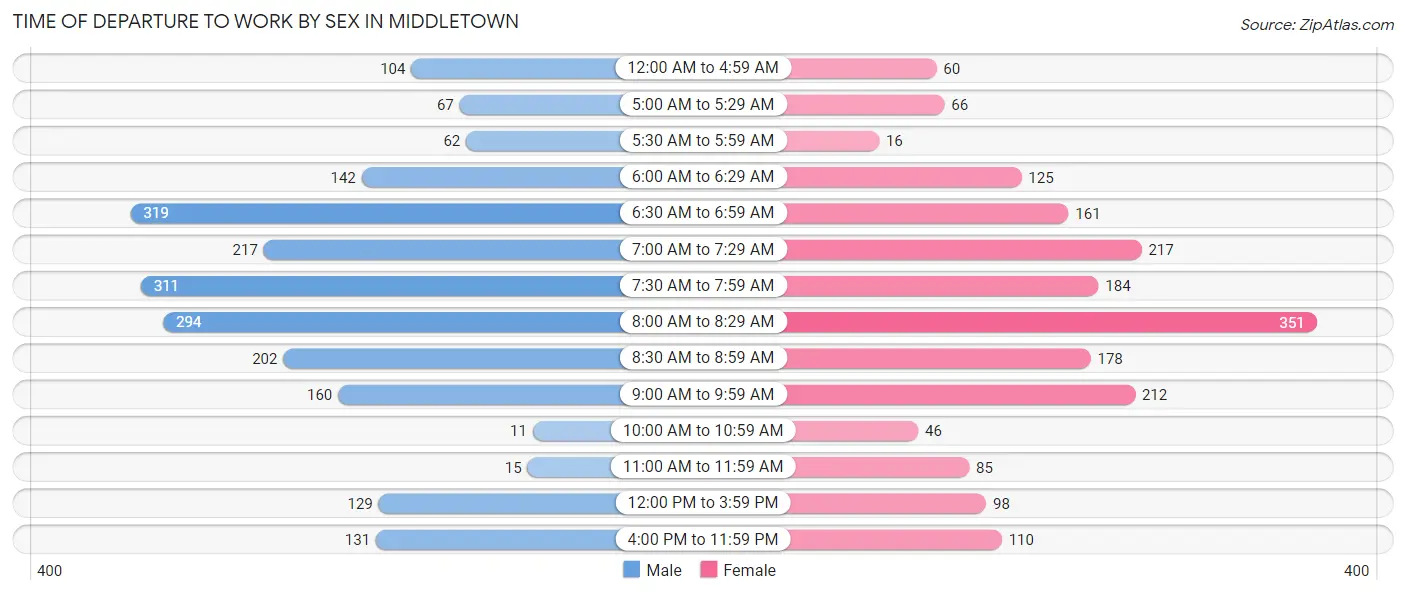
| Time of Departure | Male | Female |
| 12:00 AM to 4:59 AM | 104 (4.8%) | 60 (3.1%) |
| 5:00 AM to 5:29 AM | 67 (3.1%) | 66 (3.5%) |
| 5:30 AM to 5:59 AM | 62 (2.9%) | 16 (0.8%) |
| 6:00 AM to 6:29 AM | 142 (6.6%) | 125 (6.6%) |
| 6:30 AM to 6:59 AM | 319 (14.7%) | 161 (8.4%) |
| 7:00 AM to 7:29 AM | 217 (10.0%) | 217 (11.4%) |
| 7:30 AM to 7:59 AM | 311 (14.4%) | 184 (9.6%) |
| 8:00 AM to 8:29 AM | 294 (13.6%) | 351 (18.4%) |
| 8:30 AM to 8:59 AM | 202 (9.3%) | 178 (9.3%) |
| 9:00 AM to 9:59 AM | 160 (7.4%) | 212 (11.1%) |
| 10:00 AM to 10:59 AM | 11 (0.5%) | 46 (2.4%) |
| 11:00 AM to 11:59 AM | 15 (0.7%) | 85 (4.4%) |
| 12:00 PM to 3:59 PM | 129 (6.0%) | 98 (5.1%) |
| 4:00 PM to 11:59 PM | 131 (6.0%) | 110 (5.8%) |
| Total | 2,164 (100.0%) | 1,909 (100.0%) |
Housing Occupancy in Middletown
Occupancy by Ownership in Middletown
Of the total 4,307 dwellings in Middletown, owner-occupied units account for 2,737 (63.5%), while renter-occupied units make up 1,570 (36.4%).
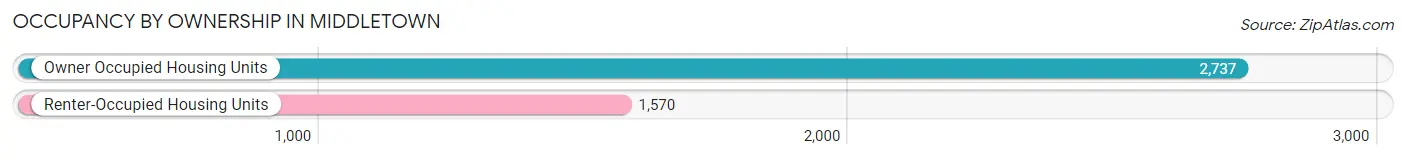
| Occupancy | # Housing Units | % Housing Units |
| Owner Occupied Housing Units | 2,737 | 63.5% |
| Renter-Occupied Housing Units | 1,570 | 36.4% |
| Total Occupied Housing Units | 4,307 | 100.0% |
Occupancy by Household Size in Middletown
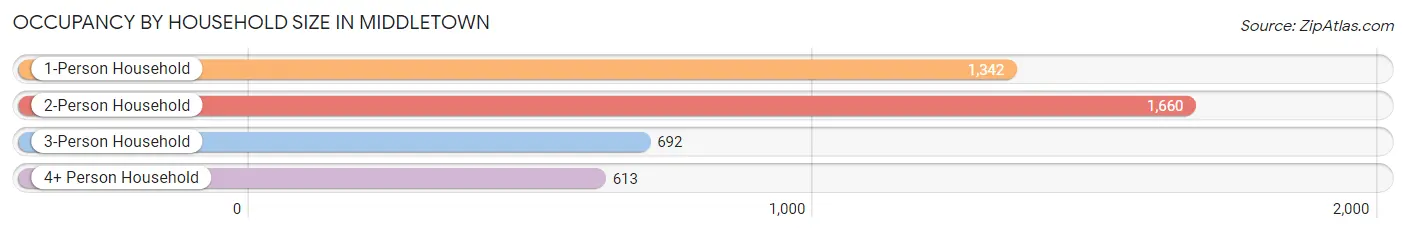
| Household Size | # Housing Units | % Housing Units |
| 1-Person Household | 1,342 | 31.2% |
| 2-Person Household | 1,660 | 38.5% |
| 3-Person Household | 692 | 16.1% |
| 4+ Person Household | 613 | 14.2% |
| Total Housing Units | 4,307 | 100.0% |
Occupancy by Ownership by Household Size in Middletown
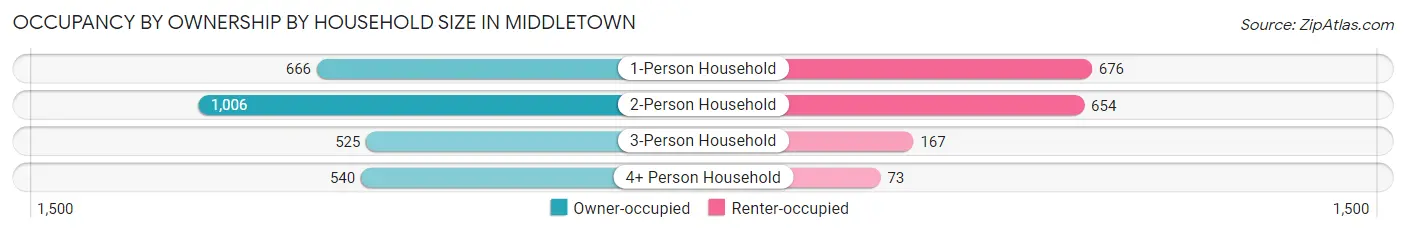
| Household Size | Owner-occupied | Renter-occupied |
| 1-Person Household | 666 (49.6%) | 676 (50.4%) |
| 2-Person Household | 1,006 (60.6%) | 654 (39.4%) |
| 3-Person Household | 525 (75.9%) | 167 (24.1%) |
| 4+ Person Household | 540 (88.1%) | 73 (11.9%) |
| Total Housing Units | 2,737 (63.5%) | 1,570 (36.4%) |
Occupancy by Educational Attainment in Middletown
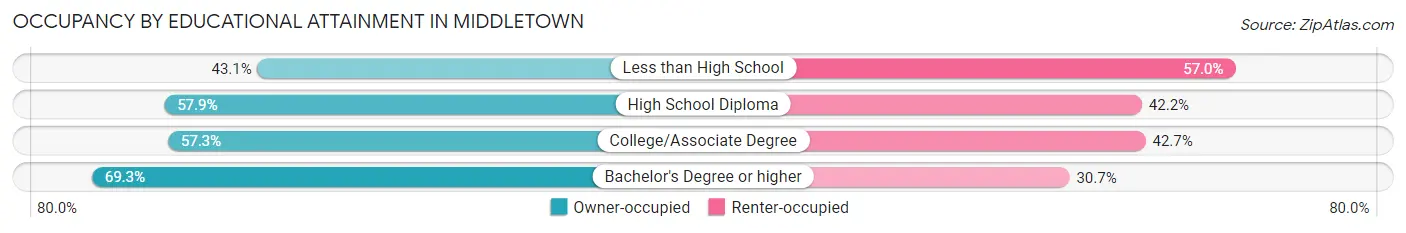
| Household Size | Owner-occupied | Renter-occupied |
| Less than High School | 65 (43.0%) | 86 (57.0%) |
| High School Diploma | 442 (57.9%) | 322 (42.1%) |
| College/Associate Degree | 579 (57.3%) | 432 (42.7%) |
| Bachelor's Degree or higher | 1,651 (69.3%) | 730 (30.7%) |
Occupancy by Age of Householder in Middletown
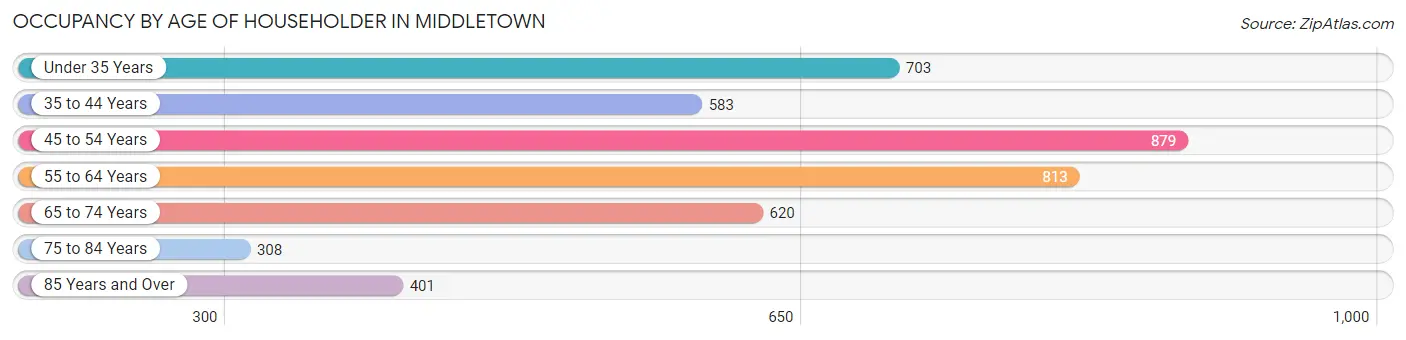
| Age Bracket | # Households | % Households |
| Under 35 Years | 703 | 16.3% |
| 35 to 44 Years | 583 | 13.5% |
| 45 to 54 Years | 879 | 20.4% |
| 55 to 64 Years | 813 | 18.9% |
| 65 to 74 Years | 620 | 14.4% |
| 75 to 84 Years | 308 | 7.1% |
| 85 Years and Over | 401 | 9.3% |
| Total | 4,307 | 100.0% |
Housing Finances in Middletown
Median Income by Occupancy in Middletown
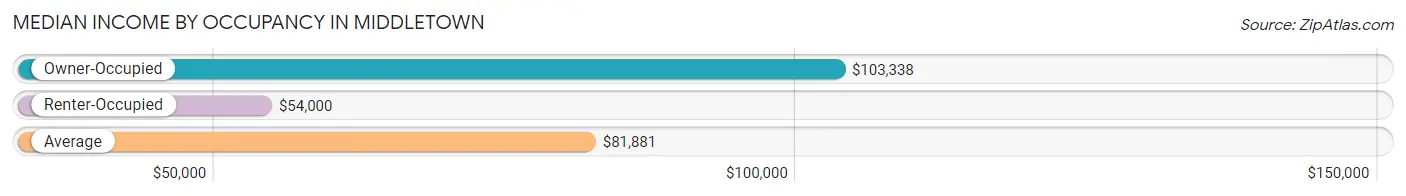
| Occupancy Type | # Households | Median Income |
| Owner-Occupied | 2,737 (63.5%) | $103,338 |
| Renter-Occupied | 1,570 (36.4%) | $54,000 |
| Average | 4,307 (100.0%) | $81,881 |
Occupancy by Householder Income Bracket in Middletown
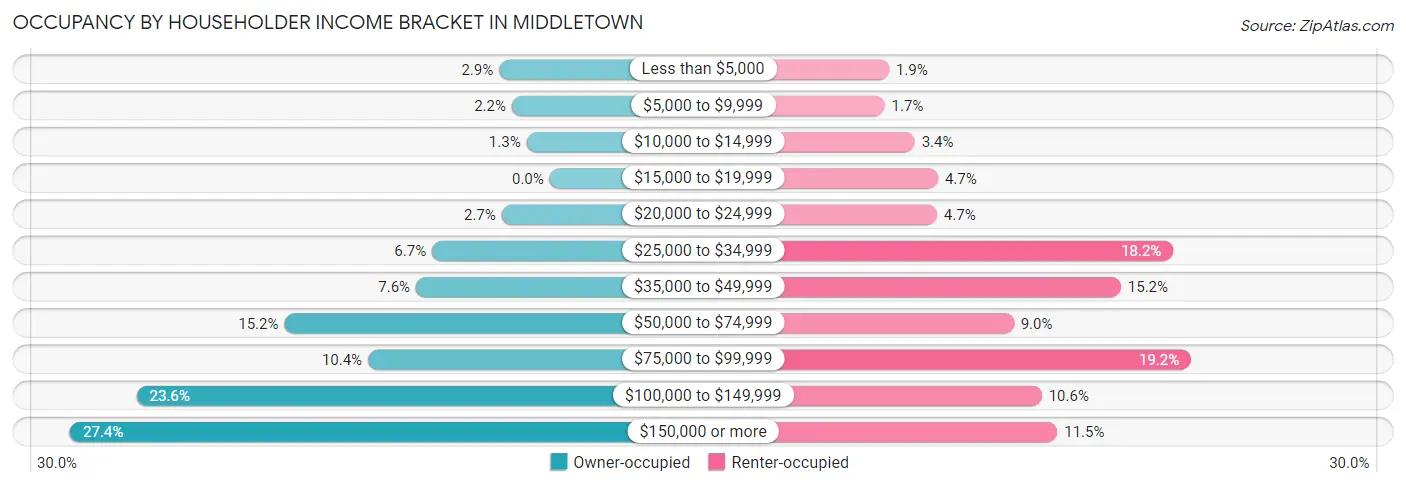
| Income Bracket | Owner-occupied | Renter-occupied |
| Less than $5,000 | 79 (2.9%) | 30 (1.9%) |
| $5,000 to $9,999 | 59 (2.2%) | 26 (1.7%) |
| $10,000 to $14,999 | 36 (1.3%) | 53 (3.4%) |
| $15,000 to $19,999 | 0 (0.0%) | 74 (4.7%) |
| $20,000 to $24,999 | 75 (2.7%) | 73 (4.6%) |
| $25,000 to $34,999 | 184 (6.7%) | 285 (18.1%) |
| $35,000 to $49,999 | 209 (7.6%) | 238 (15.2%) |
| $50,000 to $74,999 | 415 (15.2%) | 142 (9.0%) |
| $75,000 to $99,999 | 284 (10.4%) | 301 (19.2%) |
| $100,000 to $149,999 | 646 (23.6%) | 167 (10.6%) |
| $150,000 or more | 750 (27.4%) | 181 (11.5%) |
| Total | 2,737 (100.0%) | 1,570 (100.0%) |
Monthly Housing Cost Tiers in Middletown
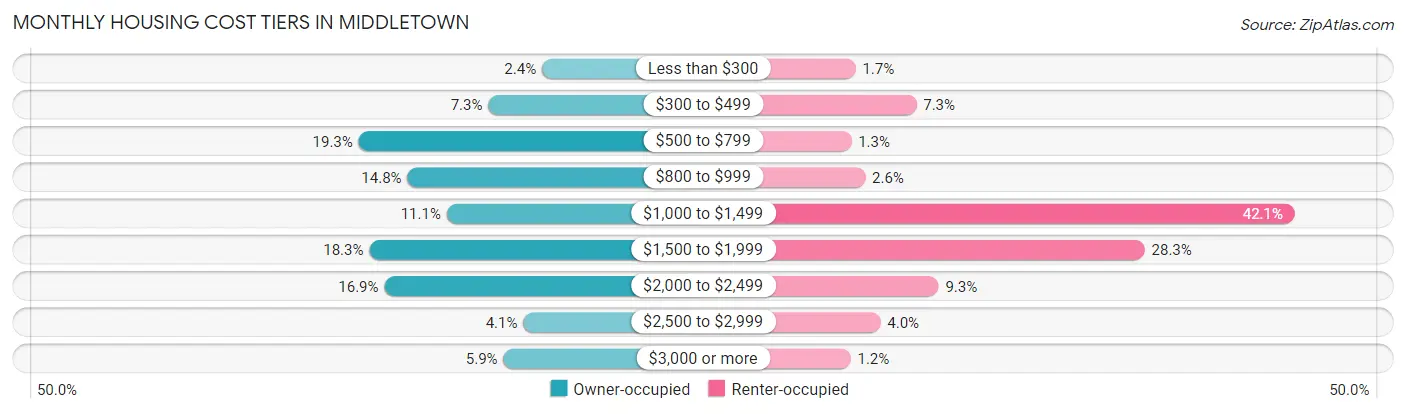
| Monthly Cost | Owner-occupied | Renter-occupied |
| Less than $300 | 65 (2.4%) | 26 (1.7%) |
| $300 to $499 | 200 (7.3%) | 114 (7.3%) |
| $500 to $799 | 527 (19.3%) | 20 (1.3%) |
| $800 to $999 | 404 (14.8%) | 40 (2.5%) |
| $1,000 to $1,499 | 305 (11.1%) | 661 (42.1%) |
| $1,500 to $1,999 | 500 (18.3%) | 444 (28.3%) |
| $2,000 to $2,499 | 462 (16.9%) | 146 (9.3%) |
| $2,500 to $2,999 | 112 (4.1%) | 62 (4.0%) |
| $3,000 or more | 162 (5.9%) | 19 (1.2%) |
| Total | 2,737 (100.0%) | 1,570 (100.0%) |
Physical Housing Characteristics in Middletown
Housing Structures in Middletown
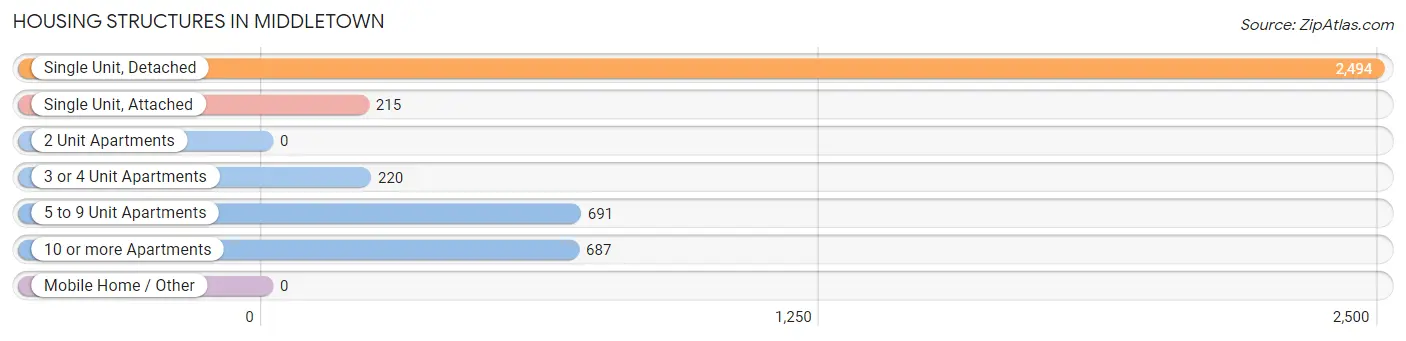
| Structure Type | # Housing Units | % Housing Units |
| Single Unit, Detached | 2,494 | 57.9% |
| Single Unit, Attached | 215 | 5.0% |
| 2 Unit Apartments | 0 | 0.0% |
| 3 or 4 Unit Apartments | 220 | 5.1% |
| 5 to 9 Unit Apartments | 691 | 16.0% |
| 10 or more Apartments | 687 | 16.0% |
| Mobile Home / Other | 0 | 0.0% |
| Total | 4,307 | 100.0% |
Housing Structures by Occupancy in Middletown
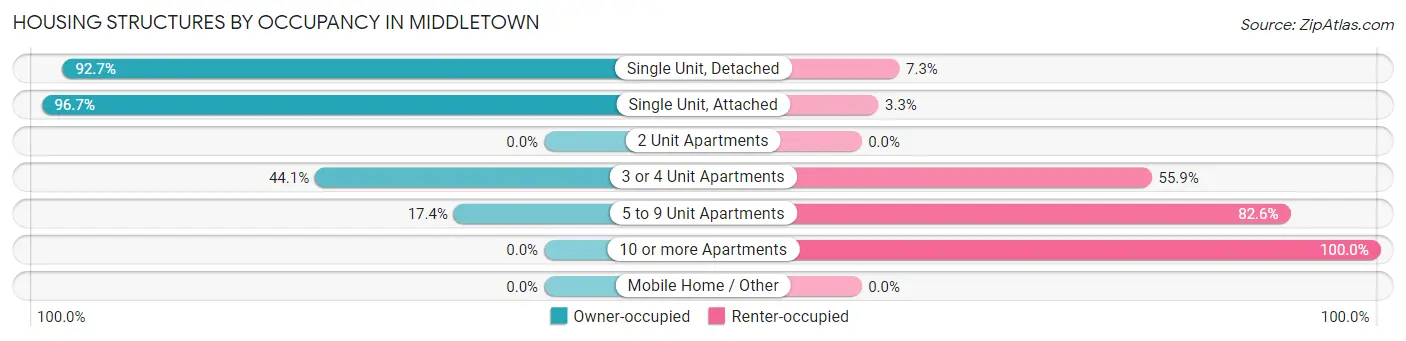
| Structure Type | Owner-occupied | Renter-occupied |
| Single Unit, Detached | 2,312 (92.7%) | 182 (7.3%) |
| Single Unit, Attached | 208 (96.7%) | 7 (3.3%) |
| 2 Unit Apartments | 0 (0.0%) | 0 (0.0%) |
| 3 or 4 Unit Apartments | 97 (44.1%) | 123 (55.9%) |
| 5 to 9 Unit Apartments | 120 (17.4%) | 571 (82.6%) |
| 10 or more Apartments | 0 (0.0%) | 687 (100.0%) |
| Mobile Home / Other | 0 (0.0%) | 0 (0.0%) |
| Total | 2,737 (63.5%) | 1,570 (36.4%) |
Housing Structures by Number of Rooms in Middletown
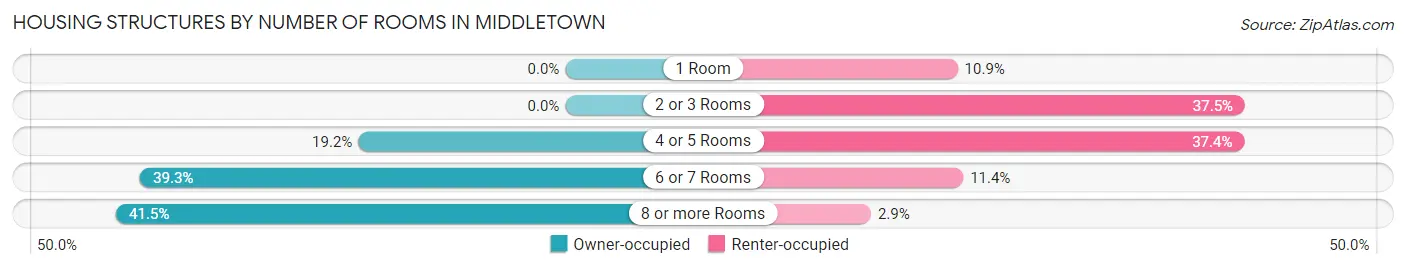
| Number of Rooms | Owner-occupied | Renter-occupied |
| 1 Room | 0 (0.0%) | 171 (10.9%) |
| 2 or 3 Rooms | 0 (0.0%) | 588 (37.4%) |
| 4 or 5 Rooms | 524 (19.2%) | 587 (37.4%) |
| 6 or 7 Rooms | 1,076 (39.3%) | 179 (11.4%) |
| 8 or more Rooms | 1,137 (41.5%) | 45 (2.9%) |
| Total | 2,737 (100.0%) | 1,570 (100.0%) |
Housing Structure by Heating Type in Middletown
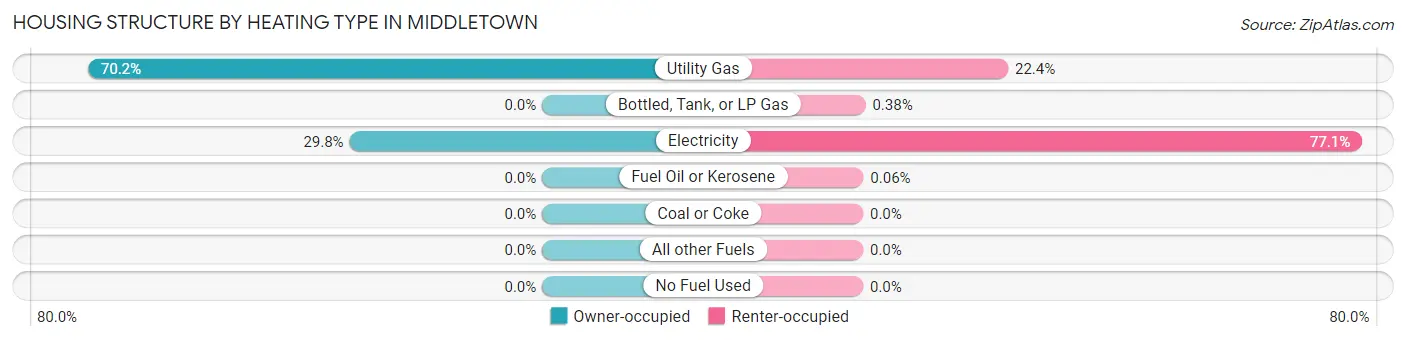
| Heating Type | Owner-occupied | Renter-occupied |
| Utility Gas | 1,922 (70.2%) | 352 (22.4%) |
| Bottled, Tank, or LP Gas | 0 (0.0%) | 6 (0.4%) |
| Electricity | 815 (29.8%) | 1,211 (77.1%) |
| Fuel Oil or Kerosene | 0 (0.0%) | 1 (0.1%) |
| Coal or Coke | 0 (0.0%) | 0 (0.0%) |
| All other Fuels | 0 (0.0%) | 0 (0.0%) |
| No Fuel Used | 0 (0.0%) | 0 (0.0%) |
| Total | 2,737 (100.0%) | 1,570 (100.0%) |
Household Vehicle Usage in Middletown
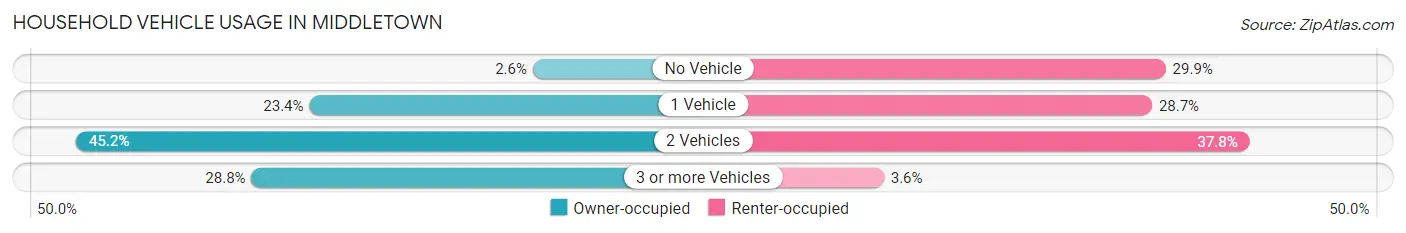
| Vehicles per Household | Owner-occupied | Renter-occupied |
| No Vehicle | 70 (2.6%) | 470 (29.9%) |
| 1 Vehicle | 641 (23.4%) | 450 (28.7%) |
| 2 Vehicles | 1,237 (45.2%) | 593 (37.8%) |
| 3 or more Vehicles | 789 (28.8%) | 57 (3.6%) |
| Total | 2,737 (100.0%) | 1,570 (100.0%) |
Real Estate & Mortgages in Middletown
Real Estate and Mortgage Overview in Middletown
| Characteristic | Without Mortgage | With Mortgage |
| Housing Units | 984 | 1,753 |
| Median Property Value | $273,000 | $294,300 |
| Median Household Income | $85,259 | $519 |
| Monthly Housing Costs | $663 | $162 |
| Real Estate Taxes | $2,369 | $24 |
Property Value by Mortgage Status in Middletown
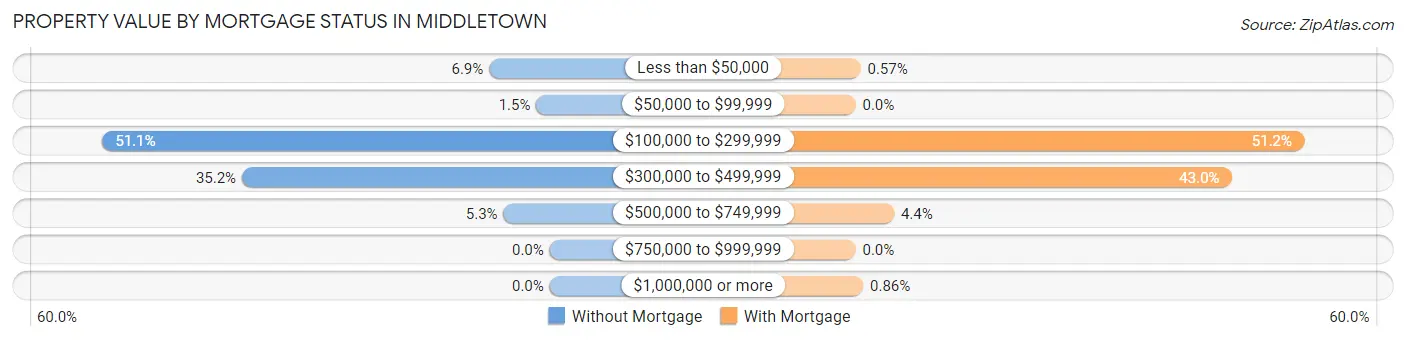
| Property Value | Without Mortgage | With Mortgage |
| Less than $50,000 | 68 (6.9%) | 10 (0.6%) |
| $50,000 to $99,999 | 15 (1.5%) | 0 (0.0%) |
| $100,000 to $299,999 | 503 (51.1%) | 898 (51.2%) |
| $300,000 to $499,999 | 346 (35.2%) | 753 (42.9%) |
| $500,000 to $749,999 | 52 (5.3%) | 77 (4.4%) |
| $750,000 to $999,999 | 0 (0.0%) | 0 (0.0%) |
| $1,000,000 or more | 0 (0.0%) | 15 (0.9%) |
| Total | 984 (100.0%) | 1,753 (100.0%) |
Household Income by Mortgage Status in Middletown
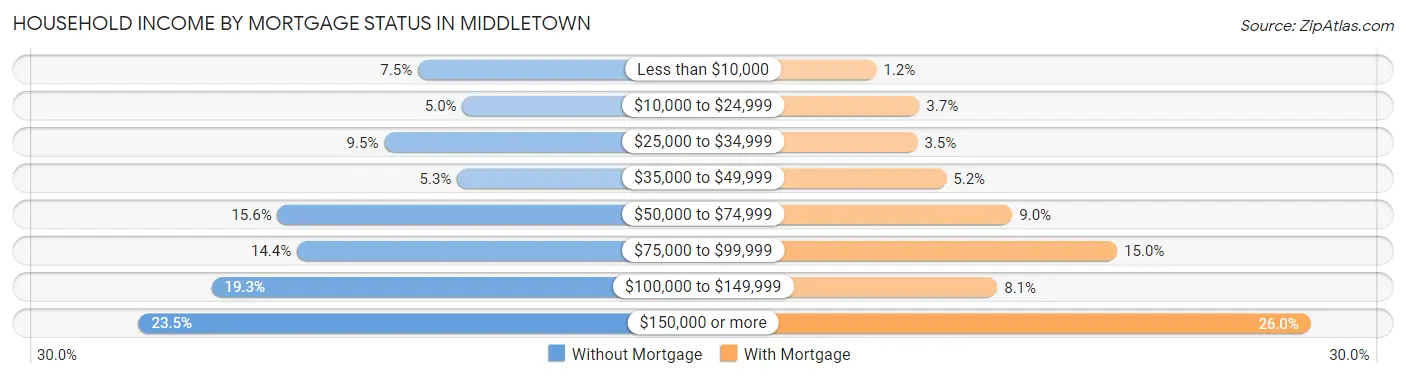
| Household Income | Without Mortgage | With Mortgage |
| Less than $10,000 | 74 (7.5%) | 21 (1.2%) |
| $10,000 to $24,999 | 49 (5.0%) | 64 (3.6%) |
| $25,000 to $34,999 | 93 (9.5%) | 62 (3.5%) |
| $35,000 to $49,999 | 52 (5.3%) | 91 (5.2%) |
| $50,000 to $74,999 | 153 (15.5%) | 157 (9.0%) |
| $75,000 to $99,999 | 142 (14.4%) | 262 (14.9%) |
| $100,000 to $149,999 | 190 (19.3%) | 142 (8.1%) |
| $150,000 or more | 231 (23.5%) | 456 (26.0%) |
| Total | 984 (100.0%) | 1,753 (100.0%) |
Property Value to Household Income Ratio in Middletown
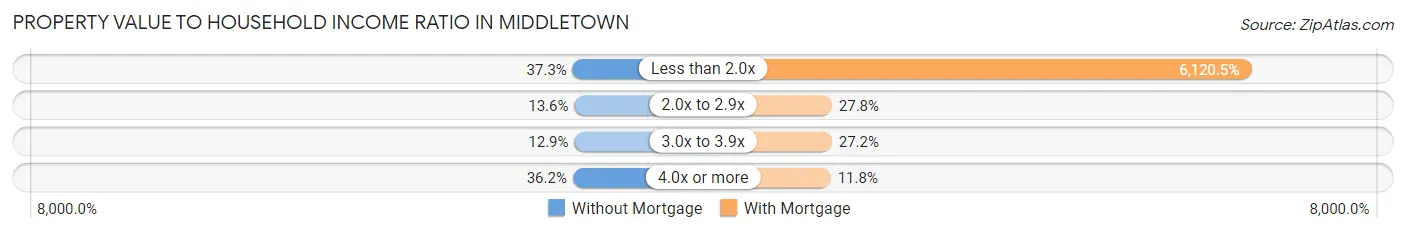
| Value-to-Income Ratio | Without Mortgage | With Mortgage |
| Less than 2.0x | 367 (37.3%) | 107,292 (6,120.5%) |
| 2.0x to 2.9x | 134 (13.6%) | 488 (27.8%) |
| 3.0x to 3.9x | 127 (12.9%) | 476 (27.2%) |
| 4.0x or more | 356 (36.2%) | 206 (11.7%) |
| Total | 984 (100.0%) | 1,753 (100.0%) |
Real Estate Taxes by Mortgage Status in Middletown
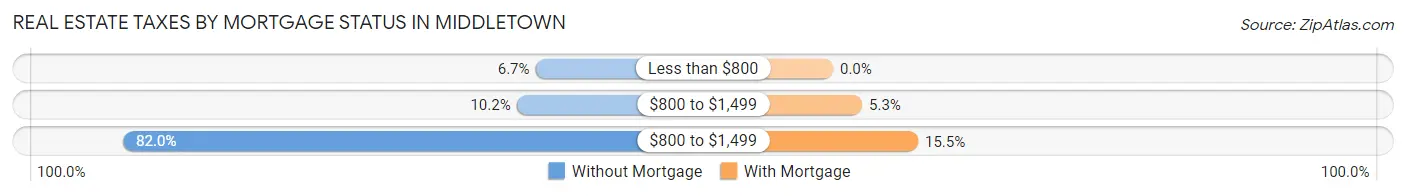
| Property Taxes | Without Mortgage | With Mortgage |
| Less than $800 | 66 (6.7%) | 0 (0.0%) |
| $800 to $1,499 | 100 (10.2%) | 93 (5.3%) |
| $800 to $1,499 | 807 (82.0%) | 272 (15.5%) |
| Total | 984 (100.0%) | 1,753 (100.0%) |
Health & Disability in Middletown
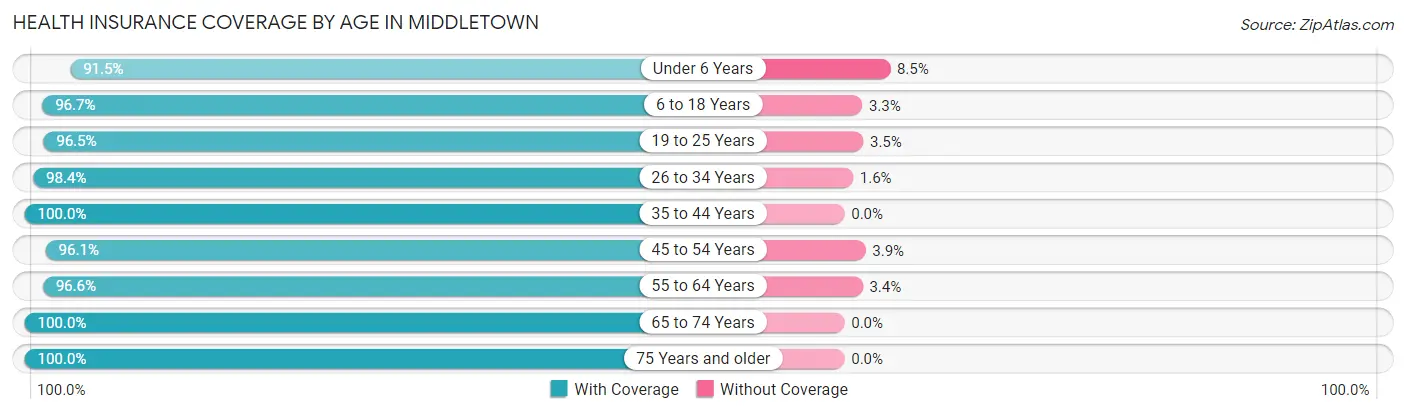
Health Insurance Coverage by Age in Middletown
| Age Bracket | With Coverage | Without Coverage |
| Under 6 Years | 591 (91.5%) | 55 (8.5%) |
| 6 to 18 Years | 1,321 (96.7%) | 45 (3.3%) |
| 19 to 25 Years | 747 (96.5%) | 27 (3.5%) |
| 26 to 34 Years | 981 (98.4%) | 16 (1.6%) |
| 35 to 44 Years | 907 (100.0%) | 0 (0.0%) |
| 45 to 54 Years | 1,271 (96.1%) | 52 (3.9%) |
| 55 to 64 Years | 1,255 (96.6%) | 44 (3.4%) |
| 65 to 74 Years | 1,192 (100.0%) | 0 (0.0%) |
| 75 Years and older | 1,082 (100.0%) | 0 (0.0%) |
| Total | 9,347 (97.5%) | 239 (2.5%) |
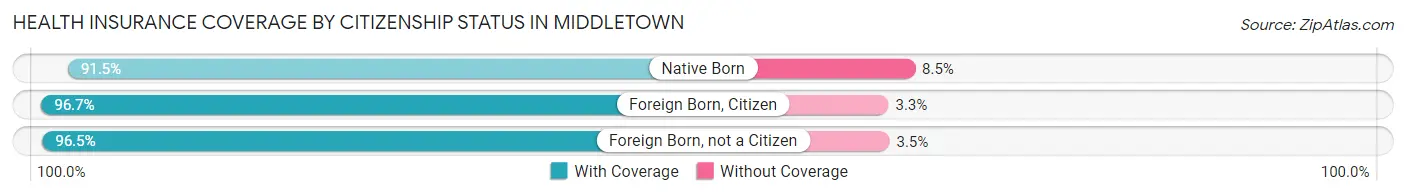
Health Insurance Coverage by Citizenship Status in Middletown
| Citizenship Status | With Coverage | Without Coverage |
| Native Born | 591 (91.5%) | 55 (8.5%) |
| Foreign Born, Citizen | 1,321 (96.7%) | 45 (3.3%) |
| Foreign Born, not a Citizen | 747 (96.5%) | 27 (3.5%) |
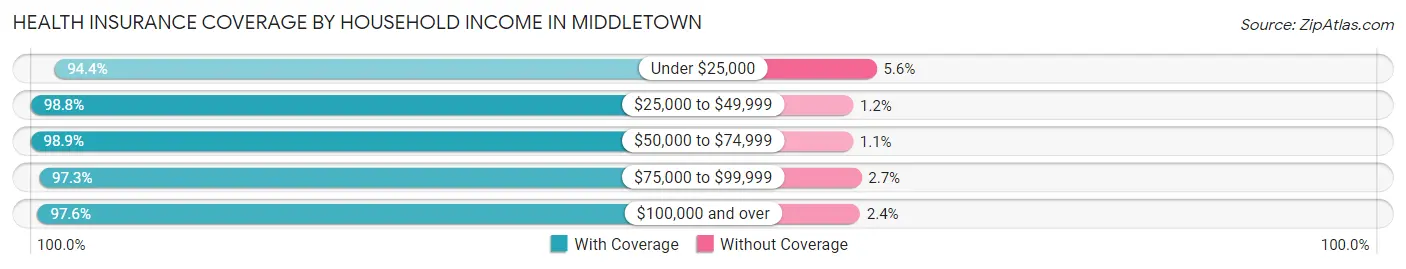
Health Insurance Coverage by Household Income in Middletown
| Household Income | With Coverage | Without Coverage |
| Under $25,000 | 883 (94.4%) | 52 (5.6%) |
| $25,000 to $49,999 | 1,340 (98.8%) | 16 (1.2%) |
| $50,000 to $74,999 | 1,051 (98.9%) | 12 (1.1%) |
| $75,000 to $99,999 | 1,145 (97.3%) | 32 (2.7%) |
| $100,000 and over | 4,916 (97.6%) | 123 (2.4%) |
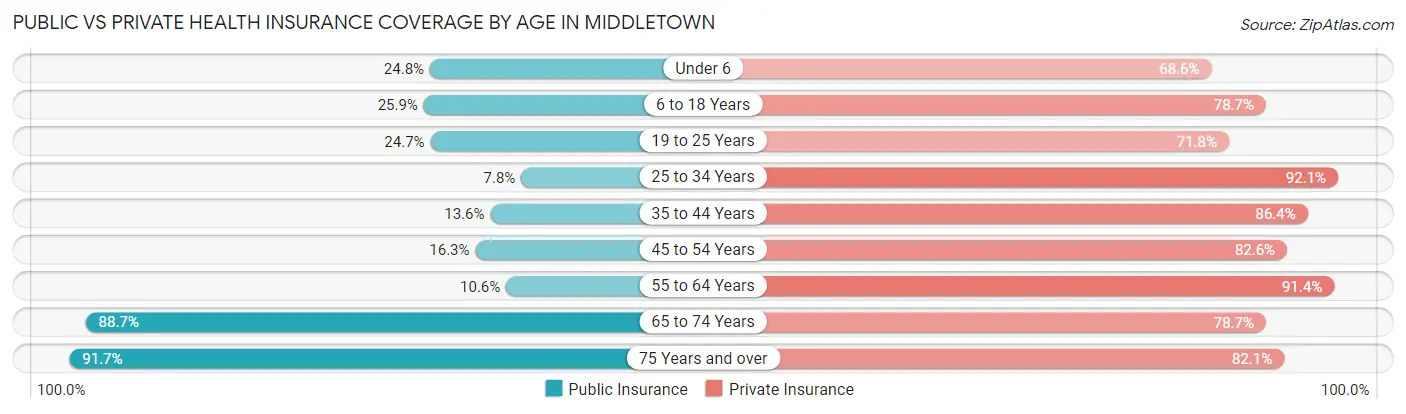
Public vs Private Health Insurance Coverage by Age in Middletown
| Age Bracket | Public Insurance | Private Insurance |
| Under 6 | 160 (24.8%) | 443 (68.6%) |
| 6 to 18 Years | 354 (25.9%) | 1,075 (78.7%) |
| 19 to 25 Years | 191 (24.7%) | 556 (71.8%) |
| 25 to 34 Years | 78 (7.8%) | 918 (92.1%) |
| 35 to 44 Years | 123 (13.6%) | 784 (86.4%) |
| 45 to 54 Years | 216 (16.3%) | 1,093 (82.6%) |
| 55 to 64 Years | 138 (10.6%) | 1,187 (91.4%) |
| 65 to 74 Years | 1,057 (88.7%) | 938 (78.7%) |
| 75 Years and over | 992 (91.7%) | 888 (82.1%) |
| Total | 3,309 (34.5%) | 7,882 (82.2%) |
Disability Status by Sex by Age in Middletown
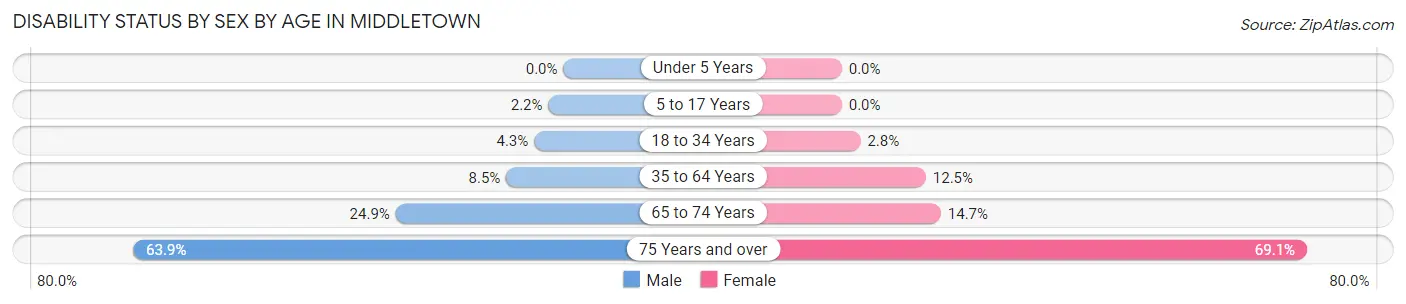
| Age Bracket | Male | Female |
| Under 5 Years | 0 (0.0%) | 0 (0.0%) |
| 5 to 17 Years | 15 (2.2%) | 0 (0.0%) |
| 18 to 34 Years | 35 (4.3%) | 31 (2.8%) |
| 35 to 64 Years | 154 (8.5%) | 214 (12.5%) |
| 65 to 74 Years | 131 (24.9%) | 98 (14.7%) |
| 75 Years and over | 299 (63.9%) | 424 (69.1%) |
Disability Class by Sex by Age in Middletown
Disability Class: Hearing Difficulty
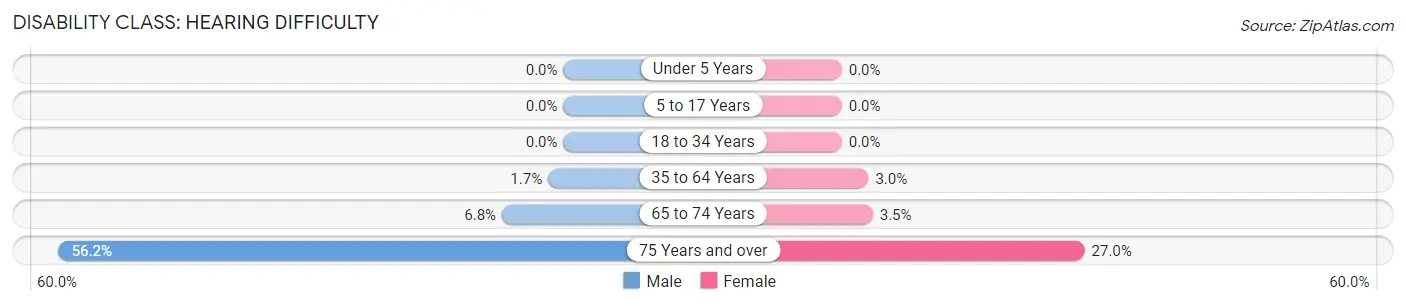
| Age Bracket | Male | Female |
| Under 5 Years | 0 (0.0%) | 0 (0.0%) |
| 5 to 17 Years | 0 (0.0%) | 0 (0.0%) |
| 18 to 34 Years | 0 (0.0%) | 0 (0.0%) |
| 35 to 64 Years | 31 (1.7%) | 51 (3.0%) |
| 65 to 74 Years | 36 (6.8%) | 23 (3.5%) |
| 75 Years and over | 263 (56.2%) | 166 (27.0%) |
Disability Class: Vision Difficulty
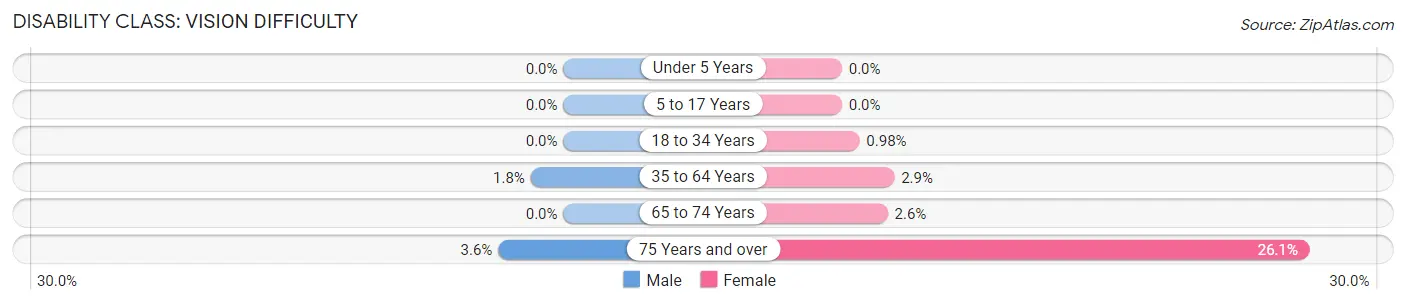
| Age Bracket | Male | Female |
| Under 5 Years | 0 (0.0%) | 0 (0.0%) |
| 5 to 17 Years | 0 (0.0%) | 0 (0.0%) |
| 18 to 34 Years | 0 (0.0%) | 11 (1.0%) |
| 35 to 64 Years | 33 (1.8%) | 50 (2.9%) |
| 65 to 74 Years | 0 (0.0%) | 17 (2.5%) |
| 75 Years and over | 17 (3.6%) | 160 (26.1%) |
Disability Class: Cognitive Difficulty

| Age Bracket | Male | Female |
| 5 to 17 Years | 15 (2.2%) | 0 (0.0%) |
| 18 to 34 Years | 35 (4.3%) | 20 (1.8%) |
| 35 to 64 Years | 74 (4.1%) | 77 (4.5%) |
| 65 to 74 Years | 0 (0.0%) | 24 (3.6%) |
| 75 Years and over | 43 (9.2%) | 192 (31.3%) |
Disability Class: Ambulatory Difficulty
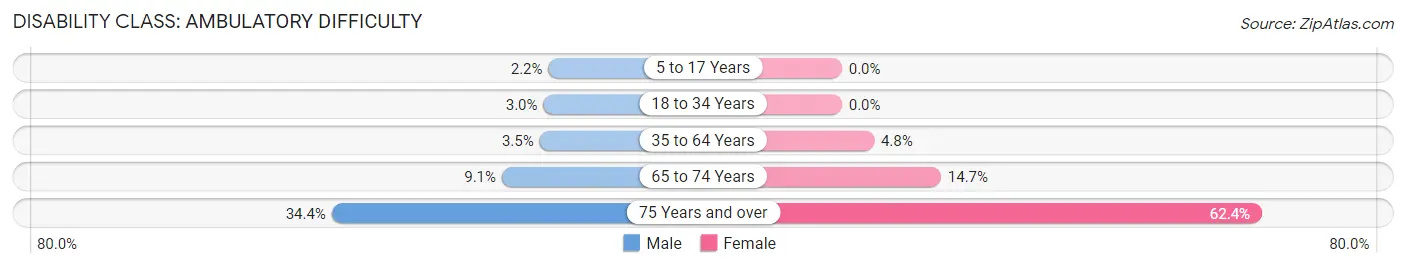
| Age Bracket | Male | Female |
| 5 to 17 Years | 15 (2.2%) | 0 (0.0%) |
| 18 to 34 Years | 24 (3.0%) | 0 (0.0%) |
| 35 to 64 Years | 64 (3.5%) | 82 (4.8%) |
| 65 to 74 Years | 48 (9.1%) | 98 (14.7%) |
| 75 Years and over | 161 (34.4%) | 383 (62.4%) |
Disability Class: Self-Care Difficulty
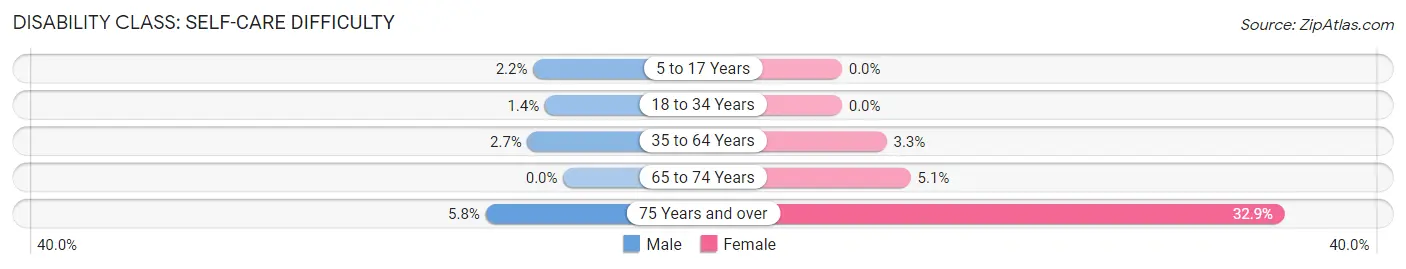
| Age Bracket | Male | Female |
| 5 to 17 Years | 15 (2.2%) | 0 (0.0%) |
| 18 to 34 Years | 11 (1.4%) | 0 (0.0%) |
| 35 to 64 Years | 48 (2.6%) | 57 (3.3%) |
| 65 to 74 Years | 0 (0.0%) | 34 (5.1%) |
| 75 Years and over | 27 (5.8%) | 202 (32.9%) |
Technology Access in Middletown
Computing Device Access in Middletown
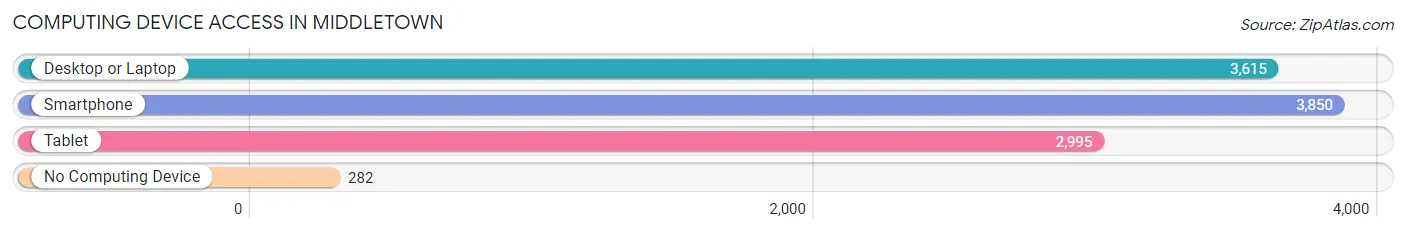
| Device Type | # Households | % Households |
| Desktop or Laptop | 3,615 | 83.9% |
| Smartphone | 3,850 | 89.4% |
| Tablet | 2,995 | 69.5% |
| No Computing Device | 282 | 6.6% |
| Total | 4,307 | 100.0% |
Internet Access in Middletown
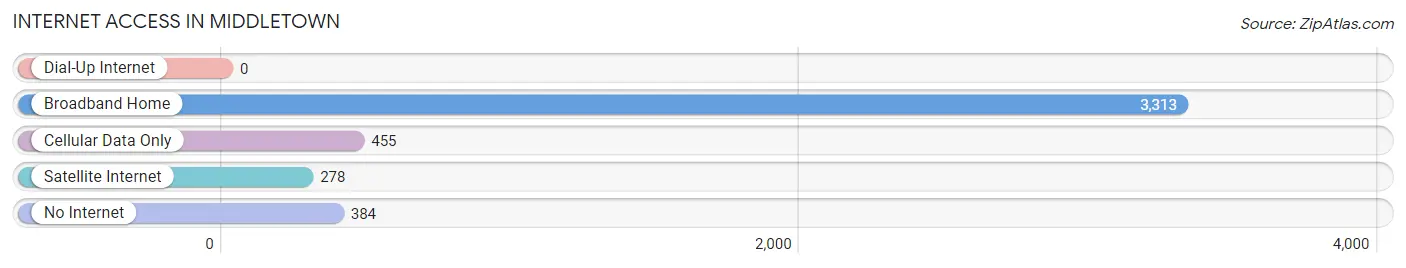
| Internet Type | # Households | % Households |
| Dial-Up Internet | 0 | 0.0% |
| Broadband Home | 3,313 | 76.9% |
| Cellular Data Only | 455 | 10.6% |
| Satellite Internet | 278 | 6.5% |
| No Internet | 384 | 8.9% |
| Total | 4,307 | 100.0% |
Middletown Summary
Middletown, Kentucky is a small city located in Jefferson County, Kentucky. It is situated on the banks of the Ohio River, just south of Louisville. The city has a population of approximately 8,000 people and is part of the Louisville metropolitan area.
History
Middletown was founded in 1817 by William and Mary Middletown, who were among the first settlers in the area. The city was originally known as Middletown Station, and was a stop on the Louisville and Nashville Railroad. The city was incorporated in 1867, and the name was changed to Middletown in 1871.
The city was a major industrial center during the 19th and early 20th centuries, with several factories and mills located in the area. The city was also home to a large number of immigrants, particularly from Germany and Ireland.
Geography
Middletown is located in Jefferson County, Kentucky, on the banks of the Ohio River. The city is situated just south of Louisville, and is part of the Louisville metropolitan area. The city has a total area of 4.2 square miles, all of which is land.
The city is located in a hilly region, with the highest point being the summit of Middletown Hill, which has an elevation of 845 feet. The city is located in a humid subtropical climate zone, with hot, humid summers and mild winters.
Economy
Middletown has a diverse economy, with a variety of industries located in the city. The city is home to several manufacturing companies, including a steel mill, a paper mill, and a plastics plant. The city is also home to a number of retail stores, restaurants, and other businesses.
The city is also home to a number of educational institutions, including the University of Louisville, Jefferson Community and Technical College, and the Kentucky School for the Blind.
Demographics
As of the 2010 census, Middletown had a population of 8,000 people. The racial makeup of the city was 79.3% White, 15.2% African American, 0.3% Native American, 0.7% Asian, 0.1% Pacific Islander, and 4.4% from other races. Hispanic or Latino of any race were 2.2% of the population.
The median household income in Middletown was $41,945, and the median family income was $50,945. The per capita income in the city was $20,945. About 11.2% of the population was below the poverty line.
Middletown is a small city with a rich history and a diverse economy. The city is home to a variety of industries, educational institutions, and businesses, and has a population of 8,000 people. The city is located in a hilly region, and has a humid subtropical climate. The city has a median household income of $41,945, and a median family income of $50,945.
Common Questions
What is Per Capita Income in Middletown?
Per Capita income in Middletown is $48,054.
What is the Median Family Income in Middletown?
Median Family Income in Middletown is $106,828.
What is the Median Household income in Middletown?
Median Household Income in Middletown is $81,881.
What is Income or Wage Gap in Middletown?
Income or Wage Gap in Middletown is 35.6%.
Women in Middletown earn 64.4 cents for every dollar earned by a man.
What is Inequality or Gini Index in Middletown?
Inequality or Gini Index in Middletown is 0.44.
What is the Total Population of Middletown?
Total Population of Middletown is 9,594.
What is the Total Male Population of Middletown?
Total Male Population of Middletown is 4,632.
What is the Total Female Population of Middletown?
Total Female Population of Middletown is 4,962.
What is the Ratio of Males per 100 Females in Middletown?
There are 93.35 Males per 100 Females in Middletown.
What is the Ratio of Females per 100 Males in Middletown?
There are 107.12 Females per 100 Males in Middletown.
What is the Median Population Age in Middletown?
Median Population Age in Middletown is 46.4 Years.
What is the Average Family Size in Middletown
Average Family Size in Middletown is 2.8 People.
What is the Average Household Size in Middletown
Average Household Size in Middletown is 2.2 People.
How Large is the Labor Force in Middletown?
There are 4,930 People in the Labor Forcein in Middletown.
What is the Percentage of People in the Labor Force in Middletown?
62.3% of People are in the Labor Force in Middletown.
What is the Unemployment Rate in Middletown?
Unemployment Rate in Middletown is 5.6%.