Wilder, KY Map & Demographics
Wilder Map
Wilder Overview
$43,548
PER CAPITA INCOME
$96,806
AVG FAMILY INCOME
$66,250
AVG HOUSEHOLD INCOME
51.5%
WAGE / INCOME GAP [ % ]
48.5¢/ $1
WAGE / INCOME GAP [ $ ]
0.52
INEQUALITY / GINI INDEX
3,152
TOTAL POPULATION
1,716
MALE POPULATION
1,436
FEMALE POPULATION
119.50
MALES / 100 FEMALES
83.68
FEMALES / 100 MALES
42.4
MEDIAN AGE
2.8
AVG FAMILY SIZE
2.0
AVG HOUSEHOLD SIZE
1,577
LABOR FORCE [ PEOPLE ]
58.8%
PERCENT IN LABOR FORCE
5.5%
UNEMPLOYMENT RATE
Wilder Area Codes
Income in Wilder
Income Overview in Wilder
Per Capita Income in Wilder is $43,548, while median incomes of families and households are $96,806 and $66,250 respectively.
| Characteristic | Number | Measure |
| Per Capita Income | 3,152 | $43,548 |
| Median Family Income | 719 | $96,806 |
| Mean Family Income | 719 | $129,401 |
| Median Household Income | 1,595 | $66,250 |
| Mean Household Income | 1,595 | $81,921 |
| Income Deficit | 719 | $0 |
| Wage / Income Gap (%) | 3,152 | 51.48% |
| Wage / Income Gap ($) | 3,152 | 48.52¢ per $1 |
| Gini / Inequality Index | 3,152 | 0.52 |
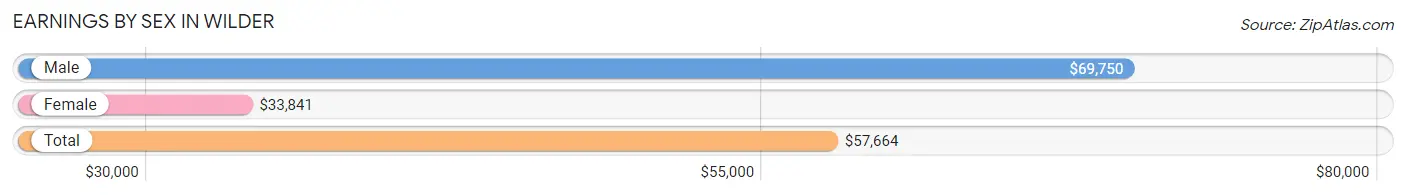
Earnings by Sex in Wilder
Average Earnings in Wilder are $57,664, $69,750 for men and $33,841 for women, a difference of 51.5%.
| Sex | Number | Average Earnings |
| Male | 924 (56.2%) | $69,750 |
| Female | 720 (43.8%) | $33,841 |
| Total | 1,644 (100.0%) | $57,664 |
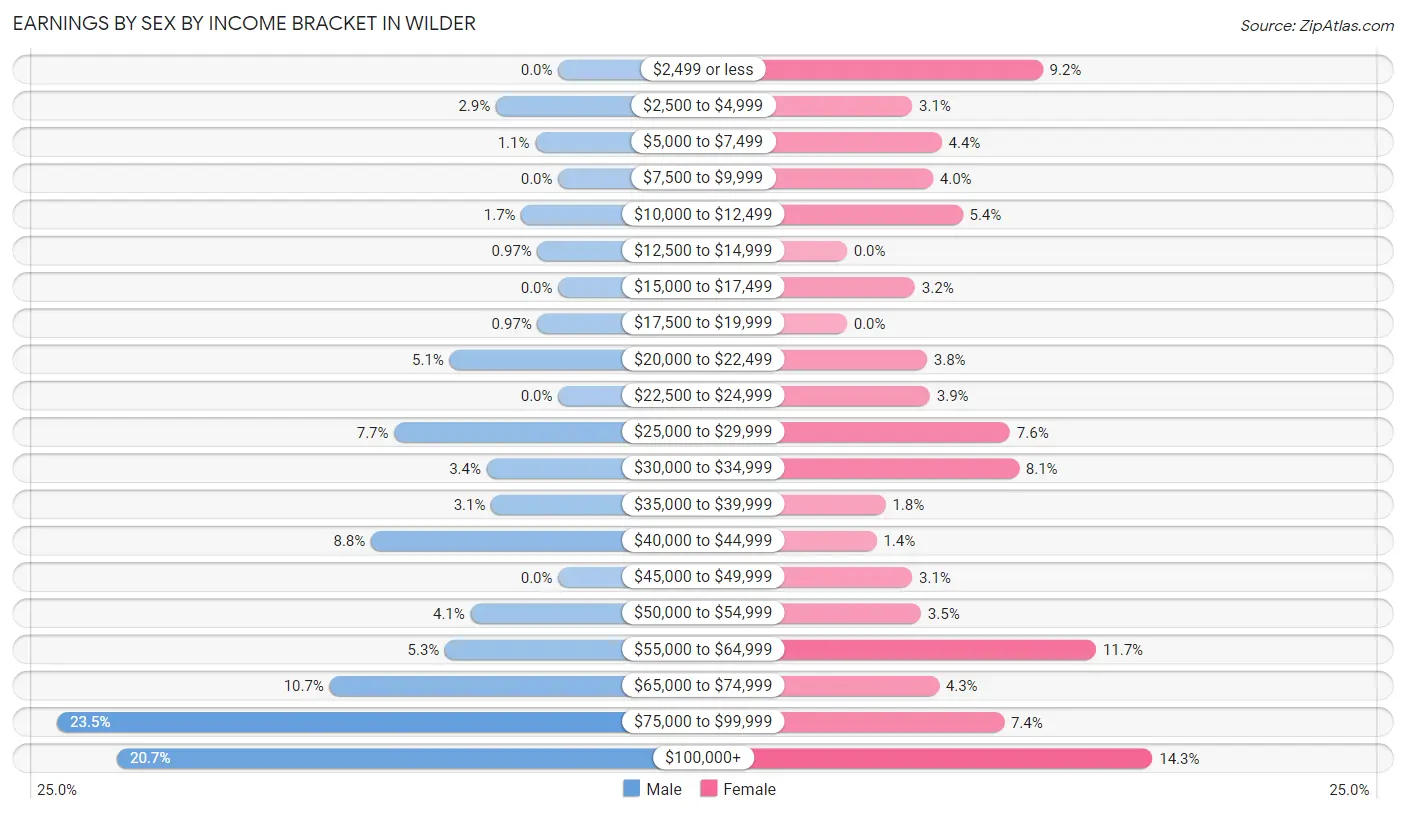
Earnings by Sex by Income Bracket in Wilder
The most common earnings brackets in Wilder are $75,000 to $99,999 for men (217 | 23.5%) and $100,000+ for women (103 | 14.3%).
| Income | Male | Female |
| $2,499 or less | 0 (0.0%) | 66 (9.2%) |
| $2,500 to $4,999 | 27 (2.9%) | 22 (3.1%) |
| $5,000 to $7,499 | 10 (1.1%) | 32 (4.4%) |
| $7,500 to $9,999 | 0 (0.0%) | 29 (4.0%) |
| $10,000 to $12,499 | 16 (1.7%) | 39 (5.4%) |
| $12,500 to $14,999 | 9 (1.0%) | 0 (0.0%) |
| $15,000 to $17,499 | 0 (0.0%) | 23 (3.2%) |
| $17,500 to $19,999 | 9 (1.0%) | 0 (0.0%) |
| $20,000 to $22,499 | 47 (5.1%) | 27 (3.7%) |
| $22,500 to $24,999 | 0 (0.0%) | 28 (3.9%) |
| $25,000 to $29,999 | 71 (7.7%) | 55 (7.6%) |
| $30,000 to $34,999 | 31 (3.4%) | 58 (8.1%) |
| $35,000 to $39,999 | 29 (3.1%) | 13 (1.8%) |
| $40,000 to $44,999 | 81 (8.8%) | 10 (1.4%) |
| $45,000 to $49,999 | 0 (0.0%) | 22 (3.1%) |
| $50,000 to $54,999 | 38 (4.1%) | 25 (3.5%) |
| $55,000 to $64,999 | 49 (5.3%) | 84 (11.7%) |
| $65,000 to $74,999 | 99 (10.7%) | 31 (4.3%) |
| $75,000 to $99,999 | 217 (23.5%) | 53 (7.4%) |
| $100,000+ | 191 (20.7%) | 103 (14.3%) |
| Total | 924 (100.0%) | 720 (100.0%) |
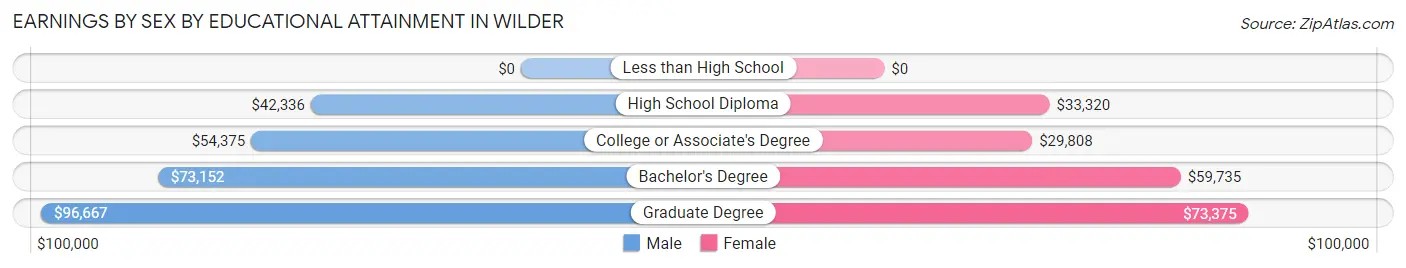
Earnings by Sex by Educational Attainment in Wilder
Average earnings in Wilder are $74,783 for men and $50,089 for women, a difference of 33.0%. Men with an educational attainment of graduate degree enjoy the highest average annual earnings of $96,667, while those with high school diploma education earn the least with $42,336. Women with an educational attainment of graduate degree earn the most with the average annual earnings of $73,375, while those with college or associate's degree education have the smallest earnings of $29,808.
| Educational Attainment | Male Income | Female Income |
| Less than High School | - | - |
| High School Diploma | $42,336 | $33,320 |
| College or Associate's Degree | $54,375 | $29,808 |
| Bachelor's Degree | $73,152 | $59,735 |
| Graduate Degree | $96,667 | $73,375 |
| Total | $74,783 | $50,089 |
Family Income in Wilder
Family Income Brackets in Wilder
According to the Wilder family income data, there are 162 families falling into the $50,000 to $74,999 income range, which is the most common income bracket and makes up 22.5% of all families.
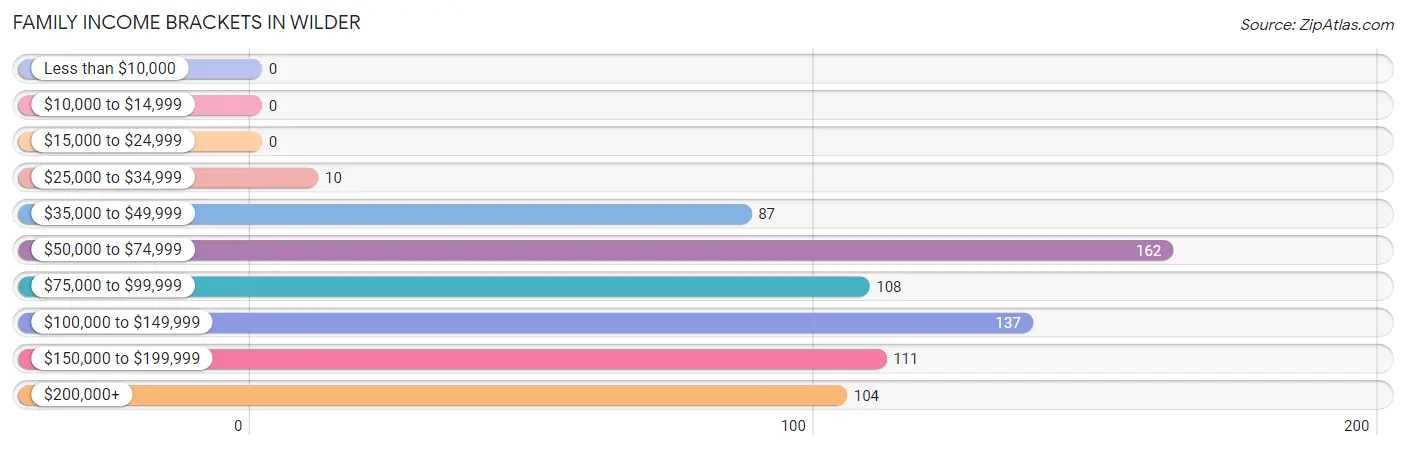
| Income Bracket | # Families | % Families |
| Less than $10,000 | 0 | 0.0% |
| $10,000 to $14,999 | 0 | 0.0% |
| $15,000 to $24,999 | 0 | 0.0% |
| $25,000 to $34,999 | 10 | 1.4% |
| $35,000 to $49,999 | 87 | 12.1% |
| $50,000 to $74,999 | 162 | 22.5% |
| $75,000 to $99,999 | 108 | 15.0% |
| $100,000 to $149,999 | 137 | 19.1% |
| $150,000 to $199,999 | 111 | 15.4% |
| $200,000+ | 104 | 14.5% |
Family Income by Famaliy Size in Wilder
3-person families (135 | 18.8%) account for the highest median family income in Wilder with $120,729 per family, while 2-person families (406 | 56.5%) have the highest median income of $43,221 per family member.
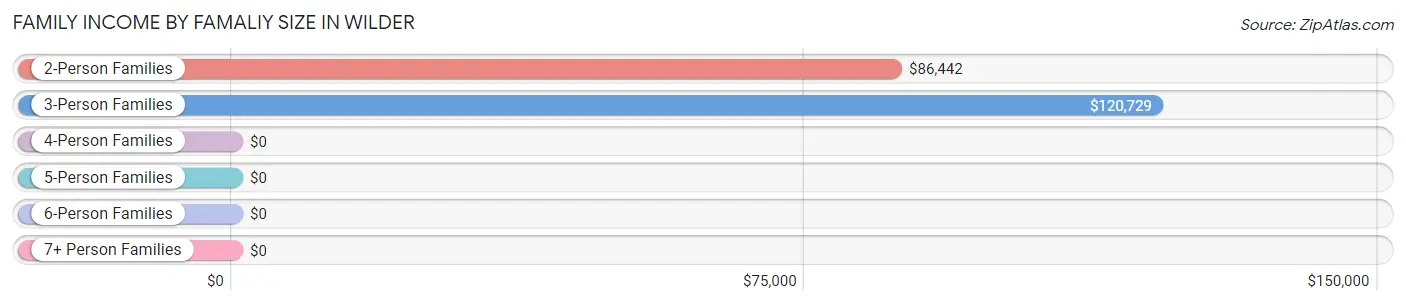
| Income Bracket | # Families | Median Income |
| 2-Person Families | 406 (56.5%) | $86,442 |
| 3-Person Families | 135 (18.8%) | $120,729 |
| 4-Person Families | 119 (16.6%) | $0 |
| 5-Person Families | 20 (2.8%) | $0 |
| 6-Person Families | 39 (5.4%) | $0 |
| 7+ Person Families | 0 (0.0%) | $0 |
| Total | 719 (100.0%) | $96,806 |
Family Income by Number of Earners in Wilder
The median family income in Wilder is $96,806, with families comprising 3+ earners (61) having the highest median family income of $134,375, while families with no earners (43) have the lowest median family income of $78,542, accounting for 8.5% and 6.0% of families, respectively.
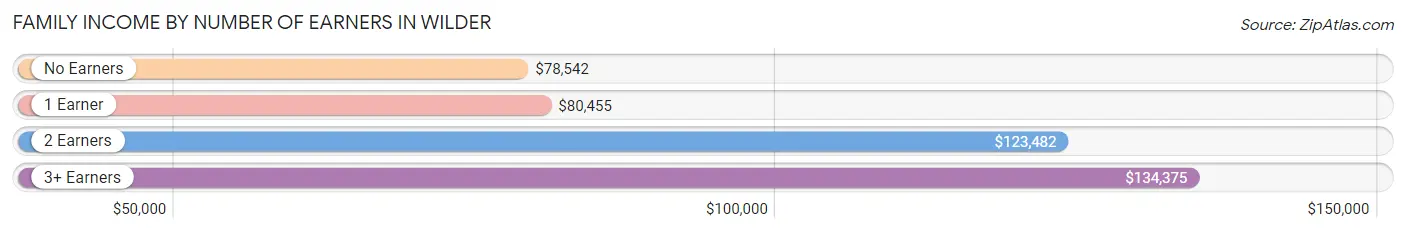
| Number of Earners | # Families | Median Income |
| No Earners | 43 (6.0%) | $78,542 |
| 1 Earner | 318 (44.2%) | $80,455 |
| 2 Earners | 297 (41.3%) | $123,482 |
| 3+ Earners | 61 (8.5%) | $134,375 |
| Total | 719 (100.0%) | $96,806 |
Household Income in Wilder
Household Income Brackets in Wilder
With 381 households falling in the category, the less than $10,000 income range is the most frequent in Wilder, accounting for 23.9% of all households.
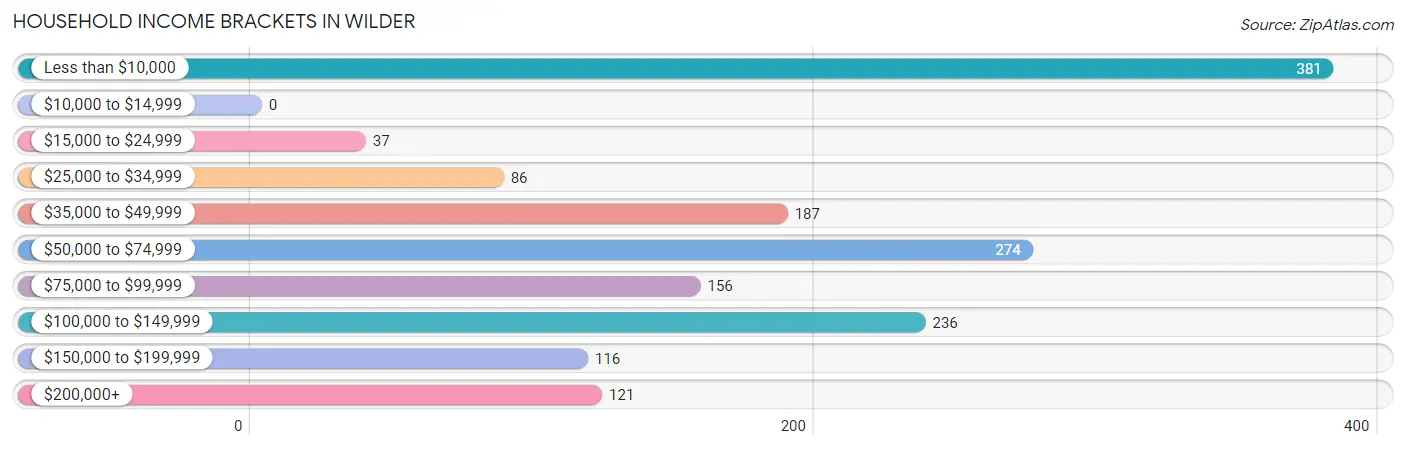
| Income Bracket | # Households | % Households |
| Less than $10,000 | 381 | 23.9% |
| $10,000 to $14,999 | 0 | 0.0% |
| $15,000 to $24,999 | 37 | 2.3% |
| $25,000 to $34,999 | 86 | 5.4% |
| $35,000 to $49,999 | 187 | 11.7% |
| $50,000 to $74,999 | 274 | 17.2% |
| $75,000 to $99,999 | 156 | 9.8% |
| $100,000 to $149,999 | 236 | 14.8% |
| $150,000 to $199,999 | 116 | 7.3% |
| $200,000+ | 121 | 7.6% |
Household Income by Householder Age in Wilder
The median household income in Wilder is $66,250, with the highest median household income of $86,042 found in the 45 to 64 years age bracket for the primary householder. A total of 500 households (31.4%) fall into this category. Meanwhile, the 15 to 24 years age bracket for the primary householder has the lowest median household income of $0, with 37 households (2.3%) in this group.
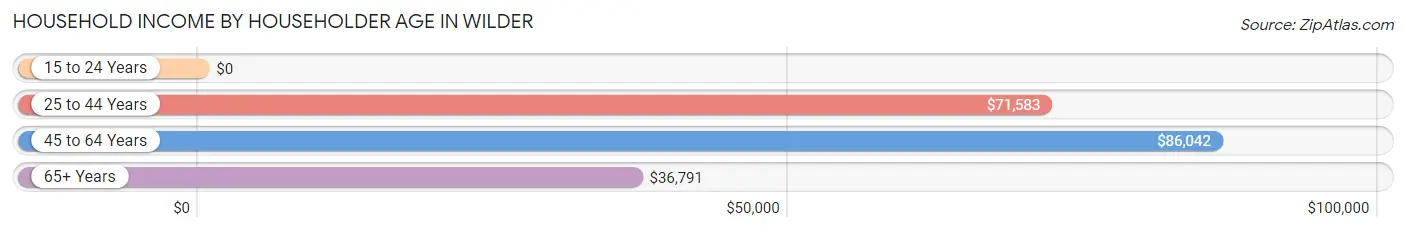
| Income Bracket | # Households | Median Income |
| 15 to 24 Years | 37 (2.3%) | $0 |
| 25 to 44 Years | 501 (31.4%) | $71,583 |
| 45 to 64 Years | 500 (31.4%) | $86,042 |
| 65+ Years | 557 (34.9%) | $36,791 |
| Total | 1,595 (100.0%) | $66,250 |
Poverty in Wilder
Income Below Poverty by Sex and Age in Wilder
With 18.5% poverty level for males and 9.8% for females among the residents of Wilder, 65 to 74 year old males and 25 to 34 year old females are the most vulnerable to poverty, with 178 males (60.5%) and 70 females (37.6%) in their respective age groups living below the poverty level.
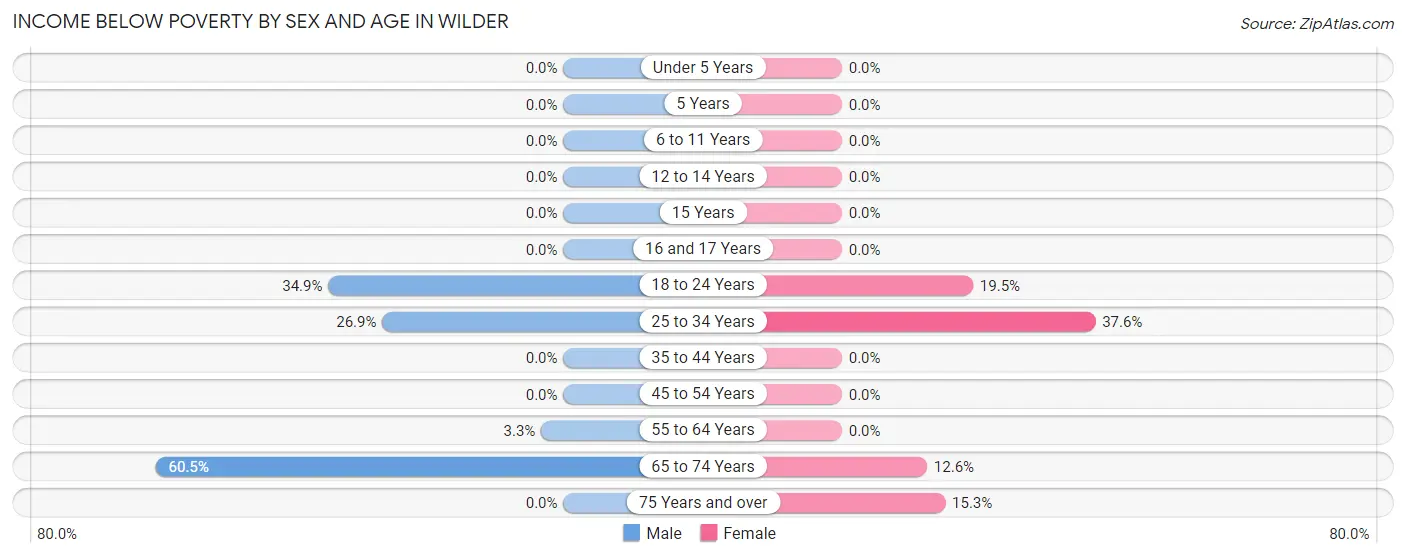
| Age Bracket | Male | Female |
| Under 5 Years | 0 (0.0%) | 0 (0.0%) |
| 5 Years | 0 (0.0%) | 0 (0.0%) |
| 6 to 11 Years | 0 (0.0%) | 0 (0.0%) |
| 12 to 14 Years | 0 (0.0%) | 0 (0.0%) |
| 15 Years | 0 (0.0%) | 0 (0.0%) |
| 16 and 17 Years | 0 (0.0%) | 0 (0.0%) |
| 18 to 24 Years | 37 (34.9%) | 22 (19.5%) |
| 25 to 34 Years | 93 (26.9%) | 70 (37.6%) |
| 35 to 44 Years | 0 (0.0%) | 0 (0.0%) |
| 45 to 54 Years | 0 (0.0%) | 0 (0.0%) |
| 55 to 64 Years | 10 (3.3%) | 0 (0.0%) |
| 65 to 74 Years | 178 (60.5%) | 23 (12.6%) |
| 75 Years and over | 0 (0.0%) | 25 (15.3%) |
| Total | 318 (18.5%) | 140 (9.8%) |
Income Above Poverty by Sex and Age in Wilder
According to the poverty statistics in Wilder, males aged under 5 years and females aged under 5 years are the age groups that are most secure financially, with 100.0% of males and 100.0% of females in these age groups living above the poverty line.
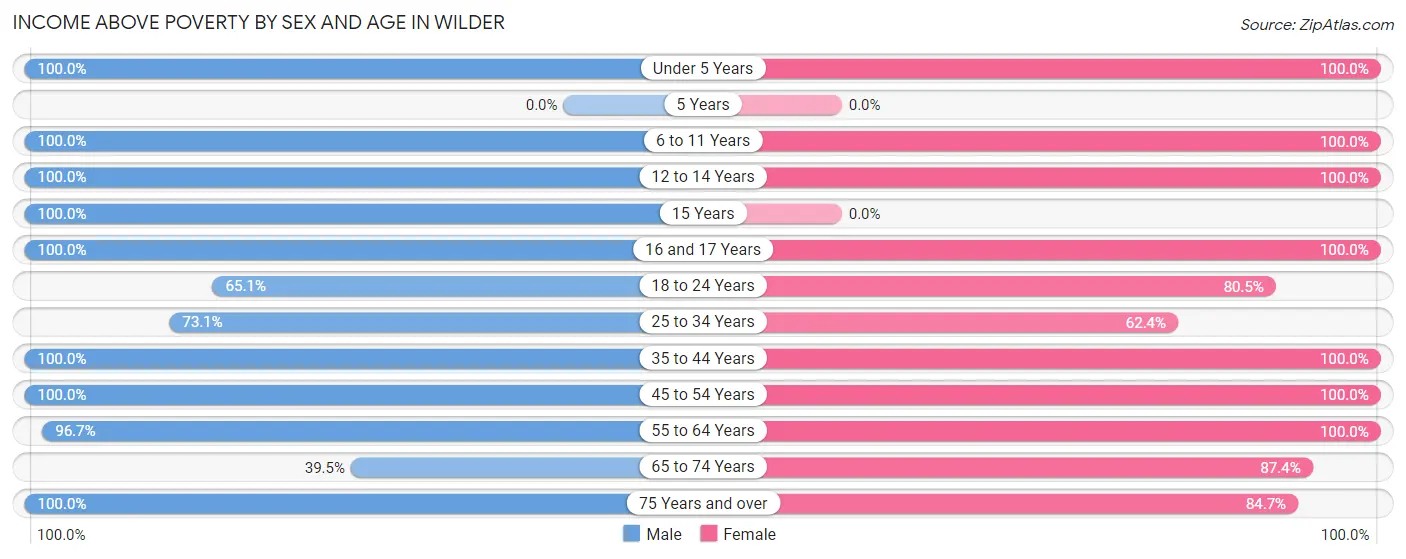
| Age Bracket | Male | Female |
| Under 5 Years | 81 (100.0%) | 70 (100.0%) |
| 5 Years | 0 (0.0%) | 0 (0.0%) |
| 6 to 11 Years | 110 (100.0%) | 107 (100.0%) |
| 12 to 14 Years | 46 (100.0%) | 37 (100.0%) |
| 15 Years | 10 (100.0%) | 0 (0.0%) |
| 16 and 17 Years | 18 (100.0%) | 20 (100.0%) |
| 18 to 24 Years | 69 (65.1%) | 91 (80.5%) |
| 25 to 34 Years | 253 (73.1%) | 116 (62.4%) |
| 35 to 44 Years | 172 (100.0%) | 214 (100.0%) |
| 45 to 54 Years | 157 (100.0%) | 82 (100.0%) |
| 55 to 64 Years | 294 (96.7%) | 253 (100.0%) |
| 65 to 74 Years | 116 (39.5%) | 159 (87.4%) |
| 75 Years and over | 72 (100.0%) | 138 (84.7%) |
| Total | 1,398 (81.5%) | 1,287 (90.2%) |
Income Below Poverty Among Married-Couple Families in Wilder
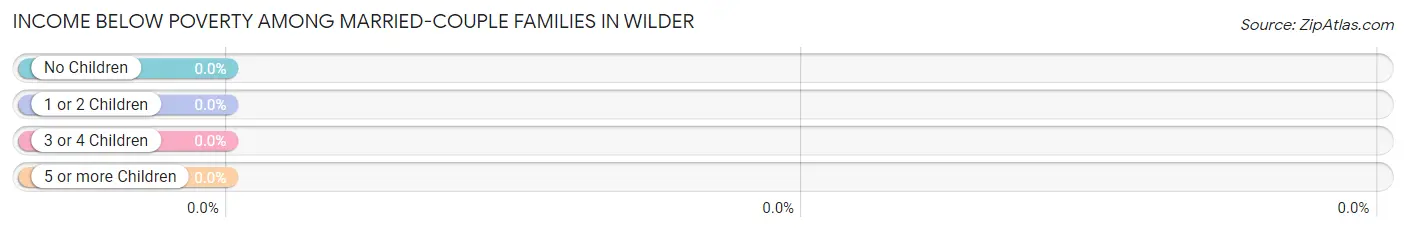
| Children | Above Poverty | Below Poverty |
| No Children | 336 (100.0%) | 0 (0.0%) |
| 1 or 2 Children | 152 (100.0%) | 0 (0.0%) |
| 3 or 4 Children | 47 (100.0%) | 0 (0.0%) |
| 5 or more Children | 0 (0.0%) | 0 (0.0%) |
| Total | 535 (100.0%) | 0 (0.0%) |
Income Below Poverty Among Single-Parent Households in Wilder
| Children | Single Father | Single Mother |
| No Children | 0 (0.0%) | 0 (0.0%) |
| 1 or 2 Children | 0 (0.0%) | 0 (0.0%) |
| 3 or 4 Children | 0 (0.0%) | 0 (0.0%) |
| 5 or more Children | 0 (0.0%) | 0 (0.0%) |
| Total | 0 (0.0%) | 0 (0.0%) |
Income Below Poverty Among Married-Couple vs Single-Parent Households in Wilder
| Children | Married-Couple Families | Single-Parent Households |
| No Children | 0 (0.0%) | 0 (0.0%) |
| 1 or 2 Children | 0 (0.0%) | 0 (0.0%) |
| 3 or 4 Children | 0 (0.0%) | 0 (0.0%) |
| 5 or more Children | 0 (0.0%) | 0 (0.0%) |
| Total | 0 (0.0%) | 0 (0.0%) |
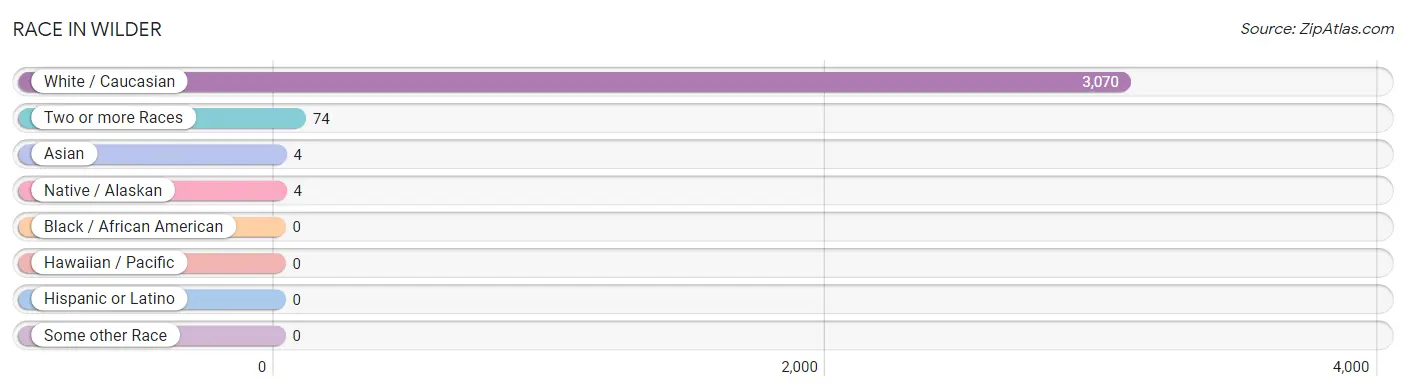
Race in Wilder
The most populous races in Wilder are White / Caucasian (3,070 | 97.4%), Two or more Races (74 | 2.4%), and Asian (4 | 0.1%).
| Race | # Population | % Population |
| Asian | 4 | 0.1% |
| Black / African American | 0 | 0.0% |
| Hawaiian / Pacific | 0 | 0.0% |
| Hispanic or Latino | 0 | 0.0% |
| Native / Alaskan | 4 | 0.1% |
| White / Caucasian | 3,070 | 97.4% |
| Two or more Races | 74 | 2.4% |
| Some other Race | 0 | 0.0% |
| Total | 3,152 | 100.0% |
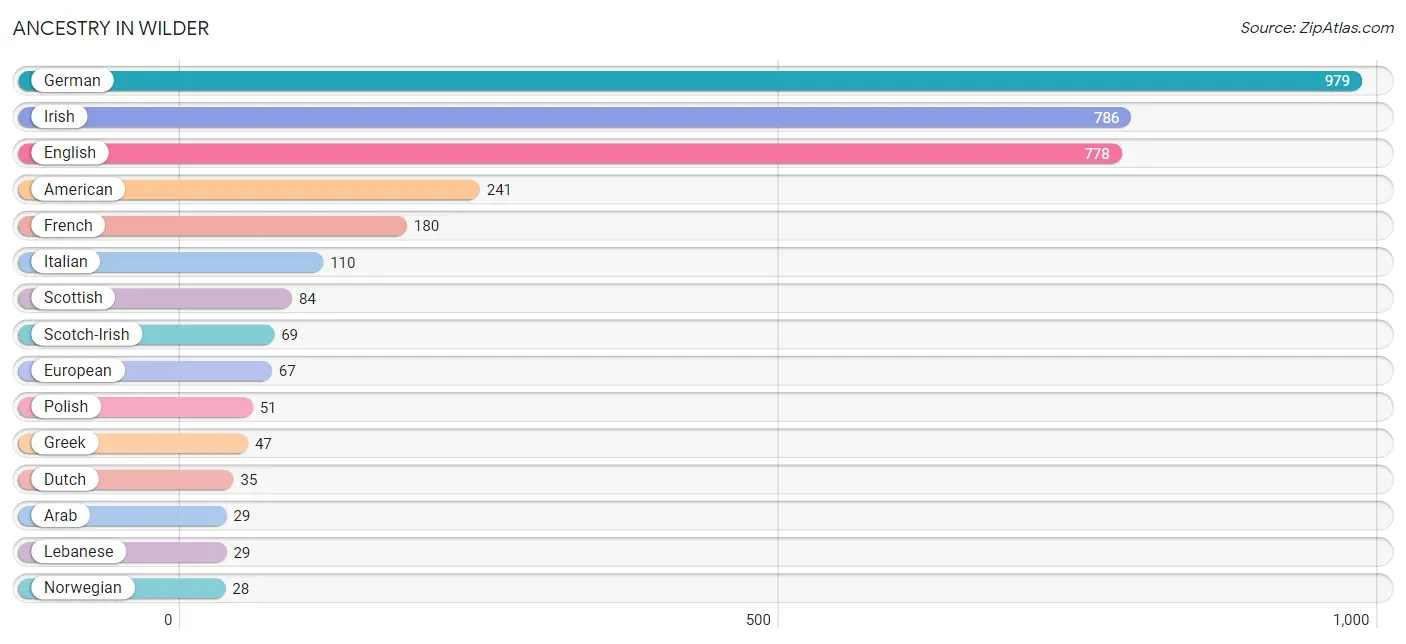
Ancestry in Wilder
The most populous ancestries reported in Wilder are German (979 | 31.1%), Irish (786 | 24.9%), English (778 | 24.7%), American (241 | 7.6%), and French (180 | 5.7%), together accounting for 94.0% of all Wilder residents.
| Ancestry | # Population | % Population |
| American | 241 | 7.6% |
| Arab | 29 | 0.9% |
| British | 20 | 0.6% |
| Cherokee | 4 | 0.1% |
| Czechoslovakian | 13 | 0.4% |
| Dutch | 35 | 1.1% |
| English | 778 | 24.7% |
| European | 67 | 2.1% |
| French | 180 | 5.7% |
| German | 979 | 31.1% |
| Greek | 47 | 1.5% |
| Indian (Asian) | 4 | 0.1% |
| Irish | 786 | 24.9% |
| Italian | 110 | 3.5% |
| Korean | 5 | 0.2% |
| Lebanese | 29 | 0.9% |
| Norwegian | 28 | 0.9% |
| Polish | 51 | 1.6% |
| Scandinavian | 15 | 0.5% |
| Scotch-Irish | 69 | 2.2% |
| Scottish | 84 | 2.7% |
| Swiss | 15 | 0.5% |
| Welsh | 25 | 0.8% | View All 23 Rows |
Immigrants in Wilder
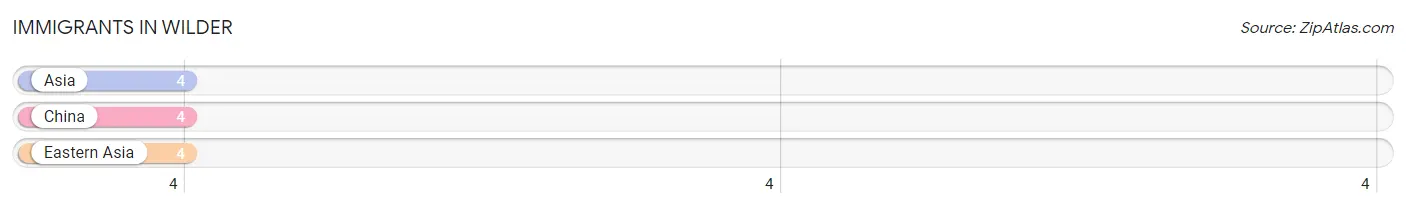
The most numerous immigrant groups reported in Wilder came from Asia (4 | 0.1%), China (4 | 0.1%), and Eastern Asia (4 | 0.1%), together accounting for 0.4% of all Wilder residents.
| Immigration Origin | # Population | % Population |
| Asia | 4 | 0.1% |
| China | 4 | 0.1% |
| Eastern Asia | 4 | 0.1% | View All 3 Rows |
Sex and Age in Wilder
Sex and Age in Wilder
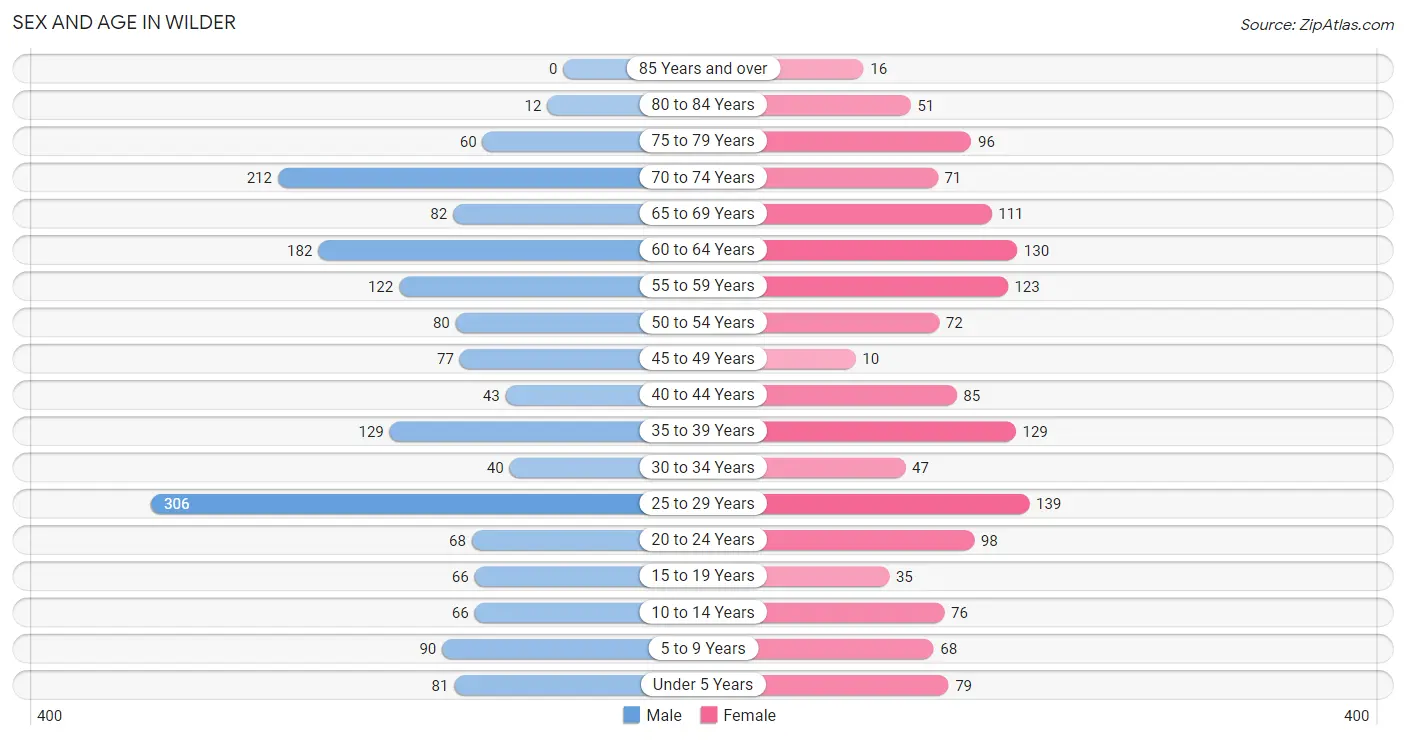
The most populous age groups in Wilder are 25 to 29 Years (306 | 17.8%) for men and 25 to 29 Years (139 | 9.7%) for women.
| Age Bracket | Male | Female |
| Under 5 Years | 81 (4.7%) | 79 (5.5%) |
| 5 to 9 Years | 90 (5.2%) | 68 (4.7%) |
| 10 to 14 Years | 66 (3.8%) | 76 (5.3%) |
| 15 to 19 Years | 66 (3.8%) | 35 (2.4%) |
| 20 to 24 Years | 68 (4.0%) | 98 (6.8%) |
| 25 to 29 Years | 306 (17.8%) | 139 (9.7%) |
| 30 to 34 Years | 40 (2.3%) | 47 (3.3%) |
| 35 to 39 Years | 129 (7.5%) | 129 (9.0%) |
| 40 to 44 Years | 43 (2.5%) | 85 (5.9%) |
| 45 to 49 Years | 77 (4.5%) | 10 (0.7%) |
| 50 to 54 Years | 80 (4.7%) | 72 (5.0%) |
| 55 to 59 Years | 122 (7.1%) | 123 (8.6%) |
| 60 to 64 Years | 182 (10.6%) | 130 (9.0%) |
| 65 to 69 Years | 82 (4.8%) | 111 (7.7%) |
| 70 to 74 Years | 212 (12.3%) | 71 (4.9%) |
| 75 to 79 Years | 60 (3.5%) | 96 (6.7%) |
| 80 to 84 Years | 12 (0.7%) | 51 (3.5%) |
| 85 Years and over | 0 (0.0%) | 16 (1.1%) |
| Total | 1,716 (100.0%) | 1,436 (100.0%) |
Families and Households in Wilder
Median Family Size in Wilder
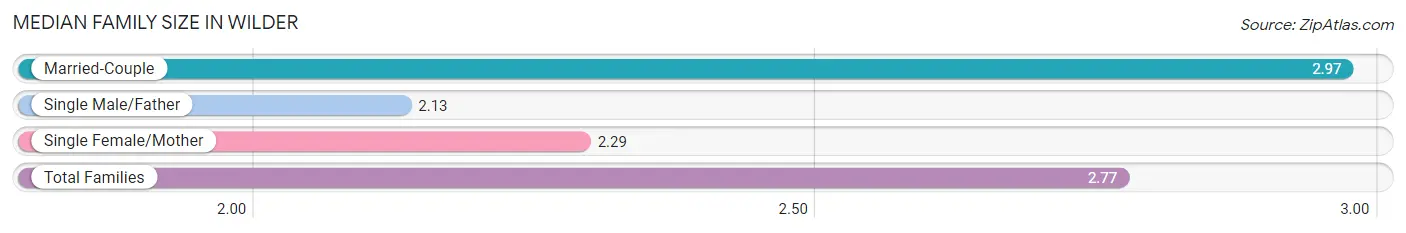
The median family size in Wilder is 2.77 persons per family, with married-couple families (535 | 74.4%) accounting for the largest median family size of 2.97 persons per family. On the other hand, single male/father families (105 | 14.6%) represent the smallest median family size with 2.13 persons per family.
| Family Type | # Families | Family Size |
| Married-Couple | 535 (74.4%) | 2.97 |
| Single Male/Father | 105 (14.6%) | 2.13 |
| Single Female/Mother | 79 (11.0%) | 2.29 |
| Total Families | 719 (100.0%) | 2.77 |
Median Household Size in Wilder
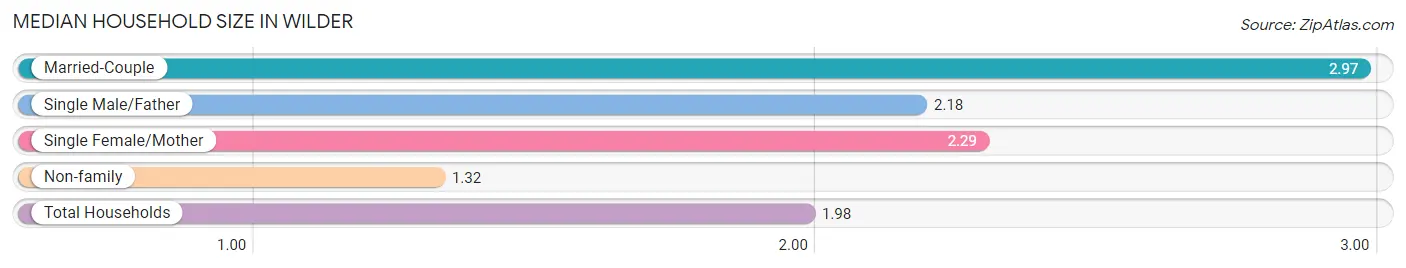
The median household size in Wilder is 1.98 persons per household, with married-couple households (535 | 33.5%) accounting for the largest median household size of 2.97 persons per household. non-family households (876 | 54.9%) represent the smallest median household size with 1.32 persons per household.
| Household Type | # Households | Household Size |
| Married-Couple | 535 (33.5%) | 2.97 |
| Single Male/Father | 105 (6.6%) | 2.18 |
| Single Female/Mother | 79 (5.0%) | 2.29 |
| Non-family | 876 (54.9%) | 1.32 |
| Total Households | 1,595 (100.0%) | 1.98 |
Household Size by Marriage Status in Wilder
Out of a total of 1,595 households in Wilder, 719 (45.1%) are family households, while 876 (54.9%) are nonfamily households. The most numerous type of family households are 2-person households, comprising 391, and the most common type of nonfamily households are 1-person households, comprising 678.
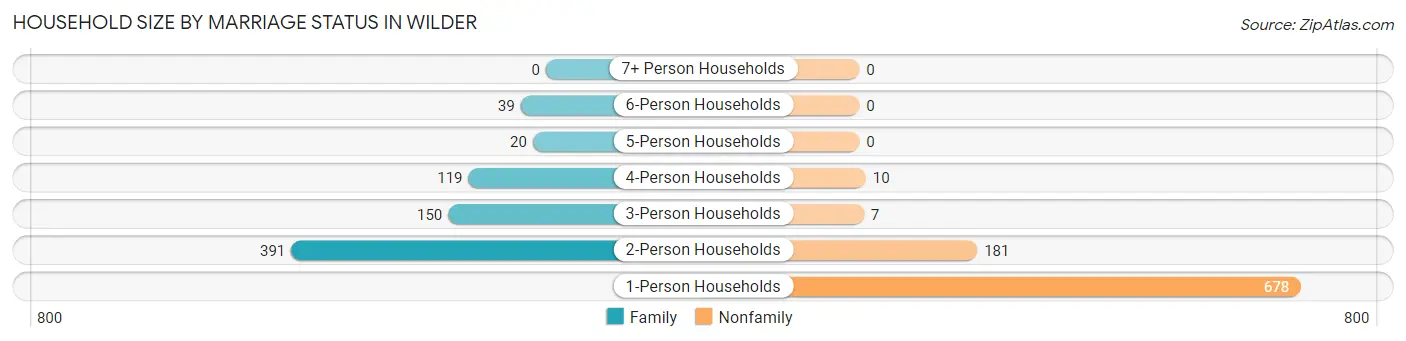
| Household Size | Family Households | Nonfamily Households |
| 1-Person Households | - | 678 (42.5%) |
| 2-Person Households | 391 (24.5%) | 181 (11.4%) |
| 3-Person Households | 150 (9.4%) | 7 (0.4%) |
| 4-Person Households | 119 (7.5%) | 10 (0.6%) |
| 5-Person Households | 20 (1.3%) | 0 (0.0%) |
| 6-Person Households | 39 (2.5%) | 0 (0.0%) |
| 7+ Person Households | 0 (0.0%) | 0 (0.0%) |
| Total | 719 (45.1%) | 876 (54.9%) |
Female Fertility in Wilder
Fertility by Age in Wilder
Average fertility rate in Wilder is 50.0 births per 1,000 women. Women in the age bracket of 20 to 34 years have the highest fertility rate with 67.0 births per 1,000 women. Women in the age bracket of 20 to 34 years acount for 70.4% of all women with births.
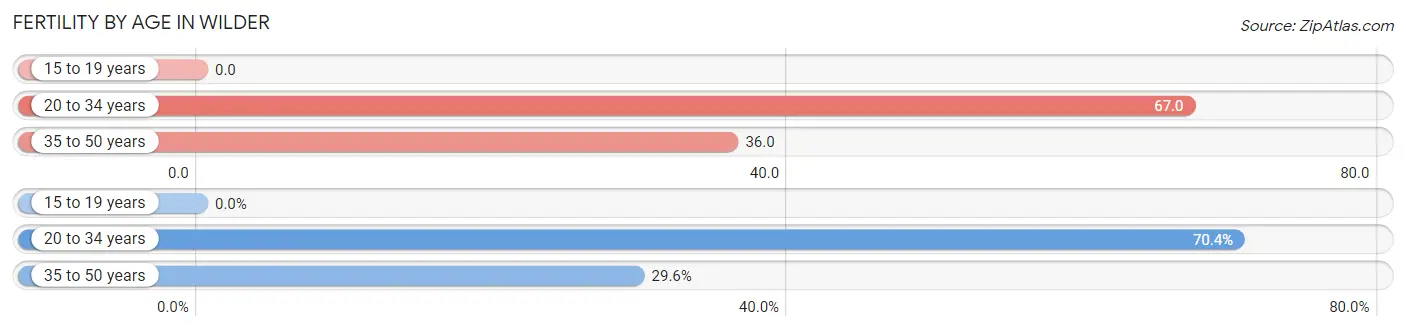
| Age Bracket | Women with Births | Births / 1,000 Women |
| 15 to 19 years | 0 (0.0%) | 0.0 |
| 20 to 34 years | 19 (70.4%) | 67.0 |
| 35 to 50 years | 8 (29.6%) | 36.0 |
| Total | 27 (100.0%) | 50.0 |
Fertility by Age by Marriage Status in Wilder
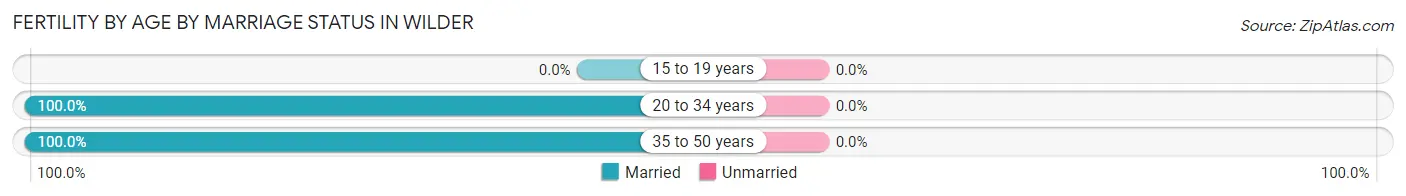
| Age Bracket | Married | Unmarried |
| 15 to 19 years | 0 (0.0%) | 0 (0.0%) |
| 20 to 34 years | 19 (100.0%) | 0 (0.0%) |
| 35 to 50 years | 8 (100.0%) | 0 (0.0%) |
| Total | 27 (100.0%) | 0 (0.0%) |
Fertility by Education in Wilder
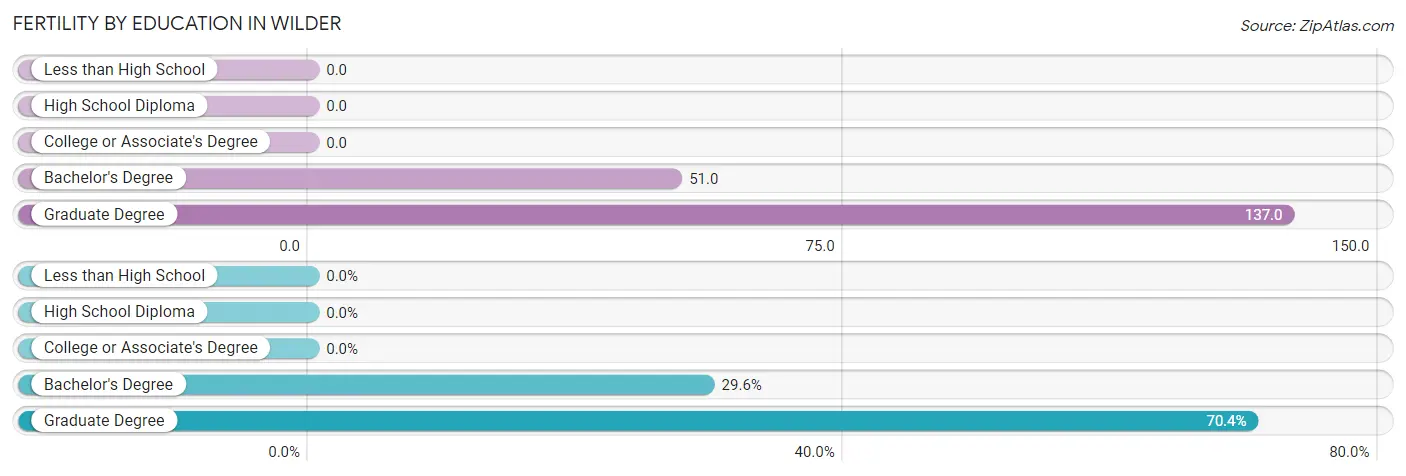
| Educational Attainment | Women with Births | Births / 1,000 Women |
| Less than High School | 0 (0.0%) | 0.0 |
| High School Diploma | 0 (0.0%) | 0.0 |
| College or Associate's Degree | 0 (0.0%) | 0.0 |
| Bachelor's Degree | 8 (29.6%) | 51.0 |
| Graduate Degree | 19 (70.4%) | 137.0 |
| Total | 27 (100.0%) | 50.0 |
Fertility by Education by Marriage Status in Wilder
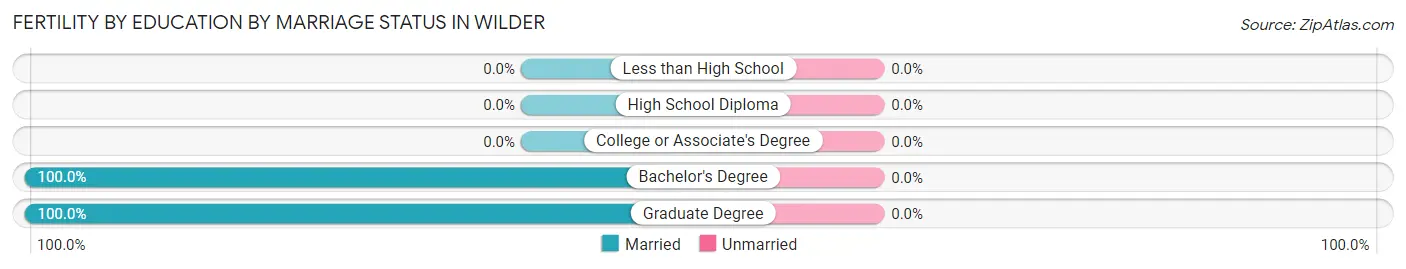
| Educational Attainment | Married | Unmarried |
| Less than High School | 0 (0.0%) | 0 (0.0%) |
| High School Diploma | 0 (0.0%) | 0 (0.0%) |
| College or Associate's Degree | 0 (0.0%) | 0 (0.0%) |
| Bachelor's Degree | 8 (100.0%) | 0 (0.0%) |
| Graduate Degree | 19 (100.0%) | 0 (0.0%) |
| Total | 27 (100.0%) | 0 (0.0%) |
Employment Characteristics in Wilder
Employment by Class of Employer in Wilder
Among the 1,481 employed individuals in Wilder, private company employees (1,008 | 68.1%), not-for-profit organizations (229 | 15.5%), and local government employees (102 | 6.9%) make up the most common classes of employment.
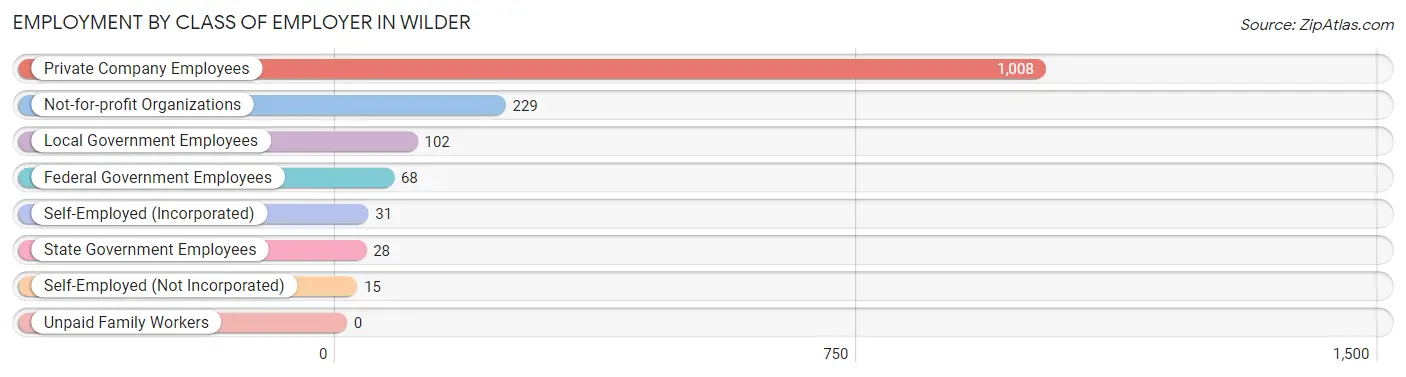
| Employer Class | # Employees | % Employees |
| Private Company Employees | 1,008 | 68.1% |
| Self-Employed (Incorporated) | 31 | 2.1% |
| Self-Employed (Not Incorporated) | 15 | 1.0% |
| Not-for-profit Organizations | 229 | 15.5% |
| Local Government Employees | 102 | 6.9% |
| State Government Employees | 28 | 1.9% |
| Federal Government Employees | 68 | 4.6% |
| Unpaid Family Workers | 0 | 0.0% |
| Total | 1,481 | 100.0% |
Employment Status by Age in Wilder
According to the labor force statistics for Wilder, out of the total population over 16 years of age (2,682), 58.8% or 1,577 individuals are in the labor force, with 5.5% or 87 of them unemployed. The age group with the highest labor force participation rate is 30 to 34 years, with 100.0% or 87 individuals in the labor force. Within the labor force, the 65 to 74 years age range has the highest percentage of unemployed individuals, with 17.2% or 11 of them being unemployed.
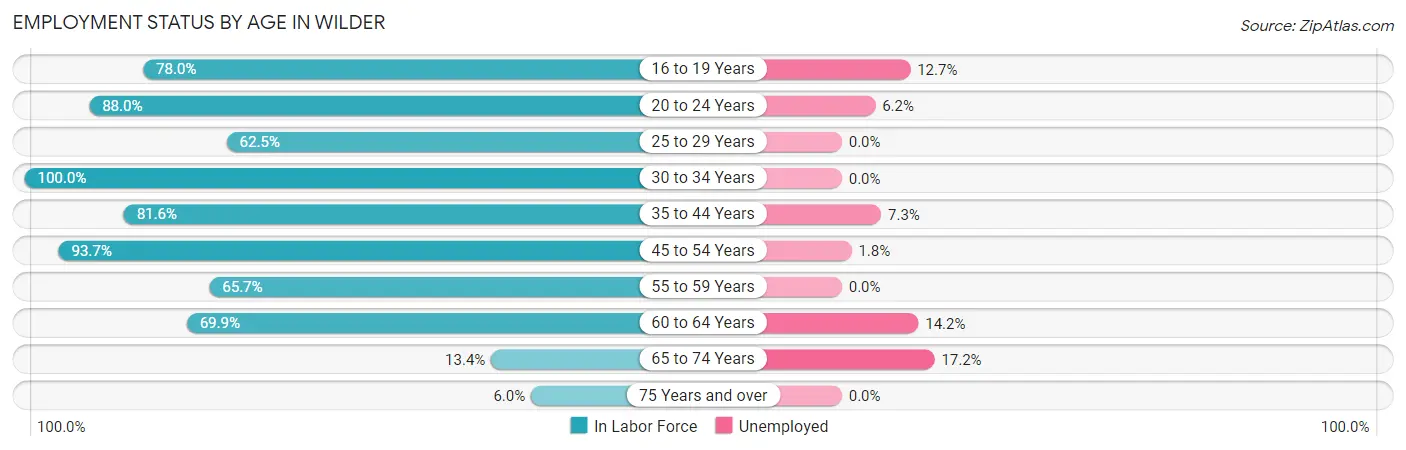
| Age Bracket | In Labor Force | Unemployed |
| 16 to 19 Years | 71 (78.0%) | 9 (12.7%) |
| 20 to 24 Years | 146 (88.0%) | 9 (6.2%) |
| 25 to 29 Years | 278 (62.5%) | 0 (0.0%) |
| 30 to 34 Years | 87 (100.0%) | 0 (0.0%) |
| 35 to 44 Years | 315 (81.6%) | 23 (7.3%) |
| 45 to 54 Years | 224 (93.7%) | 4 (1.8%) |
| 55 to 59 Years | 161 (65.7%) | 0 (0.0%) |
| 60 to 64 Years | 218 (69.9%) | 31 (14.2%) |
| 65 to 74 Years | 64 (13.4%) | 11 (17.2%) |
| 75 Years and over | 14 (6.0%) | 0 (0.0%) |
| Total | 1,577 (58.8%) | 87 (5.5%) |
Employment Status by Educational Attainment in Wilder
According to labor force statistics for Wilder, 74.9% of individuals (1,284) out of the total population between 25 and 64 years of age (1,714) are in the labor force, with 4.5% or 58 of them being unemployed. The group with the highest labor force participation rate are those with the educational attainment of less than high school, with 100.0% or 14 individuals in the labor force. Within the labor force, individuals with bachelor's degree or higher education have the highest percentage of unemployment, with 6.0% or 50 of them being unemployed.
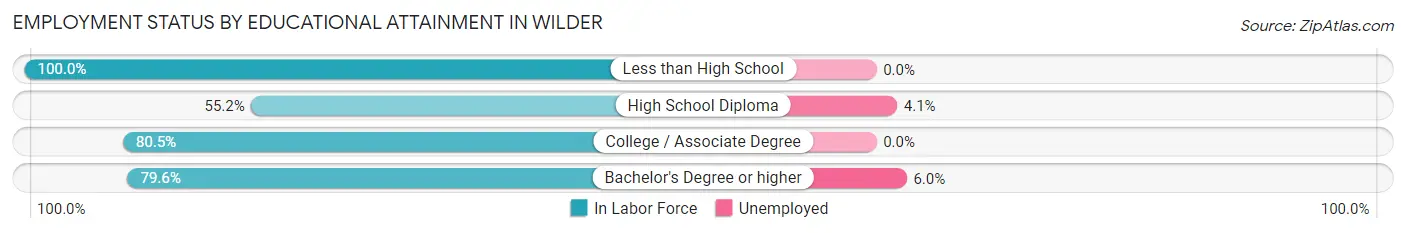
| Educational Attainment | In Labor Force | Unemployed |
| Less than High School | 14 (100.0%) | 0 (0.0%) |
| High School Diploma | 196 (55.2%) | 15 (4.1%) |
| College / Associate Degree | 239 (80.5%) | 0 (0.0%) |
| Bachelor's Degree or higher | 834 (79.6%) | 63 (6.0%) |
| Total | 1,284 (74.9%) | 77 (4.5%) |
Employment Occupations by Sex in Wilder
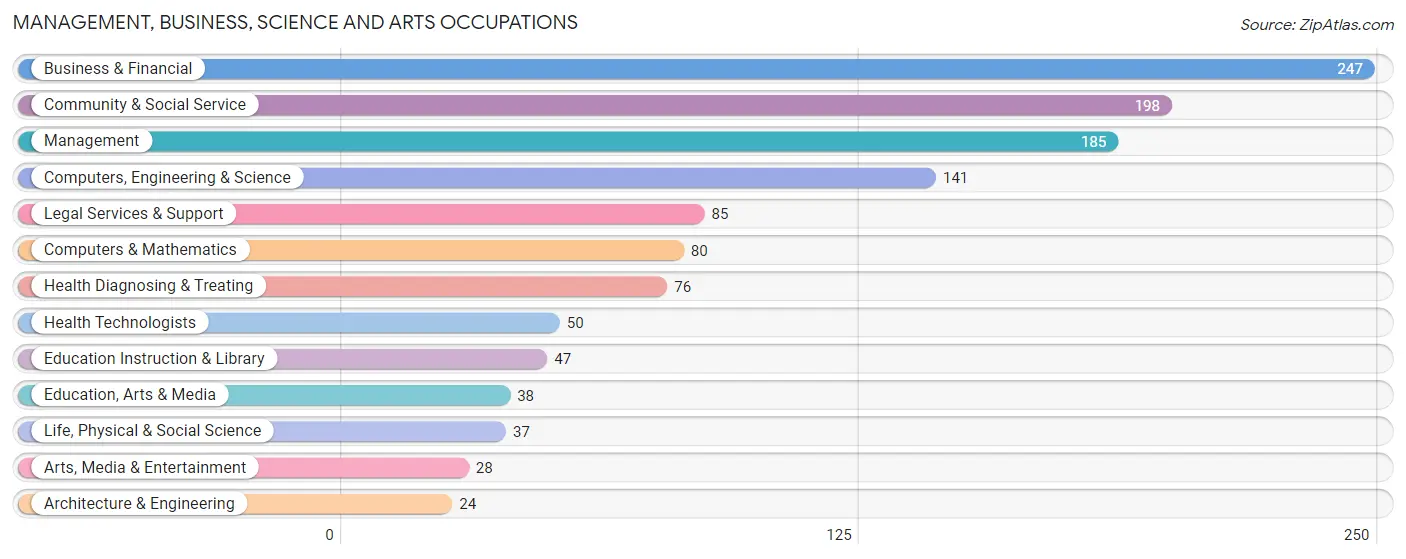
Management, Business, Science and Arts Occupations
The most common Management, Business, Science and Arts occupations in Wilder are Business & Financial (247 | 16.6%), Community & Social Service (198 | 13.3%), Management (185 | 12.4%), Computers, Engineering & Science (141 | 9.5%), and Legal Services & Support (85 | 5.7%).
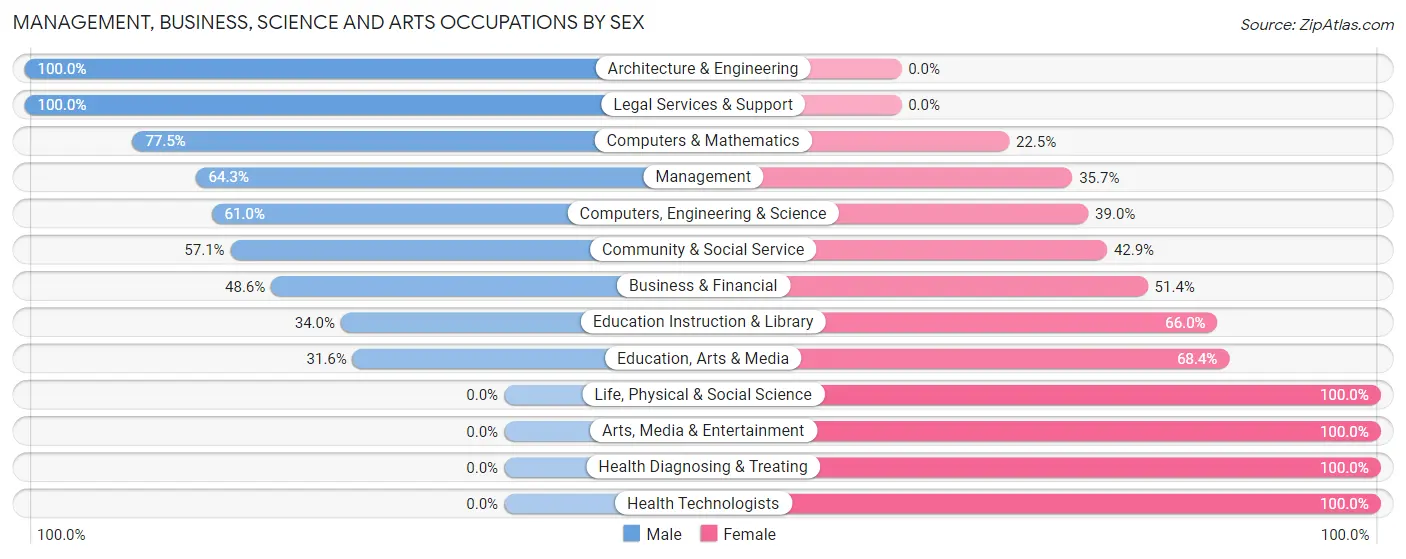
Management, Business, Science and Arts Occupations by Sex
Within the Management, Business, Science and Arts occupations in Wilder, the most male-oriented occupations are Architecture & Engineering (100.0%), Legal Services & Support (100.0%), and Computers & Mathematics (77.5%), while the most female-oriented occupations are Life, Physical & Social Science (100.0%), Arts, Media & Entertainment (100.0%), and Health Diagnosing & Treating (100.0%).
| Occupation | Male | Female |
| Management | 119 (64.3%) | 66 (35.7%) |
| Business & Financial | 120 (48.6%) | 127 (51.4%) |
| Computers, Engineering & Science | 86 (61.0%) | 55 (39.0%) |
| Computers & Mathematics | 62 (77.5%) | 18 (22.5%) |
| Architecture & Engineering | 24 (100.0%) | 0 (0.0%) |
| Life, Physical & Social Science | 0 (0.0%) | 37 (100.0%) |
| Community & Social Service | 113 (57.1%) | 85 (42.9%) |
| Education, Arts & Media | 12 (31.6%) | 26 (68.4%) |
| Legal Services & Support | 85 (100.0%) | 0 (0.0%) |
| Education Instruction & Library | 16 (34.0%) | 31 (66.0%) |
| Arts, Media & Entertainment | 0 (0.0%) | 28 (100.0%) |
| Health Diagnosing & Treating | 0 (0.0%) | 76 (100.0%) |
| Health Technologists | 0 (0.0%) | 50 (100.0%) |
| Total (Category) | 438 (51.7%) | 409 (48.3%) |
| Total (Overall) | 876 (58.8%) | 615 (41.2%) |
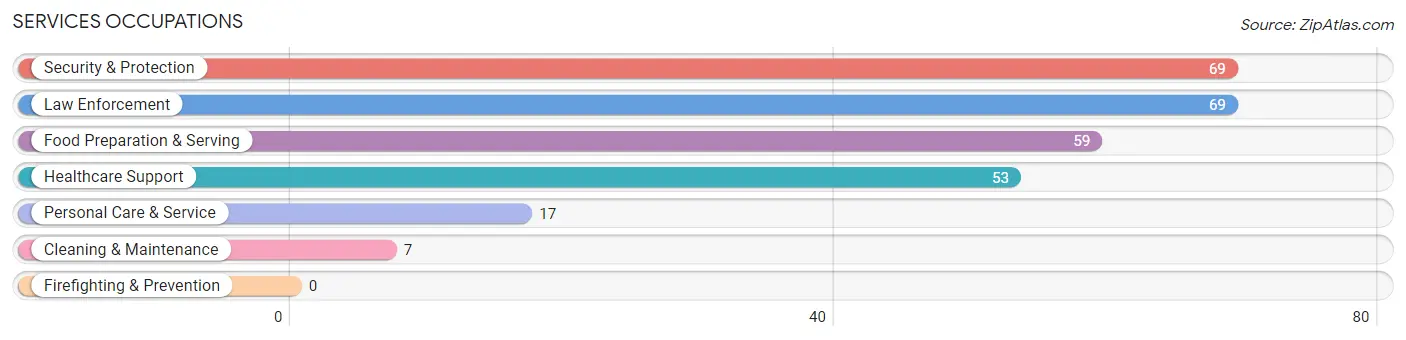
Services Occupations
The most common Services occupations in Wilder are Security & Protection (69 | 4.6%), Law Enforcement (69 | 4.6%), Food Preparation & Serving (59 | 4.0%), Healthcare Support (53 | 3.5%), and Personal Care & Service (17 | 1.1%).
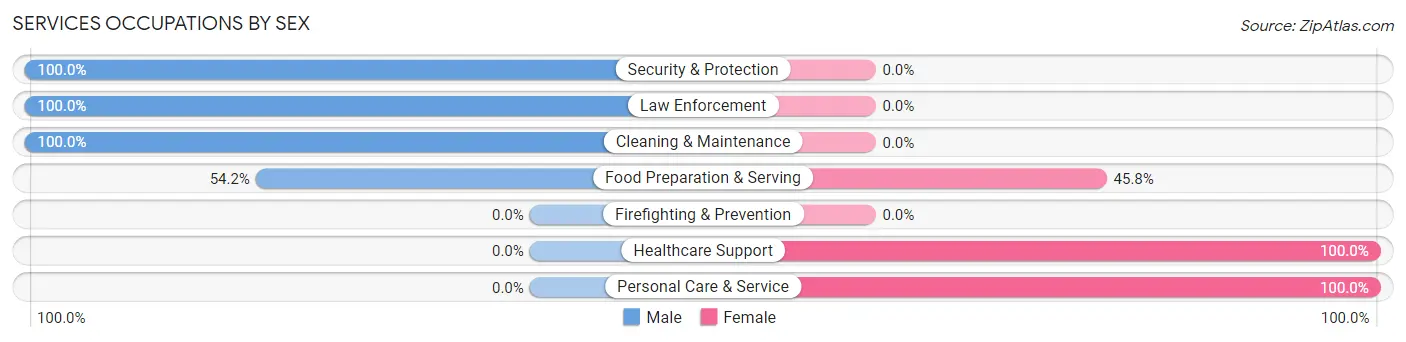
Services Occupations by Sex
Within the Services occupations in Wilder, the most male-oriented occupations are Security & Protection (100.0%), Law Enforcement (100.0%), and Cleaning & Maintenance (100.0%), while the most female-oriented occupations are Healthcare Support (100.0%), Personal Care & Service (100.0%), and Food Preparation & Serving (45.8%).
| Occupation | Male | Female |
| Healthcare Support | 0 (0.0%) | 53 (100.0%) |
| Security & Protection | 69 (100.0%) | 0 (0.0%) |
| Firefighting & Prevention | 0 (0.0%) | 0 (0.0%) |
| Law Enforcement | 69 (100.0%) | 0 (0.0%) |
| Food Preparation & Serving | 32 (54.2%) | 27 (45.8%) |
| Cleaning & Maintenance | 7 (100.0%) | 0 (0.0%) |
| Personal Care & Service | 0 (0.0%) | 17 (100.0%) |
| Total (Category) | 108 (52.7%) | 97 (47.3%) |
| Total (Overall) | 876 (58.8%) | 615 (41.2%) |
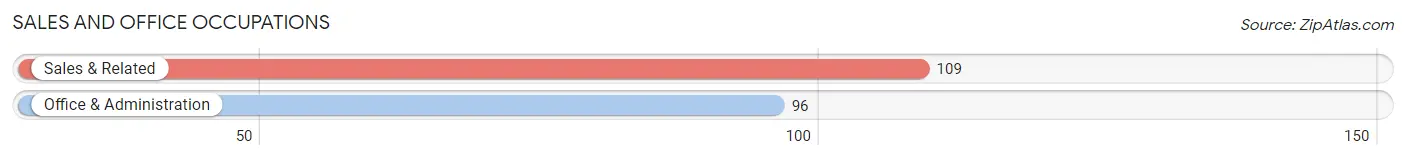
Sales and Office Occupations
The most common Sales and Office occupations in Wilder are Sales & Related (109 | 7.3%), and Office & Administration (96 | 6.4%).
Sales and Office Occupations by Sex
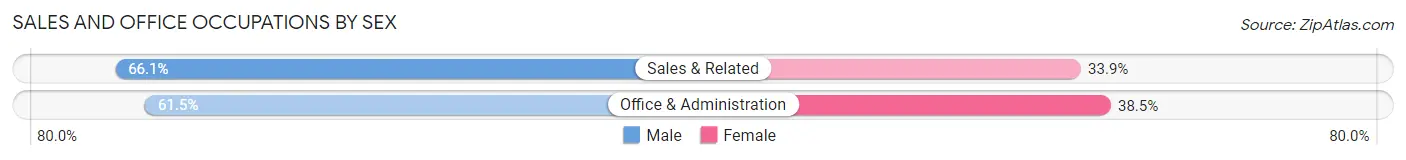
| Occupation | Male | Female |
| Sales & Related | 72 (66.1%) | 37 (33.9%) |
| Office & Administration | 59 (61.5%) | 37 (38.5%) |
| Total (Category) | 131 (63.9%) | 74 (36.1%) |
| Total (Overall) | 876 (58.8%) | 615 (41.2%) |
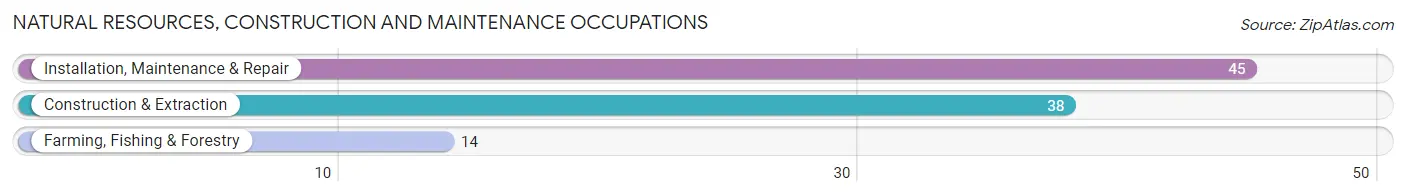
Natural Resources, Construction and Maintenance Occupations
The most common Natural Resources, Construction and Maintenance occupations in Wilder are Installation, Maintenance & Repair (45 | 3.0%), Construction & Extraction (38 | 2.5%), and Farming, Fishing & Forestry (14 | 0.9%).
Natural Resources, Construction and Maintenance Occupations by Sex
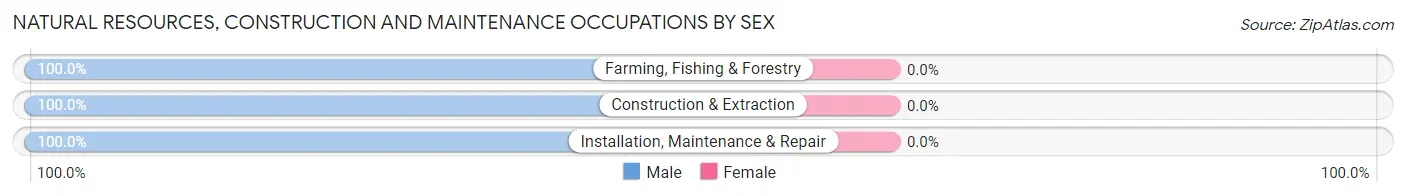
| Occupation | Male | Female |
| Farming, Fishing & Forestry | 14 (100.0%) | 0 (0.0%) |
| Construction & Extraction | 38 (100.0%) | 0 (0.0%) |
| Installation, Maintenance & Repair | 45 (100.0%) | 0 (0.0%) |
| Total (Category) | 97 (100.0%) | 0 (0.0%) |
| Total (Overall) | 876 (58.8%) | 615 (41.2%) |
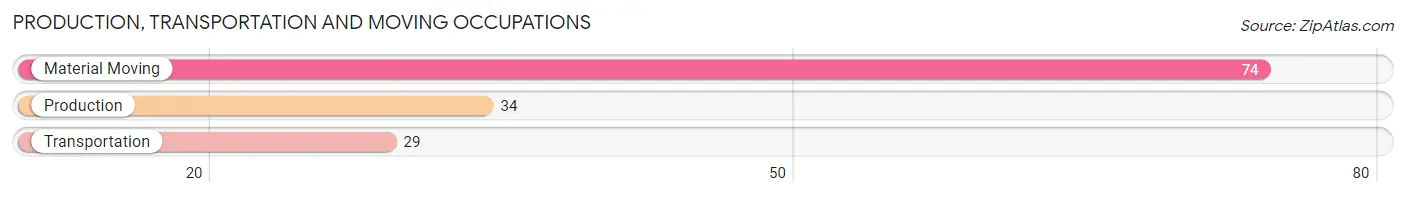
Production, Transportation and Moving Occupations
The most common Production, Transportation and Moving occupations in Wilder are Material Moving (74 | 5.0%), Production (34 | 2.3%), and Transportation (29 | 1.9%).
Production, Transportation and Moving Occupations by Sex
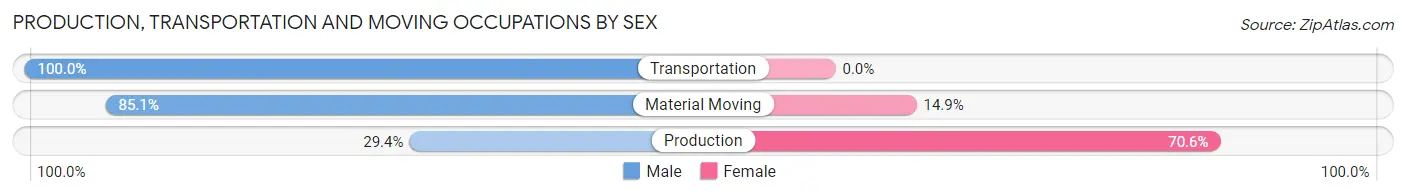
| Occupation | Male | Female |
| Production | 10 (29.4%) | 24 (70.6%) |
| Transportation | 29 (100.0%) | 0 (0.0%) |
| Material Moving | 63 (85.1%) | 11 (14.9%) |
| Total (Category) | 102 (74.5%) | 35 (25.6%) |
| Total (Overall) | 876 (58.8%) | 615 (41.2%) |
Employment Industries by Sex in Wilder
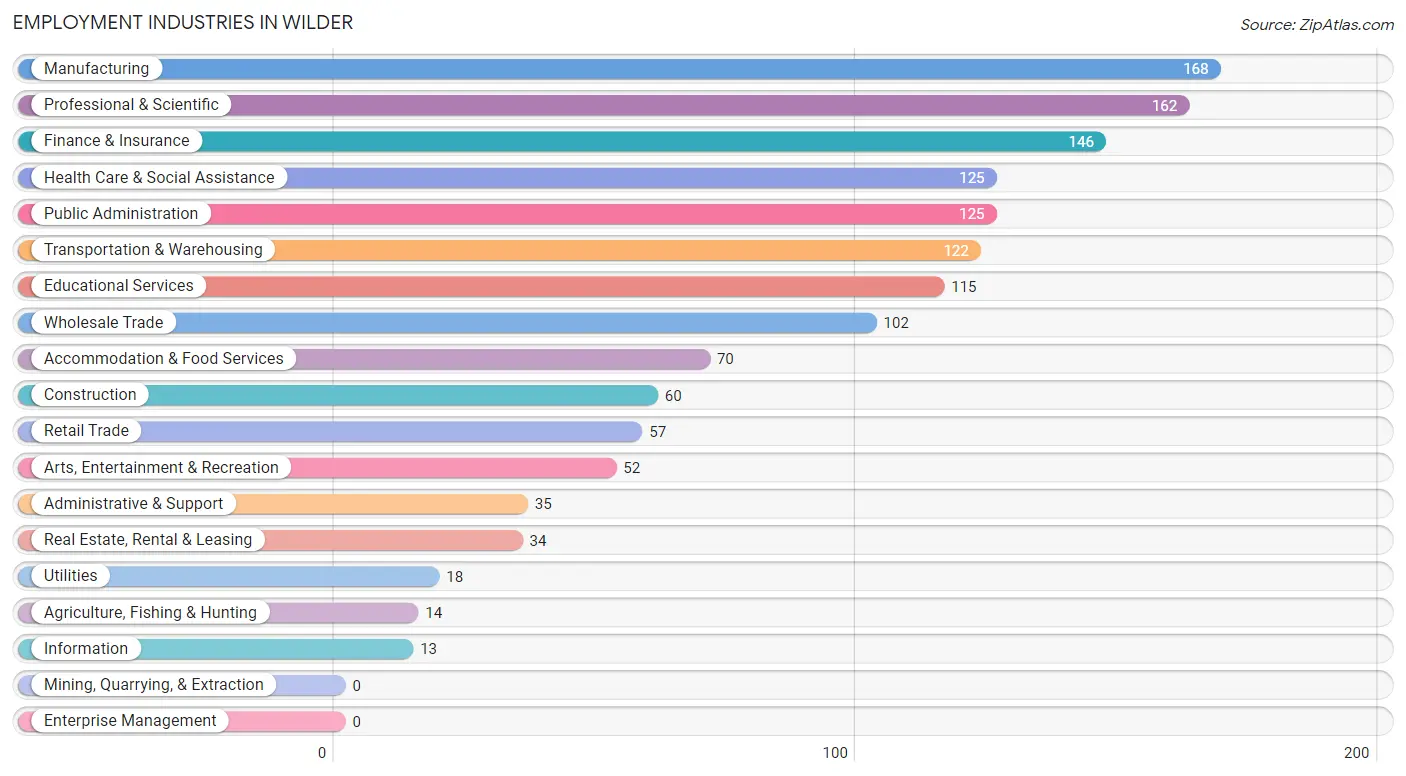
Employment Industries in Wilder
The major employment industries in Wilder include Manufacturing (168 | 11.3%), Professional & Scientific (162 | 10.9%), Finance & Insurance (146 | 9.8%), Health Care & Social Assistance (125 | 8.4%), and Public Administration (125 | 8.4%).
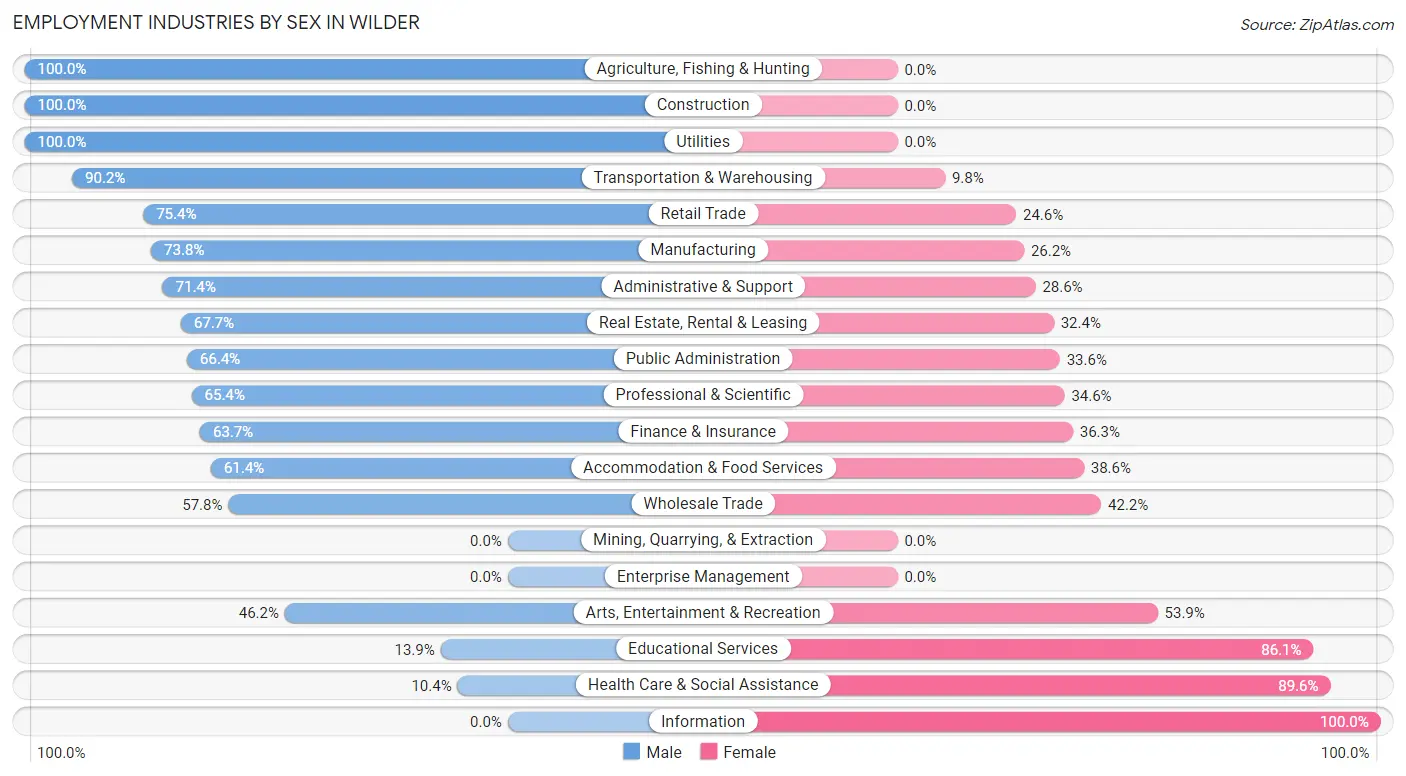
Employment Industries by Sex in Wilder
The Wilder industries that see more men than women are Agriculture, Fishing & Hunting (100.0%), Construction (100.0%), and Utilities (100.0%), whereas the industries that tend to have a higher number of women are Information (100.0%), Health Care & Social Assistance (89.6%), and Educational Services (86.1%).
| Industry | Male | Female |
| Agriculture, Fishing & Hunting | 14 (100.0%) | 0 (0.0%) |
| Mining, Quarrying, & Extraction | 0 (0.0%) | 0 (0.0%) |
| Construction | 60 (100.0%) | 0 (0.0%) |
| Manufacturing | 124 (73.8%) | 44 (26.2%) |
| Wholesale Trade | 59 (57.8%) | 43 (42.2%) |
| Retail Trade | 43 (75.4%) | 14 (24.6%) |
| Transportation & Warehousing | 110 (90.2%) | 12 (9.8%) |
| Utilities | 18 (100.0%) | 0 (0.0%) |
| Information | 0 (0.0%) | 13 (100.0%) |
| Finance & Insurance | 93 (63.7%) | 53 (36.3%) |
| Real Estate, Rental & Leasing | 23 (67.6%) | 11 (32.4%) |
| Professional & Scientific | 106 (65.4%) | 56 (34.6%) |
| Enterprise Management | 0 (0.0%) | 0 (0.0%) |
| Administrative & Support | 25 (71.4%) | 10 (28.6%) |
| Educational Services | 16 (13.9%) | 99 (86.1%) |
| Health Care & Social Assistance | 13 (10.4%) | 112 (89.6%) |
| Arts, Entertainment & Recreation | 24 (46.2%) | 28 (53.8%) |
| Accommodation & Food Services | 43 (61.4%) | 27 (38.6%) |
| Public Administration | 83 (66.4%) | 42 (33.6%) |
| Total | 876 (58.8%) | 615 (41.2%) |
Education in Wilder
School Enrollment in Wilder
The most common levels of schooling among the 657 students in Wilder are graduate / professional (210 | 32.0%), elementary school (157 | 23.9%), and middle school (87 | 13.2%).
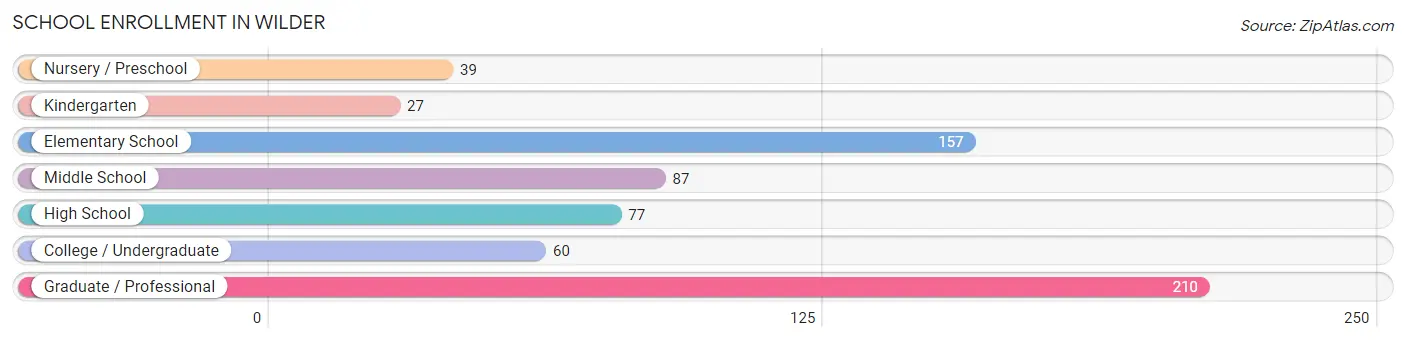
| School Level | # Students | % Students |
| Nursery / Preschool | 39 | 5.9% |
| Kindergarten | 27 | 4.1% |
| Elementary School | 157 | 23.9% |
| Middle School | 87 | 13.2% |
| High School | 77 | 11.7% |
| College / Undergraduate | 60 | 9.1% |
| Graduate / Professional | 210 | 32.0% |
| Total | 657 | 100.0% |
School Enrollment by Age by Funding Source in Wilder
Out of a total of 657 students who are enrolled in schools in Wilder, 230 (35.0%) attend a private institution, while the remaining 427 (65.0%) are enrolled in public schools. The age group of 3 to 4 year olds has the highest likelihood of being enrolled in private schools, with 39 (100.0% in the age bracket) enrolled. Conversely, the age group of 18 to 19 year olds has the lowest likelihood of being enrolled in a private school, with 22 (100.0% in the age bracket) attending a public institution.
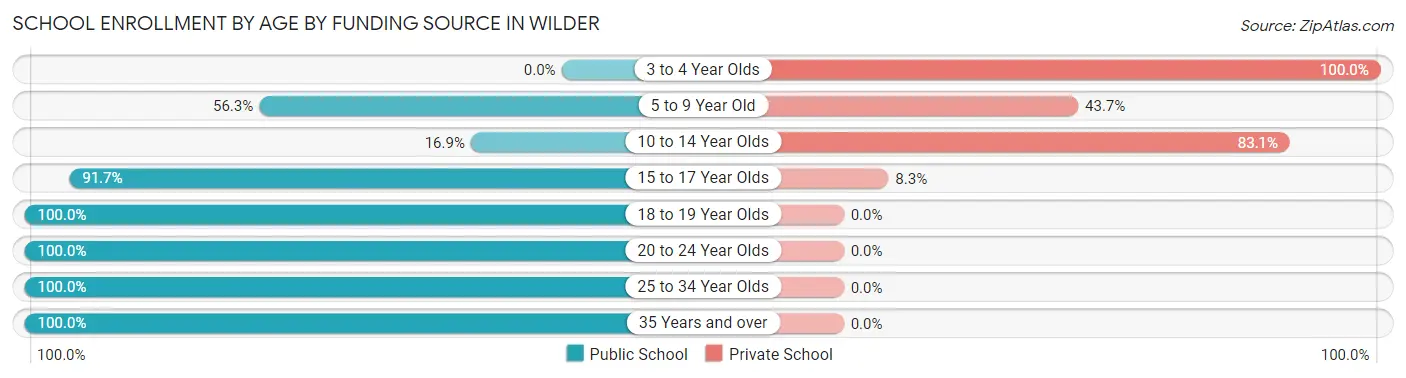
| Age Bracket | Public School | Private School |
| 3 to 4 Year Olds | 0 (0.0%) | 39 (100.0%) |
| 5 to 9 Year Old | 89 (56.3%) | 69 (43.7%) |
| 10 to 14 Year Olds | 24 (16.9%) | 118 (83.1%) |
| 15 to 17 Year Olds | 44 (91.7%) | 4 (8.3%) |
| 18 to 19 Year Olds | 22 (100.0%) | 0 (0.0%) |
| 20 to 24 Year Olds | 66 (100.0%) | 0 (0.0%) |
| 25 to 34 Year Olds | 174 (100.0%) | 0 (0.0%) |
| 35 Years and over | 8 (100.0%) | 0 (0.0%) |
| Total | 427 (65.0%) | 230 (35.0%) |
Educational Attainment by Field of Study in Wilder
Business (384 | 24.3%), education (276 | 17.4%), bio, nature & agricultural (144 | 9.1%), science & technology (132 | 8.3%), and engineering (120 | 7.6%) are the most common fields of study among 1,582 individuals in Wilder who have obtained a bachelor's degree or higher.
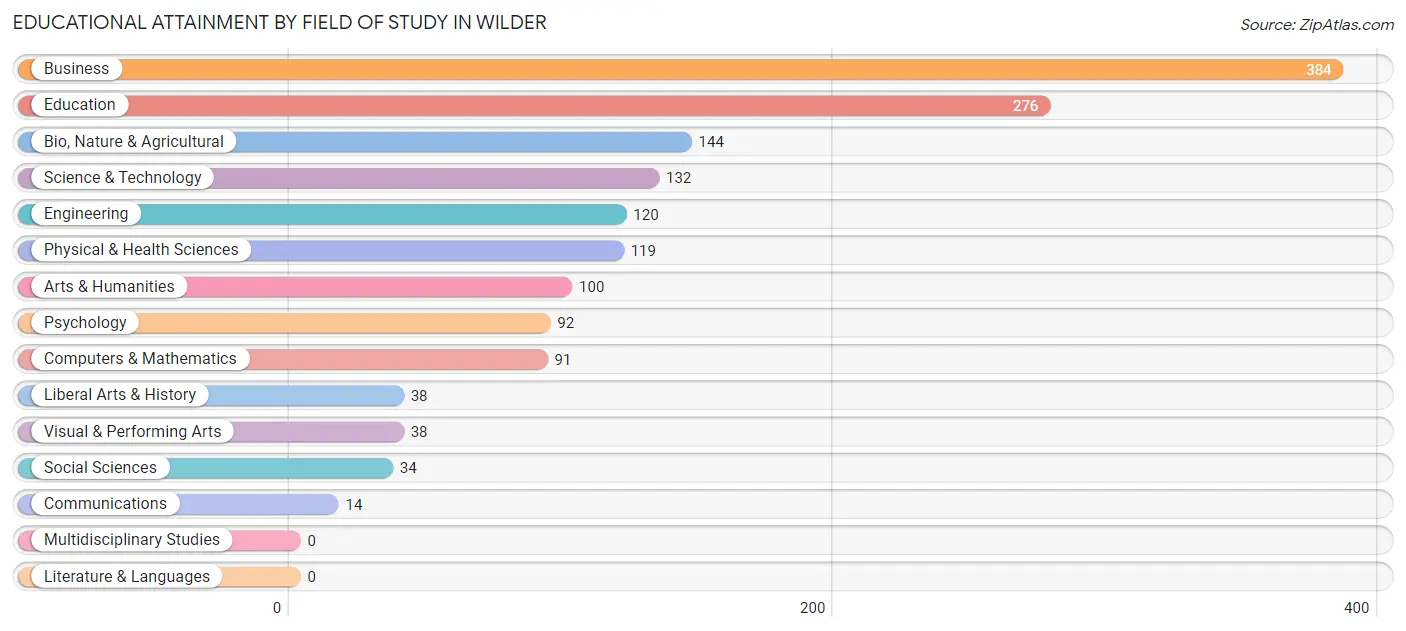
| Field of Study | # Graduates | % Graduates |
| Computers & Mathematics | 91 | 5.8% |
| Bio, Nature & Agricultural | 144 | 9.1% |
| Physical & Health Sciences | 119 | 7.5% |
| Psychology | 92 | 5.8% |
| Social Sciences | 34 | 2.1% |
| Engineering | 120 | 7.6% |
| Multidisciplinary Studies | 0 | 0.0% |
| Science & Technology | 132 | 8.3% |
| Business | 384 | 24.3% |
| Education | 276 | 17.4% |
| Literature & Languages | 0 | 0.0% |
| Liberal Arts & History | 38 | 2.4% |
| Visual & Performing Arts | 38 | 2.4% |
| Communications | 14 | 0.9% |
| Arts & Humanities | 100 | 6.3% |
| Total | 1,582 | 100.0% |
Transportation & Commute in Wilder
Vehicle Availability by Sex in Wilder
The most prevalent vehicle ownership categories in Wilder are males with 2 vehicles (610, accounting for 69.6%) and females with 2 vehicles (331, making up 100.8%).
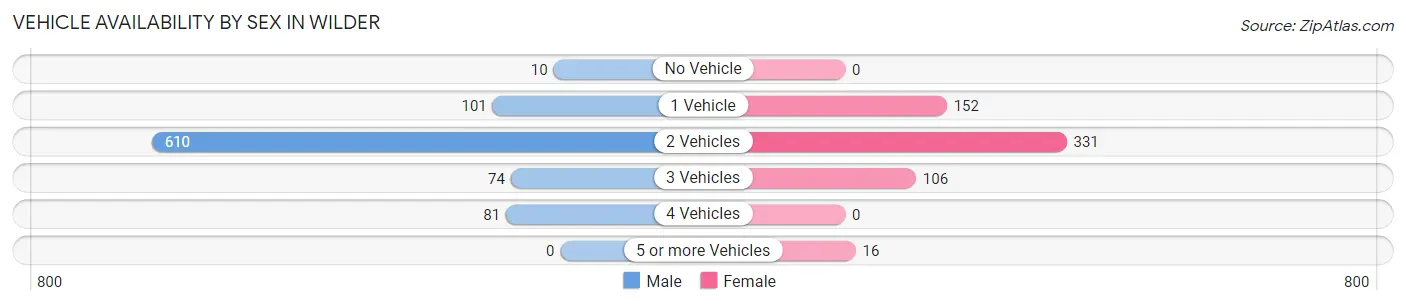
| Vehicles Available | Male | Female |
| No Vehicle | 10 (1.1%) | 0 (0.0%) |
| 1 Vehicle | 101 (11.5%) | 152 (25.1%) |
| 2 Vehicles | 610 (69.6%) | 331 (54.7%) |
| 3 Vehicles | 74 (8.5%) | 106 (17.5%) |
| 4 Vehicles | 81 (9.2%) | 0 (0.0%) |
| 5 or more Vehicles | 0 (0.0%) | 16 (2.6%) |
| Total | 876 (100.0%) | 605 (100.0%) |
Commute Time in Wilder
The most frequently occuring commute durations in Wilder are 20 to 24 minutes (372 commuters, 31.4%), 10 to 14 minutes (266 commuters, 22.5%), and 15 to 19 minutes (164 commuters, 13.8%).
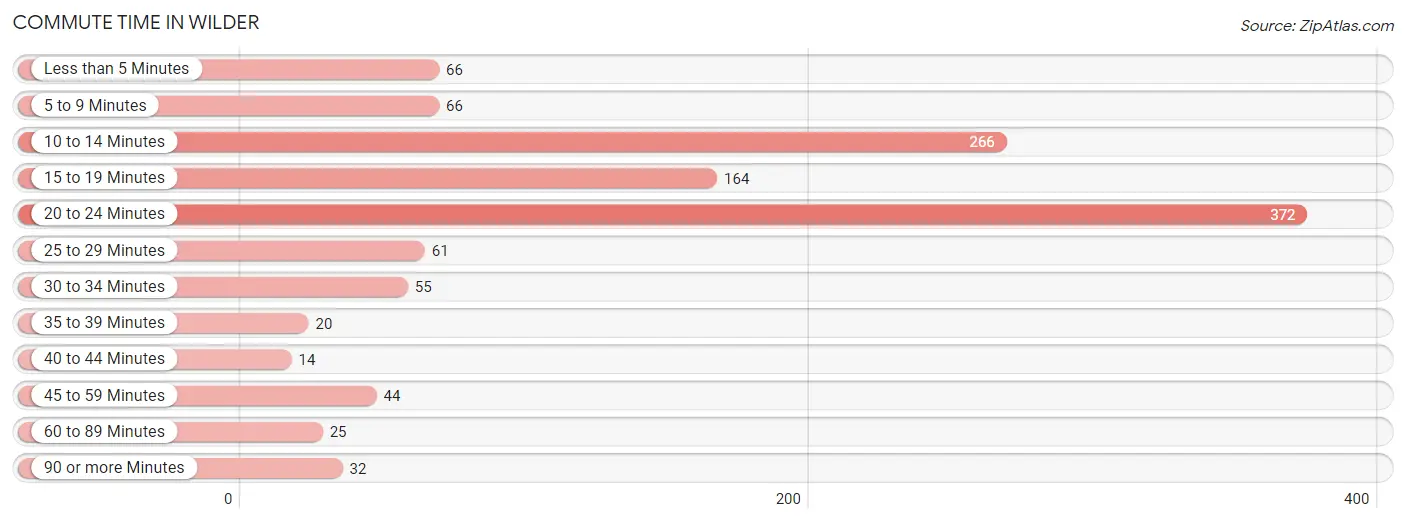
| Commute Time | # Commuters | % Commuters |
| Less than 5 Minutes | 66 | 5.6% |
| 5 to 9 Minutes | 66 | 5.6% |
| 10 to 14 Minutes | 266 | 22.5% |
| 15 to 19 Minutes | 164 | 13.8% |
| 20 to 24 Minutes | 372 | 31.4% |
| 25 to 29 Minutes | 61 | 5.1% |
| 30 to 34 Minutes | 55 | 4.6% |
| 35 to 39 Minutes | 20 | 1.7% |
| 40 to 44 Minutes | 14 | 1.2% |
| 45 to 59 Minutes | 44 | 3.7% |
| 60 to 89 Minutes | 25 | 2.1% |
| 90 or more Minutes | 32 | 2.7% |
Commute Time by Sex in Wilder
The most common commute times in Wilder are 20 to 24 minutes (202 commuters, 30.1%) for males and 10 to 14 minutes (188 commuters, 36.6%) for females.
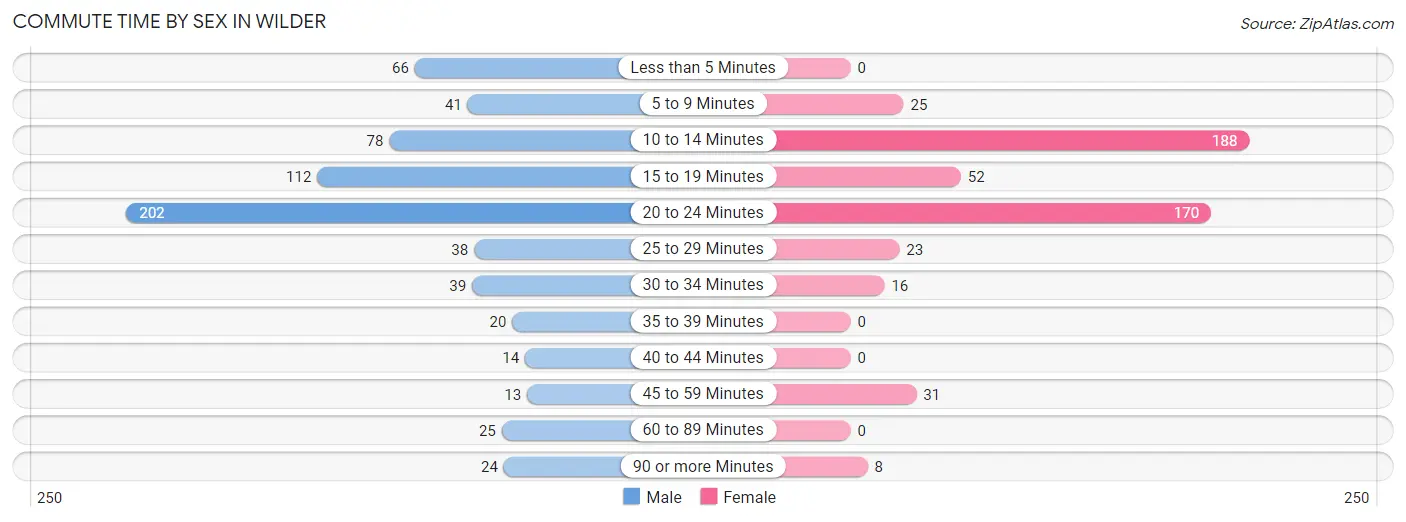
| Commute Time | Male | Female |
| Less than 5 Minutes | 66 (9.8%) | 0 (0.0%) |
| 5 to 9 Minutes | 41 (6.1%) | 25 (4.9%) |
| 10 to 14 Minutes | 78 (11.6%) | 188 (36.6%) |
| 15 to 19 Minutes | 112 (16.7%) | 52 (10.1%) |
| 20 to 24 Minutes | 202 (30.1%) | 170 (33.1%) |
| 25 to 29 Minutes | 38 (5.7%) | 23 (4.5%) |
| 30 to 34 Minutes | 39 (5.8%) | 16 (3.1%) |
| 35 to 39 Minutes | 20 (3.0%) | 0 (0.0%) |
| 40 to 44 Minutes | 14 (2.1%) | 0 (0.0%) |
| 45 to 59 Minutes | 13 (1.9%) | 31 (6.0%) |
| 60 to 89 Minutes | 25 (3.7%) | 0 (0.0%) |
| 90 or more Minutes | 24 (3.6%) | 8 (1.6%) |
Time of Departure to Work by Sex in Wilder
The most frequent times of departure to work in Wilder are 7:00 AM to 7:29 AM (221, 32.9%) for males and 7:00 AM to 7:29 AM (99, 19.3%) for females.
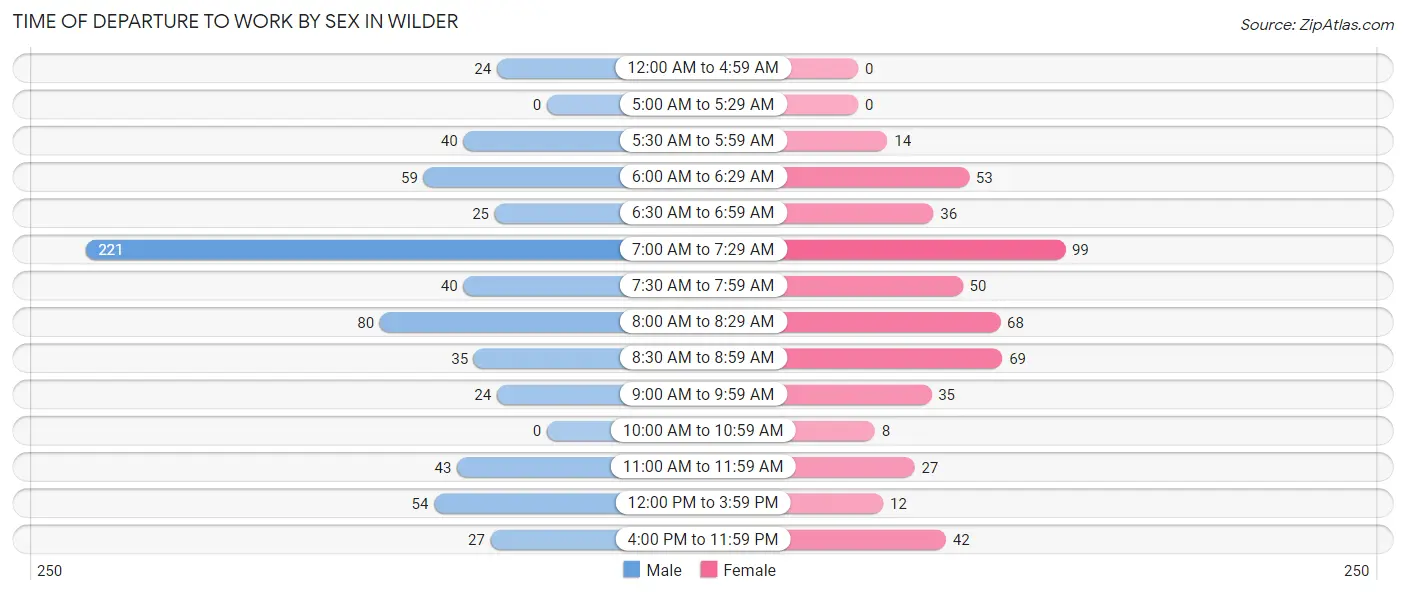
| Time of Departure | Male | Female |
| 12:00 AM to 4:59 AM | 24 (3.6%) | 0 (0.0%) |
| 5:00 AM to 5:29 AM | 0 (0.0%) | 0 (0.0%) |
| 5:30 AM to 5:59 AM | 40 (5.9%) | 14 (2.7%) |
| 6:00 AM to 6:29 AM | 59 (8.8%) | 53 (10.3%) |
| 6:30 AM to 6:59 AM | 25 (3.7%) | 36 (7.0%) |
| 7:00 AM to 7:29 AM | 221 (32.9%) | 99 (19.3%) |
| 7:30 AM to 7:59 AM | 40 (5.9%) | 50 (9.8%) |
| 8:00 AM to 8:29 AM | 80 (11.9%) | 68 (13.3%) |
| 8:30 AM to 8:59 AM | 35 (5.2%) | 69 (13.5%) |
| 9:00 AM to 9:59 AM | 24 (3.6%) | 35 (6.8%) |
| 10:00 AM to 10:59 AM | 0 (0.0%) | 8 (1.6%) |
| 11:00 AM to 11:59 AM | 43 (6.4%) | 27 (5.3%) |
| 12:00 PM to 3:59 PM | 54 (8.0%) | 12 (2.3%) |
| 4:00 PM to 11:59 PM | 27 (4.0%) | 42 (8.2%) |
| Total | 672 (100.0%) | 513 (100.0%) |
Housing Occupancy in Wilder
Occupancy by Ownership in Wilder
Of the total 1,595 dwellings in Wilder, owner-occupied units account for 1,214 (76.1%), while renter-occupied units make up 381 (23.9%).
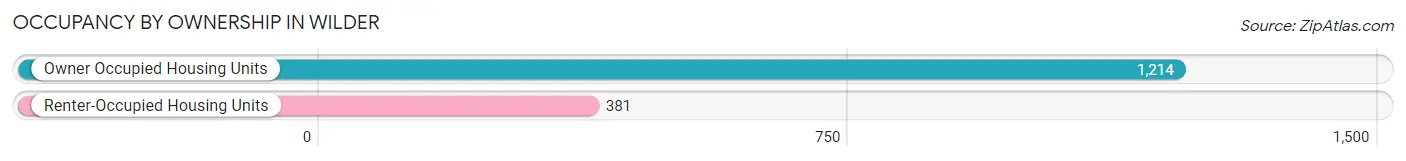
| Occupancy | # Housing Units | % Housing Units |
| Owner Occupied Housing Units | 1,214 | 76.1% |
| Renter-Occupied Housing Units | 381 | 23.9% |
| Total Occupied Housing Units | 1,595 | 100.0% |
Occupancy by Household Size in Wilder
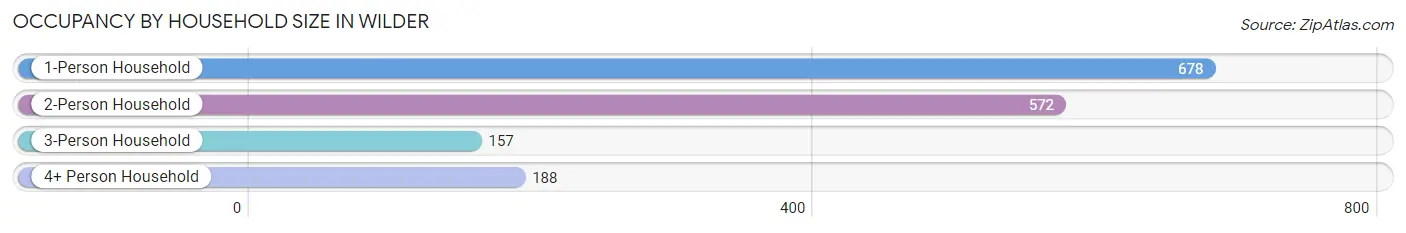
| Household Size | # Housing Units | % Housing Units |
| 1-Person Household | 678 | 42.5% |
| 2-Person Household | 572 | 35.9% |
| 3-Person Household | 157 | 9.8% |
| 4+ Person Household | 188 | 11.8% |
| Total Housing Units | 1,595 | 100.0% |
Occupancy by Ownership by Household Size in Wilder
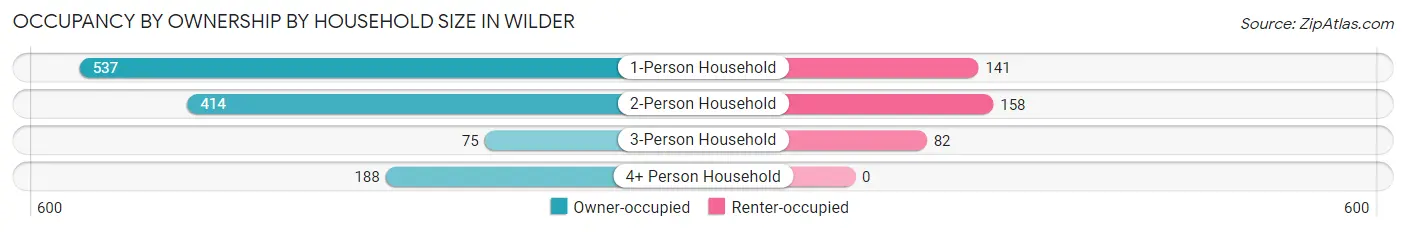
| Household Size | Owner-occupied | Renter-occupied |
| 1-Person Household | 537 (79.2%) | 141 (20.8%) |
| 2-Person Household | 414 (72.4%) | 158 (27.6%) |
| 3-Person Household | 75 (47.8%) | 82 (52.2%) |
| 4+ Person Household | 188 (100.0%) | 0 (0.0%) |
| Total Housing Units | 1,214 (76.1%) | 381 (23.9%) |
Occupancy by Educational Attainment in Wilder
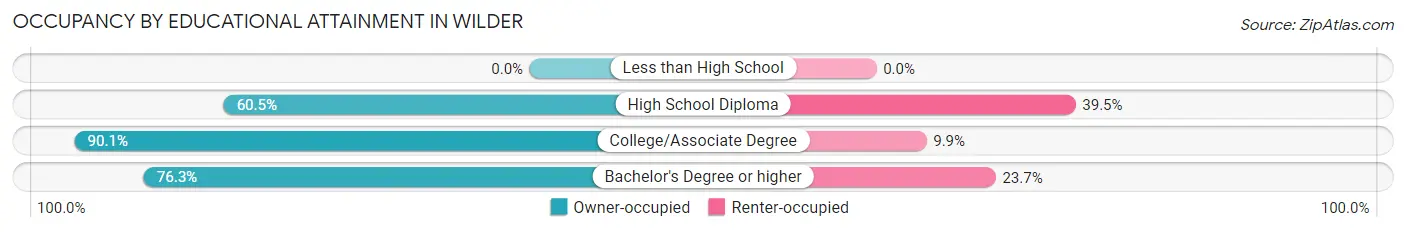
| Household Size | Owner-occupied | Renter-occupied |
| Less than High School | 0 (0.0%) | 0 (0.0%) |
| High School Diploma | 167 (60.5%) | 109 (39.5%) |
| College/Associate Degree | 263 (90.1%) | 29 (9.9%) |
| Bachelor's Degree or higher | 784 (76.3%) | 243 (23.7%) |
Occupancy by Age of Householder in Wilder
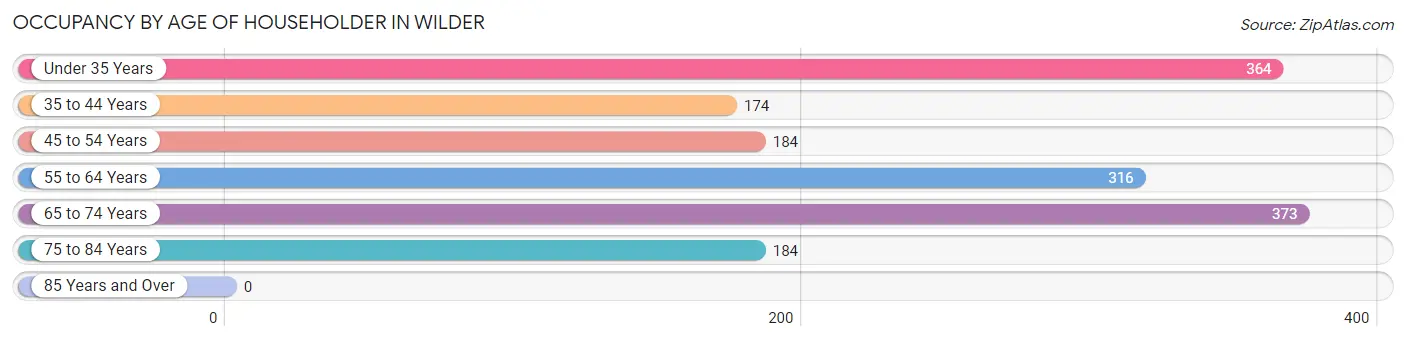
| Age Bracket | # Households | % Households |
| Under 35 Years | 364 | 22.8% |
| 35 to 44 Years | 174 | 10.9% |
| 45 to 54 Years | 184 | 11.5% |
| 55 to 64 Years | 316 | 19.8% |
| 65 to 74 Years | 373 | 23.4% |
| 75 to 84 Years | 184 | 11.5% |
| 85 Years and Over | 0 | 0.0% |
| Total | 1,595 | 100.0% |
Housing Finances in Wilder
Median Income by Occupancy in Wilder
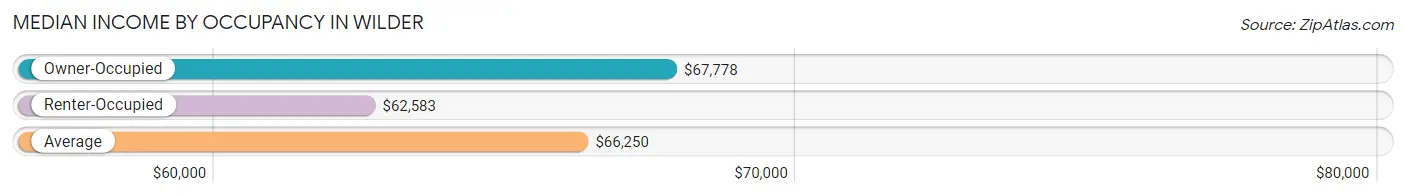
| Occupancy Type | # Households | Median Income |
| Owner-Occupied | 1,214 (76.1%) | $67,778 |
| Renter-Occupied | 381 (23.9%) | $62,583 |
| Average | 1,595 (100.0%) | $66,250 |
Occupancy by Householder Income Bracket in Wilder
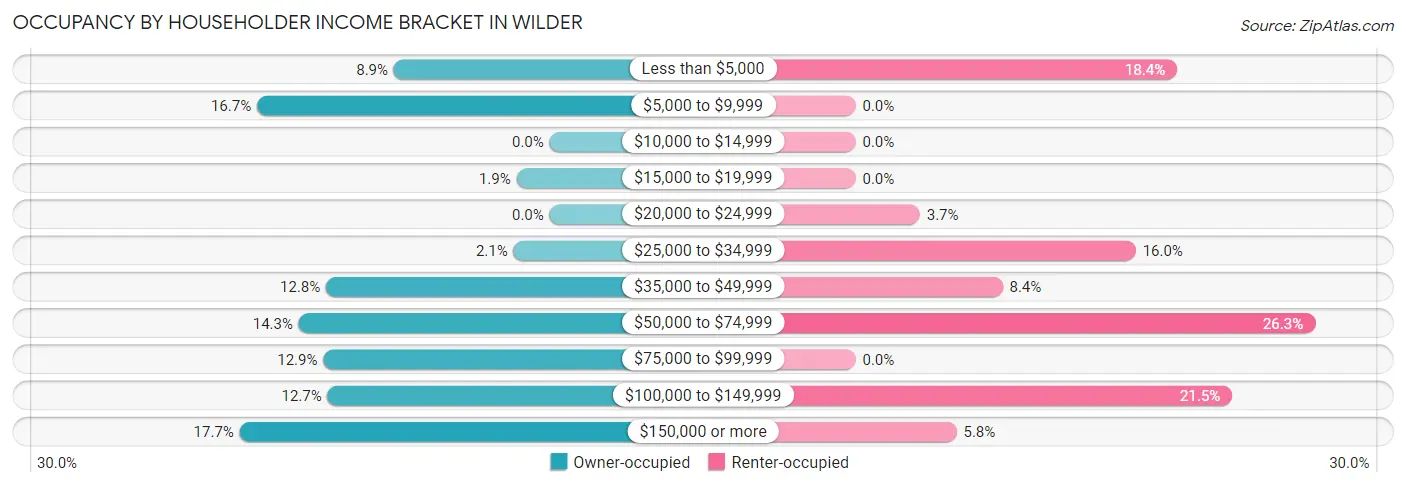
| Income Bracket | Owner-occupied | Renter-occupied |
| Less than $5,000 | 108 (8.9%) | 70 (18.4%) |
| $5,000 to $9,999 | 203 (16.7%) | 0 (0.0%) |
| $10,000 to $14,999 | 0 (0.0%) | 0 (0.0%) |
| $15,000 to $19,999 | 23 (1.9%) | 0 (0.0%) |
| $20,000 to $24,999 | 0 (0.0%) | 14 (3.7%) |
| $25,000 to $34,999 | 25 (2.1%) | 61 (16.0%) |
| $35,000 to $49,999 | 155 (12.8%) | 32 (8.4%) |
| $50,000 to $74,999 | 174 (14.3%) | 100 (26.3%) |
| $75,000 to $99,999 | 157 (12.9%) | 0 (0.0%) |
| $100,000 to $149,999 | 154 (12.7%) | 82 (21.5%) |
| $150,000 or more | 215 (17.7%) | 22 (5.8%) |
| Total | 1,214 (100.0%) | 381 (100.0%) |
Monthly Housing Cost Tiers in Wilder
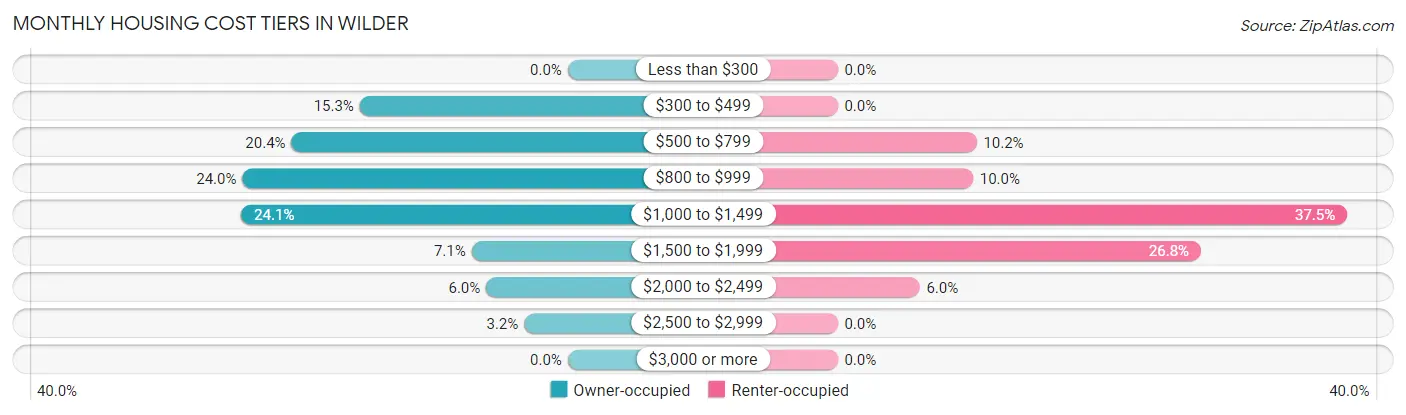
| Monthly Cost | Owner-occupied | Renter-occupied |
| Less than $300 | 0 (0.0%) | 0 (0.0%) |
| $300 to $499 | 186 (15.3%) | 0 (0.0%) |
| $500 to $799 | 247 (20.3%) | 39 (10.2%) |
| $800 to $999 | 291 (24.0%) | 38 (10.0%) |
| $1,000 to $1,499 | 292 (24.0%) | 143 (37.5%) |
| $1,500 to $1,999 | 86 (7.1%) | 102 (26.8%) |
| $2,000 to $2,499 | 73 (6.0%) | 23 (6.0%) |
| $2,500 to $2,999 | 39 (3.2%) | 0 (0.0%) |
| $3,000 or more | 0 (0.0%) | 0 (0.0%) |
| Total | 1,214 (100.0%) | 381 (100.0%) |
Physical Housing Characteristics in Wilder
Housing Structures in Wilder
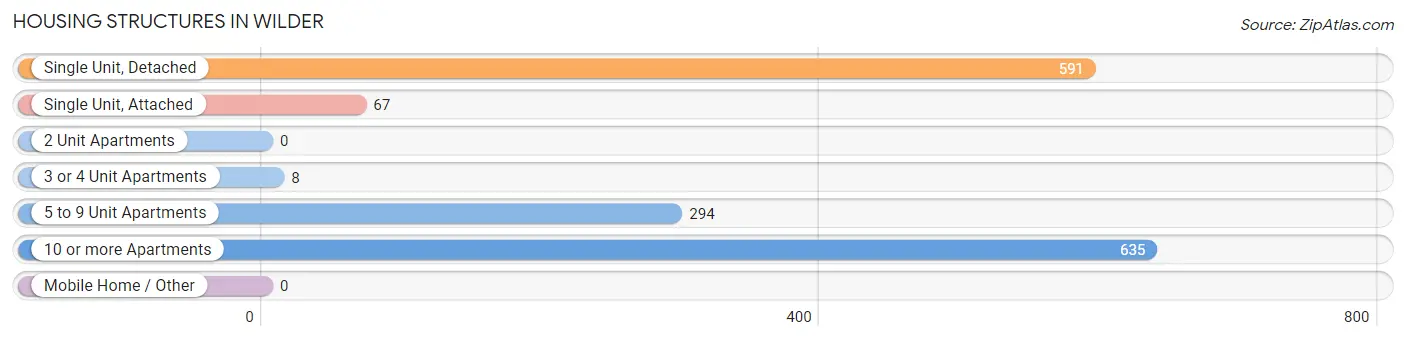
| Structure Type | # Housing Units | % Housing Units |
| Single Unit, Detached | 591 | 37.0% |
| Single Unit, Attached | 67 | 4.2% |
| 2 Unit Apartments | 0 | 0.0% |
| 3 or 4 Unit Apartments | 8 | 0.5% |
| 5 to 9 Unit Apartments | 294 | 18.4% |
| 10 or more Apartments | 635 | 39.8% |
| Mobile Home / Other | 0 | 0.0% |
| Total | 1,595 | 100.0% |
Housing Structures by Occupancy in Wilder
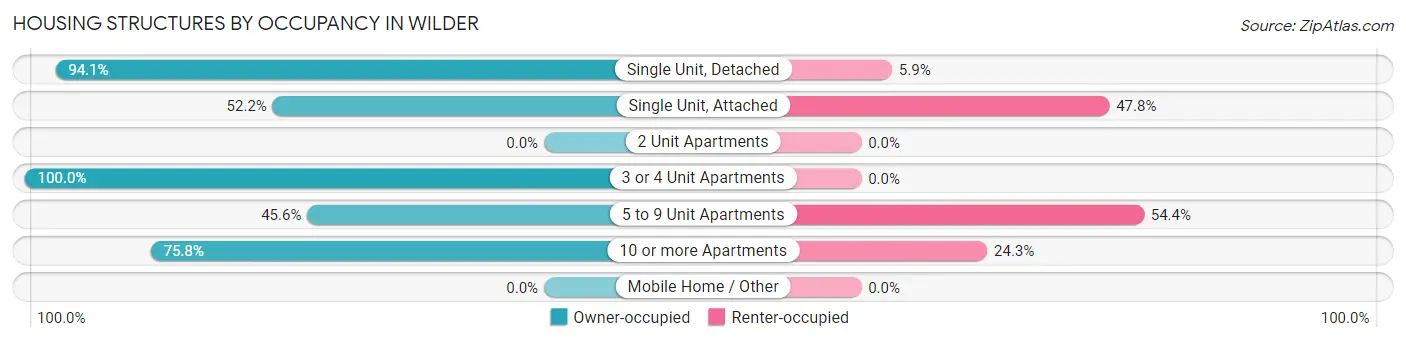
| Structure Type | Owner-occupied | Renter-occupied |
| Single Unit, Detached | 556 (94.1%) | 35 (5.9%) |
| Single Unit, Attached | 35 (52.2%) | 32 (47.8%) |
| 2 Unit Apartments | 0 (0.0%) | 0 (0.0%) |
| 3 or 4 Unit Apartments | 8 (100.0%) | 0 (0.0%) |
| 5 to 9 Unit Apartments | 134 (45.6%) | 160 (54.4%) |
| 10 or more Apartments | 481 (75.7%) | 154 (24.2%) |
| Mobile Home / Other | 0 (0.0%) | 0 (0.0%) |
| Total | 1,214 (76.1%) | 381 (23.9%) |
Housing Structures by Number of Rooms in Wilder
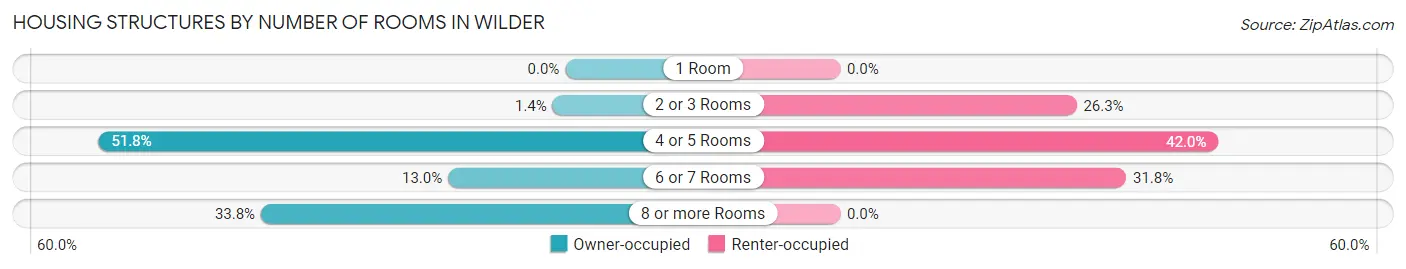
| Number of Rooms | Owner-occupied | Renter-occupied |
| 1 Room | 0 (0.0%) | 0 (0.0%) |
| 2 or 3 Rooms | 17 (1.4%) | 100 (26.3%) |
| 4 or 5 Rooms | 629 (51.8%) | 160 (42.0%) |
| 6 or 7 Rooms | 158 (13.0%) | 121 (31.8%) |
| 8 or more Rooms | 410 (33.8%) | 0 (0.0%) |
| Total | 1,214 (100.0%) | 381 (100.0%) |
Housing Structure by Heating Type in Wilder
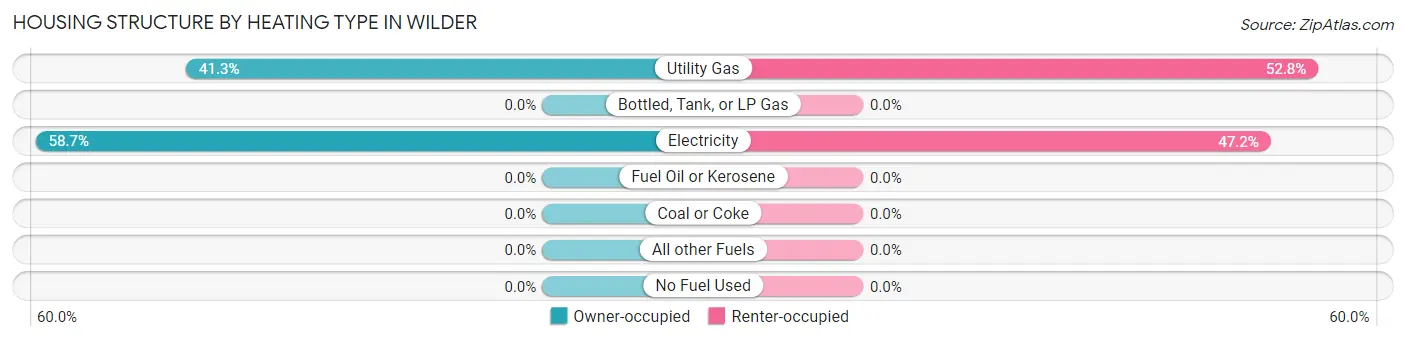
| Heating Type | Owner-occupied | Renter-occupied |
| Utility Gas | 501 (41.3%) | 201 (52.8%) |
| Bottled, Tank, or LP Gas | 0 (0.0%) | 0 (0.0%) |
| Electricity | 713 (58.7%) | 180 (47.2%) |
| Fuel Oil or Kerosene | 0 (0.0%) | 0 (0.0%) |
| Coal or Coke | 0 (0.0%) | 0 (0.0%) |
| All other Fuels | 0 (0.0%) | 0 (0.0%) |
| No Fuel Used | 0 (0.0%) | 0 (0.0%) |
| Total | 1,214 (100.0%) | 381 (100.0%) |
Household Vehicle Usage in Wilder
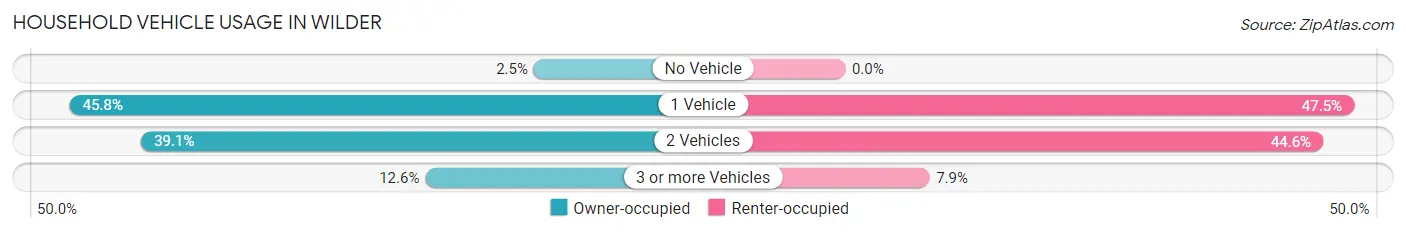
| Vehicles per Household | Owner-occupied | Renter-occupied |
| No Vehicle | 30 (2.5%) | 0 (0.0%) |
| 1 Vehicle | 556 (45.8%) | 181 (47.5%) |
| 2 Vehicles | 475 (39.1%) | 170 (44.6%) |
| 3 or more Vehicles | 153 (12.6%) | 30 (7.9%) |
| Total | 1,214 (100.0%) | 381 (100.0%) |
Real Estate & Mortgages in Wilder
Real Estate and Mortgage Overview in Wilder
| Characteristic | Without Mortgage | With Mortgage |
| Housing Units | 444 | 770 |
| Median Property Value | $215,700 | $99,600 |
| Median Household Income | $72,959 | $185 |
| Monthly Housing Costs | $555 | $0 |
| Real Estate Taxes | $1,845 | $0 |
Property Value by Mortgage Status in Wilder
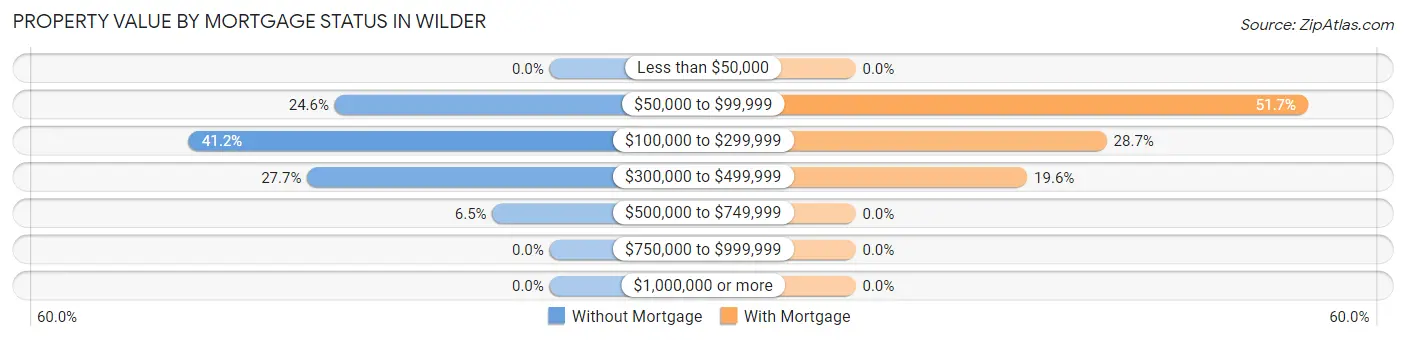
| Property Value | Without Mortgage | With Mortgage |
| Less than $50,000 | 0 (0.0%) | 0 (0.0%) |
| $50,000 to $99,999 | 109 (24.5%) | 398 (51.7%) |
| $100,000 to $299,999 | 183 (41.2%) | 221 (28.7%) |
| $300,000 to $499,999 | 123 (27.7%) | 151 (19.6%) |
| $500,000 to $749,999 | 29 (6.5%) | 0 (0.0%) |
| $750,000 to $999,999 | 0 (0.0%) | 0 (0.0%) |
| $1,000,000 or more | 0 (0.0%) | 0 (0.0%) |
| Total | 444 (100.0%) | 770 (100.0%) |
Household Income by Mortgage Status in Wilder
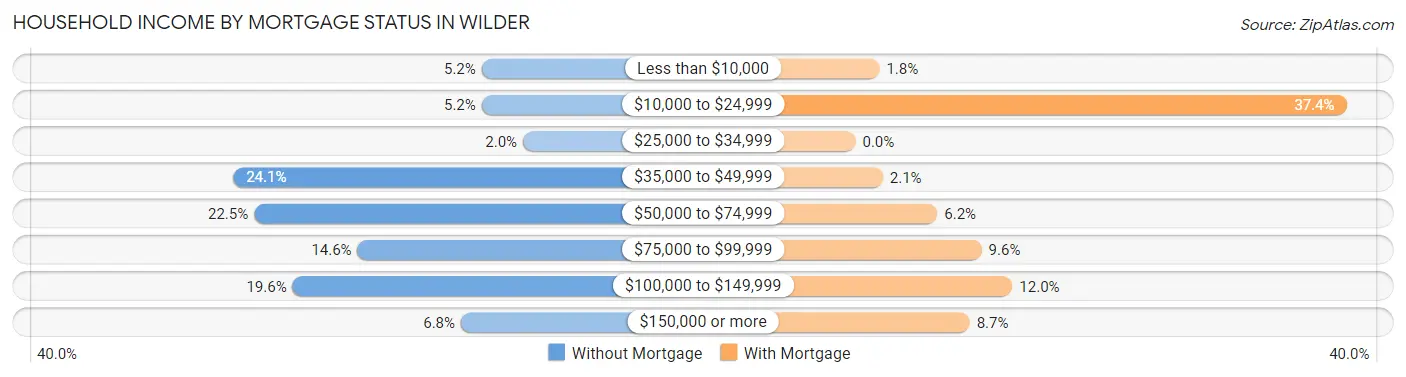
| Household Income | Without Mortgage | With Mortgage |
| Less than $10,000 | 23 (5.2%) | 14 (1.8%) |
| $10,000 to $24,999 | 23 (5.2%) | 288 (37.4%) |
| $25,000 to $34,999 | 9 (2.0%) | 0 (0.0%) |
| $35,000 to $49,999 | 107 (24.1%) | 16 (2.1%) |
| $50,000 to $74,999 | 100 (22.5%) | 48 (6.2%) |
| $75,000 to $99,999 | 65 (14.6%) | 74 (9.6%) |
| $100,000 to $149,999 | 87 (19.6%) | 92 (11.9%) |
| $150,000 or more | 30 (6.8%) | 67 (8.7%) |
| Total | 444 (100.0%) | 770 (100.0%) |
Property Value to Household Income Ratio in Wilder
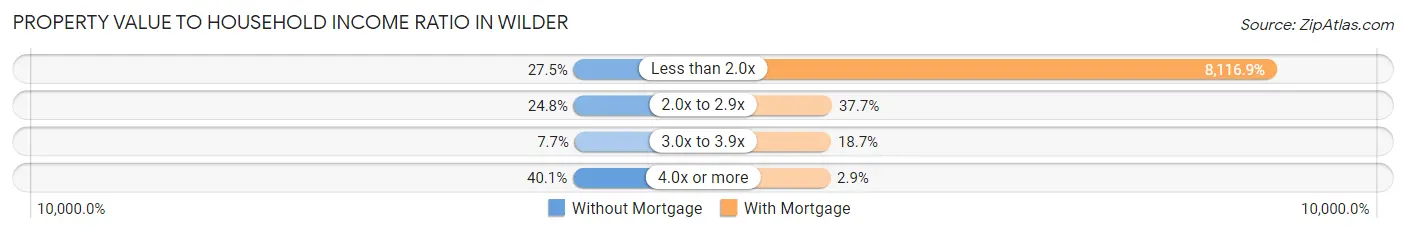
| Value-to-Income Ratio | Without Mortgage | With Mortgage |
| Less than 2.0x | 122 (27.5%) | 62,500 (8,116.9%) |
| 2.0x to 2.9x | 110 (24.8%) | 290 (37.7%) |
| 3.0x to 3.9x | 34 (7.7%) | 144 (18.7%) |
| 4.0x or more | 178 (40.1%) | 22 (2.9%) |
| Total | 444 (100.0%) | 770 (100.0%) |
Real Estate Taxes by Mortgage Status in Wilder
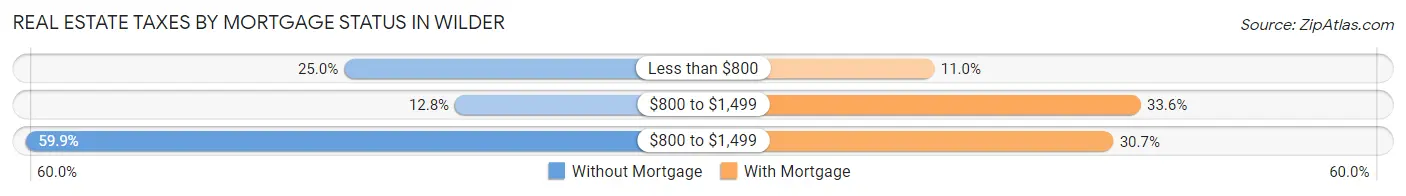
| Property Taxes | Without Mortgage | With Mortgage |
| Less than $800 | 111 (25.0%) | 85 (11.0%) |
| $800 to $1,499 | 57 (12.8%) | 259 (33.6%) |
| $800 to $1,499 | 266 (59.9%) | 236 (30.6%) |
| Total | 444 (100.0%) | 770 (100.0%) |
Health & Disability in Wilder
Health Insurance Coverage by Age in Wilder
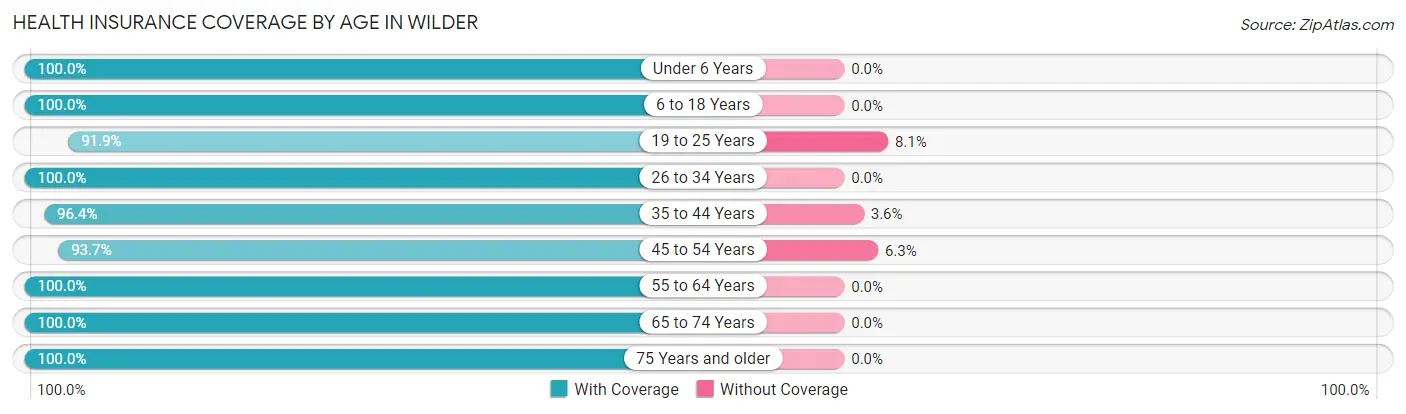
| Age Bracket | With Coverage | Without Coverage |
| Under 6 Years | 160 (100.0%) | 0 (0.0%) |
| 6 to 18 Years | 355 (100.0%) | 0 (0.0%) |
| 19 to 25 Years | 350 (91.9%) | 31 (8.1%) |
| 26 to 34 Years | 363 (100.0%) | 0 (0.0%) |
| 35 to 44 Years | 372 (96.4%) | 14 (3.6%) |
| 45 to 54 Years | 224 (93.7%) | 15 (6.3%) |
| 55 to 64 Years | 557 (100.0%) | 0 (0.0%) |
| 65 to 74 Years | 476 (100.0%) | 0 (0.0%) |
| 75 Years and older | 235 (100.0%) | 0 (0.0%) |
| Total | 3,092 (98.1%) | 60 (1.9%) |
Health Insurance Coverage by Citizenship Status in Wilder
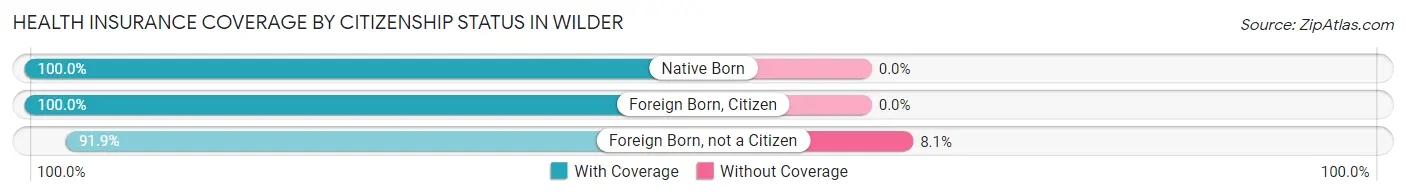
| Citizenship Status | With Coverage | Without Coverage |
| Native Born | 160 (100.0%) | 0 (0.0%) |
| Foreign Born, Citizen | 355 (100.0%) | 0 (0.0%) |
| Foreign Born, not a Citizen | 350 (91.9%) | 31 (8.1%) |
Health Insurance Coverage by Household Income in Wilder
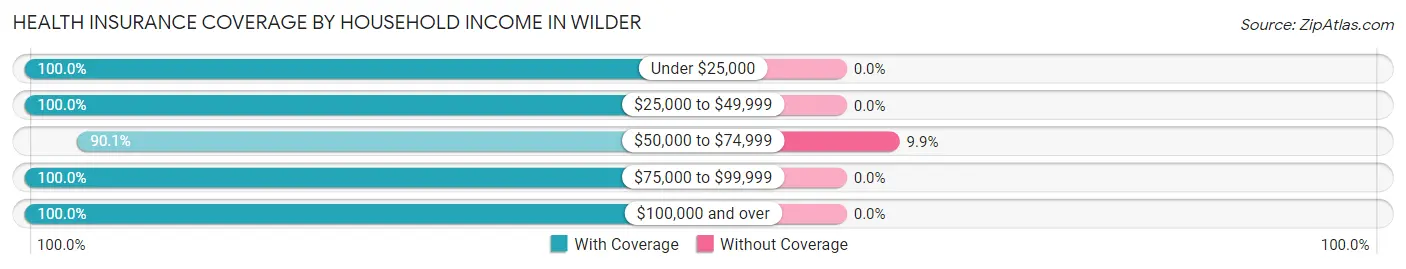
| Household Income | With Coverage | Without Coverage |
| Under $25,000 | 418 (100.0%) | 0 (0.0%) |
| $25,000 to $49,999 | 550 (100.0%) | 0 (0.0%) |
| $50,000 to $74,999 | 546 (90.1%) | 60 (9.9%) |
| $75,000 to $99,999 | 273 (100.0%) | 0 (0.0%) |
| $100,000 and over | 1,305 (100.0%) | 0 (0.0%) |
Public vs Private Health Insurance Coverage by Age in Wilder
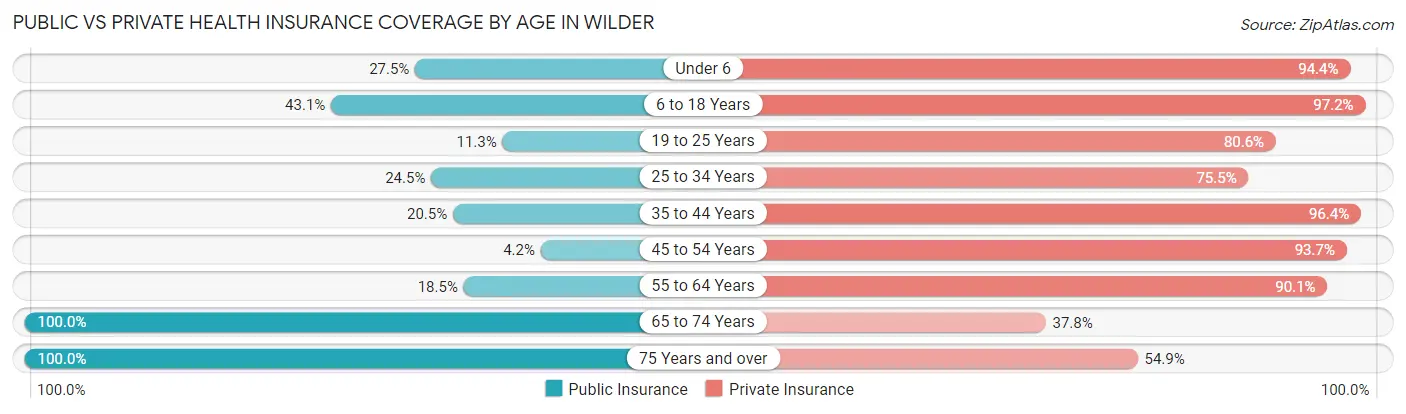
| Age Bracket | Public Insurance | Private Insurance |
| Under 6 | 44 (27.5%) | 151 (94.4%) |
| 6 to 18 Years | 153 (43.1%) | 345 (97.2%) |
| 19 to 25 Years | 43 (11.3%) | 307 (80.6%) |
| 25 to 34 Years | 89 (24.5%) | 274 (75.5%) |
| 35 to 44 Years | 79 (20.5%) | 372 (96.4%) |
| 45 to 54 Years | 10 (4.2%) | 224 (93.7%) |
| 55 to 64 Years | 103 (18.5%) | 502 (90.1%) |
| 65 to 74 Years | 476 (100.0%) | 180 (37.8%) |
| 75 Years and over | 235 (100.0%) | 129 (54.9%) |
| Total | 1,232 (39.1%) | 2,484 (78.8%) |
Disability Status by Sex by Age in Wilder
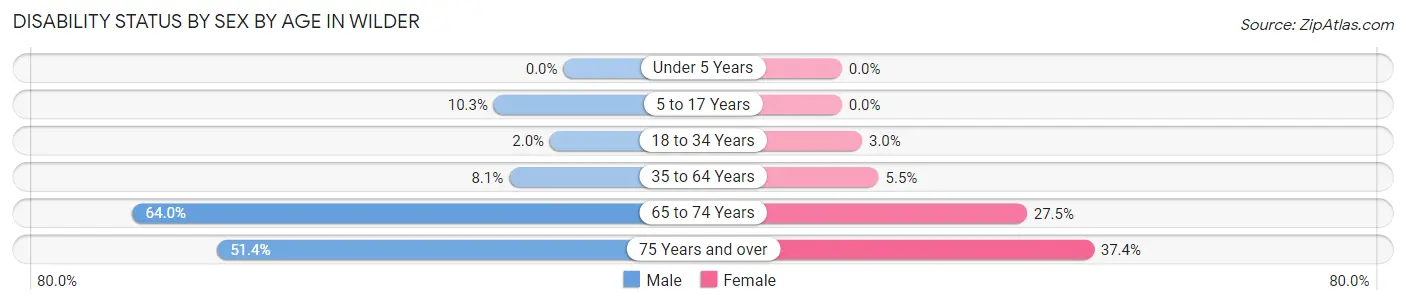
| Age Bracket | Male | Female |
| Under 5 Years | 0 (0.0%) | 0 (0.0%) |
| 5 to 17 Years | 19 (10.3%) | 0 (0.0%) |
| 18 to 34 Years | 9 (2.0%) | 9 (3.0%) |
| 35 to 64 Years | 51 (8.1%) | 30 (5.5%) |
| 65 to 74 Years | 188 (63.9%) | 50 (27.5%) |
| 75 Years and over | 37 (51.4%) | 61 (37.4%) |
Disability Class by Sex by Age in Wilder
Disability Class: Hearing Difficulty
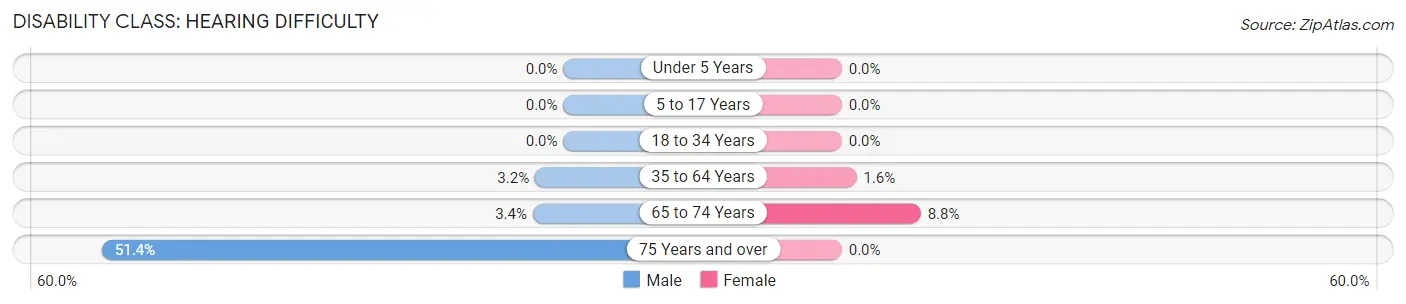
| Age Bracket | Male | Female |
| Under 5 Years | 0 (0.0%) | 0 (0.0%) |
| 5 to 17 Years | 0 (0.0%) | 0 (0.0%) |
| 18 to 34 Years | 0 (0.0%) | 0 (0.0%) |
| 35 to 64 Years | 20 (3.2%) | 9 (1.6%) |
| 65 to 74 Years | 10 (3.4%) | 16 (8.8%) |
| 75 Years and over | 37 (51.4%) | 0 (0.0%) |
Disability Class: Vision Difficulty
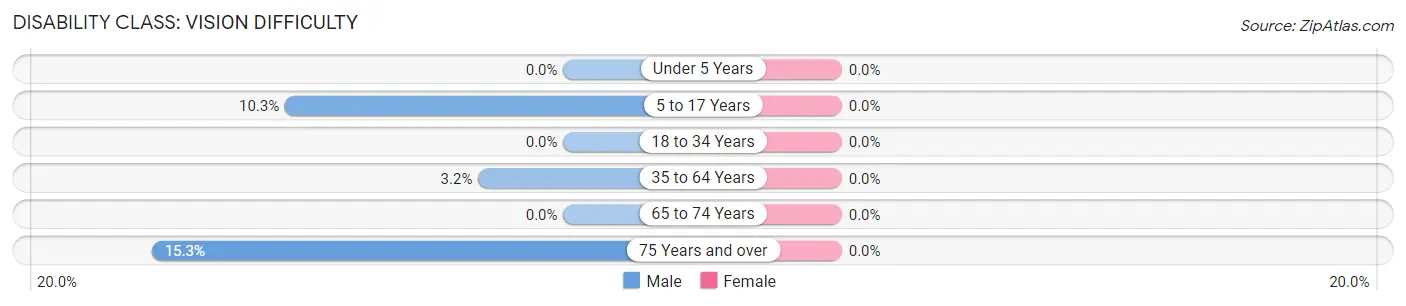
| Age Bracket | Male | Female |
| Under 5 Years | 0 (0.0%) | 0 (0.0%) |
| 5 to 17 Years | 19 (10.3%) | 0 (0.0%) |
| 18 to 34 Years | 0 (0.0%) | 0 (0.0%) |
| 35 to 64 Years | 20 (3.2%) | 0 (0.0%) |
| 65 to 74 Years | 0 (0.0%) | 0 (0.0%) |
| 75 Years and over | 11 (15.3%) | 0 (0.0%) |
Disability Class: Cognitive Difficulty
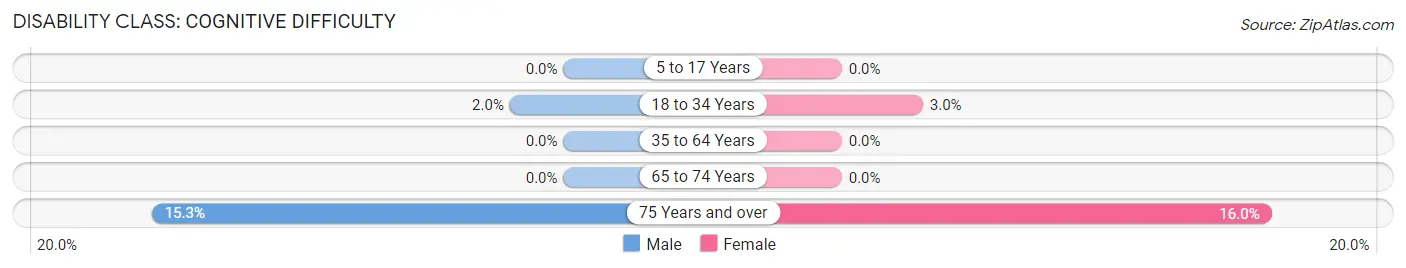
| Age Bracket | Male | Female |
| 5 to 17 Years | 0 (0.0%) | 0 (0.0%) |
| 18 to 34 Years | 9 (2.0%) | 9 (3.0%) |
| 35 to 64 Years | 0 (0.0%) | 0 (0.0%) |
| 65 to 74 Years | 0 (0.0%) | 0 (0.0%) |
| 75 Years and over | 11 (15.3%) | 26 (16.0%) |
Disability Class: Ambulatory Difficulty
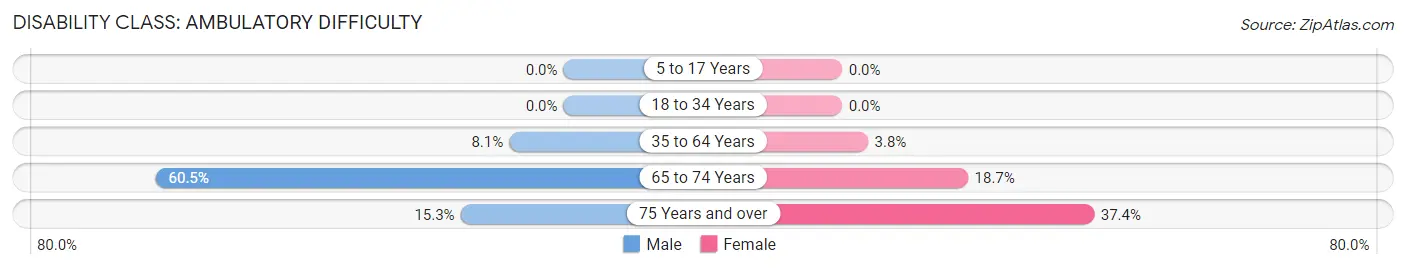
| Age Bracket | Male | Female |
| 5 to 17 Years | 0 (0.0%) | 0 (0.0%) |
| 18 to 34 Years | 0 (0.0%) | 0 (0.0%) |
| 35 to 64 Years | 51 (8.1%) | 21 (3.8%) |
| 65 to 74 Years | 178 (60.5%) | 34 (18.7%) |
| 75 Years and over | 11 (15.3%) | 61 (37.4%) |
Disability Class: Self-Care Difficulty
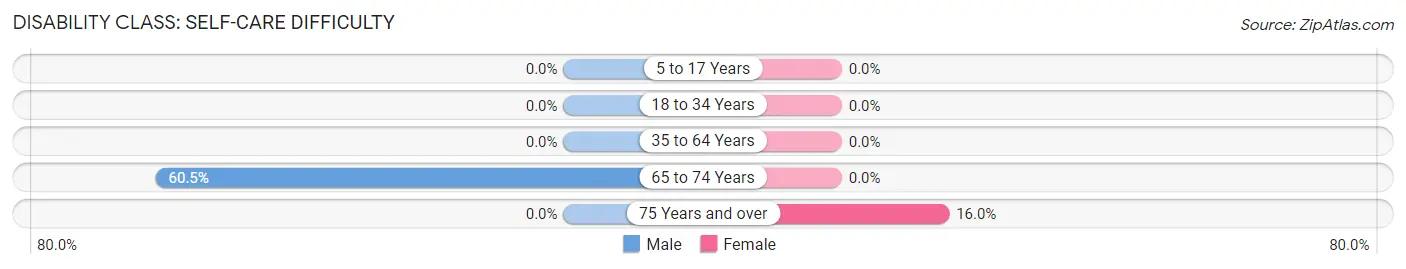
| Age Bracket | Male | Female |
| 5 to 17 Years | 0 (0.0%) | 0 (0.0%) |
| 18 to 34 Years | 0 (0.0%) | 0 (0.0%) |
| 35 to 64 Years | 0 (0.0%) | 0 (0.0%) |
| 65 to 74 Years | 178 (60.5%) | 0 (0.0%) |
| 75 Years and over | 0 (0.0%) | 26 (16.0%) |
Technology Access in Wilder
Computing Device Access in Wilder
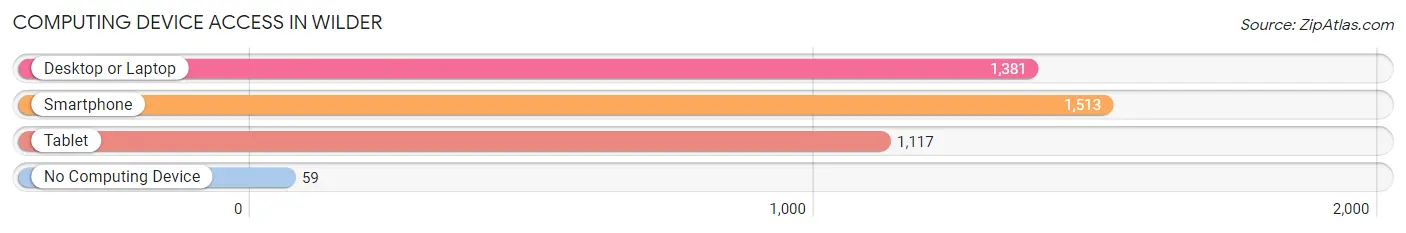
| Device Type | # Households | % Households |
| Desktop or Laptop | 1,381 | 86.6% |
| Smartphone | 1,513 | 94.9% |
| Tablet | 1,117 | 70.0% |
| No Computing Device | 59 | 3.7% |
| Total | 1,595 | 100.0% |
Internet Access in Wilder
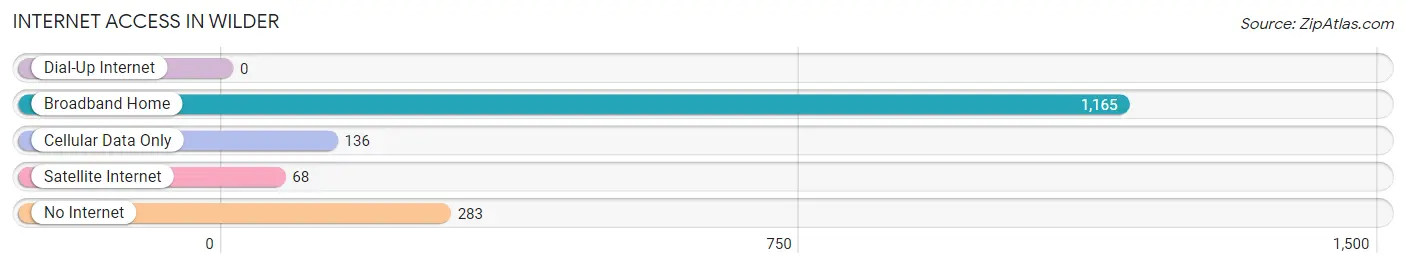
| Internet Type | # Households | % Households |
| Dial-Up Internet | 0 | 0.0% |
| Broadband Home | 1,165 | 73.0% |
| Cellular Data Only | 136 | 8.5% |
| Satellite Internet | 68 | 4.3% |
| No Internet | 283 | 17.7% |
| Total | 1,595 | 100.0% |
Wilder Summary
Wilder, Kentucky is a small city located in Campbell County, Kentucky. It is situated on the banks of the Ohio River, just north of Cincinnati, Ohio. The city has a population of approximately 4,000 people and is part of the Cincinnati metropolitan area.
History
Wilder was founded in 1817 by William Wilder, a Revolutionary War veteran. The city was originally known as Wilder’s Landing, and was a major port for steamboats traveling up and down the Ohio River. In 1845, the city was renamed Wilder, and it was incorporated in 1867.
During the Civil War, Wilder was a major supply depot for the Union Army. The city was also the site of a major battle in 1862, when Confederate forces attempted to capture the city. The Union forces were able to repel the attack and the city remained in Union hands for the remainder of the war.
In the late 19th century, Wilder became a major industrial center, with several factories and mills located in the city. The city also became a major transportation hub, with the Cincinnati, Hamilton & Dayton Railroad running through the city.
Geography
Wilder is located in the northern part of Campbell County, Kentucky. The city is situated on the banks of the Ohio River, just north of Cincinnati, Ohio. The city has a total area of 2.2 square miles, all of which is land.
The city is located in a humid subtropical climate zone, with hot, humid summers and cold, wet winters. The average annual temperature is around 57 degrees Fahrenheit, with an average high of around 79 degrees in the summer and an average low of around 35 degrees in the winter.
Economy
Wilder’s economy is largely based on manufacturing and transportation. The city is home to several factories and mills, including a paper mill, a steel mill, and a chemical plant. The city is also a major transportation hub, with the Cincinnati, Hamilton & Dayton Railroad running through the city.
The city also has a growing tourism industry, with several attractions located in the city, including the Wilder Museum of History and the Wilder Art Gallery.
Demographics
As of the 2010 census, Wilder had a population of 4,000 people. The racial makeup of the city was 94.2% White, 2.2% African American, 0.7% Native American, 0.7% Asian, 0.2% Pacific Islander, and 1.9% from other races. Hispanic or Latino of any race were 2.2% of the population.
The median household income in Wilder was $37,500, and the median family income was $45,000. The per capita income for the city was $19,000. About 11.2% of families and 14.2% of the population were below the poverty line, including 18.2% of those under age 18 and 8.2% of those age 65 or over.
Wilder is a small city with a rich history and a diverse economy. The city is home to several factories and mills, as well as a growing tourism industry. The city has a population of approximately 4,000 people, with a diverse racial makeup. The city has a median household income of $37,500 and a median family income of $45,000.
Common Questions
What is Per Capita Income in Wilder?
Per Capita income in Wilder is $43,548.
What is the Median Family Income in Wilder?
Median Family Income in Wilder is $96,806.
What is the Median Household income in Wilder?
Median Household Income in Wilder is $66,250.
What is Income or Wage Gap in Wilder?
Income or Wage Gap in Wilder is 51.5%.
Women in Wilder earn 48.5 cents for every dollar earned by a man.
What is Inequality or Gini Index in Wilder?
Inequality or Gini Index in Wilder is 0.52.
What is the Total Population of Wilder?
Total Population of Wilder is 3,152.
What is the Total Male Population of Wilder?
Total Male Population of Wilder is 1,716.
What is the Total Female Population of Wilder?
Total Female Population of Wilder is 1,436.
What is the Ratio of Males per 100 Females in Wilder?
There are 119.50 Males per 100 Females in Wilder.
What is the Ratio of Females per 100 Males in Wilder?
There are 83.68 Females per 100 Males in Wilder.
What is the Median Population Age in Wilder?
Median Population Age in Wilder is 42.4 Years.
What is the Average Family Size in Wilder
Average Family Size in Wilder is 2.8 People.
What is the Average Household Size in Wilder
Average Household Size in Wilder is 2.0 People.
How Large is the Labor Force in Wilder?
There are 1,577 People in the Labor Forcein in Wilder.
What is the Percentage of People in the Labor Force in Wilder?
58.8% of People are in the Labor Force in Wilder.
What is the Unemployment Rate in Wilder?
Unemployment Rate in Wilder is 5.5%.