Kuttawa, KY Map & Demographics
Kuttawa Map
Kuttawa Overview
$27,495
PER CAPITA INCOME
$70,469
AVG FAMILY INCOME
$59,044
AVG HOUSEHOLD INCOME
45.0%
WAGE / INCOME GAP [ % ]
55.0¢/ $1
WAGE / INCOME GAP [ $ ]
0.42
INEQUALITY / GINI INDEX
622
TOTAL POPULATION
265
MALE POPULATION
357
FEMALE POPULATION
74.23
MALES / 100 FEMALES
134.72
FEMALES / 100 MALES
64.4
MEDIAN AGE
3.1
AVG FAMILY SIZE
2.5
AVG HOUSEHOLD SIZE
142
LABOR FORCE [ PEOPLE ]
26.6%
PERCENT IN LABOR FORCE
4.9%
UNEMPLOYMENT RATE
Kuttawa Zip Codes
Kuttawa Area Codes
Income in Kuttawa
Income Overview in Kuttawa
Per Capita Income in Kuttawa is $27,495, while median incomes of families and households are $70,469 and $59,044 respectively.
| Characteristic | Number | Measure |
| Per Capita Income | 622 | $27,495 |
| Median Family Income | 115 | $70,469 |
| Mean Family Income | 115 | $88,325 |
| Median Household Income | 207 | $59,044 |
| Mean Household Income | 207 | $78,459 |
| Income Deficit | 115 | $0 |
| Wage / Income Gap (%) | 622 | 45.01% |
| Wage / Income Gap ($) | 622 | 54.99¢ per $1 |
| Gini / Inequality Index | 622 | 0.42 |
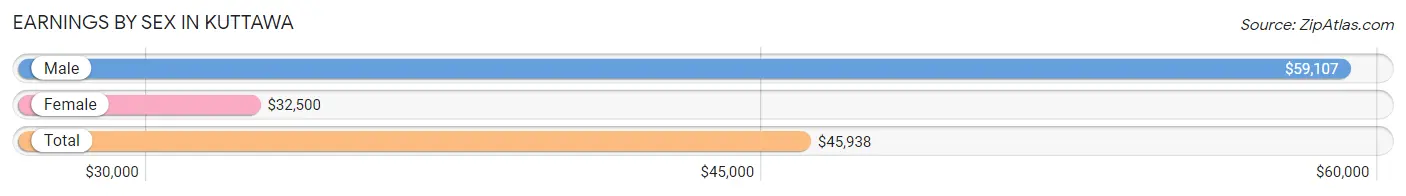
Earnings by Sex in Kuttawa
Average Earnings in Kuttawa are $45,938, $59,107 for men and $32,500 for women, a difference of 45.0%.
| Sex | Number | Average Earnings |
| Male | 77 (52.4%) | $59,107 |
| Female | 70 (47.6%) | $32,500 |
| Total | 147 (100.0%) | $45,938 |
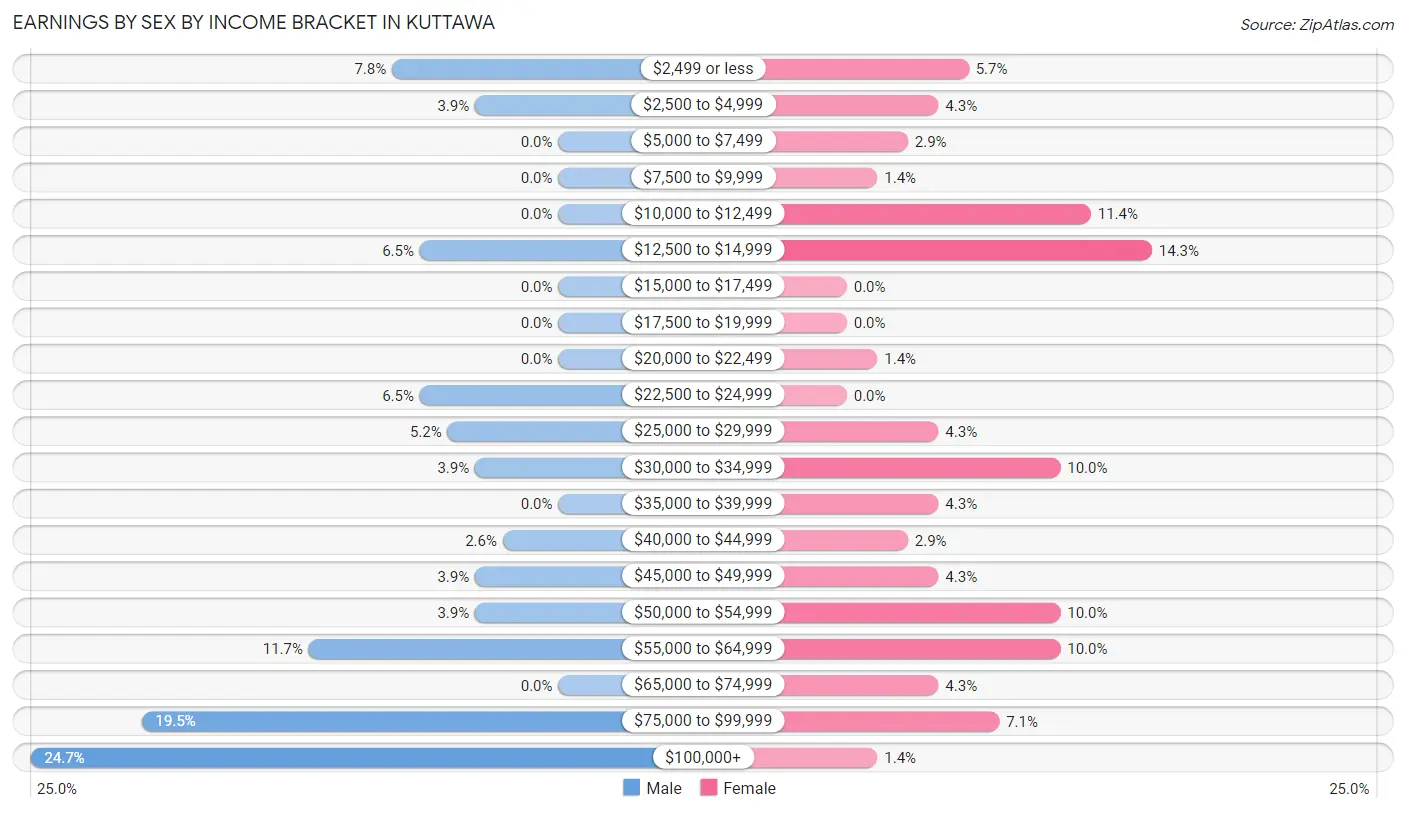
Earnings by Sex by Income Bracket in Kuttawa
The most common earnings brackets in Kuttawa are $100,000+ for men (19 | 24.7%) and $12,500 to $14,999 for women (10 | 14.3%).
| Income | Male | Female |
| $2,499 or less | 6 (7.8%) | 4 (5.7%) |
| $2,500 to $4,999 | 3 (3.9%) | 3 (4.3%) |
| $5,000 to $7,499 | 0 (0.0%) | 2 (2.9%) |
| $7,500 to $9,999 | 0 (0.0%) | 1 (1.4%) |
| $10,000 to $12,499 | 0 (0.0%) | 8 (11.4%) |
| $12,500 to $14,999 | 5 (6.5%) | 10 (14.3%) |
| $15,000 to $17,499 | 0 (0.0%) | 0 (0.0%) |
| $17,500 to $19,999 | 0 (0.0%) | 0 (0.0%) |
| $20,000 to $22,499 | 0 (0.0%) | 1 (1.4%) |
| $22,500 to $24,999 | 5 (6.5%) | 0 (0.0%) |
| $25,000 to $29,999 | 4 (5.2%) | 3 (4.3%) |
| $30,000 to $34,999 | 3 (3.9%) | 7 (10.0%) |
| $35,000 to $39,999 | 0 (0.0%) | 3 (4.3%) |
| $40,000 to $44,999 | 2 (2.6%) | 2 (2.9%) |
| $45,000 to $49,999 | 3 (3.9%) | 3 (4.3%) |
| $50,000 to $54,999 | 3 (3.9%) | 7 (10.0%) |
| $55,000 to $64,999 | 9 (11.7%) | 7 (10.0%) |
| $65,000 to $74,999 | 0 (0.0%) | 3 (4.3%) |
| $75,000 to $99,999 | 15 (19.5%) | 5 (7.1%) |
| $100,000+ | 19 (24.7%) | 1 (1.4%) |
| Total | 77 (100.0%) | 70 (100.0%) |
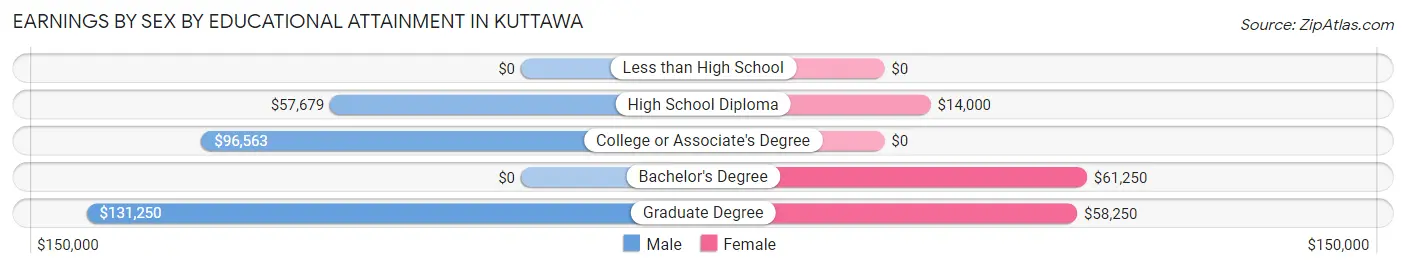
Earnings by Sex by Educational Attainment in Kuttawa
| Educational Attainment | Male Income | Female Income |
| Less than High School | - | - |
| High School Diploma | $57,679 | $14,000 |
| College or Associate's Degree | $96,563 | $0 |
| Bachelor's Degree | - | - |
| Graduate Degree | $131,250 | $58,250 |
| Total | - | - |
Family Income in Kuttawa
Family Income Brackets in Kuttawa
According to the Kuttawa family income data, there are 39 families falling into the $50,000 to $74,999 income range, which is the most common income bracket and makes up 33.9% of all families.
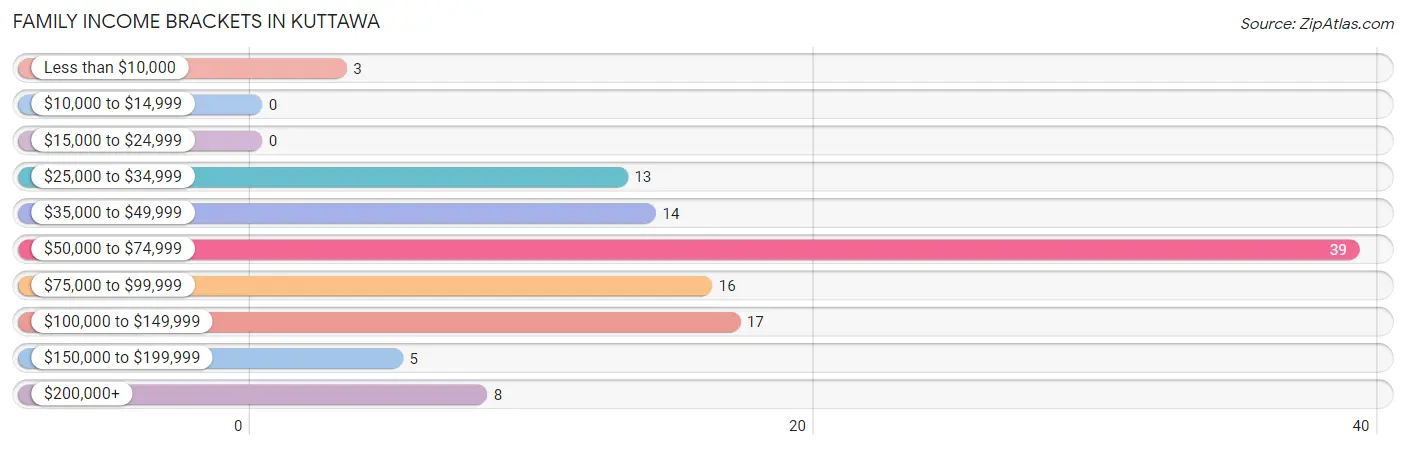
| Income Bracket | # Families | % Families |
| Less than $10,000 | 3 | 2.6% |
| $10,000 to $14,999 | 0 | 0.0% |
| $15,000 to $24,999 | 0 | 0.0% |
| $25,000 to $34,999 | 13 | 11.3% |
| $35,000 to $49,999 | 14 | 12.2% |
| $50,000 to $74,999 | 39 | 33.9% |
| $75,000 to $99,999 | 16 | 13.9% |
| $100,000 to $149,999 | 17 | 14.8% |
| $150,000 to $199,999 | 5 | 4.3% |
| $200,000+ | 8 | 7.0% |
Family Income by Famaliy Size in Kuttawa
4-person families (6 | 5.2%) account for the highest median family income in Kuttawa with $211,250 per family, while 4-person families (6 | 5.2%) have the highest median income of $52,812 per family member.
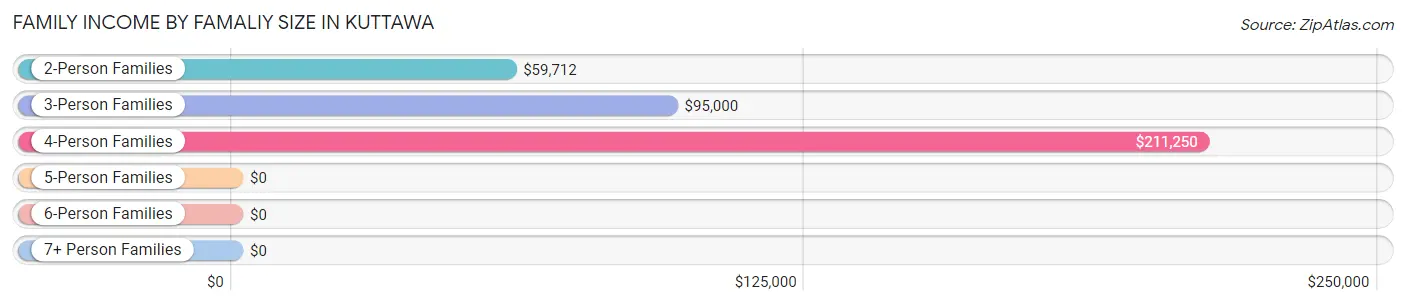
| Income Bracket | # Families | Median Income |
| 2-Person Families | 79 (68.7%) | $59,712 |
| 3-Person Families | 22 (19.1%) | $95,000 |
| 4-Person Families | 6 (5.2%) | $211,250 |
| 5-Person Families | 0 (0.0%) | $0 |
| 6-Person Families | 0 (0.0%) | $0 |
| 7+ Person Families | 8 (7.0%) | $0 |
| Total | 115 (100.0%) | $70,469 |
Family Income by Number of Earners in Kuttawa
The median family income in Kuttawa is $70,469, with families comprising 3+ earners (8) having the highest median family income of $192,500, while families with no earners (52) have the lowest median family income of $58,250, accounting for 7.0% and 45.2% of families, respectively.
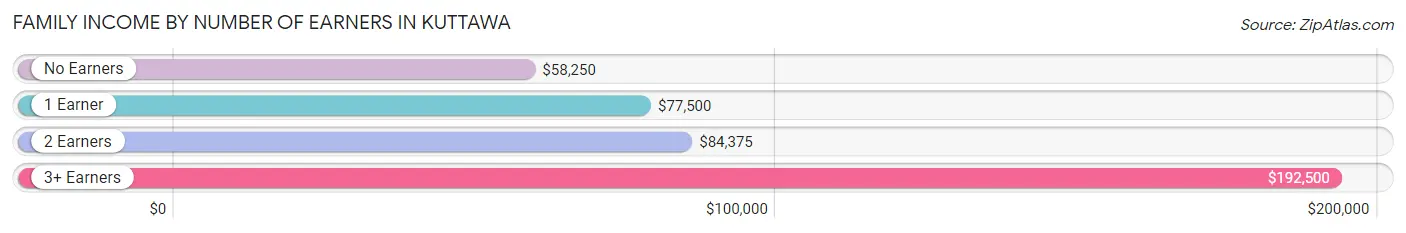
| Number of Earners | # Families | Median Income |
| No Earners | 52 (45.2%) | $58,250 |
| 1 Earner | 22 (19.1%) | $77,500 |
| 2 Earners | 33 (28.7%) | $84,375 |
| 3+ Earners | 8 (7.0%) | $192,500 |
| Total | 115 (100.0%) | $70,469 |
Household Income in Kuttawa
Household Income Brackets in Kuttawa
With 52 households falling in the category, the $50,000 to $74,999 income range is the most frequent in Kuttawa, accounting for 25.1% of all households. In contrast, only 5 households (2.4%) fall into the less than $10,000 income bracket, making it the least populous group.
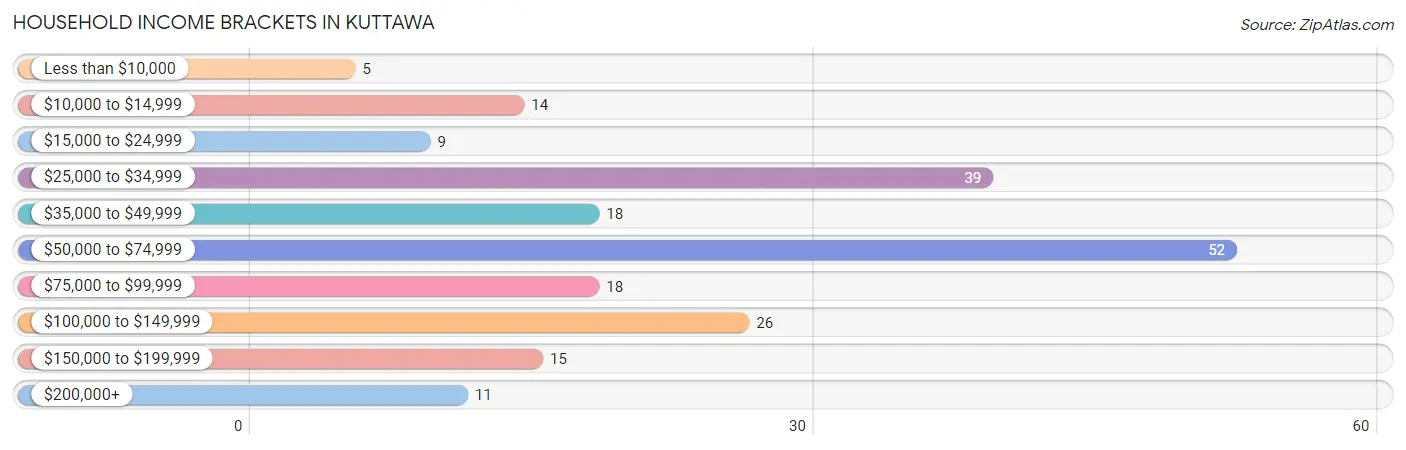
| Income Bracket | # Households | % Households |
| Less than $10,000 | 5 | 2.4% |
| $10,000 to $14,999 | 14 | 6.8% |
| $15,000 to $24,999 | 9 | 4.3% |
| $25,000 to $34,999 | 39 | 18.8% |
| $35,000 to $49,999 | 18 | 8.7% |
| $50,000 to $74,999 | 52 | 25.1% |
| $75,000 to $99,999 | 18 | 8.7% |
| $100,000 to $149,999 | 26 | 12.6% |
| $150,000 to $199,999 | 15 | 7.2% |
| $200,000+ | 11 | 5.3% |
Household Income by Householder Age in Kuttawa
The median household income in Kuttawa is $59,044, with the highest median household income of $72,031 found in the 25 to 44 years age bracket for the primary householder. A total of 21 households (10.1%) fall into this category. Meanwhile, the 15 to 24 years age bracket for the primary householder has the lowest median household income of $0, with 5 households (2.4%) in this group.
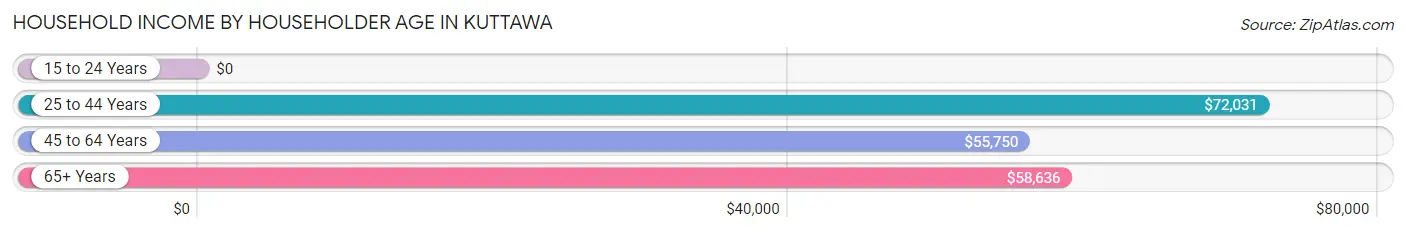
| Income Bracket | # Households | Median Income |
| 15 to 24 Years | 5 (2.4%) | $0 |
| 25 to 44 Years | 21 (10.1%) | $72,031 |
| 45 to 64 Years | 75 (36.2%) | $55,750 |
| 65+ Years | 106 (51.2%) | $58,636 |
| Total | 207 (100.0%) | $59,044 |
Poverty in Kuttawa
Income Below Poverty by Sex and Age in Kuttawa
With 7.0% poverty level for males and 15.6% for females among the residents of Kuttawa, 35 to 44 year old males and 45 to 54 year old females are the most vulnerable to poverty, with 4 males (30.8%) and 5 females (29.4%) in their respective age groups living below the poverty level.
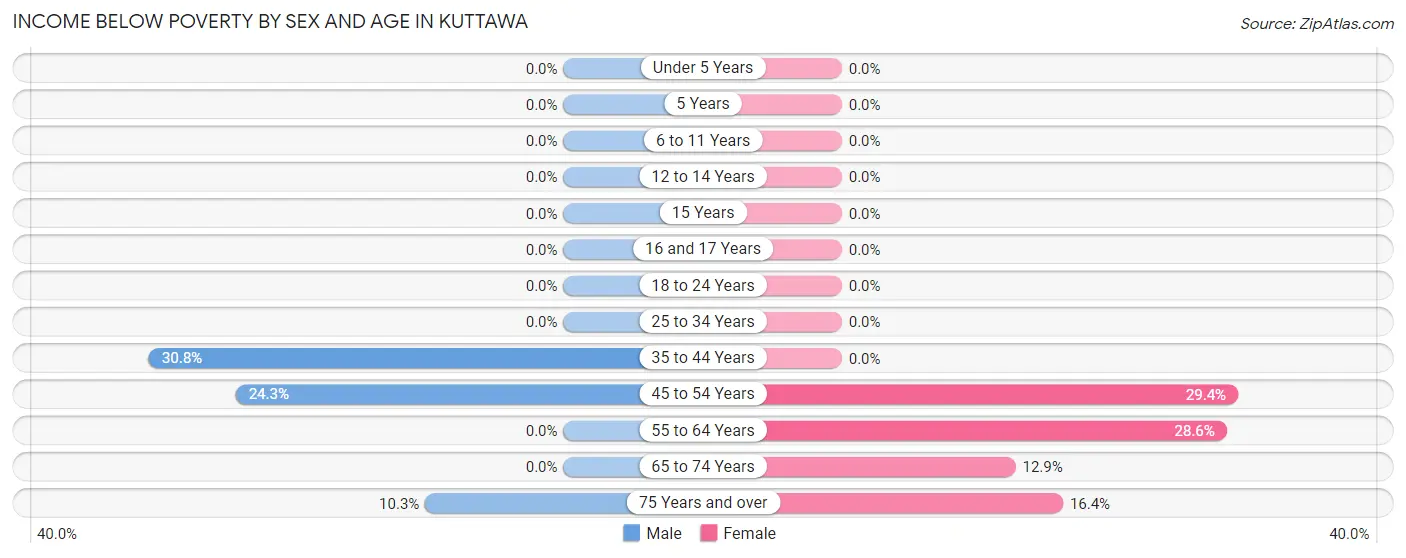
| Age Bracket | Male | Female |
| Under 5 Years | 0 (0.0%) | 0 (0.0%) |
| 5 Years | 0 (0.0%) | 0 (0.0%) |
| 6 to 11 Years | 0 (0.0%) | 0 (0.0%) |
| 12 to 14 Years | 0 (0.0%) | 0 (0.0%) |
| 15 Years | 0 (0.0%) | 0 (0.0%) |
| 16 and 17 Years | 0 (0.0%) | 0 (0.0%) |
| 18 to 24 Years | 0 (0.0%) | 0 (0.0%) |
| 25 to 34 Years | 0 (0.0%) | 0 (0.0%) |
| 35 to 44 Years | 4 (30.8%) | 0 (0.0%) |
| 45 to 54 Years | 9 (24.3%) | 5 (29.4%) |
| 55 to 64 Years | 0 (0.0%) | 18 (28.6%) |
| 65 to 74 Years | 0 (0.0%) | 8 (12.9%) |
| 75 Years and over | 4 (10.3%) | 11 (16.4%) |
| Total | 17 (7.0%) | 42 (15.6%) |
Income Above Poverty by Sex and Age in Kuttawa
According to the poverty statistics in Kuttawa, males aged under 5 years and females aged 5 years are the age groups that are most secure financially, with 100.0% of males and 100.0% of females in these age groups living above the poverty line.
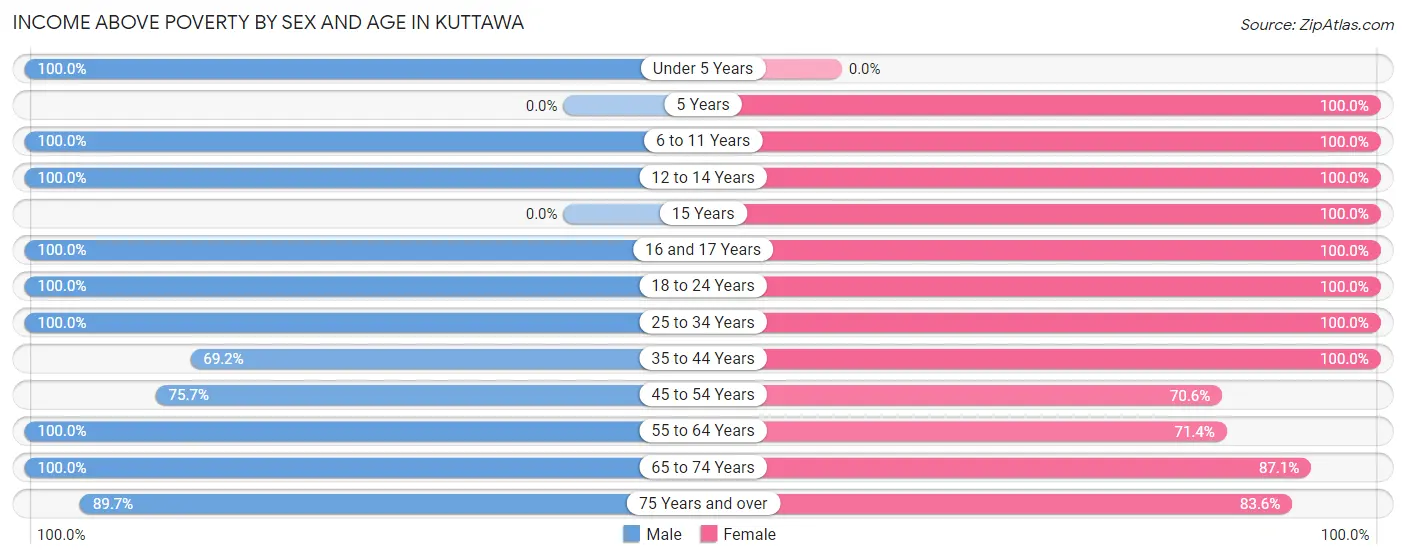
| Age Bracket | Male | Female |
| Under 5 Years | 16 (100.0%) | 0 (0.0%) |
| 5 Years | 0 (0.0%) | 12 (100.0%) |
| 6 to 11 Years | 29 (100.0%) | 1 (100.0%) |
| 12 to 14 Years | 12 (100.0%) | 15 (100.0%) |
| 15 Years | 0 (0.0%) | 3 (100.0%) |
| 16 and 17 Years | 3 (100.0%) | 7 (100.0%) |
| 18 to 24 Years | 4 (100.0%) | 5 (100.0%) |
| 25 to 34 Years | 10 (100.0%) | 3 (100.0%) |
| 35 to 44 Years | 9 (69.2%) | 14 (100.0%) |
| 45 to 54 Years | 28 (75.7%) | 12 (70.6%) |
| 55 to 64 Years | 31 (100.0%) | 45 (71.4%) |
| 65 to 74 Years | 49 (100.0%) | 54 (87.1%) |
| 75 Years and over | 35 (89.7%) | 56 (83.6%) |
| Total | 226 (93.0%) | 227 (84.4%) |
Income Below Poverty Among Married-Couple Families in Kuttawa
The poverty statistics for married-couple families in Kuttawa show that 1.8% or 2 of the total 112 families live below the poverty line. Families with no children have the highest poverty rate of 2.4%, comprising of 2 families. On the other hand, families with 1 or 2 children have the lowest poverty rate of 0.0%, which includes 0 families.
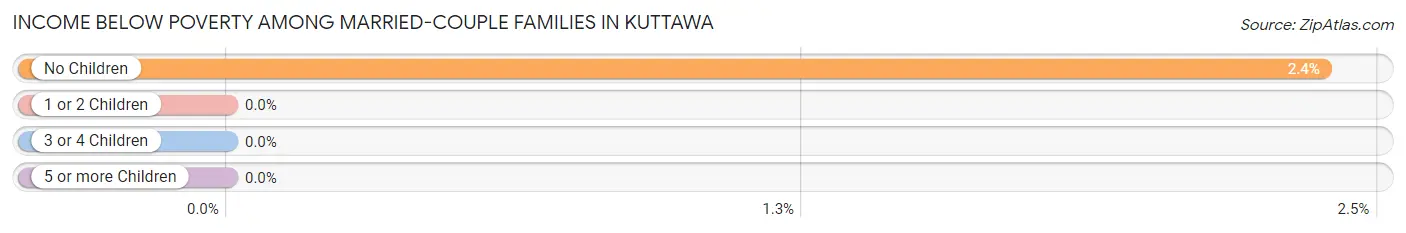
| Children | Above Poverty | Below Poverty |
| No Children | 82 (97.6%) | 2 (2.4%) |
| 1 or 2 Children | 20 (100.0%) | 0 (0.0%) |
| 3 or 4 Children | 0 (0.0%) | 0 (0.0%) |
| 5 or more Children | 8 (100.0%) | 0 (0.0%) |
| Total | 110 (98.2%) | 2 (1.8%) |
Income Below Poverty Among Single-Parent Households in Kuttawa
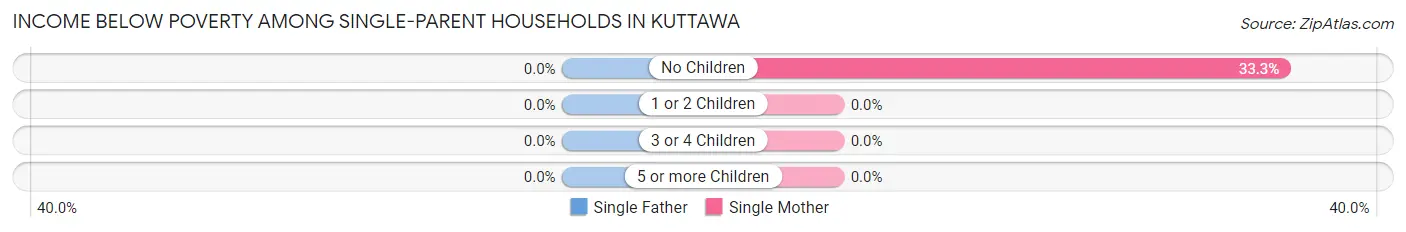
| Children | Single Father | Single Mother |
| No Children | 0 (0.0%) | 1 (33.3%) |
| 1 or 2 Children | 0 (0.0%) | 0 (0.0%) |
| 3 or 4 Children | 0 (0.0%) | 0 (0.0%) |
| 5 or more Children | 0 (0.0%) | 0 (0.0%) |
| Total | 0 (0.0%) | 1 (33.3%) |
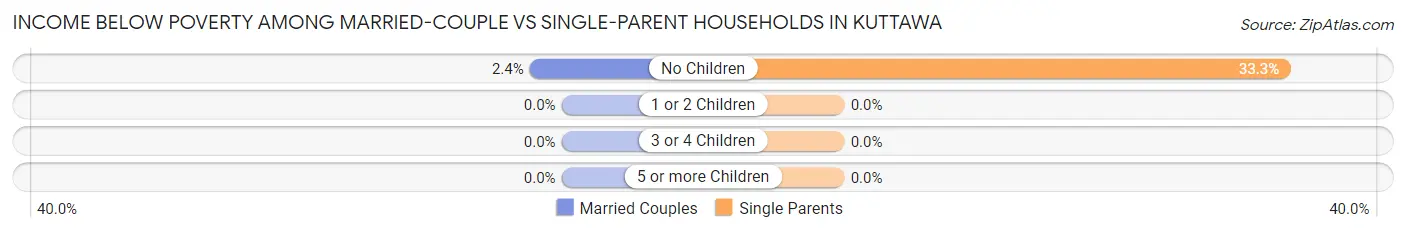
Income Below Poverty Among Married-Couple vs Single-Parent Households in Kuttawa
The poverty data for Kuttawa shows that 2 of the married-couple family households (1.8%) and 1 of the single-parent households (33.3%) are living below the poverty level. Within the married-couple family households, those with no children have the highest poverty rate, with 2 households (2.4%) falling below the poverty line. Among the single-parent households, those with no children have the highest poverty rate, with 1 household (33.3%) living below poverty.
| Children | Married-Couple Families | Single-Parent Households |
| No Children | 2 (2.4%) | 1 (33.3%) |
| 1 or 2 Children | 0 (0.0%) | 0 (0.0%) |
| 3 or 4 Children | 0 (0.0%) | 0 (0.0%) |
| 5 or more Children | 0 (0.0%) | 0 (0.0%) |
| Total | 2 (1.8%) | 1 (33.3%) |
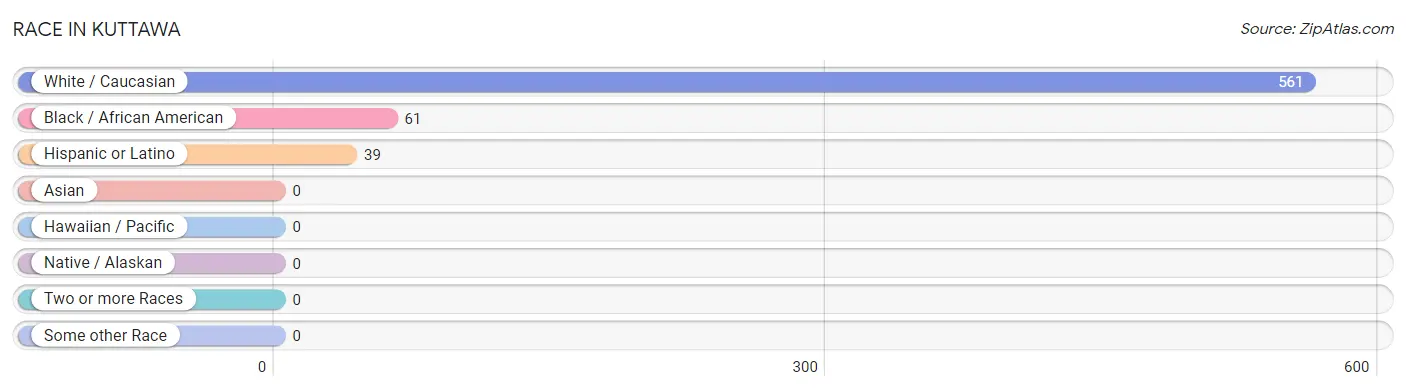
Race in Kuttawa
The most populous races in Kuttawa are White / Caucasian (561 | 90.2%), Black / African American (61 | 9.8%), and Hispanic or Latino (39 | 6.3%).
| Race | # Population | % Population |
| Asian | 0 | 0.0% |
| Black / African American | 61 | 9.8% |
| Hawaiian / Pacific | 0 | 0.0% |
| Hispanic or Latino | 39 | 6.3% |
| Native / Alaskan | 0 | 0.0% |
| White / Caucasian | 561 | 90.2% |
| Two or more Races | 0 | 0.0% |
| Some other Race | 0 | 0.0% |
| Total | 622 | 100.0% |
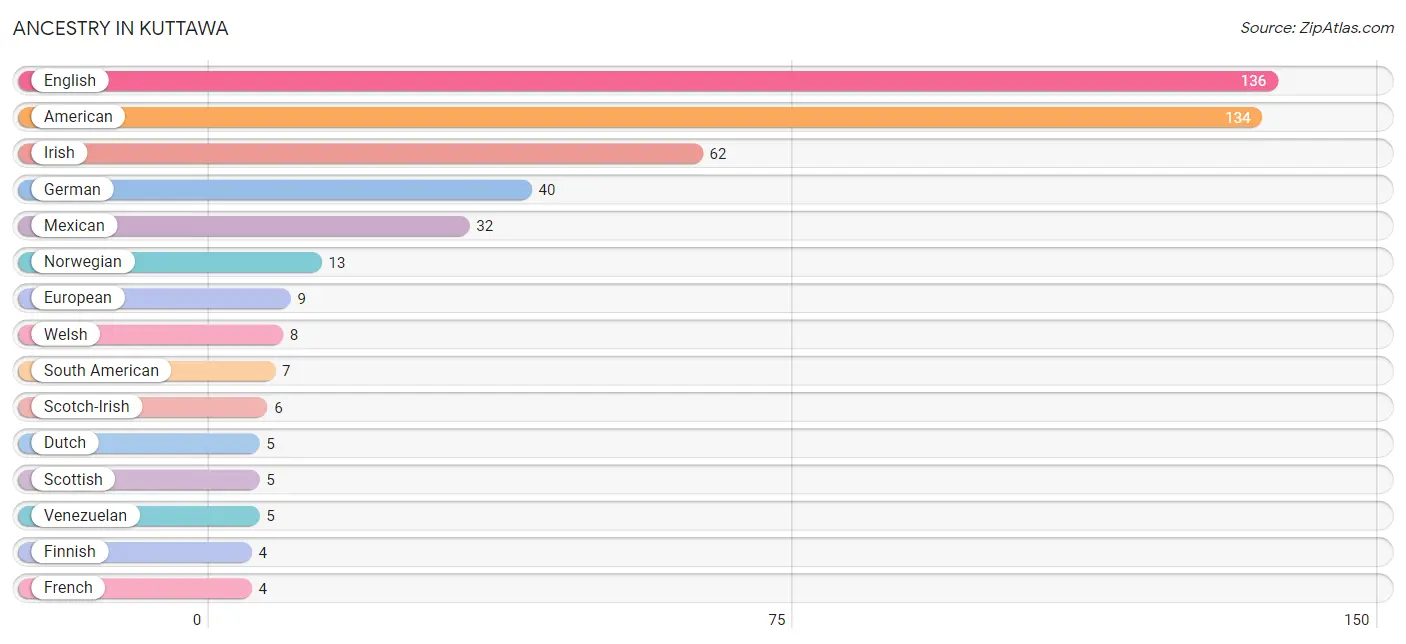
Ancestry in Kuttawa
The most populous ancestries reported in Kuttawa are English (136 | 21.9%), American (134 | 21.5%), Irish (62 | 10.0%), German (40 | 6.4%), and Mexican (32 | 5.1%), together accounting for 64.9% of all Kuttawa residents.
| Ancestry | # Population | % Population |
| American | 134 | 21.5% |
| Dutch | 5 | 0.8% |
| English | 136 | 21.9% |
| European | 9 | 1.5% |
| Finnish | 4 | 0.6% |
| French | 4 | 0.6% |
| German | 40 | 6.4% |
| Irish | 62 | 10.0% |
| Italian | 2 | 0.3% |
| Mexican | 32 | 5.1% |
| Norwegian | 13 | 2.1% |
| Peruvian | 2 | 0.3% |
| Polish | 3 | 0.5% |
| Scandinavian | 3 | 0.5% |
| Scotch-Irish | 6 | 1.0% |
| Scottish | 5 | 0.8% |
| South American | 7 | 1.1% |
| Ukrainian | 4 | 0.6% |
| Venezuelan | 5 | 0.8% |
| Welsh | 8 | 1.3% | View All 20 Rows |
Immigrants in Kuttawa
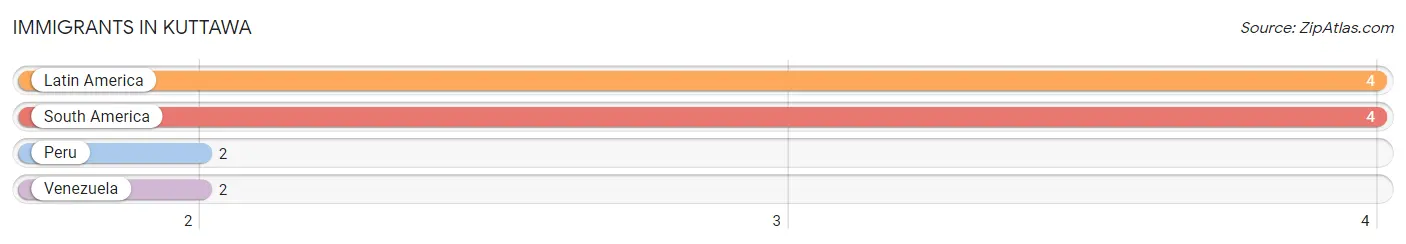
The most numerous immigrant groups reported in Kuttawa came from Latin America (4 | 0.6%), South America (4 | 0.6%), Peru (2 | 0.3%), and Venezuela (2 | 0.3%), together accounting for 1.9% of all Kuttawa residents.
| Immigration Origin | # Population | % Population |
| Latin America | 4 | 0.6% |
| Peru | 2 | 0.3% |
| South America | 4 | 0.6% |
| Venezuela | 2 | 0.3% | View All 4 Rows |
Sex and Age in Kuttawa
Sex and Age in Kuttawa
The most populous age groups in Kuttawa are 70 to 74 Years (30 | 11.3%) for men and 85 Years and over (58 | 16.3%) for women.
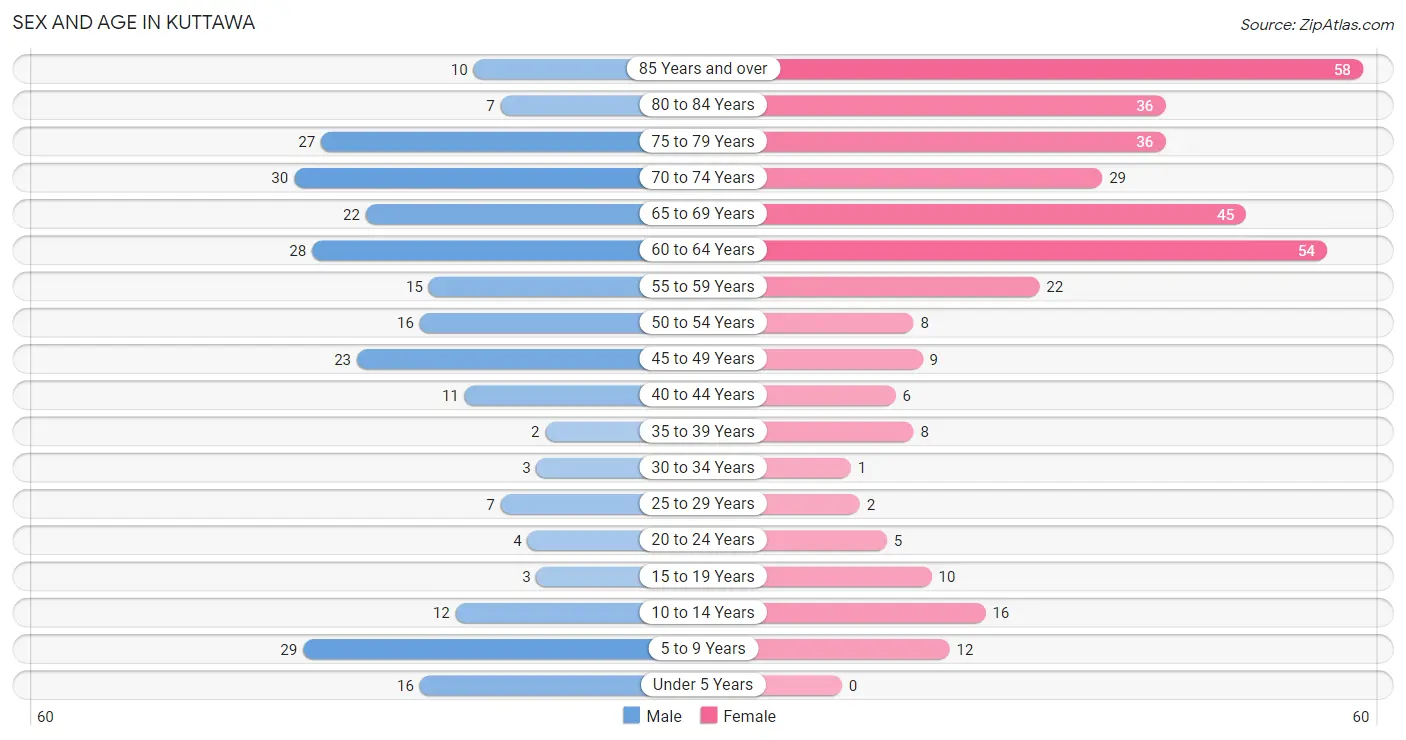
| Age Bracket | Male | Female |
| Under 5 Years | 16 (6.0%) | 0 (0.0%) |
| 5 to 9 Years | 29 (10.9%) | 12 (3.4%) |
| 10 to 14 Years | 12 (4.5%) | 16 (4.5%) |
| 15 to 19 Years | 3 (1.1%) | 10 (2.8%) |
| 20 to 24 Years | 4 (1.5%) | 5 (1.4%) |
| 25 to 29 Years | 7 (2.6%) | 2 (0.6%) |
| 30 to 34 Years | 3 (1.1%) | 1 (0.3%) |
| 35 to 39 Years | 2 (0.7%) | 8 (2.2%) |
| 40 to 44 Years | 11 (4.2%) | 6 (1.7%) |
| 45 to 49 Years | 23 (8.7%) | 9 (2.5%) |
| 50 to 54 Years | 16 (6.0%) | 8 (2.2%) |
| 55 to 59 Years | 15 (5.7%) | 22 (6.2%) |
| 60 to 64 Years | 28 (10.6%) | 54 (15.1%) |
| 65 to 69 Years | 22 (8.3%) | 45 (12.6%) |
| 70 to 74 Years | 30 (11.3%) | 29 (8.1%) |
| 75 to 79 Years | 27 (10.2%) | 36 (10.1%) |
| 80 to 84 Years | 7 (2.6%) | 36 (10.1%) |
| 85 Years and over | 10 (3.8%) | 58 (16.3%) |
| Total | 265 (100.0%) | 357 (100.0%) |
Families and Households in Kuttawa
Median Family Size in Kuttawa
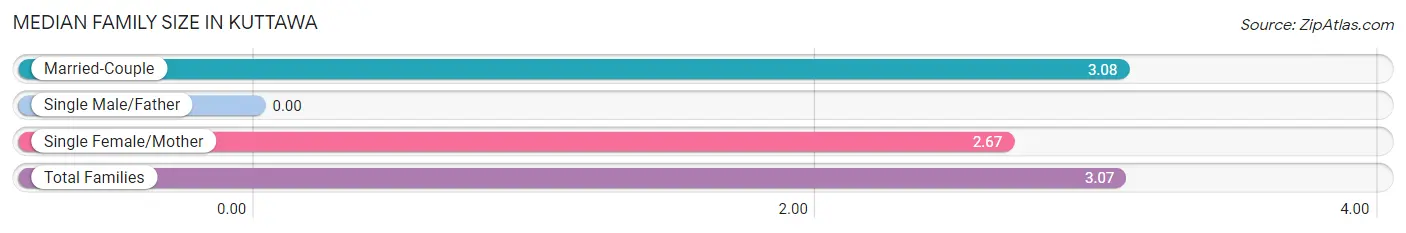
| Family Type | # Families | Family Size |
| Married-Couple | 112 (97.4%) | 3.08 |
| Single Male/Father | 0 (0.0%) | - |
| Single Female/Mother | 3 (2.6%) | 2.67 |
| Total Families | 115 (100.0%) | 3.07 |
Median Household Size in Kuttawa
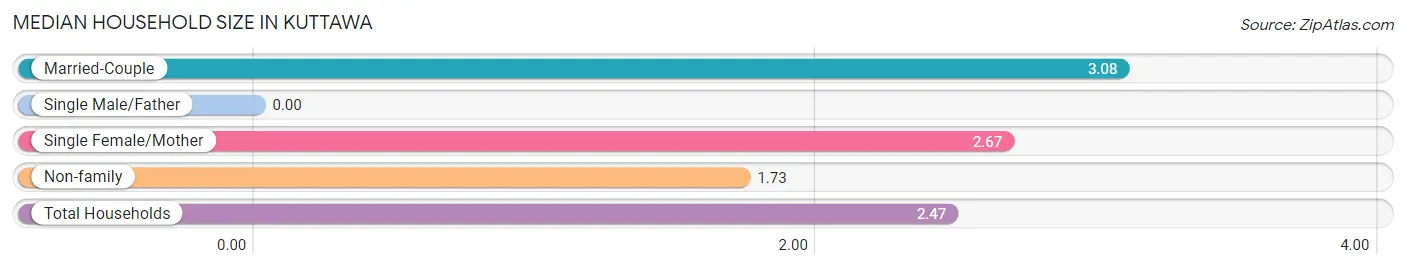
| Household Type | # Households | Household Size |
| Married-Couple | 112 (54.1%) | 3.08 |
| Single Male/Father | 0 (0.0%) | - |
| Single Female/Mother | 3 (1.5%) | 2.67 |
| Non-family | 92 (44.4%) | 1.73 |
| Total Households | 207 (100.0%) | 2.47 |
Household Size by Marriage Status in Kuttawa
Out of a total of 207 households in Kuttawa, 115 (55.6%) are family households, while 92 (44.4%) are nonfamily households. The most numerous type of family households are 2-person households, comprising 79, and the most common type of nonfamily households are 1-person households, comprising 86.
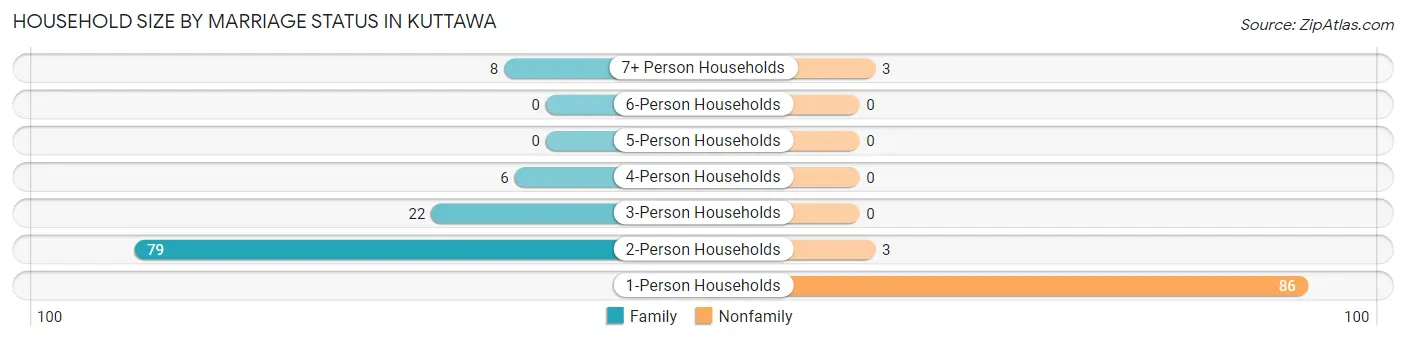
| Household Size | Family Households | Nonfamily Households |
| 1-Person Households | - | 86 (41.5%) |
| 2-Person Households | 79 (38.2%) | 3 (1.5%) |
| 3-Person Households | 22 (10.6%) | 0 (0.0%) |
| 4-Person Households | 6 (2.9%) | 0 (0.0%) |
| 5-Person Households | 0 (0.0%) | 0 (0.0%) |
| 6-Person Households | 0 (0.0%) | 0 (0.0%) |
| 7+ Person Households | 8 (3.9%) | 3 (1.5%) |
| Total | 115 (55.6%) | 92 (44.4%) |
Female Fertility in Kuttawa
Fertility by Age in Kuttawa
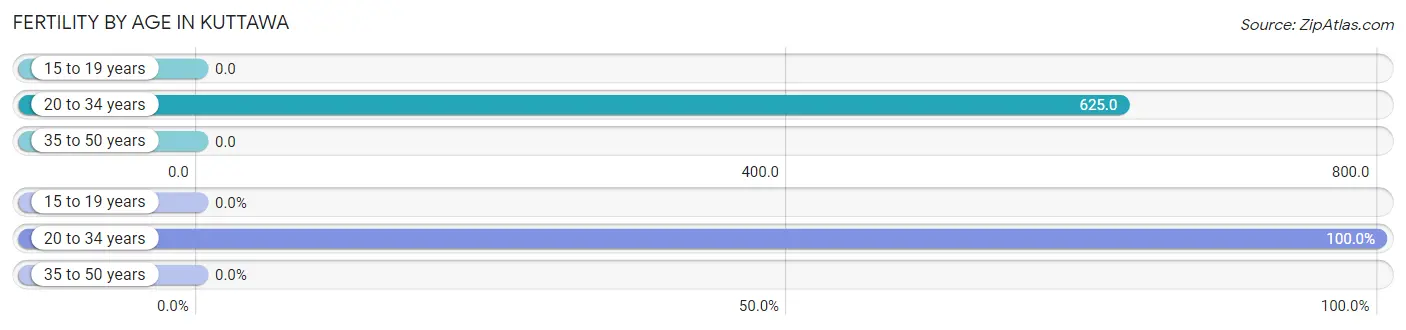
Average fertility rate in Kuttawa is 116.0 births per 1,000 women. Women in the age bracket of 20 to 34 years have the highest fertility rate with 625.0 births per 1,000 women. Women in the age bracket of 20 to 34 years acount for 100.0% of all women with births.
| Age Bracket | Women with Births | Births / 1,000 Women |
| 15 to 19 years | 0 (0.0%) | 0.0 |
| 20 to 34 years | 5 (100.0%) | 625.0 |
| 35 to 50 years | 0 (0.0%) | 0.0 |
| Total | 5 (100.0%) | 116.0 |
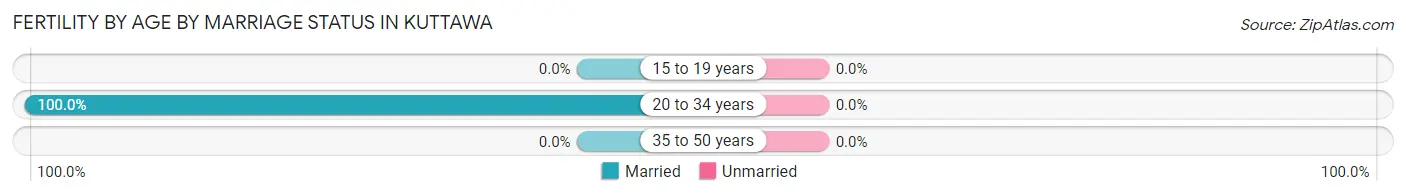
Fertility by Age by Marriage Status in Kuttawa
| Age Bracket | Married | Unmarried |
| 15 to 19 years | 0 (0.0%) | 0 (0.0%) |
| 20 to 34 years | 5 (100.0%) | 0 (0.0%) |
| 35 to 50 years | 0 (0.0%) | 0 (0.0%) |
| Total | 5 (100.0%) | 0 (0.0%) |
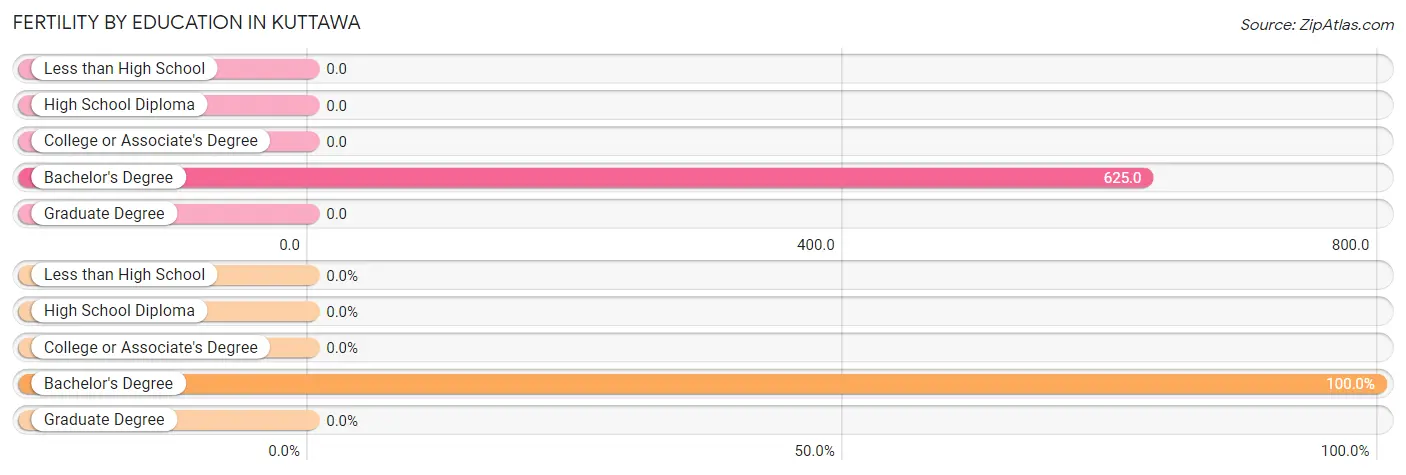
Fertility by Education in Kuttawa
| Educational Attainment | Women with Births | Births / 1,000 Women |
| Less than High School | 0 (0.0%) | 0.0 |
| High School Diploma | 0 (0.0%) | 0.0 |
| College or Associate's Degree | 0 (0.0%) | 0.0 |
| Bachelor's Degree | 5 (100.0%) | 625.0 |
| Graduate Degree | 0 (0.0%) | 0.0 |
| Total | 5 (100.0%) | 116.0 |
Fertility by Education by Marriage Status in Kuttawa
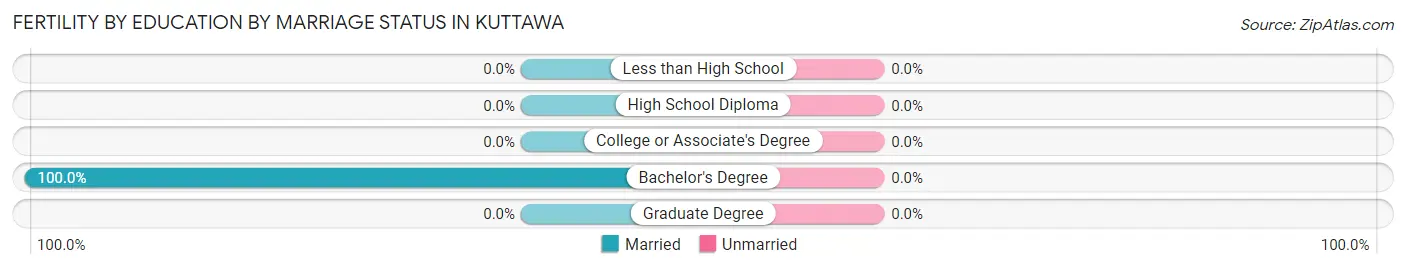
| Educational Attainment | Married | Unmarried |
| Less than High School | 0 (0.0%) | 0 (0.0%) |
| High School Diploma | 0 (0.0%) | 0 (0.0%) |
| College or Associate's Degree | 0 (0.0%) | 0 (0.0%) |
| Bachelor's Degree | 5 (100.0%) | 0 (0.0%) |
| Graduate Degree | 0 (0.0%) | 0 (0.0%) |
| Total | 5 (100.0%) | 0 (0.0%) |
Employment Characteristics in Kuttawa
Employment by Class of Employer in Kuttawa
Among the 130 employed individuals in Kuttawa, private company employees (96 | 73.9%), local government employees (11 | 8.5%), and state government employees (11 | 8.5%) make up the most common classes of employment.
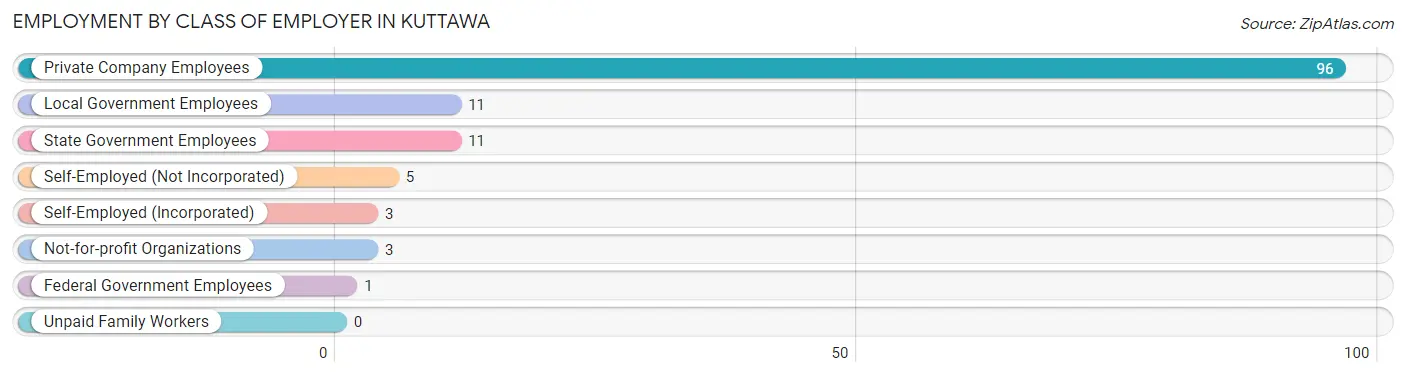
| Employer Class | # Employees | % Employees |
| Private Company Employees | 96 | 73.9% |
| Self-Employed (Incorporated) | 3 | 2.3% |
| Self-Employed (Not Incorporated) | 5 | 3.8% |
| Not-for-profit Organizations | 3 | 2.3% |
| Local Government Employees | 11 | 8.5% |
| State Government Employees | 11 | 8.5% |
| Federal Government Employees | 1 | 0.8% |
| Unpaid Family Workers | 0 | 0.0% |
| Total | 130 | 100.0% |
Employment Status by Age in Kuttawa
According to the labor force statistics for Kuttawa, out of the total population over 16 years of age (534), 26.6% or 142 individuals are in the labor force, with 4.9% or 7 of them unemployed. The age group with the highest labor force participation rate is 35 to 44 years, with 85.2% or 23 individuals in the labor force. Within the labor force, the 20 to 24 years age range has the highest percentage of unemployed individuals, with 71.4% or 5 of them being unemployed.
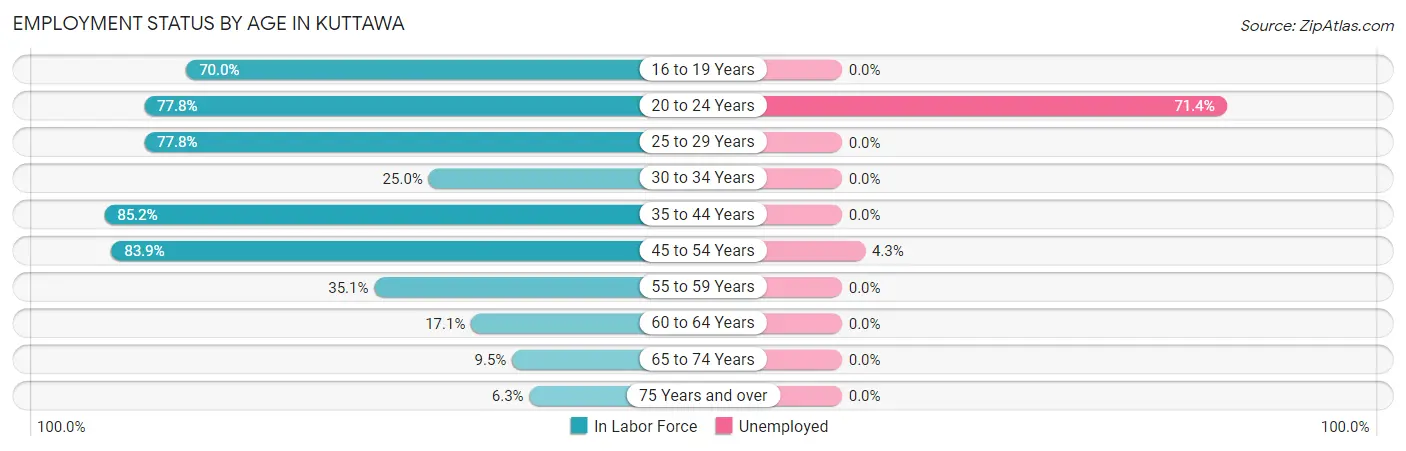
| Age Bracket | In Labor Force | Unemployed |
| 16 to 19 Years | 7 (70.0%) | 0 (0.0%) |
| 20 to 24 Years | 7 (77.8%) | 5 (71.4%) |
| 25 to 29 Years | 7 (77.8%) | 0 (0.0%) |
| 30 to 34 Years | 1 (25.0%) | 0 (0.0%) |
| 35 to 44 Years | 23 (85.2%) | 0 (0.0%) |
| 45 to 54 Years | 47 (83.9%) | 2 (4.3%) |
| 55 to 59 Years | 13 (35.1%) | 0 (0.0%) |
| 60 to 64 Years | 14 (17.1%) | 0 (0.0%) |
| 65 to 74 Years | 12 (9.5%) | 0 (0.0%) |
| 75 Years and over | 11 (6.3%) | 0 (0.0%) |
| Total | 142 (26.6%) | 7 (4.9%) |
Employment Status by Educational Attainment in Kuttawa
According to labor force statistics for Kuttawa, 48.8% of individuals (105) out of the total population between 25 and 64 years of age (215) are in the labor force, with 1.9% or 2 of them being unemployed. The group with the highest labor force participation rate are those with the educational attainment of bachelor's degree or higher, with 70.4% or 38 individuals in the labor force. Within the labor force, individuals with bachelor's degree or higher education have the highest percentage of unemployment, with 5.3% or 2 of them being unemployed.
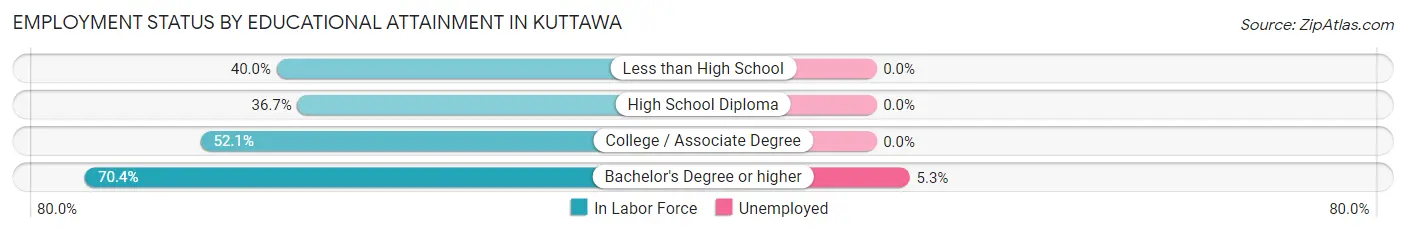
| Educational Attainment | In Labor Force | Unemployed |
| Less than High School | 6 (40.0%) | 0 (0.0%) |
| High School Diploma | 36 (36.7%) | 0 (0.0%) |
| College / Associate Degree | 25 (52.1%) | 0 (0.0%) |
| Bachelor's Degree or higher | 38 (70.4%) | 3 (5.3%) |
| Total | 105 (48.8%) | 4 (1.9%) |
Employment Occupations by Sex in Kuttawa
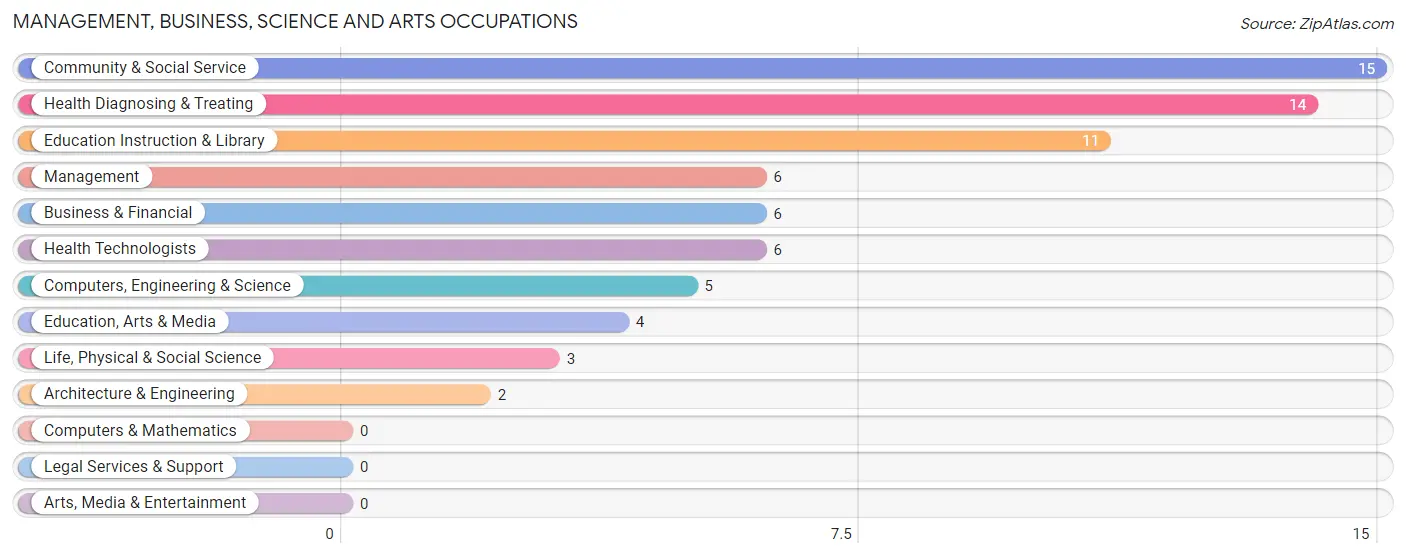
Management, Business, Science and Arts Occupations
The most common Management, Business, Science and Arts occupations in Kuttawa are Community & Social Service (15 | 11.1%), Health Diagnosing & Treating (14 | 10.4%), Education Instruction & Library (11 | 8.2%), Management (6 | 4.4%), and Business & Financial (6 | 4.4%).
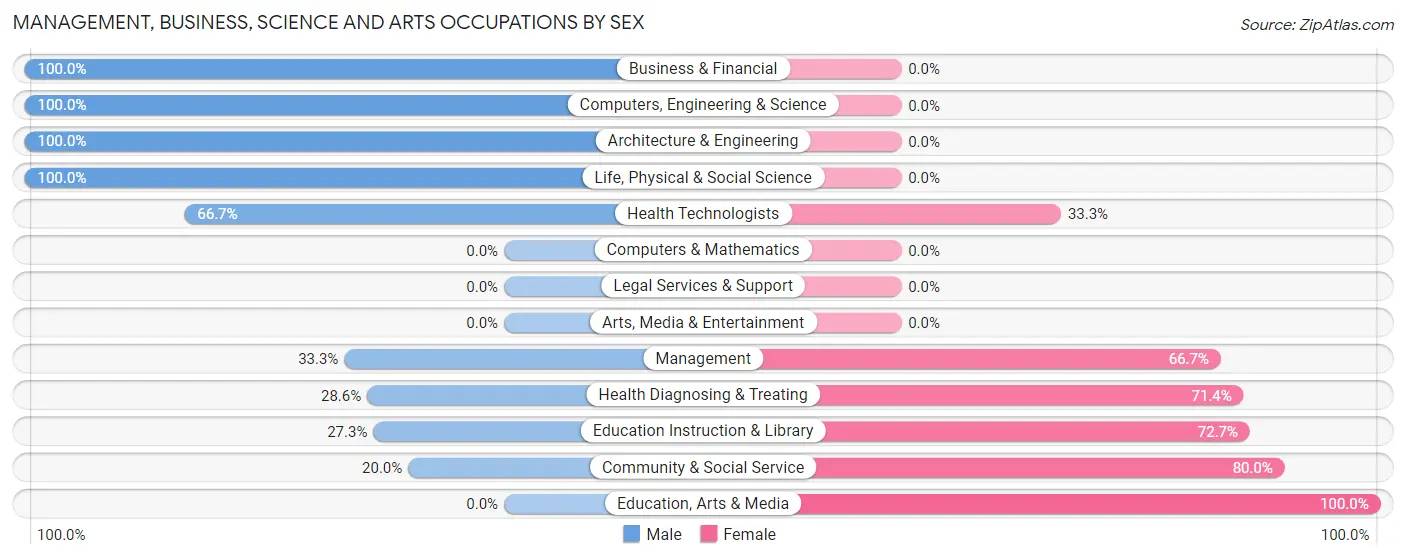
Management, Business, Science and Arts Occupations by Sex
Within the Management, Business, Science and Arts occupations in Kuttawa, the most male-oriented occupations are Business & Financial (100.0%), Computers, Engineering & Science (100.0%), and Architecture & Engineering (100.0%), while the most female-oriented occupations are Education, Arts & Media (100.0%), Community & Social Service (80.0%), and Education Instruction & Library (72.7%).
| Occupation | Male | Female |
| Management | 2 (33.3%) | 4 (66.7%) |
| Business & Financial | 6 (100.0%) | 0 (0.0%) |
| Computers, Engineering & Science | 5 (100.0%) | 0 (0.0%) |
| Computers & Mathematics | 0 (0.0%) | 0 (0.0%) |
| Architecture & Engineering | 2 (100.0%) | 0 (0.0%) |
| Life, Physical & Social Science | 3 (100.0%) | 0 (0.0%) |
| Community & Social Service | 3 (20.0%) | 12 (80.0%) |
| Education, Arts & Media | 0 (0.0%) | 4 (100.0%) |
| Legal Services & Support | 0 (0.0%) | 0 (0.0%) |
| Education Instruction & Library | 3 (27.3%) | 8 (72.7%) |
| Arts, Media & Entertainment | 0 (0.0%) | 0 (0.0%) |
| Health Diagnosing & Treating | 4 (28.6%) | 10 (71.4%) |
| Health Technologists | 4 (66.7%) | 2 (33.3%) |
| Total (Category) | 20 (43.5%) | 26 (56.5%) |
| Total (Overall) | 68 (50.4%) | 67 (49.6%) |
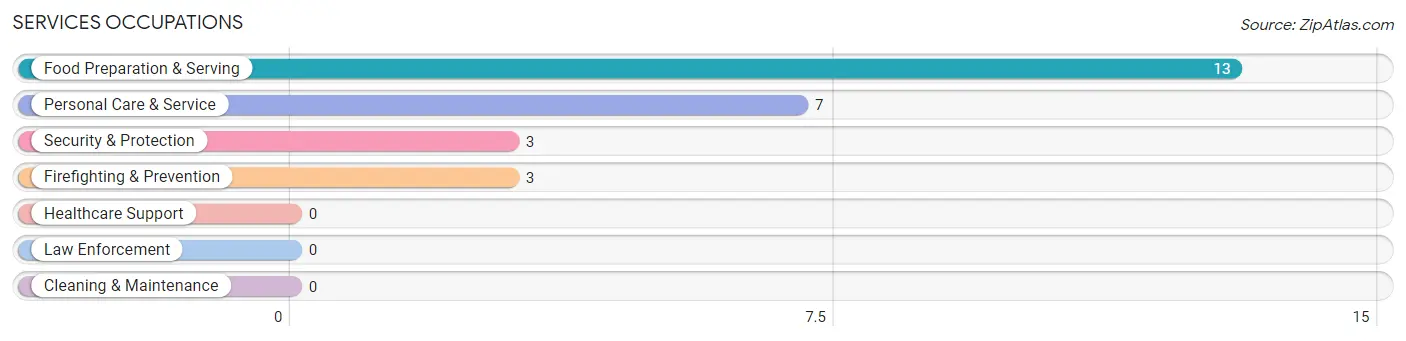
Services Occupations
The most common Services occupations in Kuttawa are Food Preparation & Serving (13 | 9.6%), Personal Care & Service (7 | 5.2%), Security & Protection (3 | 2.2%), and Firefighting & Prevention (3 | 2.2%).
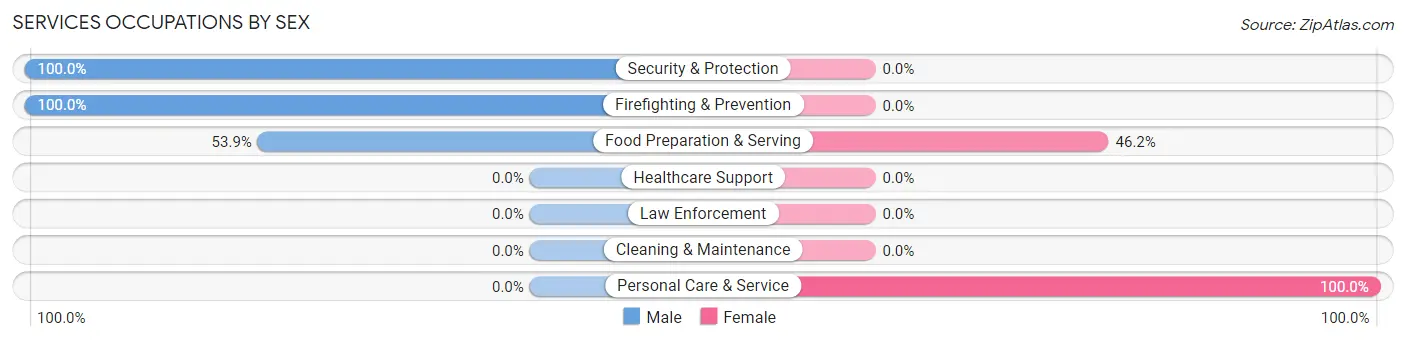
Services Occupations by Sex
Within the Services occupations in Kuttawa, the most male-oriented occupations are Security & Protection (100.0%), Firefighting & Prevention (100.0%), and Food Preparation & Serving (53.8%), while the most female-oriented occupations are Personal Care & Service (100.0%), and Food Preparation & Serving (46.2%).
| Occupation | Male | Female |
| Healthcare Support | 0 (0.0%) | 0 (0.0%) |
| Security & Protection | 3 (100.0%) | 0 (0.0%) |
| Firefighting & Prevention | 3 (100.0%) | 0 (0.0%) |
| Law Enforcement | 0 (0.0%) | 0 (0.0%) |
| Food Preparation & Serving | 7 (53.8%) | 6 (46.2%) |
| Cleaning & Maintenance | 0 (0.0%) | 0 (0.0%) |
| Personal Care & Service | 0 (0.0%) | 7 (100.0%) |
| Total (Category) | 10 (43.5%) | 13 (56.5%) |
| Total (Overall) | 68 (50.4%) | 67 (49.6%) |
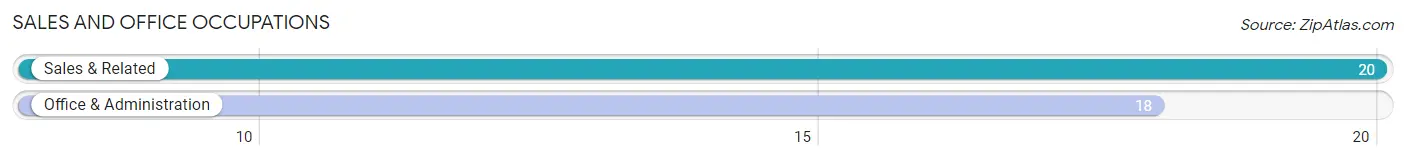
Sales and Office Occupations
The most common Sales and Office occupations in Kuttawa are Sales & Related (20 | 14.8%), and Office & Administration (18 | 13.3%).
Sales and Office Occupations by Sex
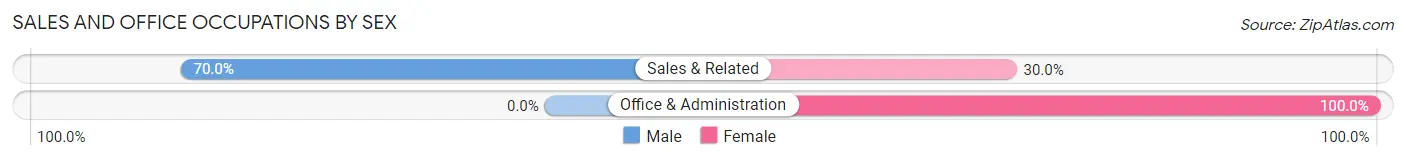
| Occupation | Male | Female |
| Sales & Related | 14 (70.0%) | 6 (30.0%) |
| Office & Administration | 0 (0.0%) | 18 (100.0%) |
| Total (Category) | 14 (36.8%) | 24 (63.2%) |
| Total (Overall) | 68 (50.4%) | 67 (49.6%) |
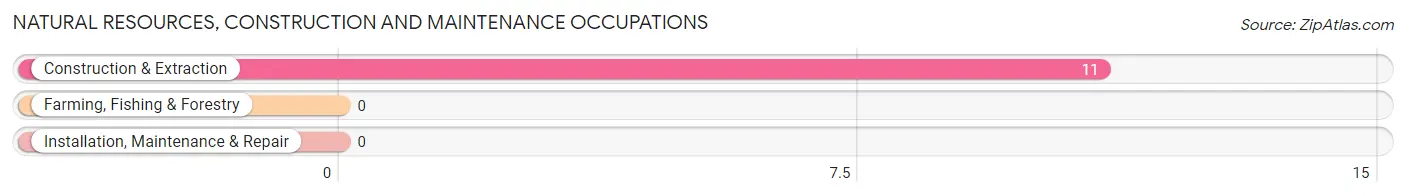
Natural Resources, Construction and Maintenance Occupations
The most common Natural Resources, Construction and Maintenance occupations in Kuttawa are , and Construction & Extraction (11 | 8.2%).
Natural Resources, Construction and Maintenance Occupations by Sex
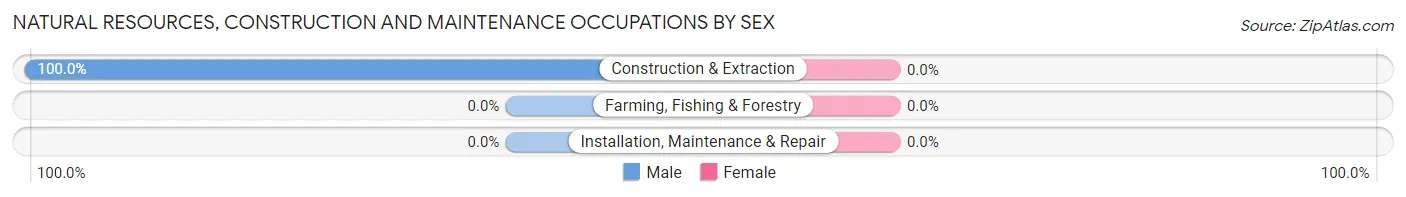
| Occupation | Male | Female |
| Farming, Fishing & Forestry | 0 (0.0%) | 0 (0.0%) |
| Construction & Extraction | 11 (100.0%) | 0 (0.0%) |
| Installation, Maintenance & Repair | 0 (0.0%) | 0 (0.0%) |
| Total (Category) | 11 (100.0%) | 0 (0.0%) |
| Total (Overall) | 68 (50.4%) | 67 (49.6%) |
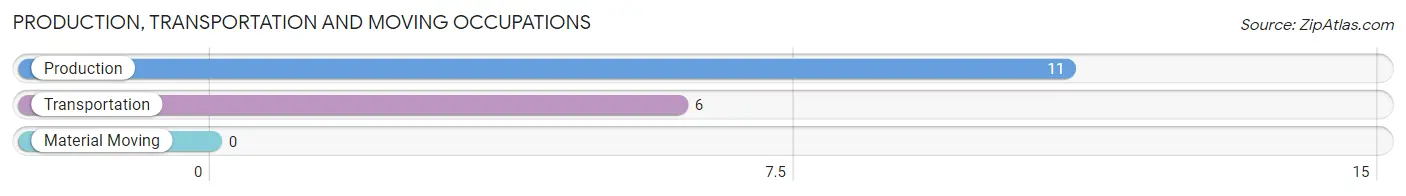
Production, Transportation and Moving Occupations
The most common Production, Transportation and Moving occupations in Kuttawa are Production (11 | 8.2%), and Transportation (6 | 4.4%).
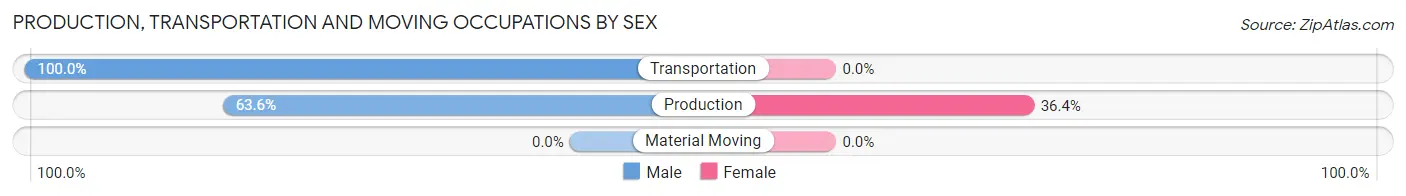
Production, Transportation and Moving Occupations by Sex
| Occupation | Male | Female |
| Production | 7 (63.6%) | 4 (36.4%) |
| Transportation | 6 (100.0%) | 0 (0.0%) |
| Material Moving | 0 (0.0%) | 0 (0.0%) |
| Total (Category) | 13 (76.5%) | 4 (23.5%) |
| Total (Overall) | 68 (50.4%) | 67 (49.6%) |
Employment Industries by Sex in Kuttawa
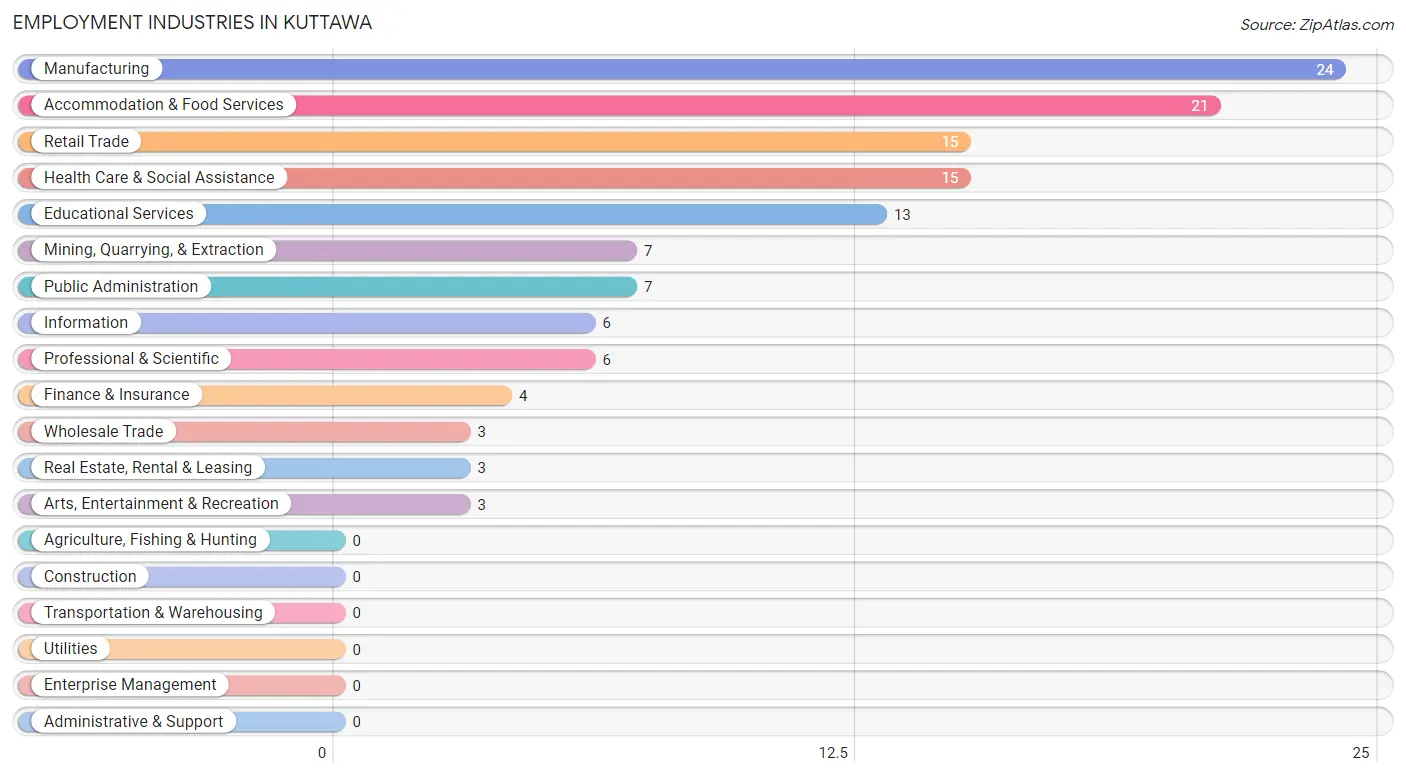
Employment Industries in Kuttawa
The major employment industries in Kuttawa include Manufacturing (24 | 17.8%), Accommodation & Food Services (21 | 15.6%), Retail Trade (15 | 11.1%), Health Care & Social Assistance (15 | 11.1%), and Educational Services (13 | 9.6%).
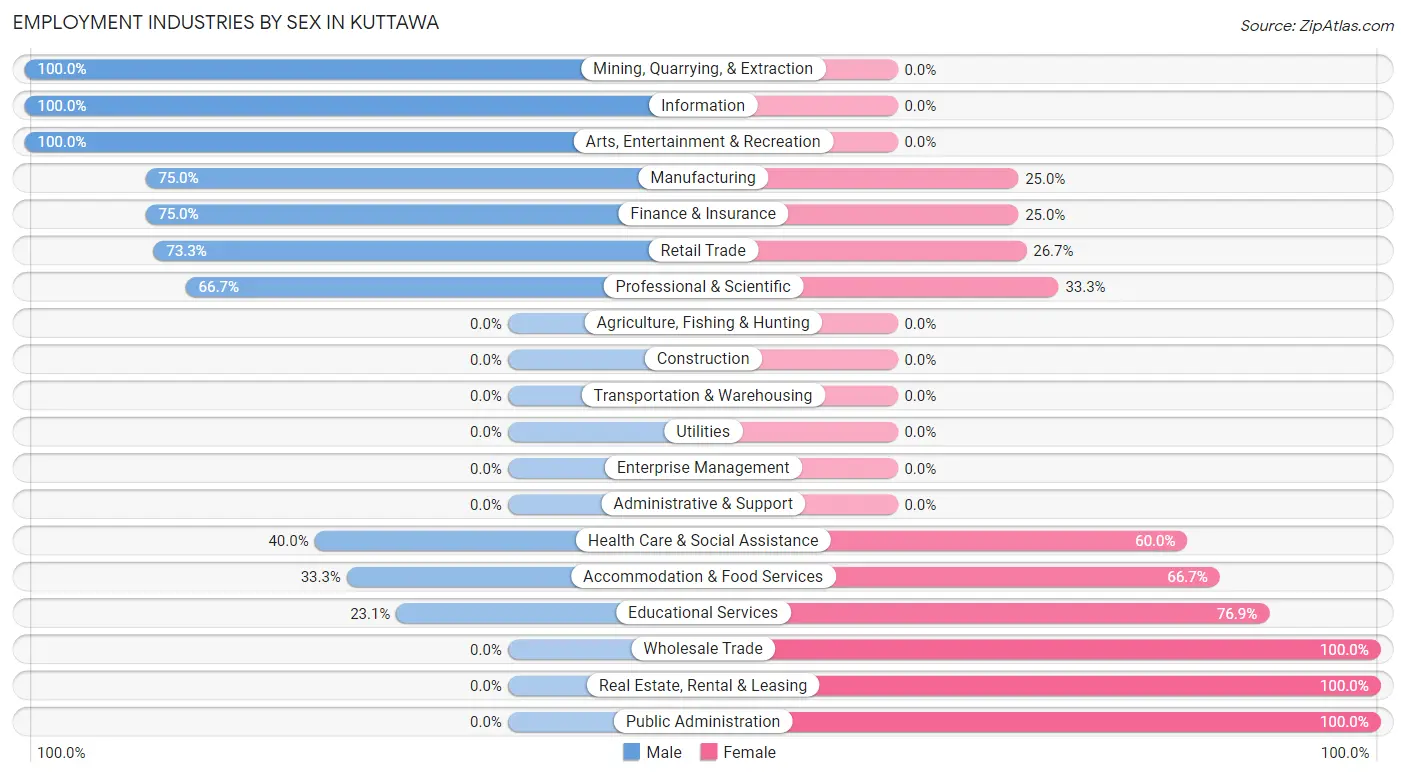
Employment Industries by Sex in Kuttawa
The Kuttawa industries that see more men than women are Mining, Quarrying, & Extraction (100.0%), Information (100.0%), and Arts, Entertainment & Recreation (100.0%), whereas the industries that tend to have a higher number of women are Wholesale Trade (100.0%), Real Estate, Rental & Leasing (100.0%), and Public Administration (100.0%).
| Industry | Male | Female |
| Agriculture, Fishing & Hunting | 0 (0.0%) | 0 (0.0%) |
| Mining, Quarrying, & Extraction | 7 (100.0%) | 0 (0.0%) |
| Construction | 0 (0.0%) | 0 (0.0%) |
| Manufacturing | 18 (75.0%) | 6 (25.0%) |
| Wholesale Trade | 0 (0.0%) | 3 (100.0%) |
| Retail Trade | 11 (73.3%) | 4 (26.7%) |
| Transportation & Warehousing | 0 (0.0%) | 0 (0.0%) |
| Utilities | 0 (0.0%) | 0 (0.0%) |
| Information | 6 (100.0%) | 0 (0.0%) |
| Finance & Insurance | 3 (75.0%) | 1 (25.0%) |
| Real Estate, Rental & Leasing | 0 (0.0%) | 3 (100.0%) |
| Professional & Scientific | 4 (66.7%) | 2 (33.3%) |
| Enterprise Management | 0 (0.0%) | 0 (0.0%) |
| Administrative & Support | 0 (0.0%) | 0 (0.0%) |
| Educational Services | 3 (23.1%) | 10 (76.9%) |
| Health Care & Social Assistance | 6 (40.0%) | 9 (60.0%) |
| Arts, Entertainment & Recreation | 3 (100.0%) | 0 (0.0%) |
| Accommodation & Food Services | 7 (33.3%) | 14 (66.7%) |
| Public Administration | 0 (0.0%) | 7 (100.0%) |
| Total | 68 (50.4%) | 67 (49.6%) |
Education in Kuttawa
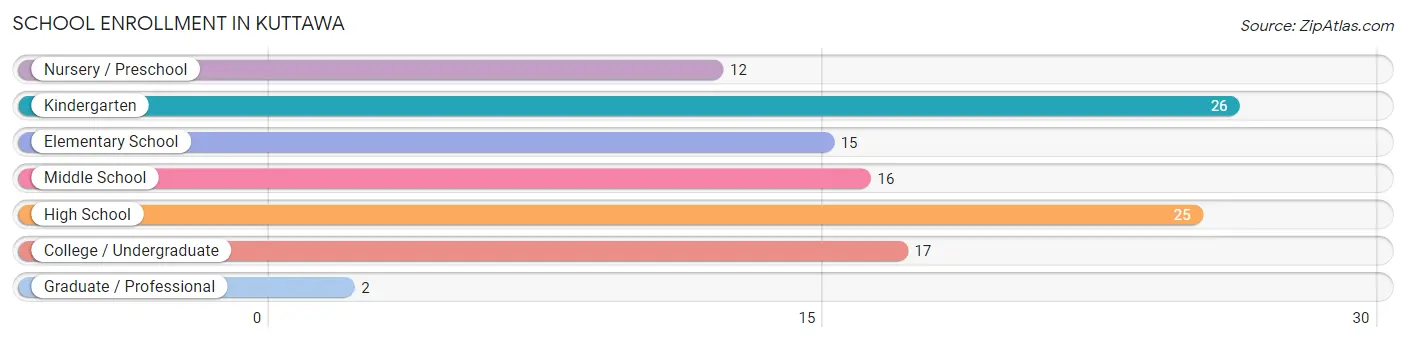
School Enrollment in Kuttawa
The most common levels of schooling among the 113 students in Kuttawa are kindergarten (26 | 23.0%), high school (25 | 22.1%), and college / undergraduate (17 | 15.0%).
| School Level | # Students | % Students |
| Nursery / Preschool | 12 | 10.6% |
| Kindergarten | 26 | 23.0% |
| Elementary School | 15 | 13.3% |
| Middle School | 16 | 14.2% |
| High School | 25 | 22.1% |
| College / Undergraduate | 17 | 15.0% |
| Graduate / Professional | 2 | 1.8% |
| Total | 113 | 100.0% |
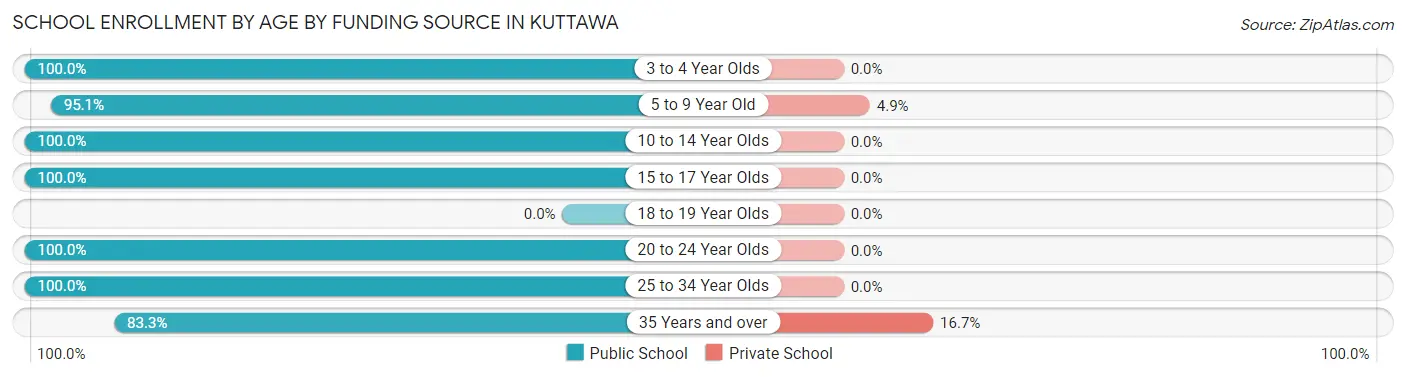
School Enrollment by Age by Funding Source in Kuttawa
Out of a total of 113 students who are enrolled in schools in Kuttawa, 3 (2.7%) attend a private institution, while the remaining 110 (97.3%) are enrolled in public schools. The age group of 35 years and over has the highest likelihood of being enrolled in private schools, with 1 (16.7% in the age bracket) enrolled. Conversely, the age group of 3 to 4 year olds has the lowest likelihood of being enrolled in a private school, with 12 (100.0% in the age bracket) attending a public institution.
| Age Bracket | Public School | Private School |
| 3 to 4 Year Olds | 12 (100.0%) | 0 (0.0%) |
| 5 to 9 Year Old | 39 (95.1%) | 2 (4.9%) |
| 10 to 14 Year Olds | 28 (100.0%) | 0 (0.0%) |
| 15 to 17 Year Olds | 13 (100.0%) | 0 (0.0%) |
| 18 to 19 Year Olds | 0 (0.0%) | 0 (0.0%) |
| 20 to 24 Year Olds | 9 (100.0%) | 0 (0.0%) |
| 25 to 34 Year Olds | 4 (100.0%) | 0 (0.0%) |
| 35 Years and over | 5 (83.3%) | 1 (16.7%) |
| Total | 110 (97.3%) | 3 (2.7%) |
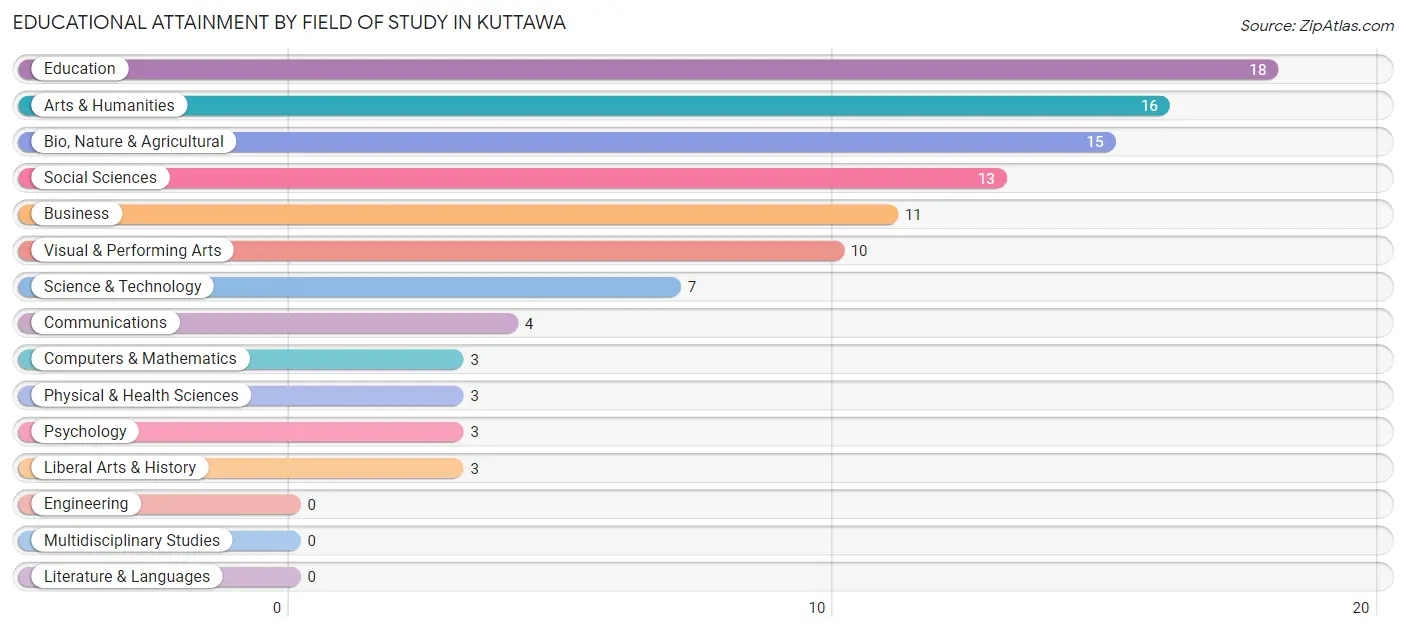
Educational Attainment by Field of Study in Kuttawa
Education (18 | 17.0%), arts & humanities (16 | 15.1%), bio, nature & agricultural (15 | 14.1%), social sciences (13 | 12.3%), and business (11 | 10.4%) are the most common fields of study among 106 individuals in Kuttawa who have obtained a bachelor's degree or higher.
| Field of Study | # Graduates | % Graduates |
| Computers & Mathematics | 3 | 2.8% |
| Bio, Nature & Agricultural | 15 | 14.1% |
| Physical & Health Sciences | 3 | 2.8% |
| Psychology | 3 | 2.8% |
| Social Sciences | 13 | 12.3% |
| Engineering | 0 | 0.0% |
| Multidisciplinary Studies | 0 | 0.0% |
| Science & Technology | 7 | 6.6% |
| Business | 11 | 10.4% |
| Education | 18 | 17.0% |
| Literature & Languages | 0 | 0.0% |
| Liberal Arts & History | 3 | 2.8% |
| Visual & Performing Arts | 10 | 9.4% |
| Communications | 4 | 3.8% |
| Arts & Humanities | 16 | 15.1% |
| Total | 106 | 100.0% |
Transportation & Commute in Kuttawa
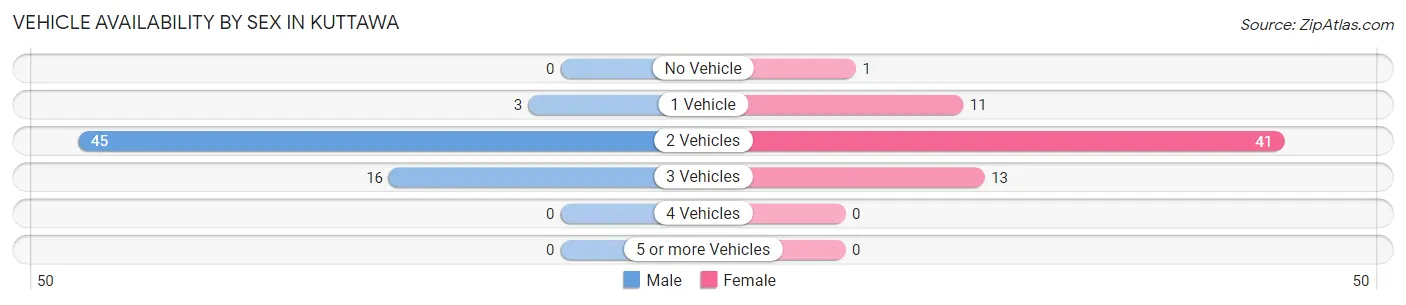
Vehicle Availability by Sex in Kuttawa
The most prevalent vehicle ownership categories in Kuttawa are males with 2 vehicles (45, accounting for 70.3%) and females with 2 vehicles (41, making up 68.2%).
| Vehicles Available | Male | Female |
| No Vehicle | 0 (0.0%) | 1 (1.5%) |
| 1 Vehicle | 3 (4.7%) | 11 (16.7%) |
| 2 Vehicles | 45 (70.3%) | 41 (62.1%) |
| 3 Vehicles | 16 (25.0%) | 13 (19.7%) |
| 4 Vehicles | 0 (0.0%) | 0 (0.0%) |
| 5 or more Vehicles | 0 (0.0%) | 0 (0.0%) |
| Total | 64 (100.0%) | 66 (100.0%) |
Commute Time in Kuttawa
The most frequently occuring commute durations in Kuttawa are 5 to 9 minutes (36 commuters, 27.7%), 10 to 14 minutes (24 commuters, 18.5%), and 30 to 34 minutes (16 commuters, 12.3%).
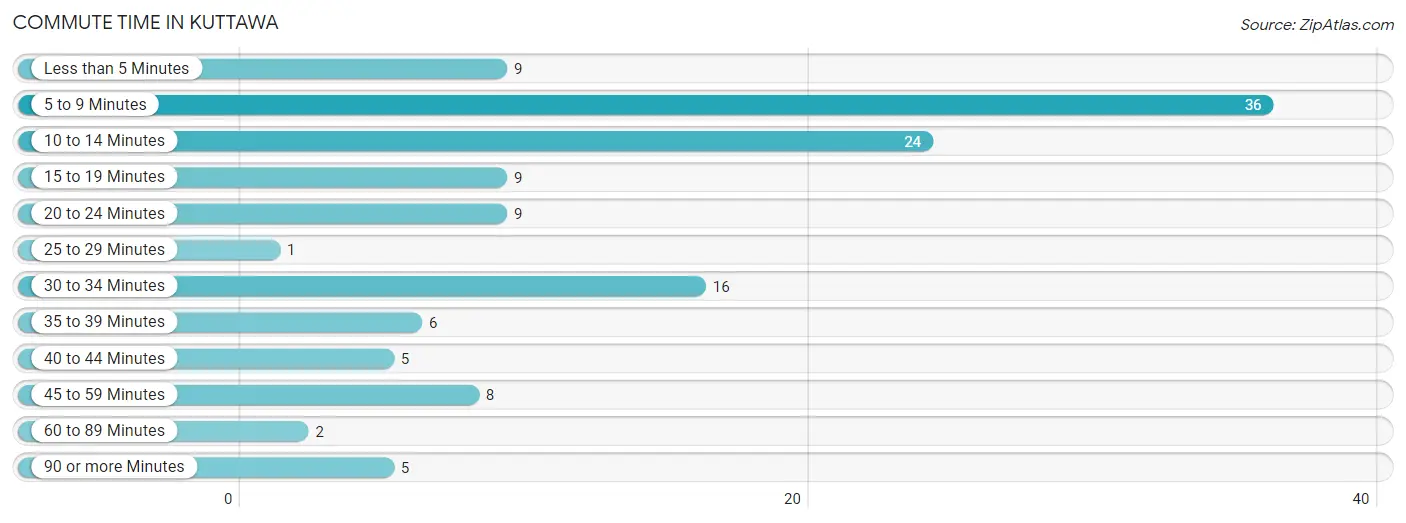
| Commute Time | # Commuters | % Commuters |
| Less than 5 Minutes | 9 | 6.9% |
| 5 to 9 Minutes | 36 | 27.7% |
| 10 to 14 Minutes | 24 | 18.5% |
| 15 to 19 Minutes | 9 | 6.9% |
| 20 to 24 Minutes | 9 | 6.9% |
| 25 to 29 Minutes | 1 | 0.8% |
| 30 to 34 Minutes | 16 | 12.3% |
| 35 to 39 Minutes | 6 | 4.6% |
| 40 to 44 Minutes | 5 | 3.8% |
| 45 to 59 Minutes | 8 | 6.1% |
| 60 to 89 Minutes | 2 | 1.5% |
| 90 or more Minutes | 5 | 3.8% |
Commute Time by Sex in Kuttawa
The most common commute times in Kuttawa are 5 to 9 minutes (20 commuters, 31.2%) for males and 5 to 9 minutes (16 commuters, 24.2%) for females.
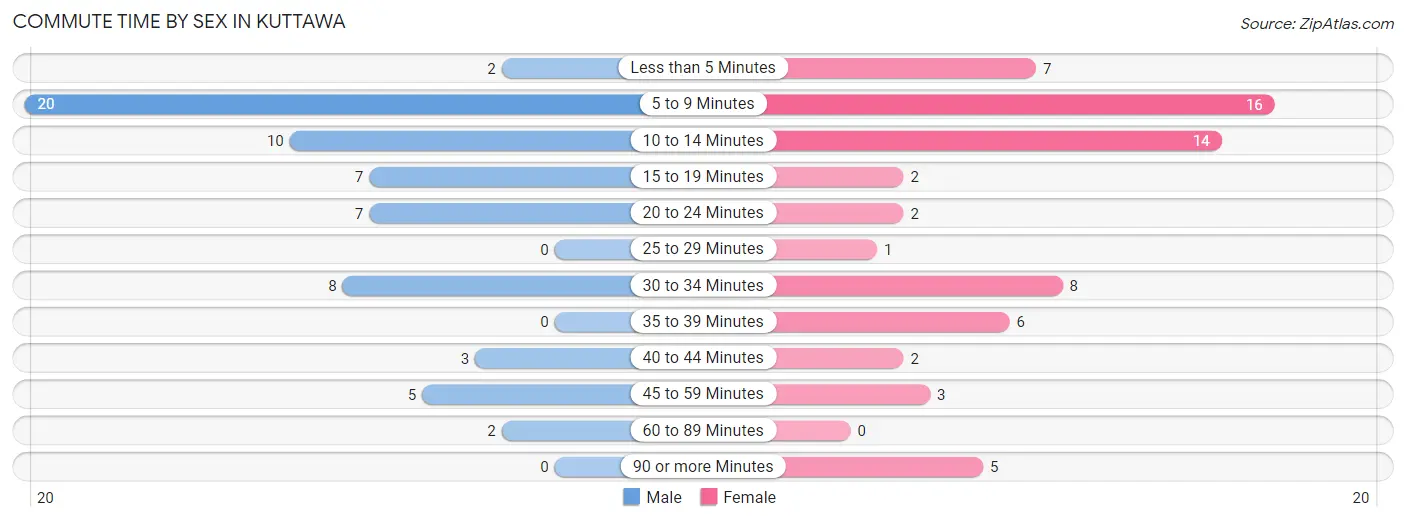
| Commute Time | Male | Female |
| Less than 5 Minutes | 2 (3.1%) | 7 (10.6%) |
| 5 to 9 Minutes | 20 (31.2%) | 16 (24.2%) |
| 10 to 14 Minutes | 10 (15.6%) | 14 (21.2%) |
| 15 to 19 Minutes | 7 (10.9%) | 2 (3.0%) |
| 20 to 24 Minutes | 7 (10.9%) | 2 (3.0%) |
| 25 to 29 Minutes | 0 (0.0%) | 1 (1.5%) |
| 30 to 34 Minutes | 8 (12.5%) | 8 (12.1%) |
| 35 to 39 Minutes | 0 (0.0%) | 6 (9.1%) |
| 40 to 44 Minutes | 3 (4.7%) | 2 (3.0%) |
| 45 to 59 Minutes | 5 (7.8%) | 3 (4.5%) |
| 60 to 89 Minutes | 2 (3.1%) | 0 (0.0%) |
| 90 or more Minutes | 0 (0.0%) | 5 (7.6%) |
Time of Departure to Work by Sex in Kuttawa
The most frequent times of departure to work in Kuttawa are 6:30 AM to 6:59 AM (15, 23.4%) for males and 7:30 AM to 7:59 AM (11, 16.7%) for females.
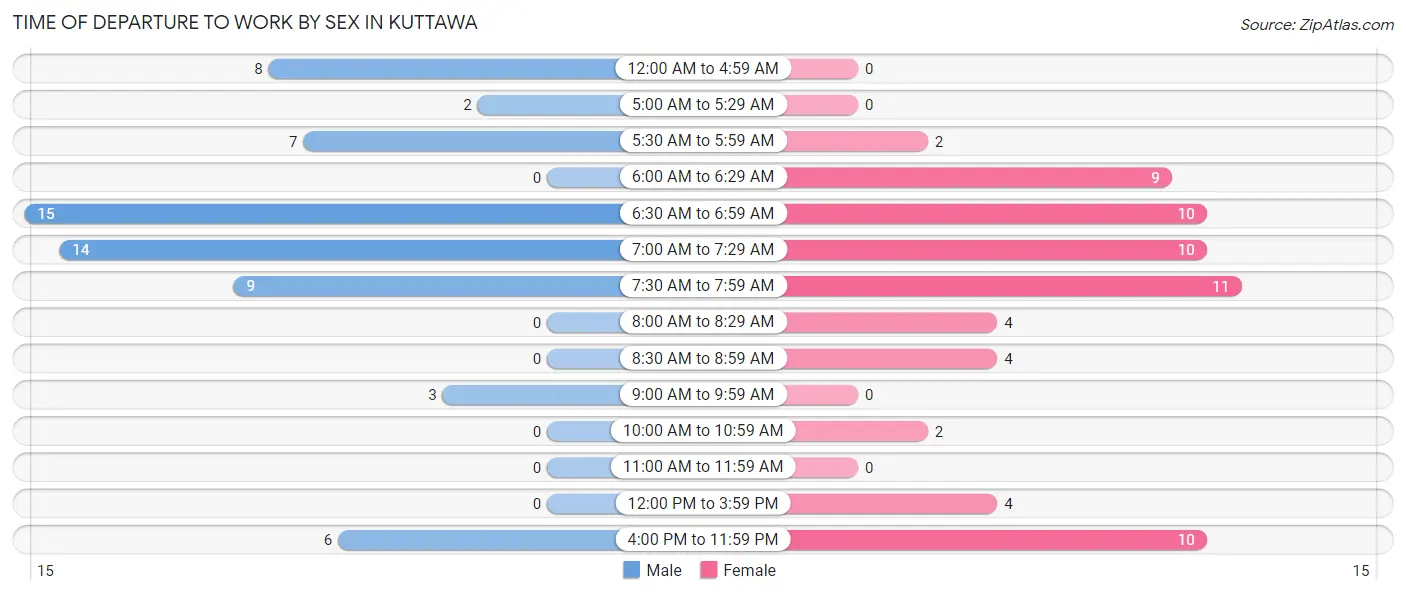
| Time of Departure | Male | Female |
| 12:00 AM to 4:59 AM | 8 (12.5%) | 0 (0.0%) |
| 5:00 AM to 5:29 AM | 2 (3.1%) | 0 (0.0%) |
| 5:30 AM to 5:59 AM | 7 (10.9%) | 2 (3.0%) |
| 6:00 AM to 6:29 AM | 0 (0.0%) | 9 (13.6%) |
| 6:30 AM to 6:59 AM | 15 (23.4%) | 10 (15.1%) |
| 7:00 AM to 7:29 AM | 14 (21.9%) | 10 (15.1%) |
| 7:30 AM to 7:59 AM | 9 (14.1%) | 11 (16.7%) |
| 8:00 AM to 8:29 AM | 0 (0.0%) | 4 (6.1%) |
| 8:30 AM to 8:59 AM | 0 (0.0%) | 4 (6.1%) |
| 9:00 AM to 9:59 AM | 3 (4.7%) | 0 (0.0%) |
| 10:00 AM to 10:59 AM | 0 (0.0%) | 2 (3.0%) |
| 11:00 AM to 11:59 AM | 0 (0.0%) | 0 (0.0%) |
| 12:00 PM to 3:59 PM | 0 (0.0%) | 4 (6.1%) |
| 4:00 PM to 11:59 PM | 6 (9.4%) | 10 (15.1%) |
| Total | 64 (100.0%) | 66 (100.0%) |
Housing Occupancy in Kuttawa
Occupancy by Ownership in Kuttawa
Of the total 207 dwellings in Kuttawa, owner-occupied units account for 180 (87.0%), while renter-occupied units make up 27 (13.0%).
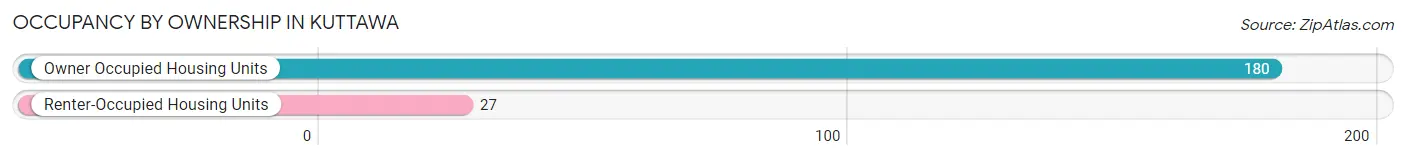
| Occupancy | # Housing Units | % Housing Units |
| Owner Occupied Housing Units | 180 | 87.0% |
| Renter-Occupied Housing Units | 27 | 13.0% |
| Total Occupied Housing Units | 207 | 100.0% |
Occupancy by Household Size in Kuttawa
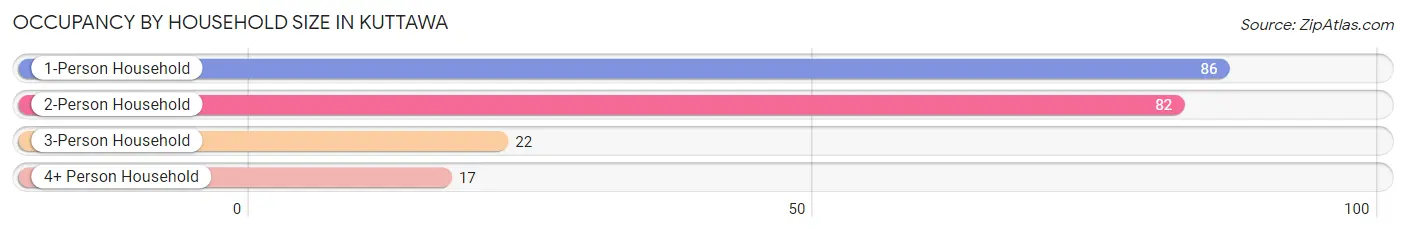
| Household Size | # Housing Units | % Housing Units |
| 1-Person Household | 86 | 41.5% |
| 2-Person Household | 82 | 39.6% |
| 3-Person Household | 22 | 10.6% |
| 4+ Person Household | 17 | 8.2% |
| Total Housing Units | 207 | 100.0% |
Occupancy by Ownership by Household Size in Kuttawa
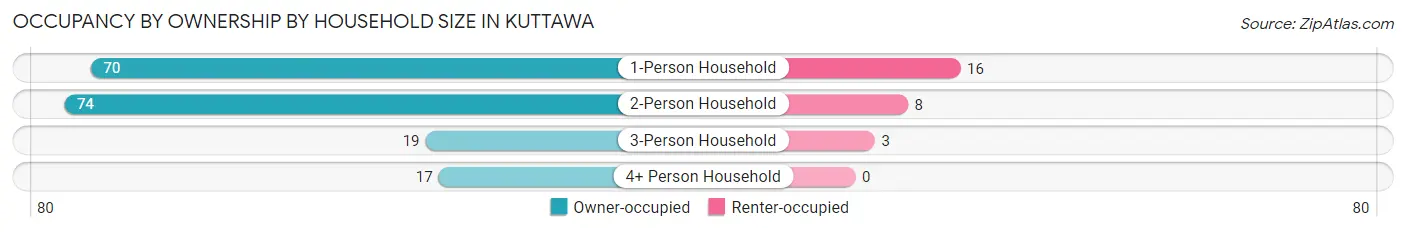
| Household Size | Owner-occupied | Renter-occupied |
| 1-Person Household | 70 (81.4%) | 16 (18.6%) |
| 2-Person Household | 74 (90.2%) | 8 (9.8%) |
| 3-Person Household | 19 (86.4%) | 3 (13.6%) |
| 4+ Person Household | 17 (100.0%) | 0 (0.0%) |
| Total Housing Units | 180 (87.0%) | 27 (13.0%) |
Occupancy by Educational Attainment in Kuttawa
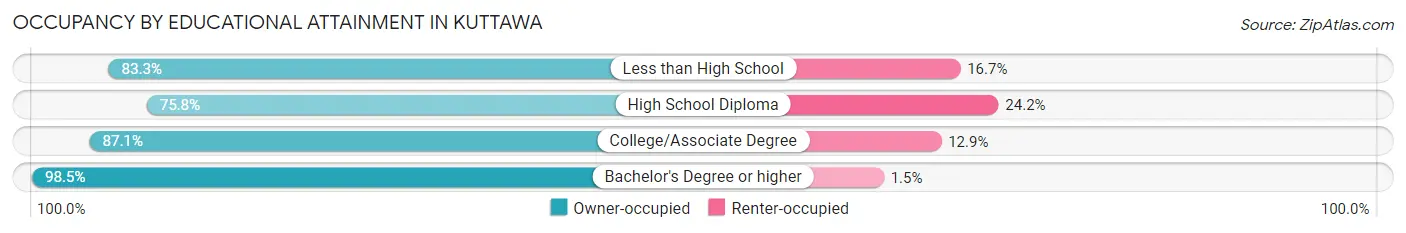
| Household Size | Owner-occupied | Renter-occupied |
| Less than High School | 10 (83.3%) | 2 (16.7%) |
| High School Diploma | 50 (75.8%) | 16 (24.2%) |
| College/Associate Degree | 54 (87.1%) | 8 (12.9%) |
| Bachelor's Degree or higher | 66 (98.5%) | 1 (1.5%) |
Occupancy by Age of Householder in Kuttawa
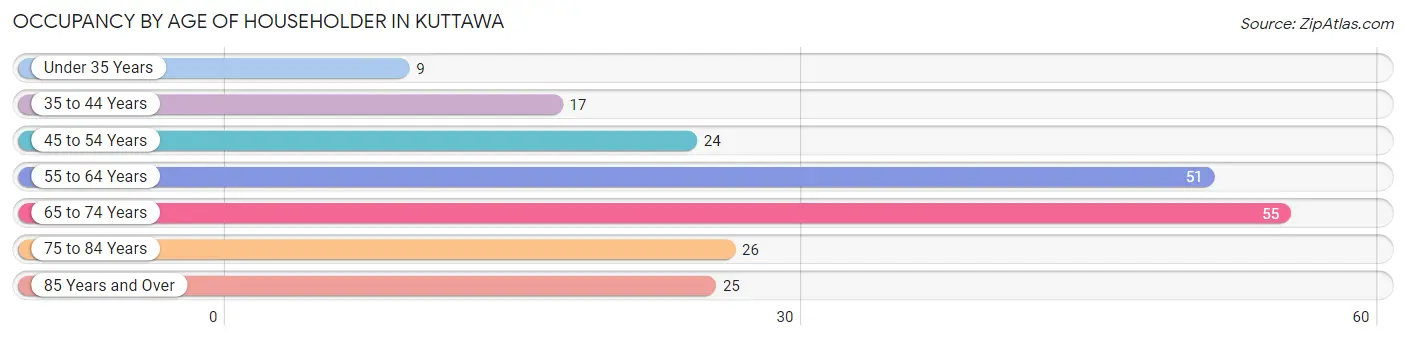
| Age Bracket | # Households | % Households |
| Under 35 Years | 9 | 4.3% |
| 35 to 44 Years | 17 | 8.2% |
| 45 to 54 Years | 24 | 11.6% |
| 55 to 64 Years | 51 | 24.6% |
| 65 to 74 Years | 55 | 26.6% |
| 75 to 84 Years | 26 | 12.6% |
| 85 Years and Over | 25 | 12.1% |
| Total | 207 | 100.0% |
Housing Finances in Kuttawa
Median Income by Occupancy in Kuttawa
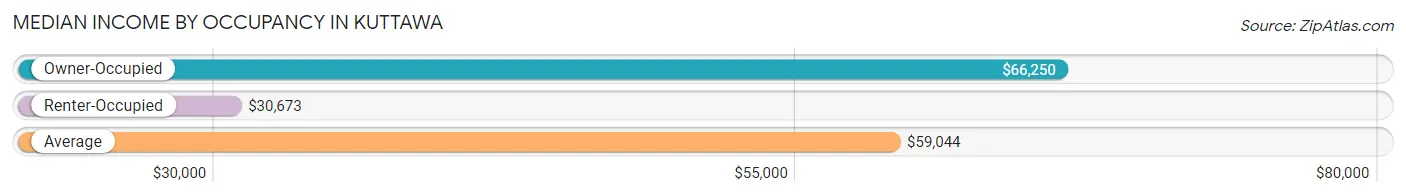
| Occupancy Type | # Households | Median Income |
| Owner-Occupied | 180 (87.0%) | $66,250 |
| Renter-Occupied | 27 (13.0%) | $30,673 |
| Average | 207 (100.0%) | $59,044 |
Occupancy by Householder Income Bracket in Kuttawa
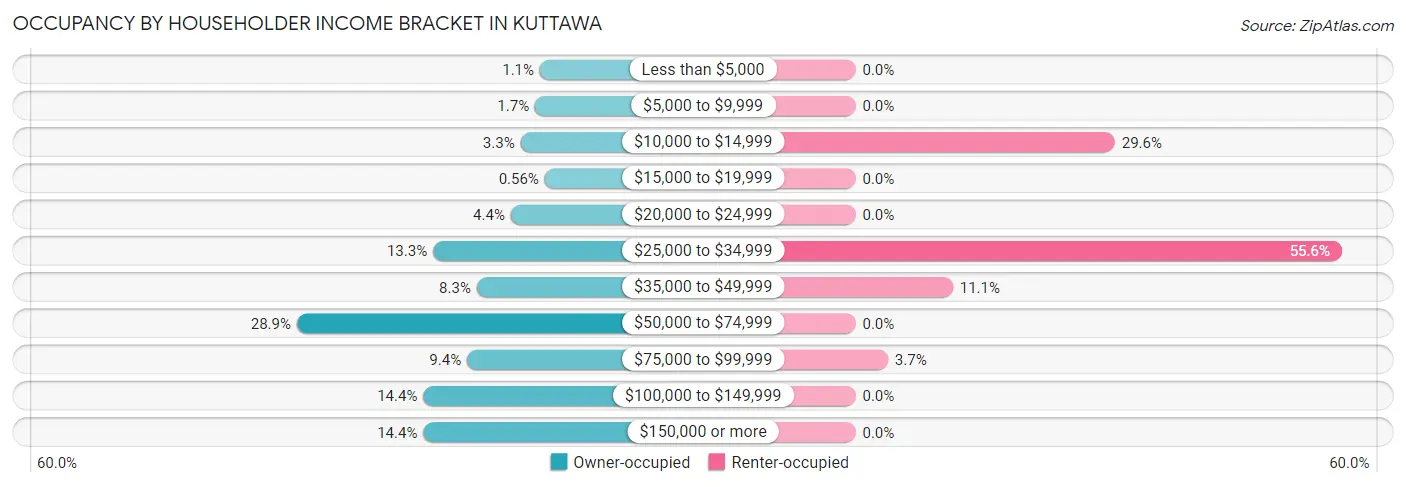
| Income Bracket | Owner-occupied | Renter-occupied |
| Less than $5,000 | 2 (1.1%) | 0 (0.0%) |
| $5,000 to $9,999 | 3 (1.7%) | 0 (0.0%) |
| $10,000 to $14,999 | 6 (3.3%) | 8 (29.6%) |
| $15,000 to $19,999 | 1 (0.6%) | 0 (0.0%) |
| $20,000 to $24,999 | 8 (4.4%) | 0 (0.0%) |
| $25,000 to $34,999 | 24 (13.3%) | 15 (55.6%) |
| $35,000 to $49,999 | 15 (8.3%) | 3 (11.1%) |
| $50,000 to $74,999 | 52 (28.9%) | 0 (0.0%) |
| $75,000 to $99,999 | 17 (9.4%) | 1 (3.7%) |
| $100,000 to $149,999 | 26 (14.4%) | 0 (0.0%) |
| $150,000 or more | 26 (14.4%) | 0 (0.0%) |
| Total | 180 (100.0%) | 27 (100.0%) |
Monthly Housing Cost Tiers in Kuttawa
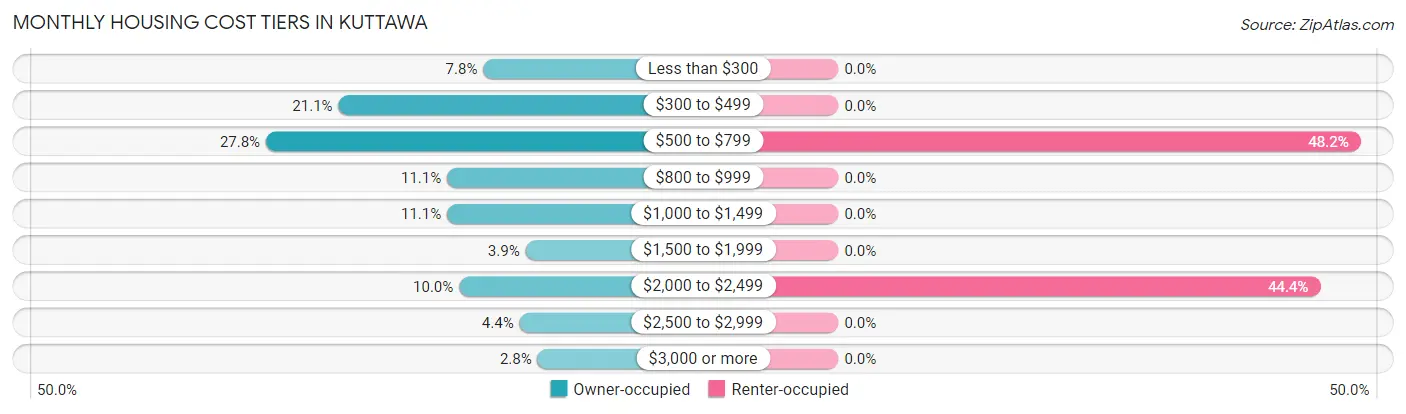
| Monthly Cost | Owner-occupied | Renter-occupied |
| Less than $300 | 14 (7.8%) | 0 (0.0%) |
| $300 to $499 | 38 (21.1%) | 0 (0.0%) |
| $500 to $799 | 50 (27.8%) | 13 (48.1%) |
| $800 to $999 | 20 (11.1%) | 0 (0.0%) |
| $1,000 to $1,499 | 20 (11.1%) | 0 (0.0%) |
| $1,500 to $1,999 | 7 (3.9%) | 0 (0.0%) |
| $2,000 to $2,499 | 18 (10.0%) | 12 (44.4%) |
| $2,500 to $2,999 | 8 (4.4%) | 0 (0.0%) |
| $3,000 or more | 5 (2.8%) | 0 (0.0%) |
| Total | 180 (100.0%) | 27 (100.0%) |
Physical Housing Characteristics in Kuttawa
Housing Structures in Kuttawa
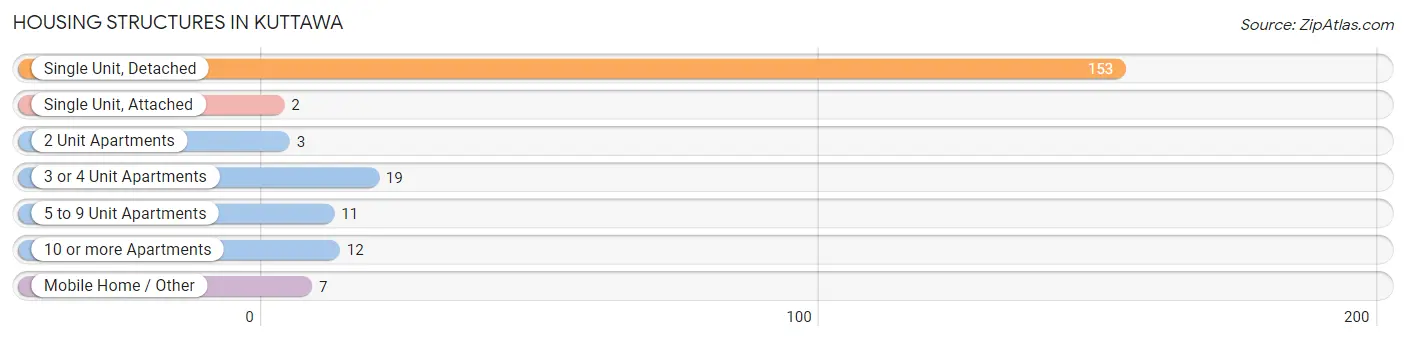
| Structure Type | # Housing Units | % Housing Units |
| Single Unit, Detached | 153 | 73.9% |
| Single Unit, Attached | 2 | 1.0% |
| 2 Unit Apartments | 3 | 1.5% |
| 3 or 4 Unit Apartments | 19 | 9.2% |
| 5 to 9 Unit Apartments | 11 | 5.3% |
| 10 or more Apartments | 12 | 5.8% |
| Mobile Home / Other | 7 | 3.4% |
| Total | 207 | 100.0% |
Housing Structures by Occupancy in Kuttawa
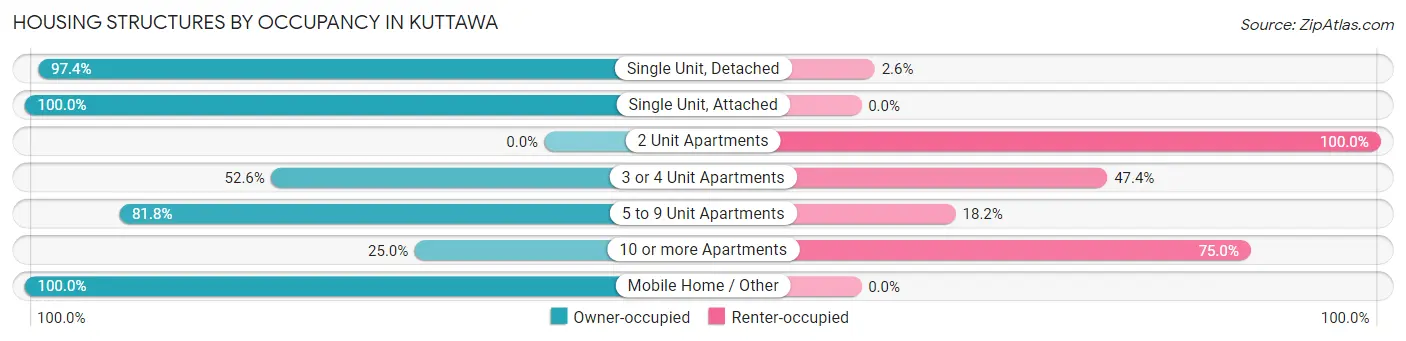
| Structure Type | Owner-occupied | Renter-occupied |
| Single Unit, Detached | 149 (97.4%) | 4 (2.6%) |
| Single Unit, Attached | 2 (100.0%) | 0 (0.0%) |
| 2 Unit Apartments | 0 (0.0%) | 3 (100.0%) |
| 3 or 4 Unit Apartments | 10 (52.6%) | 9 (47.4%) |
| 5 to 9 Unit Apartments | 9 (81.8%) | 2 (18.2%) |
| 10 or more Apartments | 3 (25.0%) | 9 (75.0%) |
| Mobile Home / Other | 7 (100.0%) | 0 (0.0%) |
| Total | 180 (87.0%) | 27 (13.0%) |
Housing Structures by Number of Rooms in Kuttawa
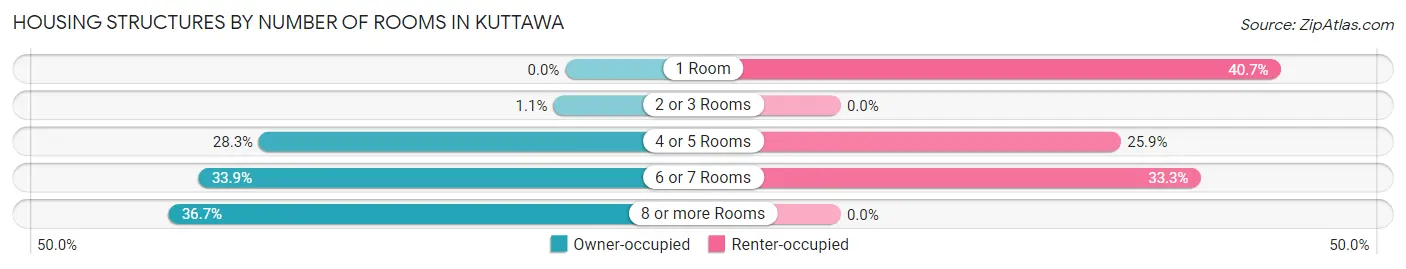
| Number of Rooms | Owner-occupied | Renter-occupied |
| 1 Room | 0 (0.0%) | 11 (40.7%) |
| 2 or 3 Rooms | 2 (1.1%) | 0 (0.0%) |
| 4 or 5 Rooms | 51 (28.3%) | 7 (25.9%) |
| 6 or 7 Rooms | 61 (33.9%) | 9 (33.3%) |
| 8 or more Rooms | 66 (36.7%) | 0 (0.0%) |
| Total | 180 (100.0%) | 27 (100.0%) |
Housing Structure by Heating Type in Kuttawa
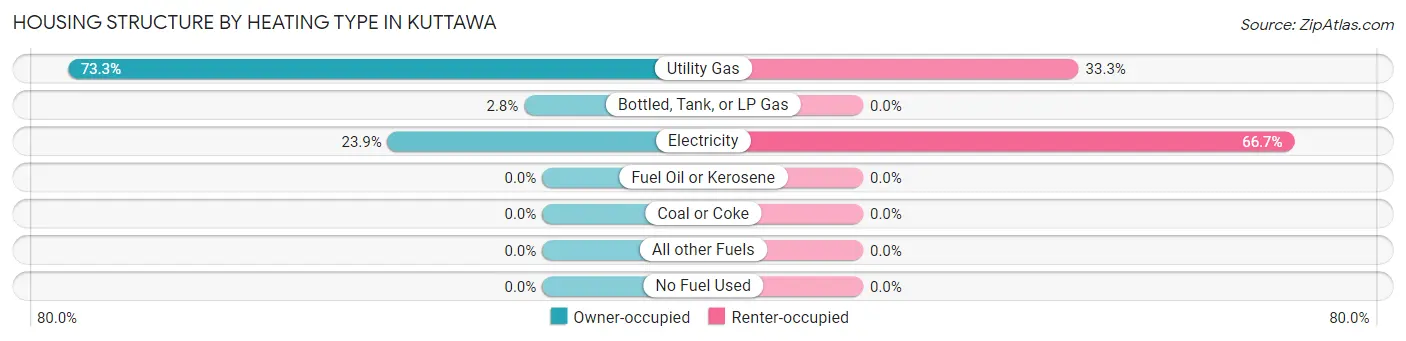
| Heating Type | Owner-occupied | Renter-occupied |
| Utility Gas | 132 (73.3%) | 9 (33.3%) |
| Bottled, Tank, or LP Gas | 5 (2.8%) | 0 (0.0%) |
| Electricity | 43 (23.9%) | 18 (66.7%) |
| Fuel Oil or Kerosene | 0 (0.0%) | 0 (0.0%) |
| Coal or Coke | 0 (0.0%) | 0 (0.0%) |
| All other Fuels | 0 (0.0%) | 0 (0.0%) |
| No Fuel Used | 0 (0.0%) | 0 (0.0%) |
| Total | 180 (100.0%) | 27 (100.0%) |
Household Vehicle Usage in Kuttawa
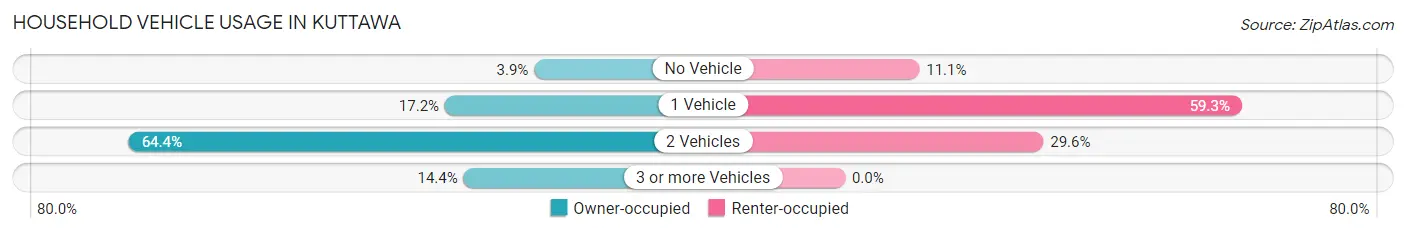
| Vehicles per Household | Owner-occupied | Renter-occupied |
| No Vehicle | 7 (3.9%) | 3 (11.1%) |
| 1 Vehicle | 31 (17.2%) | 16 (59.3%) |
| 2 Vehicles | 116 (64.4%) | 8 (29.6%) |
| 3 or more Vehicles | 26 (14.4%) | 0 (0.0%) |
| Total | 180 (100.0%) | 27 (100.0%) |
Real Estate & Mortgages in Kuttawa
Real Estate and Mortgage Overview in Kuttawa
| Characteristic | Without Mortgage | With Mortgage |
| Housing Units | 113 | 67 |
| Median Property Value | $220,500 | $326,900 |
| Median Household Income | $58,750 | $16 |
| Monthly Housing Costs | $517 | $5 |
| Real Estate Taxes | $1,438 | $4 |
Property Value by Mortgage Status in Kuttawa
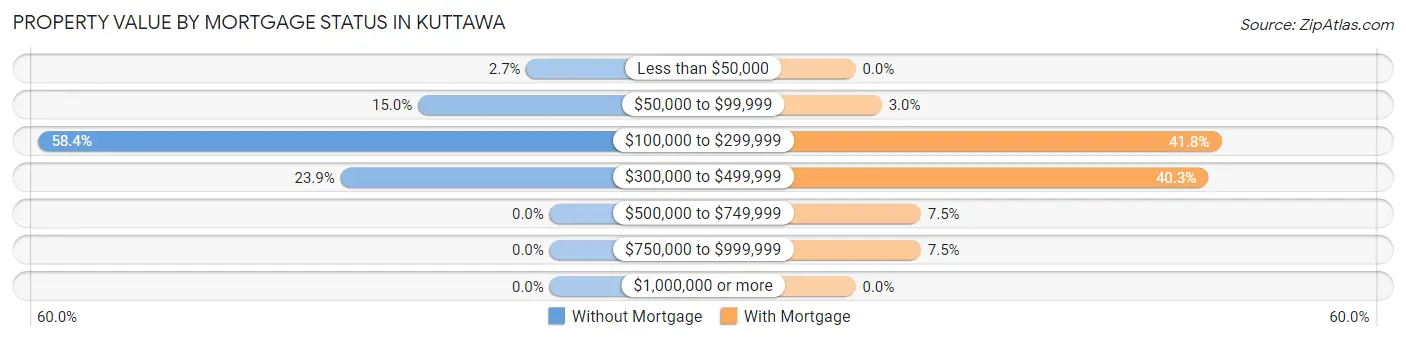
| Property Value | Without Mortgage | With Mortgage |
| Less than $50,000 | 3 (2.6%) | 0 (0.0%) |
| $50,000 to $99,999 | 17 (15.0%) | 2 (3.0%) |
| $100,000 to $299,999 | 66 (58.4%) | 28 (41.8%) |
| $300,000 to $499,999 | 27 (23.9%) | 27 (40.3%) |
| $500,000 to $749,999 | 0 (0.0%) | 5 (7.5%) |
| $750,000 to $999,999 | 0 (0.0%) | 5 (7.5%) |
| $1,000,000 or more | 0 (0.0%) | 0 (0.0%) |
| Total | 113 (100.0%) | 67 (100.0%) |
Household Income by Mortgage Status in Kuttawa
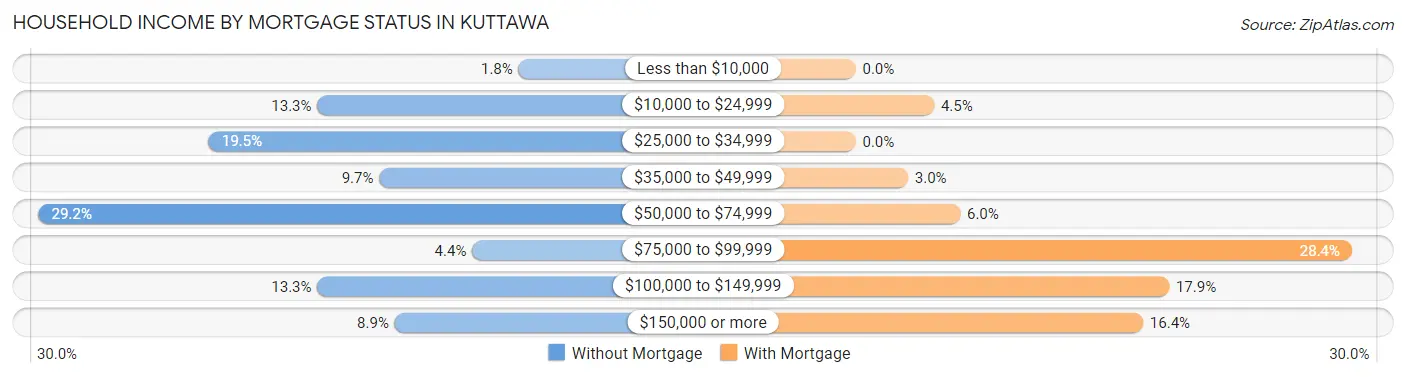
| Household Income | Without Mortgage | With Mortgage |
| Less than $10,000 | 2 (1.8%) | 0 (0.0%) |
| $10,000 to $24,999 | 15 (13.3%) | 3 (4.5%) |
| $25,000 to $34,999 | 22 (19.5%) | 0 (0.0%) |
| $35,000 to $49,999 | 11 (9.7%) | 2 (3.0%) |
| $50,000 to $74,999 | 33 (29.2%) | 4 (6.0%) |
| $75,000 to $99,999 | 5 (4.4%) | 19 (28.4%) |
| $100,000 to $149,999 | 15 (13.3%) | 12 (17.9%) |
| $150,000 or more | 10 (8.8%) | 11 (16.4%) |
| Total | 113 (100.0%) | 67 (100.0%) |
Property Value to Household Income Ratio in Kuttawa
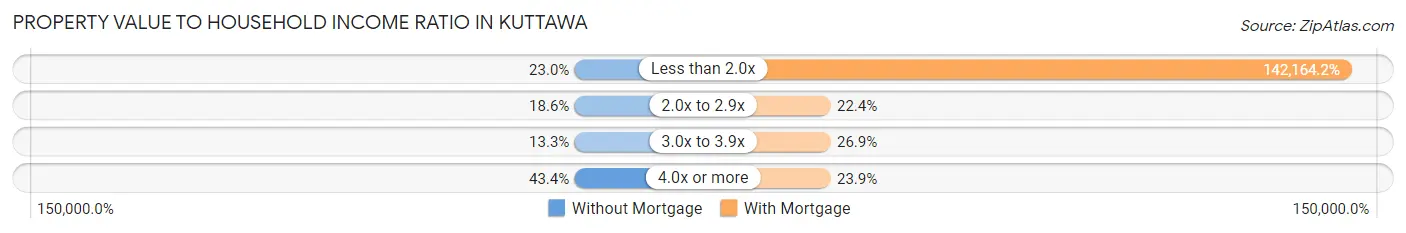
| Value-to-Income Ratio | Without Mortgage | With Mortgage |
| Less than 2.0x | 26 (23.0%) | 95,250 (142,164.2%) |
| 2.0x to 2.9x | 21 (18.6%) | 15 (22.4%) |
| 3.0x to 3.9x | 15 (13.3%) | 18 (26.9%) |
| 4.0x or more | 49 (43.4%) | 16 (23.9%) |
| Total | 113 (100.0%) | 67 (100.0%) |
Real Estate Taxes by Mortgage Status in Kuttawa
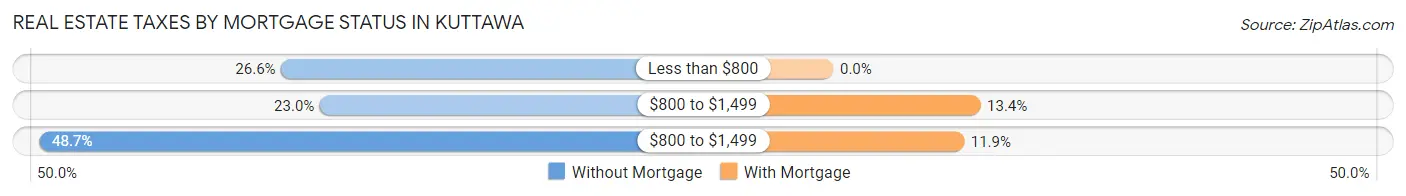
| Property Taxes | Without Mortgage | With Mortgage |
| Less than $800 | 30 (26.6%) | 0 (0.0%) |
| $800 to $1,499 | 26 (23.0%) | 9 (13.4%) |
| $800 to $1,499 | 55 (48.7%) | 8 (11.9%) |
| Total | 113 (100.0%) | 67 (100.0%) |
Health & Disability in Kuttawa
Health Insurance Coverage by Age in Kuttawa
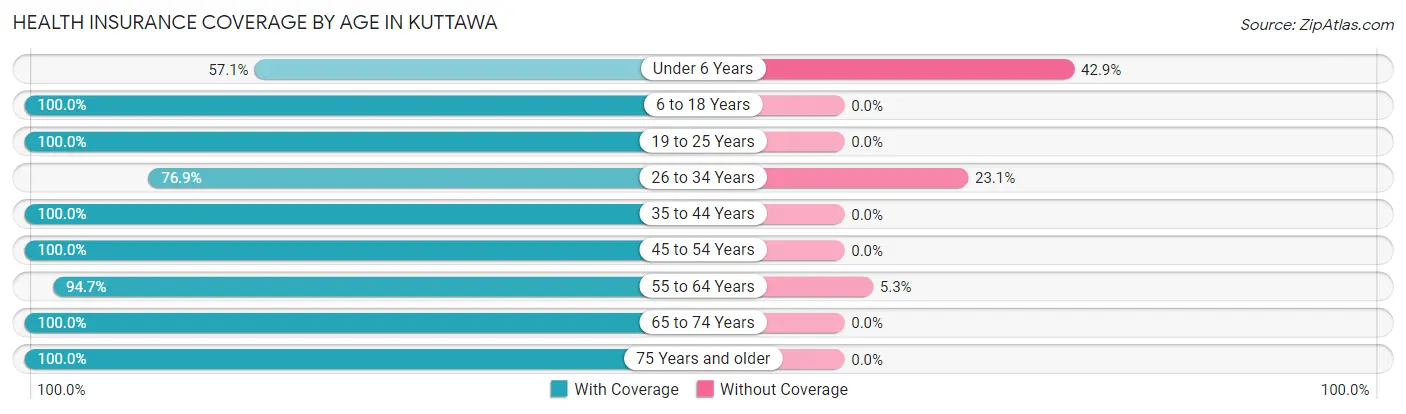
| Age Bracket | With Coverage | Without Coverage |
| Under 6 Years | 16 (57.1%) | 12 (42.9%) |
| 6 to 18 Years | 70 (100.0%) | 0 (0.0%) |
| 19 to 25 Years | 9 (100.0%) | 0 (0.0%) |
| 26 to 34 Years | 10 (76.9%) | 3 (23.1%) |
| 35 to 44 Years | 27 (100.0%) | 0 (0.0%) |
| 45 to 54 Years | 54 (100.0%) | 0 (0.0%) |
| 55 to 64 Years | 89 (94.7%) | 5 (5.3%) |
| 65 to 74 Years | 111 (100.0%) | 0 (0.0%) |
| 75 Years and older | 106 (100.0%) | 0 (0.0%) |
| Total | 492 (96.1%) | 20 (3.9%) |
Health Insurance Coverage by Citizenship Status in Kuttawa
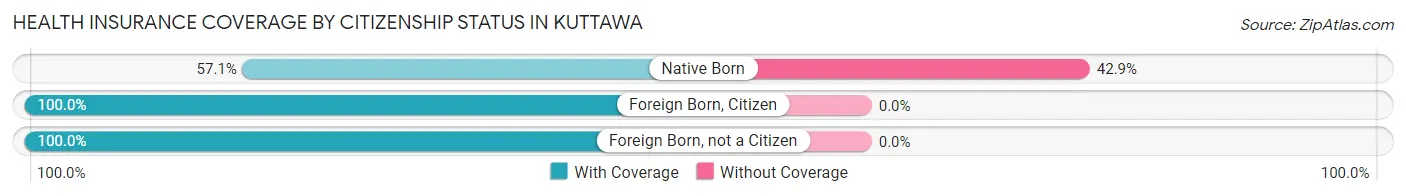
| Citizenship Status | With Coverage | Without Coverage |
| Native Born | 16 (57.1%) | 12 (42.9%) |
| Foreign Born, Citizen | 70 (100.0%) | 0 (0.0%) |
| Foreign Born, not a Citizen | 9 (100.0%) | 0 (0.0%) |
Health Insurance Coverage by Household Income in Kuttawa
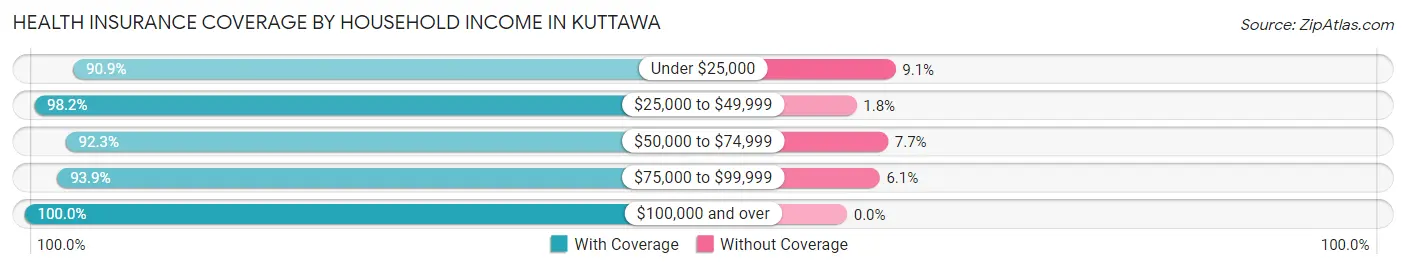
| Household Income | With Coverage | Without Coverage |
| Under $25,000 | 30 (90.9%) | 3 (9.1%) |
| $25,000 to $49,999 | 110 (98.2%) | 2 (1.8%) |
| $50,000 to $74,999 | 144 (92.3%) | 12 (7.7%) |
| $75,000 to $99,999 | 46 (93.9%) | 3 (6.1%) |
| $100,000 and over | 162 (100.0%) | 0 (0.0%) |
Public vs Private Health Insurance Coverage by Age in Kuttawa
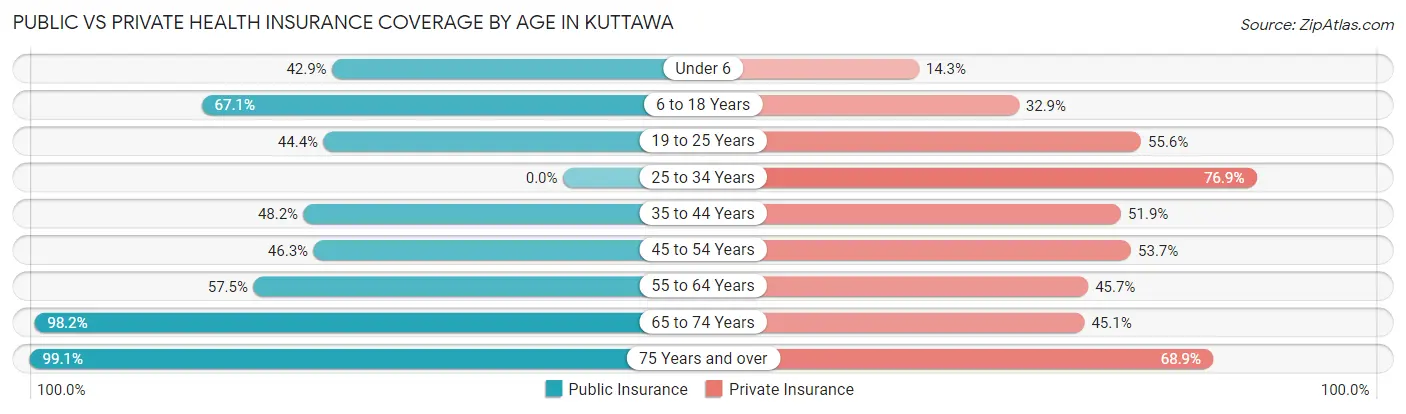
| Age Bracket | Public Insurance | Private Insurance |
| Under 6 | 12 (42.9%) | 4 (14.3%) |
| 6 to 18 Years | 47 (67.1%) | 23 (32.9%) |
| 19 to 25 Years | 4 (44.4%) | 5 (55.6%) |
| 25 to 34 Years | 0 (0.0%) | 10 (76.9%) |
| 35 to 44 Years | 13 (48.1%) | 14 (51.8%) |
| 45 to 54 Years | 25 (46.3%) | 29 (53.7%) |
| 55 to 64 Years | 54 (57.5%) | 43 (45.7%) |
| 65 to 74 Years | 109 (98.2%) | 50 (45.1%) |
| 75 Years and over | 105 (99.1%) | 73 (68.9%) |
| Total | 369 (72.1%) | 251 (49.0%) |
Disability Status by Sex by Age in Kuttawa
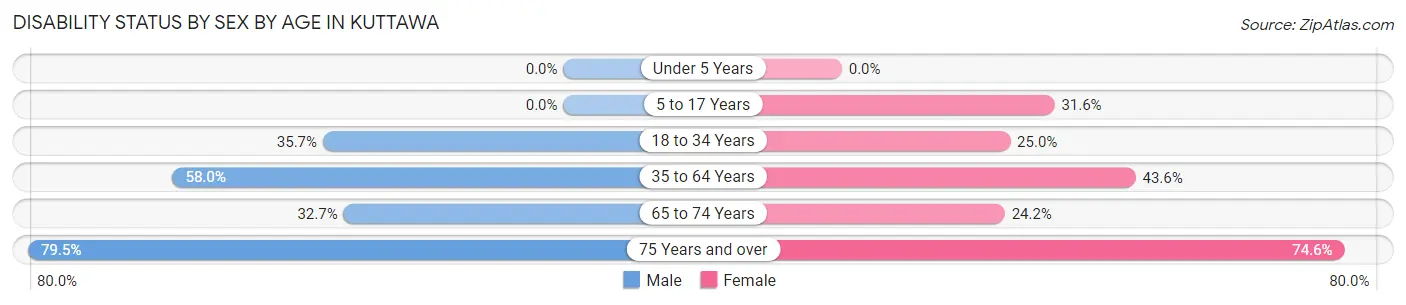
| Age Bracket | Male | Female |
| Under 5 Years | 0 (0.0%) | 0 (0.0%) |
| 5 to 17 Years | 0 (0.0%) | 12 (31.6%) |
| 18 to 34 Years | 5 (35.7%) | 2 (25.0%) |
| 35 to 64 Years | 47 (58.0%) | 41 (43.6%) |
| 65 to 74 Years | 16 (32.7%) | 15 (24.2%) |
| 75 Years and over | 31 (79.5%) | 50 (74.6%) |
Disability Class by Sex by Age in Kuttawa
Disability Class: Hearing Difficulty
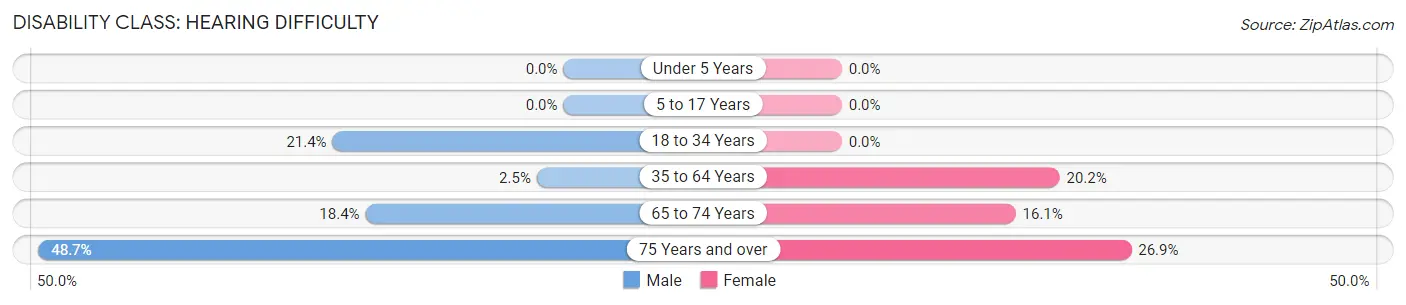
| Age Bracket | Male | Female |
| Under 5 Years | 0 (0.0%) | 0 (0.0%) |
| 5 to 17 Years | 0 (0.0%) | 0 (0.0%) |
| 18 to 34 Years | 3 (21.4%) | 0 (0.0%) |
| 35 to 64 Years | 2 (2.5%) | 19 (20.2%) |
| 65 to 74 Years | 9 (18.4%) | 10 (16.1%) |
| 75 Years and over | 19 (48.7%) | 18 (26.9%) |
Disability Class: Vision Difficulty
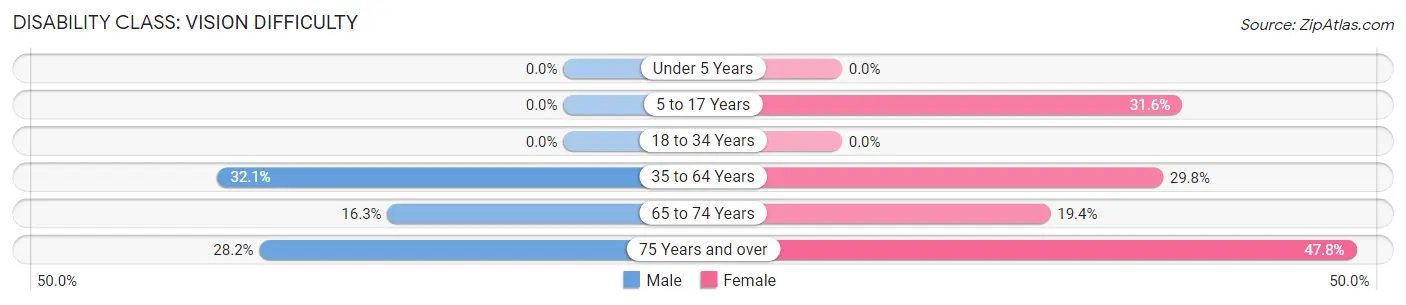
| Age Bracket | Male | Female |
| Under 5 Years | 0 (0.0%) | 0 (0.0%) |
| 5 to 17 Years | 0 (0.0%) | 12 (31.6%) |
| 18 to 34 Years | 0 (0.0%) | 0 (0.0%) |
| 35 to 64 Years | 26 (32.1%) | 28 (29.8%) |
| 65 to 74 Years | 8 (16.3%) | 12 (19.4%) |
| 75 Years and over | 11 (28.2%) | 32 (47.8%) |
Disability Class: Cognitive Difficulty
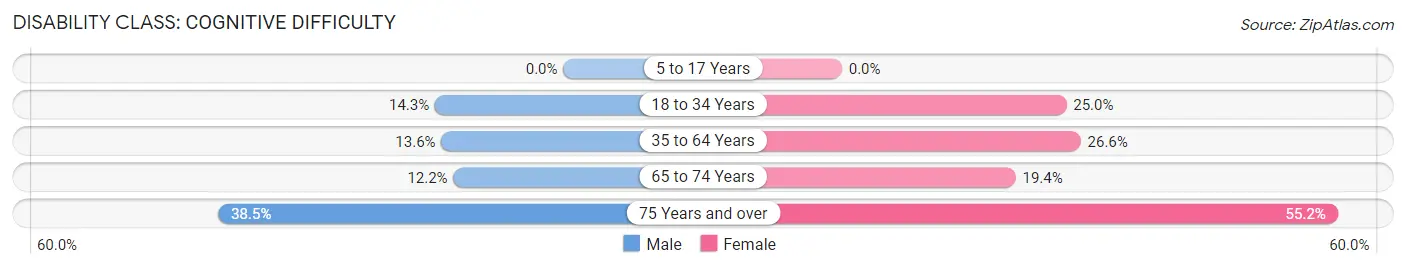
| Age Bracket | Male | Female |
| 5 to 17 Years | 0 (0.0%) | 0 (0.0%) |
| 18 to 34 Years | 2 (14.3%) | 2 (25.0%) |
| 35 to 64 Years | 11 (13.6%) | 25 (26.6%) |
| 65 to 74 Years | 6 (12.2%) | 12 (19.4%) |
| 75 Years and over | 15 (38.5%) | 37 (55.2%) |
Disability Class: Ambulatory Difficulty
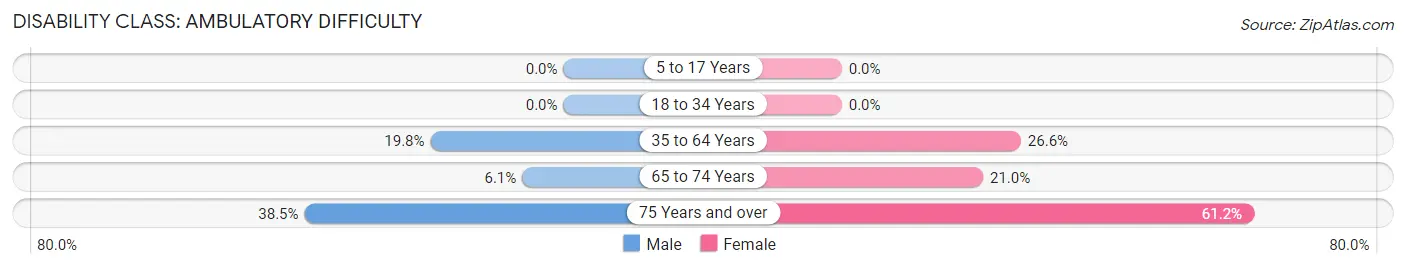
| Age Bracket | Male | Female |
| 5 to 17 Years | 0 (0.0%) | 0 (0.0%) |
| 18 to 34 Years | 0 (0.0%) | 0 (0.0%) |
| 35 to 64 Years | 16 (19.8%) | 25 (26.6%) |
| 65 to 74 Years | 3 (6.1%) | 13 (21.0%) |
| 75 Years and over | 15 (38.5%) | 41 (61.2%) |
Disability Class: Self-Care Difficulty
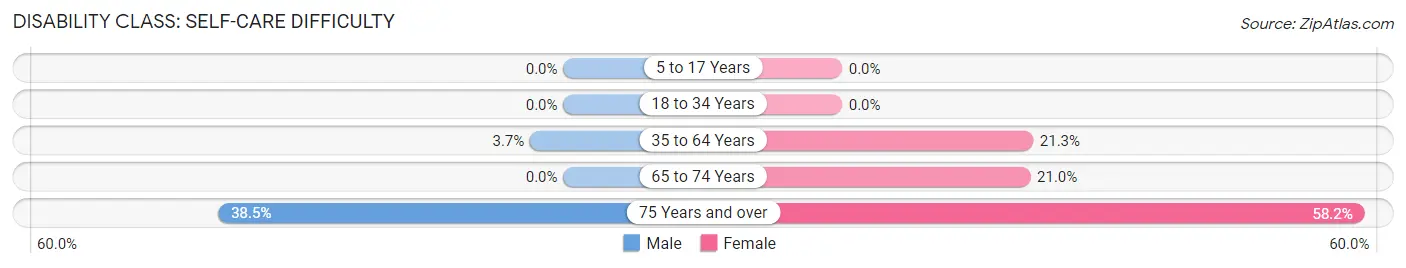
| Age Bracket | Male | Female |
| 5 to 17 Years | 0 (0.0%) | 0 (0.0%) |
| 18 to 34 Years | 0 (0.0%) | 0 (0.0%) |
| 35 to 64 Years | 3 (3.7%) | 20 (21.3%) |
| 65 to 74 Years | 0 (0.0%) | 13 (21.0%) |
| 75 Years and over | 15 (38.5%) | 39 (58.2%) |
Technology Access in Kuttawa
Computing Device Access in Kuttawa
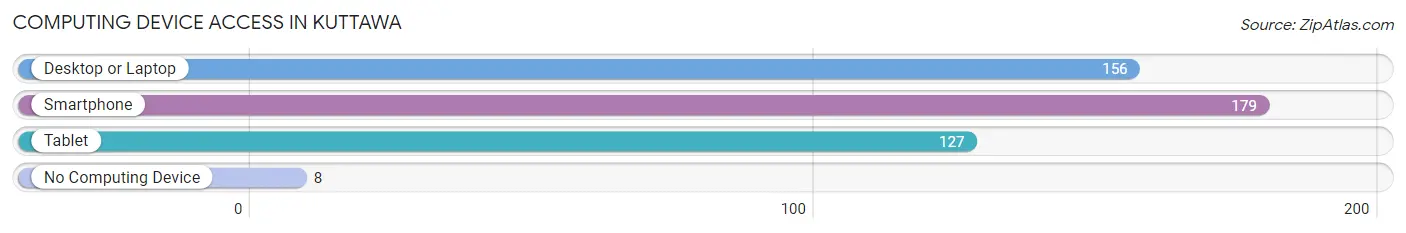
| Device Type | # Households | % Households |
| Desktop or Laptop | 156 | 75.4% |
| Smartphone | 179 | 86.5% |
| Tablet | 127 | 61.4% |
| No Computing Device | 8 | 3.9% |
| Total | 207 | 100.0% |
Internet Access in Kuttawa
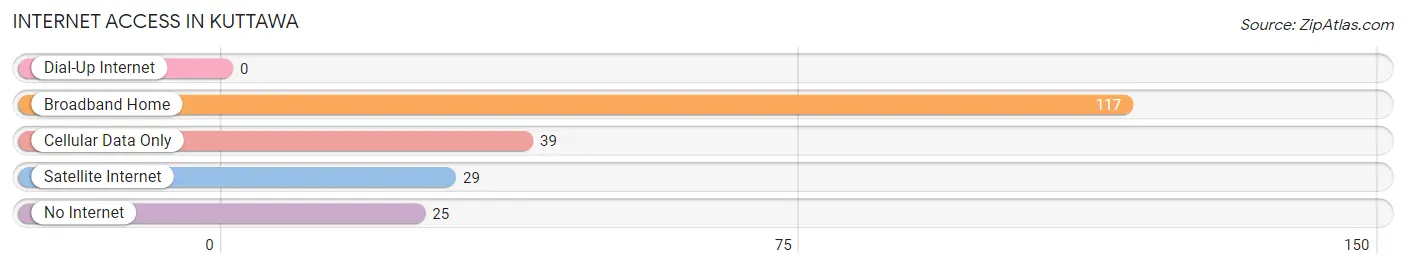
| Internet Type | # Households | % Households |
| Dial-Up Internet | 0 | 0.0% |
| Broadband Home | 117 | 56.5% |
| Cellular Data Only | 39 | 18.8% |
| Satellite Internet | 29 | 14.0% |
| No Internet | 25 | 12.1% |
| Total | 207 | 100.0% |
Kuttawa Summary
Kuttawa is a small town located in Lyon County, Kentucky, United States. It is situated on the banks of Lake Barkley, a reservoir of the Cumberland River. The town was founded in 1854 and has a population of approximately 1,000 people.
Geography
Kuttawa is located in western Kentucky, approximately 30 miles east of Paducah and 40 miles west of Nashville, Tennessee. The town is situated on the banks of Lake Barkley, a reservoir of the Cumberland River. The lake is a popular destination for fishing, boating, and other recreational activities. The town is also located near the Land Between the Lakes National Recreation Area, a 170,000-acre outdoor recreation area.
The town is located in a hilly region of Kentucky, with an elevation of 463 feet above sea level. The climate is humid subtropical, with hot summers and mild winters. The average annual temperature is around 60 degrees Fahrenheit.
Economy
Kuttawa’s economy is largely based on tourism and recreation. The town is home to several marinas, campgrounds, and resorts that cater to visitors who come to enjoy the lake and the surrounding area. The town also has several restaurants, shops, and other businesses that serve the local community.
The town is also home to several manufacturing companies, including a furniture factory and a plastics plant. The town is also home to a large coal-fired power plant, which provides electricity to the region.
Demographics
As of the 2010 census, the population of Kuttawa was 1,000 people. The racial makeup of the town was 97.2% White, 0.7% African American, 0.3% Native American, 0.2% Asian, 0.1% Pacific Islander, and 1.5% from other races. The median household income was $35,000, and the median family income was $41,000.
The town is served by the Lyon County School District, which includes two elementary schools, one middle school, and one high school. The town is also home to a branch of the University of Kentucky.
Conclusion
Kuttawa is a small town located in western Kentucky, on the banks of Lake Barkley. The town is a popular destination for tourists and outdoor enthusiasts, and its economy is largely based on tourism and recreation. The town has a population of approximately 1,000 people, and the median household income is $35,000. The town is served by the Lyon County School District, and is home to a branch of the University of Kentucky.
Common Questions
What is Per Capita Income in Kuttawa?
Per Capita income in Kuttawa is $27,495.
What is the Median Family Income in Kuttawa?
Median Family Income in Kuttawa is $70,469.
What is the Median Household income in Kuttawa?
Median Household Income in Kuttawa is $59,044.
What is Income or Wage Gap in Kuttawa?
Income or Wage Gap in Kuttawa is 45.0%.
Women in Kuttawa earn 55.0 cents for every dollar earned by a man.
What is Inequality or Gini Index in Kuttawa?
Inequality or Gini Index in Kuttawa is 0.42.
What is the Total Population of Kuttawa?
Total Population of Kuttawa is 622.
What is the Total Male Population of Kuttawa?
Total Male Population of Kuttawa is 265.
What is the Total Female Population of Kuttawa?
Total Female Population of Kuttawa is 357.
What is the Ratio of Males per 100 Females in Kuttawa?
There are 74.23 Males per 100 Females in Kuttawa.
What is the Ratio of Females per 100 Males in Kuttawa?
There are 134.72 Females per 100 Males in Kuttawa.
What is the Median Population Age in Kuttawa?
Median Population Age in Kuttawa is 64.4 Years.
What is the Average Family Size in Kuttawa
Average Family Size in Kuttawa is 3.1 People.
What is the Average Household Size in Kuttawa
Average Household Size in Kuttawa is 2.5 People.
How Large is the Labor Force in Kuttawa?
There are 142 People in the Labor Forcein in Kuttawa.
What is the Percentage of People in the Labor Force in Kuttawa?
26.6% of People are in the Labor Force in Kuttawa.
What is the Unemployment Rate in Kuttawa?
Unemployment Rate in Kuttawa is 4.9%.