Wurtland, KY Map & Demographics
Wurtland Map
Wurtland Overview
$22,342
PER CAPITA INCOME
$58,750
AVG FAMILY INCOME
$43,654
AVG HOUSEHOLD INCOME
14.3%
WAGE / INCOME GAP [ % ]
85.7¢/ $1
WAGE / INCOME GAP [ $ ]
$9,442
FAMILY INCOME DEFICIT
0.43
INEQUALITY / GINI INDEX
1,133
TOTAL POPULATION
580
MALE POPULATION
553
FEMALE POPULATION
104.88
MALES / 100 FEMALES
95.34
FEMALES / 100 MALES
39.7
MEDIAN AGE
3.4
AVG FAMILY SIZE
2.7
AVG HOUSEHOLD SIZE
402
LABOR FORCE [ PEOPLE ]
40.1%
PERCENT IN LABOR FORCE
5.7%
UNEMPLOYMENT RATE
Wurtland Area Codes
Income in Wurtland
Income Overview in Wurtland
Per Capita Income in Wurtland is $22,342, while median incomes of families and households are $58,750 and $43,654 respectively.
| Characteristic | Number | Measure |
| Per Capita Income | 1,133 | $22,342 |
| Median Family Income | 247 | $58,750 |
| Mean Family Income | 247 | $72,399 |
| Median Household Income | 372 | $43,654 |
| Mean Household Income | 372 | $62,979 |
| Income Deficit | 247 | $9,442 |
| Wage / Income Gap (%) | 1,133 | 14.27% |
| Wage / Income Gap ($) | 1,133 | 85.73¢ per $1 |
| Gini / Inequality Index | 1,133 | 0.43 |
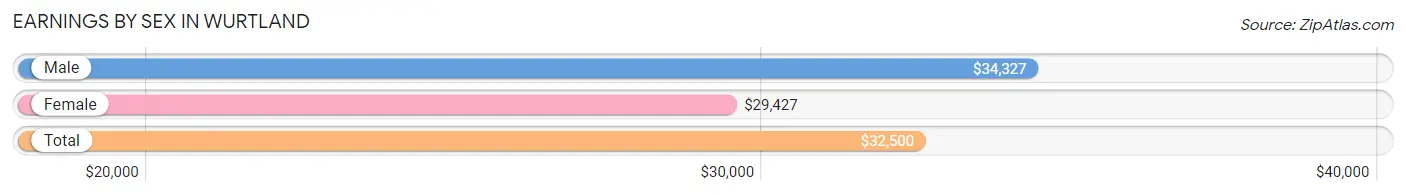
Earnings by Sex in Wurtland
Average Earnings in Wurtland are $32,500, $34,327 for men and $29,427 for women, a difference of 14.3%.
| Sex | Number | Average Earnings |
| Male | 225 (49.8%) | $34,327 |
| Female | 227 (50.2%) | $29,427 |
| Total | 452 (100.0%) | $32,500 |
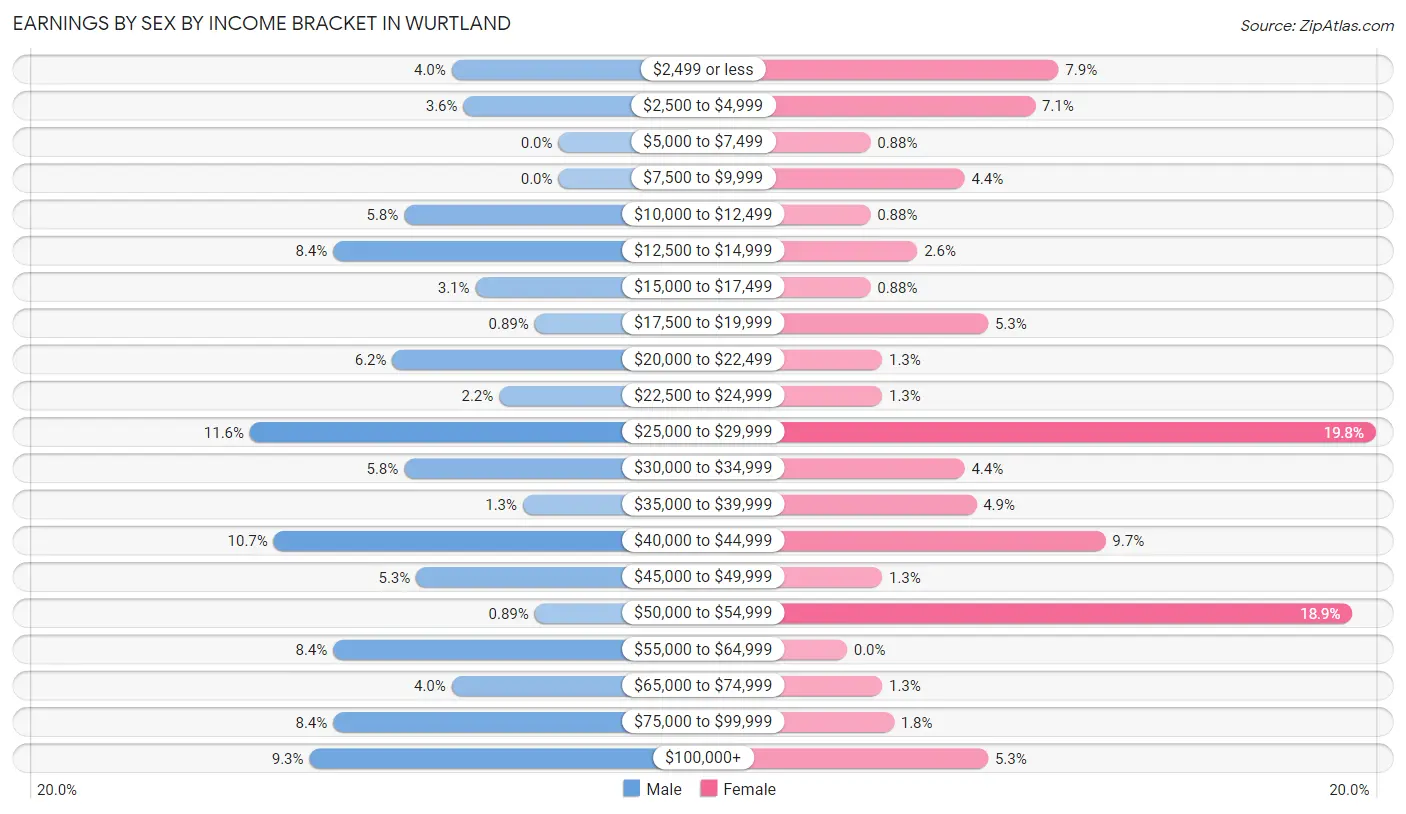
Earnings by Sex by Income Bracket in Wurtland
The most common earnings brackets in Wurtland are $25,000 to $29,999 for men (26 | 11.6%) and $25,000 to $29,999 for women (45 | 19.8%).
| Income | Male | Female |
| $2,499 or less | 9 (4.0%) | 18 (7.9%) |
| $2,500 to $4,999 | 8 (3.6%) | 16 (7.0%) |
| $5,000 to $7,499 | 0 (0.0%) | 2 (0.9%) |
| $7,500 to $9,999 | 0 (0.0%) | 10 (4.4%) |
| $10,000 to $12,499 | 13 (5.8%) | 2 (0.9%) |
| $12,500 to $14,999 | 19 (8.4%) | 6 (2.6%) |
| $15,000 to $17,499 | 7 (3.1%) | 2 (0.9%) |
| $17,500 to $19,999 | 2 (0.9%) | 12 (5.3%) |
| $20,000 to $22,499 | 14 (6.2%) | 3 (1.3%) |
| $22,500 to $24,999 | 5 (2.2%) | 3 (1.3%) |
| $25,000 to $29,999 | 26 (11.6%) | 45 (19.8%) |
| $30,000 to $34,999 | 13 (5.8%) | 10 (4.4%) |
| $35,000 to $39,999 | 3 (1.3%) | 11 (4.9%) |
| $40,000 to $44,999 | 24 (10.7%) | 22 (9.7%) |
| $45,000 to $49,999 | 12 (5.3%) | 3 (1.3%) |
| $50,000 to $54,999 | 2 (0.9%) | 43 (18.9%) |
| $55,000 to $64,999 | 19 (8.4%) | 0 (0.0%) |
| $65,000 to $74,999 | 9 (4.0%) | 3 (1.3%) |
| $75,000 to $99,999 | 19 (8.4%) | 4 (1.8%) |
| $100,000+ | 21 (9.3%) | 12 (5.3%) |
| Total | 225 (100.0%) | 227 (100.0%) |
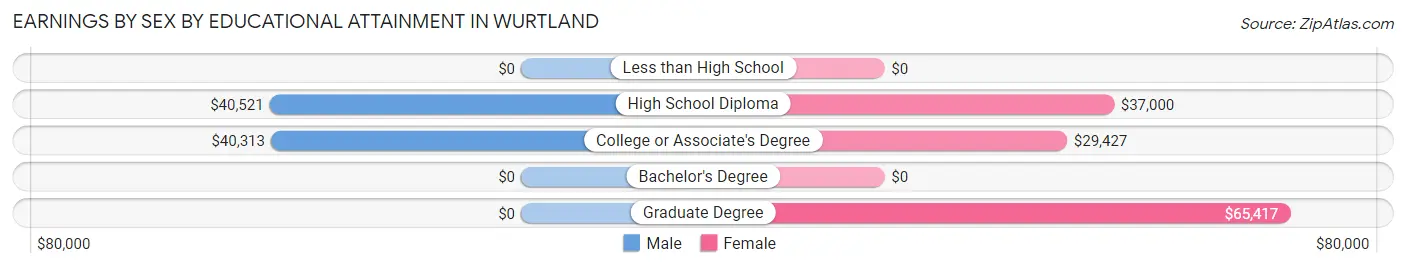
Earnings by Sex by Educational Attainment in Wurtland
Average earnings in Wurtland are $36,250 for men and $33,333 for women, a difference of 8.1%. Men with an educational attainment of high school diploma enjoy the highest average annual earnings of $40,521, while those with college or associate's degree education earn the least with $40,313. Women with an educational attainment of graduate degree earn the most with the average annual earnings of $65,417, while those with college or associate's degree education have the smallest earnings of $29,427.
| Educational Attainment | Male Income | Female Income |
| Less than High School | - | - |
| High School Diploma | $40,521 | $37,000 |
| College or Associate's Degree | $40,313 | $29,427 |
| Bachelor's Degree | - | - |
| Graduate Degree | - | - |
| Total | $36,250 | $33,333 |
Family Income in Wurtland
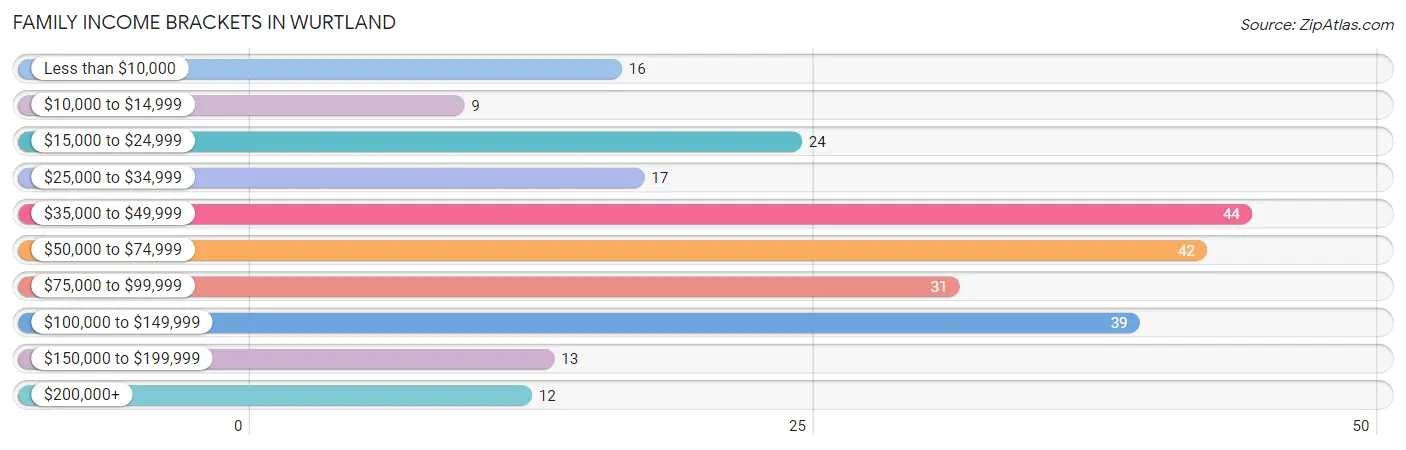
Family Income Brackets in Wurtland
According to the Wurtland family income data, there are 44 families falling into the $35,000 to $49,999 income range, which is the most common income bracket and makes up 17.8% of all families. Conversely, the $10,000 to $14,999 income bracket is the least frequent group with only 9 families (3.6%) belonging to this category.
| Income Bracket | # Families | % Families |
| Less than $10,000 | 16 | 6.5% |
| $10,000 to $14,999 | 9 | 3.6% |
| $15,000 to $24,999 | 24 | 9.7% |
| $25,000 to $34,999 | 17 | 6.9% |
| $35,000 to $49,999 | 44 | 17.8% |
| $50,000 to $74,999 | 42 | 17.0% |
| $75,000 to $99,999 | 31 | 12.6% |
| $100,000 to $149,999 | 39 | 15.8% |
| $150,000 to $199,999 | 13 | 5.3% |
| $200,000+ | 12 | 4.9% |
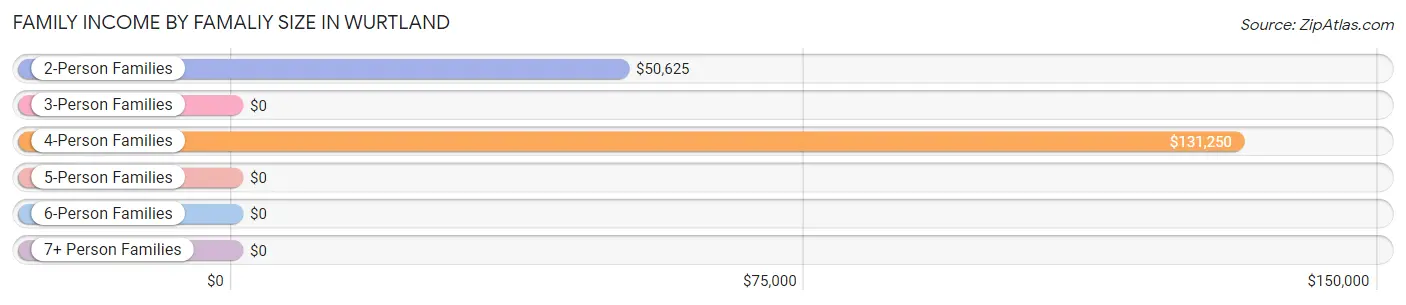
Family Income by Famaliy Size in Wurtland
4-person families (41 | 16.6%) account for the highest median family income in Wurtland with $131,250 per family, while 4-person families (41 | 16.6%) have the highest median income of $32,812 per family member.
| Income Bracket | # Families | Median Income |
| 2-Person Families | 147 (59.5%) | $50,625 |
| 3-Person Families | 31 (12.6%) | $0 |
| 4-Person Families | 41 (16.6%) | $131,250 |
| 5-Person Families | 28 (11.3%) | $0 |
| 6-Person Families | 0 (0.0%) | $0 |
| 7+ Person Families | 0 (0.0%) | $0 |
| Total | 247 (100.0%) | $58,750 |
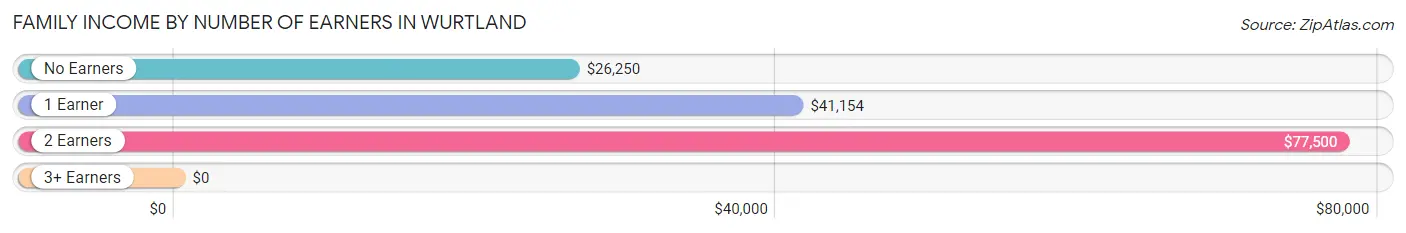
Family Income by Number of Earners in Wurtland
| Number of Earners | # Families | Median Income |
| No Earners | 44 (17.8%) | $26,250 |
| 1 Earner | 86 (34.8%) | $41,154 |
| 2 Earners | 104 (42.1%) | $77,500 |
| 3+ Earners | 13 (5.3%) | $0 |
| Total | 247 (100.0%) | $58,750 |
Household Income in Wurtland
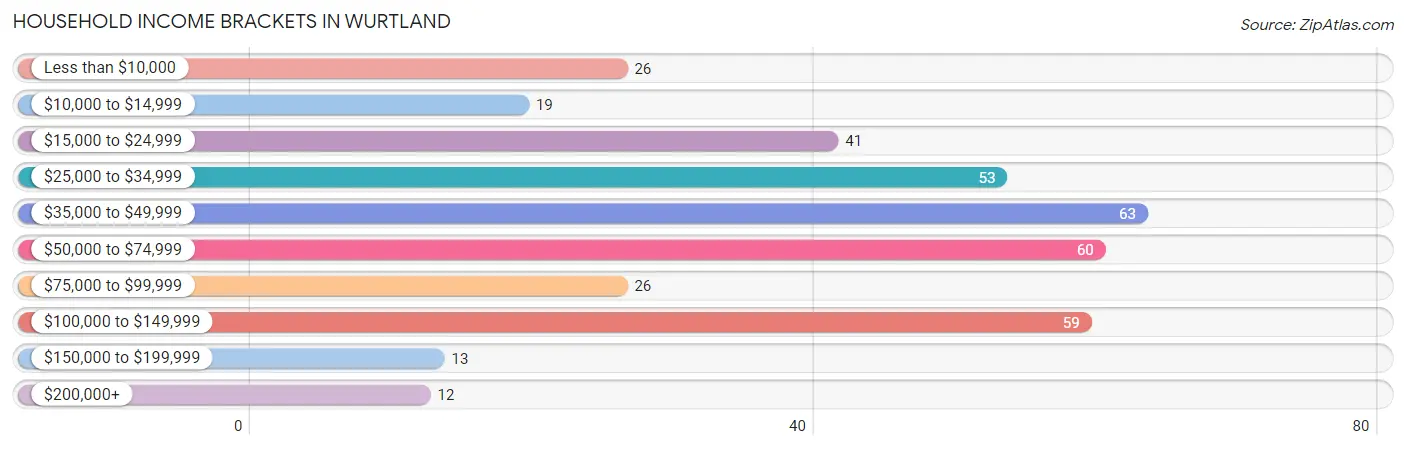
Household Income Brackets in Wurtland
With 63 households falling in the category, the $35,000 to $49,999 income range is the most frequent in Wurtland, accounting for 16.9% of all households. In contrast, only 12 households (3.2%) fall into the $200,000+ income bracket, making it the least populous group.
| Income Bracket | # Households | % Households |
| Less than $10,000 | 26 | 7.0% |
| $10,000 to $14,999 | 19 | 5.1% |
| $15,000 to $24,999 | 41 | 11.0% |
| $25,000 to $34,999 | 53 | 14.2% |
| $35,000 to $49,999 | 63 | 16.9% |
| $50,000 to $74,999 | 60 | 16.1% |
| $75,000 to $99,999 | 26 | 7.0% |
| $100,000 to $149,999 | 59 | 15.9% |
| $150,000 to $199,999 | 13 | 3.5% |
| $200,000+ | 12 | 3.2% |
Household Income by Householder Age in Wurtland
The median household income in Wurtland is $43,654, with the highest median household income of $64,583 found in the 25 to 44 years age bracket for the primary householder. A total of 99 households (26.6%) fall into this category. Meanwhile, the 15 to 24 years age bracket for the primary householder has the lowest median household income of $0, with 7 households (1.9%) in this group.
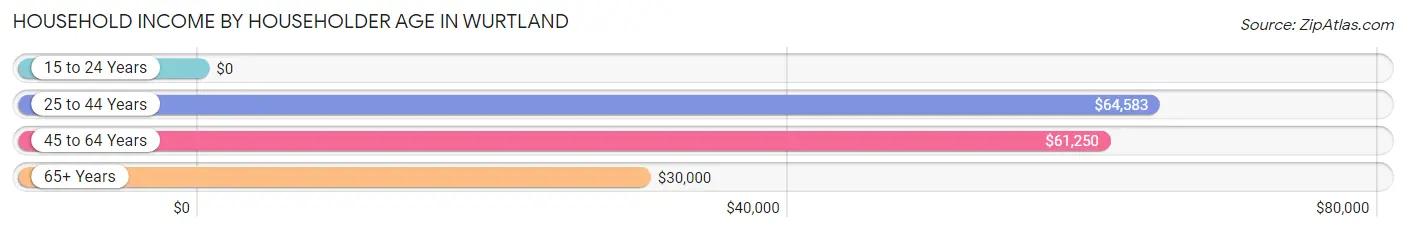
| Income Bracket | # Households | Median Income |
| 15 to 24 Years | 7 (1.9%) | $0 |
| 25 to 44 Years | 99 (26.6%) | $64,583 |
| 45 to 64 Years | 148 (39.8%) | $61,250 |
| 65+ Years | 118 (31.7%) | $30,000 |
| Total | 372 (100.0%) | $43,654 |
Poverty in Wurtland
Income Below Poverty by Sex and Age in Wurtland
With 39.9% poverty level for males and 23.2% for females among the residents of Wurtland, 16 and 17 year old males and 5 year old females are the most vulnerable to poverty, with 142 males (98.6%) and 3 females (100.0%) in their respective age groups living below the poverty level.
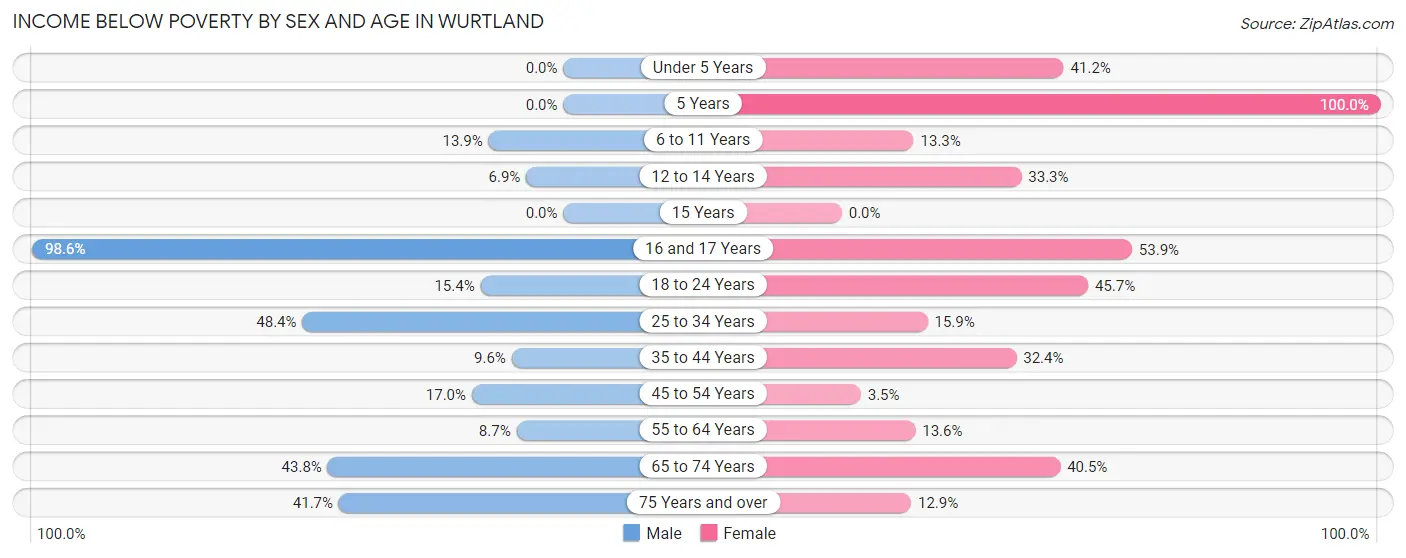
| Age Bracket | Male | Female |
| Under 5 Years | 0 (0.0%) | 7 (41.2%) |
| 5 Years | 0 (0.0%) | 3 (100.0%) |
| 6 to 11 Years | 5 (13.9%) | 2 (13.3%) |
| 12 to 14 Years | 2 (6.9%) | 2 (33.3%) |
| 15 Years | 0 (0.0%) | 0 (0.0%) |
| 16 and 17 Years | 142 (98.6%) | 14 (53.8%) |
| 18 to 24 Years | 4 (15.4%) | 16 (45.7%) |
| 25 to 34 Years | 31 (48.4%) | 7 (15.9%) |
| 35 to 44 Years | 7 (9.6%) | 23 (32.4%) |
| 45 to 54 Years | 9 (17.0%) | 3 (3.5%) |
| 55 to 64 Years | 6 (8.7%) | 9 (13.6%) |
| 65 to 74 Years | 7 (43.8%) | 15 (40.5%) |
| 75 Years and over | 5 (41.7%) | 9 (12.9%) |
| Total | 218 (39.9%) | 110 (23.2%) |
Income Above Poverty by Sex and Age in Wurtland
According to the poverty statistics in Wurtland, males aged under 5 years and females aged 45 to 54 years are the age groups that are most secure financially, with 100.0% of males and 96.5% of females in these age groups living above the poverty line.
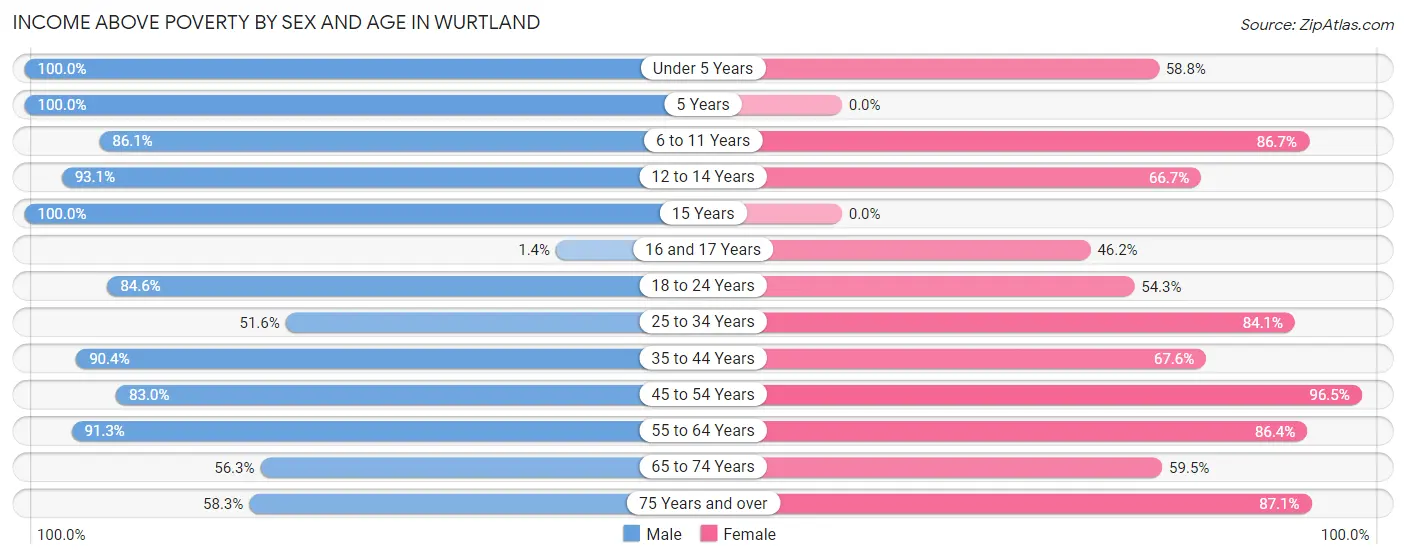
| Age Bracket | Male | Female |
| Under 5 Years | 19 (100.0%) | 10 (58.8%) |
| 5 Years | 4 (100.0%) | 0 (0.0%) |
| 6 to 11 Years | 31 (86.1%) | 13 (86.7%) |
| 12 to 14 Years | 27 (93.1%) | 4 (66.7%) |
| 15 Years | 1 (100.0%) | 0 (0.0%) |
| 16 and 17 Years | 2 (1.4%) | 12 (46.2%) |
| 18 to 24 Years | 22 (84.6%) | 19 (54.3%) |
| 25 to 34 Years | 33 (51.6%) | 37 (84.1%) |
| 35 to 44 Years | 66 (90.4%) | 48 (67.6%) |
| 45 to 54 Years | 44 (83.0%) | 82 (96.5%) |
| 55 to 64 Years | 63 (91.3%) | 57 (86.4%) |
| 65 to 74 Years | 9 (56.2%) | 22 (59.5%) |
| 75 Years and over | 7 (58.3%) | 61 (87.1%) |
| Total | 328 (60.1%) | 365 (76.8%) |
Income Below Poverty Among Married-Couple Families in Wurtland
The poverty statistics for married-couple families in Wurtland show that 19.3% or 31 of the total 161 families live below the poverty line. Families with 3 or 4 children have the highest poverty rate of 23.8%, comprising of 5 families. On the other hand, families with 1 or 2 children have the lowest poverty rate of 10.9%, which includes 5 families.
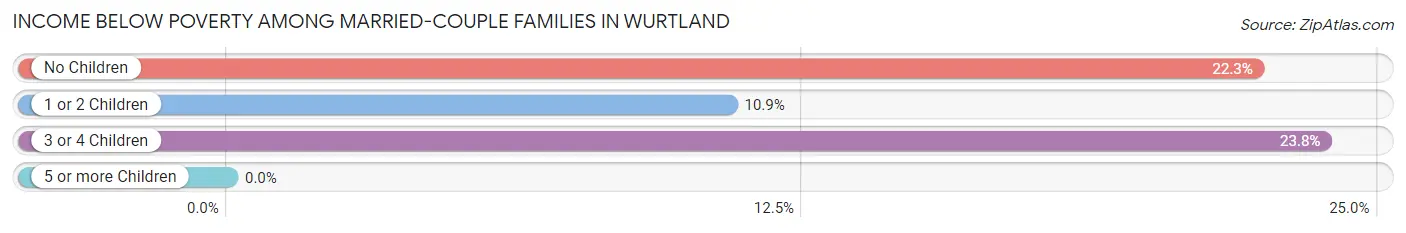
| Children | Above Poverty | Below Poverty |
| No Children | 73 (77.7%) | 21 (22.3%) |
| 1 or 2 Children | 41 (89.1%) | 5 (10.9%) |
| 3 or 4 Children | 16 (76.2%) | 5 (23.8%) |
| 5 or more Children | 0 (0.0%) | 0 (0.0%) |
| Total | 130 (80.7%) | 31 (19.3%) |
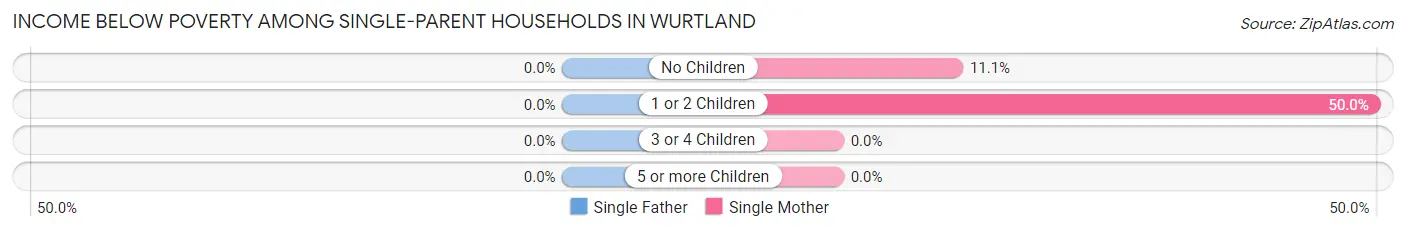
Income Below Poverty Among Single-Parent Households in Wurtland
| Children | Single Father | Single Mother |
| No Children | 0 (0.0%) | 4 (11.1%) |
| 1 or 2 Children | 0 (0.0%) | 15 (50.0%) |
| 3 or 4 Children | 0 (0.0%) | 0 (0.0%) |
| 5 or more Children | 0 (0.0%) | 0 (0.0%) |
| Total | 0 (0.0%) | 19 (28.8%) |
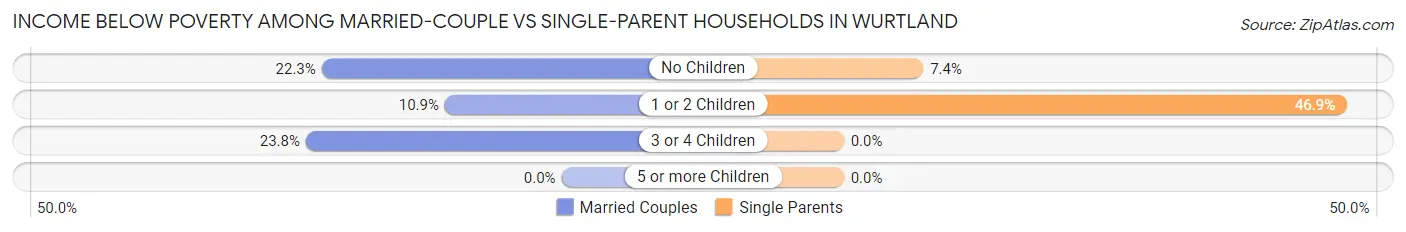
Income Below Poverty Among Married-Couple vs Single-Parent Households in Wurtland
The poverty data for Wurtland shows that 31 of the married-couple family households (19.3%) and 19 of the single-parent households (22.1%) are living below the poverty level. Within the married-couple family households, those with 3 or 4 children have the highest poverty rate, with 5 households (23.8%) falling below the poverty line. Among the single-parent households, those with 1 or 2 children have the highest poverty rate, with 15 household (46.9%) living below poverty.
| Children | Married-Couple Families | Single-Parent Households |
| No Children | 21 (22.3%) | 4 (7.4%) |
| 1 or 2 Children | 5 (10.9%) | 15 (46.9%) |
| 3 or 4 Children | 5 (23.8%) | 0 (0.0%) |
| 5 or more Children | 0 (0.0%) | 0 (0.0%) |
| Total | 31 (19.3%) | 19 (22.1%) |
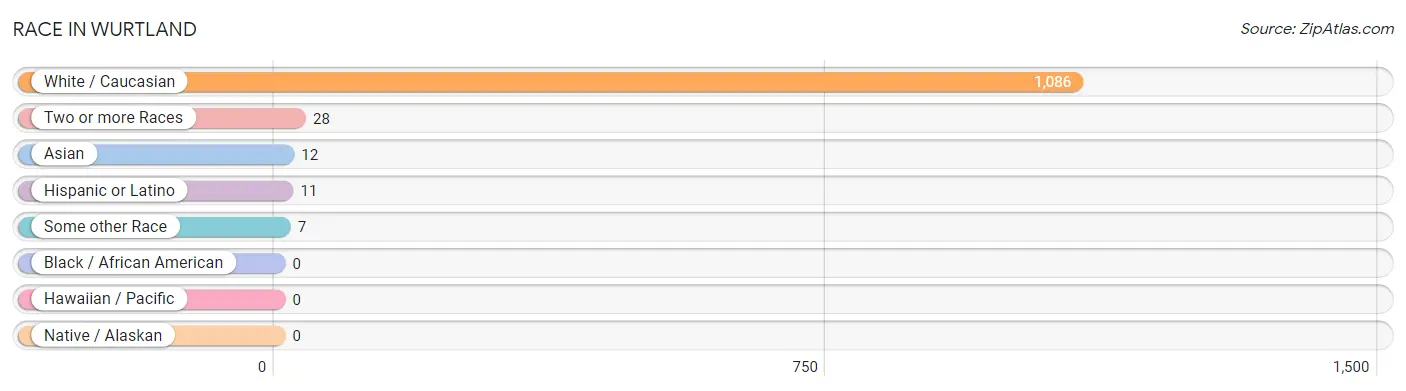
Race in Wurtland
The most populous races in Wurtland are White / Caucasian (1,086 | 95.9%), Two or more Races (28 | 2.5%), and Asian (12 | 1.1%).
| Race | # Population | % Population |
| Asian | 12 | 1.1% |
| Black / African American | 0 | 0.0% |
| Hawaiian / Pacific | 0 | 0.0% |
| Hispanic or Latino | 11 | 1.0% |
| Native / Alaskan | 0 | 0.0% |
| White / Caucasian | 1,086 | 95.9% |
| Two or more Races | 28 | 2.5% |
| Some other Race | 7 | 0.6% |
| Total | 1,133 | 100.0% |
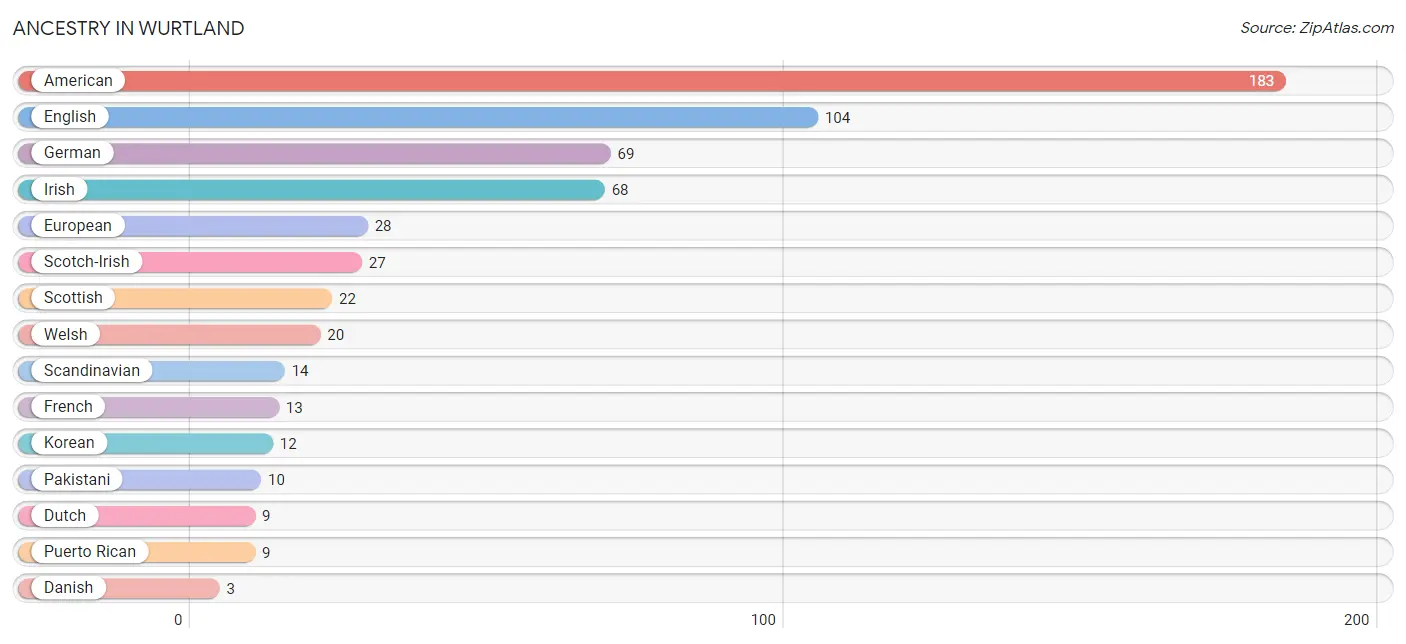
Ancestry in Wurtland
The most populous ancestries reported in Wurtland are American (183 | 16.2%), English (104 | 9.2%), German (69 | 6.1%), Irish (68 | 6.0%), and European (28 | 2.5%), together accounting for 39.9% of all Wurtland residents.
| Ancestry | # Population | % Population |
| American | 183 | 16.2% |
| Cuban | 2 | 0.2% |
| Danish | 3 | 0.3% |
| Dutch | 9 | 0.8% |
| Eastern European | 3 | 0.3% |
| English | 104 | 9.2% |
| European | 28 | 2.5% |
| French | 13 | 1.1% |
| German | 69 | 6.1% |
| Irish | 68 | 6.0% |
| Korean | 12 | 1.1% |
| Pakistani | 10 | 0.9% |
| Polish | 3 | 0.3% |
| Puerto Rican | 9 | 0.8% |
| Scandinavian | 14 | 1.2% |
| Scotch-Irish | 27 | 2.4% |
| Scottish | 22 | 1.9% |
| Swedish | 3 | 0.3% |
| Swiss | 3 | 0.3% |
| Welsh | 20 | 1.8% | View All 20 Rows |
Immigrants in Wurtland
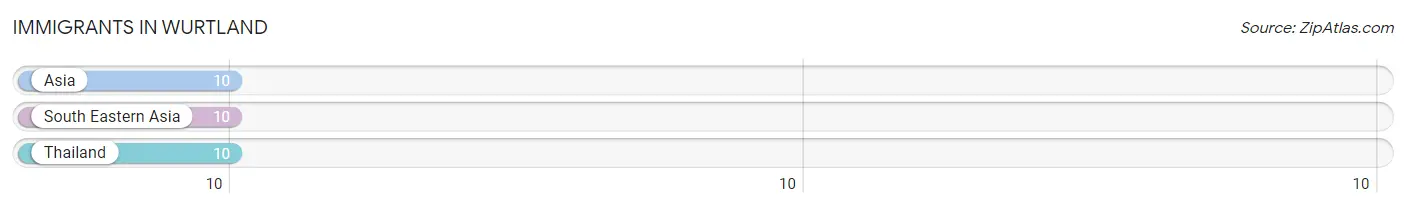
The most numerous immigrant groups reported in Wurtland came from Asia (10 | 0.9%), South Eastern Asia (10 | 0.9%), and Thailand (10 | 0.9%), together accounting for 2.6% of all Wurtland residents.
| Immigration Origin | # Population | % Population |
| Asia | 10 | 0.9% |
| South Eastern Asia | 10 | 0.9% |
| Thailand | 10 | 0.9% | View All 3 Rows |
Sex and Age in Wurtland
Sex and Age in Wurtland
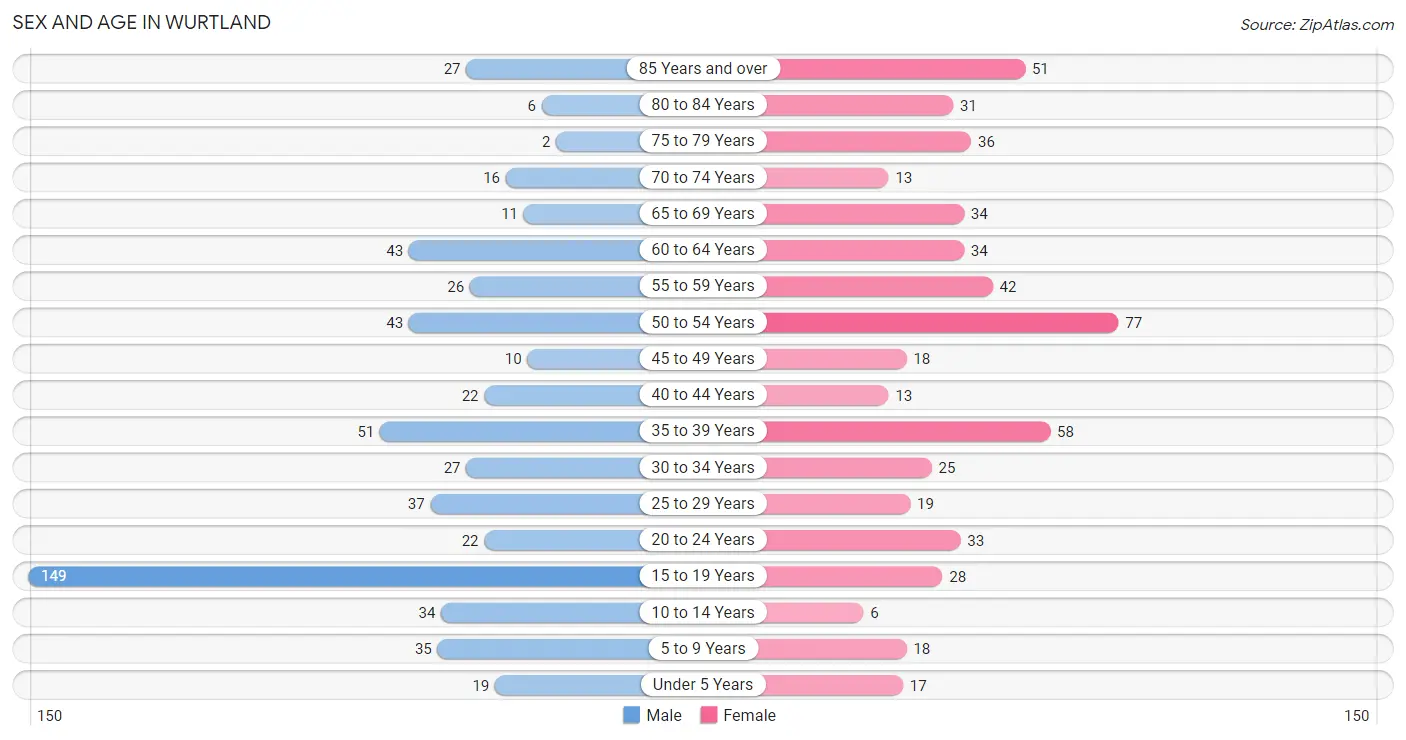
The most populous age groups in Wurtland are 15 to 19 Years (149 | 25.7%) for men and 50 to 54 Years (77 | 13.9%) for women.
| Age Bracket | Male | Female |
| Under 5 Years | 19 (3.3%) | 17 (3.1%) |
| 5 to 9 Years | 35 (6.0%) | 18 (3.3%) |
| 10 to 14 Years | 34 (5.9%) | 6 (1.1%) |
| 15 to 19 Years | 149 (25.7%) | 28 (5.1%) |
| 20 to 24 Years | 22 (3.8%) | 33 (6.0%) |
| 25 to 29 Years | 37 (6.4%) | 19 (3.4%) |
| 30 to 34 Years | 27 (4.7%) | 25 (4.5%) |
| 35 to 39 Years | 51 (8.8%) | 58 (10.5%) |
| 40 to 44 Years | 22 (3.8%) | 13 (2.4%) |
| 45 to 49 Years | 10 (1.7%) | 18 (3.3%) |
| 50 to 54 Years | 43 (7.4%) | 77 (13.9%) |
| 55 to 59 Years | 26 (4.5%) | 42 (7.6%) |
| 60 to 64 Years | 43 (7.4%) | 34 (6.1%) |
| 65 to 69 Years | 11 (1.9%) | 34 (6.1%) |
| 70 to 74 Years | 16 (2.8%) | 13 (2.4%) |
| 75 to 79 Years | 2 (0.3%) | 36 (6.5%) |
| 80 to 84 Years | 6 (1.0%) | 31 (5.6%) |
| 85 Years and over | 27 (4.7%) | 51 (9.2%) |
| Total | 580 (100.0%) | 553 (100.0%) |
Families and Households in Wurtland
Median Family Size in Wurtland
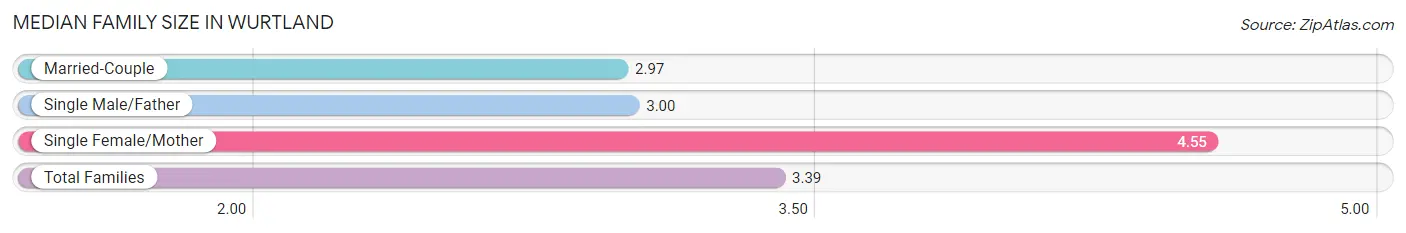
The median family size in Wurtland is 3.39 persons per family, with single female/mother families (66 | 26.7%) accounting for the largest median family size of 4.55 persons per family. On the other hand, married-couple families (161 | 65.2%) represent the smallest median family size with 2.97 persons per family.
| Family Type | # Families | Family Size |
| Married-Couple | 161 (65.2%) | 2.97 |
| Single Male/Father | 20 (8.1%) | 3.00 |
| Single Female/Mother | 66 (26.7%) | 4.55 |
| Total Families | 247 (100.0%) | 3.39 |
Median Household Size in Wurtland
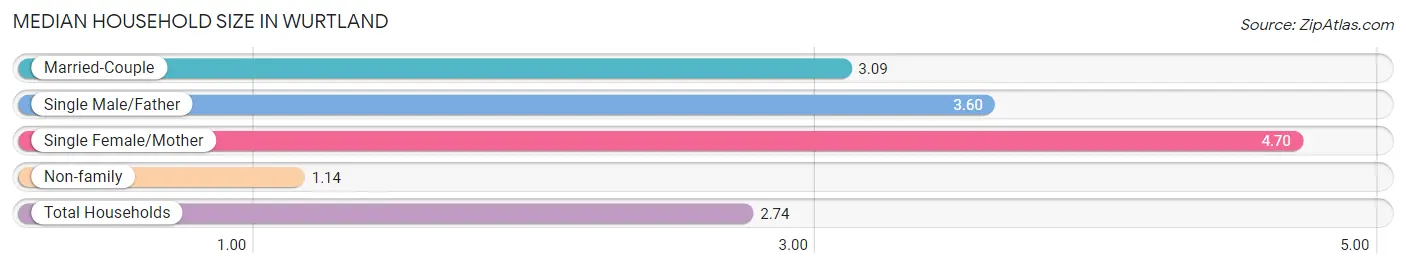
The median household size in Wurtland is 2.74 persons per household, with single female/mother households (66 | 17.7%) accounting for the largest median household size of 4.7 persons per household. non-family households (125 | 33.6%) represent the smallest median household size with 1.14 persons per household.
| Household Type | # Households | Household Size |
| Married-Couple | 161 (43.3%) | 3.09 |
| Single Male/Father | 20 (5.4%) | 3.60 |
| Single Female/Mother | 66 (17.7%) | 4.70 |
| Non-family | 125 (33.6%) | 1.14 |
| Total Households | 372 (100.0%) | 2.74 |
Household Size by Marriage Status in Wurtland
Out of a total of 372 households in Wurtland, 247 (66.4%) are family households, while 125 (33.6%) are nonfamily households. The most numerous type of family households are 2-person households, comprising 134, and the most common type of nonfamily households are 1-person households, comprising 113.
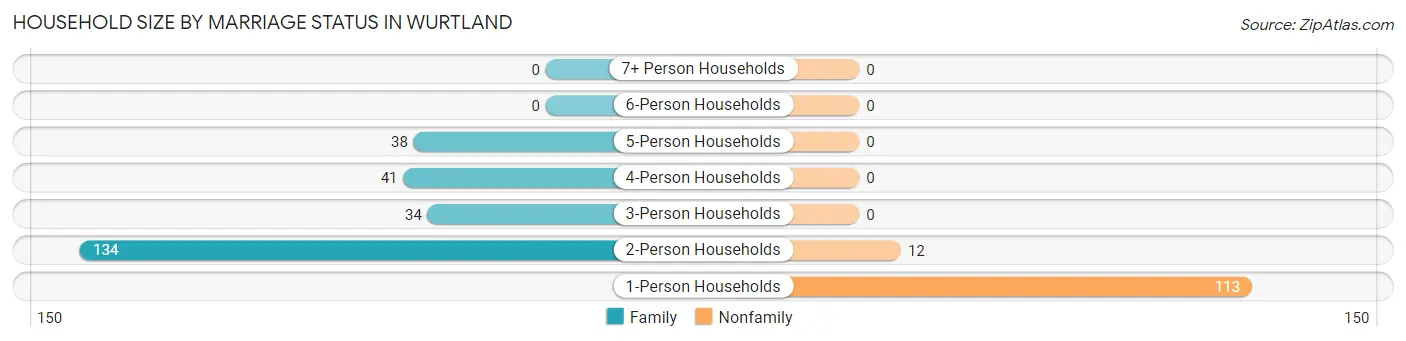
| Household Size | Family Households | Nonfamily Households |
| 1-Person Households | - | 113 (30.4%) |
| 2-Person Households | 134 (36.0%) | 12 (3.2%) |
| 3-Person Households | 34 (9.1%) | 0 (0.0%) |
| 4-Person Households | 41 (11.0%) | 0 (0.0%) |
| 5-Person Households | 38 (10.2%) | 0 (0.0%) |
| 6-Person Households | 0 (0.0%) | 0 (0.0%) |
| 7+ Person Households | 0 (0.0%) | 0 (0.0%) |
| Total | 247 (66.4%) | 125 (33.6%) |
Female Fertility in Wurtland
Fertility by Age in Wurtland
Average fertility rate in Wurtland is 10.0 births per 1,000 women. Women in the age bracket of 20 to 34 years have the highest fertility rate with 26.0 births per 1,000 women. Women in the age bracket of 20 to 34 years acount for 100.0% of all women with births.
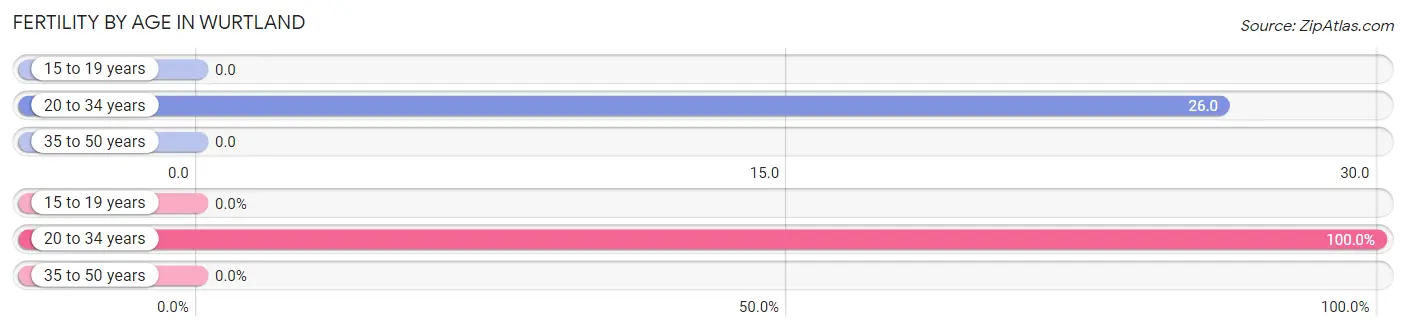
| Age Bracket | Women with Births | Births / 1,000 Women |
| 15 to 19 years | 0 (0.0%) | 0.0 |
| 20 to 34 years | 2 (100.0%) | 26.0 |
| 35 to 50 years | 0 (0.0%) | 0.0 |
| Total | 2 (100.0%) | 10.0 |
Fertility by Age by Marriage Status in Wurtland
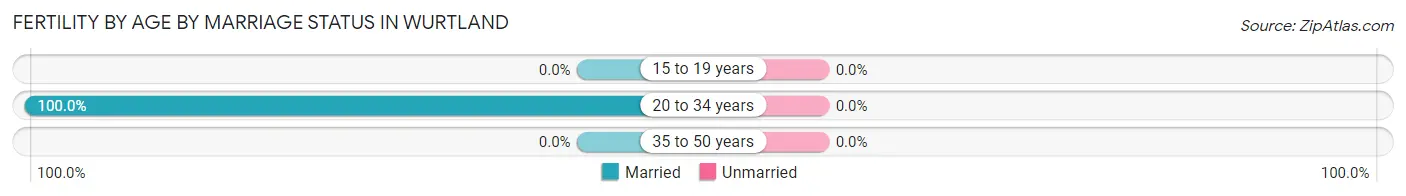
| Age Bracket | Married | Unmarried |
| 15 to 19 years | 0 (0.0%) | 0 (0.0%) |
| 20 to 34 years | 2 (100.0%) | 0 (0.0%) |
| 35 to 50 years | 0 (0.0%) | 0 (0.0%) |
| Total | 2 (100.0%) | 0 (0.0%) |
Fertility by Education in Wurtland
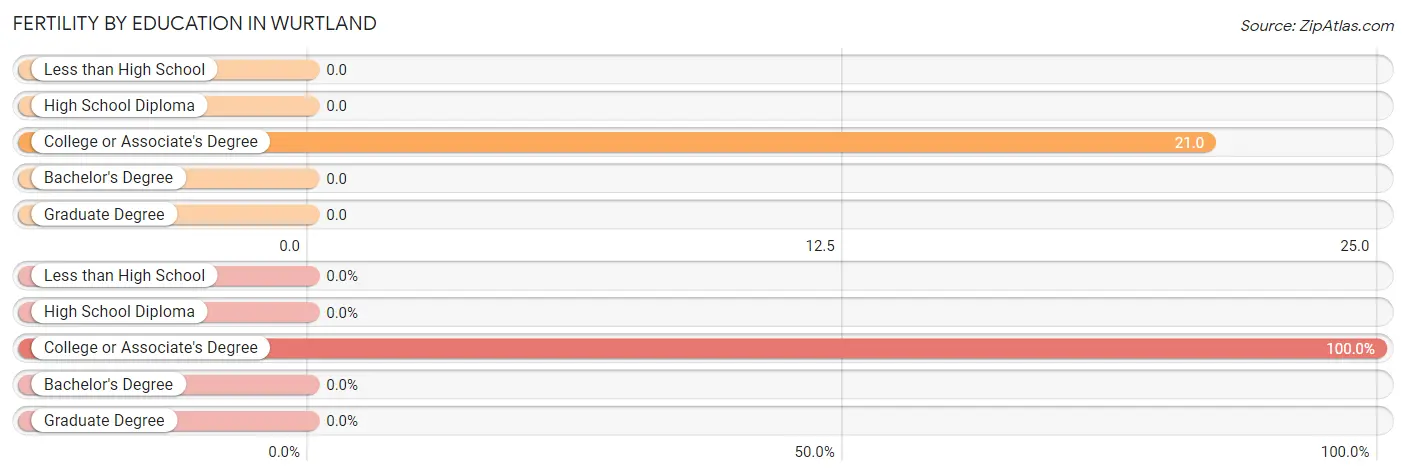
| Educational Attainment | Women with Births | Births / 1,000 Women |
| Less than High School | 0 (0.0%) | 0.0 |
| High School Diploma | 0 (0.0%) | 0.0 |
| College or Associate's Degree | 2 (100.0%) | 21.0 |
| Bachelor's Degree | 0 (0.0%) | 0.0 |
| Graduate Degree | 0 (0.0%) | 0.0 |
| Total | 2 (100.0%) | 10.0 |
Fertility by Education by Marriage Status in Wurtland
| Educational Attainment | Married | Unmarried |
| Less than High School | 0 (0.0%) | 0 (0.0%) |
| High School Diploma | 0 (0.0%) | 0 (0.0%) |
| College or Associate's Degree | 2 (100.0%) | 0 (0.0%) |
| Bachelor's Degree | 0 (0.0%) | 0 (0.0%) |
| Graduate Degree | 0 (0.0%) | 0 (0.0%) |
| Total | 2 (100.0%) | 0 (0.0%) |
Employment Characteristics in Wurtland
Employment by Class of Employer in Wurtland
Among the 368 employed individuals in Wurtland, private company employees (214 | 58.2%), not-for-profit organizations (58 | 15.8%), and self-employed (incorporated) (27 | 7.3%) make up the most common classes of employment.
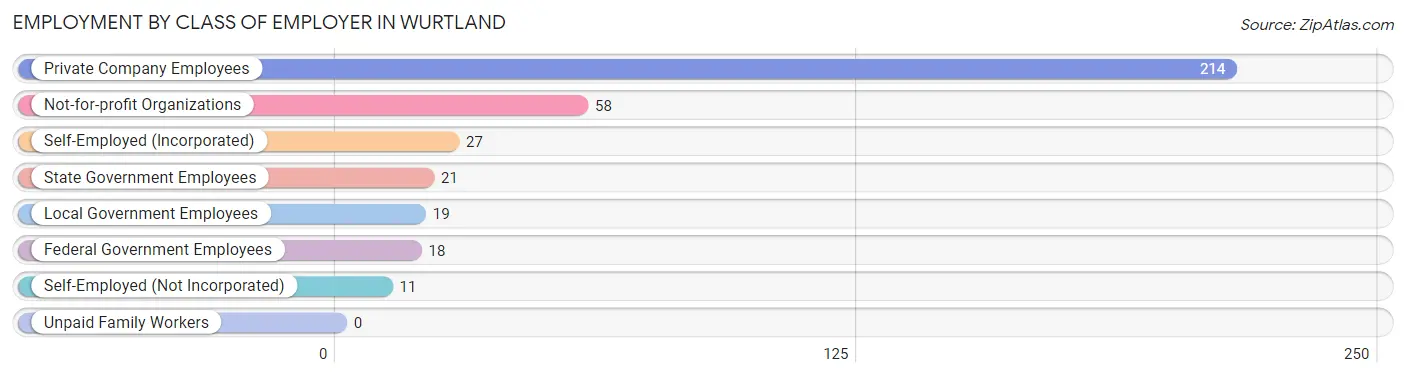
| Employer Class | # Employees | % Employees |
| Private Company Employees | 214 | 58.2% |
| Self-Employed (Incorporated) | 27 | 7.3% |
| Self-Employed (Not Incorporated) | 11 | 3.0% |
| Not-for-profit Organizations | 58 | 15.8% |
| Local Government Employees | 19 | 5.2% |
| State Government Employees | 21 | 5.7% |
| Federal Government Employees | 18 | 4.9% |
| Unpaid Family Workers | 0 | 0.0% |
| Total | 368 | 100.0% |
Employment Status by Age in Wurtland
According to the labor force statistics for Wurtland, out of the total population over 16 years of age (1,003), 40.1% or 402 individuals are in the labor force, with 5.7% or 23 of them unemployed. The age group with the highest labor force participation rate is 25 to 29 years, with 89.3% or 50 individuals in the labor force. Within the labor force, the 16 to 19 years age range has the highest percentage of unemployed individuals, with 40.0% or 4 of them being unemployed.
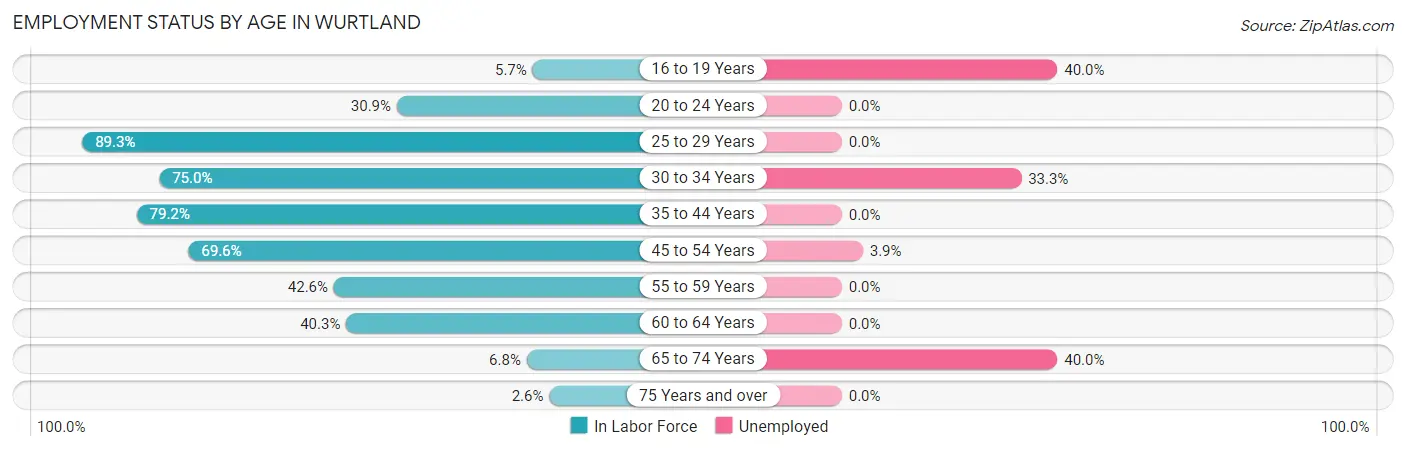
| Age Bracket | In Labor Force | Unemployed |
| 16 to 19 Years | 10 (5.7%) | 4 (40.0%) |
| 20 to 24 Years | 17 (30.9%) | 0 (0.0%) |
| 25 to 29 Years | 50 (89.3%) | 0 (0.0%) |
| 30 to 34 Years | 39 (75.0%) | 13 (33.3%) |
| 35 to 44 Years | 114 (79.2%) | 0 (0.0%) |
| 45 to 54 Years | 103 (69.6%) | 4 (3.9%) |
| 55 to 59 Years | 29 (42.6%) | 0 (0.0%) |
| 60 to 64 Years | 31 (40.3%) | 0 (0.0%) |
| 65 to 74 Years | 5 (6.8%) | 2 (40.0%) |
| 75 Years and over | 4 (2.6%) | 0 (0.0%) |
| Total | 402 (40.1%) | 23 (5.7%) |
Employment Status by Educational Attainment in Wurtland
According to labor force statistics for Wurtland, 67.2% of individuals (366) out of the total population between 25 and 64 years of age (545) are in the labor force, with 4.6% or 17 of them being unemployed. The group with the highest labor force participation rate are those with the educational attainment of college / associate degree, with 80.9% or 195 individuals in the labor force. Within the labor force, individuals with less than high school education have the highest percentage of unemployment, with 55.6% or 10 of them being unemployed.
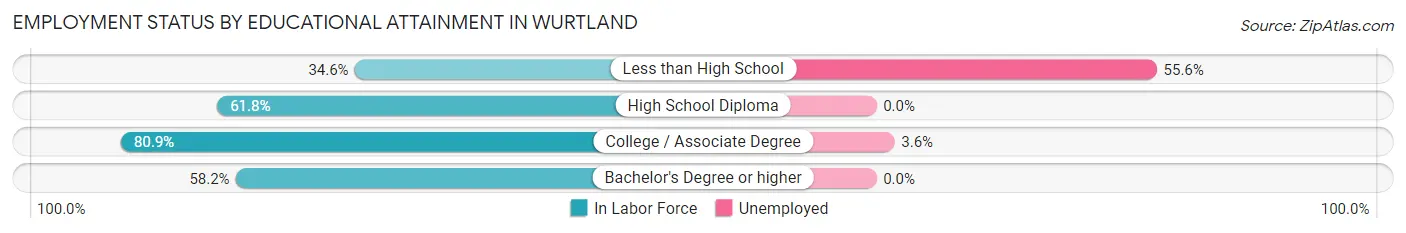
| Educational Attainment | In Labor Force | Unemployed |
| Less than High School | 18 (34.6%) | 29 (55.6%) |
| High School Diploma | 107 (61.8%) | 0 (0.0%) |
| College / Associate Degree | 195 (80.9%) | 9 (3.6%) |
| Bachelor's Degree or higher | 46 (58.2%) | 0 (0.0%) |
| Total | 366 (67.2%) | 25 (4.6%) |
Employment Occupations by Sex in Wurtland
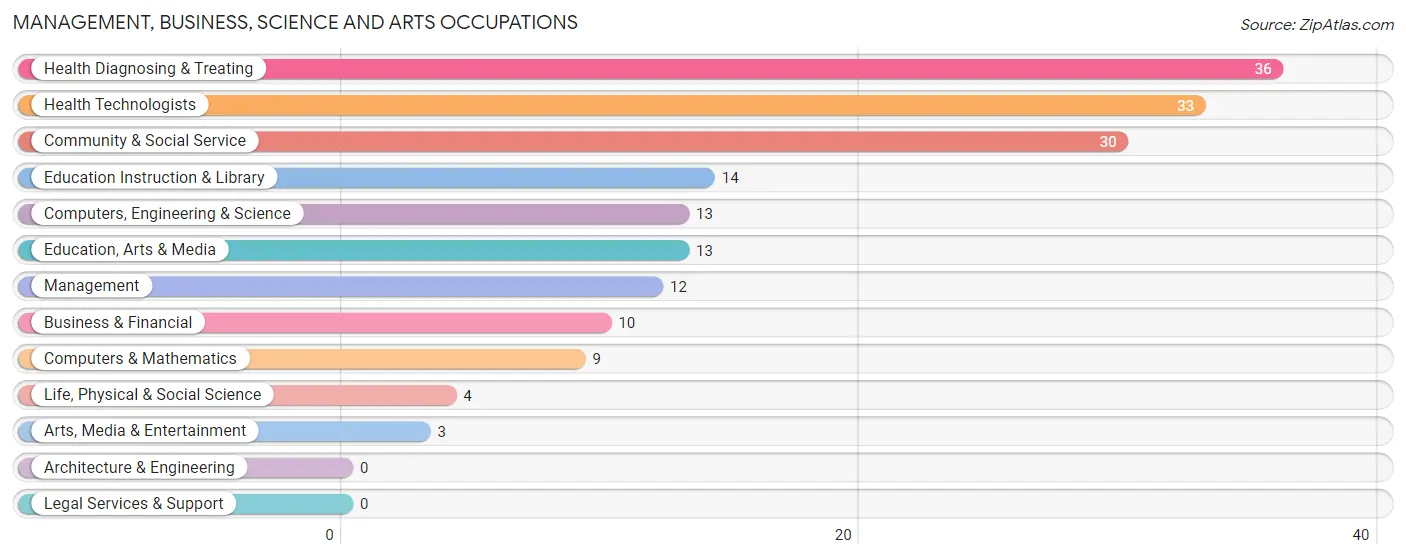
Management, Business, Science and Arts Occupations
The most common Management, Business, Science and Arts occupations in Wurtland are Health Diagnosing & Treating (36 | 9.5%), Health Technologists (33 | 8.7%), Community & Social Service (30 | 7.9%), Education Instruction & Library (14 | 3.7%), and Computers, Engineering & Science (13 | 3.4%).
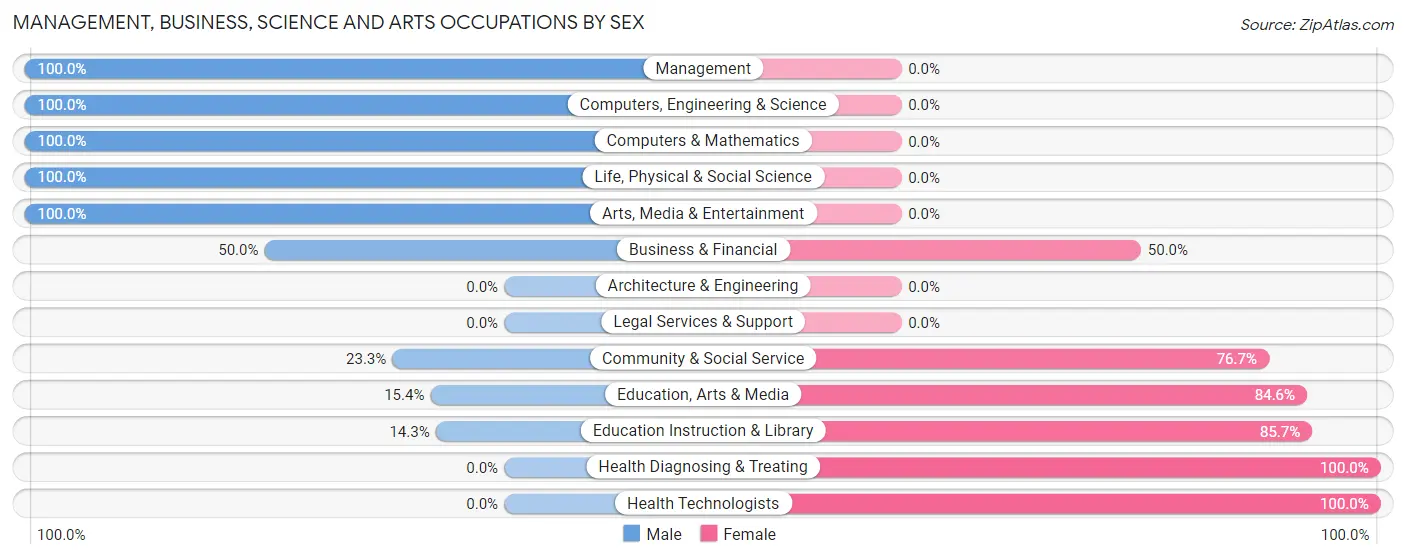
Management, Business, Science and Arts Occupations by Sex
Within the Management, Business, Science and Arts occupations in Wurtland, the most male-oriented occupations are Management (100.0%), Computers, Engineering & Science (100.0%), and Computers & Mathematics (100.0%), while the most female-oriented occupations are Health Diagnosing & Treating (100.0%), Health Technologists (100.0%), and Education Instruction & Library (85.7%).
| Occupation | Male | Female |
| Management | 12 (100.0%) | 0 (0.0%) |
| Business & Financial | 5 (50.0%) | 5 (50.0%) |
| Computers, Engineering & Science | 13 (100.0%) | 0 (0.0%) |
| Computers & Mathematics | 9 (100.0%) | 0 (0.0%) |
| Architecture & Engineering | 0 (0.0%) | 0 (0.0%) |
| Life, Physical & Social Science | 4 (100.0%) | 0 (0.0%) |
| Community & Social Service | 7 (23.3%) | 23 (76.7%) |
| Education, Arts & Media | 2 (15.4%) | 11 (84.6%) |
| Legal Services & Support | 0 (0.0%) | 0 (0.0%) |
| Education Instruction & Library | 2 (14.3%) | 12 (85.7%) |
| Arts, Media & Entertainment | 3 (100.0%) | 0 (0.0%) |
| Health Diagnosing & Treating | 0 (0.0%) | 36 (100.0%) |
| Health Technologists | 0 (0.0%) | 33 (100.0%) |
| Total (Category) | 37 (36.6%) | 64 (63.4%) |
| Total (Overall) | 210 (55.4%) | 169 (44.6%) |
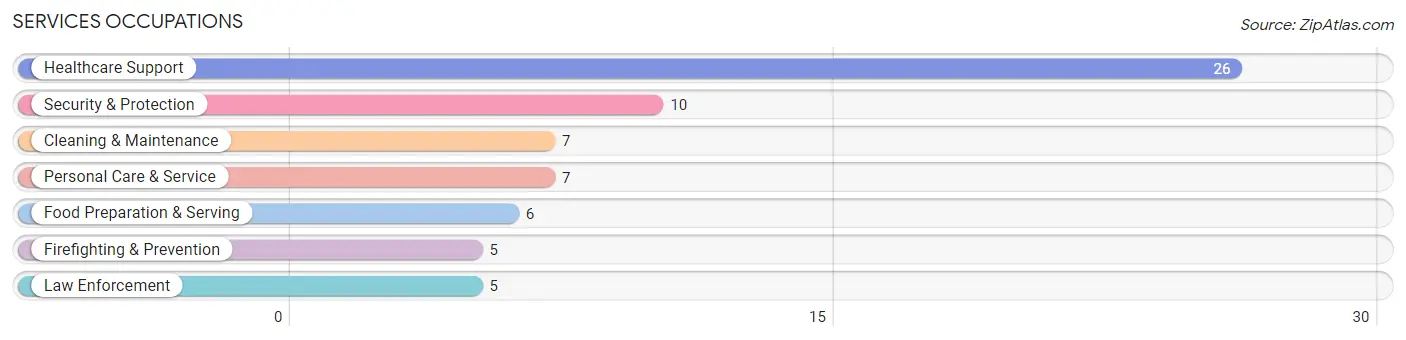
Services Occupations
The most common Services occupations in Wurtland are Healthcare Support (26 | 6.9%), Security & Protection (10 | 2.6%), Cleaning & Maintenance (7 | 1.8%), Personal Care & Service (7 | 1.8%), and Food Preparation & Serving (6 | 1.6%).
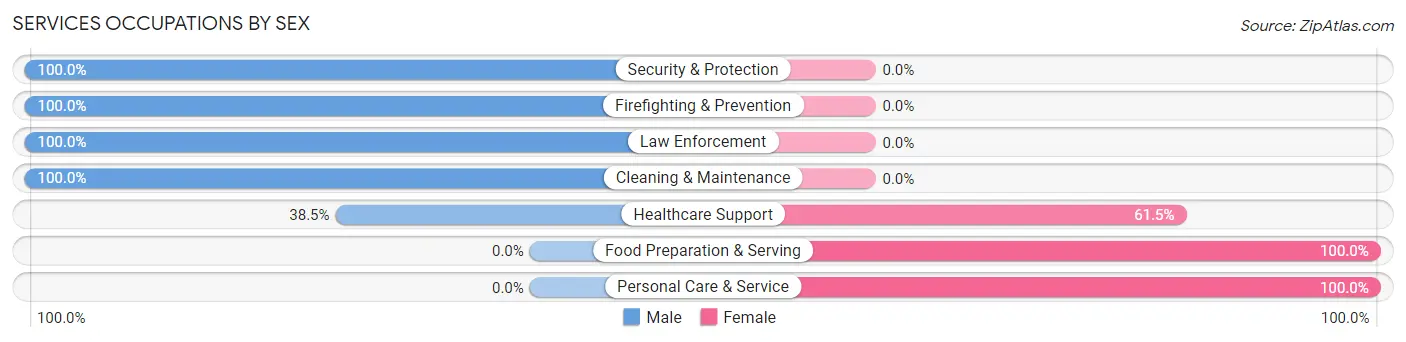
Services Occupations by Sex
Within the Services occupations in Wurtland, the most male-oriented occupations are Security & Protection (100.0%), Firefighting & Prevention (100.0%), and Law Enforcement (100.0%), while the most female-oriented occupations are Food Preparation & Serving (100.0%), Personal Care & Service (100.0%), and Healthcare Support (61.5%).
| Occupation | Male | Female |
| Healthcare Support | 10 (38.5%) | 16 (61.5%) |
| Security & Protection | 10 (100.0%) | 0 (0.0%) |
| Firefighting & Prevention | 5 (100.0%) | 0 (0.0%) |
| Law Enforcement | 5 (100.0%) | 0 (0.0%) |
| Food Preparation & Serving | 0 (0.0%) | 6 (100.0%) |
| Cleaning & Maintenance | 7 (100.0%) | 0 (0.0%) |
| Personal Care & Service | 0 (0.0%) | 7 (100.0%) |
| Total (Category) | 27 (48.2%) | 29 (51.8%) |
| Total (Overall) | 210 (55.4%) | 169 (44.6%) |
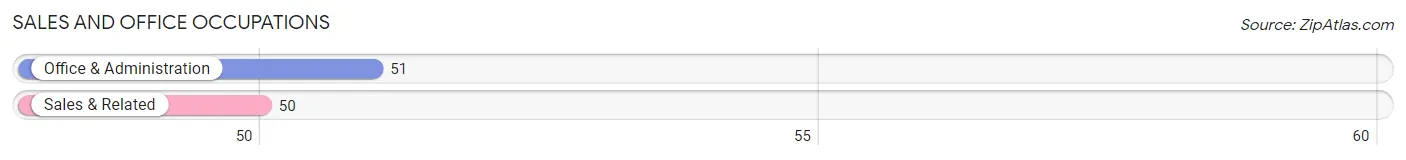
Sales and Office Occupations
The most common Sales and Office occupations in Wurtland are Office & Administration (51 | 13.5%), and Sales & Related (50 | 13.2%).
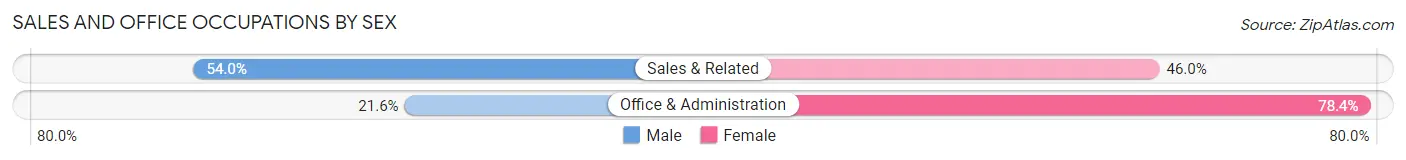
Sales and Office Occupations by Sex
| Occupation | Male | Female |
| Sales & Related | 27 (54.0%) | 23 (46.0%) |
| Office & Administration | 11 (21.6%) | 40 (78.4%) |
| Total (Category) | 38 (37.6%) | 63 (62.4%) |
| Total (Overall) | 210 (55.4%) | 169 (44.6%) |
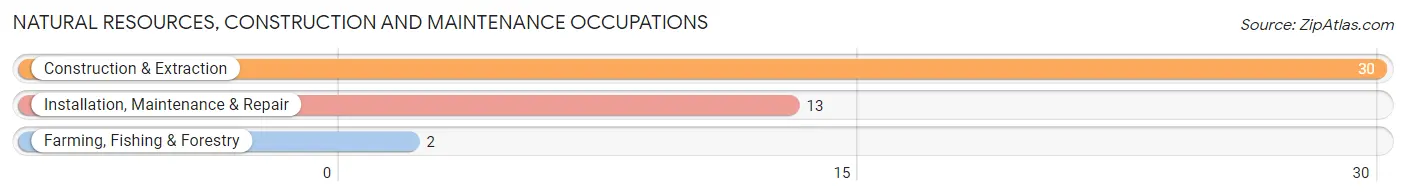
Natural Resources, Construction and Maintenance Occupations
The most common Natural Resources, Construction and Maintenance occupations in Wurtland are Construction & Extraction (30 | 7.9%), Installation, Maintenance & Repair (13 | 3.4%), and Farming, Fishing & Forestry (2 | 0.5%).
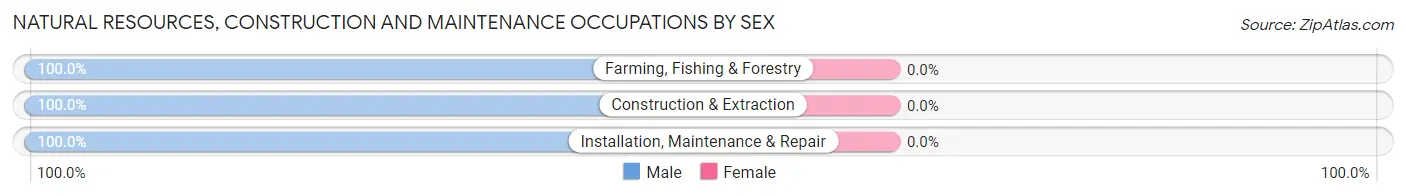
Natural Resources, Construction and Maintenance Occupations by Sex
| Occupation | Male | Female |
| Farming, Fishing & Forestry | 2 (100.0%) | 0 (0.0%) |
| Construction & Extraction | 30 (100.0%) | 0 (0.0%) |
| Installation, Maintenance & Repair | 13 (100.0%) | 0 (0.0%) |
| Total (Category) | 45 (100.0%) | 0 (0.0%) |
| Total (Overall) | 210 (55.4%) | 169 (44.6%) |
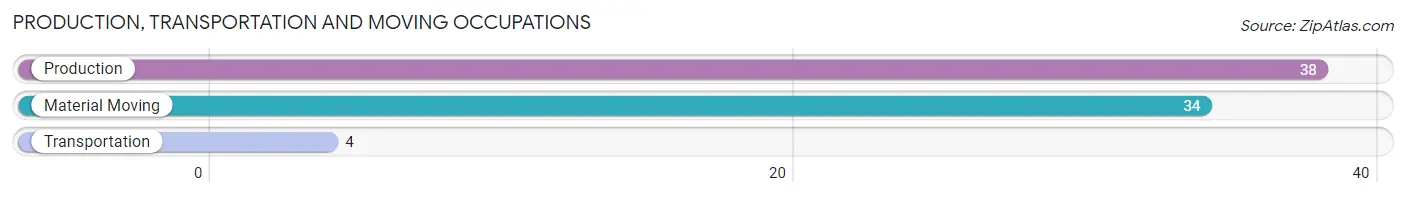
Production, Transportation and Moving Occupations
The most common Production, Transportation and Moving occupations in Wurtland are Production (38 | 10.0%), Material Moving (34 | 9.0%), and Transportation (4 | 1.1%).
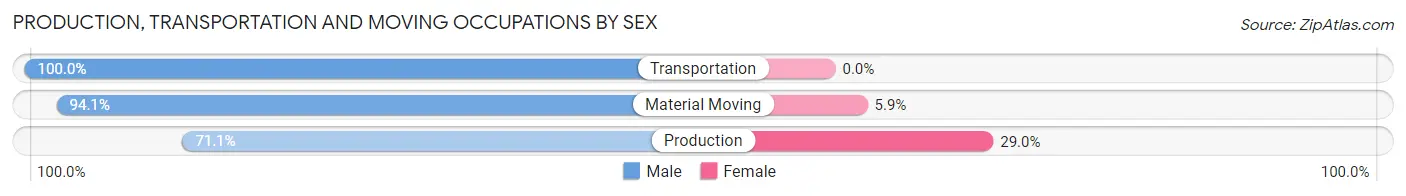
Production, Transportation and Moving Occupations by Sex
| Occupation | Male | Female |
| Production | 27 (71.1%) | 11 (28.9%) |
| Transportation | 4 (100.0%) | 0 (0.0%) |
| Material Moving | 32 (94.1%) | 2 (5.9%) |
| Total (Category) | 63 (82.9%) | 13 (17.1%) |
| Total (Overall) | 210 (55.4%) | 169 (44.6%) |
Employment Industries by Sex in Wurtland
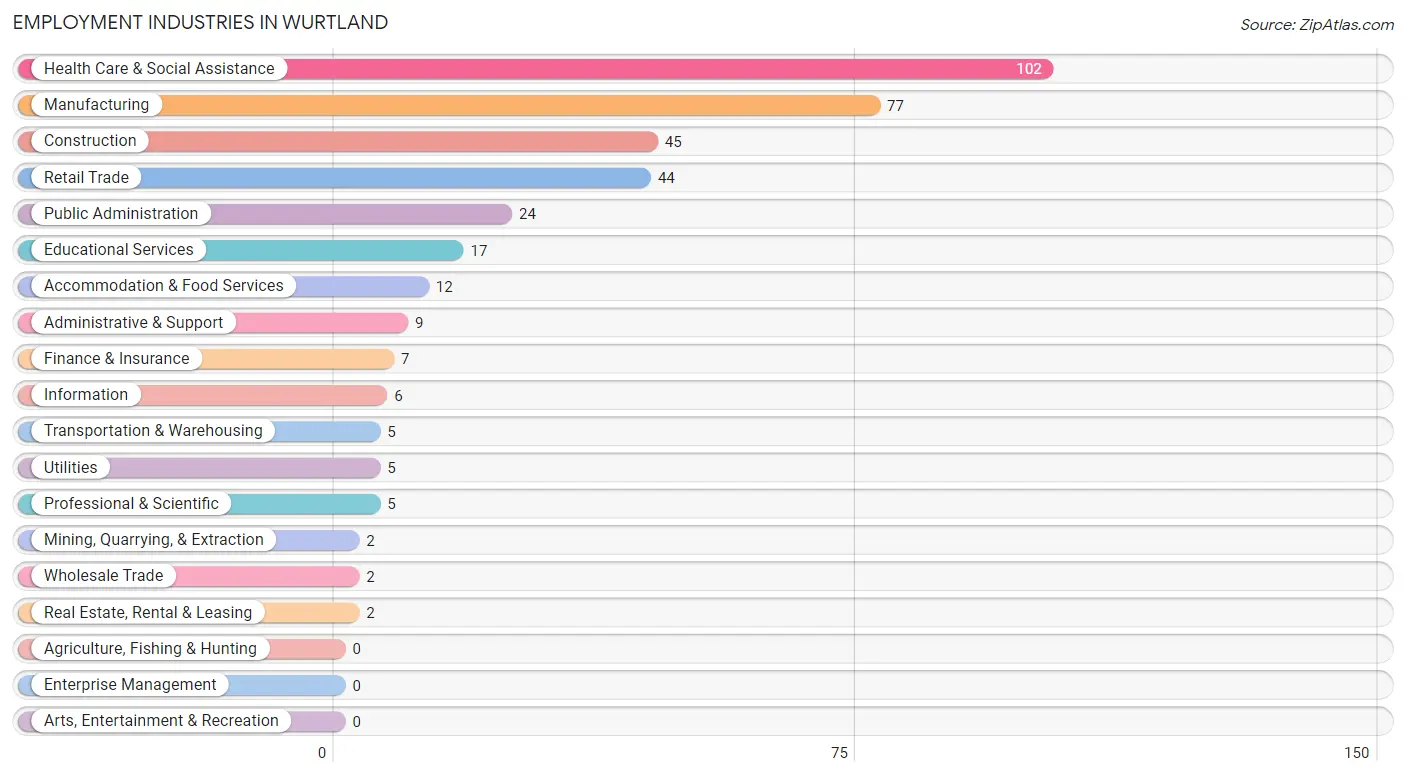
Employment Industries in Wurtland
The major employment industries in Wurtland include Health Care & Social Assistance (102 | 26.9%), Manufacturing (77 | 20.3%), Construction (45 | 11.9%), Retail Trade (44 | 11.6%), and Public Administration (24 | 6.3%).
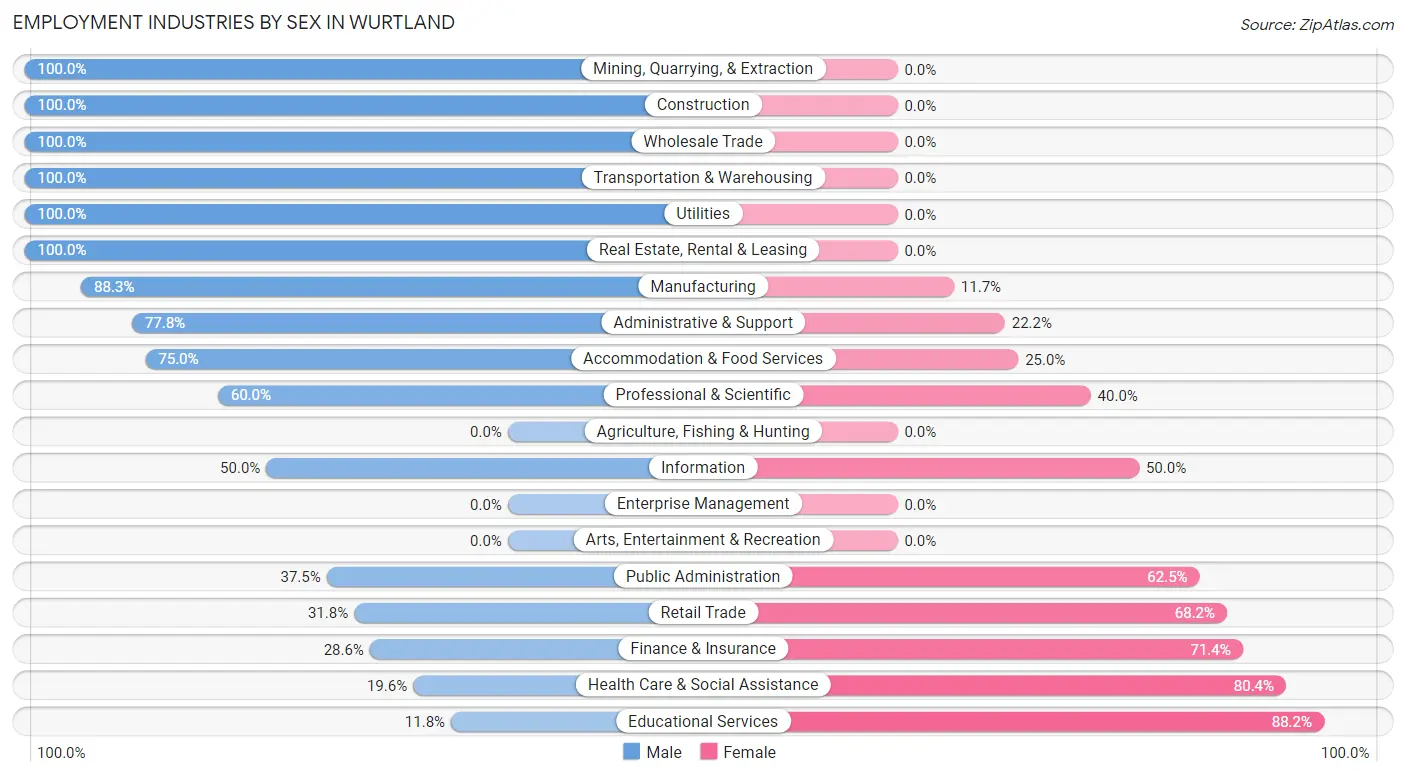
Employment Industries by Sex in Wurtland
The Wurtland industries that see more men than women are Mining, Quarrying, & Extraction (100.0%), Construction (100.0%), and Wholesale Trade (100.0%), whereas the industries that tend to have a higher number of women are Educational Services (88.2%), Health Care & Social Assistance (80.4%), and Finance & Insurance (71.4%).
| Industry | Male | Female |
| Agriculture, Fishing & Hunting | 0 (0.0%) | 0 (0.0%) |
| Mining, Quarrying, & Extraction | 2 (100.0%) | 0 (0.0%) |
| Construction | 45 (100.0%) | 0 (0.0%) |
| Manufacturing | 68 (88.3%) | 9 (11.7%) |
| Wholesale Trade | 2 (100.0%) | 0 (0.0%) |
| Retail Trade | 14 (31.8%) | 30 (68.2%) |
| Transportation & Warehousing | 5 (100.0%) | 0 (0.0%) |
| Utilities | 5 (100.0%) | 0 (0.0%) |
| Information | 3 (50.0%) | 3 (50.0%) |
| Finance & Insurance | 2 (28.6%) | 5 (71.4%) |
| Real Estate, Rental & Leasing | 2 (100.0%) | 0 (0.0%) |
| Professional & Scientific | 3 (60.0%) | 2 (40.0%) |
| Enterprise Management | 0 (0.0%) | 0 (0.0%) |
| Administrative & Support | 7 (77.8%) | 2 (22.2%) |
| Educational Services | 2 (11.8%) | 15 (88.2%) |
| Health Care & Social Assistance | 20 (19.6%) | 82 (80.4%) |
| Arts, Entertainment & Recreation | 0 (0.0%) | 0 (0.0%) |
| Accommodation & Food Services | 9 (75.0%) | 3 (25.0%) |
| Public Administration | 9 (37.5%) | 15 (62.5%) |
| Total | 210 (55.4%) | 169 (44.6%) |
Education in Wurtland
School Enrollment in Wurtland
The most common levels of schooling among the 298 students in Wurtland are high school (175 | 58.7%), elementary school (49 | 16.4%), and middle school (30 | 10.1%).
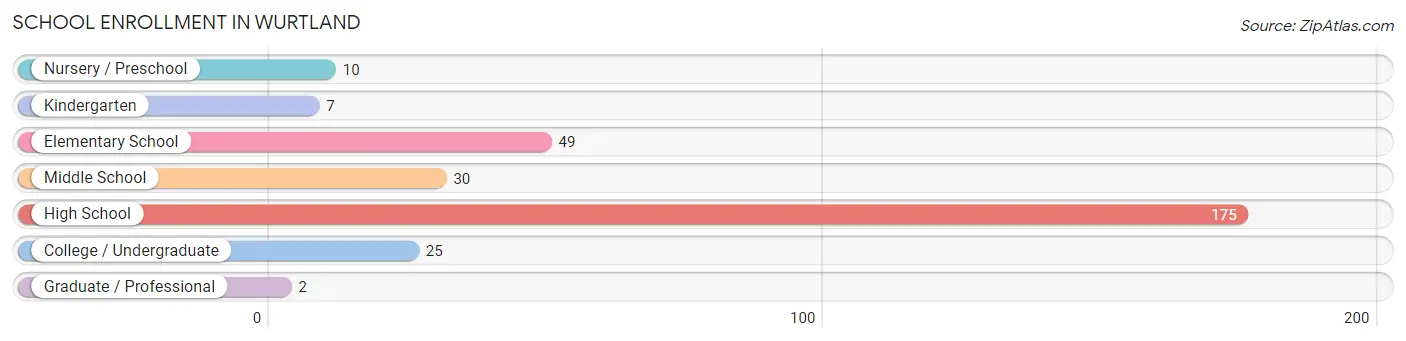
| School Level | # Students | % Students |
| Nursery / Preschool | 10 | 3.4% |
| Kindergarten | 7 | 2.4% |
| Elementary School | 49 | 16.4% |
| Middle School | 30 | 10.1% |
| High School | 175 | 58.7% |
| College / Undergraduate | 25 | 8.4% |
| Graduate / Professional | 2 | 0.7% |
| Total | 298 | 100.0% |
School Enrollment by Age by Funding Source in Wurtland
Out of a total of 298 students who are enrolled in schools in Wurtland, 145 (48.7%) attend a private institution, while the remaining 153 (51.3%) are enrolled in public schools. The age group of 15 to 17 year olds has the highest likelihood of being enrolled in private schools, with 142 (84.5% in the age bracket) enrolled. Conversely, the age group of 3 to 4 year olds has the lowest likelihood of being enrolled in a private school, with 8 (100.0% in the age bracket) attending a public institution.
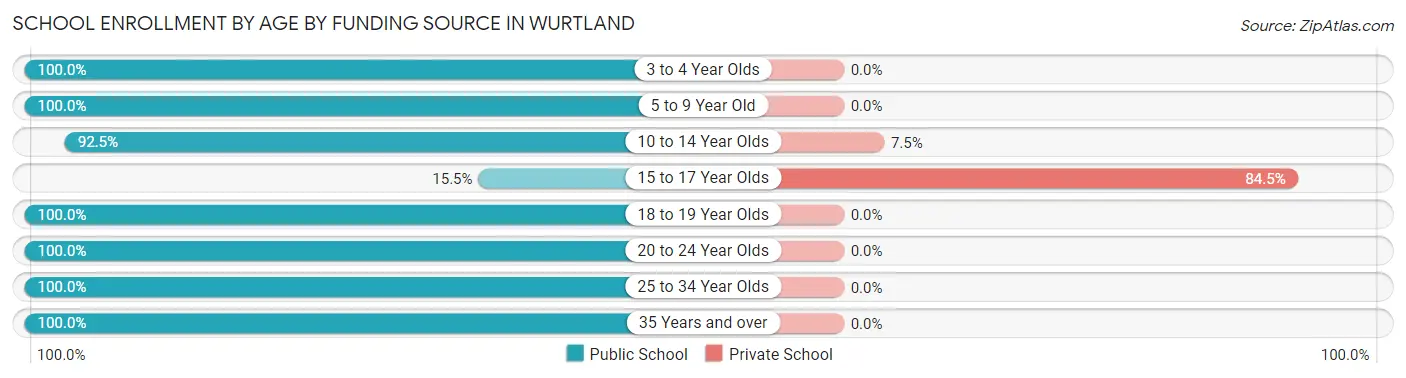
| Age Bracket | Public School | Private School |
| 3 to 4 Year Olds | 8 (100.0%) | 0 (0.0%) |
| 5 to 9 Year Old | 53 (100.0%) | 0 (0.0%) |
| 10 to 14 Year Olds | 37 (92.5%) | 3 (7.5%) |
| 15 to 17 Year Olds | 26 (15.5%) | 142 (84.5%) |
| 18 to 19 Year Olds | 2 (100.0%) | 0 (0.0%) |
| 20 to 24 Year Olds | 14 (100.0%) | 0 (0.0%) |
| 25 to 34 Year Olds | 3 (100.0%) | 0 (0.0%) |
| 35 Years and over | 10 (100.0%) | 0 (0.0%) |
| Total | 153 (51.3%) | 145 (48.7%) |
Educational Attainment by Field of Study in Wurtland
Science & technology (21 | 22.1%), education (17 | 17.9%), arts & humanities (16 | 16.8%), business (11 | 11.6%), and social sciences (10 | 10.5%) are the most common fields of study among 95 individuals in Wurtland who have obtained a bachelor's degree or higher.
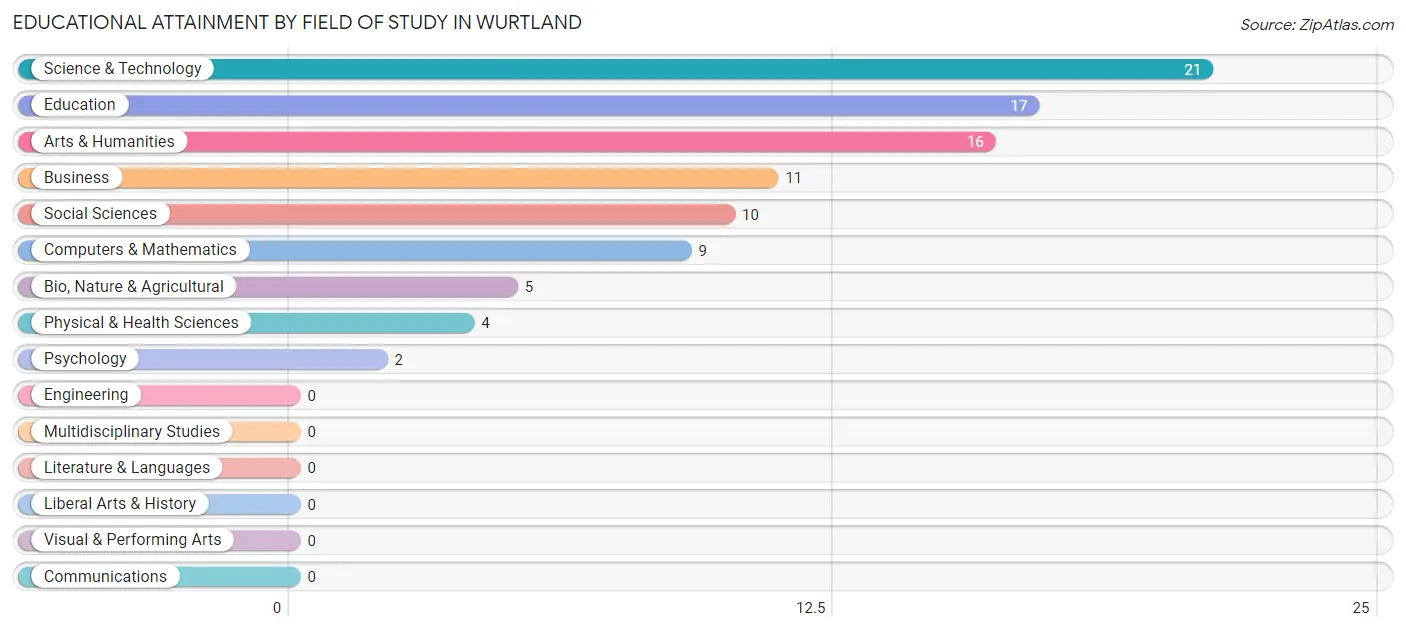
| Field of Study | # Graduates | % Graduates |
| Computers & Mathematics | 9 | 9.5% |
| Bio, Nature & Agricultural | 5 | 5.3% |
| Physical & Health Sciences | 4 | 4.2% |
| Psychology | 2 | 2.1% |
| Social Sciences | 10 | 10.5% |
| Engineering | 0 | 0.0% |
| Multidisciplinary Studies | 0 | 0.0% |
| Science & Technology | 21 | 22.1% |
| Business | 11 | 11.6% |
| Education | 17 | 17.9% |
| Literature & Languages | 0 | 0.0% |
| Liberal Arts & History | 0 | 0.0% |
| Visual & Performing Arts | 0 | 0.0% |
| Communications | 0 | 0.0% |
| Arts & Humanities | 16 | 16.8% |
| Total | 95 | 100.0% |
Transportation & Commute in Wurtland
Vehicle Availability by Sex in Wurtland
The most prevalent vehicle ownership categories in Wurtland are males with 2 vehicles (99, accounting for 48.5%) and females with 2 vehicles (70, making up 60.4%).
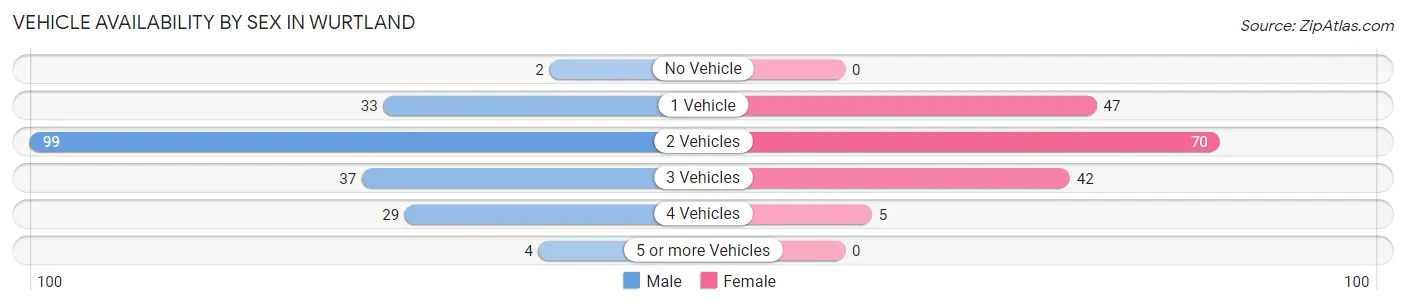
| Vehicles Available | Male | Female |
| No Vehicle | 2 (1.0%) | 0 (0.0%) |
| 1 Vehicle | 33 (16.2%) | 47 (28.7%) |
| 2 Vehicles | 99 (48.5%) | 70 (42.7%) |
| 3 Vehicles | 37 (18.1%) | 42 (25.6%) |
| 4 Vehicles | 29 (14.2%) | 5 (3.0%) |
| 5 or more Vehicles | 4 (2.0%) | 0 (0.0%) |
| Total | 204 (100.0%) | 164 (100.0%) |
Commute Time in Wurtland
The most frequently occuring commute durations in Wurtland are 35 to 39 minutes (79 commuters, 22.0%), 20 to 24 minutes (70 commuters, 19.5%), and 10 to 14 minutes (46 commuters, 12.8%).
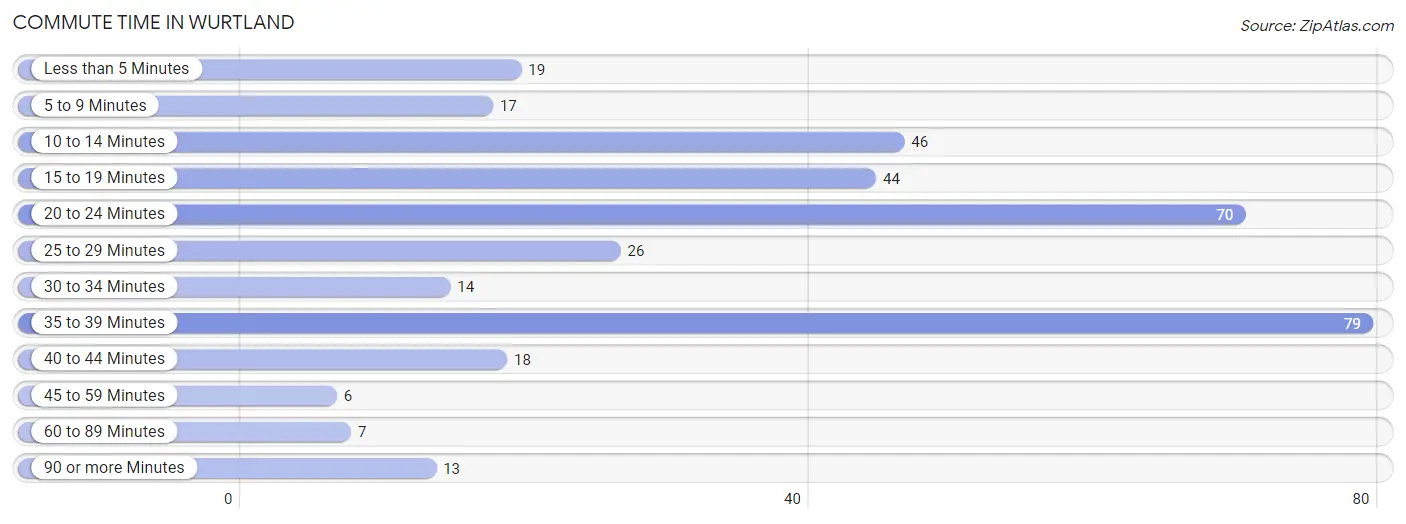
| Commute Time | # Commuters | % Commuters |
| Less than 5 Minutes | 19 | 5.3% |
| 5 to 9 Minutes | 17 | 4.7% |
| 10 to 14 Minutes | 46 | 12.8% |
| 15 to 19 Minutes | 44 | 12.3% |
| 20 to 24 Minutes | 70 | 19.5% |
| 25 to 29 Minutes | 26 | 7.2% |
| 30 to 34 Minutes | 14 | 3.9% |
| 35 to 39 Minutes | 79 | 22.0% |
| 40 to 44 Minutes | 18 | 5.0% |
| 45 to 59 Minutes | 6 | 1.7% |
| 60 to 89 Minutes | 7 | 1.9% |
| 90 or more Minutes | 13 | 3.6% |
Commute Time by Sex in Wurtland
The most common commute times in Wurtland are 35 to 39 minutes (71 commuters, 35.1%) for males and 20 to 24 minutes (58 commuters, 36.9%) for females.
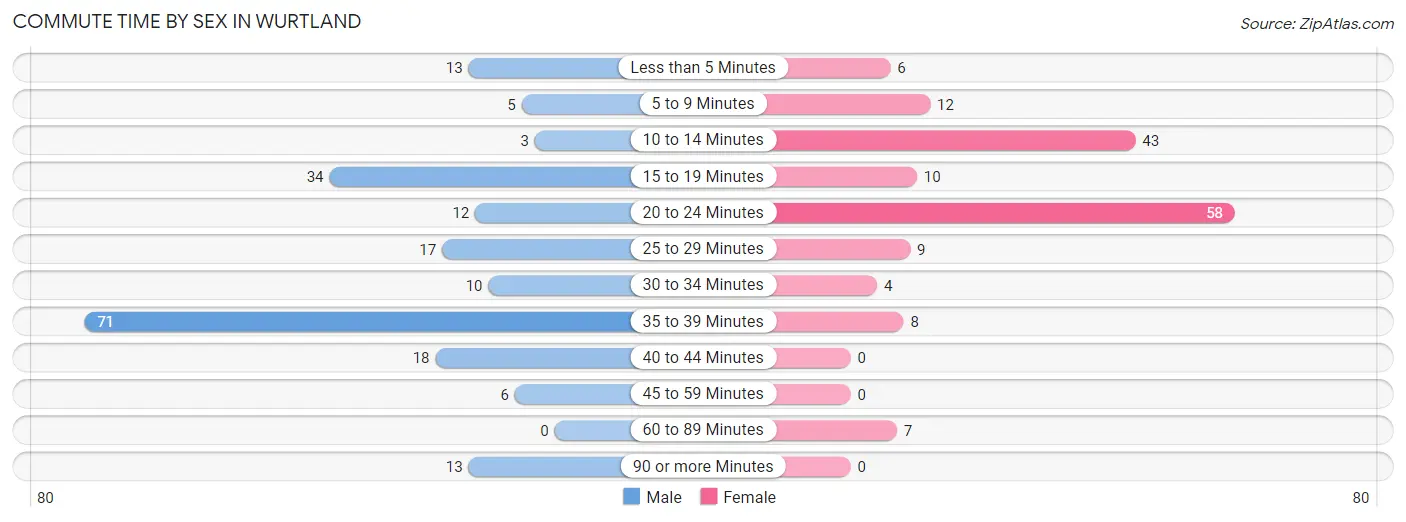
| Commute Time | Male | Female |
| Less than 5 Minutes | 13 (6.4%) | 6 (3.8%) |
| 5 to 9 Minutes | 5 (2.5%) | 12 (7.6%) |
| 10 to 14 Minutes | 3 (1.5%) | 43 (27.4%) |
| 15 to 19 Minutes | 34 (16.8%) | 10 (6.4%) |
| 20 to 24 Minutes | 12 (5.9%) | 58 (36.9%) |
| 25 to 29 Minutes | 17 (8.4%) | 9 (5.7%) |
| 30 to 34 Minutes | 10 (5.0%) | 4 (2.5%) |
| 35 to 39 Minutes | 71 (35.1%) | 8 (5.1%) |
| 40 to 44 Minutes | 18 (8.9%) | 0 (0.0%) |
| 45 to 59 Minutes | 6 (3.0%) | 0 (0.0%) |
| 60 to 89 Minutes | 0 (0.0%) | 7 (4.5%) |
| 90 or more Minutes | 13 (6.4%) | 0 (0.0%) |
Time of Departure to Work by Sex in Wurtland
The most frequent times of departure to work in Wurtland are 5:30 AM to 5:59 AM (46, 22.8%) for males and 6:30 AM to 6:59 AM (40, 25.5%) for females.
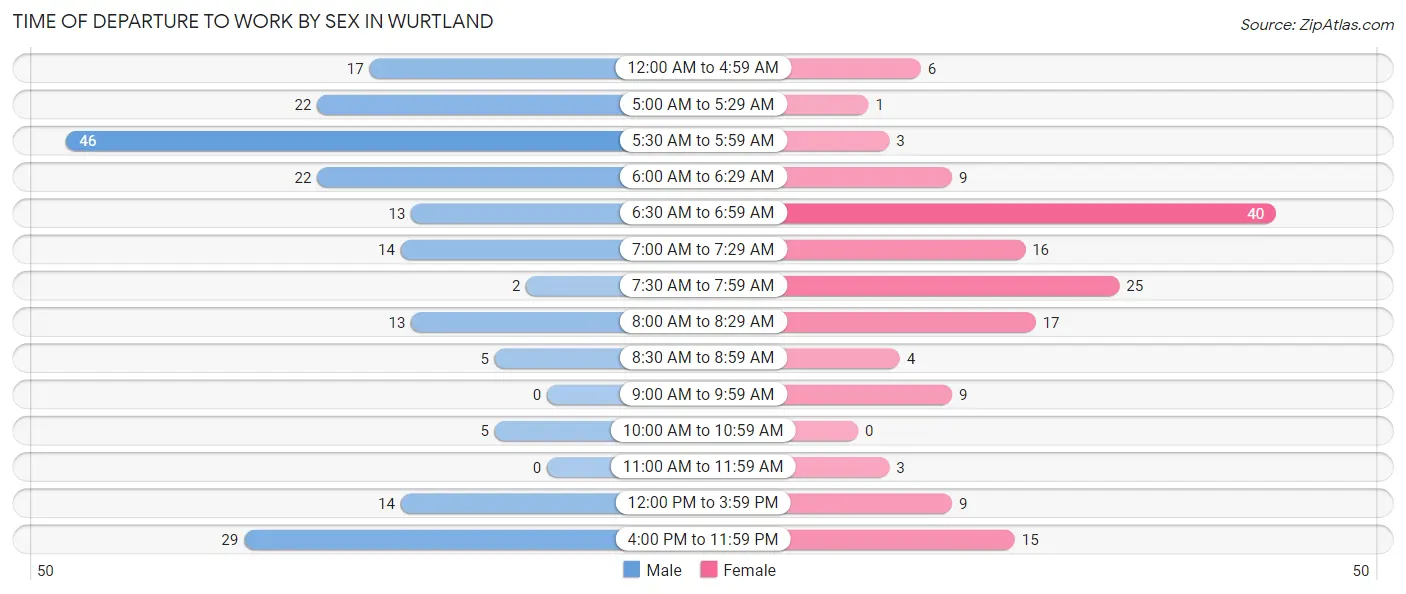
| Time of Departure | Male | Female |
| 12:00 AM to 4:59 AM | 17 (8.4%) | 6 (3.8%) |
| 5:00 AM to 5:29 AM | 22 (10.9%) | 1 (0.6%) |
| 5:30 AM to 5:59 AM | 46 (22.8%) | 3 (1.9%) |
| 6:00 AM to 6:29 AM | 22 (10.9%) | 9 (5.7%) |
| 6:30 AM to 6:59 AM | 13 (6.4%) | 40 (25.5%) |
| 7:00 AM to 7:29 AM | 14 (6.9%) | 16 (10.2%) |
| 7:30 AM to 7:59 AM | 2 (1.0%) | 25 (15.9%) |
| 8:00 AM to 8:29 AM | 13 (6.4%) | 17 (10.8%) |
| 8:30 AM to 8:59 AM | 5 (2.5%) | 4 (2.5%) |
| 9:00 AM to 9:59 AM | 0 (0.0%) | 9 (5.7%) |
| 10:00 AM to 10:59 AM | 5 (2.5%) | 0 (0.0%) |
| 11:00 AM to 11:59 AM | 0 (0.0%) | 3 (1.9%) |
| 12:00 PM to 3:59 PM | 14 (6.9%) | 9 (5.7%) |
| 4:00 PM to 11:59 PM | 29 (14.4%) | 15 (9.6%) |
| Total | 202 (100.0%) | 157 (100.0%) |
Housing Occupancy in Wurtland
Occupancy by Ownership in Wurtland
Of the total 372 dwellings in Wurtland, owner-occupied units account for 288 (77.4%), while renter-occupied units make up 84 (22.6%).
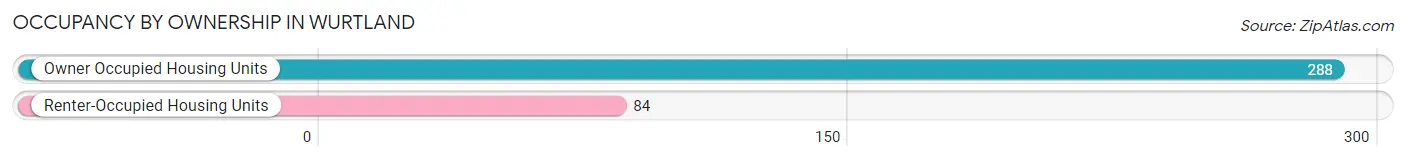
| Occupancy | # Housing Units | % Housing Units |
| Owner Occupied Housing Units | 288 | 77.4% |
| Renter-Occupied Housing Units | 84 | 22.6% |
| Total Occupied Housing Units | 372 | 100.0% |
Occupancy by Household Size in Wurtland
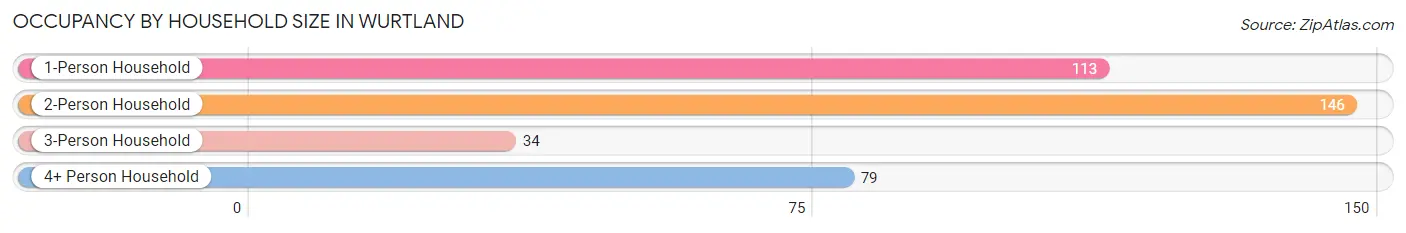
| Household Size | # Housing Units | % Housing Units |
| 1-Person Household | 113 | 30.4% |
| 2-Person Household | 146 | 39.3% |
| 3-Person Household | 34 | 9.1% |
| 4+ Person Household | 79 | 21.2% |
| Total Housing Units | 372 | 100.0% |
Occupancy by Ownership by Household Size in Wurtland
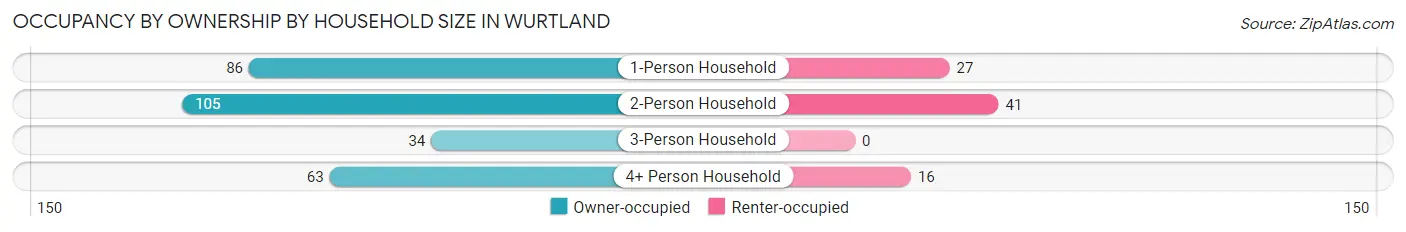
| Household Size | Owner-occupied | Renter-occupied |
| 1-Person Household | 86 (76.1%) | 27 (23.9%) |
| 2-Person Household | 105 (71.9%) | 41 (28.1%) |
| 3-Person Household | 34 (100.0%) | 0 (0.0%) |
| 4+ Person Household | 63 (79.7%) | 16 (20.3%) |
| Total Housing Units | 288 (77.4%) | 84 (22.6%) |
Occupancy by Educational Attainment in Wurtland
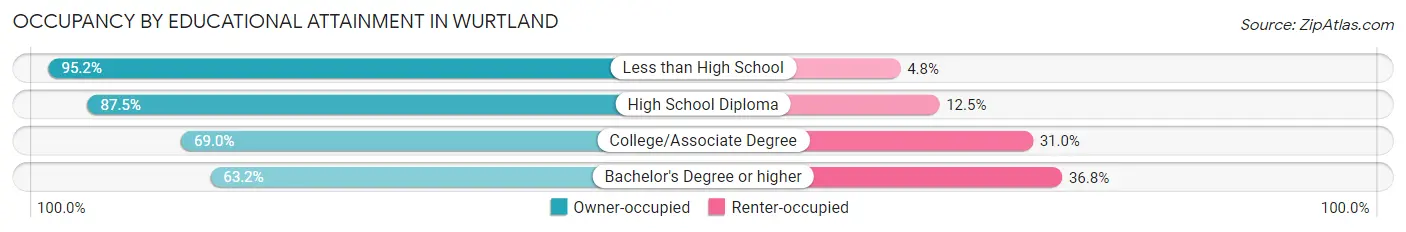
| Household Size | Owner-occupied | Renter-occupied |
| Less than High School | 40 (95.2%) | 2 (4.8%) |
| High School Diploma | 112 (87.5%) | 16 (12.5%) |
| College/Associate Degree | 100 (69.0%) | 45 (31.0%) |
| Bachelor's Degree or higher | 36 (63.2%) | 21 (36.8%) |
Occupancy by Age of Householder in Wurtland
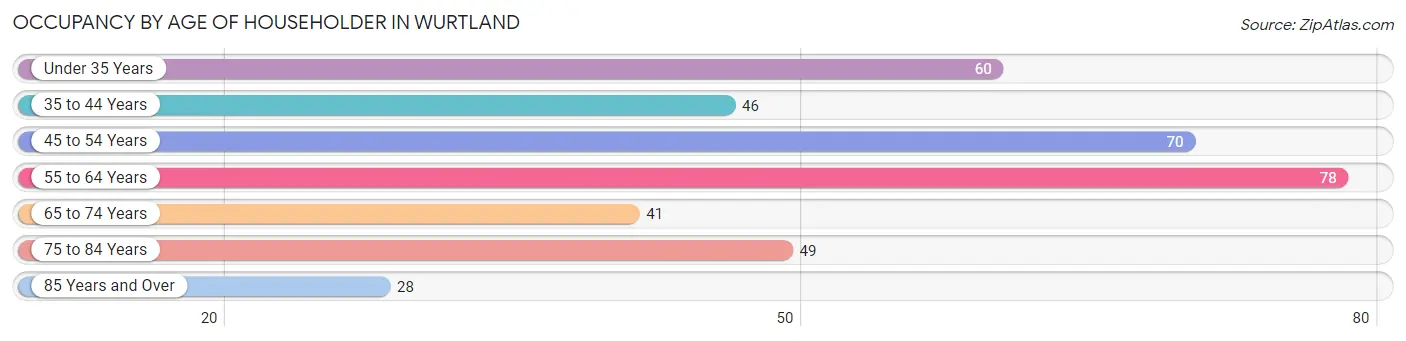
| Age Bracket | # Households | % Households |
| Under 35 Years | 60 | 16.1% |
| 35 to 44 Years | 46 | 12.4% |
| 45 to 54 Years | 70 | 18.8% |
| 55 to 64 Years | 78 | 21.0% |
| 65 to 74 Years | 41 | 11.0% |
| 75 to 84 Years | 49 | 13.2% |
| 85 Years and Over | 28 | 7.5% |
| Total | 372 | 100.0% |
Housing Finances in Wurtland
Median Income by Occupancy in Wurtland
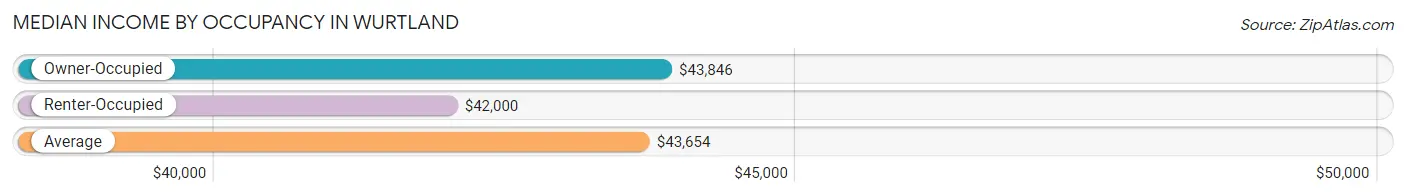
| Occupancy Type | # Households | Median Income |
| Owner-Occupied | 288 (77.4%) | $43,846 |
| Renter-Occupied | 84 (22.6%) | $42,000 |
| Average | 372 (100.0%) | $43,654 |
Occupancy by Householder Income Bracket in Wurtland
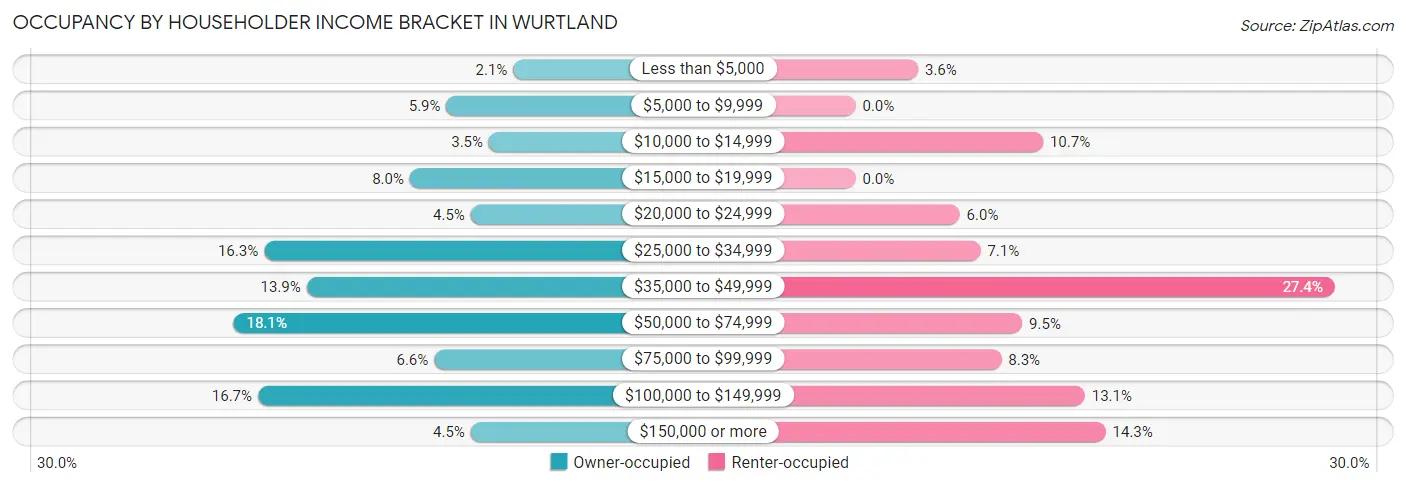
| Income Bracket | Owner-occupied | Renter-occupied |
| Less than $5,000 | 6 (2.1%) | 3 (3.6%) |
| $5,000 to $9,999 | 17 (5.9%) | 0 (0.0%) |
| $10,000 to $14,999 | 10 (3.5%) | 9 (10.7%) |
| $15,000 to $19,999 | 23 (8.0%) | 0 (0.0%) |
| $20,000 to $24,999 | 13 (4.5%) | 5 (5.9%) |
| $25,000 to $34,999 | 47 (16.3%) | 6 (7.1%) |
| $35,000 to $49,999 | 40 (13.9%) | 23 (27.4%) |
| $50,000 to $74,999 | 52 (18.1%) | 8 (9.5%) |
| $75,000 to $99,999 | 19 (6.6%) | 7 (8.3%) |
| $100,000 to $149,999 | 48 (16.7%) | 11 (13.1%) |
| $150,000 or more | 13 (4.5%) | 12 (14.3%) |
| Total | 288 (100.0%) | 84 (100.0%) |
Monthly Housing Cost Tiers in Wurtland
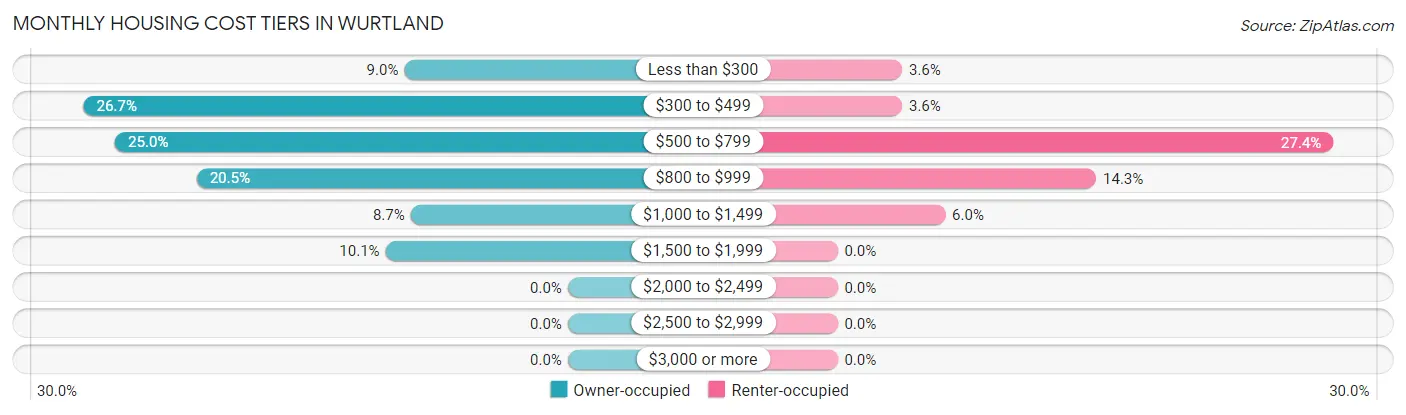
| Monthly Cost | Owner-occupied | Renter-occupied |
| Less than $300 | 26 (9.0%) | 3 (3.6%) |
| $300 to $499 | 77 (26.7%) | 3 (3.6%) |
| $500 to $799 | 72 (25.0%) | 23 (27.4%) |
| $800 to $999 | 59 (20.5%) | 12 (14.3%) |
| $1,000 to $1,499 | 25 (8.7%) | 5 (5.9%) |
| $1,500 to $1,999 | 29 (10.1%) | 0 (0.0%) |
| $2,000 to $2,499 | 0 (0.0%) | 0 (0.0%) |
| $2,500 to $2,999 | 0 (0.0%) | 0 (0.0%) |
| $3,000 or more | 0 (0.0%) | 0 (0.0%) |
| Total | 288 (100.0%) | 84 (100.0%) |
Physical Housing Characteristics in Wurtland
Housing Structures in Wurtland
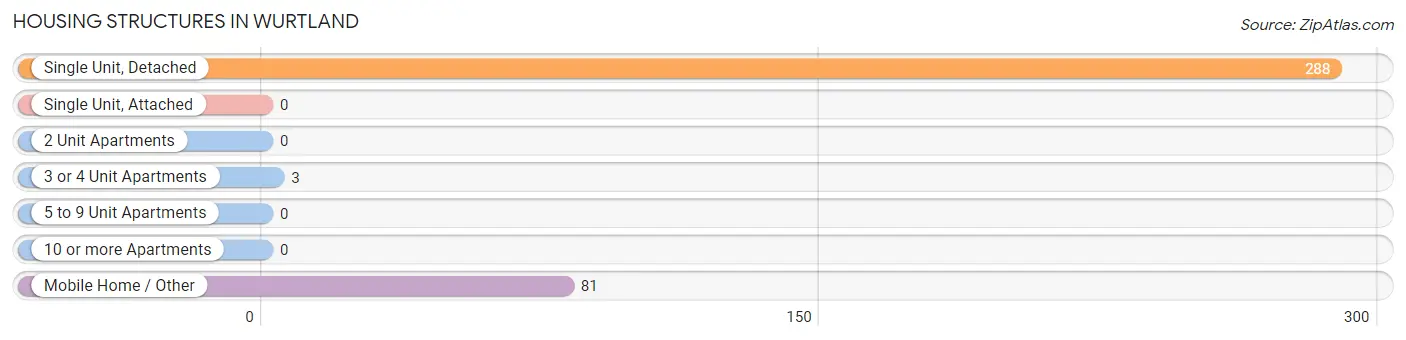
| Structure Type | # Housing Units | % Housing Units |
| Single Unit, Detached | 288 | 77.4% |
| Single Unit, Attached | 0 | 0.0% |
| 2 Unit Apartments | 0 | 0.0% |
| 3 or 4 Unit Apartments | 3 | 0.8% |
| 5 to 9 Unit Apartments | 0 | 0.0% |
| 10 or more Apartments | 0 | 0.0% |
| Mobile Home / Other | 81 | 21.8% |
| Total | 372 | 100.0% |
Housing Structures by Occupancy in Wurtland
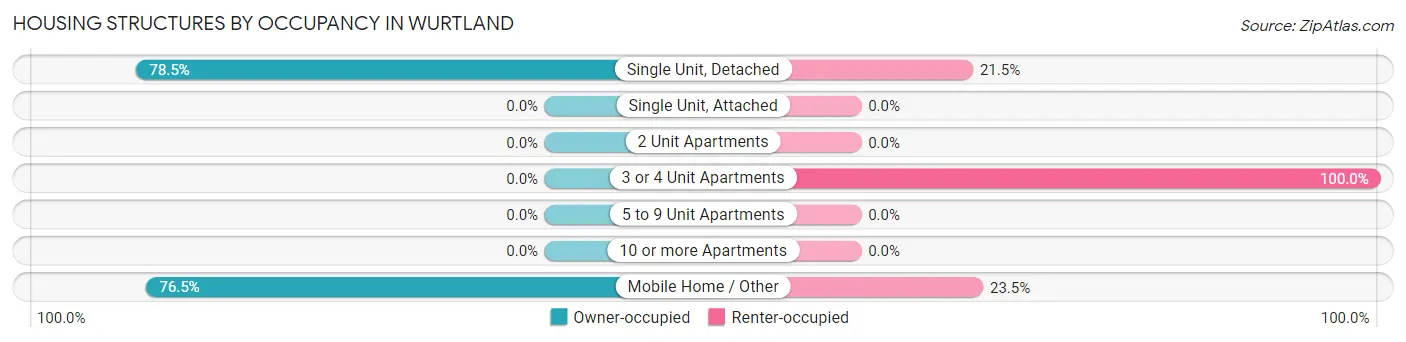
| Structure Type | Owner-occupied | Renter-occupied |
| Single Unit, Detached | 226 (78.5%) | 62 (21.5%) |
| Single Unit, Attached | 0 (0.0%) | 0 (0.0%) |
| 2 Unit Apartments | 0 (0.0%) | 0 (0.0%) |
| 3 or 4 Unit Apartments | 0 (0.0%) | 3 (100.0%) |
| 5 to 9 Unit Apartments | 0 (0.0%) | 0 (0.0%) |
| 10 or more Apartments | 0 (0.0%) | 0 (0.0%) |
| Mobile Home / Other | 62 (76.5%) | 19 (23.5%) |
| Total | 288 (77.4%) | 84 (22.6%) |
Housing Structures by Number of Rooms in Wurtland
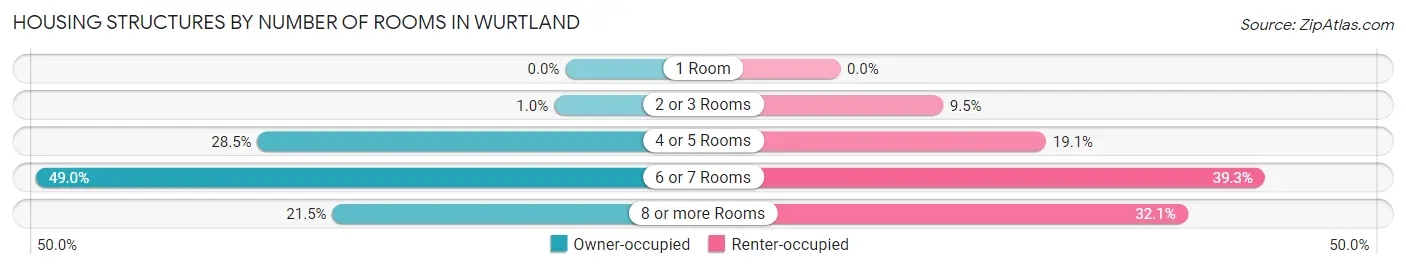
| Number of Rooms | Owner-occupied | Renter-occupied |
| 1 Room | 0 (0.0%) | 0 (0.0%) |
| 2 or 3 Rooms | 3 (1.0%) | 8 (9.5%) |
| 4 or 5 Rooms | 82 (28.5%) | 16 (19.1%) |
| 6 or 7 Rooms | 141 (49.0%) | 33 (39.3%) |
| 8 or more Rooms | 62 (21.5%) | 27 (32.1%) |
| Total | 288 (100.0%) | 84 (100.0%) |
Housing Structure by Heating Type in Wurtland
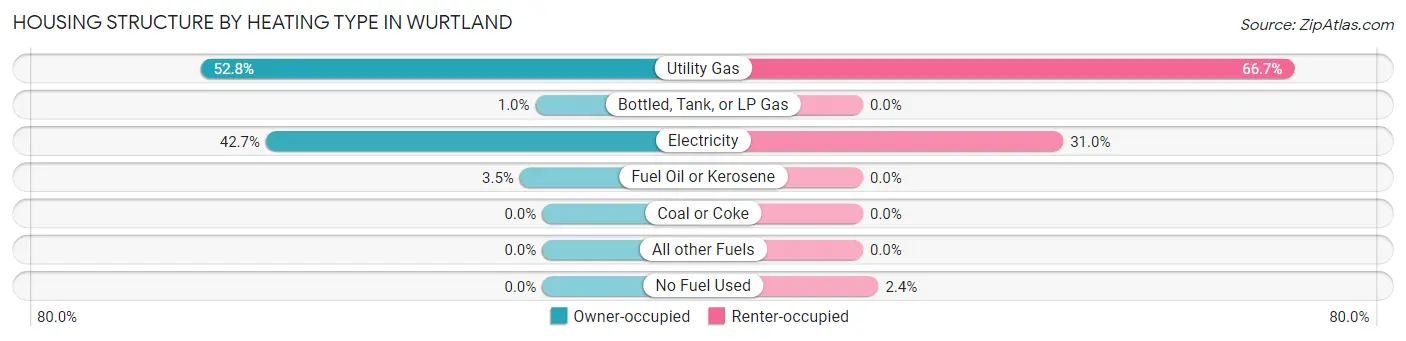
| Heating Type | Owner-occupied | Renter-occupied |
| Utility Gas | 152 (52.8%) | 56 (66.7%) |
| Bottled, Tank, or LP Gas | 3 (1.0%) | 0 (0.0%) |
| Electricity | 123 (42.7%) | 26 (30.9%) |
| Fuel Oil or Kerosene | 10 (3.5%) | 0 (0.0%) |
| Coal or Coke | 0 (0.0%) | 0 (0.0%) |
| All other Fuels | 0 (0.0%) | 0 (0.0%) |
| No Fuel Used | 0 (0.0%) | 2 (2.4%) |
| Total | 288 (100.0%) | 84 (100.0%) |
Household Vehicle Usage in Wurtland
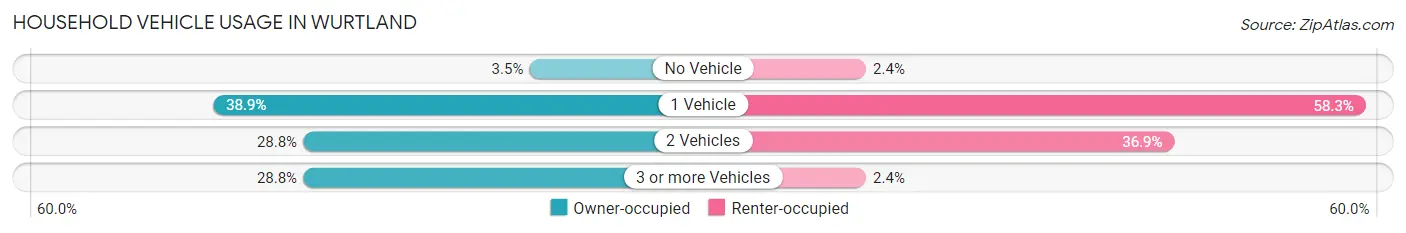
| Vehicles per Household | Owner-occupied | Renter-occupied |
| No Vehicle | 10 (3.5%) | 2 (2.4%) |
| 1 Vehicle | 112 (38.9%) | 49 (58.3%) |
| 2 Vehicles | 83 (28.8%) | 31 (36.9%) |
| 3 or more Vehicles | 83 (28.8%) | 2 (2.4%) |
| Total | 288 (100.0%) | 84 (100.0%) |
Real Estate & Mortgages in Wurtland
Real Estate and Mortgage Overview in Wurtland
| Characteristic | Without Mortgage | With Mortgage |
| Housing Units | 179 | 109 |
| Median Property Value | $58,800 | $120,200 |
| Median Household Income | $40,417 | $10 |
| Monthly Housing Costs | $467 | $0 |
| Real Estate Taxes | $808 | $6 |
Property Value by Mortgage Status in Wurtland
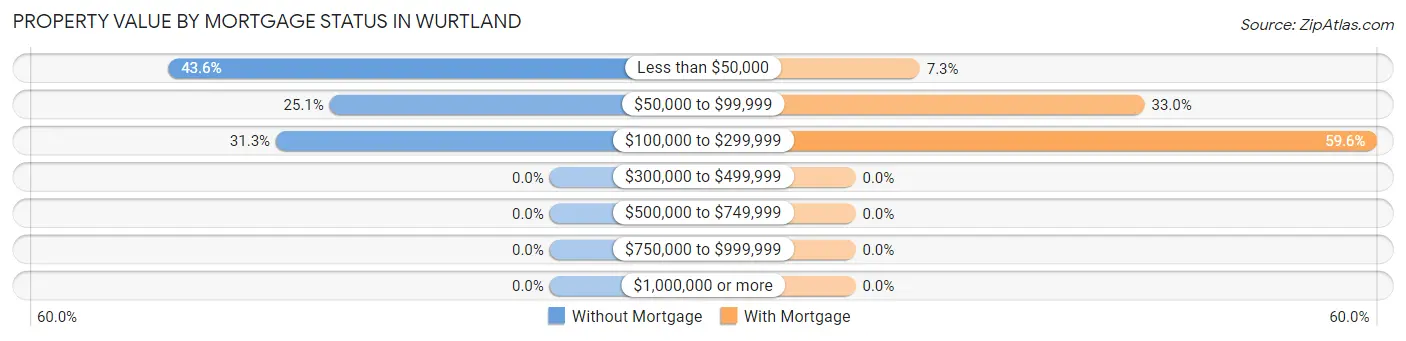
| Property Value | Without Mortgage | With Mortgage |
| Less than $50,000 | 78 (43.6%) | 8 (7.3%) |
| $50,000 to $99,999 | 45 (25.1%) | 36 (33.0%) |
| $100,000 to $299,999 | 56 (31.3%) | 65 (59.6%) |
| $300,000 to $499,999 | 0 (0.0%) | 0 (0.0%) |
| $500,000 to $749,999 | 0 (0.0%) | 0 (0.0%) |
| $750,000 to $999,999 | 0 (0.0%) | 0 (0.0%) |
| $1,000,000 or more | 0 (0.0%) | 0 (0.0%) |
| Total | 179 (100.0%) | 109 (100.0%) |
Household Income by Mortgage Status in Wurtland
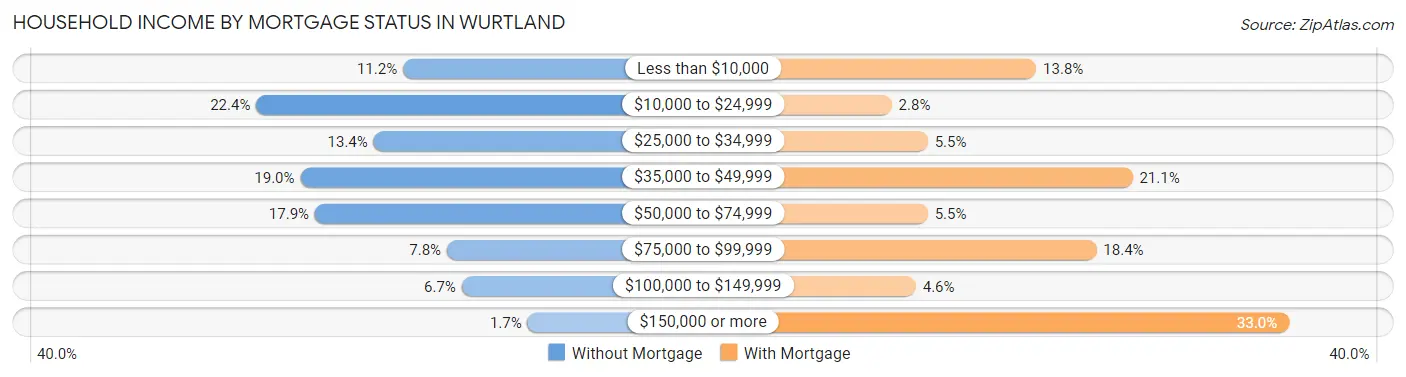
| Household Income | Without Mortgage | With Mortgage |
| Less than $10,000 | 20 (11.2%) | 15 (13.8%) |
| $10,000 to $24,999 | 40 (22.4%) | 3 (2.8%) |
| $25,000 to $34,999 | 24 (13.4%) | 6 (5.5%) |
| $35,000 to $49,999 | 34 (19.0%) | 23 (21.1%) |
| $50,000 to $74,999 | 32 (17.9%) | 6 (5.5%) |
| $75,000 to $99,999 | 14 (7.8%) | 20 (18.3%) |
| $100,000 to $149,999 | 12 (6.7%) | 5 (4.6%) |
| $150,000 or more | 3 (1.7%) | 36 (33.0%) |
| Total | 179 (100.0%) | 109 (100.0%) |
Property Value to Household Income Ratio in Wurtland
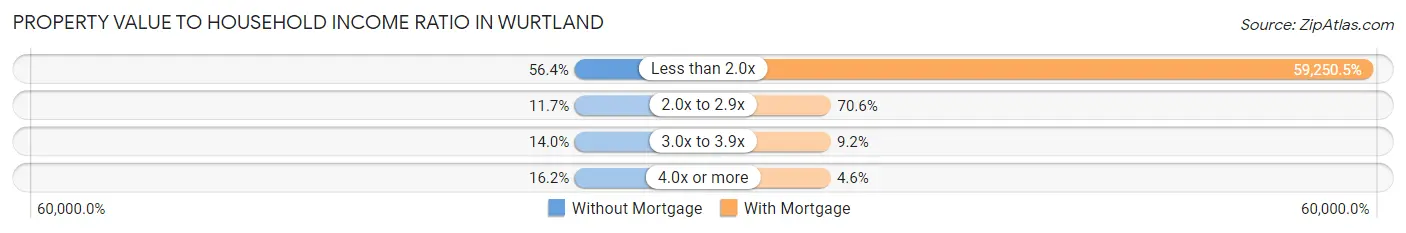
| Value-to-Income Ratio | Without Mortgage | With Mortgage |
| Less than 2.0x | 101 (56.4%) | 64,583 (59,250.5%) |
| 2.0x to 2.9x | 21 (11.7%) | 77 (70.6%) |
| 3.0x to 3.9x | 25 (14.0%) | 10 (9.2%) |
| 4.0x or more | 29 (16.2%) | 5 (4.6%) |
| Total | 179 (100.0%) | 109 (100.0%) |
Real Estate Taxes by Mortgage Status in Wurtland
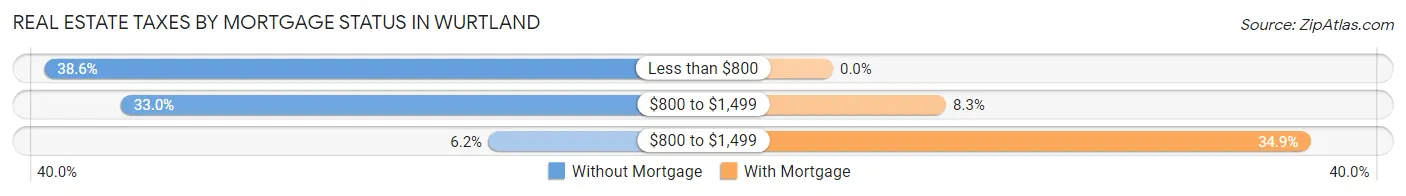
| Property Taxes | Without Mortgage | With Mortgage |
| Less than $800 | 69 (38.6%) | 0 (0.0%) |
| $800 to $1,499 | 59 (33.0%) | 9 (8.3%) |
| $800 to $1,499 | 11 (6.1%) | 38 (34.9%) |
| Total | 179 (100.0%) | 109 (100.0%) |
Health & Disability in Wurtland
Health Insurance Coverage by Age in Wurtland
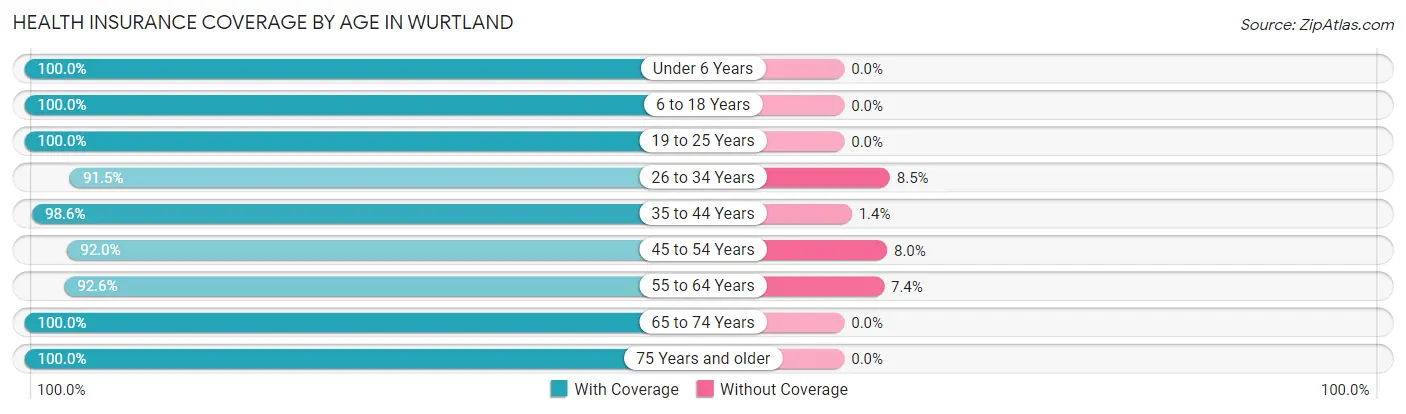
| Age Bracket | With Coverage | Without Coverage |
| Under 6 Years | 43 (100.0%) | 0 (0.0%) |
| 6 to 18 Years | 261 (100.0%) | 0 (0.0%) |
| 19 to 25 Years | 59 (100.0%) | 0 (0.0%) |
| 26 to 34 Years | 97 (91.5%) | 9 (8.5%) |
| 35 to 44 Years | 142 (98.6%) | 2 (1.4%) |
| 45 to 54 Years | 127 (92.0%) | 11 (8.0%) |
| 55 to 64 Years | 125 (92.6%) | 10 (7.4%) |
| 65 to 74 Years | 53 (100.0%) | 0 (0.0%) |
| 75 Years and older | 82 (100.0%) | 0 (0.0%) |
| Total | 989 (96.9%) | 32 (3.1%) |
Health Insurance Coverage by Citizenship Status in Wurtland
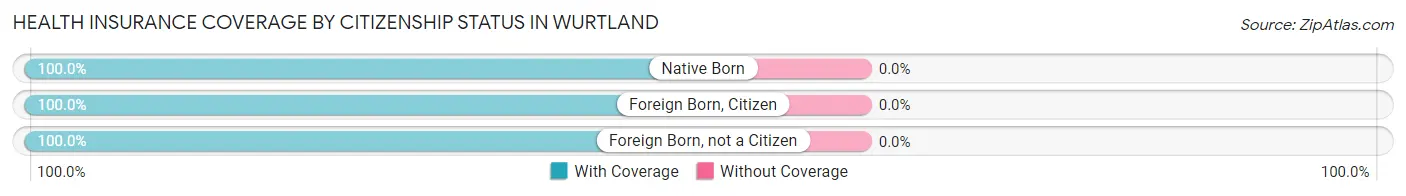
| Citizenship Status | With Coverage | Without Coverage |
| Native Born | 43 (100.0%) | 0 (0.0%) |
| Foreign Born, Citizen | 261 (100.0%) | 0 (0.0%) |
| Foreign Born, not a Citizen | 59 (100.0%) | 0 (0.0%) |
Health Insurance Coverage by Household Income in Wurtland
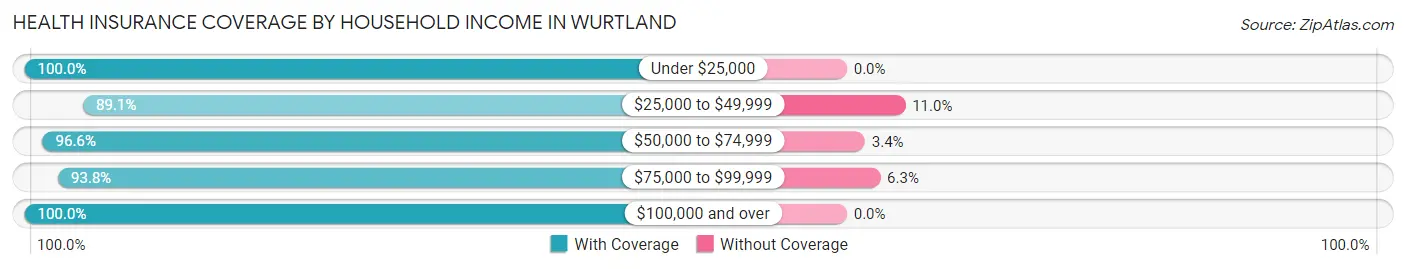
| Household Income | With Coverage | Without Coverage |
| Under $25,000 | 159 (100.0%) | 0 (0.0%) |
| $25,000 to $49,999 | 187 (89.0%) | 23 (11.0%) |
| $50,000 to $74,999 | 143 (96.6%) | 5 (3.4%) |
| $75,000 to $99,999 | 60 (93.8%) | 4 (6.2%) |
| $100,000 and over | 440 (100.0%) | 0 (0.0%) |
Public vs Private Health Insurance Coverage by Age in Wurtland
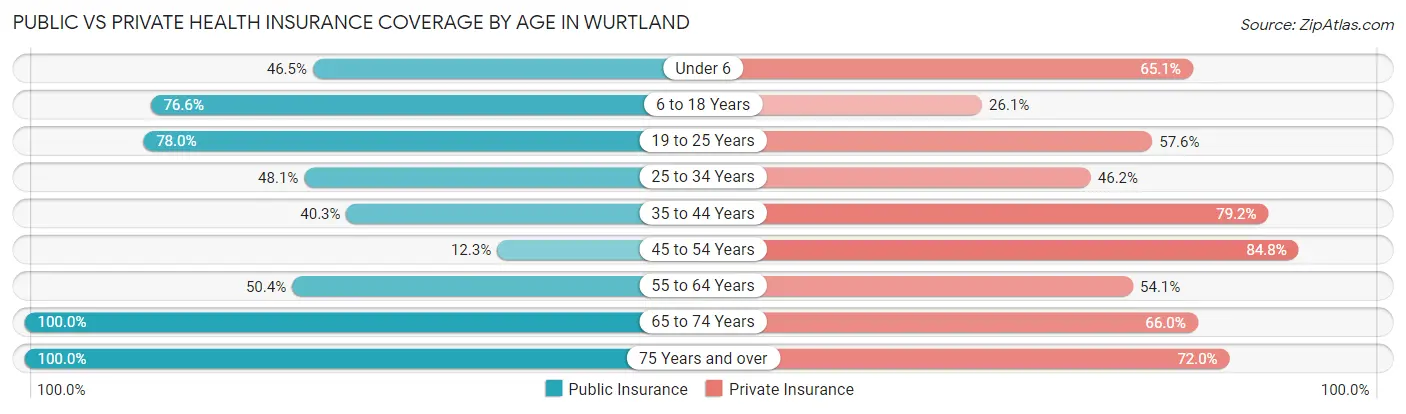
| Age Bracket | Public Insurance | Private Insurance |
| Under 6 | 20 (46.5%) | 28 (65.1%) |
| 6 to 18 Years | 200 (76.6%) | 68 (26.1%) |
| 19 to 25 Years | 46 (78.0%) | 34 (57.6%) |
| 25 to 34 Years | 51 (48.1%) | 49 (46.2%) |
| 35 to 44 Years | 58 (40.3%) | 114 (79.2%) |
| 45 to 54 Years | 17 (12.3%) | 117 (84.8%) |
| 55 to 64 Years | 68 (50.4%) | 73 (54.1%) |
| 65 to 74 Years | 53 (100.0%) | 35 (66.0%) |
| 75 Years and over | 82 (100.0%) | 59 (72.0%) |
| Total | 595 (58.3%) | 577 (56.5%) |
Disability Status by Sex by Age in Wurtland
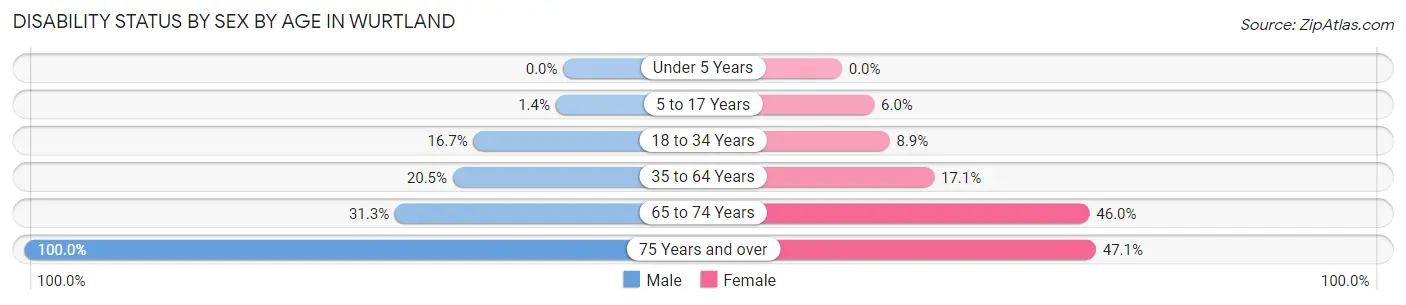
| Age Bracket | Male | Female |
| Under 5 Years | 0 (0.0%) | 0 (0.0%) |
| 5 to 17 Years | 3 (1.4%) | 3 (6.0%) |
| 18 to 34 Years | 15 (16.7%) | 7 (8.9%) |
| 35 to 64 Years | 40 (20.5%) | 38 (17.1%) |
| 65 to 74 Years | 5 (31.2%) | 17 (46.0%) |
| 75 Years and over | 12 (100.0%) | 33 (47.1%) |
Disability Class by Sex by Age in Wurtland
Disability Class: Hearing Difficulty
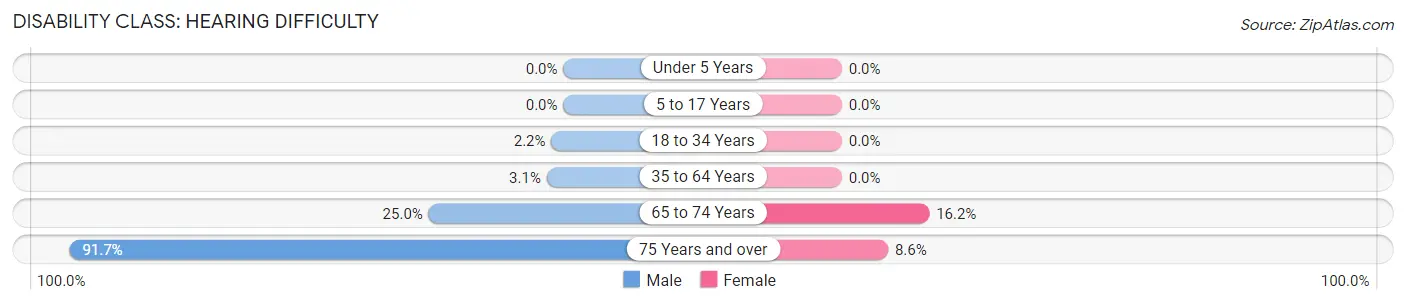
| Age Bracket | Male | Female |
| Under 5 Years | 0 (0.0%) | 0 (0.0%) |
| 5 to 17 Years | 0 (0.0%) | 0 (0.0%) |
| 18 to 34 Years | 2 (2.2%) | 0 (0.0%) |
| 35 to 64 Years | 6 (3.1%) | 0 (0.0%) |
| 65 to 74 Years | 4 (25.0%) | 6 (16.2%) |
| 75 Years and over | 11 (91.7%) | 6 (8.6%) |
Disability Class: Vision Difficulty
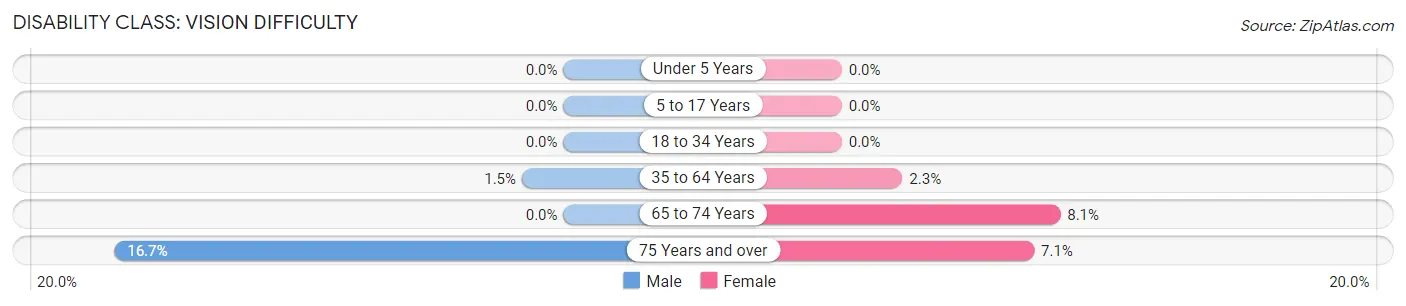
| Age Bracket | Male | Female |
| Under 5 Years | 0 (0.0%) | 0 (0.0%) |
| 5 to 17 Years | 0 (0.0%) | 0 (0.0%) |
| 18 to 34 Years | 0 (0.0%) | 0 (0.0%) |
| 35 to 64 Years | 3 (1.5%) | 5 (2.2%) |
| 65 to 74 Years | 0 (0.0%) | 3 (8.1%) |
| 75 Years and over | 2 (16.7%) | 5 (7.1%) |
Disability Class: Cognitive Difficulty
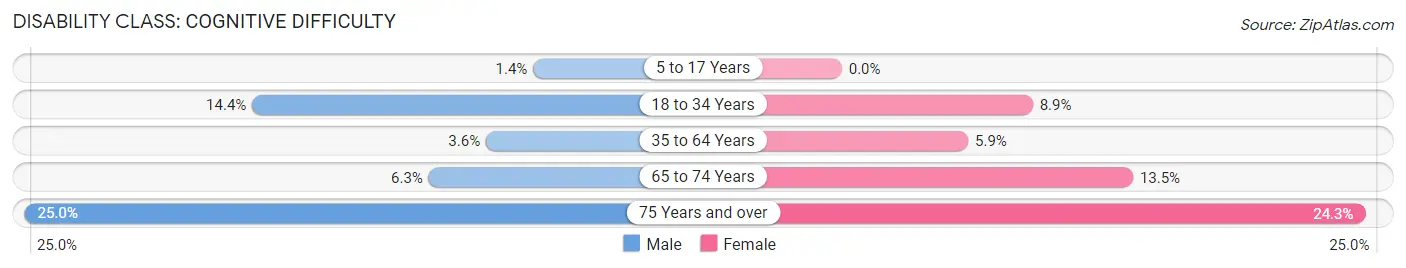
| Age Bracket | Male | Female |
| 5 to 17 Years | 3 (1.4%) | 0 (0.0%) |
| 18 to 34 Years | 13 (14.4%) | 7 (8.9%) |
| 35 to 64 Years | 7 (3.6%) | 13 (5.9%) |
| 65 to 74 Years | 1 (6.2%) | 5 (13.5%) |
| 75 Years and over | 3 (25.0%) | 17 (24.3%) |
Disability Class: Ambulatory Difficulty
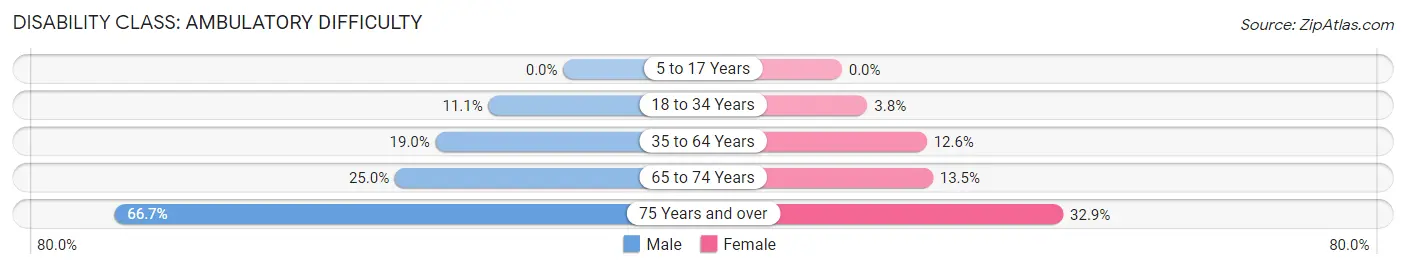
| Age Bracket | Male | Female |
| 5 to 17 Years | 0 (0.0%) | 0 (0.0%) |
| 18 to 34 Years | 10 (11.1%) | 3 (3.8%) |
| 35 to 64 Years | 37 (19.0%) | 28 (12.6%) |
| 65 to 74 Years | 4 (25.0%) | 5 (13.5%) |
| 75 Years and over | 8 (66.7%) | 23 (32.9%) |
Disability Class: Self-Care Difficulty
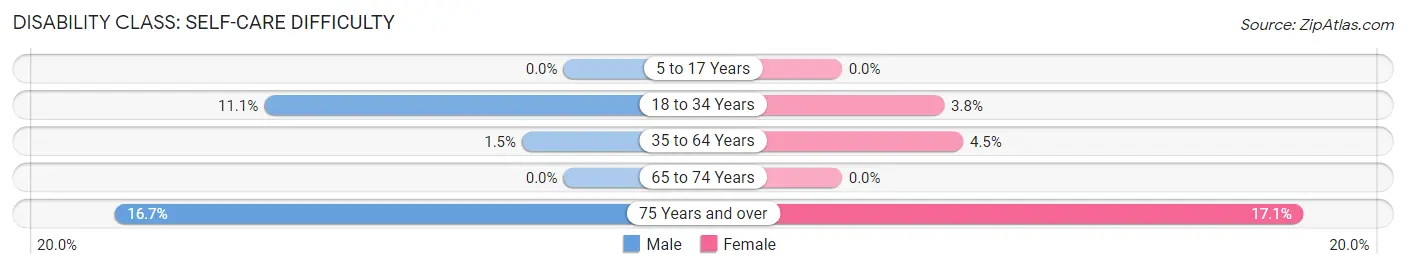
| Age Bracket | Male | Female |
| 5 to 17 Years | 0 (0.0%) | 0 (0.0%) |
| 18 to 34 Years | 10 (11.1%) | 3 (3.8%) |
| 35 to 64 Years | 3 (1.5%) | 10 (4.5%) |
| 65 to 74 Years | 0 (0.0%) | 0 (0.0%) |
| 75 Years and over | 2 (16.7%) | 12 (17.1%) |
Technology Access in Wurtland
Computing Device Access in Wurtland
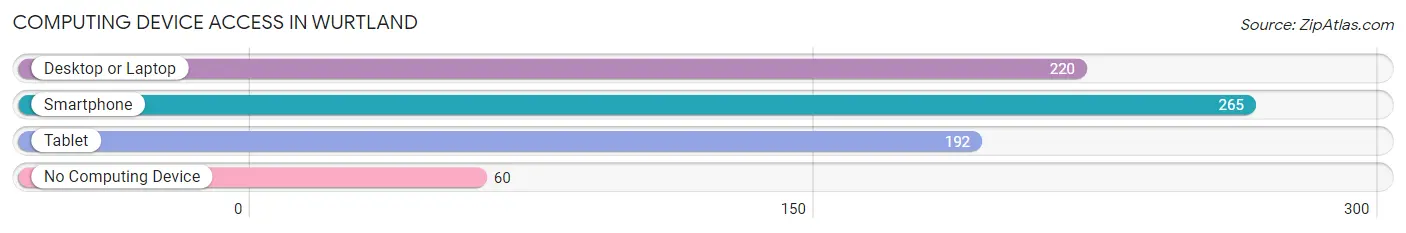
| Device Type | # Households | % Households |
| Desktop or Laptop | 220 | 59.1% |
| Smartphone | 265 | 71.2% |
| Tablet | 192 | 51.6% |
| No Computing Device | 60 | 16.1% |
| Total | 372 | 100.0% |
Internet Access in Wurtland
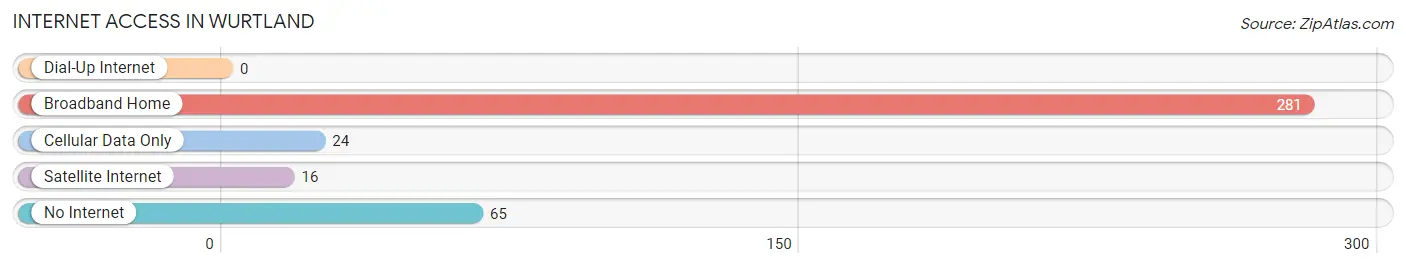
| Internet Type | # Households | % Households |
| Dial-Up Internet | 0 | 0.0% |
| Broadband Home | 281 | 75.5% |
| Cellular Data Only | 24 | 6.5% |
| Satellite Internet | 16 | 4.3% |
| No Internet | 65 | 17.5% |
| Total | 372 | 100.0% |
Wurtland Summary
Wurtland is a small unincorporated community located in Greenup County, Kentucky, United States. It is situated along the Ohio River, approximately 8 miles east of the city of Greenup. The population of Wurtland was estimated to be 1,092 in the 2010 census.
History
The area that is now Wurtland was first settled in the early 1800s by a group of German immigrants. The town was originally known as “Wurtzland”, named after the family of John Wurtz, who was one of the first settlers. The name was later changed to “Wurtland”.
The town was officially incorporated in 1883. At the time, the town was a small farming community, with a population of just over 200 people. The town grew slowly over the years, and by the early 1900s, the population had grown to around 500 people.
In the early 1900s, the town began to experience a period of growth and prosperity. The town was home to several businesses, including a general store, a blacksmith shop, a sawmill, and a grist mill. The town also had a post office, a bank, and a hotel.
Geography
Wurtland is located in Greenup County, Kentucky, along the Ohio River. The town is situated on the north side of the river, approximately 8 miles east of the city of Greenup. The town is bordered by the towns of Russell and Flatwoods to the north, and the towns of South Shore and Raceland to the south.
The town is located in a hilly region, with an elevation of around 500 feet above sea level. The climate in Wurtland is humid subtropical, with hot summers and mild winters. The average annual temperature is around 57 degrees Fahrenheit.
Economy
The economy of Wurtland is largely based on agriculture and tourism. The town is home to several farms, which produce a variety of crops, including corn, soybeans, wheat, and hay. The town is also home to several tourist attractions, including the Wurtland Historical Museum, the Wurtland Riverwalk, and the Wurtland Nature Center.
The town is also home to several small businesses, including restaurants, shops, and a gas station. The town is served by the Greenup County School District, which operates several schools in the area.
Demographics
As of the 2010 census, the population of Wurtland was estimated to be 1,092. The racial makeup of the town was 97.3% White, 0.9% African American, 0.3% Native American, 0.2% Asian, and 1.3% from other races. The median household income in Wurtland was $37,917, and the median family income was $45,625.
Conclusion
Wurtland is a small unincorporated community located in Greenup County, Kentucky, United States. It is situated along the Ohio River, approximately 8 miles east of the city of Greenup. The population of Wurtland was estimated to be 1,092 in the 2010 census. The town is largely based on agriculture and tourism, and is home to several small businesses, farms, and tourist attractions. The town is served by the Greenup County School District, and has a median household income of $37,917.
Common Questions
What is Per Capita Income in Wurtland?
Per Capita income in Wurtland is $22,342.
What is the Median Family Income in Wurtland?
Median Family Income in Wurtland is $58,750.
What is the Median Household income in Wurtland?
Median Household Income in Wurtland is $43,654.
What is Income or Wage Gap in Wurtland?
Income or Wage Gap in Wurtland is 14.3%.
Women in Wurtland earn 85.7 cents for every dollar earned by a man.
What is Family Income Deficit in Wurtland?
Family Income Deficit in Wurtland is $9,442.
Families that are below poverty line in Wurtland earn $9,442 less on average than the poverty threshold level.
What is Inequality or Gini Index in Wurtland?
Inequality or Gini Index in Wurtland is 0.43.
What is the Total Population of Wurtland?
Total Population of Wurtland is 1,133.
What is the Total Male Population of Wurtland?
Total Male Population of Wurtland is 580.
What is the Total Female Population of Wurtland?
Total Female Population of Wurtland is 553.
What is the Ratio of Males per 100 Females in Wurtland?
There are 104.88 Males per 100 Females in Wurtland.
What is the Ratio of Females per 100 Males in Wurtland?
There are 95.34 Females per 100 Males in Wurtland.
What is the Median Population Age in Wurtland?
Median Population Age in Wurtland is 39.7 Years.
What is the Average Family Size in Wurtland
Average Family Size in Wurtland is 3.4 People.
What is the Average Household Size in Wurtland
Average Household Size in Wurtland is 2.7 People.
How Large is the Labor Force in Wurtland?
There are 402 People in the Labor Forcein in Wurtland.
What is the Percentage of People in the Labor Force in Wurtland?
40.1% of People are in the Labor Force in Wurtland.
What is the Unemployment Rate in Wurtland?
Unemployment Rate in Wurtland is 5.7%.