Zip Codes with the Highest Percentage of Population Employed in Life, Physical & Social Science in Kentucky
RELATED REPORTS & OPTIONS
Life, Physical & Social Science
Kentucky
Compare Zip Codes
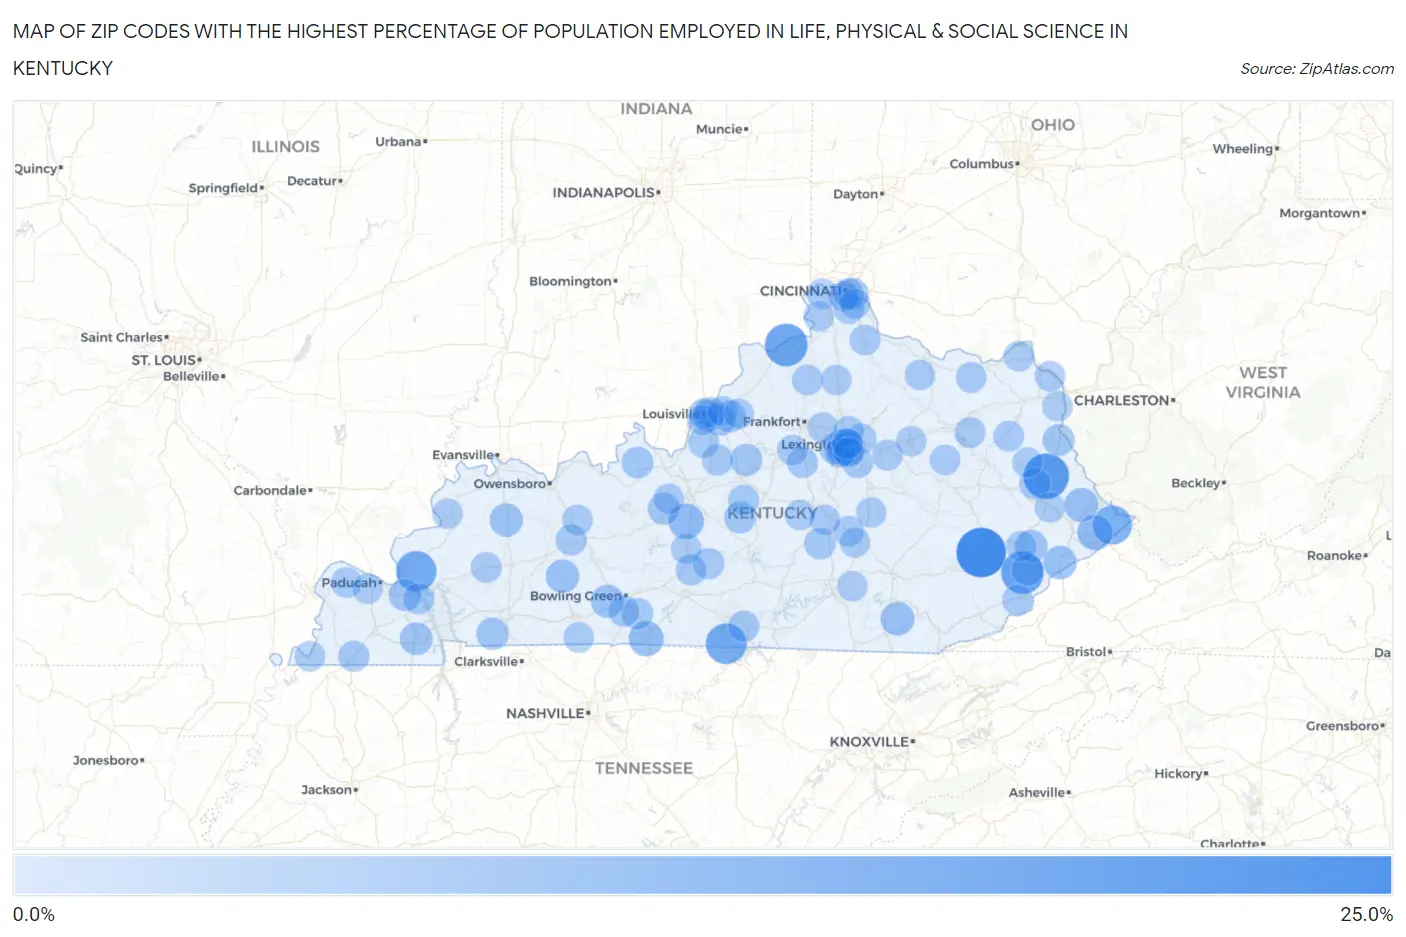
Map of Zip Codes with the Highest Percentage of Population Employed in Life, Physical & Social Science in Kentucky
0.0%
25.0%
Zip Codes with the Highest Percentage of Population Employed in Life, Physical & Social Science in Kentucky
| Zip Code | % Employed | vs State | vs National | |
| 1. | 41754 | 22.1% | 0.77%(+21.4)#1 | 1.1%(+21.0)#51 |
| 2. | 41260 | 17.4% | 0.77%(+16.6)#2 | 1.1%(+16.3)#80 |
| 3. | 41832 | 14.5% | 0.77%(+13.7)#3 | 1.1%(+13.4)#111 |
| 4. | 41045 | 14.5% | 0.77%(+13.7)#4 | 1.1%(+13.4)#112 |
| 5. | 42151 | 12.3% | 0.77%(+11.6)#5 | 1.1%(+11.2)#141 |
| 6. | 42083 | 12.1% | 0.77%(+11.3)#6 | 1.1%(+11.0)#144 |
| 7. | 41553 | 10.5% | 0.77%(+9.70)#7 | 1.1%(+9.38)#194 |
| 8. | 42776 | 6.6% | 0.77%(+5.83)#8 | 1.1%(+5.50)#457 |
| 9. | 41554 | 6.4% | 0.77%(+5.60)#9 | 1.1%(+5.27)#492 |
| 10. | 42120 | 6.0% | 0.77%(+5.23)#10 | 1.1%(+4.91)#550 |
| 11. | 41571 | 5.1% | 0.77%(+4.28)#11 | 1.1%(+3.96)#747 |
| 12. | 40759 | 4.6% | 0.77%(+3.84)#12 | 1.1%(+3.51)#885 |
| 13. | 41537 | 4.4% | 0.77%(+3.64)#13 | 1.1%(+3.32)#959 |
| 14. | 42324 | 4.4% | 0.77%(+3.59)#14 | 1.1%(+3.27)#983 |
| 15. | 42456 | 4.1% | 0.77%(+3.38)#15 | 1.1%(+3.05)#1,075 |
| 16. | 42274 | 4.1% | 0.77%(+3.30)#16 | 1.1%(+2.98)#1,115 |
| 17. | 42020 | 3.7% | 0.77%(+2.96)#17 | 1.1%(+2.64)#1,299 |
| 18. | 41844 | 3.6% | 0.77%(+2.80)#18 | 1.1%(+2.48)#1,380 |
| 19. | 40502 | 3.5% | 0.77%(+2.72)#19 | 1.1%(+2.40)#1,431 |
| 20. | 42236 | 3.3% | 0.77%(+2.54)#20 | 1.1%(+2.22)#1,569 |
| 21. | 42029 | 3.1% | 0.77%(+2.37)#21 | 1.1%(+2.05)#1,719 |
| 22. | 40020 | 3.0% | 0.77%(+2.26)#22 | 1.1%(+1.94)#1,843 |
| 23. | 40504 | 3.0% | 0.77%(+2.26)#23 | 1.1%(+1.94)#1,844 |
| 24. | 42732 | 2.9% | 0.77%(+2.11)#24 | 1.1%(+1.79)#2,015 |
| 25. | 40243 | 2.8% | 0.77%(+2.06)#25 | 1.1%(+1.74)#2,080 |
| 26. | 41230 | 2.7% | 0.77%(+1.96)#26 | 1.1%(+1.64)#2,205 |
| 27. | 41075 | 2.7% | 0.77%(+1.96)#27 | 1.1%(+1.64)#2,215 |
| 28. | 40176 | 2.6% | 0.77%(+1.82)#28 | 1.1%(+1.50)#2,416 |
| 29. | 40060 | 2.6% | 0.77%(+1.82)#29 | 1.1%(+1.49)#2,426 |
| 30. | 41826 | 2.5% | 0.77%(+1.76)#30 | 1.1%(+1.44)#2,522 |
| 31. | 40220 | 2.5% | 0.77%(+1.73)#31 | 1.1%(+1.41)#2,578 |
| 32. | 40442 | 2.5% | 0.77%(+1.69)#32 | 1.1%(+1.36)#2,657 |
| 33. | 41222 | 2.4% | 0.77%(+1.61)#33 | 1.1%(+1.29)#2,800 |
| 34. | 42122 | 2.3% | 0.77%(+1.51)#34 | 1.1%(+1.19)#3,005 |
| 35. | 40204 | 2.3% | 0.77%(+1.50)#35 | 1.1%(+1.18)#3,026 |
| 36. | 40513 | 2.2% | 0.77%(+1.41)#36 | 1.1%(+1.09)#3,228 |
| 37. | 40503 | 2.2% | 0.77%(+1.39)#37 | 1.1%(+1.07)#3,280 |
| 38. | 42717 | 2.0% | 0.77%(+1.25)#38 | 1.1%(+0.927)#3,637 |
| 39. | 42044 | 2.0% | 0.77%(+1.24)#39 | 1.1%(+0.918)#3,662 |
| 40. | 40110 | 2.0% | 0.77%(+1.20)#40 | 1.1%(+0.881)#3,768 |
| 41. | 42041 | 2.0% | 0.77%(+1.20)#41 | 1.1%(+0.877)#3,779 |
| 42. | 40508 | 2.0% | 0.77%(+1.18)#42 | 1.1%(+0.861)#3,823 |
| 43. | 42746 | 1.9% | 0.77%(+1.16)#43 | 1.1%(+0.840)#3,883 |
| 44. | 42354 | 1.9% | 0.77%(+1.14)#44 | 1.1%(+0.814)#3,962 |
| 45. | 40372 | 1.9% | 0.77%(+1.10)#45 | 1.1%(+0.773)#4,094 |
| 46. | 42749 | 1.8% | 0.77%(+1.05)#46 | 1.1%(+0.731)#4,248 |
| 47. | 40515 | 1.8% | 0.77%(+1.05)#47 | 1.1%(+0.730)#4,258 |
| 48. | 42104 | 1.7% | 0.77%(+0.962)#48 | 1.1%(+0.638)#4,596 |
| 49. | 40037 | 1.7% | 0.77%(+0.958)#49 | 1.1%(+0.635)#4,612 |
| 50. | 40109 | 1.7% | 0.77%(+0.929)#50 | 1.1%(+0.606)#4,743 |
| 51. | 42053 | 1.7% | 0.77%(+0.896)#51 | 1.1%(+0.572)#4,881 |
| 52. | 40206 | 1.7% | 0.77%(+0.888)#52 | 1.1%(+0.564)#4,923 |
| 53. | 40313 | 1.7% | 0.77%(+0.883)#53 | 1.1%(+0.560)#4,942 |
| 54. | 41171 | 1.6% | 0.77%(+0.877)#54 | 1.1%(+0.553)#4,976 |
| 55. | 40359 | 1.6% | 0.77%(+0.855)#55 | 1.1%(+0.531)#5,068 |
| 56. | 41006 | 1.6% | 0.77%(+0.848)#56 | 1.1%(+0.524)#5,093 |
| 57. | 40391 | 1.6% | 0.77%(+0.837)#57 | 1.1%(+0.513)#5,138 |
| 58. | 40419 | 1.6% | 0.77%(+0.815)#58 | 1.1%(+0.491)#5,241 |
| 59. | 42347 | 1.6% | 0.77%(+0.810)#59 | 1.1%(+0.486)#5,263 |
| 60. | 40342 | 1.5% | 0.77%(+0.781)#60 | 1.1%(+0.457)#5,392 |
| 61. | 40516 | 1.5% | 0.77%(+0.779)#61 | 1.1%(+0.455)#5,404 |
| 62. | 42408 | 1.5% | 0.77%(+0.773)#62 | 1.1%(+0.449)#5,444 |
| 63. | 41015 | 1.5% | 0.77%(+0.757)#63 | 1.1%(+0.433)#5,524 |
| 64. | 41179 | 1.5% | 0.77%(+0.742)#64 | 1.1%(+0.418)#5,614 |
| 65. | 41011 | 1.5% | 0.77%(+0.731)#65 | 1.1%(+0.407)#5,665 |
| 66. | 41048 | 1.4% | 0.77%(+0.680)#66 | 1.1%(+0.356)#5,933 |
| 67. | 40514 | 1.4% | 0.77%(+0.669)#67 | 1.1%(+0.345)#5,988 |
| 68. | 42724 | 1.4% | 0.77%(+0.664)#68 | 1.1%(+0.340)#6,019 |
| 69. | 40484 | 1.4% | 0.77%(+0.662)#69 | 1.1%(+0.338)#6,031 |
| 70. | 40322 | 1.4% | 0.77%(+0.645)#70 | 1.1%(+0.322)#6,120 |
| 71. | 41071 | 1.4% | 0.77%(+0.634)#71 | 1.1%(+0.311)#6,181 |
| 72. | 40823 | 1.4% | 0.77%(+0.633)#72 | 1.1%(+0.309)#6,189 |
| 73. | 41010 | 1.4% | 0.77%(+0.628)#73 | 1.1%(+0.304)#6,230 |
| 74. | 42765 | 1.3% | 0.77%(+0.573)#74 | 1.1%(+0.250)#6,526 |
| 75. | 40404 | 1.3% | 0.77%(+0.570)#75 | 1.1%(+0.246)#6,556 |
| 76. | 40202 | 1.3% | 0.77%(+0.556)#76 | 1.1%(+0.232)#6,643 |
| 77. | 40511 | 1.3% | 0.77%(+0.548)#77 | 1.1%(+0.225)#6,705 |
| 78. | 41169 | 1.3% | 0.77%(+0.547)#78 | 1.1%(+0.223)#6,715 |
| 79. | 41055 | 1.3% | 0.77%(+0.542)#79 | 1.1%(+0.218)#6,752 |
| 80. | 42202 | 1.3% | 0.77%(+0.533)#80 | 1.1%(+0.209)#6,803 |
| 81. | 41822 | 1.3% | 0.77%(+0.532)#81 | 1.1%(+0.208)#6,816 |
| 82. | 40507 | 1.3% | 0.77%(+0.527)#82 | 1.1%(+0.204)#6,840 |
| 83. | 40353 | 1.3% | 0.77%(+0.515)#83 | 1.1%(+0.192)#6,911 |
| 84. | 40208 | 1.3% | 0.77%(+0.506)#84 | 1.1%(+0.182)#6,978 |
| 85. | 41129 | 1.3% | 0.77%(+0.504)#85 | 1.1%(+0.180)#6,992 |
| 86. | 41091 | 1.3% | 0.77%(+0.501)#86 | 1.1%(+0.177)#7,019 |
| 87. | 40409 | 1.2% | 0.77%(+0.480)#87 | 1.1%(+0.156)#7,151 |
| 88. | 41175 | 1.2% | 0.77%(+0.450)#88 | 1.1%(+0.127)#7,365 |
| 89. | 42001 | 1.2% | 0.77%(+0.449)#89 | 1.1%(+0.125)#7,375 |
| 90. | 40242 | 1.2% | 0.77%(+0.433)#90 | 1.1%(+0.109)#7,496 |
| 91. | 42459 | 1.2% | 0.77%(+0.391)#91 | 1.1%(+0.067)#7,808 |
| 92. | 41601 | 1.2% | 0.77%(+0.389)#92 | 1.1%(+0.065)#7,821 |
| 93. | 40245 | 1.2% | 0.77%(+0.384)#93 | 1.1%(+0.060)#7,852 |
| 94. | 42050 | 1.1% | 0.77%(+0.379)#94 | 1.1%(+0.055)#7,890 |
| 95. | 41219 | 1.1% | 0.77%(+0.356)#95 | 1.1%(+0.033)#8,048 |
| 96. | 40347 | 1.1% | 0.77%(+0.340)#96 | 1.1%(+0.016)#8,175 |
| 97. | 40517 | 1.1% | 0.77%(+0.331)#97 | 1.1%(+0.007)#8,241 |
| 98. | 41076 | 1.1% | 0.77%(+0.328)#98 | 1.1%(+0.004)#8,264 |
| 99. | 40464 | 1.1% | 0.77%(+0.317)#99 | 1.1%(-0.006)#8,346 |
| 100. | 42501 | 1.1% | 0.77%(+0.316)#100 | 1.1%(-0.008)#8,368 |
Common Questions
What are the Top 10 Zip Codes with the Highest Percentage of Population Employed in Life, Physical & Social Science in Kentucky?
Top 10 Zip Codes with the Highest Percentage of Population Employed in Life, Physical & Social Science in Kentucky are:
What zip code has the Highest Percentage of Population Employed in Life, Physical & Social Science in Kentucky?
41754 has the Highest Percentage of Population Employed in Life, Physical & Social Science in Kentucky with 22.1%.
What is the Percentage of Population Employed in Life, Physical & Social Science in the State of Kentucky?
Percentage of Population Employed in Life, Physical & Social Science in Kentucky is 0.77%.
What is the Percentage of Population Employed in Life, Physical & Social Science in the United States?
Percentage of Population Employed in Life, Physical & Social Science in the United States is 1.1%.