Fort Wright, KY Map & Demographics
Fort Wright Map
Fort Wright Overview
$48,433
PER CAPITA INCOME
$133,125
AVG FAMILY INCOME
$105,075
AVG HOUSEHOLD INCOME
27.9%
WAGE / INCOME GAP [ % ]
72.1¢/ $1
WAGE / INCOME GAP [ $ ]
$12,319
FAMILY INCOME DEFICIT
0.38
INEQUALITY / GINI INDEX
5,841
TOTAL POPULATION
2,986
MALE POPULATION
2,855
FEMALE POPULATION
104.59
MALES / 100 FEMALES
95.61
FEMALES / 100 MALES
39.4
MEDIAN AGE
3.2
AVG FAMILY SIZE
2.4
AVG HOUSEHOLD SIZE
3,193
LABOR FORCE [ PEOPLE ]
66.5%
PERCENT IN LABOR FORCE
2.7%
UNEMPLOYMENT RATE
Income in Fort Wright
Income Overview in Fort Wright
Per Capita Income in Fort Wright is $48,433, while median incomes of families and households are $133,125 and $105,075 respectively.
| Characteristic | Number | Measure |
| Per Capita Income | 5,841 | $48,433 |
| Median Family Income | 1,455 | $133,125 |
| Mean Family Income | 1,455 | $134,205 |
| Median Household Income | 2,415 | $105,075 |
| Mean Household Income | 2,415 | $115,859 |
| Income Deficit | 1,455 | $12,319 |
| Wage / Income Gap (%) | 5,841 | 27.91% |
| Wage / Income Gap ($) | 5,841 | 72.09¢ per $1 |
| Gini / Inequality Index | 5,841 | 0.38 |
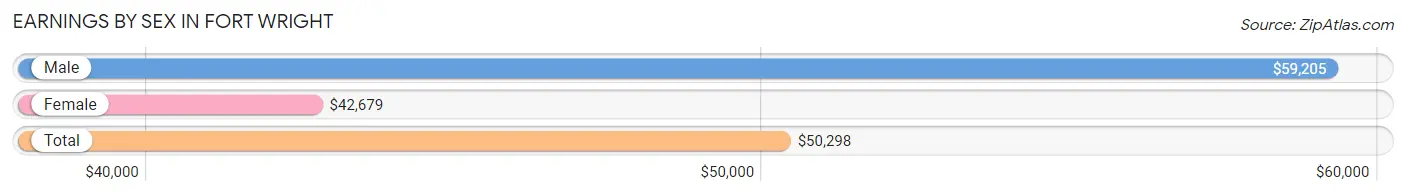
Earnings by Sex in Fort Wright
Average Earnings in Fort Wright are $50,298, $59,205 for men and $42,679 for women, a difference of 27.9%.
| Sex | Number | Average Earnings |
| Male | 1,785 (51.5%) | $59,205 |
| Female | 1,684 (48.5%) | $42,679 |
| Total | 3,469 (100.0%) | $50,298 |
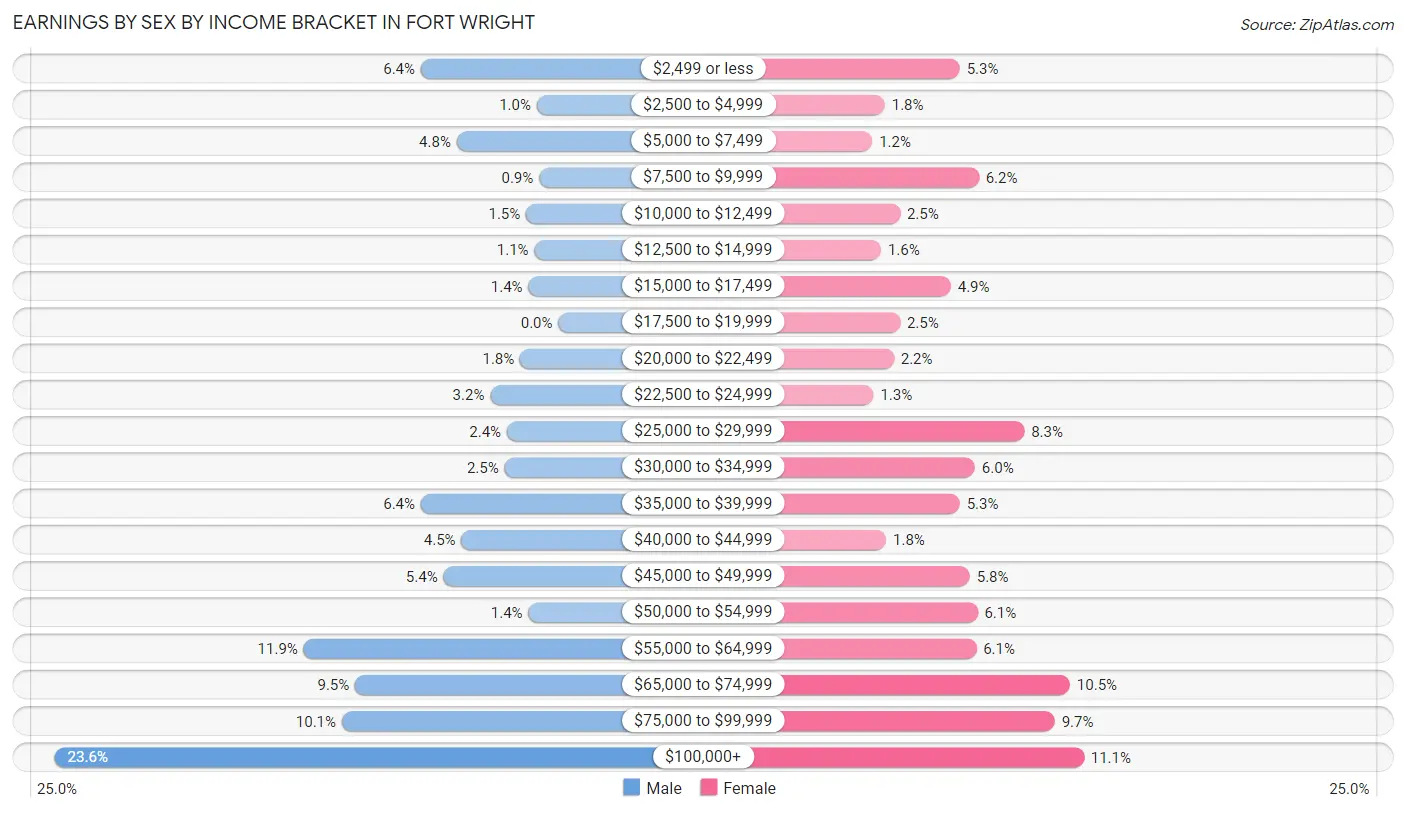
Earnings by Sex by Income Bracket in Fort Wright
The most common earnings brackets in Fort Wright are $100,000+ for men (421 | 23.6%) and $100,000+ for women (187 | 11.1%).
| Income | Male | Female |
| $2,499 or less | 115 (6.4%) | 89 (5.3%) |
| $2,500 to $4,999 | 18 (1.0%) | 30 (1.8%) |
| $5,000 to $7,499 | 85 (4.8%) | 20 (1.2%) |
| $7,500 to $9,999 | 16 (0.9%) | 104 (6.2%) |
| $10,000 to $12,499 | 27 (1.5%) | 42 (2.5%) |
| $12,500 to $14,999 | 20 (1.1%) | 27 (1.6%) |
| $15,000 to $17,499 | 25 (1.4%) | 82 (4.9%) |
| $17,500 to $19,999 | 0 (0.0%) | 42 (2.5%) |
| $20,000 to $22,499 | 32 (1.8%) | 37 (2.2%) |
| $22,500 to $24,999 | 57 (3.2%) | 21 (1.3%) |
| $25,000 to $29,999 | 43 (2.4%) | 140 (8.3%) |
| $30,000 to $34,999 | 45 (2.5%) | 101 (6.0%) |
| $35,000 to $39,999 | 115 (6.4%) | 89 (5.3%) |
| $40,000 to $44,999 | 81 (4.5%) | 31 (1.8%) |
| $45,000 to $49,999 | 96 (5.4%) | 97 (5.8%) |
| $50,000 to $54,999 | 25 (1.4%) | 103 (6.1%) |
| $55,000 to $64,999 | 213 (11.9%) | 102 (6.1%) |
| $65,000 to $74,999 | 170 (9.5%) | 176 (10.4%) |
| $75,000 to $99,999 | 181 (10.1%) | 164 (9.7%) |
| $100,000+ | 421 (23.6%) | 187 (11.1%) |
| Total | 1,785 (100.0%) | 1,684 (100.0%) |
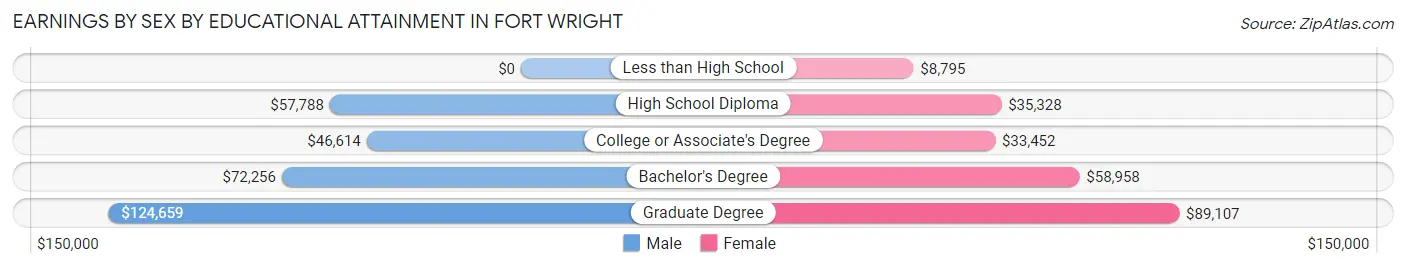
Earnings by Sex by Educational Attainment in Fort Wright
Average earnings in Fort Wright are $69,028 for men and $47,028 for women, a difference of 31.9%. Men with an educational attainment of graduate degree enjoy the highest average annual earnings of $124,659, while those with college or associate's degree education earn the least with $46,614. Women with an educational attainment of graduate degree earn the most with the average annual earnings of $89,107, while those with less than high school education have the smallest earnings of $8,795.
| Educational Attainment | Male Income | Female Income |
| Less than High School | - | - |
| High School Diploma | $57,788 | $35,328 |
| College or Associate's Degree | $46,614 | $33,452 |
| Bachelor's Degree | $72,256 | $58,958 |
| Graduate Degree | $124,659 | $89,107 |
| Total | $69,028 | $47,028 |
Family Income in Fort Wright
Family Income Brackets in Fort Wright
According to the Fort Wright family income data, there are 391 families falling into the $150,000 to $199,999 income range, which is the most common income bracket and makes up 26.9% of all families. Conversely, the $15,000 to $24,999 income bracket is the least frequent group with only 1 families (0.1%) belonging to this category.
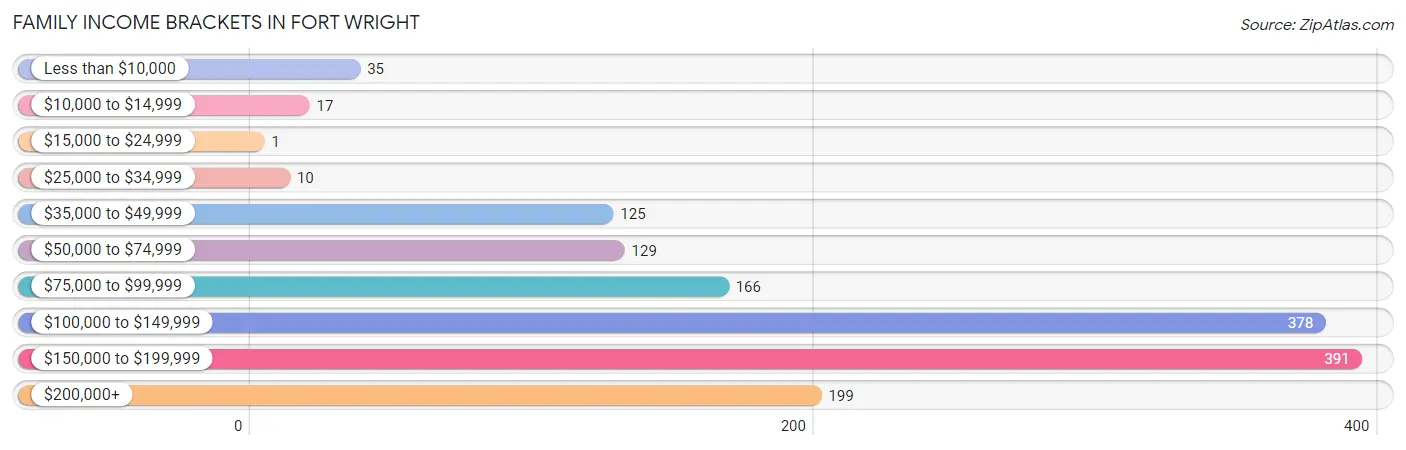
| Income Bracket | # Families | % Families |
| Less than $10,000 | 35 | 2.4% |
| $10,000 to $14,999 | 17 | 1.2% |
| $15,000 to $24,999 | 1 | 0.1% |
| $25,000 to $34,999 | 10 | 0.7% |
| $35,000 to $49,999 | 125 | 8.6% |
| $50,000 to $74,999 | 129 | 8.9% |
| $75,000 to $99,999 | 166 | 11.4% |
| $100,000 to $149,999 | 378 | 26.0% |
| $150,000 to $199,999 | 391 | 26.9% |
| $200,000+ | 199 | 13.7% |
Family Income by Famaliy Size in Fort Wright
6-person families (46 | 3.2%) account for the highest median family income in Fort Wright with $185,200 per family, while 2-person families (690 | 47.4%) have the highest median income of $60,714 per family member.
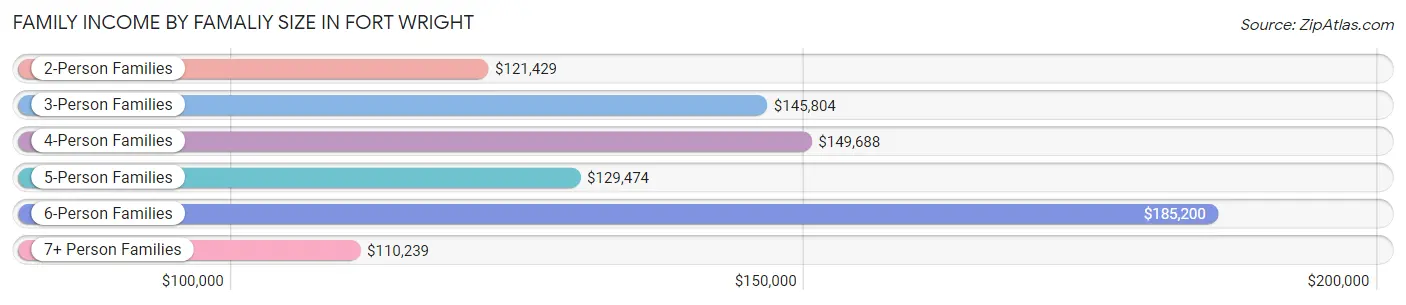
| Income Bracket | # Families | Median Income |
| 2-Person Families | 690 (47.4%) | $121,429 |
| 3-Person Families | 365 (25.1%) | $145,804 |
| 4-Person Families | 211 (14.5%) | $149,688 |
| 5-Person Families | 58 (4.0%) | $129,474 |
| 6-Person Families | 46 (3.2%) | $185,200 |
| 7+ Person Families | 85 (5.8%) | $110,239 |
| Total | 1,455 (100.0%) | $133,125 |
Family Income by Number of Earners in Fort Wright
The median family income in Fort Wright is $133,125, with families comprising 2 earners (733) having the highest median family income of $150,694, while families with no earners (215) have the lowest median family income of $76,078, accounting for 50.4% and 14.8% of families, respectively.
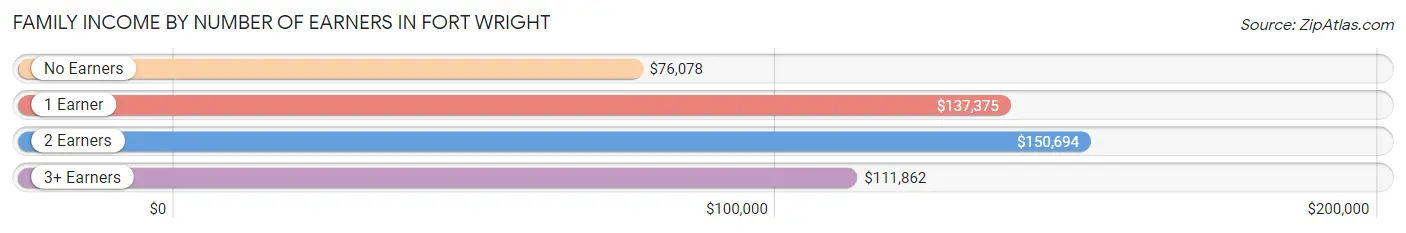
| Number of Earners | # Families | Median Income |
| No Earners | 215 (14.8%) | $76,078 |
| 1 Earner | 297 (20.4%) | $137,375 |
| 2 Earners | 733 (50.4%) | $150,694 |
| 3+ Earners | 210 (14.4%) | $111,862 |
| Total | 1,455 (100.0%) | $133,125 |
Household Income in Fort Wright
Household Income Brackets in Fort Wright
With 534 households falling in the category, the $100,000 to $149,999 income range is the most frequent in Fort Wright, accounting for 22.1% of all households. In contrast, only 29 households (1.2%) fall into the $10,000 to $14,999 income bracket, making it the least populous group.
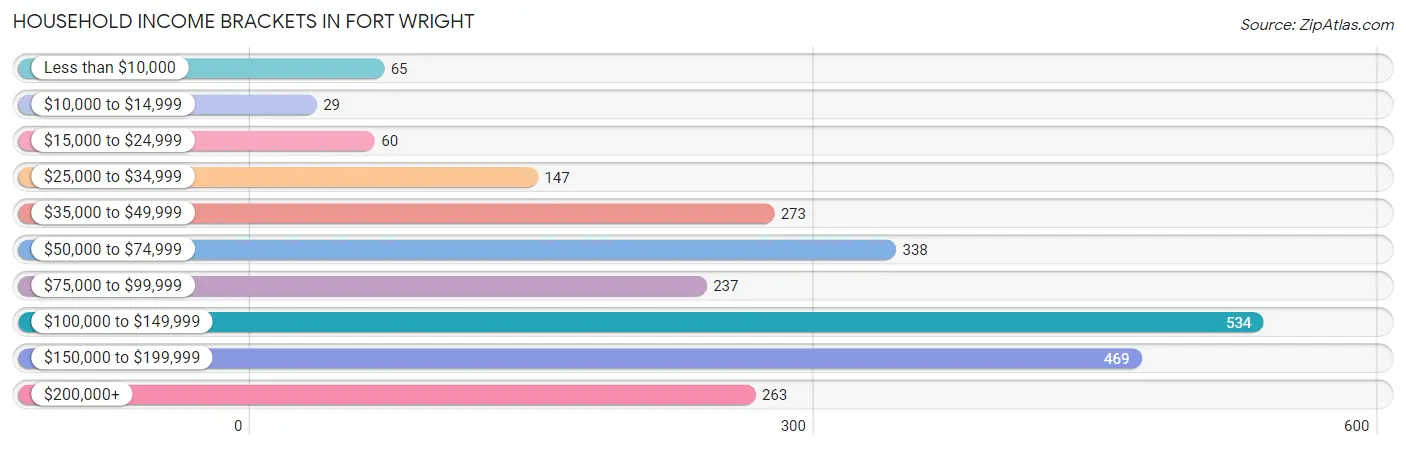
| Income Bracket | # Households | % Households |
| Less than $10,000 | 65 | 2.7% |
| $10,000 to $14,999 | 29 | 1.2% |
| $15,000 to $24,999 | 60 | 2.5% |
| $25,000 to $34,999 | 147 | 6.1% |
| $35,000 to $49,999 | 273 | 11.3% |
| $50,000 to $74,999 | 338 | 14.0% |
| $75,000 to $99,999 | 237 | 9.8% |
| $100,000 to $149,999 | 534 | 22.1% |
| $150,000 to $199,999 | 469 | 19.4% |
| $200,000+ | 263 | 10.9% |
Household Income by Householder Age in Fort Wright
The median household income in Fort Wright is $105,075, with the highest median household income of $126,167 found in the 25 to 44 years age bracket for the primary householder. A total of 710 households (29.4%) fall into this category. Meanwhile, the 15 to 24 years age bracket for the primary householder has the lowest median household income of $79,545, with 68 households (2.8%) in this group.
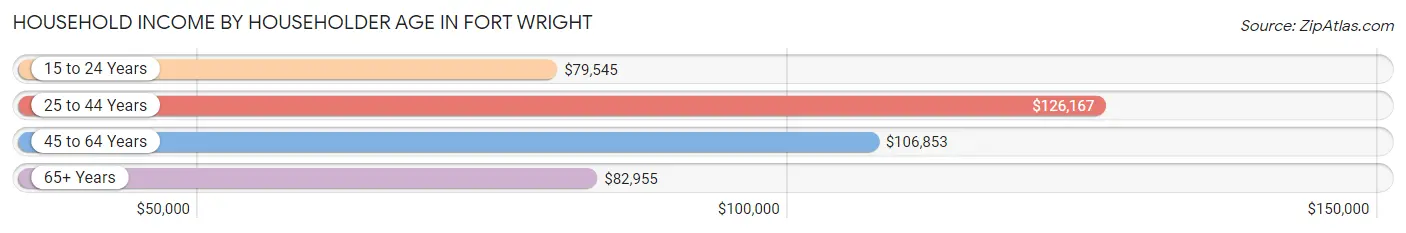
| Income Bracket | # Households | Median Income |
| 15 to 24 Years | 68 (2.8%) | $79,545 |
| 25 to 44 Years | 710 (29.4%) | $126,167 |
| 45 to 64 Years | 961 (39.8%) | $106,853 |
| 65+ Years | 676 (28.0%) | $82,955 |
| Total | 2,415 (100.0%) | $105,075 |
Poverty in Fort Wright
Income Below Poverty by Sex and Age in Fort Wright
With 2.1% poverty level for males and 4.5% for females among the residents of Fort Wright, 6 to 11 year old males and 15 year old females are the most vulnerable to poverty, with 9 males (4.8%) and 11 females (100.0%) in their respective age groups living below the poverty level.
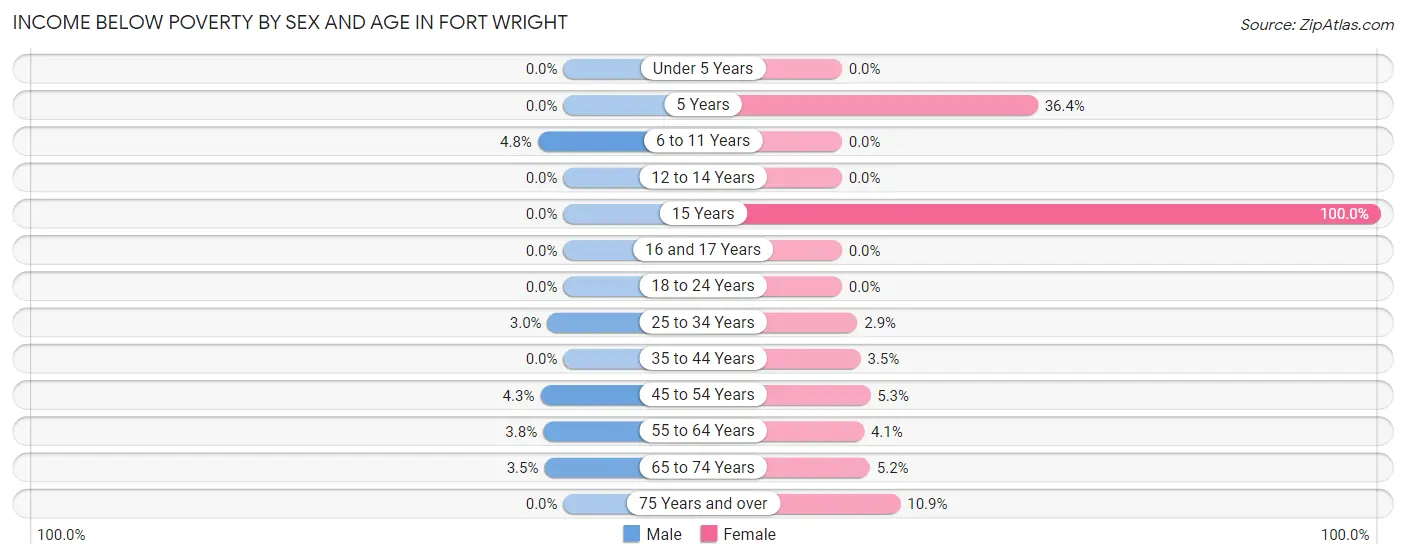
| Age Bracket | Male | Female |
| Under 5 Years | 0 (0.0%) | 0 (0.0%) |
| 5 Years | 0 (0.0%) | 12 (36.4%) |
| 6 to 11 Years | 9 (4.8%) | 0 (0.0%) |
| 12 to 14 Years | 0 (0.0%) | 0 (0.0%) |
| 15 Years | 0 (0.0%) | 11 (100.0%) |
| 16 and 17 Years | 0 (0.0%) | 0 (0.0%) |
| 18 to 24 Years | 0 (0.0%) | 0 (0.0%) |
| 25 to 34 Years | 12 (3.0%) | 13 (2.9%) |
| 35 to 44 Years | 0 (0.0%) | 10 (3.5%) |
| 45 to 54 Years | 12 (4.3%) | 21 (5.3%) |
| 55 to 64 Years | 16 (3.8%) | 22 (4.1%) |
| 65 to 74 Years | 13 (3.5%) | 20 (5.2%) |
| 75 Years and over | 0 (0.0%) | 19 (10.9%) |
| Total | 62 (2.1%) | 128 (4.5%) |
Income Above Poverty by Sex and Age in Fort Wright
According to the poverty statistics in Fort Wright, males aged under 5 years and females aged under 5 years are the age groups that are most secure financially, with 100.0% of males and 100.0% of females in these age groups living above the poverty line.
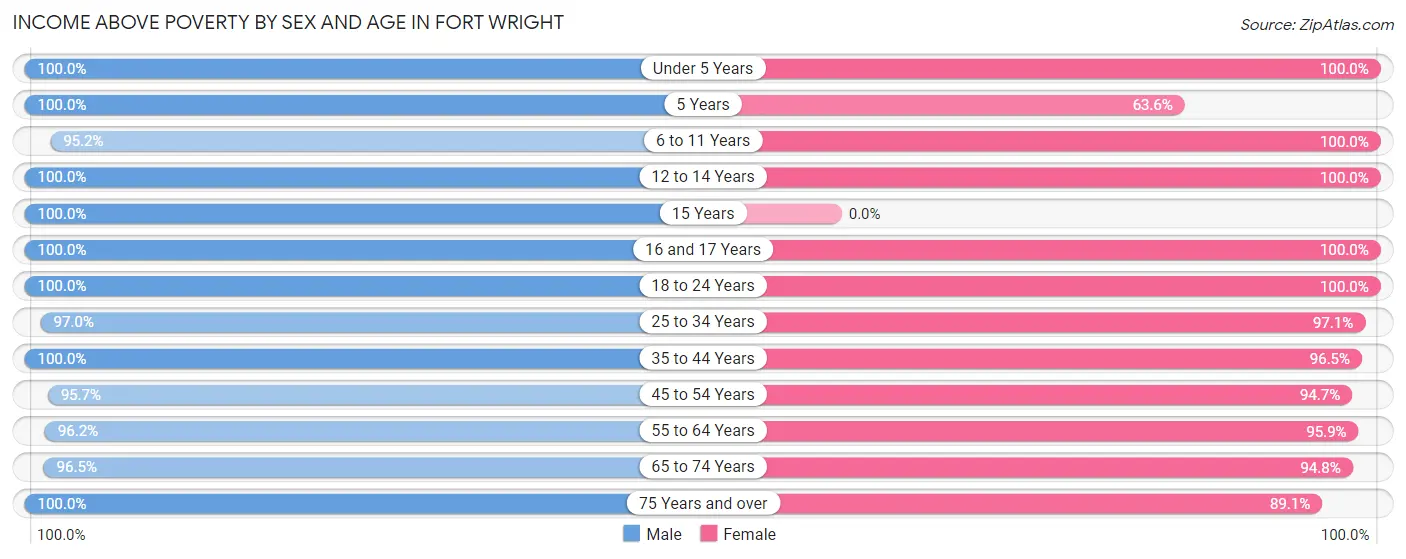
| Age Bracket | Male | Female |
| Under 5 Years | 198 (100.0%) | 117 (100.0%) |
| 5 Years | 116 (100.0%) | 21 (63.6%) |
| 6 to 11 Years | 180 (95.2%) | 206 (100.0%) |
| 12 to 14 Years | 95 (100.0%) | 64 (100.0%) |
| 15 Years | 10 (100.0%) | 0 (0.0%) |
| 16 and 17 Years | 118 (100.0%) | 33 (100.0%) |
| 18 to 24 Years | 311 (100.0%) | 161 (100.0%) |
| 25 to 34 Years | 393 (97.0%) | 439 (97.1%) |
| 35 to 44 Years | 338 (100.0%) | 277 (96.5%) |
| 45 to 54 Years | 268 (95.7%) | 376 (94.7%) |
| 55 to 64 Years | 407 (96.2%) | 513 (95.9%) |
| 65 to 74 Years | 354 (96.5%) | 364 (94.8%) |
| 75 Years and over | 136 (100.0%) | 156 (89.1%) |
| Total | 2,924 (97.9%) | 2,727 (95.5%) |
Income Below Poverty Among Married-Couple Families in Fort Wright
The poverty statistics for married-couple families in Fort Wright show that 1.8% or 21 of the total 1,188 families live below the poverty line. Families with no children have the highest poverty rate of 2.5%, comprising of 21 families. On the other hand, families with 1 or 2 children have the lowest poverty rate of 0.0%, which includes 0 families.
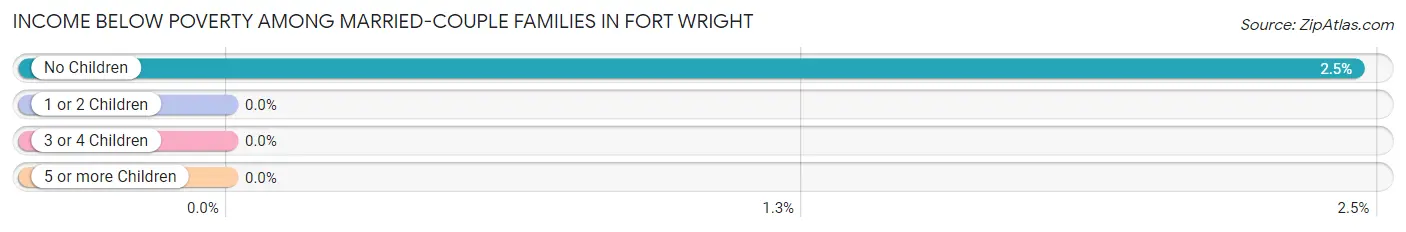
| Children | Above Poverty | Below Poverty |
| No Children | 835 (97.6%) | 21 (2.5%) |
| 1 or 2 Children | 279 (100.0%) | 0 (0.0%) |
| 3 or 4 Children | 41 (100.0%) | 0 (0.0%) |
| 5 or more Children | 12 (100.0%) | 0 (0.0%) |
| Total | 1,167 (98.2%) | 21 (1.8%) |
Income Below Poverty Among Single-Parent Households in Fort Wright
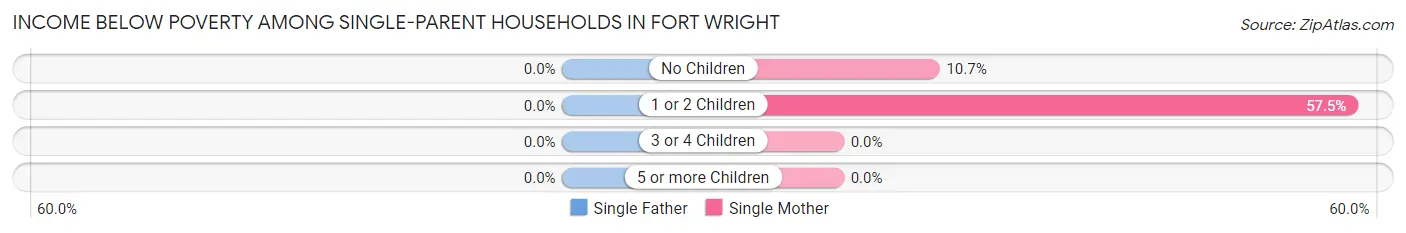
| Children | Single Father | Single Mother |
| No Children | 0 (0.0%) | 9 (10.7%) |
| 1 or 2 Children | 0 (0.0%) | 23 (57.5%) |
| 3 or 4 Children | 0 (0.0%) | 0 (0.0%) |
| 5 or more Children | 0 (0.0%) | 0 (0.0%) |
| Total | 0 (0.0%) | 32 (16.2%) |
Income Below Poverty Among Married-Couple vs Single-Parent Households in Fort Wright
The poverty data for Fort Wright shows that 21 of the married-couple family households (1.8%) and 32 of the single-parent households (12.0%) are living below the poverty level. Within the married-couple family households, those with no children have the highest poverty rate, with 21 households (2.5%) falling below the poverty line. Among the single-parent households, those with 1 or 2 children have the highest poverty rate, with 23 household (28.7%) living below poverty.
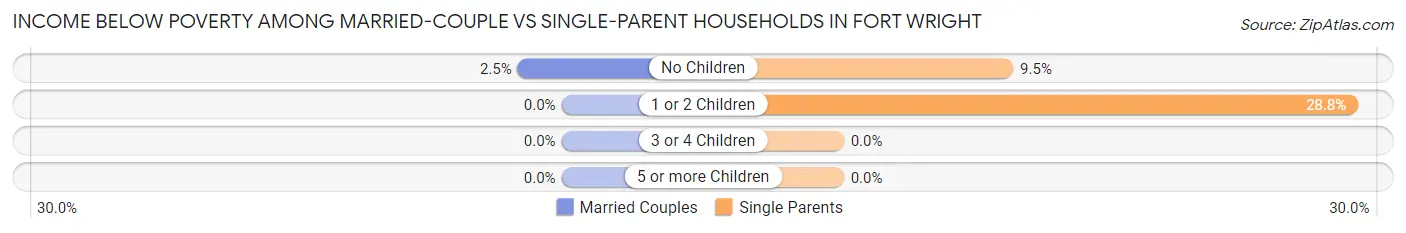
| Children | Married-Couple Families | Single-Parent Households |
| No Children | 21 (2.5%) | 9 (9.5%) |
| 1 or 2 Children | 0 (0.0%) | 23 (28.7%) |
| 3 or 4 Children | 0 (0.0%) | 0 (0.0%) |
| 5 or more Children | 0 (0.0%) | 0 (0.0%) |
| Total | 21 (1.8%) | 32 (12.0%) |
Race in Fort Wright
The most populous races in Fort Wright are White / Caucasian (5,262 | 90.1%), Two or more Races (354 | 6.1%), and Hispanic or Latino (137 | 2.4%).
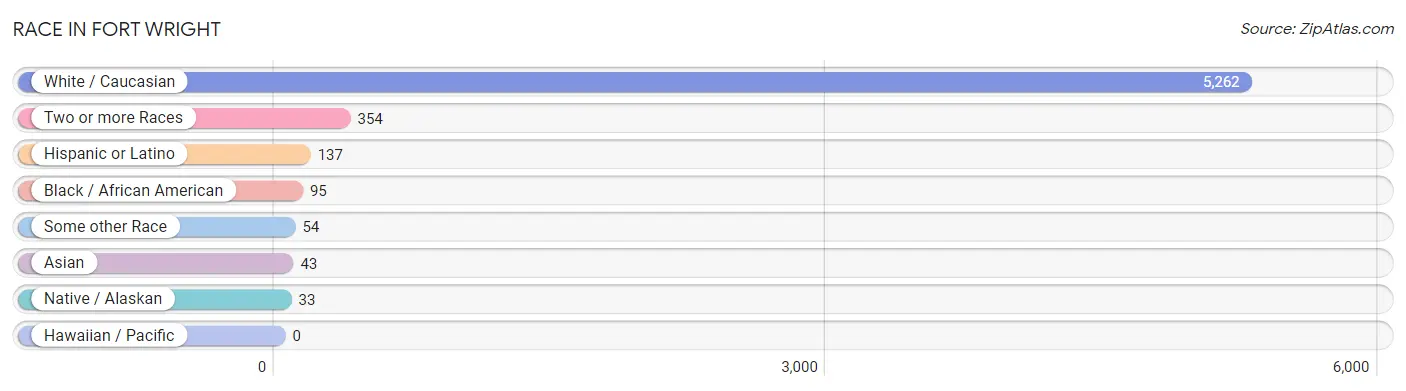
| Race | # Population | % Population |
| Asian | 43 | 0.7% |
| Black / African American | 95 | 1.6% |
| Hawaiian / Pacific | 0 | 0.0% |
| Hispanic or Latino | 137 | 2.4% |
| Native / Alaskan | 33 | 0.6% |
| White / Caucasian | 5,262 | 90.1% |
| Two or more Races | 354 | 6.1% |
| Some other Race | 54 | 0.9% |
| Total | 5,841 | 100.0% |
Ancestry in Fort Wright
The most populous ancestries reported in Fort Wright are German (2,477 | 42.4%), Irish (1,054 | 18.0%), English (787 | 13.5%), American (399 | 6.8%), and French (301 | 5.1%), together accounting for 85.9% of all Fort Wright residents.
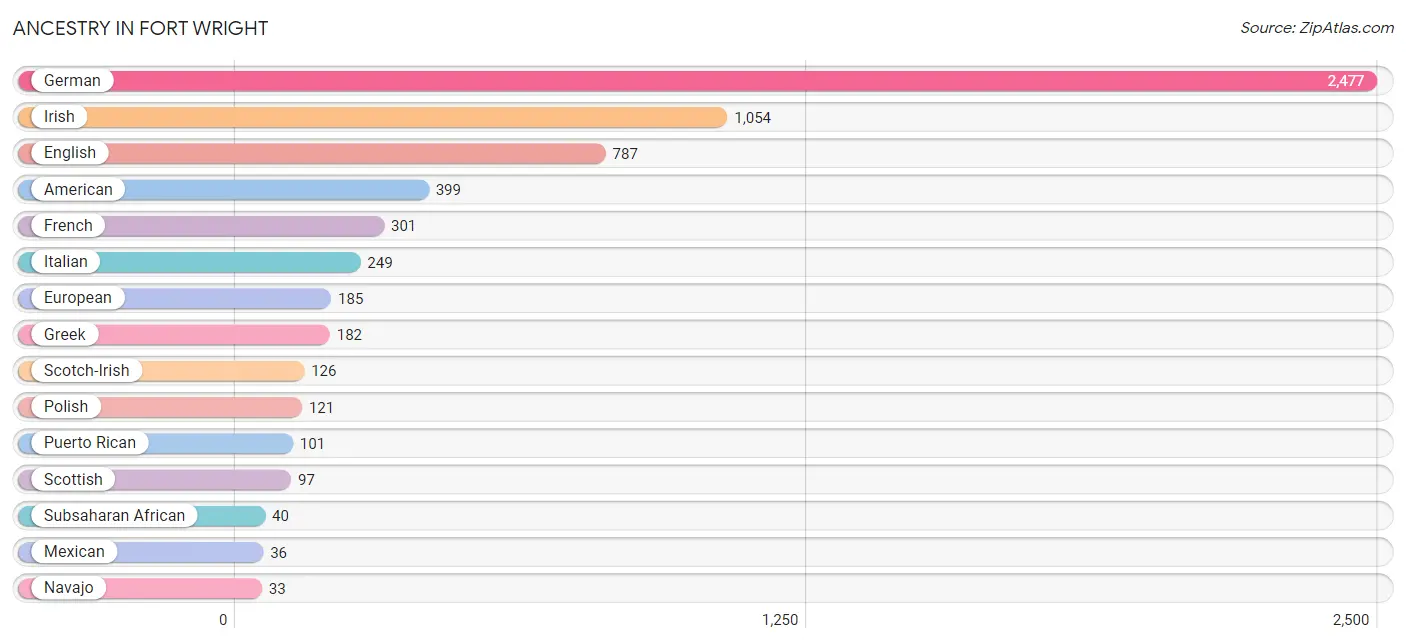
| Ancestry | # Population | % Population |
| African | 25 | 0.4% |
| Albanian | 12 | 0.2% |
| American | 399 | 6.8% |
| Belgian | 26 | 0.4% |
| British | 17 | 0.3% |
| Burmese | 29 | 0.5% |
| Central American Indian | 25 | 0.4% |
| Cherokee | 12 | 0.2% |
| Dutch | 14 | 0.2% |
| Eastern European | 23 | 0.4% |
| English | 787 | 13.5% |
| European | 185 | 3.2% |
| French | 301 | 5.1% |
| French Canadian | 7 | 0.1% |
| German | 2,477 | 42.4% |
| Greek | 182 | 3.1% |
| Indian (Asian) | 17 | 0.3% |
| Irish | 1,054 | 18.0% |
| Italian | 249 | 4.3% |
| Kenyan | 8 | 0.1% |
| Mexican | 36 | 0.6% |
| Navajo | 33 | 0.6% |
| Polish | 121 | 2.1% |
| Puerto Rican | 101 | 1.7% |
| Scandinavian | 9 | 0.2% |
| Scotch-Irish | 126 | 2.2% |
| Scottish | 97 | 1.7% |
| Subsaharan African | 40 | 0.7% |
| Swiss | 21 | 0.4% |
| Ukrainian | 13 | 0.2% |
| Welsh | 16 | 0.3% |
| West Indian | 11 | 0.2% | View All 32 Rows |
Immigrants in Fort Wright
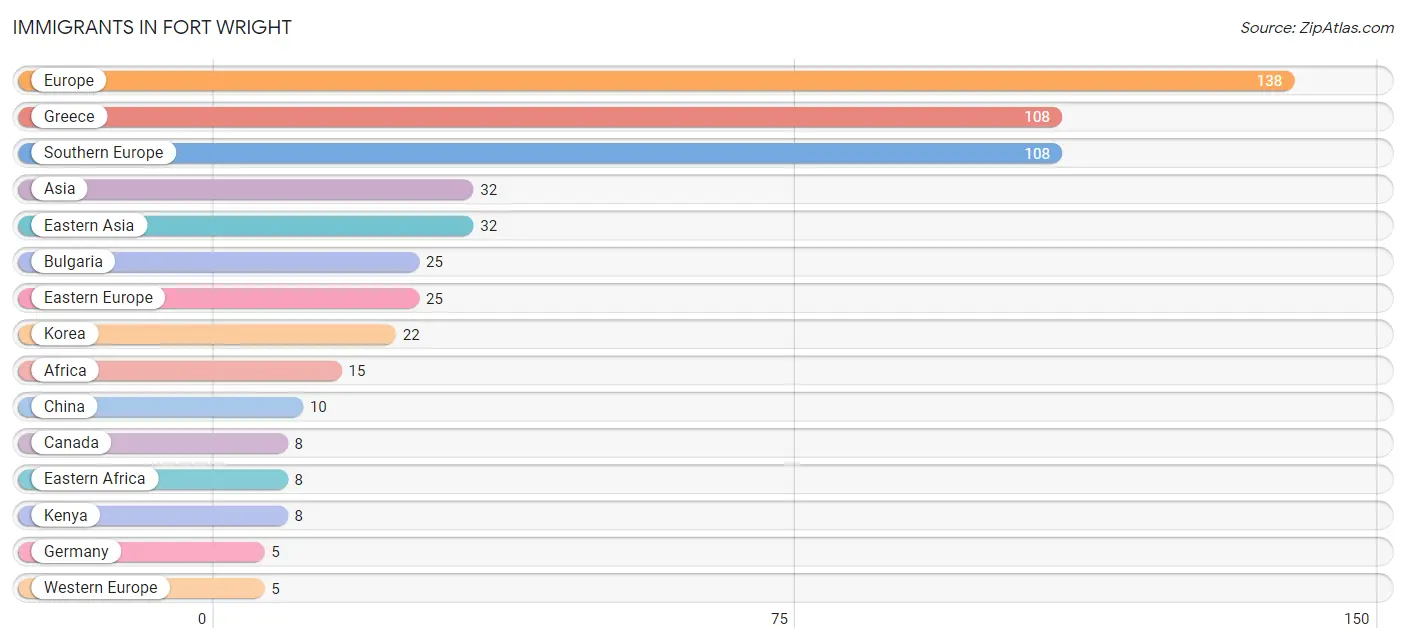
The most numerous immigrant groups reported in Fort Wright came from Europe (138 | 2.4%), Greece (108 | 1.8%), Southern Europe (108 | 1.8%), Asia (32 | 0.5%), and Eastern Asia (32 | 0.5%), together accounting for 7.2% of all Fort Wright residents.
| Immigration Origin | # Population | % Population |
| Africa | 15 | 0.3% |
| Asia | 32 | 0.5% |
| Bulgaria | 25 | 0.4% |
| Canada | 8 | 0.1% |
| China | 10 | 0.2% |
| Eastern Africa | 8 | 0.1% |
| Eastern Asia | 32 | 0.5% |
| Eastern Europe | 25 | 0.4% |
| Europe | 138 | 2.4% |
| Germany | 5 | 0.1% |
| Greece | 108 | 1.8% |
| Kenya | 8 | 0.1% |
| Korea | 22 | 0.4% |
| Southern Europe | 108 | 1.8% |
| Western Europe | 5 | 0.1% | View All 15 Rows |
Sex and Age in Fort Wright
Sex and Age in Fort Wright
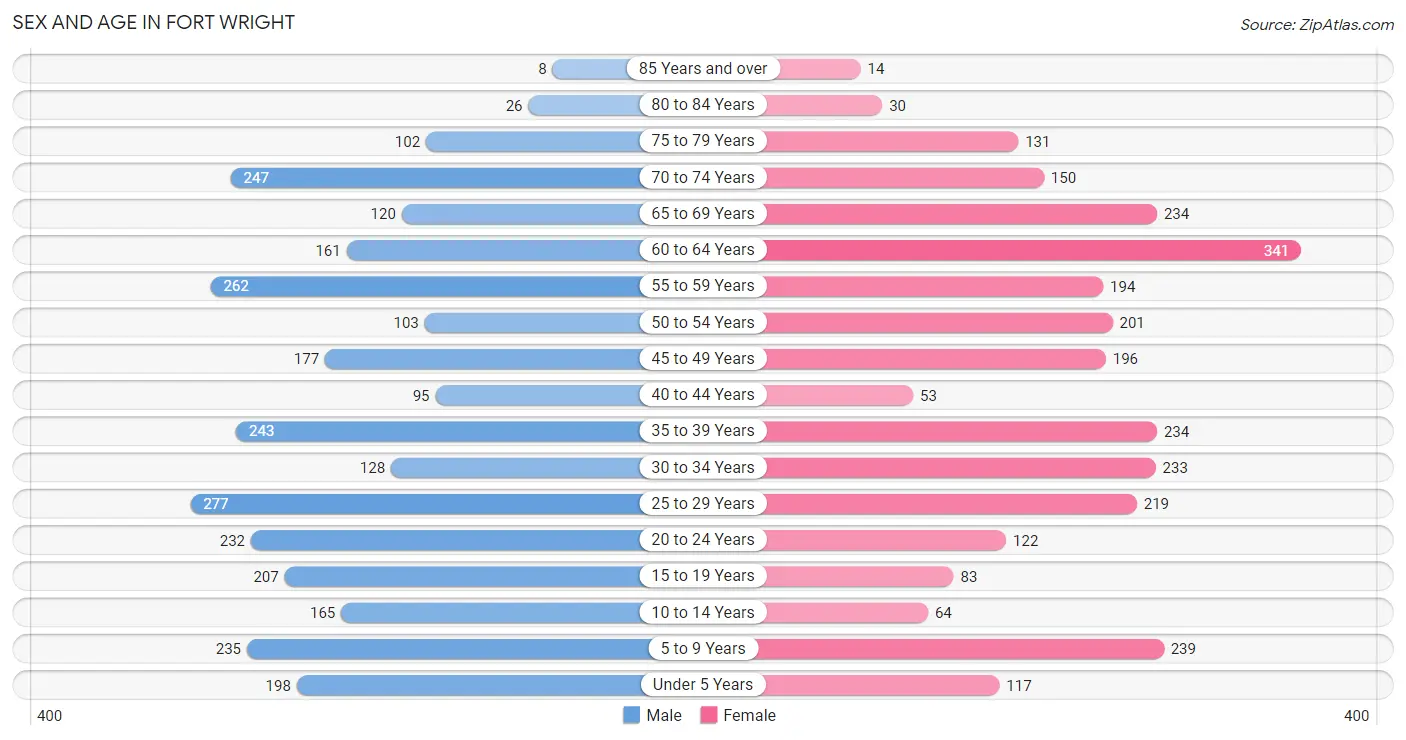
The most populous age groups in Fort Wright are 25 to 29 Years (277 | 9.3%) for men and 60 to 64 Years (341 | 11.9%) for women.
| Age Bracket | Male | Female |
| Under 5 Years | 198 (6.6%) | 117 (4.1%) |
| 5 to 9 Years | 235 (7.9%) | 239 (8.4%) |
| 10 to 14 Years | 165 (5.5%) | 64 (2.2%) |
| 15 to 19 Years | 207 (6.9%) | 83 (2.9%) |
| 20 to 24 Years | 232 (7.8%) | 122 (4.3%) |
| 25 to 29 Years | 277 (9.3%) | 219 (7.7%) |
| 30 to 34 Years | 128 (4.3%) | 233 (8.2%) |
| 35 to 39 Years | 243 (8.1%) | 234 (8.2%) |
| 40 to 44 Years | 95 (3.2%) | 53 (1.9%) |
| 45 to 49 Years | 177 (5.9%) | 196 (6.9%) |
| 50 to 54 Years | 103 (3.5%) | 201 (7.0%) |
| 55 to 59 Years | 262 (8.8%) | 194 (6.8%) |
| 60 to 64 Years | 161 (5.4%) | 341 (11.9%) |
| 65 to 69 Years | 120 (4.0%) | 234 (8.2%) |
| 70 to 74 Years | 247 (8.3%) | 150 (5.2%) |
| 75 to 79 Years | 102 (3.4%) | 131 (4.6%) |
| 80 to 84 Years | 26 (0.9%) | 30 (1.1%) |
| 85 Years and over | 8 (0.3%) | 14 (0.5%) |
| Total | 2,986 (100.0%) | 2,855 (100.0%) |
Families and Households in Fort Wright
Median Family Size in Fort Wright
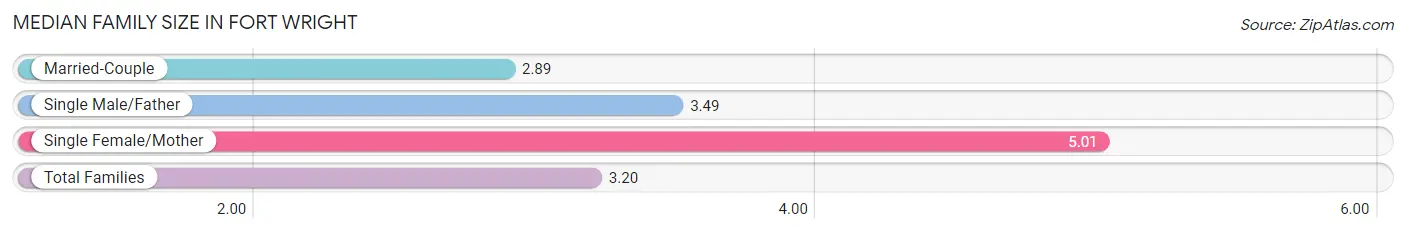
The median family size in Fort Wright is 3.20 persons per family, with single female/mother families (197 | 13.5%) accounting for the largest median family size of 5.01 persons per family. On the other hand, married-couple families (1,188 | 81.7%) represent the smallest median family size with 2.89 persons per family.
| Family Type | # Families | Family Size |
| Married-Couple | 1,188 (81.7%) | 2.89 |
| Single Male/Father | 70 (4.8%) | 3.49 |
| Single Female/Mother | 197 (13.5%) | 5.01 |
| Total Families | 1,455 (100.0%) | 3.20 |
Median Household Size in Fort Wright
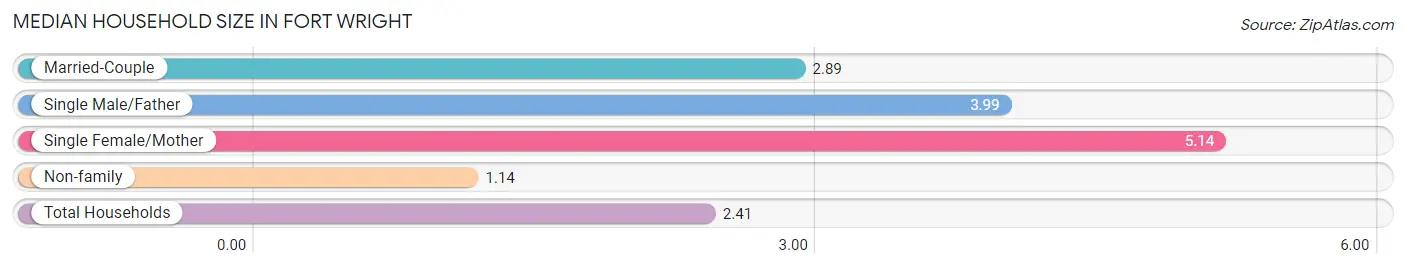
The median household size in Fort Wright is 2.41 persons per household, with single female/mother households (197 | 8.2%) accounting for the largest median household size of 5.14 persons per household. non-family households (960 | 39.8%) represent the smallest median household size with 1.14 persons per household.
| Household Type | # Households | Household Size |
| Married-Couple | 1,188 (49.2%) | 2.89 |
| Single Male/Father | 70 (2.9%) | 3.99 |
| Single Female/Mother | 197 (8.2%) | 5.14 |
| Non-family | 960 (39.8%) | 1.14 |
| Total Households | 2,415 (100.0%) | 2.41 |
Household Size by Marriage Status in Fort Wright
Out of a total of 2,415 households in Fort Wright, 1,455 (60.3%) are family households, while 960 (39.8%) are nonfamily households. The most numerous type of family households are 2-person households, comprising 656, and the most common type of nonfamily households are 1-person households, comprising 841.
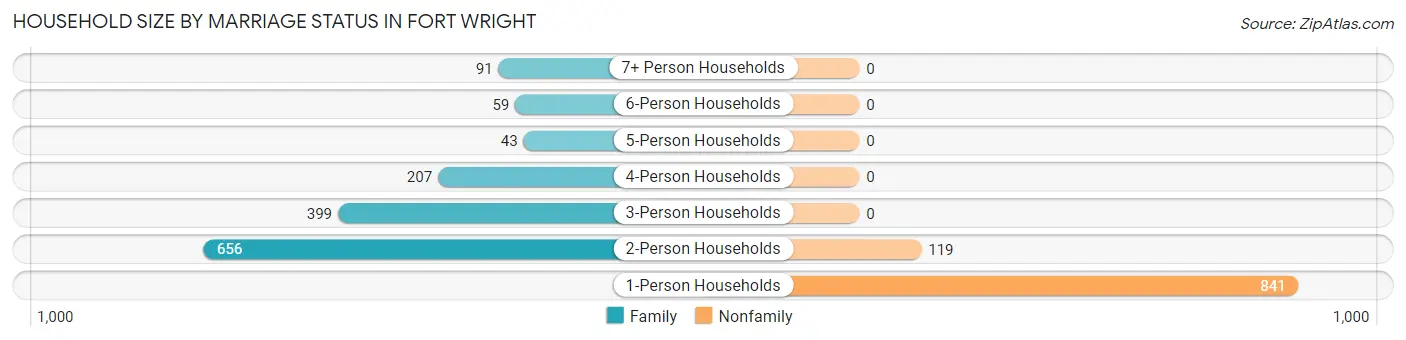
| Household Size | Family Households | Nonfamily Households |
| 1-Person Households | - | 841 (34.8%) |
| 2-Person Households | 656 (27.2%) | 119 (4.9%) |
| 3-Person Households | 399 (16.5%) | 0 (0.0%) |
| 4-Person Households | 207 (8.6%) | 0 (0.0%) |
| 5-Person Households | 43 (1.8%) | 0 (0.0%) |
| 6-Person Households | 59 (2.4%) | 0 (0.0%) |
| 7+ Person Households | 91 (3.8%) | 0 (0.0%) |
| Total | 1,455 (60.3%) | 960 (39.8%) |
Female Fertility in Fort Wright
Fertility by Age in Fort Wright
Average fertility rate in Fort Wright is 58.0 births per 1,000 women. Women in the age bracket of 20 to 34 years have the highest fertility rate with 89.0 births per 1,000 women. Women in the age bracket of 20 to 34 years acount for 71.8% of all women with births.
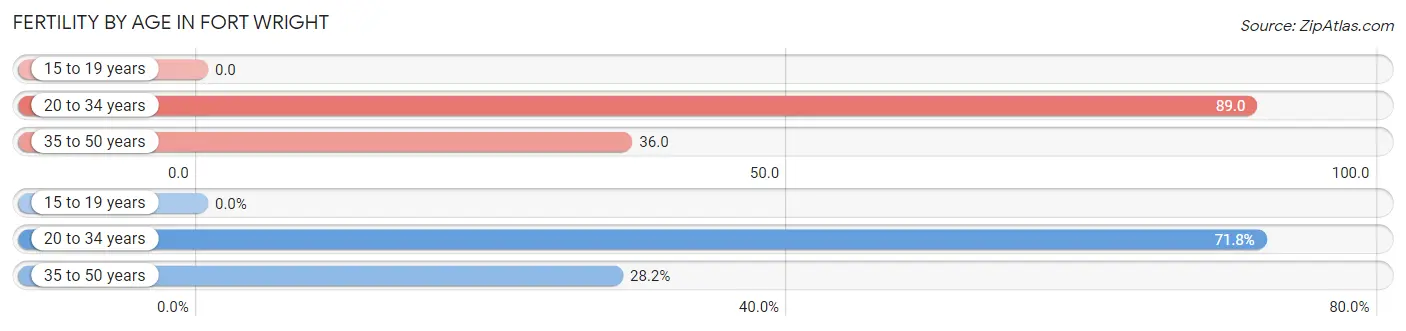
| Age Bracket | Women with Births | Births / 1,000 Women |
| 15 to 19 years | 0 (0.0%) | 0.0 |
| 20 to 34 years | 51 (71.8%) | 89.0 |
| 35 to 50 years | 20 (28.2%) | 36.0 |
| Total | 71 (100.0%) | 58.0 |
Fertility by Age by Marriage Status in Fort Wright
66.2% of women with births (71) in Fort Wright are married. The highest percentage of unmarried women with births falls into 35 to 50 years age bracket with 100.0% of them unmarried at the time of birth, while the lowest percentage of unmarried women with births belong to 20 to 34 years age bracket with 7.8% of them unmarried.
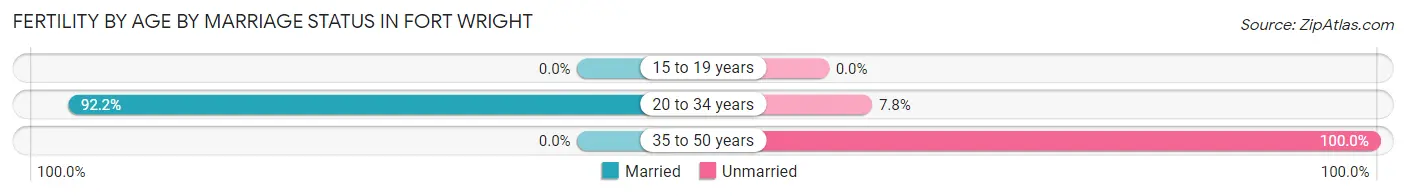
| Age Bracket | Married | Unmarried |
| 15 to 19 years | 0 (0.0%) | 0 (0.0%) |
| 20 to 34 years | 47 (92.2%) | 4 (7.8%) |
| 35 to 50 years | 0 (0.0%) | 20 (100.0%) |
| Total | 47 (66.2%) | 24 (33.8%) |
Fertility by Education in Fort Wright
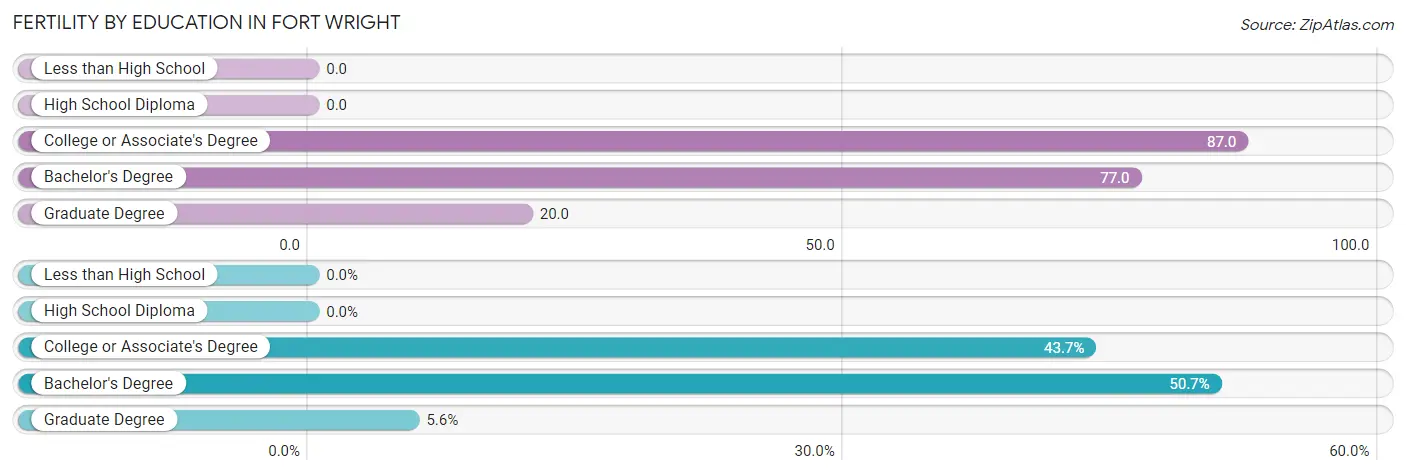
| Educational Attainment | Women with Births | Births / 1,000 Women |
| Less than High School | 0 (0.0%) | 0.0 |
| High School Diploma | 0 (0.0%) | 0.0 |
| College or Associate's Degree | 31 (43.7%) | 87.0 |
| Bachelor's Degree | 36 (50.7%) | 77.0 |
| Graduate Degree | 4 (5.6%) | 20.0 |
| Total | 71 (100.0%) | 58.0 |
Fertility by Education by Marriage Status in Fort Wright
33.8% of women with births in Fort Wright are unmarried. Women with the educational attainment of bachelor's degree are most likely to be married with 100.0% of them married at childbirth, while women with the educational attainment of graduate degree are least likely to be married with 100.0% of them unmarried at childbirth.
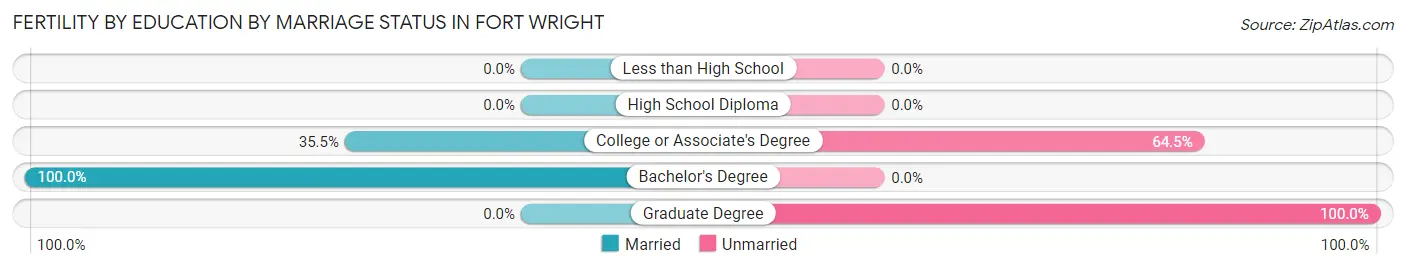
| Educational Attainment | Married | Unmarried |
| Less than High School | 0 (0.0%) | 0 (0.0%) |
| High School Diploma | 0 (0.0%) | 0 (0.0%) |
| College or Associate's Degree | 11 (35.5%) | 20 (64.5%) |
| Bachelor's Degree | 36 (100.0%) | 0 (0.0%) |
| Graduate Degree | 0 (0.0%) | 4 (100.0%) |
| Total | 47 (66.2%) | 24 (33.8%) |
Employment Characteristics in Fort Wright
Employment by Class of Employer in Fort Wright
Among the 3,077 employed individuals in Fort Wright, private company employees (2,185 | 71.0%), not-for-profit organizations (425 | 13.8%), and local government employees (214 | 7.0%) make up the most common classes of employment.
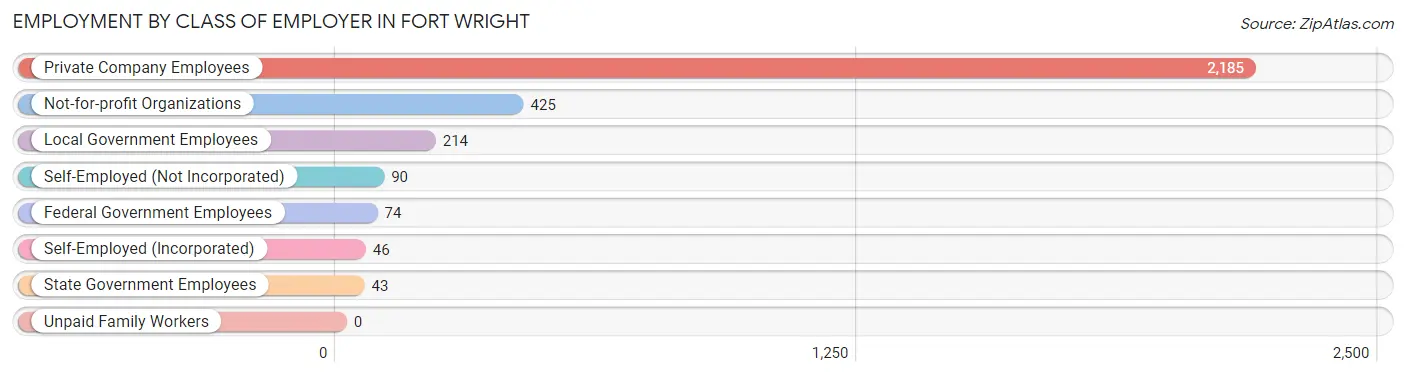
| Employer Class | # Employees | % Employees |
| Private Company Employees | 2,185 | 71.0% |
| Self-Employed (Incorporated) | 46 | 1.5% |
| Self-Employed (Not Incorporated) | 90 | 2.9% |
| Not-for-profit Organizations | 425 | 13.8% |
| Local Government Employees | 214 | 7.0% |
| State Government Employees | 43 | 1.4% |
| Federal Government Employees | 74 | 2.4% |
| Unpaid Family Workers | 0 | 0.0% |
| Total | 3,077 | 100.0% |
Employment Status by Age in Fort Wright
According to the labor force statistics for Fort Wright, out of the total population over 16 years of age (4,802), 66.5% or 3,193 individuals are in the labor force, with 2.7% or 86 of them unemployed. The age group with the highest labor force participation rate is 30 to 34 years, with 100.0% or 361 individuals in the labor force. Within the labor force, the 60 to 64 years age range has the highest percentage of unemployed individuals, with 5.2% or 19 of them being unemployed.
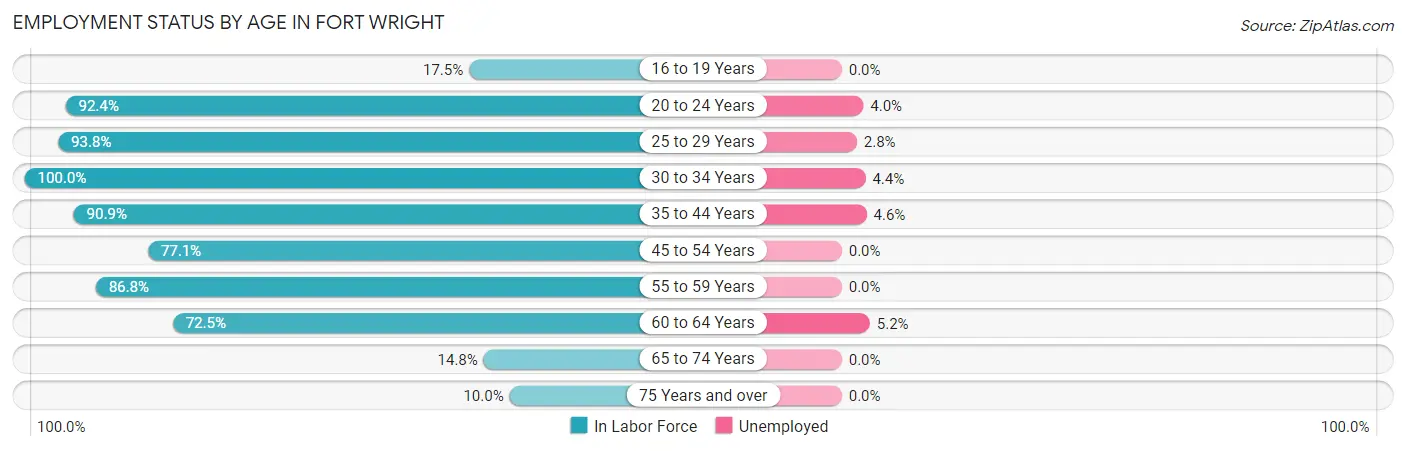
| Age Bracket | In Labor Force | Unemployed |
| 16 to 19 Years | 47 (17.5%) | 0 (0.0%) |
| 20 to 24 Years | 327 (92.4%) | 13 (4.0%) |
| 25 to 29 Years | 465 (93.8%) | 13 (2.8%) |
| 30 to 34 Years | 361 (100.0%) | 16 (4.4%) |
| 35 to 44 Years | 568 (90.9%) | 26 (4.6%) |
| 45 to 54 Years | 522 (77.1%) | 0 (0.0%) |
| 55 to 59 Years | 396 (86.8%) | 0 (0.0%) |
| 60 to 64 Years | 364 (72.5%) | 19 (5.2%) |
| 65 to 74 Years | 111 (14.8%) | 0 (0.0%) |
| 75 Years and over | 31 (10.0%) | 0 (0.0%) |
| Total | 3,193 (66.5%) | 86 (2.7%) |
Employment Status by Educational Attainment in Fort Wright
According to labor force statistics for Fort Wright, 85.9% of individuals (2,678) out of the total population between 25 and 64 years of age (3,117) are in the labor force, with 2.8% or 75 of them being unemployed. The group with the highest labor force participation rate are those with the educational attainment of bachelor's degree or higher, with 90.7% or 1,375 individuals in the labor force. Within the labor force, individuals with college / associate degree education have the highest percentage of unemployment, with 6.3% or 51 of them being unemployed.
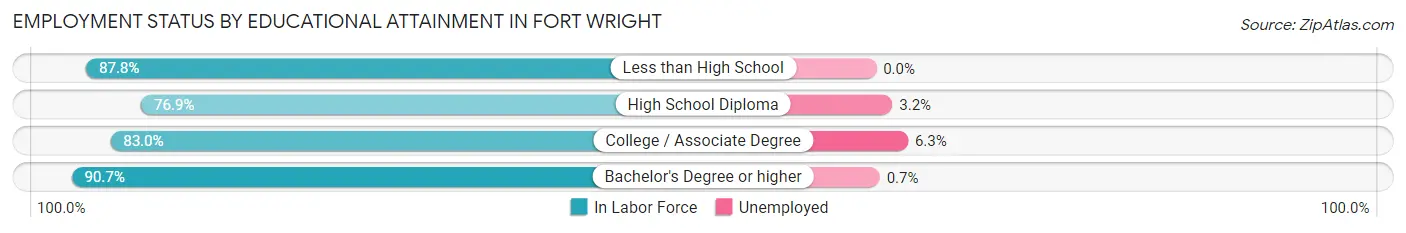
| Educational Attainment | In Labor Force | Unemployed |
| Less than High School | 86 (87.8%) | 0 (0.0%) |
| High School Diploma | 405 (76.9%) | 17 (3.2%) |
| College / Associate Degree | 810 (83.0%) | 61 (6.3%) |
| Bachelor's Degree or higher | 1,375 (90.7%) | 11 (0.7%) |
| Total | 2,678 (85.9%) | 87 (2.8%) |
Employment Occupations by Sex in Fort Wright
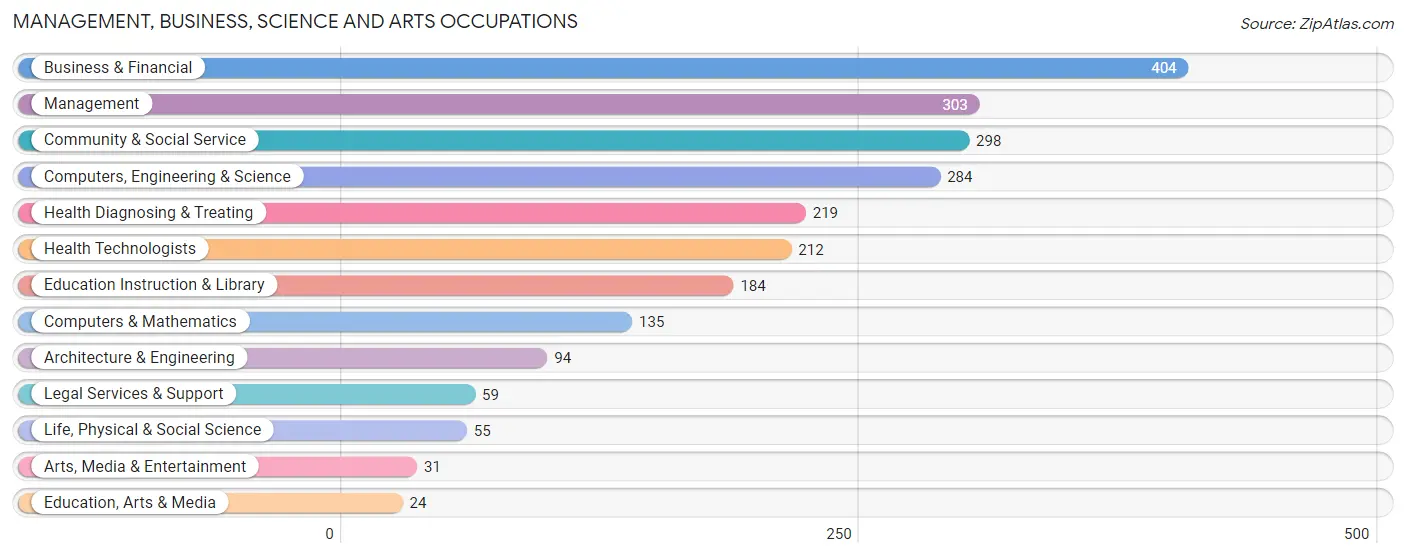
Management, Business, Science and Arts Occupations
The most common Management, Business, Science and Arts occupations in Fort Wright are Business & Financial (404 | 13.0%), Management (303 | 9.8%), Community & Social Service (298 | 9.6%), Computers, Engineering & Science (284 | 9.1%), and Health Diagnosing & Treating (219 | 7.0%).
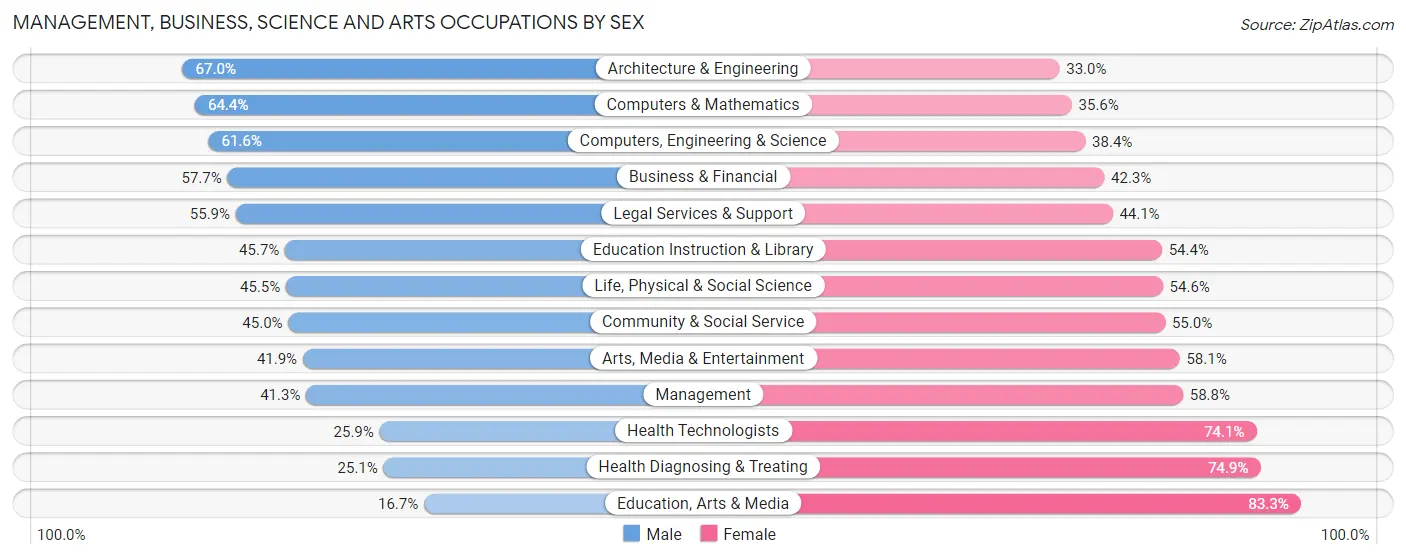
Management, Business, Science and Arts Occupations by Sex
Within the Management, Business, Science and Arts occupations in Fort Wright, the most male-oriented occupations are Architecture & Engineering (67.0%), Computers & Mathematics (64.4%), and Computers, Engineering & Science (61.6%), while the most female-oriented occupations are Education, Arts & Media (83.3%), Health Diagnosing & Treating (74.9%), and Health Technologists (74.1%).
| Occupation | Male | Female |
| Management | 125 (41.2%) | 178 (58.8%) |
| Business & Financial | 233 (57.7%) | 171 (42.3%) |
| Computers, Engineering & Science | 175 (61.6%) | 109 (38.4%) |
| Computers & Mathematics | 87 (64.4%) | 48 (35.6%) |
| Architecture & Engineering | 63 (67.0%) | 31 (33.0%) |
| Life, Physical & Social Science | 25 (45.5%) | 30 (54.5%) |
| Community & Social Service | 134 (45.0%) | 164 (55.0%) |
| Education, Arts & Media | 4 (16.7%) | 20 (83.3%) |
| Legal Services & Support | 33 (55.9%) | 26 (44.1%) |
| Education Instruction & Library | 84 (45.7%) | 100 (54.3%) |
| Arts, Media & Entertainment | 13 (41.9%) | 18 (58.1%) |
| Health Diagnosing & Treating | 55 (25.1%) | 164 (74.9%) |
| Health Technologists | 55 (25.9%) | 157 (74.1%) |
| Total (Category) | 722 (47.9%) | 786 (52.1%) |
| Total (Overall) | 1,537 (49.5%) | 1,568 (50.5%) |
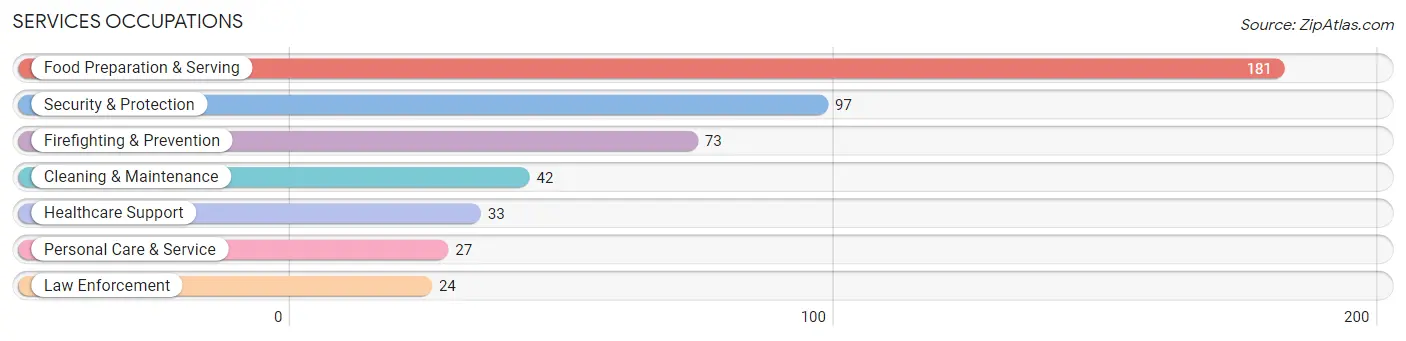
Services Occupations
The most common Services occupations in Fort Wright are Food Preparation & Serving (181 | 5.8%), Security & Protection (97 | 3.1%), Firefighting & Prevention (73 | 2.4%), Cleaning & Maintenance (42 | 1.3%), and Healthcare Support (33 | 1.1%).
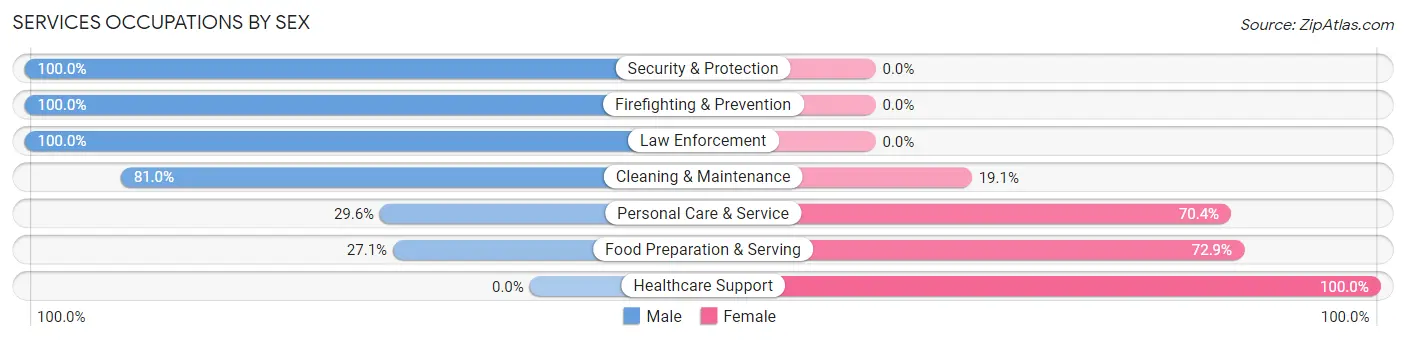
Services Occupations by Sex
Within the Services occupations in Fort Wright, the most male-oriented occupations are Security & Protection (100.0%), Firefighting & Prevention (100.0%), and Law Enforcement (100.0%), while the most female-oriented occupations are Healthcare Support (100.0%), Food Preparation & Serving (72.9%), and Personal Care & Service (70.4%).
| Occupation | Male | Female |
| Healthcare Support | 0 (0.0%) | 33 (100.0%) |
| Security & Protection | 97 (100.0%) | 0 (0.0%) |
| Firefighting & Prevention | 73 (100.0%) | 0 (0.0%) |
| Law Enforcement | 24 (100.0%) | 0 (0.0%) |
| Food Preparation & Serving | 49 (27.1%) | 132 (72.9%) |
| Cleaning & Maintenance | 34 (80.9%) | 8 (19.1%) |
| Personal Care & Service | 8 (29.6%) | 19 (70.4%) |
| Total (Category) | 188 (49.5%) | 192 (50.5%) |
| Total (Overall) | 1,537 (49.5%) | 1,568 (50.5%) |
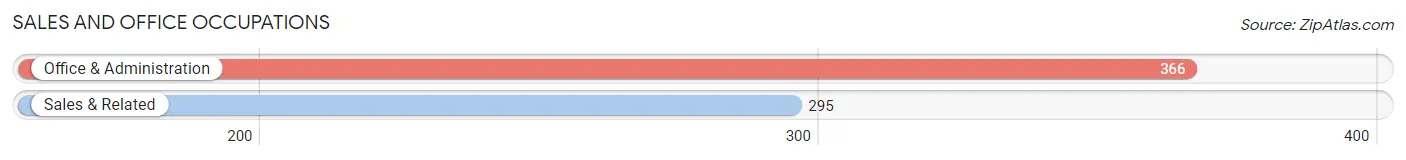
Sales and Office Occupations
The most common Sales and Office occupations in Fort Wright are Office & Administration (366 | 11.8%), and Sales & Related (295 | 9.5%).
Sales and Office Occupations by Sex

| Occupation | Male | Female |
| Sales & Related | 160 (54.2%) | 135 (45.8%) |
| Office & Administration | 40 (10.9%) | 326 (89.1%) |
| Total (Category) | 200 (30.3%) | 461 (69.7%) |
| Total (Overall) | 1,537 (49.5%) | 1,568 (50.5%) |
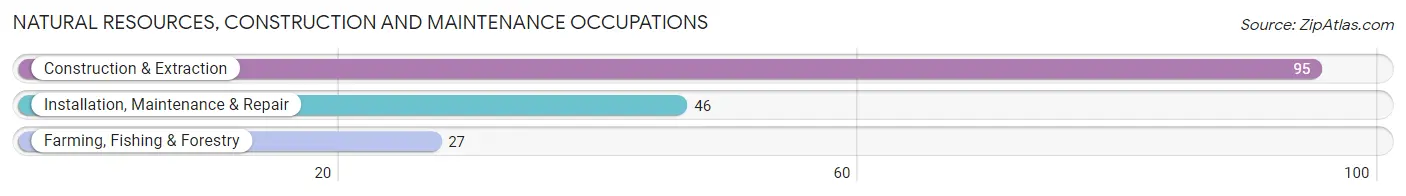
Natural Resources, Construction and Maintenance Occupations
The most common Natural Resources, Construction and Maintenance occupations in Fort Wright are Construction & Extraction (95 | 3.1%), Installation, Maintenance & Repair (46 | 1.5%), and Farming, Fishing & Forestry (27 | 0.9%).
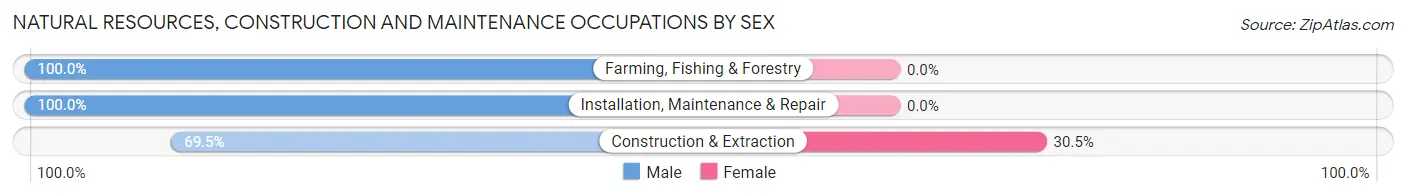
Natural Resources, Construction and Maintenance Occupations by Sex
| Occupation | Male | Female |
| Farming, Fishing & Forestry | 27 (100.0%) | 0 (0.0%) |
| Construction & Extraction | 66 (69.5%) | 29 (30.5%) |
| Installation, Maintenance & Repair | 46 (100.0%) | 0 (0.0%) |
| Total (Category) | 139 (82.7%) | 29 (17.3%) |
| Total (Overall) | 1,537 (49.5%) | 1,568 (50.5%) |
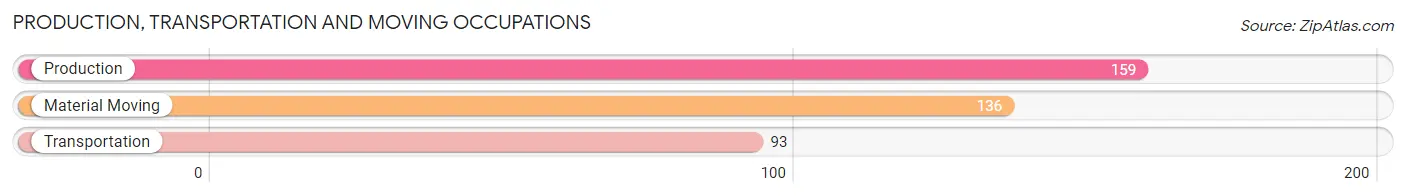
Production, Transportation and Moving Occupations
The most common Production, Transportation and Moving occupations in Fort Wright are Production (159 | 5.1%), Material Moving (136 | 4.4%), and Transportation (93 | 3.0%).
Production, Transportation and Moving Occupations by Sex
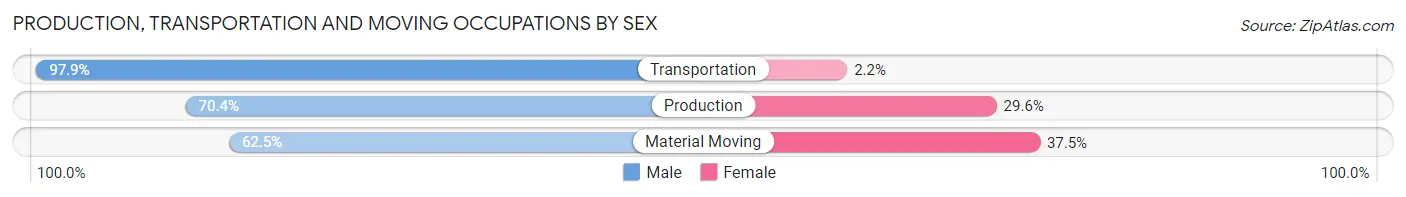
| Occupation | Male | Female |
| Production | 112 (70.4%) | 47 (29.6%) |
| Transportation | 91 (97.9%) | 2 (2.1%) |
| Material Moving | 85 (62.5%) | 51 (37.5%) |
| Total (Category) | 288 (74.2%) | 100 (25.8%) |
| Total (Overall) | 1,537 (49.5%) | 1,568 (50.5%) |
Employment Industries by Sex in Fort Wright
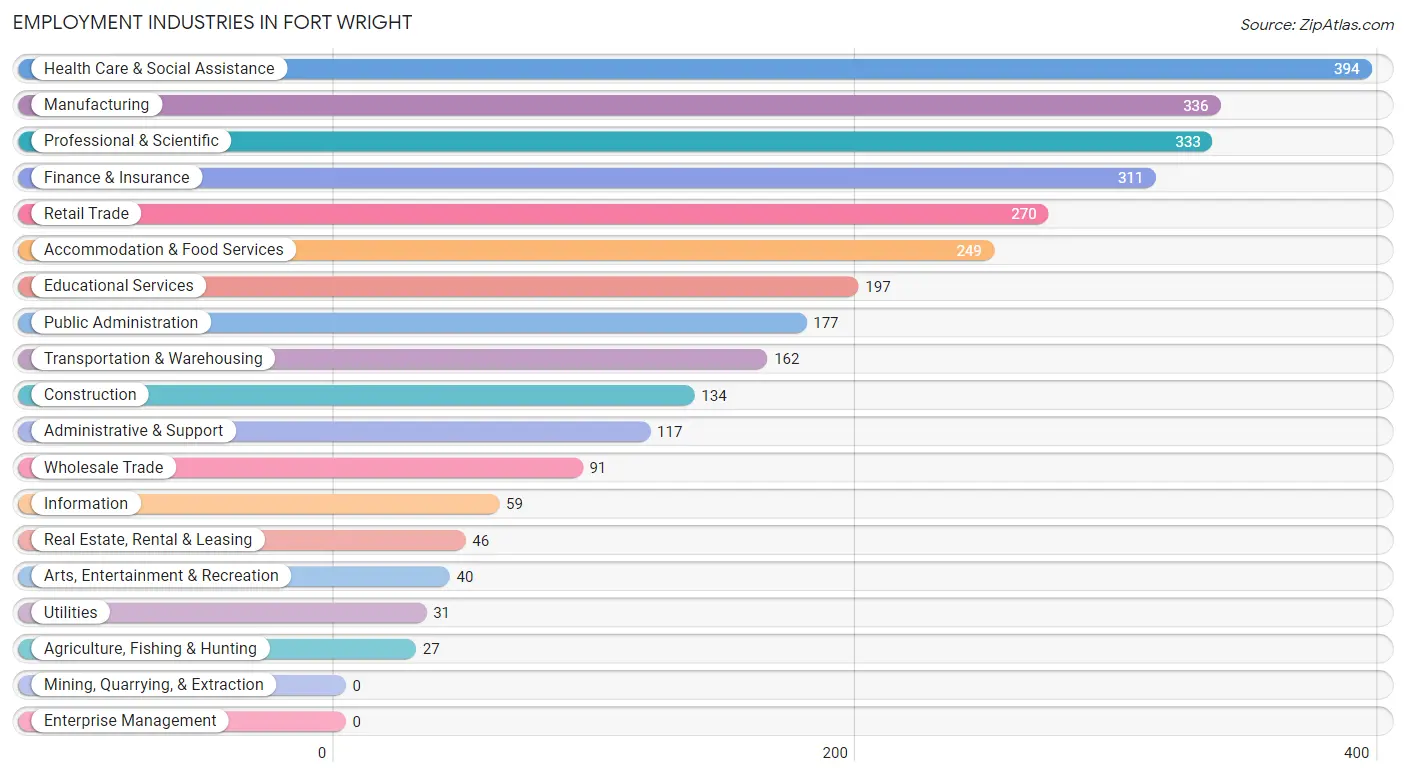
Employment Industries in Fort Wright
The major employment industries in Fort Wright include Health Care & Social Assistance (394 | 12.7%), Manufacturing (336 | 10.8%), Professional & Scientific (333 | 10.7%), Finance & Insurance (311 | 10.0%), and Retail Trade (270 | 8.7%).
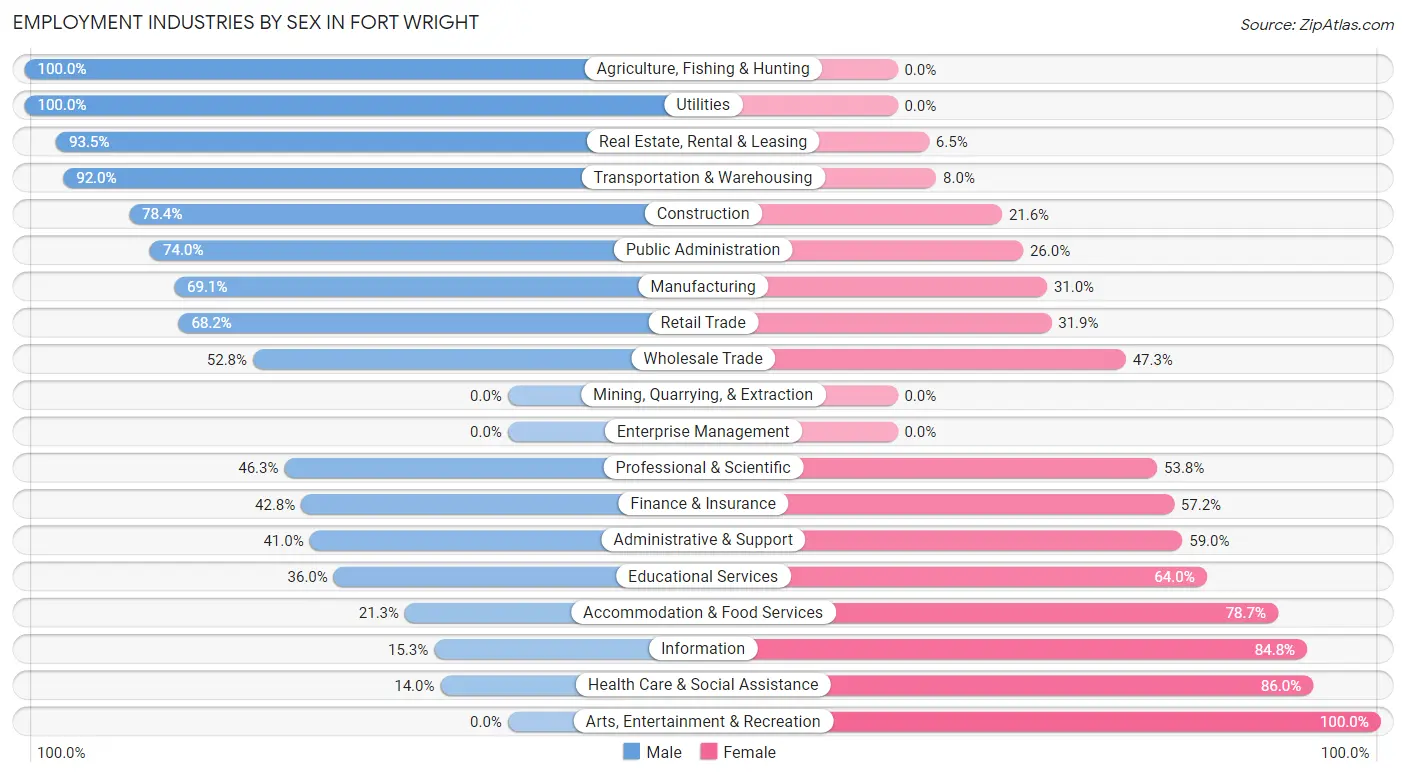
Employment Industries by Sex in Fort Wright
The Fort Wright industries that see more men than women are Agriculture, Fishing & Hunting (100.0%), Utilities (100.0%), and Real Estate, Rental & Leasing (93.5%), whereas the industries that tend to have a higher number of women are Arts, Entertainment & Recreation (100.0%), Health Care & Social Assistance (86.0%), and Information (84.8%).
| Industry | Male | Female |
| Agriculture, Fishing & Hunting | 27 (100.0%) | 0 (0.0%) |
| Mining, Quarrying, & Extraction | 0 (0.0%) | 0 (0.0%) |
| Construction | 105 (78.4%) | 29 (21.6%) |
| Manufacturing | 232 (69.1%) | 104 (30.9%) |
| Wholesale Trade | 48 (52.7%) | 43 (47.2%) |
| Retail Trade | 184 (68.1%) | 86 (31.9%) |
| Transportation & Warehousing | 149 (92.0%) | 13 (8.0%) |
| Utilities | 31 (100.0%) | 0 (0.0%) |
| Information | 9 (15.2%) | 50 (84.8%) |
| Finance & Insurance | 133 (42.8%) | 178 (57.2%) |
| Real Estate, Rental & Leasing | 43 (93.5%) | 3 (6.5%) |
| Professional & Scientific | 154 (46.3%) | 179 (53.7%) |
| Enterprise Management | 0 (0.0%) | 0 (0.0%) |
| Administrative & Support | 48 (41.0%) | 69 (59.0%) |
| Educational Services | 71 (36.0%) | 126 (64.0%) |
| Health Care & Social Assistance | 55 (14.0%) | 339 (86.0%) |
| Arts, Entertainment & Recreation | 0 (0.0%) | 40 (100.0%) |
| Accommodation & Food Services | 53 (21.3%) | 196 (78.7%) |
| Public Administration | 131 (74.0%) | 46 (26.0%) |
| Total | 1,537 (49.5%) | 1,568 (50.5%) |
Education in Fort Wright
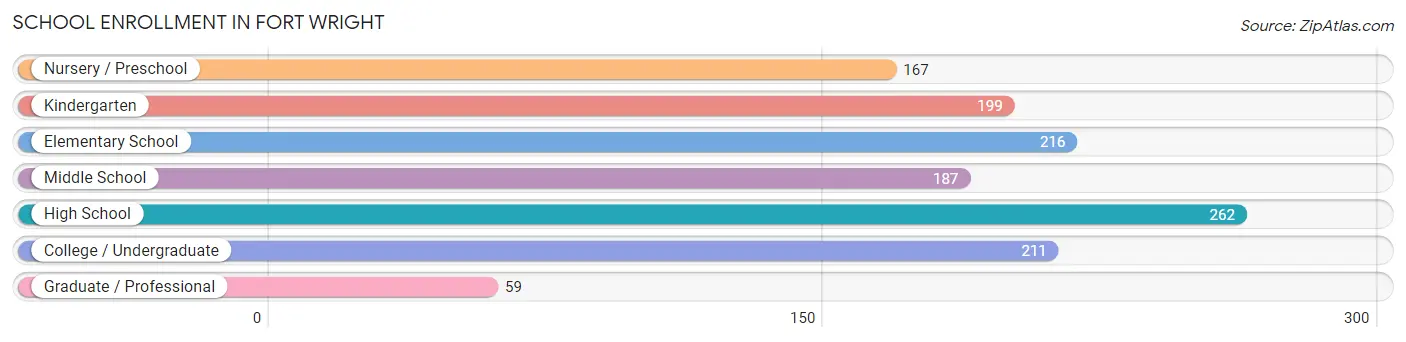
School Enrollment in Fort Wright
The most common levels of schooling among the 1,301 students in Fort Wright are high school (262 | 20.1%), elementary school (216 | 16.6%), and college / undergraduate (211 | 16.2%).
| School Level | # Students | % Students |
| Nursery / Preschool | 167 | 12.8% |
| Kindergarten | 199 | 15.3% |
| Elementary School | 216 | 16.6% |
| Middle School | 187 | 14.4% |
| High School | 262 | 20.1% |
| College / Undergraduate | 211 | 16.2% |
| Graduate / Professional | 59 | 4.5% |
| Total | 1,301 | 100.0% |
School Enrollment by Age by Funding Source in Fort Wright
Out of a total of 1,301 students who are enrolled in schools in Fort Wright, 334 (25.7%) attend a private institution, while the remaining 967 (74.3%) are enrolled in public schools. The age group of 3 to 4 year olds has the highest likelihood of being enrolled in private schools, with 40 (60.6% in the age bracket) enrolled. Conversely, the age group of 35 years and over has the lowest likelihood of being enrolled in a private school, with 37 (100.0% in the age bracket) attending a public institution.
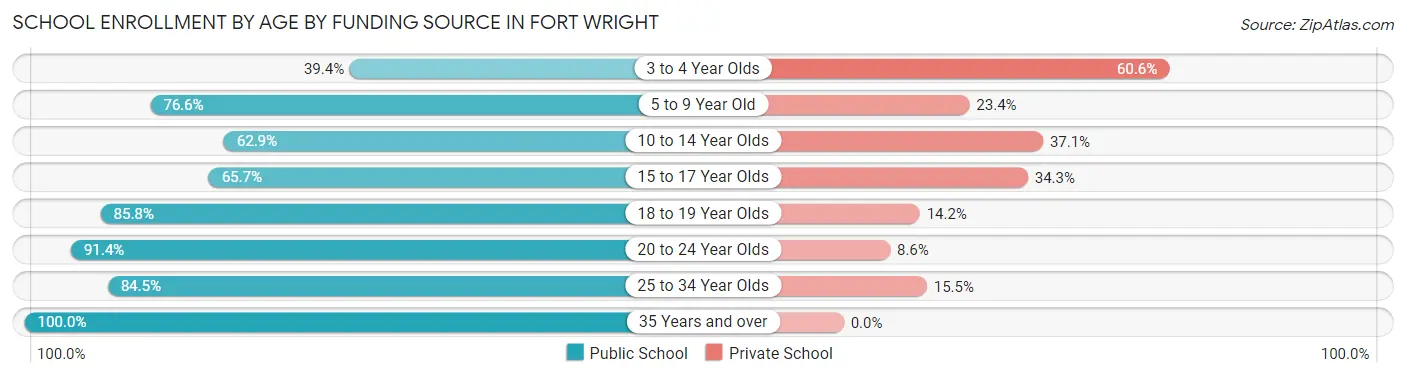
| Age Bracket | Public School | Private School |
| 3 to 4 Year Olds | 26 (39.4%) | 40 (60.6%) |
| 5 to 9 Year Old | 363 (76.6%) | 111 (23.4%) |
| 10 to 14 Year Olds | 144 (62.9%) | 85 (37.1%) |
| 15 to 17 Year Olds | 113 (65.7%) | 59 (34.3%) |
| 18 to 19 Year Olds | 97 (85.8%) | 16 (14.2%) |
| 20 to 24 Year Olds | 127 (91.4%) | 12 (8.6%) |
| 25 to 34 Year Olds | 60 (84.5%) | 11 (15.5%) |
| 35 Years and over | 37 (100.0%) | 0 (0.0%) |
| Total | 967 (74.3%) | 334 (25.7%) |
Educational Attainment by Field of Study in Fort Wright
Business (655 | 31.4%), science & technology (246 | 11.8%), education (169 | 8.1%), social sciences (165 | 7.9%), and arts & humanities (165 | 7.9%) are the most common fields of study among 2,087 individuals in Fort Wright who have obtained a bachelor's degree or higher.
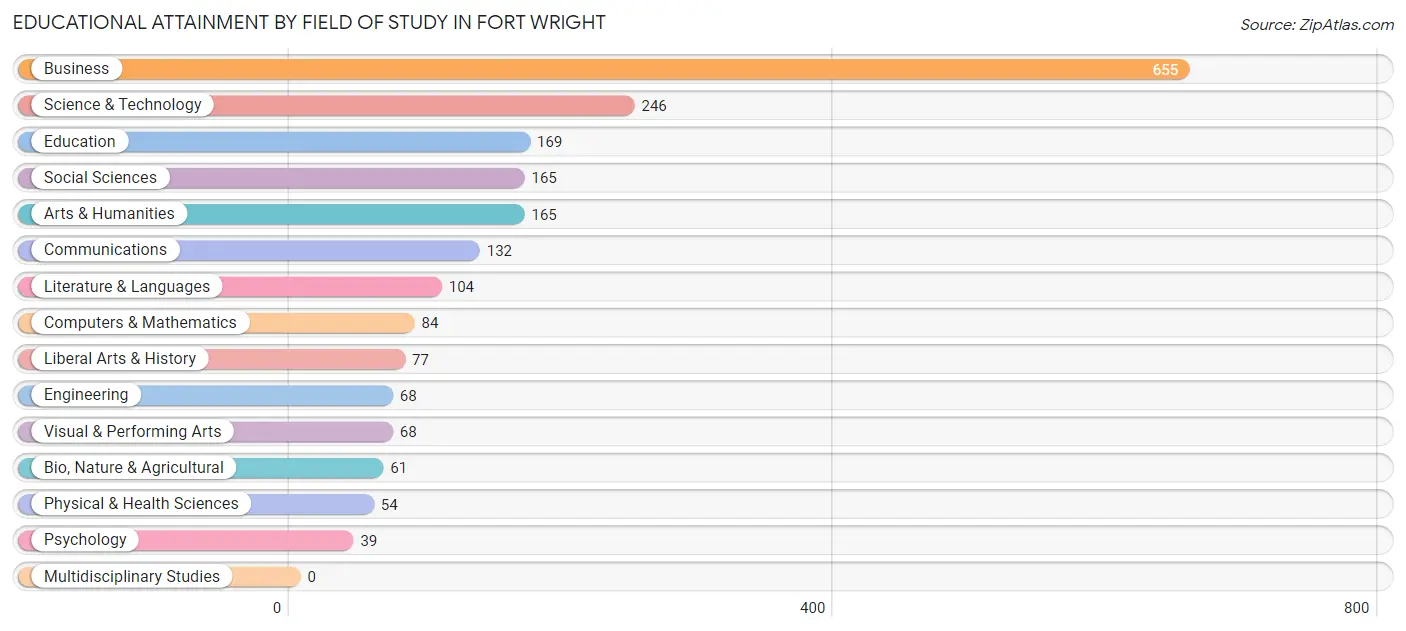
| Field of Study | # Graduates | % Graduates |
| Computers & Mathematics | 84 | 4.0% |
| Bio, Nature & Agricultural | 61 | 2.9% |
| Physical & Health Sciences | 54 | 2.6% |
| Psychology | 39 | 1.9% |
| Social Sciences | 165 | 7.9% |
| Engineering | 68 | 3.3% |
| Multidisciplinary Studies | 0 | 0.0% |
| Science & Technology | 246 | 11.8% |
| Business | 655 | 31.4% |
| Education | 169 | 8.1% |
| Literature & Languages | 104 | 5.0% |
| Liberal Arts & History | 77 | 3.7% |
| Visual & Performing Arts | 68 | 3.3% |
| Communications | 132 | 6.3% |
| Arts & Humanities | 165 | 7.9% |
| Total | 2,087 | 100.0% |
Transportation & Commute in Fort Wright
Vehicle Availability by Sex in Fort Wright
The most prevalent vehicle ownership categories in Fort Wright are males with 2 vehicles (826, accounting for 54.3%) and females with 2 vehicles (959, making up 53.0%).
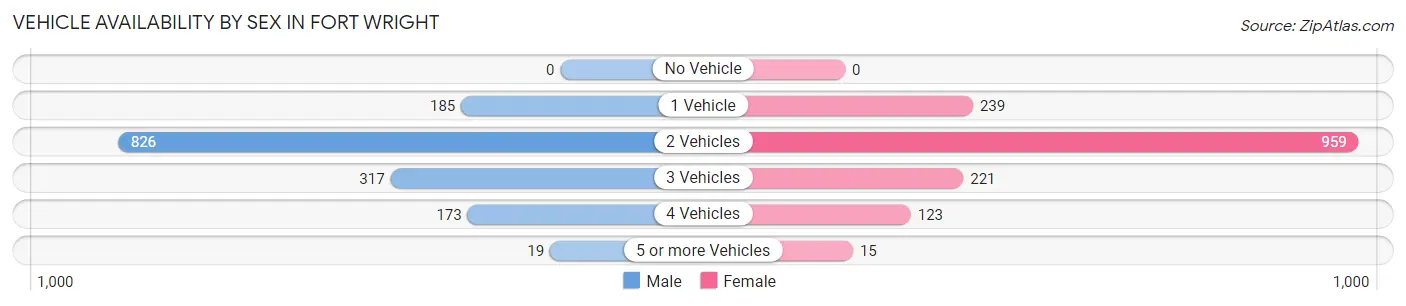
| Vehicles Available | Male | Female |
| No Vehicle | 0 (0.0%) | 0 (0.0%) |
| 1 Vehicle | 185 (12.2%) | 239 (15.3%) |
| 2 Vehicles | 826 (54.3%) | 959 (61.6%) |
| 3 Vehicles | 317 (20.9%) | 221 (14.2%) |
| 4 Vehicles | 173 (11.4%) | 123 (7.9%) |
| 5 or more Vehicles | 19 (1.3%) | 15 (1.0%) |
| Total | 1,520 (100.0%) | 1,557 (100.0%) |
Commute Time in Fort Wright
The most frequently occuring commute durations in Fort Wright are 20 to 24 minutes (644 commuters, 23.6%), 15 to 19 minutes (639 commuters, 23.4%), and 10 to 14 minutes (548 commuters, 20.1%).
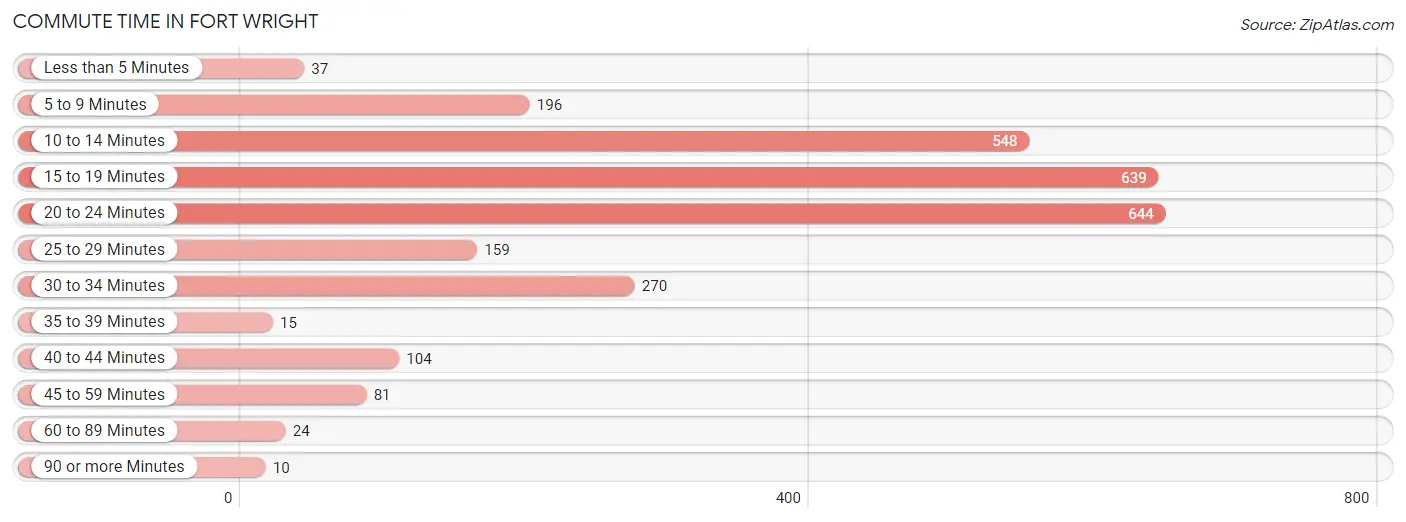
| Commute Time | # Commuters | % Commuters |
| Less than 5 Minutes | 37 | 1.4% |
| 5 to 9 Minutes | 196 | 7.2% |
| 10 to 14 Minutes | 548 | 20.1% |
| 15 to 19 Minutes | 639 | 23.4% |
| 20 to 24 Minutes | 644 | 23.6% |
| 25 to 29 Minutes | 159 | 5.8% |
| 30 to 34 Minutes | 270 | 9.9% |
| 35 to 39 Minutes | 15 | 0.5% |
| 40 to 44 Minutes | 104 | 3.8% |
| 45 to 59 Minutes | 81 | 3.0% |
| 60 to 89 Minutes | 24 | 0.9% |
| 90 or more Minutes | 10 | 0.4% |
Commute Time by Sex in Fort Wright
The most common commute times in Fort Wright are 15 to 19 minutes (349 commuters, 25.6%) for males and 20 to 24 minutes (336 commuters, 24.6%) for females.
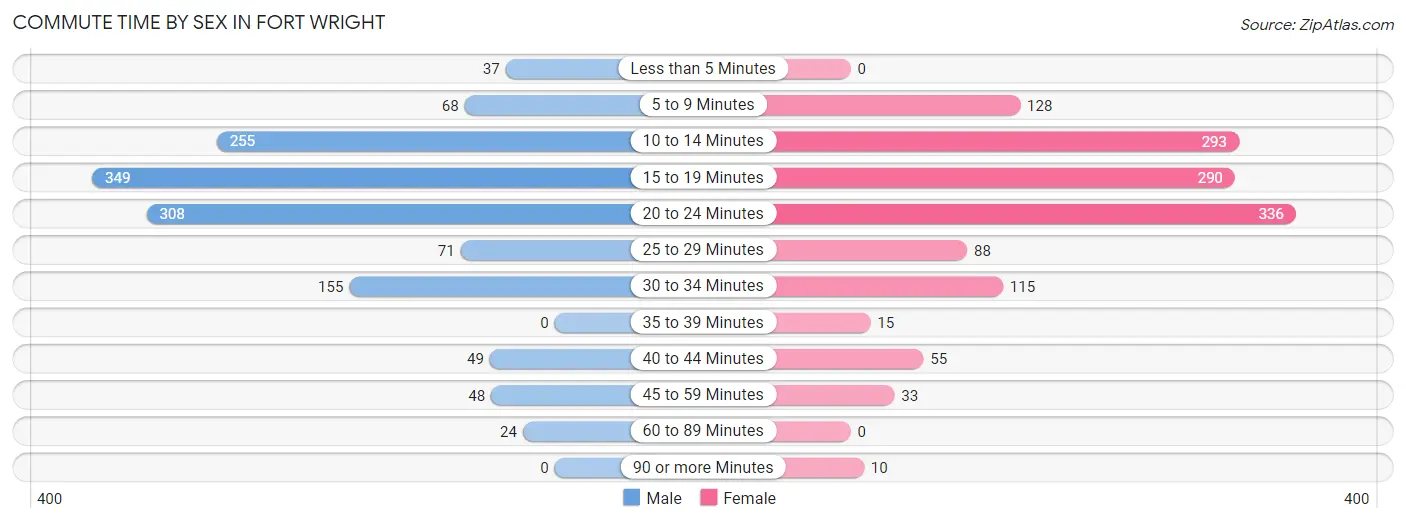
| Commute Time | Male | Female |
| Less than 5 Minutes | 37 (2.7%) | 0 (0.0%) |
| 5 to 9 Minutes | 68 (5.0%) | 128 (9.4%) |
| 10 to 14 Minutes | 255 (18.7%) | 293 (21.5%) |
| 15 to 19 Minutes | 349 (25.6%) | 290 (21.3%) |
| 20 to 24 Minutes | 308 (22.6%) | 336 (24.6%) |
| 25 to 29 Minutes | 71 (5.2%) | 88 (6.5%) |
| 30 to 34 Minutes | 155 (11.4%) | 115 (8.4%) |
| 35 to 39 Minutes | 0 (0.0%) | 15 (1.1%) |
| 40 to 44 Minutes | 49 (3.6%) | 55 (4.0%) |
| 45 to 59 Minutes | 48 (3.5%) | 33 (2.4%) |
| 60 to 89 Minutes | 24 (1.8%) | 0 (0.0%) |
| 90 or more Minutes | 0 (0.0%) | 10 (0.7%) |
Time of Departure to Work by Sex in Fort Wright
The most frequent times of departure to work in Fort Wright are 7:30 AM to 7:59 AM (243, 17.8%) for males and 7:30 AM to 7:59 AM (338, 24.8%) for females.
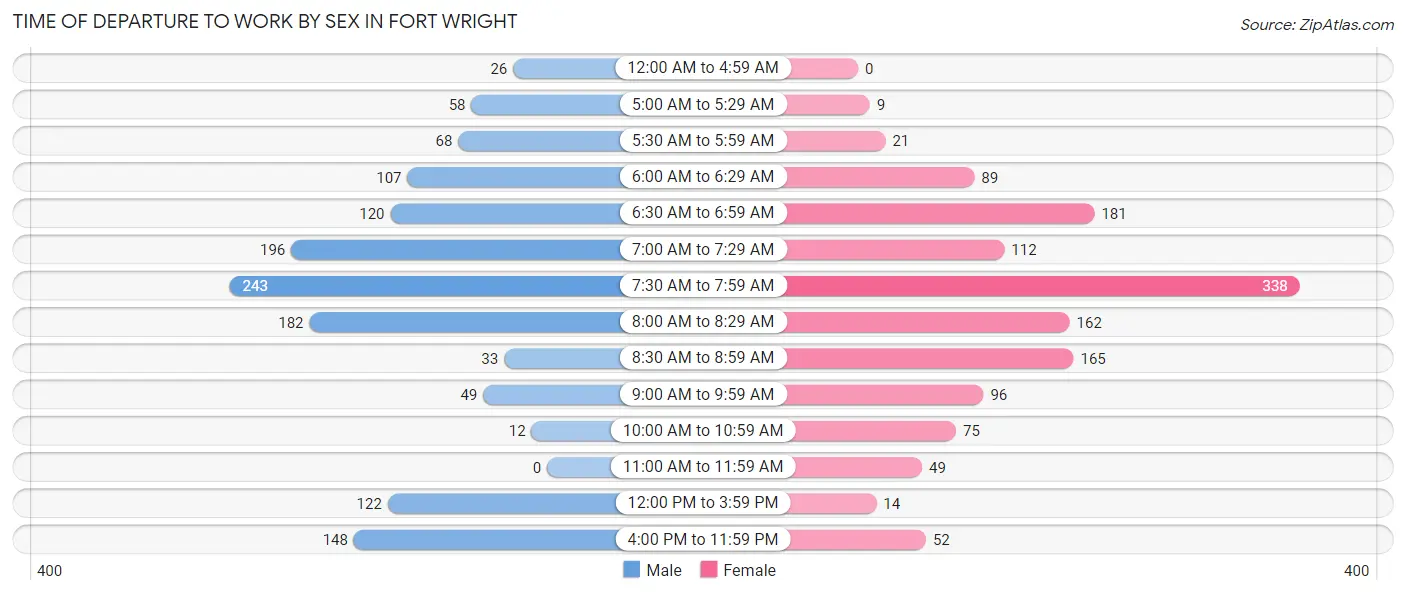
| Time of Departure | Male | Female |
| 12:00 AM to 4:59 AM | 26 (1.9%) | 0 (0.0%) |
| 5:00 AM to 5:29 AM | 58 (4.3%) | 9 (0.7%) |
| 5:30 AM to 5:59 AM | 68 (5.0%) | 21 (1.5%) |
| 6:00 AM to 6:29 AM | 107 (7.8%) | 89 (6.5%) |
| 6:30 AM to 6:59 AM | 120 (8.8%) | 181 (13.3%) |
| 7:00 AM to 7:29 AM | 196 (14.4%) | 112 (8.2%) |
| 7:30 AM to 7:59 AM | 243 (17.8%) | 338 (24.8%) |
| 8:00 AM to 8:29 AM | 182 (13.3%) | 162 (11.9%) |
| 8:30 AM to 8:59 AM | 33 (2.4%) | 165 (12.1%) |
| 9:00 AM to 9:59 AM | 49 (3.6%) | 96 (7.0%) |
| 10:00 AM to 10:59 AM | 12 (0.9%) | 75 (5.5%) |
| 11:00 AM to 11:59 AM | 0 (0.0%) | 49 (3.6%) |
| 12:00 PM to 3:59 PM | 122 (8.9%) | 14 (1.0%) |
| 4:00 PM to 11:59 PM | 148 (10.8%) | 52 (3.8%) |
| Total | 1,364 (100.0%) | 1,363 (100.0%) |
Housing Occupancy in Fort Wright
Occupancy by Ownership in Fort Wright
Of the total 2,415 dwellings in Fort Wright, owner-occupied units account for 1,692 (70.1%), while renter-occupied units make up 723 (29.9%).
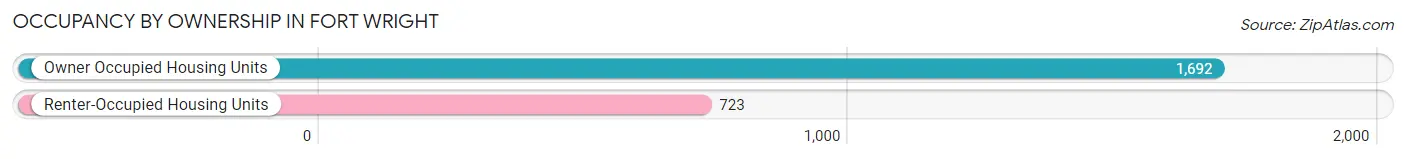
| Occupancy | # Housing Units | % Housing Units |
| Owner Occupied Housing Units | 1,692 | 70.1% |
| Renter-Occupied Housing Units | 723 | 29.9% |
| Total Occupied Housing Units | 2,415 | 100.0% |
Occupancy by Household Size in Fort Wright
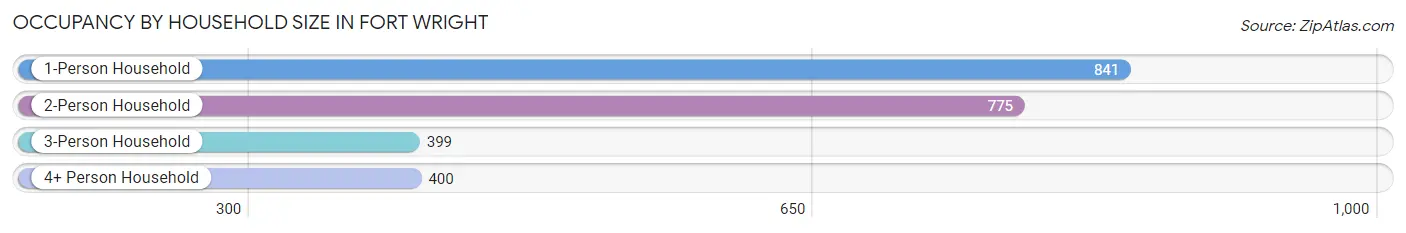
| Household Size | # Housing Units | % Housing Units |
| 1-Person Household | 841 | 34.8% |
| 2-Person Household | 775 | 32.1% |
| 3-Person Household | 399 | 16.5% |
| 4+ Person Household | 400 | 16.6% |
| Total Housing Units | 2,415 | 100.0% |
Occupancy by Ownership by Household Size in Fort Wright
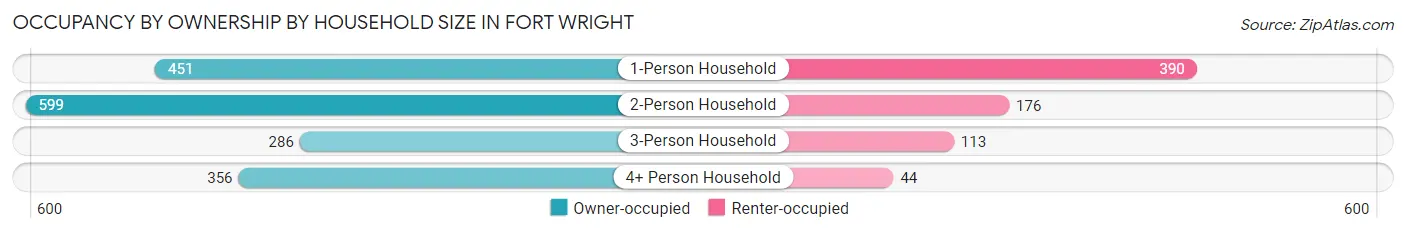
| Household Size | Owner-occupied | Renter-occupied |
| 1-Person Household | 451 (53.6%) | 390 (46.4%) |
| 2-Person Household | 599 (77.3%) | 176 (22.7%) |
| 3-Person Household | 286 (71.7%) | 113 (28.3%) |
| 4+ Person Household | 356 (89.0%) | 44 (11.0%) |
| Total Housing Units | 1,692 (70.1%) | 723 (29.9%) |
Occupancy by Educational Attainment in Fort Wright
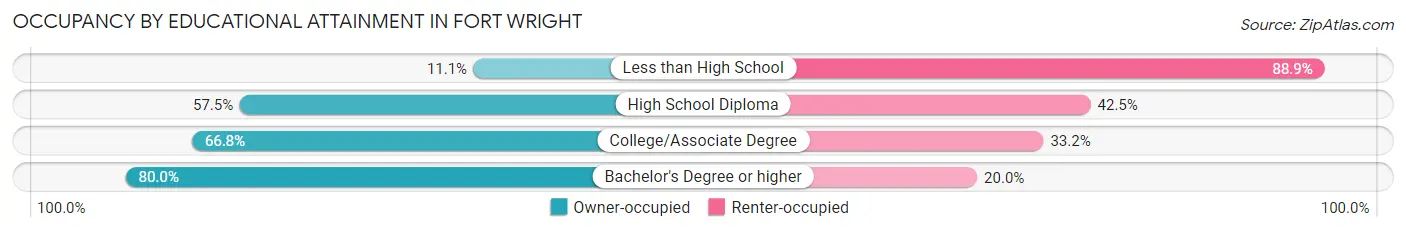
| Household Size | Owner-occupied | Renter-occupied |
| Less than High School | 10 (11.1%) | 80 (88.9%) |
| High School Diploma | 246 (57.5%) | 182 (42.5%) |
| College/Associate Degree | 413 (66.8%) | 205 (33.2%) |
| Bachelor's Degree or higher | 1,023 (80.0%) | 256 (20.0%) |
Occupancy by Age of Householder in Fort Wright
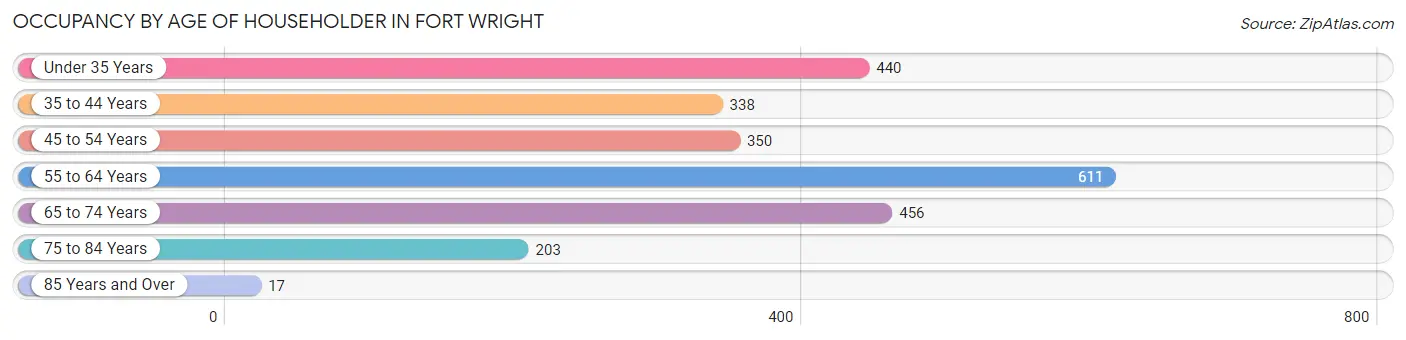
| Age Bracket | # Households | % Households |
| Under 35 Years | 440 | 18.2% |
| 35 to 44 Years | 338 | 14.0% |
| 45 to 54 Years | 350 | 14.5% |
| 55 to 64 Years | 611 | 25.3% |
| 65 to 74 Years | 456 | 18.9% |
| 75 to 84 Years | 203 | 8.4% |
| 85 Years and Over | 17 | 0.7% |
| Total | 2,415 | 100.0% |
Housing Finances in Fort Wright
Median Income by Occupancy in Fort Wright
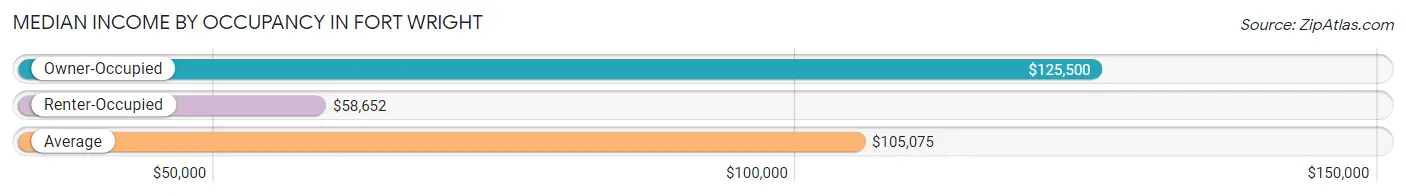
| Occupancy Type | # Households | Median Income |
| Owner-Occupied | 1,692 (70.1%) | $125,500 |
| Renter-Occupied | 723 (29.9%) | $58,652 |
| Average | 2,415 (100.0%) | $105,075 |
Occupancy by Householder Income Bracket in Fort Wright
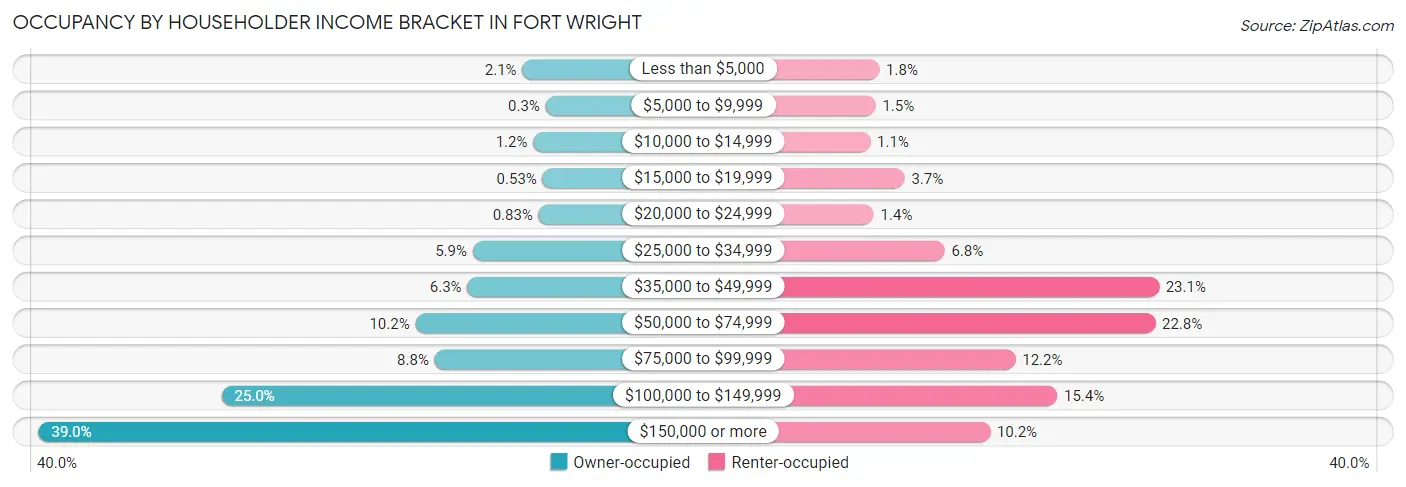
| Income Bracket | Owner-occupied | Renter-occupied |
| Less than $5,000 | 35 (2.1%) | 13 (1.8%) |
| $5,000 to $9,999 | 5 (0.3%) | 11 (1.5%) |
| $10,000 to $14,999 | 21 (1.2%) | 8 (1.1%) |
| $15,000 to $19,999 | 9 (0.5%) | 27 (3.7%) |
| $20,000 to $24,999 | 14 (0.8%) | 10 (1.4%) |
| $25,000 to $34,999 | 99 (5.9%) | 49 (6.8%) |
| $35,000 to $49,999 | 106 (6.3%) | 167 (23.1%) |
| $50,000 to $74,999 | 173 (10.2%) | 165 (22.8%) |
| $75,000 to $99,999 | 148 (8.7%) | 88 (12.2%) |
| $100,000 to $149,999 | 423 (25.0%) | 111 (15.3%) |
| $150,000 or more | 659 (39.0%) | 74 (10.2%) |
| Total | 1,692 (100.0%) | 723 (100.0%) |
Monthly Housing Cost Tiers in Fort Wright
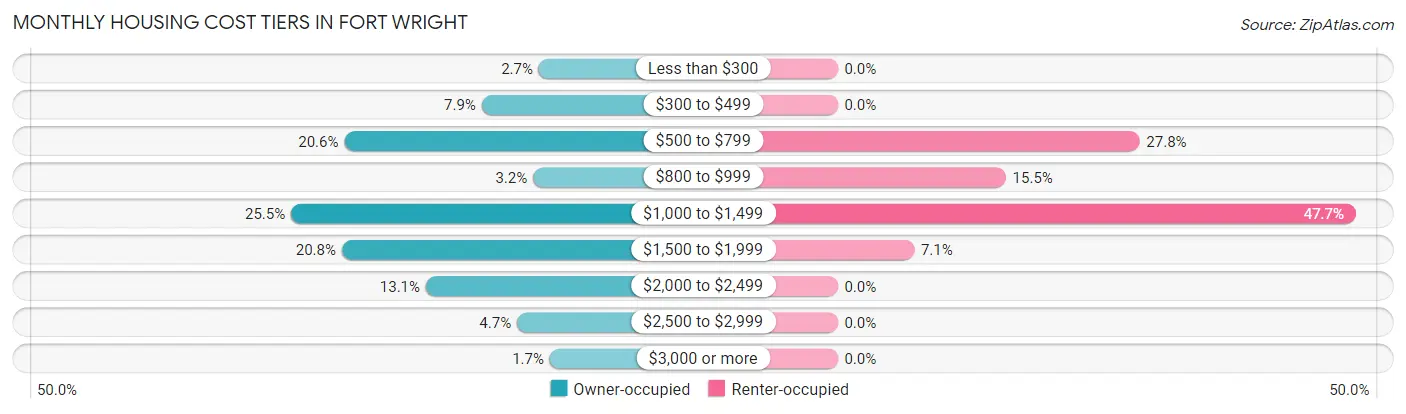
| Monthly Cost | Owner-occupied | Renter-occupied |
| Less than $300 | 45 (2.7%) | 0 (0.0%) |
| $300 to $499 | 134 (7.9%) | 0 (0.0%) |
| $500 to $799 | 348 (20.6%) | 201 (27.8%) |
| $800 to $999 | 54 (3.2%) | 112 (15.5%) |
| $1,000 to $1,499 | 431 (25.5%) | 345 (47.7%) |
| $1,500 to $1,999 | 352 (20.8%) | 51 (7.0%) |
| $2,000 to $2,499 | 221 (13.1%) | 0 (0.0%) |
| $2,500 to $2,999 | 79 (4.7%) | 0 (0.0%) |
| $3,000 or more | 28 (1.7%) | 0 (0.0%) |
| Total | 1,692 (100.0%) | 723 (100.0%) |
Physical Housing Characteristics in Fort Wright
Housing Structures in Fort Wright
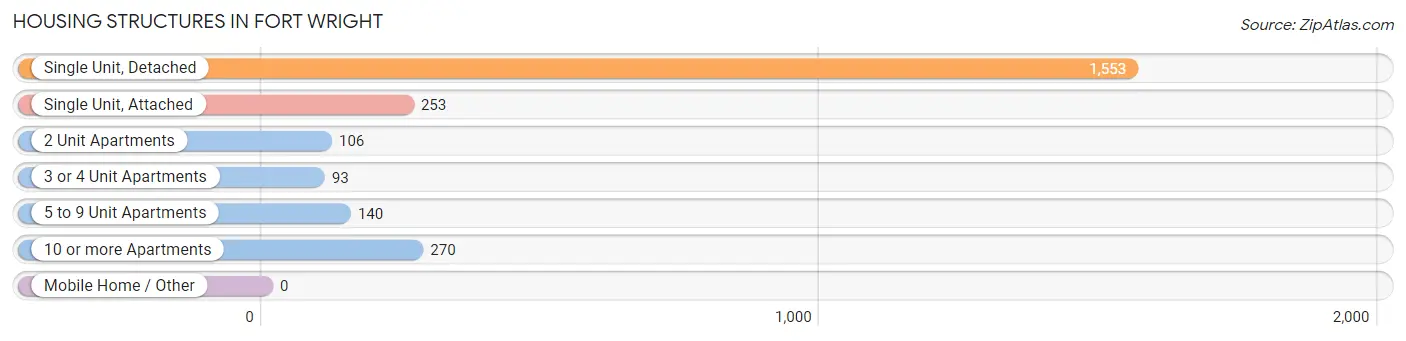
| Structure Type | # Housing Units | % Housing Units |
| Single Unit, Detached | 1,553 | 64.3% |
| Single Unit, Attached | 253 | 10.5% |
| 2 Unit Apartments | 106 | 4.4% |
| 3 or 4 Unit Apartments | 93 | 3.8% |
| 5 to 9 Unit Apartments | 140 | 5.8% |
| 10 or more Apartments | 270 | 11.2% |
| Mobile Home / Other | 0 | 0.0% |
| Total | 2,415 | 100.0% |
Housing Structures by Occupancy in Fort Wright
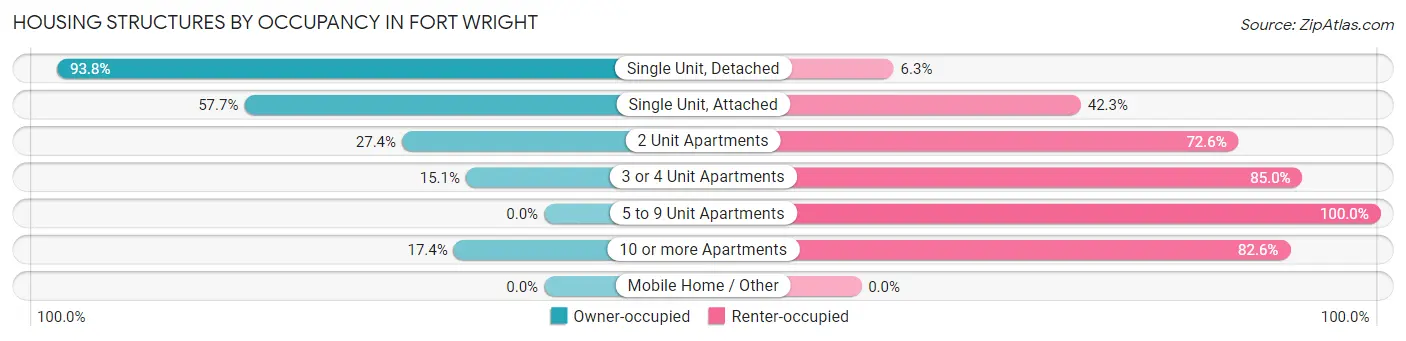
| Structure Type | Owner-occupied | Renter-occupied |
| Single Unit, Detached | 1,456 (93.8%) | 97 (6.2%) |
| Single Unit, Attached | 146 (57.7%) | 107 (42.3%) |
| 2 Unit Apartments | 29 (27.4%) | 77 (72.6%) |
| 3 or 4 Unit Apartments | 14 (15.0%) | 79 (85.0%) |
| 5 to 9 Unit Apartments | 0 (0.0%) | 140 (100.0%) |
| 10 or more Apartments | 47 (17.4%) | 223 (82.6%) |
| Mobile Home / Other | 0 (0.0%) | 0 (0.0%) |
| Total | 1,692 (70.1%) | 723 (29.9%) |
Housing Structures by Number of Rooms in Fort Wright
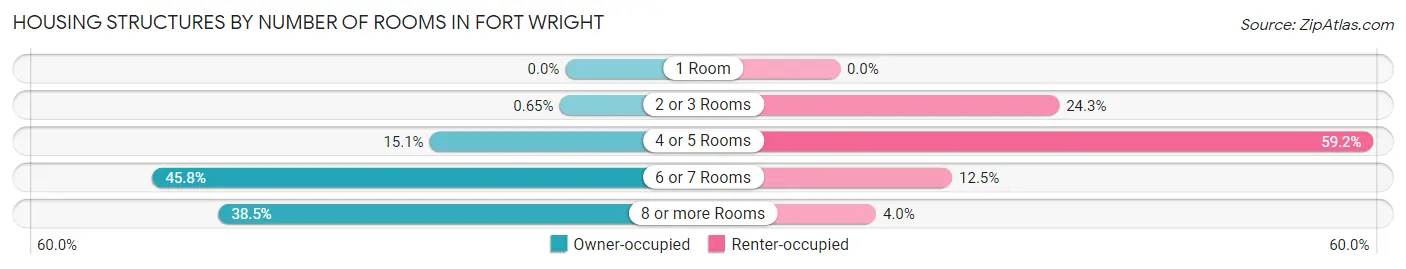
| Number of Rooms | Owner-occupied | Renter-occupied |
| 1 Room | 0 (0.0%) | 0 (0.0%) |
| 2 or 3 Rooms | 11 (0.6%) | 176 (24.3%) |
| 4 or 5 Rooms | 255 (15.1%) | 428 (59.2%) |
| 6 or 7 Rooms | 775 (45.8%) | 90 (12.4%) |
| 8 or more Rooms | 651 (38.5%) | 29 (4.0%) |
| Total | 1,692 (100.0%) | 723 (100.0%) |
Housing Structure by Heating Type in Fort Wright
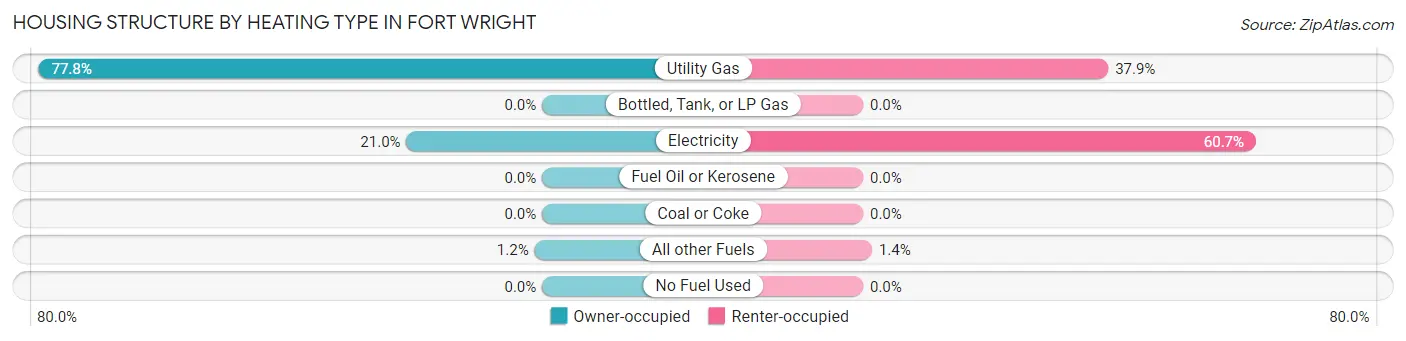
| Heating Type | Owner-occupied | Renter-occupied |
| Utility Gas | 1,317 (77.8%) | 274 (37.9%) |
| Bottled, Tank, or LP Gas | 0 (0.0%) | 0 (0.0%) |
| Electricity | 355 (21.0%) | 439 (60.7%) |
| Fuel Oil or Kerosene | 0 (0.0%) | 0 (0.0%) |
| Coal or Coke | 0 (0.0%) | 0 (0.0%) |
| All other Fuels | 20 (1.2%) | 10 (1.4%) |
| No Fuel Used | 0 (0.0%) | 0 (0.0%) |
| Total | 1,692 (100.0%) | 723 (100.0%) |
Household Vehicle Usage in Fort Wright
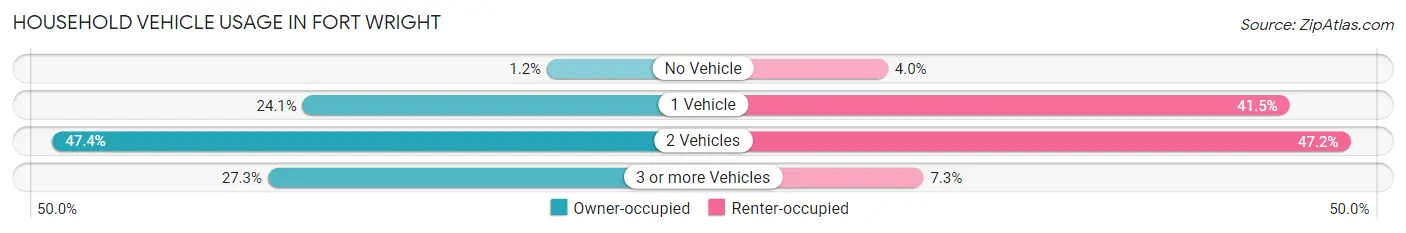
| Vehicles per Household | Owner-occupied | Renter-occupied |
| No Vehicle | 21 (1.2%) | 29 (4.0%) |
| 1 Vehicle | 407 (24.0%) | 300 (41.5%) |
| 2 Vehicles | 802 (47.4%) | 341 (47.2%) |
| 3 or more Vehicles | 462 (27.3%) | 53 (7.3%) |
| Total | 1,692 (100.0%) | 723 (100.0%) |
Real Estate & Mortgages in Fort Wright
Real Estate and Mortgage Overview in Fort Wright
| Characteristic | Without Mortgage | With Mortgage |
| Housing Units | 520 | 1,172 |
| Median Property Value | $268,400 | $268,400 |
| Median Household Income | $105,776 | $472 |
| Monthly Housing Costs | $542 | $28 |
| Real Estate Taxes | $2,315 | $32 |
Property Value by Mortgage Status in Fort Wright
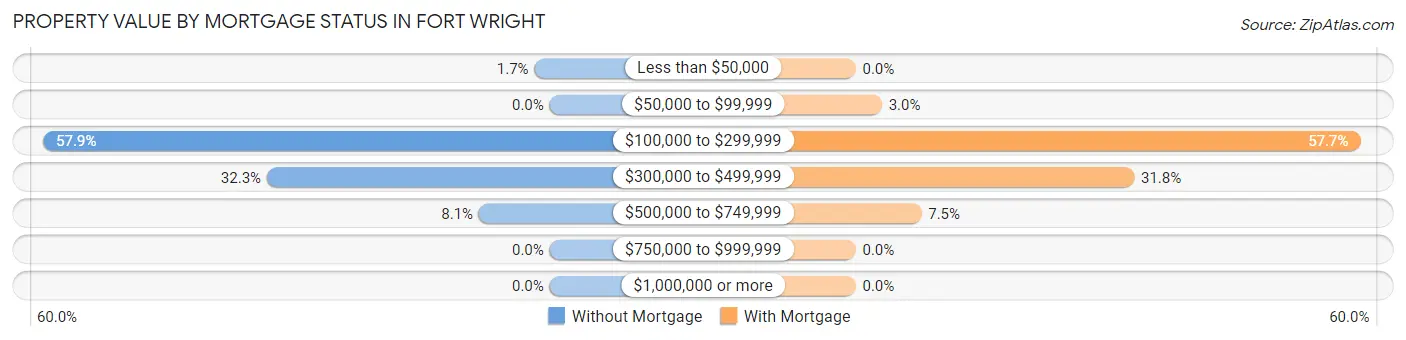
| Property Value | Without Mortgage | With Mortgage |
| Less than $50,000 | 9 (1.7%) | 0 (0.0%) |
| $50,000 to $99,999 | 0 (0.0%) | 35 (3.0%) |
| $100,000 to $299,999 | 301 (57.9%) | 676 (57.7%) |
| $300,000 to $499,999 | 168 (32.3%) | 373 (31.8%) |
| $500,000 to $749,999 | 42 (8.1%) | 88 (7.5%) |
| $750,000 to $999,999 | 0 (0.0%) | 0 (0.0%) |
| $1,000,000 or more | 0 (0.0%) | 0 (0.0%) |
| Total | 520 (100.0%) | 1,172 (100.0%) |
Household Income by Mortgage Status in Fort Wright
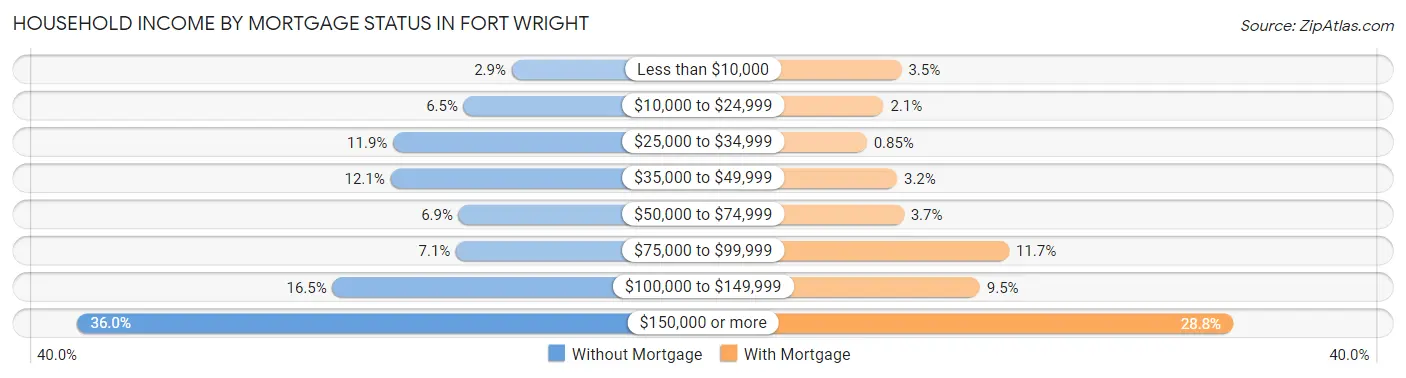
| Household Income | Without Mortgage | With Mortgage |
| Less than $10,000 | 15 (2.9%) | 41 (3.5%) |
| $10,000 to $24,999 | 34 (6.5%) | 25 (2.1%) |
| $25,000 to $34,999 | 62 (11.9%) | 10 (0.9%) |
| $35,000 to $49,999 | 63 (12.1%) | 37 (3.2%) |
| $50,000 to $74,999 | 36 (6.9%) | 43 (3.7%) |
| $75,000 to $99,999 | 37 (7.1%) | 137 (11.7%) |
| $100,000 to $149,999 | 86 (16.5%) | 111 (9.5%) |
| $150,000 or more | 187 (36.0%) | 337 (28.7%) |
| Total | 520 (100.0%) | 1,172 (100.0%) |
Property Value to Household Income Ratio in Fort Wright
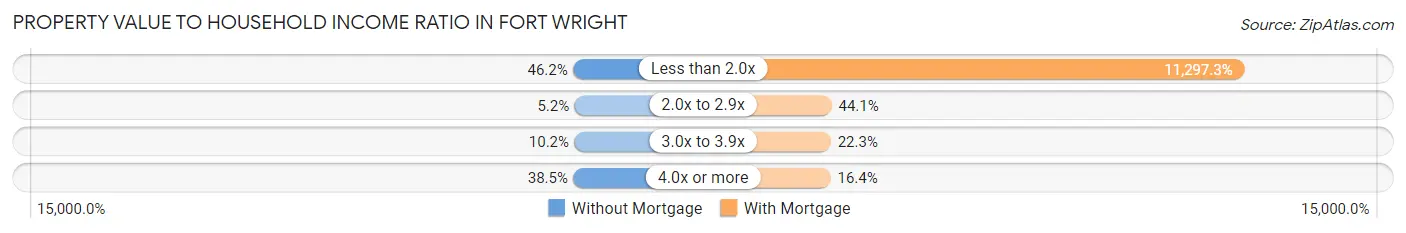
| Value-to-Income Ratio | Without Mortgage | With Mortgage |
| Less than 2.0x | 240 (46.2%) | 132,404 (11,297.3%) |
| 2.0x to 2.9x | 27 (5.2%) | 517 (44.1%) |
| 3.0x to 3.9x | 53 (10.2%) | 261 (22.3%) |
| 4.0x or more | 200 (38.5%) | 192 (16.4%) |
| Total | 520 (100.0%) | 1,172 (100.0%) |
Real Estate Taxes by Mortgage Status in Fort Wright
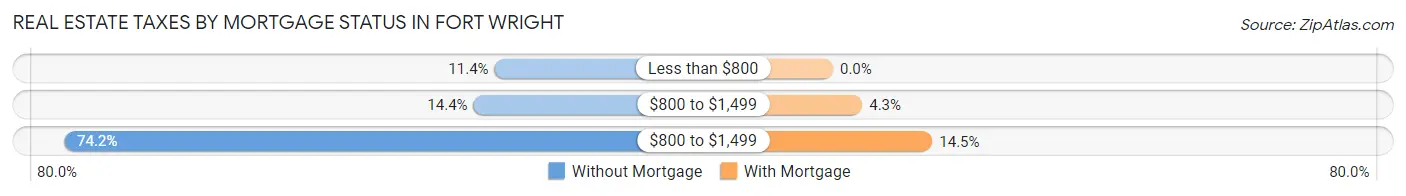
| Property Taxes | Without Mortgage | With Mortgage |
| Less than $800 | 59 (11.4%) | 0 (0.0%) |
| $800 to $1,499 | 75 (14.4%) | 50 (4.3%) |
| $800 to $1,499 | 386 (74.2%) | 170 (14.5%) |
| Total | 520 (100.0%) | 1,172 (100.0%) |
Health & Disability in Fort Wright
Health Insurance Coverage by Age in Fort Wright
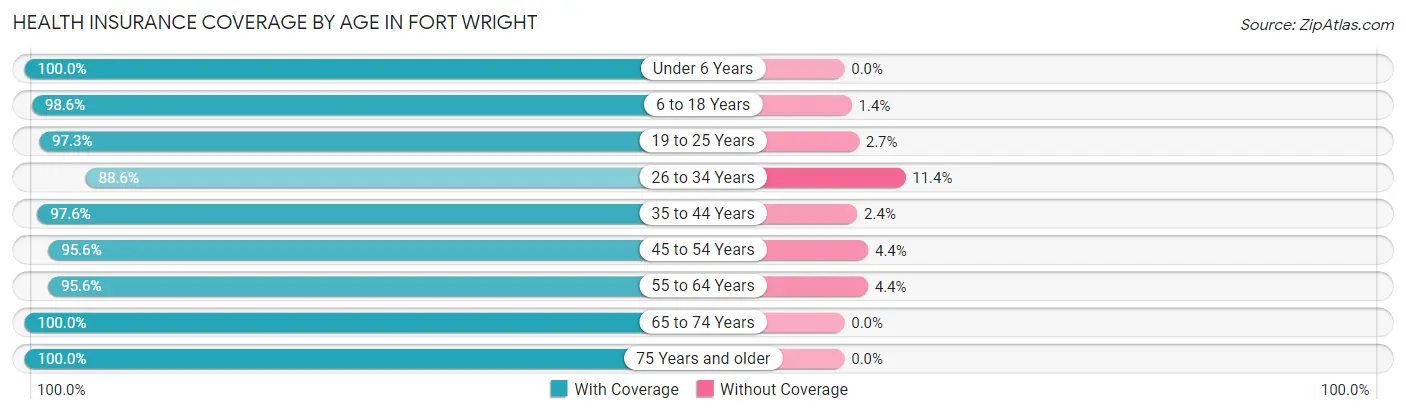
| Age Bracket | With Coverage | Without Coverage |
| Under 6 Years | 464 (100.0%) | 0 (0.0%) |
| 6 to 18 Years | 798 (98.6%) | 11 (1.4%) |
| 19 to 25 Years | 468 (97.3%) | 13 (2.7%) |
| 26 to 34 Years | 678 (88.6%) | 87 (11.4%) |
| 35 to 44 Years | 610 (97.6%) | 15 (2.4%) |
| 45 to 54 Years | 647 (95.6%) | 30 (4.4%) |
| 55 to 64 Years | 916 (95.6%) | 42 (4.4%) |
| 65 to 74 Years | 751 (100.0%) | 0 (0.0%) |
| 75 Years and older | 311 (100.0%) | 0 (0.0%) |
| Total | 5,643 (96.6%) | 198 (3.4%) |
Health Insurance Coverage by Citizenship Status in Fort Wright
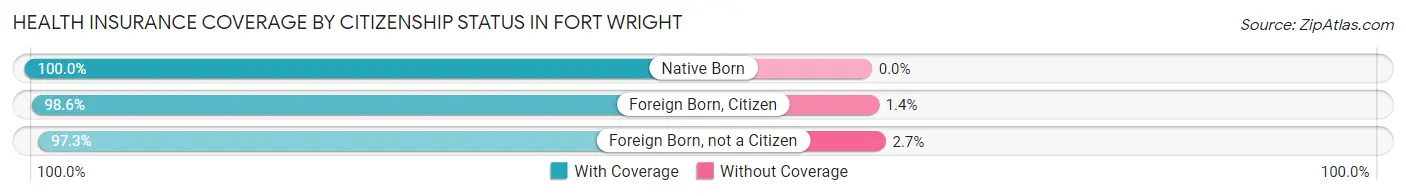
| Citizenship Status | With Coverage | Without Coverage |
| Native Born | 464 (100.0%) | 0 (0.0%) |
| Foreign Born, Citizen | 798 (98.6%) | 11 (1.4%) |
| Foreign Born, not a Citizen | 468 (97.3%) | 13 (2.7%) |
Health Insurance Coverage by Household Income in Fort Wright
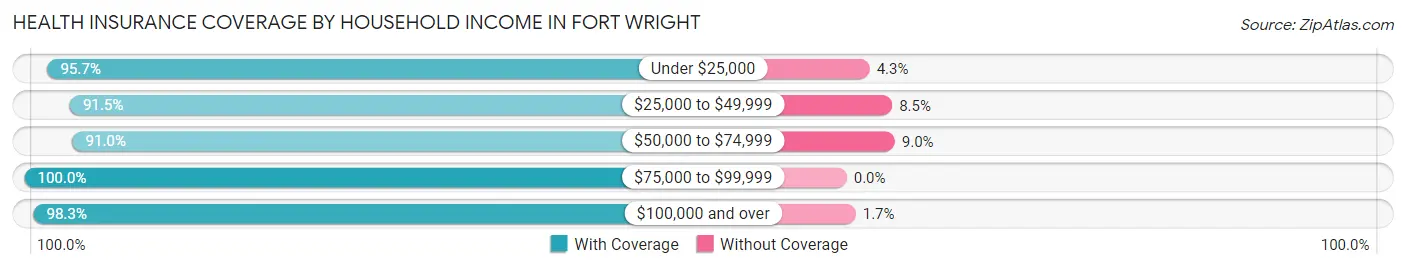
| Household Income | With Coverage | Without Coverage |
| Under $25,000 | 223 (95.7%) | 10 (4.3%) |
| $25,000 to $49,999 | 559 (91.5%) | 52 (8.5%) |
| $50,000 to $74,999 | 758 (91.0%) | 75 (9.0%) |
| $75,000 to $99,999 | 540 (100.0%) | 0 (0.0%) |
| $100,000 and over | 3,551 (98.3%) | 61 (1.7%) |
Public vs Private Health Insurance Coverage by Age in Fort Wright
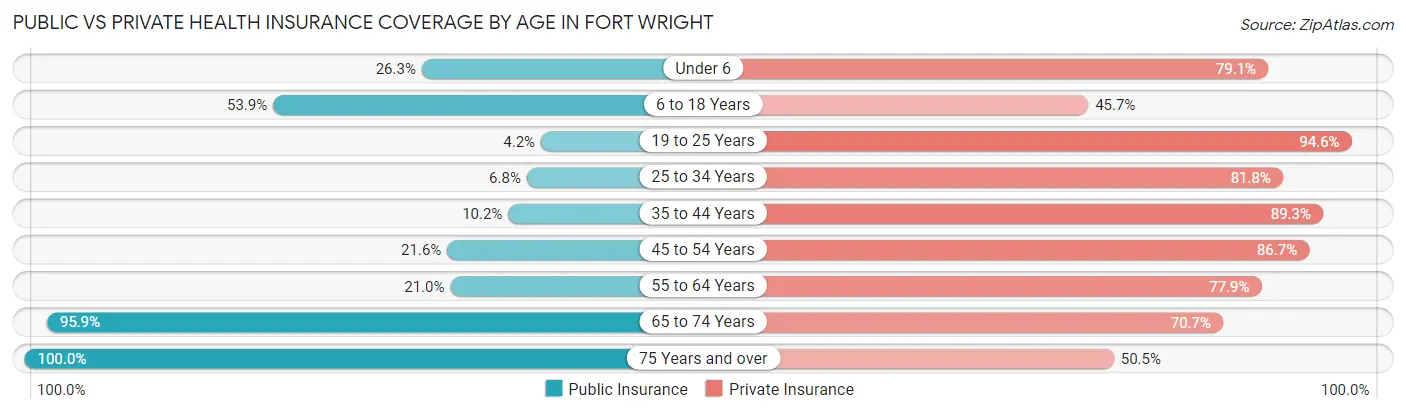
| Age Bracket | Public Insurance | Private Insurance |
| Under 6 | 122 (26.3%) | 367 (79.1%) |
| 6 to 18 Years | 436 (53.9%) | 370 (45.7%) |
| 19 to 25 Years | 20 (4.2%) | 455 (94.6%) |
| 25 to 34 Years | 52 (6.8%) | 626 (81.8%) |
| 35 to 44 Years | 64 (10.2%) | 558 (89.3%) |
| 45 to 54 Years | 146 (21.6%) | 587 (86.7%) |
| 55 to 64 Years | 201 (21.0%) | 746 (77.9%) |
| 65 to 74 Years | 720 (95.9%) | 531 (70.7%) |
| 75 Years and over | 311 (100.0%) | 157 (50.5%) |
| Total | 2,072 (35.5%) | 4,397 (75.3%) |
Disability Status by Sex by Age in Fort Wright
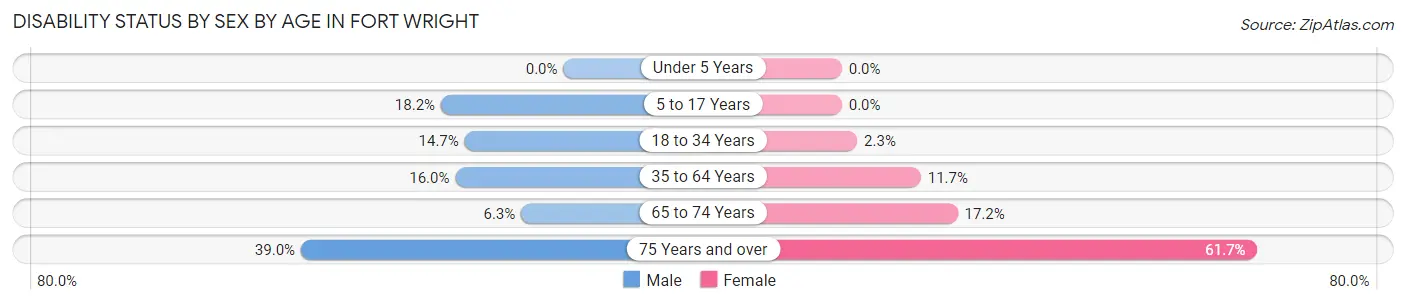
| Age Bracket | Male | Female |
| Under 5 Years | 0 (0.0%) | 0 (0.0%) |
| 5 to 17 Years | 96 (18.2%) | 0 (0.0%) |
| 18 to 34 Years | 105 (14.7%) | 14 (2.3%) |
| 35 to 64 Years | 167 (16.0%) | 143 (11.7%) |
| 65 to 74 Years | 23 (6.3%) | 66 (17.2%) |
| 75 Years and over | 53 (39.0%) | 108 (61.7%) |
Disability Class by Sex by Age in Fort Wright
Disability Class: Hearing Difficulty
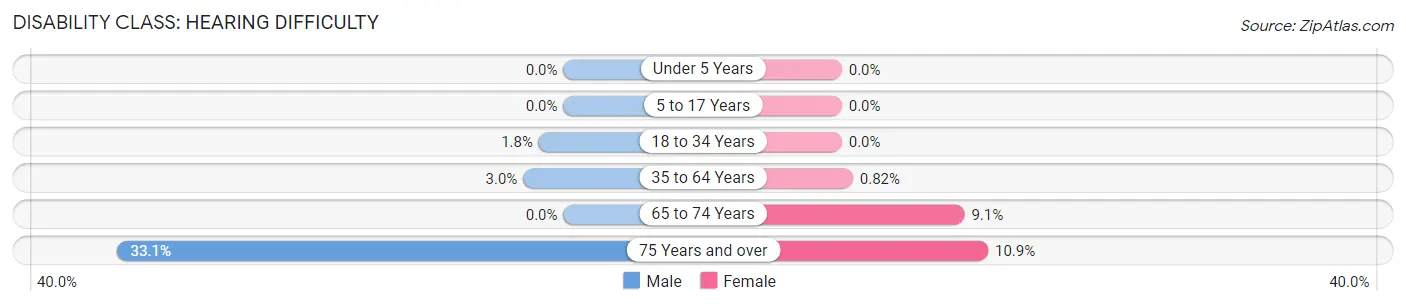
| Age Bracket | Male | Female |
| Under 5 Years | 0 (0.0%) | 0 (0.0%) |
| 5 to 17 Years | 0 (0.0%) | 0 (0.0%) |
| 18 to 34 Years | 13 (1.8%) | 0 (0.0%) |
| 35 to 64 Years | 31 (3.0%) | 10 (0.8%) |
| 65 to 74 Years | 0 (0.0%) | 35 (9.1%) |
| 75 Years and over | 45 (33.1%) | 19 (10.9%) |
Disability Class: Vision Difficulty
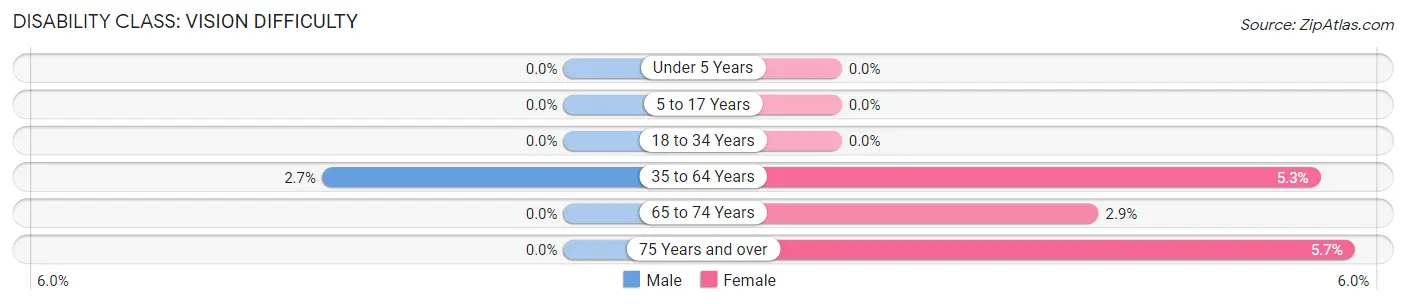
| Age Bracket | Male | Female |
| Under 5 Years | 0 (0.0%) | 0 (0.0%) |
| 5 to 17 Years | 0 (0.0%) | 0 (0.0%) |
| 18 to 34 Years | 0 (0.0%) | 0 (0.0%) |
| 35 to 64 Years | 28 (2.7%) | 65 (5.3%) |
| 65 to 74 Years | 0 (0.0%) | 11 (2.9%) |
| 75 Years and over | 0 (0.0%) | 10 (5.7%) |
Disability Class: Cognitive Difficulty
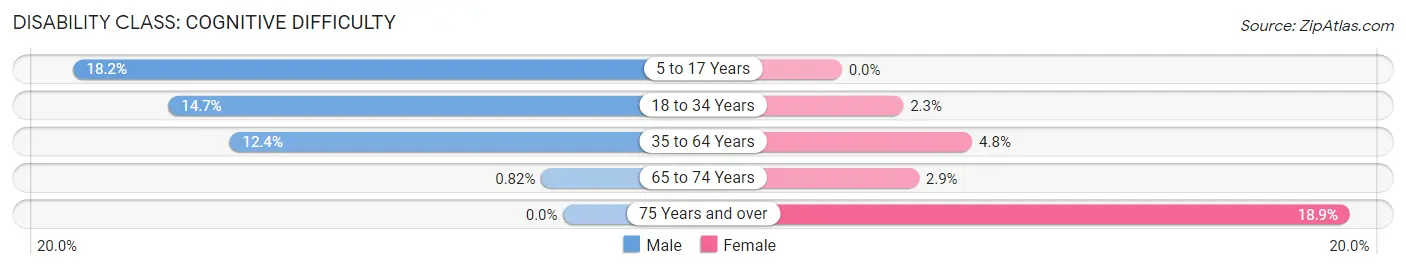
| Age Bracket | Male | Female |
| 5 to 17 Years | 96 (18.2%) | 0 (0.0%) |
| 18 to 34 Years | 105 (14.7%) | 14 (2.3%) |
| 35 to 64 Years | 129 (12.4%) | 59 (4.8%) |
| 65 to 74 Years | 3 (0.8%) | 11 (2.9%) |
| 75 Years and over | 0 (0.0%) | 33 (18.9%) |
Disability Class: Ambulatory Difficulty
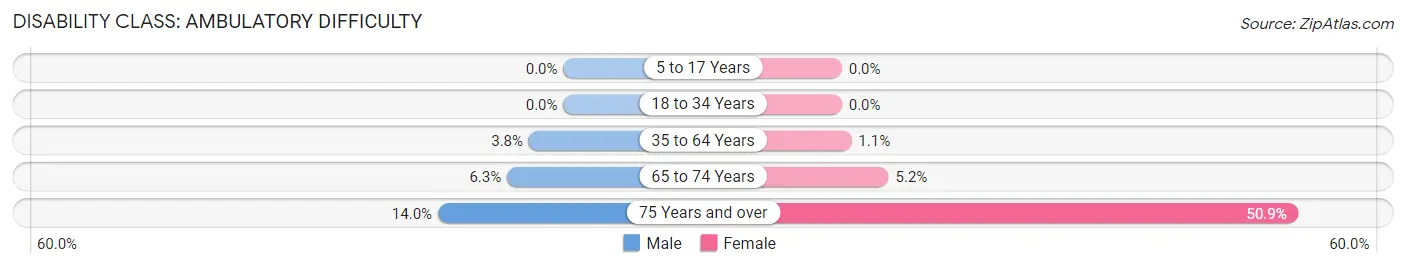
| Age Bracket | Male | Female |
| 5 to 17 Years | 0 (0.0%) | 0 (0.0%) |
| 18 to 34 Years | 0 (0.0%) | 0 (0.0%) |
| 35 to 64 Years | 40 (3.8%) | 13 (1.1%) |
| 65 to 74 Years | 23 (6.3%) | 20 (5.2%) |
| 75 Years and over | 19 (14.0%) | 89 (50.9%) |
Disability Class: Self-Care Difficulty
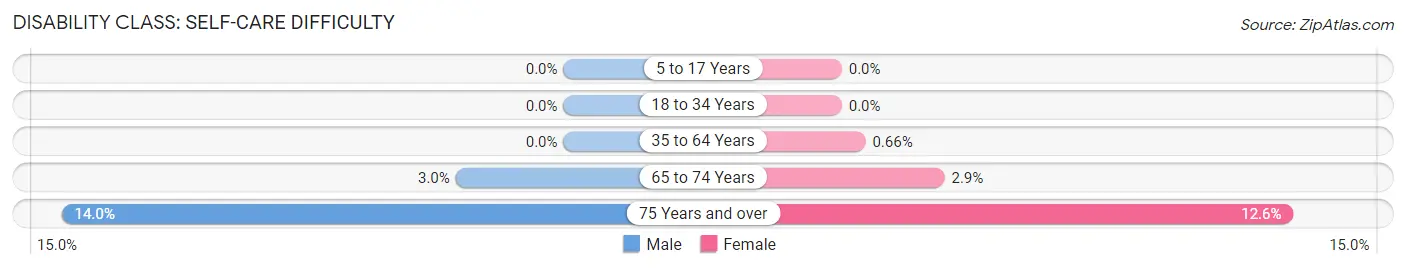
| Age Bracket | Male | Female |
| 5 to 17 Years | 0 (0.0%) | 0 (0.0%) |
| 18 to 34 Years | 0 (0.0%) | 0 (0.0%) |
| 35 to 64 Years | 0 (0.0%) | 8 (0.7%) |
| 65 to 74 Years | 11 (3.0%) | 11 (2.9%) |
| 75 Years and over | 19 (14.0%) | 22 (12.6%) |
Technology Access in Fort Wright
Computing Device Access in Fort Wright
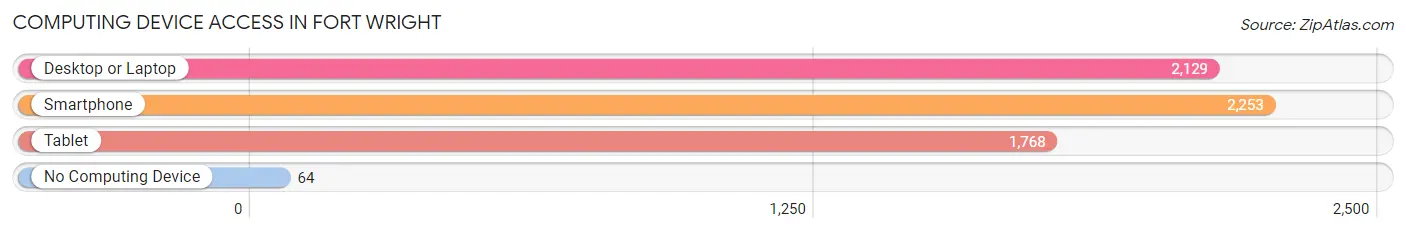
| Device Type | # Households | % Households |
| Desktop or Laptop | 2,129 | 88.2% |
| Smartphone | 2,253 | 93.3% |
| Tablet | 1,768 | 73.2% |
| No Computing Device | 64 | 2.6% |
| Total | 2,415 | 100.0% |
Internet Access in Fort Wright
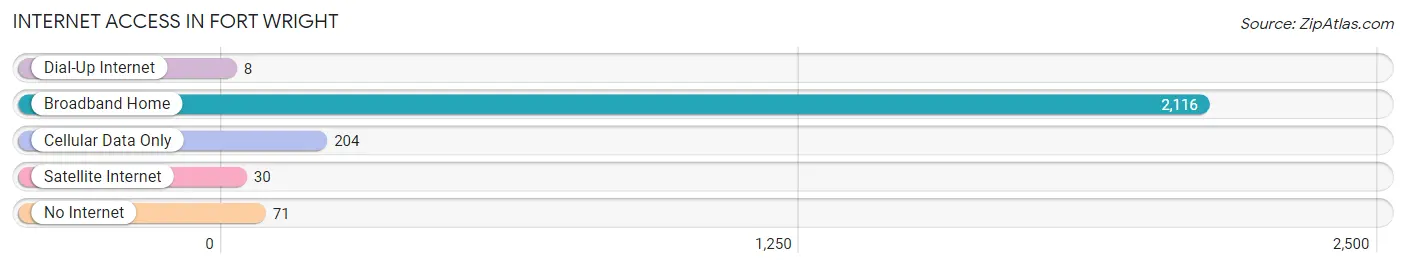
| Internet Type | # Households | % Households |
| Dial-Up Internet | 8 | 0.3% |
| Broadband Home | 2,116 | 87.6% |
| Cellular Data Only | 204 | 8.5% |
| Satellite Internet | 30 | 1.2% |
| No Internet | 71 | 2.9% |
| Total | 2,415 | 100.0% |
Fort Wright Summary
History
Fort Wright is a city located in Kenton County, Kentucky, United States. It is a suburb of Cincinnati, Ohio, and is part of the Greater Cincinnati metropolitan area. The city was incorporated in 1967 and is named after General Horatio Wright, a Union Army officer who served in the Civil War.
Fort Wright was originally part of the Symmes Purchase, a large tract of land purchased by John Cleves Symmes from the United States government in 1788. The area was first settled in the early 1800s by farmers and was known as "The Bend" due to its location at the bend of the Licking River. In 1867, the area was renamed Fort Wright in honor of General Horatio Wright.
The city of Fort Wright was officially incorporated in 1967. The city was originally a small farming community, but has since grown into a thriving suburb of Cincinnati. The city is home to several businesses, including the headquarters of the Cincinnati/Northern Kentucky International Airport.
Geography
Fort Wright is located in Kenton County, Kentucky, in the northern part of the state. It is situated on the banks of the Licking River, just south of the Ohio border. The city is bordered by the cities of Covington, Park Hills, and Fort Mitchell.
The city has a total area of 4.2 square miles, all of which is land. The terrain is mostly flat, with some rolling hills. The climate is humid subtropical, with hot, humid summers and cold, wet winters.
Economy
Fort Wright has a diverse economy, with a variety of businesses and industries. The city is home to several corporate headquarters, including the Cincinnati/Northern Kentucky International Airport. Other major employers in the city include the University of Cincinnati Medical Center, St. Elizabeth Healthcare, and the Cincinnati Children's Hospital Medical Center.
The city also has a thriving retail sector, with several shopping centers and malls. The city is home to the Florence Mall, which is the largest shopping center in the area.
Demographics
As of the 2010 census, the population of Fort Wright was 8,945. The racial makeup of the city was 87.3% White, 8.2% African American, 0.7% Asian, 0.3% Native American, and 3.5% from other races. Hispanic or Latino of any race were 2.2% of the population.
The median household income in Fort Wright was $60,945, and the median family income was $71,945. The per capita income was $30,945. About 4.3% of families and 5.7% of the population were below the poverty line.
The city is served by the Kenton County School District, which includes two elementary schools, one middle school, and one high school. The city is also home to several private schools, including the Covington Latin School and the St. Joseph School.
Common Questions
What is Per Capita Income in Fort Wright?
Per Capita income in Fort Wright is $48,433.
What is the Median Family Income in Fort Wright?
Median Family Income in Fort Wright is $133,125.
What is the Median Household income in Fort Wright?
Median Household Income in Fort Wright is $105,075.
What is Income or Wage Gap in Fort Wright?
Income or Wage Gap in Fort Wright is 27.9%.
Women in Fort Wright earn 72.1 cents for every dollar earned by a man.
What is Family Income Deficit in Fort Wright?
Family Income Deficit in Fort Wright is $12,319.
Families that are below poverty line in Fort Wright earn $12,319 less on average than the poverty threshold level.
What is Inequality or Gini Index in Fort Wright?
Inequality or Gini Index in Fort Wright is 0.38.
What is the Total Population of Fort Wright?
Total Population of Fort Wright is 5,841.
What is the Total Male Population of Fort Wright?
Total Male Population of Fort Wright is 2,986.
What is the Total Female Population of Fort Wright?
Total Female Population of Fort Wright is 2,855.
What is the Ratio of Males per 100 Females in Fort Wright?
There are 104.59 Males per 100 Females in Fort Wright.
What is the Ratio of Females per 100 Males in Fort Wright?
There are 95.61 Females per 100 Males in Fort Wright.
What is the Median Population Age in Fort Wright?
Median Population Age in Fort Wright is 39.4 Years.
What is the Average Family Size in Fort Wright
Average Family Size in Fort Wright is 3.2 People.
What is the Average Household Size in Fort Wright
Average Household Size in Fort Wright is 2.4 People.
How Large is the Labor Force in Fort Wright?
There are 3,193 People in the Labor Forcein in Fort Wright.
What is the Percentage of People in the Labor Force in Fort Wright?
66.5% of People are in the Labor Force in Fort Wright.
What is the Unemployment Rate in Fort Wright?
Unemployment Rate in Fort Wright is 2.7%.