Allen, KY Map & Demographics
Allen Map
Allen Overview
$14,551
PER CAPITA INCOME
$34,519
AVG FAMILY INCOME
$33,269
AVG HOUSEHOLD INCOME
0.51
INEQUALITY / GINI INDEX
213
TOTAL POPULATION
92
MALE POPULATION
121
FEMALE POPULATION
76.03
MALES / 100 FEMALES
131.52
FEMALES / 100 MALES
20.4
MEDIAN AGE
4.0
AVG FAMILY SIZE
2.7
AVG HOUSEHOLD SIZE
78
LABOR FORCE [ PEOPLE ]
58.2%
PERCENT IN LABOR FORCE
30.8%
UNEMPLOYMENT RATE
Allen Zip Codes
Allen Area Codes
Income in Allen
Income Overview in Allen
Per Capita Income in Allen is $14,551, while median incomes of families and households are $34,519 and $33,269 respectively.
| Characteristic | Number | Measure |
| Per Capita Income | 213 | $14,551 |
| Median Family Income | 41 | $34,519 |
| Mean Family Income | 41 | $46,534 |
| Median Household Income | 80 | $33,269 |
| Mean Household Income | 80 | $40,033 |
| Income Deficit | 41 | $0 |
| Wage / Income Gap (%) | 213 | 0.00% |
| Wage / Income Gap ($) | 213 | 100.00¢ per $1 |
| Gini / Inequality Index | 213 | 0.51 |
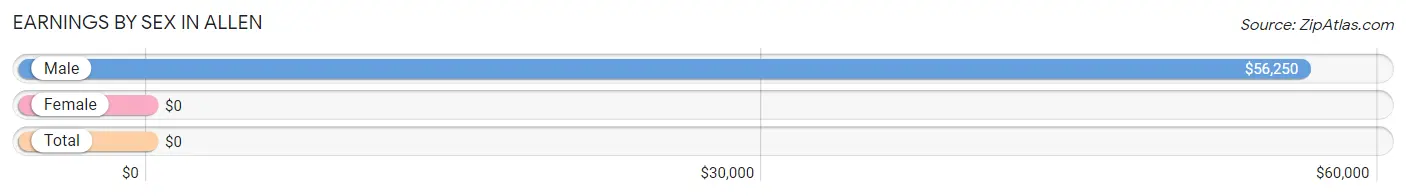
Earnings by Sex in Allen
| Sex | Number | Average Earnings |
| Male | 30 (40.5%) | $56,250 |
| Female | 44 (59.5%) | $0 |
| Total | 74 (100.0%) | $0 |
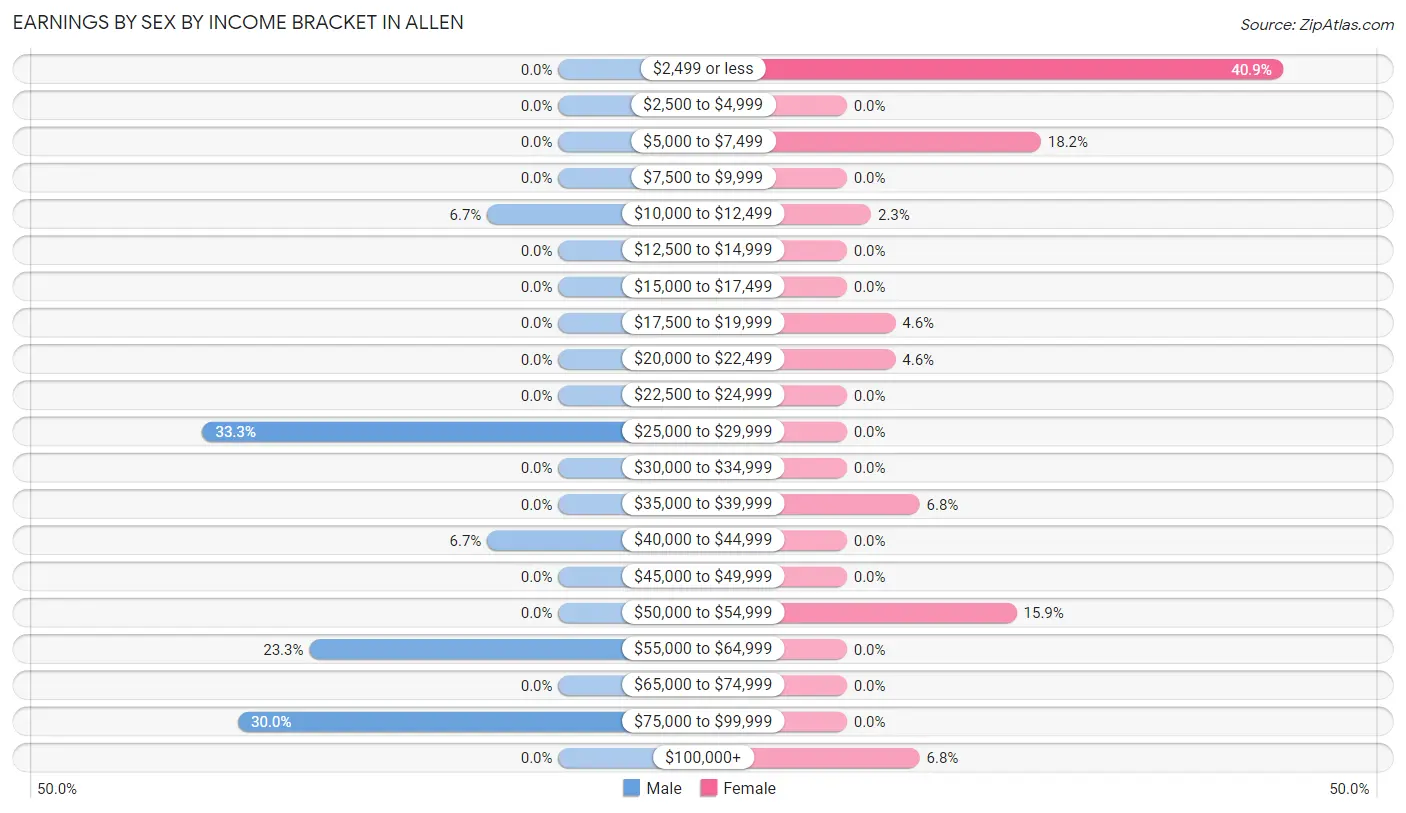
Earnings by Sex by Income Bracket in Allen
The most common earnings brackets in Allen are $25,000 to $29,999 for men (10 | 33.3%) and $2,499 or less for women (18 | 40.9%).
| Income | Male | Female |
| $2,499 or less | 0 (0.0%) | 18 (40.9%) |
| $2,500 to $4,999 | 0 (0.0%) | 0 (0.0%) |
| $5,000 to $7,499 | 0 (0.0%) | 8 (18.2%) |
| $7,500 to $9,999 | 0 (0.0%) | 0 (0.0%) |
| $10,000 to $12,499 | 2 (6.7%) | 1 (2.3%) |
| $12,500 to $14,999 | 0 (0.0%) | 0 (0.0%) |
| $15,000 to $17,499 | 0 (0.0%) | 0 (0.0%) |
| $17,500 to $19,999 | 0 (0.0%) | 2 (4.5%) |
| $20,000 to $22,499 | 0 (0.0%) | 2 (4.5%) |
| $22,500 to $24,999 | 0 (0.0%) | 0 (0.0%) |
| $25,000 to $29,999 | 10 (33.3%) | 0 (0.0%) |
| $30,000 to $34,999 | 0 (0.0%) | 0 (0.0%) |
| $35,000 to $39,999 | 0 (0.0%) | 3 (6.8%) |
| $40,000 to $44,999 | 2 (6.7%) | 0 (0.0%) |
| $45,000 to $49,999 | 0 (0.0%) | 0 (0.0%) |
| $50,000 to $54,999 | 0 (0.0%) | 7 (15.9%) |
| $55,000 to $64,999 | 7 (23.3%) | 0 (0.0%) |
| $65,000 to $74,999 | 0 (0.0%) | 0 (0.0%) |
| $75,000 to $99,999 | 9 (30.0%) | 0 (0.0%) |
| $100,000+ | 0 (0.0%) | 3 (6.8%) |
| Total | 30 (100.0%) | 44 (100.0%) |
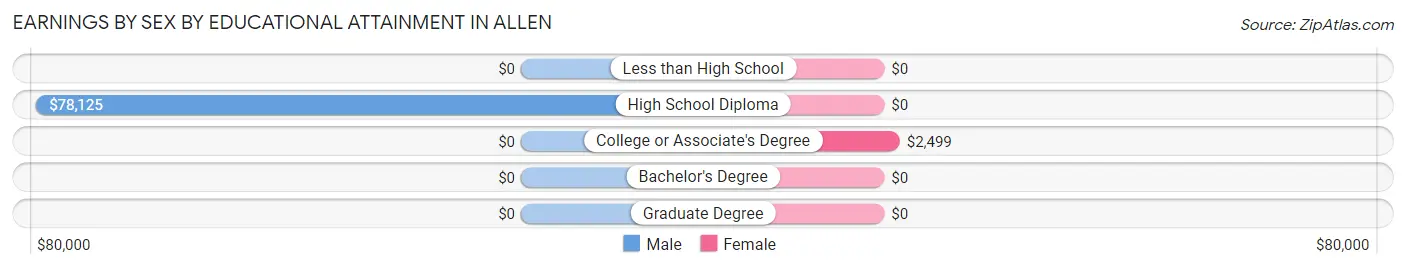
Earnings by Sex by Educational Attainment in Allen
| Educational Attainment | Male Income | Female Income |
| Less than High School | - | - |
| High School Diploma | $78,125 | $0 |
| College or Associate's Degree | - | - |
| Bachelor's Degree | - | - |
| Graduate Degree | - | - |
| Total | $70,000 | $0 |
Family Income in Allen
Family Income Brackets in Allen
According to the Allen family income data, there are 15 families falling into the $25,000 to $34,999 income range, which is the most common income bracket and makes up 36.6% of all families.
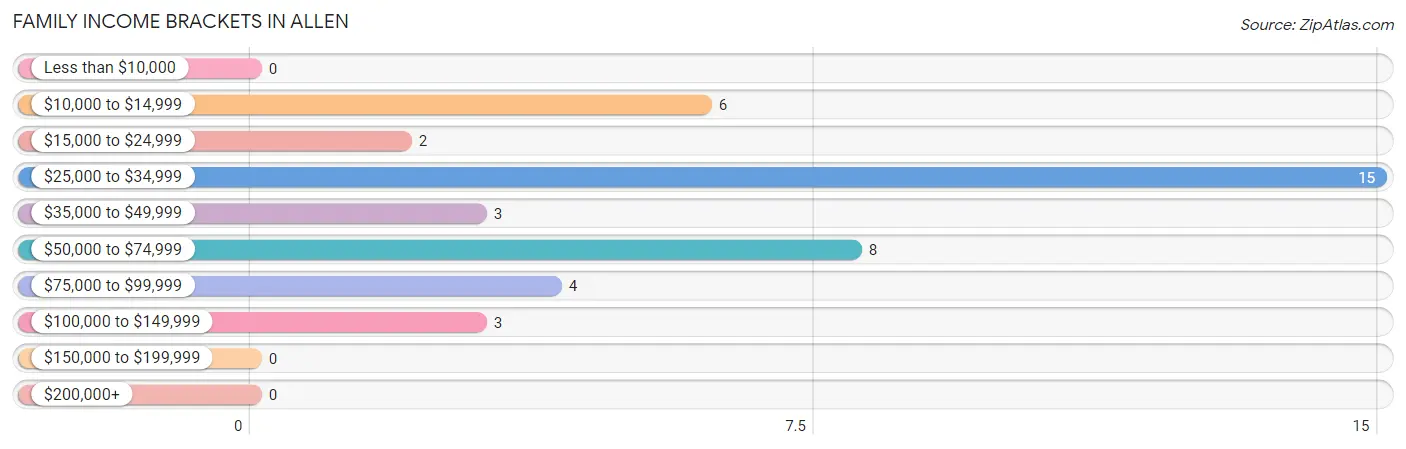
| Income Bracket | # Families | % Families |
| Less than $10,000 | 0 | 0.0% |
| $10,000 to $14,999 | 6 | 14.6% |
| $15,000 to $24,999 | 2 | 4.9% |
| $25,000 to $34,999 | 15 | 36.6% |
| $35,000 to $49,999 | 3 | 7.3% |
| $50,000 to $74,999 | 8 | 19.5% |
| $75,000 to $99,999 | 4 | 9.8% |
| $100,000 to $149,999 | 3 | 7.3% |
| $150,000 to $199,999 | 0 | 0.0% |
| $200,000+ | 0 | 0.0% |
Family Income by Famaliy Size in Allen
3-person families (13 | 31.7%) account for the highest median family income in Allen with $33,625 per family, while 3-person families (13 | 31.7%) have the highest median income of $11,208 per family member.
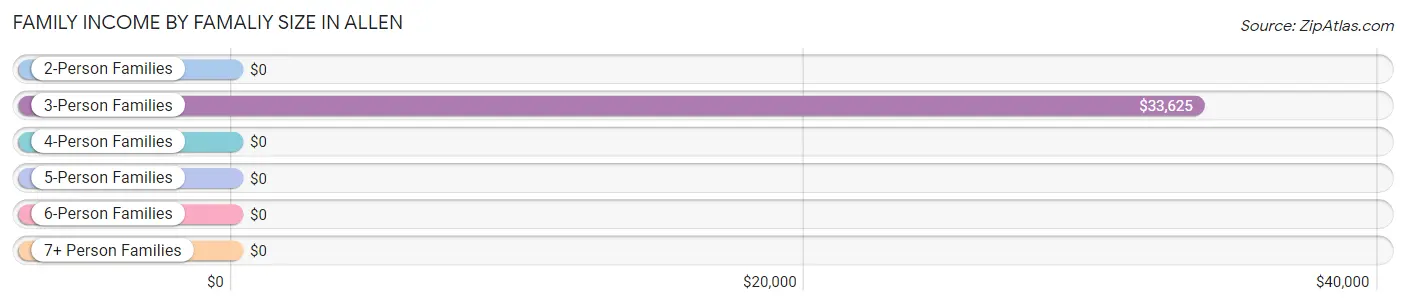
| Income Bracket | # Families | Median Income |
| 2-Person Families | 11 (26.8%) | $0 |
| 3-Person Families | 13 (31.7%) | $33,625 |
| 4-Person Families | 0 (0.0%) | $0 |
| 5-Person Families | 6 (14.6%) | $0 |
| 6-Person Families | 9 (22.0%) | $0 |
| 7+ Person Families | 2 (4.9%) | $0 |
| Total | 41 (100.0%) | $34,519 |
Family Income by Number of Earners in Allen
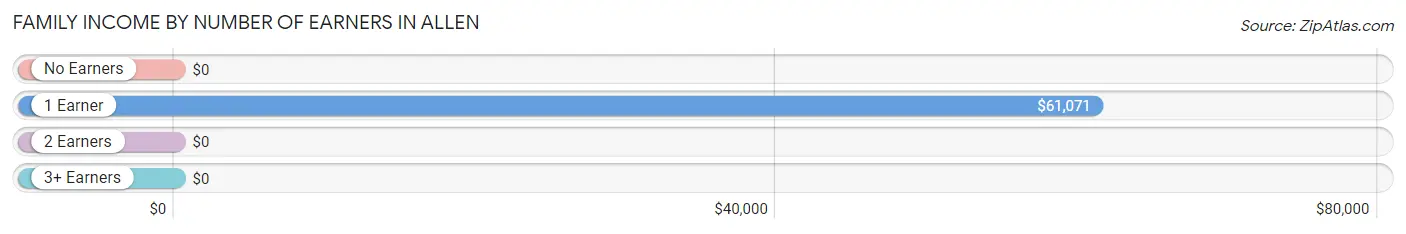
| Number of Earners | # Families | Median Income |
| No Earners | 11 (26.8%) | $0 |
| 1 Earner | 12 (29.3%) | $61,071 |
| 2 Earners | 18 (43.9%) | $0 |
| 3+ Earners | 0 (0.0%) | $0 |
| Total | 41 (100.0%) | $34,519 |
Household Income in Allen
Household Income Brackets in Allen
With 18 households falling in the category, the less than $10,000 income range is the most frequent in Allen, accounting for 22.5% of all households.
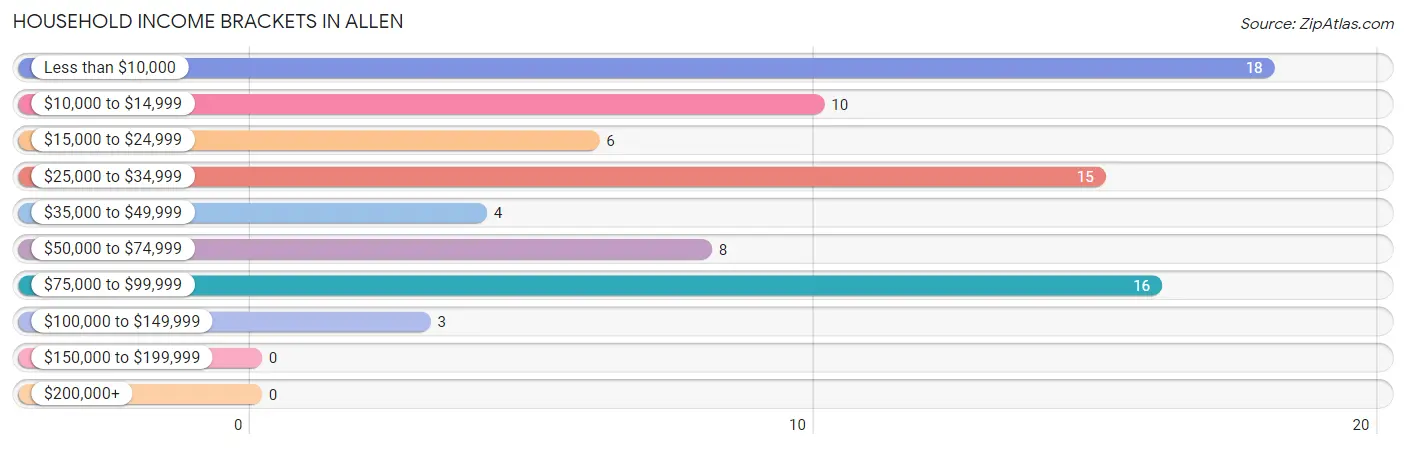
| Income Bracket | # Households | % Households |
| Less than $10,000 | 18 | 22.5% |
| $10,000 to $14,999 | 10 | 12.5% |
| $15,000 to $24,999 | 6 | 7.5% |
| $25,000 to $34,999 | 15 | 18.8% |
| $35,000 to $49,999 | 4 | 5.0% |
| $50,000 to $74,999 | 8 | 10.0% |
| $75,000 to $99,999 | 16 | 20.0% |
| $100,000 to $149,999 | 3 | 3.8% |
| $150,000 to $199,999 | 0 | 0.0% |
| $200,000+ | 0 | 0.0% |
Household Income by Householder Age in Allen
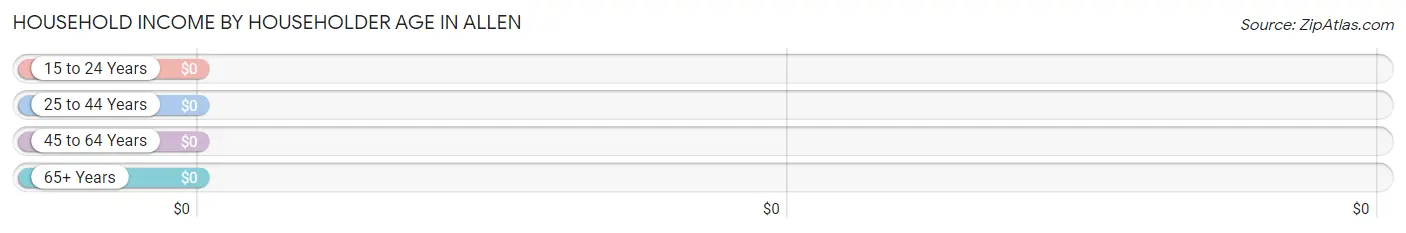
| Income Bracket | # Households | Median Income |
| 15 to 24 Years | 12 (15.0%) | $0 |
| 25 to 44 Years | 41 (51.2%) | $0 |
| 45 to 64 Years | 14 (17.5%) | $0 |
| 65+ Years | 13 (16.3%) | $0 |
| Total | 80 (100.0%) | $33,269 |
Poverty in Allen
Income Below Poverty by Sex and Age in Allen
With 21.8% poverty level for males and 38.8% for females among the residents of Allen, 15 year old males and 45 to 54 year old females are the most vulnerable to poverty, with 7 males (100.0%) and 4 females (80.0%) in their respective age groups living below the poverty level.
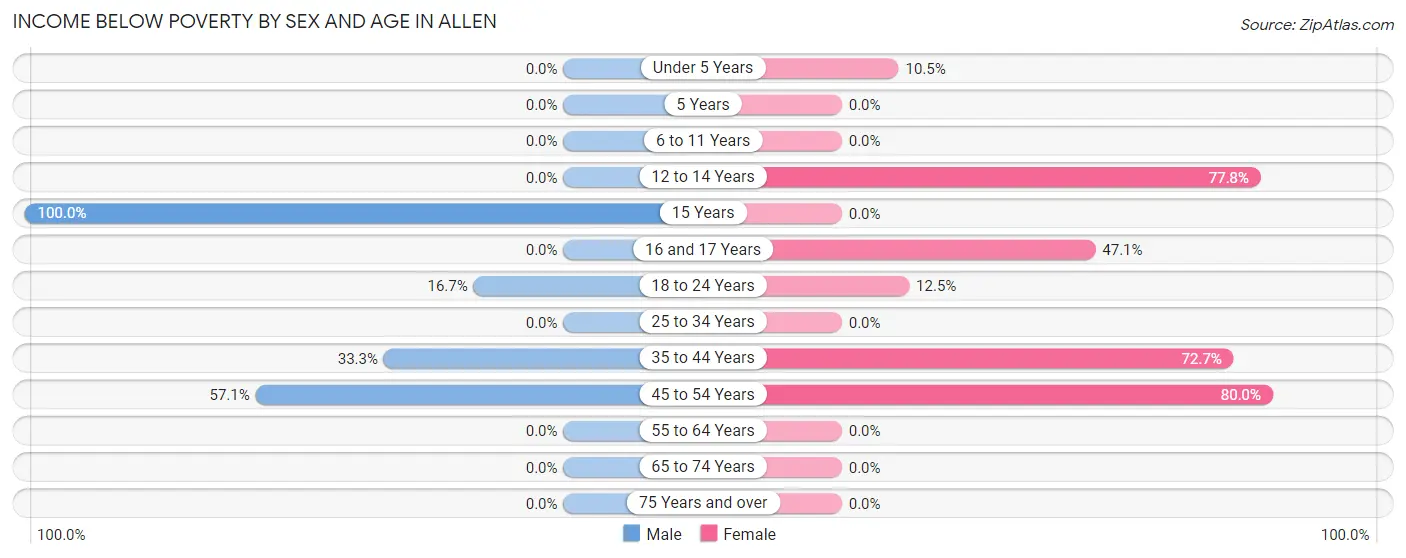
| Age Bracket | Male | Female |
| Under 5 Years | 0 (0.0%) | 2 (10.5%) |
| 5 Years | 0 (0.0%) | 0 (0.0%) |
| 6 to 11 Years | 0 (0.0%) | 0 (0.0%) |
| 12 to 14 Years | 0 (0.0%) | 7 (77.8%) |
| 15 Years | 7 (100.0%) | 0 (0.0%) |
| 16 and 17 Years | 0 (0.0%) | 8 (47.1%) |
| 18 to 24 Years | 2 (16.7%) | 2 (12.5%) |
| 25 to 34 Years | 0 (0.0%) | 0 (0.0%) |
| 35 to 44 Years | 6 (33.3%) | 24 (72.7%) |
| 45 to 54 Years | 4 (57.1%) | 4 (80.0%) |
| 55 to 64 Years | 0 (0.0%) | 0 (0.0%) |
| 65 to 74 Years | 0 (0.0%) | 0 (0.0%) |
| 75 Years and over | 0 (0.0%) | 0 (0.0%) |
| Total | 19 (21.8%) | 47 (38.8%) |
Income Above Poverty by Sex and Age in Allen
According to the poverty statistics in Allen, males aged under 5 years and females aged 6 to 11 years are the age groups that are most secure financially, with 100.0% of males and 100.0% of females in these age groups living above the poverty line.
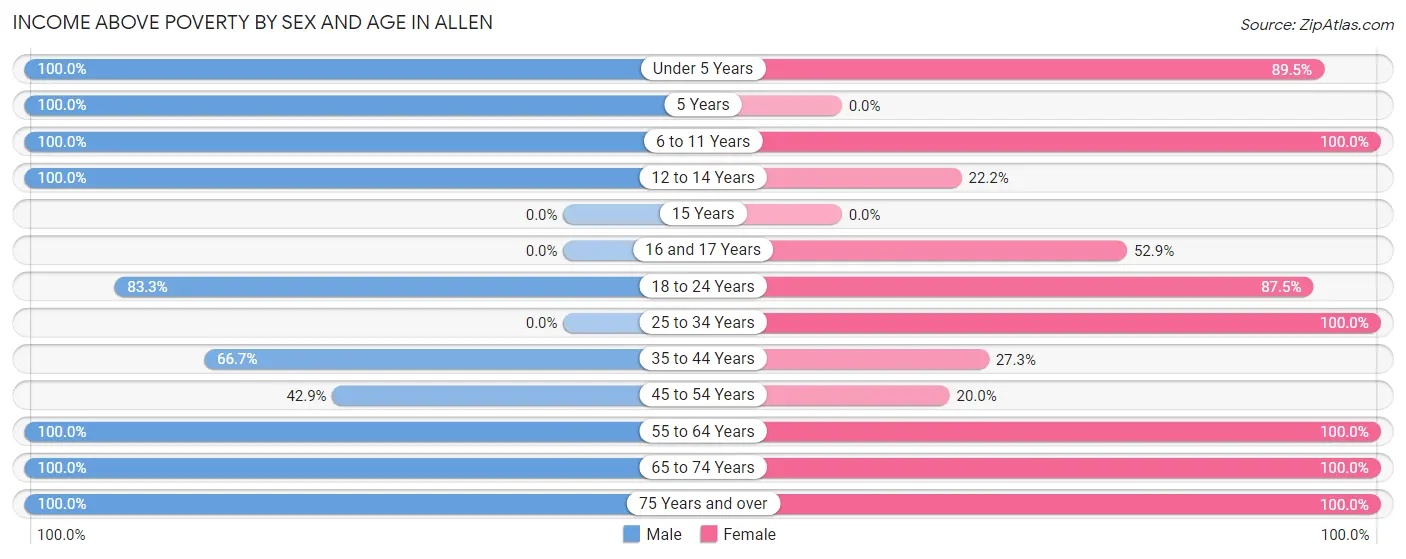
| Age Bracket | Male | Female |
| Under 5 Years | 20 (100.0%) | 17 (89.5%) |
| 5 Years | 2 (100.0%) | 0 (0.0%) |
| 6 to 11 Years | 6 (100.0%) | 6 (100.0%) |
| 12 to 14 Years | 5 (100.0%) | 2 (22.2%) |
| 15 Years | 0 (0.0%) | 0 (0.0%) |
| 16 and 17 Years | 0 (0.0%) | 9 (52.9%) |
| 18 to 24 Years | 10 (83.3%) | 14 (87.5%) |
| 25 to 34 Years | 0 (0.0%) | 2 (100.0%) |
| 35 to 44 Years | 12 (66.7%) | 9 (27.3%) |
| 45 to 54 Years | 3 (42.9%) | 1 (20.0%) |
| 55 to 64 Years | 2 (100.0%) | 8 (100.0%) |
| 65 to 74 Years | 2 (100.0%) | 3 (100.0%) |
| 75 Years and over | 6 (100.0%) | 3 (100.0%) |
| Total | 68 (78.2%) | 74 (61.2%) |
Income Below Poverty Among Married-Couple Families in Allen
The poverty statistics for married-couple families in Allen show that 29.6% or 8 of the total 27 families live below the poverty line. Families with 3 or 4 children have the highest poverty rate of 75.0%, comprising of 6 families. On the other hand, families with no children have the lowest poverty rate of 0.0%, which includes 0 families.
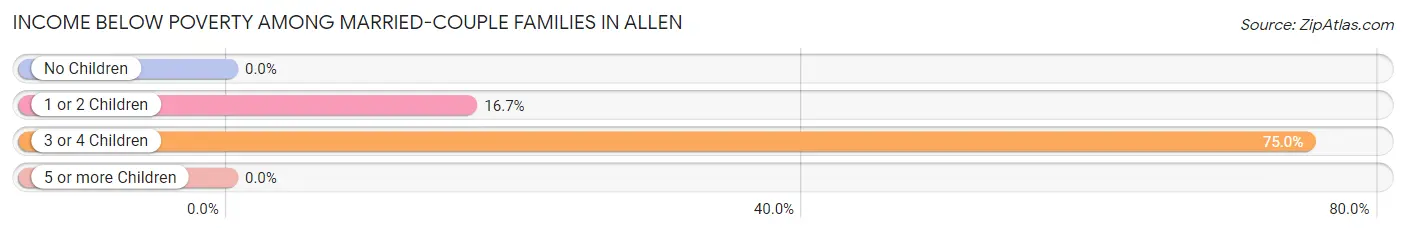
| Children | Above Poverty | Below Poverty |
| No Children | 7 (100.0%) | 0 (0.0%) |
| 1 or 2 Children | 10 (83.3%) | 2 (16.7%) |
| 3 or 4 Children | 2 (25.0%) | 6 (75.0%) |
| 5 or more Children | 0 (0.0%) | 0 (0.0%) |
| Total | 19 (70.4%) | 8 (29.6%) |
Income Below Poverty Among Single-Parent Households in Allen
| Children | Single Father | Single Mother |
| No Children | 0 (0.0%) | 0 (0.0%) |
| 1 or 2 Children | 0 (0.0%) | 0 (0.0%) |
| 3 or 4 Children | 0 (0.0%) | 0 (0.0%) |
| 5 or more Children | 0 (0.0%) | 0 (0.0%) |
| Total | 0 (0.0%) | 0 (0.0%) |
Income Below Poverty Among Married-Couple vs Single-Parent Households in Allen
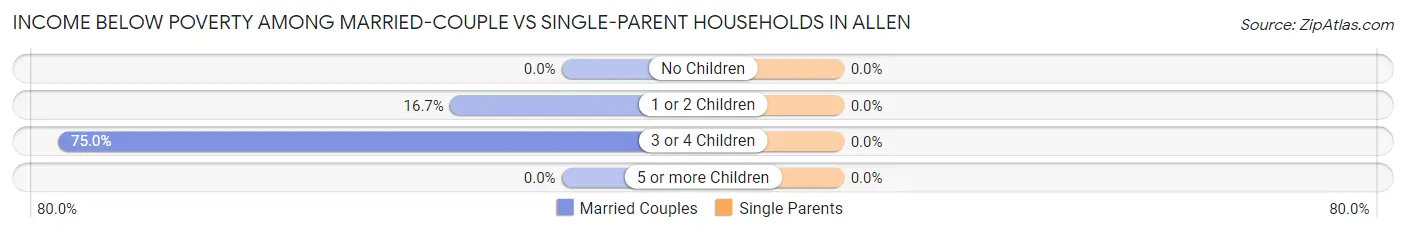
| Children | Married-Couple Families | Single-Parent Households |
| No Children | 0 (0.0%) | 0 (0.0%) |
| 1 or 2 Children | 2 (16.7%) | 0 (0.0%) |
| 3 or 4 Children | 6 (75.0%) | 0 (0.0%) |
| 5 or more Children | 0 (0.0%) | 0 (0.0%) |
| Total | 8 (29.6%) | 0 (0.0%) |
Race in Allen
The most populous races in Allen are White / Caucasian (205 | 96.2%), Two or more Races (5 | 2.4%), and Asian (3 | 1.4%).
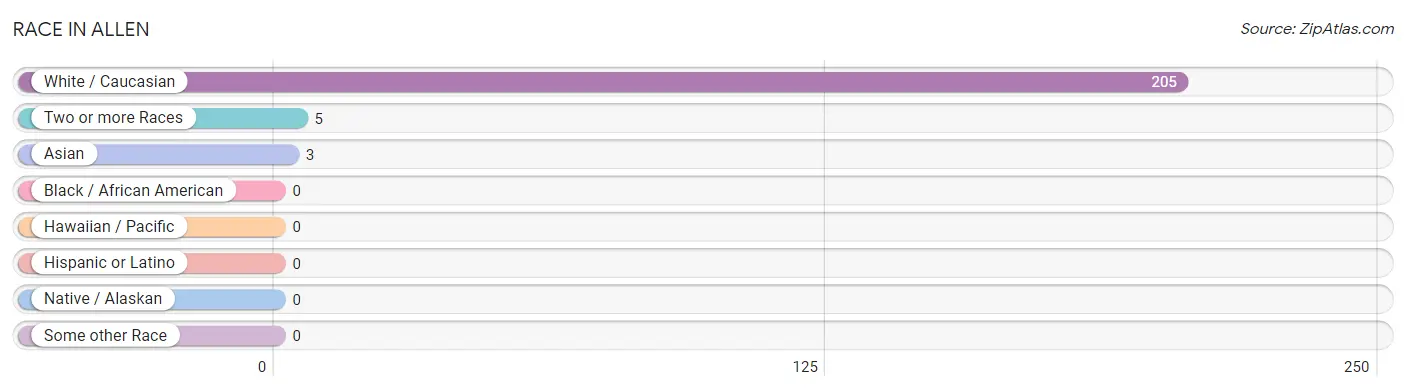
| Race | # Population | % Population |
| Asian | 3 | 1.4% |
| Black / African American | 0 | 0.0% |
| Hawaiian / Pacific | 0 | 0.0% |
| Hispanic or Latino | 0 | 0.0% |
| Native / Alaskan | 0 | 0.0% |
| White / Caucasian | 205 | 96.2% |
| Two or more Races | 5 | 2.4% |
| Some other Race | 0 | 0.0% |
| Total | 213 | 100.0% |
Ancestry in Allen
The most populous ancestries reported in Allen are American (30 | 14.1%), Scotch-Irish (18 | 8.5%), English (13 | 6.1%), German (11 | 5.2%), and Welsh (6 | 2.8%), together accounting for 36.6% of all Allen residents.
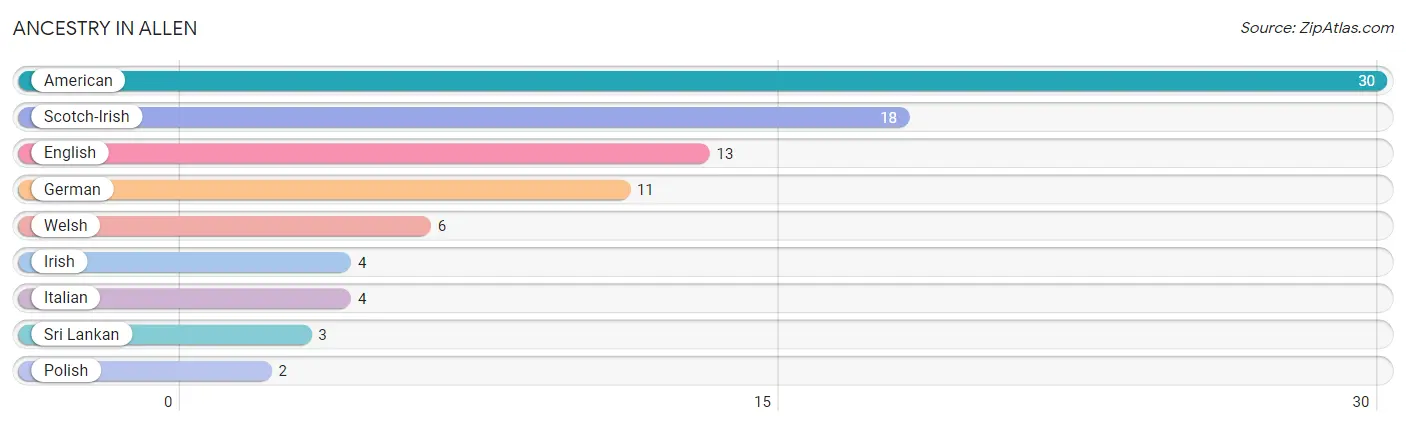
| Ancestry | # Population | % Population |
| American | 30 | 14.1% |
| English | 13 | 6.1% |
| German | 11 | 5.2% |
| Irish | 4 | 1.9% |
| Italian | 4 | 1.9% |
| Polish | 2 | 0.9% |
| Scotch-Irish | 18 | 8.5% |
| Sri Lankan | 3 | 1.4% |
| Welsh | 6 | 2.8% | View All 9 Rows |
Immigrants in Allen
The most numerous immigrant groups reported in Allen came from Asia (3 | 1.4%), South Eastern Asia (3 | 1.4%), and Vietnam (3 | 1.4%), together accounting for 4.2% of all Allen residents.
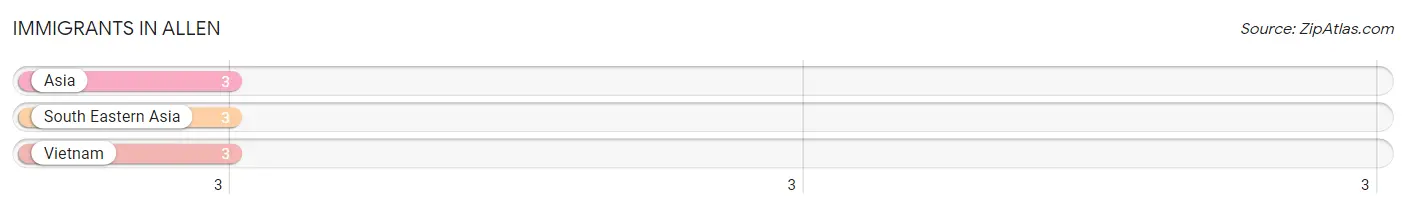
| Immigration Origin | # Population | % Population |
| Asia | 3 | 1.4% |
| South Eastern Asia | 3 | 1.4% |
| Vietnam | 3 | 1.4% | View All 3 Rows |
Sex and Age in Allen
Sex and Age in Allen
The most populous age groups in Allen are Under 5 Years (20 | 21.7%) for men and 40 to 44 Years (27 | 22.3%) for women.
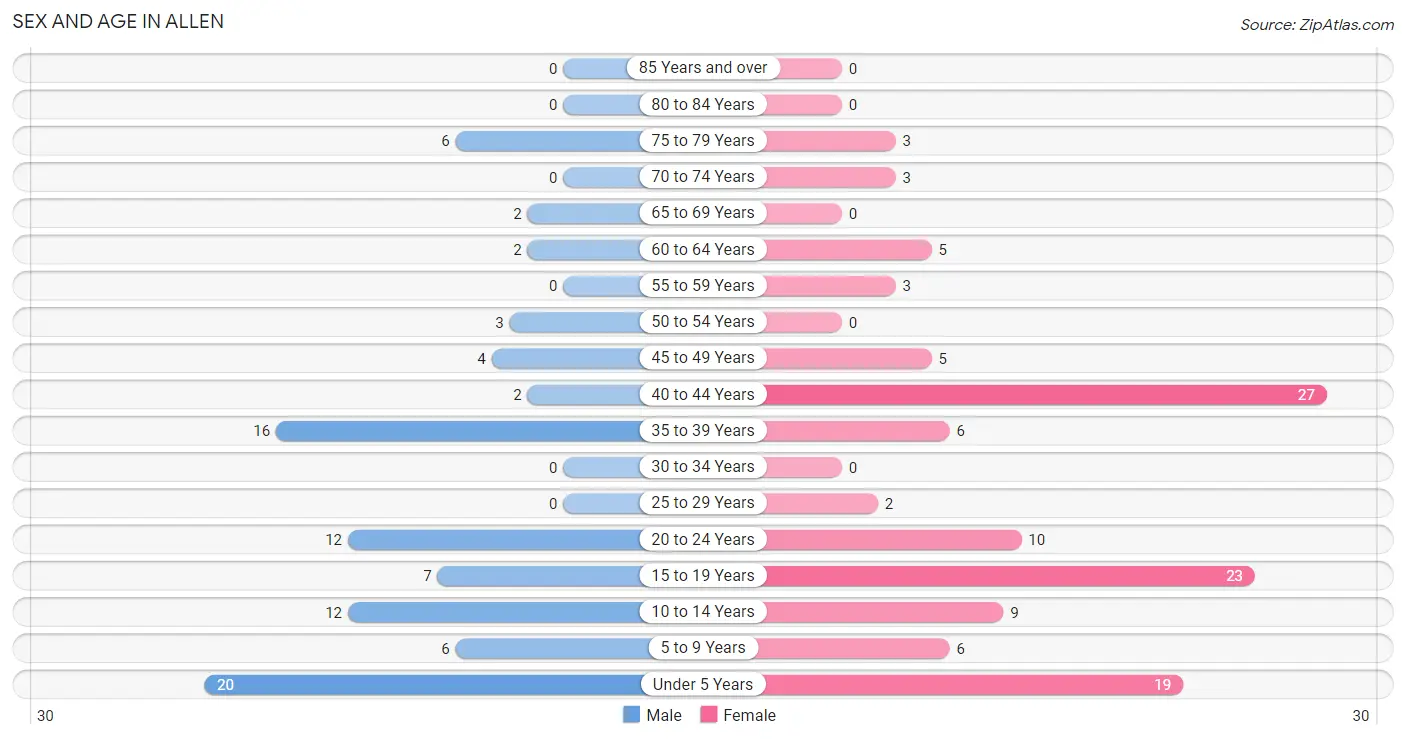
| Age Bracket | Male | Female |
| Under 5 Years | 20 (21.7%) | 19 (15.7%) |
| 5 to 9 Years | 6 (6.5%) | 6 (5.0%) |
| 10 to 14 Years | 12 (13.0%) | 9 (7.4%) |
| 15 to 19 Years | 7 (7.6%) | 23 (19.0%) |
| 20 to 24 Years | 12 (13.0%) | 10 (8.3%) |
| 25 to 29 Years | 0 (0.0%) | 2 (1.7%) |
| 30 to 34 Years | 0 (0.0%) | 0 (0.0%) |
| 35 to 39 Years | 16 (17.4%) | 6 (5.0%) |
| 40 to 44 Years | 2 (2.2%) | 27 (22.3%) |
| 45 to 49 Years | 4 (4.3%) | 5 (4.1%) |
| 50 to 54 Years | 3 (3.3%) | 0 (0.0%) |
| 55 to 59 Years | 0 (0.0%) | 3 (2.5%) |
| 60 to 64 Years | 2 (2.2%) | 5 (4.1%) |
| 65 to 69 Years | 2 (2.2%) | 0 (0.0%) |
| 70 to 74 Years | 0 (0.0%) | 3 (2.5%) |
| 75 to 79 Years | 6 (6.5%) | 3 (2.5%) |
| 80 to 84 Years | 0 (0.0%) | 0 (0.0%) |
| 85 Years and over | 0 (0.0%) | 0 (0.0%) |
| Total | 92 (100.0%) | 121 (100.0%) |
Families and Households in Allen
Median Family Size in Allen
The median family size in Allen is 4.02 persons per family, with single female/mother families (10 | 24.4%) accounting for the largest median family size of 5.8 persons per family. On the other hand, married-couple families (27 | 65.8%) represent the smallest median family size with 3.26 persons per family.
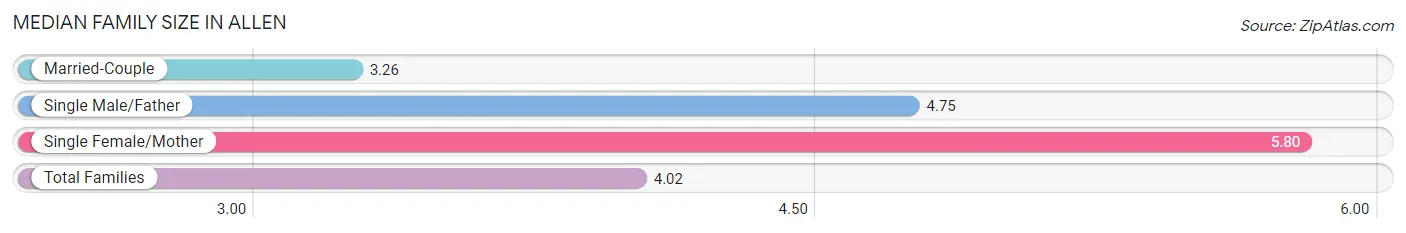
| Family Type | # Families | Family Size |
| Married-Couple | 27 (65.8%) | 3.26 |
| Single Male/Father | 4 (9.8%) | 4.75 |
| Single Female/Mother | 10 (24.4%) | 5.80 |
| Total Families | 41 (100.0%) | 4.02 |
Median Household Size in Allen
The median household size in Allen is 2.66 persons per household, with single female/mother households (10 | 12.5%) accounting for the largest median household size of 5.8 persons per household. non-family households (39 | 48.7%) represent the smallest median household size with 1.23 persons per household.
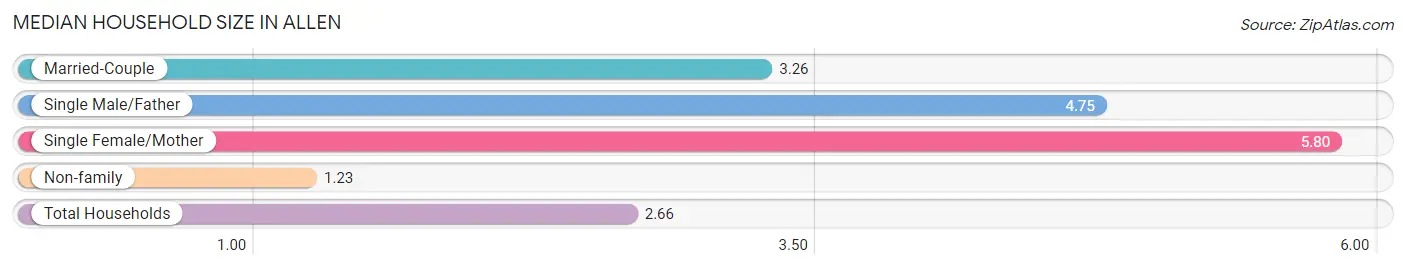
| Household Type | # Households | Household Size |
| Married-Couple | 27 (33.8%) | 3.26 |
| Single Male/Father | 4 (5.0%) | 4.75 |
| Single Female/Mother | 10 (12.5%) | 5.80 |
| Non-family | 39 (48.7%) | 1.23 |
| Total Households | 80 (100.0%) | 2.66 |
Household Size by Marriage Status in Allen
Out of a total of 80 households in Allen, 41 (51.2%) are family households, while 39 (48.7%) are nonfamily households. The most numerous type of family households are 3-person households, comprising 13, and the most common type of nonfamily households are 1-person households, comprising 32.
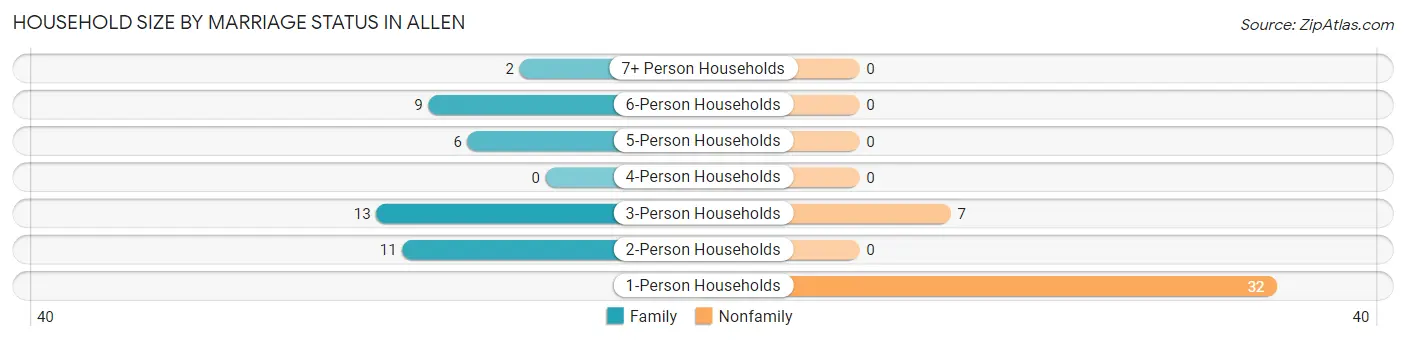
| Household Size | Family Households | Nonfamily Households |
| 1-Person Households | - | 32 (40.0%) |
| 2-Person Households | 11 (13.8%) | 0 (0.0%) |
| 3-Person Households | 13 (16.3%) | 7 (8.7%) |
| 4-Person Households | 0 (0.0%) | 0 (0.0%) |
| 5-Person Households | 6 (7.5%) | 0 (0.0%) |
| 6-Person Households | 9 (11.3%) | 0 (0.0%) |
| 7+ Person Households | 2 (2.5%) | 0 (0.0%) |
| Total | 41 (51.2%) | 39 (48.7%) |
Female Fertility in Allen
Fertility by Age in Allen
Average fertility rate in Allen is 205.0 births per 1,000 women. Women in the age bracket of 20 to 34 years have the highest fertility rate with 750.0 births per 1,000 women. Women in the age bracket of 20 to 34 years acount for 60.0% of all women with births.
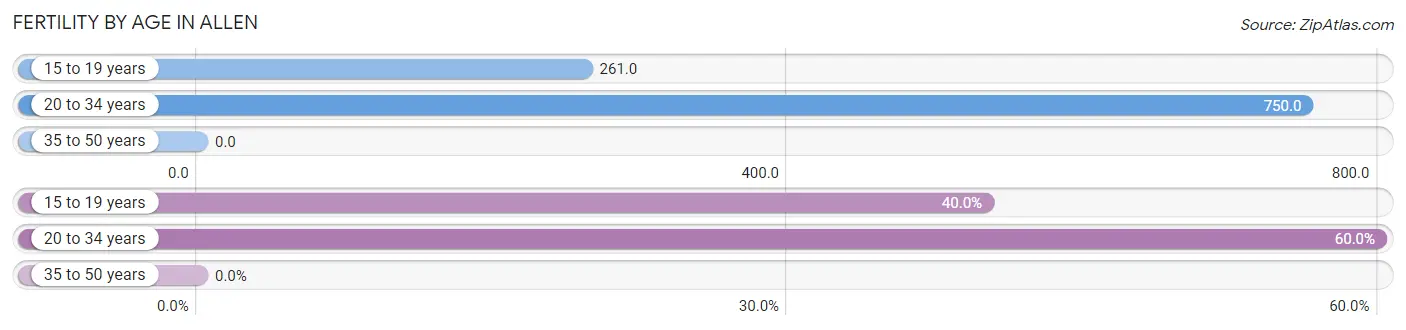
| Age Bracket | Women with Births | Births / 1,000 Women |
| 15 to 19 years | 6 (40.0%) | 261.0 |
| 20 to 34 years | 9 (60.0%) | 750.0 |
| 35 to 50 years | 0 (0.0%) | 0.0 |
| Total | 15 (100.0%) | 205.0 |
Fertility by Age by Marriage Status in Allen
53.3% of women with births (15) in Allen are married. The highest percentage of unmarried women with births falls into 20 to 34 years age bracket with 77.8% of them unmarried at the time of birth, while the lowest percentage of unmarried women with births belong to 15 to 19 years age bracket with 0.0% of them unmarried.
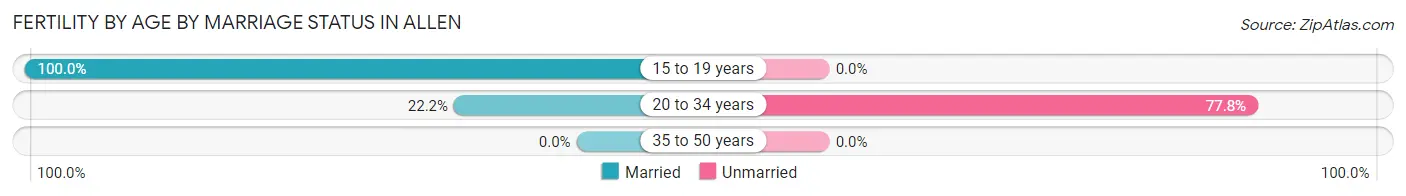
| Age Bracket | Married | Unmarried |
| 15 to 19 years | 6 (100.0%) | 0 (0.0%) |
| 20 to 34 years | 2 (22.2%) | 7 (77.8%) |
| 35 to 50 years | 0 (0.0%) | 0 (0.0%) |
| Total | 8 (53.3%) | 7 (46.7%) |
Fertility by Education in Allen
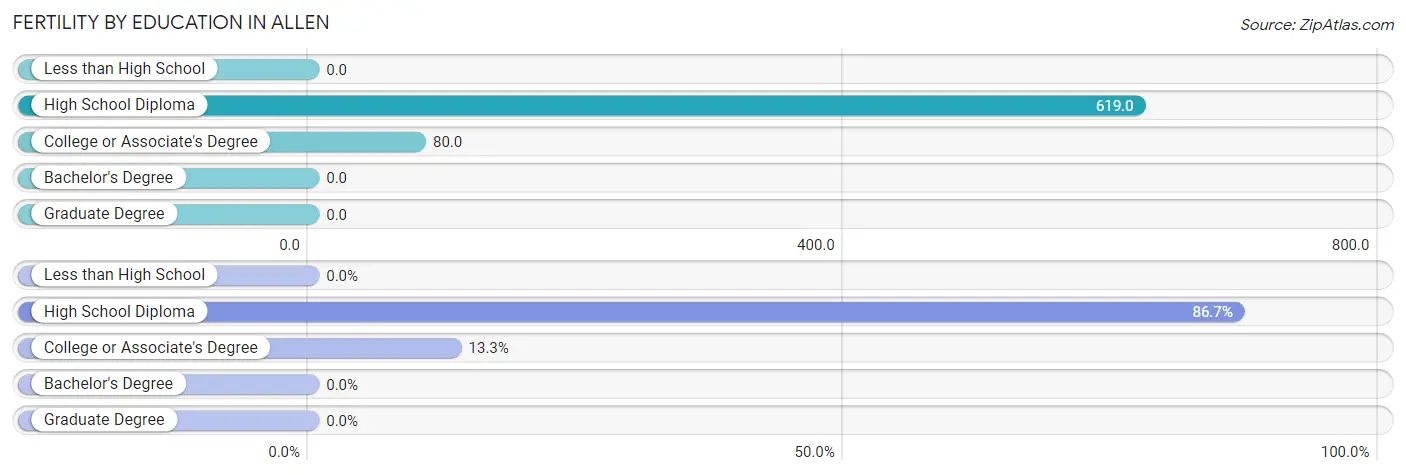
| Educational Attainment | Women with Births | Births / 1,000 Women |
| Less than High School | 0 (0.0%) | 0.0 |
| High School Diploma | 13 (86.7%) | 619.0 |
| College or Associate's Degree | 2 (13.3%) | 80.0 |
| Bachelor's Degree | 0 (0.0%) | 0.0 |
| Graduate Degree | 0 (0.0%) | 0.0 |
| Total | 15 (100.0%) | 205.0 |
Fertility by Education by Marriage Status in Allen
46.7% of women with births in Allen are unmarried. Women with the educational attainment of college or associate's degree are most likely to be married with 100.0% of them married at childbirth, while women with the educational attainment of high school diploma are least likely to be married with 53.8% of them unmarried at childbirth.
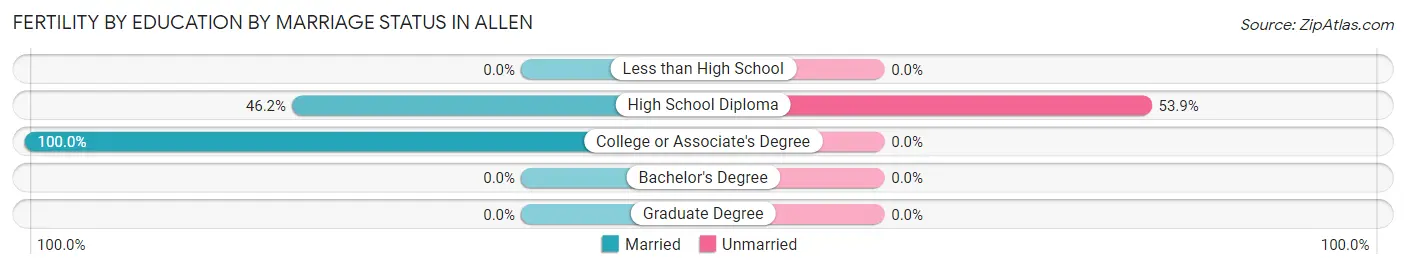
| Educational Attainment | Married | Unmarried |
| Less than High School | 0 (0.0%) | 0 (0.0%) |
| High School Diploma | 6 (46.2%) | 7 (53.8%) |
| College or Associate's Degree | 2 (100.0%) | 0 (0.0%) |
| Bachelor's Degree | 0 (0.0%) | 0 (0.0%) |
| Graduate Degree | 0 (0.0%) | 0 (0.0%) |
| Total | 8 (53.3%) | 7 (46.7%) |
Employment Characteristics in Allen
Employment by Class of Employer in Allen
Among the 47 employed individuals in Allen, private company employees (37 | 78.7%), local government employees (5 | 10.6%), and state government employees (3 | 6.4%) make up the most common classes of employment.
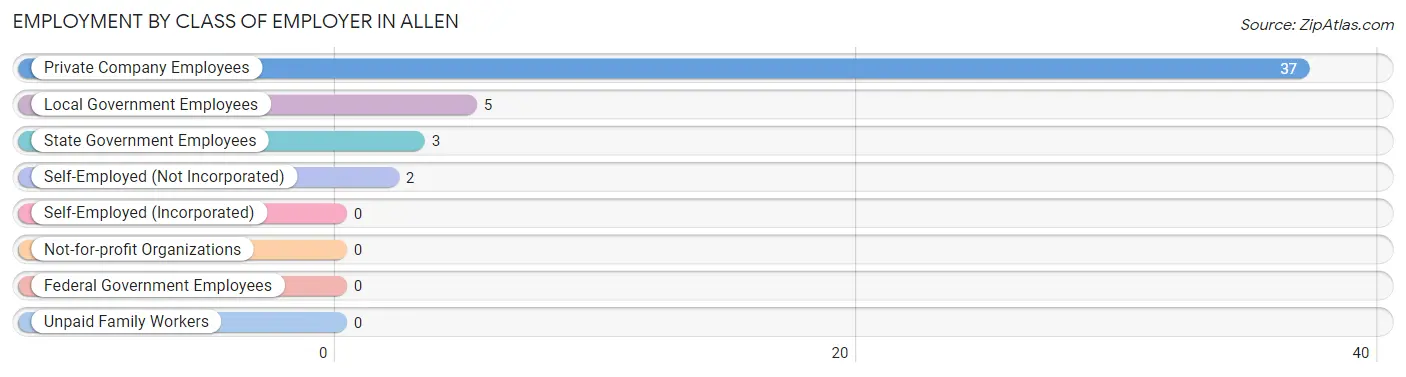
| Employer Class | # Employees | % Employees |
| Private Company Employees | 37 | 78.7% |
| Self-Employed (Incorporated) | 0 | 0.0% |
| Self-Employed (Not Incorporated) | 2 | 4.3% |
| Not-for-profit Organizations | 0 | 0.0% |
| Local Government Employees | 5 | 10.6% |
| State Government Employees | 3 | 6.4% |
| Federal Government Employees | 0 | 0.0% |
| Unpaid Family Workers | 0 | 0.0% |
| Total | 47 | 100.0% |
Employment Status by Age in Allen
According to the labor force statistics for Allen, out of the total population over 16 years of age (134), 58.2% or 78 individuals are in the labor force, with 30.8% or 24 of them unemployed. The age group with the highest labor force participation rate is 25 to 29 years, with 100.0% or 2 individuals in the labor force. Within the labor force, the 25 to 29 years age range has the highest percentage of unemployed individuals, with 100.0% or 2 of them being unemployed.
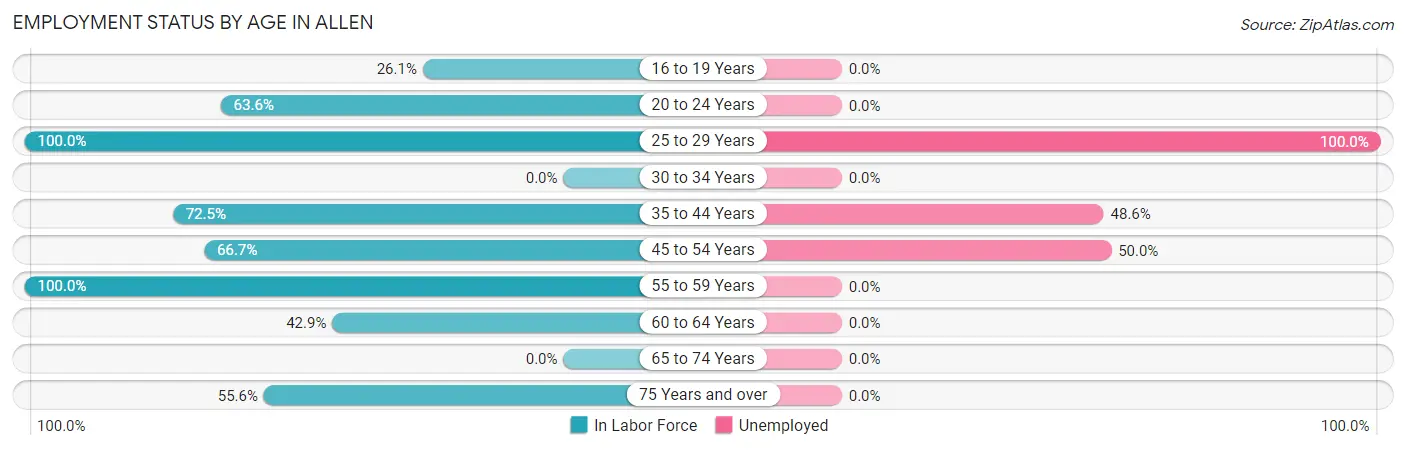
| Age Bracket | In Labor Force | Unemployed |
| 16 to 19 Years | 6 (26.1%) | 0 (0.0%) |
| 20 to 24 Years | 14 (63.6%) | 0 (0.0%) |
| 25 to 29 Years | 2 (100.0%) | 2 (100.0%) |
| 30 to 34 Years | 0 (0.0%) | 0 (0.0%) |
| 35 to 44 Years | 37 (72.5%) | 18 (48.6%) |
| 45 to 54 Years | 8 (66.7%) | 4 (50.0%) |
| 55 to 59 Years | 3 (100.0%) | 0 (0.0%) |
| 60 to 64 Years | 3 (42.9%) | 0 (0.0%) |
| 65 to 74 Years | 0 (0.0%) | 0 (0.0%) |
| 75 Years and over | 5 (55.6%) | 0 (0.0%) |
| Total | 78 (58.2%) | 24 (30.8%) |
Employment Status by Educational Attainment in Allen
According to labor force statistics for Allen, 70.7% of individuals (53) out of the total population between 25 and 64 years of age (75) are in the labor force, with 45.3% or 24 of them being unemployed. The group with the highest labor force participation rate are those with the educational attainment of college / associate degree, with 100.0% or 26 individuals in the labor force. Within the labor force, individuals with bachelor's degree or higher education have the highest percentage of unemployment, with 100.0% or 4 of them being unemployed.
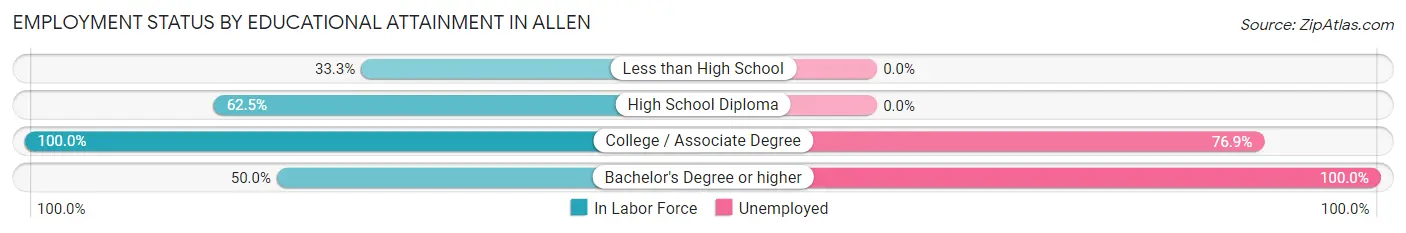
| Educational Attainment | In Labor Force | Unemployed |
| Less than High School | 3 (33.3%) | 0 (0.0%) |
| High School Diploma | 20 (62.5%) | 0 (0.0%) |
| College / Associate Degree | 26 (100.0%) | 20 (76.9%) |
| Bachelor's Degree or higher | 4 (50.0%) | 8 (100.0%) |
| Total | 53 (70.7%) | 34 (45.3%) |
Employment Occupations by Sex in Allen
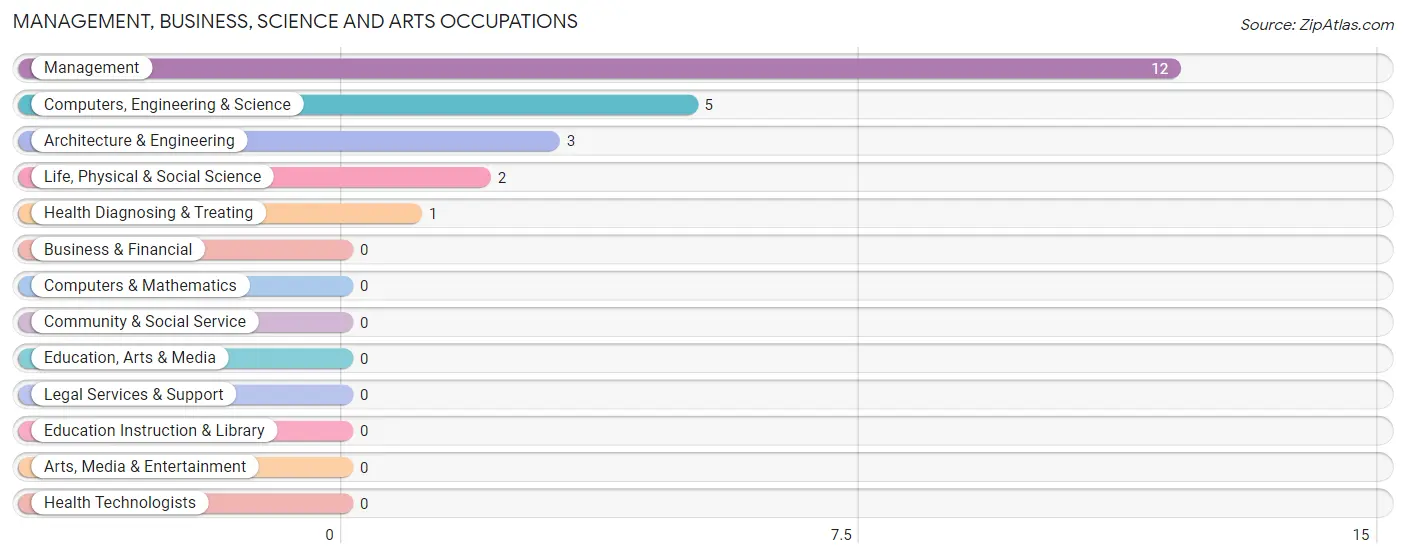
Management, Business, Science and Arts Occupations
The most common Management, Business, Science and Arts occupations in Allen are Management (12 | 22.2%), Computers, Engineering & Science (5 | 9.3%), Architecture & Engineering (3 | 5.6%), Life, Physical & Social Science (2 | 3.7%), and Health Diagnosing & Treating (1 | 1.8%).
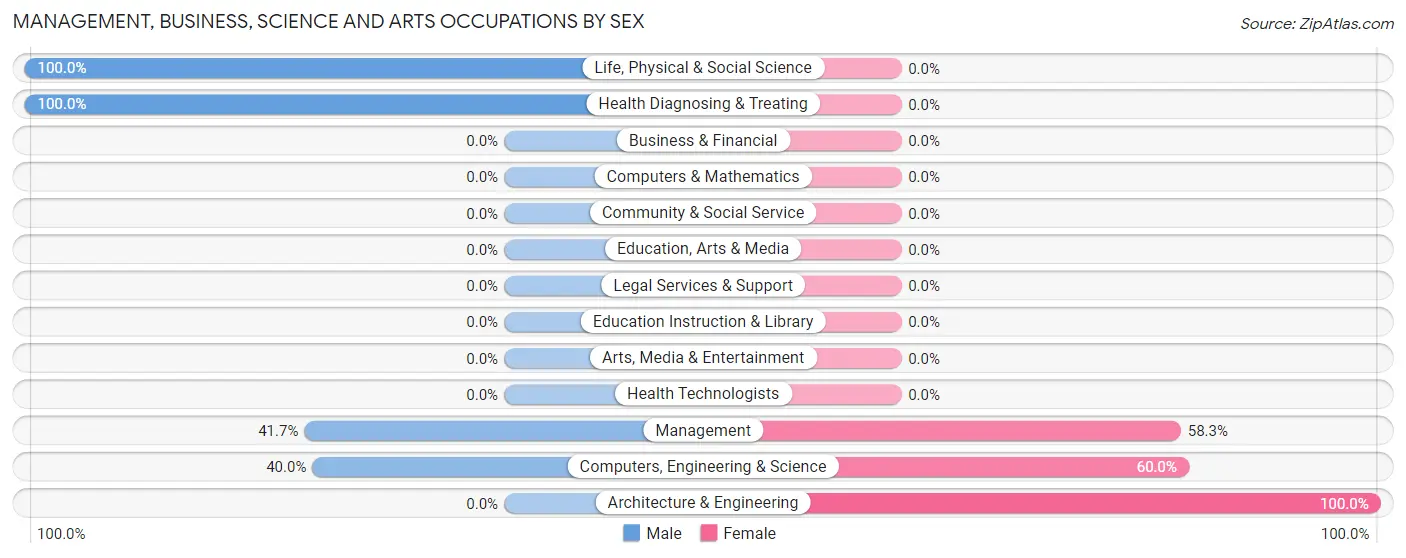
Management, Business, Science and Arts Occupations by Sex
Within the Management, Business, Science and Arts occupations in Allen, the most male-oriented occupations are Life, Physical & Social Science (100.0%), Health Diagnosing & Treating (100.0%), and Management (41.7%), while the most female-oriented occupations are Architecture & Engineering (100.0%), Computers, Engineering & Science (60.0%), and Management (58.3%).
| Occupation | Male | Female |
| Management | 5 (41.7%) | 7 (58.3%) |
| Business & Financial | 0 (0.0%) | 0 (0.0%) |
| Computers, Engineering & Science | 2 (40.0%) | 3 (60.0%) |
| Computers & Mathematics | 0 (0.0%) | 0 (0.0%) |
| Architecture & Engineering | 0 (0.0%) | 3 (100.0%) |
| Life, Physical & Social Science | 2 (100.0%) | 0 (0.0%) |
| Community & Social Service | 0 (0.0%) | 0 (0.0%) |
| Education, Arts & Media | 0 (0.0%) | 0 (0.0%) |
| Legal Services & Support | 0 (0.0%) | 0 (0.0%) |
| Education Instruction & Library | 0 (0.0%) | 0 (0.0%) |
| Arts, Media & Entertainment | 0 (0.0%) | 0 (0.0%) |
| Health Diagnosing & Treating | 1 (100.0%) | 0 (0.0%) |
| Health Technologists | 0 (0.0%) | 0 (0.0%) |
| Total (Category) | 8 (44.4%) | 10 (55.6%) |
| Total (Overall) | 30 (55.6%) | 24 (44.4%) |
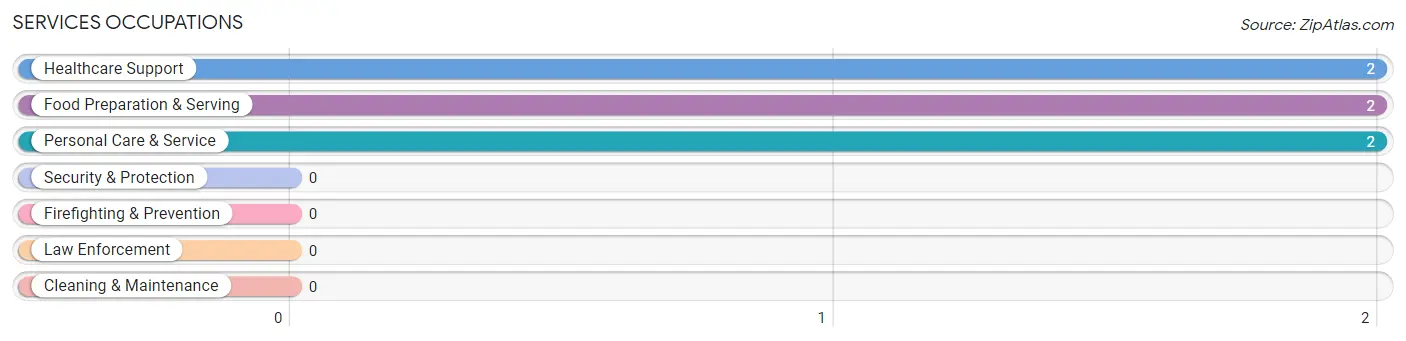
Services Occupations
The most common Services occupations in Allen are Healthcare Support (2 | 3.7%), Food Preparation & Serving (2 | 3.7%), and Personal Care & Service (2 | 3.7%).
Services Occupations by Sex
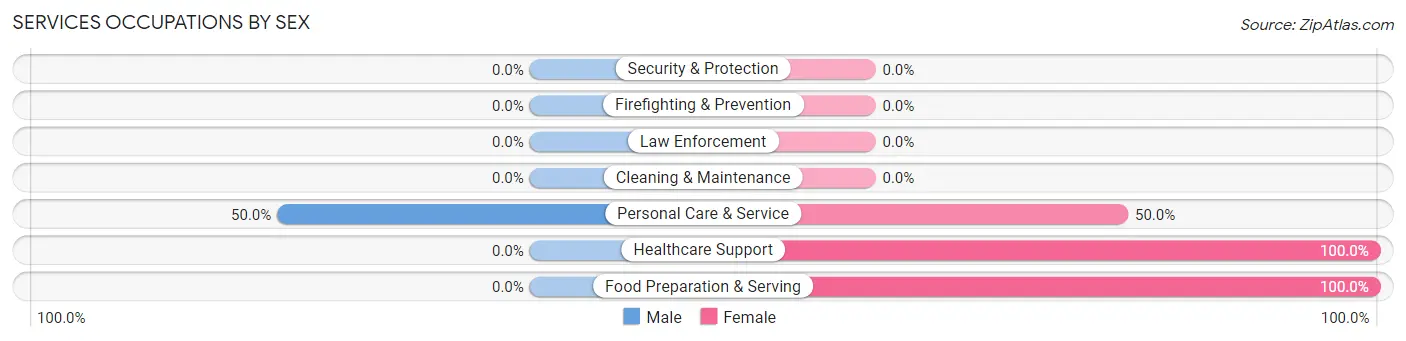
| Occupation | Male | Female |
| Healthcare Support | 0 (0.0%) | 2 (100.0%) |
| Security & Protection | 0 (0.0%) | 0 (0.0%) |
| Firefighting & Prevention | 0 (0.0%) | 0 (0.0%) |
| Law Enforcement | 0 (0.0%) | 0 (0.0%) |
| Food Preparation & Serving | 0 (0.0%) | 2 (100.0%) |
| Cleaning & Maintenance | 0 (0.0%) | 0 (0.0%) |
| Personal Care & Service | 1 (50.0%) | 1 (50.0%) |
| Total (Category) | 1 (16.7%) | 5 (83.3%) |
| Total (Overall) | 30 (55.6%) | 24 (44.4%) |
Sales and Office Occupations
The most common Sales and Office occupations in Allen are Sales & Related (6 | 11.1%), and Office & Administration (2 | 3.7%).
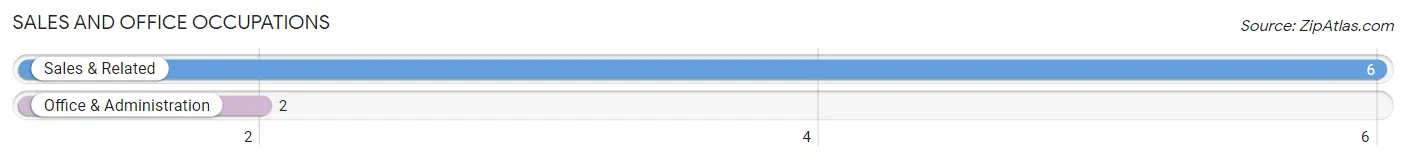
Sales and Office Occupations by Sex
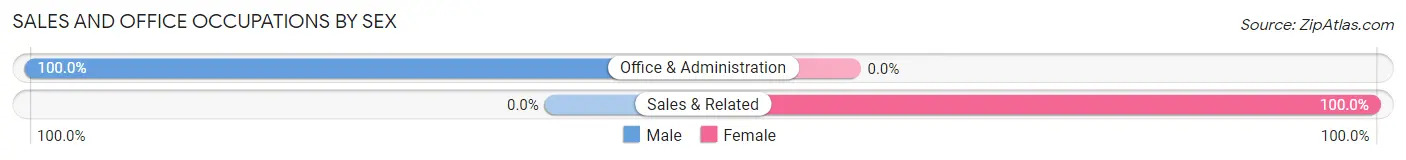
| Occupation | Male | Female |
| Sales & Related | 0 (0.0%) | 6 (100.0%) |
| Office & Administration | 2 (100.0%) | 0 (0.0%) |
| Total (Category) | 2 (25.0%) | 6 (75.0%) |
| Total (Overall) | 30 (55.6%) | 24 (44.4%) |
Natural Resources, Construction and Maintenance Occupations
The most common Natural Resources, Construction and Maintenance occupations in Allen are , and Construction & Extraction (2 | 3.7%).
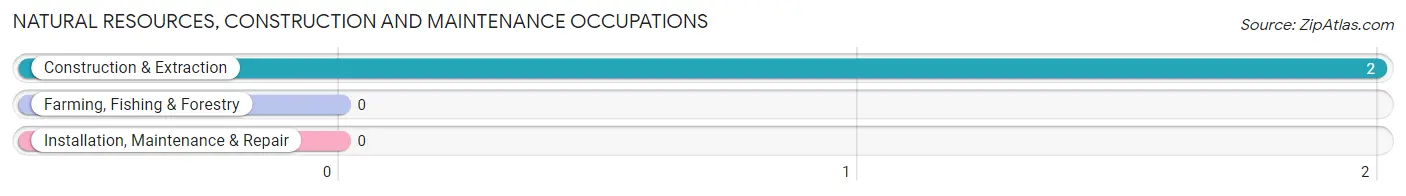
Natural Resources, Construction and Maintenance Occupations by Sex
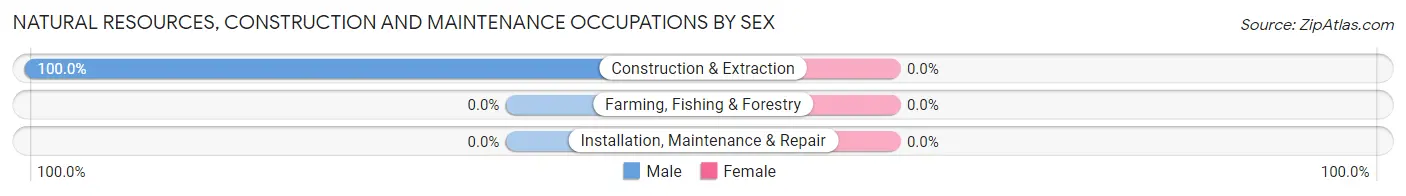
| Occupation | Male | Female |
| Farming, Fishing & Forestry | 0 (0.0%) | 0 (0.0%) |
| Construction & Extraction | 2 (100.0%) | 0 (0.0%) |
| Installation, Maintenance & Repair | 0 (0.0%) | 0 (0.0%) |
| Total (Category) | 2 (100.0%) | 0 (0.0%) |
| Total (Overall) | 30 (55.6%) | 24 (44.4%) |
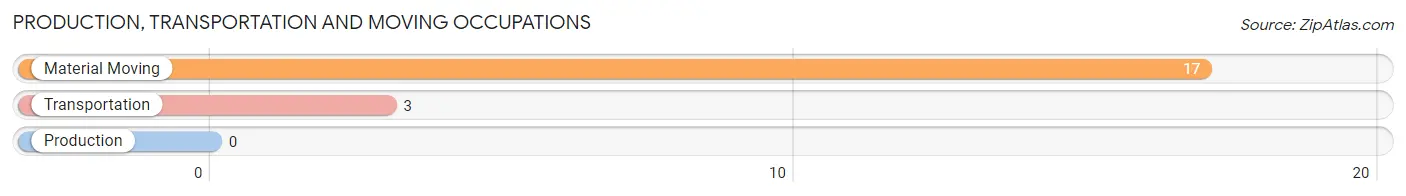
Production, Transportation and Moving Occupations
The most common Production, Transportation and Moving occupations in Allen are Material Moving (17 | 31.5%), and Transportation (3 | 5.6%).
Production, Transportation and Moving Occupations by Sex
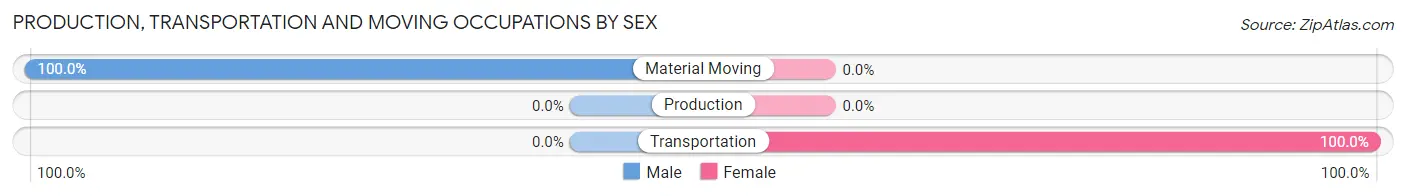
| Occupation | Male | Female |
| Production | 0 (0.0%) | 0 (0.0%) |
| Transportation | 0 (0.0%) | 3 (100.0%) |
| Material Moving | 17 (100.0%) | 0 (0.0%) |
| Total (Category) | 17 (85.0%) | 3 (15.0%) |
| Total (Overall) | 30 (55.6%) | 24 (44.4%) |
Employment Industries by Sex in Allen
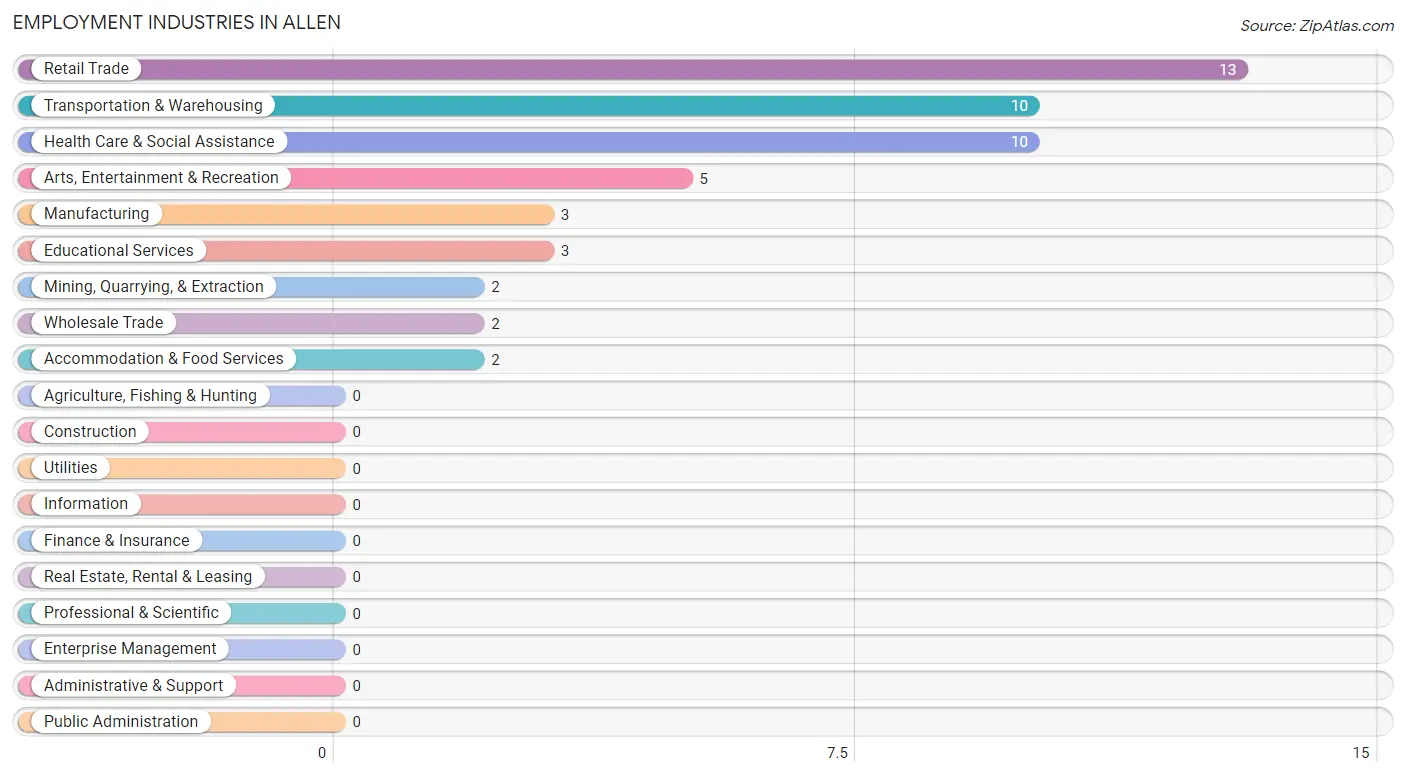
Employment Industries in Allen
The major employment industries in Allen include Retail Trade (13 | 24.1%), Transportation & Warehousing (10 | 18.5%), Health Care & Social Assistance (10 | 18.5%), Arts, Entertainment & Recreation (5 | 9.3%), and Manufacturing (3 | 5.6%).
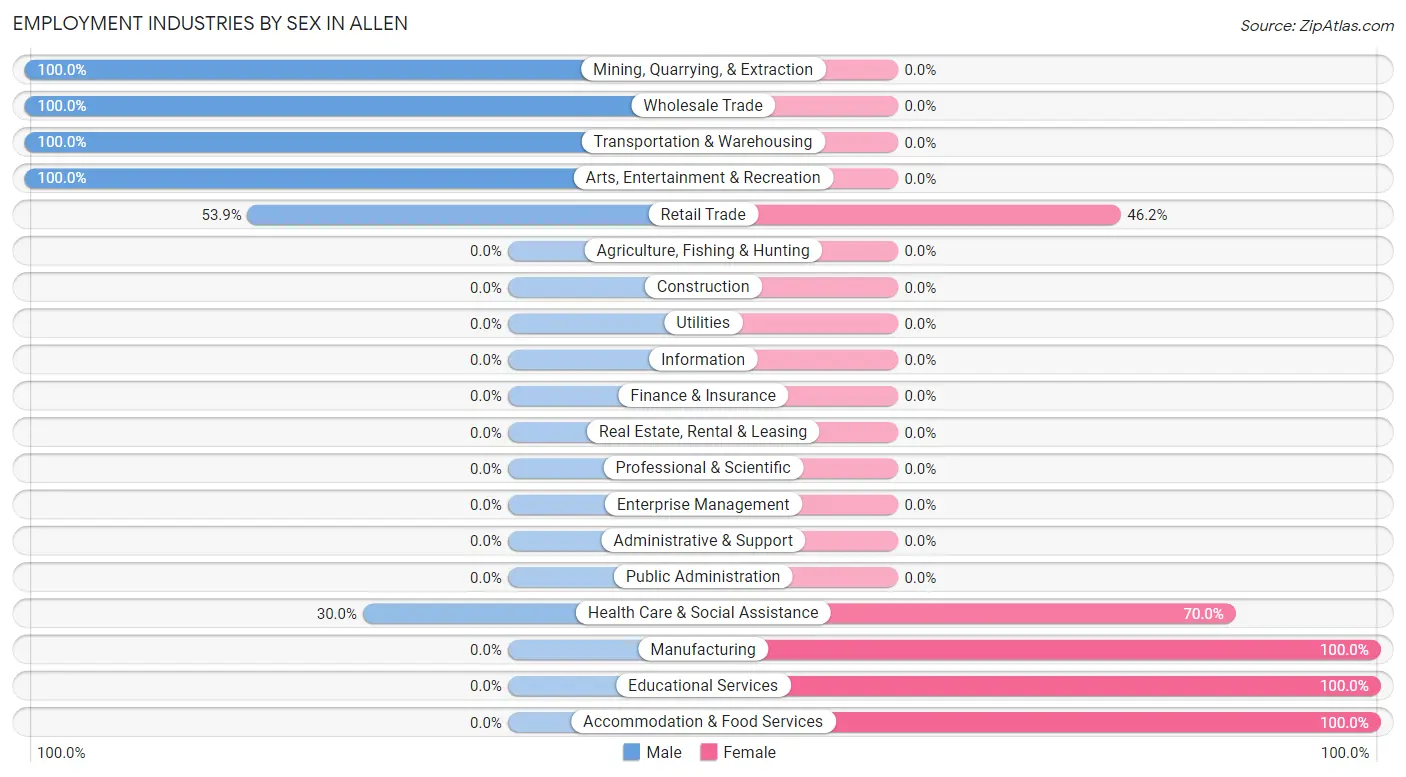
Employment Industries by Sex in Allen
The Allen industries that see more men than women are Mining, Quarrying, & Extraction (100.0%), Wholesale Trade (100.0%), and Transportation & Warehousing (100.0%), whereas the industries that tend to have a higher number of women are Manufacturing (100.0%), Educational Services (100.0%), and Accommodation & Food Services (100.0%).
| Industry | Male | Female |
| Agriculture, Fishing & Hunting | 0 (0.0%) | 0 (0.0%) |
| Mining, Quarrying, & Extraction | 2 (100.0%) | 0 (0.0%) |
| Construction | 0 (0.0%) | 0 (0.0%) |
| Manufacturing | 0 (0.0%) | 3 (100.0%) |
| Wholesale Trade | 2 (100.0%) | 0 (0.0%) |
| Retail Trade | 7 (53.8%) | 6 (46.2%) |
| Transportation & Warehousing | 10 (100.0%) | 0 (0.0%) |
| Utilities | 0 (0.0%) | 0 (0.0%) |
| Information | 0 (0.0%) | 0 (0.0%) |
| Finance & Insurance | 0 (0.0%) | 0 (0.0%) |
| Real Estate, Rental & Leasing | 0 (0.0%) | 0 (0.0%) |
| Professional & Scientific | 0 (0.0%) | 0 (0.0%) |
| Enterprise Management | 0 (0.0%) | 0 (0.0%) |
| Administrative & Support | 0 (0.0%) | 0 (0.0%) |
| Educational Services | 0 (0.0%) | 3 (100.0%) |
| Health Care & Social Assistance | 3 (30.0%) | 7 (70.0%) |
| Arts, Entertainment & Recreation | 5 (100.0%) | 0 (0.0%) |
| Accommodation & Food Services | 0 (0.0%) | 2 (100.0%) |
| Public Administration | 0 (0.0%) | 0 (0.0%) |
| Total | 30 (55.6%) | 24 (44.4%) |
Education in Allen
School Enrollment in Allen
The most common levels of schooling among the 59 students in Allen are high school (24 | 40.7%), middle school (21 | 35.6%), and elementary school (8 | 13.6%).
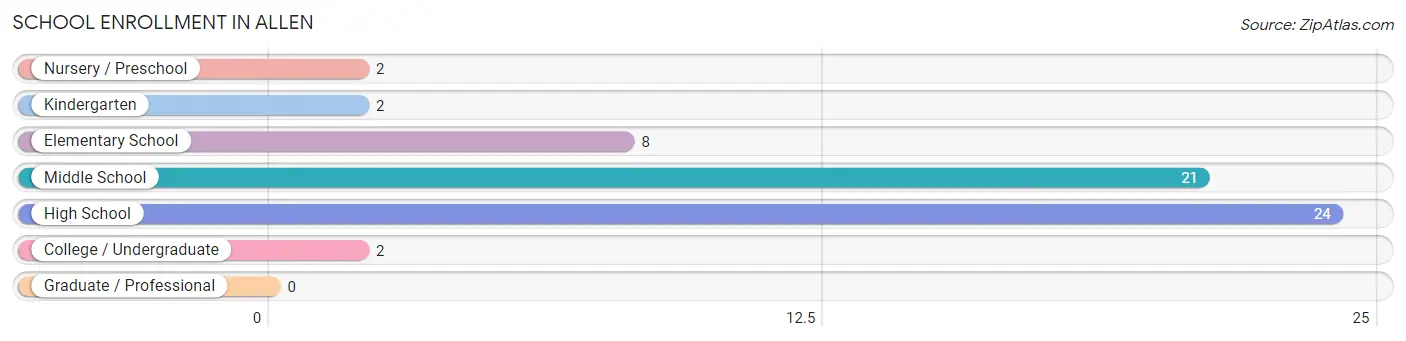
| School Level | # Students | % Students |
| Nursery / Preschool | 2 | 3.4% |
| Kindergarten | 2 | 3.4% |
| Elementary School | 8 | 13.6% |
| Middle School | 21 | 35.6% |
| High School | 24 | 40.7% |
| College / Undergraduate | 2 | 3.4% |
| Graduate / Professional | 0 | 0.0% |
| Total | 59 | 100.0% |
School Enrollment by Age by Funding Source in Allen
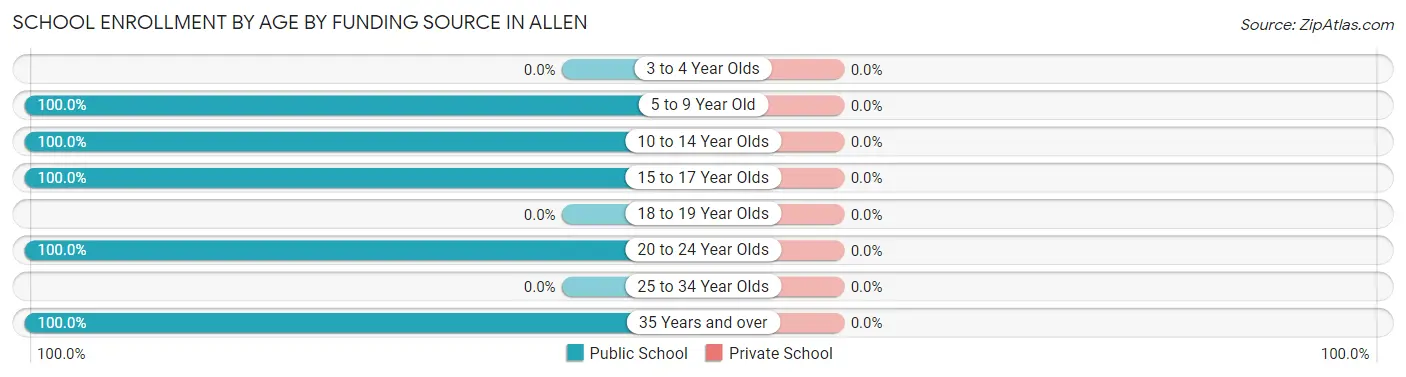
| Age Bracket | Public School | Private School |
| 3 to 4 Year Olds | 0 (0.0%) | 0 (0.0%) |
| 5 to 9 Year Old | 12 (100.0%) | 0 (0.0%) |
| 10 to 14 Year Olds | 21 (100.0%) | 0 (0.0%) |
| 15 to 17 Year Olds | 24 (100.0%) | 0 (0.0%) |
| 18 to 19 Year Olds | 0 (0.0%) | 0 (0.0%) |
| 20 to 24 Year Olds | 1 (100.0%) | 0 (0.0%) |
| 25 to 34 Year Olds | 0 (0.0%) | 0 (0.0%) |
| 35 Years and over | 1 (100.0%) | 0 (0.0%) |
| Total | 59 (100.0%) | 0 (0.0%) |
Educational Attainment by Field of Study in Allen
Business (4 | 26.7%), literature & languages (4 | 26.7%), science & technology (3 | 20.0%), arts & humanities (3 | 20.0%), and computers & mathematics (1 | 6.7%) are the most common fields of study among 15 individuals in Allen who have obtained a bachelor's degree or higher.
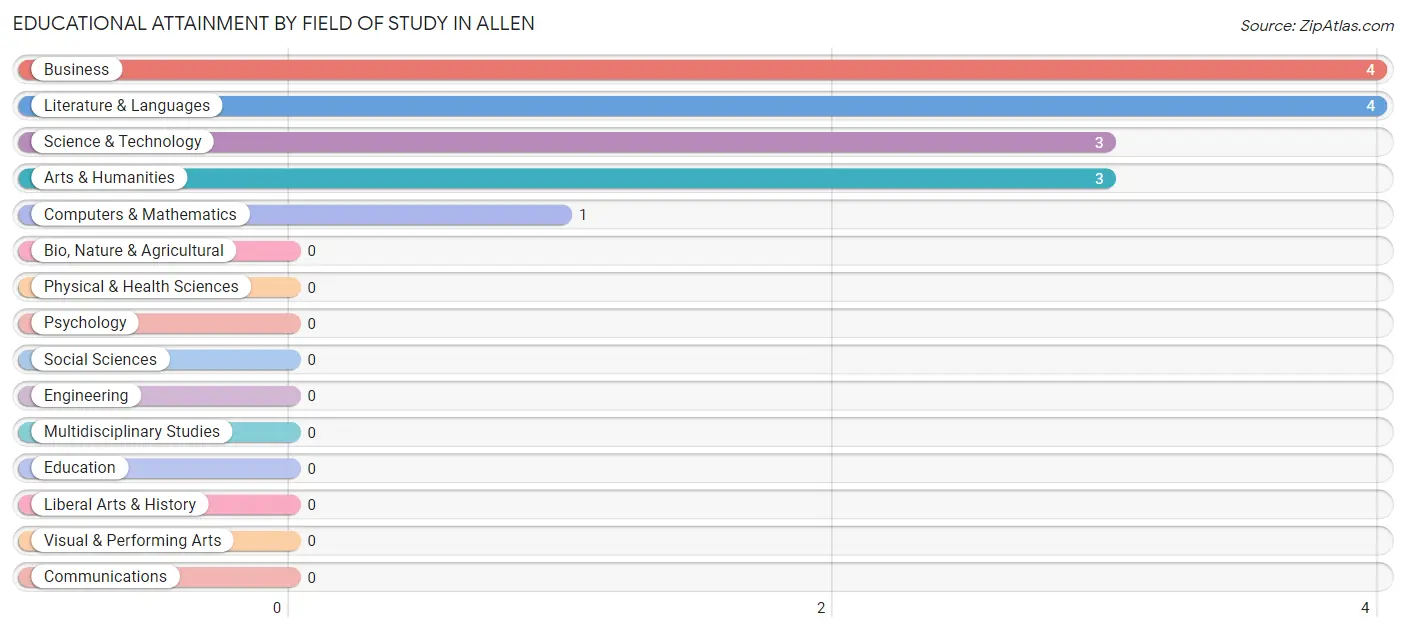
| Field of Study | # Graduates | % Graduates |
| Computers & Mathematics | 1 | 6.7% |
| Bio, Nature & Agricultural | 0 | 0.0% |
| Physical & Health Sciences | 0 | 0.0% |
| Psychology | 0 | 0.0% |
| Social Sciences | 0 | 0.0% |
| Engineering | 0 | 0.0% |
| Multidisciplinary Studies | 0 | 0.0% |
| Science & Technology | 3 | 20.0% |
| Business | 4 | 26.7% |
| Education | 0 | 0.0% |
| Literature & Languages | 4 | 26.7% |
| Liberal Arts & History | 0 | 0.0% |
| Visual & Performing Arts | 0 | 0.0% |
| Communications | 0 | 0.0% |
| Arts & Humanities | 3 | 20.0% |
| Total | 15 | 100.0% |
Transportation & Commute in Allen
Vehicle Availability by Sex in Allen
The most prevalent vehicle ownership categories in Allen are males with 3 vehicles (10, accounting for 43.5%) and females with 3 vehicles (12, making up 41.7%).
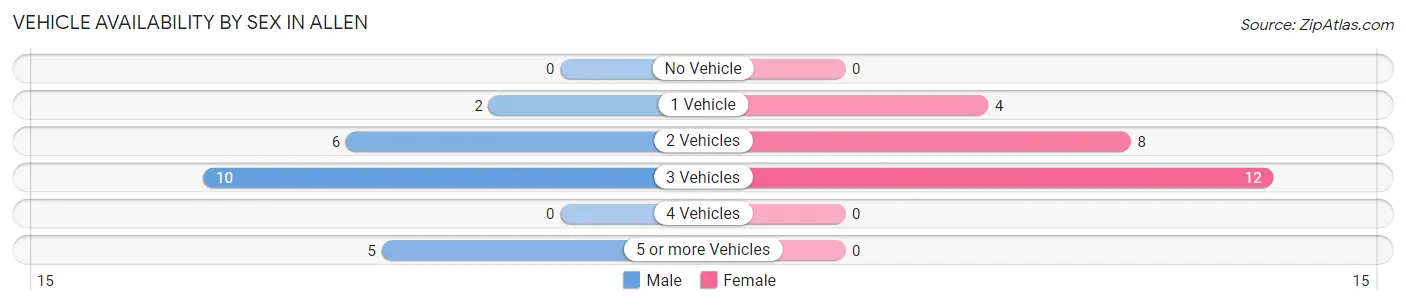
| Vehicles Available | Male | Female |
| No Vehicle | 0 (0.0%) | 0 (0.0%) |
| 1 Vehicle | 2 (8.7%) | 4 (16.7%) |
| 2 Vehicles | 6 (26.1%) | 8 (33.3%) |
| 3 Vehicles | 10 (43.5%) | 12 (50.0%) |
| 4 Vehicles | 0 (0.0%) | 0 (0.0%) |
| 5 or more Vehicles | 5 (21.7%) | 0 (0.0%) |
| Total | 23 (100.0%) | 24 (100.0%) |
Commute Time in Allen
The most frequently occuring commute durations in Allen are 25 to 29 minutes (11 commuters, 26.8%), 5 to 9 minutes (10 commuters, 24.4%), and 15 to 19 minutes (9 commuters, 22.0%).
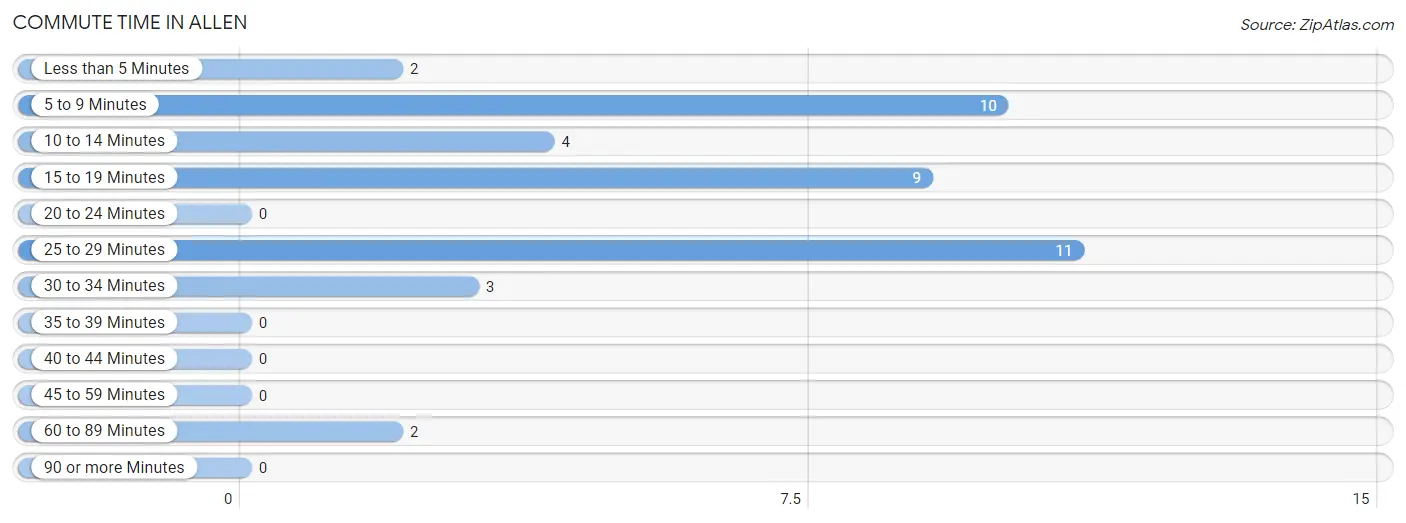
| Commute Time | # Commuters | % Commuters |
| Less than 5 Minutes | 2 | 4.9% |
| 5 to 9 Minutes | 10 | 24.4% |
| 10 to 14 Minutes | 4 | 9.8% |
| 15 to 19 Minutes | 9 | 22.0% |
| 20 to 24 Minutes | 0 | 0.0% |
| 25 to 29 Minutes | 11 | 26.8% |
| 30 to 34 Minutes | 3 | 7.3% |
| 35 to 39 Minutes | 0 | 0.0% |
| 40 to 44 Minutes | 0 | 0.0% |
| 45 to 59 Minutes | 0 | 0.0% |
| 60 to 89 Minutes | 2 | 4.9% |
| 90 or more Minutes | 0 | 0.0% |
Commute Time by Sex in Allen
The most common commute times in Allen are 25 to 29 minutes (11 commuters, 47.8%) for males and 15 to 19 minutes (9 commuters, 50.0%) for females.
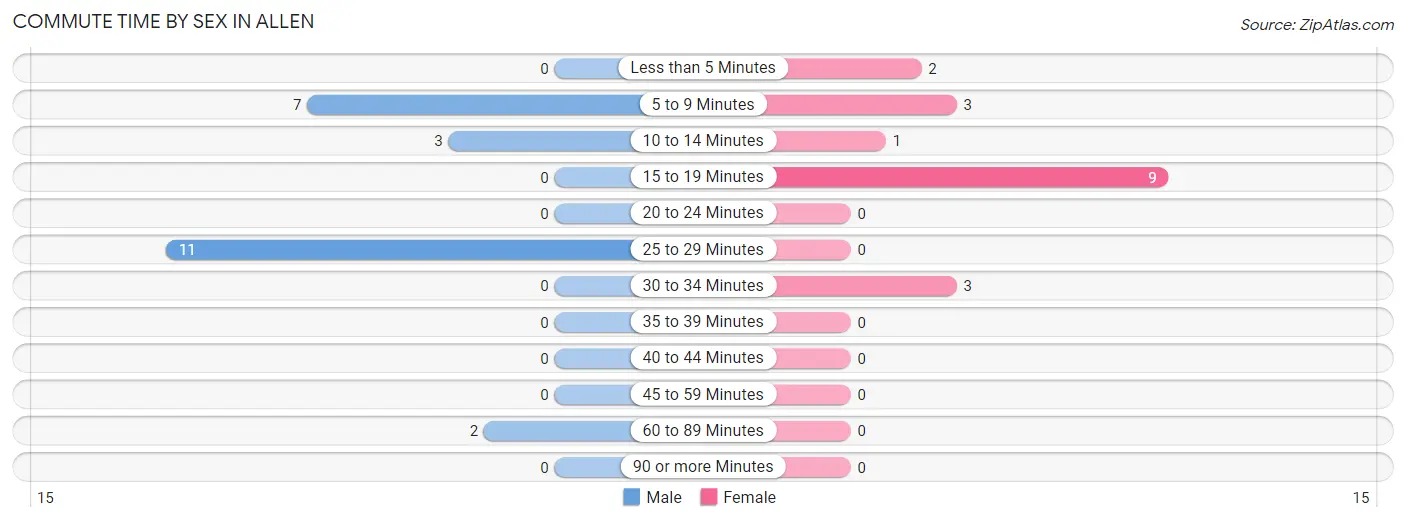
| Commute Time | Male | Female |
| Less than 5 Minutes | 0 (0.0%) | 2 (11.1%) |
| 5 to 9 Minutes | 7 (30.4%) | 3 (16.7%) |
| 10 to 14 Minutes | 3 (13.0%) | 1 (5.6%) |
| 15 to 19 Minutes | 0 (0.0%) | 9 (50.0%) |
| 20 to 24 Minutes | 0 (0.0%) | 0 (0.0%) |
| 25 to 29 Minutes | 11 (47.8%) | 0 (0.0%) |
| 30 to 34 Minutes | 0 (0.0%) | 3 (16.7%) |
| 35 to 39 Minutes | 0 (0.0%) | 0 (0.0%) |
| 40 to 44 Minutes | 0 (0.0%) | 0 (0.0%) |
| 45 to 59 Minutes | 0 (0.0%) | 0 (0.0%) |
| 60 to 89 Minutes | 2 (8.7%) | 0 (0.0%) |
| 90 or more Minutes | 0 (0.0%) | 0 (0.0%) |
Time of Departure to Work by Sex in Allen
The most frequent times of departure to work in Allen are 7:30 AM to 7:59 AM (12, 52.2%) for males and 4:00 PM to 11:59 PM (7, 38.9%) for females.
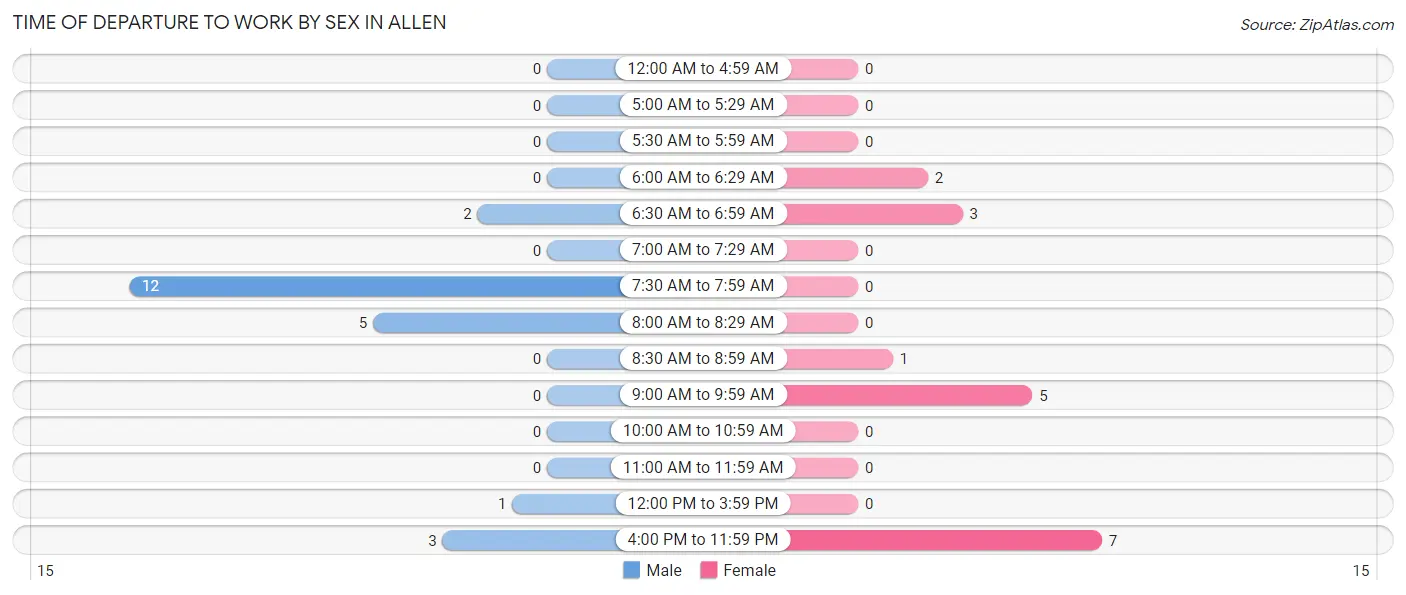
| Time of Departure | Male | Female |
| 12:00 AM to 4:59 AM | 0 (0.0%) | 0 (0.0%) |
| 5:00 AM to 5:29 AM | 0 (0.0%) | 0 (0.0%) |
| 5:30 AM to 5:59 AM | 0 (0.0%) | 0 (0.0%) |
| 6:00 AM to 6:29 AM | 0 (0.0%) | 2 (11.1%) |
| 6:30 AM to 6:59 AM | 2 (8.7%) | 3 (16.7%) |
| 7:00 AM to 7:29 AM | 0 (0.0%) | 0 (0.0%) |
| 7:30 AM to 7:59 AM | 12 (52.2%) | 0 (0.0%) |
| 8:00 AM to 8:29 AM | 5 (21.7%) | 0 (0.0%) |
| 8:30 AM to 8:59 AM | 0 (0.0%) | 1 (5.6%) |
| 9:00 AM to 9:59 AM | 0 (0.0%) | 5 (27.8%) |
| 10:00 AM to 10:59 AM | 0 (0.0%) | 0 (0.0%) |
| 11:00 AM to 11:59 AM | 0 (0.0%) | 0 (0.0%) |
| 12:00 PM to 3:59 PM | 1 (4.3%) | 0 (0.0%) |
| 4:00 PM to 11:59 PM | 3 (13.0%) | 7 (38.9%) |
| Total | 23 (100.0%) | 18 (100.0%) |
Housing Occupancy in Allen
Occupancy by Ownership in Allen
Of the total 80 dwellings in Allen, owner-occupied units account for 51 (63.7%), while renter-occupied units make up 29 (36.2%).
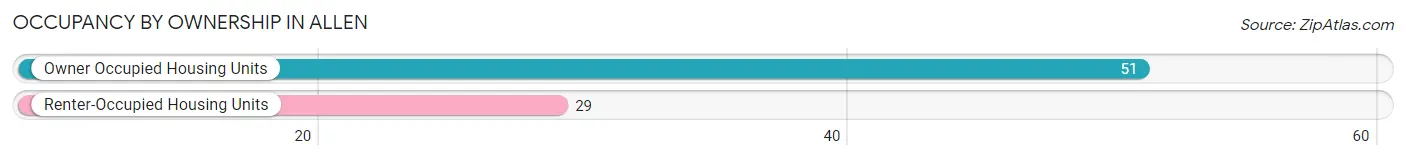
| Occupancy | # Housing Units | % Housing Units |
| Owner Occupied Housing Units | 51 | 63.7% |
| Renter-Occupied Housing Units | 29 | 36.2% |
| Total Occupied Housing Units | 80 | 100.0% |
Occupancy by Household Size in Allen
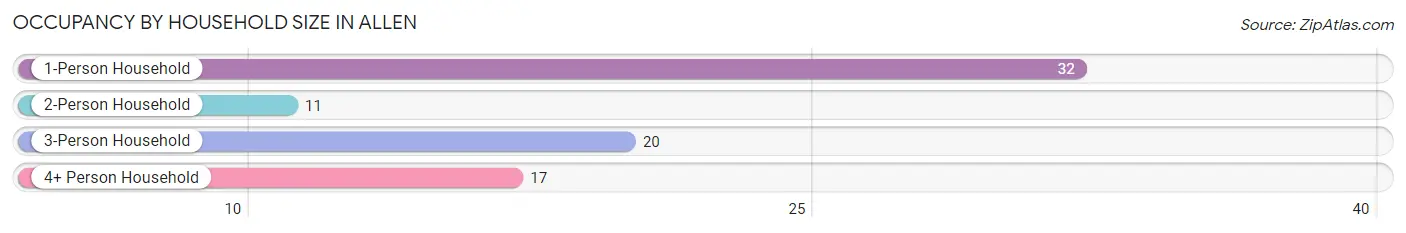
| Household Size | # Housing Units | % Housing Units |
| 1-Person Household | 32 | 40.0% |
| 2-Person Household | 11 | 13.8% |
| 3-Person Household | 20 | 25.0% |
| 4+ Person Household | 17 | 21.2% |
| Total Housing Units | 80 | 100.0% |
Occupancy by Ownership by Household Size in Allen
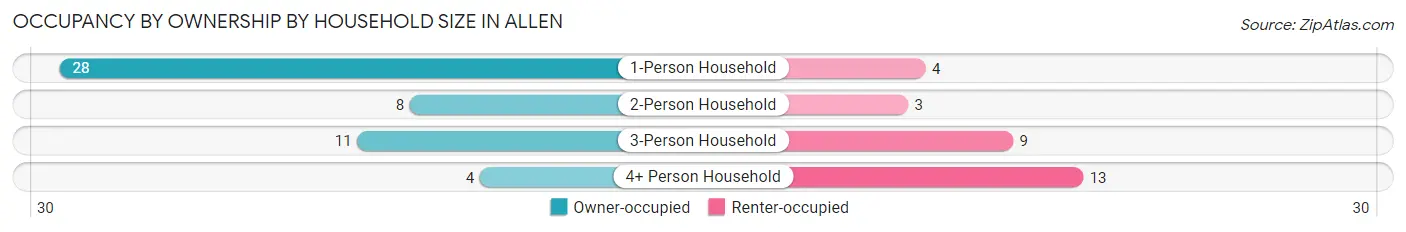
| Household Size | Owner-occupied | Renter-occupied |
| 1-Person Household | 28 (87.5%) | 4 (12.5%) |
| 2-Person Household | 8 (72.7%) | 3 (27.3%) |
| 3-Person Household | 11 (55.0%) | 9 (45.0%) |
| 4+ Person Household | 4 (23.5%) | 13 (76.5%) |
| Total Housing Units | 51 (63.7%) | 29 (36.2%) |
Occupancy by Educational Attainment in Allen
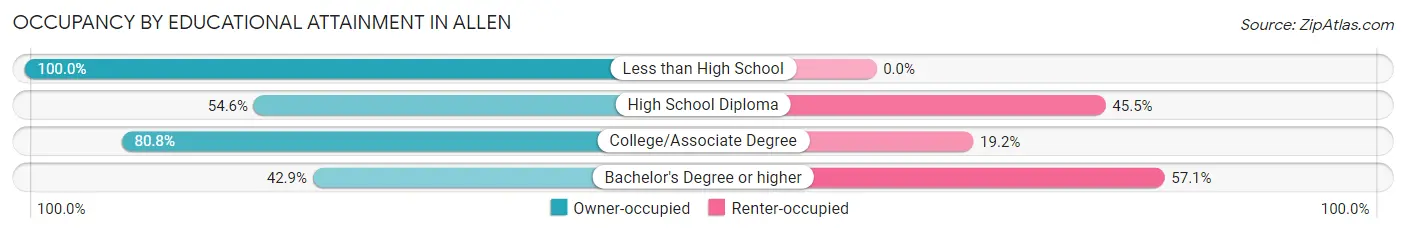
| Household Size | Owner-occupied | Renter-occupied |
| Less than High School | 3 (100.0%) | 0 (0.0%) |
| High School Diploma | 24 (54.5%) | 20 (45.5%) |
| College/Associate Degree | 21 (80.8%) | 5 (19.2%) |
| Bachelor's Degree or higher | 3 (42.9%) | 4 (57.1%) |
Occupancy by Age of Householder in Allen
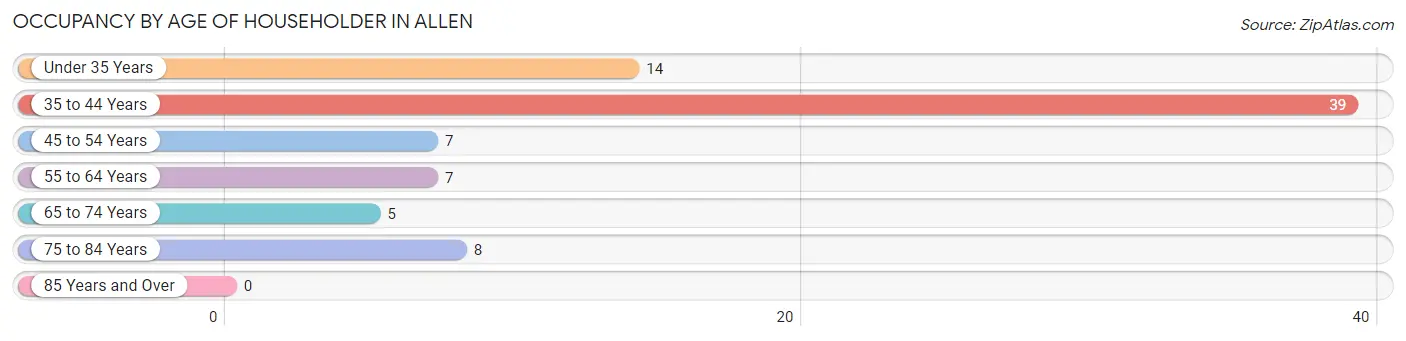
| Age Bracket | # Households | % Households |
| Under 35 Years | 14 | 17.5% |
| 35 to 44 Years | 39 | 48.7% |
| 45 to 54 Years | 7 | 8.7% |
| 55 to 64 Years | 7 | 8.7% |
| 65 to 74 Years | 5 | 6.2% |
| 75 to 84 Years | 8 | 10.0% |
| 85 Years and Over | 0 | 0.0% |
| Total | 80 | 100.0% |
Housing Finances in Allen
Median Income by Occupancy in Allen
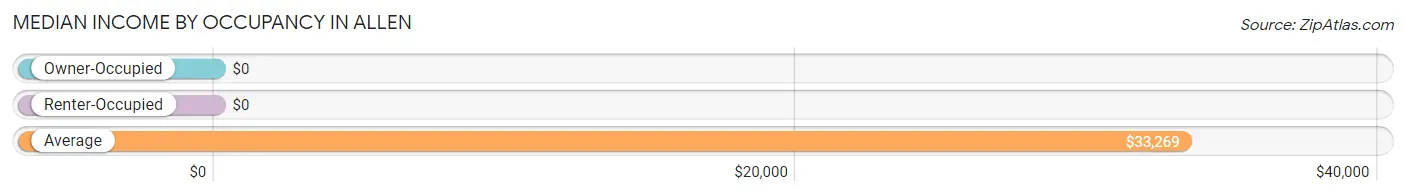
| Occupancy Type | # Households | Median Income |
| Owner-Occupied | 51 (63.7%) | $0 |
| Renter-Occupied | 29 (36.2%) | $0 |
| Average | 80 (100.0%) | $33,269 |
Occupancy by Householder Income Bracket in Allen
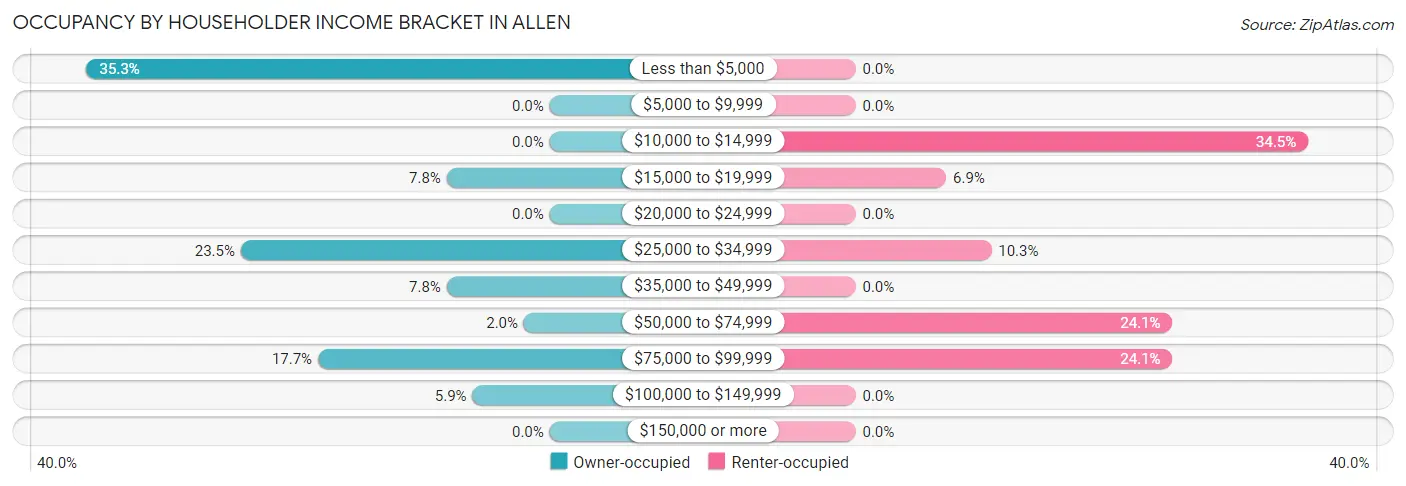
| Income Bracket | Owner-occupied | Renter-occupied |
| Less than $5,000 | 18 (35.3%) | 0 (0.0%) |
| $5,000 to $9,999 | 0 (0.0%) | 0 (0.0%) |
| $10,000 to $14,999 | 0 (0.0%) | 10 (34.5%) |
| $15,000 to $19,999 | 4 (7.8%) | 2 (6.9%) |
| $20,000 to $24,999 | 0 (0.0%) | 0 (0.0%) |
| $25,000 to $34,999 | 12 (23.5%) | 3 (10.3%) |
| $35,000 to $49,999 | 4 (7.8%) | 0 (0.0%) |
| $50,000 to $74,999 | 1 (2.0%) | 7 (24.1%) |
| $75,000 to $99,999 | 9 (17.6%) | 7 (24.1%) |
| $100,000 to $149,999 | 3 (5.9%) | 0 (0.0%) |
| $150,000 or more | 0 (0.0%) | 0 (0.0%) |
| Total | 51 (100.0%) | 29 (100.0%) |
Monthly Housing Cost Tiers in Allen
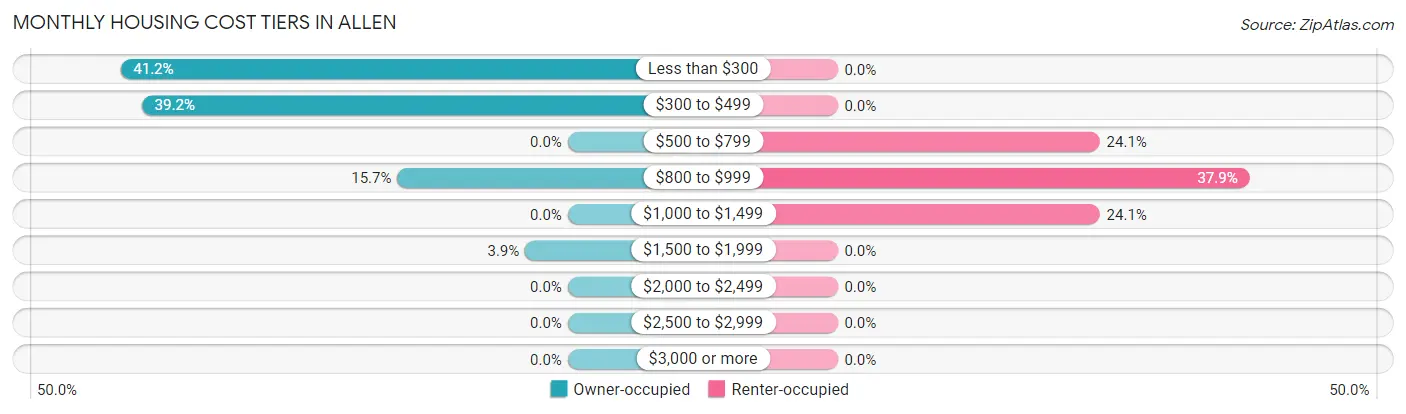
| Monthly Cost | Owner-occupied | Renter-occupied |
| Less than $300 | 21 (41.2%) | 0 (0.0%) |
| $300 to $499 | 20 (39.2%) | 0 (0.0%) |
| $500 to $799 | 0 (0.0%) | 7 (24.1%) |
| $800 to $999 | 8 (15.7%) | 11 (37.9%) |
| $1,000 to $1,499 | 0 (0.0%) | 7 (24.1%) |
| $1,500 to $1,999 | 2 (3.9%) | 0 (0.0%) |
| $2,000 to $2,499 | 0 (0.0%) | 0 (0.0%) |
| $2,500 to $2,999 | 0 (0.0%) | 0 (0.0%) |
| $3,000 or more | 0 (0.0%) | 0 (0.0%) |
| Total | 51 (100.0%) | 29 (100.0%) |
Physical Housing Characteristics in Allen
Housing Structures in Allen
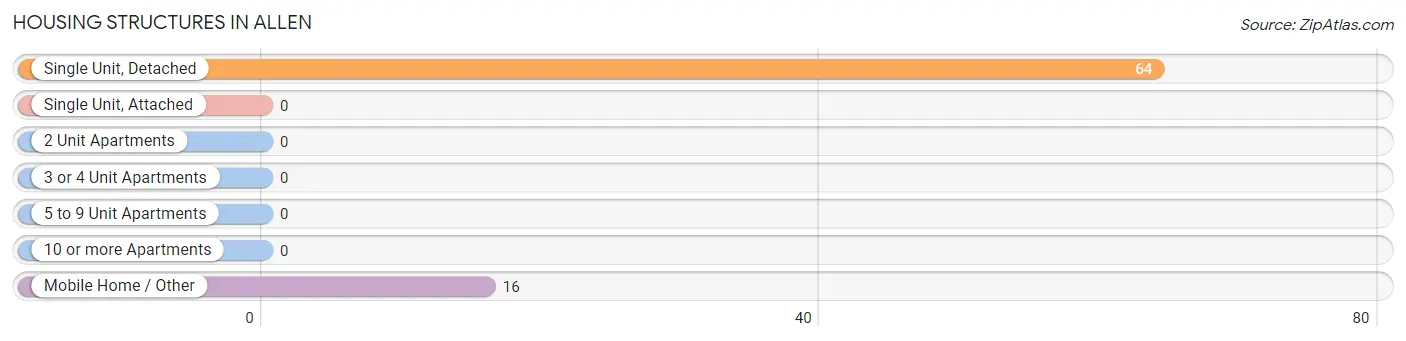
| Structure Type | # Housing Units | % Housing Units |
| Single Unit, Detached | 64 | 80.0% |
| Single Unit, Attached | 0 | 0.0% |
| 2 Unit Apartments | 0 | 0.0% |
| 3 or 4 Unit Apartments | 0 | 0.0% |
| 5 to 9 Unit Apartments | 0 | 0.0% |
| 10 or more Apartments | 0 | 0.0% |
| Mobile Home / Other | 16 | 20.0% |
| Total | 80 | 100.0% |
Housing Structures by Occupancy in Allen
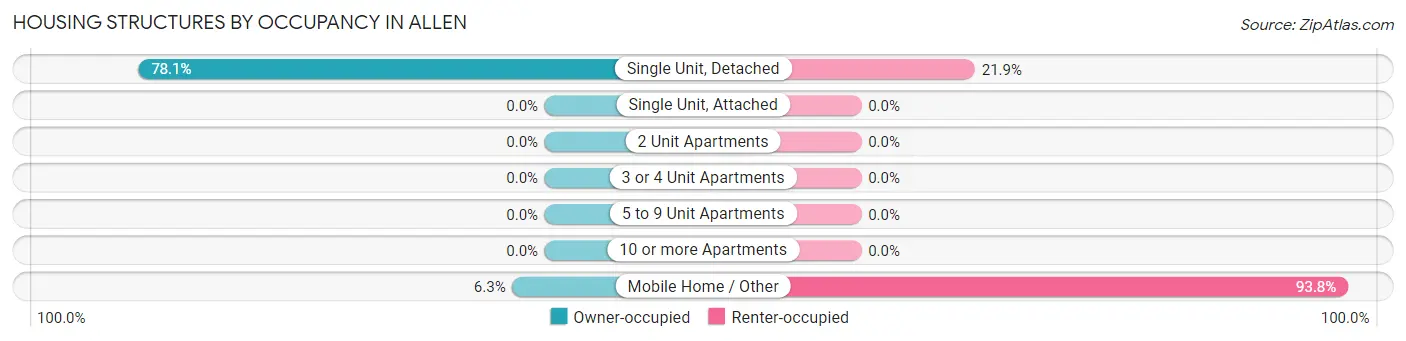
| Structure Type | Owner-occupied | Renter-occupied |
| Single Unit, Detached | 50 (78.1%) | 14 (21.9%) |
| Single Unit, Attached | 0 (0.0%) | 0 (0.0%) |
| 2 Unit Apartments | 0 (0.0%) | 0 (0.0%) |
| 3 or 4 Unit Apartments | 0 (0.0%) | 0 (0.0%) |
| 5 to 9 Unit Apartments | 0 (0.0%) | 0 (0.0%) |
| 10 or more Apartments | 0 (0.0%) | 0 (0.0%) |
| Mobile Home / Other | 1 (6.2%) | 15 (93.8%) |
| Total | 51 (63.7%) | 29 (36.2%) |
Housing Structures by Number of Rooms in Allen
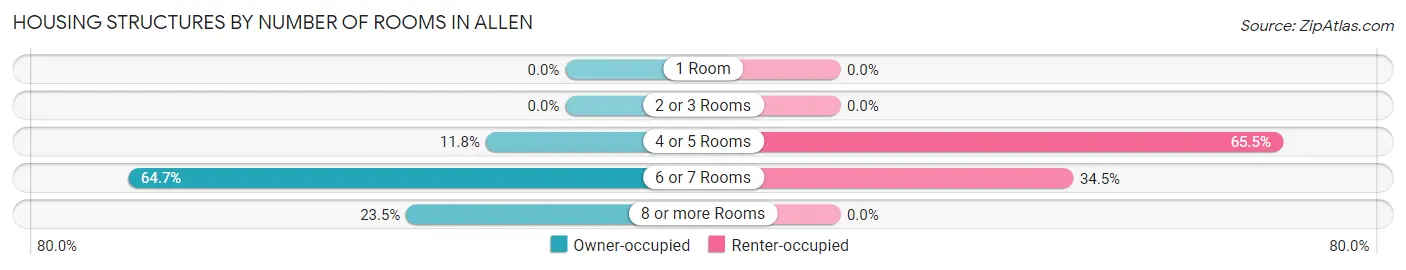
| Number of Rooms | Owner-occupied | Renter-occupied |
| 1 Room | 0 (0.0%) | 0 (0.0%) |
| 2 or 3 Rooms | 0 (0.0%) | 0 (0.0%) |
| 4 or 5 Rooms | 6 (11.8%) | 19 (65.5%) |
| 6 or 7 Rooms | 33 (64.7%) | 10 (34.5%) |
| 8 or more Rooms | 12 (23.5%) | 0 (0.0%) |
| Total | 51 (100.0%) | 29 (100.0%) |
Housing Structure by Heating Type in Allen
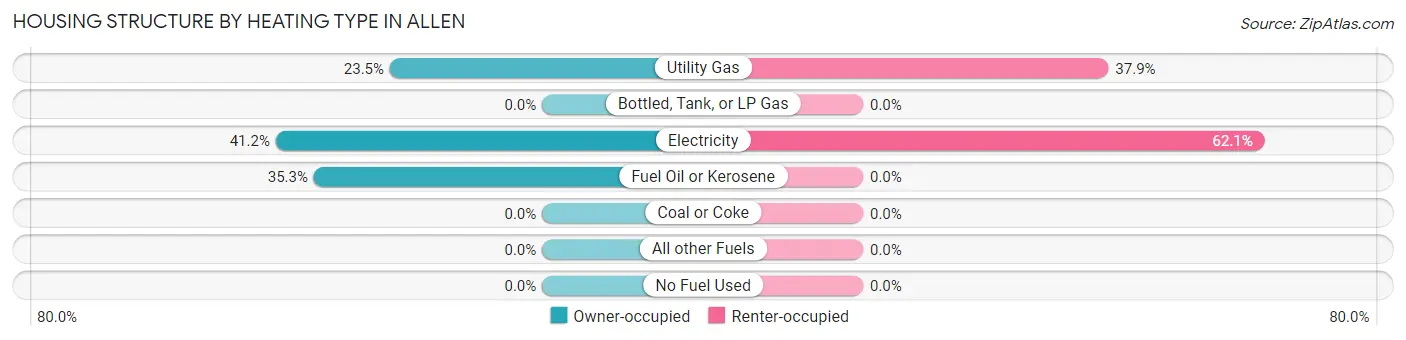
| Heating Type | Owner-occupied | Renter-occupied |
| Utility Gas | 12 (23.5%) | 11 (37.9%) |
| Bottled, Tank, or LP Gas | 0 (0.0%) | 0 (0.0%) |
| Electricity | 21 (41.2%) | 18 (62.1%) |
| Fuel Oil or Kerosene | 18 (35.3%) | 0 (0.0%) |
| Coal or Coke | 0 (0.0%) | 0 (0.0%) |
| All other Fuels | 0 (0.0%) | 0 (0.0%) |
| No Fuel Used | 0 (0.0%) | 0 (0.0%) |
| Total | 51 (100.0%) | 29 (100.0%) |
Household Vehicle Usage in Allen
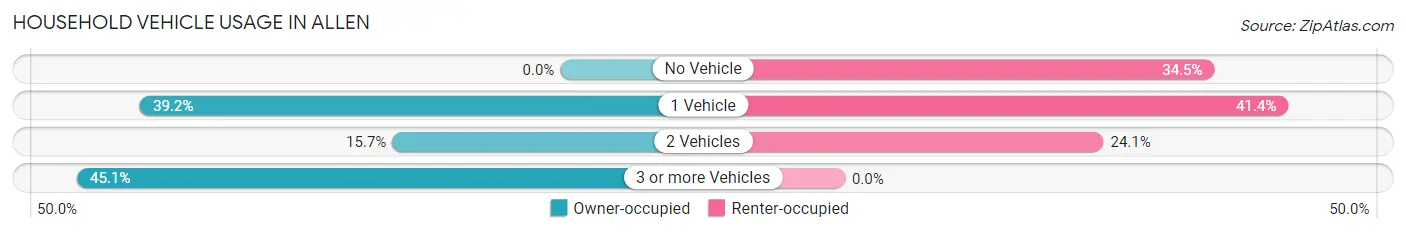
| Vehicles per Household | Owner-occupied | Renter-occupied |
| No Vehicle | 0 (0.0%) | 10 (34.5%) |
| 1 Vehicle | 20 (39.2%) | 12 (41.4%) |
| 2 Vehicles | 8 (15.7%) | 7 (24.1%) |
| 3 or more Vehicles | 23 (45.1%) | 0 (0.0%) |
| Total | 51 (100.0%) | 29 (100.0%) |
Real Estate & Mortgages in Allen
Real Estate and Mortgage Overview in Allen
| Characteristic | Without Mortgage | With Mortgage |
| Housing Units | 47 | 4 |
| Median Property Value | - | - |
| Median Household Income | - | - |
| Monthly Housing Costs | $392 | $0 |
| Real Estate Taxes | - | - |
Property Value by Mortgage Status in Allen
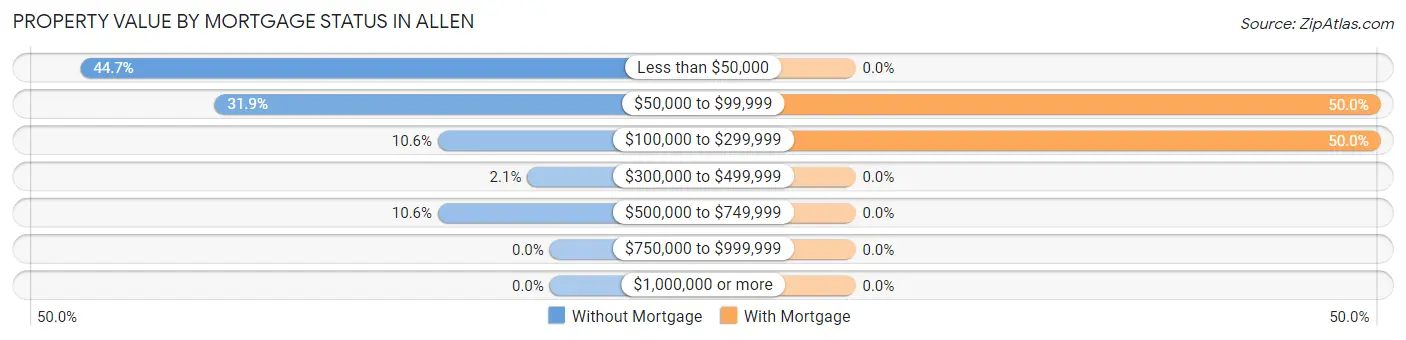
| Property Value | Without Mortgage | With Mortgage |
| Less than $50,000 | 21 (44.7%) | 0 (0.0%) |
| $50,000 to $99,999 | 15 (31.9%) | 2 (50.0%) |
| $100,000 to $299,999 | 5 (10.6%) | 2 (50.0%) |
| $300,000 to $499,999 | 1 (2.1%) | 0 (0.0%) |
| $500,000 to $749,999 | 5 (10.6%) | 0 (0.0%) |
| $750,000 to $999,999 | 0 (0.0%) | 0 (0.0%) |
| $1,000,000 or more | 0 (0.0%) | 0 (0.0%) |
| Total | 47 (100.0%) | 4 (100.0%) |
Household Income by Mortgage Status in Allen
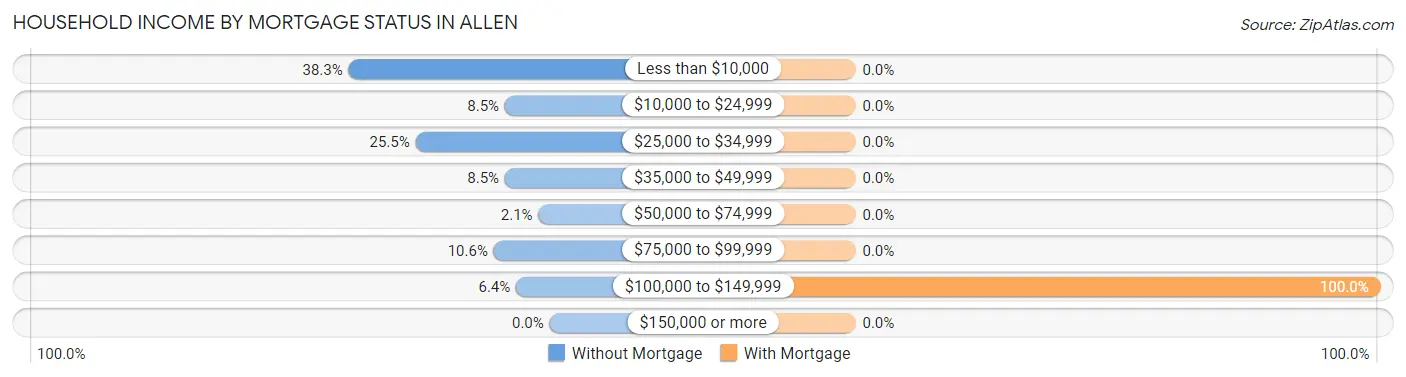
| Household Income | Without Mortgage | With Mortgage |
| Less than $10,000 | 18 (38.3%) | 0 (0.0%) |
| $10,000 to $24,999 | 4 (8.5%) | 0 (0.0%) |
| $25,000 to $34,999 | 12 (25.5%) | 0 (0.0%) |
| $35,000 to $49,999 | 4 (8.5%) | 0 (0.0%) |
| $50,000 to $74,999 | 1 (2.1%) | 0 (0.0%) |
| $75,000 to $99,999 | 5 (10.6%) | 0 (0.0%) |
| $100,000 to $149,999 | 3 (6.4%) | 4 (100.0%) |
| $150,000 or more | 0 (0.0%) | 0 (0.0%) |
| Total | 47 (100.0%) | 4 (100.0%) |
Property Value to Household Income Ratio in Allen
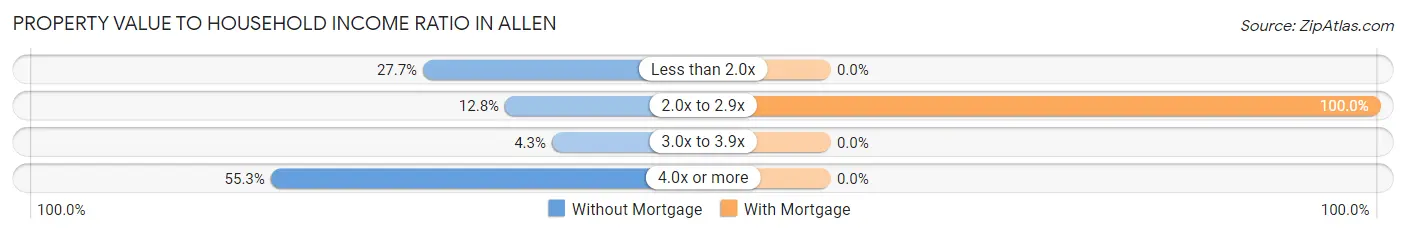
| Value-to-Income Ratio | Without Mortgage | With Mortgage |
| Less than 2.0x | 13 (27.7%) | 0 (0.0%) |
| 2.0x to 2.9x | 6 (12.8%) | 4 (100.0%) |
| 3.0x to 3.9x | 2 (4.3%) | 0 (0.0%) |
| 4.0x or more | 26 (55.3%) | 0 (0.0%) |
| Total | 47 (100.0%) | 4 (100.0%) |
Real Estate Taxes by Mortgage Status in Allen
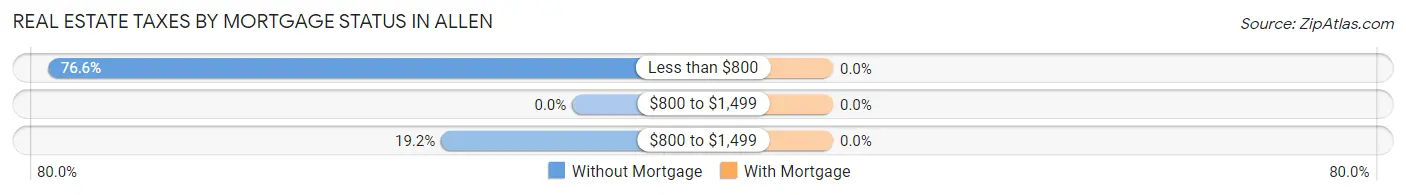
| Property Taxes | Without Mortgage | With Mortgage |
| Less than $800 | 36 (76.6%) | 0 (0.0%) |
| $800 to $1,499 | 0 (0.0%) | 0 (0.0%) |
| $800 to $1,499 | 9 (19.2%) | 0 (0.0%) |
| Total | 47 (100.0%) | 4 (100.0%) |
Health & Disability in Allen
Health Insurance Coverage by Age in Allen
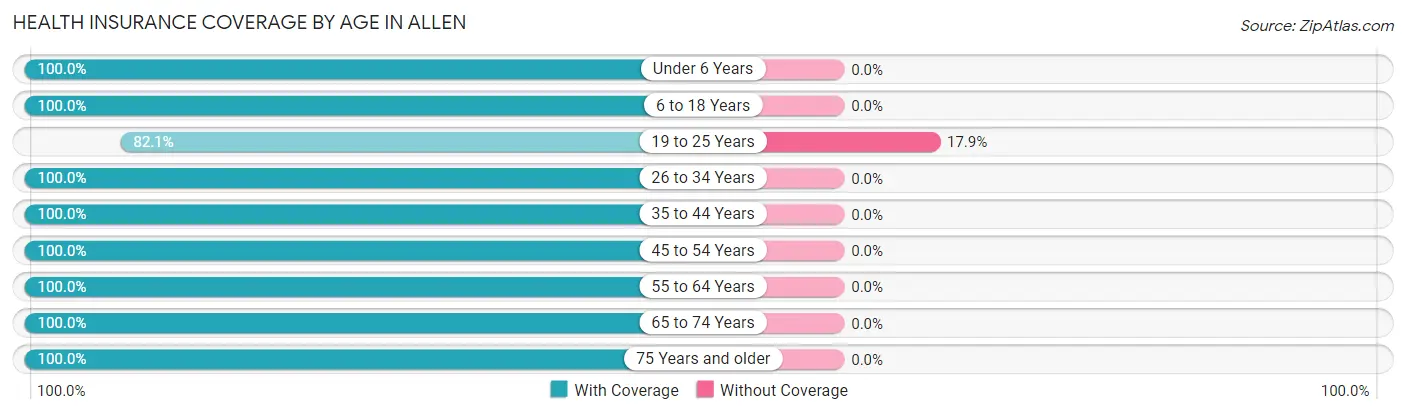
| Age Bracket | With Coverage | Without Coverage |
| Under 6 Years | 41 (100.0%) | 0 (0.0%) |
| 6 to 18 Years | 55 (100.0%) | 0 (0.0%) |
| 19 to 25 Years | 23 (82.1%) | 5 (17.9%) |
| 26 to 34 Years | 2 (100.0%) | 0 (0.0%) |
| 35 to 44 Years | 51 (100.0%) | 0 (0.0%) |
| 45 to 54 Years | 12 (100.0%) | 0 (0.0%) |
| 55 to 64 Years | 10 (100.0%) | 0 (0.0%) |
| 65 to 74 Years | 5 (100.0%) | 0 (0.0%) |
| 75 Years and older | 9 (100.0%) | 0 (0.0%) |
| Total | 208 (97.7%) | 5 (2.4%) |
Health Insurance Coverage by Citizenship Status in Allen
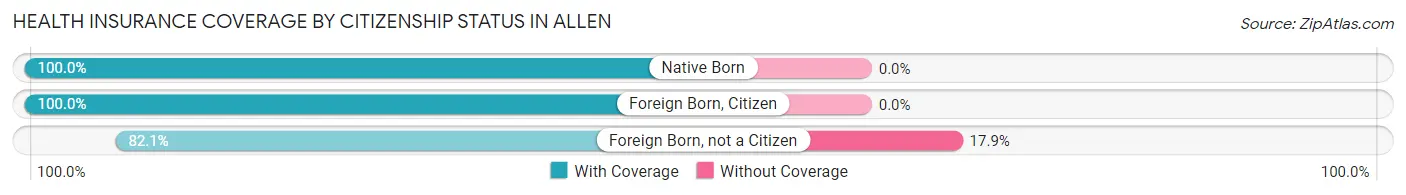
| Citizenship Status | With Coverage | Without Coverage |
| Native Born | 41 (100.0%) | 0 (0.0%) |
| Foreign Born, Citizen | 55 (100.0%) | 0 (0.0%) |
| Foreign Born, not a Citizen | 23 (82.1%) | 5 (17.9%) |
Health Insurance Coverage by Household Income in Allen
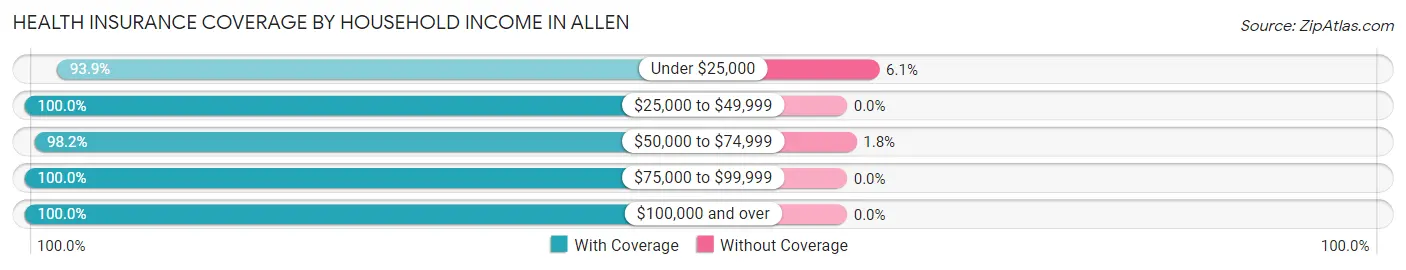
| Household Income | With Coverage | Without Coverage |
| Under $25,000 | 62 (93.9%) | 4 (6.1%) |
| $25,000 to $49,999 | 37 (100.0%) | 0 (0.0%) |
| $50,000 to $74,999 | 55 (98.2%) | 1 (1.8%) |
| $75,000 to $99,999 | 48 (100.0%) | 0 (0.0%) |
| $100,000 and over | 6 (100.0%) | 0 (0.0%) |
Public vs Private Health Insurance Coverage by Age in Allen
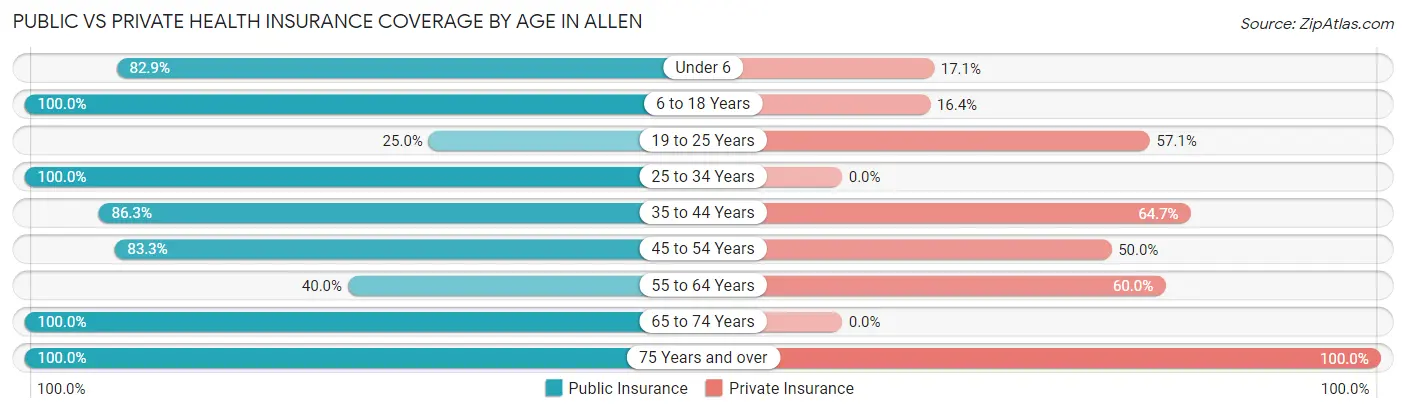
| Age Bracket | Public Insurance | Private Insurance |
| Under 6 | 34 (82.9%) | 7 (17.1%) |
| 6 to 18 Years | 55 (100.0%) | 9 (16.4%) |
| 19 to 25 Years | 7 (25.0%) | 16 (57.1%) |
| 25 to 34 Years | 2 (100.0%) | 0 (0.0%) |
| 35 to 44 Years | 44 (86.3%) | 33 (64.7%) |
| 45 to 54 Years | 10 (83.3%) | 6 (50.0%) |
| 55 to 64 Years | 4 (40.0%) | 6 (60.0%) |
| 65 to 74 Years | 5 (100.0%) | 0 (0.0%) |
| 75 Years and over | 9 (100.0%) | 9 (100.0%) |
| Total | 170 (79.8%) | 86 (40.4%) |
Disability Status by Sex by Age in Allen
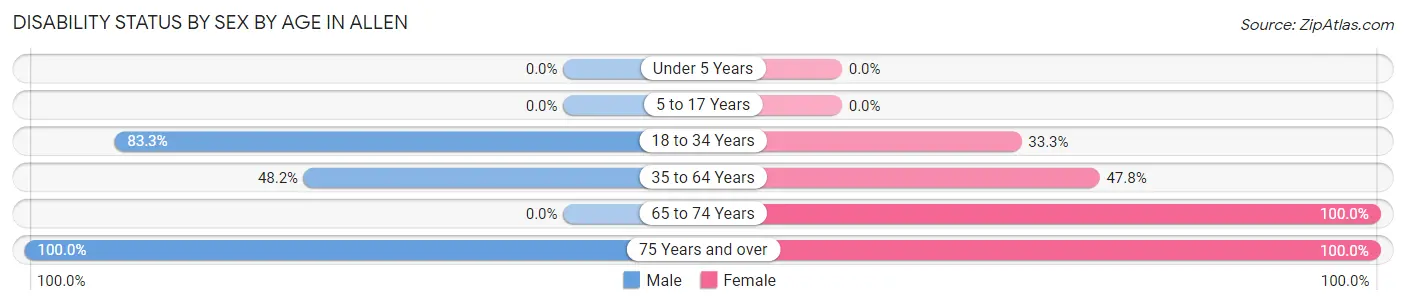
| Age Bracket | Male | Female |
| Under 5 Years | 0 (0.0%) | 0 (0.0%) |
| 5 to 17 Years | 0 (0.0%) | 0 (0.0%) |
| 18 to 34 Years | 10 (83.3%) | 6 (33.3%) |
| 35 to 64 Years | 13 (48.1%) | 22 (47.8%) |
| 65 to 74 Years | 0 (0.0%) | 3 (100.0%) |
| 75 Years and over | 6 (100.0%) | 3 (100.0%) |
Disability Class by Sex by Age in Allen
Disability Class: Hearing Difficulty
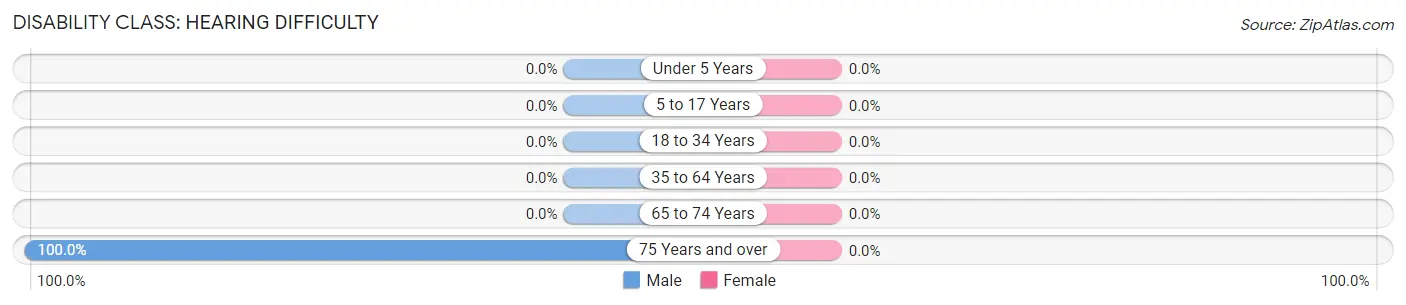
| Age Bracket | Male | Female |
| Under 5 Years | 0 (0.0%) | 0 (0.0%) |
| 5 to 17 Years | 0 (0.0%) | 0 (0.0%) |
| 18 to 34 Years | 0 (0.0%) | 0 (0.0%) |
| 35 to 64 Years | 0 (0.0%) | 0 (0.0%) |
| 65 to 74 Years | 0 (0.0%) | 0 (0.0%) |
| 75 Years and over | 6 (100.0%) | 0 (0.0%) |
Disability Class: Vision Difficulty
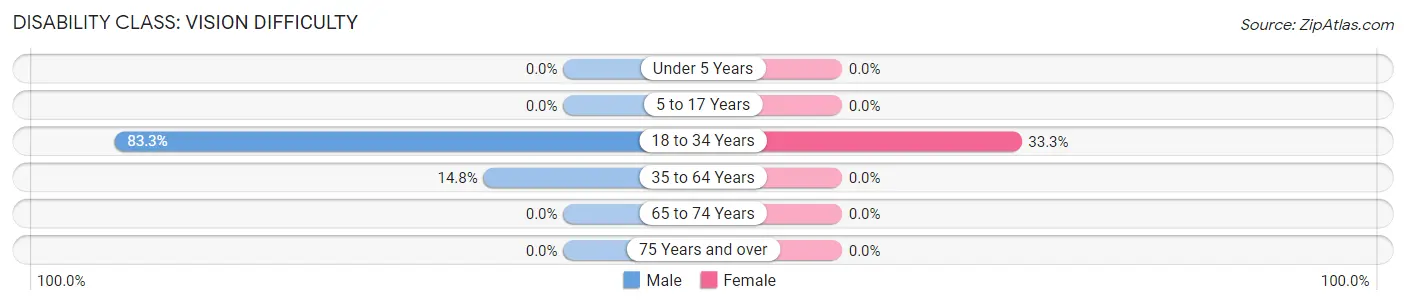
| Age Bracket | Male | Female |
| Under 5 Years | 0 (0.0%) | 0 (0.0%) |
| 5 to 17 Years | 0 (0.0%) | 0 (0.0%) |
| 18 to 34 Years | 10 (83.3%) | 6 (33.3%) |
| 35 to 64 Years | 4 (14.8%) | 0 (0.0%) |
| 65 to 74 Years | 0 (0.0%) | 0 (0.0%) |
| 75 Years and over | 0 (0.0%) | 0 (0.0%) |
Disability Class: Cognitive Difficulty
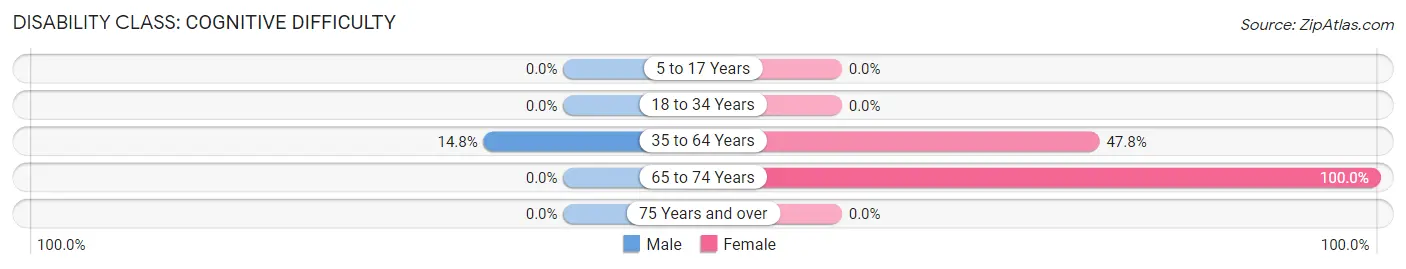
| Age Bracket | Male | Female |
| 5 to 17 Years | 0 (0.0%) | 0 (0.0%) |
| 18 to 34 Years | 0 (0.0%) | 0 (0.0%) |
| 35 to 64 Years | 4 (14.8%) | 22 (47.8%) |
| 65 to 74 Years | 0 (0.0%) | 3 (100.0%) |
| 75 Years and over | 0 (0.0%) | 0 (0.0%) |
Disability Class: Ambulatory Difficulty
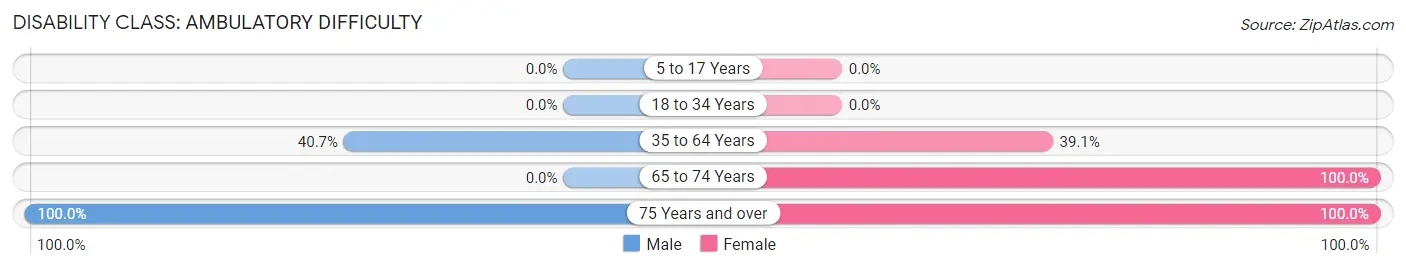
| Age Bracket | Male | Female |
| 5 to 17 Years | 0 (0.0%) | 0 (0.0%) |
| 18 to 34 Years | 0 (0.0%) | 0 (0.0%) |
| 35 to 64 Years | 11 (40.7%) | 18 (39.1%) |
| 65 to 74 Years | 0 (0.0%) | 3 (100.0%) |
| 75 Years and over | 6 (100.0%) | 3 (100.0%) |
Disability Class: Self-Care Difficulty
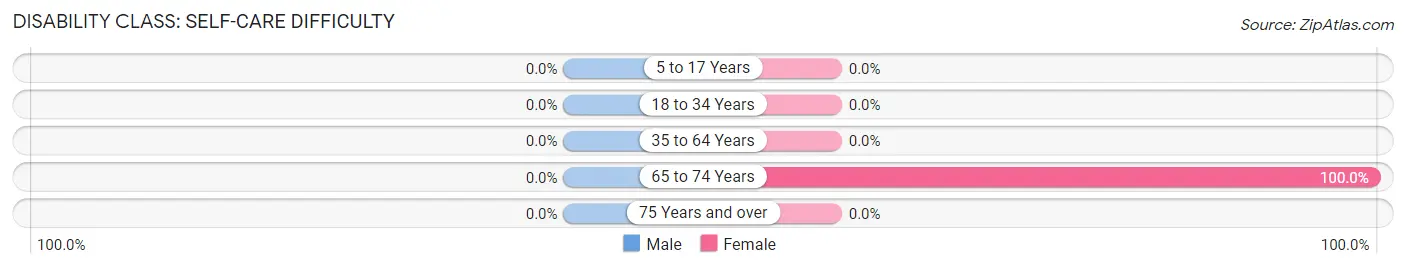
| Age Bracket | Male | Female |
| 5 to 17 Years | 0 (0.0%) | 0 (0.0%) |
| 18 to 34 Years | 0 (0.0%) | 0 (0.0%) |
| 35 to 64 Years | 0 (0.0%) | 0 (0.0%) |
| 65 to 74 Years | 0 (0.0%) | 3 (100.0%) |
| 75 Years and over | 0 (0.0%) | 0 (0.0%) |
Technology Access in Allen
Computing Device Access in Allen
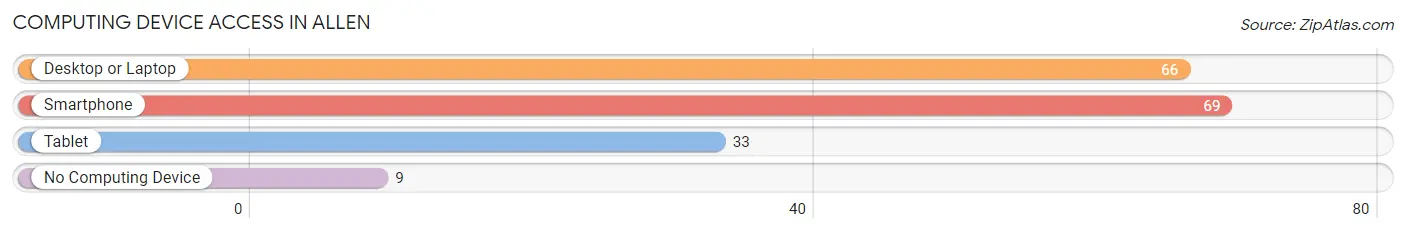
| Device Type | # Households | % Households |
| Desktop or Laptop | 66 | 82.5% |
| Smartphone | 69 | 86.3% |
| Tablet | 33 | 41.2% |
| No Computing Device | 9 | 11.3% |
| Total | 80 | 100.0% |
Internet Access in Allen
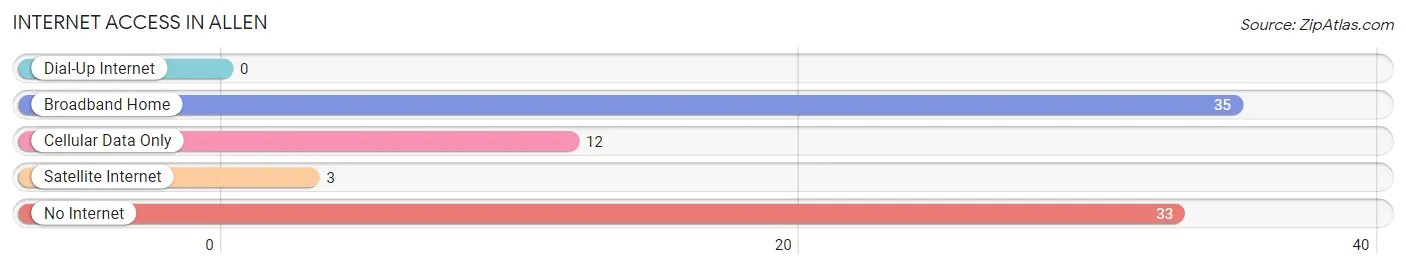
| Internet Type | # Households | % Households |
| Dial-Up Internet | 0 | 0.0% |
| Broadband Home | 35 | 43.8% |
| Cellular Data Only | 12 | 15.0% |
| Satellite Internet | 3 | 3.7% |
| No Internet | 33 | 41.2% |
| Total | 80 | 100.0% |
Allen Summary
Allen is a small unincorporated community located in Floyd County, Kentucky. It is situated in the Appalachian Mountains, and is part of the Big Sandy region. The population of Allen was estimated to be around 500 in 2020.
History
Allen was first settled in the late 1700s by a group of settlers from North Carolina. The town was named after a local settler, William Allen. The town was officially incorporated in 1820.
In the early 1900s, Allen was a thriving coal mining town. The coal industry was the main source of employment for the town’s residents. The town also had a number of stores, churches, and other businesses.
In the 1950s, the coal industry began to decline and many of the town’s residents moved away. The town’s population decreased significantly and the town began to decline.
In the late 1990s, the town began to experience a resurgence. The town was revitalized with the opening of a new grocery store, a post office, and a bank. The town also began to attract new businesses and residents.
Geography
Allen is located in the Appalachian Mountains in Floyd County, Kentucky. The town is situated in the Big Sandy region, which is known for its rolling hills and lush forests. The town is located near the Kentucky-Virginia border and is about an hour’s drive from Lexington, Kentucky.
The town is situated at an elevation of 1,000 feet above sea level. The climate in Allen is humid subtropical, with hot summers and mild winters. The average annual temperature is around 60 degrees Fahrenheit.
Economy
The economy of Allen is largely based on agriculture and tourism. The town is home to several farms, which produce a variety of crops, including corn, soybeans, and tobacco. The town also has a number of small businesses, including restaurants, stores, and other services.
Tourism is also an important part of the town’s economy. The town is home to several attractions, including the Big Sandy River, the Red River Gorge, and the Daniel Boone National Forest. The town also hosts several festivals and events throughout the year, including the Allen County Fair and the Allen County Music Festival.
Demographics
As of 2020, the population of Allen was estimated to be around 500. The town is predominantly white, with a small African American population. The median household income in Allen is around $30,000. The town has a high poverty rate, with around 25% of the population living below the poverty line.
Common Questions
What is Per Capita Income in Allen?
Per Capita income in Allen is $14,551.
What is the Median Family Income in Allen?
Median Family Income in Allen is $34,519.
What is the Median Household income in Allen?
Median Household Income in Allen is $33,269.
What is Inequality or Gini Index in Allen?
Inequality or Gini Index in Allen is 0.51.
What is the Total Population of Allen?
Total Population of Allen is 213.
What is the Total Male Population of Allen?
Total Male Population of Allen is 92.
What is the Total Female Population of Allen?
Total Female Population of Allen is 121.
What is the Ratio of Males per 100 Females in Allen?
There are 76.03 Males per 100 Females in Allen.
What is the Ratio of Females per 100 Males in Allen?
There are 131.52 Females per 100 Males in Allen.
What is the Median Population Age in Allen?
Median Population Age in Allen is 20.4 Years.
What is the Average Family Size in Allen
Average Family Size in Allen is 4.0 People.
What is the Average Household Size in Allen
Average Household Size in Allen is 2.7 People.
How Large is the Labor Force in Allen?
There are 78 People in the Labor Forcein in Allen.
What is the Percentage of People in the Labor Force in Allen?
58.2% of People are in the Labor Force in Allen.
What is the Unemployment Rate in Allen?
Unemployment Rate in Allen is 30.8%.