Doe Valley, KY Map & Demographics
Doe Valley Map
Doe Valley Overview
$49,559
PER CAPITA INCOME
$111,094
AVG FAMILY INCOME
$102,143
AVG HOUSEHOLD INCOME
65.6%
WAGE / INCOME GAP [ % ]
34.4¢/ $1
WAGE / INCOME GAP [ $ ]
0.36
INEQUALITY / GINI INDEX
1,871
TOTAL POPULATION
803
MALE POPULATION
1,068
FEMALE POPULATION
75.19
MALES / 100 FEMALES
133.00
FEMALES / 100 MALES
51.3
MEDIAN AGE
2.6
AVG FAMILY SIZE
2.5
AVG HOUSEHOLD SIZE
917
LABOR FORCE [ PEOPLE ]
55.9%
PERCENT IN LABOR FORCE
Income in Doe Valley
Income Overview in Doe Valley
Per Capita Income in Doe Valley is $49,559, while median incomes of families and households are $111,094 and $102,143 respectively.
| Characteristic | Number | Measure |
| Per Capita Income | 1,871 | $49,559 |
| Median Family Income | 613 | $111,094 |
| Mean Family Income | 613 | $131,222 |
| Median Household Income | 736 | $102,143 |
| Mean Household Income | 736 | $121,384 |
| Income Deficit | 613 | $0 |
| Wage / Income Gap (%) | 1,871 | 65.62% |
| Wage / Income Gap ($) | 1,871 | 34.38¢ per $1 |
| Gini / Inequality Index | 1,871 | 0.36 |
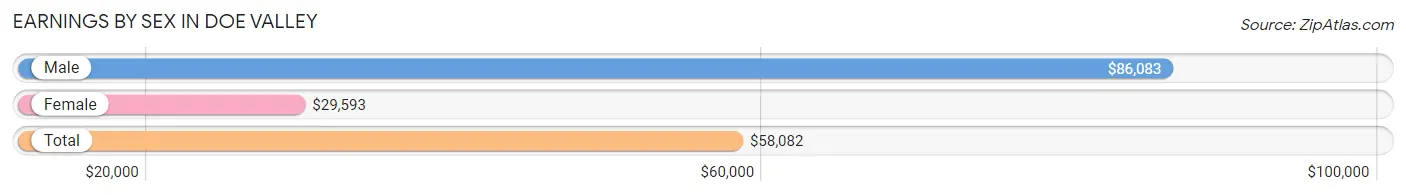
Earnings by Sex in Doe Valley
Average Earnings in Doe Valley are $58,082, $86,083 for men and $29,593 for women, a difference of 65.6%.
| Sex | Number | Average Earnings |
| Male | 525 (50.3%) | $86,083 |
| Female | 519 (49.7%) | $29,593 |
| Total | 1,044 (100.0%) | $58,082 |
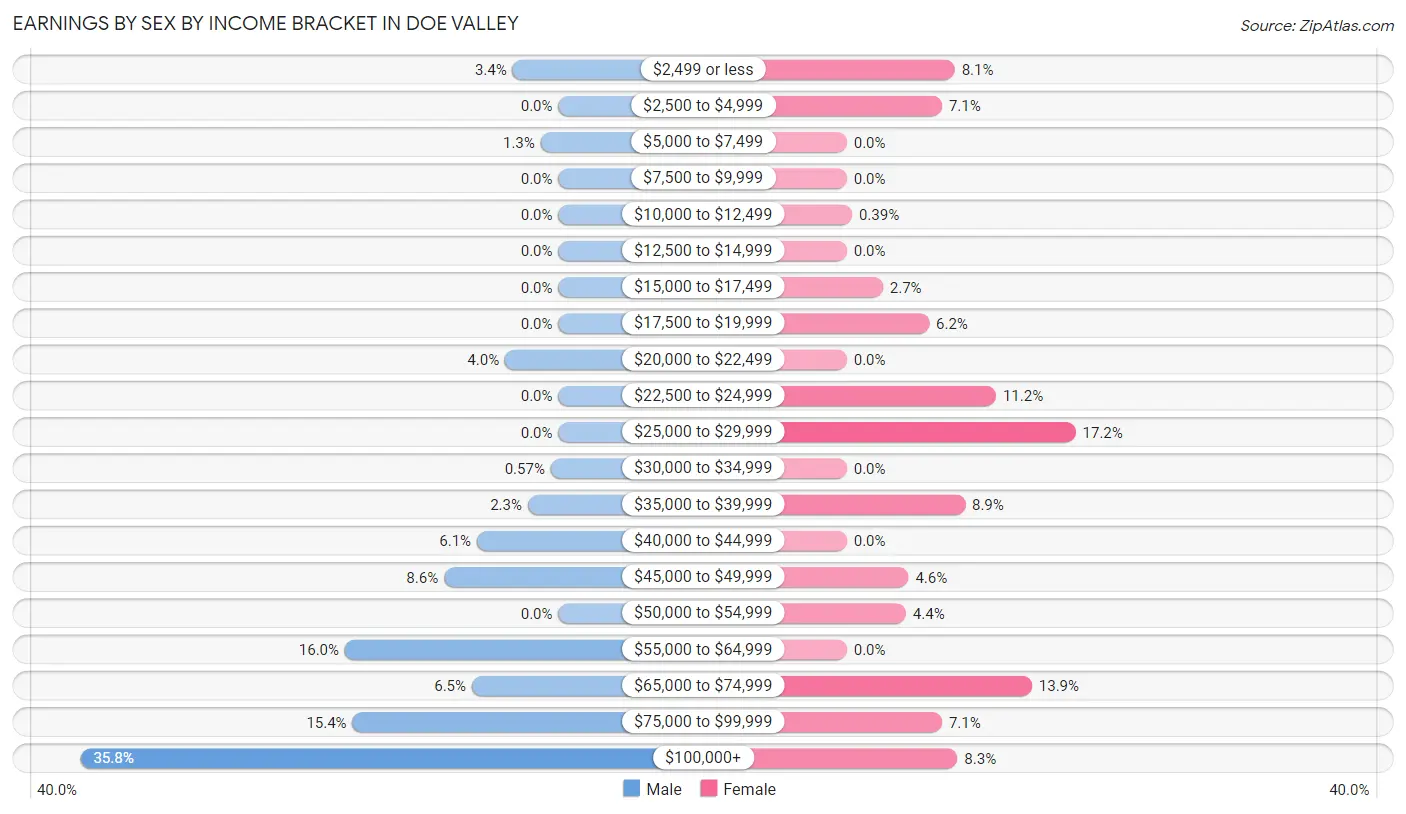
Earnings by Sex by Income Bracket in Doe Valley
The most common earnings brackets in Doe Valley are $100,000+ for men (188 | 35.8%) and $25,000 to $29,999 for women (89 | 17.2%).
| Income | Male | Female |
| $2,499 or less | 18 (3.4%) | 42 (8.1%) |
| $2,500 to $4,999 | 0 (0.0%) | 37 (7.1%) |
| $5,000 to $7,499 | 7 (1.3%) | 0 (0.0%) |
| $7,500 to $9,999 | 0 (0.0%) | 0 (0.0%) |
| $10,000 to $12,499 | 0 (0.0%) | 2 (0.4%) |
| $12,500 to $14,999 | 0 (0.0%) | 0 (0.0%) |
| $15,000 to $17,499 | 0 (0.0%) | 14 (2.7%) |
| $17,500 to $19,999 | 0 (0.0%) | 32 (6.2%) |
| $20,000 to $22,499 | 21 (4.0%) | 0 (0.0%) |
| $22,500 to $24,999 | 0 (0.0%) | 58 (11.2%) |
| $25,000 to $29,999 | 0 (0.0%) | 89 (17.2%) |
| $30,000 to $34,999 | 3 (0.6%) | 0 (0.0%) |
| $35,000 to $39,999 | 12 (2.3%) | 46 (8.9%) |
| $40,000 to $44,999 | 32 (6.1%) | 0 (0.0%) |
| $45,000 to $49,999 | 45 (8.6%) | 24 (4.6%) |
| $50,000 to $54,999 | 0 (0.0%) | 23 (4.4%) |
| $55,000 to $64,999 | 84 (16.0%) | 0 (0.0%) |
| $65,000 to $74,999 | 34 (6.5%) | 72 (13.9%) |
| $75,000 to $99,999 | 81 (15.4%) | 37 (7.1%) |
| $100,000+ | 188 (35.8%) | 43 (8.3%) |
| Total | 525 (100.0%) | 519 (100.0%) |
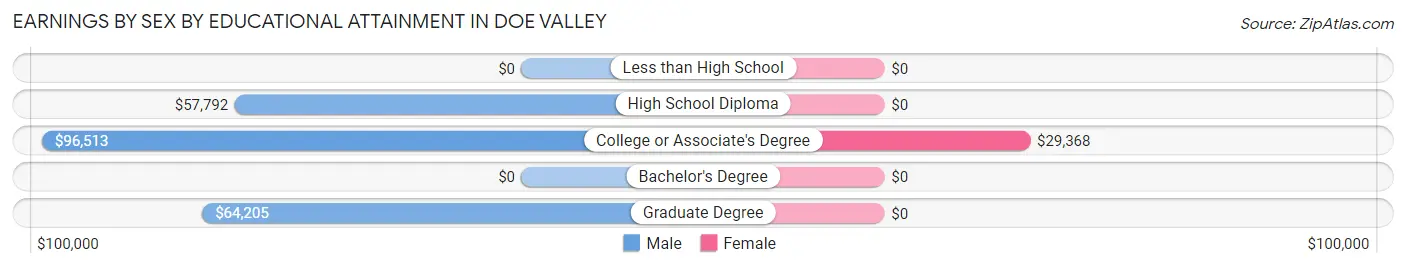
Earnings by Sex by Educational Attainment in Doe Valley
Average earnings in Doe Valley are $86,333 for men and $38,723 for women, a difference of 55.1%. Men with an educational attainment of college or associate's degree enjoy the highest average annual earnings of $96,513, while those with high school diploma education earn the least with $57,792. Women with an educational attainment of college or associate's degree earn the most with the average annual earnings of $29,368, while those with college or associate's degree education have the smallest earnings of $29,368.
| Educational Attainment | Male Income | Female Income |
| Less than High School | - | - |
| High School Diploma | $57,792 | $0 |
| College or Associate's Degree | $96,513 | $29,368 |
| Bachelor's Degree | - | - |
| Graduate Degree | $64,205 | $0 |
| Total | $86,333 | $38,723 |
Family Income in Doe Valley
Family Income Brackets in Doe Valley
According to the Doe Valley family income data, there are 152 families falling into the $200,000+ income range, which is the most common income bracket and makes up 24.8% of all families.
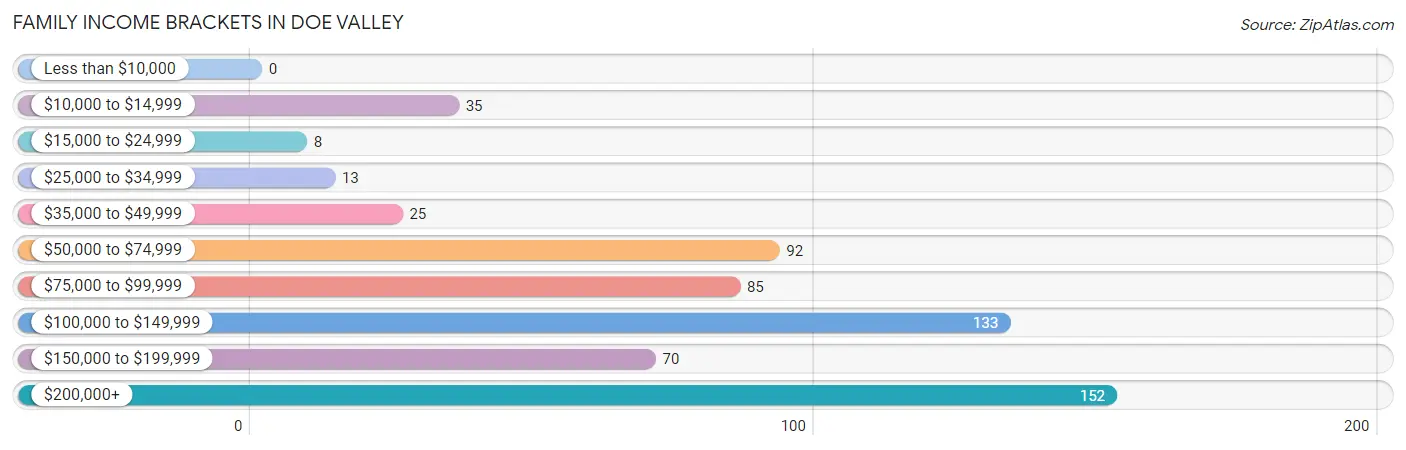
| Income Bracket | # Families | % Families |
| Less than $10,000 | 0 | 0.0% |
| $10,000 to $14,999 | 35 | 5.7% |
| $15,000 to $24,999 | 8 | 1.3% |
| $25,000 to $34,999 | 13 | 2.1% |
| $35,000 to $49,999 | 25 | 4.1% |
| $50,000 to $74,999 | 92 | 15.0% |
| $75,000 to $99,999 | 85 | 13.9% |
| $100,000 to $149,999 | 133 | 21.7% |
| $150,000 to $199,999 | 70 | 11.4% |
| $200,000+ | 152 | 24.8% |
Family Income by Famaliy Size in Doe Valley
2-person families (441 | 71.9%) account for the highest median family income in Doe Valley with $129,564 per family, while 2-person families (441 | 71.9%) have the highest median income of $64,782 per family member.
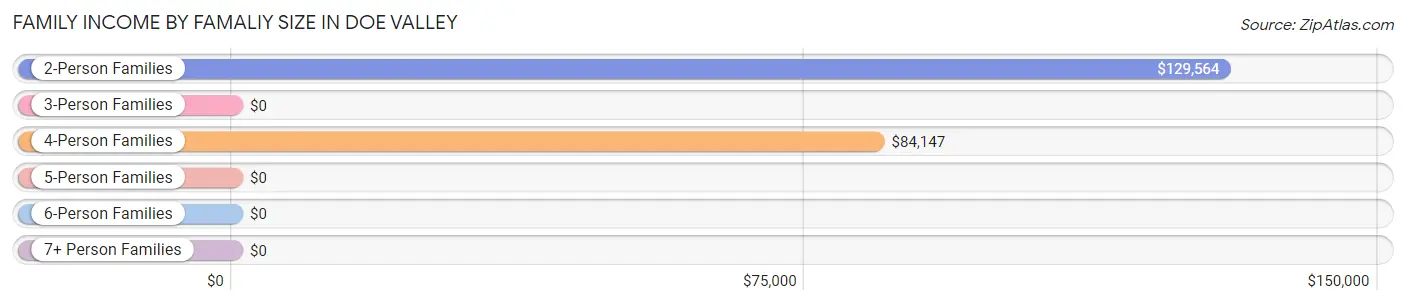
| Income Bracket | # Families | Median Income |
| 2-Person Families | 441 (71.9%) | $129,564 |
| 3-Person Families | 12 (2.0%) | $0 |
| 4-Person Families | 143 (23.3%) | $84,147 |
| 5-Person Families | 15 (2.5%) | $0 |
| 6-Person Families | 0 (0.0%) | $0 |
| 7+ Person Families | 2 (0.3%) | $0 |
| Total | 613 (100.0%) | $111,094 |
Family Income by Number of Earners in Doe Valley
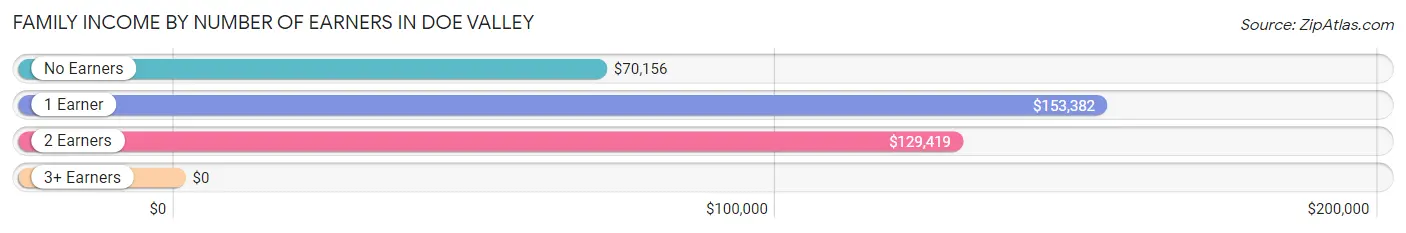
| Number of Earners | # Families | Median Income |
| No Earners | 171 (27.9%) | $70,156 |
| 1 Earner | 160 (26.1%) | $153,382 |
| 2 Earners | 230 (37.5%) | $129,419 |
| 3+ Earners | 52 (8.5%) | $0 |
| Total | 613 (100.0%) | $111,094 |
Household Income in Doe Valley
Household Income Brackets in Doe Valley
With 152 households falling in the category, the $200,000+ income range is the most frequent in Doe Valley, accounting for 20.6% of all households.
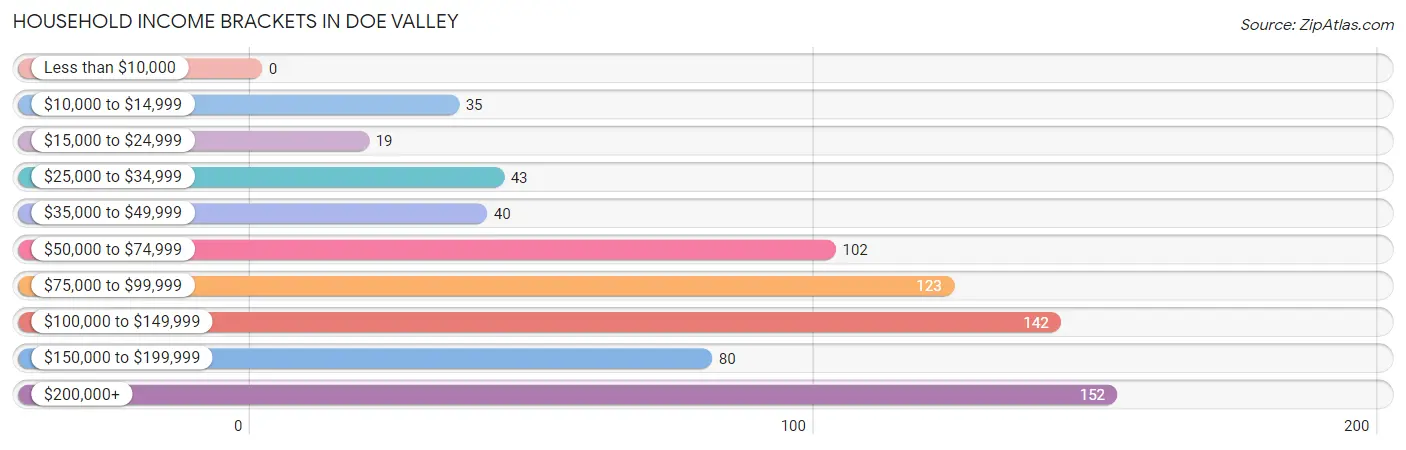
| Income Bracket | # Households | % Households |
| Less than $10,000 | 0 | 0.0% |
| $10,000 to $14,999 | 35 | 4.8% |
| $15,000 to $24,999 | 19 | 2.6% |
| $25,000 to $34,999 | 43 | 5.8% |
| $35,000 to $49,999 | 40 | 5.4% |
| $50,000 to $74,999 | 102 | 13.9% |
| $75,000 to $99,999 | 123 | 16.7% |
| $100,000 to $149,999 | 142 | 19.3% |
| $150,000 to $199,999 | 80 | 10.9% |
| $200,000+ | 152 | 20.7% |
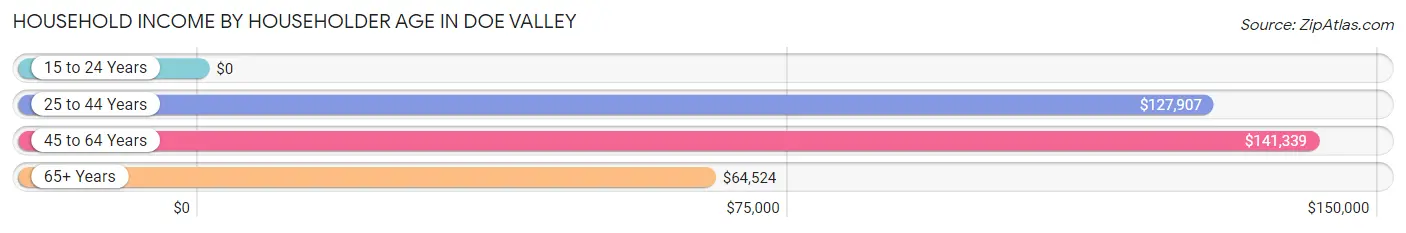
Household Income by Householder Age in Doe Valley
The median household income in Doe Valley is $102,143, with the highest median household income of $141,339 found in the 45 to 64 years age bracket for the primary householder. A total of 406 households (55.2%) fall into this category.
| Income Bracket | # Households | Median Income |
| 15 to 24 Years | 0 (0.0%) | $0 |
| 25 to 44 Years | 128 (17.4%) | $127,907 |
| 45 to 64 Years | 406 (55.2%) | $141,339 |
| 65+ Years | 202 (27.5%) | $64,524 |
| Total | 736 (100.0%) | $102,143 |
Poverty in Doe Valley
Income Below Poverty by Sex and Age in Doe Valley
With 3.4% poverty level for males and 9.3% for females among the residents of Doe Valley, 65 to 74 year old males and 12 to 14 year old females are the most vulnerable to poverty, with 12 males (19.4%) and 15 females (100.0%) in their respective age groups living below the poverty level.
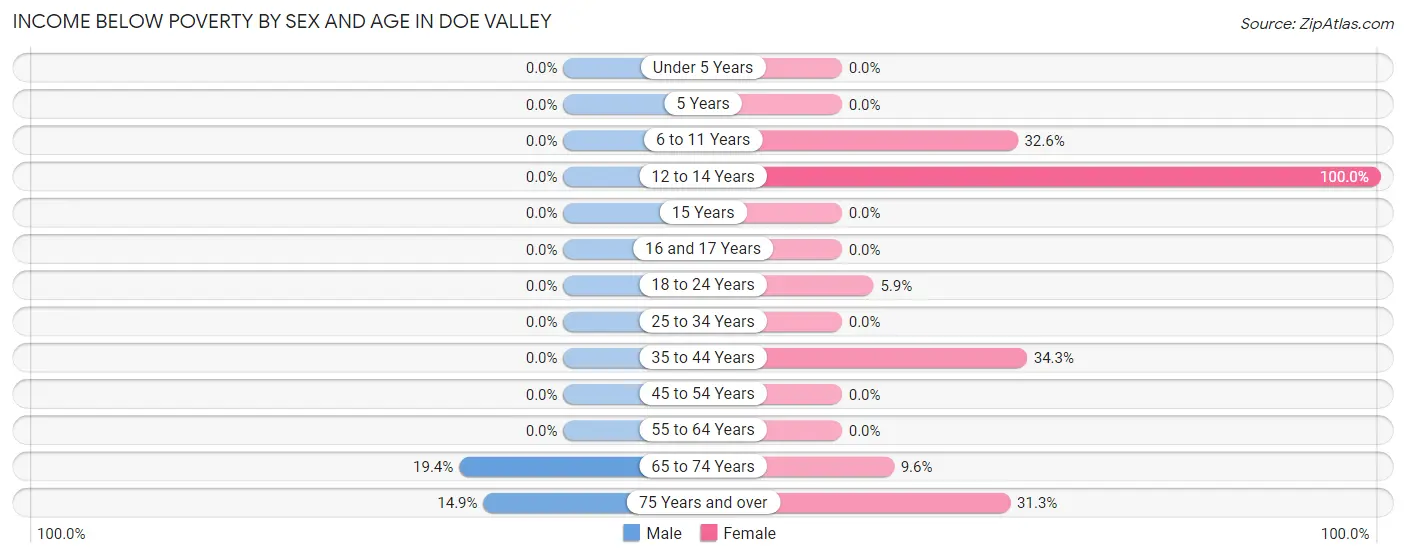
| Age Bracket | Male | Female |
| Under 5 Years | 0 (0.0%) | 0 (0.0%) |
| 5 Years | 0 (0.0%) | 0 (0.0%) |
| 6 to 11 Years | 0 (0.0%) | 15 (32.6%) |
| 12 to 14 Years | 0 (0.0%) | 15 (100.0%) |
| 15 Years | 0 (0.0%) | 0 (0.0%) |
| 16 and 17 Years | 0 (0.0%) | 0 (0.0%) |
| 18 to 24 Years | 0 (0.0%) | 2 (5.9%) |
| 25 to 34 Years | 0 (0.0%) | 0 (0.0%) |
| 35 to 44 Years | 0 (0.0%) | 34 (34.3%) |
| 45 to 54 Years | 0 (0.0%) | 0 (0.0%) |
| 55 to 64 Years | 0 (0.0%) | 0 (0.0%) |
| 65 to 74 Years | 12 (19.4%) | 13 (9.6%) |
| 75 Years and over | 15 (14.8%) | 20 (31.2%) |
| Total | 27 (3.4%) | 99 (9.3%) |
Income Above Poverty by Sex and Age in Doe Valley
According to the poverty statistics in Doe Valley, males aged under 5 years and females aged under 5 years are the age groups that are most secure financially, with 100.0% of males and 100.0% of females in these age groups living above the poverty line.
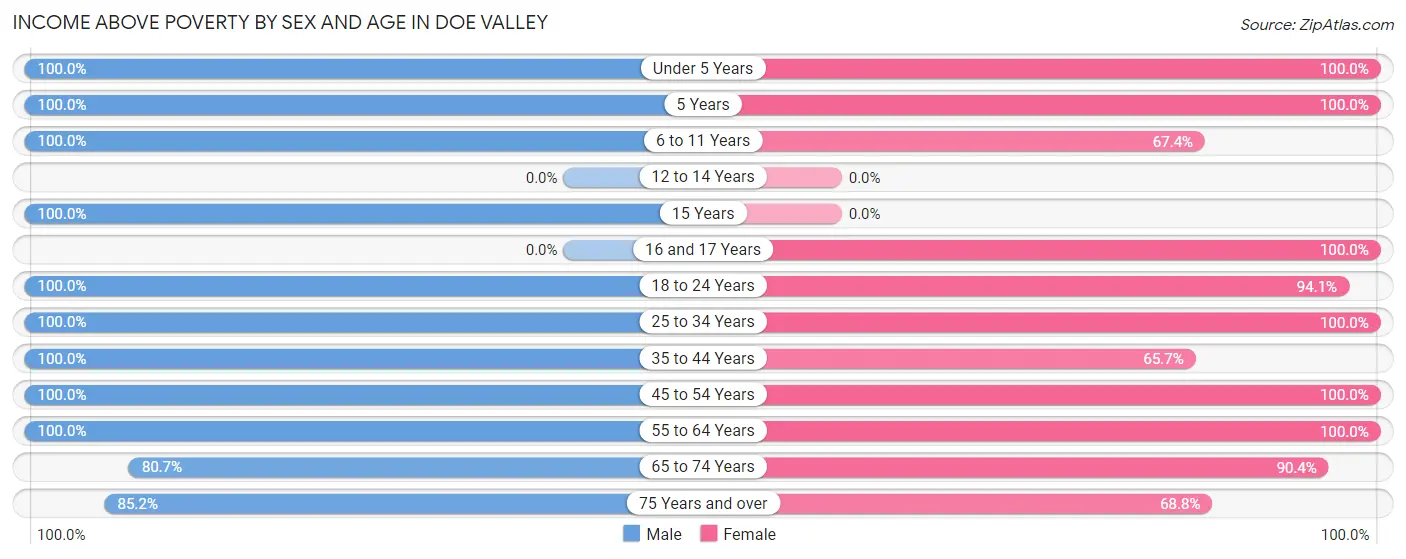
| Age Bracket | Male | Female |
| Under 5 Years | 11 (100.0%) | 75 (100.0%) |
| 5 Years | 14 (100.0%) | 11 (100.0%) |
| 6 to 11 Years | 27 (100.0%) | 31 (67.4%) |
| 12 to 14 Years | 0 (0.0%) | 0 (0.0%) |
| 15 Years | 31 (100.0%) | 0 (0.0%) |
| 16 and 17 Years | 0 (0.0%) | 40 (100.0%) |
| 18 to 24 Years | 3 (100.0%) | 32 (94.1%) |
| 25 to 34 Years | 116 (100.0%) | 104 (100.0%) |
| 35 to 44 Years | 64 (100.0%) | 65 (65.7%) |
| 45 to 54 Years | 145 (100.0%) | 179 (100.0%) |
| 55 to 64 Years | 229 (100.0%) | 266 (100.0%) |
| 65 to 74 Years | 50 (80.6%) | 122 (90.4%) |
| 75 Years and over | 86 (85.2%) | 44 (68.8%) |
| Total | 776 (96.6%) | 969 (90.7%) |
Income Below Poverty Among Married-Couple Families in Doe Valley
The poverty statistics for married-couple families in Doe Valley show that 5.8% or 35 of the total 601 families live below the poverty line. Families with 1 or 2 children have the highest poverty rate of 10.6%, comprising of 15 families. On the other hand, families with no children have the lowest poverty rate of 4.3%, which includes 20 families.
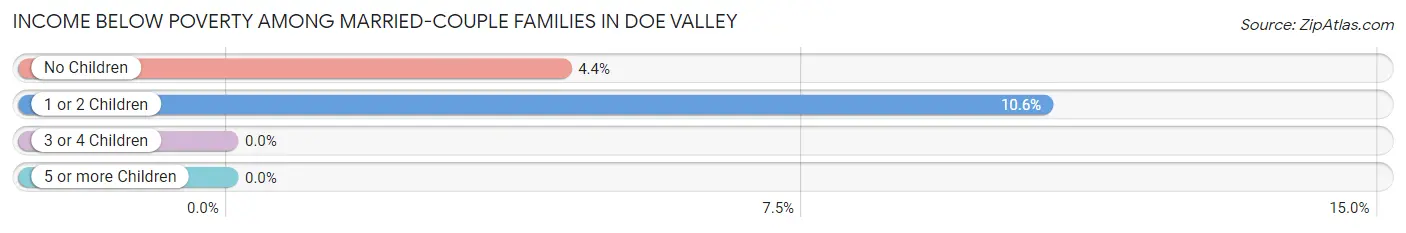
| Children | Above Poverty | Below Poverty |
| No Children | 440 (95.7%) | 20 (4.3%) |
| 1 or 2 Children | 126 (89.4%) | 15 (10.6%) |
| 3 or 4 Children | 0 (0.0%) | 0 (0.0%) |
| 5 or more Children | 0 (0.0%) | 0 (0.0%) |
| Total | 566 (94.2%) | 35 (5.8%) |
Income Below Poverty Among Single-Parent Households in Doe Valley
| Children | Single Father | Single Mother |
| No Children | 0 (0.0%) | 0 (0.0%) |
| 1 or 2 Children | 0 (0.0%) | 0 (0.0%) |
| 3 or 4 Children | 0 (0.0%) | 0 (0.0%) |
| 5 or more Children | 0 (0.0%) | 0 (0.0%) |
| Total | 0 (0.0%) | 0 (0.0%) |
Income Below Poverty Among Married-Couple vs Single-Parent Households in Doe Valley
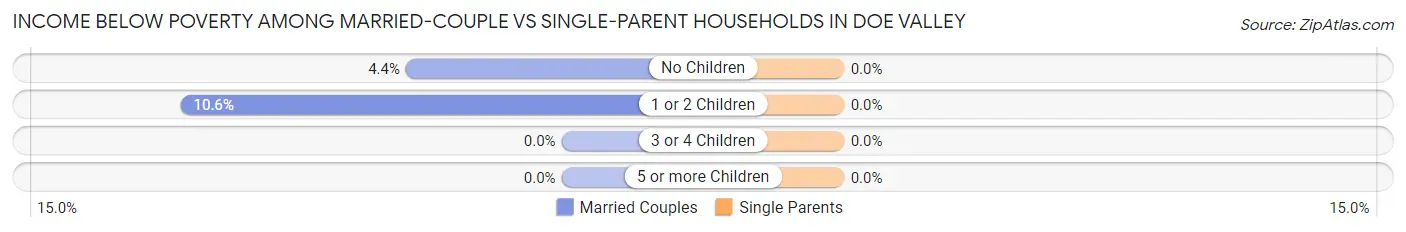
| Children | Married-Couple Families | Single-Parent Households |
| No Children | 20 (4.3%) | 0 (0.0%) |
| 1 or 2 Children | 15 (10.6%) | 0 (0.0%) |
| 3 or 4 Children | 0 (0.0%) | 0 (0.0%) |
| 5 or more Children | 0 (0.0%) | 0 (0.0%) |
| Total | 35 (5.8%) | 0 (0.0%) |
Race in Doe Valley
The most populous races in Doe Valley are White / Caucasian (1,870 | 100.0%), and Two or more Races (1 | 0.1%).
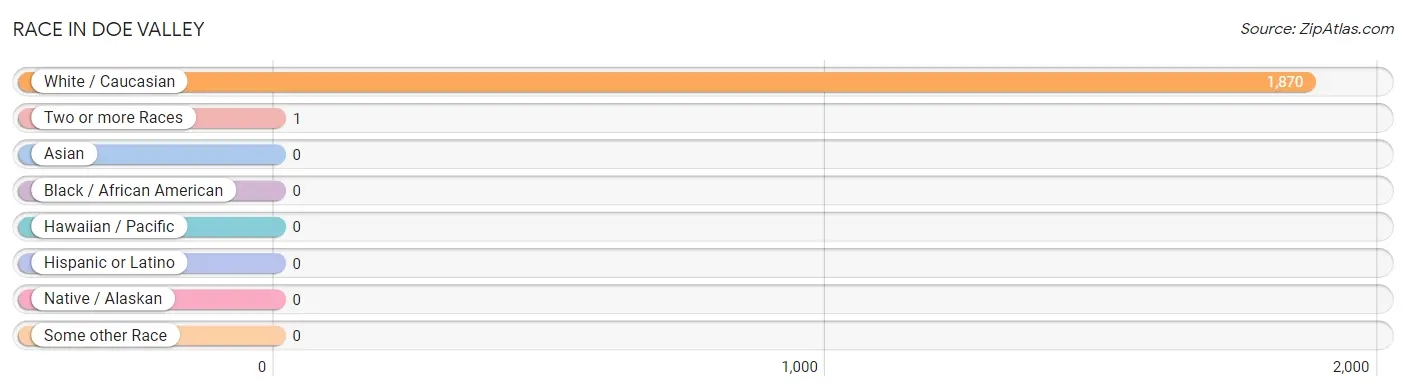
| Race | # Population | % Population |
| Asian | 0 | 0.0% |
| Black / African American | 0 | 0.0% |
| Hawaiian / Pacific | 0 | 0.0% |
| Hispanic or Latino | 0 | 0.0% |
| Native / Alaskan | 0 | 0.0% |
| White / Caucasian | 1,870 | 100.0% |
| Two or more Races | 1 | 0.1% |
| Some other Race | 0 | 0.0% |
| Total | 1,871 | 100.0% |
Ancestry in Doe Valley
The most populous ancestries reported in Doe Valley are American (331 | 17.7%), English (294 | 15.7%), German (158 | 8.4%), Irish (93 | 5.0%), and European (81 | 4.3%), together accounting for 51.1% of all Doe Valley residents.
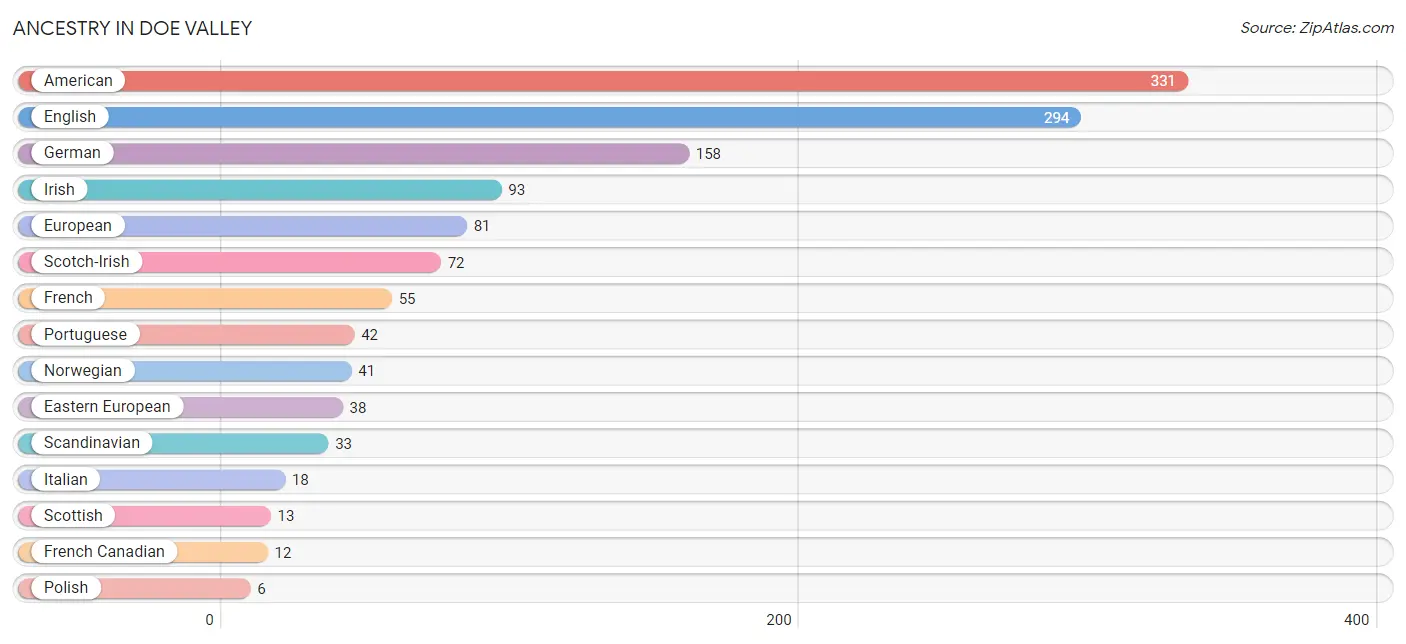
| Ancestry | # Population | % Population |
| American | 331 | 17.7% |
| Eastern European | 38 | 2.0% |
| English | 294 | 15.7% |
| European | 81 | 4.3% |
| French | 55 | 2.9% |
| French American Indian | 1 | 0.1% |
| French Canadian | 12 | 0.6% |
| German | 158 | 8.4% |
| Irish | 93 | 5.0% |
| Italian | 18 | 1.0% |
| Norwegian | 41 | 2.2% |
| Polish | 6 | 0.3% |
| Portuguese | 42 | 2.2% |
| Scandinavian | 33 | 1.8% |
| Scotch-Irish | 72 | 3.8% |
| Scottish | 13 | 0.7% | View All 16 Rows |
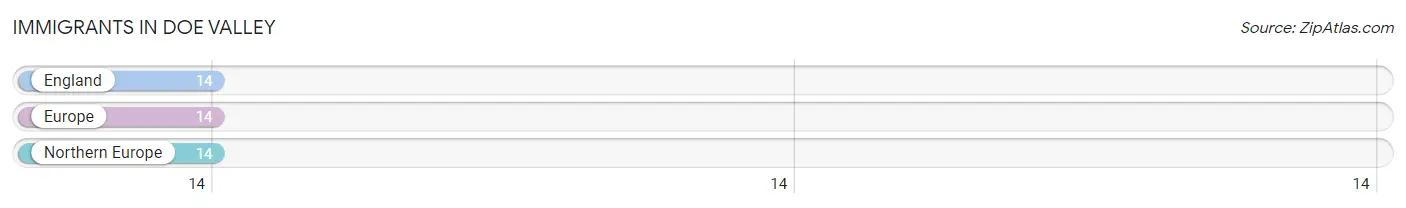
Immigrants in Doe Valley
The most numerous immigrant groups reported in Doe Valley came from England (14 | 0.7%), Europe (14 | 0.7%), and Northern Europe (14 | 0.7%), together accounting for 2.2% of all Doe Valley residents.
| Immigration Origin | # Population | % Population |
| England | 14 | 0.7% |
| Europe | 14 | 0.7% |
| Northern Europe | 14 | 0.7% | View All 3 Rows |
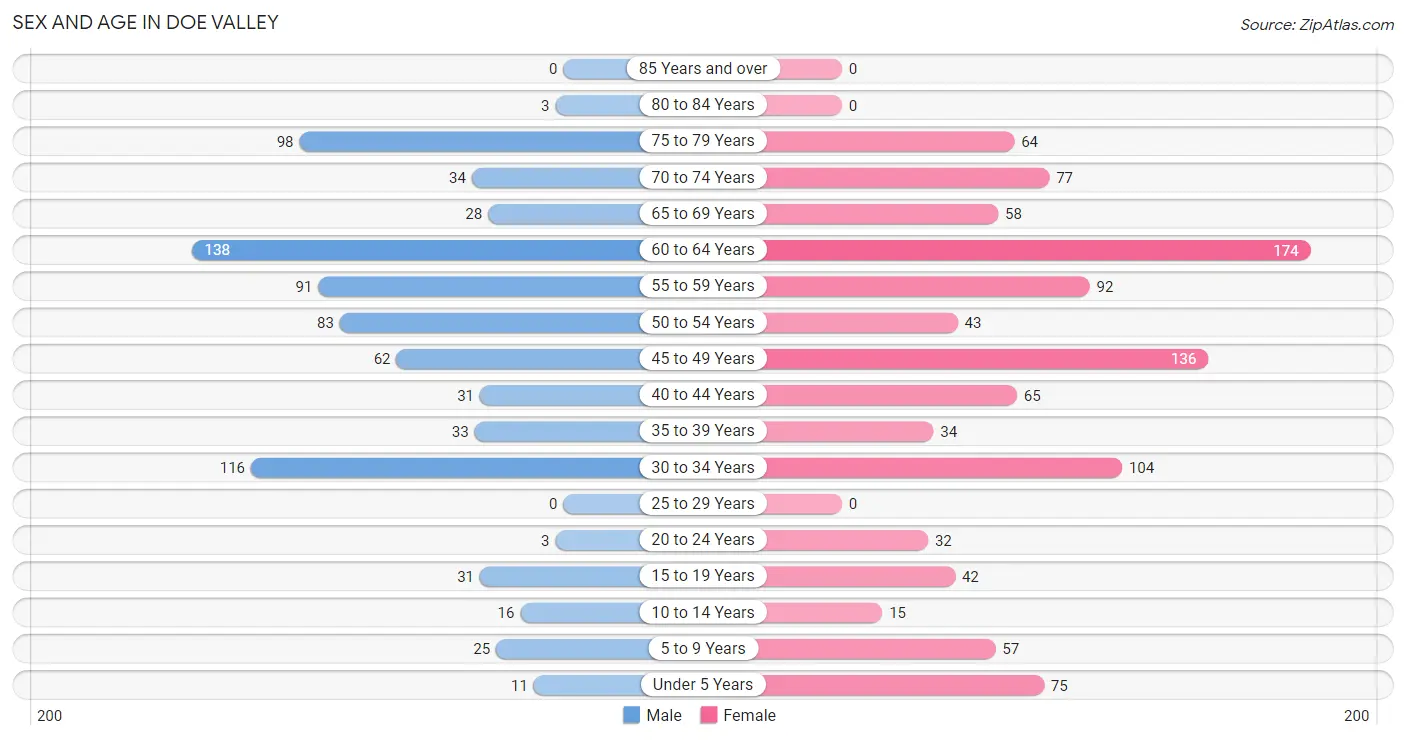
Sex and Age in Doe Valley
Sex and Age in Doe Valley
The most populous age groups in Doe Valley are 60 to 64 Years (138 | 17.2%) for men and 60 to 64 Years (174 | 16.3%) for women.
| Age Bracket | Male | Female |
| Under 5 Years | 11 (1.4%) | 75 (7.0%) |
| 5 to 9 Years | 25 (3.1%) | 57 (5.3%) |
| 10 to 14 Years | 16 (2.0%) | 15 (1.4%) |
| 15 to 19 Years | 31 (3.9%) | 42 (3.9%) |
| 20 to 24 Years | 3 (0.4%) | 32 (3.0%) |
| 25 to 29 Years | 0 (0.0%) | 0 (0.0%) |
| 30 to 34 Years | 116 (14.4%) | 104 (9.7%) |
| 35 to 39 Years | 33 (4.1%) | 34 (3.2%) |
| 40 to 44 Years | 31 (3.9%) | 65 (6.1%) |
| 45 to 49 Years | 62 (7.7%) | 136 (12.7%) |
| 50 to 54 Years | 83 (10.3%) | 43 (4.0%) |
| 55 to 59 Years | 91 (11.3%) | 92 (8.6%) |
| 60 to 64 Years | 138 (17.2%) | 174 (16.3%) |
| 65 to 69 Years | 28 (3.5%) | 58 (5.4%) |
| 70 to 74 Years | 34 (4.2%) | 77 (7.2%) |
| 75 to 79 Years | 98 (12.2%) | 64 (6.0%) |
| 80 to 84 Years | 3 (0.4%) | 0 (0.0%) |
| 85 Years and over | 0 (0.0%) | 0 (0.0%) |
| Total | 803 (100.0%) | 1,068 (100.0%) |
Families and Households in Doe Valley
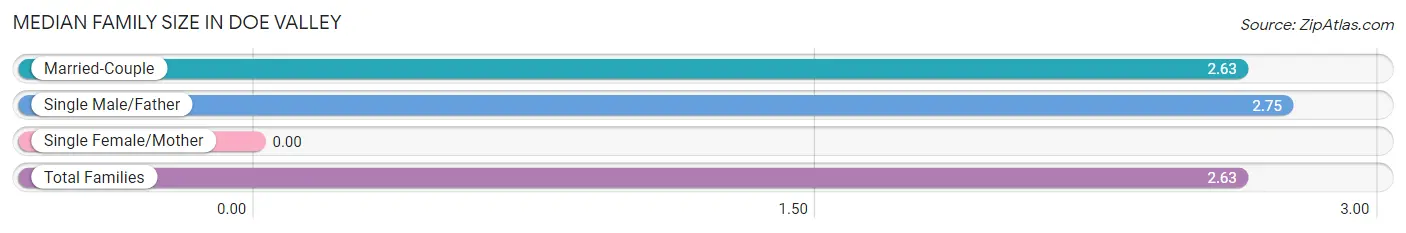
Median Family Size in Doe Valley
| Family Type | # Families | Family Size |
| Married-Couple | 601 (98.0%) | 2.63 |
| Single Male/Father | 12 (2.0%) | 2.75 |
| Single Female/Mother | 0 (0.0%) | - |
| Total Families | 613 (100.0%) | 2.63 |
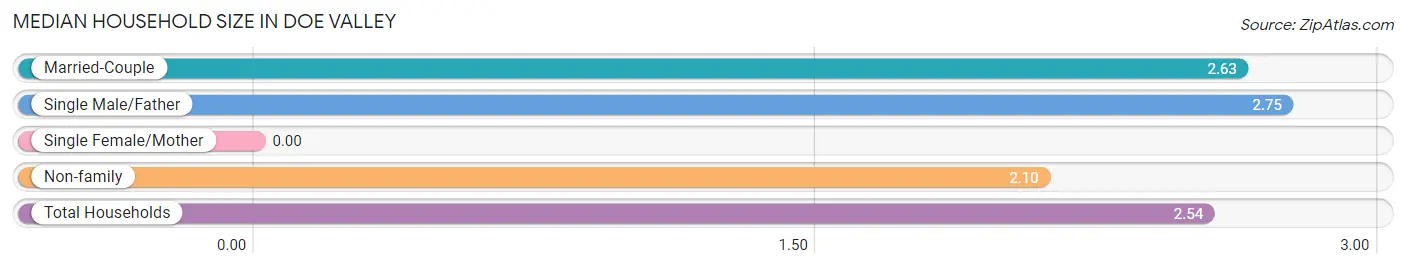
Median Household Size in Doe Valley
| Household Type | # Households | Household Size |
| Married-Couple | 601 (81.7%) | 2.63 |
| Single Male/Father | 12 (1.6%) | 2.75 |
| Single Female/Mother | 0 (0.0%) | - |
| Non-family | 123 (16.7%) | 2.10 |
| Total Households | 736 (100.0%) | 2.54 |
Household Size by Marriage Status in Doe Valley
Out of a total of 736 households in Doe Valley, 613 (83.3%) are family households, while 123 (16.7%) are nonfamily households. The most numerous type of family households are 2-person households, comprising 441, and the most common type of nonfamily households are 1-person households, comprising 77.
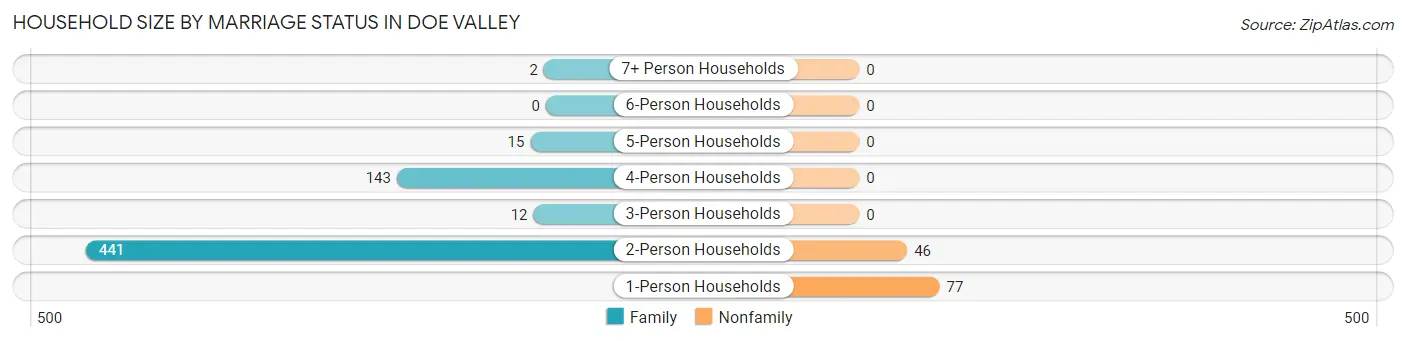
| Household Size | Family Households | Nonfamily Households |
| 1-Person Households | - | 77 (10.5%) |
| 2-Person Households | 441 (59.9%) | 46 (6.2%) |
| 3-Person Households | 12 (1.6%) | 0 (0.0%) |
| 4-Person Households | 143 (19.4%) | 0 (0.0%) |
| 5-Person Households | 15 (2.0%) | 0 (0.0%) |
| 6-Person Households | 0 (0.0%) | 0 (0.0%) |
| 7+ Person Households | 2 (0.3%) | 0 (0.0%) |
| Total | 613 (83.3%) | 123 (16.7%) |
Female Fertility in Doe Valley
Fertility by Age in Doe Valley
Average fertility rate in Doe Valley is 73.0 births per 1,000 women. Women in the age bracket of 35 to 50 years have the highest fertility rate with 128.0 births per 1,000 women. Women in the age bracket of 35 to 50 years acount for 100.0% of all women with births.
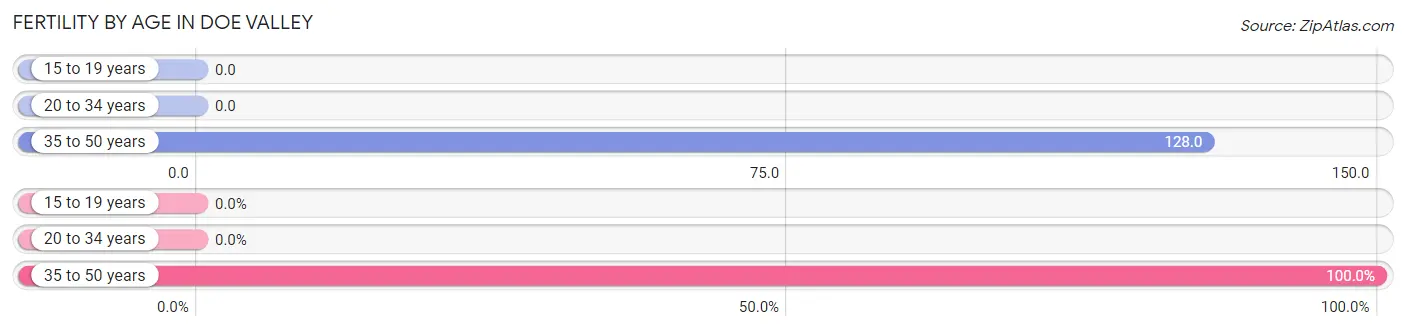
| Age Bracket | Women with Births | Births / 1,000 Women |
| 15 to 19 years | 0 (0.0%) | 0.0 |
| 20 to 34 years | 0 (0.0%) | 0.0 |
| 35 to 50 years | 30 (100.0%) | 128.0 |
| Total | 30 (100.0%) | 73.0 |
Fertility by Age by Marriage Status in Doe Valley
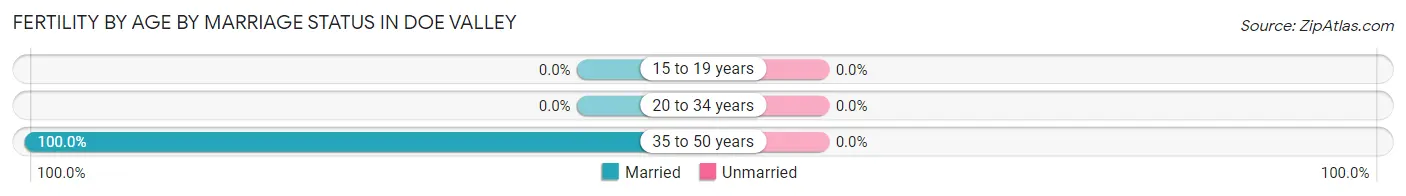
| Age Bracket | Married | Unmarried |
| 15 to 19 years | 0 (0.0%) | 0 (0.0%) |
| 20 to 34 years | 0 (0.0%) | 0 (0.0%) |
| 35 to 50 years | 30 (100.0%) | 0 (0.0%) |
| Total | 30 (100.0%) | 0 (0.0%) |
Fertility by Education in Doe Valley
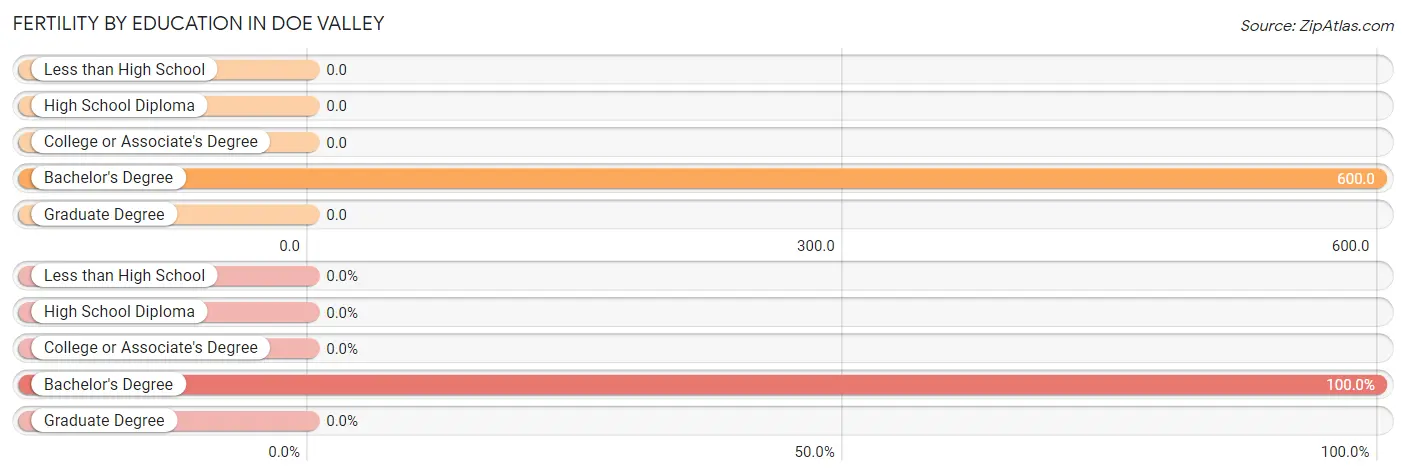
| Educational Attainment | Women with Births | Births / 1,000 Women |
| Less than High School | 0 (0.0%) | 0.0 |
| High School Diploma | 0 (0.0%) | 0.0 |
| College or Associate's Degree | 0 (0.0%) | 0.0 |
| Bachelor's Degree | 30 (100.0%) | 600.0 |
| Graduate Degree | 0 (0.0%) | 0.0 |
| Total | 30 (100.0%) | 73.0 |
Fertility by Education by Marriage Status in Doe Valley
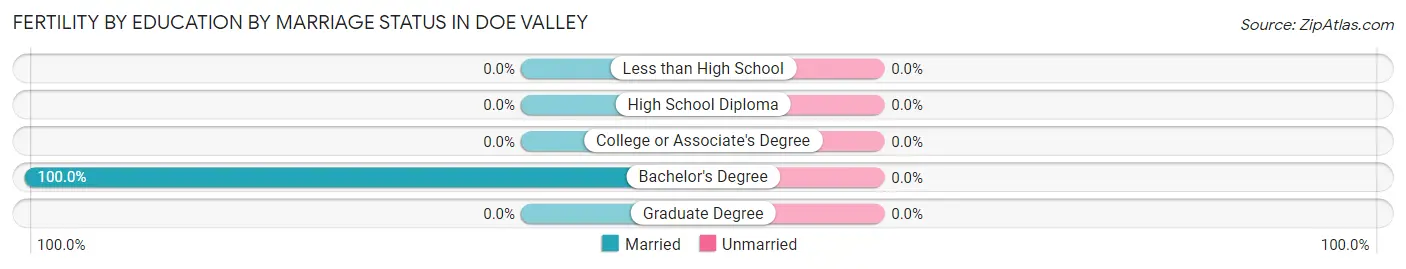
| Educational Attainment | Married | Unmarried |
| Less than High School | 0 (0.0%) | 0 (0.0%) |
| High School Diploma | 0 (0.0%) | 0 (0.0%) |
| College or Associate's Degree | 0 (0.0%) | 0 (0.0%) |
| Bachelor's Degree | 30 (100.0%) | 0 (0.0%) |
| Graduate Degree | 0 (0.0%) | 0 (0.0%) |
| Total | 30 (100.0%) | 0 (0.0%) |
Employment Characteristics in Doe Valley
Employment by Class of Employer in Doe Valley
Among the 885 employed individuals in Doe Valley, private company employees (393 | 44.4%), federal government employees (204 | 23.1%), and self-employed (not incorporated) (82 | 9.3%) make up the most common classes of employment.
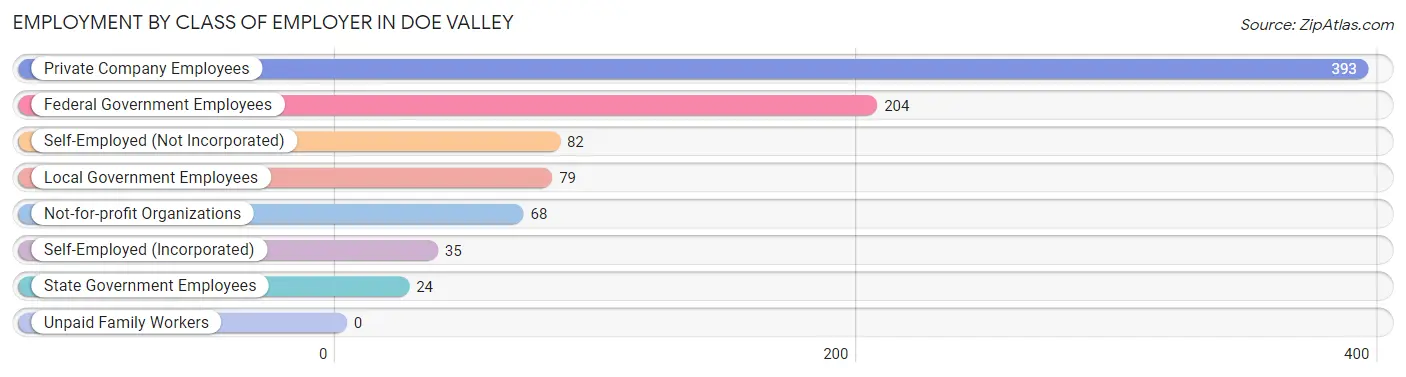
| Employer Class | # Employees | % Employees |
| Private Company Employees | 393 | 44.4% |
| Self-Employed (Incorporated) | 35 | 4.0% |
| Self-Employed (Not Incorporated) | 82 | 9.3% |
| Not-for-profit Organizations | 68 | 7.7% |
| Local Government Employees | 79 | 8.9% |
| State Government Employees | 24 | 2.7% |
| Federal Government Employees | 204 | 23.1% |
| Unpaid Family Workers | 0 | 0.0% |
| Total | 885 | 100.0% |
Employment Status by Age in Doe Valley
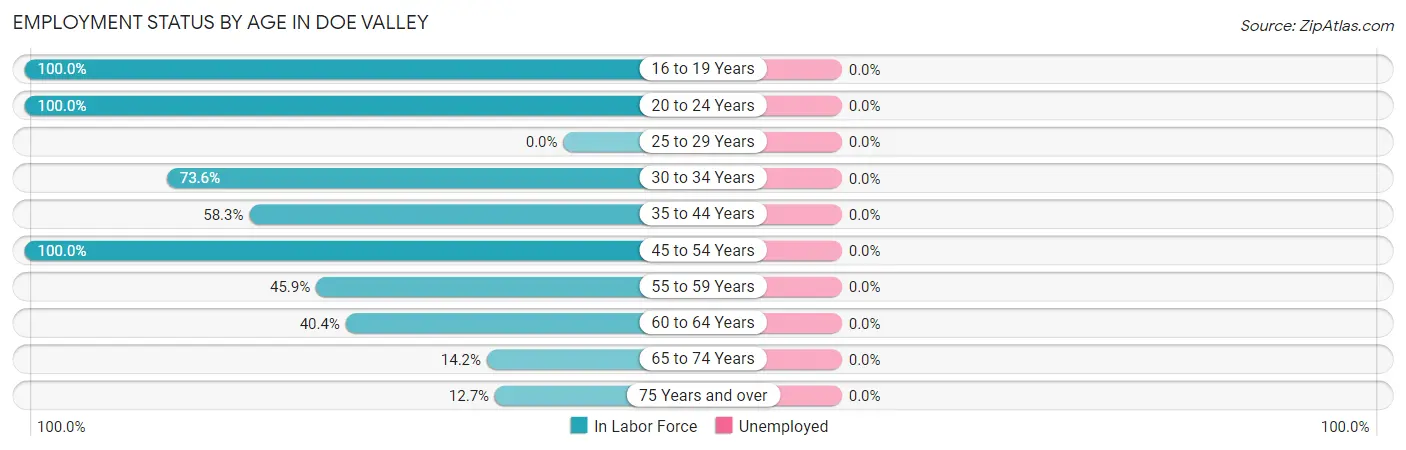
| Age Bracket | In Labor Force | Unemployed |
| 16 to 19 Years | 42 (100.0%) | 0 (0.0%) |
| 20 to 24 Years | 35 (100.0%) | 0 (0.0%) |
| 25 to 29 Years | 0 (0.0%) | 0 (0.0%) |
| 30 to 34 Years | 162 (73.6%) | 0 (0.0%) |
| 35 to 44 Years | 95 (58.3%) | 0 (0.0%) |
| 45 to 54 Years | 324 (100.0%) | 0 (0.0%) |
| 55 to 59 Years | 84 (45.9%) | 0 (0.0%) |
| 60 to 64 Years | 126 (40.4%) | 0 (0.0%) |
| 65 to 74 Years | 28 (14.2%) | 0 (0.0%) |
| 75 Years and over | 21 (12.7%) | 0 (0.0%) |
| Total | 917 (55.9%) | 0 (0.0%) |
Employment Status by Educational Attainment in Doe Valley
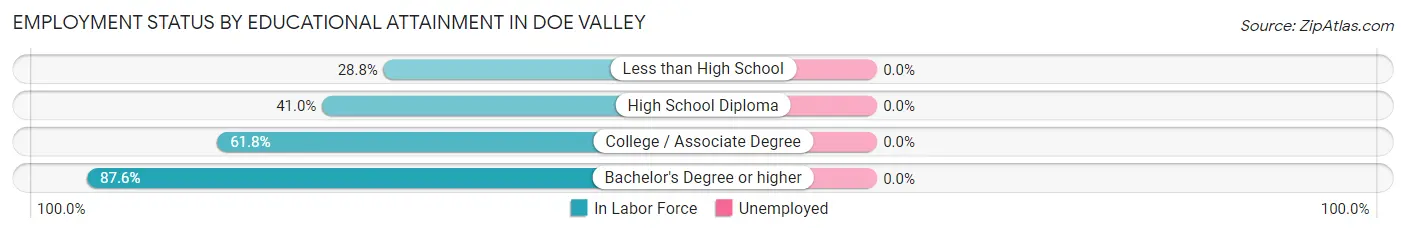
| Educational Attainment | In Labor Force | Unemployed |
| Less than High School | 15 (28.8%) | 0 (0.0%) |
| High School Diploma | 73 (41.0%) | 0 (0.0%) |
| College / Associate Degree | 356 (61.8%) | 0 (0.0%) |
| Bachelor's Degree or higher | 347 (87.6%) | 0 (0.0%) |
| Total | 791 (65.8%) | 0 (0.0%) |
Employment Occupations by Sex in Doe Valley
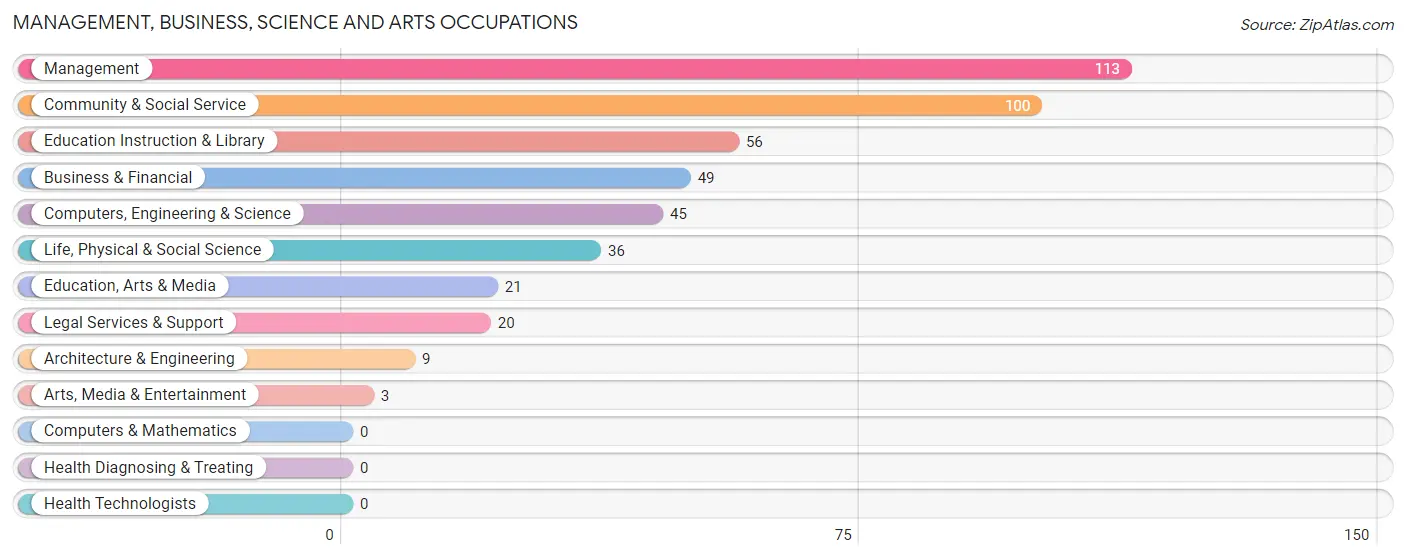
Management, Business, Science and Arts Occupations
The most common Management, Business, Science and Arts occupations in Doe Valley are Management (113 | 13.6%), Community & Social Service (100 | 12.0%), Education Instruction & Library (56 | 6.7%), Business & Financial (49 | 5.9%), and Computers, Engineering & Science (45 | 5.4%).
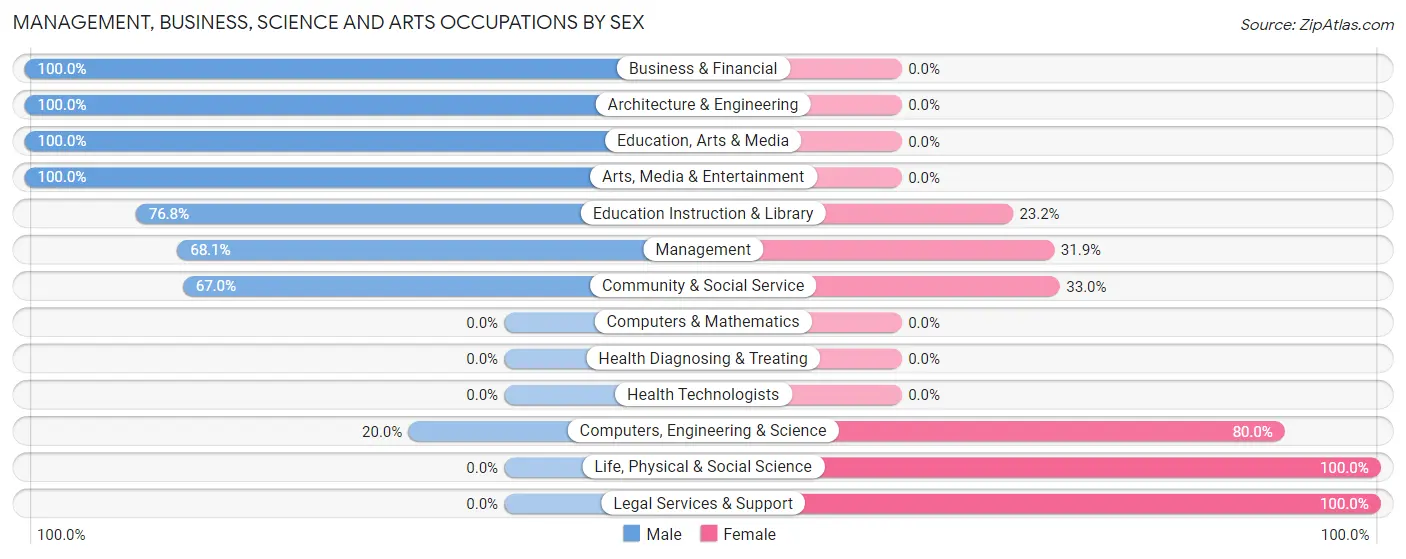
Management, Business, Science and Arts Occupations by Sex
Within the Management, Business, Science and Arts occupations in Doe Valley, the most male-oriented occupations are Business & Financial (100.0%), Architecture & Engineering (100.0%), and Education, Arts & Media (100.0%), while the most female-oriented occupations are Life, Physical & Social Science (100.0%), Legal Services & Support (100.0%), and Computers, Engineering & Science (80.0%).
| Occupation | Male | Female |
| Management | 77 (68.1%) | 36 (31.9%) |
| Business & Financial | 49 (100.0%) | 0 (0.0%) |
| Computers, Engineering & Science | 9 (20.0%) | 36 (80.0%) |
| Computers & Mathematics | 0 (0.0%) | 0 (0.0%) |
| Architecture & Engineering | 9 (100.0%) | 0 (0.0%) |
| Life, Physical & Social Science | 0 (0.0%) | 36 (100.0%) |
| Community & Social Service | 67 (67.0%) | 33 (33.0%) |
| Education, Arts & Media | 21 (100.0%) | 0 (0.0%) |
| Legal Services & Support | 0 (0.0%) | 20 (100.0%) |
| Education Instruction & Library | 43 (76.8%) | 13 (23.2%) |
| Arts, Media & Entertainment | 3 (100.0%) | 0 (0.0%) |
| Health Diagnosing & Treating | 0 (0.0%) | 0 (0.0%) |
| Health Technologists | 0 (0.0%) | 0 (0.0%) |
| Total (Category) | 202 (65.8%) | 105 (34.2%) |
| Total (Overall) | 453 (54.4%) | 379 (45.6%) |
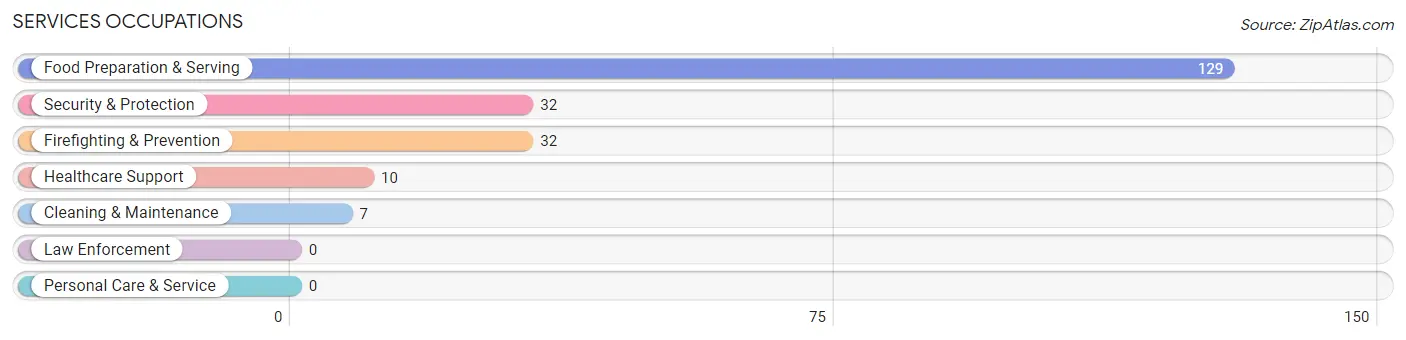
Services Occupations
The most common Services occupations in Doe Valley are Food Preparation & Serving (129 | 15.5%), Security & Protection (32 | 3.8%), Firefighting & Prevention (32 | 3.8%), Healthcare Support (10 | 1.2%), and Cleaning & Maintenance (7 | 0.8%).
Services Occupations by Sex
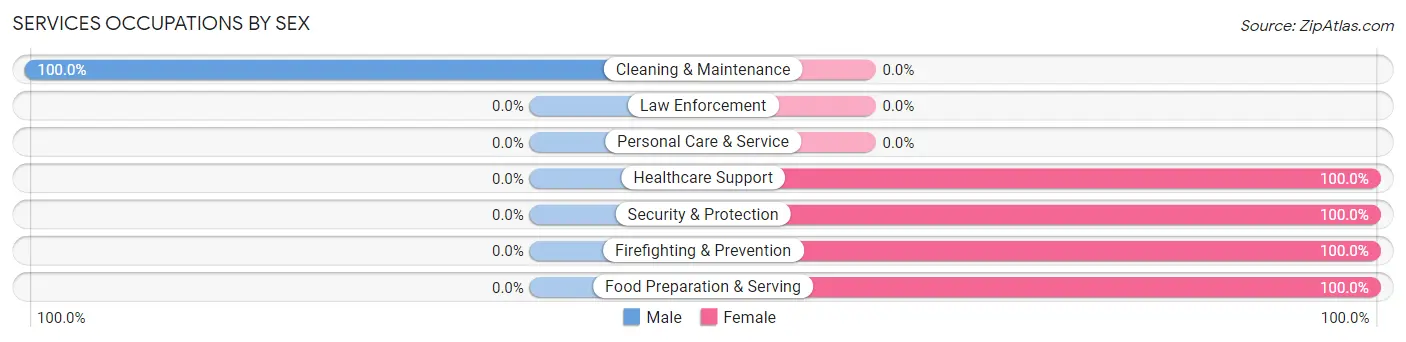
| Occupation | Male | Female |
| Healthcare Support | 0 (0.0%) | 10 (100.0%) |
| Security & Protection | 0 (0.0%) | 32 (100.0%) |
| Firefighting & Prevention | 0 (0.0%) | 32 (100.0%) |
| Law Enforcement | 0 (0.0%) | 0 (0.0%) |
| Food Preparation & Serving | 0 (0.0%) | 129 (100.0%) |
| Cleaning & Maintenance | 7 (100.0%) | 0 (0.0%) |
| Personal Care & Service | 0 (0.0%) | 0 (0.0%) |
| Total (Category) | 7 (3.9%) | 171 (96.1%) |
| Total (Overall) | 453 (54.4%) | 379 (45.6%) |
Sales and Office Occupations
The most common Sales and Office occupations in Doe Valley are Office & Administration (125 | 15.0%), and Sales & Related (69 | 8.3%).

Sales and Office Occupations by Sex
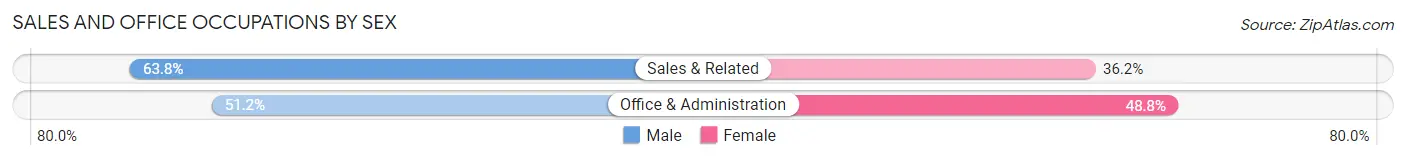
| Occupation | Male | Female |
| Sales & Related | 44 (63.8%) | 25 (36.2%) |
| Office & Administration | 64 (51.2%) | 61 (48.8%) |
| Total (Category) | 108 (55.7%) | 86 (44.3%) |
| Total (Overall) | 453 (54.4%) | 379 (45.6%) |
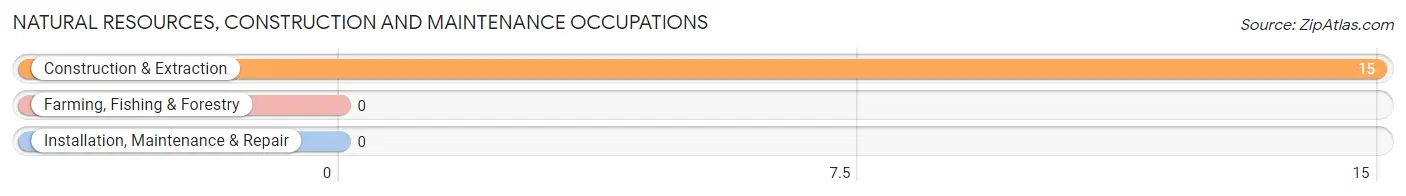
Natural Resources, Construction and Maintenance Occupations
The most common Natural Resources, Construction and Maintenance occupations in Doe Valley are , and Construction & Extraction (15 | 1.8%).
Natural Resources, Construction and Maintenance Occupations by Sex
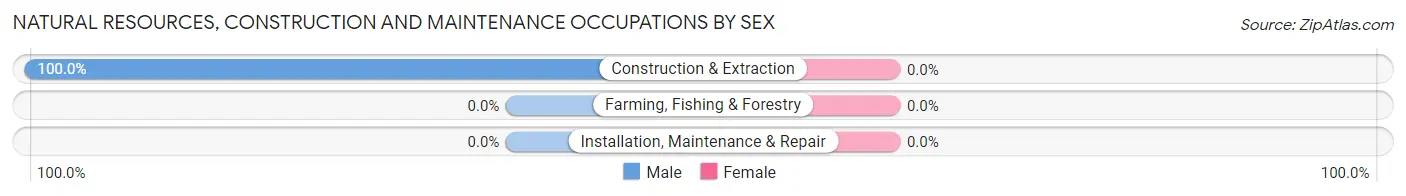
| Occupation | Male | Female |
| Farming, Fishing & Forestry | 0 (0.0%) | 0 (0.0%) |
| Construction & Extraction | 15 (100.0%) | 0 (0.0%) |
| Installation, Maintenance & Repair | 0 (0.0%) | 0 (0.0%) |
| Total (Category) | 15 (100.0%) | 0 (0.0%) |
| Total (Overall) | 453 (54.4%) | 379 (45.6%) |
Production, Transportation and Moving Occupations
The most common Production, Transportation and Moving occupations in Doe Valley are Transportation (76 | 9.1%), Material Moving (45 | 5.4%), and Production (17 | 2.0%).
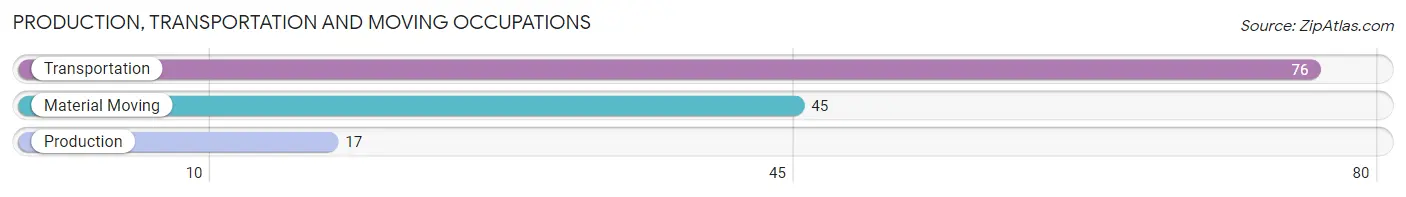
Production, Transportation and Moving Occupations by Sex
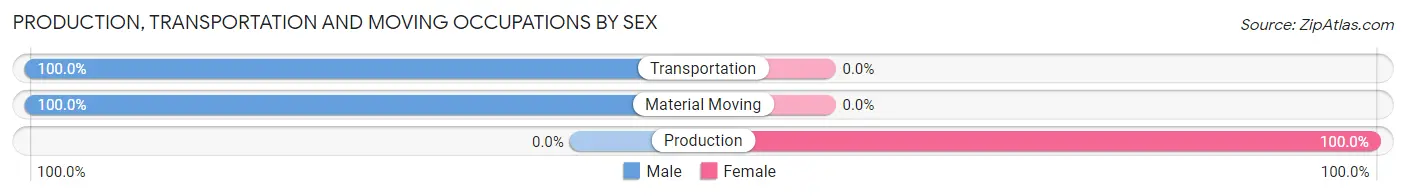
| Occupation | Male | Female |
| Production | 0 (0.0%) | 17 (100.0%) |
| Transportation | 76 (100.0%) | 0 (0.0%) |
| Material Moving | 45 (100.0%) | 0 (0.0%) |
| Total (Category) | 121 (87.7%) | 17 (12.3%) |
| Total (Overall) | 453 (54.4%) | 379 (45.6%) |
Employment Industries by Sex in Doe Valley
Employment Industries in Doe Valley
The major employment industries in Doe Valley include Accommodation & Food Services (165 | 19.8%), Educational Services (90 | 10.8%), Public Administration (87 | 10.5%), Transportation & Warehousing (76 | 9.1%), and Health Care & Social Assistance (70 | 8.4%).

Employment Industries by Sex in Doe Valley
The Doe Valley industries that see more men than women are Construction (100.0%), Wholesale Trade (100.0%), and Transportation & Warehousing (100.0%), whereas the industries that tend to have a higher number of women are Finance & Insurance (100.0%), Accommodation & Food Services (100.0%), and Arts, Entertainment & Recreation (82.1%).
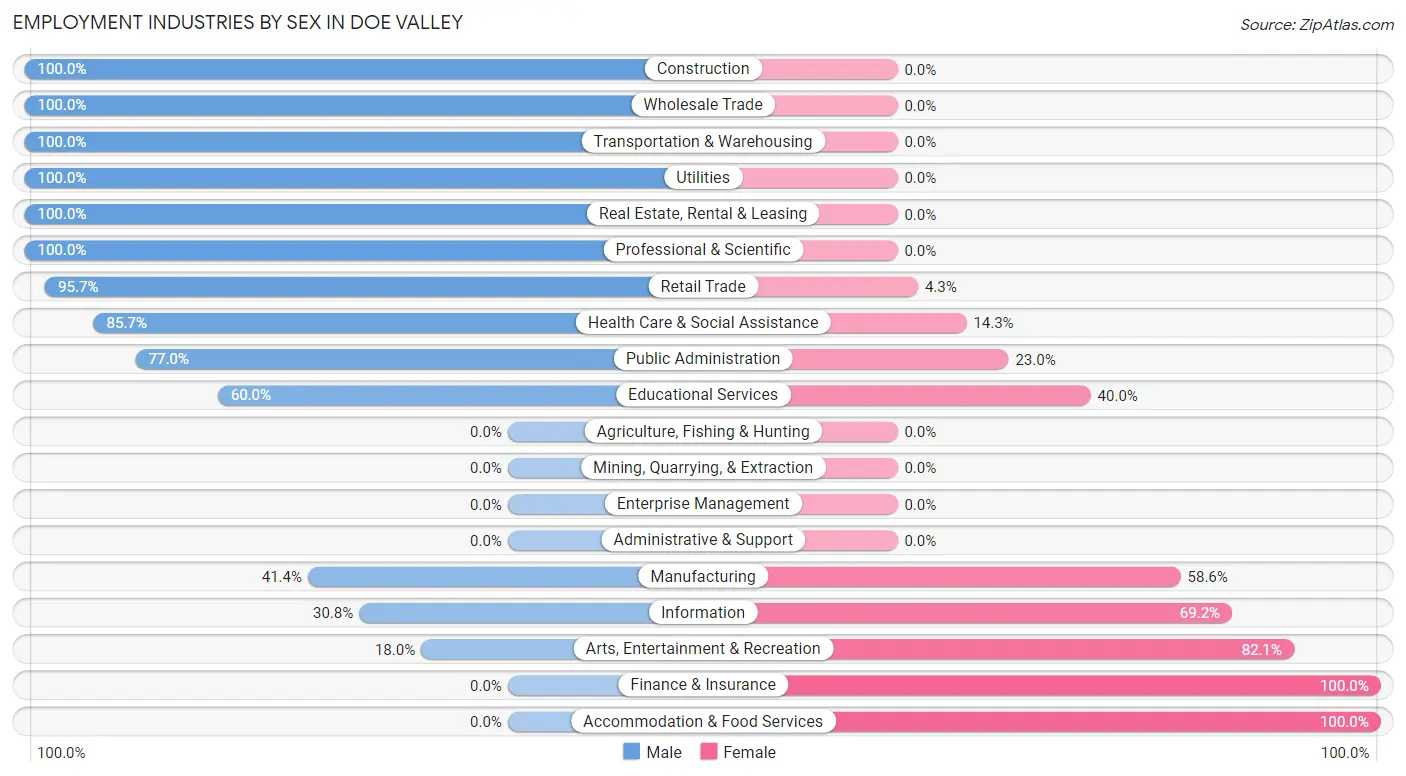
| Industry | Male | Female |
| Agriculture, Fishing & Hunting | 0 (0.0%) | 0 (0.0%) |
| Mining, Quarrying, & Extraction | 0 (0.0%) | 0 (0.0%) |
| Construction | 24 (100.0%) | 0 (0.0%) |
| Manufacturing | 12 (41.4%) | 17 (58.6%) |
| Wholesale Trade | 14 (100.0%) | 0 (0.0%) |
| Retail Trade | 45 (95.7%) | 2 (4.3%) |
| Transportation & Warehousing | 76 (100.0%) | 0 (0.0%) |
| Utilities | 47 (100.0%) | 0 (0.0%) |
| Information | 16 (30.8%) | 36 (69.2%) |
| Finance & Insurance | 0 (0.0%) | 14 (100.0%) |
| Real Estate, Rental & Leasing | 7 (100.0%) | 0 (0.0%) |
| Professional & Scientific | 3 (100.0%) | 0 (0.0%) |
| Enterprise Management | 0 (0.0%) | 0 (0.0%) |
| Administrative & Support | 0 (0.0%) | 0 (0.0%) |
| Educational Services | 54 (60.0%) | 36 (40.0%) |
| Health Care & Social Assistance | 60 (85.7%) | 10 (14.3%) |
| Arts, Entertainment & Recreation | 7 (17.9%) | 32 (82.1%) |
| Accommodation & Food Services | 0 (0.0%) | 165 (100.0%) |
| Public Administration | 67 (77.0%) | 20 (23.0%) |
| Total | 453 (54.4%) | 379 (45.6%) |
Education in Doe Valley
School Enrollment in Doe Valley
The most common levels of schooling among the 339 students in Doe Valley are college / undergraduate (127 | 37.5%), high school (71 | 20.9%), and elementary school (57 | 16.8%).
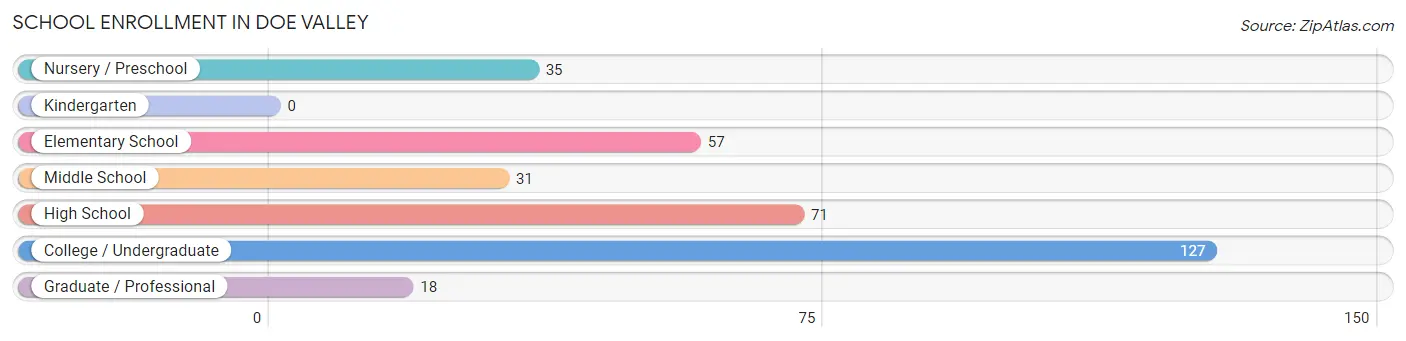
| School Level | # Students | % Students |
| Nursery / Preschool | 35 | 10.3% |
| Kindergarten | 0 | 0.0% |
| Elementary School | 57 | 16.8% |
| Middle School | 31 | 9.1% |
| High School | 71 | 20.9% |
| College / Undergraduate | 127 | 37.5% |
| Graduate / Professional | 18 | 5.3% |
| Total | 339 | 100.0% |
School Enrollment by Age by Funding Source in Doe Valley
Out of a total of 339 students who are enrolled in schools in Doe Valley, 34 (10.0%) attend a private institution, while the remaining 305 (90.0%) are enrolled in public schools. The age group of 35 years and over has the highest likelihood of being enrolled in private schools, with 34 (65.4% in the age bracket) enrolled. Conversely, the age group of 3 to 4 year olds has the lowest likelihood of being enrolled in a private school, with 10 (100.0% in the age bracket) attending a public institution.
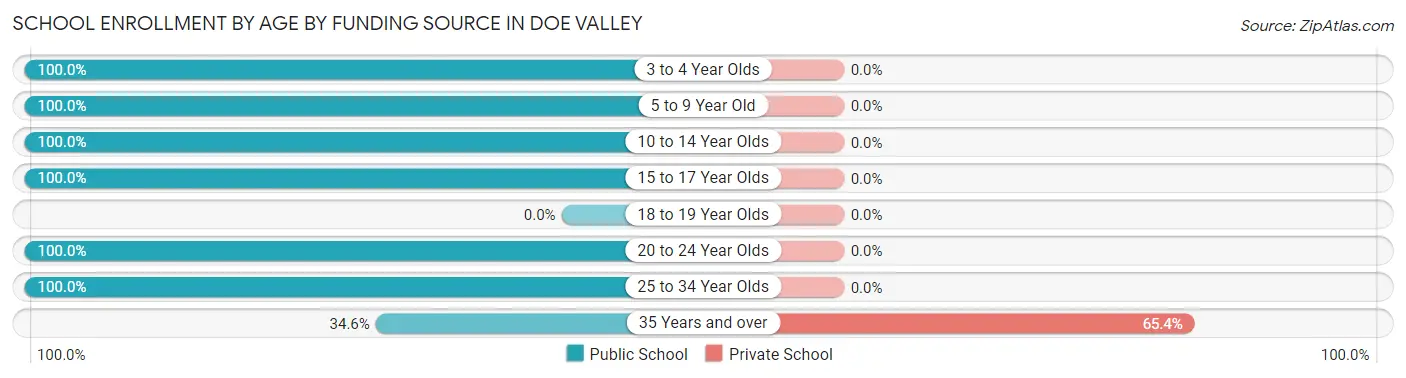
| Age Bracket | Public School | Private School |
| 3 to 4 Year Olds | 10 (100.0%) | 0 (0.0%) |
| 5 to 9 Year Old | 82 (100.0%) | 0 (0.0%) |
| 10 to 14 Year Olds | 31 (100.0%) | 0 (0.0%) |
| 15 to 17 Year Olds | 71 (100.0%) | 0 (0.0%) |
| 18 to 19 Year Olds | 0 (0.0%) | 0 (0.0%) |
| 20 to 24 Year Olds | 35 (100.0%) | 0 (0.0%) |
| 25 to 34 Year Olds | 58 (100.0%) | 0 (0.0%) |
| 35 Years and over | 18 (34.6%) | 34 (65.4%) |
| Total | 305 (90.0%) | 34 (10.0%) |
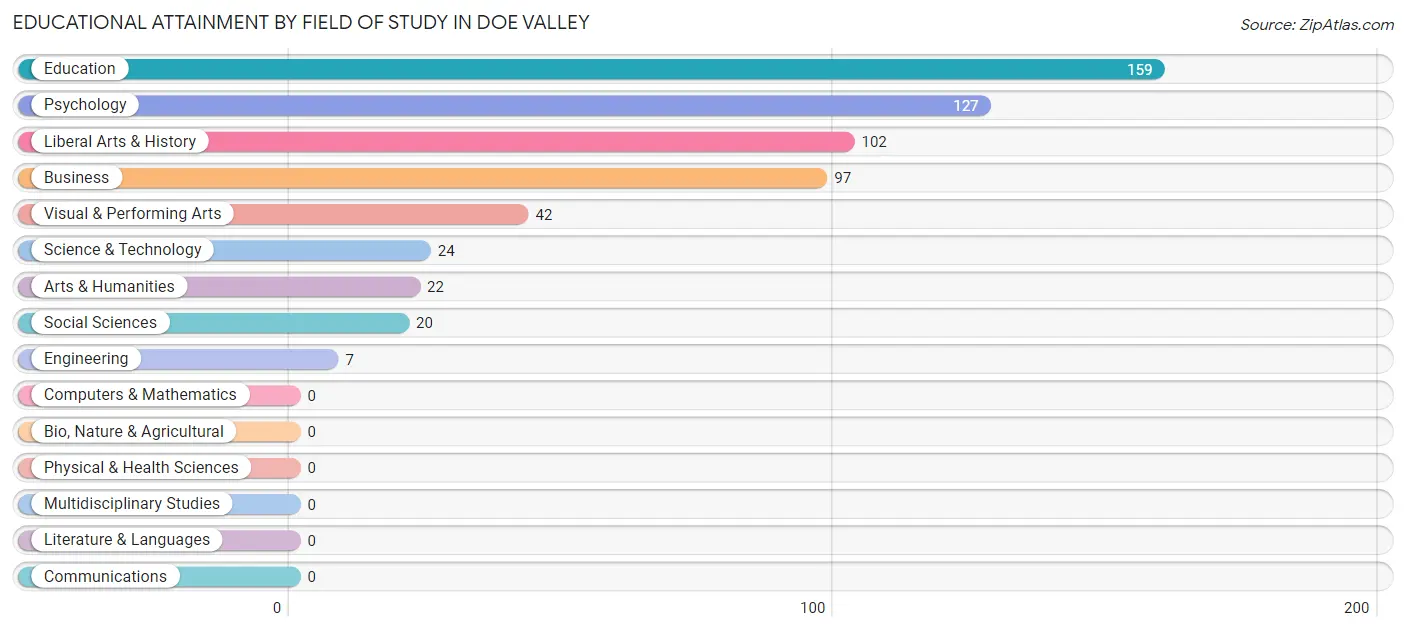
Educational Attainment by Field of Study in Doe Valley
Education (159 | 26.5%), psychology (127 | 21.2%), liberal arts & history (102 | 17.0%), business (97 | 16.2%), and visual & performing arts (42 | 7.0%) are the most common fields of study among 600 individuals in Doe Valley who have obtained a bachelor's degree or higher.
| Field of Study | # Graduates | % Graduates |
| Computers & Mathematics | 0 | 0.0% |
| Bio, Nature & Agricultural | 0 | 0.0% |
| Physical & Health Sciences | 0 | 0.0% |
| Psychology | 127 | 21.2% |
| Social Sciences | 20 | 3.3% |
| Engineering | 7 | 1.2% |
| Multidisciplinary Studies | 0 | 0.0% |
| Science & Technology | 24 | 4.0% |
| Business | 97 | 16.2% |
| Education | 159 | 26.5% |
| Literature & Languages | 0 | 0.0% |
| Liberal Arts & History | 102 | 17.0% |
| Visual & Performing Arts | 42 | 7.0% |
| Communications | 0 | 0.0% |
| Arts & Humanities | 22 | 3.7% |
| Total | 600 | 100.0% |
Transportation & Commute in Doe Valley
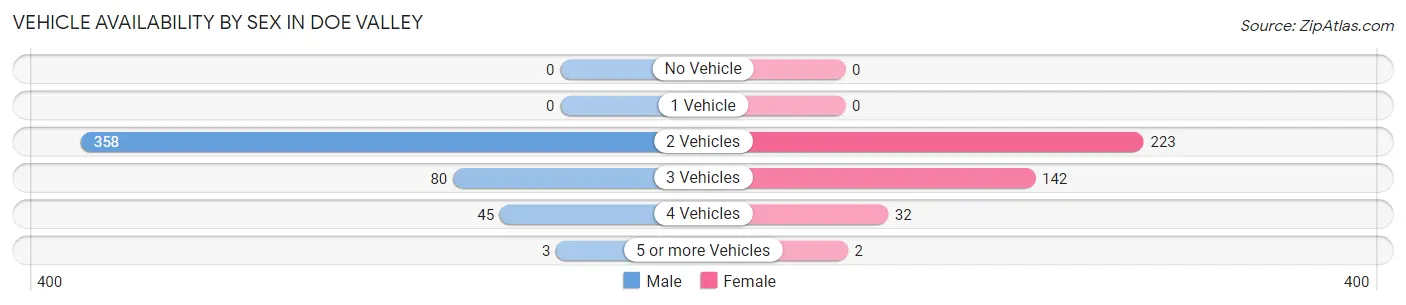
Vehicle Availability by Sex in Doe Valley
The most prevalent vehicle ownership categories in Doe Valley are males with 2 vehicles (358, accounting for 73.7%) and females with 2 vehicles (223, making up 89.7%).
| Vehicles Available | Male | Female |
| No Vehicle | 0 (0.0%) | 0 (0.0%) |
| 1 Vehicle | 0 (0.0%) | 0 (0.0%) |
| 2 Vehicles | 358 (73.7%) | 223 (55.9%) |
| 3 Vehicles | 80 (16.5%) | 142 (35.6%) |
| 4 Vehicles | 45 (9.3%) | 32 (8.0%) |
| 5 or more Vehicles | 3 (0.6%) | 2 (0.5%) |
| Total | 486 (100.0%) | 399 (100.0%) |
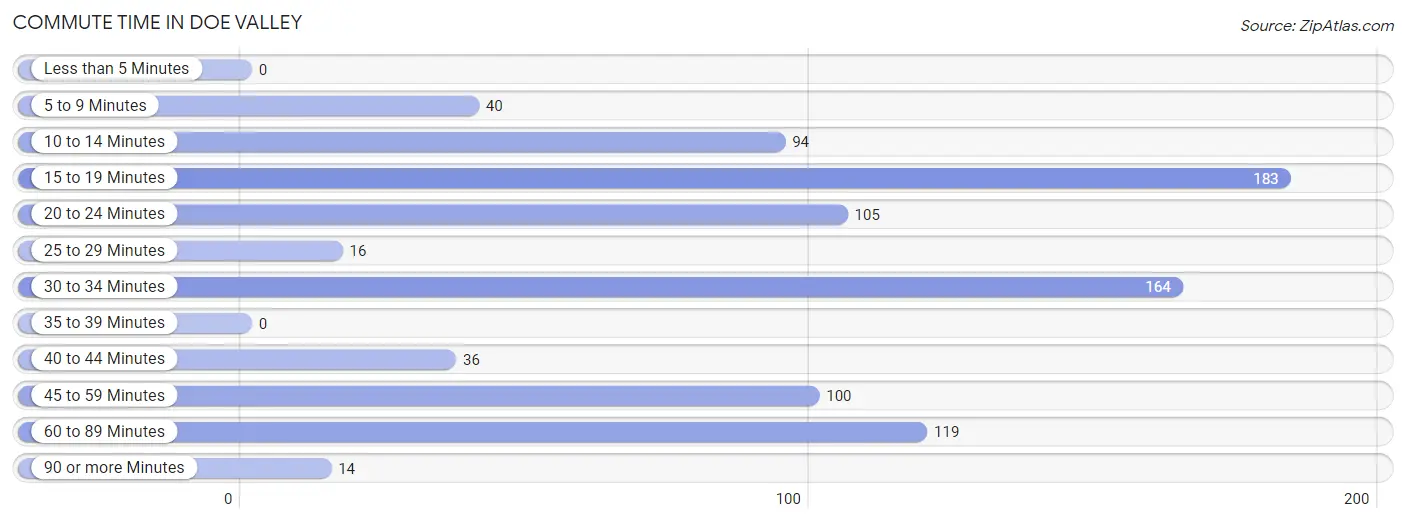
Commute Time in Doe Valley
The most frequently occuring commute durations in Doe Valley are 15 to 19 minutes (183 commuters, 21.0%), 30 to 34 minutes (164 commuters, 18.8%), and 60 to 89 minutes (119 commuters, 13.7%).
| Commute Time | # Commuters | % Commuters |
| Less than 5 Minutes | 0 | 0.0% |
| 5 to 9 Minutes | 40 | 4.6% |
| 10 to 14 Minutes | 94 | 10.8% |
| 15 to 19 Minutes | 183 | 21.0% |
| 20 to 24 Minutes | 105 | 12.1% |
| 25 to 29 Minutes | 16 | 1.8% |
| 30 to 34 Minutes | 164 | 18.8% |
| 35 to 39 Minutes | 0 | 0.0% |
| 40 to 44 Minutes | 36 | 4.1% |
| 45 to 59 Minutes | 100 | 11.5% |
| 60 to 89 Minutes | 119 | 13.7% |
| 90 or more Minutes | 14 | 1.6% |
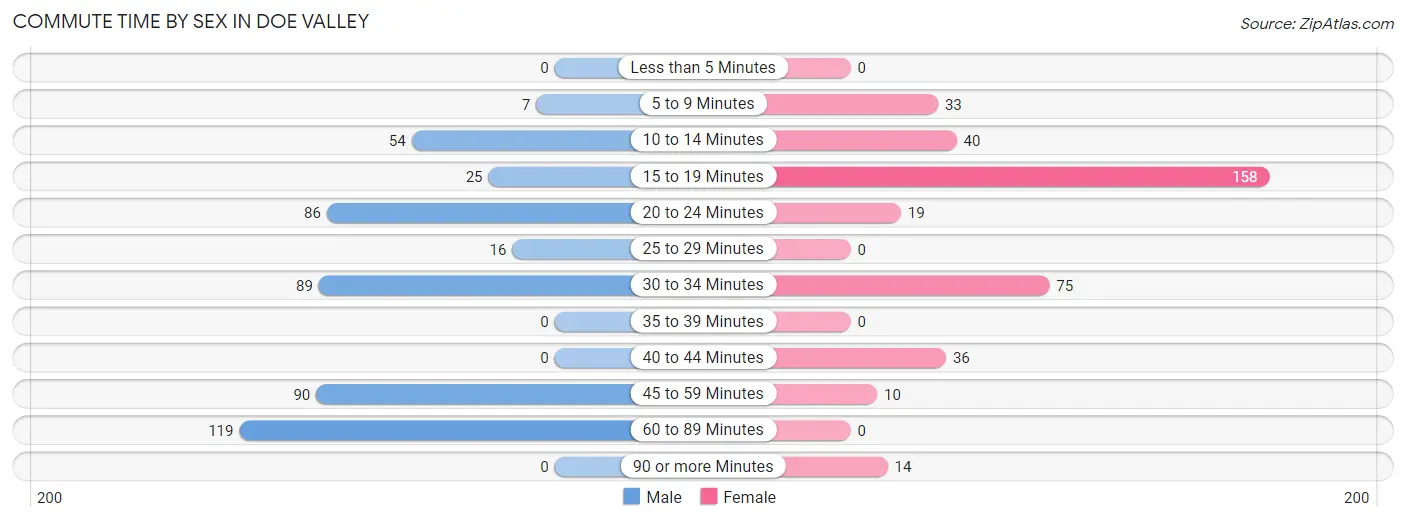
Commute Time by Sex in Doe Valley
The most common commute times in Doe Valley are 60 to 89 minutes (119 commuters, 24.5%) for males and 15 to 19 minutes (158 commuters, 41.0%) for females.
| Commute Time | Male | Female |
| Less than 5 Minutes | 0 (0.0%) | 0 (0.0%) |
| 5 to 9 Minutes | 7 (1.4%) | 33 (8.6%) |
| 10 to 14 Minutes | 54 (11.1%) | 40 (10.4%) |
| 15 to 19 Minutes | 25 (5.1%) | 158 (41.0%) |
| 20 to 24 Minutes | 86 (17.7%) | 19 (4.9%) |
| 25 to 29 Minutes | 16 (3.3%) | 0 (0.0%) |
| 30 to 34 Minutes | 89 (18.3%) | 75 (19.5%) |
| 35 to 39 Minutes | 0 (0.0%) | 0 (0.0%) |
| 40 to 44 Minutes | 0 (0.0%) | 36 (9.3%) |
| 45 to 59 Minutes | 90 (18.5%) | 10 (2.6%) |
| 60 to 89 Minutes | 119 (24.5%) | 0 (0.0%) |
| 90 or more Minutes | 0 (0.0%) | 14 (3.6%) |
Time of Departure to Work by Sex in Doe Valley
The most frequent times of departure to work in Doe Valley are 7:00 AM to 7:29 AM (168, 34.6%) for males and 6:30 AM to 6:59 AM (89, 23.1%) for females.
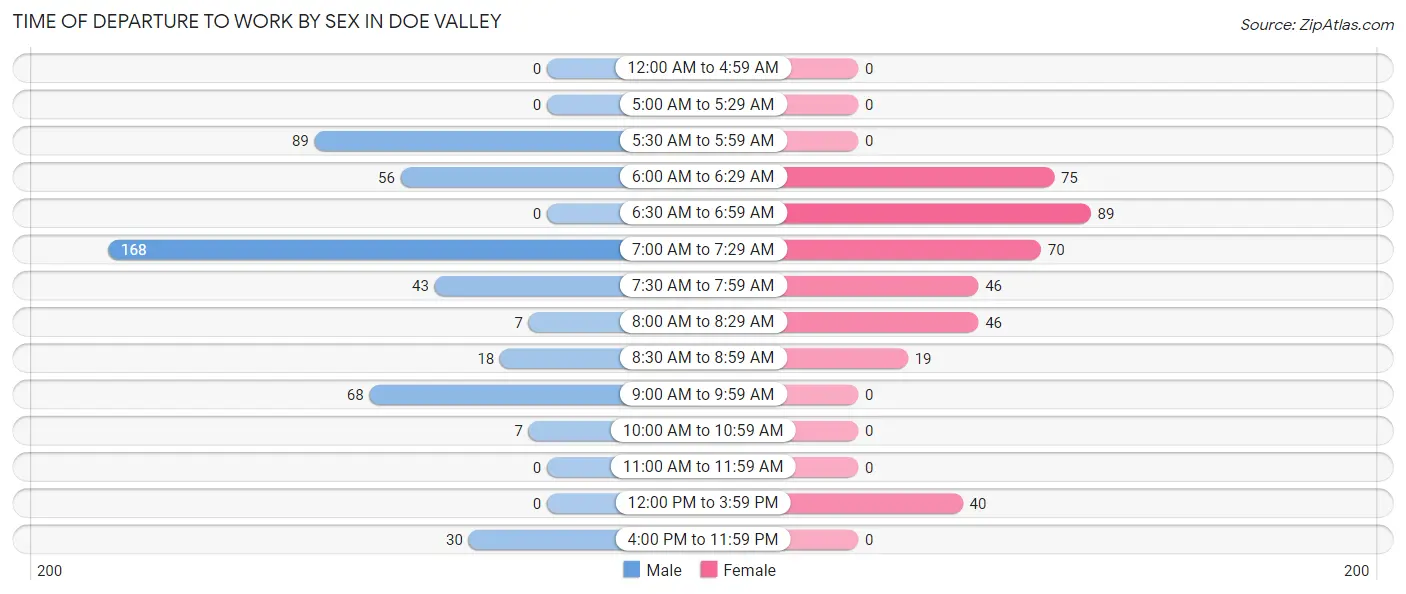
| Time of Departure | Male | Female |
| 12:00 AM to 4:59 AM | 0 (0.0%) | 0 (0.0%) |
| 5:00 AM to 5:29 AM | 0 (0.0%) | 0 (0.0%) |
| 5:30 AM to 5:59 AM | 89 (18.3%) | 0 (0.0%) |
| 6:00 AM to 6:29 AM | 56 (11.5%) | 75 (19.5%) |
| 6:30 AM to 6:59 AM | 0 (0.0%) | 89 (23.1%) |
| 7:00 AM to 7:29 AM | 168 (34.6%) | 70 (18.2%) |
| 7:30 AM to 7:59 AM | 43 (8.8%) | 46 (11.9%) |
| 8:00 AM to 8:29 AM | 7 (1.4%) | 46 (11.9%) |
| 8:30 AM to 8:59 AM | 18 (3.7%) | 19 (4.9%) |
| 9:00 AM to 9:59 AM | 68 (14.0%) | 0 (0.0%) |
| 10:00 AM to 10:59 AM | 7 (1.4%) | 0 (0.0%) |
| 11:00 AM to 11:59 AM | 0 (0.0%) | 0 (0.0%) |
| 12:00 PM to 3:59 PM | 0 (0.0%) | 40 (10.4%) |
| 4:00 PM to 11:59 PM | 30 (6.2%) | 0 (0.0%) |
| Total | 486 (100.0%) | 385 (100.0%) |
Housing Occupancy in Doe Valley
Occupancy by Ownership in Doe Valley
Of the total 736 dwellings in Doe Valley, owner-occupied units account for 736 (100.0%), while renter-occupied units make up 0 (0.0%).
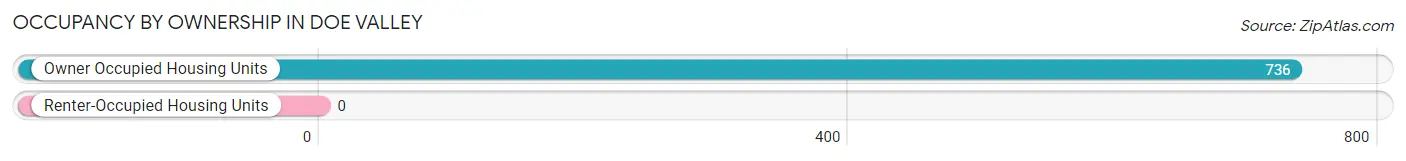
| Occupancy | # Housing Units | % Housing Units |
| Owner Occupied Housing Units | 736 | 100.0% |
| Renter-Occupied Housing Units | 0 | 0.0% |
| Total Occupied Housing Units | 736 | 100.0% |
Occupancy by Household Size in Doe Valley
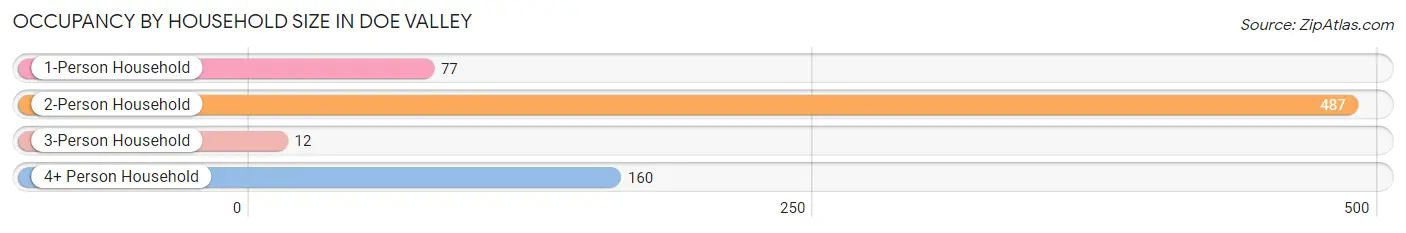
| Household Size | # Housing Units | % Housing Units |
| 1-Person Household | 77 | 10.5% |
| 2-Person Household | 487 | 66.2% |
| 3-Person Household | 12 | 1.6% |
| 4+ Person Household | 160 | 21.7% |
| Total Housing Units | 736 | 100.0% |
Occupancy by Ownership by Household Size in Doe Valley
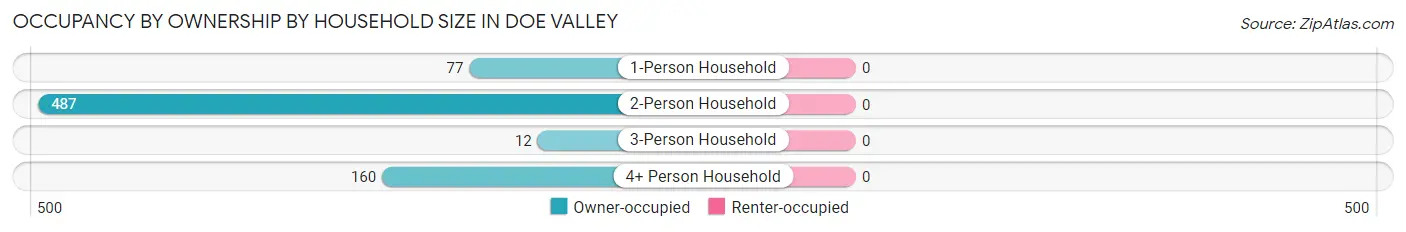
| Household Size | Owner-occupied | Renter-occupied |
| 1-Person Household | 77 (100.0%) | 0 (0.0%) |
| 2-Person Household | 487 (100.0%) | 0 (0.0%) |
| 3-Person Household | 12 (100.0%) | 0 (0.0%) |
| 4+ Person Household | 160 (100.0%) | 0 (0.0%) |
| Total Housing Units | 736 (100.0%) | 0 (0.0%) |
Occupancy by Educational Attainment in Doe Valley
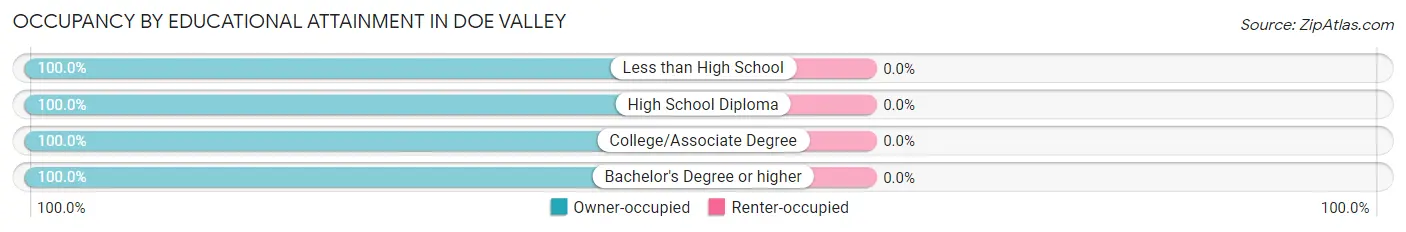
| Household Size | Owner-occupied | Renter-occupied |
| Less than High School | 25 (100.0%) | 0 (0.0%) |
| High School Diploma | 188 (100.0%) | 0 (0.0%) |
| College/Associate Degree | 236 (100.0%) | 0 (0.0%) |
| Bachelor's Degree or higher | 287 (100.0%) | 0 (0.0%) |
Occupancy by Age of Householder in Doe Valley
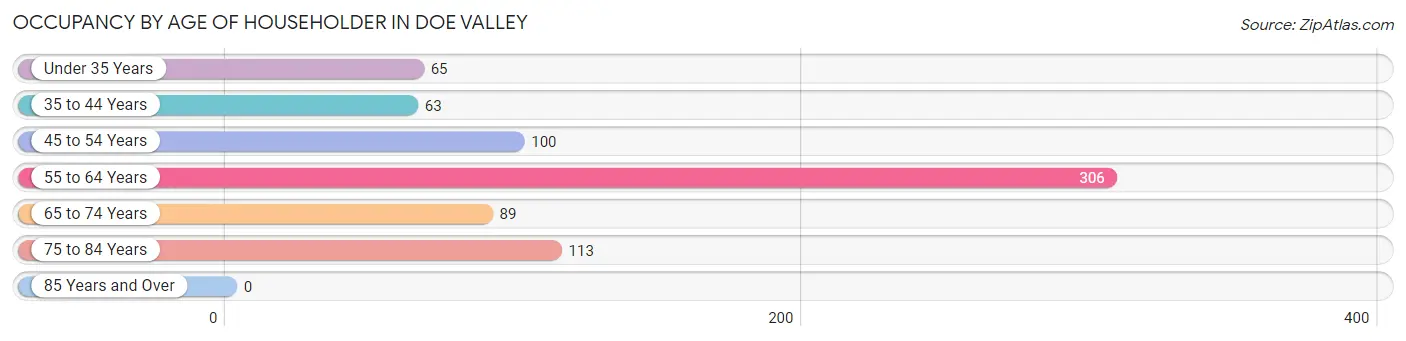
| Age Bracket | # Households | % Households |
| Under 35 Years | 65 | 8.8% |
| 35 to 44 Years | 63 | 8.6% |
| 45 to 54 Years | 100 | 13.6% |
| 55 to 64 Years | 306 | 41.6% |
| 65 to 74 Years | 89 | 12.1% |
| 75 to 84 Years | 113 | 15.3% |
| 85 Years and Over | 0 | 0.0% |
| Total | 736 | 100.0% |
Housing Finances in Doe Valley
Median Income by Occupancy in Doe Valley
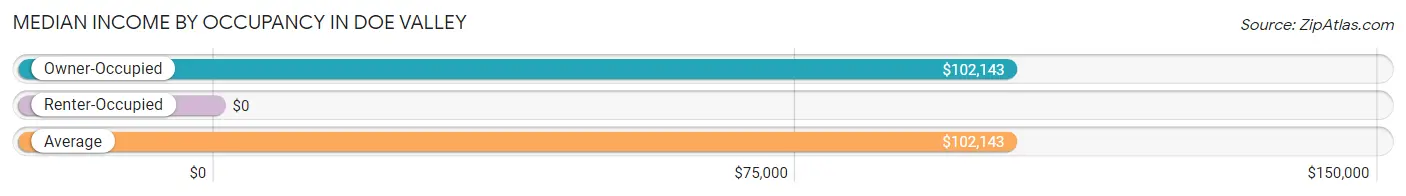
| Occupancy Type | # Households | Median Income |
| Owner-Occupied | 736 (100.0%) | $102,143 |
| Renter-Occupied | 0 (0.0%) | $0 |
| Average | 736 (100.0%) | $102,143 |
Occupancy by Householder Income Bracket in Doe Valley
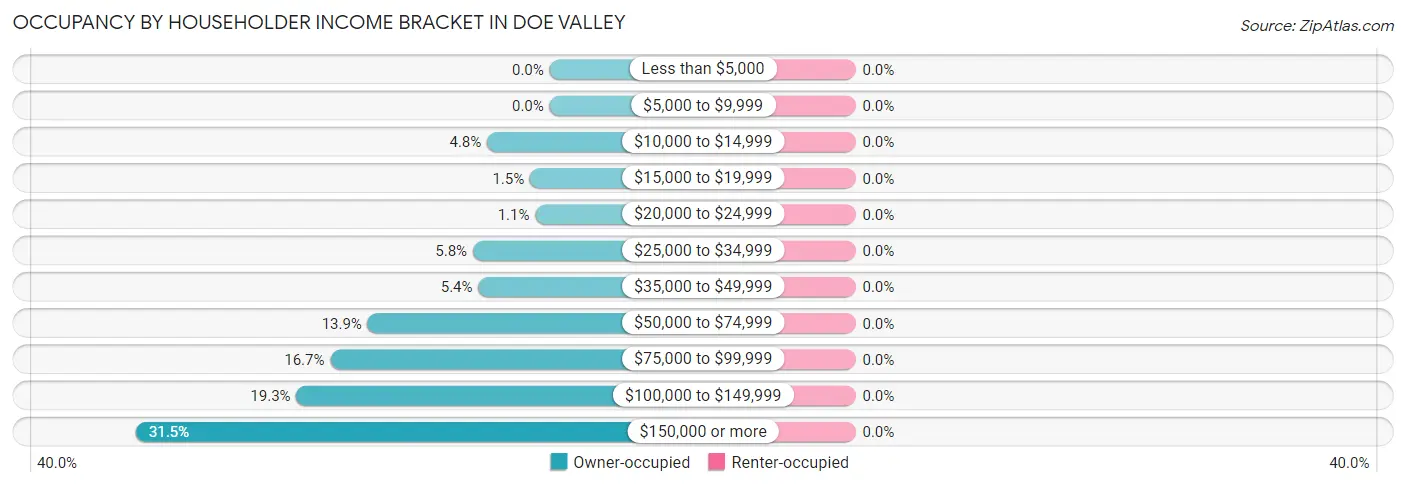
| Income Bracket | Owner-occupied | Renter-occupied |
| Less than $5,000 | 0 (0.0%) | 0 (0.0%) |
| $5,000 to $9,999 | 0 (0.0%) | 0 (0.0%) |
| $10,000 to $14,999 | 35 (4.8%) | 0 (0.0%) |
| $15,000 to $19,999 | 11 (1.5%) | 0 (0.0%) |
| $20,000 to $24,999 | 8 (1.1%) | 0 (0.0%) |
| $25,000 to $34,999 | 43 (5.8%) | 0 (0.0%) |
| $35,000 to $49,999 | 40 (5.4%) | 0 (0.0%) |
| $50,000 to $74,999 | 102 (13.9%) | 0 (0.0%) |
| $75,000 to $99,999 | 123 (16.7%) | 0 (0.0%) |
| $100,000 to $149,999 | 142 (19.3%) | 0 (0.0%) |
| $150,000 or more | 232 (31.5%) | 0 (0.0%) |
| Total | 736 (100.0%) | 0 (0.0%) |
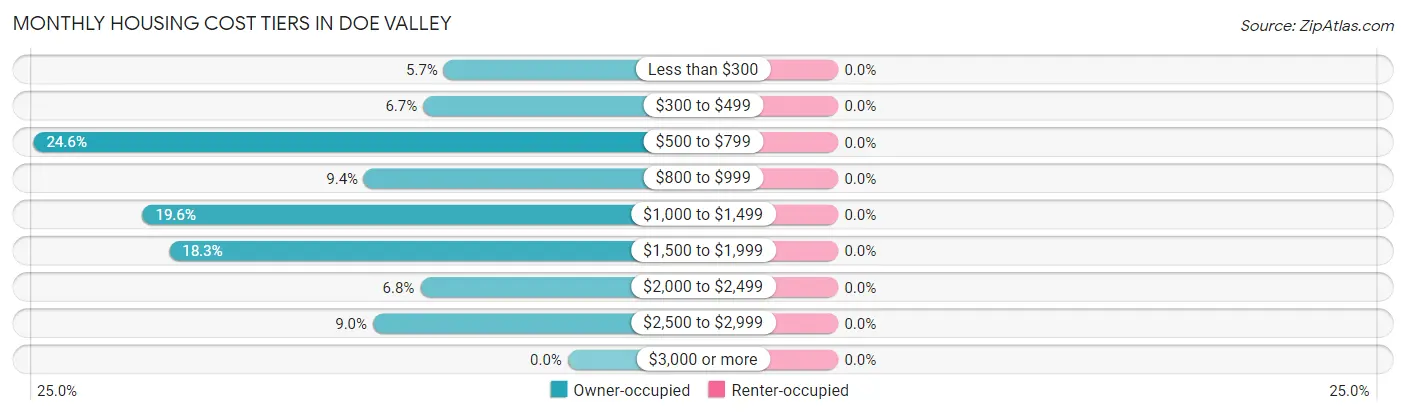
Monthly Housing Cost Tiers in Doe Valley
| Monthly Cost | Owner-occupied | Renter-occupied |
| Less than $300 | 42 (5.7%) | 0 (0.0%) |
| $300 to $499 | 49 (6.7%) | 0 (0.0%) |
| $500 to $799 | 181 (24.6%) | 0 (0.0%) |
| $800 to $999 | 69 (9.4%) | 0 (0.0%) |
| $1,000 to $1,499 | 144 (19.6%) | 0 (0.0%) |
| $1,500 to $1,999 | 135 (18.3%) | 0 (0.0%) |
| $2,000 to $2,499 | 50 (6.8%) | 0 (0.0%) |
| $2,500 to $2,999 | 66 (9.0%) | 0 (0.0%) |
| $3,000 or more | 0 (0.0%) | 0 (0.0%) |
| Total | 736 (100.0%) | 0 (0.0%) |
Physical Housing Characteristics in Doe Valley
Housing Structures in Doe Valley
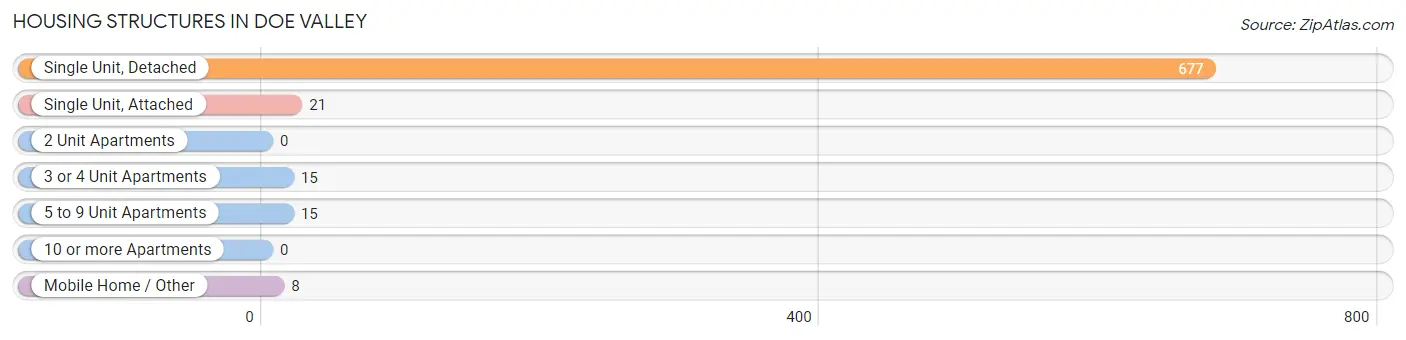
| Structure Type | # Housing Units | % Housing Units |
| Single Unit, Detached | 677 | 92.0% |
| Single Unit, Attached | 21 | 2.9% |
| 2 Unit Apartments | 0 | 0.0% |
| 3 or 4 Unit Apartments | 15 | 2.0% |
| 5 to 9 Unit Apartments | 15 | 2.0% |
| 10 or more Apartments | 0 | 0.0% |
| Mobile Home / Other | 8 | 1.1% |
| Total | 736 | 100.0% |
Housing Structures by Occupancy in Doe Valley
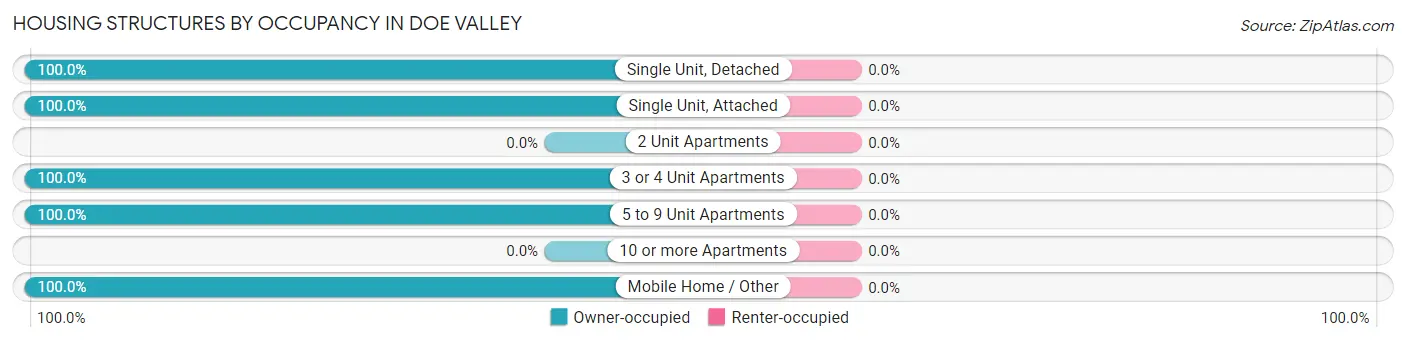
| Structure Type | Owner-occupied | Renter-occupied |
| Single Unit, Detached | 677 (100.0%) | 0 (0.0%) |
| Single Unit, Attached | 21 (100.0%) | 0 (0.0%) |
| 2 Unit Apartments | 0 (0.0%) | 0 (0.0%) |
| 3 or 4 Unit Apartments | 15 (100.0%) | 0 (0.0%) |
| 5 to 9 Unit Apartments | 15 (100.0%) | 0 (0.0%) |
| 10 or more Apartments | 0 (0.0%) | 0 (0.0%) |
| Mobile Home / Other | 8 (100.0%) | 0 (0.0%) |
| Total | 736 (100.0%) | 0 (0.0%) |
Housing Structures by Number of Rooms in Doe Valley
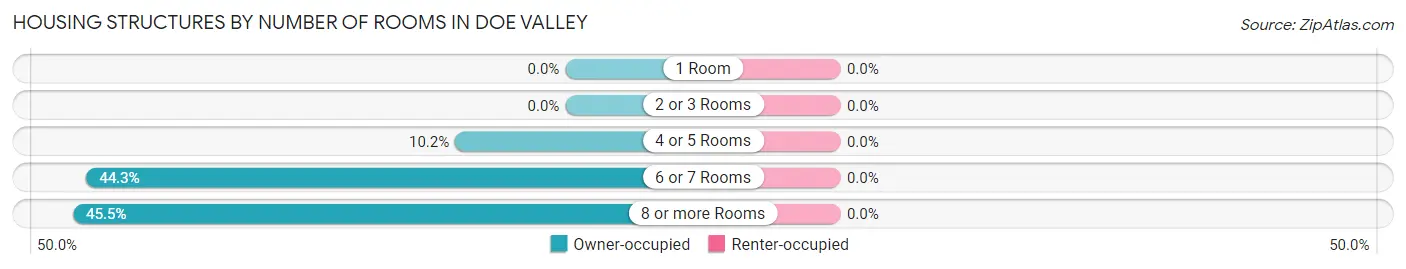
| Number of Rooms | Owner-occupied | Renter-occupied |
| 1 Room | 0 (0.0%) | 0 (0.0%) |
| 2 or 3 Rooms | 0 (0.0%) | 0 (0.0%) |
| 4 or 5 Rooms | 75 (10.2%) | 0 (0.0%) |
| 6 or 7 Rooms | 326 (44.3%) | 0 (0.0%) |
| 8 or more Rooms | 335 (45.5%) | 0 (0.0%) |
| Total | 736 (100.0%) | 0 (0.0%) |
Housing Structure by Heating Type in Doe Valley
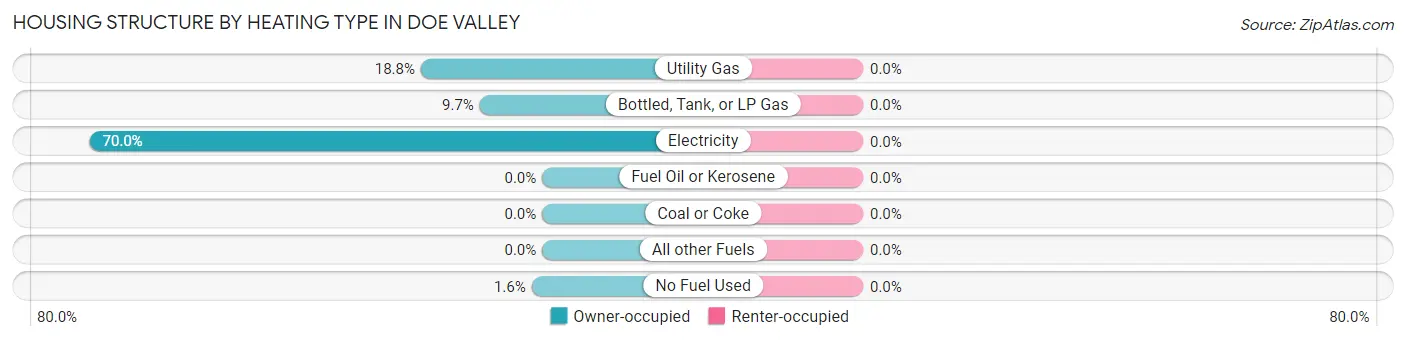
| Heating Type | Owner-occupied | Renter-occupied |
| Utility Gas | 138 (18.8%) | 0 (0.0%) |
| Bottled, Tank, or LP Gas | 71 (9.7%) | 0 (0.0%) |
| Electricity | 515 (70.0%) | 0 (0.0%) |
| Fuel Oil or Kerosene | 0 (0.0%) | 0 (0.0%) |
| Coal or Coke | 0 (0.0%) | 0 (0.0%) |
| All other Fuels | 0 (0.0%) | 0 (0.0%) |
| No Fuel Used | 12 (1.6%) | 0 (0.0%) |
| Total | 736 (100.0%) | 0 (0.0%) |
Household Vehicle Usage in Doe Valley
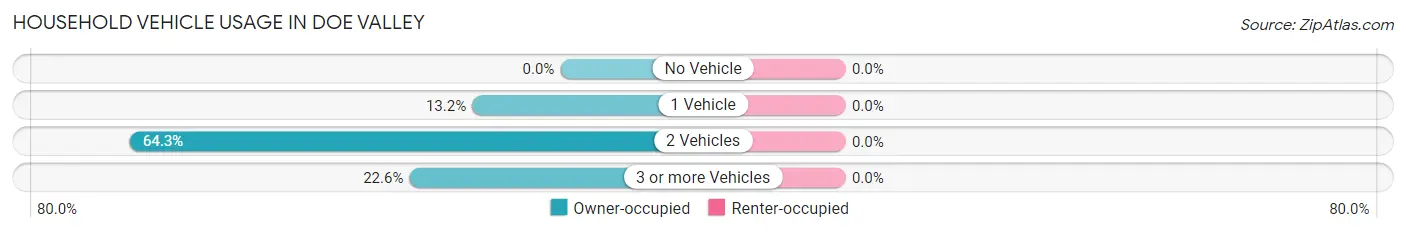
| Vehicles per Household | Owner-occupied | Renter-occupied |
| No Vehicle | 0 (0.0%) | 0 (0.0%) |
| 1 Vehicle | 97 (13.2%) | 0 (0.0%) |
| 2 Vehicles | 473 (64.3%) | 0 (0.0%) |
| 3 or more Vehicles | 166 (22.6%) | 0 (0.0%) |
| Total | 736 (100.0%) | 0 (0.0%) |
Real Estate & Mortgages in Doe Valley
Real Estate and Mortgage Overview in Doe Valley
| Characteristic | Without Mortgage | With Mortgage |
| Housing Units | 287 | 449 |
| Median Property Value | $327,200 | $249,000 |
| Median Household Income | - | - |
| Monthly Housing Costs | $611 | $0 |
| Real Estate Taxes | $2,153 | $0 |
Property Value by Mortgage Status in Doe Valley
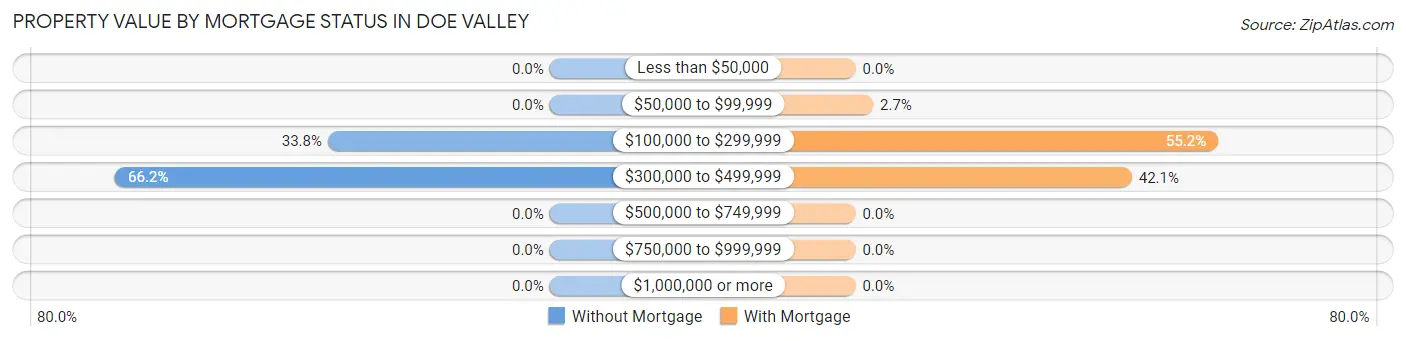
| Property Value | Without Mortgage | With Mortgage |
| Less than $50,000 | 0 (0.0%) | 0 (0.0%) |
| $50,000 to $99,999 | 0 (0.0%) | 12 (2.7%) |
| $100,000 to $299,999 | 97 (33.8%) | 248 (55.2%) |
| $300,000 to $499,999 | 190 (66.2%) | 189 (42.1%) |
| $500,000 to $749,999 | 0 (0.0%) | 0 (0.0%) |
| $750,000 to $999,999 | 0 (0.0%) | 0 (0.0%) |
| $1,000,000 or more | 0 (0.0%) | 0 (0.0%) |
| Total | 287 (100.0%) | 449 (100.0%) |
Household Income by Mortgage Status in Doe Valley
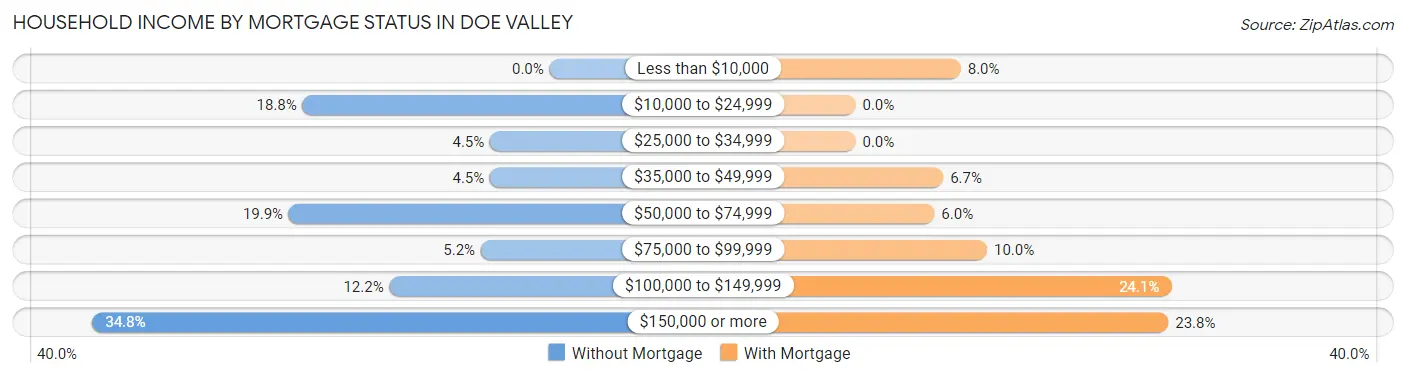
| Household Income | Without Mortgage | With Mortgage |
| Less than $10,000 | 0 (0.0%) | 36 (8.0%) |
| $10,000 to $24,999 | 54 (18.8%) | 0 (0.0%) |
| $25,000 to $34,999 | 13 (4.5%) | 0 (0.0%) |
| $35,000 to $49,999 | 13 (4.5%) | 30 (6.7%) |
| $50,000 to $74,999 | 57 (19.9%) | 27 (6.0%) |
| $75,000 to $99,999 | 15 (5.2%) | 45 (10.0%) |
| $100,000 to $149,999 | 35 (12.2%) | 108 (24.0%) |
| $150,000 or more | 100 (34.8%) | 107 (23.8%) |
| Total | 287 (100.0%) | 449 (100.0%) |
Property Value to Household Income Ratio in Doe Valley
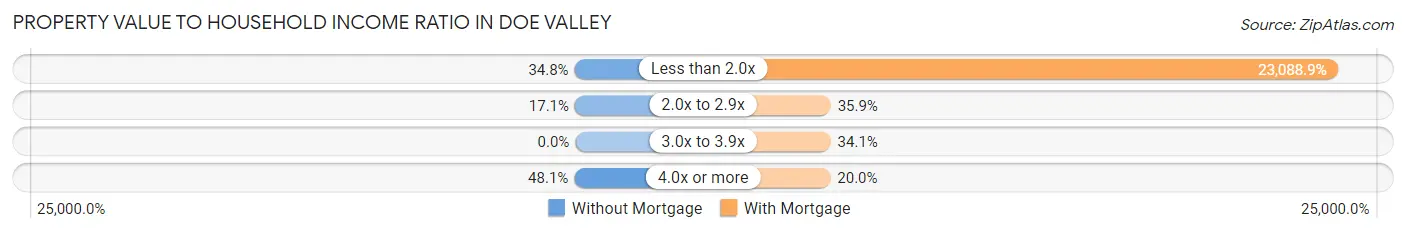
| Value-to-Income Ratio | Without Mortgage | With Mortgage |
| Less than 2.0x | 100 (34.8%) | 103,669 (23,088.9%) |
| 2.0x to 2.9x | 49 (17.1%) | 161 (35.9%) |
| 3.0x to 3.9x | 0 (0.0%) | 153 (34.1%) |
| 4.0x or more | 138 (48.1%) | 90 (20.0%) |
| Total | 287 (100.0%) | 449 (100.0%) |
Real Estate Taxes by Mortgage Status in Doe Valley
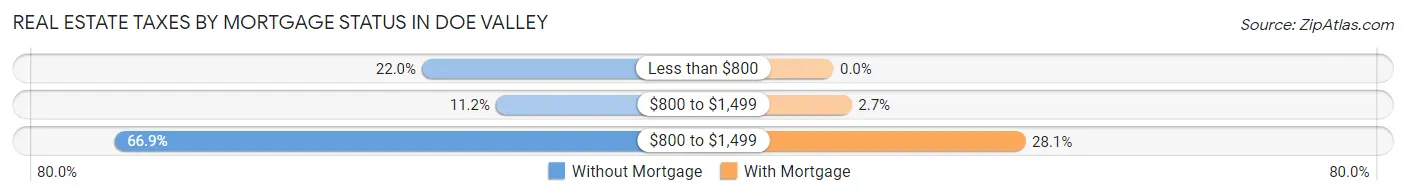
| Property Taxes | Without Mortgage | With Mortgage |
| Less than $800 | 63 (22.0%) | 0 (0.0%) |
| $800 to $1,499 | 32 (11.2%) | 12 (2.7%) |
| $800 to $1,499 | 192 (66.9%) | 126 (28.1%) |
| Total | 287 (100.0%) | 449 (100.0%) |
Health & Disability in Doe Valley
Health Insurance Coverage by Age in Doe Valley
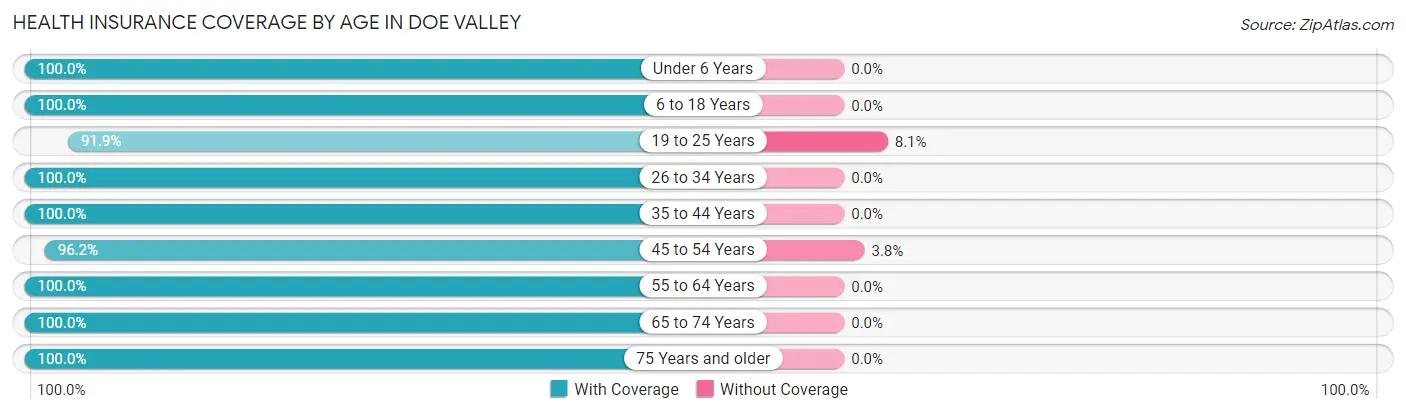
| Age Bracket | With Coverage | Without Coverage |
| Under 6 Years | 111 (100.0%) | 0 (0.0%) |
| 6 to 18 Years | 159 (100.0%) | 0 (0.0%) |
| 19 to 25 Years | 34 (91.9%) | 3 (8.1%) |
| 26 to 34 Years | 220 (100.0%) | 0 (0.0%) |
| 35 to 44 Years | 163 (100.0%) | 0 (0.0%) |
| 45 to 54 Years | 230 (96.2%) | 9 (3.8%) |
| 55 to 64 Years | 495 (100.0%) | 0 (0.0%) |
| 65 to 74 Years | 197 (100.0%) | 0 (0.0%) |
| 75 Years and older | 165 (100.0%) | 0 (0.0%) |
| Total | 1,774 (99.3%) | 12 (0.7%) |
Health Insurance Coverage by Citizenship Status in Doe Valley
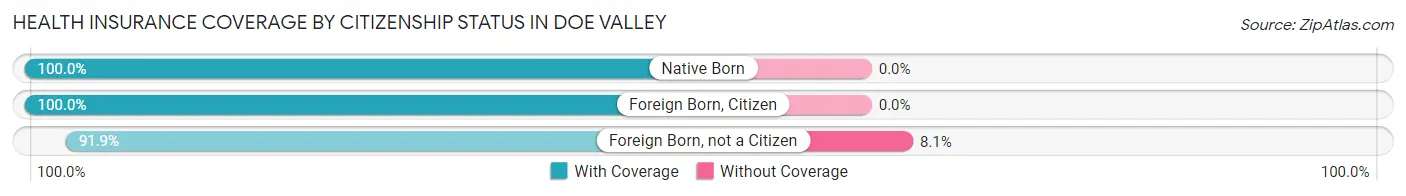
| Citizenship Status | With Coverage | Without Coverage |
| Native Born | 111 (100.0%) | 0 (0.0%) |
| Foreign Born, Citizen | 159 (100.0%) | 0 (0.0%) |
| Foreign Born, not a Citizen | 34 (91.9%) | 3 (8.1%) |
Health Insurance Coverage by Household Income in Doe Valley
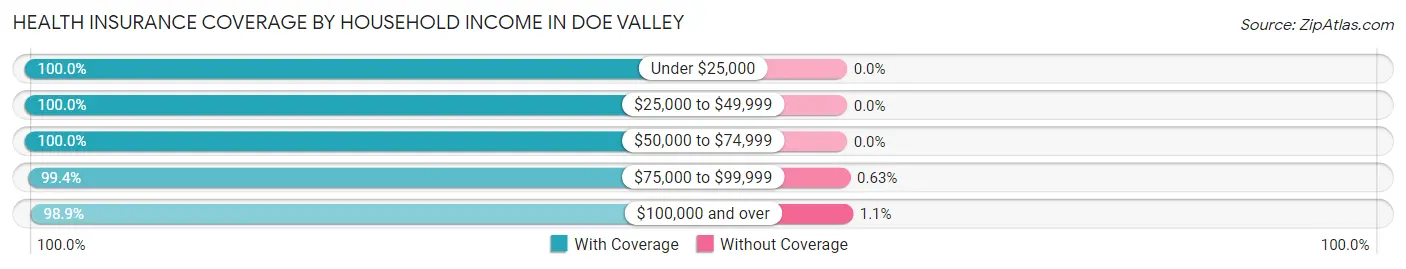
| Household Income | With Coverage | Without Coverage |
| Under $25,000 | 151 (100.0%) | 0 (0.0%) |
| $25,000 to $49,999 | 132 (100.0%) | 0 (0.0%) |
| $50,000 to $74,999 | 225 (100.0%) | 0 (0.0%) |
| $75,000 to $99,999 | 473 (99.4%) | 3 (0.6%) |
| $100,000 and over | 793 (98.9%) | 9 (1.1%) |
Public vs Private Health Insurance Coverage by Age in Doe Valley
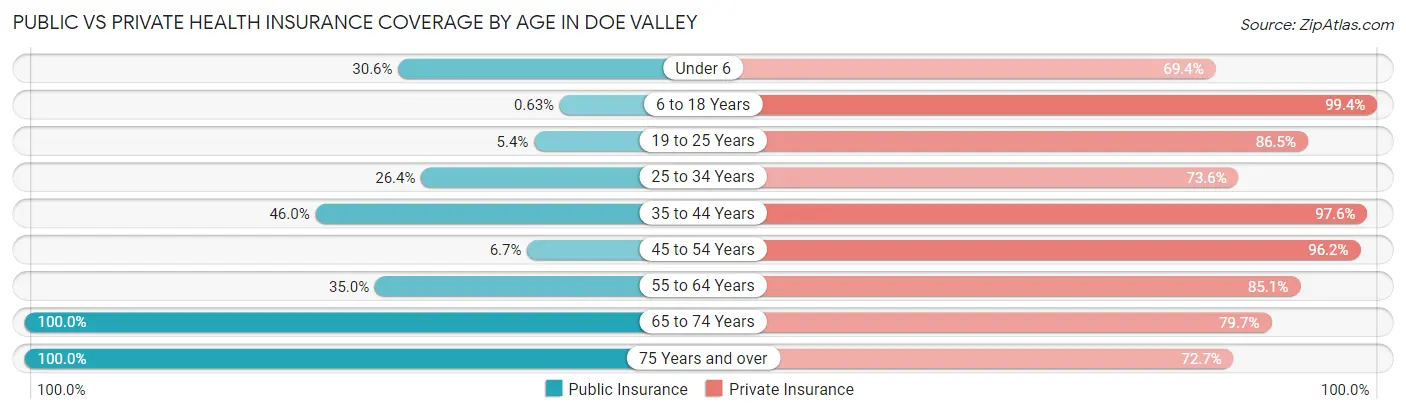
| Age Bracket | Public Insurance | Private Insurance |
| Under 6 | 34 (30.6%) | 77 (69.4%) |
| 6 to 18 Years | 1 (0.6%) | 158 (99.4%) |
| 19 to 25 Years | 2 (5.4%) | 32 (86.5%) |
| 25 to 34 Years | 58 (26.4%) | 162 (73.6%) |
| 35 to 44 Years | 75 (46.0%) | 159 (97.6%) |
| 45 to 54 Years | 16 (6.7%) | 230 (96.2%) |
| 55 to 64 Years | 173 (34.9%) | 421 (85.1%) |
| 65 to 74 Years | 197 (100.0%) | 157 (79.7%) |
| 75 Years and over | 165 (100.0%) | 120 (72.7%) |
| Total | 721 (40.4%) | 1,516 (84.9%) |
Disability Status by Sex by Age in Doe Valley
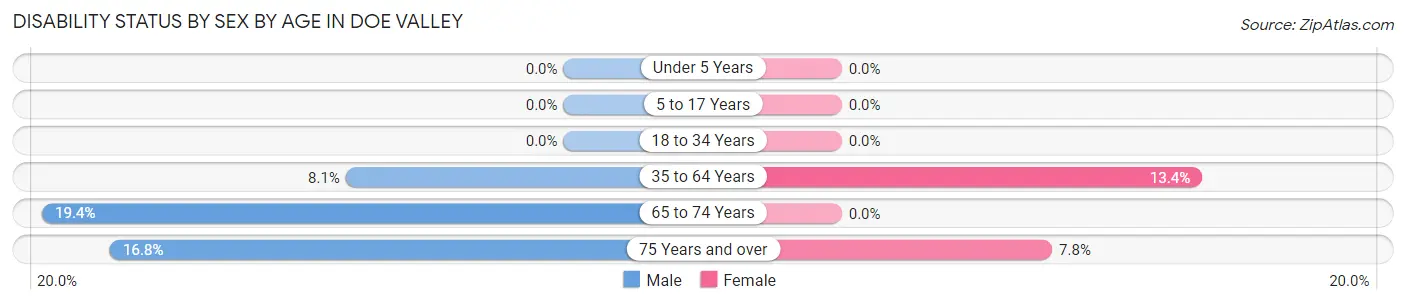
| Age Bracket | Male | Female |
| Under 5 Years | 0 (0.0%) | 0 (0.0%) |
| 5 to 17 Years | 0 (0.0%) | 0 (0.0%) |
| 18 to 34 Years | 0 (0.0%) | 0 (0.0%) |
| 35 to 64 Years | 32 (8.1%) | 67 (13.4%) |
| 65 to 74 Years | 12 (19.4%) | 0 (0.0%) |
| 75 Years and over | 17 (16.8%) | 5 (7.8%) |
Disability Class by Sex by Age in Doe Valley
Disability Class: Hearing Difficulty
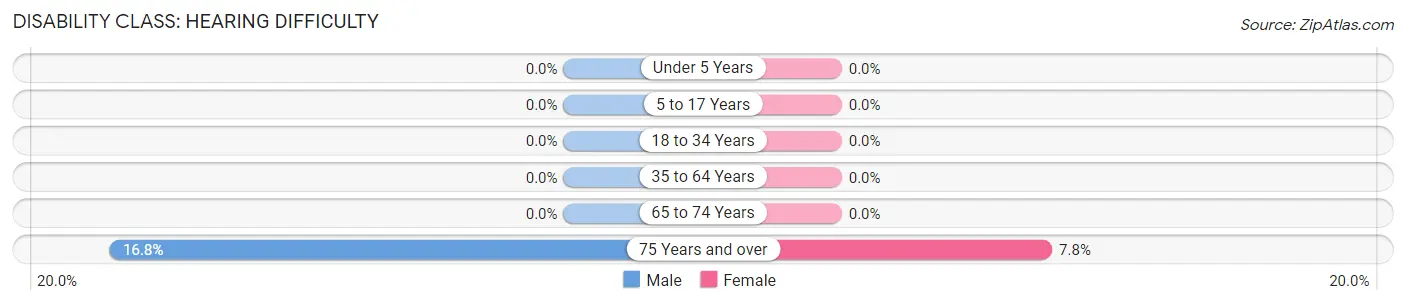
| Age Bracket | Male | Female |
| Under 5 Years | 0 (0.0%) | 0 (0.0%) |
| 5 to 17 Years | 0 (0.0%) | 0 (0.0%) |
| 18 to 34 Years | 0 (0.0%) | 0 (0.0%) |
| 35 to 64 Years | 0 (0.0%) | 0 (0.0%) |
| 65 to 74 Years | 0 (0.0%) | 0 (0.0%) |
| 75 Years and over | 17 (16.8%) | 5 (7.8%) |
Disability Class: Vision Difficulty
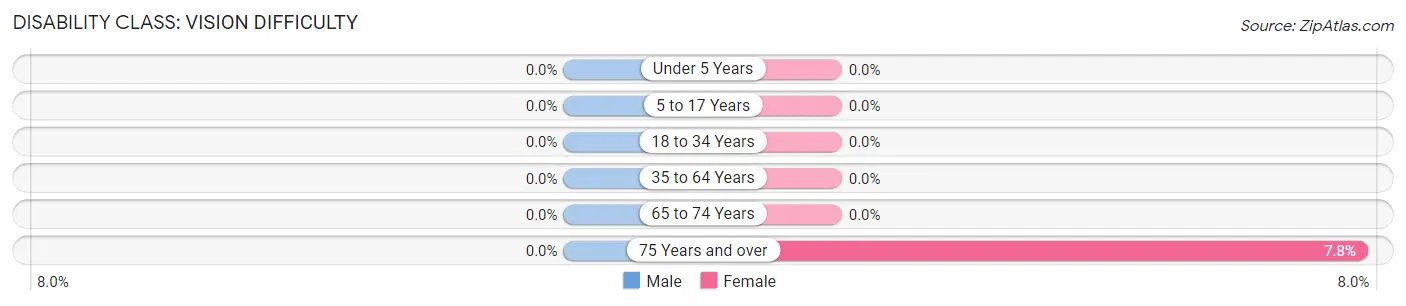
| Age Bracket | Male | Female |
| Under 5 Years | 0 (0.0%) | 0 (0.0%) |
| 5 to 17 Years | 0 (0.0%) | 0 (0.0%) |
| 18 to 34 Years | 0 (0.0%) | 0 (0.0%) |
| 35 to 64 Years | 0 (0.0%) | 0 (0.0%) |
| 65 to 74 Years | 0 (0.0%) | 0 (0.0%) |
| 75 Years and over | 0 (0.0%) | 5 (7.8%) |
Disability Class: Cognitive Difficulty
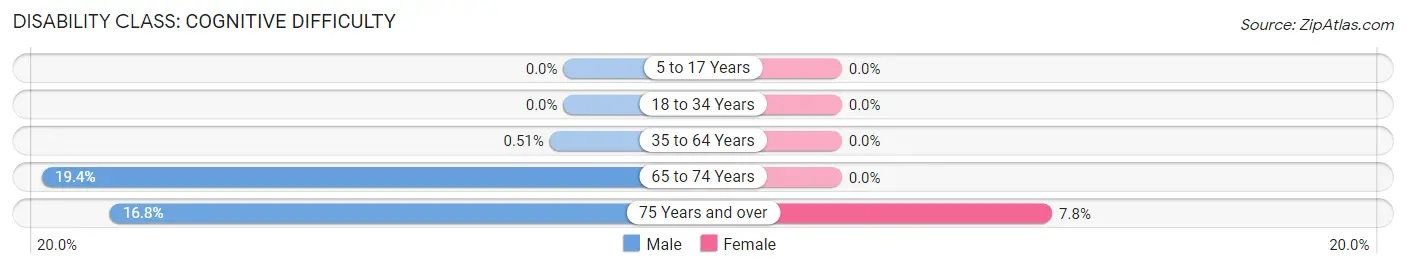
| Age Bracket | Male | Female |
| 5 to 17 Years | 0 (0.0%) | 0 (0.0%) |
| 18 to 34 Years | 0 (0.0%) | 0 (0.0%) |
| 35 to 64 Years | 2 (0.5%) | 0 (0.0%) |
| 65 to 74 Years | 12 (19.4%) | 0 (0.0%) |
| 75 Years and over | 17 (16.8%) | 5 (7.8%) |
Disability Class: Ambulatory Difficulty
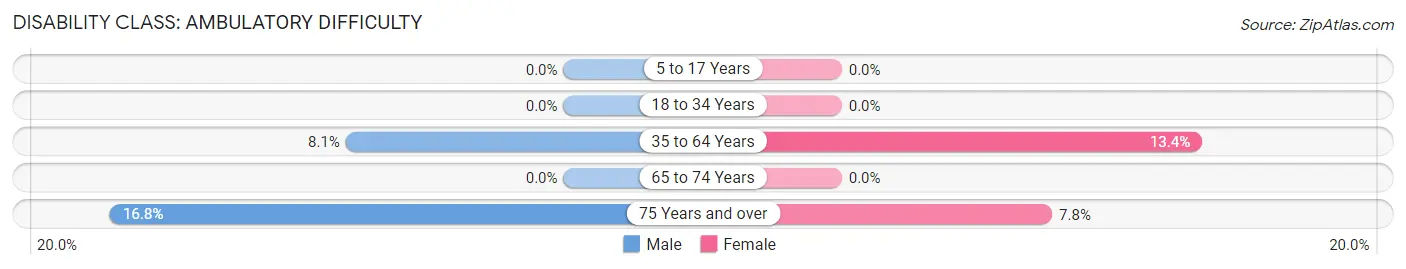
| Age Bracket | Male | Female |
| 5 to 17 Years | 0 (0.0%) | 0 (0.0%) |
| 18 to 34 Years | 0 (0.0%) | 0 (0.0%) |
| 35 to 64 Years | 32 (8.1%) | 67 (13.4%) |
| 65 to 74 Years | 0 (0.0%) | 0 (0.0%) |
| 75 Years and over | 17 (16.8%) | 5 (7.8%) |
Disability Class: Self-Care Difficulty
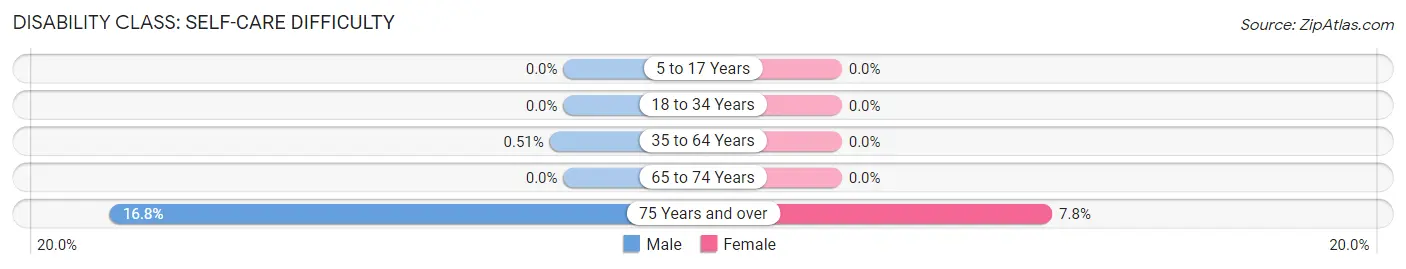
| Age Bracket | Male | Female |
| 5 to 17 Years | 0 (0.0%) | 0 (0.0%) |
| 18 to 34 Years | 0 (0.0%) | 0 (0.0%) |
| 35 to 64 Years | 2 (0.5%) | 0 (0.0%) |
| 65 to 74 Years | 0 (0.0%) | 0 (0.0%) |
| 75 Years and over | 17 (16.8%) | 5 (7.8%) |
Technology Access in Doe Valley
Computing Device Access in Doe Valley
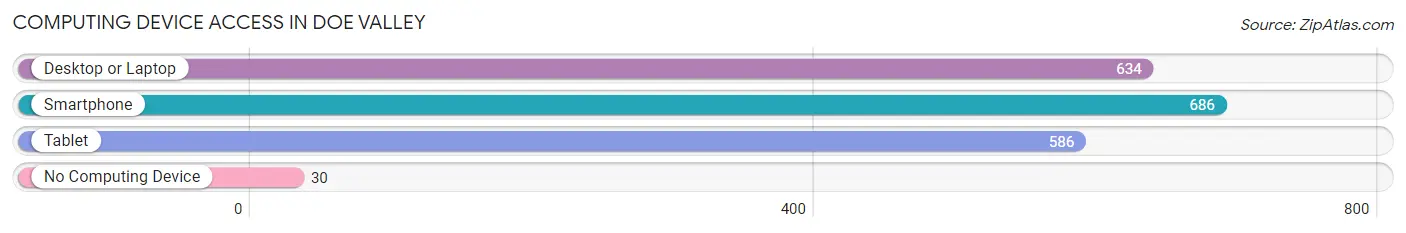
| Device Type | # Households | % Households |
| Desktop or Laptop | 634 | 86.1% |
| Smartphone | 686 | 93.2% |
| Tablet | 586 | 79.6% |
| No Computing Device | 30 | 4.1% |
| Total | 736 | 100.0% |
Internet Access in Doe Valley
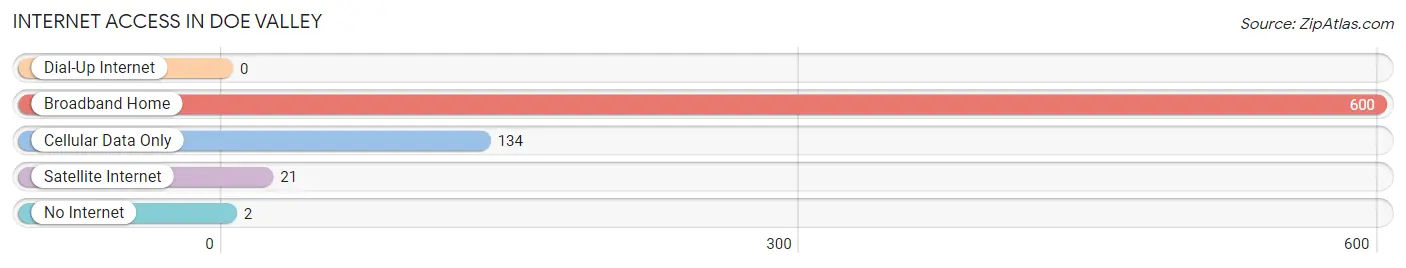
| Internet Type | # Households | % Households |
| Dial-Up Internet | 0 | 0.0% |
| Broadband Home | 600 | 81.5% |
| Cellular Data Only | 134 | 18.2% |
| Satellite Internet | 21 | 2.9% |
| No Internet | 2 | 0.3% |
| Total | 736 | 100.0% |
Doe Valley Summary
Doe Valley is a small unincorporated community located in the western part of Grayson County, Kentucky. It is situated in the foothills of the Appalachian Mountains, and is surrounded by rolling hills and lush forests. The area is known for its rural beauty and its close proximity to the larger cities of Louisville and Lexington.
History
The area now known as Doe Valley was first settled in the early 1800s by a group of settlers from Virginia. The settlers were attracted to the area by its abundant natural resources, including timber, coal, and iron ore. The area was originally known as “Doe’s Valley”, named after the Doe family who were among the first settlers.
The area was primarily an agricultural community until the late 19th century, when coal mining began to take off in the area. The coal industry brought a large influx of people to the area, and the population of Doe Valley grew rapidly. The town was officially incorporated in 1891, and the population continued to grow throughout the early 20th century.
Geography
Doe Valley is located in the western part of Grayson County, Kentucky. It is situated in the foothills of the Appalachian Mountains, and is surrounded by rolling hills and lush forests. The area is known for its rural beauty and its close proximity to the larger cities of Louisville and Lexington.
The climate in Doe Valley is generally mild, with hot summers and cold winters. The average temperature in the summer is around 75 degrees Fahrenheit, and the average temperature in the winter is around 40 degrees Fahrenheit. The area receives an average of 45 inches of precipitation per year, with most of it falling in the form of rain.
Economy
The economy of Doe Valley is largely based on agriculture and coal mining. The area is home to several large farms, which produce a variety of crops, including corn, soybeans, and wheat. The coal industry is also a major employer in the area, with several large coal mines located in the area.
In addition to agriculture and coal mining, Doe Valley is also home to several small businesses, including restaurants, stores, and other services. The area is also home to several tourist attractions, including the Doe Valley Country Club and the Doe Valley Golf Course.
Demographics
As of the 2010 census, the population of Doe Valley was 1,845. The population is primarily white (97.3%), with a small percentage of African Americans (1.2%) and Hispanics (1.5%). The median household income in Doe Valley is $41,250, and the median age is 41.
The majority of the population (90.3%) is employed, with most of the jobs being in the agriculture and coal mining industries. The unemployment rate in Doe Valley is 5.2%, which is slightly higher than the national average.
Conclusion
Doe Valley is a small unincorporated community located in the western part of Grayson County, Kentucky. It is situated in the foothills of the Appalachian Mountains, and is surrounded by rolling hills and lush forests. The area is known for its rural beauty and its close proximity to the larger cities of Louisville and Lexington. The economy of Doe Valley is largely based on agriculture and coal mining, and the population is primarily white. The median household income in Doe Valley is $41,250, and the median age is 41.
Common Questions
What is Per Capita Income in Doe Valley?
Per Capita income in Doe Valley is $49,559.
What is the Median Family Income in Doe Valley?
Median Family Income in Doe Valley is $111,094.
What is the Median Household income in Doe Valley?
Median Household Income in Doe Valley is $102,143.
What is Income or Wage Gap in Doe Valley?
Income or Wage Gap in Doe Valley is 65.6%.
Women in Doe Valley earn 34.4 cents for every dollar earned by a man.
What is Inequality or Gini Index in Doe Valley?
Inequality or Gini Index in Doe Valley is 0.36.
What is the Total Population of Doe Valley?
Total Population of Doe Valley is 1,871.
What is the Total Male Population of Doe Valley?
Total Male Population of Doe Valley is 803.
What is the Total Female Population of Doe Valley?
Total Female Population of Doe Valley is 1,068.
What is the Ratio of Males per 100 Females in Doe Valley?
There are 75.19 Males per 100 Females in Doe Valley.
What is the Ratio of Females per 100 Males in Doe Valley?
There are 133.00 Females per 100 Males in Doe Valley.
What is the Median Population Age in Doe Valley?
Median Population Age in Doe Valley is 51.3 Years.
What is the Average Family Size in Doe Valley
Average Family Size in Doe Valley is 2.6 People.
What is the Average Household Size in Doe Valley
Average Household Size in Doe Valley is 2.5 People.
How Large is the Labor Force in Doe Valley?
There are 917 People in the Labor Forcein in Doe Valley.
What is the Percentage of People in the Labor Force in Doe Valley?
55.9% of People are in the Labor Force in Doe Valley.