Woodland Hills, KY Map & Demographics
Woodland Hills Map
Woodland Hills Overview
$43,278
PER CAPITA INCOME
$104,792
AVG FAMILY INCOME
$90,096
AVG HOUSEHOLD INCOME
33.6%
WAGE / INCOME GAP [ % ]
66.4¢/ $1
WAGE / INCOME GAP [ $ ]
0.37
INEQUALITY / GINI INDEX
621
TOTAL POPULATION
333
MALE POPULATION
288
FEMALE POPULATION
115.62
MALES / 100 FEMALES
86.49
FEMALES / 100 MALES
38.0
MEDIAN AGE
3.1
AVG FAMILY SIZE
2.5
AVG HOUSEHOLD SIZE
349
LABOR FORCE [ PEOPLE ]
73.0%
PERCENT IN LABOR FORCE
1.4%
UNEMPLOYMENT RATE
Woodland Hills Area Codes
Income in Woodland Hills
Income Overview in Woodland Hills
Per Capita Income in Woodland Hills is $43,278, while median incomes of families and households are $104,792 and $90,096 respectively.
| Characteristic | Number | Measure |
| Per Capita Income | 621 | $43,278 |
| Median Family Income | 171 | $104,792 |
| Mean Family Income | 171 | $123,347 |
| Median Household Income | 253 | $90,096 |
| Mean Household Income | 253 | $105,698 |
| Income Deficit | 171 | $0 |
| Wage / Income Gap (%) | 621 | 33.64% |
| Wage / Income Gap ($) | 621 | 66.36¢ per $1 |
| Gini / Inequality Index | 621 | 0.37 |
Earnings by Sex in Woodland Hills
Average Earnings in Woodland Hills are $53,359, $60,750 for men and $40,313 for women, a difference of 33.6%.
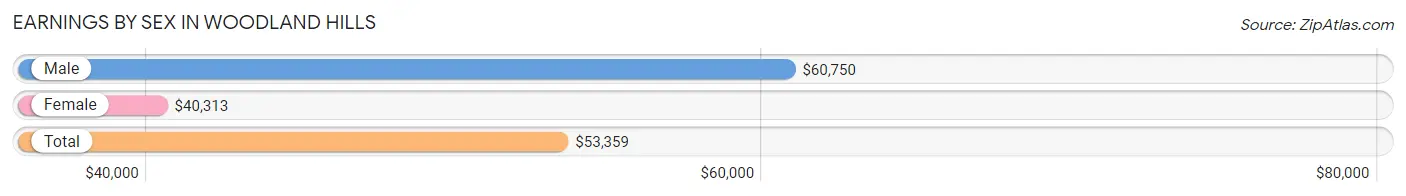
| Sex | Number | Average Earnings |
| Male | 171 (48.2%) | $60,750 |
| Female | 184 (51.8%) | $40,313 |
| Total | 355 (100.0%) | $53,359 |
Earnings by Sex by Income Bracket in Woodland Hills
The most common earnings brackets in Woodland Hills are $100,000+ for men (32 | 18.7%) and $35,000 to $39,999 for women (25 | 13.6%).
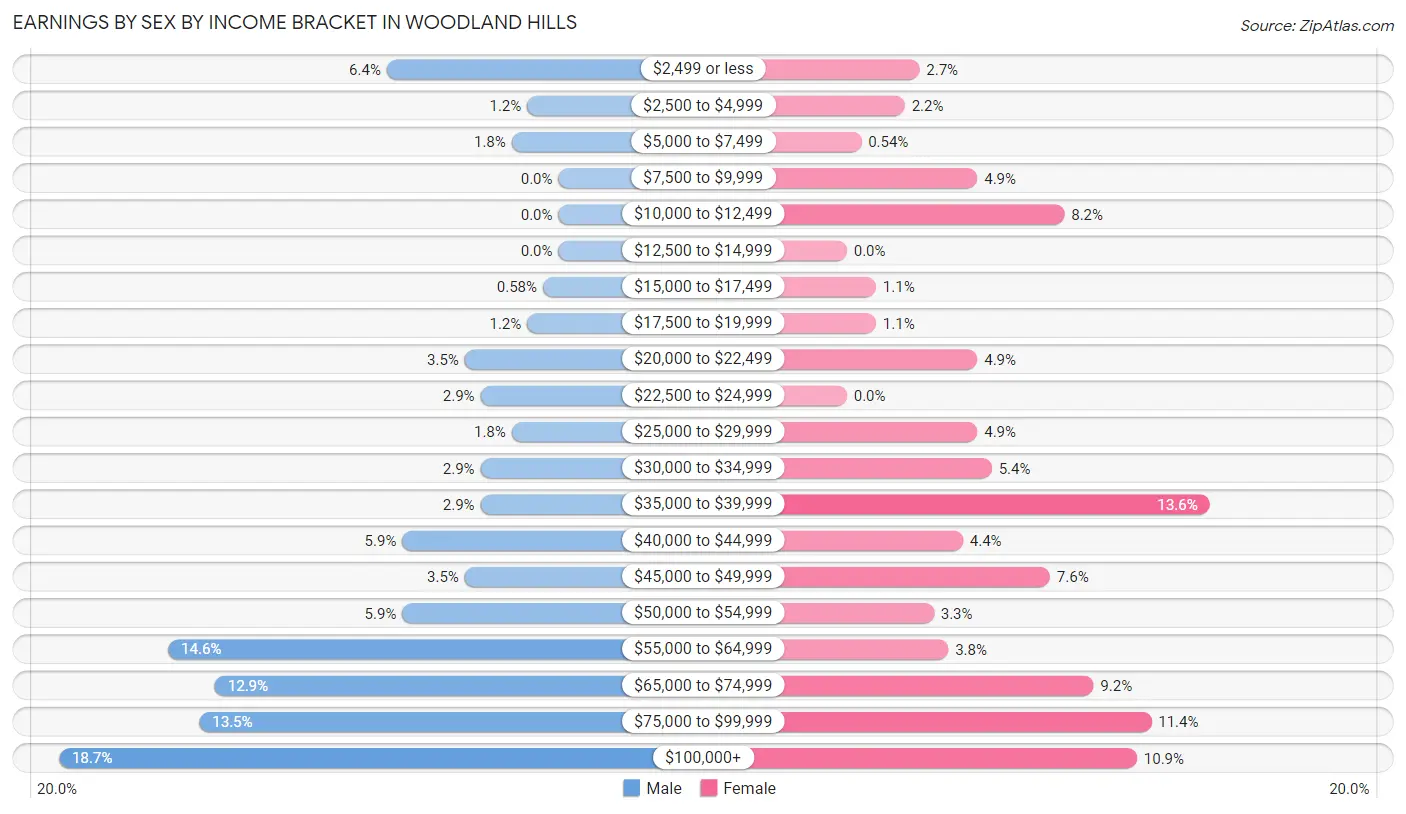
| Income | Male | Female |
| $2,499 or less | 11 (6.4%) | 5 (2.7%) |
| $2,500 to $4,999 | 2 (1.2%) | 4 (2.2%) |
| $5,000 to $7,499 | 3 (1.8%) | 1 (0.5%) |
| $7,500 to $9,999 | 0 (0.0%) | 9 (4.9%) |
| $10,000 to $12,499 | 0 (0.0%) | 15 (8.2%) |
| $12,500 to $14,999 | 0 (0.0%) | 0 (0.0%) |
| $15,000 to $17,499 | 1 (0.6%) | 2 (1.1%) |
| $17,500 to $19,999 | 2 (1.2%) | 2 (1.1%) |
| $20,000 to $22,499 | 6 (3.5%) | 9 (4.9%) |
| $22,500 to $24,999 | 5 (2.9%) | 0 (0.0%) |
| $25,000 to $29,999 | 3 (1.8%) | 9 (4.9%) |
| $30,000 to $34,999 | 5 (2.9%) | 10 (5.4%) |
| $35,000 to $39,999 | 5 (2.9%) | 25 (13.6%) |
| $40,000 to $44,999 | 10 (5.9%) | 8 (4.3%) |
| $45,000 to $49,999 | 6 (3.5%) | 14 (7.6%) |
| $50,000 to $54,999 | 10 (5.9%) | 6 (3.3%) |
| $55,000 to $64,999 | 25 (14.6%) | 7 (3.8%) |
| $65,000 to $74,999 | 22 (12.9%) | 17 (9.2%) |
| $75,000 to $99,999 | 23 (13.5%) | 21 (11.4%) |
| $100,000+ | 32 (18.7%) | 20 (10.9%) |
| Total | 171 (100.0%) | 184 (100.0%) |
Earnings by Sex by Educational Attainment in Woodland Hills
Average earnings in Woodland Hills are $63,500 for men and $42,344 for women, a difference of 33.3%. Men with an educational attainment of graduate degree enjoy the highest average annual earnings of $117,917, while those with high school diploma education earn the least with $45,000. Women with an educational attainment of graduate degree earn the most with the average annual earnings of $67,500, while those with college or associate's degree education have the smallest earnings of $38,182.
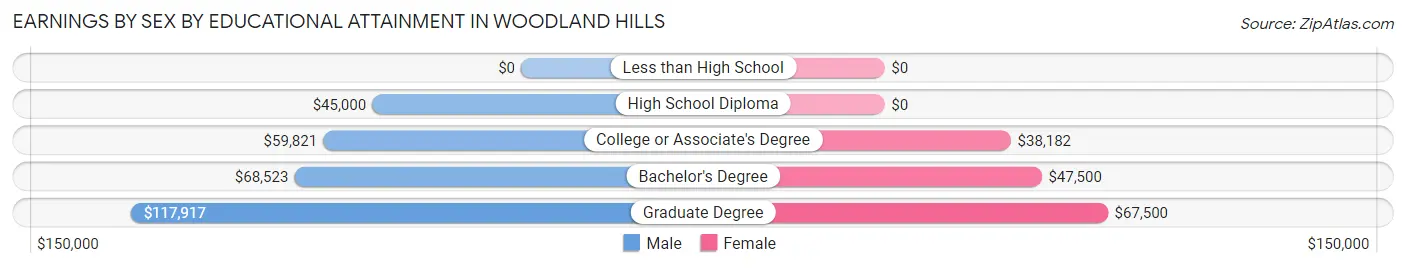
| Educational Attainment | Male Income | Female Income |
| Less than High School | - | - |
| High School Diploma | $45,000 | $0 |
| College or Associate's Degree | $59,821 | $38,182 |
| Bachelor's Degree | $68,523 | $47,500 |
| Graduate Degree | $117,917 | $67,500 |
| Total | $63,500 | $42,344 |
Family Income in Woodland Hills
Family Income Brackets in Woodland Hills
According to the Woodland Hills family income data, there are 54 families falling into the $100,000 to $149,999 income range, which is the most common income bracket and makes up 31.6% of all families.
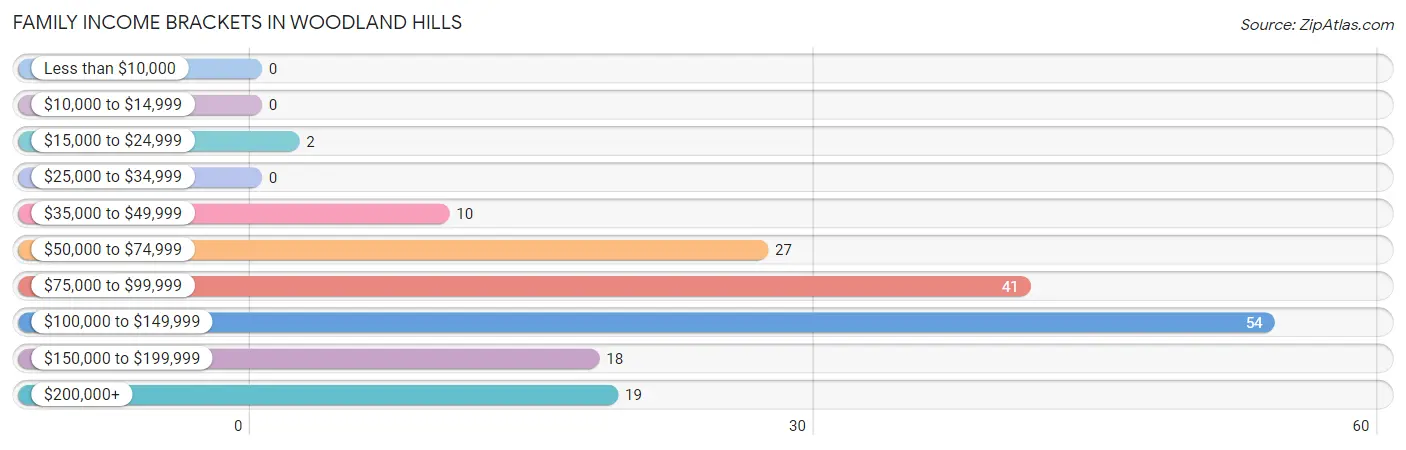
| Income Bracket | # Families | % Families |
| Less than $10,000 | 0 | 0.0% |
| $10,000 to $14,999 | 0 | 0.0% |
| $15,000 to $24,999 | 2 | 1.2% |
| $25,000 to $34,999 | 0 | 0.0% |
| $35,000 to $49,999 | 10 | 5.8% |
| $50,000 to $74,999 | 27 | 15.8% |
| $75,000 to $99,999 | 41 | 24.0% |
| $100,000 to $149,999 | 54 | 31.6% |
| $150,000 to $199,999 | 18 | 10.5% |
| $200,000+ | 19 | 11.1% |
Family Income by Famaliy Size in Woodland Hills
4-person families (33 | 19.3%) account for the highest median family income in Woodland Hills with $127,708 per family, while 2-person families (65 | 38.0%) have the highest median income of $49,688 per family member.
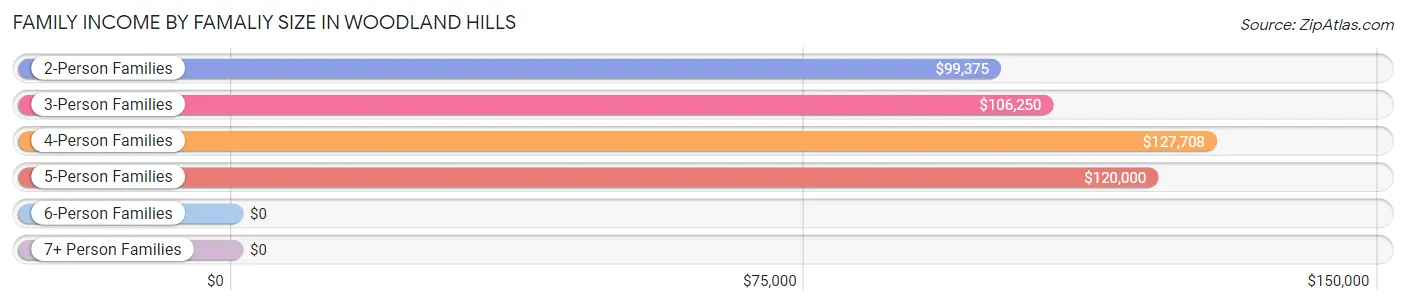
| Income Bracket | # Families | Median Income |
| 2-Person Families | 65 (38.0%) | $99,375 |
| 3-Person Families | 53 (31.0%) | $106,250 |
| 4-Person Families | 33 (19.3%) | $127,708 |
| 5-Person Families | 16 (9.4%) | $120,000 |
| 6-Person Families | 2 (1.2%) | $0 |
| 7+ Person Families | 2 (1.2%) | $0 |
| Total | 171 (100.0%) | $104,792 |
Family Income by Number of Earners in Woodland Hills
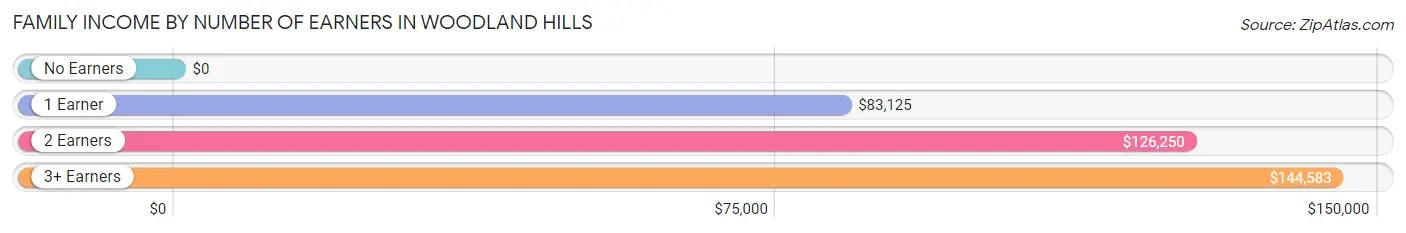
| Number of Earners | # Families | Median Income |
| No Earners | 10 (5.9%) | $0 |
| 1 Earner | 46 (26.9%) | $83,125 |
| 2 Earners | 98 (57.3%) | $126,250 |
| 3+ Earners | 17 (9.9%) | $144,583 |
| Total | 171 (100.0%) | $104,792 |
Household Income in Woodland Hills
Household Income Brackets in Woodland Hills
With 64 households falling in the category, the $100,000 to $149,999 income range is the most frequent in Woodland Hills, accounting for 25.3% of all households. In contrast, only 4 households (1.6%) fall into the less than $10,000 income bracket, making it the least populous group.
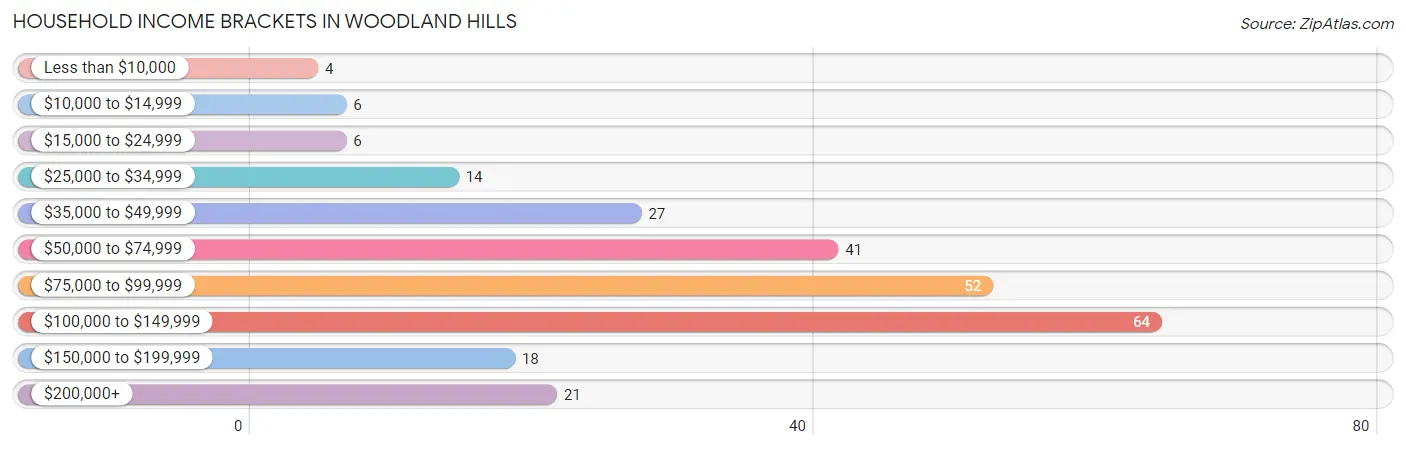
| Income Bracket | # Households | % Households |
| Less than $10,000 | 4 | 1.6% |
| $10,000 to $14,999 | 6 | 2.4% |
| $15,000 to $24,999 | 6 | 2.4% |
| $25,000 to $34,999 | 14 | 5.5% |
| $35,000 to $49,999 | 27 | 10.7% |
| $50,000 to $74,999 | 41 | 16.2% |
| $75,000 to $99,999 | 52 | 20.6% |
| $100,000 to $149,999 | 64 | 25.3% |
| $150,000 to $199,999 | 18 | 7.1% |
| $200,000+ | 21 | 8.3% |
Household Income by Householder Age in Woodland Hills
The median household income in Woodland Hills is $90,096, with the highest median household income of $106,250 found in the 45 to 64 years age bracket for the primary householder. A total of 76 households (30.0%) fall into this category. Meanwhile, the 15 to 24 years age bracket for the primary householder has the lowest median household income of $0, with 2 households (0.8%) in this group.
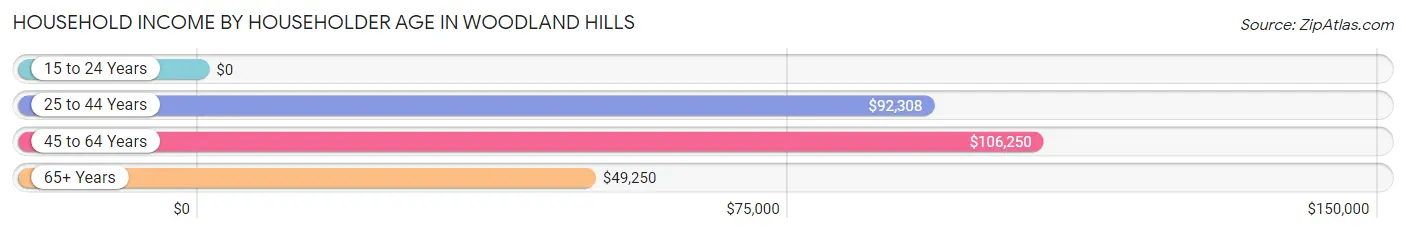
| Income Bracket | # Households | Median Income |
| 15 to 24 Years | 2 (0.8%) | $0 |
| 25 to 44 Years | 102 (40.3%) | $92,308 |
| 45 to 64 Years | 76 (30.0%) | $106,250 |
| 65+ Years | 73 (28.8%) | $49,250 |
| Total | 253 (100.0%) | $90,096 |
Poverty in Woodland Hills
Income Below Poverty by Sex and Age in Woodland Hills
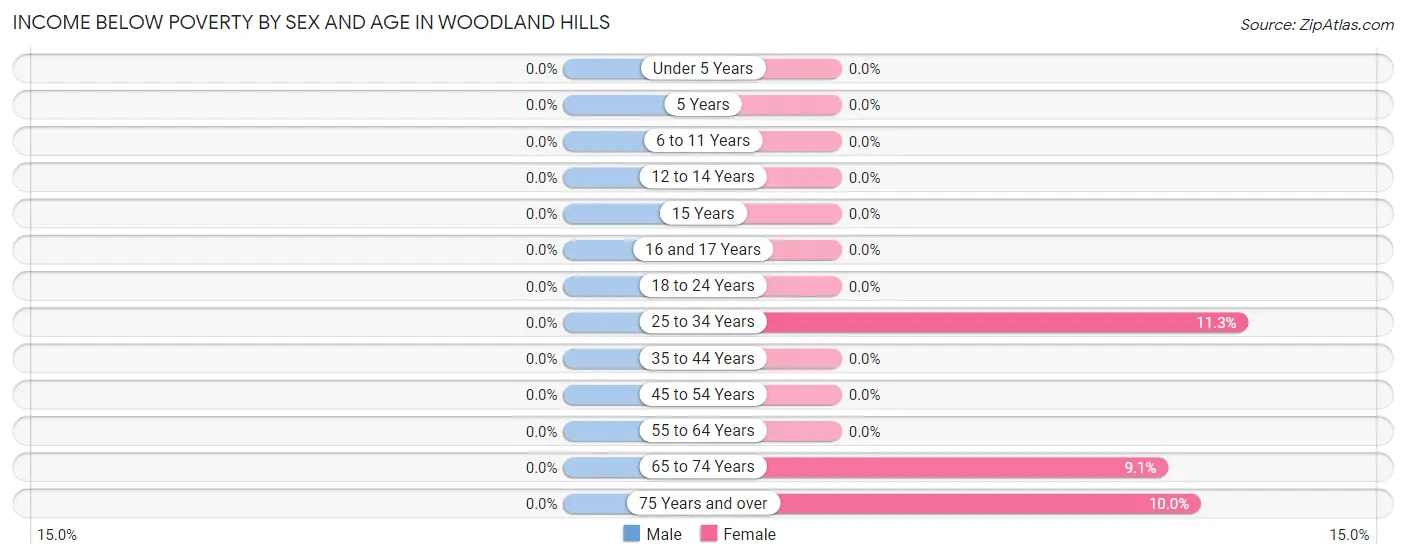
| Age Bracket | Male | Female |
| Under 5 Years | 0 (0.0%) | 0 (0.0%) |
| 5 Years | 0 (0.0%) | 0 (0.0%) |
| 6 to 11 Years | 0 (0.0%) | 0 (0.0%) |
| 12 to 14 Years | 0 (0.0%) | 0 (0.0%) |
| 15 Years | 0 (0.0%) | 0 (0.0%) |
| 16 and 17 Years | 0 (0.0%) | 0 (0.0%) |
| 18 to 24 Years | 0 (0.0%) | 0 (0.0%) |
| 25 to 34 Years | 0 (0.0%) | 6 (11.3%) |
| 35 to 44 Years | 0 (0.0%) | 0 (0.0%) |
| 45 to 54 Years | 0 (0.0%) | 0 (0.0%) |
| 55 to 64 Years | 0 (0.0%) | 0 (0.0%) |
| 65 to 74 Years | 0 (0.0%) | 2 (9.1%) |
| 75 Years and over | 0 (0.0%) | 4 (10.0%) |
| Total | 0 (0.0%) | 12 (4.2%) |
Income Above Poverty by Sex and Age in Woodland Hills
According to the poverty statistics in Woodland Hills, males aged under 5 years and females aged under 5 years are the age groups that are most secure financially, with 100.0% of males and 100.0% of females in these age groups living above the poverty line.
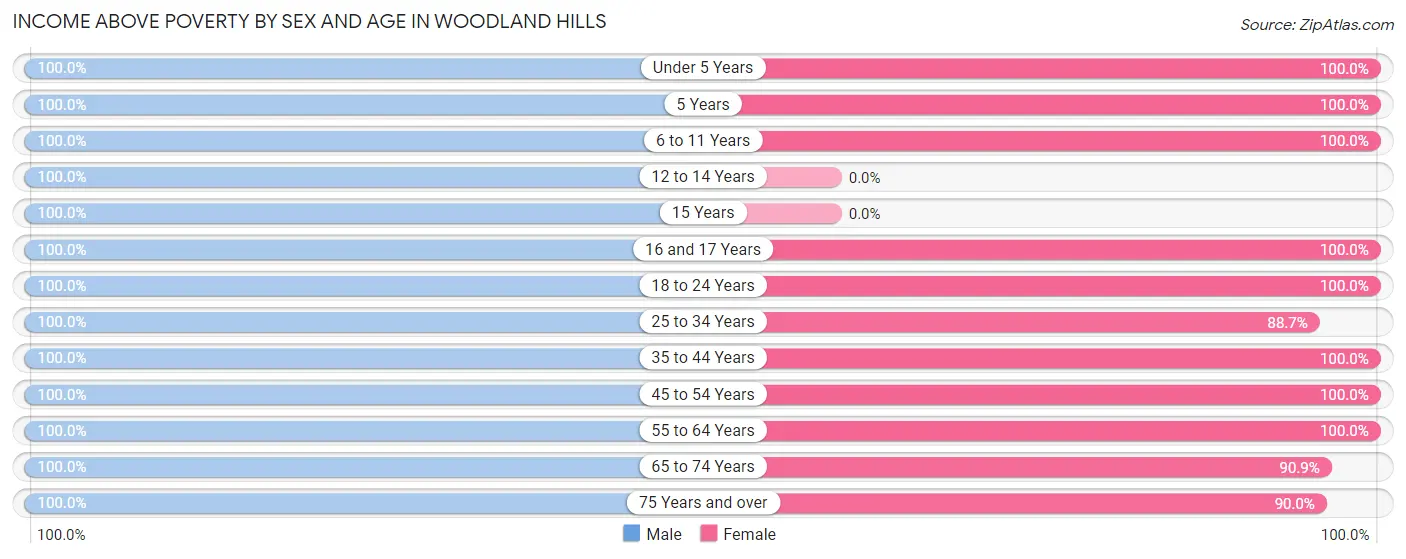
| Age Bracket | Male | Female |
| Under 5 Years | 11 (100.0%) | 13 (100.0%) |
| 5 Years | 15 (100.0%) | 8 (100.0%) |
| 6 to 11 Years | 48 (100.0%) | 24 (100.0%) |
| 12 to 14 Years | 22 (100.0%) | 0 (0.0%) |
| 15 Years | 1 (100.0%) | 0 (0.0%) |
| 16 and 17 Years | 19 (100.0%) | 9 (100.0%) |
| 18 to 24 Years | 11 (100.0%) | 8 (100.0%) |
| 25 to 34 Years | 37 (100.0%) | 47 (88.7%) |
| 35 to 44 Years | 54 (100.0%) | 49 (100.0%) |
| 45 to 54 Years | 31 (100.0%) | 29 (100.0%) |
| 55 to 64 Years | 30 (100.0%) | 33 (100.0%) |
| 65 to 74 Years | 25 (100.0%) | 20 (90.9%) |
| 75 Years and over | 28 (100.0%) | 36 (90.0%) |
| Total | 332 (100.0%) | 276 (95.8%) |
Income Below Poverty Among Married-Couple Families in Woodland Hills
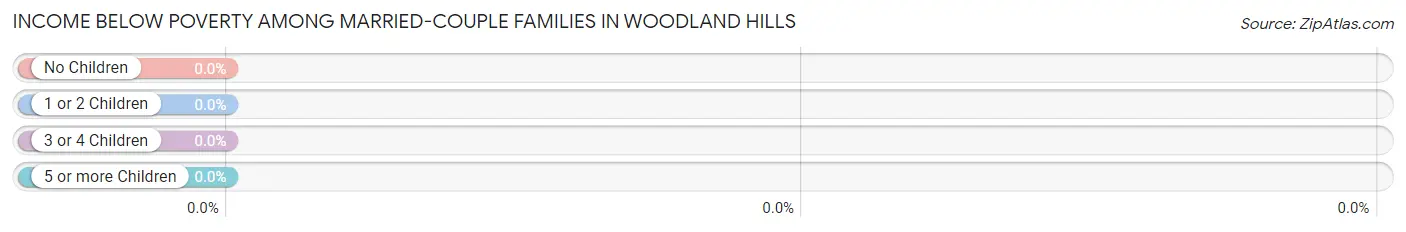
| Children | Above Poverty | Below Poverty |
| No Children | 57 (100.0%) | 0 (0.0%) |
| 1 or 2 Children | 60 (100.0%) | 0 (0.0%) |
| 3 or 4 Children | 11 (100.0%) | 0 (0.0%) |
| 5 or more Children | 0 (0.0%) | 0 (0.0%) |
| Total | 128 (100.0%) | 0 (0.0%) |
Income Below Poverty Among Single-Parent Households in Woodland Hills
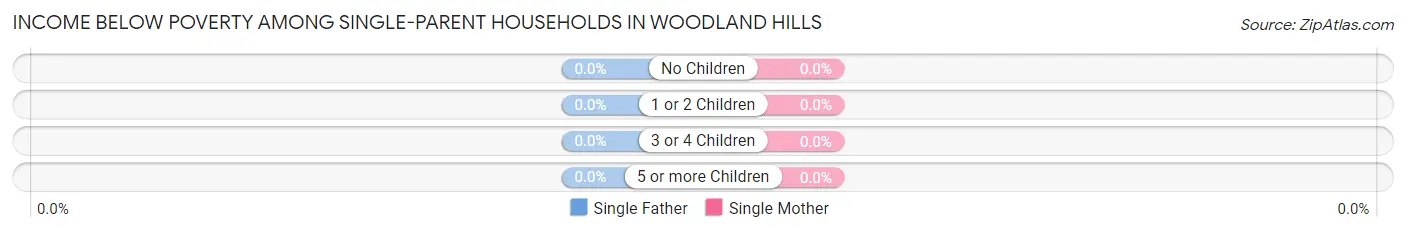
| Children | Single Father | Single Mother |
| No Children | 0 (0.0%) | 0 (0.0%) |
| 1 or 2 Children | 0 (0.0%) | 0 (0.0%) |
| 3 or 4 Children | 0 (0.0%) | 0 (0.0%) |
| 5 or more Children | 0 (0.0%) | 0 (0.0%) |
| Total | 0 (0.0%) | 0 (0.0%) |
Income Below Poverty Among Married-Couple vs Single-Parent Households in Woodland Hills
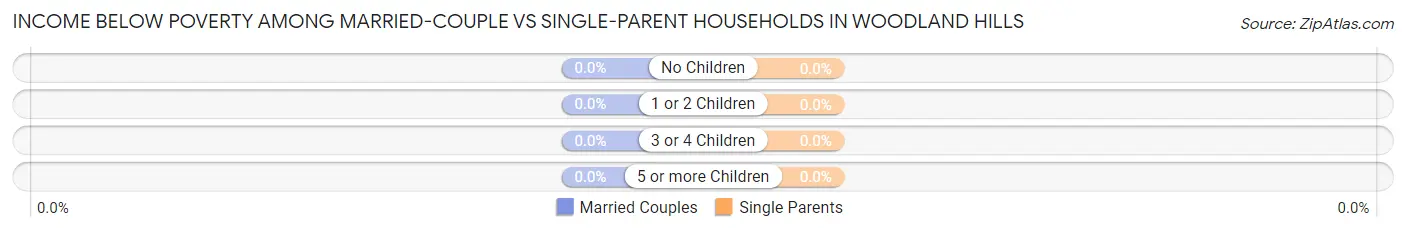
| Children | Married-Couple Families | Single-Parent Households |
| No Children | 0 (0.0%) | 0 (0.0%) |
| 1 or 2 Children | 0 (0.0%) | 0 (0.0%) |
| 3 or 4 Children | 0 (0.0%) | 0 (0.0%) |
| 5 or more Children | 0 (0.0%) | 0 (0.0%) |
| Total | 0 (0.0%) | 0 (0.0%) |
Race in Woodland Hills
The most populous races in Woodland Hills are White / Caucasian (596 | 96.0%), Hispanic or Latino (37 | 6.0%), and Two or more Races (12 | 1.9%).
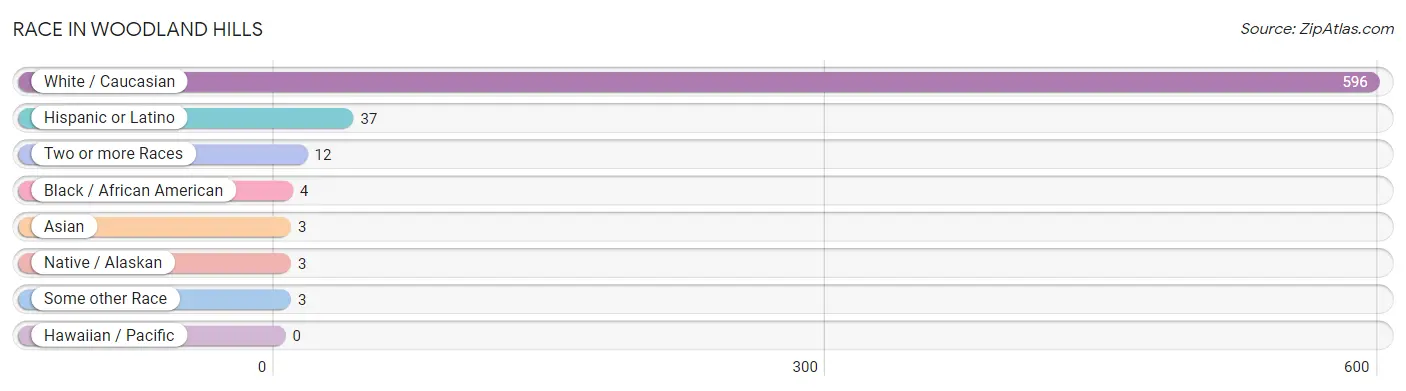
| Race | # Population | % Population |
| Asian | 3 | 0.5% |
| Black / African American | 4 | 0.6% |
| Hawaiian / Pacific | 0 | 0.0% |
| Hispanic or Latino | 37 | 6.0% |
| Native / Alaskan | 3 | 0.5% |
| White / Caucasian | 596 | 96.0% |
| Two or more Races | 12 | 1.9% |
| Some other Race | 3 | 0.5% |
| Total | 621 | 100.0% |
Ancestry in Woodland Hills
The most populous ancestries reported in Woodland Hills are German (120 | 19.3%), Irish (106 | 17.1%), English (104 | 16.8%), American (53 | 8.5%), and Italian (19 | 3.1%), together accounting for 64.7% of all Woodland Hills residents.
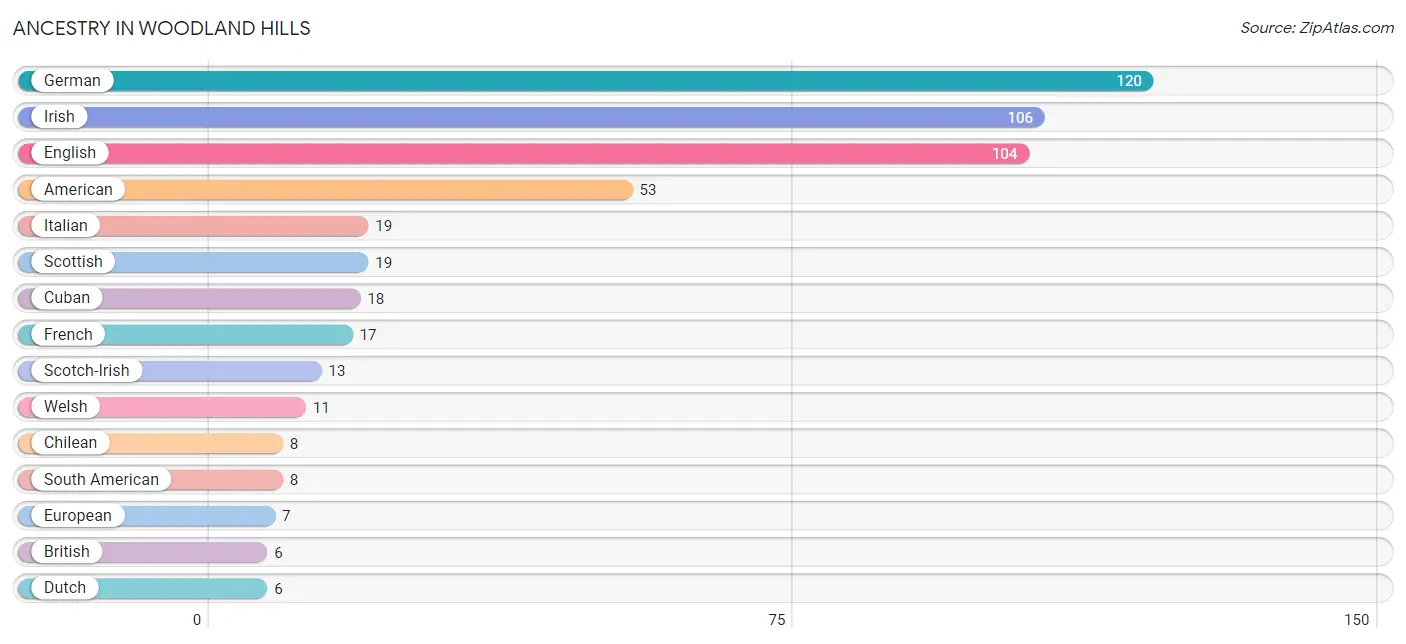
| Ancestry | # Population | % Population |
| American | 53 | 8.5% |
| Arab | 2 | 0.3% |
| Brazilian | 3 | 0.5% |
| British | 6 | 1.0% |
| Central American | 1 | 0.2% |
| Chilean | 8 | 1.3% |
| Cuban | 18 | 2.9% |
| Dominican | 5 | 0.8% |
| Dutch | 6 | 1.0% |
| English | 104 | 16.8% |
| European | 7 | 1.1% |
| French | 17 | 2.7% |
| German | 120 | 19.3% |
| Indian (Asian) | 3 | 0.5% |
| Irish | 106 | 17.1% |
| Italian | 19 | 3.1% |
| Mexican | 2 | 0.3% |
| Northern European | 2 | 0.3% |
| Palestinian | 2 | 0.3% |
| Panamanian | 1 | 0.2% |
| Polish | 4 | 0.6% |
| Potawatomi | 3 | 0.5% |
| Russian | 2 | 0.3% |
| Scandinavian | 2 | 0.3% |
| Scotch-Irish | 13 | 2.1% |
| Scottish | 19 | 3.1% |
| South American | 8 | 1.3% |
| Spaniard | 3 | 0.5% |
| Swiss | 4 | 0.6% |
| Ukrainian | 1 | 0.2% |
| Welsh | 11 | 1.8% | View All 31 Rows |
Immigrants in Woodland Hills
The most numerous immigrant groups reported in Woodland Hills came from Latin America (25 | 4.0%), Caribbean (20 | 3.2%), Cuba (18 | 2.9%), Europe (6 | 1.0%), and Chile (5 | 0.8%), together accounting for 11.9% of all Woodland Hills residents.
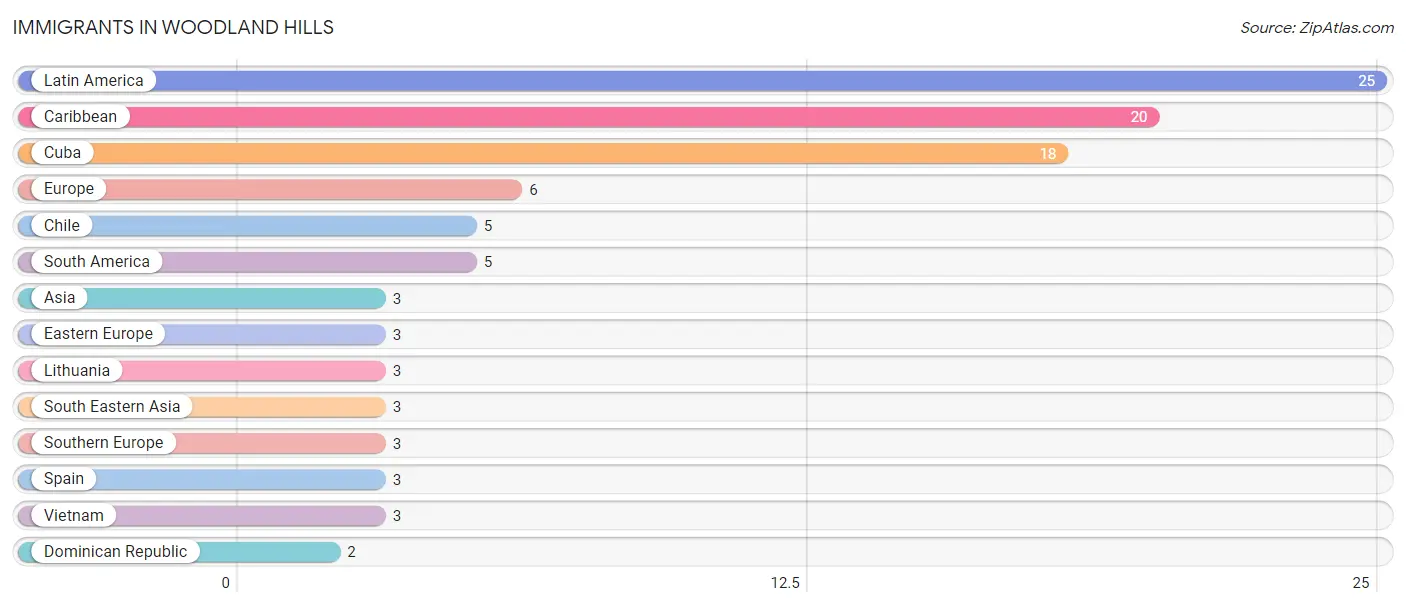
| Immigration Origin | # Population | % Population |
| Asia | 3 | 0.5% |
| Caribbean | 20 | 3.2% |
| Chile | 5 | 0.8% |
| Cuba | 18 | 2.9% |
| Dominican Republic | 2 | 0.3% |
| Eastern Europe | 3 | 0.5% |
| Europe | 6 | 1.0% |
| Latin America | 25 | 4.0% |
| Lithuania | 3 | 0.5% |
| South America | 5 | 0.8% |
| South Eastern Asia | 3 | 0.5% |
| Southern Europe | 3 | 0.5% |
| Spain | 3 | 0.5% |
| Vietnam | 3 | 0.5% | View All 14 Rows |
Sex and Age in Woodland Hills
Sex and Age in Woodland Hills
The most populous age groups in Woodland Hills are 5 to 9 Years (52 | 15.6%) for men and 30 to 34 Years (46 | 16.0%) for women.
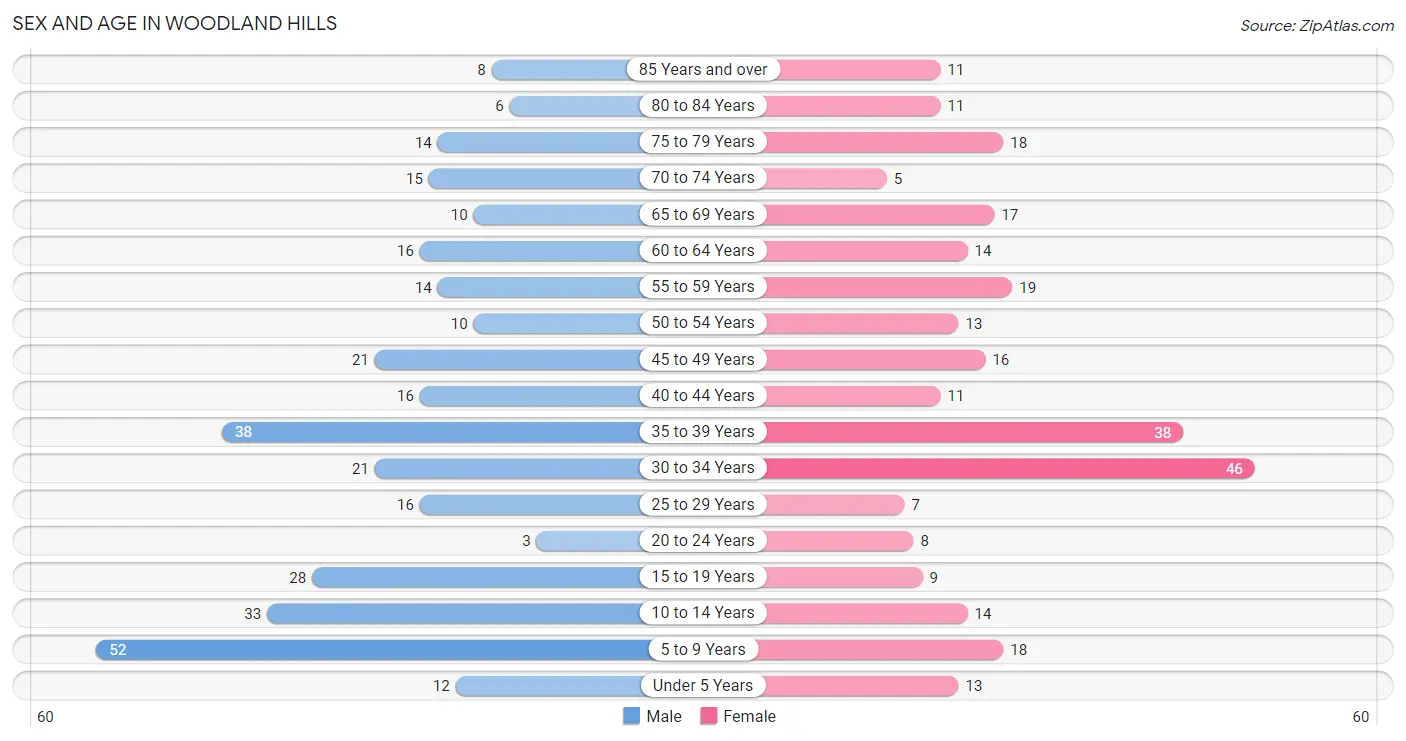
| Age Bracket | Male | Female |
| Under 5 Years | 12 (3.6%) | 13 (4.5%) |
| 5 to 9 Years | 52 (15.6%) | 18 (6.2%) |
| 10 to 14 Years | 33 (9.9%) | 14 (4.9%) |
| 15 to 19 Years | 28 (8.4%) | 9 (3.1%) |
| 20 to 24 Years | 3 (0.9%) | 8 (2.8%) |
| 25 to 29 Years | 16 (4.8%) | 7 (2.4%) |
| 30 to 34 Years | 21 (6.3%) | 46 (16.0%) |
| 35 to 39 Years | 38 (11.4%) | 38 (13.2%) |
| 40 to 44 Years | 16 (4.8%) | 11 (3.8%) |
| 45 to 49 Years | 21 (6.3%) | 16 (5.6%) |
| 50 to 54 Years | 10 (3.0%) | 13 (4.5%) |
| 55 to 59 Years | 14 (4.2%) | 19 (6.6%) |
| 60 to 64 Years | 16 (4.8%) | 14 (4.9%) |
| 65 to 69 Years | 10 (3.0%) | 17 (5.9%) |
| 70 to 74 Years | 15 (4.5%) | 5 (1.7%) |
| 75 to 79 Years | 14 (4.2%) | 18 (6.2%) |
| 80 to 84 Years | 6 (1.8%) | 11 (3.8%) |
| 85 Years and over | 8 (2.4%) | 11 (3.8%) |
| Total | 333 (100.0%) | 288 (100.0%) |
Families and Households in Woodland Hills
Median Family Size in Woodland Hills
The median family size in Woodland Hills is 3.12 persons per family, with married-couple families (128 | 74.9%) accounting for the largest median family size of 3.33 persons per family. On the other hand, single female/mother families (28 | 16.4%) represent the smallest median family size with 2.32 persons per family.
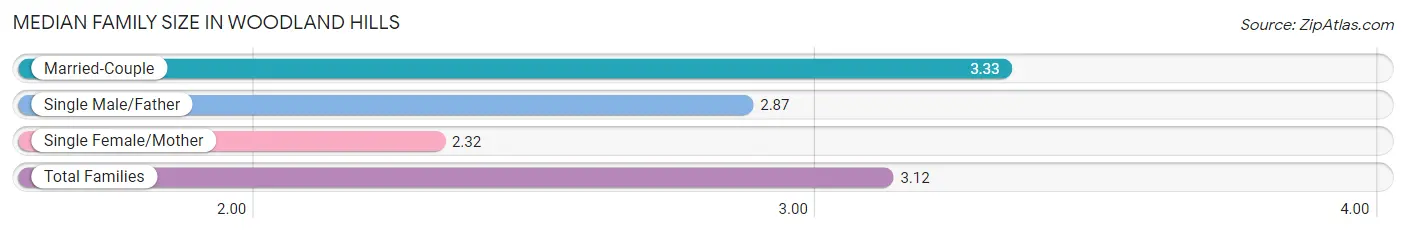
| Family Type | # Families | Family Size |
| Married-Couple | 128 (74.9%) | 3.33 |
| Single Male/Father | 15 (8.8%) | 2.87 |
| Single Female/Mother | 28 (16.4%) | 2.32 |
| Total Families | 171 (100.0%) | 3.12 |
Median Household Size in Woodland Hills
The median household size in Woodland Hills is 2.45 persons per household, with married-couple households (128 | 50.6%) accounting for the largest median household size of 3.34 persons per household. non-family households (82 | 32.4%) represent the smallest median household size with 1.02 persons per household.
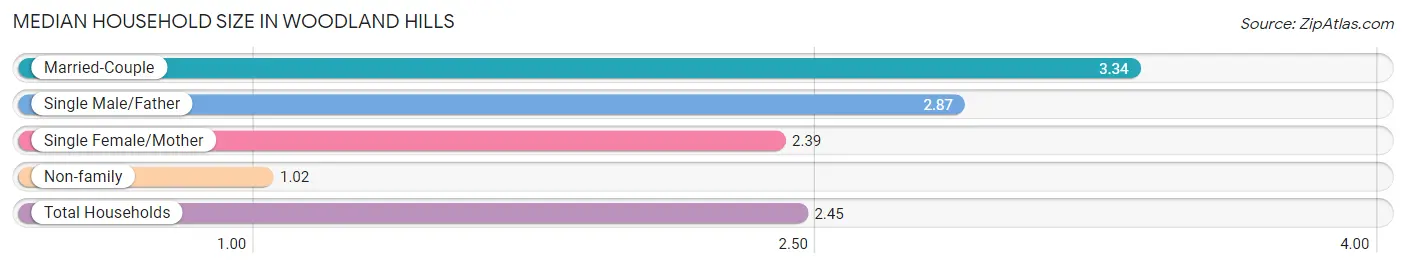
| Household Type | # Households | Household Size |
| Married-Couple | 128 (50.6%) | 3.34 |
| Single Male/Father | 15 (5.9%) | 2.87 |
| Single Female/Mother | 28 (11.1%) | 2.39 |
| Non-family | 82 (32.4%) | 1.02 |
| Total Households | 253 (100.0%) | 2.45 |
Household Size by Marriage Status in Woodland Hills
Out of a total of 253 households in Woodland Hills, 171 (67.6%) are family households, while 82 (32.4%) are nonfamily households. The most numerous type of family households are 2-person households, comprising 63, and the most common type of nonfamily households are 1-person households, comprising 80.
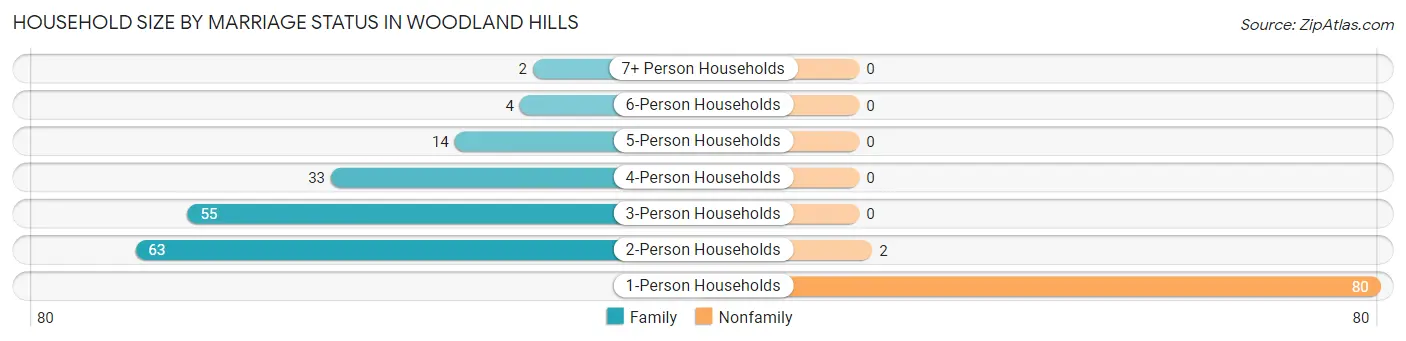
| Household Size | Family Households | Nonfamily Households |
| 1-Person Households | - | 80 (31.6%) |
| 2-Person Households | 63 (24.9%) | 2 (0.8%) |
| 3-Person Households | 55 (21.7%) | 0 (0.0%) |
| 4-Person Households | 33 (13.0%) | 0 (0.0%) |
| 5-Person Households | 14 (5.5%) | 0 (0.0%) |
| 6-Person Households | 4 (1.6%) | 0 (0.0%) |
| 7+ Person Households | 2 (0.8%) | 0 (0.0%) |
| Total | 171 (67.6%) | 82 (32.4%) |
Female Fertility in Woodland Hills
Fertility by Age in Woodland Hills
Average fertility rate in Woodland Hills is 28.0 births per 1,000 women. Women in the age bracket of 20 to 34 years have the highest fertility rate with 33.0 births per 1,000 women. Women in the age bracket of 20 to 34 years acount for 50.0% of all women with births.
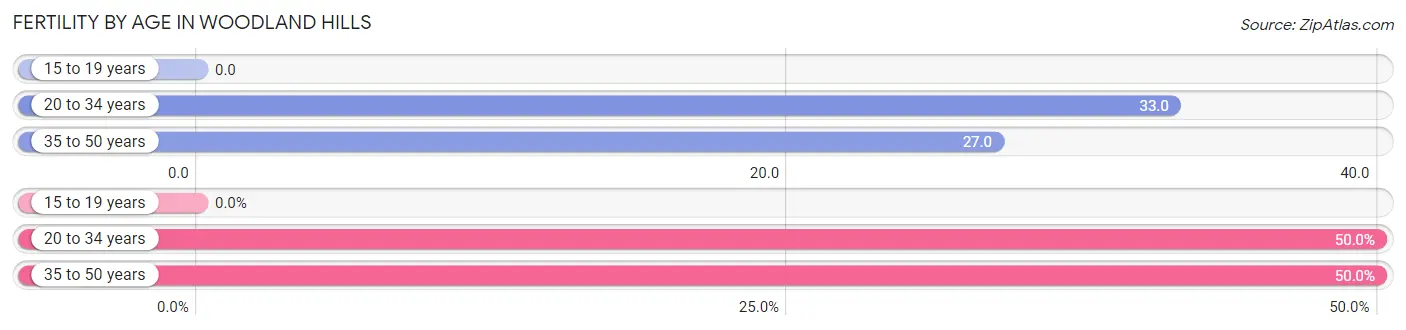
| Age Bracket | Women with Births | Births / 1,000 Women |
| 15 to 19 years | 0 (0.0%) | 0.0 |
| 20 to 34 years | 2 (50.0%) | 33.0 |
| 35 to 50 years | 2 (50.0%) | 27.0 |
| Total | 4 (100.0%) | 28.0 |
Fertility by Age by Marriage Status in Woodland Hills
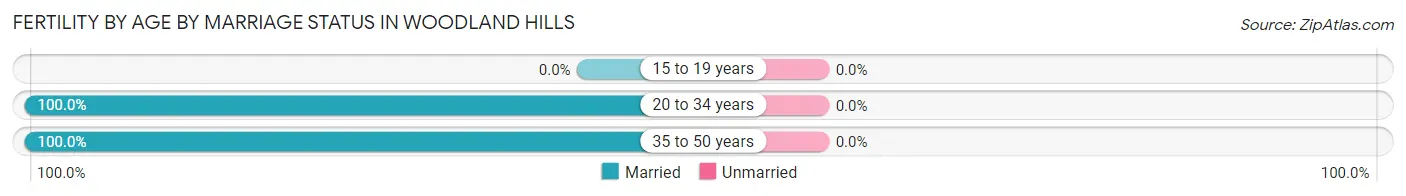
| Age Bracket | Married | Unmarried |
| 15 to 19 years | 0 (0.0%) | 0 (0.0%) |
| 20 to 34 years | 2 (100.0%) | 0 (0.0%) |
| 35 to 50 years | 2 (100.0%) | 0 (0.0%) |
| Total | 4 (100.0%) | 0 (0.0%) |
Fertility by Education in Woodland Hills
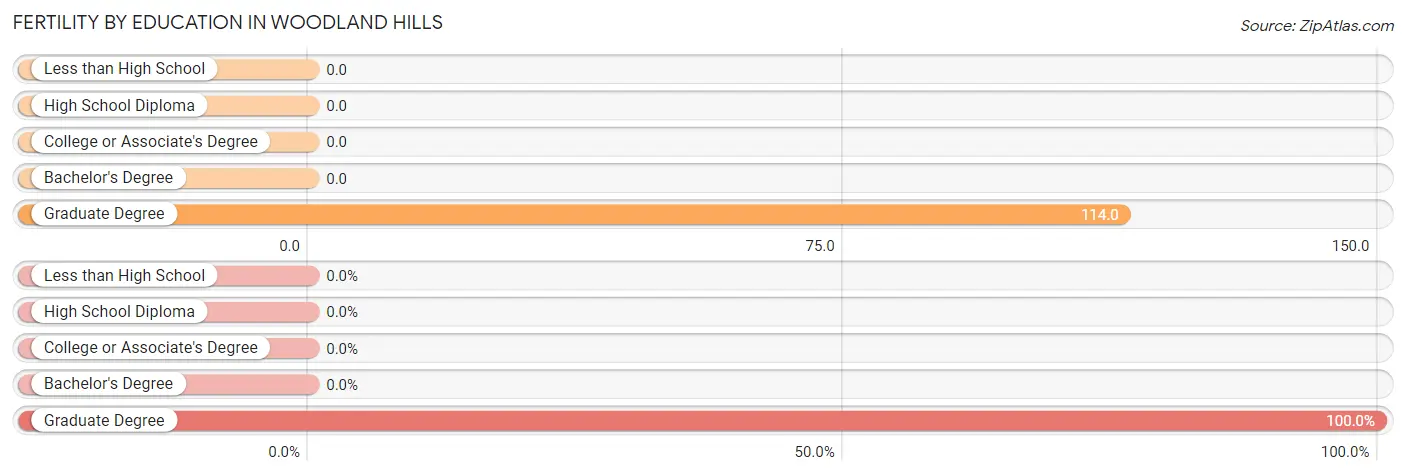
| Educational Attainment | Women with Births | Births / 1,000 Women |
| Less than High School | 0 (0.0%) | 0.0 |
| High School Diploma | 0 (0.0%) | 0.0 |
| College or Associate's Degree | 0 (0.0%) | 0.0 |
| Bachelor's Degree | 0 (0.0%) | 0.0 |
| Graduate Degree | 4 (100.0%) | 114.0 |
| Total | 4 (100.0%) | 28.0 |
Fertility by Education by Marriage Status in Woodland Hills
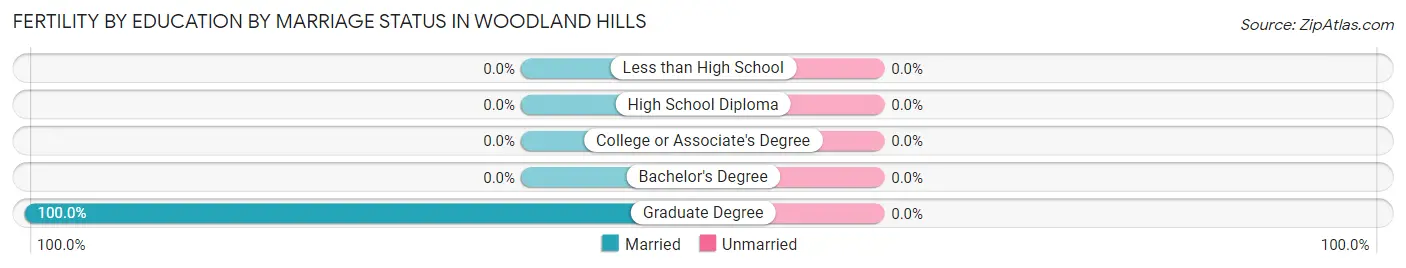
| Educational Attainment | Married | Unmarried |
| Less than High School | 0 (0.0%) | 0 (0.0%) |
| High School Diploma | 0 (0.0%) | 0 (0.0%) |
| College or Associate's Degree | 0 (0.0%) | 0 (0.0%) |
| Bachelor's Degree | 0 (0.0%) | 0 (0.0%) |
| Graduate Degree | 4 (100.0%) | 0 (0.0%) |
| Total | 4 (100.0%) | 0 (0.0%) |
Employment Characteristics in Woodland Hills
Employment by Class of Employer in Woodland Hills
Among the 340 employed individuals in Woodland Hills, private company employees (244 | 71.8%), not-for-profit organizations (37 | 10.9%), and self-employed (incorporated) (15 | 4.4%) make up the most common classes of employment.
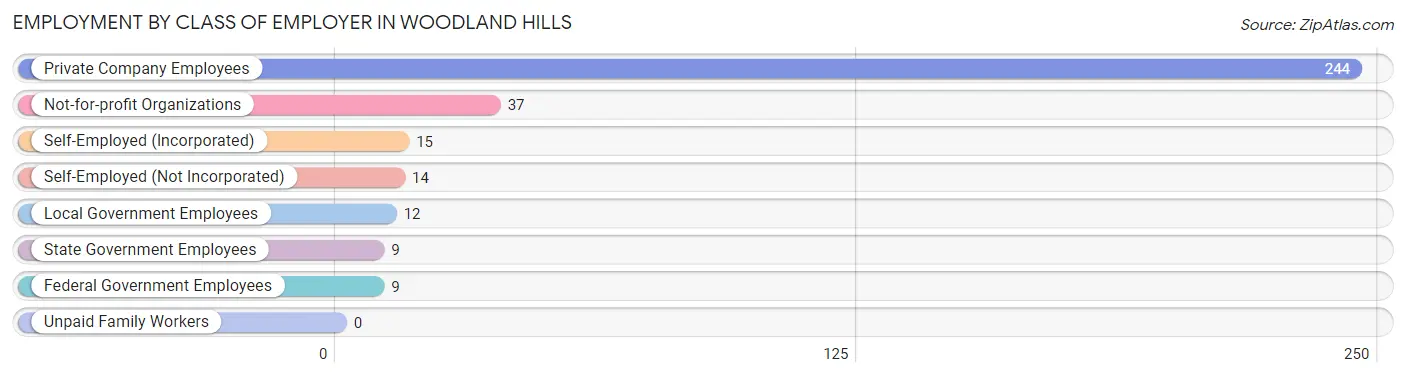
| Employer Class | # Employees | % Employees |
| Private Company Employees | 244 | 71.8% |
| Self-Employed (Incorporated) | 15 | 4.4% |
| Self-Employed (Not Incorporated) | 14 | 4.1% |
| Not-for-profit Organizations | 37 | 10.9% |
| Local Government Employees | 12 | 3.5% |
| State Government Employees | 9 | 2.6% |
| Federal Government Employees | 9 | 2.6% |
| Unpaid Family Workers | 0 | 0.0% |
| Total | 340 | 100.0% |
Employment Status by Age in Woodland Hills
According to the labor force statistics for Woodland Hills, out of the total population over 16 years of age (478), 73.0% or 349 individuals are in the labor force, with 1.4% or 5 of them unemployed. The age group with the highest labor force participation rate is 25 to 29 years, with 100.0% or 23 individuals in the labor force. Within the labor force, the 16 to 19 years age range has the highest percentage of unemployed individuals, with 15.4% or 2 of them being unemployed.
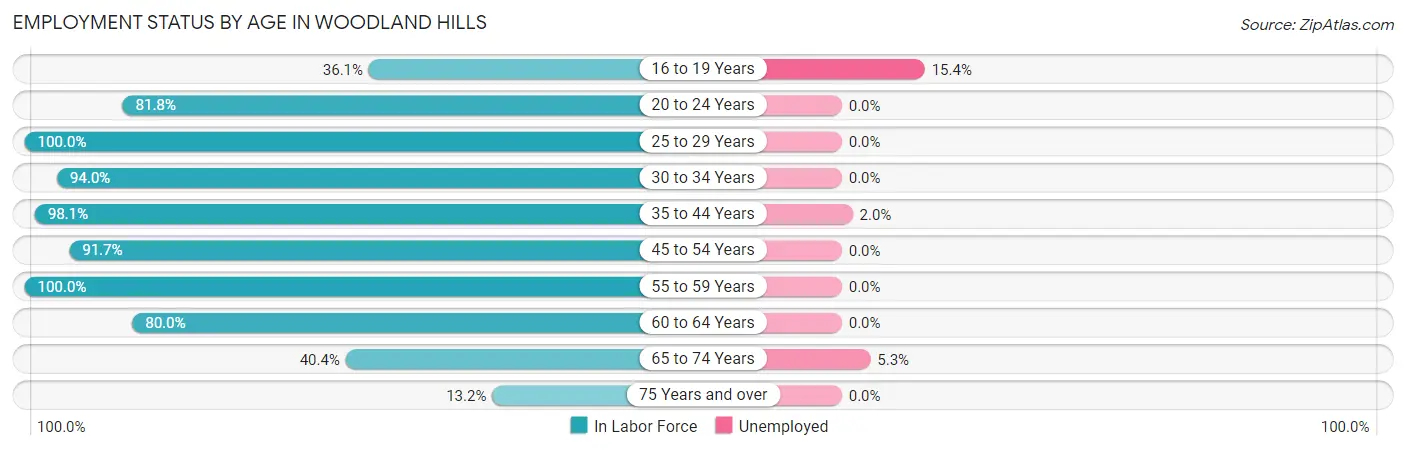
| Age Bracket | In Labor Force | Unemployed |
| 16 to 19 Years | 13 (36.1%) | 2 (15.4%) |
| 20 to 24 Years | 9 (81.8%) | 0 (0.0%) |
| 25 to 29 Years | 23 (100.0%) | 0 (0.0%) |
| 30 to 34 Years | 63 (94.0%) | 0 (0.0%) |
| 35 to 44 Years | 101 (98.1%) | 2 (2.0%) |
| 45 to 54 Years | 55 (91.7%) | 0 (0.0%) |
| 55 to 59 Years | 33 (100.0%) | 0 (0.0%) |
| 60 to 64 Years | 24 (80.0%) | 0 (0.0%) |
| 65 to 74 Years | 19 (40.4%) | 1 (5.3%) |
| 75 Years and over | 9 (13.2%) | 0 (0.0%) |
| Total | 349 (73.0%) | 5 (1.4%) |
Employment Status by Educational Attainment in Woodland Hills
According to labor force statistics for Woodland Hills, 94.6% of individuals (299) out of the total population between 25 and 64 years of age (316) are in the labor force, with 0.7% or 2 of them being unemployed. The group with the highest labor force participation rate are those with the educational attainment of bachelor's degree or higher, with 96.4% or 187 individuals in the labor force. Within the labor force, individuals with college / associate degree education have the highest percentage of unemployment, with 2.2% or 2 of them being unemployed.
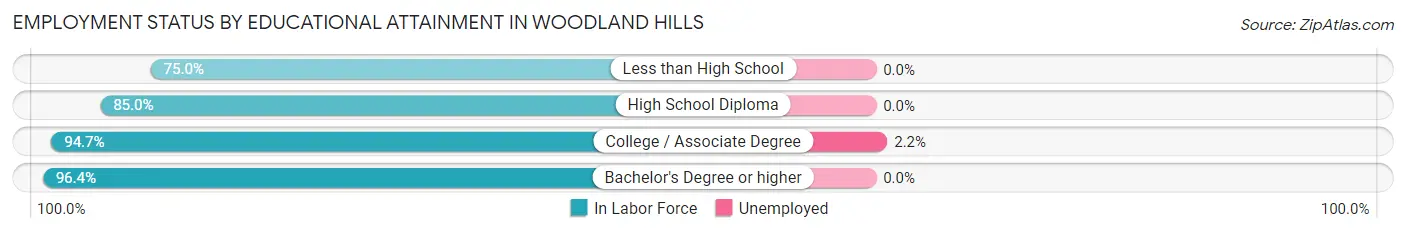
| Educational Attainment | In Labor Force | Unemployed |
| Less than High School | 6 (75.0%) | 0 (0.0%) |
| High School Diploma | 17 (85.0%) | 0 (0.0%) |
| College / Associate Degree | 89 (94.7%) | 2 (2.2%) |
| Bachelor's Degree or higher | 187 (96.4%) | 0 (0.0%) |
| Total | 299 (94.6%) | 2 (0.7%) |
Employment Occupations by Sex in Woodland Hills
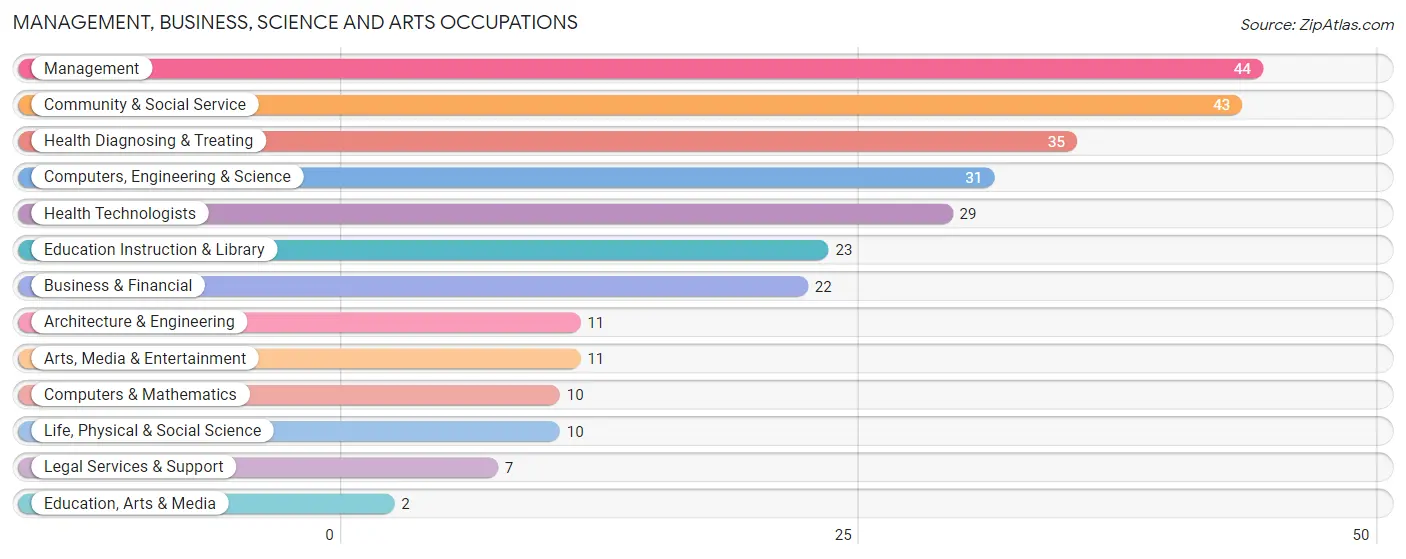
Management, Business, Science and Arts Occupations
The most common Management, Business, Science and Arts occupations in Woodland Hills are Management (44 | 12.8%), Community & Social Service (43 | 12.5%), Health Diagnosing & Treating (35 | 10.2%), Computers, Engineering & Science (31 | 9.0%), and Health Technologists (29 | 8.4%).
Management, Business, Science and Arts Occupations by Sex
Within the Management, Business, Science and Arts occupations in Woodland Hills, the most male-oriented occupations are Architecture & Engineering (72.7%), Life, Physical & Social Science (70.0%), and Arts, Media & Entertainment (63.6%), while the most female-oriented occupations are Education, Arts & Media (100.0%), Computers & Mathematics (80.0%), and Health Technologists (79.3%).
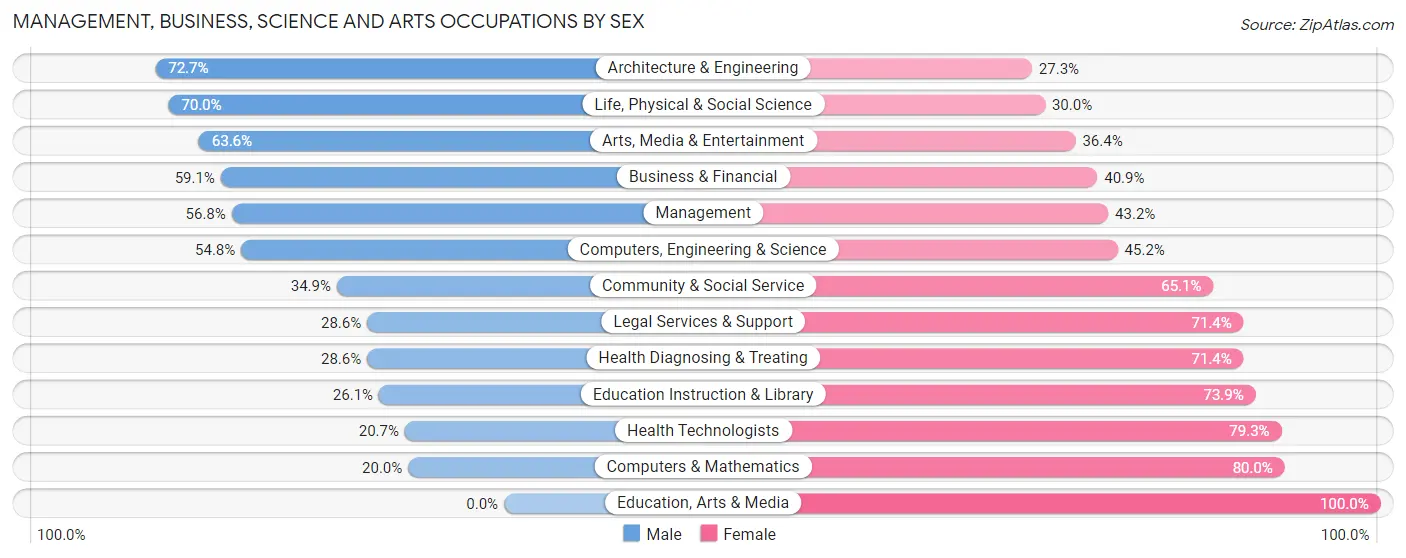
| Occupation | Male | Female |
| Management | 25 (56.8%) | 19 (43.2%) |
| Business & Financial | 13 (59.1%) | 9 (40.9%) |
| Computers, Engineering & Science | 17 (54.8%) | 14 (45.2%) |
| Computers & Mathematics | 2 (20.0%) | 8 (80.0%) |
| Architecture & Engineering | 8 (72.7%) | 3 (27.3%) |
| Life, Physical & Social Science | 7 (70.0%) | 3 (30.0%) |
| Community & Social Service | 15 (34.9%) | 28 (65.1%) |
| Education, Arts & Media | 0 (0.0%) | 2 (100.0%) |
| Legal Services & Support | 2 (28.6%) | 5 (71.4%) |
| Education Instruction & Library | 6 (26.1%) | 17 (73.9%) |
| Arts, Media & Entertainment | 7 (63.6%) | 4 (36.4%) |
| Health Diagnosing & Treating | 10 (28.6%) | 25 (71.4%) |
| Health Technologists | 6 (20.7%) | 23 (79.3%) |
| Total (Category) | 80 (45.7%) | 95 (54.3%) |
| Total (Overall) | 163 (47.4%) | 181 (52.6%) |
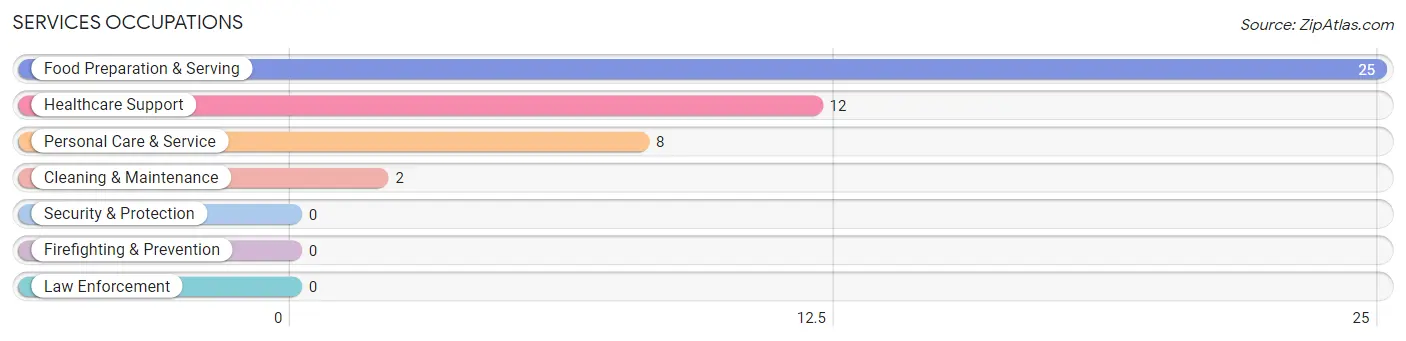
Services Occupations
The most common Services occupations in Woodland Hills are Food Preparation & Serving (25 | 7.3%), Healthcare Support (12 | 3.5%), Personal Care & Service (8 | 2.3%), and Cleaning & Maintenance (2 | 0.6%).
Services Occupations by Sex
Within the Services occupations in Woodland Hills, the most male-oriented occupations are Cleaning & Maintenance (100.0%), Personal Care & Service (100.0%), and Food Preparation & Serving (44.0%), while the most female-oriented occupations are Healthcare Support (100.0%), and Food Preparation & Serving (56.0%).
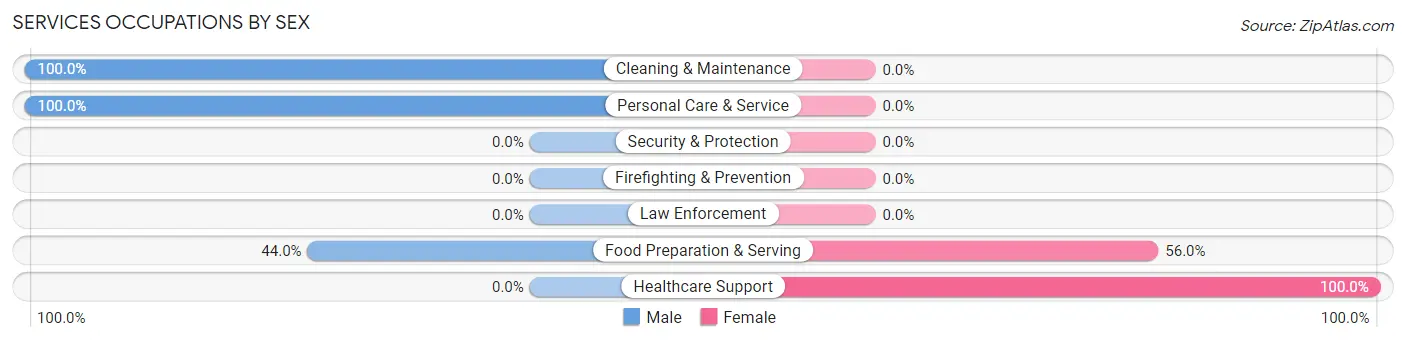
| Occupation | Male | Female |
| Healthcare Support | 0 (0.0%) | 12 (100.0%) |
| Security & Protection | 0 (0.0%) | 0 (0.0%) |
| Firefighting & Prevention | 0 (0.0%) | 0 (0.0%) |
| Law Enforcement | 0 (0.0%) | 0 (0.0%) |
| Food Preparation & Serving | 11 (44.0%) | 14 (56.0%) |
| Cleaning & Maintenance | 2 (100.0%) | 0 (0.0%) |
| Personal Care & Service | 8 (100.0%) | 0 (0.0%) |
| Total (Category) | 21 (44.7%) | 26 (55.3%) |
| Total (Overall) | 163 (47.4%) | 181 (52.6%) |
Sales and Office Occupations
The most common Sales and Office occupations in Woodland Hills are Sales & Related (55 | 16.0%), and Office & Administration (32 | 9.3%).
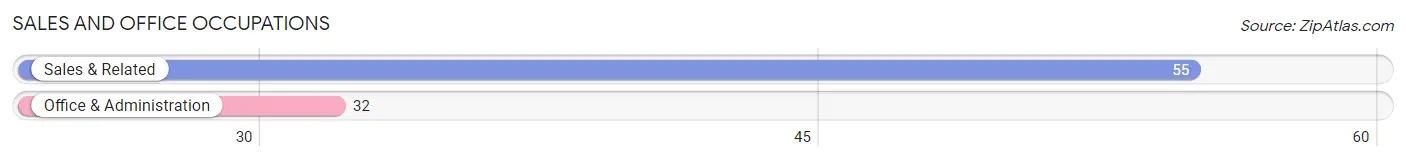
Sales and Office Occupations by Sex

| Occupation | Male | Female |
| Sales & Related | 27 (49.1%) | 28 (50.9%) |
| Office & Administration | 4 (12.5%) | 28 (87.5%) |
| Total (Category) | 31 (35.6%) | 56 (64.4%) |
| Total (Overall) | 163 (47.4%) | 181 (52.6%) |
Natural Resources, Construction and Maintenance Occupations
The most common Natural Resources, Construction and Maintenance occupations in Woodland Hills are , and Construction & Extraction (16 | 4.6%).
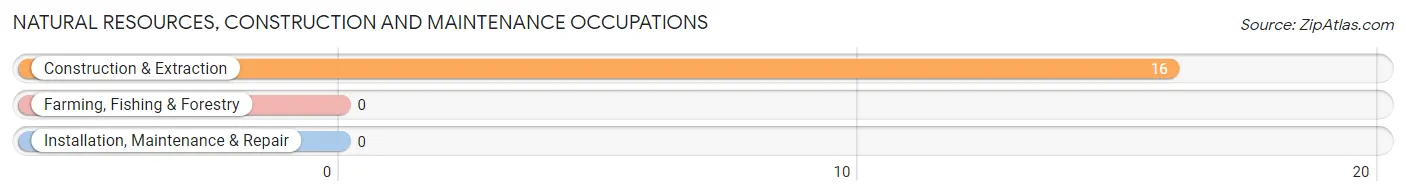
Natural Resources, Construction and Maintenance Occupations by Sex
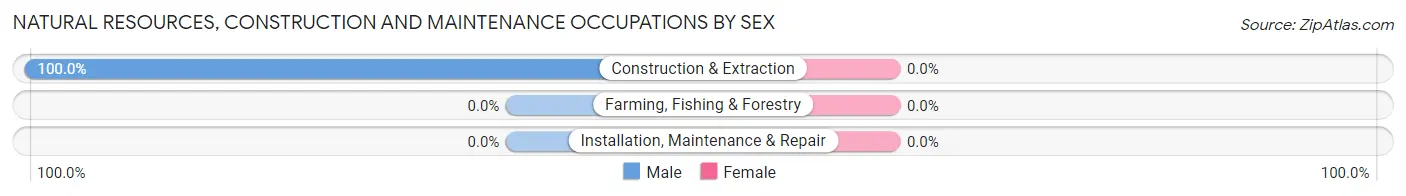
| Occupation | Male | Female |
| Farming, Fishing & Forestry | 0 (0.0%) | 0 (0.0%) |
| Construction & Extraction | 16 (100.0%) | 0 (0.0%) |
| Installation, Maintenance & Repair | 0 (0.0%) | 0 (0.0%) |
| Total (Category) | 16 (100.0%) | 0 (0.0%) |
| Total (Overall) | 163 (47.4%) | 181 (52.6%) |
Production, Transportation and Moving Occupations
The most common Production, Transportation and Moving occupations in Woodland Hills are Production (13 | 3.8%), Transportation (5 | 1.5%), and Material Moving (1 | 0.3%).
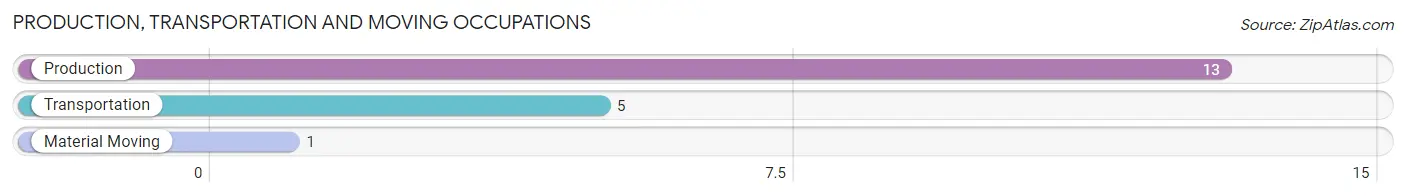
Production, Transportation and Moving Occupations by Sex
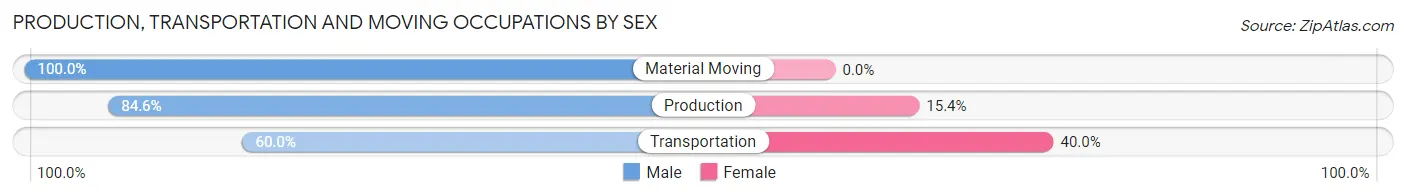
| Occupation | Male | Female |
| Production | 11 (84.6%) | 2 (15.4%) |
| Transportation | 3 (60.0%) | 2 (40.0%) |
| Material Moving | 1 (100.0%) | 0 (0.0%) |
| Total (Category) | 15 (78.9%) | 4 (21.0%) |
| Total (Overall) | 163 (47.4%) | 181 (52.6%) |
Employment Industries by Sex in Woodland Hills
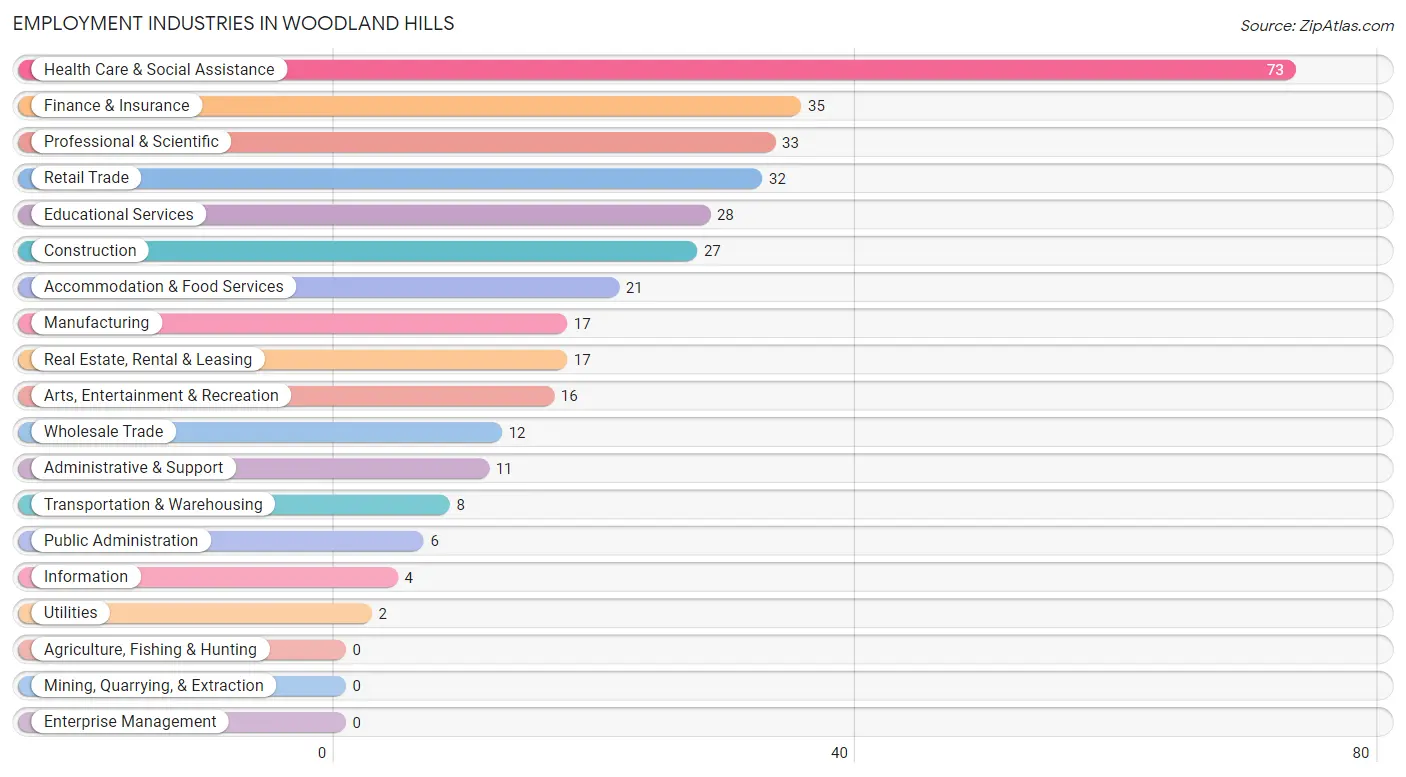
Employment Industries in Woodland Hills
The major employment industries in Woodland Hills include Health Care & Social Assistance (73 | 21.2%), Finance & Insurance (35 | 10.2%), Professional & Scientific (33 | 9.6%), Retail Trade (32 | 9.3%), and Educational Services (28 | 8.1%).
Employment Industries by Sex in Woodland Hills
The Woodland Hills industries that see more men than women are Utilities (100.0%), Information (100.0%), and Administrative & Support (100.0%), whereas the industries that tend to have a higher number of women are Educational Services (78.6%), Professional & Scientific (75.8%), and Health Care & Social Assistance (75.3%).
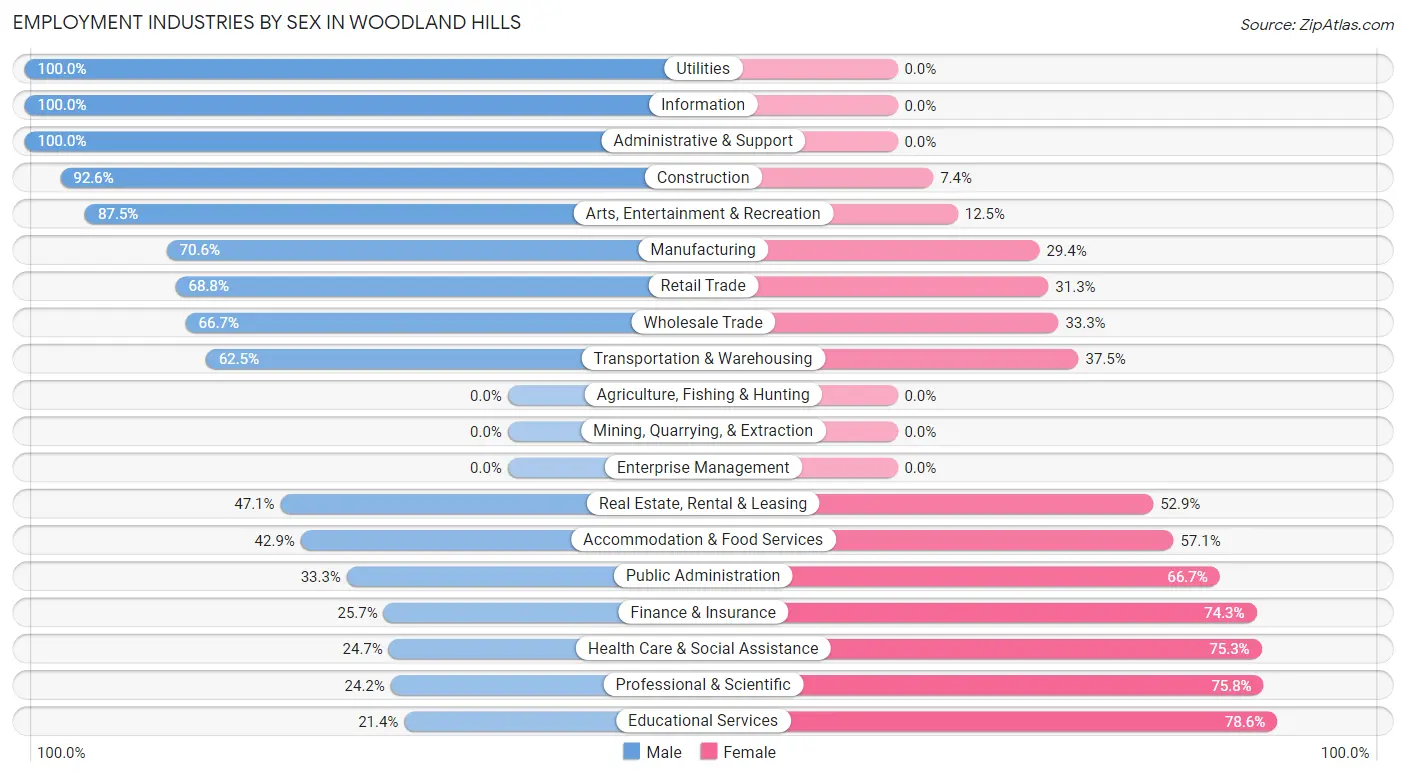
| Industry | Male | Female |
| Agriculture, Fishing & Hunting | 0 (0.0%) | 0 (0.0%) |
| Mining, Quarrying, & Extraction | 0 (0.0%) | 0 (0.0%) |
| Construction | 25 (92.6%) | 2 (7.4%) |
| Manufacturing | 12 (70.6%) | 5 (29.4%) |
| Wholesale Trade | 8 (66.7%) | 4 (33.3%) |
| Retail Trade | 22 (68.8%) | 10 (31.2%) |
| Transportation & Warehousing | 5 (62.5%) | 3 (37.5%) |
| Utilities | 2 (100.0%) | 0 (0.0%) |
| Information | 4 (100.0%) | 0 (0.0%) |
| Finance & Insurance | 9 (25.7%) | 26 (74.3%) |
| Real Estate, Rental & Leasing | 8 (47.1%) | 9 (52.9%) |
| Professional & Scientific | 8 (24.2%) | 25 (75.8%) |
| Enterprise Management | 0 (0.0%) | 0 (0.0%) |
| Administrative & Support | 11 (100.0%) | 0 (0.0%) |
| Educational Services | 6 (21.4%) | 22 (78.6%) |
| Health Care & Social Assistance | 18 (24.7%) | 55 (75.3%) |
| Arts, Entertainment & Recreation | 14 (87.5%) | 2 (12.5%) |
| Accommodation & Food Services | 9 (42.9%) | 12 (57.1%) |
| Public Administration | 2 (33.3%) | 4 (66.7%) |
| Total | 163 (47.4%) | 181 (52.6%) |
Education in Woodland Hills
School Enrollment in Woodland Hills
The most common levels of schooling among the 178 students in Woodland Hills are elementary school (48 | 27.0%), high school (42 | 23.6%), and middle school (30 | 16.9%).
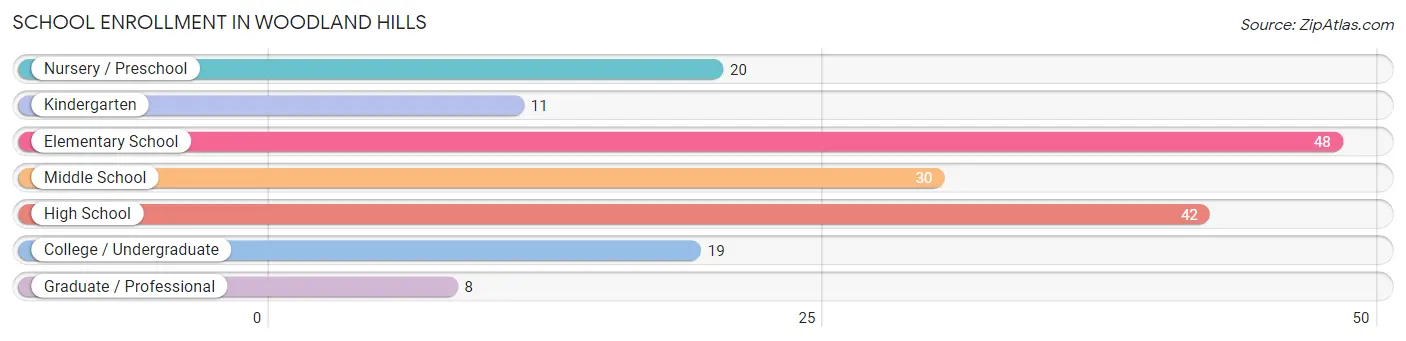
| School Level | # Students | % Students |
| Nursery / Preschool | 20 | 11.2% |
| Kindergarten | 11 | 6.2% |
| Elementary School | 48 | 27.0% |
| Middle School | 30 | 16.9% |
| High School | 42 | 23.6% |
| College / Undergraduate | 19 | 10.7% |
| Graduate / Professional | 8 | 4.5% |
| Total | 178 | 100.0% |
School Enrollment by Age by Funding Source in Woodland Hills
Out of a total of 178 students who are enrolled in schools in Woodland Hills, 54 (30.3%) attend a private institution, while the remaining 124 (69.7%) are enrolled in public schools. The age group of 20 to 24 year olds has the highest likelihood of being enrolled in private schools, with 2 (100.0% in the age bracket) enrolled. Conversely, the age group of 18 to 19 year olds has the lowest likelihood of being enrolled in a private school, with 6 (100.0% in the age bracket) attending a public institution.
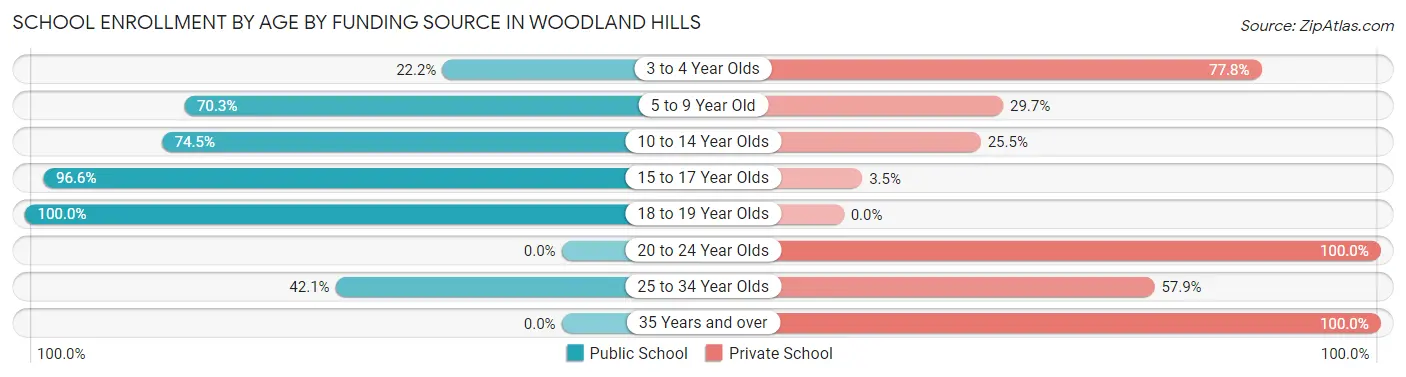
| Age Bracket | Public School | Private School |
| 3 to 4 Year Olds | 2 (22.2%) | 7 (77.8%) |
| 5 to 9 Year Old | 45 (70.3%) | 19 (29.7%) |
| 10 to 14 Year Olds | 35 (74.5%) | 12 (25.5%) |
| 15 to 17 Year Olds | 28 (96.6%) | 1 (3.5%) |
| 18 to 19 Year Olds | 6 (100.0%) | 0 (0.0%) |
| 20 to 24 Year Olds | 0 (0.0%) | 2 (100.0%) |
| 25 to 34 Year Olds | 8 (42.1%) | 11 (57.9%) |
| 35 Years and over | 0 (0.0%) | 2 (100.0%) |
| Total | 124 (69.7%) | 54 (30.3%) |
Educational Attainment by Field of Study in Woodland Hills
Business (67 | 25.5%), social sciences (48 | 18.2%), science & technology (26 | 9.9%), bio, nature & agricultural (18 | 6.8%), and engineering (18 | 6.8%) are the most common fields of study among 263 individuals in Woodland Hills who have obtained a bachelor's degree or higher.
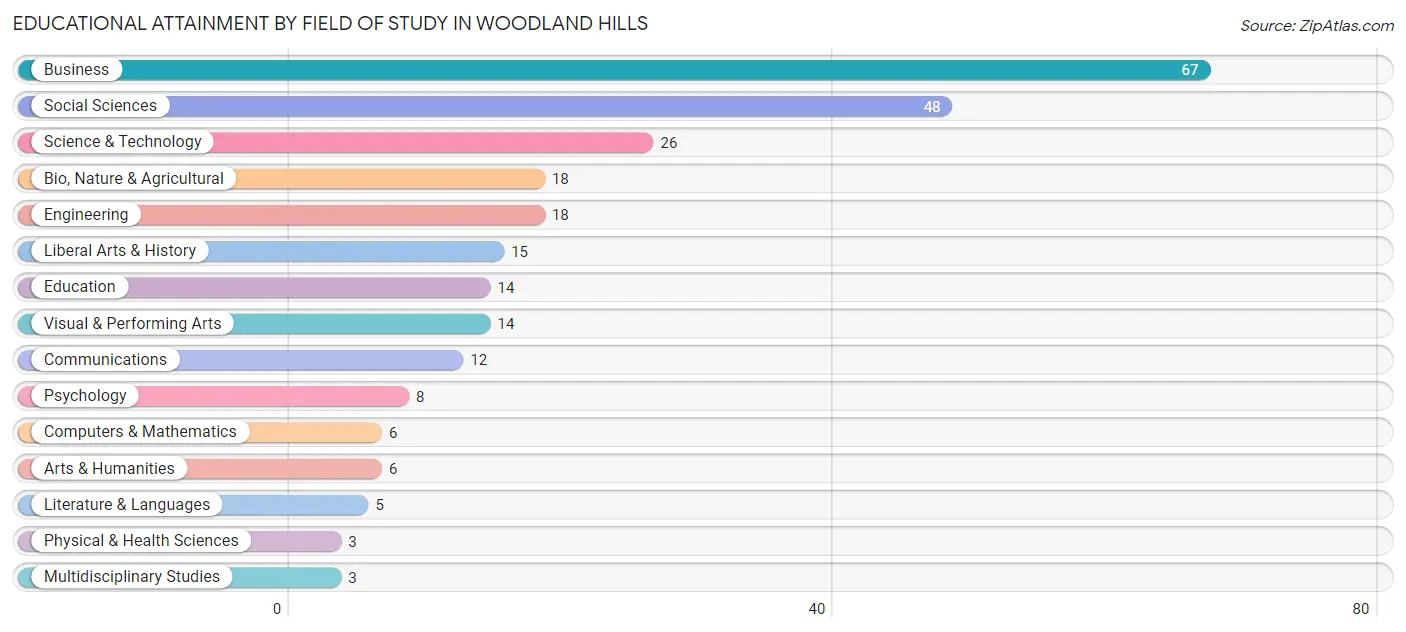
| Field of Study | # Graduates | % Graduates |
| Computers & Mathematics | 6 | 2.3% |
| Bio, Nature & Agricultural | 18 | 6.8% |
| Physical & Health Sciences | 3 | 1.1% |
| Psychology | 8 | 3.0% |
| Social Sciences | 48 | 18.2% |
| Engineering | 18 | 6.8% |
| Multidisciplinary Studies | 3 | 1.1% |
| Science & Technology | 26 | 9.9% |
| Business | 67 | 25.5% |
| Education | 14 | 5.3% |
| Literature & Languages | 5 | 1.9% |
| Liberal Arts & History | 15 | 5.7% |
| Visual & Performing Arts | 14 | 5.3% |
| Communications | 12 | 4.6% |
| Arts & Humanities | 6 | 2.3% |
| Total | 263 | 100.0% |
Transportation & Commute in Woodland Hills
Vehicle Availability by Sex in Woodland Hills
The most prevalent vehicle ownership categories in Woodland Hills are males with 2 vehicles (67, accounting for 41.1%) and females with 2 vehicles (78, making up 37.9%).
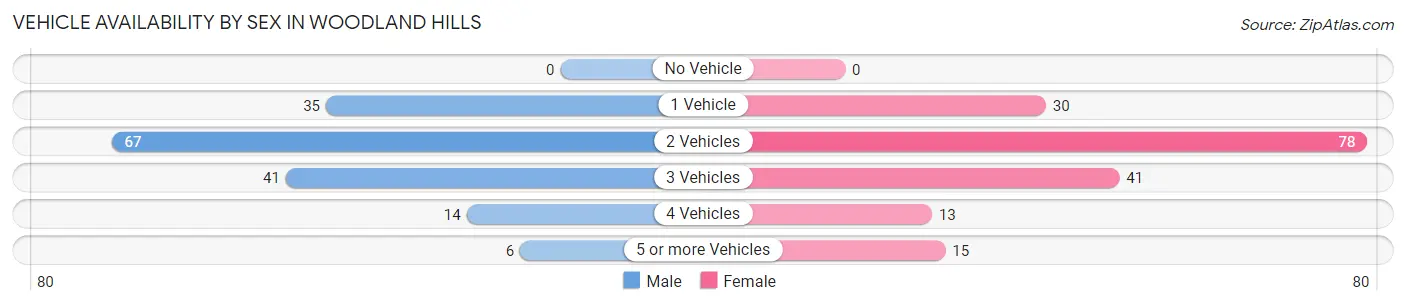
| Vehicles Available | Male | Female |
| No Vehicle | 0 (0.0%) | 0 (0.0%) |
| 1 Vehicle | 35 (21.5%) | 30 (17.0%) |
| 2 Vehicles | 67 (41.1%) | 78 (44.1%) |
| 3 Vehicles | 41 (25.2%) | 41 (23.2%) |
| 4 Vehicles | 14 (8.6%) | 13 (7.3%) |
| 5 or more Vehicles | 6 (3.7%) | 15 (8.5%) |
| Total | 163 (100.0%) | 177 (100.0%) |
Commute Time in Woodland Hills
The most frequently occuring commute durations in Woodland Hills are 20 to 24 minutes (90 commuters, 29.3%), 10 to 14 minutes (46 commuters, 15.0%), and 30 to 34 minutes (40 commuters, 13.0%).
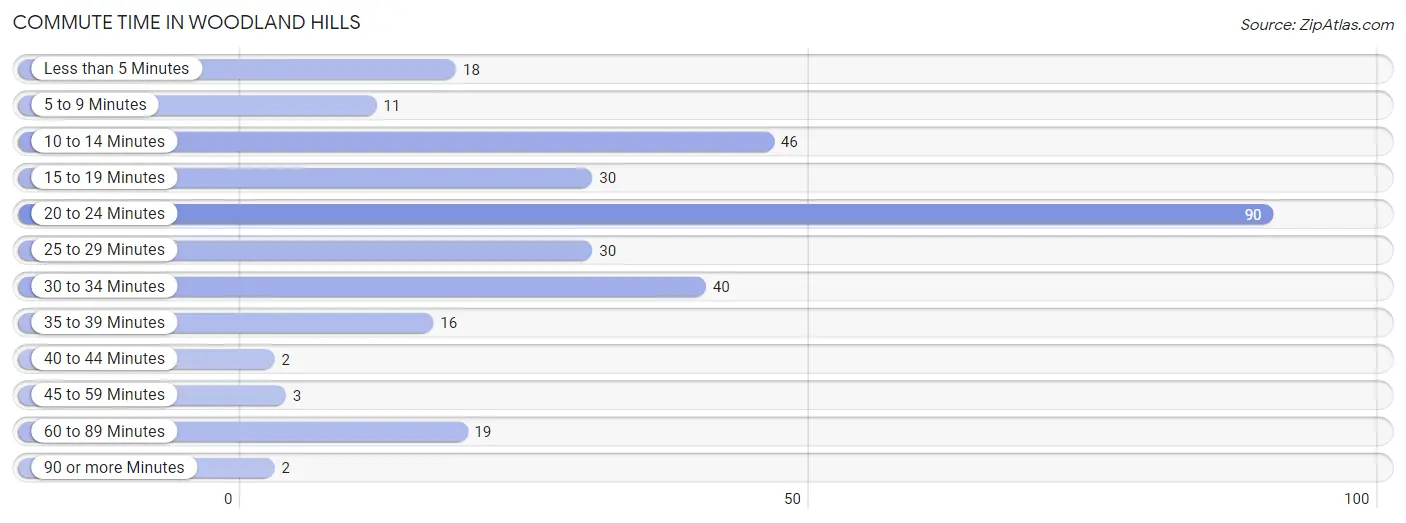
| Commute Time | # Commuters | % Commuters |
| Less than 5 Minutes | 18 | 5.9% |
| 5 to 9 Minutes | 11 | 3.6% |
| 10 to 14 Minutes | 46 | 15.0% |
| 15 to 19 Minutes | 30 | 9.8% |
| 20 to 24 Minutes | 90 | 29.3% |
| 25 to 29 Minutes | 30 | 9.8% |
| 30 to 34 Minutes | 40 | 13.0% |
| 35 to 39 Minutes | 16 | 5.2% |
| 40 to 44 Minutes | 2 | 0.6% |
| 45 to 59 Minutes | 3 | 1.0% |
| 60 to 89 Minutes | 19 | 6.2% |
| 90 or more Minutes | 2 | 0.6% |
Commute Time by Sex in Woodland Hills
The most common commute times in Woodland Hills are 20 to 24 minutes (44 commuters, 29.7%) for males and 20 to 24 minutes (46 commuters, 28.9%) for females.
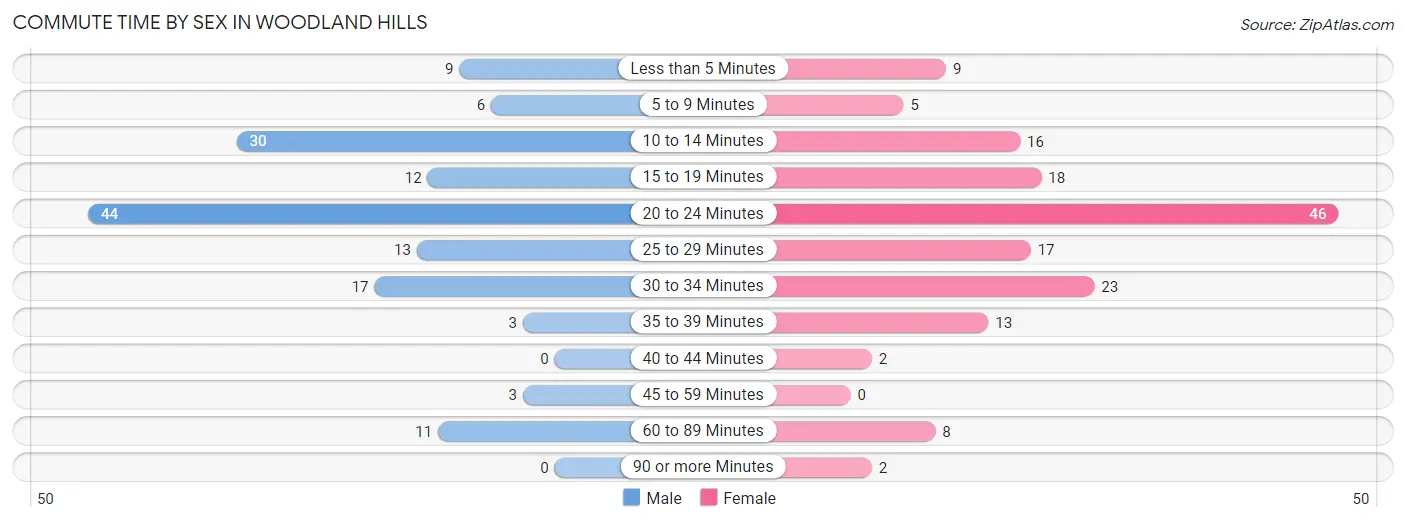
| Commute Time | Male | Female |
| Less than 5 Minutes | 9 (6.1%) | 9 (5.7%) |
| 5 to 9 Minutes | 6 (4.1%) | 5 (3.1%) |
| 10 to 14 Minutes | 30 (20.3%) | 16 (10.1%) |
| 15 to 19 Minutes | 12 (8.1%) | 18 (11.3%) |
| 20 to 24 Minutes | 44 (29.7%) | 46 (28.9%) |
| 25 to 29 Minutes | 13 (8.8%) | 17 (10.7%) |
| 30 to 34 Minutes | 17 (11.5%) | 23 (14.5%) |
| 35 to 39 Minutes | 3 (2.0%) | 13 (8.2%) |
| 40 to 44 Minutes | 0 (0.0%) | 2 (1.3%) |
| 45 to 59 Minutes | 3 (2.0%) | 0 (0.0%) |
| 60 to 89 Minutes | 11 (7.4%) | 8 (5.0%) |
| 90 or more Minutes | 0 (0.0%) | 2 (1.3%) |
Time of Departure to Work by Sex in Woodland Hills
The most frequent times of departure to work in Woodland Hills are 7:30 AM to 7:59 AM (23, 15.5%) for males and 8:30 AM to 8:59 AM (38, 23.9%) for females.
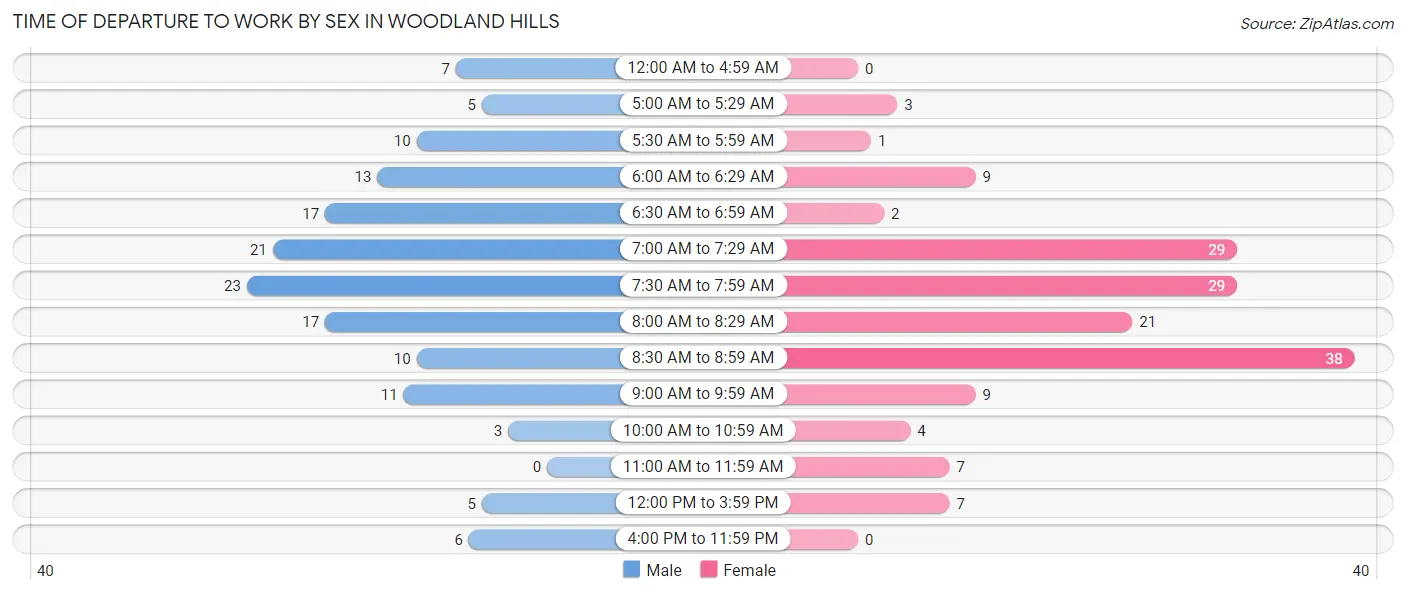
| Time of Departure | Male | Female |
| 12:00 AM to 4:59 AM | 7 (4.7%) | 0 (0.0%) |
| 5:00 AM to 5:29 AM | 5 (3.4%) | 3 (1.9%) |
| 5:30 AM to 5:59 AM | 10 (6.8%) | 1 (0.6%) |
| 6:00 AM to 6:29 AM | 13 (8.8%) | 9 (5.7%) |
| 6:30 AM to 6:59 AM | 17 (11.5%) | 2 (1.3%) |
| 7:00 AM to 7:29 AM | 21 (14.2%) | 29 (18.2%) |
| 7:30 AM to 7:59 AM | 23 (15.5%) | 29 (18.2%) |
| 8:00 AM to 8:29 AM | 17 (11.5%) | 21 (13.2%) |
| 8:30 AM to 8:59 AM | 10 (6.8%) | 38 (23.9%) |
| 9:00 AM to 9:59 AM | 11 (7.4%) | 9 (5.7%) |
| 10:00 AM to 10:59 AM | 3 (2.0%) | 4 (2.5%) |
| 11:00 AM to 11:59 AM | 0 (0.0%) | 7 (4.4%) |
| 12:00 PM to 3:59 PM | 5 (3.4%) | 7 (4.4%) |
| 4:00 PM to 11:59 PM | 6 (4.1%) | 0 (0.0%) |
| Total | 148 (100.0%) | 159 (100.0%) |
Housing Occupancy in Woodland Hills
Occupancy by Ownership in Woodland Hills
Of the total 253 dwellings in Woodland Hills, owner-occupied units account for 222 (87.7%), while renter-occupied units make up 31 (12.2%).
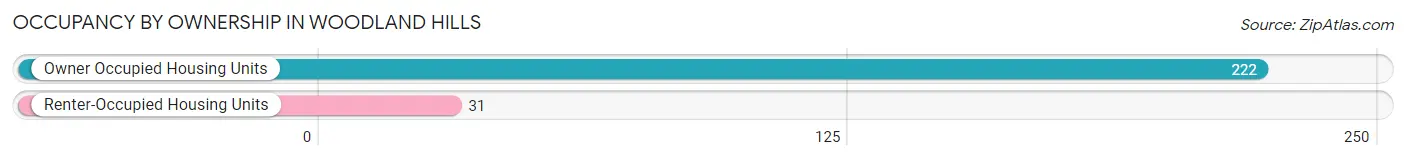
| Occupancy | # Housing Units | % Housing Units |
| Owner Occupied Housing Units | 222 | 87.7% |
| Renter-Occupied Housing Units | 31 | 12.2% |
| Total Occupied Housing Units | 253 | 100.0% |
Occupancy by Household Size in Woodland Hills
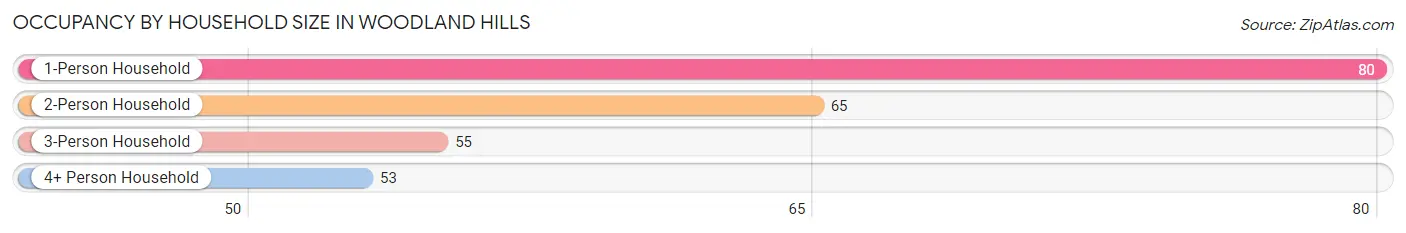
| Household Size | # Housing Units | % Housing Units |
| 1-Person Household | 80 | 31.6% |
| 2-Person Household | 65 | 25.7% |
| 3-Person Household | 55 | 21.7% |
| 4+ Person Household | 53 | 20.9% |
| Total Housing Units | 253 | 100.0% |
Occupancy by Ownership by Household Size in Woodland Hills
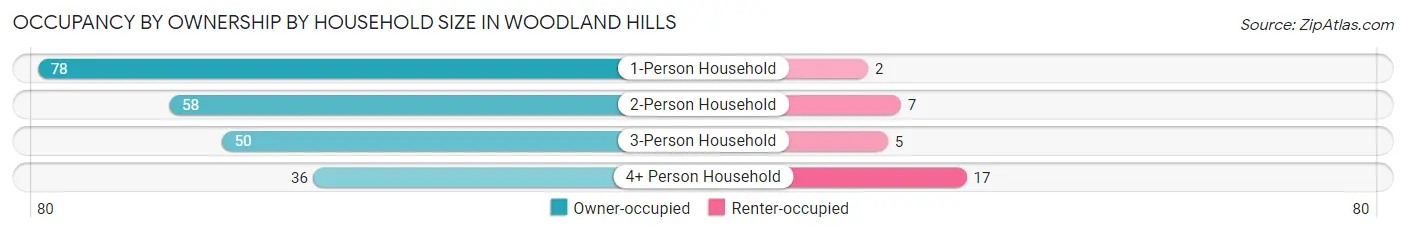
| Household Size | Owner-occupied | Renter-occupied |
| 1-Person Household | 78 (97.5%) | 2 (2.5%) |
| 2-Person Household | 58 (89.2%) | 7 (10.8%) |
| 3-Person Household | 50 (90.9%) | 5 (9.1%) |
| 4+ Person Household | 36 (67.9%) | 17 (32.1%) |
| Total Housing Units | 222 (87.7%) | 31 (12.2%) |
Occupancy by Educational Attainment in Woodland Hills
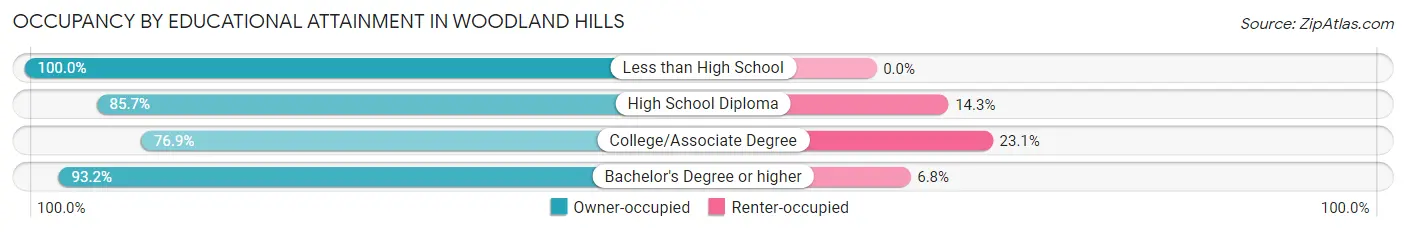
| Household Size | Owner-occupied | Renter-occupied |
| Less than High School | 6 (100.0%) | 0 (0.0%) |
| High School Diploma | 18 (85.7%) | 3 (14.3%) |
| College/Associate Degree | 60 (76.9%) | 18 (23.1%) |
| Bachelor's Degree or higher | 138 (93.2%) | 10 (6.8%) |
Occupancy by Age of Householder in Woodland Hills
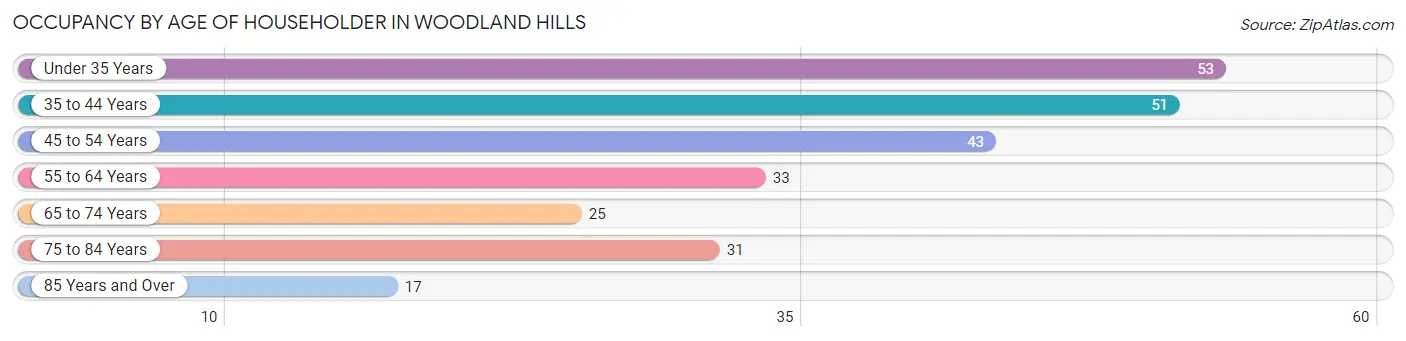
| Age Bracket | # Households | % Households |
| Under 35 Years | 53 | 20.9% |
| 35 to 44 Years | 51 | 20.2% |
| 45 to 54 Years | 43 | 17.0% |
| 55 to 64 Years | 33 | 13.0% |
| 65 to 74 Years | 25 | 9.9% |
| 75 to 84 Years | 31 | 12.2% |
| 85 Years and Over | 17 | 6.7% |
| Total | 253 | 100.0% |
Housing Finances in Woodland Hills
Median Income by Occupancy in Woodland Hills
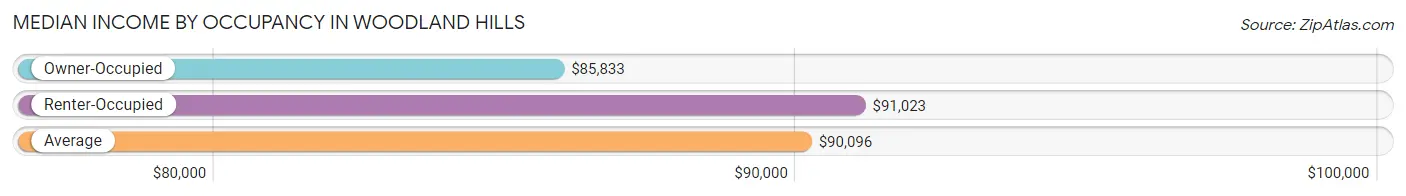
| Occupancy Type | # Households | Median Income |
| Owner-Occupied | 222 (87.7%) | $85,833 |
| Renter-Occupied | 31 (12.2%) | $91,023 |
| Average | 253 (100.0%) | $90,096 |
Occupancy by Householder Income Bracket in Woodland Hills
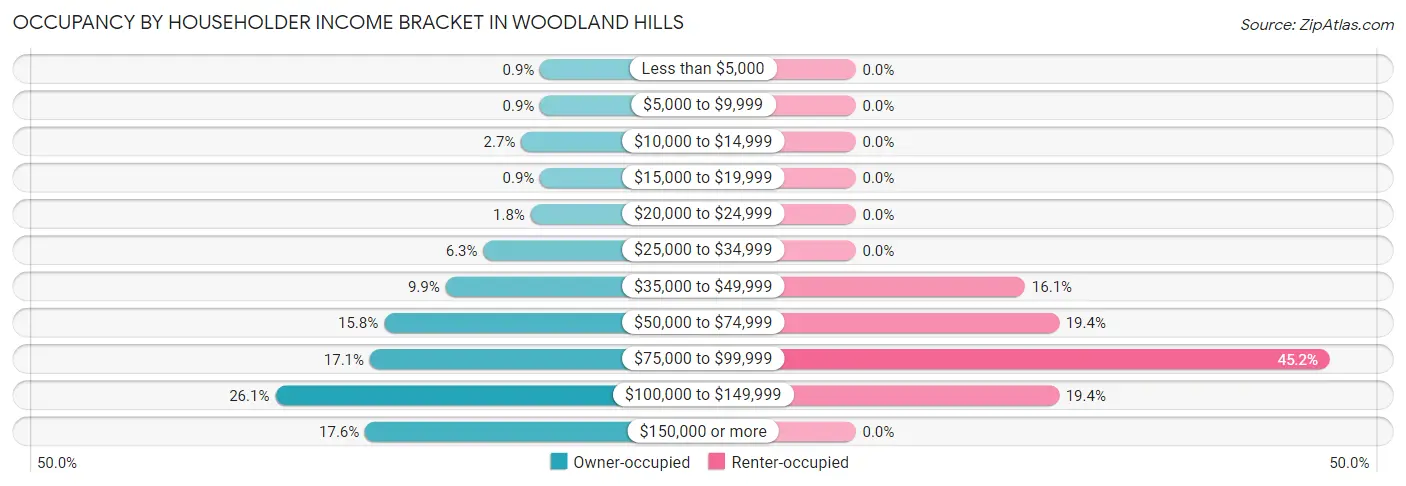
| Income Bracket | Owner-occupied | Renter-occupied |
| Less than $5,000 | 2 (0.9%) | 0 (0.0%) |
| $5,000 to $9,999 | 2 (0.9%) | 0 (0.0%) |
| $10,000 to $14,999 | 6 (2.7%) | 0 (0.0%) |
| $15,000 to $19,999 | 2 (0.9%) | 0 (0.0%) |
| $20,000 to $24,999 | 4 (1.8%) | 0 (0.0%) |
| $25,000 to $34,999 | 14 (6.3%) | 0 (0.0%) |
| $35,000 to $49,999 | 22 (9.9%) | 5 (16.1%) |
| $50,000 to $74,999 | 35 (15.8%) | 6 (19.4%) |
| $75,000 to $99,999 | 38 (17.1%) | 14 (45.2%) |
| $100,000 to $149,999 | 58 (26.1%) | 6 (19.4%) |
| $150,000 or more | 39 (17.6%) | 0 (0.0%) |
| Total | 222 (100.0%) | 31 (100.0%) |
Monthly Housing Cost Tiers in Woodland Hills
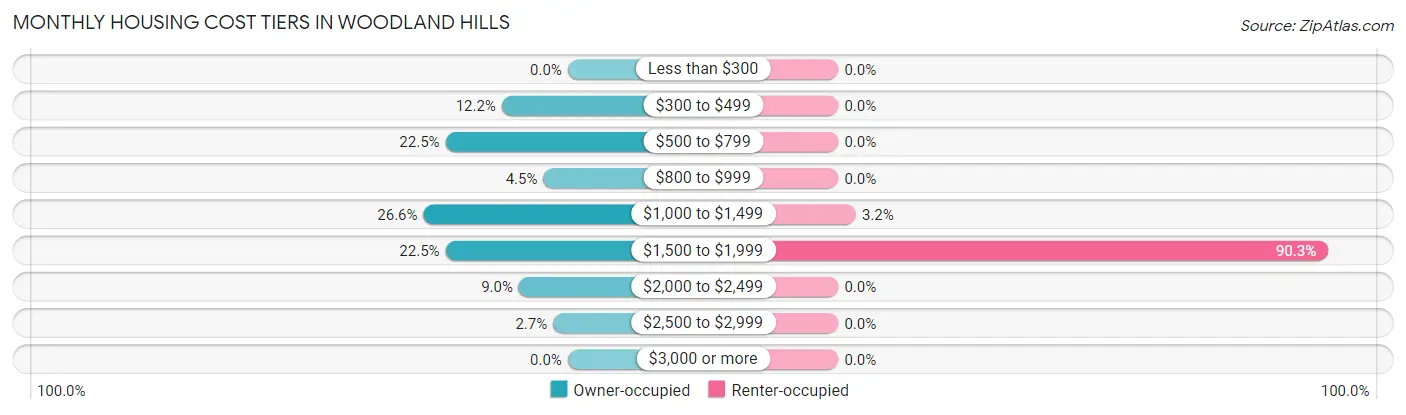
| Monthly Cost | Owner-occupied | Renter-occupied |
| Less than $300 | 0 (0.0%) | 0 (0.0%) |
| $300 to $499 | 27 (12.2%) | 0 (0.0%) |
| $500 to $799 | 50 (22.5%) | 0 (0.0%) |
| $800 to $999 | 10 (4.5%) | 0 (0.0%) |
| $1,000 to $1,499 | 59 (26.6%) | 1 (3.2%) |
| $1,500 to $1,999 | 50 (22.5%) | 28 (90.3%) |
| $2,000 to $2,499 | 20 (9.0%) | 0 (0.0%) |
| $2,500 to $2,999 | 6 (2.7%) | 0 (0.0%) |
| $3,000 or more | 0 (0.0%) | 0 (0.0%) |
| Total | 222 (100.0%) | 31 (100.0%) |
Physical Housing Characteristics in Woodland Hills
Housing Structures in Woodland Hills
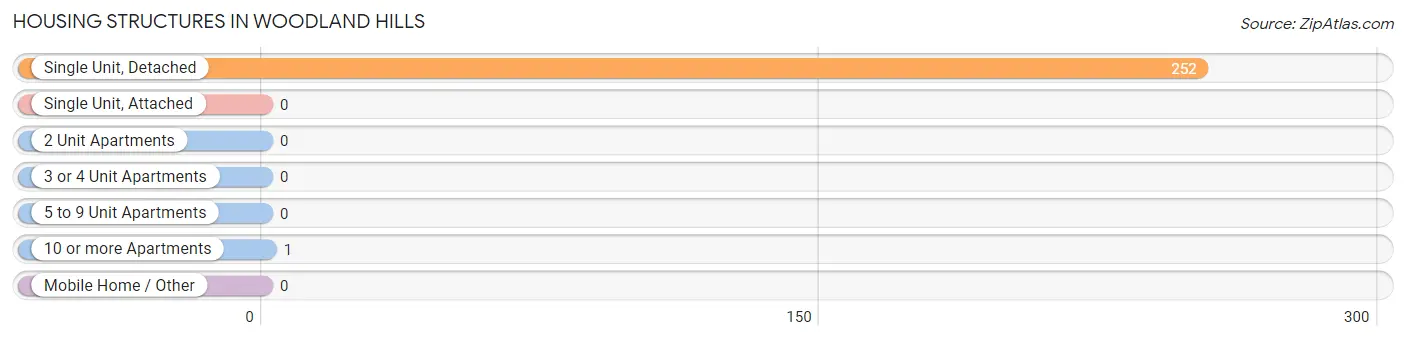
| Structure Type | # Housing Units | % Housing Units |
| Single Unit, Detached | 252 | 99.6% |
| Single Unit, Attached | 0 | 0.0% |
| 2 Unit Apartments | 0 | 0.0% |
| 3 or 4 Unit Apartments | 0 | 0.0% |
| 5 to 9 Unit Apartments | 0 | 0.0% |
| 10 or more Apartments | 1 | 0.4% |
| Mobile Home / Other | 0 | 0.0% |
| Total | 253 | 100.0% |
Housing Structures by Occupancy in Woodland Hills
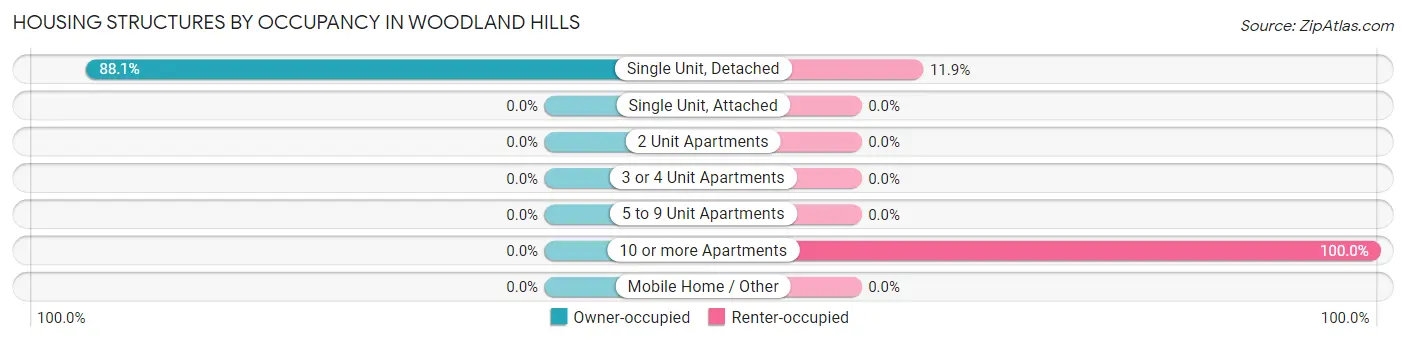
| Structure Type | Owner-occupied | Renter-occupied |
| Single Unit, Detached | 222 (88.1%) | 30 (11.9%) |
| Single Unit, Attached | 0 (0.0%) | 0 (0.0%) |
| 2 Unit Apartments | 0 (0.0%) | 0 (0.0%) |
| 3 or 4 Unit Apartments | 0 (0.0%) | 0 (0.0%) |
| 5 to 9 Unit Apartments | 0 (0.0%) | 0 (0.0%) |
| 10 or more Apartments | 0 (0.0%) | 1 (100.0%) |
| Mobile Home / Other | 0 (0.0%) | 0 (0.0%) |
| Total | 222 (87.7%) | 31 (12.2%) |
Housing Structures by Number of Rooms in Woodland Hills
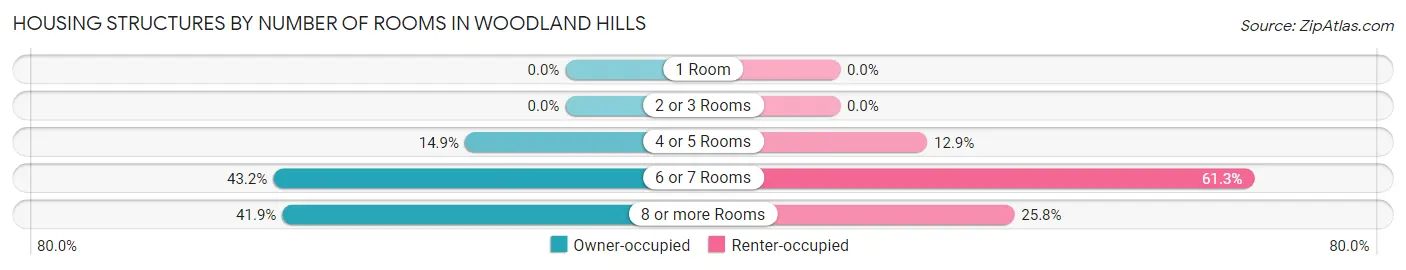
| Number of Rooms | Owner-occupied | Renter-occupied |
| 1 Room | 0 (0.0%) | 0 (0.0%) |
| 2 or 3 Rooms | 0 (0.0%) | 0 (0.0%) |
| 4 or 5 Rooms | 33 (14.9%) | 4 (12.9%) |
| 6 or 7 Rooms | 96 (43.2%) | 19 (61.3%) |
| 8 or more Rooms | 93 (41.9%) | 8 (25.8%) |
| Total | 222 (100.0%) | 31 (100.0%) |
Housing Structure by Heating Type in Woodland Hills
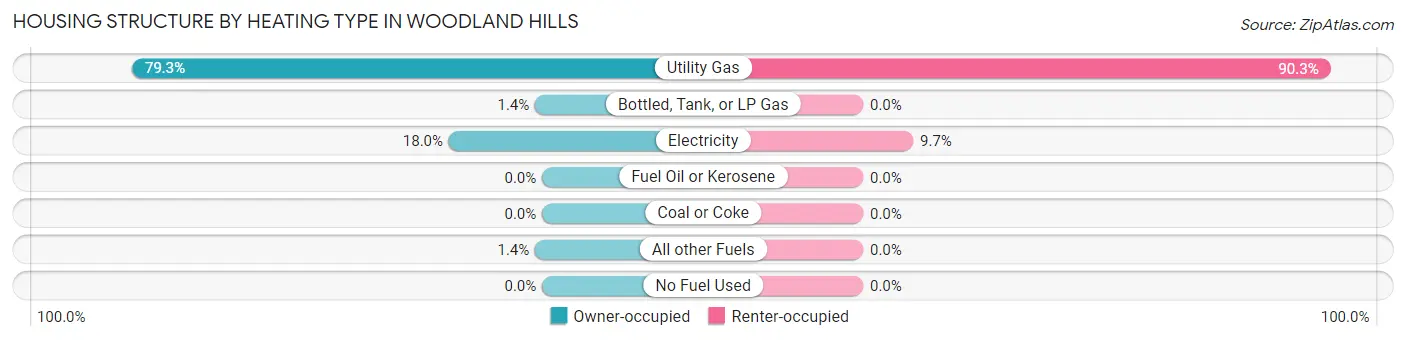
| Heating Type | Owner-occupied | Renter-occupied |
| Utility Gas | 176 (79.3%) | 28 (90.3%) |
| Bottled, Tank, or LP Gas | 3 (1.3%) | 0 (0.0%) |
| Electricity | 40 (18.0%) | 3 (9.7%) |
| Fuel Oil or Kerosene | 0 (0.0%) | 0 (0.0%) |
| Coal or Coke | 0 (0.0%) | 0 (0.0%) |
| All other Fuels | 3 (1.3%) | 0 (0.0%) |
| No Fuel Used | 0 (0.0%) | 0 (0.0%) |
| Total | 222 (100.0%) | 31 (100.0%) |
Household Vehicle Usage in Woodland Hills
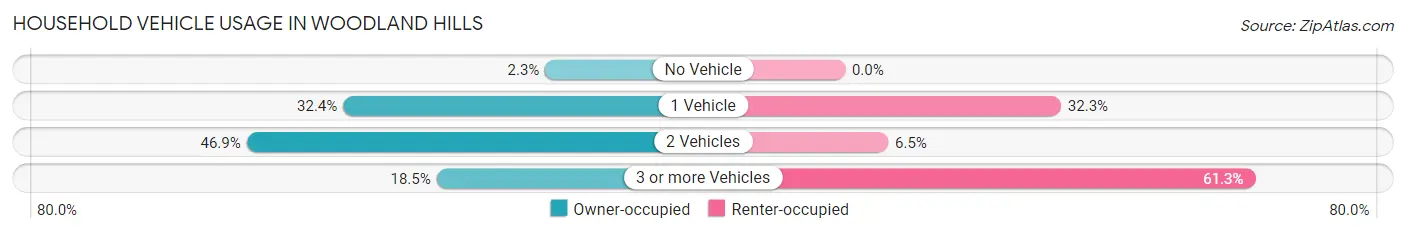
| Vehicles per Household | Owner-occupied | Renter-occupied |
| No Vehicle | 5 (2.2%) | 0 (0.0%) |
| 1 Vehicle | 72 (32.4%) | 10 (32.3%) |
| 2 Vehicles | 104 (46.9%) | 2 (6.5%) |
| 3 or more Vehicles | 41 (18.5%) | 19 (61.3%) |
| Total | 222 (100.0%) | 31 (100.0%) |
Real Estate & Mortgages in Woodland Hills
Real Estate and Mortgage Overview in Woodland Hills
| Characteristic | Without Mortgage | With Mortgage |
| Housing Units | 82 | 140 |
| Median Property Value | $222,300 | $233,600 |
| Median Household Income | $67,727 | $27 |
| Monthly Housing Costs | $561 | $0 |
| Real Estate Taxes | $1,732 | $0 |
Property Value by Mortgage Status in Woodland Hills
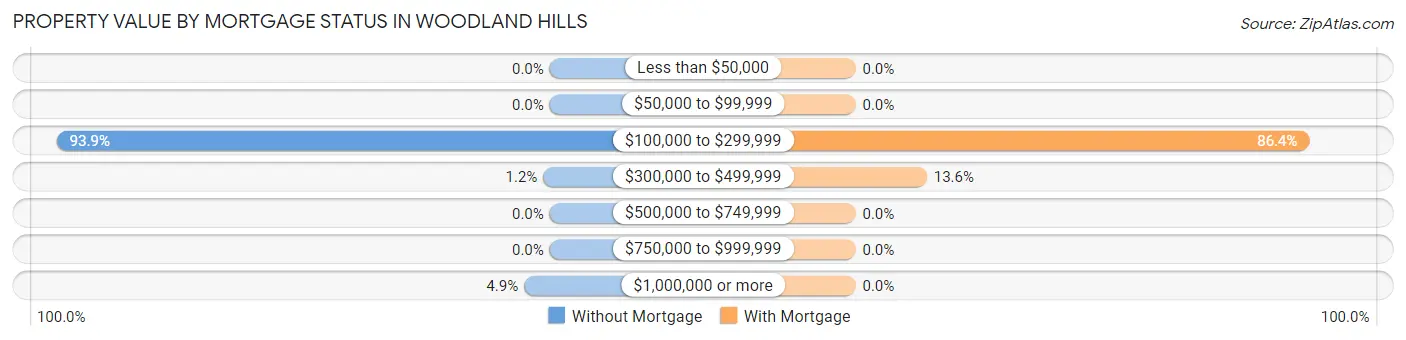
| Property Value | Without Mortgage | With Mortgage |
| Less than $50,000 | 0 (0.0%) | 0 (0.0%) |
| $50,000 to $99,999 | 0 (0.0%) | 0 (0.0%) |
| $100,000 to $299,999 | 77 (93.9%) | 121 (86.4%) |
| $300,000 to $499,999 | 1 (1.2%) | 19 (13.6%) |
| $500,000 to $749,999 | 0 (0.0%) | 0 (0.0%) |
| $750,000 to $999,999 | 0 (0.0%) | 0 (0.0%) |
| $1,000,000 or more | 4 (4.9%) | 0 (0.0%) |
| Total | 82 (100.0%) | 140 (100.0%) |
Household Income by Mortgage Status in Woodland Hills
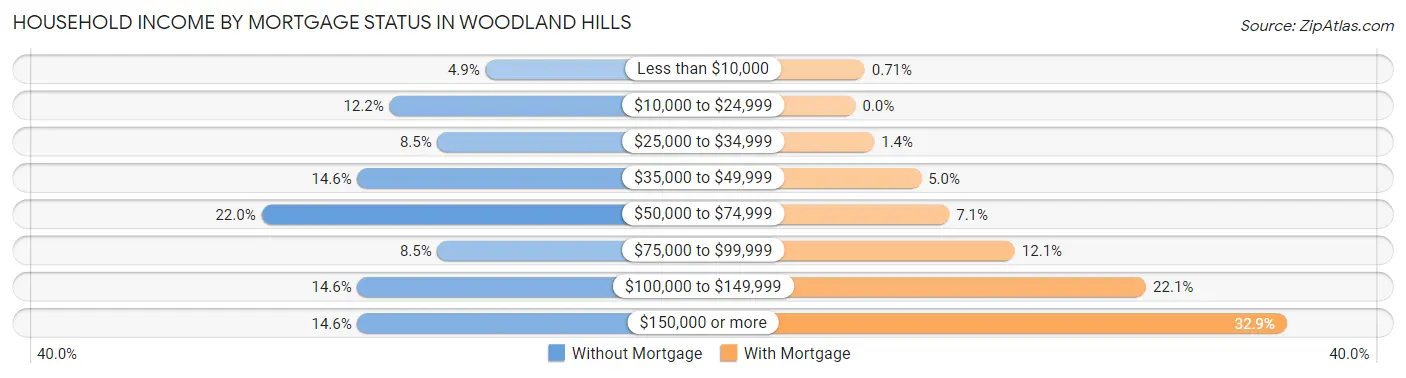
| Household Income | Without Mortgage | With Mortgage |
| Less than $10,000 | 4 (4.9%) | 1 (0.7%) |
| $10,000 to $24,999 | 10 (12.2%) | 0 (0.0%) |
| $25,000 to $34,999 | 7 (8.5%) | 2 (1.4%) |
| $35,000 to $49,999 | 12 (14.6%) | 7 (5.0%) |
| $50,000 to $74,999 | 18 (22.0%) | 10 (7.1%) |
| $75,000 to $99,999 | 7 (8.5%) | 17 (12.1%) |
| $100,000 to $149,999 | 12 (14.6%) | 31 (22.1%) |
| $150,000 or more | 12 (14.6%) | 46 (32.9%) |
| Total | 82 (100.0%) | 140 (100.0%) |
Property Value to Household Income Ratio in Woodland Hills
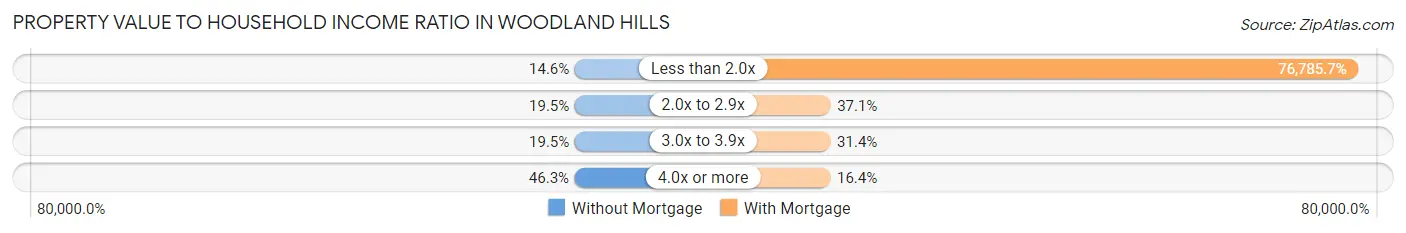
| Value-to-Income Ratio | Without Mortgage | With Mortgage |
| Less than 2.0x | 12 (14.6%) | 107,500 (76,785.7%) |
| 2.0x to 2.9x | 16 (19.5%) | 52 (37.1%) |
| 3.0x to 3.9x | 16 (19.5%) | 44 (31.4%) |
| 4.0x or more | 38 (46.3%) | 23 (16.4%) |
| Total | 82 (100.0%) | 140 (100.0%) |
Real Estate Taxes by Mortgage Status in Woodland Hills
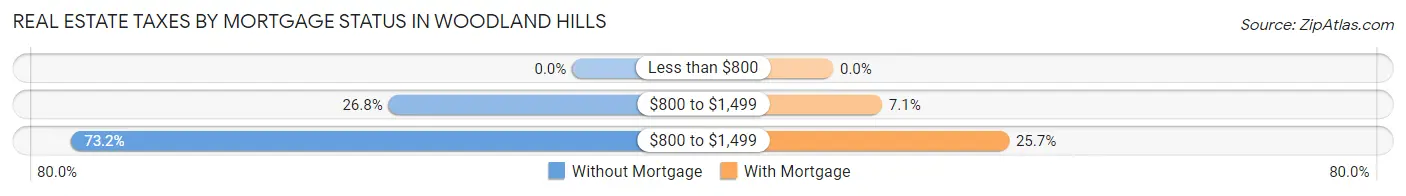
| Property Taxes | Without Mortgage | With Mortgage |
| Less than $800 | 0 (0.0%) | 0 (0.0%) |
| $800 to $1,499 | 22 (26.8%) | 10 (7.1%) |
| $800 to $1,499 | 60 (73.2%) | 36 (25.7%) |
| Total | 82 (100.0%) | 140 (100.0%) |
Health & Disability in Woodland Hills
Health Insurance Coverage by Age in Woodland Hills
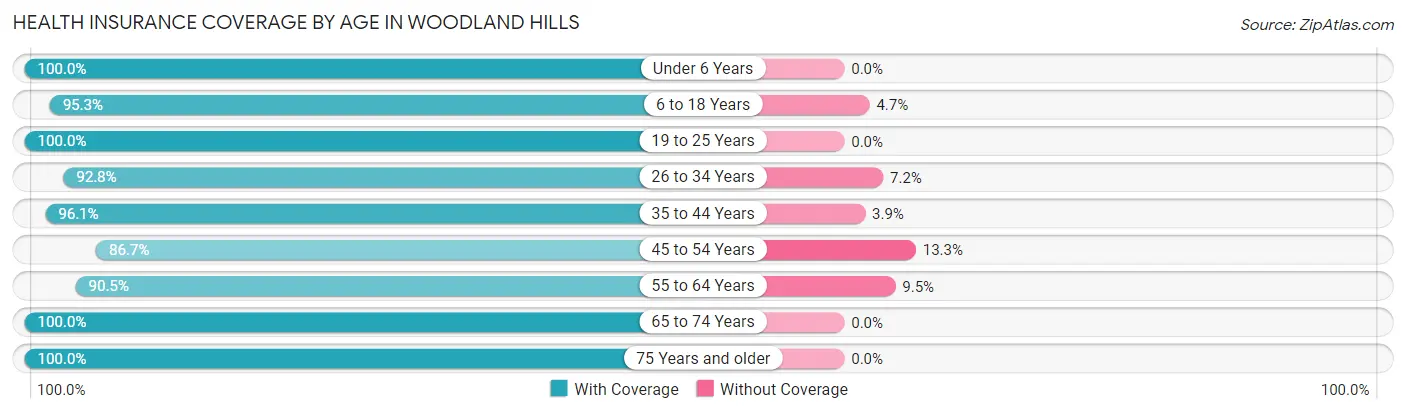
| Age Bracket | With Coverage | Without Coverage |
| Under 6 Years | 48 (100.0%) | 0 (0.0%) |
| 6 to 18 Years | 122 (95.3%) | 6 (4.7%) |
| 19 to 25 Years | 21 (100.0%) | 0 (0.0%) |
| 26 to 34 Years | 77 (92.8%) | 6 (7.2%) |
| 35 to 44 Years | 99 (96.1%) | 4 (3.9%) |
| 45 to 54 Years | 52 (86.7%) | 8 (13.3%) |
| 55 to 64 Years | 57 (90.5%) | 6 (9.5%) |
| 65 to 74 Years | 47 (100.0%) | 0 (0.0%) |
| 75 Years and older | 68 (100.0%) | 0 (0.0%) |
| Total | 591 (95.2%) | 30 (4.8%) |
Health Insurance Coverage by Citizenship Status in Woodland Hills
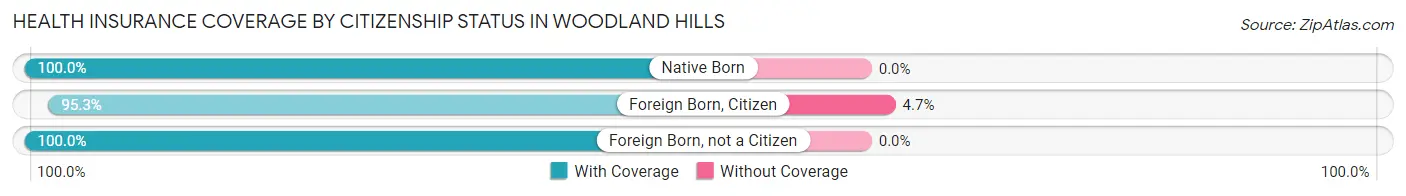
| Citizenship Status | With Coverage | Without Coverage |
| Native Born | 48 (100.0%) | 0 (0.0%) |
| Foreign Born, Citizen | 122 (95.3%) | 6 (4.7%) |
| Foreign Born, not a Citizen | 21 (100.0%) | 0 (0.0%) |
Health Insurance Coverage by Household Income in Woodland Hills
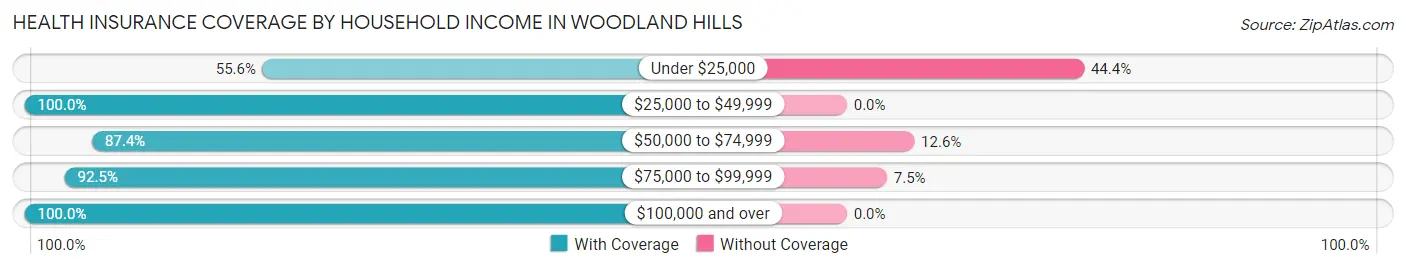
| Household Income | With Coverage | Without Coverage |
| Under $25,000 | 10 (55.6%) | 8 (44.4%) |
| $25,000 to $49,999 | 55 (100.0%) | 0 (0.0%) |
| $50,000 to $74,999 | 90 (87.4%) | 13 (12.6%) |
| $75,000 to $99,999 | 111 (92.5%) | 9 (7.5%) |
| $100,000 and over | 325 (100.0%) | 0 (0.0%) |
Public vs Private Health Insurance Coverage by Age in Woodland Hills
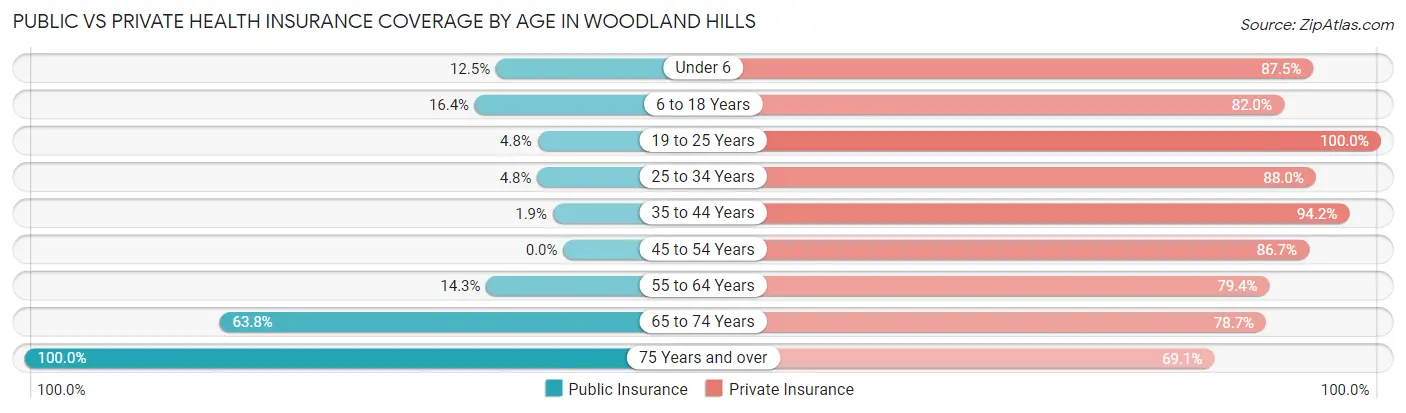
| Age Bracket | Public Insurance | Private Insurance |
| Under 6 | 6 (12.5%) | 42 (87.5%) |
| 6 to 18 Years | 21 (16.4%) | 105 (82.0%) |
| 19 to 25 Years | 1 (4.8%) | 21 (100.0%) |
| 25 to 34 Years | 4 (4.8%) | 73 (87.9%) |
| 35 to 44 Years | 2 (1.9%) | 97 (94.2%) |
| 45 to 54 Years | 0 (0.0%) | 52 (86.7%) |
| 55 to 64 Years | 9 (14.3%) | 50 (79.4%) |
| 65 to 74 Years | 30 (63.8%) | 37 (78.7%) |
| 75 Years and over | 68 (100.0%) | 47 (69.1%) |
| Total | 141 (22.7%) | 524 (84.4%) |
Disability Status by Sex by Age in Woodland Hills
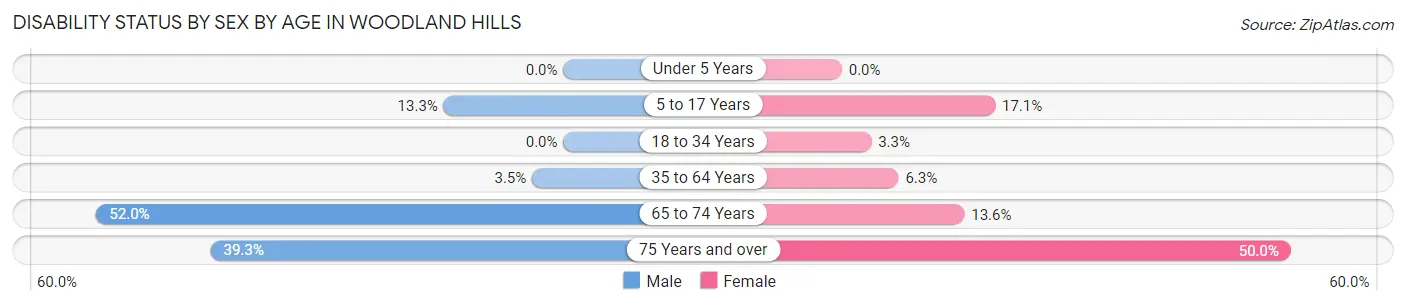
| Age Bracket | Male | Female |
| Under 5 Years | 0 (0.0%) | 0 (0.0%) |
| 5 to 17 Years | 14 (13.3%) | 7 (17.1%) |
| 18 to 34 Years | 0 (0.0%) | 2 (3.3%) |
| 35 to 64 Years | 4 (3.5%) | 7 (6.3%) |
| 65 to 74 Years | 13 (52.0%) | 3 (13.6%) |
| 75 Years and over | 11 (39.3%) | 20 (50.0%) |
Disability Class by Sex by Age in Woodland Hills
Disability Class: Hearing Difficulty
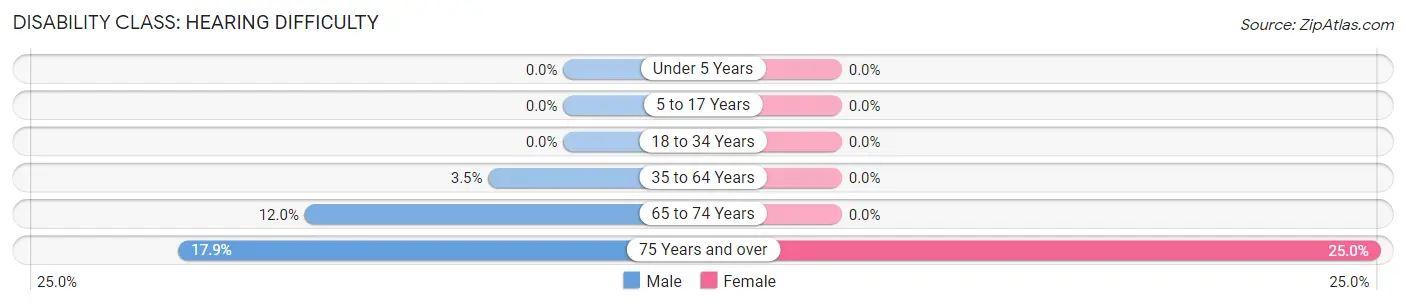
| Age Bracket | Male | Female |
| Under 5 Years | 0 (0.0%) | 0 (0.0%) |
| 5 to 17 Years | 0 (0.0%) | 0 (0.0%) |
| 18 to 34 Years | 0 (0.0%) | 0 (0.0%) |
| 35 to 64 Years | 4 (3.5%) | 0 (0.0%) |
| 65 to 74 Years | 3 (12.0%) | 0 (0.0%) |
| 75 Years and over | 5 (17.9%) | 10 (25.0%) |
Disability Class: Vision Difficulty
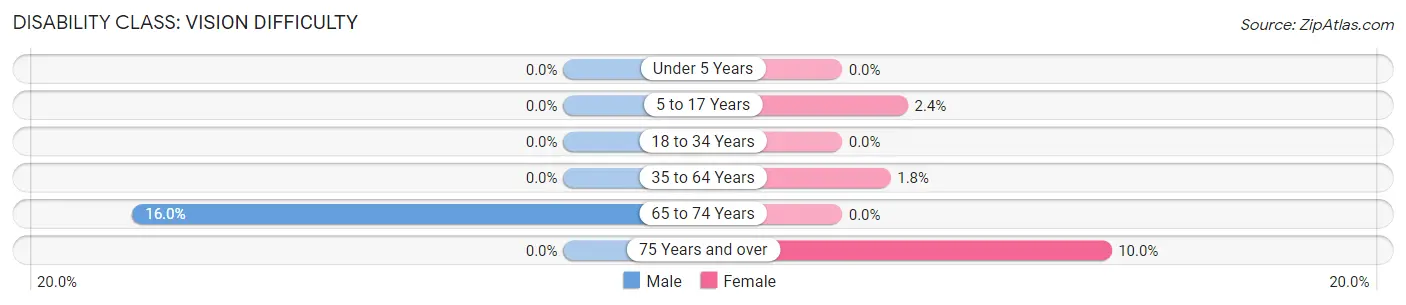
| Age Bracket | Male | Female |
| Under 5 Years | 0 (0.0%) | 0 (0.0%) |
| 5 to 17 Years | 0 (0.0%) | 1 (2.4%) |
| 18 to 34 Years | 0 (0.0%) | 0 (0.0%) |
| 35 to 64 Years | 0 (0.0%) | 2 (1.8%) |
| 65 to 74 Years | 4 (16.0%) | 0 (0.0%) |
| 75 Years and over | 0 (0.0%) | 4 (10.0%) |
Disability Class: Cognitive Difficulty
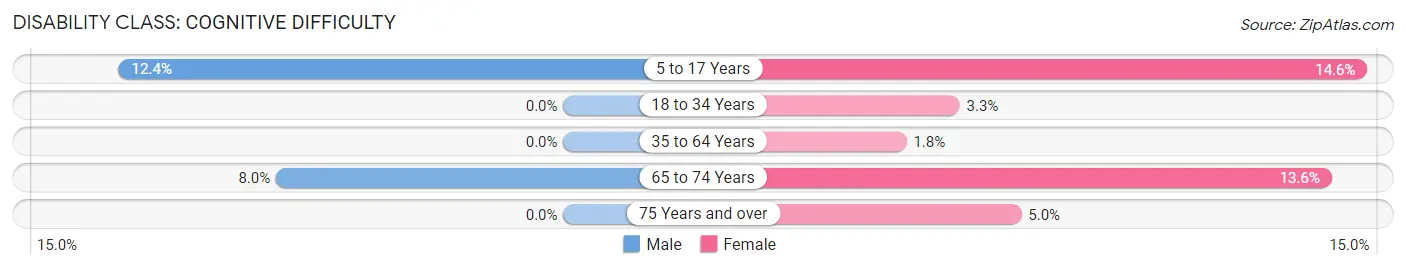
| Age Bracket | Male | Female |
| 5 to 17 Years | 13 (12.4%) | 6 (14.6%) |
| 18 to 34 Years | 0 (0.0%) | 2 (3.3%) |
| 35 to 64 Years | 0 (0.0%) | 2 (1.8%) |
| 65 to 74 Years | 2 (8.0%) | 3 (13.6%) |
| 75 Years and over | 0 (0.0%) | 2 (5.0%) |
Disability Class: Ambulatory Difficulty
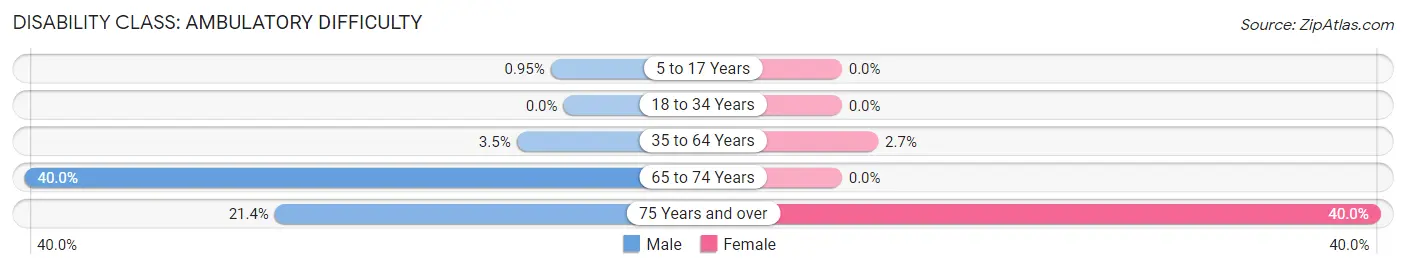
| Age Bracket | Male | Female |
| 5 to 17 Years | 1 (0.9%) | 0 (0.0%) |
| 18 to 34 Years | 0 (0.0%) | 0 (0.0%) |
| 35 to 64 Years | 4 (3.5%) | 3 (2.7%) |
| 65 to 74 Years | 10 (40.0%) | 0 (0.0%) |
| 75 Years and over | 6 (21.4%) | 16 (40.0%) |
Disability Class: Self-Care Difficulty
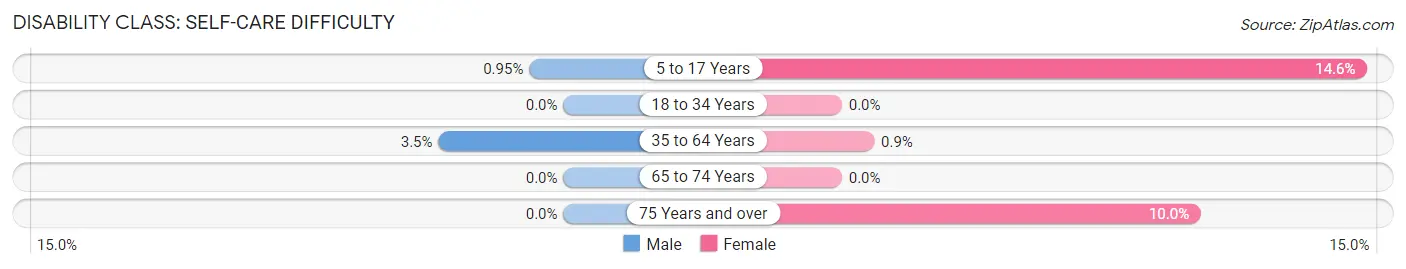
| Age Bracket | Male | Female |
| 5 to 17 Years | 1 (0.9%) | 6 (14.6%) |
| 18 to 34 Years | 0 (0.0%) | 0 (0.0%) |
| 35 to 64 Years | 4 (3.5%) | 1 (0.9%) |
| 65 to 74 Years | 0 (0.0%) | 0 (0.0%) |
| 75 Years and over | 0 (0.0%) | 4 (10.0%) |
Technology Access in Woodland Hills
Computing Device Access in Woodland Hills
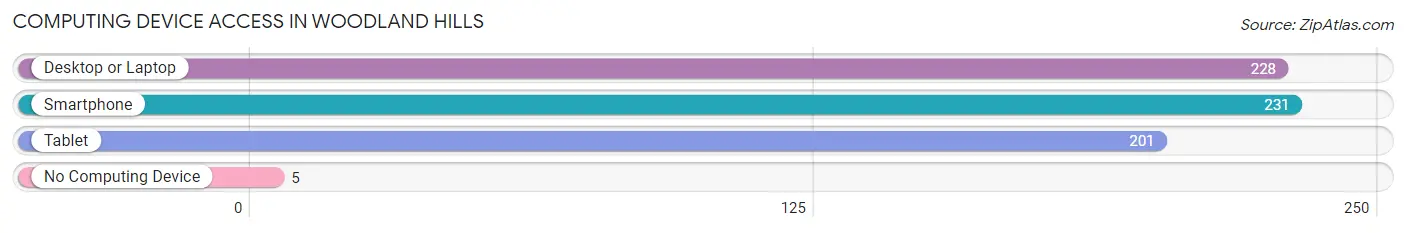
| Device Type | # Households | % Households |
| Desktop or Laptop | 228 | 90.1% |
| Smartphone | 231 | 91.3% |
| Tablet | 201 | 79.4% |
| No Computing Device | 5 | 2.0% |
| Total | 253 | 100.0% |
Internet Access in Woodland Hills
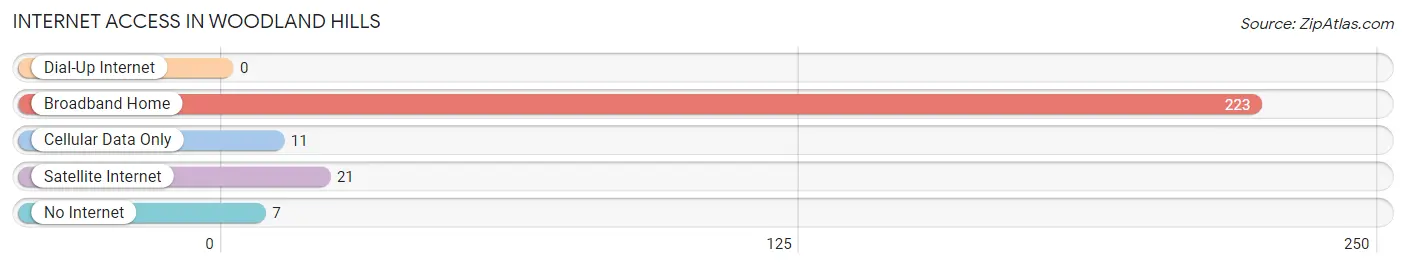
| Internet Type | # Households | % Households |
| Dial-Up Internet | 0 | 0.0% |
| Broadband Home | 223 | 88.1% |
| Cellular Data Only | 11 | 4.3% |
| Satellite Internet | 21 | 8.3% |
| No Internet | 7 | 2.8% |
| Total | 253 | 100.0% |
Woodland Hills Summary
Woodland Hills is a small unincorporated community located in the state of Kentucky, in the United States. It is situated in the western part of the state, in the county of Warren. The community is located in the foothills of the Appalachian Mountains, and is surrounded by rolling hills and lush forests. The area is known for its rural beauty and its proximity to the larger cities of Bowling Green and Nashville.
History
Woodland Hills was first settled in the early 1800s by a group of settlers from Virginia. The area was originally known as “The Hills” and was home to a small farming community. The area was later renamed Woodland Hills in the late 1800s, when the first post office was established.
The area was largely rural until the 1950s, when the construction of Interstate 65 brought an influx of new residents and businesses. The area has since grown to become a popular destination for tourists and outdoor enthusiasts.
Geography
Woodland Hills is located in the western part of Kentucky, in the county of Warren. The community is situated in the foothills of the Appalachian Mountains, and is surrounded by rolling hills and lush forests. The area is known for its rural beauty and its proximity to the larger cities of Bowling Green and Nashville.
The climate in Woodland Hills is generally mild, with temperatures ranging from the mid-30s in the winter to the mid-80s in the summer. The area receives an average of 45 inches of precipitation per year, with most of it falling in the form of rain.
Economy
The economy of Woodland Hills is largely based on tourism and outdoor recreation. The area is home to several state parks, including Barren River Lake State Park and Mammoth Cave National Park. These parks attract visitors from all over the country, who come to enjoy the area’s natural beauty and outdoor activities.
In addition to tourism, the area is also home to several small businesses, including restaurants, retail stores, and service providers. The area is also home to several farms, which produce a variety of crops, including corn, soybeans, and hay.
Demographics
As of the 2010 census, the population of Woodland Hills was 1,845. The population is largely white (94.3%), with a small percentage of African Americans (2.3%) and Hispanics (1.7%). The median household income in the area is $41,944, and the median age is 41.7 years.
Woodland Hills is a small, rural community with a strong sense of community and a commitment to preserving its natural beauty. The area is home to a variety of outdoor activities, including hiking, fishing, and camping, and is a popular destination for tourists and outdoor enthusiasts.
Common Questions
What is Per Capita Income in Woodland Hills?
Per Capita income in Woodland Hills is $43,278.
What is the Median Family Income in Woodland Hills?
Median Family Income in Woodland Hills is $104,792.
What is the Median Household income in Woodland Hills?
Median Household Income in Woodland Hills is $90,096.
What is Income or Wage Gap in Woodland Hills?
Income or Wage Gap in Woodland Hills is 33.6%.
Women in Woodland Hills earn 66.4 cents for every dollar earned by a man.
What is Inequality or Gini Index in Woodland Hills?
Inequality or Gini Index in Woodland Hills is 0.37.
What is the Total Population of Woodland Hills?
Total Population of Woodland Hills is 621.
What is the Total Male Population of Woodland Hills?
Total Male Population of Woodland Hills is 333.
What is the Total Female Population of Woodland Hills?
Total Female Population of Woodland Hills is 288.
What is the Ratio of Males per 100 Females in Woodland Hills?
There are 115.62 Males per 100 Females in Woodland Hills.
What is the Ratio of Females per 100 Males in Woodland Hills?
There are 86.49 Females per 100 Males in Woodland Hills.
What is the Median Population Age in Woodland Hills?
Median Population Age in Woodland Hills is 38.0 Years.
What is the Average Family Size in Woodland Hills
Average Family Size in Woodland Hills is 3.1 People.
What is the Average Household Size in Woodland Hills
Average Household Size in Woodland Hills is 2.5 People.
How Large is the Labor Force in Woodland Hills?
There are 349 People in the Labor Forcein in Woodland Hills.
What is the Percentage of People in the Labor Force in Woodland Hills?
73.0% of People are in the Labor Force in Woodland Hills.
What is the Unemployment Rate in Woodland Hills?
Unemployment Rate in Woodland Hills is 1.4%.