Riverwood, KY Map & Demographics
Riverwood Map
Riverwood Overview
$91,644
PER CAPITA INCOME
$250,001
AVG FAMILY INCOME
$250,001
AVG HOUSEHOLD INCOME
61.1%
WAGE / INCOME GAP [ % ]
38.9¢/ $1
WAGE / INCOME GAP [ $ ]
0.34
INEQUALITY / GINI INDEX
501
TOTAL POPULATION
268
MALE POPULATION
233
FEMALE POPULATION
115.02
MALES / 100 FEMALES
86.94
FEMALES / 100 MALES
42.0
MEDIAN AGE
3.0
AVG FAMILY SIZE
2.8
AVG HOUSEHOLD SIZE
259
LABOR FORCE [ PEOPLE ]
72.1%
PERCENT IN LABOR FORCE
0.8%
UNEMPLOYMENT RATE
Riverwood Area Codes
Income in Riverwood
Income Overview in Riverwood
Per Capita Income in Riverwood is $91,644, while median incomes of families and households are $250,001 and $250,001 respectively.
| Characteristic | Number | Measure |
| Per Capita Income | 501 | $91,644 |
| Median Family Income | 159 | $250,001 |
| Mean Family Income | 159 | $275,799 |
| Median Household Income | 180 | $250,001 |
| Mean Household Income | 180 | $258,024 |
| Income Deficit | 159 | $0 |
| Wage / Income Gap (%) | 501 | 61.11% |
| Wage / Income Gap ($) | 501 | 38.89¢ per $1 |
| Gini / Inequality Index | 501 | 0.34 |
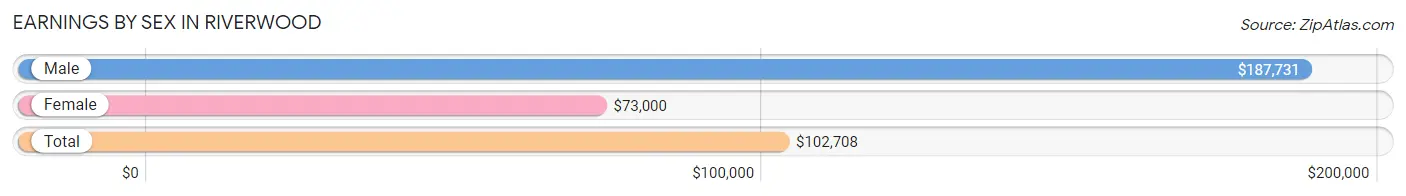
Earnings by Sex in Riverwood
Average Earnings in Riverwood are $102,708, $187,731 for men and $73,000 for women, a difference of 61.1%.
| Sex | Number | Average Earnings |
| Male | 143 (53.2%) | $187,731 |
| Female | 126 (46.8%) | $73,000 |
| Total | 269 (100.0%) | $102,708 |
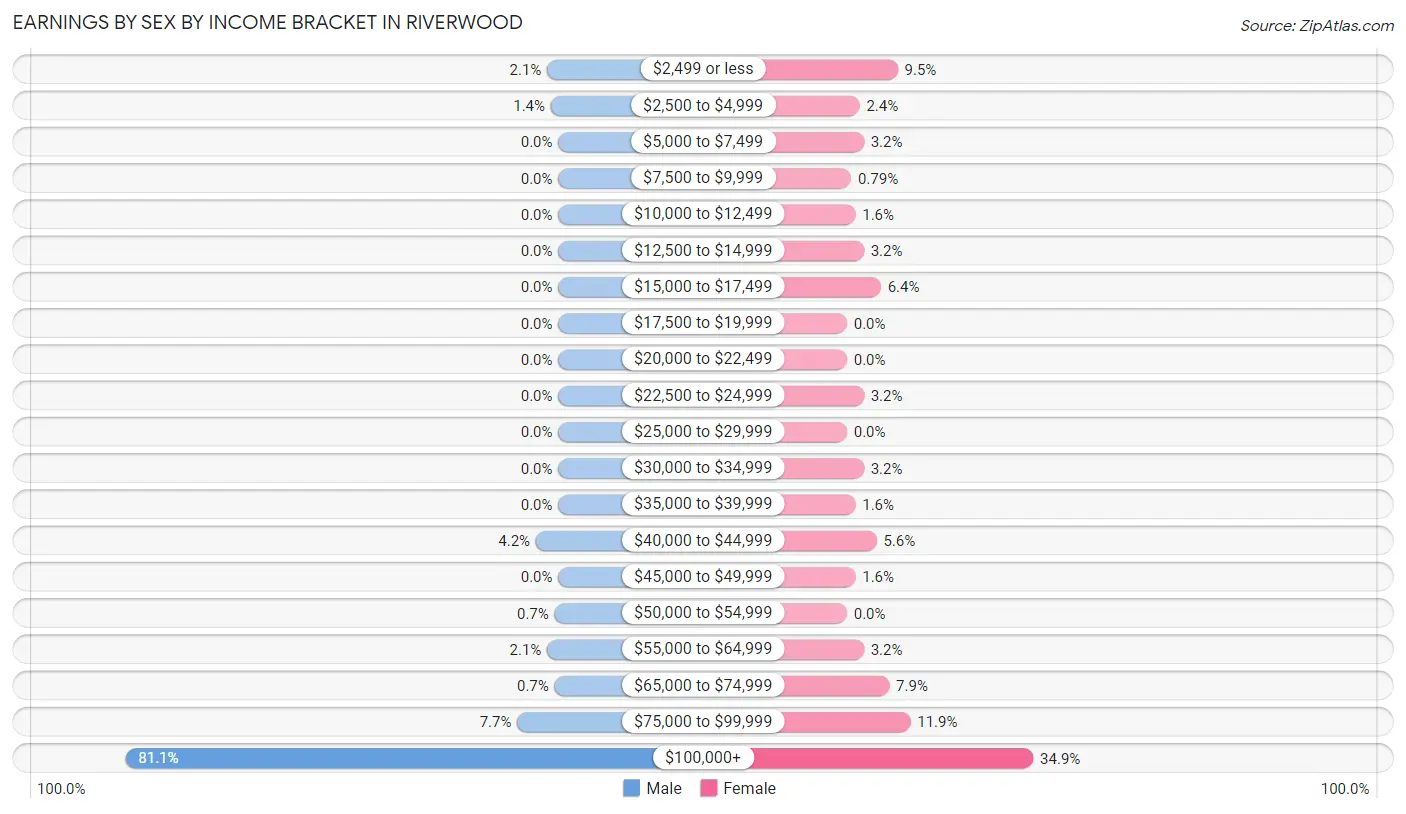
Earnings by Sex by Income Bracket in Riverwood
The most common earnings brackets in Riverwood are $100,000+ for men (116 | 81.1%) and $100,000+ for women (44 | 34.9%).
| Income | Male | Female |
| $2,499 or less | 3 (2.1%) | 12 (9.5%) |
| $2,500 to $4,999 | 2 (1.4%) | 3 (2.4%) |
| $5,000 to $7,499 | 0 (0.0%) | 4 (3.2%) |
| $7,500 to $9,999 | 0 (0.0%) | 1 (0.8%) |
| $10,000 to $12,499 | 0 (0.0%) | 2 (1.6%) |
| $12,500 to $14,999 | 0 (0.0%) | 4 (3.2%) |
| $15,000 to $17,499 | 0 (0.0%) | 8 (6.4%) |
| $17,500 to $19,999 | 0 (0.0%) | 0 (0.0%) |
| $20,000 to $22,499 | 0 (0.0%) | 0 (0.0%) |
| $22,500 to $24,999 | 0 (0.0%) | 4 (3.2%) |
| $25,000 to $29,999 | 0 (0.0%) | 0 (0.0%) |
| $30,000 to $34,999 | 0 (0.0%) | 4 (3.2%) |
| $35,000 to $39,999 | 0 (0.0%) | 2 (1.6%) |
| $40,000 to $44,999 | 6 (4.2%) | 7 (5.6%) |
| $45,000 to $49,999 | 0 (0.0%) | 2 (1.6%) |
| $50,000 to $54,999 | 1 (0.7%) | 0 (0.0%) |
| $55,000 to $64,999 | 3 (2.1%) | 4 (3.2%) |
| $65,000 to $74,999 | 1 (0.7%) | 10 (7.9%) |
| $75,000 to $99,999 | 11 (7.7%) | 15 (11.9%) |
| $100,000+ | 116 (81.1%) | 44 (34.9%) |
| Total | 143 (100.0%) | 126 (100.0%) |
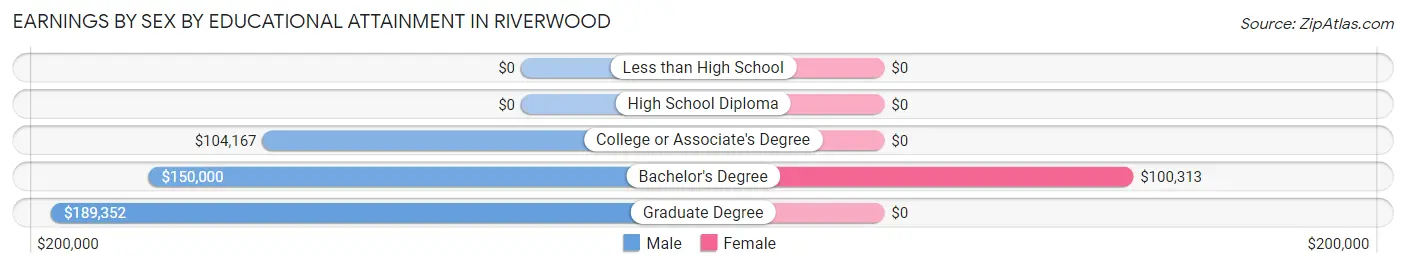
Earnings by Sex by Educational Attainment in Riverwood
Average earnings in Riverwood are $188,056 for men and $78,333 for women, a difference of 58.4%. Men with an educational attainment of graduate degree enjoy the highest average annual earnings of $189,352, while those with college or associate's degree education earn the least with $104,167. Women with an educational attainment of bachelor's degree earn the most with the average annual earnings of $100,313, while those with bachelor's degree education have the smallest earnings of $100,313.
| Educational Attainment | Male Income | Female Income |
| Less than High School | - | - |
| High School Diploma | - | - |
| College or Associate's Degree | $104,167 | $0 |
| Bachelor's Degree | $150,000 | $100,313 |
| Graduate Degree | $189,352 | $0 |
| Total | $188,056 | $78,333 |
Family Income in Riverwood
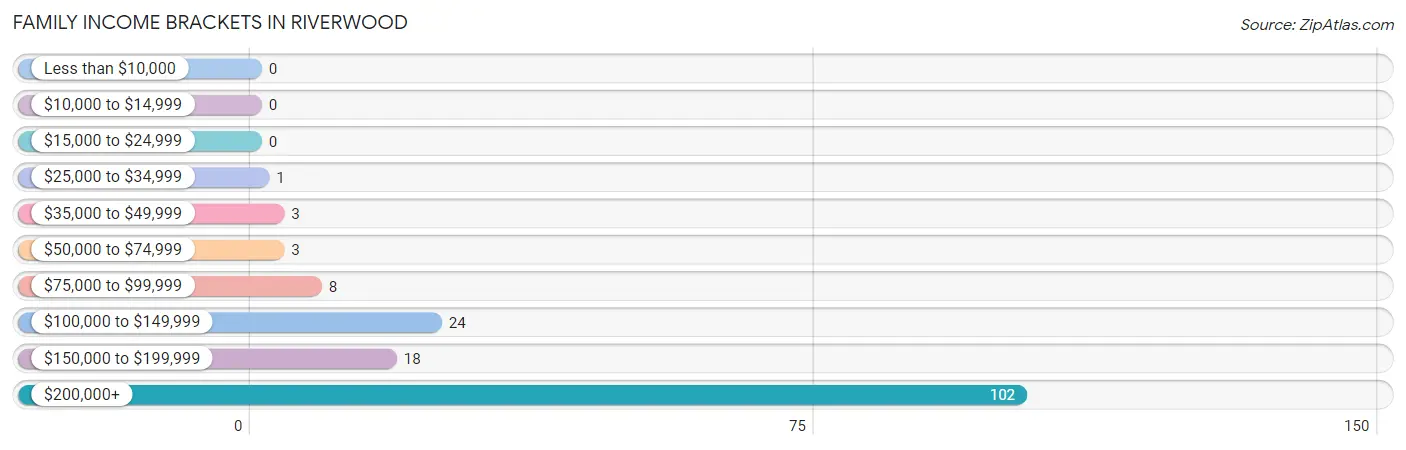
Family Income Brackets in Riverwood
According to the Riverwood family income data, there are 102 families falling into the $200,000+ income range, which is the most common income bracket and makes up 64.1% of all families.
| Income Bracket | # Families | % Families |
| Less than $10,000 | 0 | 0.0% |
| $10,000 to $14,999 | 0 | 0.0% |
| $15,000 to $24,999 | 0 | 0.0% |
| $25,000 to $34,999 | 1 | 0.6% |
| $35,000 to $49,999 | 3 | 1.9% |
| $50,000 to $74,999 | 3 | 1.9% |
| $75,000 to $99,999 | 8 | 5.0% |
| $100,000 to $149,999 | 24 | 15.1% |
| $150,000 to $199,999 | 18 | 11.3% |
| $200,000+ | 102 | 64.2% |
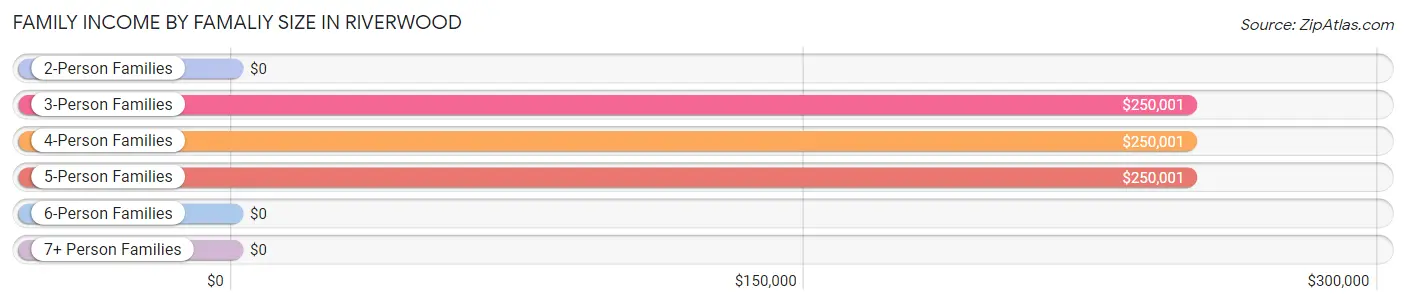
Family Income by Famaliy Size in Riverwood
3-person families (34 | 21.4%) account for the highest median family income in Riverwood with $250,001 per family, while 3-person families (34 | 21.4%) have the highest median income of $83,334 per family member.
| Income Bracket | # Families | Median Income |
| 2-Person Families | 66 (41.5%) | $0 |
| 3-Person Families | 34 (21.4%) | $250,001 |
| 4-Person Families | 45 (28.3%) | $250,001 |
| 5-Person Families | 14 (8.8%) | $250,001 |
| 6-Person Families | 0 (0.0%) | $0 |
| 7+ Person Families | 0 (0.0%) | $0 |
| Total | 159 (100.0%) | $250,001 |
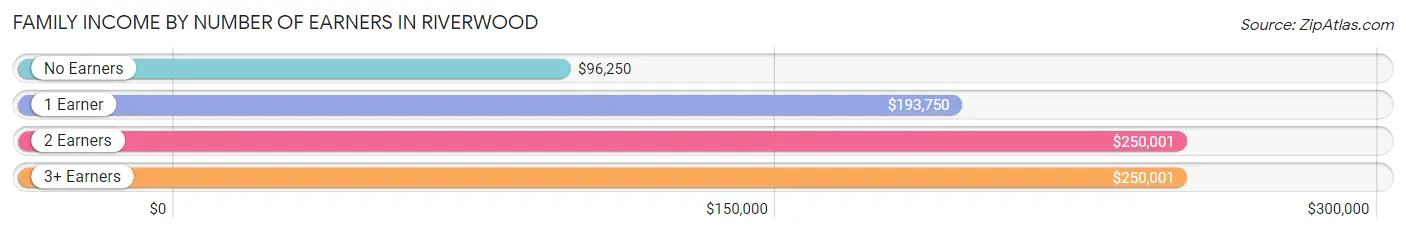
Family Income by Number of Earners in Riverwood
The median family income in Riverwood is $250,001, with families comprising 2 earners (91) having the highest median family income of $250,001, while families with no earners (20) have the lowest median family income of $96,250, accounting for 57.2% and 12.6% of families, respectively.
| Number of Earners | # Families | Median Income |
| No Earners | 20 (12.6%) | $96,250 |
| 1 Earner | 28 (17.6%) | $193,750 |
| 2 Earners | 91 (57.2%) | $250,001 |
| 3+ Earners | 20 (12.6%) | $250,001 |
| Total | 159 (100.0%) | $250,001 |
Household Income in Riverwood
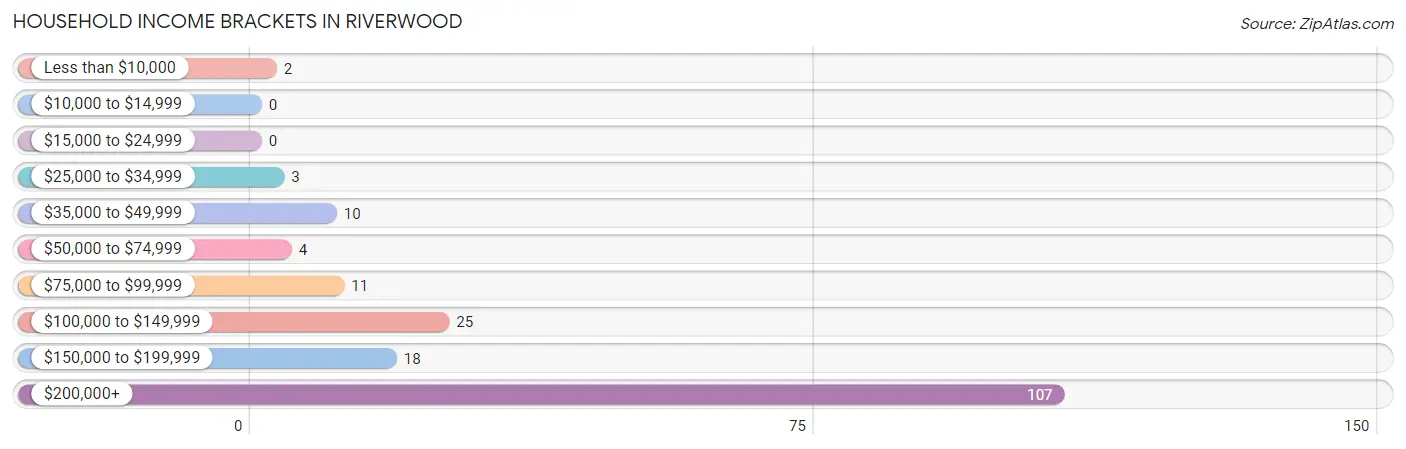
Household Income Brackets in Riverwood
With 107 households falling in the category, the $200,000+ income range is the most frequent in Riverwood, accounting for 59.4% of all households.
| Income Bracket | # Households | % Households |
| Less than $10,000 | 2 | 1.1% |
| $10,000 to $14,999 | 0 | 0.0% |
| $15,000 to $24,999 | 0 | 0.0% |
| $25,000 to $34,999 | 3 | 1.7% |
| $35,000 to $49,999 | 10 | 5.6% |
| $50,000 to $74,999 | 4 | 2.2% |
| $75,000 to $99,999 | 11 | 6.1% |
| $100,000 to $149,999 | 25 | 13.9% |
| $150,000 to $199,999 | 18 | 10.0% |
| $200,000+ | 107 | 59.4% |
Household Income by Householder Age in Riverwood
The median household income in Riverwood is $250,001, with the highest median household income of $250,001 found in the 25 to 44 years age bracket for the primary householder. A total of 53 households (29.4%) fall into this category. Meanwhile, the 15 to 24 years age bracket for the primary householder has the lowest median household income of $0, with 1 households (0.6%) in this group.
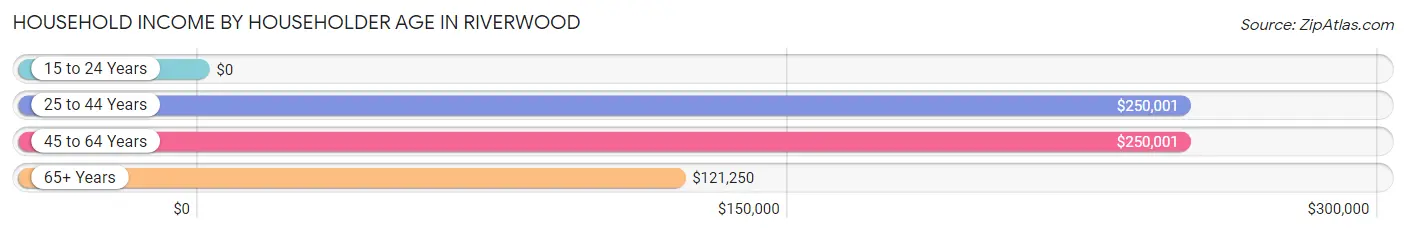
| Income Bracket | # Households | Median Income |
| 15 to 24 Years | 1 (0.6%) | $0 |
| 25 to 44 Years | 53 (29.4%) | $250,001 |
| 45 to 64 Years | 69 (38.3%) | $250,001 |
| 65+ Years | 57 (31.7%) | $121,250 |
| Total | 180 (100.0%) | $250,001 |
Poverty in Riverwood
Income Below Poverty by Sex and Age in Riverwood
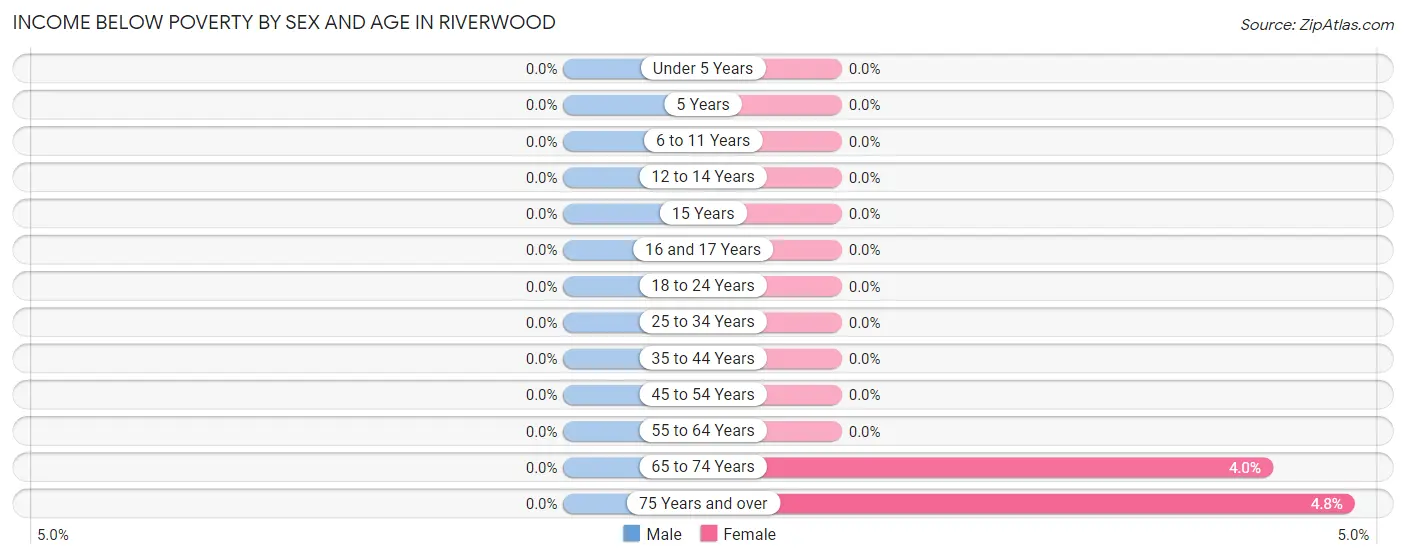
| Age Bracket | Male | Female |
| Under 5 Years | 0 (0.0%) | 0 (0.0%) |
| 5 Years | 0 (0.0%) | 0 (0.0%) |
| 6 to 11 Years | 0 (0.0%) | 0 (0.0%) |
| 12 to 14 Years | 0 (0.0%) | 0 (0.0%) |
| 15 Years | 0 (0.0%) | 0 (0.0%) |
| 16 and 17 Years | 0 (0.0%) | 0 (0.0%) |
| 18 to 24 Years | 0 (0.0%) | 0 (0.0%) |
| 25 to 34 Years | 0 (0.0%) | 0 (0.0%) |
| 35 to 44 Years | 0 (0.0%) | 0 (0.0%) |
| 45 to 54 Years | 0 (0.0%) | 0 (0.0%) |
| 55 to 64 Years | 0 (0.0%) | 0 (0.0%) |
| 65 to 74 Years | 0 (0.0%) | 1 (4.0%) |
| 75 Years and over | 0 (0.0%) | 1 (4.8%) |
| Total | 0 (0.0%) | 2 (0.9%) |
Income Above Poverty by Sex and Age in Riverwood
According to the poverty statistics in Riverwood, males aged under 5 years and females aged under 5 years are the age groups that are most secure financially, with 100.0% of males and 100.0% of females in these age groups living above the poverty line.
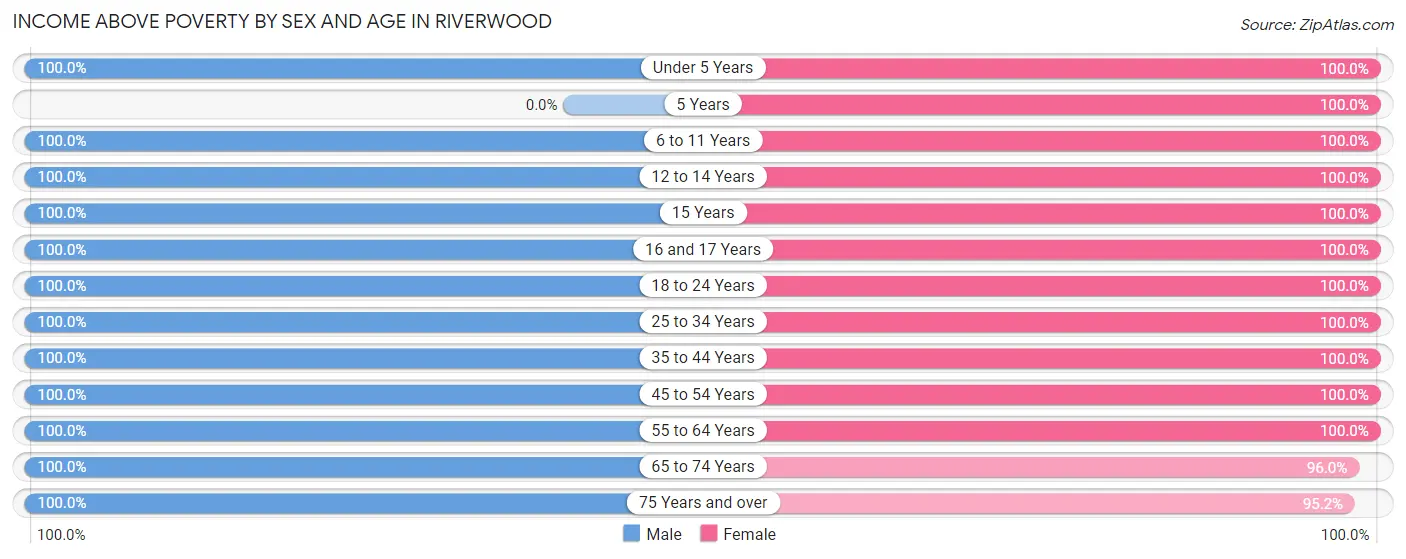
| Age Bracket | Male | Female |
| Under 5 Years | 33 (100.0%) | 10 (100.0%) |
| 5 Years | 0 (0.0%) | 3 (100.0%) |
| 6 to 11 Years | 53 (100.0%) | 23 (100.0%) |
| 12 to 14 Years | 5 (100.0%) | 6 (100.0%) |
| 15 Years | 3 (100.0%) | 6 (100.0%) |
| 16 and 17 Years | 2 (100.0%) | 6 (100.0%) |
| 18 to 24 Years | 8 (100.0%) | 6 (100.0%) |
| 25 to 34 Years | 11 (100.0%) | 17 (100.0%) |
| 35 to 44 Years | 52 (100.0%) | 48 (100.0%) |
| 45 to 54 Years | 33 (100.0%) | 24 (100.0%) |
| 55 to 64 Years | 30 (100.0%) | 38 (100.0%) |
| 65 to 74 Years | 24 (100.0%) | 24 (96.0%) |
| 75 Years and over | 14 (100.0%) | 20 (95.2%) |
| Total | 268 (100.0%) | 231 (99.1%) |
Income Below Poverty Among Married-Couple Families in Riverwood
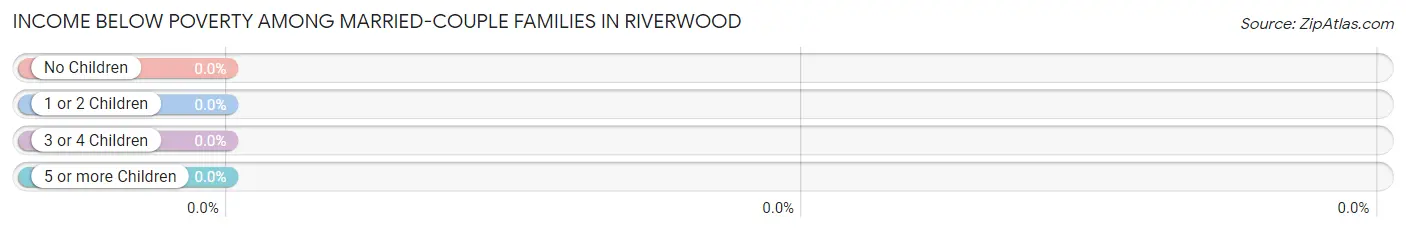
| Children | Above Poverty | Below Poverty |
| No Children | 78 (100.0%) | 0 (0.0%) |
| 1 or 2 Children | 64 (100.0%) | 0 (0.0%) |
| 3 or 4 Children | 10 (100.0%) | 0 (0.0%) |
| 5 or more Children | 0 (0.0%) | 0 (0.0%) |
| Total | 152 (100.0%) | 0 (0.0%) |
Income Below Poverty Among Single-Parent Households in Riverwood
| Children | Single Father | Single Mother |
| No Children | 0 (0.0%) | 0 (0.0%) |
| 1 or 2 Children | 0 (0.0%) | 0 (0.0%) |
| 3 or 4 Children | 0 (0.0%) | 0 (0.0%) |
| 5 or more Children | 0 (0.0%) | 0 (0.0%) |
| Total | 0 (0.0%) | 0 (0.0%) |
Income Below Poverty Among Married-Couple vs Single-Parent Households in Riverwood
| Children | Married-Couple Families | Single-Parent Households |
| No Children | 0 (0.0%) | 0 (0.0%) |
| 1 or 2 Children | 0 (0.0%) | 0 (0.0%) |
| 3 or 4 Children | 0 (0.0%) | 0 (0.0%) |
| 5 or more Children | 0 (0.0%) | 0 (0.0%) |
| Total | 0 (0.0%) | 0 (0.0%) |
Race in Riverwood
The most populous races in Riverwood are White / Caucasian (484 | 96.6%), Asian (7 | 1.4%), and Hispanic or Latino (6 | 1.2%).
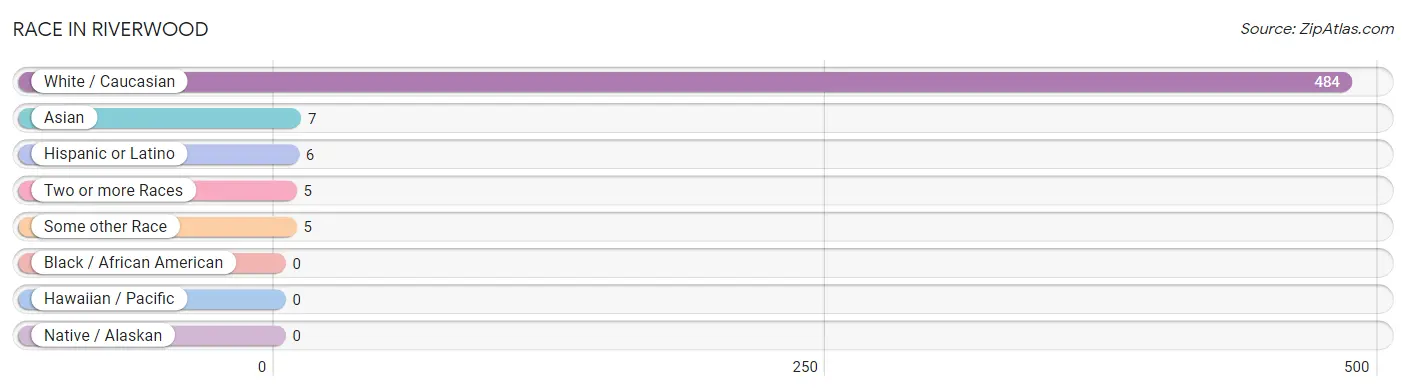
| Race | # Population | % Population |
| Asian | 7 | 1.4% |
| Black / African American | 0 | 0.0% |
| Hawaiian / Pacific | 0 | 0.0% |
| Hispanic or Latino | 6 | 1.2% |
| Native / Alaskan | 0 | 0.0% |
| White / Caucasian | 484 | 96.6% |
| Two or more Races | 5 | 1.0% |
| Some other Race | 5 | 1.0% |
| Total | 501 | 100.0% |
Ancestry in Riverwood
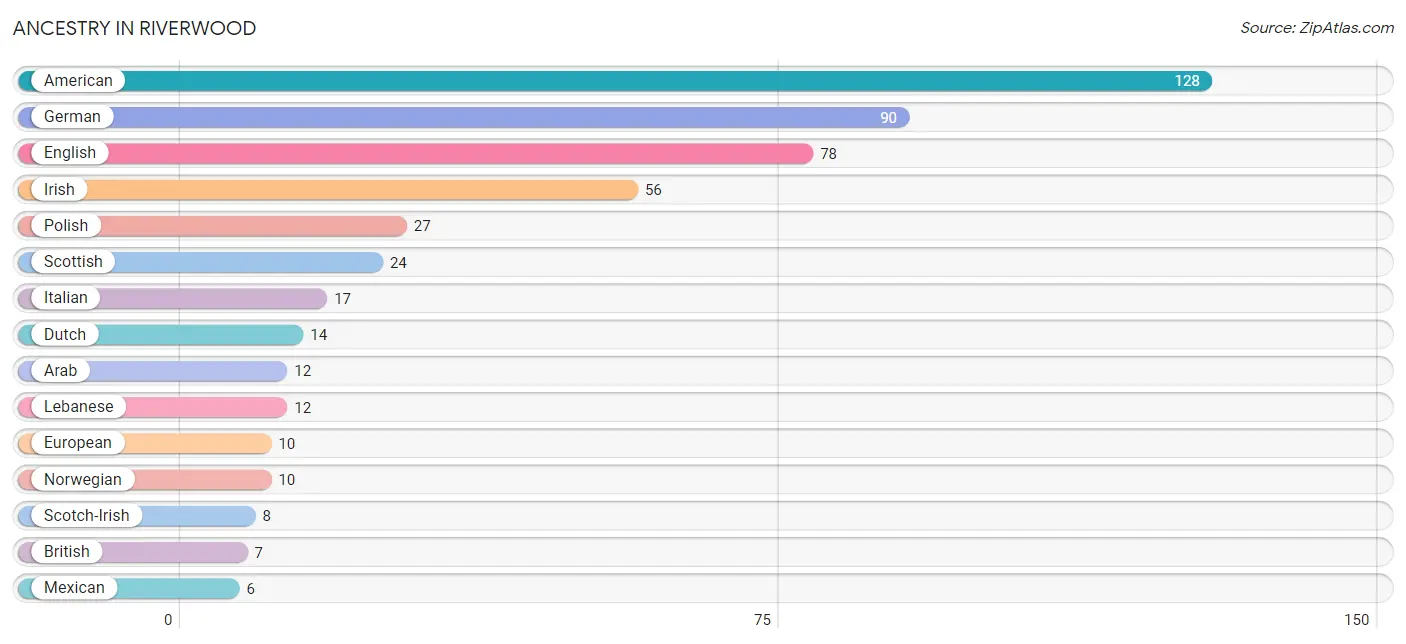
The most populous ancestries reported in Riverwood are American (128 | 25.6%), German (90 | 18.0%), English (78 | 15.6%), Irish (56 | 11.2%), and Polish (27 | 5.4%), together accounting for 75.6% of all Riverwood residents.
| Ancestry | # Population | % Population |
| American | 128 | 25.6% |
| Apache | 3 | 0.6% |
| Arab | 12 | 2.4% |
| Australian | 1 | 0.2% |
| Bhutanese | 2 | 0.4% |
| British | 7 | 1.4% |
| Czech | 3 | 0.6% |
| Danish | 1 | 0.2% |
| Dutch | 14 | 2.8% |
| Eastern European | 1 | 0.2% |
| English | 78 | 15.6% |
| European | 10 | 2.0% |
| French | 1 | 0.2% |
| French Canadian | 1 | 0.2% |
| German | 90 | 18.0% |
| Hungarian | 1 | 0.2% |
| Indian (Asian) | 1 | 0.2% |
| Iranian | 2 | 0.4% |
| Irish | 56 | 11.2% |
| Italian | 17 | 3.4% |
| Lebanese | 12 | 2.4% |
| Lithuanian | 1 | 0.2% |
| Mexican | 6 | 1.2% |
| Norwegian | 10 | 2.0% |
| Polish | 27 | 5.4% |
| Russian | 2 | 0.4% |
| Scotch-Irish | 8 | 1.6% |
| Scottish | 24 | 4.8% |
| Slovak | 2 | 0.4% |
| Slovene | 1 | 0.2% |
| Swedish | 3 | 0.6% |
| Swiss | 4 | 0.8% |
| Thai | 6 | 1.2% |
| Welsh | 3 | 0.6% | View All 34 Rows |
Immigrants in Riverwood
The most numerous immigrant groups reported in Riverwood came from Europe (10 | 2.0%), England (6 | 1.2%), Northern Europe (6 | 1.2%), Asia (4 | 0.8%), and Eastern Asia (2 | 0.4%), together accounting for 5.6% of all Riverwood residents.
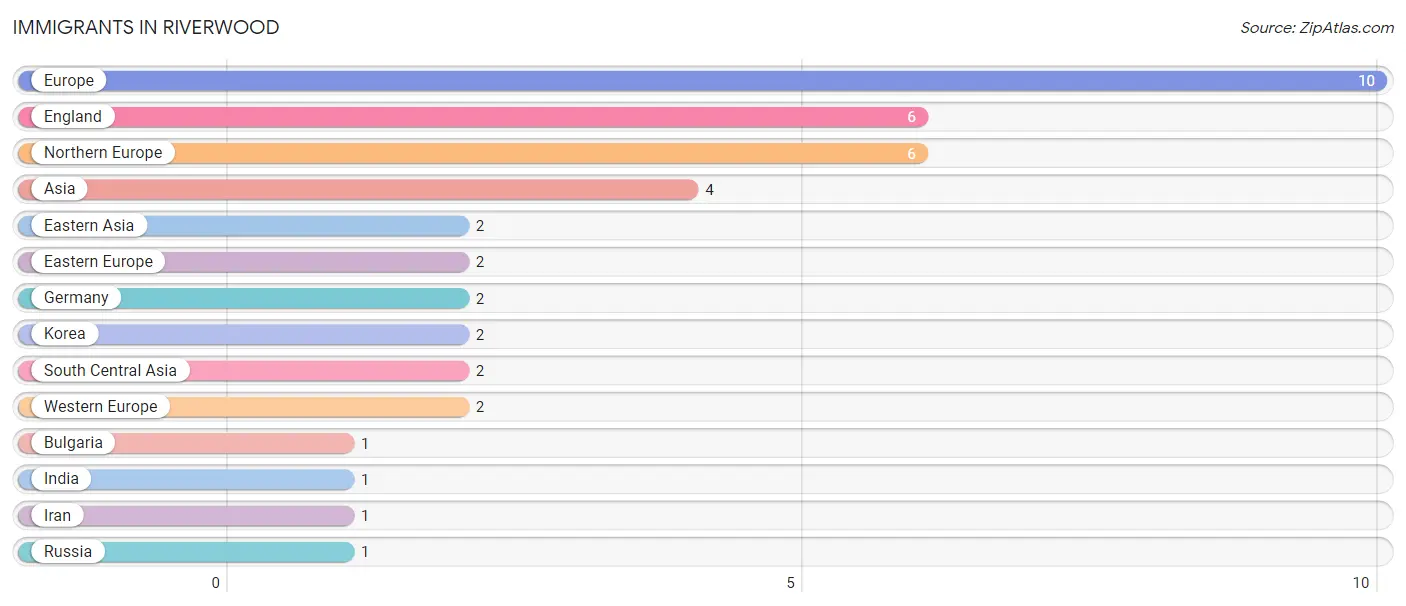
| Immigration Origin | # Population | % Population |
| Asia | 4 | 0.8% |
| Bulgaria | 1 | 0.2% |
| Eastern Asia | 2 | 0.4% |
| Eastern Europe | 2 | 0.4% |
| England | 6 | 1.2% |
| Europe | 10 | 2.0% |
| Germany | 2 | 0.4% |
| India | 1 | 0.2% |
| Iran | 1 | 0.2% |
| Korea | 2 | 0.4% |
| Northern Europe | 6 | 1.2% |
| Russia | 1 | 0.2% |
| South Central Asia | 2 | 0.4% |
| Western Europe | 2 | 0.4% | View All 14 Rows |
Sex and Age in Riverwood
Sex and Age in Riverwood
The most populous age groups in Riverwood are 5 to 9 Years (50 | 18.7%) for men and 40 to 44 Years (38 | 16.3%) for women.
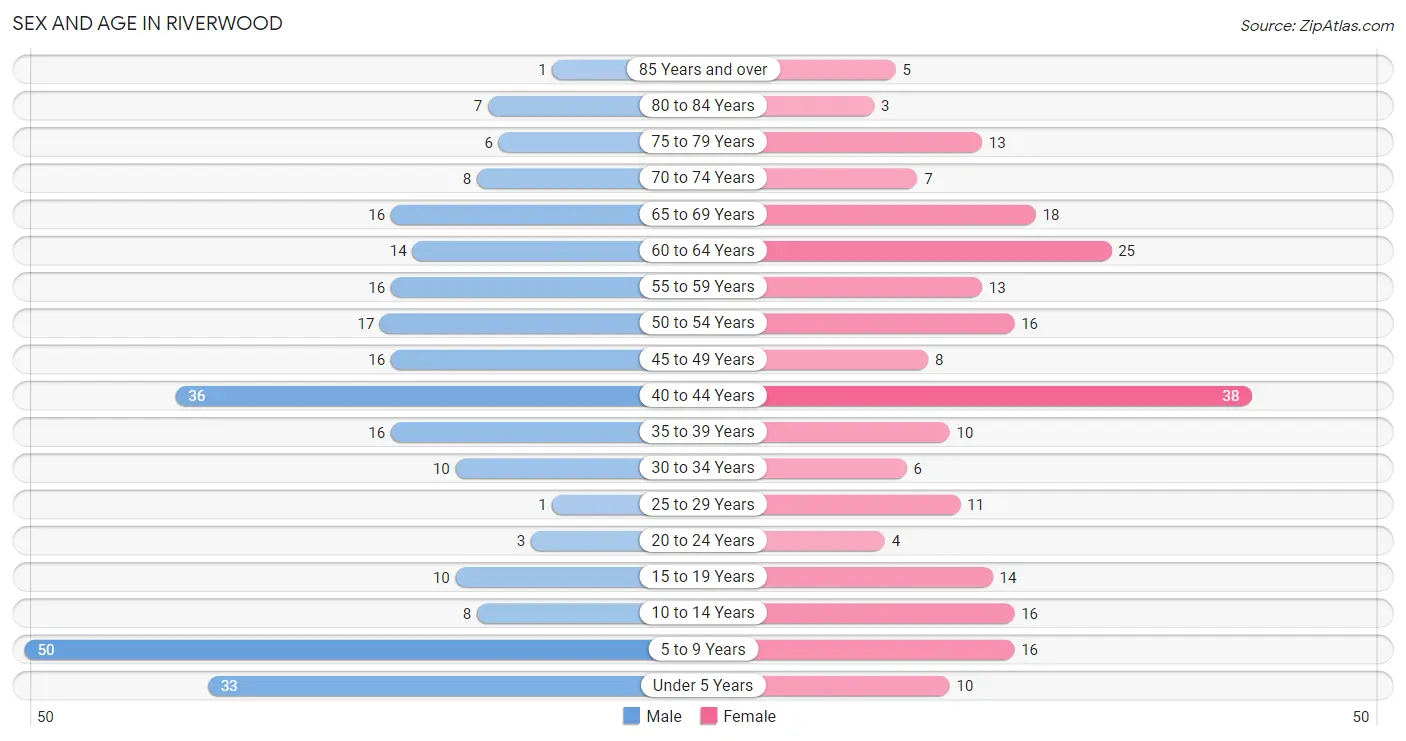
| Age Bracket | Male | Female |
| Under 5 Years | 33 (12.3%) | 10 (4.3%) |
| 5 to 9 Years | 50 (18.7%) | 16 (6.9%) |
| 10 to 14 Years | 8 (3.0%) | 16 (6.9%) |
| 15 to 19 Years | 10 (3.7%) | 14 (6.0%) |
| 20 to 24 Years | 3 (1.1%) | 4 (1.7%) |
| 25 to 29 Years | 1 (0.4%) | 11 (4.7%) |
| 30 to 34 Years | 10 (3.7%) | 6 (2.6%) |
| 35 to 39 Years | 16 (6.0%) | 10 (4.3%) |
| 40 to 44 Years | 36 (13.4%) | 38 (16.3%) |
| 45 to 49 Years | 16 (6.0%) | 8 (3.4%) |
| 50 to 54 Years | 17 (6.3%) | 16 (6.9%) |
| 55 to 59 Years | 16 (6.0%) | 13 (5.6%) |
| 60 to 64 Years | 14 (5.2%) | 25 (10.7%) |
| 65 to 69 Years | 16 (6.0%) | 18 (7.7%) |
| 70 to 74 Years | 8 (3.0%) | 7 (3.0%) |
| 75 to 79 Years | 6 (2.2%) | 13 (5.6%) |
| 80 to 84 Years | 7 (2.6%) | 3 (1.3%) |
| 85 Years and over | 1 (0.4%) | 5 (2.1%) |
| Total | 268 (100.0%) | 233 (100.0%) |
Families and Households in Riverwood
Median Family Size in Riverwood
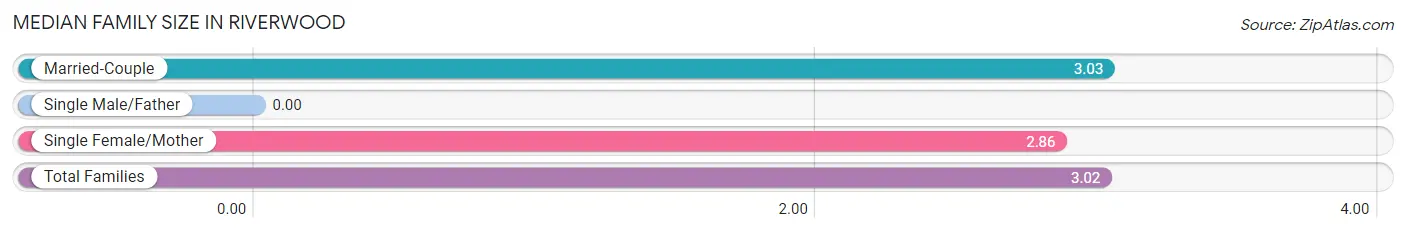
| Family Type | # Families | Family Size |
| Married-Couple | 152 (95.6%) | 3.03 |
| Single Male/Father | 0 (0.0%) | - |
| Single Female/Mother | 7 (4.4%) | 2.86 |
| Total Families | 159 (100.0%) | 3.02 |
Median Household Size in Riverwood
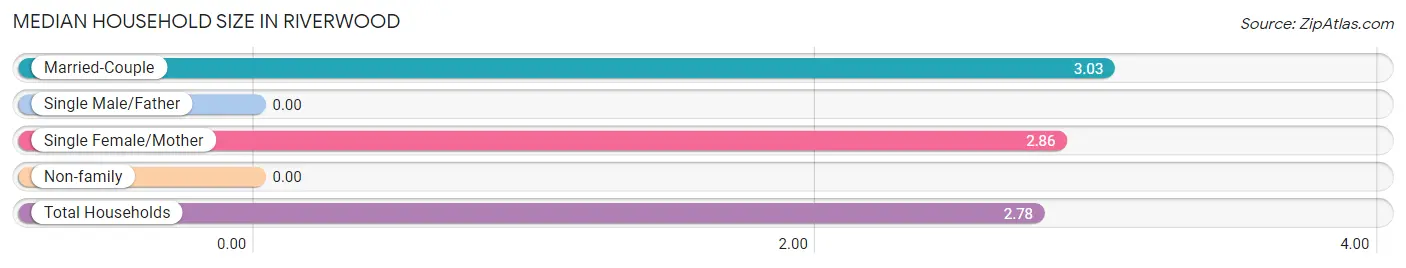
| Household Type | # Households | Household Size |
| Married-Couple | 152 (84.4%) | 3.03 |
| Single Male/Father | 0 (0.0%) | - |
| Single Female/Mother | 7 (3.9%) | 2.86 |
| Non-family | 21 (11.7%) | - |
| Total Households | 180 (100.0%) | 2.78 |
Household Size by Marriage Status in Riverwood
Out of a total of 180 households in Riverwood, 159 (88.3%) are family households, while 21 (11.7%) are nonfamily households. The most numerous type of family households are 2-person households, comprising 66, and the most common type of nonfamily households are 1-person households, comprising 21.
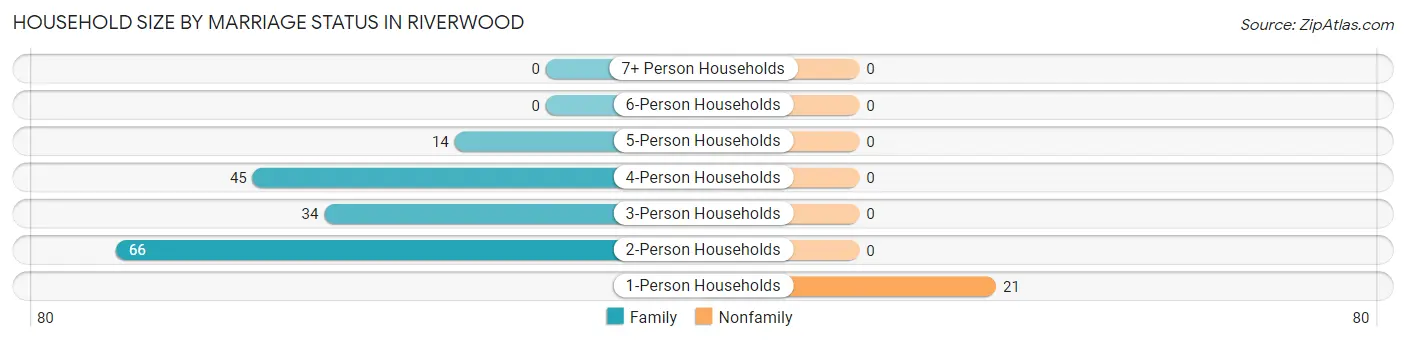
| Household Size | Family Households | Nonfamily Households |
| 1-Person Households | - | 21 (11.7%) |
| 2-Person Households | 66 (36.7%) | 0 (0.0%) |
| 3-Person Households | 34 (18.9%) | 0 (0.0%) |
| 4-Person Households | 45 (25.0%) | 0 (0.0%) |
| 5-Person Households | 14 (7.8%) | 0 (0.0%) |
| 6-Person Households | 0 (0.0%) | 0 (0.0%) |
| 7+ Person Households | 0 (0.0%) | 0 (0.0%) |
| Total | 159 (88.3%) | 21 (11.7%) |
Female Fertility in Riverwood
Fertility by Age in Riverwood
Average fertility rate in Riverwood is 33.0 births per 1,000 women. Women in the age bracket of 20 to 34 years have the highest fertility rate with 95.0 births per 1,000 women. Women in the age bracket of 20 to 34 years acount for 66.7% of all women with births.
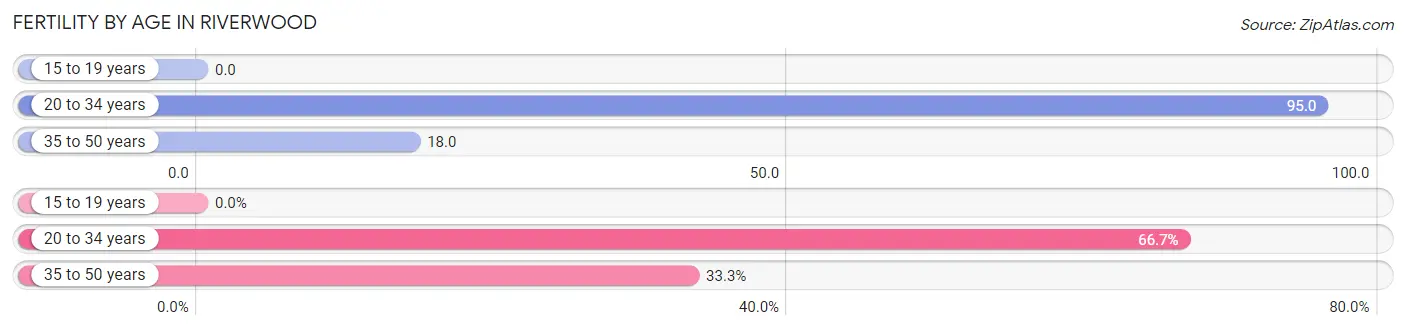
| Age Bracket | Women with Births | Births / 1,000 Women |
| 15 to 19 years | 0 (0.0%) | 0.0 |
| 20 to 34 years | 2 (66.7%) | 95.0 |
| 35 to 50 years | 1 (33.3%) | 18.0 |
| Total | 3 (100.0%) | 33.0 |
Fertility by Age by Marriage Status in Riverwood
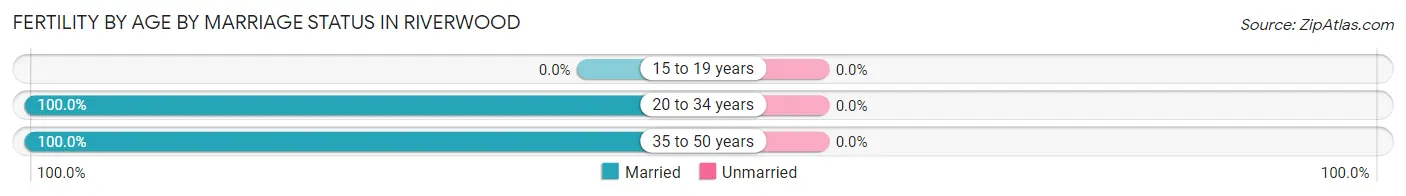
| Age Bracket | Married | Unmarried |
| 15 to 19 years | 0 (0.0%) | 0 (0.0%) |
| 20 to 34 years | 2 (100.0%) | 0 (0.0%) |
| 35 to 50 years | 1 (100.0%) | 0 (0.0%) |
| Total | 3 (100.0%) | 0 (0.0%) |
Fertility by Education in Riverwood
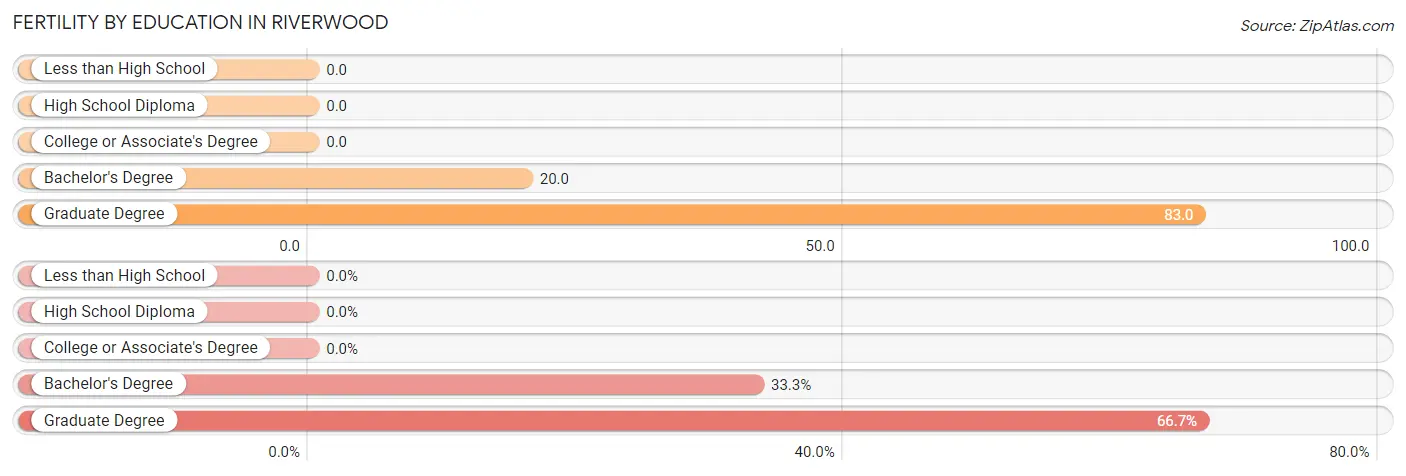
| Educational Attainment | Women with Births | Births / 1,000 Women |
| Less than High School | 0 (0.0%) | 0.0 |
| High School Diploma | 0 (0.0%) | 0.0 |
| College or Associate's Degree | 0 (0.0%) | 0.0 |
| Bachelor's Degree | 1 (33.3%) | 20.0 |
| Graduate Degree | 2 (66.7%) | 83.0 |
| Total | 3 (100.0%) | 33.0 |
Fertility by Education by Marriage Status in Riverwood
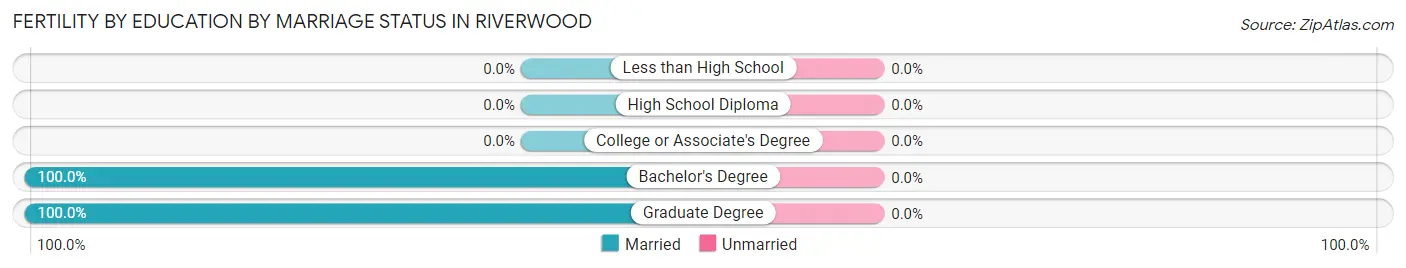
| Educational Attainment | Married | Unmarried |
| Less than High School | 0 (0.0%) | 0 (0.0%) |
| High School Diploma | 0 (0.0%) | 0 (0.0%) |
| College or Associate's Degree | 0 (0.0%) | 0 (0.0%) |
| Bachelor's Degree | 1 (100.0%) | 0 (0.0%) |
| Graduate Degree | 2 (100.0%) | 0 (0.0%) |
| Total | 3 (100.0%) | 0 (0.0%) |
Employment Characteristics in Riverwood
Employment by Class of Employer in Riverwood
Among the 255 employed individuals in Riverwood, private company employees (172 | 67.4%), self-employed (incorporated) (33 | 12.9%), and not-for-profit organizations (24 | 9.4%) make up the most common classes of employment.
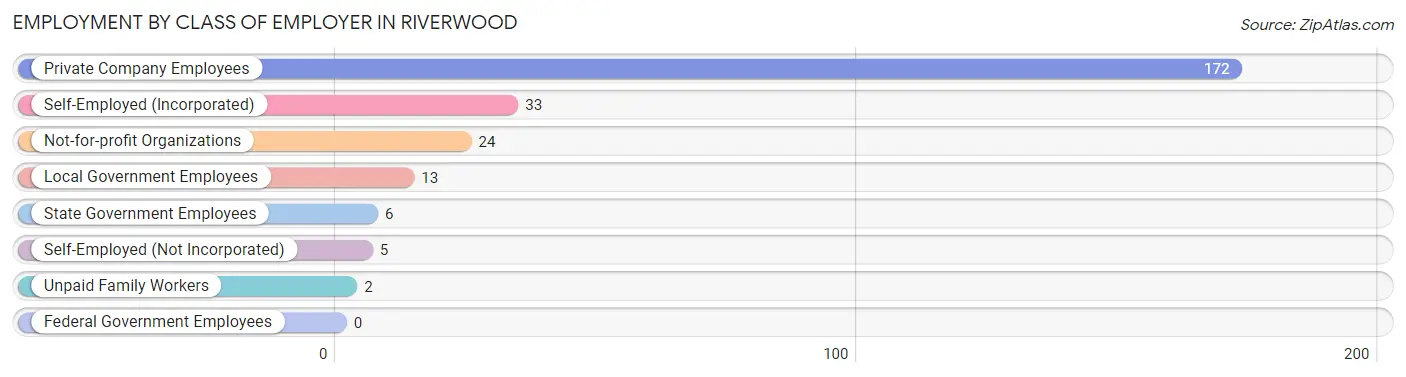
| Employer Class | # Employees | % Employees |
| Private Company Employees | 172 | 67.4% |
| Self-Employed (Incorporated) | 33 | 12.9% |
| Self-Employed (Not Incorporated) | 5 | 2.0% |
| Not-for-profit Organizations | 24 | 9.4% |
| Local Government Employees | 13 | 5.1% |
| State Government Employees | 6 | 2.4% |
| Federal Government Employees | 0 | 0.0% |
| Unpaid Family Workers | 2 | 0.8% |
| Total | 255 | 100.0% |
Employment Status by Age in Riverwood
According to the labor force statistics for Riverwood, out of the total population over 16 years of age (359), 72.1% or 259 individuals are in the labor force, with 0.8% or 2 of them unemployed. The age group with the highest labor force participation rate is 20 to 24 years, with 100.0% or 7 individuals in the labor force. Within the labor force, the 45 to 54 years age range has the highest percentage of unemployed individuals, with 4.3% or 2 of them being unemployed.
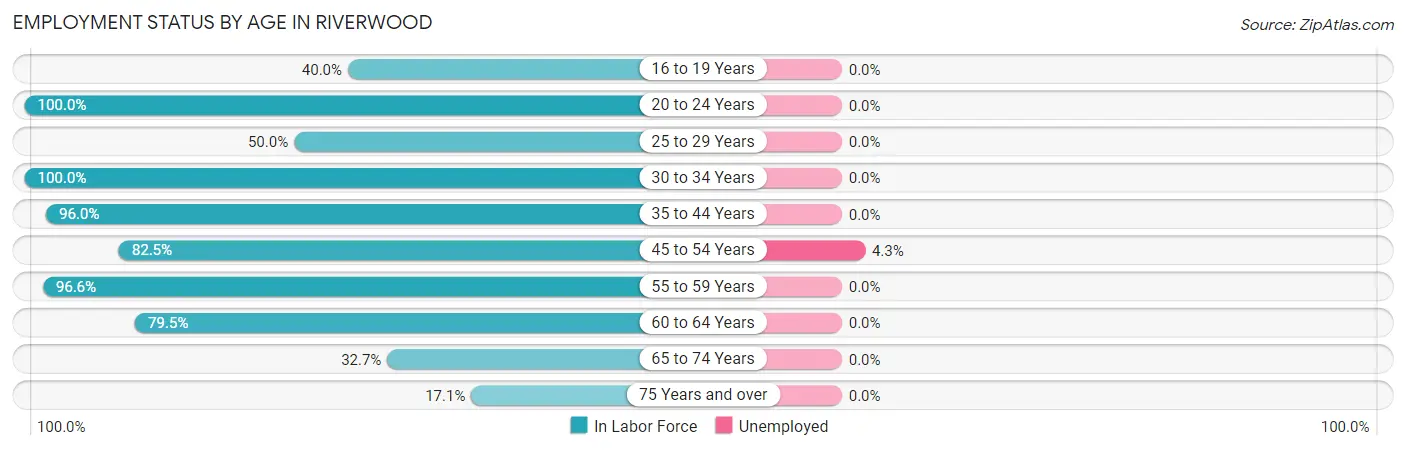
| Age Bracket | In Labor Force | Unemployed |
| 16 to 19 Years | 6 (40.0%) | 0 (0.0%) |
| 20 to 24 Years | 7 (100.0%) | 0 (0.0%) |
| 25 to 29 Years | 6 (50.0%) | 0 (0.0%) |
| 30 to 34 Years | 16 (100.0%) | 0 (0.0%) |
| 35 to 44 Years | 96 (96.0%) | 0 (0.0%) |
| 45 to 54 Years | 47 (82.5%) | 2 (4.3%) |
| 55 to 59 Years | 28 (96.6%) | 0 (0.0%) |
| 60 to 64 Years | 31 (79.5%) | 0 (0.0%) |
| 65 to 74 Years | 16 (32.7%) | 0 (0.0%) |
| 75 Years and over | 6 (17.1%) | 0 (0.0%) |
| Total | 259 (72.1%) | 2 (0.8%) |
Employment Status by Educational Attainment in Riverwood
According to labor force statistics for Riverwood, 88.5% of individuals (224) out of the total population between 25 and 64 years of age (253) are in the labor force, with 0.9% or 2 of them being unemployed. The group with the highest labor force participation rate are those with the educational attainment of less than high school, with 100.0% or 2 individuals in the labor force. Within the labor force, individuals with bachelor's degree or higher education have the highest percentage of unemployment, with 1.0% or 2 of them being unemployed.
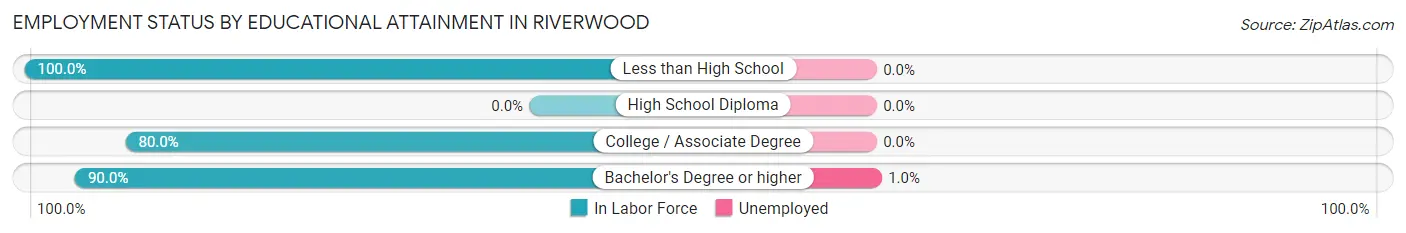
| Educational Attainment | In Labor Force | Unemployed |
| Less than High School | 2 (100.0%) | 0 (0.0%) |
| High School Diploma | 0 (0.0%) | 0 (0.0%) |
| College / Associate Degree | 16 (80.0%) | 0 (0.0%) |
| Bachelor's Degree or higher | 206 (90.0%) | 2 (1.0%) |
| Total | 224 (88.5%) | 2 (0.9%) |
Employment Occupations by Sex in Riverwood
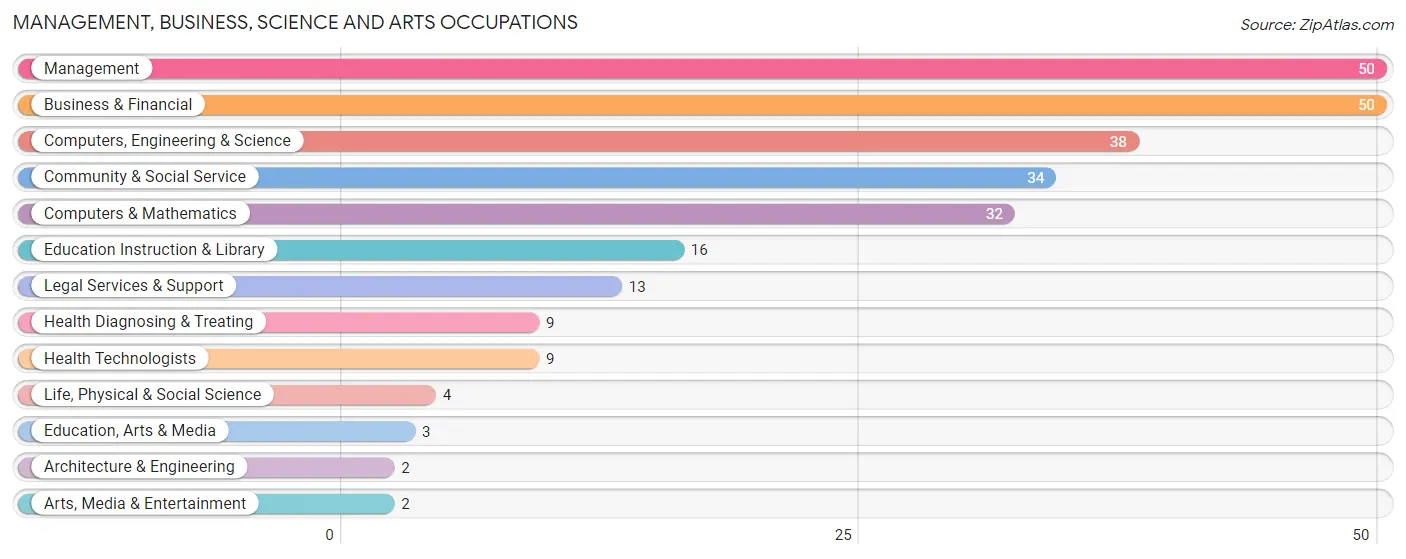
Management, Business, Science and Arts Occupations
The most common Management, Business, Science and Arts occupations in Riverwood are Management (50 | 19.5%), Business & Financial (50 | 19.5%), Computers, Engineering & Science (38 | 14.8%), Community & Social Service (34 | 13.2%), and Computers & Mathematics (32 | 12.4%).
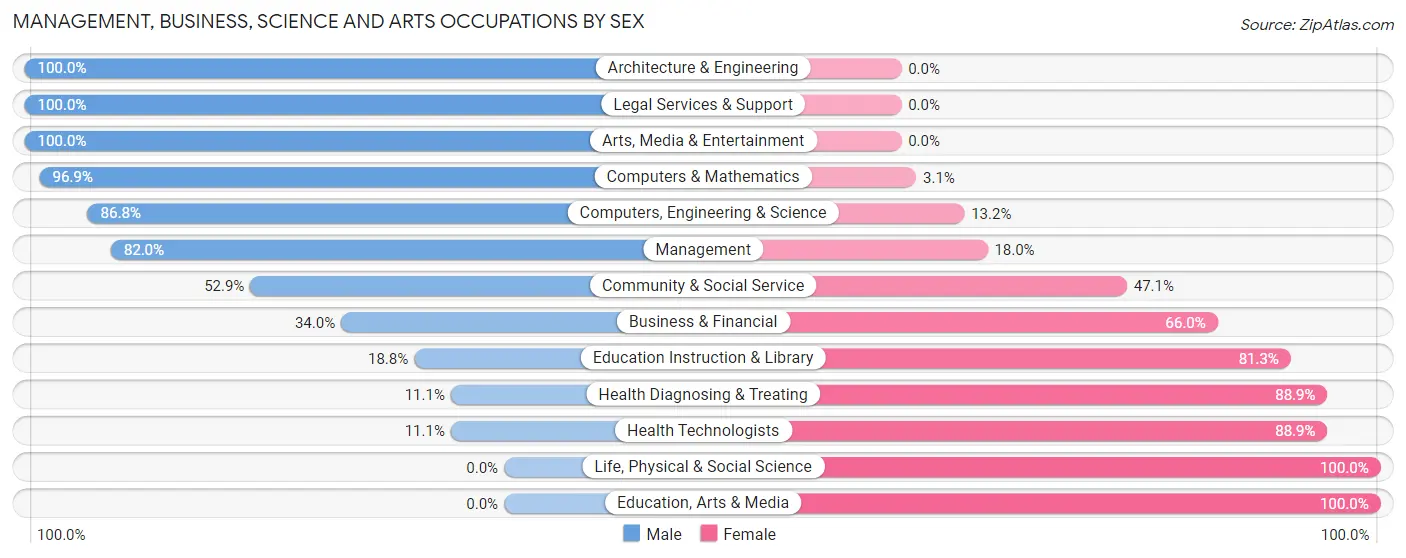
Management, Business, Science and Arts Occupations by Sex
Within the Management, Business, Science and Arts occupations in Riverwood, the most male-oriented occupations are Architecture & Engineering (100.0%), Legal Services & Support (100.0%), and Arts, Media & Entertainment (100.0%), while the most female-oriented occupations are Life, Physical & Social Science (100.0%), Education, Arts & Media (100.0%), and Health Diagnosing & Treating (88.9%).
| Occupation | Male | Female |
| Management | 41 (82.0%) | 9 (18.0%) |
| Business & Financial | 17 (34.0%) | 33 (66.0%) |
| Computers, Engineering & Science | 33 (86.8%) | 5 (13.2%) |
| Computers & Mathematics | 31 (96.9%) | 1 (3.1%) |
| Architecture & Engineering | 2 (100.0%) | 0 (0.0%) |
| Life, Physical & Social Science | 0 (0.0%) | 4 (100.0%) |
| Community & Social Service | 18 (52.9%) | 16 (47.1%) |
| Education, Arts & Media | 0 (0.0%) | 3 (100.0%) |
| Legal Services & Support | 13 (100.0%) | 0 (0.0%) |
| Education Instruction & Library | 3 (18.8%) | 13 (81.2%) |
| Arts, Media & Entertainment | 2 (100.0%) | 0 (0.0%) |
| Health Diagnosing & Treating | 1 (11.1%) | 8 (88.9%) |
| Health Technologists | 1 (11.1%) | 8 (88.9%) |
| Total (Category) | 110 (60.8%) | 71 (39.2%) |
| Total (Overall) | 137 (53.3%) | 120 (46.7%) |
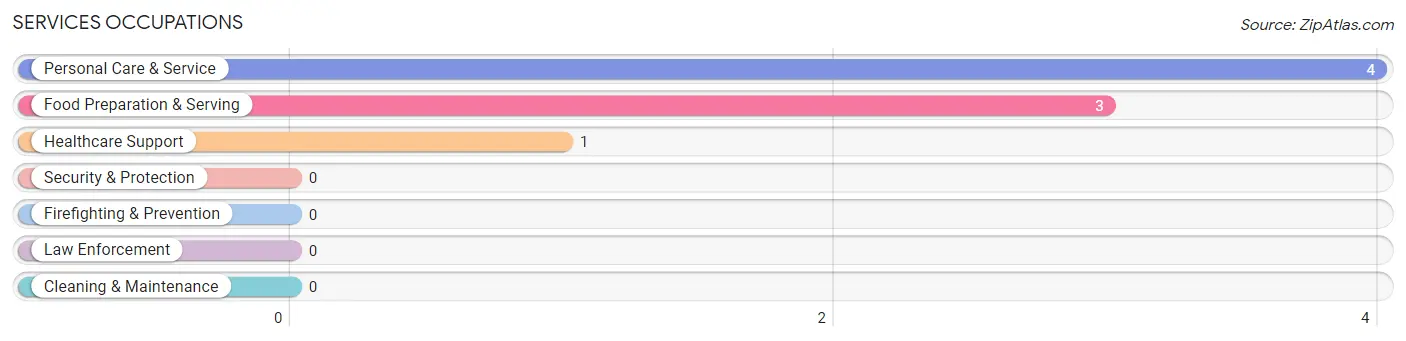
Services Occupations
The most common Services occupations in Riverwood are Personal Care & Service (4 | 1.6%), Food Preparation & Serving (3 | 1.2%), and Healthcare Support (1 | 0.4%).
Services Occupations by Sex
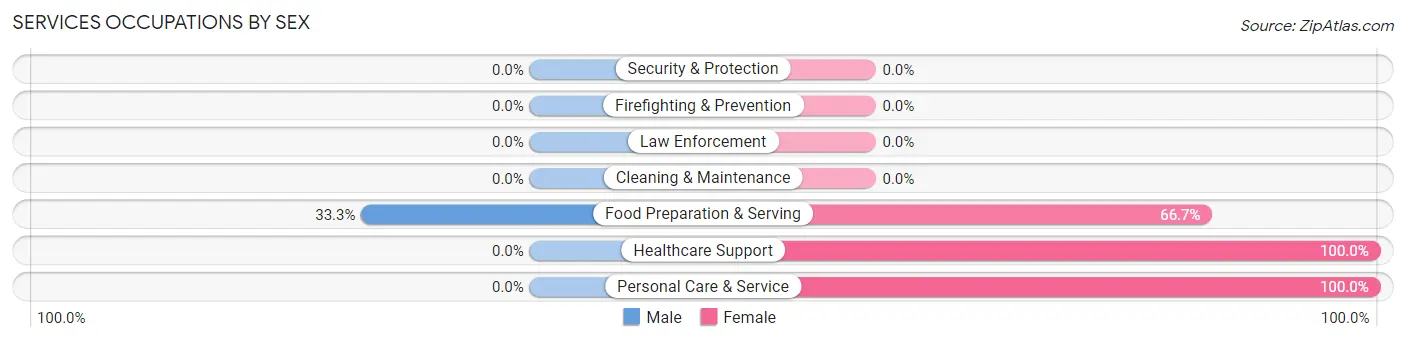
| Occupation | Male | Female |
| Healthcare Support | 0 (0.0%) | 1 (100.0%) |
| Security & Protection | 0 (0.0%) | 0 (0.0%) |
| Firefighting & Prevention | 0 (0.0%) | 0 (0.0%) |
| Law Enforcement | 0 (0.0%) | 0 (0.0%) |
| Food Preparation & Serving | 1 (33.3%) | 2 (66.7%) |
| Cleaning & Maintenance | 0 (0.0%) | 0 (0.0%) |
| Personal Care & Service | 0 (0.0%) | 4 (100.0%) |
| Total (Category) | 1 (12.5%) | 7 (87.5%) |
| Total (Overall) | 137 (53.3%) | 120 (46.7%) |
Sales and Office Occupations
The most common Sales and Office occupations in Riverwood are Sales & Related (39 | 15.2%), and Office & Administration (16 | 6.2%).
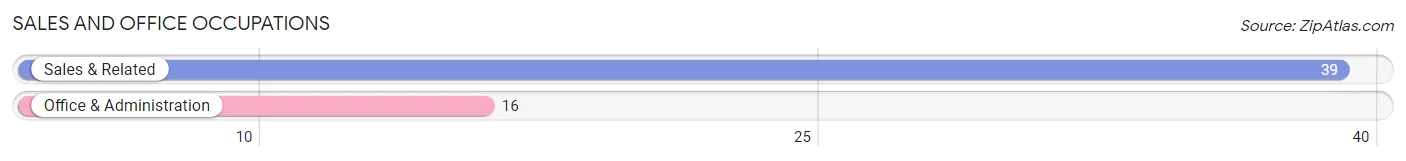
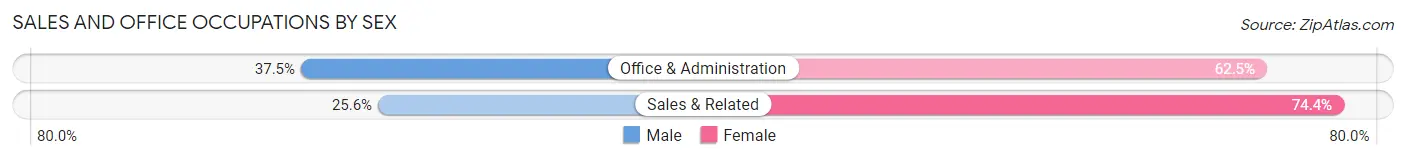
Sales and Office Occupations by Sex
| Occupation | Male | Female |
| Sales & Related | 10 (25.6%) | 29 (74.4%) |
| Office & Administration | 6 (37.5%) | 10 (62.5%) |
| Total (Category) | 16 (29.1%) | 39 (70.9%) |
| Total (Overall) | 137 (53.3%) | 120 (46.7%) |
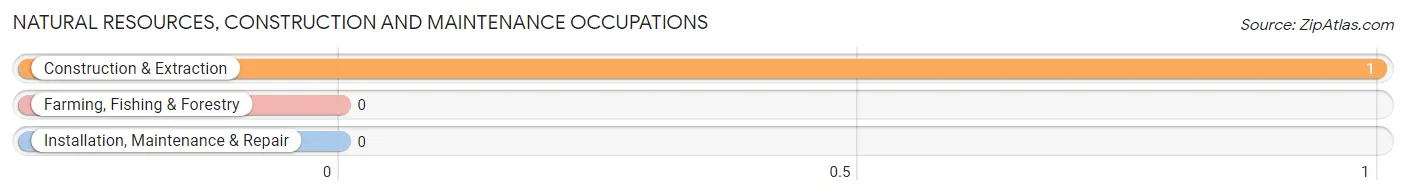
Natural Resources, Construction and Maintenance Occupations
The most common Natural Resources, Construction and Maintenance occupations in Riverwood are , and Construction & Extraction (1 | 0.4%).
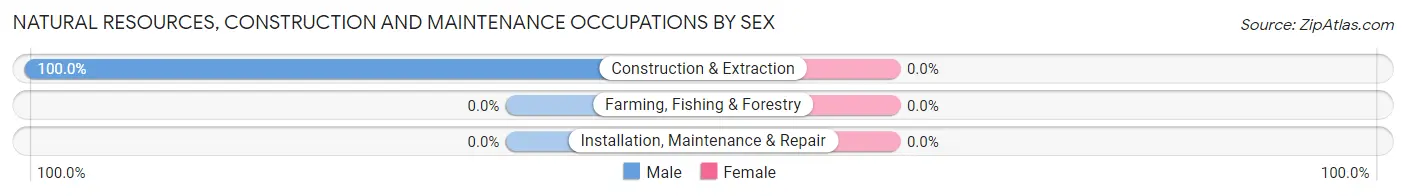
Natural Resources, Construction and Maintenance Occupations by Sex
| Occupation | Male | Female |
| Farming, Fishing & Forestry | 0 (0.0%) | 0 (0.0%) |
| Construction & Extraction | 1 (100.0%) | 0 (0.0%) |
| Installation, Maintenance & Repair | 0 (0.0%) | 0 (0.0%) |
| Total (Category) | 1 (100.0%) | 0 (0.0%) |
| Total (Overall) | 137 (53.3%) | 120 (46.7%) |
Production, Transportation and Moving Occupations
The most common Production, Transportation and Moving occupations in Riverwood are Transportation (8 | 3.1%), and Production (4 | 1.6%).
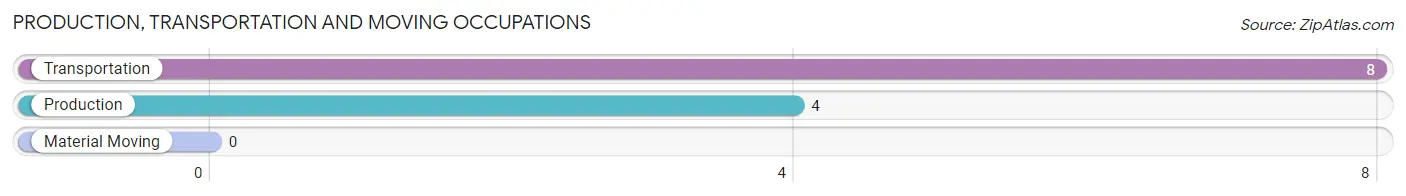
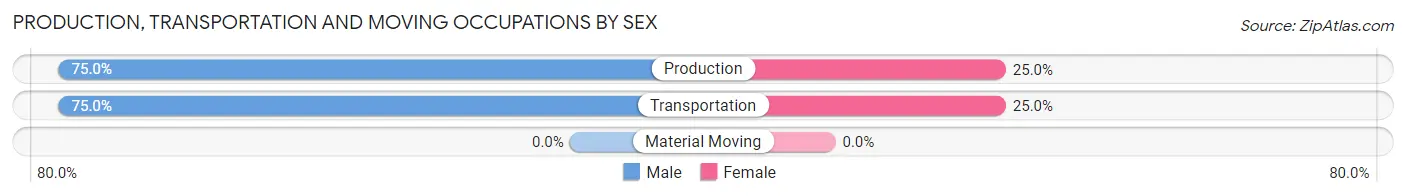
Production, Transportation and Moving Occupations by Sex
| Occupation | Male | Female |
| Production | 3 (75.0%) | 1 (25.0%) |
| Transportation | 6 (75.0%) | 2 (25.0%) |
| Material Moving | 0 (0.0%) | 0 (0.0%) |
| Total (Category) | 9 (75.0%) | 3 (25.0%) |
| Total (Overall) | 137 (53.3%) | 120 (46.7%) |
Employment Industries by Sex in Riverwood
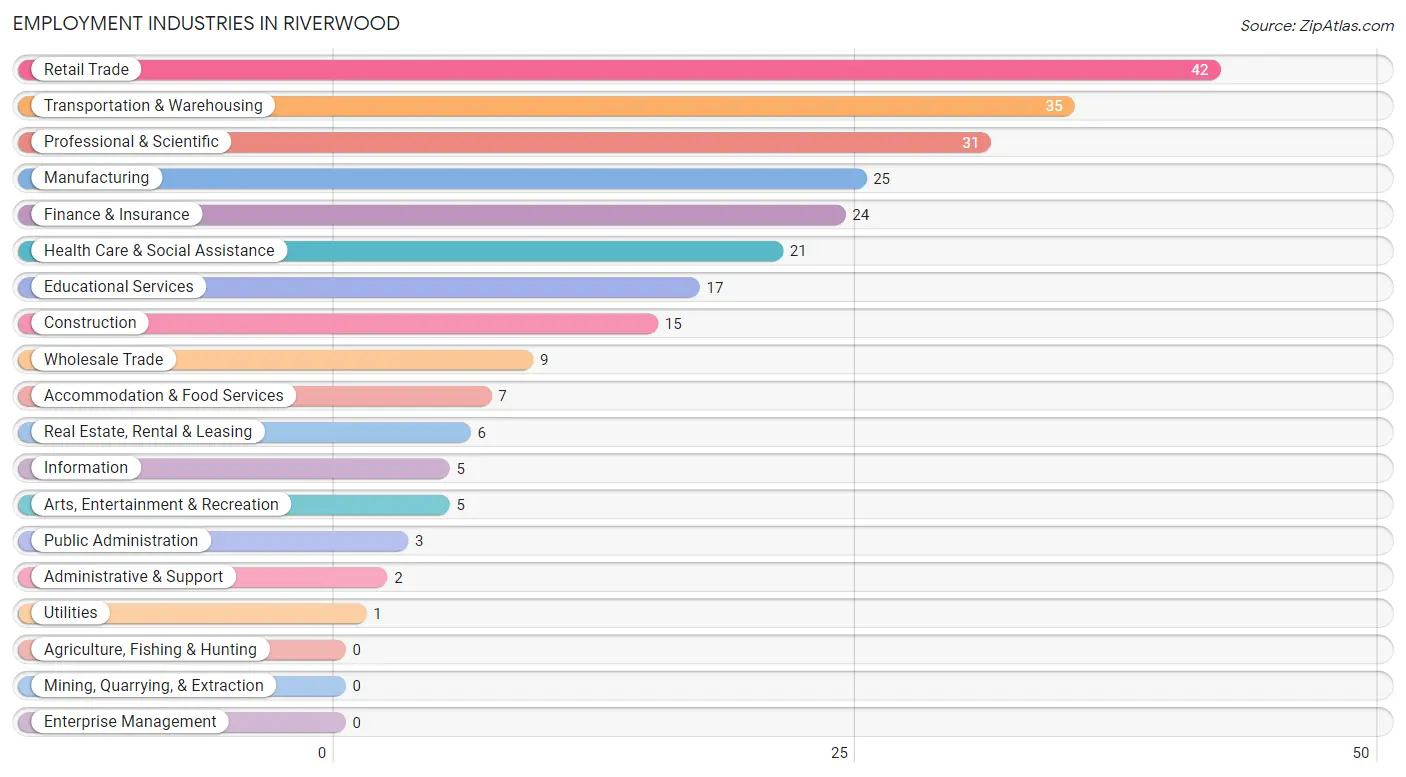
Employment Industries in Riverwood
The major employment industries in Riverwood include Retail Trade (42 | 16.3%), Transportation & Warehousing (35 | 13.6%), Professional & Scientific (31 | 12.1%), Manufacturing (25 | 9.7%), and Finance & Insurance (24 | 9.3%).
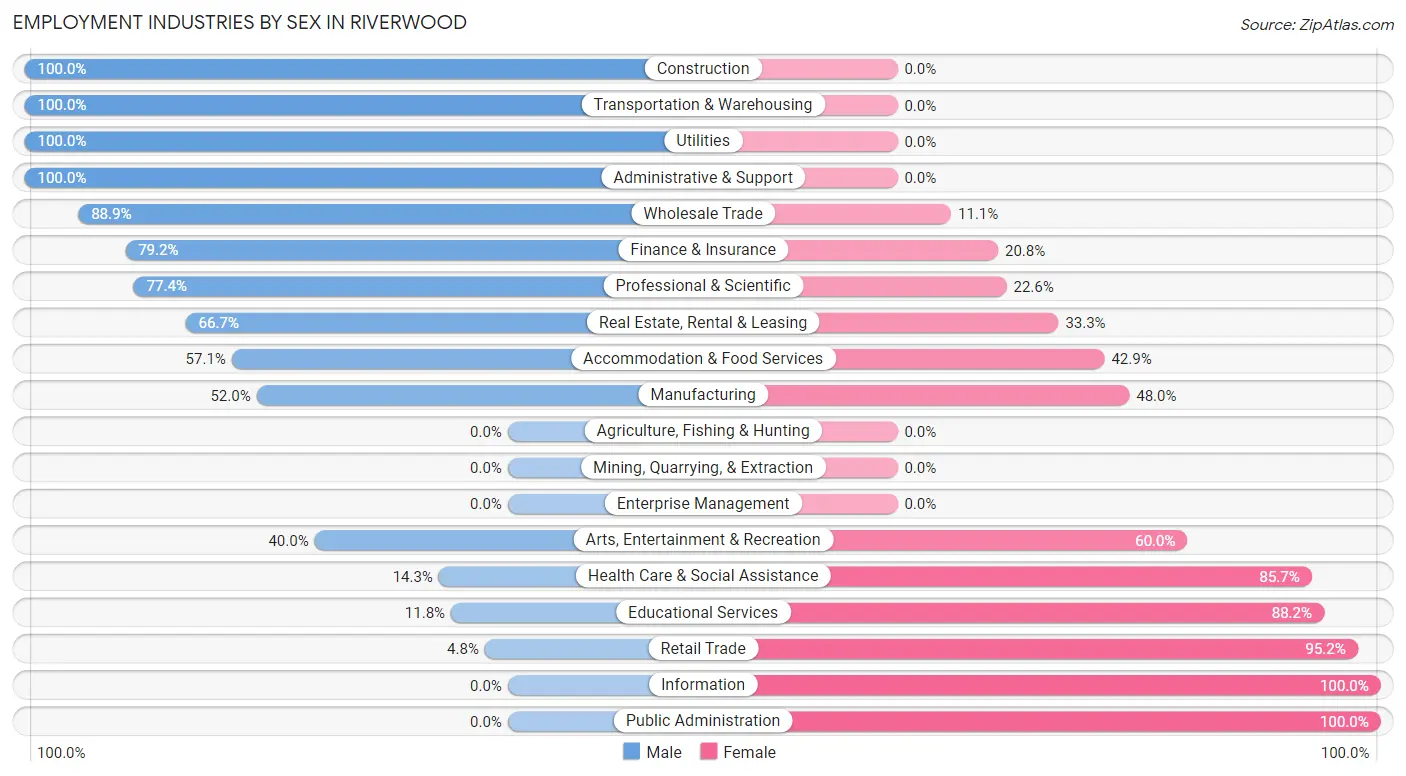
Employment Industries by Sex in Riverwood
The Riverwood industries that see more men than women are Construction (100.0%), Transportation & Warehousing (100.0%), and Utilities (100.0%), whereas the industries that tend to have a higher number of women are Information (100.0%), Public Administration (100.0%), and Retail Trade (95.2%).
| Industry | Male | Female |
| Agriculture, Fishing & Hunting | 0 (0.0%) | 0 (0.0%) |
| Mining, Quarrying, & Extraction | 0 (0.0%) | 0 (0.0%) |
| Construction | 15 (100.0%) | 0 (0.0%) |
| Manufacturing | 13 (52.0%) | 12 (48.0%) |
| Wholesale Trade | 8 (88.9%) | 1 (11.1%) |
| Retail Trade | 2 (4.8%) | 40 (95.2%) |
| Transportation & Warehousing | 35 (100.0%) | 0 (0.0%) |
| Utilities | 1 (100.0%) | 0 (0.0%) |
| Information | 0 (0.0%) | 5 (100.0%) |
| Finance & Insurance | 19 (79.2%) | 5 (20.8%) |
| Real Estate, Rental & Leasing | 4 (66.7%) | 2 (33.3%) |
| Professional & Scientific | 24 (77.4%) | 7 (22.6%) |
| Enterprise Management | 0 (0.0%) | 0 (0.0%) |
| Administrative & Support | 2 (100.0%) | 0 (0.0%) |
| Educational Services | 2 (11.8%) | 15 (88.2%) |
| Health Care & Social Assistance | 3 (14.3%) | 18 (85.7%) |
| Arts, Entertainment & Recreation | 2 (40.0%) | 3 (60.0%) |
| Accommodation & Food Services | 4 (57.1%) | 3 (42.9%) |
| Public Administration | 0 (0.0%) | 3 (100.0%) |
| Total | 137 (53.3%) | 120 (46.7%) |
Education in Riverwood
School Enrollment in Riverwood
The most common levels of schooling among the 123 students in Riverwood are elementary school (65 | 52.8%), high school (23 | 18.7%), and middle school (19 | 15.4%).
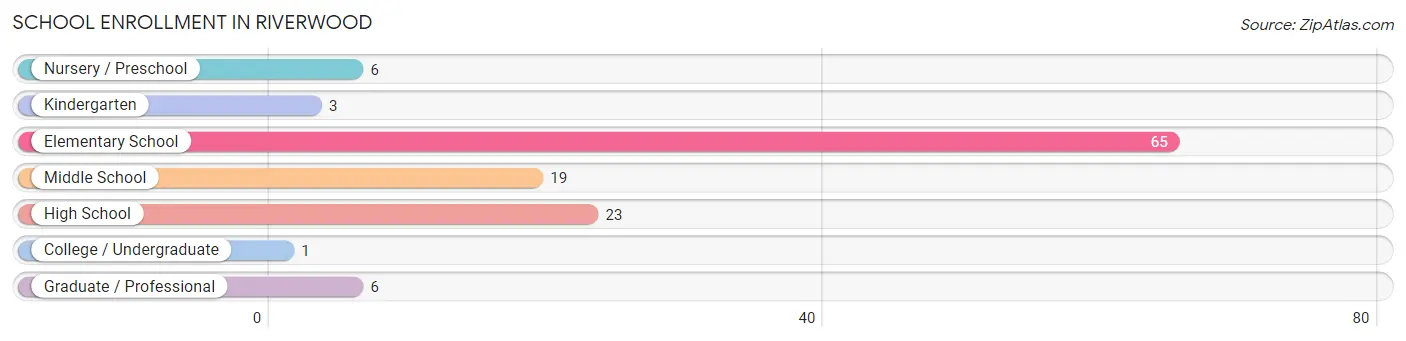
| School Level | # Students | % Students |
| Nursery / Preschool | 6 | 4.9% |
| Kindergarten | 3 | 2.4% |
| Elementary School | 65 | 52.8% |
| Middle School | 19 | 15.4% |
| High School | 23 | 18.7% |
| College / Undergraduate | 1 | 0.8% |
| Graduate / Professional | 6 | 4.9% |
| Total | 123 | 100.0% |
School Enrollment by Age by Funding Source in Riverwood
Out of a total of 123 students who are enrolled in schools in Riverwood, 63 (51.2%) attend a private institution, while the remaining 60 (48.8%) are enrolled in public schools. The age group of 15 to 17 year olds has the highest likelihood of being enrolled in private schools, with 14 (87.5% in the age bracket) enrolled. Conversely, the age group of 25 to 34 year olds has the lowest likelihood of being enrolled in a private school, with 5 (100.0% in the age bracket) attending a public institution.
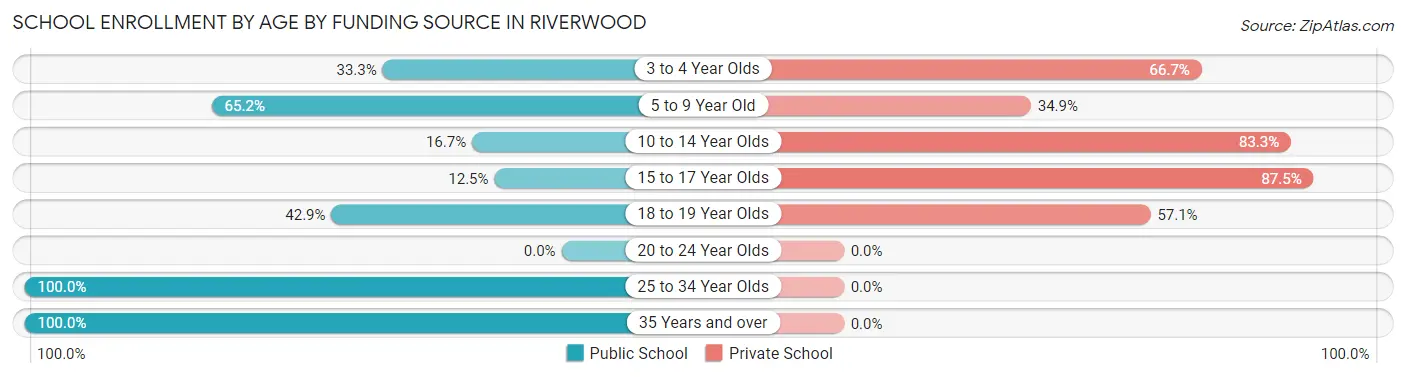
| Age Bracket | Public School | Private School |
| 3 to 4 Year Olds | 1 (33.3%) | 2 (66.7%) |
| 5 to 9 Year Old | 43 (65.1%) | 23 (34.8%) |
| 10 to 14 Year Olds | 4 (16.7%) | 20 (83.3%) |
| 15 to 17 Year Olds | 2 (12.5%) | 14 (87.5%) |
| 18 to 19 Year Olds | 3 (42.9%) | 4 (57.1%) |
| 20 to 24 Year Olds | 0 (0.0%) | 0 (0.0%) |
| 25 to 34 Year Olds | 5 (100.0%) | 0 (0.0%) |
| 35 Years and over | 2 (100.0%) | 0 (0.0%) |
| Total | 60 (48.8%) | 63 (51.2%) |
Educational Attainment by Field of Study in Riverwood
Business (81 | 26.1%), engineering (41 | 13.2%), science & technology (31 | 10.0%), social sciences (29 | 9.3%), and bio, nature & agricultural (19 | 6.1%) are the most common fields of study among 311 individuals in Riverwood who have obtained a bachelor's degree or higher.
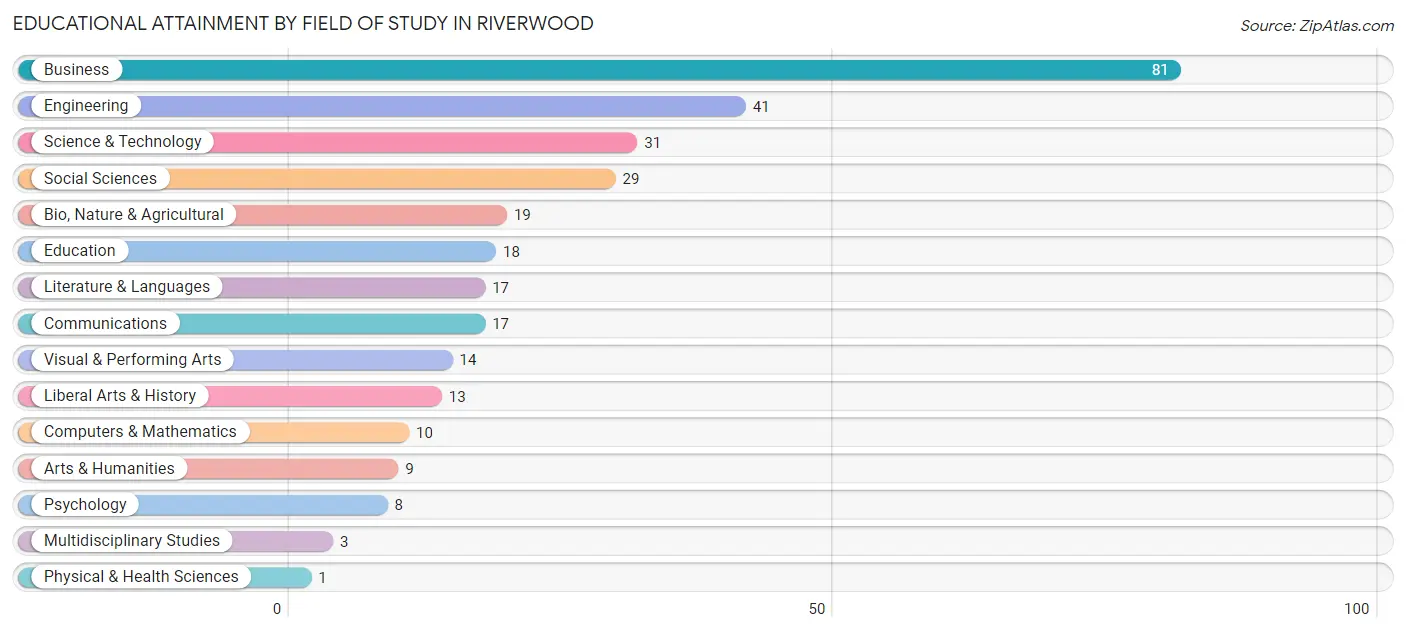
| Field of Study | # Graduates | % Graduates |
| Computers & Mathematics | 10 | 3.2% |
| Bio, Nature & Agricultural | 19 | 6.1% |
| Physical & Health Sciences | 1 | 0.3% |
| Psychology | 8 | 2.6% |
| Social Sciences | 29 | 9.3% |
| Engineering | 41 | 13.2% |
| Multidisciplinary Studies | 3 | 1.0% |
| Science & Technology | 31 | 10.0% |
| Business | 81 | 26.1% |
| Education | 18 | 5.8% |
| Literature & Languages | 17 | 5.5% |
| Liberal Arts & History | 13 | 4.2% |
| Visual & Performing Arts | 14 | 4.5% |
| Communications | 17 | 5.5% |
| Arts & Humanities | 9 | 2.9% |
| Total | 311 | 100.0% |
Transportation & Commute in Riverwood
Vehicle Availability by Sex in Riverwood
The most prevalent vehicle ownership categories in Riverwood are males with 2 vehicles (86, accounting for 62.8%) and females with 2 vehicles (62, making up 72.9%).
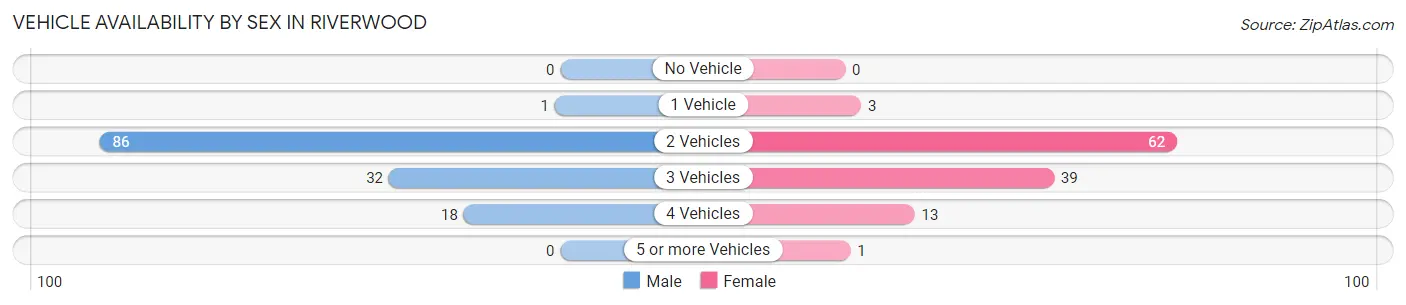
| Vehicles Available | Male | Female |
| No Vehicle | 0 (0.0%) | 0 (0.0%) |
| 1 Vehicle | 1 (0.7%) | 3 (2.5%) |
| 2 Vehicles | 86 (62.8%) | 62 (52.5%) |
| 3 Vehicles | 32 (23.4%) | 39 (33.1%) |
| 4 Vehicles | 18 (13.1%) | 13 (11.0%) |
| 5 or more Vehicles | 0 (0.0%) | 1 (0.9%) |
| Total | 137 (100.0%) | 118 (100.0%) |
Commute Time in Riverwood
The most frequently occuring commute durations in Riverwood are 15 to 19 minutes (57 commuters, 34.8%), 20 to 24 minutes (41 commuters, 25.0%), and 10 to 14 minutes (32 commuters, 19.5%).
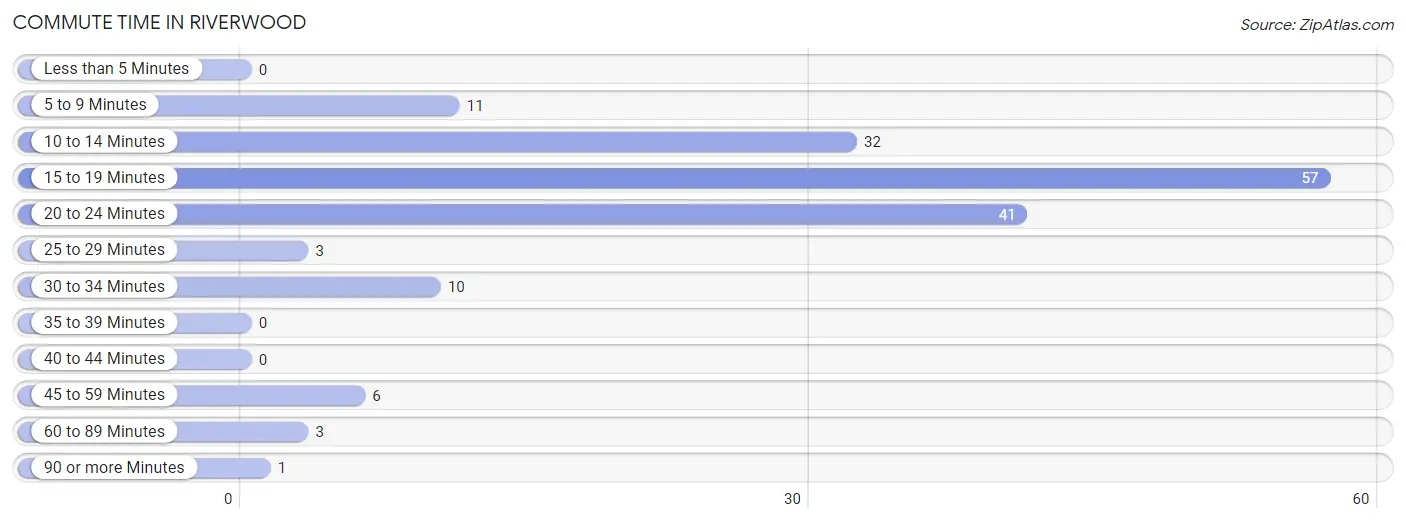
| Commute Time | # Commuters | % Commuters |
| Less than 5 Minutes | 0 | 0.0% |
| 5 to 9 Minutes | 11 | 6.7% |
| 10 to 14 Minutes | 32 | 19.5% |
| 15 to 19 Minutes | 57 | 34.8% |
| 20 to 24 Minutes | 41 | 25.0% |
| 25 to 29 Minutes | 3 | 1.8% |
| 30 to 34 Minutes | 10 | 6.1% |
| 35 to 39 Minutes | 0 | 0.0% |
| 40 to 44 Minutes | 0 | 0.0% |
| 45 to 59 Minutes | 6 | 3.7% |
| 60 to 89 Minutes | 3 | 1.8% |
| 90 or more Minutes | 1 | 0.6% |
Commute Time by Sex in Riverwood
The most common commute times in Riverwood are 15 to 19 minutes (33 commuters, 36.7%) for males and 15 to 19 minutes (24 commuters, 32.4%) for females.
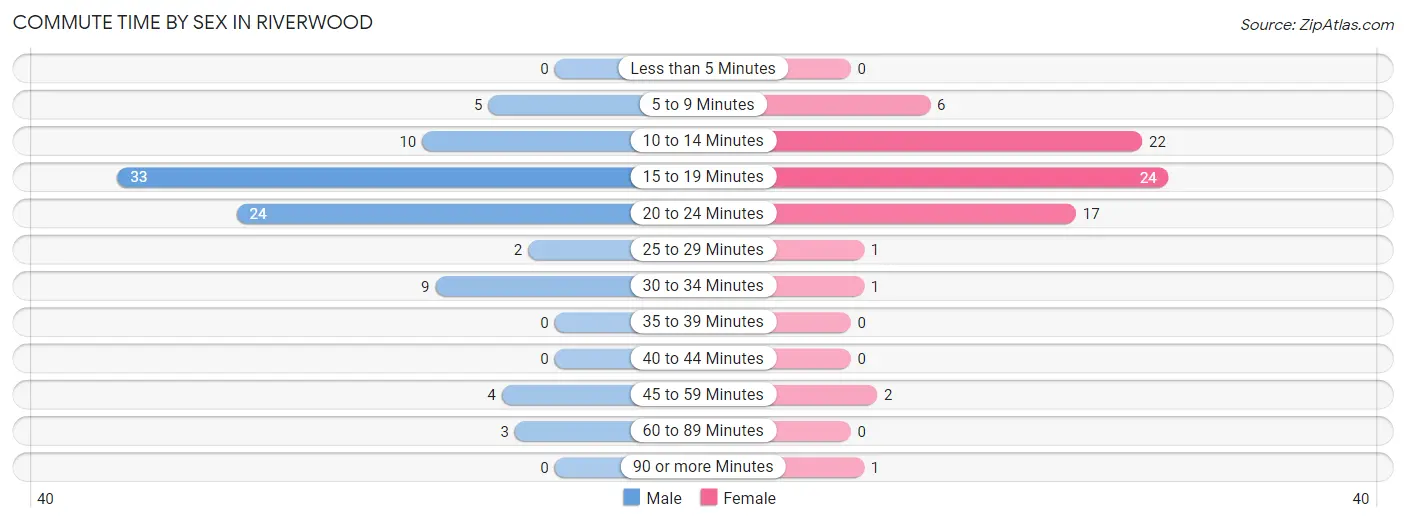
| Commute Time | Male | Female |
| Less than 5 Minutes | 0 (0.0%) | 0 (0.0%) |
| 5 to 9 Minutes | 5 (5.6%) | 6 (8.1%) |
| 10 to 14 Minutes | 10 (11.1%) | 22 (29.7%) |
| 15 to 19 Minutes | 33 (36.7%) | 24 (32.4%) |
| 20 to 24 Minutes | 24 (26.7%) | 17 (23.0%) |
| 25 to 29 Minutes | 2 (2.2%) | 1 (1.3%) |
| 30 to 34 Minutes | 9 (10.0%) | 1 (1.3%) |
| 35 to 39 Minutes | 0 (0.0%) | 0 (0.0%) |
| 40 to 44 Minutes | 0 (0.0%) | 0 (0.0%) |
| 45 to 59 Minutes | 4 (4.4%) | 2 (2.7%) |
| 60 to 89 Minutes | 3 (3.3%) | 0 (0.0%) |
| 90 or more Minutes | 0 (0.0%) | 1 (1.3%) |
Time of Departure to Work by Sex in Riverwood
The most frequent times of departure to work in Riverwood are 8:00 AM to 8:29 AM (35, 38.9%) for males and 7:30 AM to 7:59 AM (14, 18.9%) for females.
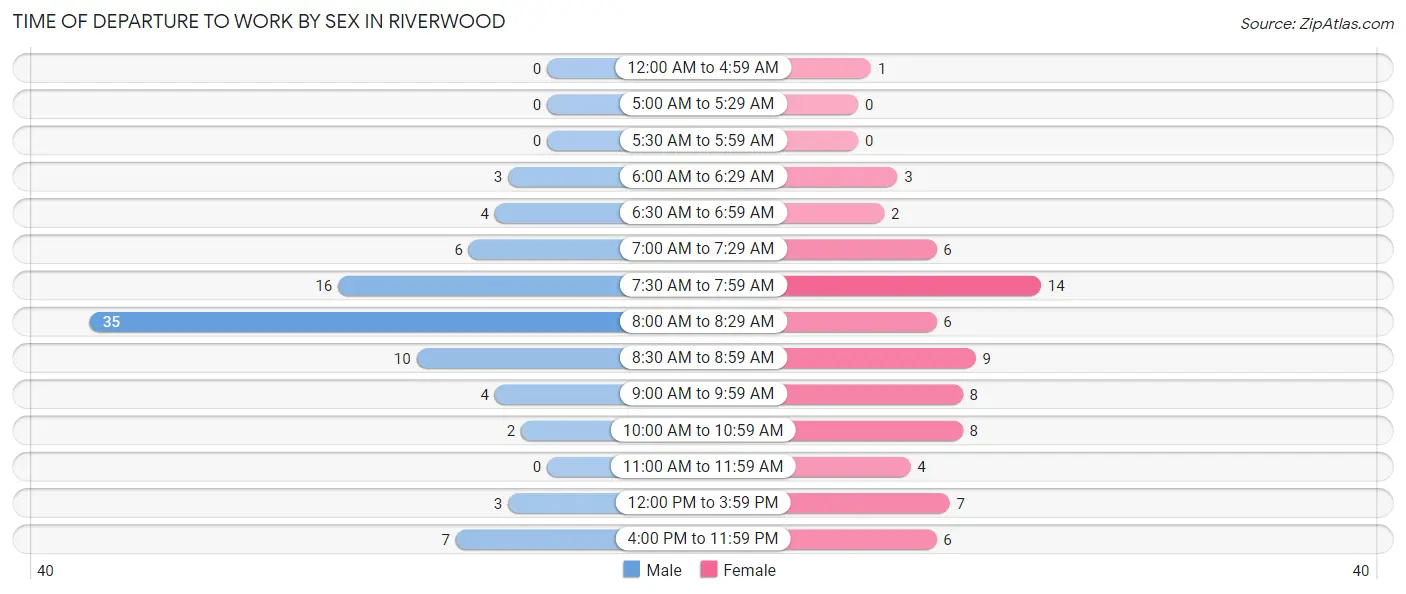
| Time of Departure | Male | Female |
| 12:00 AM to 4:59 AM | 0 (0.0%) | 1 (1.3%) |
| 5:00 AM to 5:29 AM | 0 (0.0%) | 0 (0.0%) |
| 5:30 AM to 5:59 AM | 0 (0.0%) | 0 (0.0%) |
| 6:00 AM to 6:29 AM | 3 (3.3%) | 3 (4.1%) |
| 6:30 AM to 6:59 AM | 4 (4.4%) | 2 (2.7%) |
| 7:00 AM to 7:29 AM | 6 (6.7%) | 6 (8.1%) |
| 7:30 AM to 7:59 AM | 16 (17.8%) | 14 (18.9%) |
| 8:00 AM to 8:29 AM | 35 (38.9%) | 6 (8.1%) |
| 8:30 AM to 8:59 AM | 10 (11.1%) | 9 (12.2%) |
| 9:00 AM to 9:59 AM | 4 (4.4%) | 8 (10.8%) |
| 10:00 AM to 10:59 AM | 2 (2.2%) | 8 (10.8%) |
| 11:00 AM to 11:59 AM | 0 (0.0%) | 4 (5.4%) |
| 12:00 PM to 3:59 PM | 3 (3.3%) | 7 (9.5%) |
| 4:00 PM to 11:59 PM | 7 (7.8%) | 6 (8.1%) |
| Total | 90 (100.0%) | 74 (100.0%) |
Housing Occupancy in Riverwood
Occupancy by Ownership in Riverwood
Of the total 180 dwellings in Riverwood, owner-occupied units account for 176 (97.8%), while renter-occupied units make up 4 (2.2%).
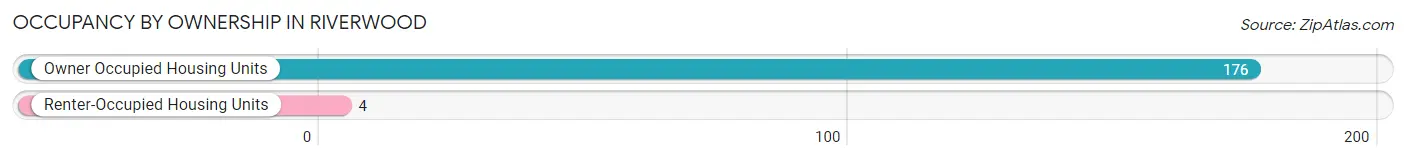
| Occupancy | # Housing Units | % Housing Units |
| Owner Occupied Housing Units | 176 | 97.8% |
| Renter-Occupied Housing Units | 4 | 2.2% |
| Total Occupied Housing Units | 180 | 100.0% |
Occupancy by Household Size in Riverwood
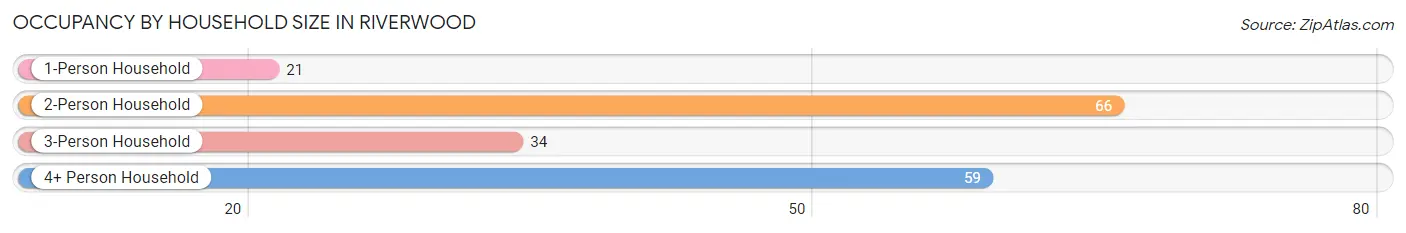
| Household Size | # Housing Units | % Housing Units |
| 1-Person Household | 21 | 11.7% |
| 2-Person Household | 66 | 36.7% |
| 3-Person Household | 34 | 18.9% |
| 4+ Person Household | 59 | 32.8% |
| Total Housing Units | 180 | 100.0% |
Occupancy by Ownership by Household Size in Riverwood
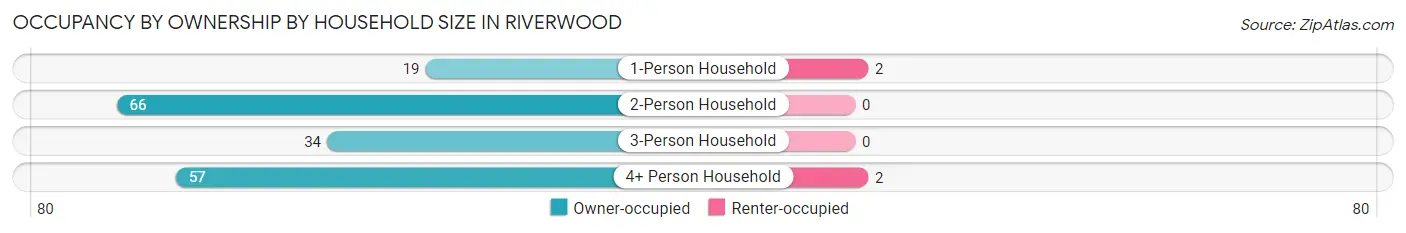
| Household Size | Owner-occupied | Renter-occupied |
| 1-Person Household | 19 (90.5%) | 2 (9.5%) |
| 2-Person Household | 66 (100.0%) | 0 (0.0%) |
| 3-Person Household | 34 (100.0%) | 0 (0.0%) |
| 4+ Person Household | 57 (96.6%) | 2 (3.4%) |
| Total Housing Units | 176 (97.8%) | 4 (2.2%) |
Occupancy by Educational Attainment in Riverwood
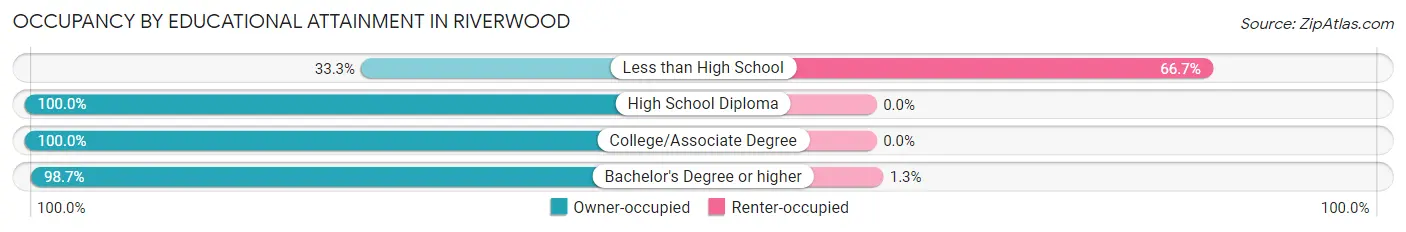
| Household Size | Owner-occupied | Renter-occupied |
| Less than High School | 1 (33.3%) | 2 (66.7%) |
| High School Diploma | 6 (100.0%) | 0 (0.0%) |
| College/Associate Degree | 18 (100.0%) | 0 (0.0%) |
| Bachelor's Degree or higher | 151 (98.7%) | 2 (1.3%) |
Occupancy by Age of Householder in Riverwood
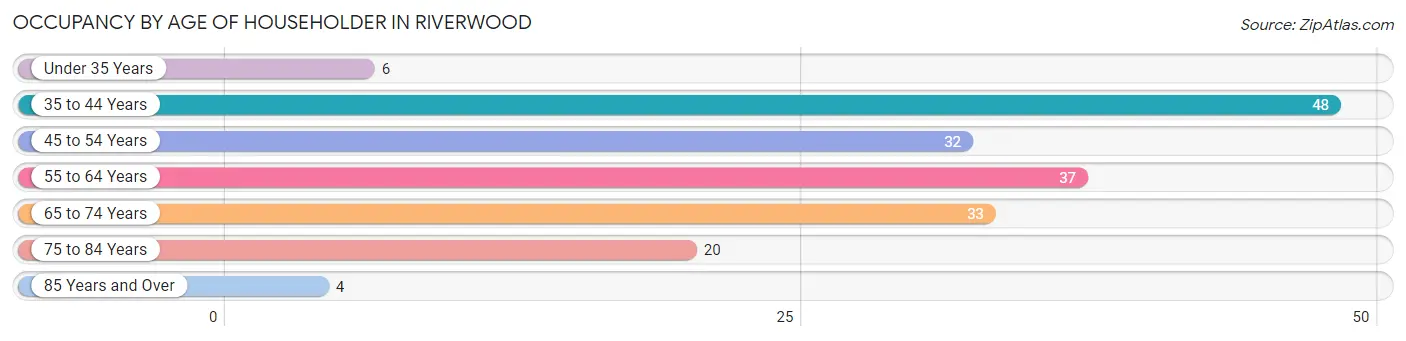
| Age Bracket | # Households | % Households |
| Under 35 Years | 6 | 3.3% |
| 35 to 44 Years | 48 | 26.7% |
| 45 to 54 Years | 32 | 17.8% |
| 55 to 64 Years | 37 | 20.6% |
| 65 to 74 Years | 33 | 18.3% |
| 75 to 84 Years | 20 | 11.1% |
| 85 Years and Over | 4 | 2.2% |
| Total | 180 | 100.0% |
Housing Finances in Riverwood
Median Income by Occupancy in Riverwood
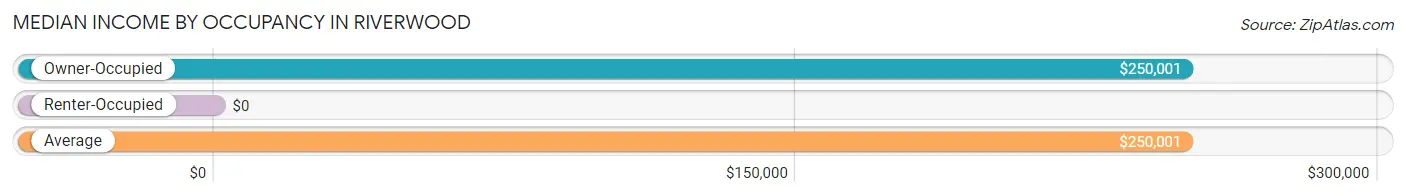
| Occupancy Type | # Households | Median Income |
| Owner-Occupied | 176 (97.8%) | $250,001 |
| Renter-Occupied | 4 (2.2%) | $0 |
| Average | 180 (100.0%) | $250,001 |
Occupancy by Householder Income Bracket in Riverwood
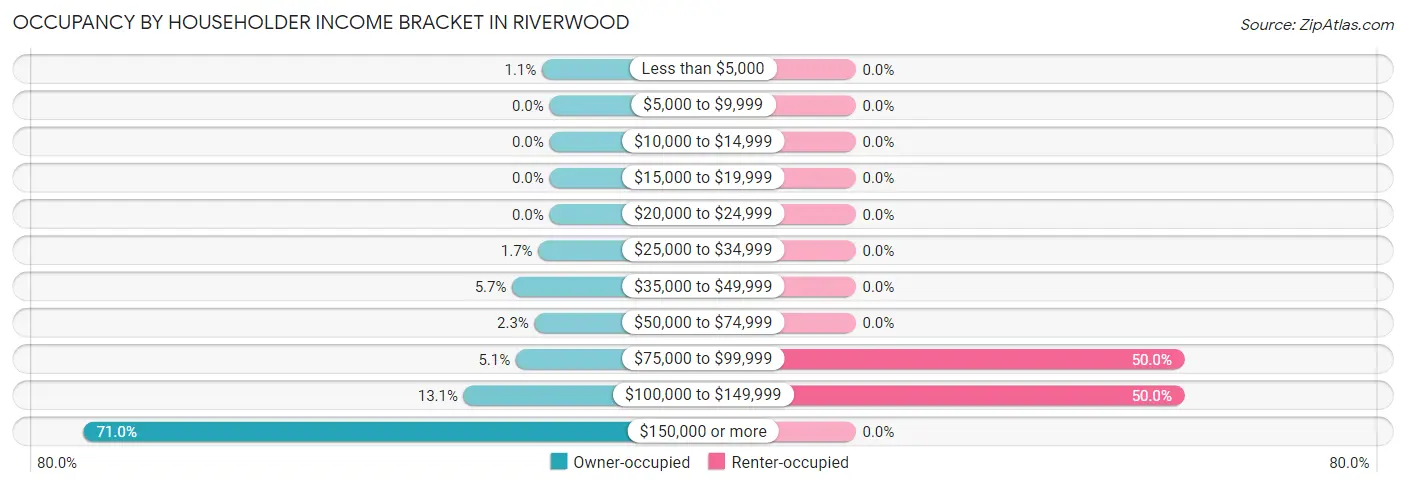
| Income Bracket | Owner-occupied | Renter-occupied |
| Less than $5,000 | 2 (1.1%) | 0 (0.0%) |
| $5,000 to $9,999 | 0 (0.0%) | 0 (0.0%) |
| $10,000 to $14,999 | 0 (0.0%) | 0 (0.0%) |
| $15,000 to $19,999 | 0 (0.0%) | 0 (0.0%) |
| $20,000 to $24,999 | 0 (0.0%) | 0 (0.0%) |
| $25,000 to $34,999 | 3 (1.7%) | 0 (0.0%) |
| $35,000 to $49,999 | 10 (5.7%) | 0 (0.0%) |
| $50,000 to $74,999 | 4 (2.3%) | 0 (0.0%) |
| $75,000 to $99,999 | 9 (5.1%) | 2 (50.0%) |
| $100,000 to $149,999 | 23 (13.1%) | 2 (50.0%) |
| $150,000 or more | 125 (71.0%) | 0 (0.0%) |
| Total | 176 (100.0%) | 4 (100.0%) |
Monthly Housing Cost Tiers in Riverwood
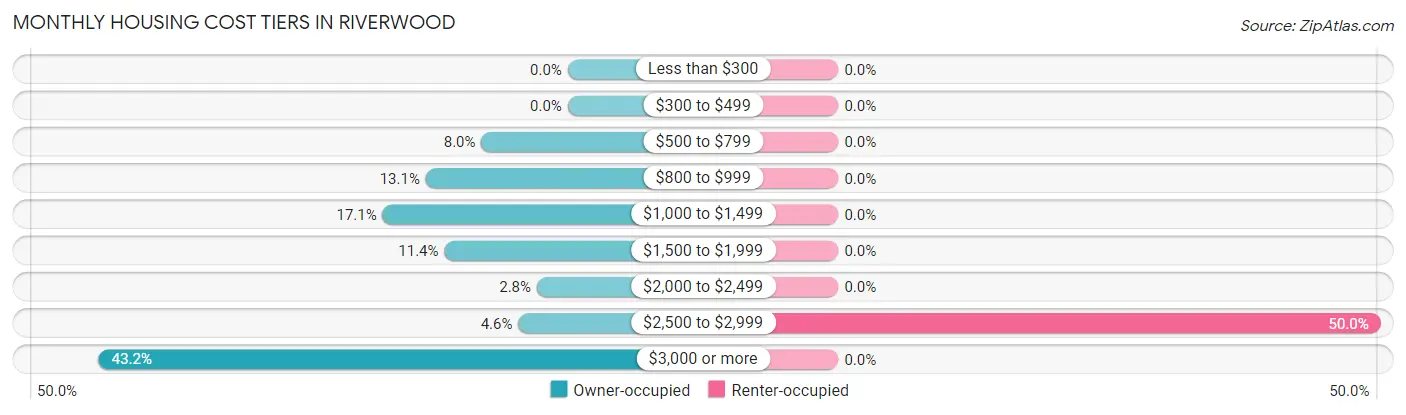
| Monthly Cost | Owner-occupied | Renter-occupied |
| Less than $300 | 0 (0.0%) | 0 (0.0%) |
| $300 to $499 | 0 (0.0%) | 0 (0.0%) |
| $500 to $799 | 14 (8.0%) | 0 (0.0%) |
| $800 to $999 | 23 (13.1%) | 0 (0.0%) |
| $1,000 to $1,499 | 30 (17.1%) | 0 (0.0%) |
| $1,500 to $1,999 | 20 (11.4%) | 0 (0.0%) |
| $2,000 to $2,499 | 5 (2.8%) | 0 (0.0%) |
| $2,500 to $2,999 | 8 (4.5%) | 2 (50.0%) |
| $3,000 or more | 76 (43.2%) | 0 (0.0%) |
| Total | 176 (100.0%) | 4 (100.0%) |
Physical Housing Characteristics in Riverwood
Housing Structures in Riverwood
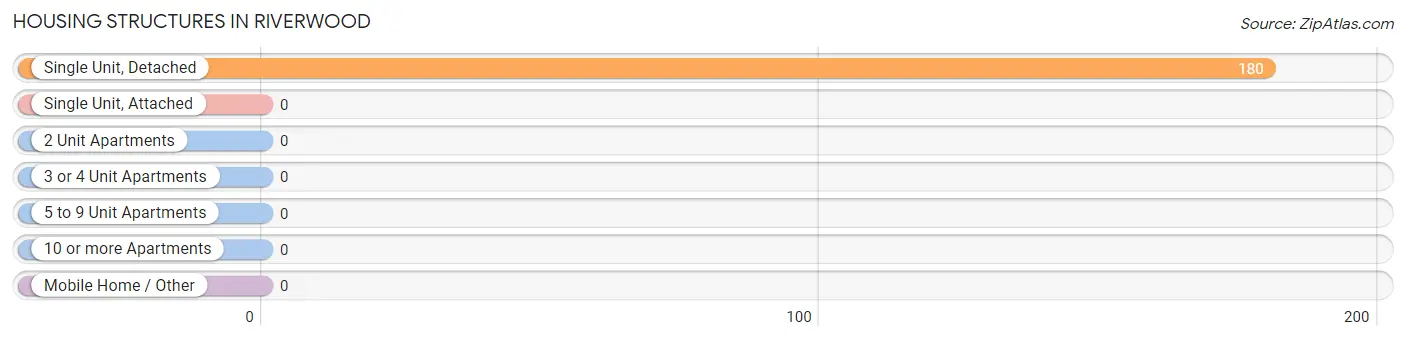
| Structure Type | # Housing Units | % Housing Units |
| Single Unit, Detached | 180 | 100.0% |
| Single Unit, Attached | 0 | 0.0% |
| 2 Unit Apartments | 0 | 0.0% |
| 3 or 4 Unit Apartments | 0 | 0.0% |
| 5 to 9 Unit Apartments | 0 | 0.0% |
| 10 or more Apartments | 0 | 0.0% |
| Mobile Home / Other | 0 | 0.0% |
| Total | 180 | 100.0% |
Housing Structures by Occupancy in Riverwood
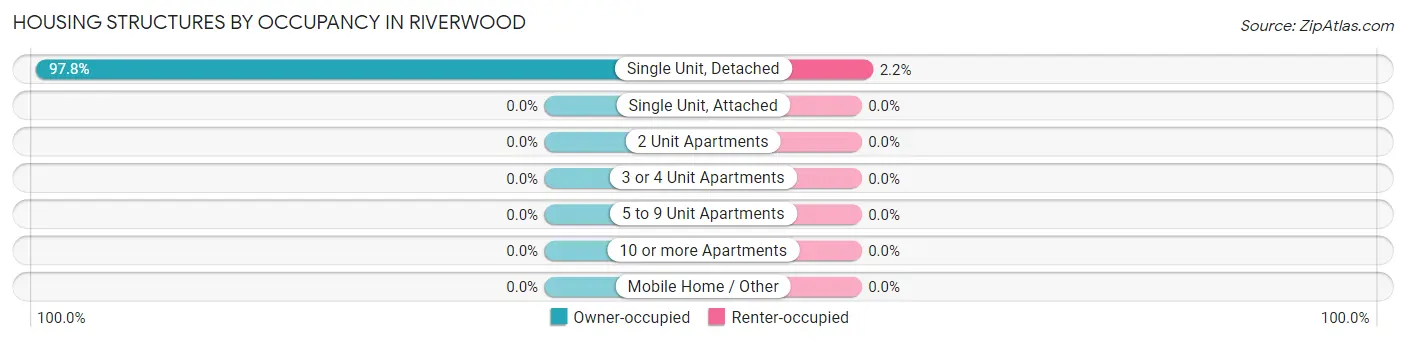
| Structure Type | Owner-occupied | Renter-occupied |
| Single Unit, Detached | 176 (97.8%) | 4 (2.2%) |
| Single Unit, Attached | 0 (0.0%) | 0 (0.0%) |
| 2 Unit Apartments | 0 (0.0%) | 0 (0.0%) |
| 3 or 4 Unit Apartments | 0 (0.0%) | 0 (0.0%) |
| 5 to 9 Unit Apartments | 0 (0.0%) | 0 (0.0%) |
| 10 or more Apartments | 0 (0.0%) | 0 (0.0%) |
| Mobile Home / Other | 0 (0.0%) | 0 (0.0%) |
| Total | 176 (97.8%) | 4 (2.2%) |
Housing Structures by Number of Rooms in Riverwood
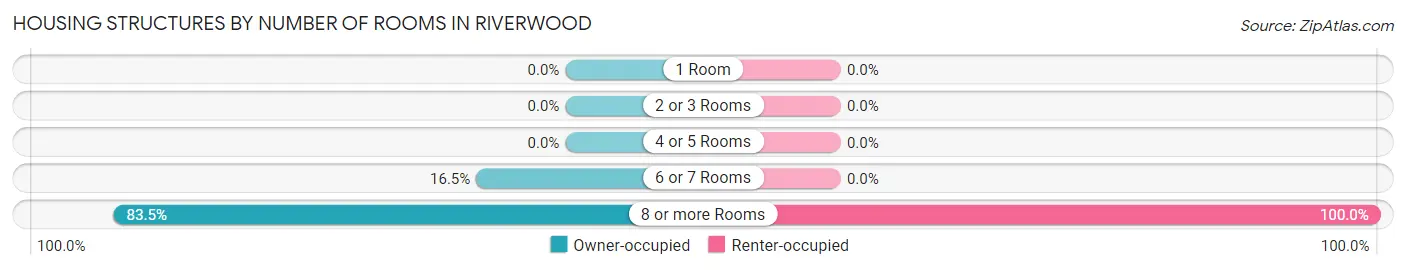
| Number of Rooms | Owner-occupied | Renter-occupied |
| 1 Room | 0 (0.0%) | 0 (0.0%) |
| 2 or 3 Rooms | 0 (0.0%) | 0 (0.0%) |
| 4 or 5 Rooms | 0 (0.0%) | 0 (0.0%) |
| 6 or 7 Rooms | 29 (16.5%) | 0 (0.0%) |
| 8 or more Rooms | 147 (83.5%) | 4 (100.0%) |
| Total | 176 (100.0%) | 4 (100.0%) |
Housing Structure by Heating Type in Riverwood
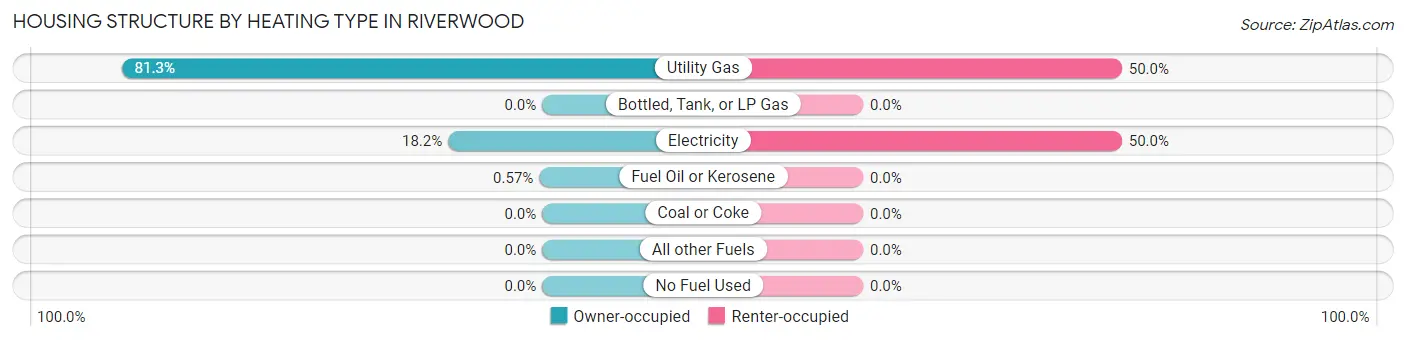
| Heating Type | Owner-occupied | Renter-occupied |
| Utility Gas | 143 (81.2%) | 2 (50.0%) |
| Bottled, Tank, or LP Gas | 0 (0.0%) | 0 (0.0%) |
| Electricity | 32 (18.2%) | 2 (50.0%) |
| Fuel Oil or Kerosene | 1 (0.6%) | 0 (0.0%) |
| Coal or Coke | 0 (0.0%) | 0 (0.0%) |
| All other Fuels | 0 (0.0%) | 0 (0.0%) |
| No Fuel Used | 0 (0.0%) | 0 (0.0%) |
| Total | 176 (100.0%) | 4 (100.0%) |
Household Vehicle Usage in Riverwood
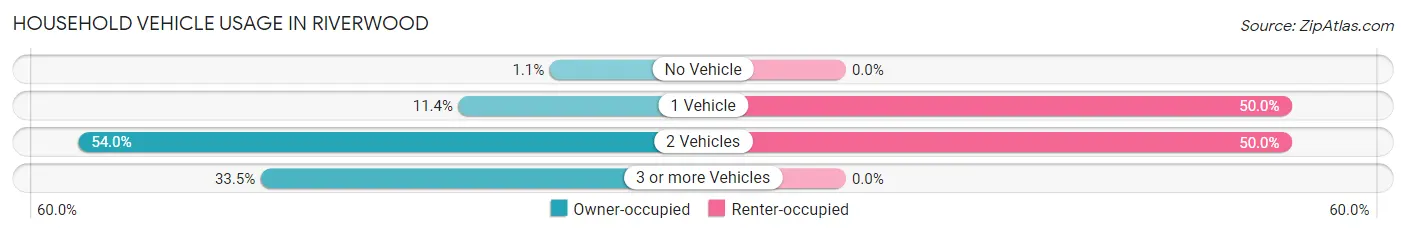
| Vehicles per Household | Owner-occupied | Renter-occupied |
| No Vehicle | 2 (1.1%) | 0 (0.0%) |
| 1 Vehicle | 20 (11.4%) | 2 (50.0%) |
| 2 Vehicles | 95 (54.0%) | 2 (50.0%) |
| 3 or more Vehicles | 59 (33.5%) | 0 (0.0%) |
| Total | 176 (100.0%) | 4 (100.0%) |
Real Estate & Mortgages in Riverwood
Real Estate and Mortgage Overview in Riverwood
| Characteristic | Without Mortgage | With Mortgage |
| Housing Units | 71 | 105 |
| Median Property Value | $591,200 | $607,400 |
| Median Household Income | $168,750 | $82 |
| Monthly Housing Costs | $1,004 | $76 |
| Real Estate Taxes | $4,885 | $0 |
Property Value by Mortgage Status in Riverwood
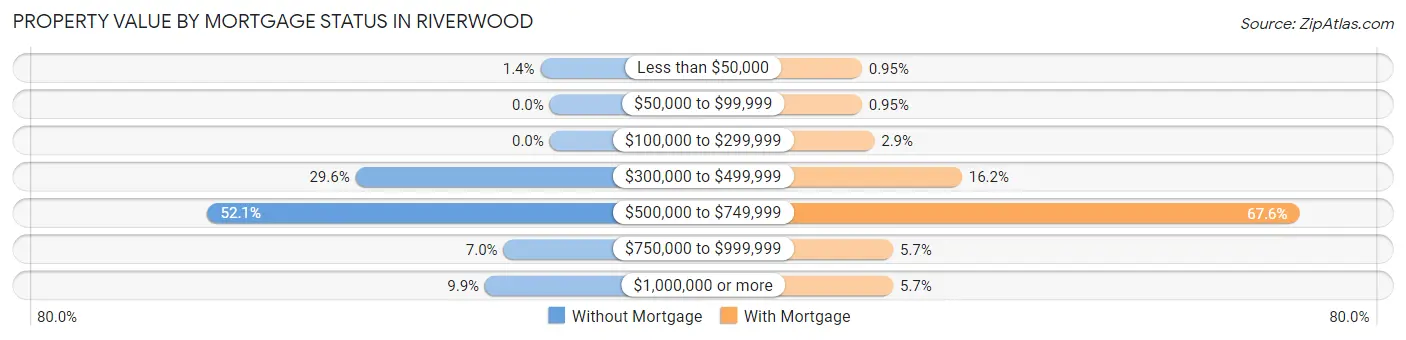
| Property Value | Without Mortgage | With Mortgage |
| Less than $50,000 | 1 (1.4%) | 1 (0.9%) |
| $50,000 to $99,999 | 0 (0.0%) | 1 (0.9%) |
| $100,000 to $299,999 | 0 (0.0%) | 3 (2.9%) |
| $300,000 to $499,999 | 21 (29.6%) | 17 (16.2%) |
| $500,000 to $749,999 | 37 (52.1%) | 71 (67.6%) |
| $750,000 to $999,999 | 5 (7.0%) | 6 (5.7%) |
| $1,000,000 or more | 7 (9.9%) | 6 (5.7%) |
| Total | 71 (100.0%) | 105 (100.0%) |
Household Income by Mortgage Status in Riverwood
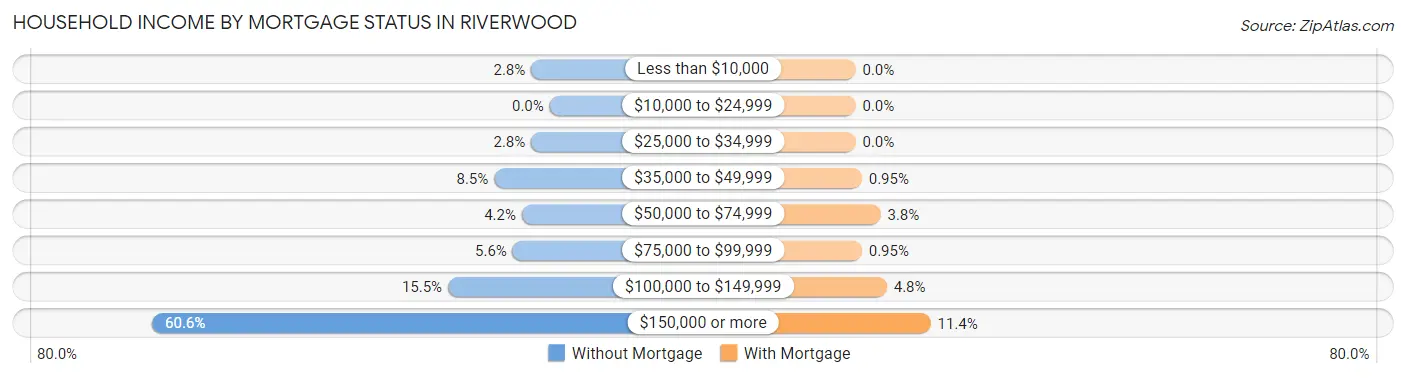
| Household Income | Without Mortgage | With Mortgage |
| Less than $10,000 | 2 (2.8%) | 0 (0.0%) |
| $10,000 to $24,999 | 0 (0.0%) | 0 (0.0%) |
| $25,000 to $34,999 | 2 (2.8%) | 0 (0.0%) |
| $35,000 to $49,999 | 6 (8.5%) | 1 (0.9%) |
| $50,000 to $74,999 | 3 (4.2%) | 4 (3.8%) |
| $75,000 to $99,999 | 4 (5.6%) | 1 (0.9%) |
| $100,000 to $149,999 | 11 (15.5%) | 5 (4.8%) |
| $150,000 or more | 43 (60.6%) | 12 (11.4%) |
| Total | 71 (100.0%) | 105 (100.0%) |
Property Value to Household Income Ratio in Riverwood
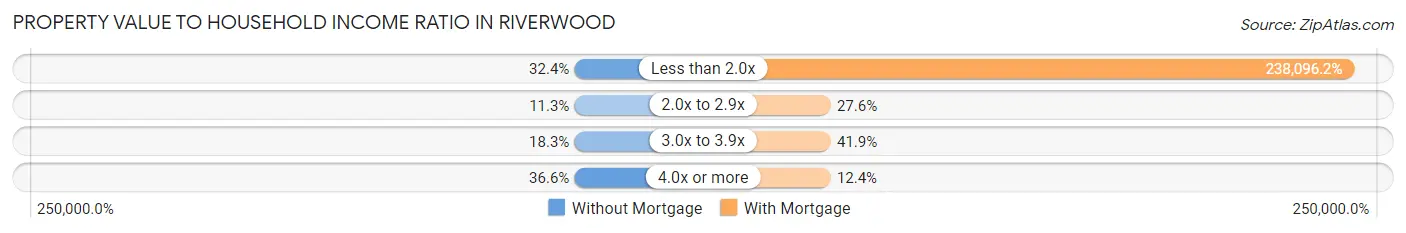
| Value-to-Income Ratio | Without Mortgage | With Mortgage |
| Less than 2.0x | 23 (32.4%) | 250,001 (238,096.2%) |
| 2.0x to 2.9x | 8 (11.3%) | 29 (27.6%) |
| 3.0x to 3.9x | 13 (18.3%) | 44 (41.9%) |
| 4.0x or more | 26 (36.6%) | 13 (12.4%) |
| Total | 71 (100.0%) | 105 (100.0%) |
Real Estate Taxes by Mortgage Status in Riverwood
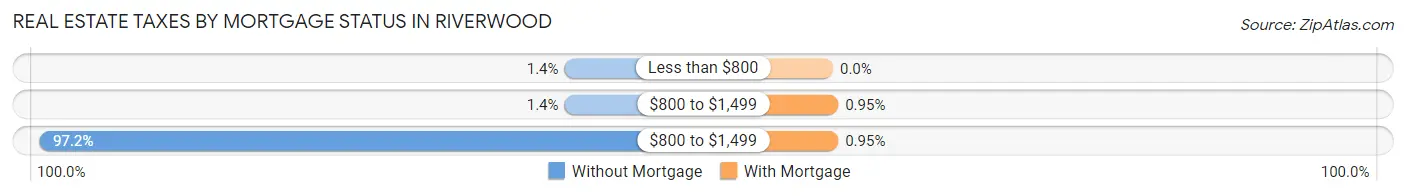
| Property Taxes | Without Mortgage | With Mortgage |
| Less than $800 | 1 (1.4%) | 0 (0.0%) |
| $800 to $1,499 | 1 (1.4%) | 1 (0.9%) |
| $800 to $1,499 | 69 (97.2%) | 1 (0.9%) |
| Total | 71 (100.0%) | 105 (100.0%) |
Health & Disability in Riverwood
Health Insurance Coverage by Age in Riverwood
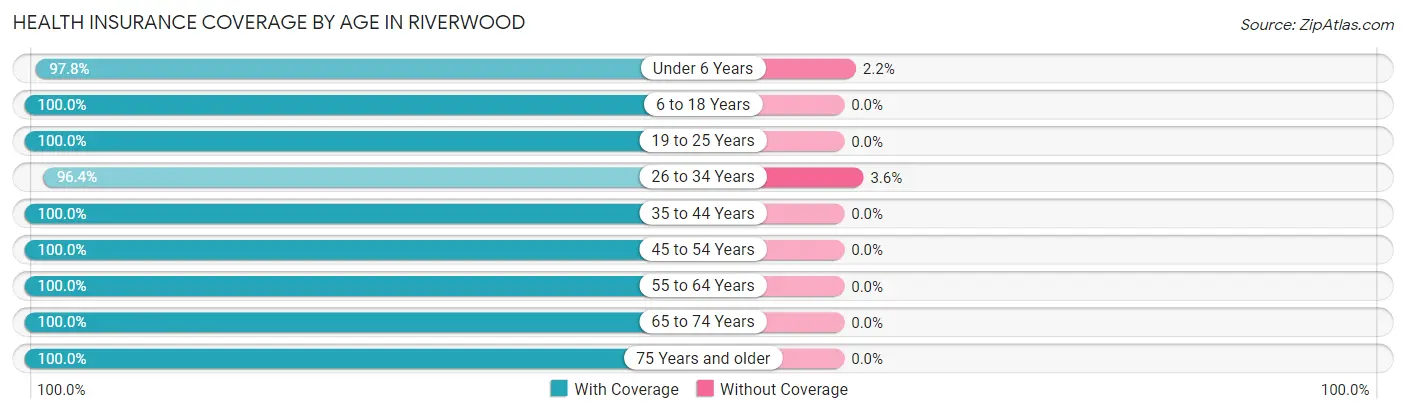
| Age Bracket | With Coverage | Without Coverage |
| Under 6 Years | 45 (97.8%) | 1 (2.2%) |
| 6 to 18 Years | 110 (100.0%) | 0 (0.0%) |
| 19 to 25 Years | 8 (100.0%) | 0 (0.0%) |
| 26 to 34 Years | 27 (96.4%) | 1 (3.6%) |
| 35 to 44 Years | 100 (100.0%) | 0 (0.0%) |
| 45 to 54 Years | 57 (100.0%) | 0 (0.0%) |
| 55 to 64 Years | 68 (100.0%) | 0 (0.0%) |
| 65 to 74 Years | 49 (100.0%) | 0 (0.0%) |
| 75 Years and older | 35 (100.0%) | 0 (0.0%) |
| Total | 499 (99.6%) | 2 (0.4%) |
Health Insurance Coverage by Citizenship Status in Riverwood
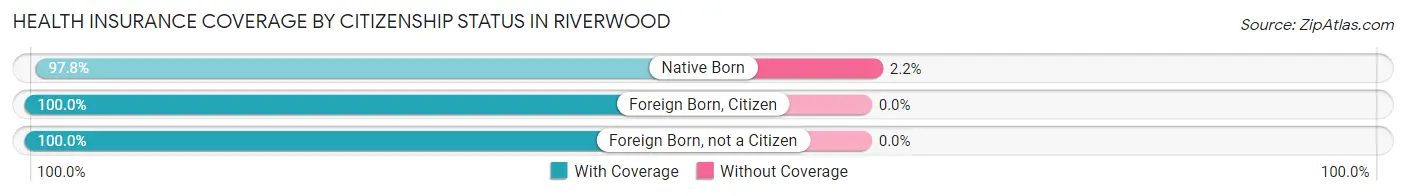
| Citizenship Status | With Coverage | Without Coverage |
| Native Born | 45 (97.8%) | 1 (2.2%) |
| Foreign Born, Citizen | 110 (100.0%) | 0 (0.0%) |
| Foreign Born, not a Citizen | 8 (100.0%) | 0 (0.0%) |
Health Insurance Coverage by Household Income in Riverwood
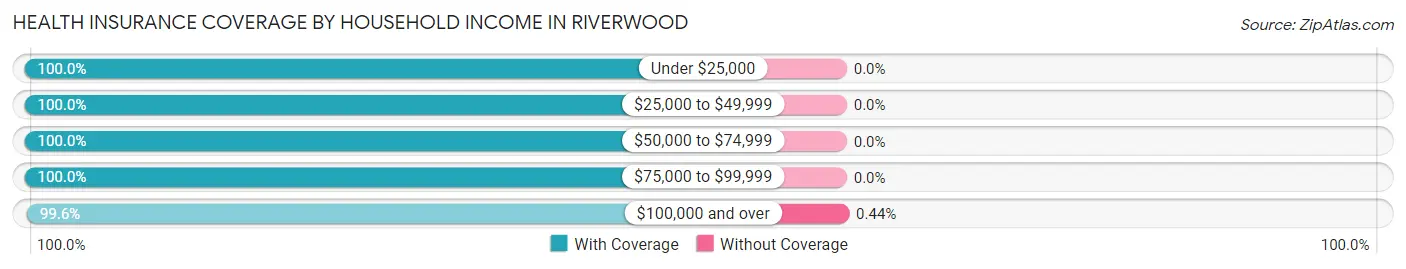
| Household Income | With Coverage | Without Coverage |
| Under $25,000 | 2 (100.0%) | 0 (0.0%) |
| $25,000 to $49,999 | 16 (100.0%) | 0 (0.0%) |
| $50,000 to $74,999 | 6 (100.0%) | 0 (0.0%) |
| $75,000 to $99,999 | 20 (100.0%) | 0 (0.0%) |
| $100,000 and over | 455 (99.6%) | 2 (0.4%) |
Public vs Private Health Insurance Coverage by Age in Riverwood
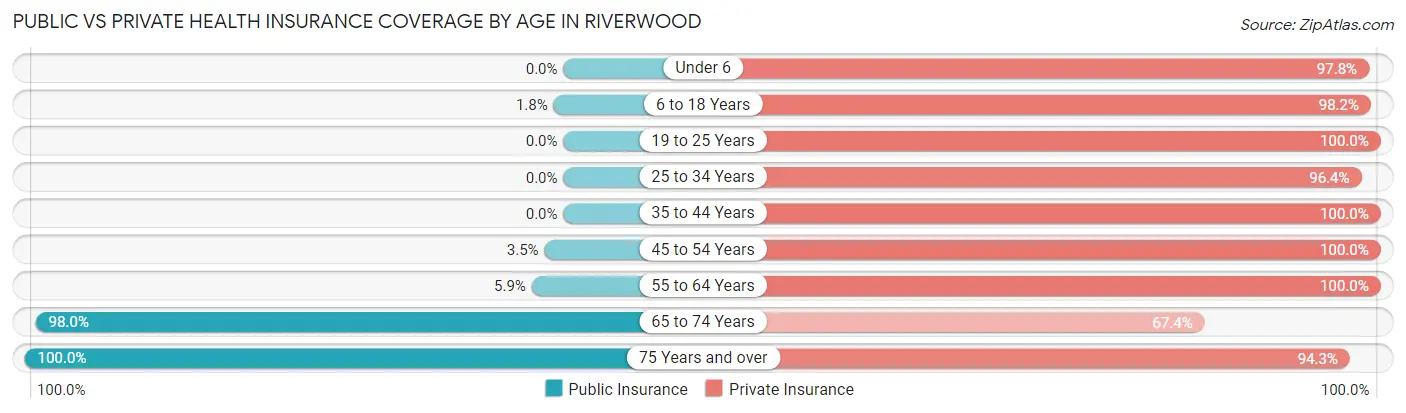
| Age Bracket | Public Insurance | Private Insurance |
| Under 6 | 0 (0.0%) | 45 (97.8%) |
| 6 to 18 Years | 2 (1.8%) | 108 (98.2%) |
| 19 to 25 Years | 0 (0.0%) | 8 (100.0%) |
| 25 to 34 Years | 0 (0.0%) | 27 (96.4%) |
| 35 to 44 Years | 0 (0.0%) | 100 (100.0%) |
| 45 to 54 Years | 2 (3.5%) | 57 (100.0%) |
| 55 to 64 Years | 4 (5.9%) | 68 (100.0%) |
| 65 to 74 Years | 48 (98.0%) | 33 (67.3%) |
| 75 Years and over | 35 (100.0%) | 33 (94.3%) |
| Total | 91 (18.2%) | 479 (95.6%) |
Disability Status by Sex by Age in Riverwood
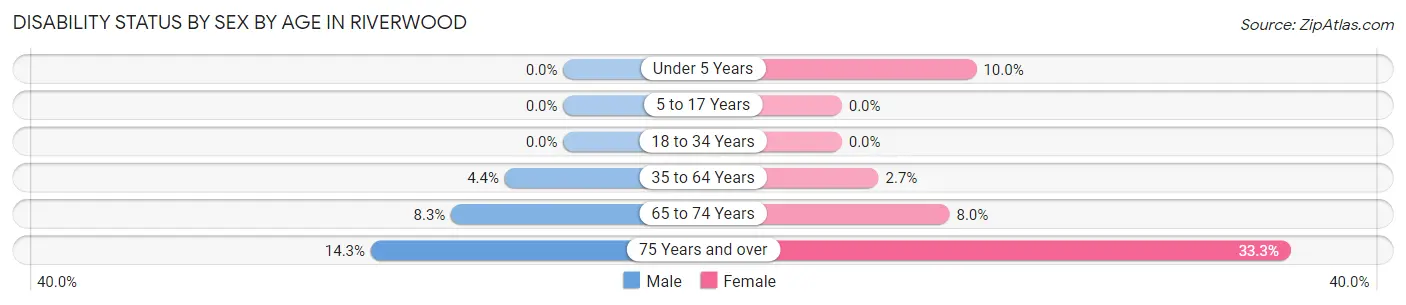
| Age Bracket | Male | Female |
| Under 5 Years | 0 (0.0%) | 1 (10.0%) |
| 5 to 17 Years | 0 (0.0%) | 0 (0.0%) |
| 18 to 34 Years | 0 (0.0%) | 0 (0.0%) |
| 35 to 64 Years | 5 (4.3%) | 3 (2.7%) |
| 65 to 74 Years | 2 (8.3%) | 2 (8.0%) |
| 75 Years and over | 2 (14.3%) | 7 (33.3%) |
Disability Class by Sex by Age in Riverwood
Disability Class: Hearing Difficulty
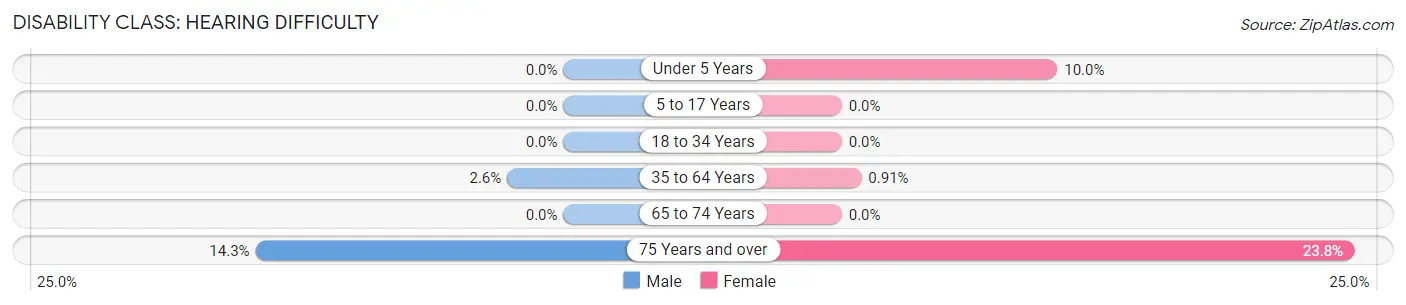
| Age Bracket | Male | Female |
| Under 5 Years | 0 (0.0%) | 1 (10.0%) |
| 5 to 17 Years | 0 (0.0%) | 0 (0.0%) |
| 18 to 34 Years | 0 (0.0%) | 0 (0.0%) |
| 35 to 64 Years | 3 (2.6%) | 1 (0.9%) |
| 65 to 74 Years | 0 (0.0%) | 0 (0.0%) |
| 75 Years and over | 2 (14.3%) | 5 (23.8%) |
Disability Class: Vision Difficulty
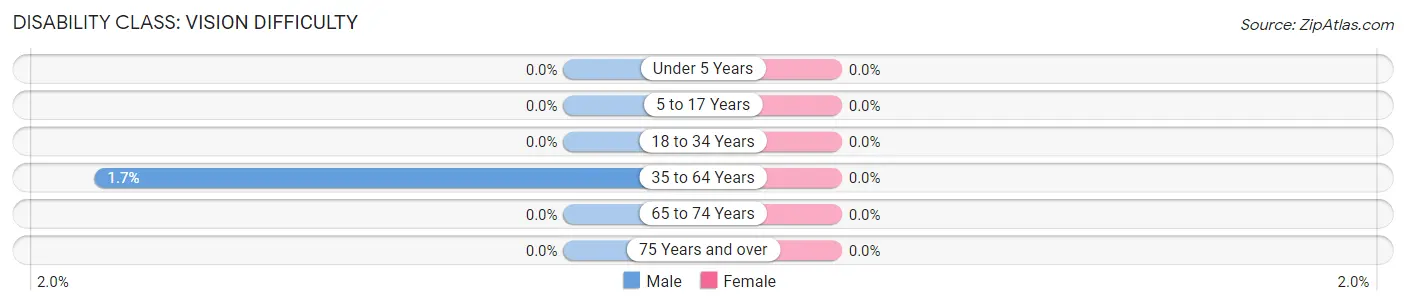
| Age Bracket | Male | Female |
| Under 5 Years | 0 (0.0%) | 0 (0.0%) |
| 5 to 17 Years | 0 (0.0%) | 0 (0.0%) |
| 18 to 34 Years | 0 (0.0%) | 0 (0.0%) |
| 35 to 64 Years | 2 (1.7%) | 0 (0.0%) |
| 65 to 74 Years | 0 (0.0%) | 0 (0.0%) |
| 75 Years and over | 0 (0.0%) | 0 (0.0%) |
Disability Class: Cognitive Difficulty
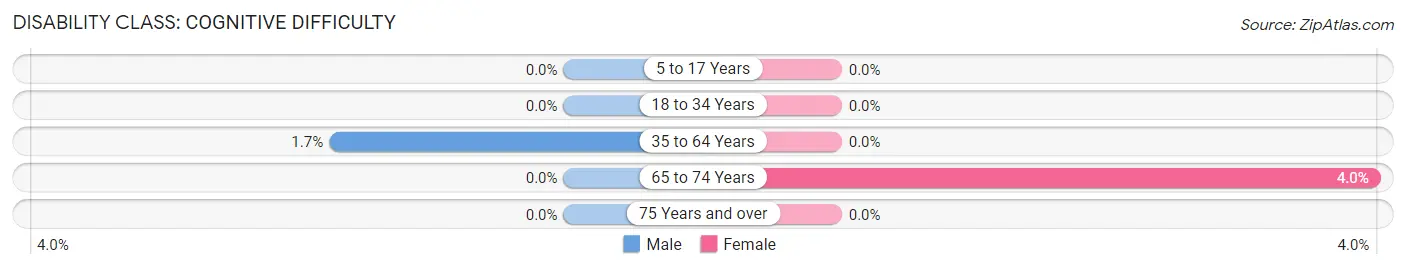
| Age Bracket | Male | Female |
| 5 to 17 Years | 0 (0.0%) | 0 (0.0%) |
| 18 to 34 Years | 0 (0.0%) | 0 (0.0%) |
| 35 to 64 Years | 2 (1.7%) | 0 (0.0%) |
| 65 to 74 Years | 0 (0.0%) | 1 (4.0%) |
| 75 Years and over | 0 (0.0%) | 0 (0.0%) |
Disability Class: Ambulatory Difficulty
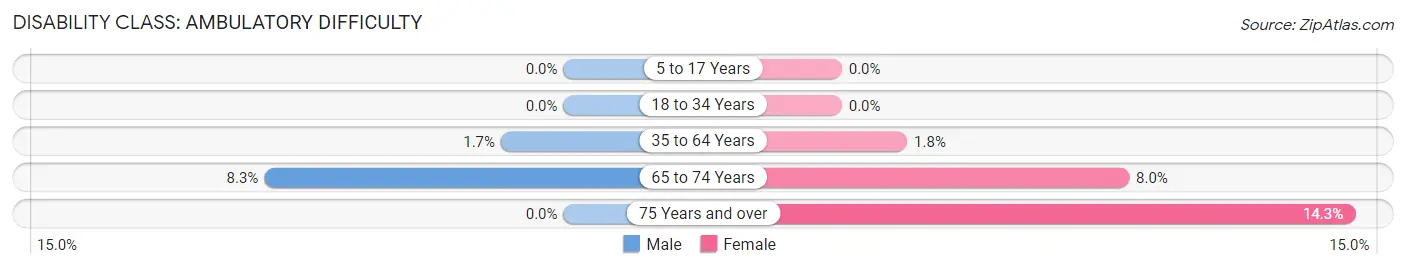
| Age Bracket | Male | Female |
| 5 to 17 Years | 0 (0.0%) | 0 (0.0%) |
| 18 to 34 Years | 0 (0.0%) | 0 (0.0%) |
| 35 to 64 Years | 2 (1.7%) | 2 (1.8%) |
| 65 to 74 Years | 2 (8.3%) | 2 (8.0%) |
| 75 Years and over | 0 (0.0%) | 3 (14.3%) |
Disability Class: Self-Care Difficulty
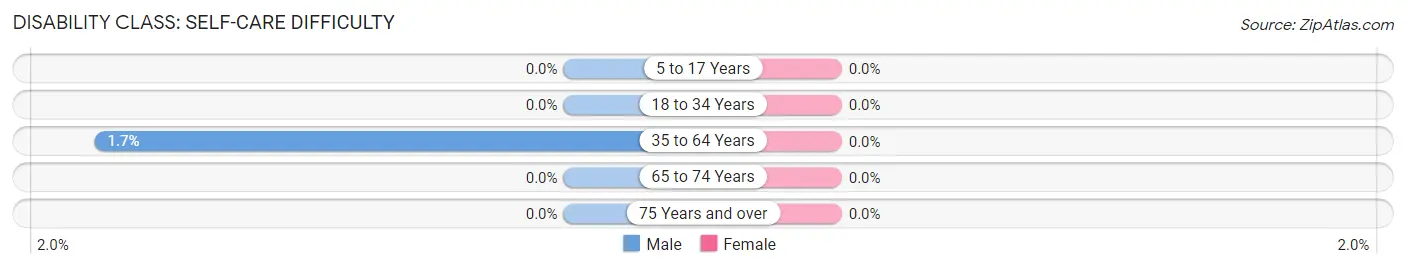
| Age Bracket | Male | Female |
| 5 to 17 Years | 0 (0.0%) | 0 (0.0%) |
| 18 to 34 Years | 0 (0.0%) | 0 (0.0%) |
| 35 to 64 Years | 2 (1.7%) | 0 (0.0%) |
| 65 to 74 Years | 0 (0.0%) | 0 (0.0%) |
| 75 Years and over | 0 (0.0%) | 0 (0.0%) |
Technology Access in Riverwood
Computing Device Access in Riverwood
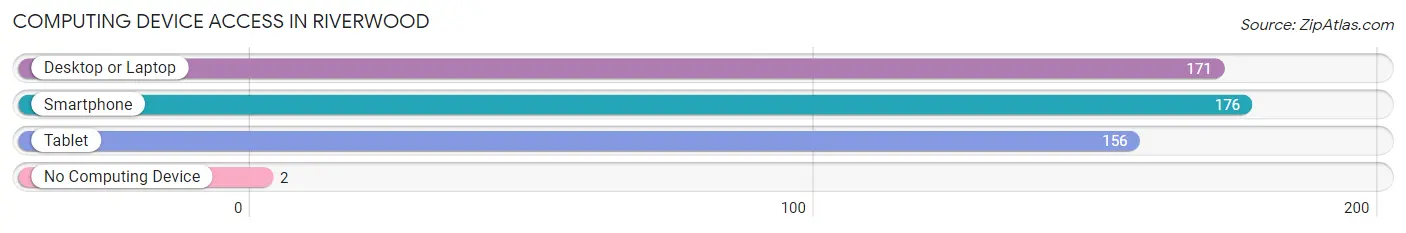
| Device Type | # Households | % Households |
| Desktop or Laptop | 171 | 95.0% |
| Smartphone | 176 | 97.8% |
| Tablet | 156 | 86.7% |
| No Computing Device | 2 | 1.1% |
| Total | 180 | 100.0% |
Internet Access in Riverwood
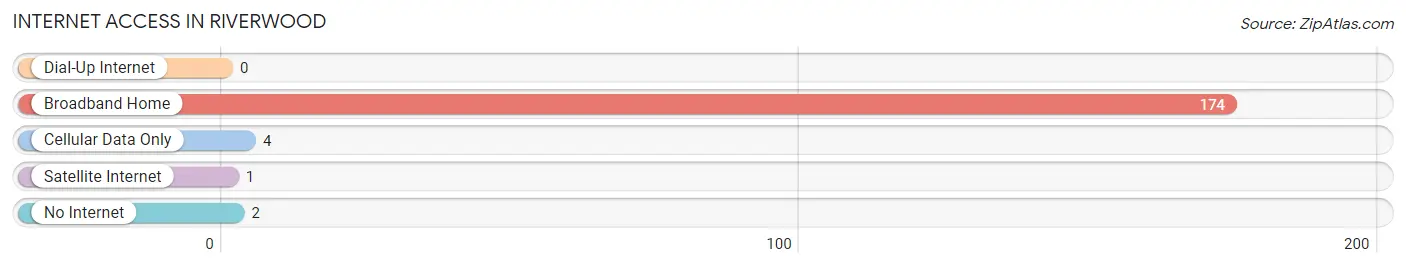
| Internet Type | # Households | % Households |
| Dial-Up Internet | 0 | 0.0% |
| Broadband Home | 174 | 96.7% |
| Cellular Data Only | 4 | 2.2% |
| Satellite Internet | 1 | 0.6% |
| No Internet | 2 | 1.1% |
| Total | 180 | 100.0% |
Riverwood Summary
Riverwood, Kentucky is a small town located in the western part of the state, in the foothills of the Appalachian Mountains. It is situated in the county of Clay, and is part of the larger metropolitan area of Lexington. The town has a population of just over 1,000 people, and is known for its rural charm and small-town atmosphere.
History
The area that is now Riverwood was first settled in the early 1800s by a group of settlers from Virginia. The town was originally known as “Riverwood Station”, and was a stop on the Louisville and Nashville Railroad. The town was officially incorporated in 1883, and the name was changed to Riverwood.
The town grew slowly over the years, and by the early 1900s, it had become a popular destination for tourists and vacationers. The town was known for its scenic beauty, and was a popular spot for fishing and hunting. The town also had a thriving lumber industry, and was home to several sawmills.
In the 1950s, the town began to decline as the lumber industry moved away and the railroad stopped running. The town was nearly abandoned by the 1970s, but in the 1980s, the town began to experience a resurgence. The town was revitalized by the opening of a new state park, and the town began to attract new businesses and residents.
Geography
Riverwood is located in the western part of Clay County, in the foothills of the Appalachian Mountains. The town is situated along the banks of the Kentucky River, and is surrounded by rolling hills and lush forests. The town is located about 25 miles from Lexington, and is accessible by both highway and rail.
The climate in Riverwood is temperate, with hot summers and cold winters. The average temperature in the summer is around 80 degrees Fahrenheit, and the average temperature in the winter is around 40 degrees Fahrenheit. The town receives an average of 40 inches of rain per year, and the area is known for its mild winters and warm summers.
Economy
The economy of Riverwood is largely based on tourism and agriculture. The town is home to several small businesses, including restaurants, shops, and lodging. The town is also home to a number of farms, and the area is known for its production of corn, soybeans, and hay.
The town is also home to a number of manufacturing companies, including a furniture factory and a plastics factory. The town is also home to a number of small businesses, including a grocery store, a hardware store, and a gas station.
Demographics
As of the 2010 census, the population of Riverwood was 1,072. The town is predominantly white, with a population that is 97.3% white and 2.7% other races. The median household income in the town is $37,500, and the median age is 43.
The town is home to a number of churches, including Baptist, Methodist, and Presbyterian. The town is also home to a number of schools, including a public elementary school and a private high school.
Conclusion
Riverwood, Kentucky is a small town located in the western part of the state, in the foothills of the Appalachian Mountains. The town has a population of just over 1,000 people, and is known for its rural charm and small-town atmosphere. The town is largely based on tourism and agriculture, and is home to a number of small businesses, churches, and schools. The town is predominantly white, with a population that is 97.3% white and 2.7% other races. The median household income in the town is $37,500, and the median age is 43.
Common Questions
What is Per Capita Income in Riverwood?
Per Capita income in Riverwood is $91,644.
What is the Median Family Income in Riverwood?
Median Family Income in Riverwood is $250,001.
What is the Median Household income in Riverwood?
Median Household Income in Riverwood is $250,001.
What is Income or Wage Gap in Riverwood?
Income or Wage Gap in Riverwood is 61.1%.
Women in Riverwood earn 38.9 cents for every dollar earned by a man.
What is Inequality or Gini Index in Riverwood?
Inequality or Gini Index in Riverwood is 0.34.
What is the Total Population of Riverwood?
Total Population of Riverwood is 501.
What is the Total Male Population of Riverwood?
Total Male Population of Riverwood is 268.
What is the Total Female Population of Riverwood?
Total Female Population of Riverwood is 233.
What is the Ratio of Males per 100 Females in Riverwood?
There are 115.02 Males per 100 Females in Riverwood.
What is the Ratio of Females per 100 Males in Riverwood?
There are 86.94 Females per 100 Males in Riverwood.
What is the Median Population Age in Riverwood?
Median Population Age in Riverwood is 42.0 Years.
What is the Average Family Size in Riverwood
Average Family Size in Riverwood is 3.0 People.
What is the Average Household Size in Riverwood
Average Household Size in Riverwood is 2.8 People.
How Large is the Labor Force in Riverwood?
There are 259 People in the Labor Forcein in Riverwood.
What is the Percentage of People in the Labor Force in Riverwood?
72.1% of People are in the Labor Force in Riverwood.
What is the Unemployment Rate in Riverwood?
Unemployment Rate in Riverwood is 0.8%.