Woodlawn Park, KY Map & Demographics
Woodlawn Park Map
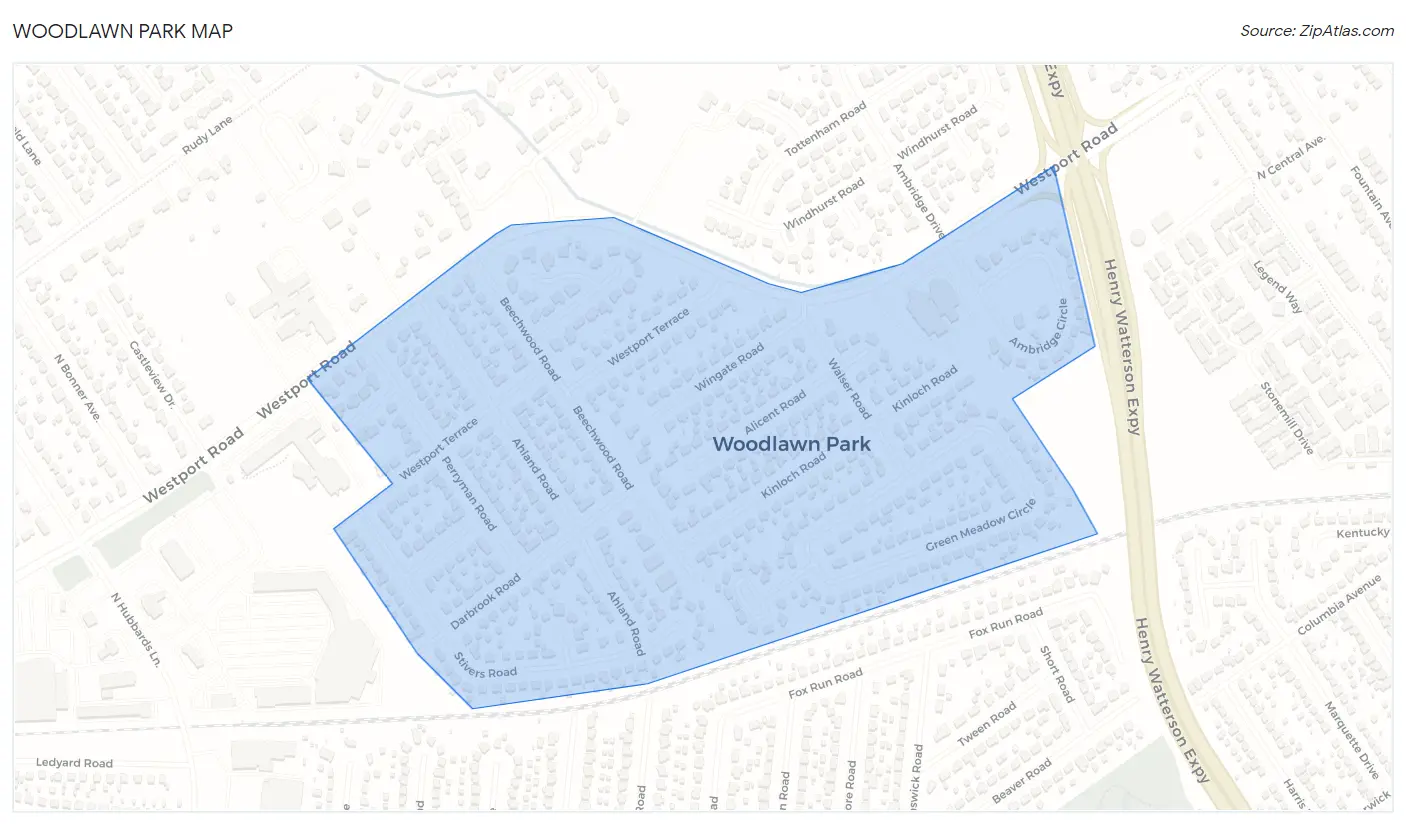
Woodlawn Park Overview
$47,534
PER CAPITA INCOME
$103,393
AVG FAMILY INCOME
$95,455
AVG HOUSEHOLD INCOME
15.8%
WAGE / INCOME GAP [ % ]
84.2¢/ $1
WAGE / INCOME GAP [ $ ]
0.34
INEQUALITY / GINI INDEX
776
TOTAL POPULATION
381
MALE POPULATION
395
FEMALE POPULATION
96.46
MALES / 100 FEMALES
103.67
FEMALES / 100 MALES
46.1
MEDIAN AGE
2.5
AVG FAMILY SIZE
2.1
AVG HOUSEHOLD SIZE
425
LABOR FORCE [ PEOPLE ]
66.2%
PERCENT IN LABOR FORCE
3.8%
UNEMPLOYMENT RATE
Woodlawn Park Area Codes
Income in Woodlawn Park
Income Overview in Woodlawn Park
Per Capita Income in Woodlawn Park is $47,534, while median incomes of families and households are $103,393 and $95,455 respectively.
| Characteristic | Number | Measure |
| Per Capita Income | 776 | $47,534 |
| Median Family Income | 257 | $103,393 |
| Mean Family Income | 257 | $115,154 |
| Median Household Income | 364 | $95,455 |
| Mean Household Income | 364 | $103,129 |
| Income Deficit | 257 | $0 |
| Wage / Income Gap (%) | 776 | 15.83% |
| Wage / Income Gap ($) | 776 | 84.17¢ per $1 |
| Gini / Inequality Index | 776 | 0.34 |
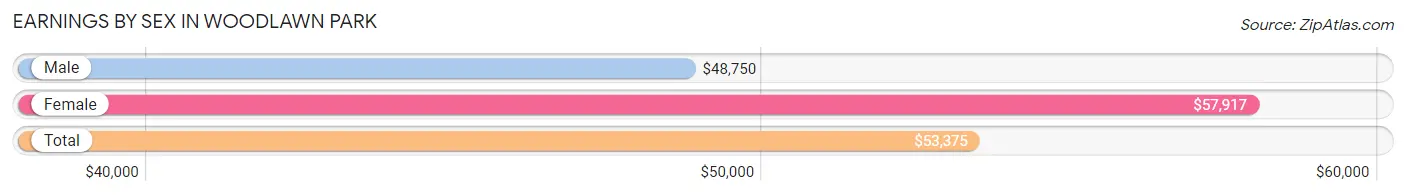
Earnings by Sex in Woodlawn Park
Average Earnings in Woodlawn Park are $53,375, $48,750 for men and $57,917 for women, a difference of 15.8%.
| Sex | Number | Average Earnings |
| Male | 220 (51.0%) | $48,750 |
| Female | 211 (49.0%) | $57,917 |
| Total | 431 (100.0%) | $53,375 |
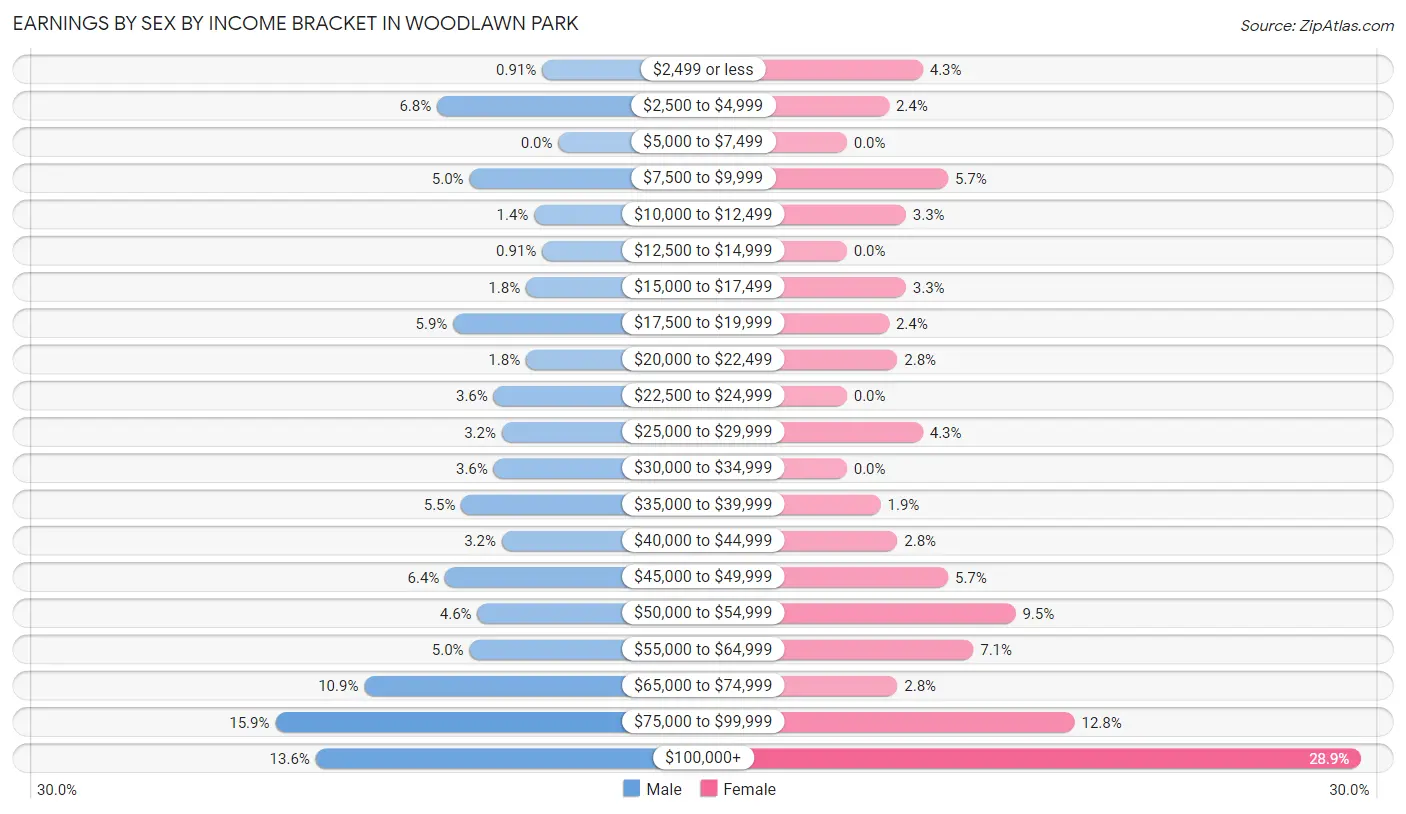
Earnings by Sex by Income Bracket in Woodlawn Park
The most common earnings brackets in Woodlawn Park are $75,000 to $99,999 for men (35 | 15.9%) and $100,000+ for women (61 | 28.9%).
| Income | Male | Female |
| $2,499 or less | 2 (0.9%) | 9 (4.3%) |
| $2,500 to $4,999 | 15 (6.8%) | 5 (2.4%) |
| $5,000 to $7,499 | 0 (0.0%) | 0 (0.0%) |
| $7,500 to $9,999 | 11 (5.0%) | 12 (5.7%) |
| $10,000 to $12,499 | 3 (1.4%) | 7 (3.3%) |
| $12,500 to $14,999 | 2 (0.9%) | 0 (0.0%) |
| $15,000 to $17,499 | 4 (1.8%) | 7 (3.3%) |
| $17,500 to $19,999 | 13 (5.9%) | 5 (2.4%) |
| $20,000 to $22,499 | 4 (1.8%) | 6 (2.8%) |
| $22,500 to $24,999 | 8 (3.6%) | 0 (0.0%) |
| $25,000 to $29,999 | 7 (3.2%) | 9 (4.3%) |
| $30,000 to $34,999 | 8 (3.6%) | 0 (0.0%) |
| $35,000 to $39,999 | 12 (5.4%) | 4 (1.9%) |
| $40,000 to $44,999 | 7 (3.2%) | 6 (2.8%) |
| $45,000 to $49,999 | 14 (6.4%) | 12 (5.7%) |
| $50,000 to $54,999 | 10 (4.5%) | 20 (9.5%) |
| $55,000 to $64,999 | 11 (5.0%) | 15 (7.1%) |
| $65,000 to $74,999 | 24 (10.9%) | 6 (2.8%) |
| $75,000 to $99,999 | 35 (15.9%) | 27 (12.8%) |
| $100,000+ | 30 (13.6%) | 61 (28.9%) |
| Total | 220 (100.0%) | 211 (100.0%) |
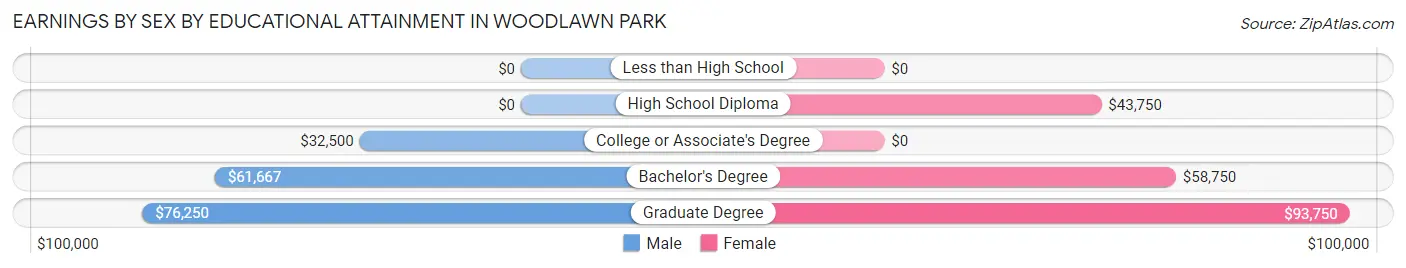
Earnings by Sex by Educational Attainment in Woodlawn Park
Average earnings in Woodlawn Park are $55,417 for men and $60,556 for women, a difference of 8.5%. Men with an educational attainment of graduate degree enjoy the highest average annual earnings of $76,250, while those with college or associate's degree education earn the least with $32,500. Women with an educational attainment of graduate degree earn the most with the average annual earnings of $93,750, while those with high school diploma education have the smallest earnings of $43,750.
| Educational Attainment | Male Income | Female Income |
| Less than High School | - | - |
| High School Diploma | - | - |
| College or Associate's Degree | $32,500 | $0 |
| Bachelor's Degree | $61,667 | $58,750 |
| Graduate Degree | $76,250 | $93,750 |
| Total | $55,417 | $60,556 |
Family Income in Woodlawn Park
Family Income Brackets in Woodlawn Park
According to the Woodlawn Park family income data, there are 72 families falling into the $100,000 to $149,999 income range, which is the most common income bracket and makes up 28.0% of all families.
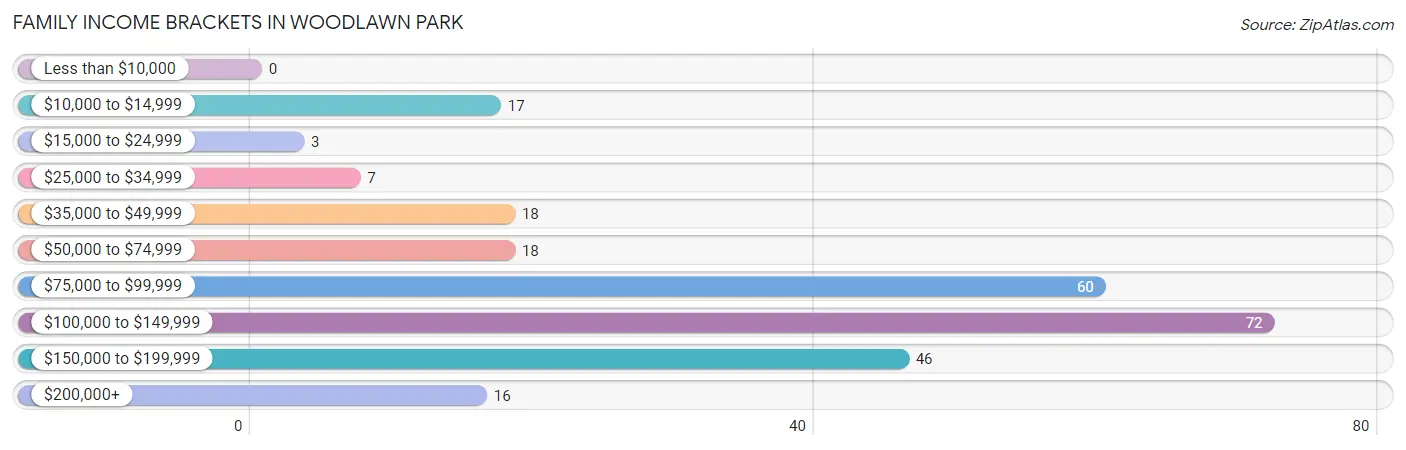
| Income Bracket | # Families | % Families |
| Less than $10,000 | 0 | 0.0% |
| $10,000 to $14,999 | 17 | 6.6% |
| $15,000 to $24,999 | 3 | 1.2% |
| $25,000 to $34,999 | 7 | 2.7% |
| $35,000 to $49,999 | 18 | 7.0% |
| $50,000 to $74,999 | 18 | 7.0% |
| $75,000 to $99,999 | 60 | 23.3% |
| $100,000 to $149,999 | 72 | 28.0% |
| $150,000 to $199,999 | 46 | 17.9% |
| $200,000+ | 16 | 6.2% |
Family Income by Famaliy Size in Woodlawn Park
4-person families (38 | 14.8%) account for the highest median family income in Woodlawn Park with $153,438 per family, while 2-person families (171 | 66.5%) have the highest median income of $47,812 per family member.
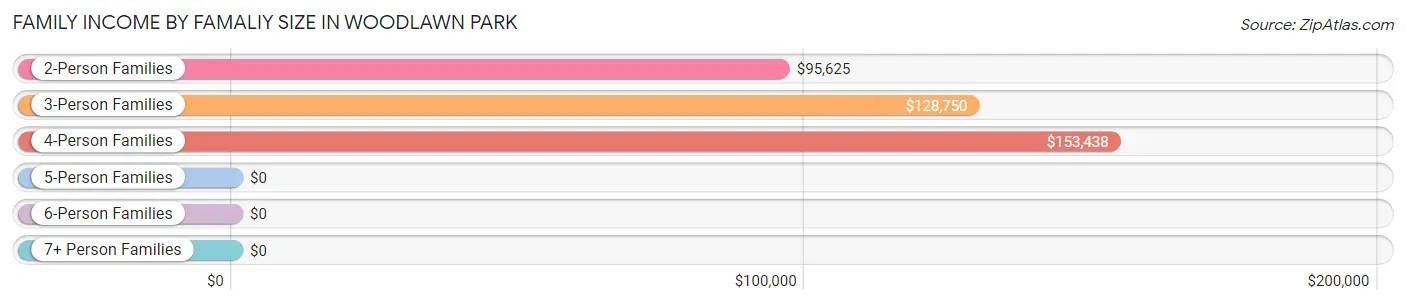
| Income Bracket | # Families | Median Income |
| 2-Person Families | 171 (66.5%) | $95,625 |
| 3-Person Families | 45 (17.5%) | $128,750 |
| 4-Person Families | 38 (14.8%) | $153,438 |
| 5-Person Families | 3 (1.2%) | $0 |
| 6-Person Families | 0 (0.0%) | $0 |
| 7+ Person Families | 0 (0.0%) | $0 |
| Total | 257 (100.0%) | $103,393 |
Family Income by Number of Earners in Woodlawn Park
The median family income in Woodlawn Park is $103,393, with families comprising 2 earners (116) having the highest median family income of $138,750, while families with 1 earner (79) have the lowest median family income of $70,417, accounting for 45.1% and 30.7% of families, respectively.
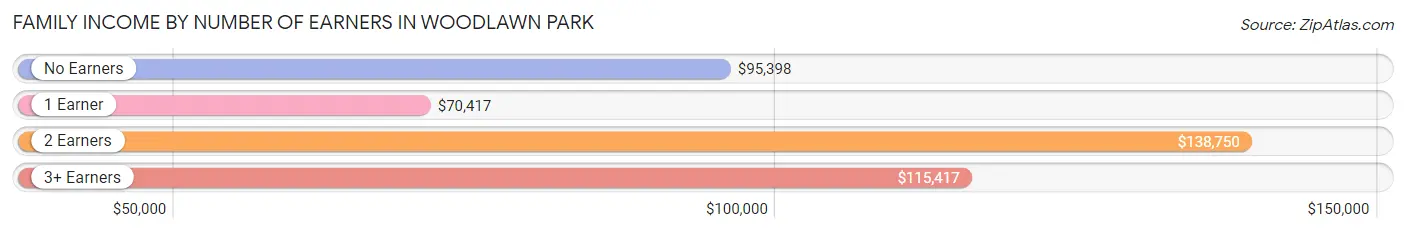
| Number of Earners | # Families | Median Income |
| No Earners | 51 (19.8%) | $95,398 |
| 1 Earner | 79 (30.7%) | $70,417 |
| 2 Earners | 116 (45.1%) | $138,750 |
| 3+ Earners | 11 (4.3%) | $115,417 |
| Total | 257 (100.0%) | $103,393 |
Household Income in Woodlawn Park
Household Income Brackets in Woodlawn Park
With 96 households falling in the category, the $100,000 to $149,999 income range is the most frequent in Woodlawn Park, accounting for 26.4% of all households. In contrast, only 3 households (0.8%) fall into the less than $10,000 income bracket, making it the least populous group.
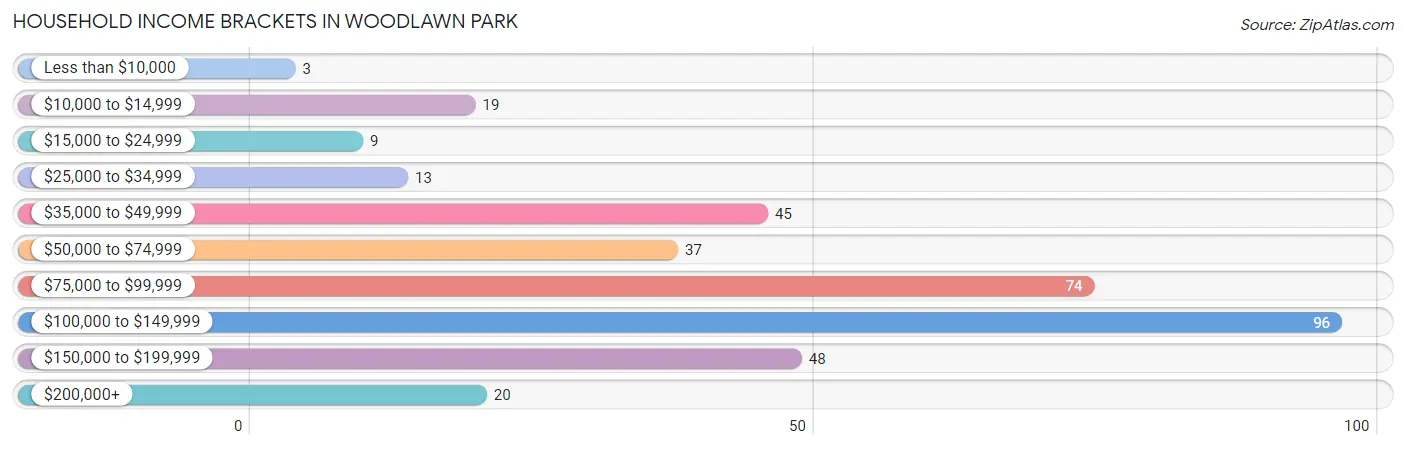
| Income Bracket | # Households | % Households |
| Less than $10,000 | 3 | 0.8% |
| $10,000 to $14,999 | 19 | 5.2% |
| $15,000 to $24,999 | 9 | 2.5% |
| $25,000 to $34,999 | 13 | 3.6% |
| $35,000 to $49,999 | 45 | 12.4% |
| $50,000 to $74,999 | 37 | 10.2% |
| $75,000 to $99,999 | 74 | 20.3% |
| $100,000 to $149,999 | 96 | 26.4% |
| $150,000 to $199,999 | 48 | 13.2% |
| $200,000+ | 20 | 5.5% |
Household Income by Householder Age in Woodlawn Park
The median household income in Woodlawn Park is $95,455, with the highest median household income of $127,917 found in the 25 to 44 years age bracket for the primary householder. A total of 107 households (29.4%) fall into this category. Meanwhile, the 15 to 24 years age bracket for the primary householder has the lowest median household income of $0, with 2 households (0.5%) in this group.
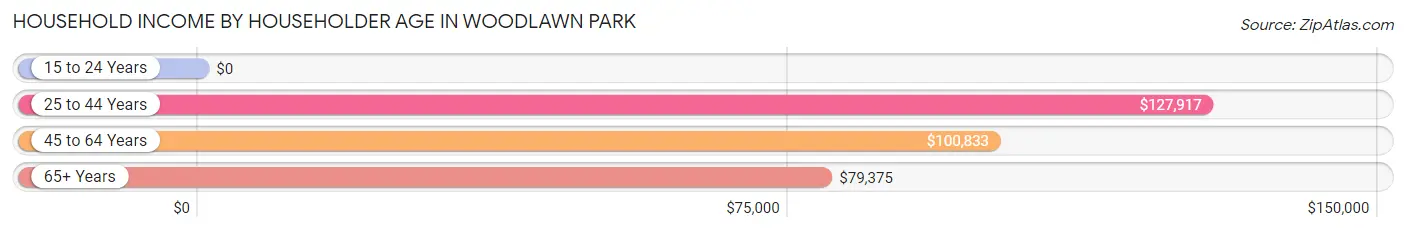
| Income Bracket | # Households | Median Income |
| 15 to 24 Years | 2 (0.5%) | $0 |
| 25 to 44 Years | 107 (29.4%) | $127,917 |
| 45 to 64 Years | 136 (37.4%) | $100,833 |
| 65+ Years | 119 (32.7%) | $79,375 |
| Total | 364 (100.0%) | $95,455 |
Poverty in Woodlawn Park
Income Below Poverty by Sex and Age in Woodlawn Park
With 1.6% poverty level for males and 10.9% for females among the residents of Woodlawn Park, 25 to 34 year old males and 6 to 11 year old females are the most vulnerable to poverty, with 4 males (7.8%) and 8 females (47.1%) in their respective age groups living below the poverty level.
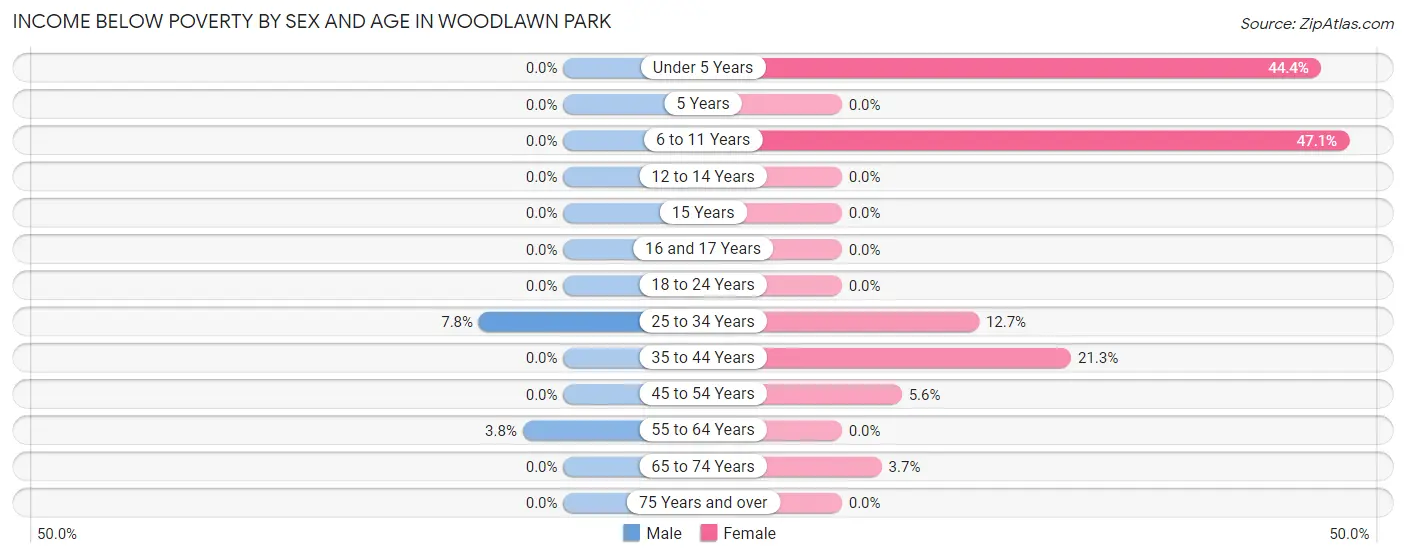
| Age Bracket | Male | Female |
| Under 5 Years | 0 (0.0%) | 12 (44.4%) |
| 5 Years | 0 (0.0%) | 0 (0.0%) |
| 6 to 11 Years | 0 (0.0%) | 8 (47.1%) |
| 12 to 14 Years | 0 (0.0%) | 0 (0.0%) |
| 15 Years | 0 (0.0%) | 0 (0.0%) |
| 16 and 17 Years | 0 (0.0%) | 0 (0.0%) |
| 18 to 24 Years | 0 (0.0%) | 0 (0.0%) |
| 25 to 34 Years | 4 (7.8%) | 7 (12.7%) |
| 35 to 44 Years | 0 (0.0%) | 10 (21.3%) |
| 45 to 54 Years | 0 (0.0%) | 3 (5.6%) |
| 55 to 64 Years | 2 (3.8%) | 0 (0.0%) |
| 65 to 74 Years | 0 (0.0%) | 3 (3.7%) |
| 75 Years and over | 0 (0.0%) | 0 (0.0%) |
| Total | 6 (1.6%) | 43 (10.9%) |
Income Above Poverty by Sex and Age in Woodlawn Park
According to the poverty statistics in Woodlawn Park, males aged under 5 years and females aged 5 years are the age groups that are most secure financially, with 100.0% of males and 100.0% of females in these age groups living above the poverty line.
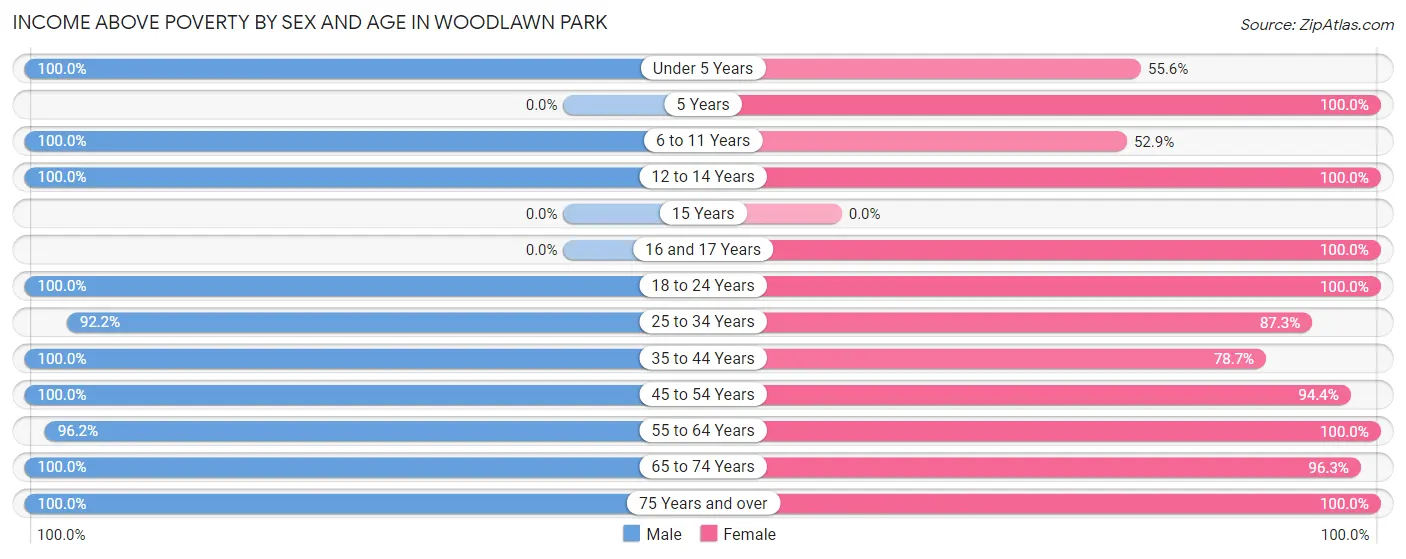
| Age Bracket | Male | Female |
| Under 5 Years | 16 (100.0%) | 15 (55.6%) |
| 5 Years | 0 (0.0%) | 6 (100.0%) |
| 6 to 11 Years | 36 (100.0%) | 9 (52.9%) |
| 12 to 14 Years | 11 (100.0%) | 21 (100.0%) |
| 15 Years | 0 (0.0%) | 0 (0.0%) |
| 16 and 17 Years | 0 (0.0%) | 3 (100.0%) |
| 18 to 24 Years | 29 (100.0%) | 10 (100.0%) |
| 25 to 34 Years | 47 (92.2%) | 48 (87.3%) |
| 35 to 44 Years | 48 (100.0%) | 37 (78.7%) |
| 45 to 54 Years | 52 (100.0%) | 51 (94.4%) |
| 55 to 64 Years | 51 (96.2%) | 53 (100.0%) |
| 65 to 74 Years | 49 (100.0%) | 78 (96.3%) |
| 75 Years and over | 36 (100.0%) | 21 (100.0%) |
| Total | 375 (98.4%) | 352 (89.1%) |
Income Below Poverty Among Married-Couple Families in Woodlawn Park
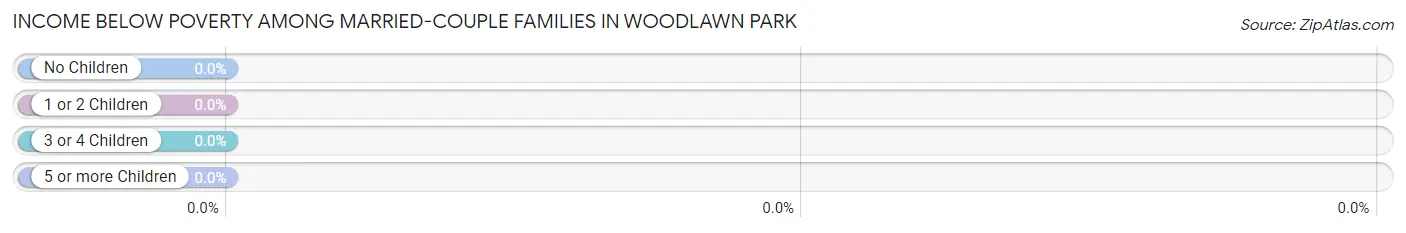
| Children | Above Poverty | Below Poverty |
| No Children | 148 (100.0%) | 0 (0.0%) |
| 1 or 2 Children | 43 (100.0%) | 0 (0.0%) |
| 3 or 4 Children | 0 (0.0%) | 0 (0.0%) |
| 5 or more Children | 0 (0.0%) | 0 (0.0%) |
| Total | 191 (100.0%) | 0 (0.0%) |
Income Below Poverty Among Single-Parent Households in Woodlawn Park
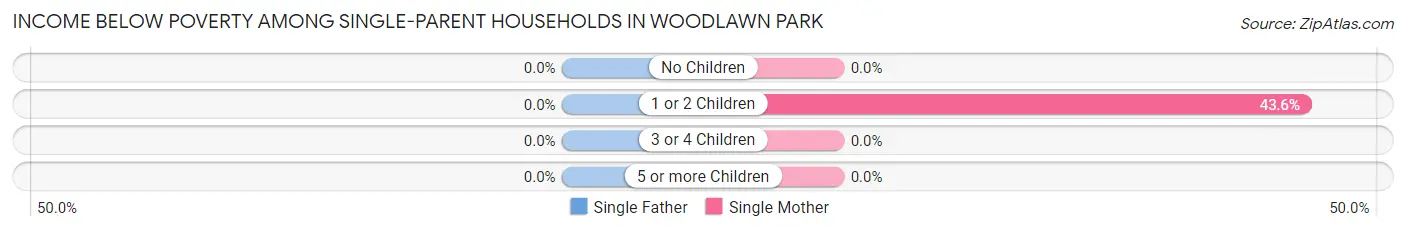
| Children | Single Father | Single Mother |
| No Children | 0 (0.0%) | 0 (0.0%) |
| 1 or 2 Children | 0 (0.0%) | 17 (43.6%) |
| 3 or 4 Children | 0 (0.0%) | 0 (0.0%) |
| 5 or more Children | 0 (0.0%) | 0 (0.0%) |
| Total | 0 (0.0%) | 17 (34.0%) |
Income Below Poverty Among Married-Couple vs Single-Parent Households in Woodlawn Park
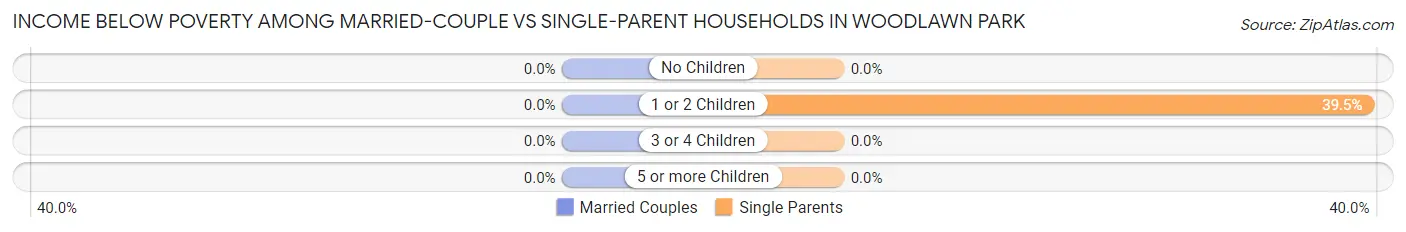
| Children | Married-Couple Families | Single-Parent Households |
| No Children | 0 (0.0%) | 0 (0.0%) |
| 1 or 2 Children | 0 (0.0%) | 17 (39.5%) |
| 3 or 4 Children | 0 (0.0%) | 0 (0.0%) |
| 5 or more Children | 0 (0.0%) | 0 (0.0%) |
| Total | 0 (0.0%) | 17 (25.8%) |
Race in Woodlawn Park
The most populous races in Woodlawn Park are White / Caucasian (740 | 95.4%), Two or more Races (31 | 4.0%), and Hispanic or Latino (11 | 1.4%).
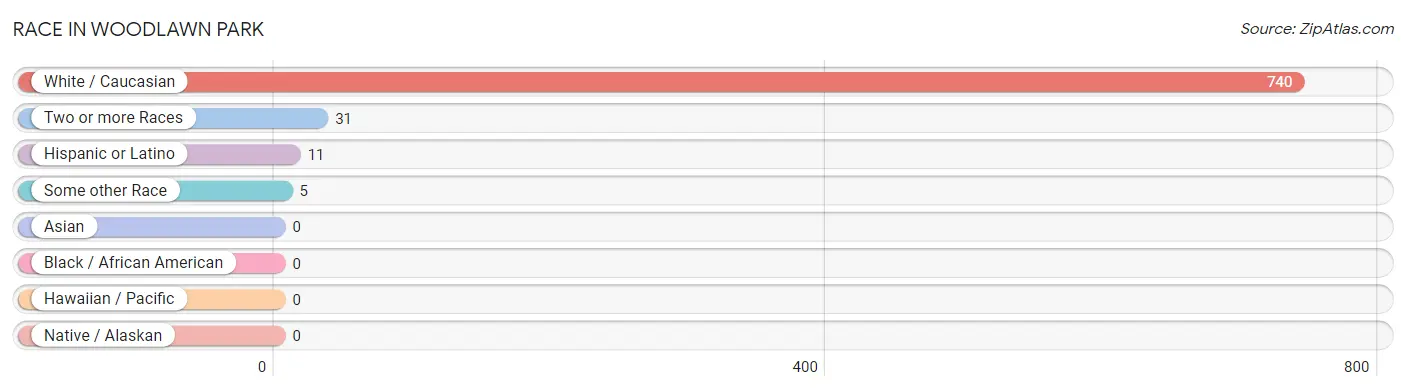
| Race | # Population | % Population |
| Asian | 0 | 0.0% |
| Black / African American | 0 | 0.0% |
| Hawaiian / Pacific | 0 | 0.0% |
| Hispanic or Latino | 11 | 1.4% |
| Native / Alaskan | 0 | 0.0% |
| White / Caucasian | 740 | 95.4% |
| Two or more Races | 31 | 4.0% |
| Some other Race | 5 | 0.6% |
| Total | 776 | 100.0% |
Ancestry in Woodlawn Park
The most populous ancestries reported in Woodlawn Park are Irish (146 | 18.8%), German (139 | 17.9%), English (112 | 14.4%), American (102 | 13.1%), and Italian (85 | 11.0%), together accounting for 75.2% of all Woodlawn Park residents.
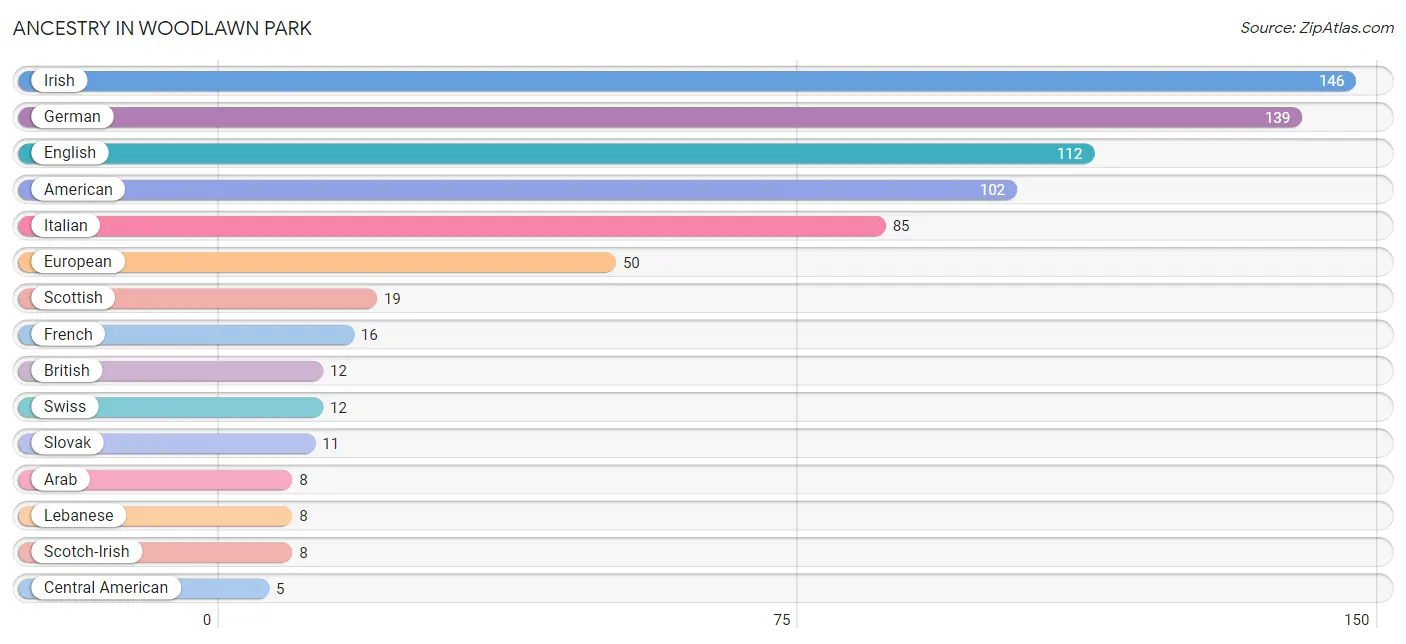
| Ancestry | # Population | % Population |
| American | 102 | 13.1% |
| Arab | 8 | 1.0% |
| Austrian | 3 | 0.4% |
| British | 12 | 1.5% |
| Central American | 5 | 0.6% |
| Dutch | 5 | 0.6% |
| English | 112 | 14.4% |
| European | 50 | 6.4% |
| French | 16 | 2.1% |
| German | 139 | 17.9% |
| Indian (Asian) | 3 | 0.4% |
| Irish | 146 | 18.8% |
| Italian | 85 | 11.0% |
| Lebanese | 8 | 1.0% |
| Mexican | 4 | 0.5% |
| Nicaraguan | 5 | 0.6% |
| Polish | 3 | 0.4% |
| Puerto Rican | 2 | 0.3% |
| Russian | 4 | 0.5% |
| Scandinavian | 3 | 0.4% |
| Scotch-Irish | 8 | 1.0% |
| Scottish | 19 | 2.5% |
| Slovak | 11 | 1.4% |
| Swedish | 3 | 0.4% |
| Swiss | 12 | 1.5% |
| Welsh | 1 | 0.1% | View All 26 Rows |
Immigrants in Woodlawn Park
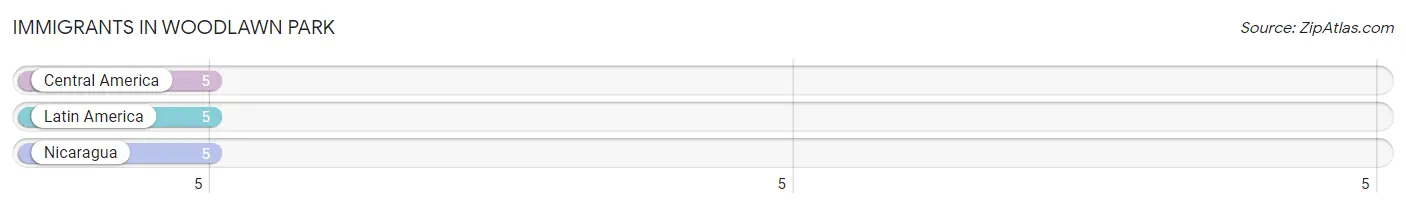
The most numerous immigrant groups reported in Woodlawn Park came from Central America (5 | 0.6%), Latin America (5 | 0.6%), and Nicaragua (5 | 0.6%), together accounting for 1.9% of all Woodlawn Park residents.
| Immigration Origin | # Population | % Population |
| Central America | 5 | 0.6% |
| Latin America | 5 | 0.6% |
| Nicaragua | 5 | 0.6% | View All 3 Rows |
Sex and Age in Woodlawn Park
Sex and Age in Woodlawn Park
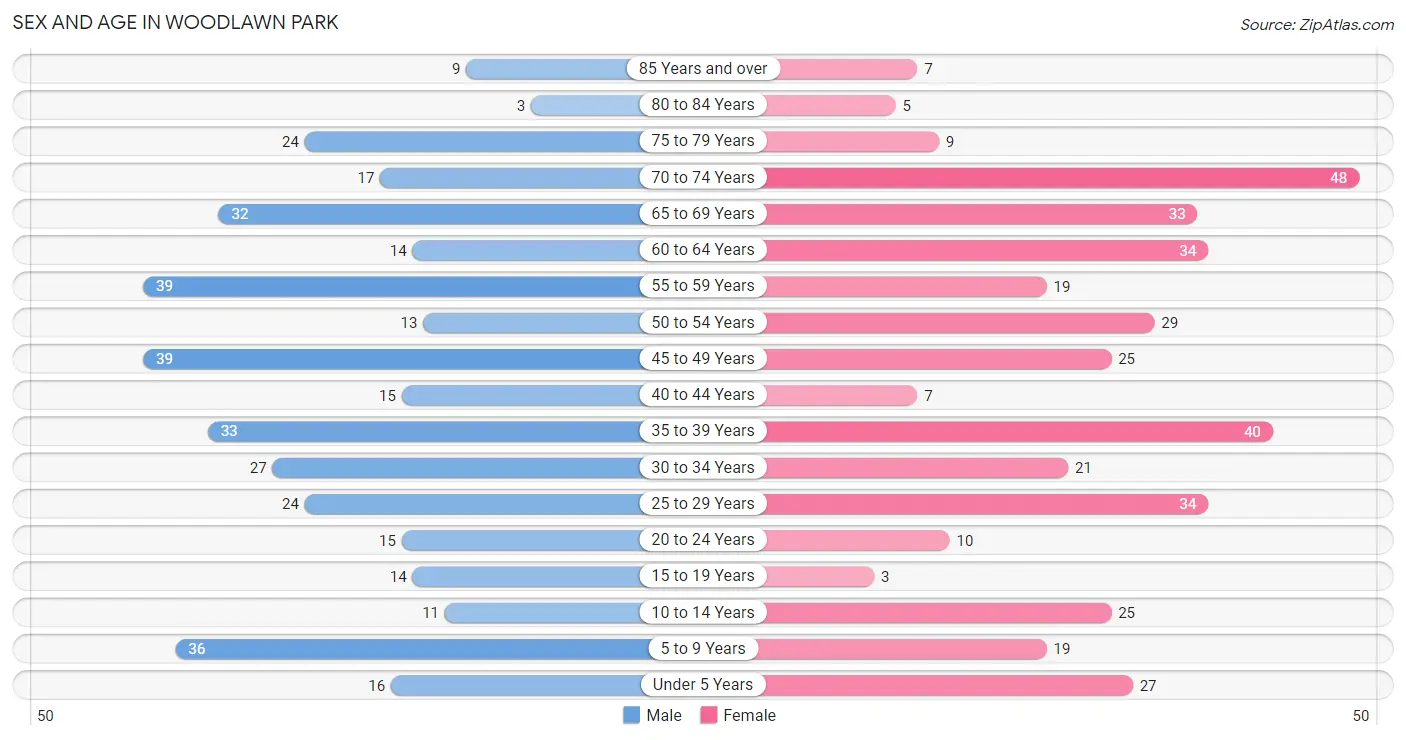
The most populous age groups in Woodlawn Park are 45 to 49 Years (39 | 10.2%) for men and 70 to 74 Years (48 | 12.1%) for women.
| Age Bracket | Male | Female |
| Under 5 Years | 16 (4.2%) | 27 (6.8%) |
| 5 to 9 Years | 36 (9.5%) | 19 (4.8%) |
| 10 to 14 Years | 11 (2.9%) | 25 (6.3%) |
| 15 to 19 Years | 14 (3.7%) | 3 (0.8%) |
| 20 to 24 Years | 15 (3.9%) | 10 (2.5%) |
| 25 to 29 Years | 24 (6.3%) | 34 (8.6%) |
| 30 to 34 Years | 27 (7.1%) | 21 (5.3%) |
| 35 to 39 Years | 33 (8.7%) | 40 (10.1%) |
| 40 to 44 Years | 15 (3.9%) | 7 (1.8%) |
| 45 to 49 Years | 39 (10.2%) | 25 (6.3%) |
| 50 to 54 Years | 13 (3.4%) | 29 (7.3%) |
| 55 to 59 Years | 39 (10.2%) | 19 (4.8%) |
| 60 to 64 Years | 14 (3.7%) | 34 (8.6%) |
| 65 to 69 Years | 32 (8.4%) | 33 (8.4%) |
| 70 to 74 Years | 17 (4.5%) | 48 (12.1%) |
| 75 to 79 Years | 24 (6.3%) | 9 (2.3%) |
| 80 to 84 Years | 3 (0.8%) | 5 (1.3%) |
| 85 Years and over | 9 (2.4%) | 7 (1.8%) |
| Total | 381 (100.0%) | 395 (100.0%) |
Families and Households in Woodlawn Park
Median Family Size in Woodlawn Park
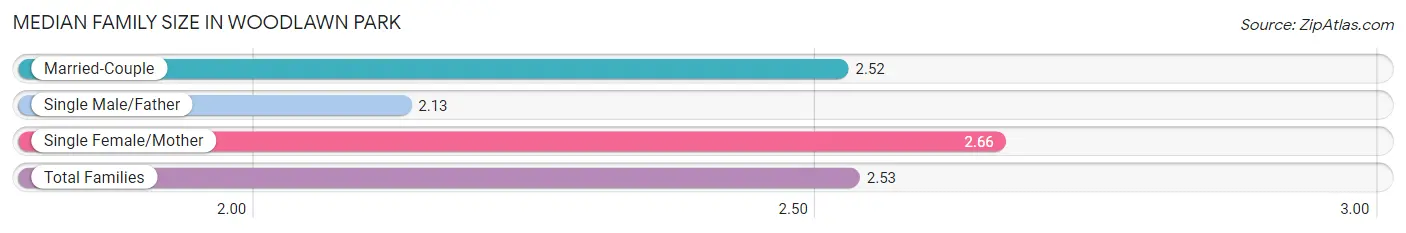
The median family size in Woodlawn Park is 2.53 persons per family, with single female/mother families (50 | 19.5%) accounting for the largest median family size of 2.66 persons per family. On the other hand, single male/father families (16 | 6.2%) represent the smallest median family size with 2.13 persons per family.
| Family Type | # Families | Family Size |
| Married-Couple | 191 (74.3%) | 2.52 |
| Single Male/Father | 16 (6.2%) | 2.13 |
| Single Female/Mother | 50 (19.5%) | 2.66 |
| Total Families | 257 (100.0%) | 2.53 |
Median Household Size in Woodlawn Park
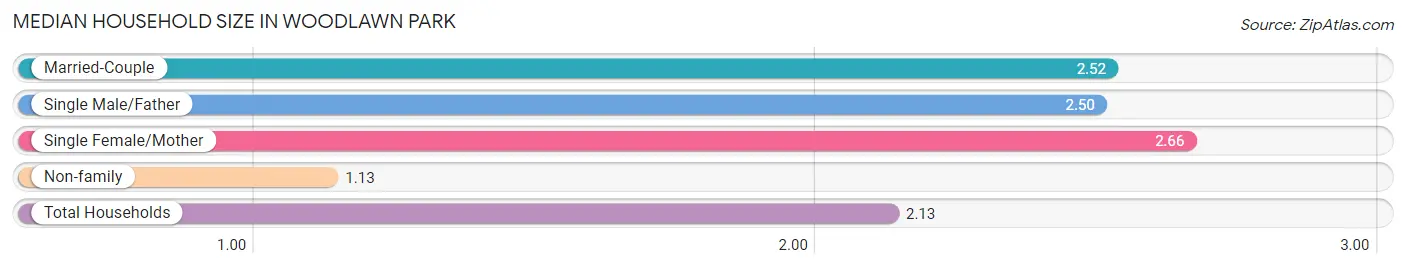
The median household size in Woodlawn Park is 2.13 persons per household, with single female/mother households (50 | 13.7%) accounting for the largest median household size of 2.66 persons per household. non-family households (107 | 29.4%) represent the smallest median household size with 1.13 persons per household.
| Household Type | # Households | Household Size |
| Married-Couple | 191 (52.5%) | 2.52 |
| Single Male/Father | 16 (4.4%) | 2.50 |
| Single Female/Mother | 50 (13.7%) | 2.66 |
| Non-family | 107 (29.4%) | 1.13 |
| Total Households | 364 (100.0%) | 2.13 |
Household Size by Marriage Status in Woodlawn Park
Out of a total of 364 households in Woodlawn Park, 257 (70.6%) are family households, while 107 (29.4%) are nonfamily households. The most numerous type of family households are 2-person households, comprising 168, and the most common type of nonfamily households are 1-person households, comprising 95.
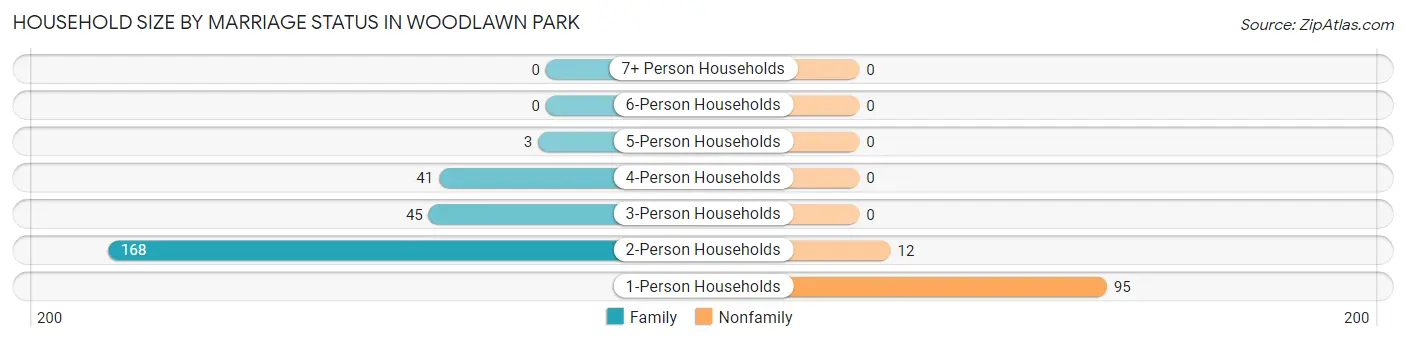
| Household Size | Family Households | Nonfamily Households |
| 1-Person Households | - | 95 (26.1%) |
| 2-Person Households | 168 (46.2%) | 12 (3.3%) |
| 3-Person Households | 45 (12.4%) | 0 (0.0%) |
| 4-Person Households | 41 (11.3%) | 0 (0.0%) |
| 5-Person Households | 3 (0.8%) | 0 (0.0%) |
| 6-Person Households | 0 (0.0%) | 0 (0.0%) |
| 7+ Person Households | 0 (0.0%) | 0 (0.0%) |
| Total | 257 (70.6%) | 107 (29.4%) |
Female Fertility in Woodlawn Park
Fertility by Age in Woodlawn Park
Average fertility rate in Woodlawn Park is 49.0 births per 1,000 women. Women in the age bracket of 20 to 34 years have the highest fertility rate with 108.0 births per 1,000 women. Women in the age bracket of 20 to 34 years acount for 100.0% of all women with births.
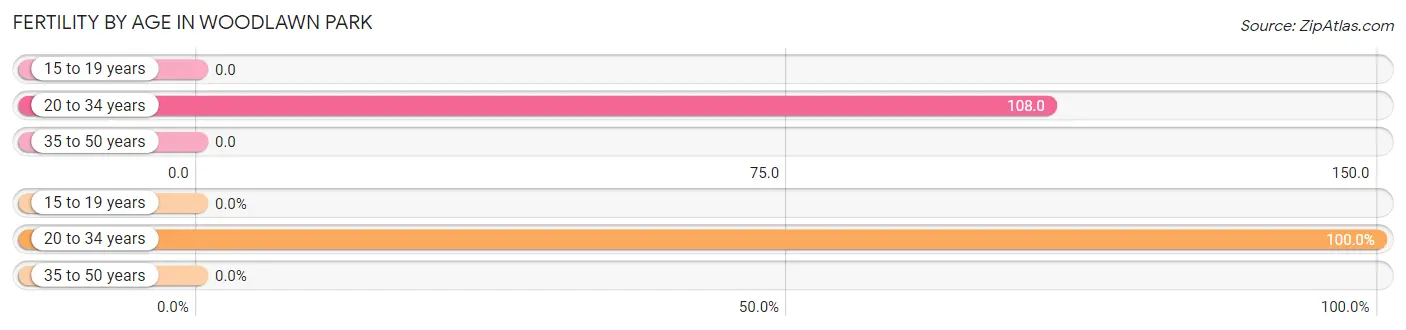
| Age Bracket | Women with Births | Births / 1,000 Women |
| 15 to 19 years | 0 (0.0%) | 0.0 |
| 20 to 34 years | 7 (100.0%) | 108.0 |
| 35 to 50 years | 0 (0.0%) | 0.0 |
| Total | 7 (100.0%) | 49.0 |
Fertility by Age by Marriage Status in Woodlawn Park
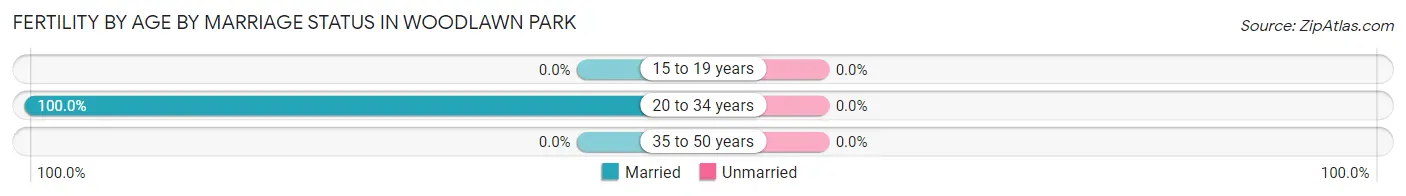
| Age Bracket | Married | Unmarried |
| 15 to 19 years | 0 (0.0%) | 0 (0.0%) |
| 20 to 34 years | 7 (100.0%) | 0 (0.0%) |
| 35 to 50 years | 0 (0.0%) | 0 (0.0%) |
| Total | 7 (100.0%) | 0 (0.0%) |
Fertility by Education in Woodlawn Park
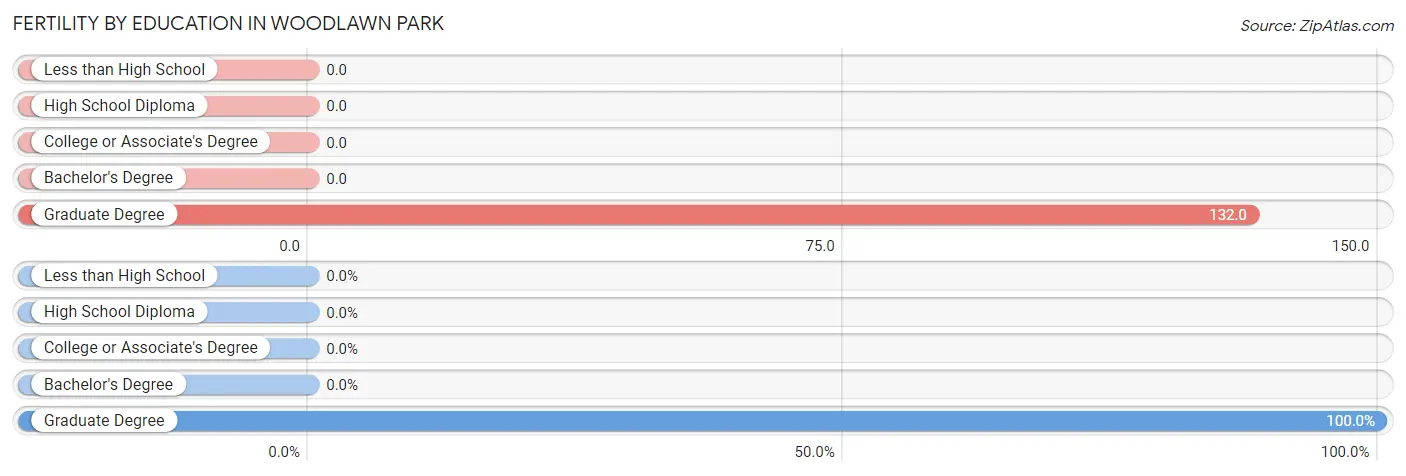
| Educational Attainment | Women with Births | Births / 1,000 Women |
| Less than High School | 0 (0.0%) | 0.0 |
| High School Diploma | 0 (0.0%) | 0.0 |
| College or Associate's Degree | 0 (0.0%) | 0.0 |
| Bachelor's Degree | 0 (0.0%) | 0.0 |
| Graduate Degree | 7 (100.0%) | 132.0 |
| Total | 7 (100.0%) | 49.0 |
Fertility by Education by Marriage Status in Woodlawn Park
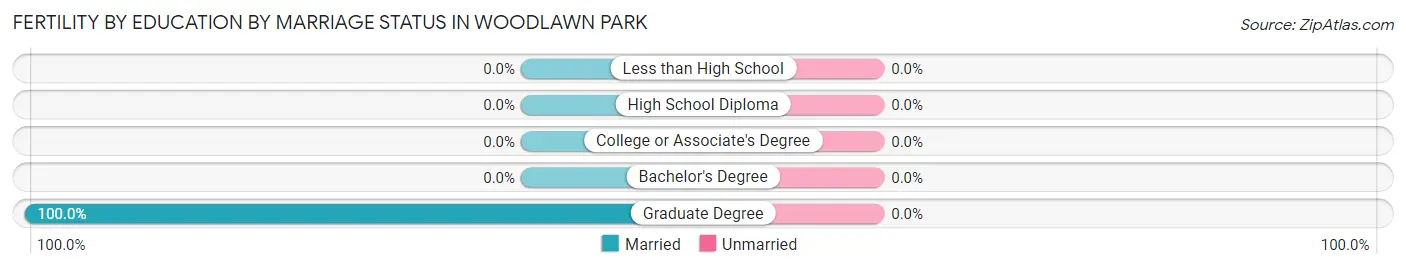
| Educational Attainment | Married | Unmarried |
| Less than High School | 0 (0.0%) | 0 (0.0%) |
| High School Diploma | 0 (0.0%) | 0 (0.0%) |
| College or Associate's Degree | 0 (0.0%) | 0 (0.0%) |
| Bachelor's Degree | 0 (0.0%) | 0 (0.0%) |
| Graduate Degree | 7 (100.0%) | 0 (0.0%) |
| Total | 7 (100.0%) | 0 (0.0%) |
Employment Characteristics in Woodlawn Park
Employment by Class of Employer in Woodlawn Park
Among the 406 employed individuals in Woodlawn Park, private company employees (227 | 55.9%), not-for-profit organizations (50 | 12.3%), and self-employed (not incorporated) (47 | 11.6%) make up the most common classes of employment.
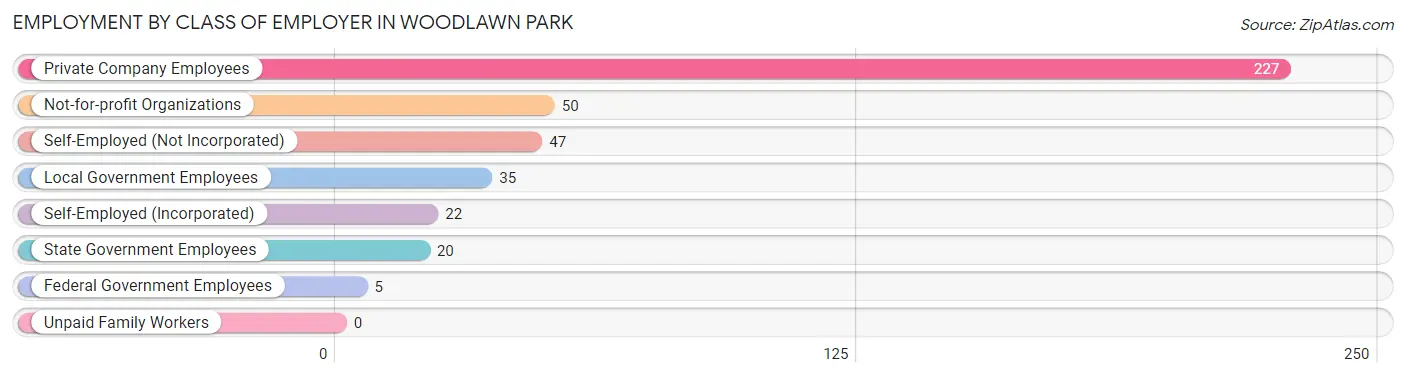
| Employer Class | # Employees | % Employees |
| Private Company Employees | 227 | 55.9% |
| Self-Employed (Incorporated) | 22 | 5.4% |
| Self-Employed (Not Incorporated) | 47 | 11.6% |
| Not-for-profit Organizations | 50 | 12.3% |
| Local Government Employees | 35 | 8.6% |
| State Government Employees | 20 | 4.9% |
| Federal Government Employees | 5 | 1.2% |
| Unpaid Family Workers | 0 | 0.0% |
| Total | 406 | 100.0% |
Employment Status by Age in Woodlawn Park
According to the labor force statistics for Woodlawn Park, out of the total population over 16 years of age (642), 66.2% or 425 individuals are in the labor force, with 3.8% or 16 of them unemployed. The age group with the highest labor force participation rate is 20 to 24 years, with 100.0% or 25 individuals in the labor force. Within the labor force, the 25 to 29 years age range has the highest percentage of unemployed individuals, with 14.6% or 7 of them being unemployed.
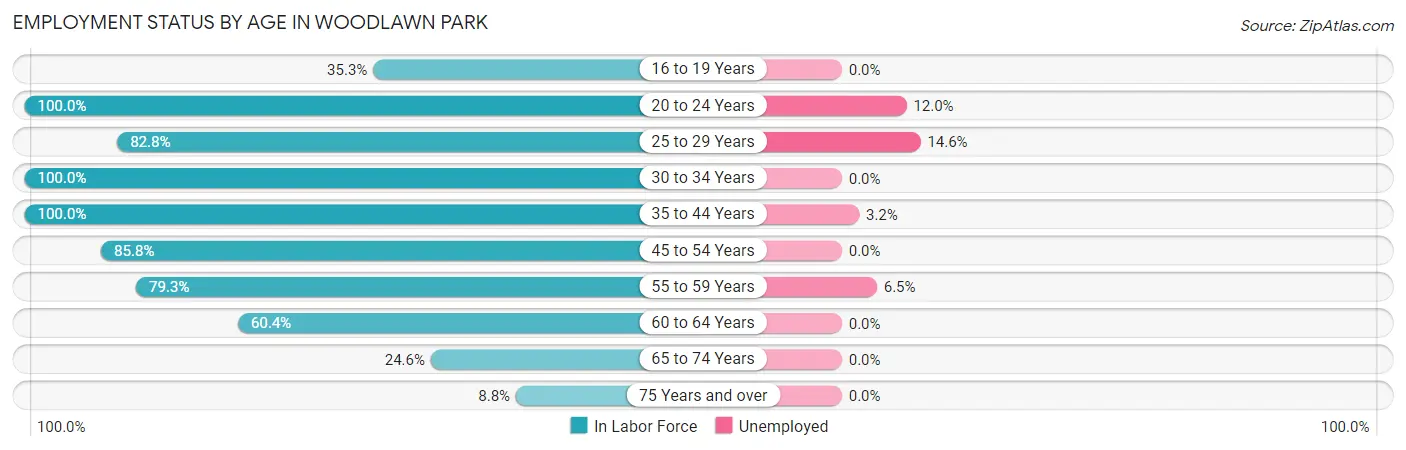
| Age Bracket | In Labor Force | Unemployed |
| 16 to 19 Years | 6 (35.3%) | 0 (0.0%) |
| 20 to 24 Years | 25 (100.0%) | 3 (12.0%) |
| 25 to 29 Years | 48 (82.8%) | 7 (14.6%) |
| 30 to 34 Years | 48 (100.0%) | 0 (0.0%) |
| 35 to 44 Years | 95 (100.0%) | 3 (3.2%) |
| 45 to 54 Years | 91 (85.8%) | 0 (0.0%) |
| 55 to 59 Years | 46 (79.3%) | 3 (6.5%) |
| 60 to 64 Years | 29 (60.4%) | 0 (0.0%) |
| 65 to 74 Years | 32 (24.6%) | 0 (0.0%) |
| 75 Years and over | 5 (8.8%) | 0 (0.0%) |
| Total | 425 (66.2%) | 16 (3.8%) |
Employment Status by Educational Attainment in Woodlawn Park
According to labor force statistics for Woodlawn Park, 86.4% of individuals (357) out of the total population between 25 and 64 years of age (413) are in the labor force, with 3.6% or 13 of them being unemployed. The group with the highest labor force participation rate are those with the educational attainment of less than high school, with 100.0% or 6 individuals in the labor force. Within the labor force, individuals with college / associate degree education have the highest percentage of unemployment, with 9.7% or 6 of them being unemployed.
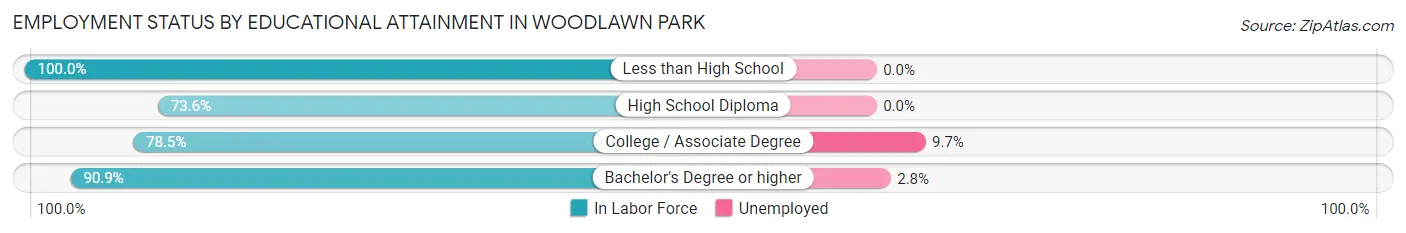
| Educational Attainment | In Labor Force | Unemployed |
| Less than High School | 6 (100.0%) | 0 (0.0%) |
| High School Diploma | 39 (73.6%) | 0 (0.0%) |
| College / Associate Degree | 62 (78.5%) | 8 (9.7%) |
| Bachelor's Degree or higher | 250 (90.9%) | 8 (2.8%) |
| Total | 357 (86.4%) | 15 (3.6%) |
Employment Occupations by Sex in Woodlawn Park
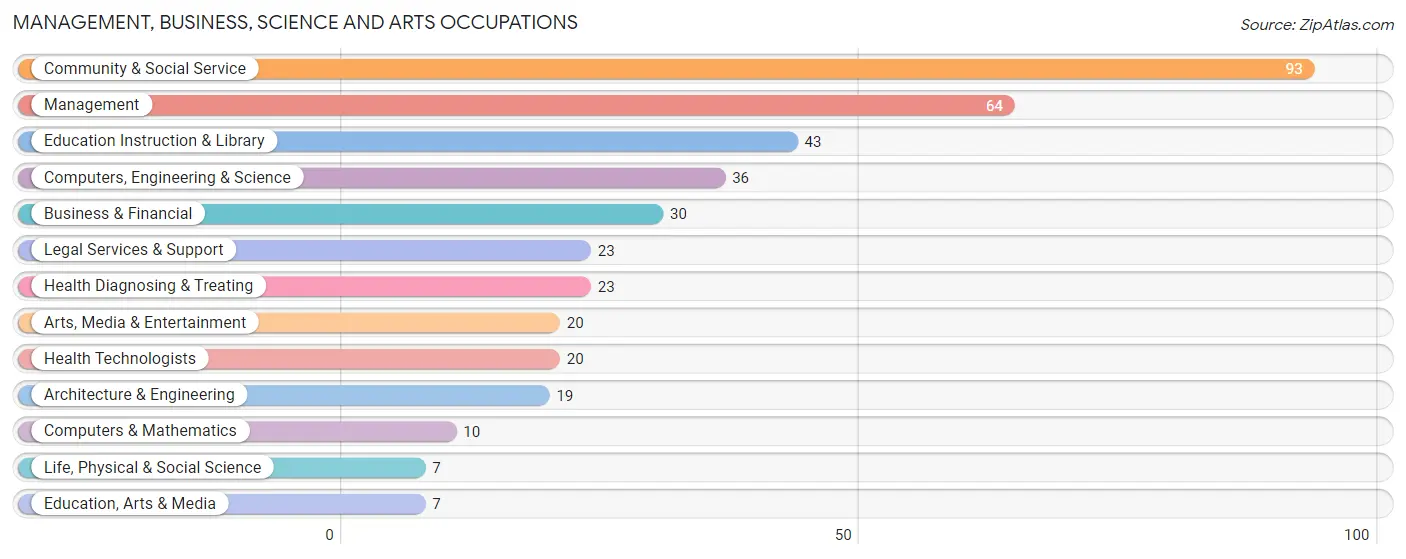
Management, Business, Science and Arts Occupations
The most common Management, Business, Science and Arts occupations in Woodlawn Park are Community & Social Service (93 | 22.7%), Management (64 | 15.7%), Education Instruction & Library (43 | 10.5%), Computers, Engineering & Science (36 | 8.8%), and Business & Financial (30 | 7.3%).
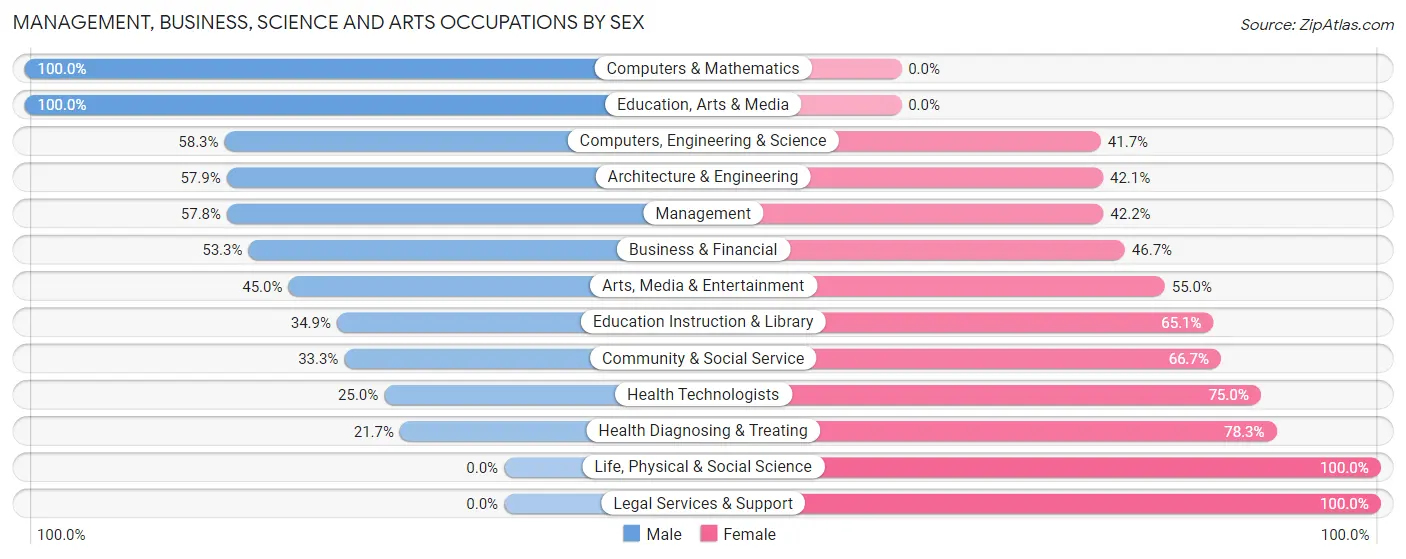
Management, Business, Science and Arts Occupations by Sex
Within the Management, Business, Science and Arts occupations in Woodlawn Park, the most male-oriented occupations are Computers & Mathematics (100.0%), Education, Arts & Media (100.0%), and Computers, Engineering & Science (58.3%), while the most female-oriented occupations are Life, Physical & Social Science (100.0%), Legal Services & Support (100.0%), and Health Diagnosing & Treating (78.3%).
| Occupation | Male | Female |
| Management | 37 (57.8%) | 27 (42.2%) |
| Business & Financial | 16 (53.3%) | 14 (46.7%) |
| Computers, Engineering & Science | 21 (58.3%) | 15 (41.7%) |
| Computers & Mathematics | 10 (100.0%) | 0 (0.0%) |
| Architecture & Engineering | 11 (57.9%) | 8 (42.1%) |
| Life, Physical & Social Science | 0 (0.0%) | 7 (100.0%) |
| Community & Social Service | 31 (33.3%) | 62 (66.7%) |
| Education, Arts & Media | 7 (100.0%) | 0 (0.0%) |
| Legal Services & Support | 0 (0.0%) | 23 (100.0%) |
| Education Instruction & Library | 15 (34.9%) | 28 (65.1%) |
| Arts, Media & Entertainment | 9 (45.0%) | 11 (55.0%) |
| Health Diagnosing & Treating | 5 (21.7%) | 18 (78.3%) |
| Health Technologists | 5 (25.0%) | 15 (75.0%) |
| Total (Category) | 110 (44.7%) | 136 (55.3%) |
| Total (Overall) | 208 (50.9%) | 201 (49.1%) |
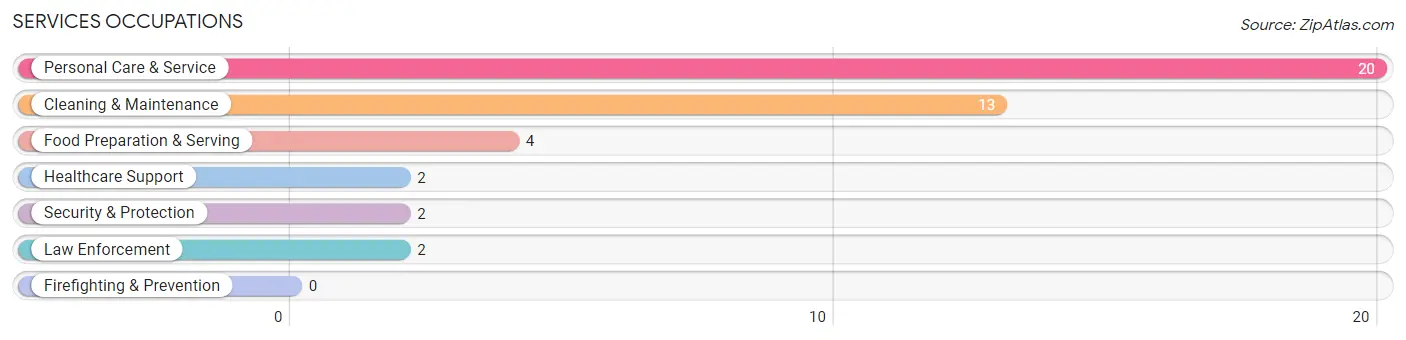
Services Occupations
The most common Services occupations in Woodlawn Park are Personal Care & Service (20 | 4.9%), Cleaning & Maintenance (13 | 3.2%), Food Preparation & Serving (4 | 1.0%), Healthcare Support (2 | 0.5%), and Security & Protection (2 | 0.5%).
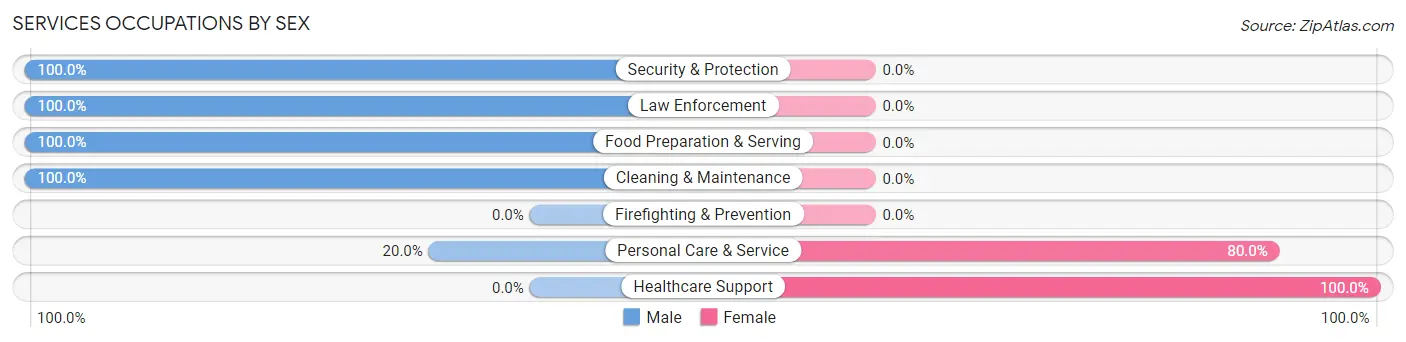
Services Occupations by Sex
Within the Services occupations in Woodlawn Park, the most male-oriented occupations are Security & Protection (100.0%), Law Enforcement (100.0%), and Food Preparation & Serving (100.0%), while the most female-oriented occupations are Healthcare Support (100.0%), and Personal Care & Service (80.0%).
| Occupation | Male | Female |
| Healthcare Support | 0 (0.0%) | 2 (100.0%) |
| Security & Protection | 2 (100.0%) | 0 (0.0%) |
| Firefighting & Prevention | 0 (0.0%) | 0 (0.0%) |
| Law Enforcement | 2 (100.0%) | 0 (0.0%) |
| Food Preparation & Serving | 4 (100.0%) | 0 (0.0%) |
| Cleaning & Maintenance | 13 (100.0%) | 0 (0.0%) |
| Personal Care & Service | 4 (20.0%) | 16 (80.0%) |
| Total (Category) | 23 (56.1%) | 18 (43.9%) |
| Total (Overall) | 208 (50.9%) | 201 (49.1%) |
Sales and Office Occupations
The most common Sales and Office occupations in Woodlawn Park are Office & Administration (34 | 8.3%), and Sales & Related (33 | 8.1%).
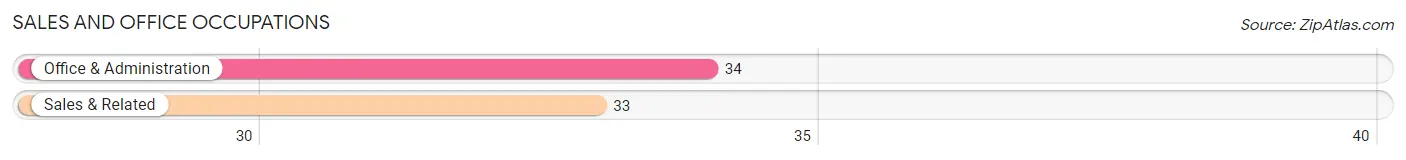
Sales and Office Occupations by Sex
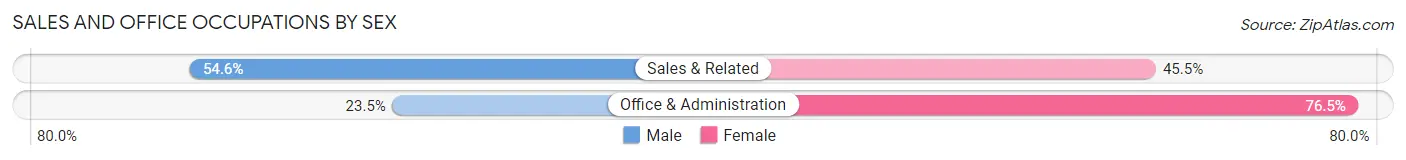
| Occupation | Male | Female |
| Sales & Related | 18 (54.5%) | 15 (45.5%) |
| Office & Administration | 8 (23.5%) | 26 (76.5%) |
| Total (Category) | 26 (38.8%) | 41 (61.2%) |
| Total (Overall) | 208 (50.9%) | 201 (49.1%) |
Natural Resources, Construction and Maintenance Occupations
The most common Natural Resources, Construction and Maintenance occupations in Woodlawn Park are Construction & Extraction (21 | 5.1%), and Installation, Maintenance & Repair (3 | 0.7%).
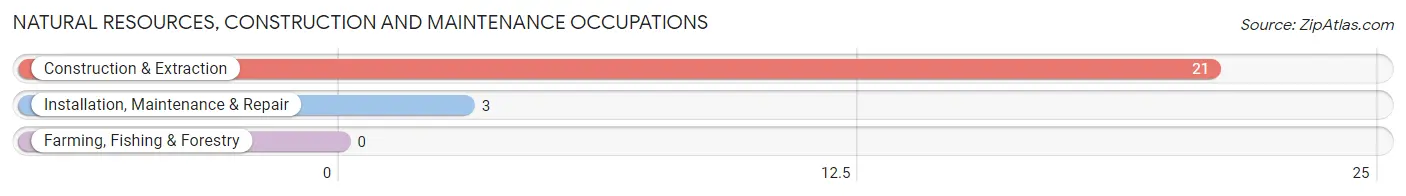
Natural Resources, Construction and Maintenance Occupations by Sex
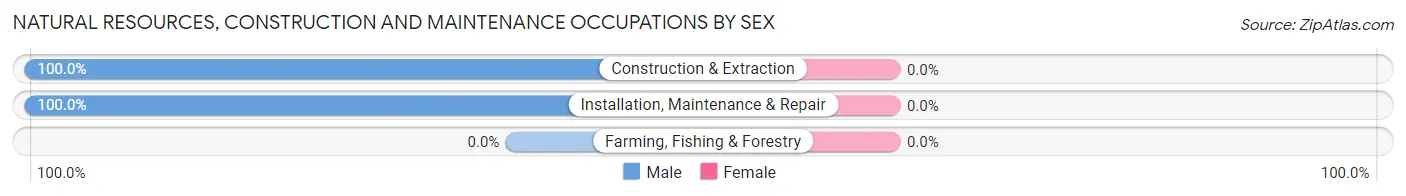
| Occupation | Male | Female |
| Farming, Fishing & Forestry | 0 (0.0%) | 0 (0.0%) |
| Construction & Extraction | 21 (100.0%) | 0 (0.0%) |
| Installation, Maintenance & Repair | 3 (100.0%) | 0 (0.0%) |
| Total (Category) | 24 (100.0%) | 0 (0.0%) |
| Total (Overall) | 208 (50.9%) | 201 (49.1%) |
Production, Transportation and Moving Occupations
The most common Production, Transportation and Moving occupations in Woodlawn Park are Transportation (18 | 4.4%), Material Moving (10 | 2.4%), and Production (3 | 0.7%).
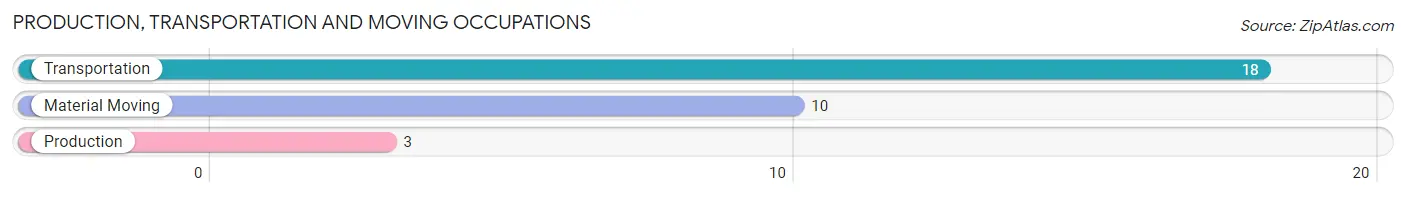
Production, Transportation and Moving Occupations by Sex
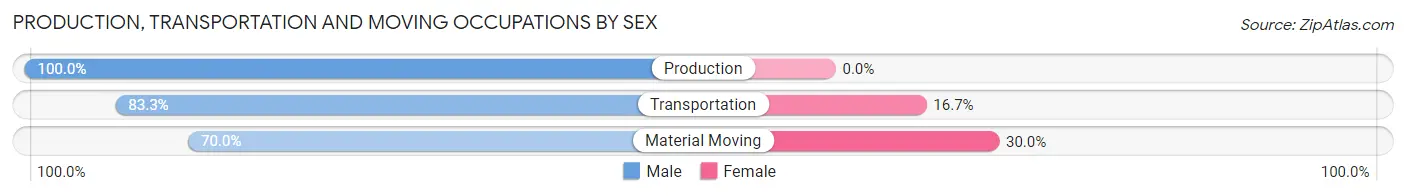
| Occupation | Male | Female |
| Production | 3 (100.0%) | 0 (0.0%) |
| Transportation | 15 (83.3%) | 3 (16.7%) |
| Material Moving | 7 (70.0%) | 3 (30.0%) |
| Total (Category) | 25 (80.6%) | 6 (19.4%) |
| Total (Overall) | 208 (50.9%) | 201 (49.1%) |
Employment Industries by Sex in Woodlawn Park
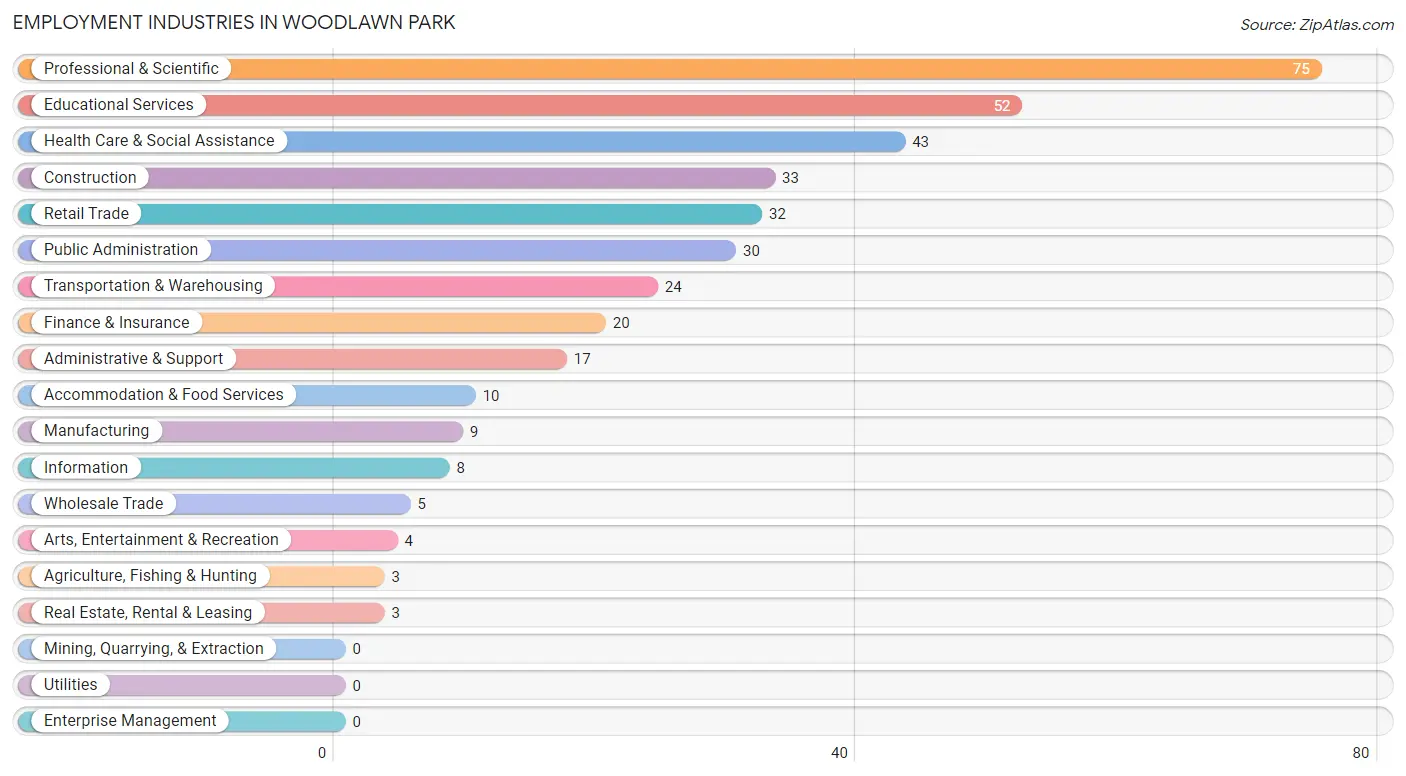
Employment Industries in Woodlawn Park
The major employment industries in Woodlawn Park include Professional & Scientific (75 | 18.3%), Educational Services (52 | 12.7%), Health Care & Social Assistance (43 | 10.5%), Construction (33 | 8.1%), and Retail Trade (32 | 7.8%).
Employment Industries by Sex in Woodlawn Park
The Woodlawn Park industries that see more men than women are Real Estate, Rental & Leasing (100.0%), Arts, Entertainment & Recreation (100.0%), and Accommodation & Food Services (100.0%), whereas the industries that tend to have a higher number of women are Agriculture, Fishing & Hunting (100.0%), Health Care & Social Assistance (76.7%), and Professional & Scientific (74.7%).
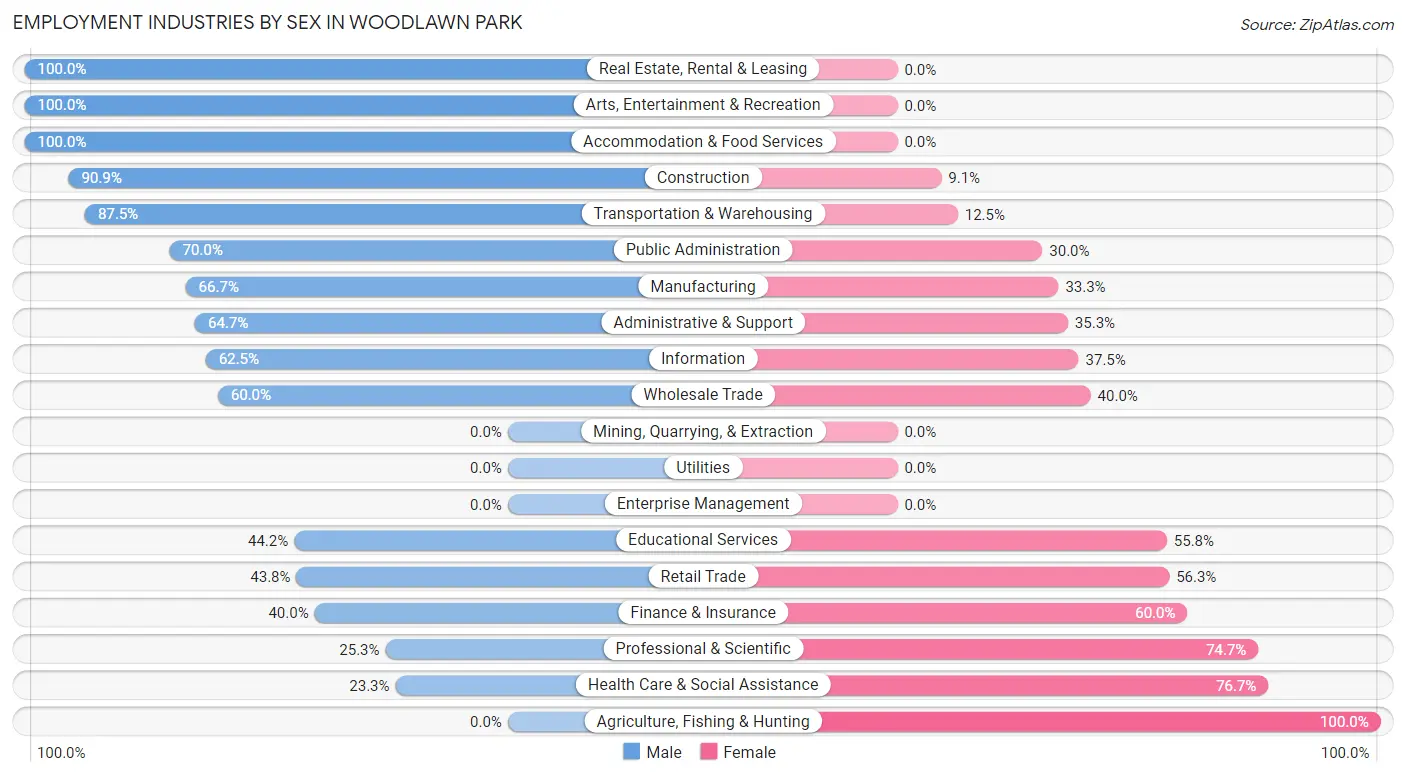
| Industry | Male | Female |
| Agriculture, Fishing & Hunting | 0 (0.0%) | 3 (100.0%) |
| Mining, Quarrying, & Extraction | 0 (0.0%) | 0 (0.0%) |
| Construction | 30 (90.9%) | 3 (9.1%) |
| Manufacturing | 6 (66.7%) | 3 (33.3%) |
| Wholesale Trade | 3 (60.0%) | 2 (40.0%) |
| Retail Trade | 14 (43.8%) | 18 (56.2%) |
| Transportation & Warehousing | 21 (87.5%) | 3 (12.5%) |
| Utilities | 0 (0.0%) | 0 (0.0%) |
| Information | 5 (62.5%) | 3 (37.5%) |
| Finance & Insurance | 8 (40.0%) | 12 (60.0%) |
| Real Estate, Rental & Leasing | 3 (100.0%) | 0 (0.0%) |
| Professional & Scientific | 19 (25.3%) | 56 (74.7%) |
| Enterprise Management | 0 (0.0%) | 0 (0.0%) |
| Administrative & Support | 11 (64.7%) | 6 (35.3%) |
| Educational Services | 23 (44.2%) | 29 (55.8%) |
| Health Care & Social Assistance | 10 (23.3%) | 33 (76.7%) |
| Arts, Entertainment & Recreation | 4 (100.0%) | 0 (0.0%) |
| Accommodation & Food Services | 10 (100.0%) | 0 (0.0%) |
| Public Administration | 21 (70.0%) | 9 (30.0%) |
| Total | 208 (50.9%) | 201 (49.1%) |
Education in Woodlawn Park
School Enrollment in Woodlawn Park
The most common levels of schooling among the 170 students in Woodlawn Park are elementary school (40 | 23.5%), college / undergraduate (32 | 18.8%), and middle school (29 | 17.1%).
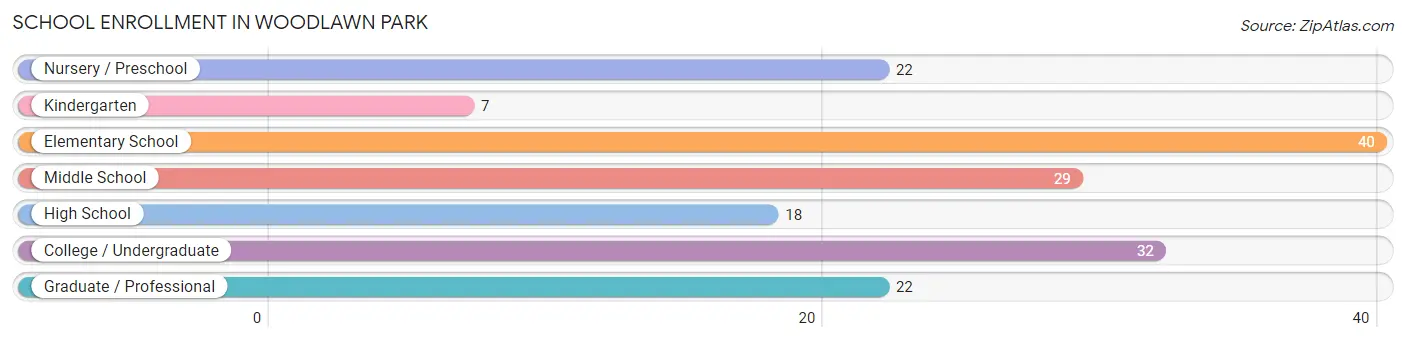
| School Level | # Students | % Students |
| Nursery / Preschool | 22 | 12.9% |
| Kindergarten | 7 | 4.1% |
| Elementary School | 40 | 23.5% |
| Middle School | 29 | 17.1% |
| High School | 18 | 10.6% |
| College / Undergraduate | 32 | 18.8% |
| Graduate / Professional | 22 | 12.9% |
| Total | 170 | 100.0% |
School Enrollment by Age by Funding Source in Woodlawn Park
Out of a total of 170 students who are enrolled in schools in Woodlawn Park, 92 (54.1%) attend a private institution, while the remaining 78 (45.9%) are enrolled in public schools. The age group of 3 to 4 year olds has the highest likelihood of being enrolled in private schools, with 16 (100.0% in the age bracket) enrolled. Conversely, the age group of 25 to 34 year olds has the lowest likelihood of being enrolled in a private school, with 18 (100.0% in the age bracket) attending a public institution.
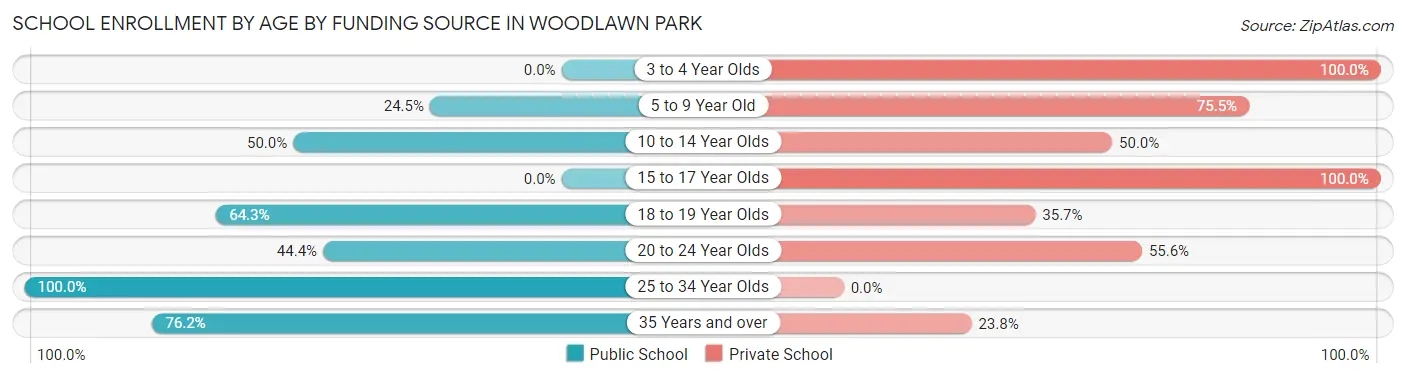
| Age Bracket | Public School | Private School |
| 3 to 4 Year Olds | 0 (0.0%) | 16 (100.0%) |
| 5 to 9 Year Old | 13 (24.5%) | 40 (75.5%) |
| 10 to 14 Year Olds | 18 (50.0%) | 18 (50.0%) |
| 15 to 17 Year Olds | 0 (0.0%) | 3 (100.0%) |
| 18 to 19 Year Olds | 9 (64.3%) | 5 (35.7%) |
| 20 to 24 Year Olds | 4 (44.4%) | 5 (55.6%) |
| 25 to 34 Year Olds | 18 (100.0%) | 0 (0.0%) |
| 35 Years and over | 16 (76.2%) | 5 (23.8%) |
| Total | 78 (45.9%) | 92 (54.1%) |
Educational Attainment by Field of Study in Woodlawn Park
Business (66 | 17.0%), education (54 | 13.9%), communications (44 | 11.3%), science & technology (32 | 8.2%), and bio, nature & agricultural (29 | 7.5%) are the most common fields of study among 389 individuals in Woodlawn Park who have obtained a bachelor's degree or higher.
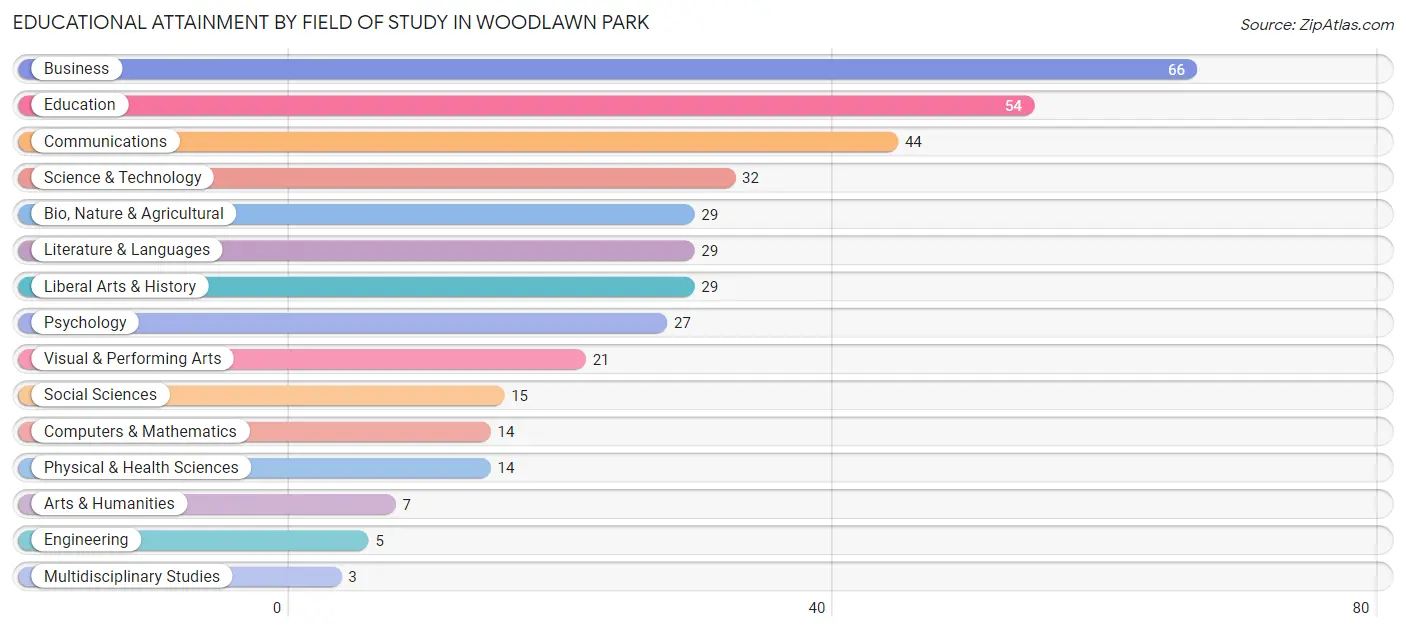
| Field of Study | # Graduates | % Graduates |
| Computers & Mathematics | 14 | 3.6% |
| Bio, Nature & Agricultural | 29 | 7.5% |
| Physical & Health Sciences | 14 | 3.6% |
| Psychology | 27 | 6.9% |
| Social Sciences | 15 | 3.9% |
| Engineering | 5 | 1.3% |
| Multidisciplinary Studies | 3 | 0.8% |
| Science & Technology | 32 | 8.2% |
| Business | 66 | 17.0% |
| Education | 54 | 13.9% |
| Literature & Languages | 29 | 7.5% |
| Liberal Arts & History | 29 | 7.5% |
| Visual & Performing Arts | 21 | 5.4% |
| Communications | 44 | 11.3% |
| Arts & Humanities | 7 | 1.8% |
| Total | 389 | 100.0% |
Transportation & Commute in Woodlawn Park
Vehicle Availability by Sex in Woodlawn Park
The most prevalent vehicle ownership categories in Woodlawn Park are males with 2 vehicles (133, accounting for 64.9%) and females with 2 vehicles (117, making up 66.2%).
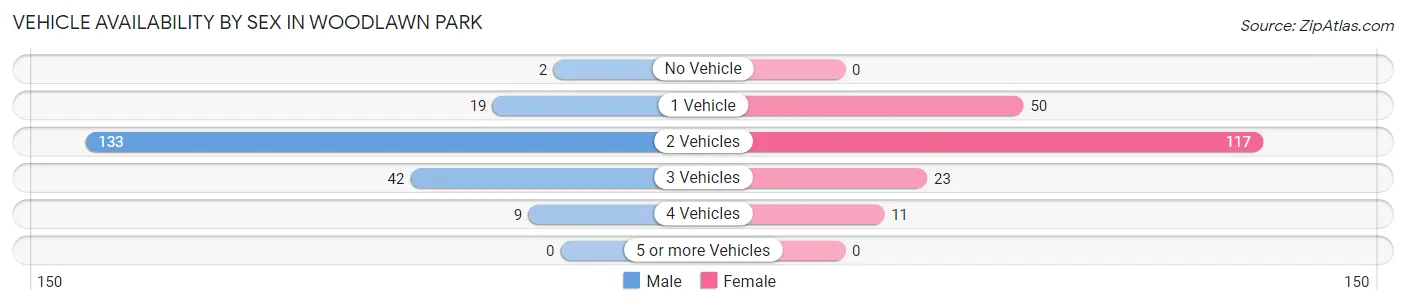
| Vehicles Available | Male | Female |
| No Vehicle | 2 (1.0%) | 0 (0.0%) |
| 1 Vehicle | 19 (9.3%) | 50 (24.9%) |
| 2 Vehicles | 133 (64.9%) | 117 (58.2%) |
| 3 Vehicles | 42 (20.5%) | 23 (11.4%) |
| 4 Vehicles | 9 (4.4%) | 11 (5.5%) |
| 5 or more Vehicles | 0 (0.0%) | 0 (0.0%) |
| Total | 205 (100.0%) | 201 (100.0%) |
Commute Time in Woodlawn Park
The most frequently occuring commute durations in Woodlawn Park are 15 to 19 minutes (96 commuters, 30.1%), 20 to 24 minutes (81 commuters, 25.4%), and 10 to 14 minutes (47 commuters, 14.7%).
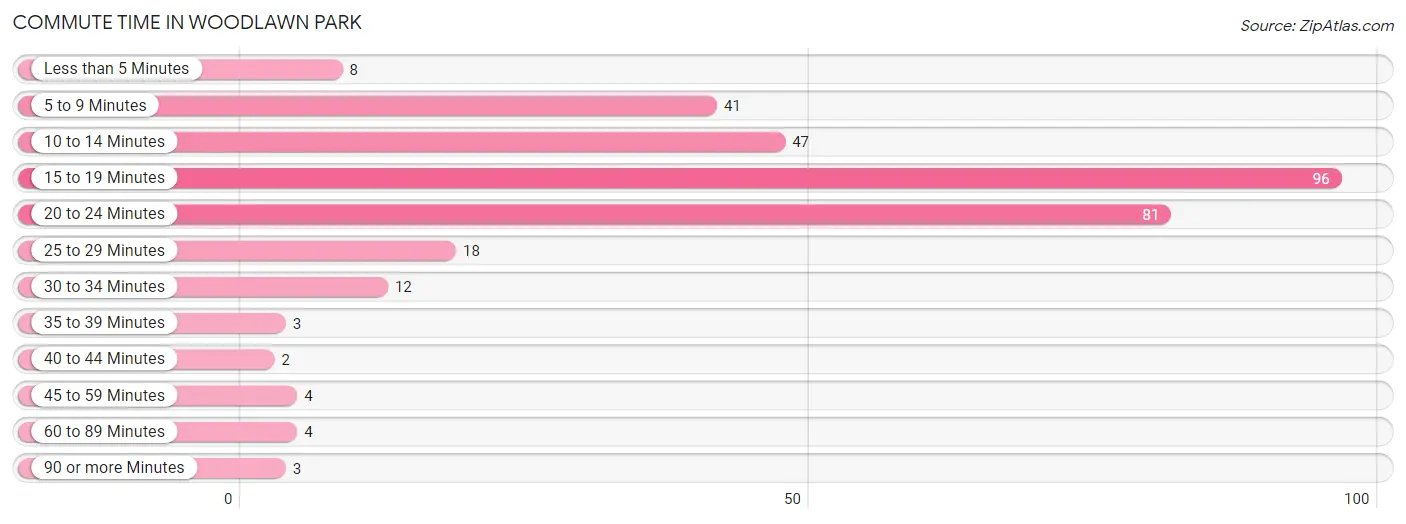
| Commute Time | # Commuters | % Commuters |
| Less than 5 Minutes | 8 | 2.5% |
| 5 to 9 Minutes | 41 | 12.9% |
| 10 to 14 Minutes | 47 | 14.7% |
| 15 to 19 Minutes | 96 | 30.1% |
| 20 to 24 Minutes | 81 | 25.4% |
| 25 to 29 Minutes | 18 | 5.6% |
| 30 to 34 Minutes | 12 | 3.8% |
| 35 to 39 Minutes | 3 | 0.9% |
| 40 to 44 Minutes | 2 | 0.6% |
| 45 to 59 Minutes | 4 | 1.3% |
| 60 to 89 Minutes | 4 | 1.3% |
| 90 or more Minutes | 3 | 0.9% |
Commute Time by Sex in Woodlawn Park
The most common commute times in Woodlawn Park are 20 to 24 minutes (41 commuters, 25.6%) for males and 15 to 19 minutes (63 commuters, 39.6%) for females.
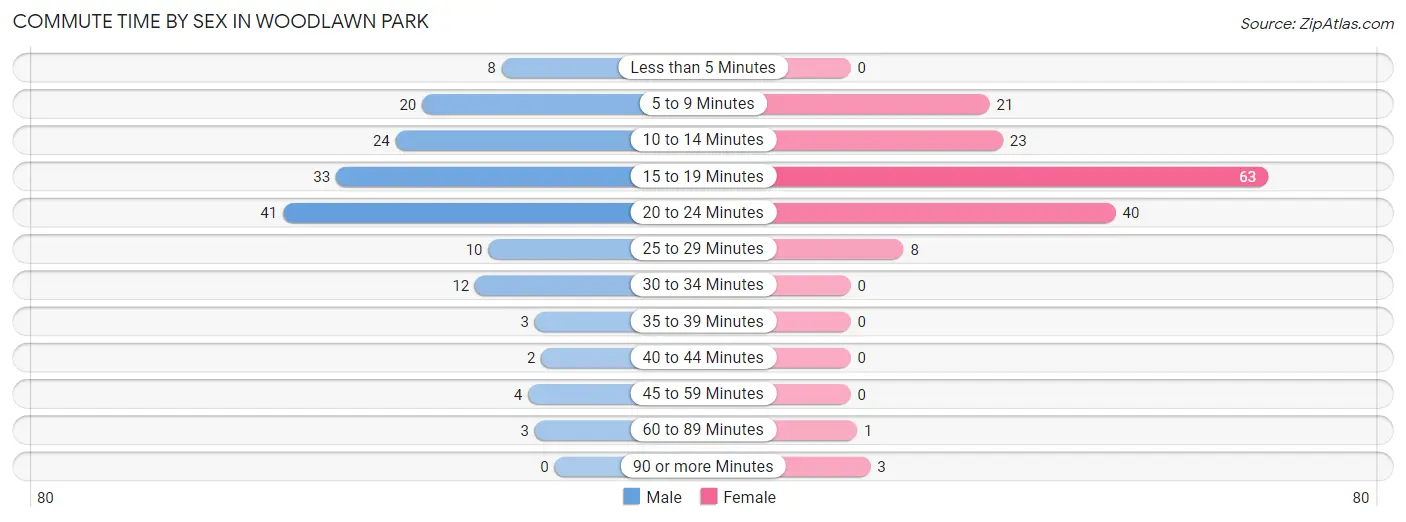
| Commute Time | Male | Female |
| Less than 5 Minutes | 8 (5.0%) | 0 (0.0%) |
| 5 to 9 Minutes | 20 (12.5%) | 21 (13.2%) |
| 10 to 14 Minutes | 24 (15.0%) | 23 (14.5%) |
| 15 to 19 Minutes | 33 (20.6%) | 63 (39.6%) |
| 20 to 24 Minutes | 41 (25.6%) | 40 (25.2%) |
| 25 to 29 Minutes | 10 (6.2%) | 8 (5.0%) |
| 30 to 34 Minutes | 12 (7.5%) | 0 (0.0%) |
| 35 to 39 Minutes | 3 (1.9%) | 0 (0.0%) |
| 40 to 44 Minutes | 2 (1.3%) | 0 (0.0%) |
| 45 to 59 Minutes | 4 (2.5%) | 0 (0.0%) |
| 60 to 89 Minutes | 3 (1.9%) | 1 (0.6%) |
| 90 or more Minutes | 0 (0.0%) | 3 (1.9%) |
Time of Departure to Work by Sex in Woodlawn Park
The most frequent times of departure to work in Woodlawn Park are 7:30 AM to 7:59 AM (30, 18.8%) for males and 8:00 AM to 8:29 AM (53, 33.3%) for females.
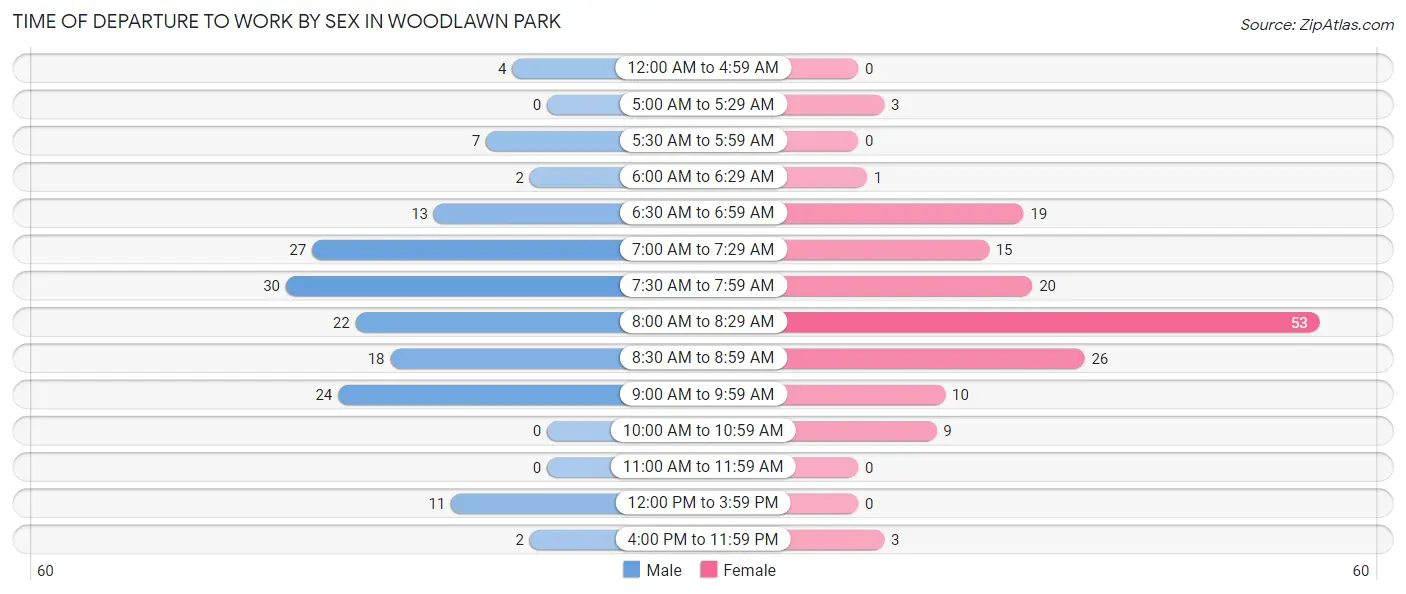
| Time of Departure | Male | Female |
| 12:00 AM to 4:59 AM | 4 (2.5%) | 0 (0.0%) |
| 5:00 AM to 5:29 AM | 0 (0.0%) | 3 (1.9%) |
| 5:30 AM to 5:59 AM | 7 (4.4%) | 0 (0.0%) |
| 6:00 AM to 6:29 AM | 2 (1.3%) | 1 (0.6%) |
| 6:30 AM to 6:59 AM | 13 (8.1%) | 19 (11.9%) |
| 7:00 AM to 7:29 AM | 27 (16.9%) | 15 (9.4%) |
| 7:30 AM to 7:59 AM | 30 (18.8%) | 20 (12.6%) |
| 8:00 AM to 8:29 AM | 22 (13.8%) | 53 (33.3%) |
| 8:30 AM to 8:59 AM | 18 (11.3%) | 26 (16.4%) |
| 9:00 AM to 9:59 AM | 24 (15.0%) | 10 (6.3%) |
| 10:00 AM to 10:59 AM | 0 (0.0%) | 9 (5.7%) |
| 11:00 AM to 11:59 AM | 0 (0.0%) | 0 (0.0%) |
| 12:00 PM to 3:59 PM | 11 (6.9%) | 0 (0.0%) |
| 4:00 PM to 11:59 PM | 2 (1.3%) | 3 (1.9%) |
| Total | 160 (100.0%) | 159 (100.0%) |
Housing Occupancy in Woodlawn Park
Occupancy by Ownership in Woodlawn Park
Of the total 364 dwellings in Woodlawn Park, owner-occupied units account for 319 (87.6%), while renter-occupied units make up 45 (12.4%).
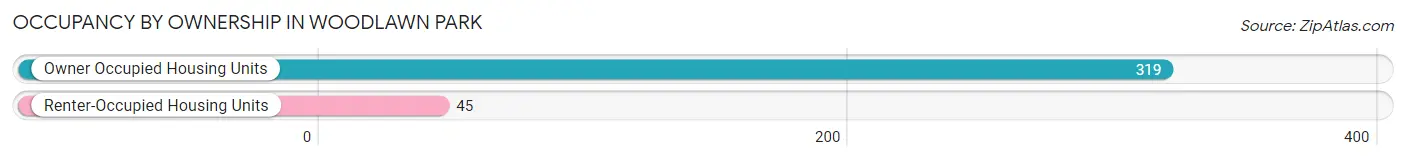
| Occupancy | # Housing Units | % Housing Units |
| Owner Occupied Housing Units | 319 | 87.6% |
| Renter-Occupied Housing Units | 45 | 12.4% |
| Total Occupied Housing Units | 364 | 100.0% |
Occupancy by Household Size in Woodlawn Park
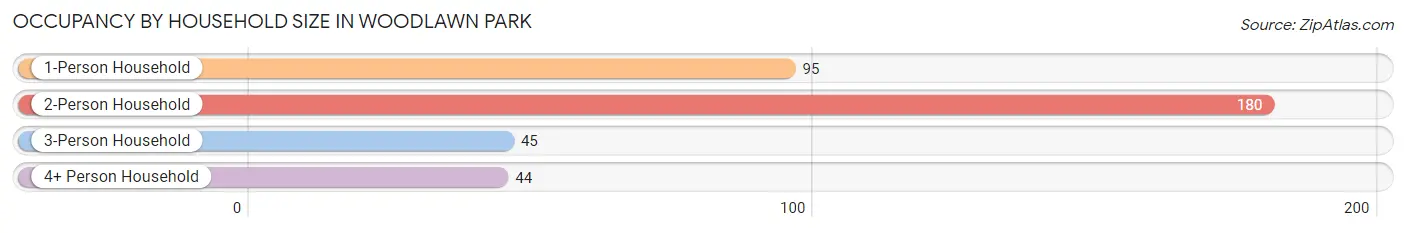
| Household Size | # Housing Units | % Housing Units |
| 1-Person Household | 95 | 26.1% |
| 2-Person Household | 180 | 49.4% |
| 3-Person Household | 45 | 12.4% |
| 4+ Person Household | 44 | 12.1% |
| Total Housing Units | 364 | 100.0% |
Occupancy by Ownership by Household Size in Woodlawn Park
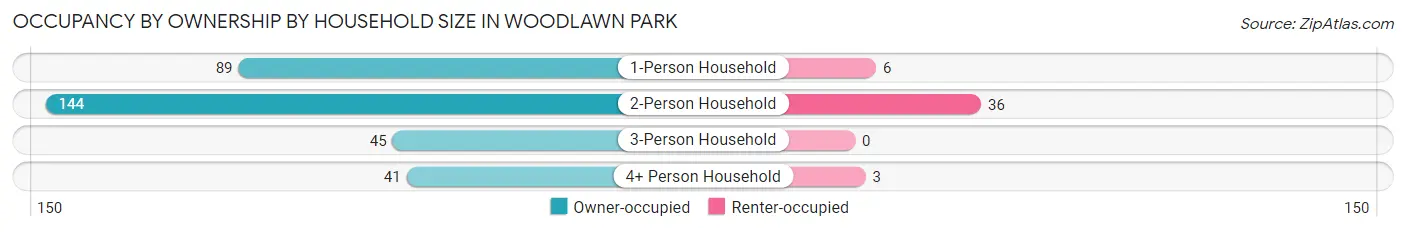
| Household Size | Owner-occupied | Renter-occupied |
| 1-Person Household | 89 (93.7%) | 6 (6.3%) |
| 2-Person Household | 144 (80.0%) | 36 (20.0%) |
| 3-Person Household | 45 (100.0%) | 0 (0.0%) |
| 4+ Person Household | 41 (93.2%) | 3 (6.8%) |
| Total Housing Units | 319 (87.6%) | 45 (12.4%) |
Occupancy by Educational Attainment in Woodlawn Park
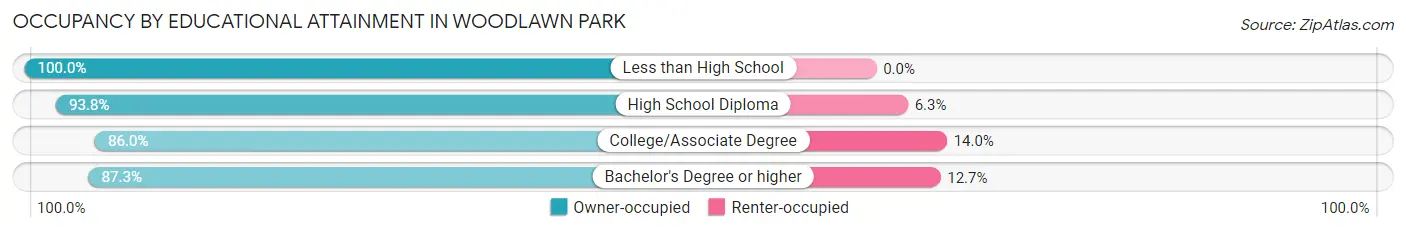
| Household Size | Owner-occupied | Renter-occupied |
| Less than High School | 3 (100.0%) | 0 (0.0%) |
| High School Diploma | 30 (93.8%) | 2 (6.2%) |
| College/Associate Degree | 80 (86.0%) | 13 (14.0%) |
| Bachelor's Degree or higher | 206 (87.3%) | 30 (12.7%) |
Occupancy by Age of Householder in Woodlawn Park
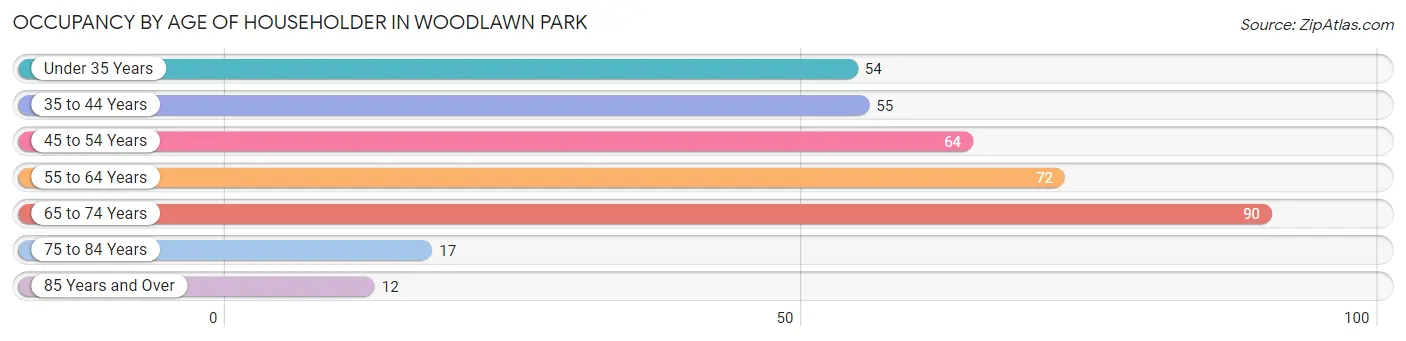
| Age Bracket | # Households | % Households |
| Under 35 Years | 54 | 14.8% |
| 35 to 44 Years | 55 | 15.1% |
| 45 to 54 Years | 64 | 17.6% |
| 55 to 64 Years | 72 | 19.8% |
| 65 to 74 Years | 90 | 24.7% |
| 75 to 84 Years | 17 | 4.7% |
| 85 Years and Over | 12 | 3.3% |
| Total | 364 | 100.0% |
Housing Finances in Woodlawn Park
Median Income by Occupancy in Woodlawn Park
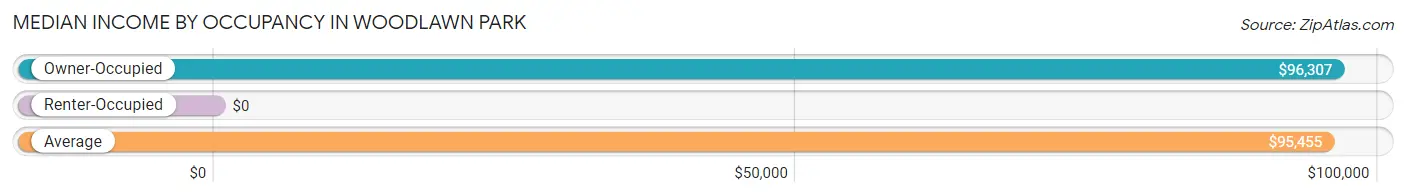
| Occupancy Type | # Households | Median Income |
| Owner-Occupied | 319 (87.6%) | $96,307 |
| Renter-Occupied | 45 (12.4%) | $0 |
| Average | 364 (100.0%) | $95,455 |
Occupancy by Householder Income Bracket in Woodlawn Park
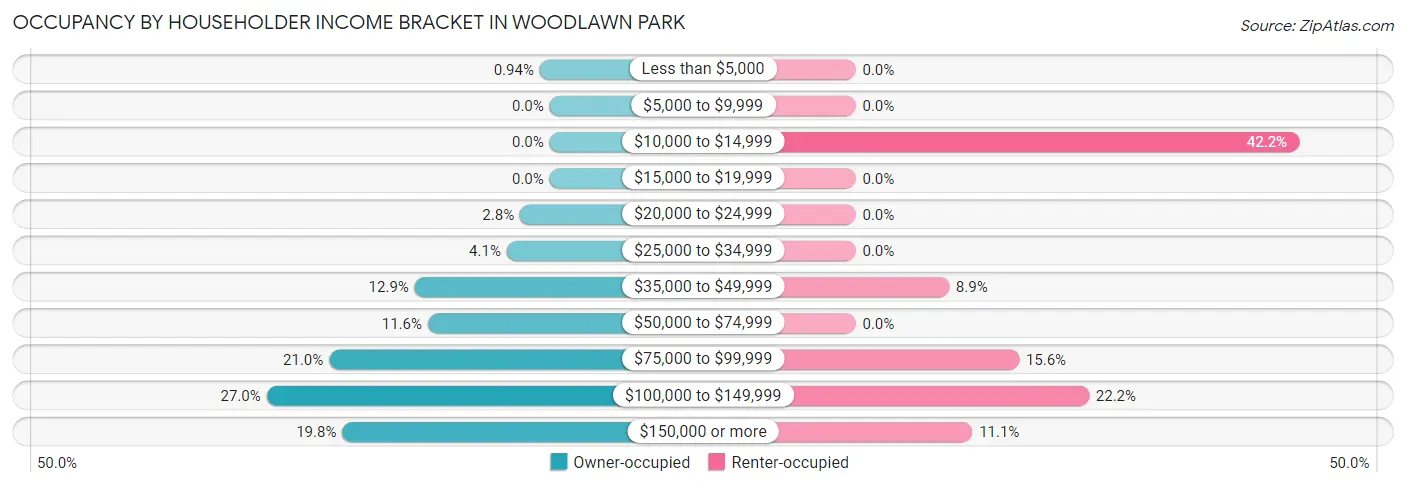
| Income Bracket | Owner-occupied | Renter-occupied |
| Less than $5,000 | 3 (0.9%) | 0 (0.0%) |
| $5,000 to $9,999 | 0 (0.0%) | 0 (0.0%) |
| $10,000 to $14,999 | 0 (0.0%) | 19 (42.2%) |
| $15,000 to $19,999 | 0 (0.0%) | 0 (0.0%) |
| $20,000 to $24,999 | 9 (2.8%) | 0 (0.0%) |
| $25,000 to $34,999 | 13 (4.1%) | 0 (0.0%) |
| $35,000 to $49,999 | 41 (12.9%) | 4 (8.9%) |
| $50,000 to $74,999 | 37 (11.6%) | 0 (0.0%) |
| $75,000 to $99,999 | 67 (21.0%) | 7 (15.6%) |
| $100,000 to $149,999 | 86 (27.0%) | 10 (22.2%) |
| $150,000 or more | 63 (19.8%) | 5 (11.1%) |
| Total | 319 (100.0%) | 45 (100.0%) |
Monthly Housing Cost Tiers in Woodlawn Park

| Monthly Cost | Owner-occupied | Renter-occupied |
| Less than $300 | 4 (1.3%) | 0 (0.0%) |
| $300 to $499 | 39 (12.2%) | 0 (0.0%) |
| $500 to $799 | 85 (26.7%) | 7 (15.6%) |
| $800 to $999 | 8 (2.5%) | 3 (6.7%) |
| $1,000 to $1,499 | 54 (16.9%) | 10 (22.2%) |
| $1,500 to $1,999 | 61 (19.1%) | 16 (35.6%) |
| $2,000 to $2,499 | 50 (15.7%) | 7 (15.6%) |
| $2,500 to $2,999 | 15 (4.7%) | 0 (0.0%) |
| $3,000 or more | 3 (0.9%) | 0 (0.0%) |
| Total | 319 (100.0%) | 45 (100.0%) |
Physical Housing Characteristics in Woodlawn Park
Housing Structures in Woodlawn Park
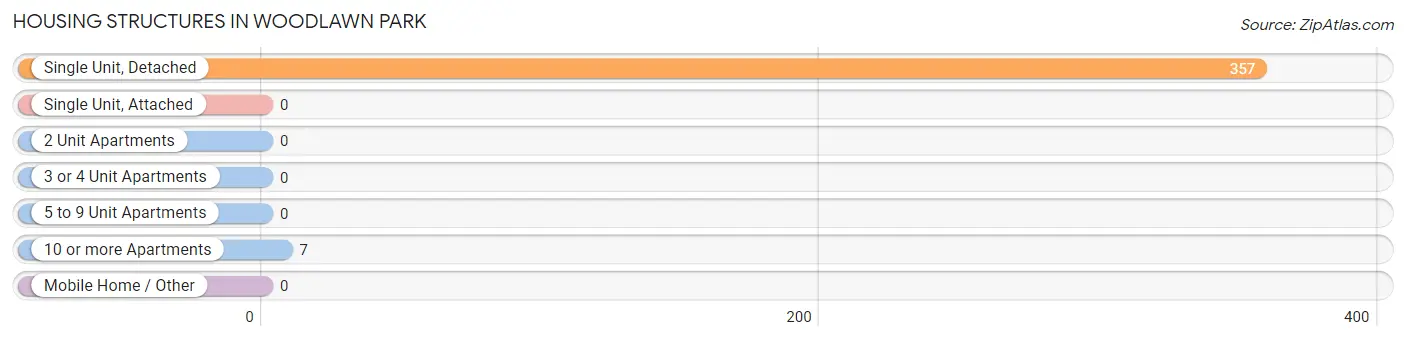
| Structure Type | # Housing Units | % Housing Units |
| Single Unit, Detached | 357 | 98.1% |
| Single Unit, Attached | 0 | 0.0% |
| 2 Unit Apartments | 0 | 0.0% |
| 3 or 4 Unit Apartments | 0 | 0.0% |
| 5 to 9 Unit Apartments | 0 | 0.0% |
| 10 or more Apartments | 7 | 1.9% |
| Mobile Home / Other | 0 | 0.0% |
| Total | 364 | 100.0% |
Housing Structures by Occupancy in Woodlawn Park
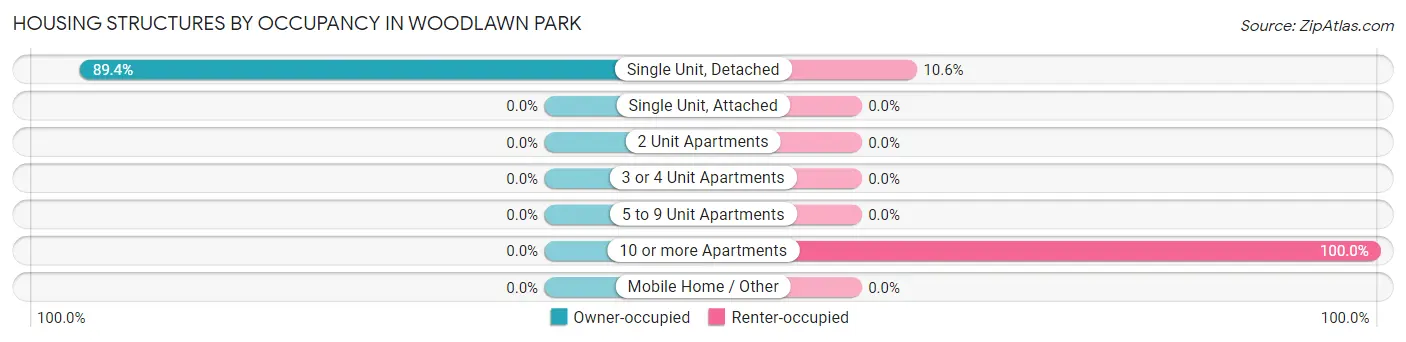
| Structure Type | Owner-occupied | Renter-occupied |
| Single Unit, Detached | 319 (89.4%) | 38 (10.6%) |
| Single Unit, Attached | 0 (0.0%) | 0 (0.0%) |
| 2 Unit Apartments | 0 (0.0%) | 0 (0.0%) |
| 3 or 4 Unit Apartments | 0 (0.0%) | 0 (0.0%) |
| 5 to 9 Unit Apartments | 0 (0.0%) | 0 (0.0%) |
| 10 or more Apartments | 0 (0.0%) | 7 (100.0%) |
| Mobile Home / Other | 0 (0.0%) | 0 (0.0%) |
| Total | 319 (87.6%) | 45 (12.4%) |
Housing Structures by Number of Rooms in Woodlawn Park
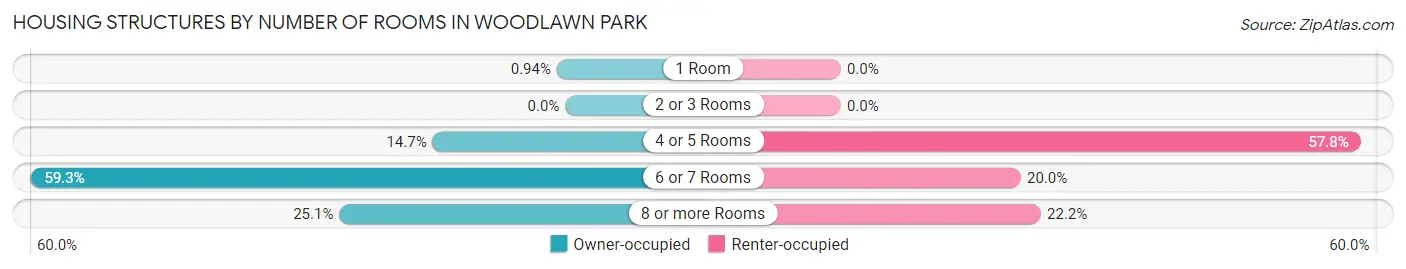
| Number of Rooms | Owner-occupied | Renter-occupied |
| 1 Room | 3 (0.9%) | 0 (0.0%) |
| 2 or 3 Rooms | 0 (0.0%) | 0 (0.0%) |
| 4 or 5 Rooms | 47 (14.7%) | 26 (57.8%) |
| 6 or 7 Rooms | 189 (59.3%) | 9 (20.0%) |
| 8 or more Rooms | 80 (25.1%) | 10 (22.2%) |
| Total | 319 (100.0%) | 45 (100.0%) |
Housing Structure by Heating Type in Woodlawn Park
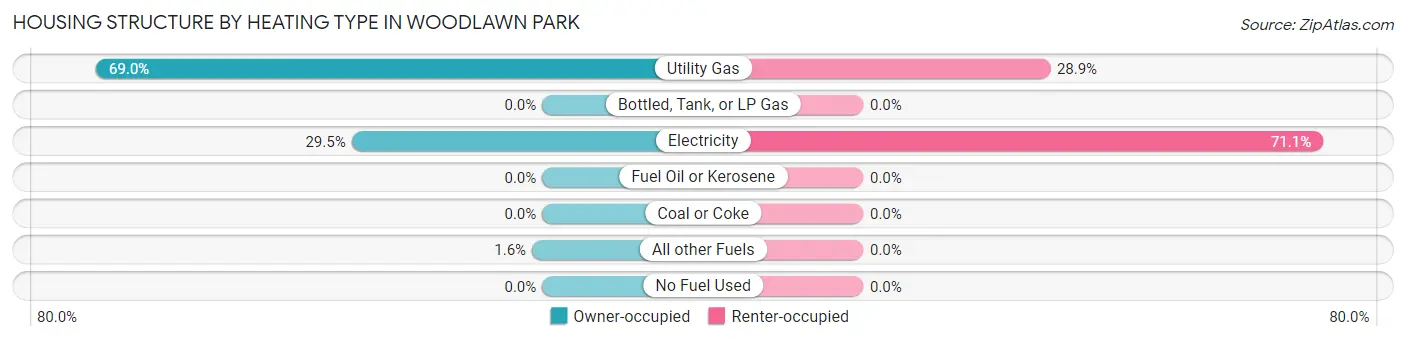
| Heating Type | Owner-occupied | Renter-occupied |
| Utility Gas | 220 (69.0%) | 13 (28.9%) |
| Bottled, Tank, or LP Gas | 0 (0.0%) | 0 (0.0%) |
| Electricity | 94 (29.5%) | 32 (71.1%) |
| Fuel Oil or Kerosene | 0 (0.0%) | 0 (0.0%) |
| Coal or Coke | 0 (0.0%) | 0 (0.0%) |
| All other Fuels | 5 (1.6%) | 0 (0.0%) |
| No Fuel Used | 0 (0.0%) | 0 (0.0%) |
| Total | 319 (100.0%) | 45 (100.0%) |
Household Vehicle Usage in Woodlawn Park
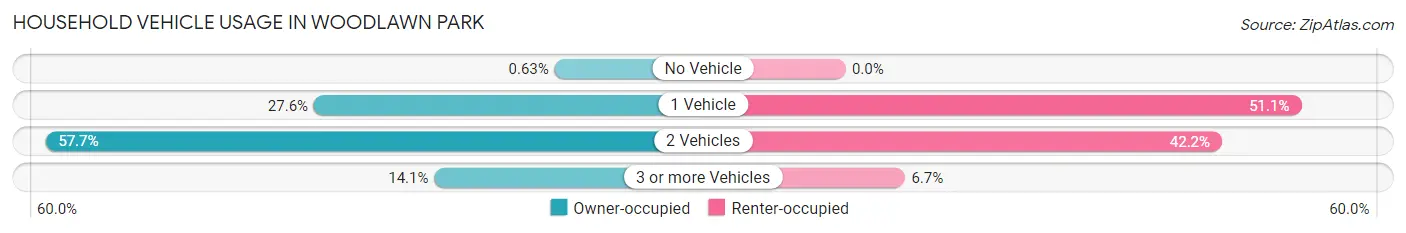
| Vehicles per Household | Owner-occupied | Renter-occupied |
| No Vehicle | 2 (0.6%) | 0 (0.0%) |
| 1 Vehicle | 88 (27.6%) | 23 (51.1%) |
| 2 Vehicles | 184 (57.7%) | 19 (42.2%) |
| 3 or more Vehicles | 45 (14.1%) | 3 (6.7%) |
| Total | 319 (100.0%) | 45 (100.0%) |
Real Estate & Mortgages in Woodlawn Park
Real Estate and Mortgage Overview in Woodlawn Park
| Characteristic | Without Mortgage | With Mortgage |
| Housing Units | 131 | 188 |
| Median Property Value | $240,200 | $286,700 |
| Median Household Income | $81,875 | $54 |
| Monthly Housing Costs | $598 | $3 |
| Real Estate Taxes | $2,228 | $0 |
Property Value by Mortgage Status in Woodlawn Park
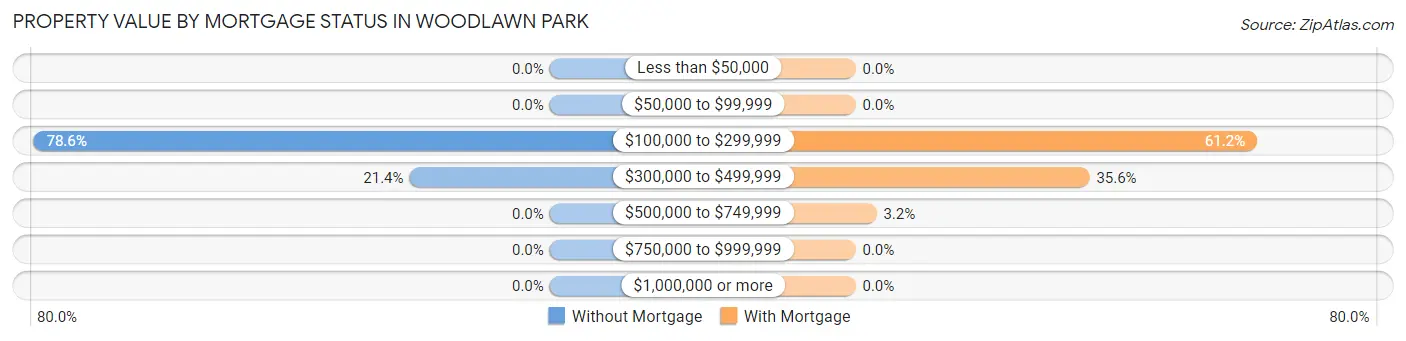
| Property Value | Without Mortgage | With Mortgage |
| Less than $50,000 | 0 (0.0%) | 0 (0.0%) |
| $50,000 to $99,999 | 0 (0.0%) | 0 (0.0%) |
| $100,000 to $299,999 | 103 (78.6%) | 115 (61.2%) |
| $300,000 to $499,999 | 28 (21.4%) | 67 (35.6%) |
| $500,000 to $749,999 | 0 (0.0%) | 6 (3.2%) |
| $750,000 to $999,999 | 0 (0.0%) | 0 (0.0%) |
| $1,000,000 or more | 0 (0.0%) | 0 (0.0%) |
| Total | 131 (100.0%) | 188 (100.0%) |
Household Income by Mortgage Status in Woodlawn Park
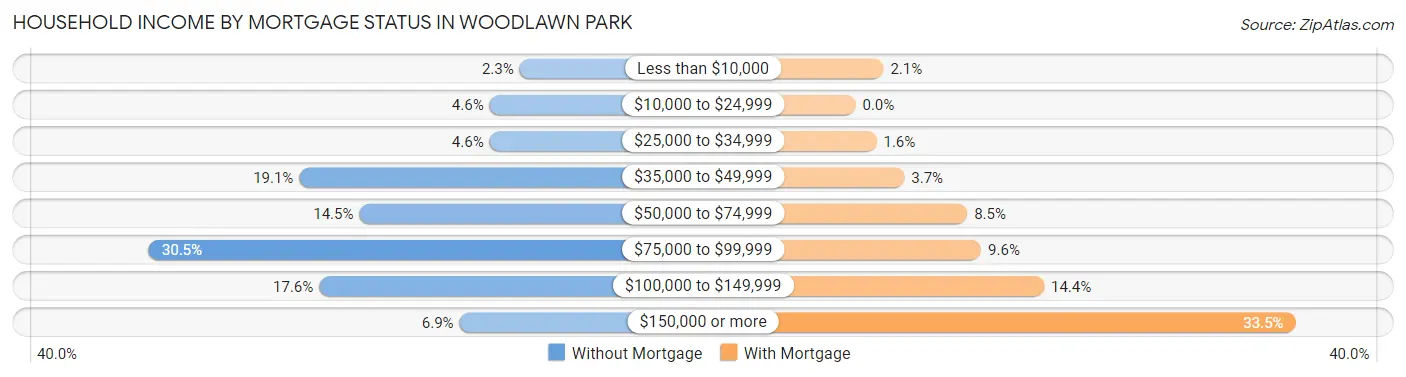
| Household Income | Without Mortgage | With Mortgage |
| Less than $10,000 | 3 (2.3%) | 4 (2.1%) |
| $10,000 to $24,999 | 6 (4.6%) | 0 (0.0%) |
| $25,000 to $34,999 | 6 (4.6%) | 3 (1.6%) |
| $35,000 to $49,999 | 25 (19.1%) | 7 (3.7%) |
| $50,000 to $74,999 | 19 (14.5%) | 16 (8.5%) |
| $75,000 to $99,999 | 40 (30.5%) | 18 (9.6%) |
| $100,000 to $149,999 | 23 (17.6%) | 27 (14.4%) |
| $150,000 or more | 9 (6.9%) | 63 (33.5%) |
| Total | 131 (100.0%) | 188 (100.0%) |
Property Value to Household Income Ratio in Woodlawn Park
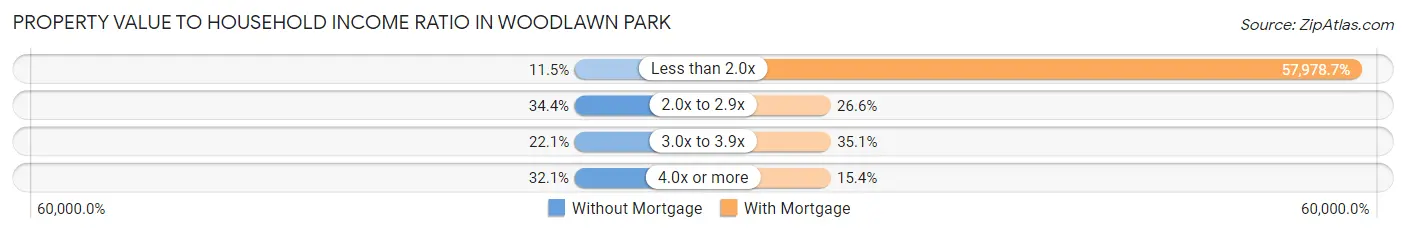
| Value-to-Income Ratio | Without Mortgage | With Mortgage |
| Less than 2.0x | 15 (11.5%) | 109,000 (57,978.7%) |
| 2.0x to 2.9x | 45 (34.4%) | 50 (26.6%) |
| 3.0x to 3.9x | 29 (22.1%) | 66 (35.1%) |
| 4.0x or more | 42 (32.1%) | 29 (15.4%) |
| Total | 131 (100.0%) | 188 (100.0%) |
Real Estate Taxes by Mortgage Status in Woodlawn Park
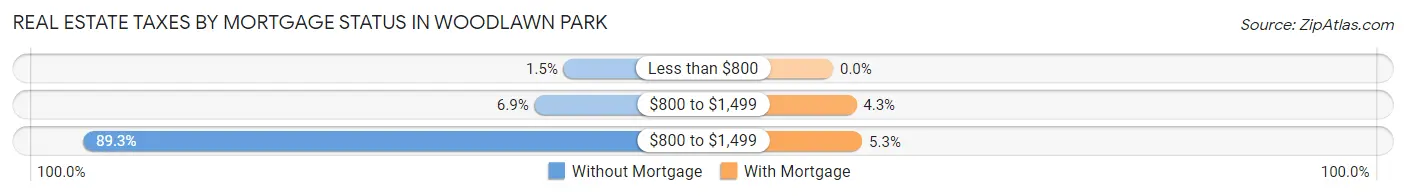
| Property Taxes | Without Mortgage | With Mortgage |
| Less than $800 | 2 (1.5%) | 0 (0.0%) |
| $800 to $1,499 | 9 (6.9%) | 8 (4.3%) |
| $800 to $1,499 | 117 (89.3%) | 10 (5.3%) |
| Total | 131 (100.0%) | 188 (100.0%) |
Health & Disability in Woodlawn Park
Health Insurance Coverage by Age in Woodlawn Park
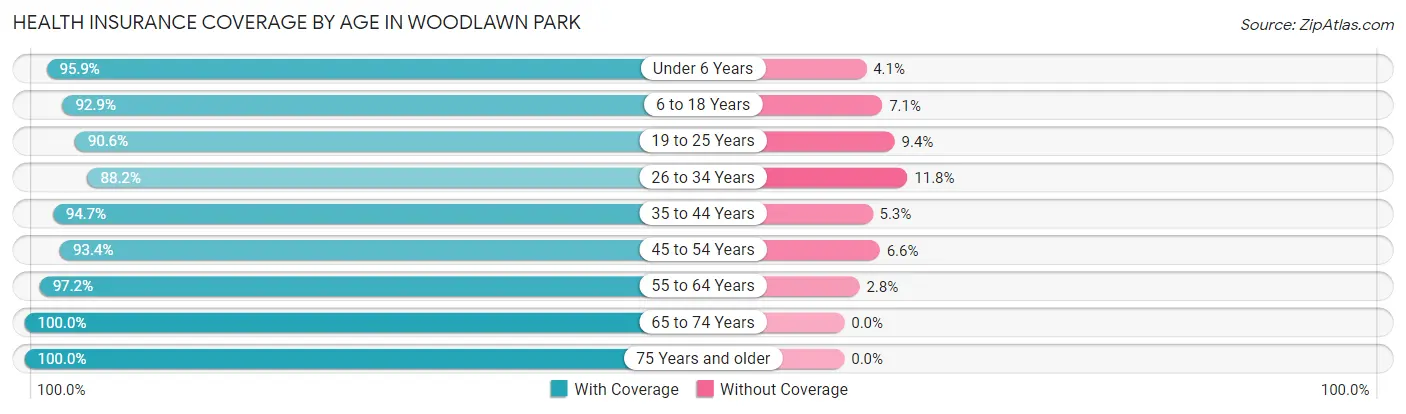
| Age Bracket | With Coverage | Without Coverage |
| Under 6 Years | 47 (95.9%) | 2 (4.1%) |
| 6 to 18 Years | 92 (92.9%) | 7 (7.1%) |
| 19 to 25 Years | 29 (90.6%) | 3 (9.4%) |
| 26 to 34 Years | 90 (88.2%) | 12 (11.8%) |
| 35 to 44 Years | 90 (94.7%) | 5 (5.3%) |
| 45 to 54 Years | 99 (93.4%) | 7 (6.6%) |
| 55 to 64 Years | 103 (97.2%) | 3 (2.8%) |
| 65 to 74 Years | 130 (100.0%) | 0 (0.0%) |
| 75 Years and older | 57 (100.0%) | 0 (0.0%) |
| Total | 737 (95.0%) | 39 (5.0%) |
Health Insurance Coverage by Citizenship Status in Woodlawn Park
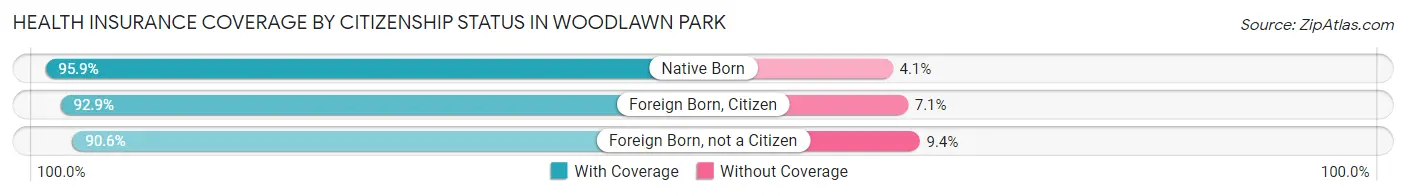
| Citizenship Status | With Coverage | Without Coverage |
| Native Born | 47 (95.9%) | 2 (4.1%) |
| Foreign Born, Citizen | 92 (92.9%) | 7 (7.1%) |
| Foreign Born, not a Citizen | 29 (90.6%) | 3 (9.4%) |
Health Insurance Coverage by Household Income in Woodlawn Park
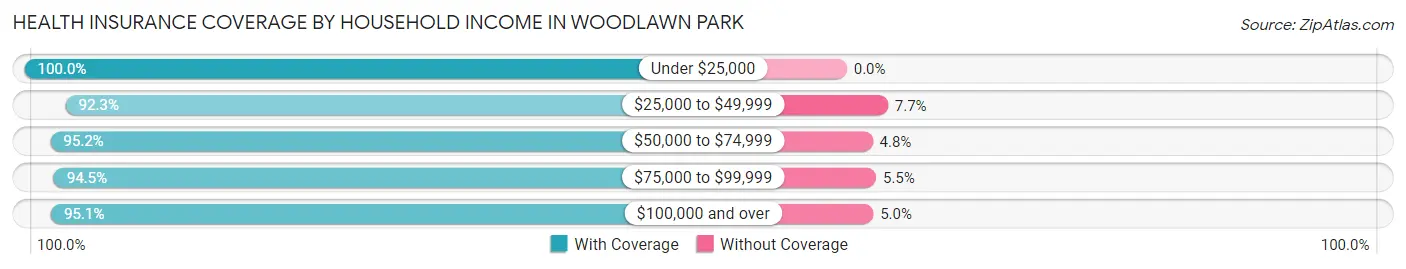
| Household Income | With Coverage | Without Coverage |
| Under $25,000 | 53 (100.0%) | 0 (0.0%) |
| $25,000 to $49,999 | 84 (92.3%) | 7 (7.7%) |
| $50,000 to $74,999 | 59 (95.2%) | 3 (4.8%) |
| $75,000 to $99,999 | 138 (94.5%) | 8 (5.5%) |
| $100,000 and over | 403 (95.1%) | 21 (5.0%) |
Public vs Private Health Insurance Coverage by Age in Woodlawn Park
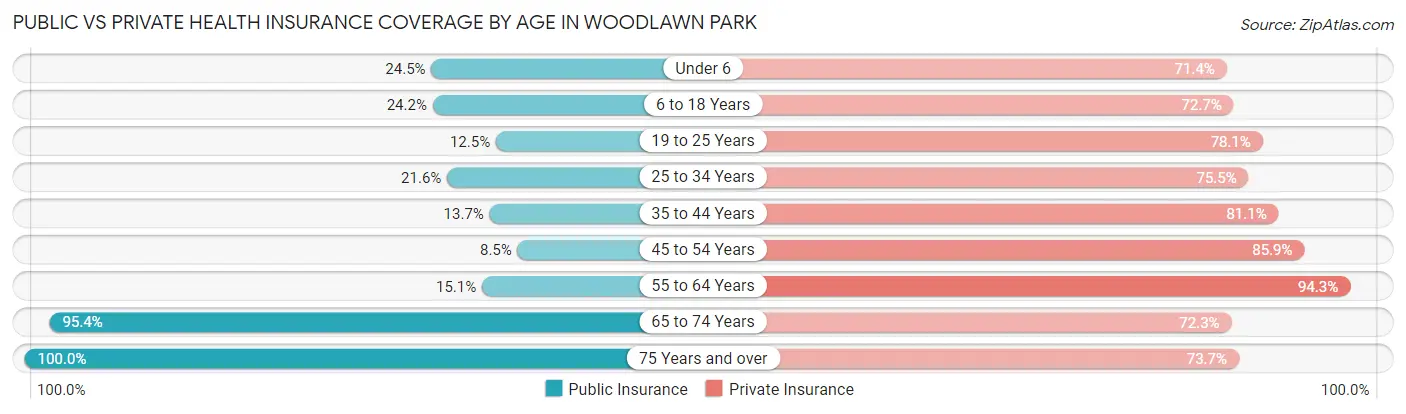
| Age Bracket | Public Insurance | Private Insurance |
| Under 6 | 12 (24.5%) | 35 (71.4%) |
| 6 to 18 Years | 24 (24.2%) | 72 (72.7%) |
| 19 to 25 Years | 4 (12.5%) | 25 (78.1%) |
| 25 to 34 Years | 22 (21.6%) | 77 (75.5%) |
| 35 to 44 Years | 13 (13.7%) | 77 (81.0%) |
| 45 to 54 Years | 9 (8.5%) | 91 (85.9%) |
| 55 to 64 Years | 16 (15.1%) | 100 (94.3%) |
| 65 to 74 Years | 124 (95.4%) | 94 (72.3%) |
| 75 Years and over | 57 (100.0%) | 42 (73.7%) |
| Total | 281 (36.2%) | 613 (79.0%) |
Disability Status by Sex by Age in Woodlawn Park
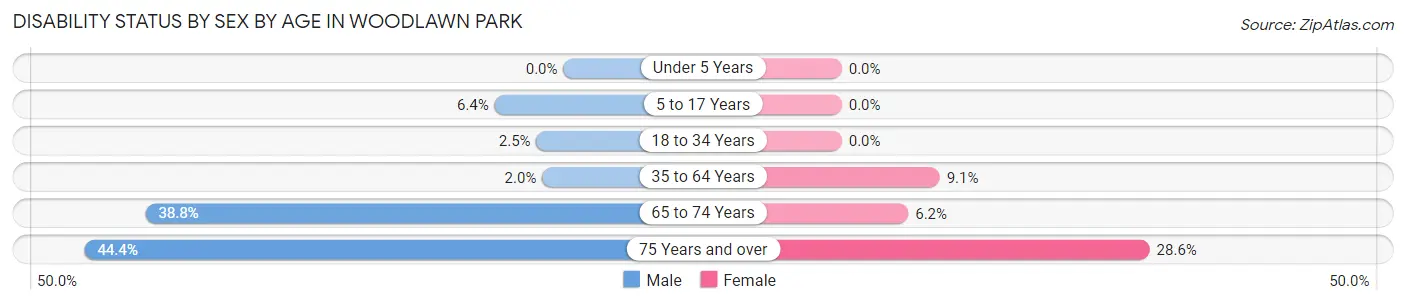
| Age Bracket | Male | Female |
| Under 5 Years | 0 (0.0%) | 0 (0.0%) |
| 5 to 17 Years | 3 (6.4%) | 0 (0.0%) |
| 18 to 34 Years | 2 (2.5%) | 0 (0.0%) |
| 35 to 64 Years | 3 (2.0%) | 14 (9.1%) |
| 65 to 74 Years | 19 (38.8%) | 5 (6.2%) |
| 75 Years and over | 16 (44.4%) | 6 (28.6%) |
Disability Class by Sex by Age in Woodlawn Park
Disability Class: Hearing Difficulty
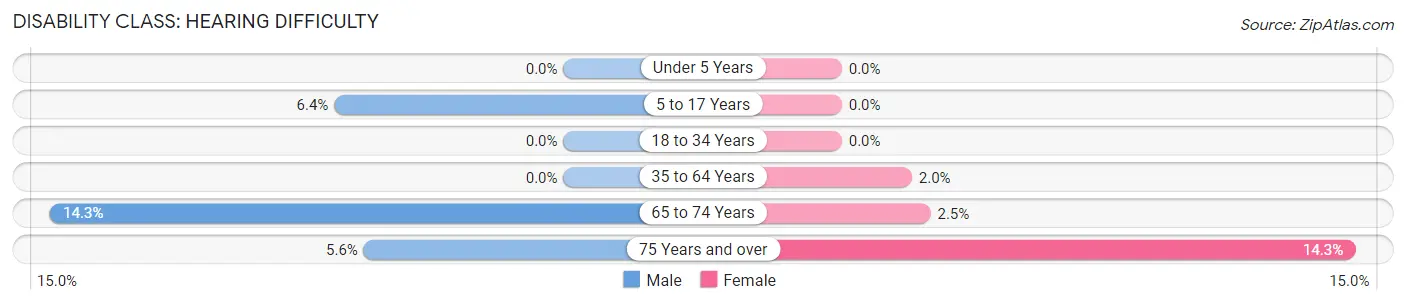
| Age Bracket | Male | Female |
| Under 5 Years | 0 (0.0%) | 0 (0.0%) |
| 5 to 17 Years | 3 (6.4%) | 0 (0.0%) |
| 18 to 34 Years | 0 (0.0%) | 0 (0.0%) |
| 35 to 64 Years | 0 (0.0%) | 3 (1.9%) |
| 65 to 74 Years | 7 (14.3%) | 2 (2.5%) |
| 75 Years and over | 2 (5.6%) | 3 (14.3%) |
Disability Class: Vision Difficulty
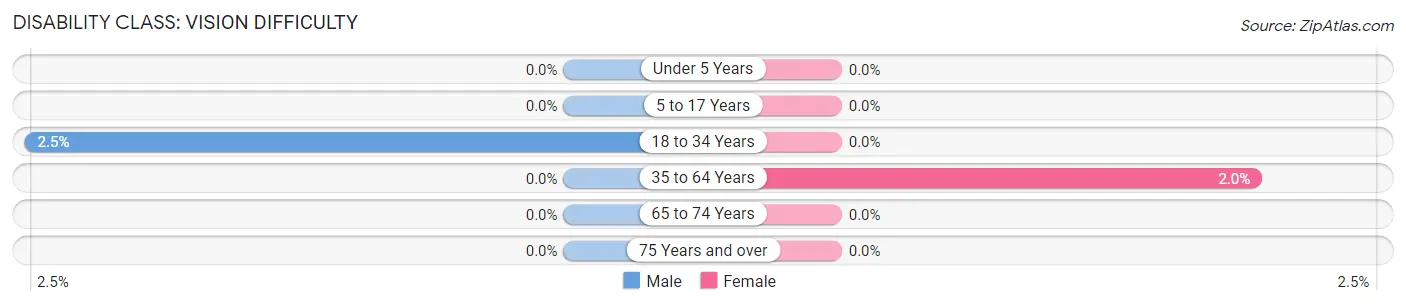
| Age Bracket | Male | Female |
| Under 5 Years | 0 (0.0%) | 0 (0.0%) |
| 5 to 17 Years | 0 (0.0%) | 0 (0.0%) |
| 18 to 34 Years | 2 (2.5%) | 0 (0.0%) |
| 35 to 64 Years | 0 (0.0%) | 3 (1.9%) |
| 65 to 74 Years | 0 (0.0%) | 0 (0.0%) |
| 75 Years and over | 0 (0.0%) | 0 (0.0%) |
Disability Class: Cognitive Difficulty
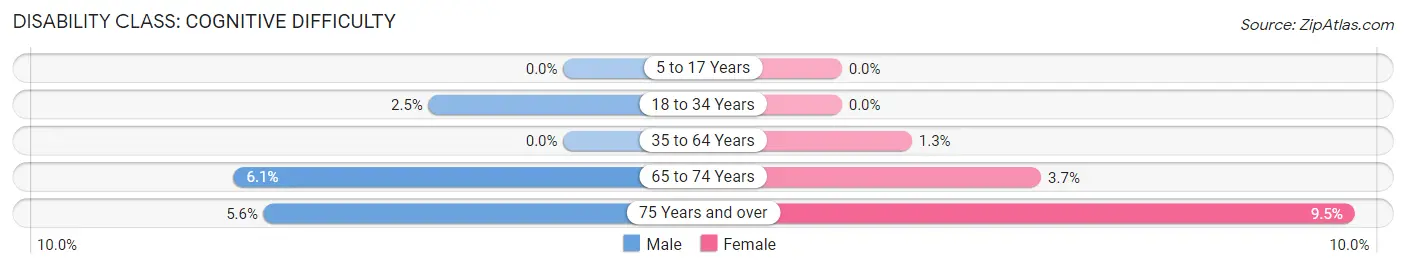
| Age Bracket | Male | Female |
| 5 to 17 Years | 0 (0.0%) | 0 (0.0%) |
| 18 to 34 Years | 2 (2.5%) | 0 (0.0%) |
| 35 to 64 Years | 0 (0.0%) | 2 (1.3%) |
| 65 to 74 Years | 3 (6.1%) | 3 (3.7%) |
| 75 Years and over | 2 (5.6%) | 2 (9.5%) |
Disability Class: Ambulatory Difficulty
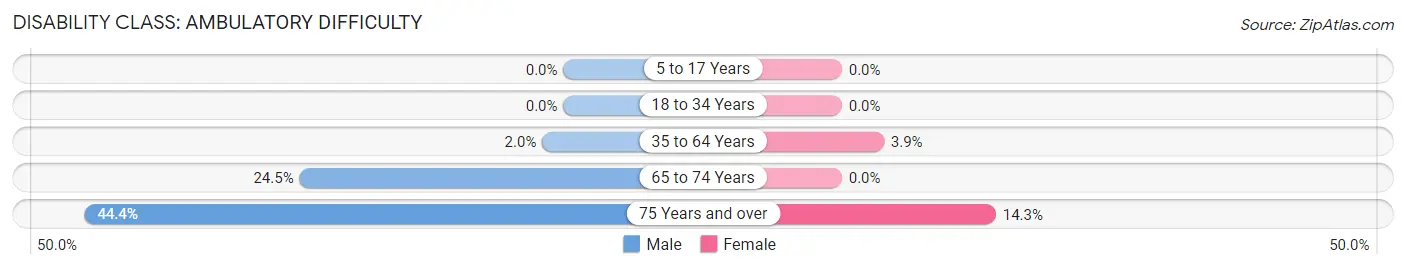
| Age Bracket | Male | Female |
| 5 to 17 Years | 0 (0.0%) | 0 (0.0%) |
| 18 to 34 Years | 0 (0.0%) | 0 (0.0%) |
| 35 to 64 Years | 3 (2.0%) | 6 (3.9%) |
| 65 to 74 Years | 12 (24.5%) | 0 (0.0%) |
| 75 Years and over | 16 (44.4%) | 3 (14.3%) |
Disability Class: Self-Care Difficulty
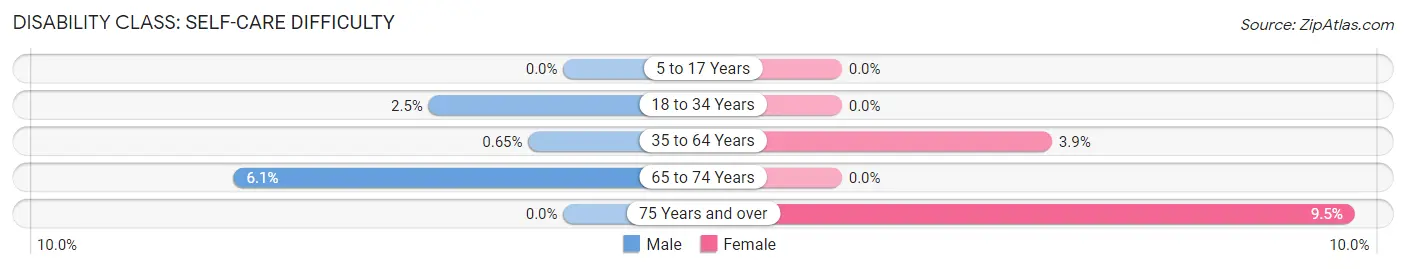
| Age Bracket | Male | Female |
| 5 to 17 Years | 0 (0.0%) | 0 (0.0%) |
| 18 to 34 Years | 2 (2.5%) | 0 (0.0%) |
| 35 to 64 Years | 1 (0.6%) | 6 (3.9%) |
| 65 to 74 Years | 3 (6.1%) | 0 (0.0%) |
| 75 Years and over | 0 (0.0%) | 2 (9.5%) |
Technology Access in Woodlawn Park
Computing Device Access in Woodlawn Park
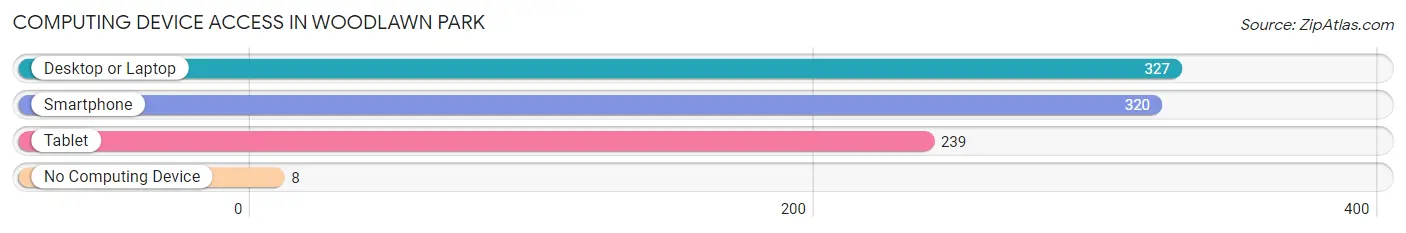
| Device Type | # Households | % Households |
| Desktop or Laptop | 327 | 89.8% |
| Smartphone | 320 | 87.9% |
| Tablet | 239 | 65.7% |
| No Computing Device | 8 | 2.2% |
| Total | 364 | 100.0% |
Internet Access in Woodlawn Park
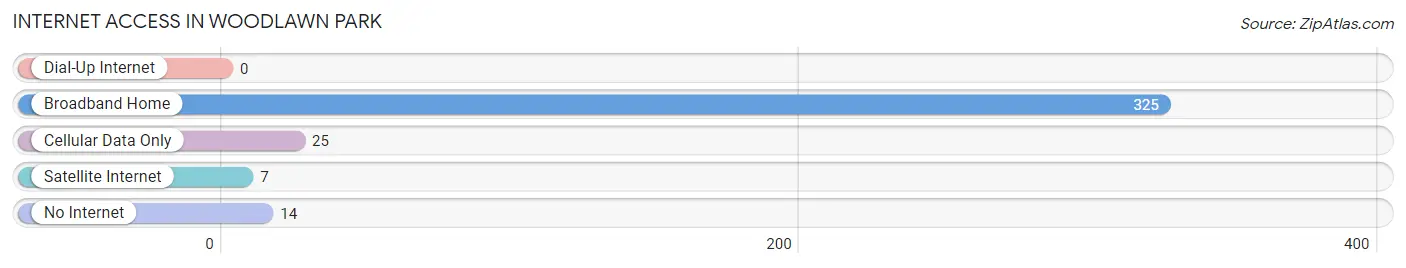
| Internet Type | # Households | % Households |
| Dial-Up Internet | 0 | 0.0% |
| Broadband Home | 325 | 89.3% |
| Cellular Data Only | 25 | 6.9% |
| Satellite Internet | 7 | 1.9% |
| No Internet | 14 | 3.8% |
| Total | 364 | 100.0% |
Woodlawn Park Summary
Woodlawn Park is a small unincorporated community located in Jefferson County, Kentucky. It is situated just south of the city of Louisville and is part of the Louisville Metro area. The community is bordered by the Ohio River to the north, the Watterson Expressway to the east, and the Louisville International Airport to the south.
History
Woodlawn Park was originally part of a large tract of land owned by the Wood family in the early 1800s. The family sold the land to the Louisville and Nashville Railroad in 1871, and the area was developed as a residential neighborhood. The area was annexed by the city of Louisville in 1874 and was known as Woodlawn Park.
The area was home to a variety of businesses, including a hotel, a grocery store, a post office, and a movie theater. The area was also home to a number of churches, including the Woodlawn Park Baptist Church, which was founded in 1876.
In the early 1900s, the area began to decline as the city of Louisville expanded and the population shifted to the suburbs. The area was further impacted by the construction of the Watterson Expressway in the 1950s, which cut through the neighborhood and caused the displacement of many residents.
Geography
Woodlawn Park is located in Jefferson County, Kentucky, just south of the city of Louisville. It is bordered by the Ohio River to the north, the Watterson Expressway to the east, and the Louisville International Airport to the south. The area is mostly flat, with some rolling hills in the northern part of the neighborhood.
Economy
Woodlawn Park is primarily a residential neighborhood, with few businesses or commercial establishments. The area is home to a number of churches, including the Woodlawn Park Baptist Church, which was founded in 1876.
Demographics
As of the 2010 census, the population of Woodlawn Park was 1,845. The racial makeup of the neighborhood was 79.3% White, 15.2% African American, 0.7% Asian, 0.2% Native American, and 4.6% from other races. The median household income was $37,941, and the median home value was $117,000.
Conclusion
Woodlawn Park is a small unincorporated community located in Jefferson County, Kentucky. It is situated just south of the city of Louisville and is part of the Louisville Metro area. The area was originally part of a large tract of land owned by the Wood family in the early 1800s, and was annexed by the city of Louisville in 1874. The area is primarily residential, with few businesses or commercial establishments. As of the 2010 census, the population of Woodlawn Park was 1,845, with a median household income of $37,941 and a median home value of $117,000.
Common Questions
What is Per Capita Income in Woodlawn Park?
Per Capita income in Woodlawn Park is $47,534.
What is the Median Family Income in Woodlawn Park?
Median Family Income in Woodlawn Park is $103,393.
What is the Median Household income in Woodlawn Park?
Median Household Income in Woodlawn Park is $95,455.
What is Income or Wage Gap in Woodlawn Park?
Income or Wage Gap in Woodlawn Park is 15.8%.
Women in Woodlawn Park earn 84.2 cents for every dollar earned by a man.
What is Inequality or Gini Index in Woodlawn Park?
Inequality or Gini Index in Woodlawn Park is 0.34.
What is the Total Population of Woodlawn Park?
Total Population of Woodlawn Park is 776.
What is the Total Male Population of Woodlawn Park?
Total Male Population of Woodlawn Park is 381.
What is the Total Female Population of Woodlawn Park?
Total Female Population of Woodlawn Park is 395.
What is the Ratio of Males per 100 Females in Woodlawn Park?
There are 96.46 Males per 100 Females in Woodlawn Park.
What is the Ratio of Females per 100 Males in Woodlawn Park?
There are 103.67 Females per 100 Males in Woodlawn Park.
What is the Median Population Age in Woodlawn Park?
Median Population Age in Woodlawn Park is 46.1 Years.
What is the Average Family Size in Woodlawn Park
Average Family Size in Woodlawn Park is 2.5 People.
What is the Average Household Size in Woodlawn Park
Average Household Size in Woodlawn Park is 2.1 People.
How Large is the Labor Force in Woodlawn Park?
There are 425 People in the Labor Forcein in Woodlawn Park.
What is the Percentage of People in the Labor Force in Woodlawn Park?
66.2% of People are in the Labor Force in Woodlawn Park.
What is the Unemployment Rate in Woodlawn Park?
Unemployment Rate in Woodlawn Park is 3.8%.