Hickman, KY Map & Demographics
Hickman Map
Hickman Overview
$18,976
PER CAPITA INCOME
$57,813
AVG FAMILY INCOME
$31,000
AVG HOUSEHOLD INCOME
13.1%
WAGE / INCOME GAP [ % ]
86.9¢/ $1
WAGE / INCOME GAP [ $ ]
0.49
INEQUALITY / GINI INDEX
1,884
TOTAL POPULATION
1,194
MALE POPULATION
690
FEMALE POPULATION
173.04
MALES / 100 FEMALES
57.79
FEMALES / 100 MALES
42.8
MEDIAN AGE
3.9
AVG FAMILY SIZE
2.3
AVG HOUSEHOLD SIZE
559
LABOR FORCE [ PEOPLE ]
33.1%
PERCENT IN LABOR FORCE
4.9%
UNEMPLOYMENT RATE
Hickman Zip Codes
Hickman Area Codes
Income in Hickman
Income Overview in Hickman
Per Capita Income in Hickman is $18,976, while median incomes of families and households are $57,813 and $31,000 respectively.
| Characteristic | Number | Measure |
| Per Capita Income | 1,884 | $18,976 |
| Median Family Income | 241 | $57,813 |
| Mean Family Income | 241 | $67,023 |
| Median Household Income | 630 | $31,000 |
| Mean Household Income | 630 | $40,003 |
| Income Deficit | 241 | $0 |
| Wage / Income Gap (%) | 1,884 | 13.10% |
| Wage / Income Gap ($) | 1,884 | 86.90¢ per $1 |
| Gini / Inequality Index | 1,884 | 0.49 |
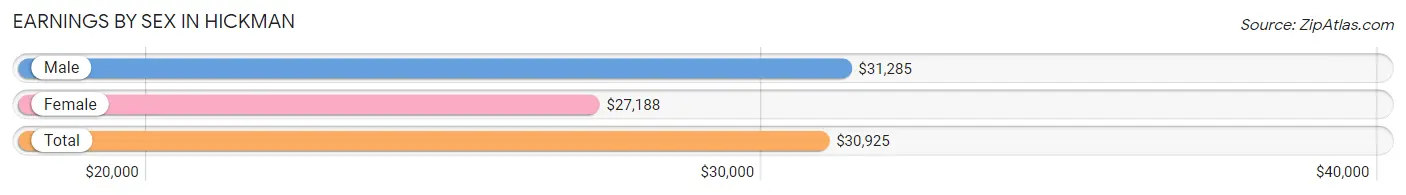
Earnings by Sex in Hickman
Average Earnings in Hickman are $30,925, $31,285 for men and $27,188 for women, a difference of 13.1%.
| Sex | Number | Average Earnings |
| Male | 546 (69.2%) | $31,285 |
| Female | 243 (30.8%) | $27,188 |
| Total | 789 (100.0%) | $30,925 |
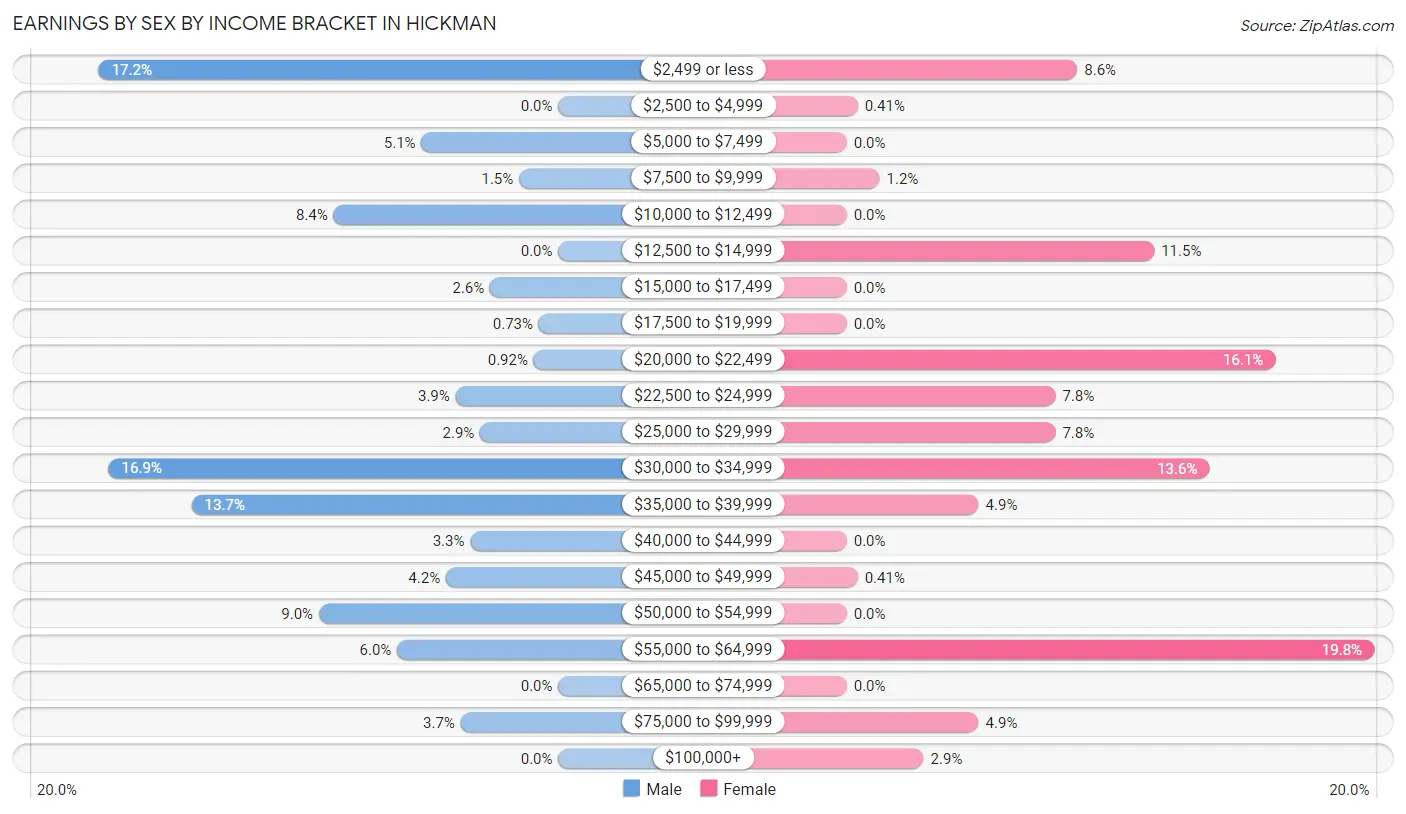
Earnings by Sex by Income Bracket in Hickman
The most common earnings brackets in Hickman are $2,499 or less for men (94 | 17.2%) and $55,000 to $64,999 for women (48 | 19.8%).
| Income | Male | Female |
| $2,499 or less | 94 (17.2%) | 21 (8.6%) |
| $2,500 to $4,999 | 0 (0.0%) | 1 (0.4%) |
| $5,000 to $7,499 | 28 (5.1%) | 0 (0.0%) |
| $7,500 to $9,999 | 8 (1.5%) | 3 (1.2%) |
| $10,000 to $12,499 | 46 (8.4%) | 0 (0.0%) |
| $12,500 to $14,999 | 0 (0.0%) | 28 (11.5%) |
| $15,000 to $17,499 | 14 (2.6%) | 0 (0.0%) |
| $17,500 to $19,999 | 4 (0.7%) | 0 (0.0%) |
| $20,000 to $22,499 | 5 (0.9%) | 39 (16.1%) |
| $22,500 to $24,999 | 21 (3.8%) | 19 (7.8%) |
| $25,000 to $29,999 | 16 (2.9%) | 19 (7.8%) |
| $30,000 to $34,999 | 92 (16.9%) | 33 (13.6%) |
| $35,000 to $39,999 | 75 (13.7%) | 12 (4.9%) |
| $40,000 to $44,999 | 18 (3.3%) | 0 (0.0%) |
| $45,000 to $49,999 | 23 (4.2%) | 1 (0.4%) |
| $50,000 to $54,999 | 49 (9.0%) | 0 (0.0%) |
| $55,000 to $64,999 | 33 (6.0%) | 48 (19.8%) |
| $65,000 to $74,999 | 0 (0.0%) | 0 (0.0%) |
| $75,000 to $99,999 | 20 (3.7%) | 12 (4.9%) |
| $100,000+ | 0 (0.0%) | 7 (2.9%) |
| Total | 546 (100.0%) | 243 (100.0%) |
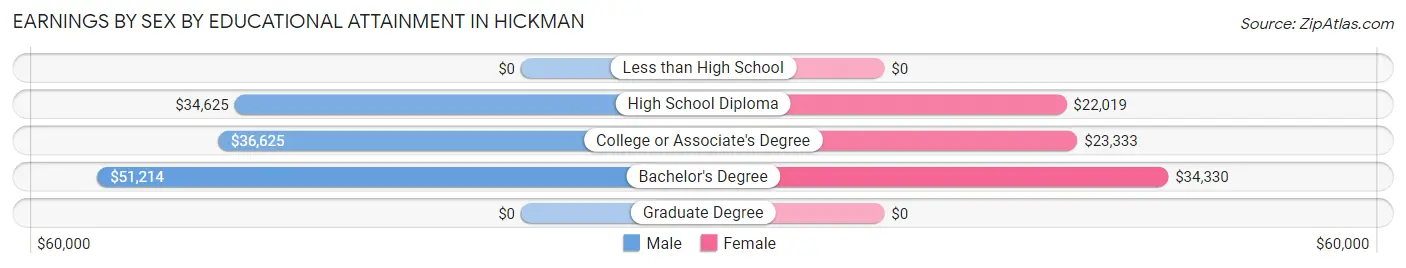
Earnings by Sex by Educational Attainment in Hickman
Average earnings in Hickman are $35,850 for men and $24,342 for women, a difference of 32.1%. Men with an educational attainment of bachelor's degree enjoy the highest average annual earnings of $51,214, while those with high school diploma education earn the least with $34,625. Women with an educational attainment of bachelor's degree earn the most with the average annual earnings of $34,330, while those with high school diploma education have the smallest earnings of $22,019.
| Educational Attainment | Male Income | Female Income |
| Less than High School | - | - |
| High School Diploma | $34,625 | $22,019 |
| College or Associate's Degree | $36,625 | $23,333 |
| Bachelor's Degree | $51,214 | $34,330 |
| Graduate Degree | - | - |
| Total | $35,850 | $24,342 |
Family Income in Hickman
Family Income Brackets in Hickman
According to the Hickman family income data, there are 52 families falling into the $50,000 to $74,999 income range, which is the most common income bracket and makes up 21.6% of all families.
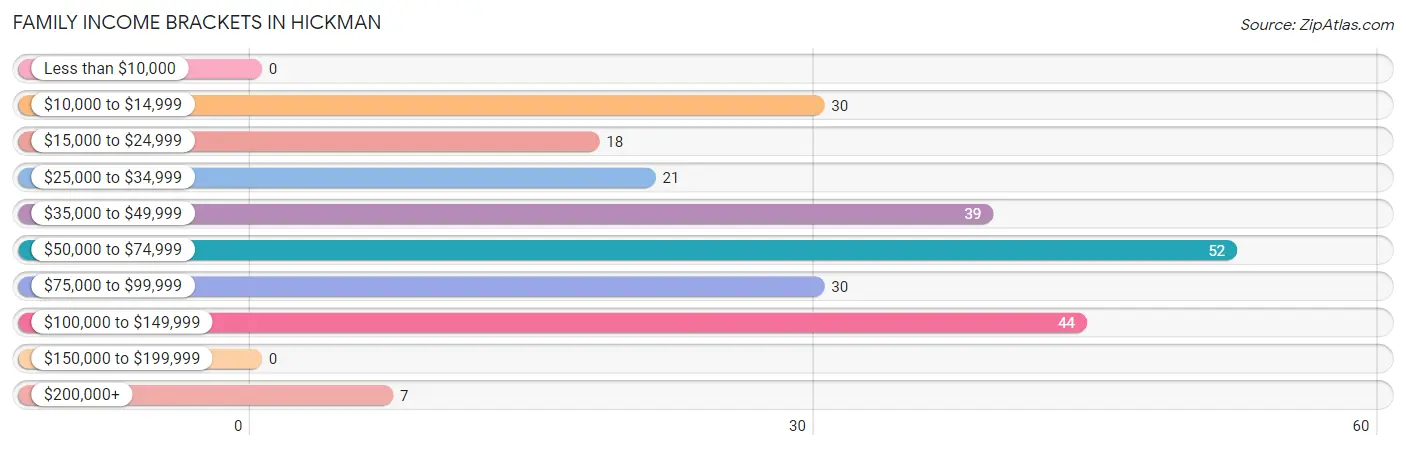
| Income Bracket | # Families | % Families |
| Less than $10,000 | 0 | 0.0% |
| $10,000 to $14,999 | 30 | 12.4% |
| $15,000 to $24,999 | 18 | 7.5% |
| $25,000 to $34,999 | 21 | 8.7% |
| $35,000 to $49,999 | 39 | 16.2% |
| $50,000 to $74,999 | 52 | 21.6% |
| $75,000 to $99,999 | 30 | 12.4% |
| $100,000 to $149,999 | 44 | 18.3% |
| $150,000 to $199,999 | 0 | 0.0% |
| $200,000+ | 7 | 2.9% |
Family Income by Famaliy Size in Hickman
2-person families (133 | 55.2%) account for the highest median family income in Hickman with $51,354 per family, while 2-person families (133 | 55.2%) have the highest median income of $25,677 per family member.
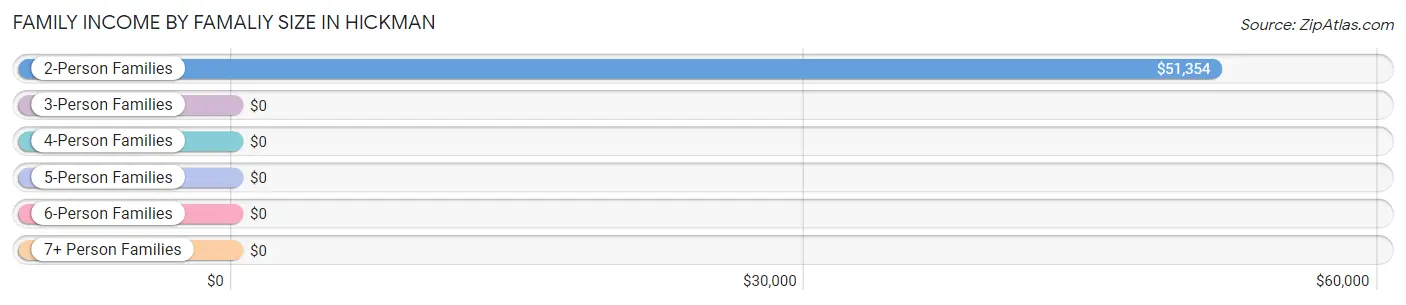
| Income Bracket | # Families | Median Income |
| 2-Person Families | 133 (55.2%) | $51,354 |
| 3-Person Families | 76 (31.5%) | $0 |
| 4-Person Families | 15 (6.2%) | $0 |
| 5-Person Families | 7 (2.9%) | $0 |
| 6-Person Families | 10 (4.2%) | $0 |
| 7+ Person Families | 0 (0.0%) | $0 |
| Total | 241 (100.0%) | $57,813 |
Family Income by Number of Earners in Hickman
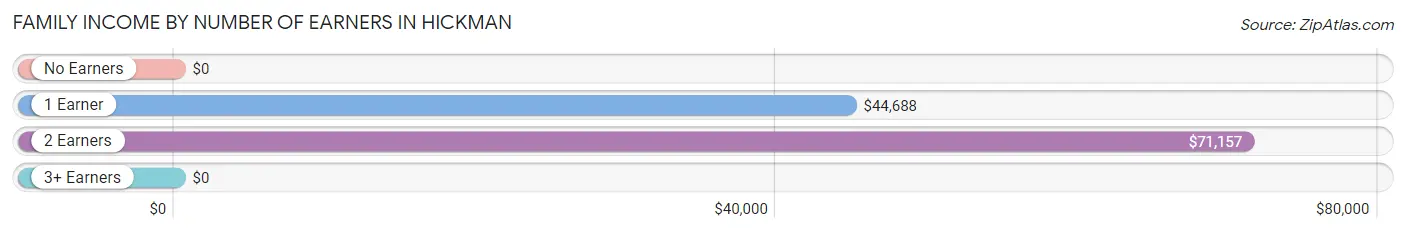
| Number of Earners | # Families | Median Income |
| No Earners | 78 (32.4%) | $0 |
| 1 Earner | 94 (39.0%) | $44,688 |
| 2 Earners | 51 (21.2%) | $71,157 |
| 3+ Earners | 18 (7.5%) | $0 |
| Total | 241 (100.0%) | $57,813 |
Household Income in Hickman
Household Income Brackets in Hickman
With 190 households falling in the category, the $10,000 to $14,999 income range is the most frequent in Hickman, accounting for 30.2% of all households.
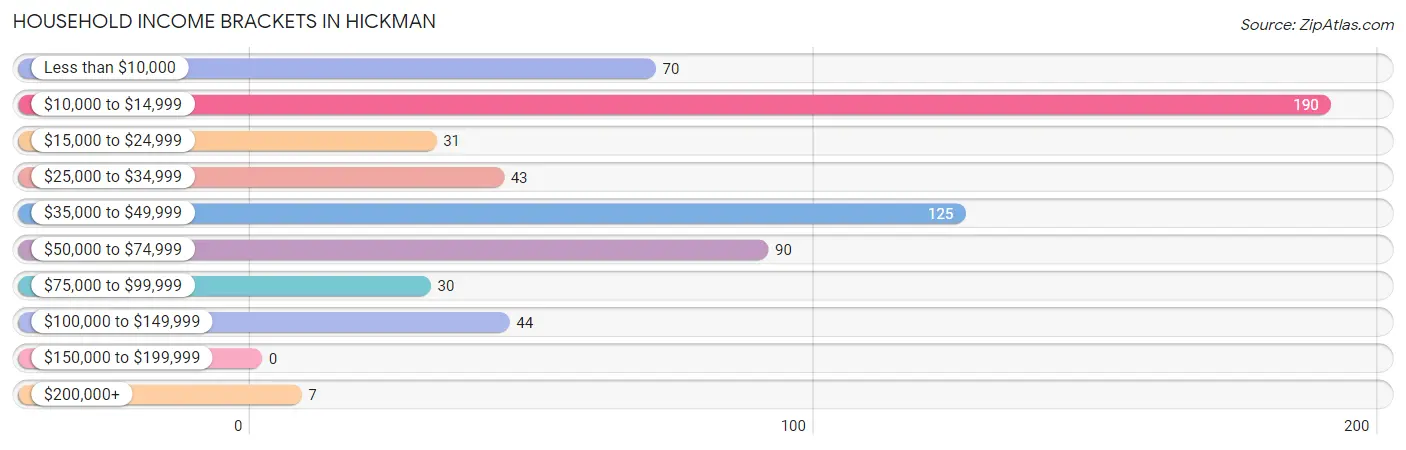
| Income Bracket | # Households | % Households |
| Less than $10,000 | 70 | 11.1% |
| $10,000 to $14,999 | 190 | 30.2% |
| $15,000 to $24,999 | 31 | 4.9% |
| $25,000 to $34,999 | 43 | 6.8% |
| $35,000 to $49,999 | 125 | 19.8% |
| $50,000 to $74,999 | 90 | 14.3% |
| $75,000 to $99,999 | 30 | 4.8% |
| $100,000 to $149,999 | 44 | 7.0% |
| $150,000 to $199,999 | 0 | 0.0% |
| $200,000+ | 7 | 1.1% |
Household Income by Householder Age in Hickman
The median household income in Hickman is $31,000, with the highest median household income of $38,690 found in the 65+ years age bracket for the primary householder. A total of 168 households (26.7%) fall into this category. Meanwhile, the 15 to 24 years age bracket for the primary householder has the lowest median household income of $0, with 27 households (4.3%) in this group.
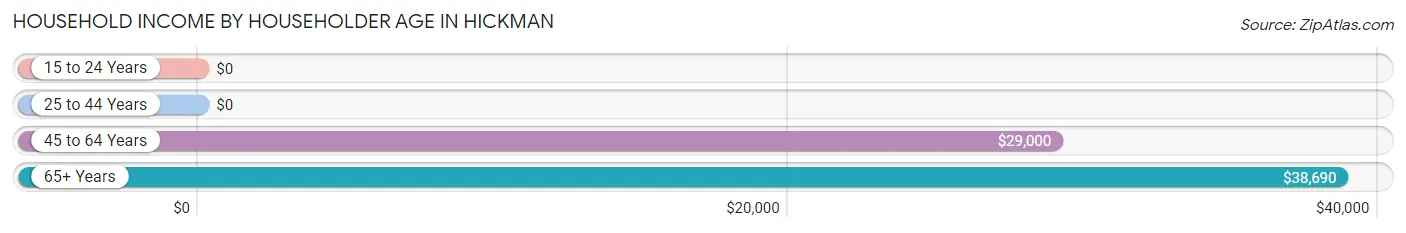
| Income Bracket | # Households | Median Income |
| 15 to 24 Years | 27 (4.3%) | $0 |
| 25 to 44 Years | 119 (18.9%) | $0 |
| 45 to 64 Years | 316 (50.2%) | $29,000 |
| 65+ Years | 168 (26.7%) | $38,690 |
| Total | 630 (100.0%) | $31,000 |
Poverty in Hickman
Income Below Poverty by Sex and Age in Hickman
With 29.0% poverty level for males and 36.2% for females among the residents of Hickman, 35 to 44 year old males and 75 year old and over females are the most vulnerable to poverty, with 32 males (86.5%) and 46 females (69.7%) in their respective age groups living below the poverty level.
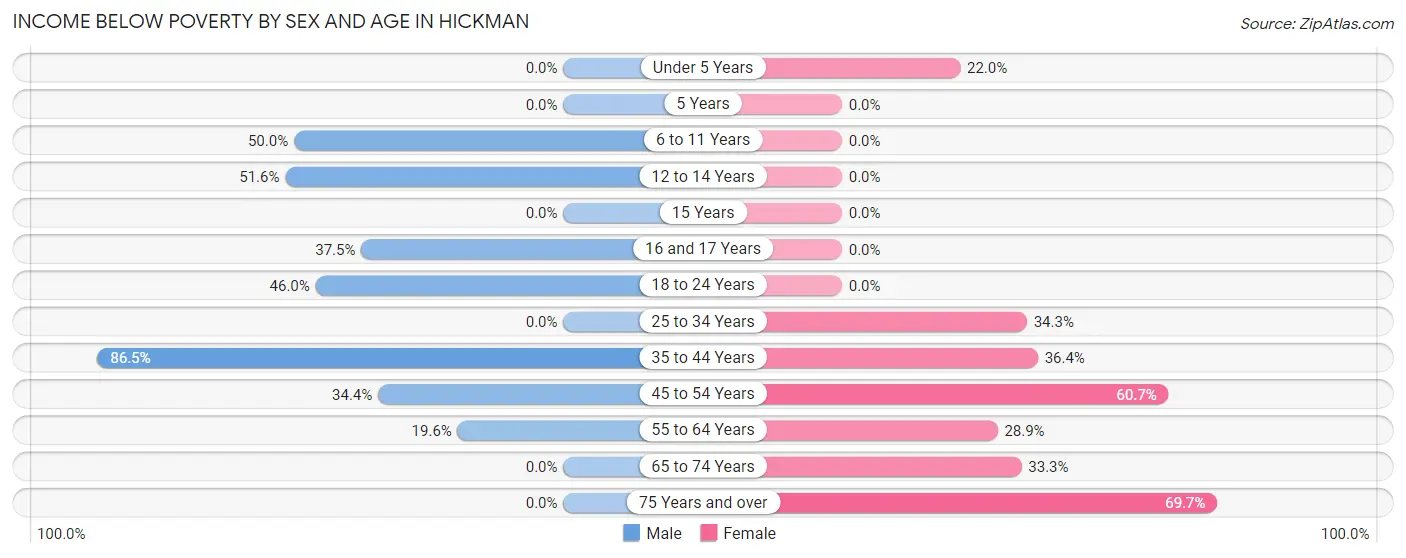
| Age Bracket | Male | Female |
| Under 5 Years | 0 (0.0%) | 9 (22.0%) |
| 5 Years | 0 (0.0%) | 0 (0.0%) |
| 6 to 11 Years | 35 (50.0%) | 0 (0.0%) |
| 12 to 14 Years | 16 (51.6%) | 0 (0.0%) |
| 15 Years | 0 (0.0%) | 0 (0.0%) |
| 16 and 17 Years | 6 (37.5%) | 0 (0.0%) |
| 18 to 24 Years | 80 (46.0%) | 0 (0.0%) |
| 25 to 34 Years | 0 (0.0%) | 23 (34.3%) |
| 35 to 44 Years | 32 (86.5%) | 24 (36.4%) |
| 45 to 54 Years | 22 (34.4%) | 74 (60.7%) |
| 55 to 64 Years | 41 (19.6%) | 26 (28.9%) |
| 65 to 74 Years | 0 (0.0%) | 37 (33.3%) |
| 75 Years and over | 0 (0.0%) | 46 (69.7%) |
| Total | 232 (29.0%) | 239 (36.2%) |
Income Above Poverty by Sex and Age in Hickman
According to the poverty statistics in Hickman, males aged under 5 years and females aged 5 years are the age groups that are most secure financially, with 100.0% of males and 100.0% of females in these age groups living above the poverty line.
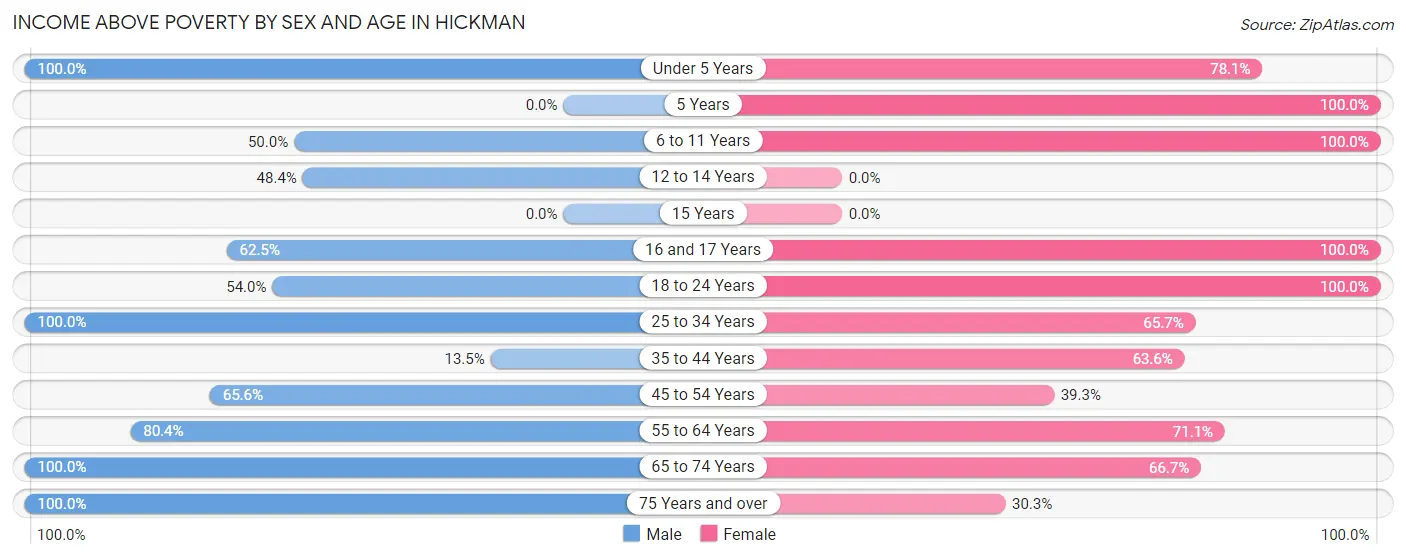
| Age Bracket | Male | Female |
| Under 5 Years | 22 (100.0%) | 32 (78.0%) |
| 5 Years | 0 (0.0%) | 23 (100.0%) |
| 6 to 11 Years | 35 (50.0%) | 8 (100.0%) |
| 12 to 14 Years | 15 (48.4%) | 0 (0.0%) |
| 15 Years | 0 (0.0%) | 0 (0.0%) |
| 16 and 17 Years | 10 (62.5%) | 23 (100.0%) |
| 18 to 24 Years | 94 (54.0%) | 43 (100.0%) |
| 25 to 34 Years | 80 (100.0%) | 44 (65.7%) |
| 35 to 44 Years | 5 (13.5%) | 42 (63.6%) |
| 45 to 54 Years | 42 (65.6%) | 48 (39.3%) |
| 55 to 64 Years | 168 (80.4%) | 64 (71.1%) |
| 65 to 74 Years | 83 (100.0%) | 74 (66.7%) |
| 75 Years and over | 13 (100.0%) | 20 (30.3%) |
| Total | 567 (71.0%) | 421 (63.8%) |
Income Below Poverty Among Married-Couple Families in Hickman
The poverty statistics for married-couple families in Hickman show that 6.7% or 11 of the total 165 families live below the poverty line. Families with no children have the highest poverty rate of 8.8%, comprising of 11 families. On the other hand, families with 1 or 2 children have the lowest poverty rate of 0.0%, which includes 0 families.
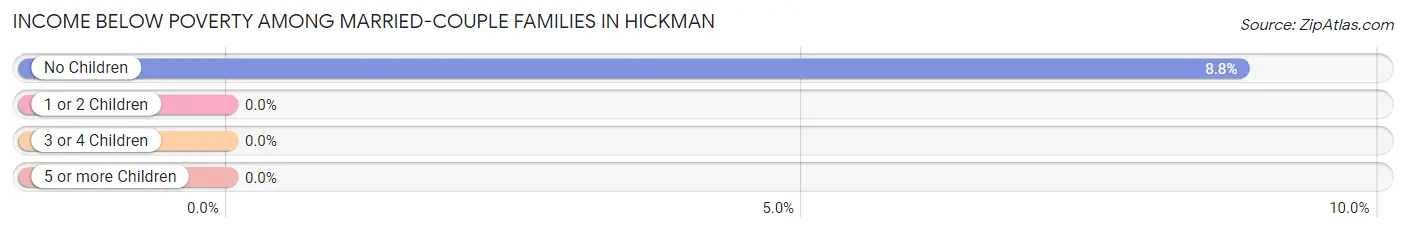
| Children | Above Poverty | Below Poverty |
| No Children | 114 (91.2%) | 11 (8.8%) |
| 1 or 2 Children | 23 (100.0%) | 0 (0.0%) |
| 3 or 4 Children | 17 (100.0%) | 0 (0.0%) |
| 5 or more Children | 0 (0.0%) | 0 (0.0%) |
| Total | 154 (93.3%) | 11 (6.7%) |
Income Below Poverty Among Single-Parent Households in Hickman
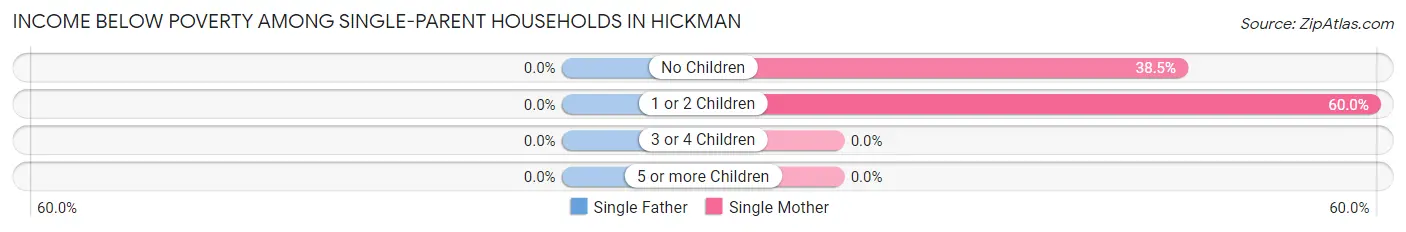
| Children | Single Father | Single Mother |
| No Children | 0 (0.0%) | 10 (38.5%) |
| 1 or 2 Children | 0 (0.0%) | 27 (60.0%) |
| 3 or 4 Children | 0 (0.0%) | 0 (0.0%) |
| 5 or more Children | 0 (0.0%) | 0 (0.0%) |
| Total | 0 (0.0%) | 37 (48.7%) |
Income Below Poverty Among Married-Couple vs Single-Parent Households in Hickman
The poverty data for Hickman shows that 11 of the married-couple family households (6.7%) and 37 of the single-parent households (48.7%) are living below the poverty level. Within the married-couple family households, those with no children have the highest poverty rate, with 11 households (8.8%) falling below the poverty line. Among the single-parent households, those with 1 or 2 children have the highest poverty rate, with 27 household (60.0%) living below poverty.
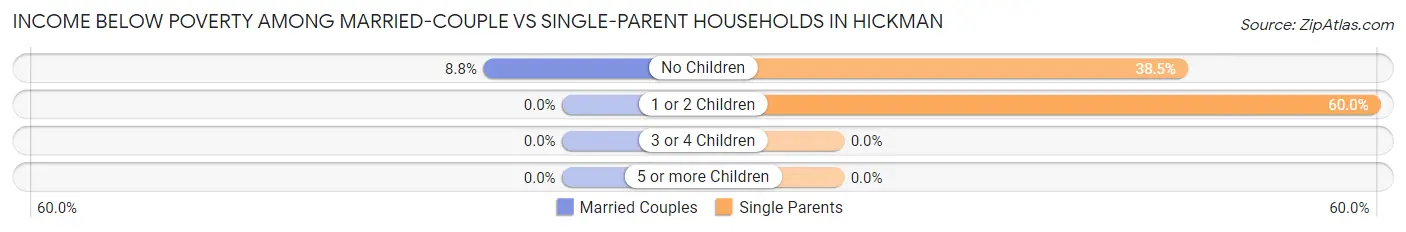
| Children | Married-Couple Families | Single-Parent Households |
| No Children | 11 (8.8%) | 10 (38.5%) |
| 1 or 2 Children | 0 (0.0%) | 27 (60.0%) |
| 3 or 4 Children | 0 (0.0%) | 0 (0.0%) |
| 5 or more Children | 0 (0.0%) | 0 (0.0%) |
| Total | 11 (6.7%) | 37 (48.7%) |
Race in Hickman
The most populous races in Hickman are White / Caucasian (1,214 | 64.4%), Black / African American (660 | 35.0%), and Hispanic or Latino (11 | 0.6%).
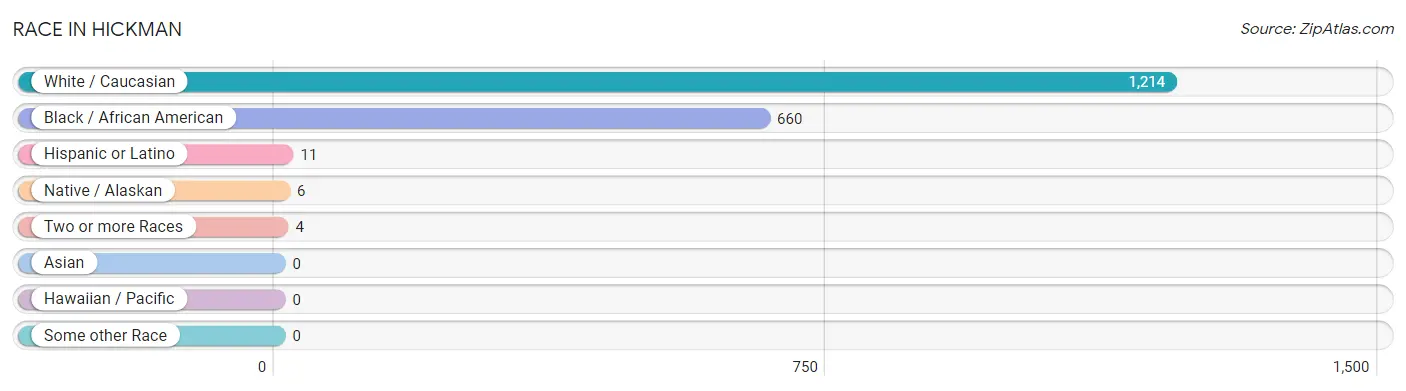
| Race | # Population | % Population |
| Asian | 0 | 0.0% |
| Black / African American | 660 | 35.0% |
| Hawaiian / Pacific | 0 | 0.0% |
| Hispanic or Latino | 11 | 0.6% |
| Native / Alaskan | 6 | 0.3% |
| White / Caucasian | 1,214 | 64.4% |
| Two or more Races | 4 | 0.2% |
| Some other Race | 0 | 0.0% |
| Total | 1,884 | 100.0% |
Ancestry in Hickman
The most populous ancestries reported in Hickman are American (489 | 26.0%), English (446 | 23.7%), German (99 | 5.2%), African (91 | 4.8%), and Subsaharan African (91 | 4.8%), together accounting for 64.5% of all Hickman residents.
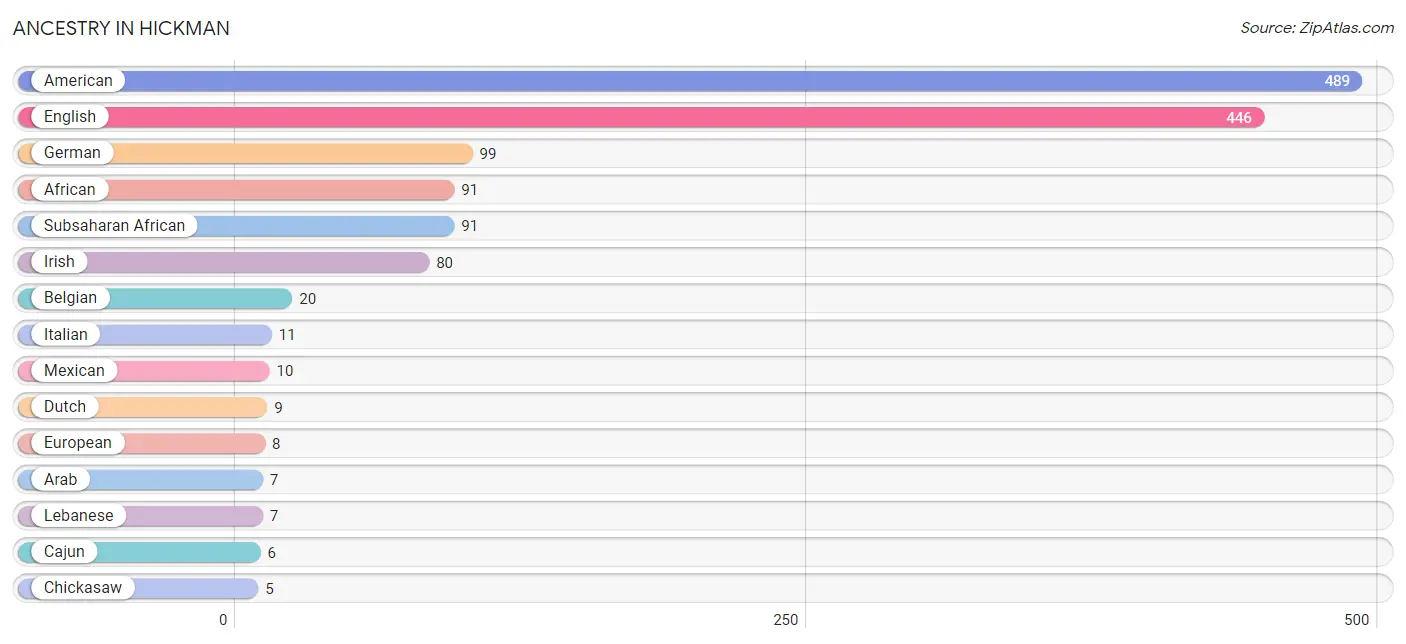
| Ancestry | # Population | % Population |
| African | 91 | 4.8% |
| American | 489 | 26.0% |
| Arab | 7 | 0.4% |
| Belgian | 20 | 1.1% |
| Blackfeet | 2 | 0.1% |
| Cajun | 6 | 0.3% |
| Cherokee | 1 | 0.1% |
| Chickasaw | 5 | 0.3% |
| Creek | 1 | 0.1% |
| Dutch | 9 | 0.5% |
| English | 446 | 23.7% |
| European | 8 | 0.4% |
| French | 3 | 0.2% |
| German | 99 | 5.2% |
| Irish | 80 | 4.3% |
| Italian | 11 | 0.6% |
| Lebanese | 7 | 0.4% |
| Mexican | 10 | 0.5% |
| Northern European | 1 | 0.1% |
| Scandinavian | 4 | 0.2% |
| South American | 1 | 0.1% |
| Subsaharan African | 91 | 4.8% |
| Trinidadian and Tobagonian | 1 | 0.1% |
| Venezuelan | 1 | 0.1% | View All 24 Rows |
Immigrants in Hickman
The most numerous immigrant groups reported in Hickman came from Central America (2 | 0.1%), Latin America (2 | 0.1%), and Mexico (2 | 0.1%), together accounting for 0.3% of all Hickman residents.
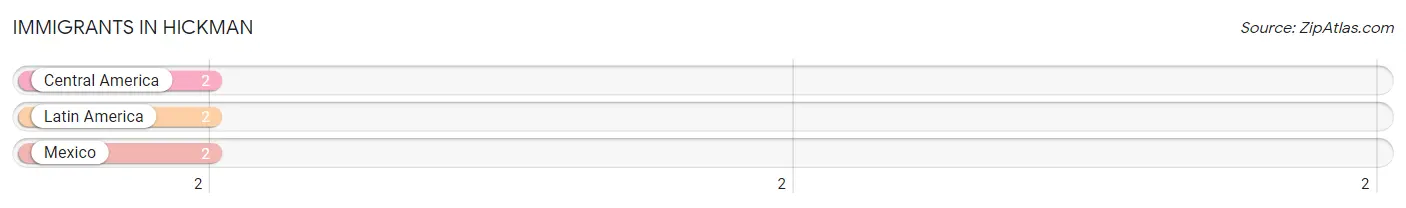
| Immigration Origin | # Population | % Population |
| Central America | 2 | 0.1% |
| Latin America | 2 | 0.1% |
| Mexico | 2 | 0.1% | View All 3 Rows |
Sex and Age in Hickman
Sex and Age in Hickman
The most populous age groups in Hickman are 20 to 24 Years (190 | 15.9%) for men and 50 to 54 Years (82 | 11.9%) for women.
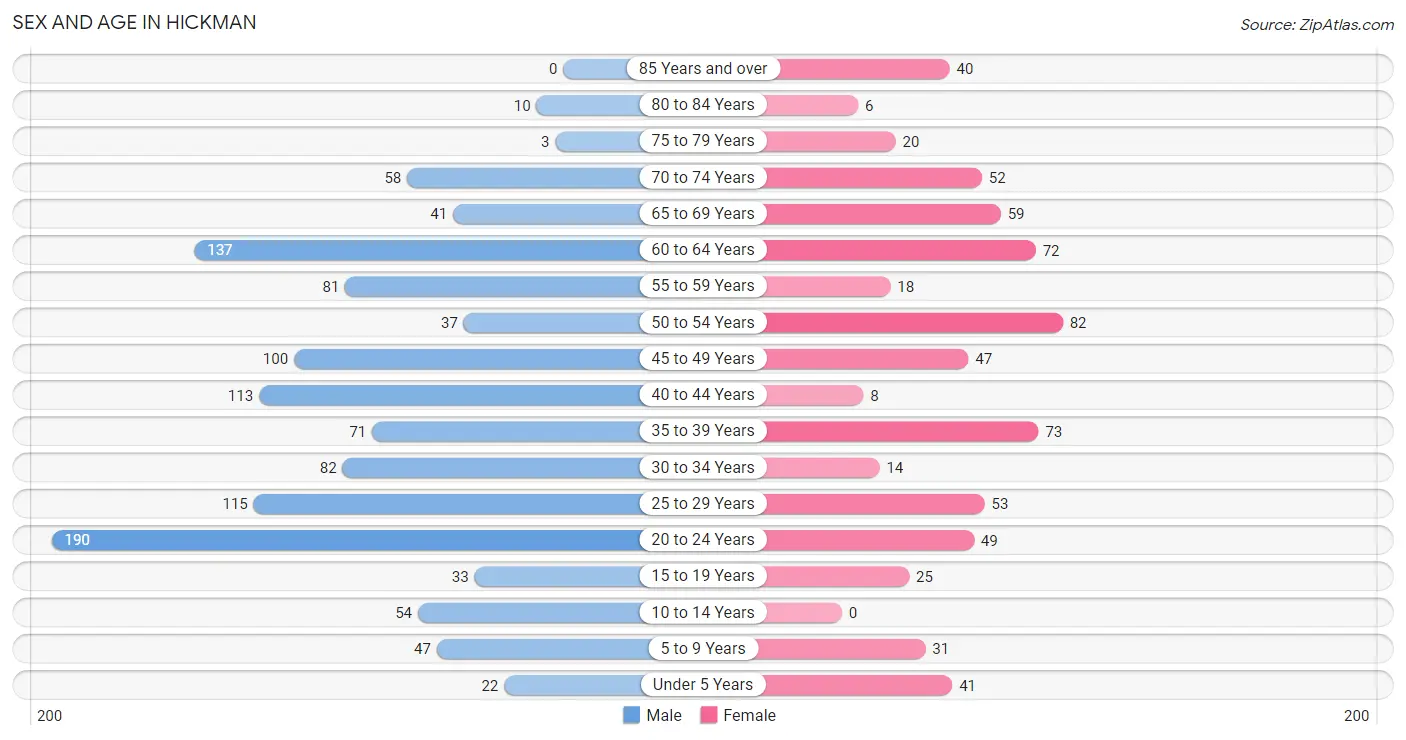
| Age Bracket | Male | Female |
| Under 5 Years | 22 (1.8%) | 41 (5.9%) |
| 5 to 9 Years | 47 (3.9%) | 31 (4.5%) |
| 10 to 14 Years | 54 (4.5%) | 0 (0.0%) |
| 15 to 19 Years | 33 (2.8%) | 25 (3.6%) |
| 20 to 24 Years | 190 (15.9%) | 49 (7.1%) |
| 25 to 29 Years | 115 (9.6%) | 53 (7.7%) |
| 30 to 34 Years | 82 (6.9%) | 14 (2.0%) |
| 35 to 39 Years | 71 (5.9%) | 73 (10.6%) |
| 40 to 44 Years | 113 (9.5%) | 8 (1.2%) |
| 45 to 49 Years | 100 (8.4%) | 47 (6.8%) |
| 50 to 54 Years | 37 (3.1%) | 82 (11.9%) |
| 55 to 59 Years | 81 (6.8%) | 18 (2.6%) |
| 60 to 64 Years | 137 (11.5%) | 72 (10.4%) |
| 65 to 69 Years | 41 (3.4%) | 59 (8.6%) |
| 70 to 74 Years | 58 (4.9%) | 52 (7.5%) |
| 75 to 79 Years | 3 (0.3%) | 20 (2.9%) |
| 80 to 84 Years | 10 (0.8%) | 6 (0.9%) |
| 85 Years and over | 0 (0.0%) | 40 (5.8%) |
| Total | 1,194 (100.0%) | 690 (100.0%) |
Families and Households in Hickman
Median Family Size in Hickman
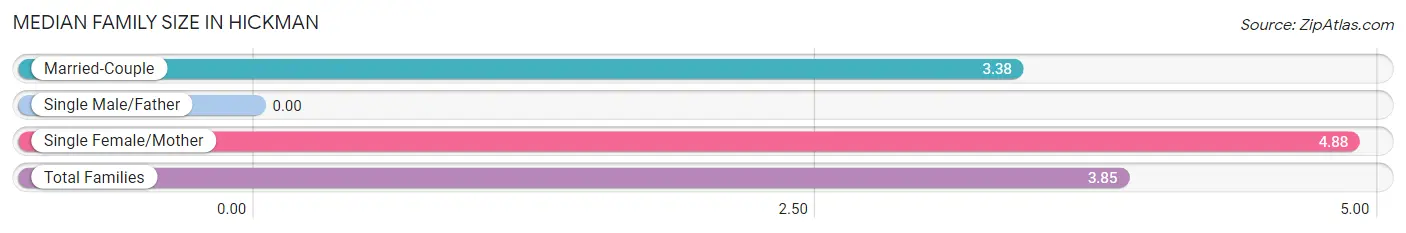
| Family Type | # Families | Family Size |
| Married-Couple | 165 (68.5%) | 3.38 |
| Single Male/Father | 0 (0.0%) | - |
| Single Female/Mother | 76 (31.5%) | 4.88 |
| Total Families | 241 (100.0%) | 3.85 |
Median Household Size in Hickman
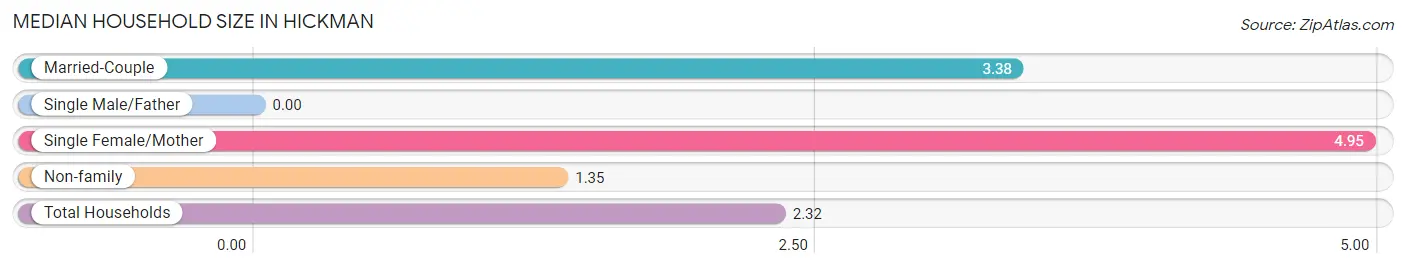
| Household Type | # Households | Household Size |
| Married-Couple | 165 (26.2%) | 3.38 |
| Single Male/Father | 0 (0.0%) | - |
| Single Female/Mother | 76 (12.1%) | 4.95 |
| Non-family | 389 (61.8%) | 1.35 |
| Total Households | 630 (100.0%) | 2.32 |
Household Size by Marriage Status in Hickman
Out of a total of 630 households in Hickman, 241 (38.3%) are family households, while 389 (61.8%) are nonfamily households. The most numerous type of family households are 2-person households, comprising 133, and the most common type of nonfamily households are 1-person households, comprising 321.
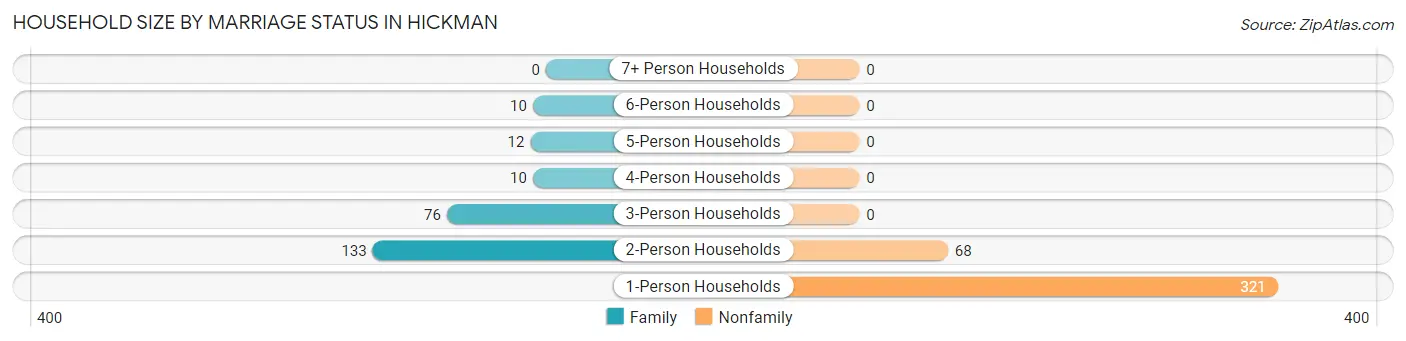
| Household Size | Family Households | Nonfamily Households |
| 1-Person Households | - | 321 (50.9%) |
| 2-Person Households | 133 (21.1%) | 68 (10.8%) |
| 3-Person Households | 76 (12.1%) | 0 (0.0%) |
| 4-Person Households | 10 (1.6%) | 0 (0.0%) |
| 5-Person Households | 12 (1.9%) | 0 (0.0%) |
| 6-Person Households | 10 (1.6%) | 0 (0.0%) |
| 7+ Person Households | 0 (0.0%) | 0 (0.0%) |
| Total | 241 (38.3%) | 389 (61.8%) |
Female Fertility in Hickman
Fertility by Age in Hickman
Average fertility rate in Hickman is 41.0 births per 1,000 women. Women in the age bracket of 35 to 50 years have the highest fertility rate with 85.0 births per 1,000 women. Women in the age bracket of 35 to 50 years acount for 100.0% of all women with births.
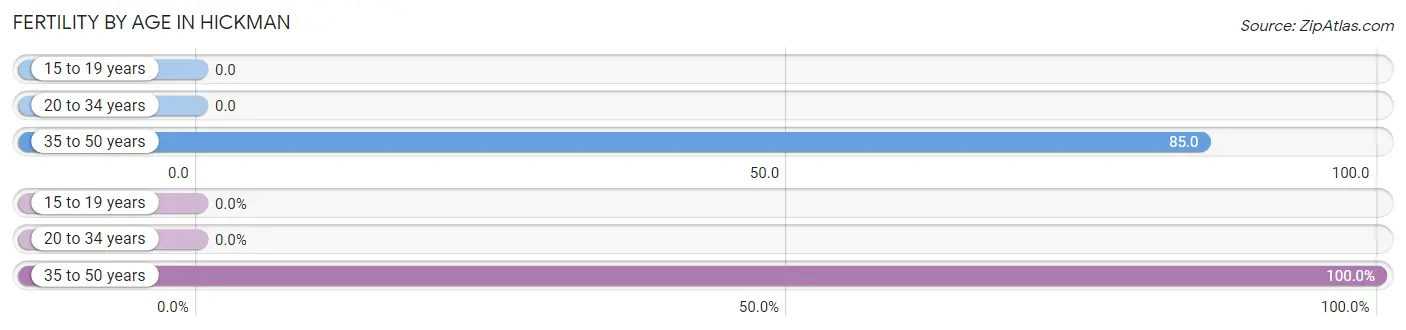
| Age Bracket | Women with Births | Births / 1,000 Women |
| 15 to 19 years | 0 (0.0%) | 0.0 |
| 20 to 34 years | 0 (0.0%) | 0.0 |
| 35 to 50 years | 11 (100.0%) | 85.0 |
| Total | 11 (100.0%) | 41.0 |
Fertility by Age by Marriage Status in Hickman
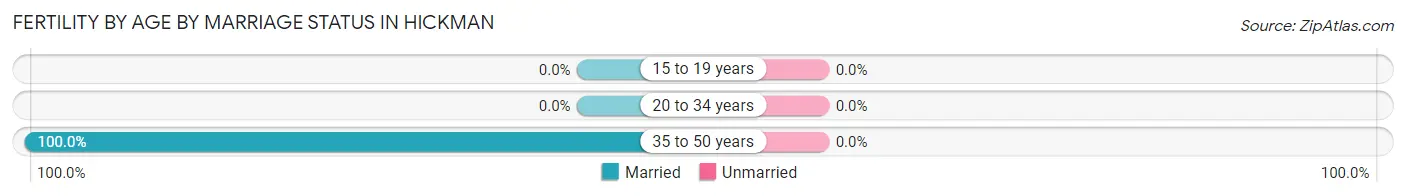
| Age Bracket | Married | Unmarried |
| 15 to 19 years | 0 (0.0%) | 0 (0.0%) |
| 20 to 34 years | 0 (0.0%) | 0 (0.0%) |
| 35 to 50 years | 11 (100.0%) | 0 (0.0%) |
| Total | 11 (100.0%) | 0 (0.0%) |
Fertility by Education in Hickman
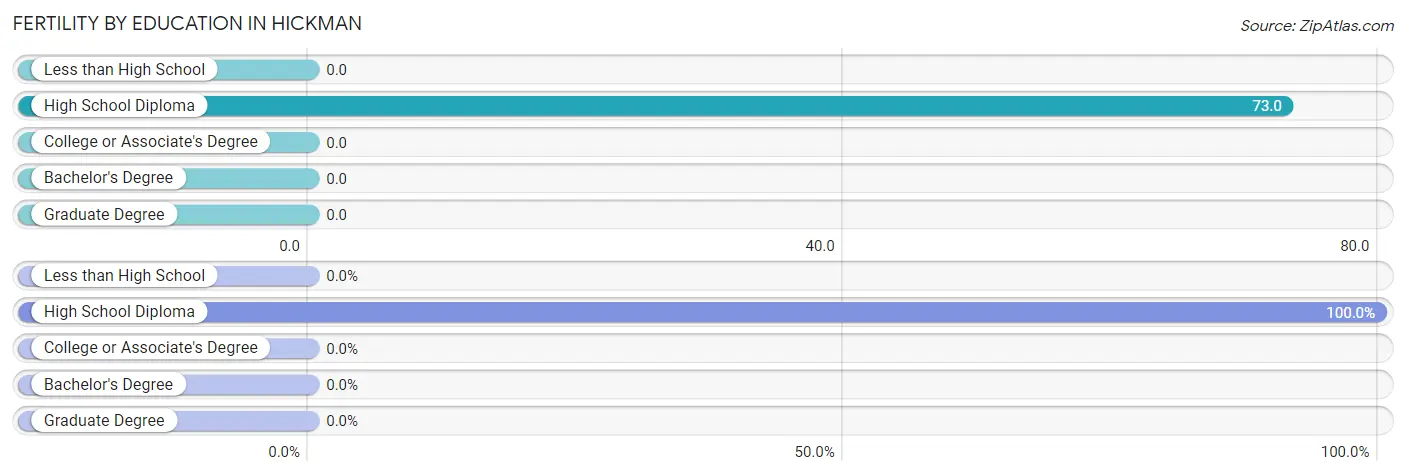
| Educational Attainment | Women with Births | Births / 1,000 Women |
| Less than High School | 0 (0.0%) | 0.0 |
| High School Diploma | 11 (100.0%) | 73.0 |
| College or Associate's Degree | 0 (0.0%) | 0.0 |
| Bachelor's Degree | 0 (0.0%) | 0.0 |
| Graduate Degree | 0 (0.0%) | 0.0 |
| Total | 11 (100.0%) | 41.0 |
Fertility by Education by Marriage Status in Hickman
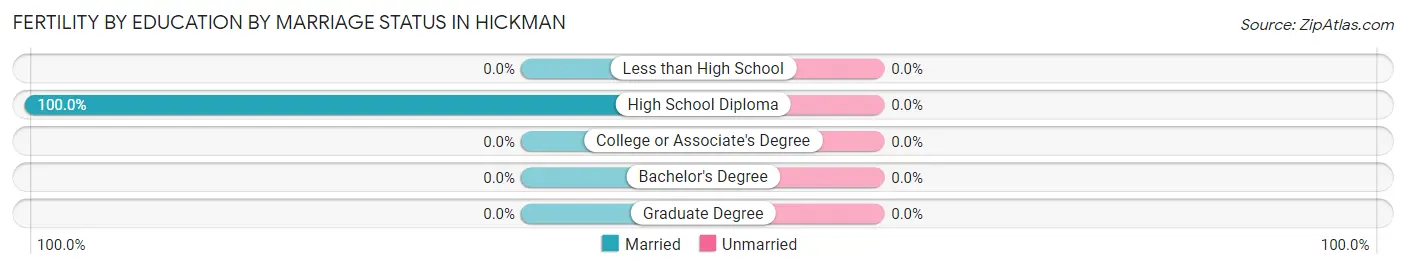
| Educational Attainment | Married | Unmarried |
| Less than High School | 0 (0.0%) | 0 (0.0%) |
| High School Diploma | 11 (100.0%) | 0 (0.0%) |
| College or Associate's Degree | 0 (0.0%) | 0 (0.0%) |
| Bachelor's Degree | 0 (0.0%) | 0 (0.0%) |
| Graduate Degree | 0 (0.0%) | 0 (0.0%) |
| Total | 11 (100.0%) | 0 (0.0%) |
Employment Characteristics in Hickman
Employment by Class of Employer in Hickman
Among the 532 employed individuals in Hickman, private company employees (392 | 73.7%), state government employees (43 | 8.1%), and self-employed (incorporated) (30 | 5.6%) make up the most common classes of employment.
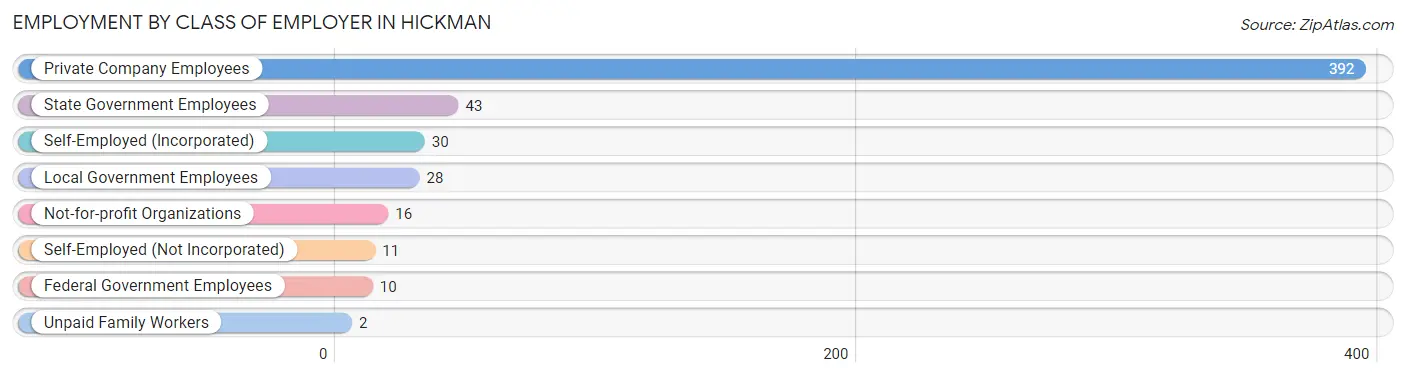
| Employer Class | # Employees | % Employees |
| Private Company Employees | 392 | 73.7% |
| Self-Employed (Incorporated) | 30 | 5.6% |
| Self-Employed (Not Incorporated) | 11 | 2.1% |
| Not-for-profit Organizations | 16 | 3.0% |
| Local Government Employees | 28 | 5.3% |
| State Government Employees | 43 | 8.1% |
| Federal Government Employees | 10 | 1.9% |
| Unpaid Family Workers | 2 | 0.4% |
| Total | 532 | 100.0% |
Employment Status by Age in Hickman
According to the labor force statistics for Hickman, out of the total population over 16 years of age (1,689), 33.1% or 559 individuals are in the labor force, with 4.9% or 27 of them unemployed. The age group with the highest labor force participation rate is 25 to 29 years, with 58.9% or 99 individuals in the labor force. Within the labor force, the 16 to 19 years age range has the highest percentage of unemployed individuals, with 77.8% or 7 of them being unemployed.
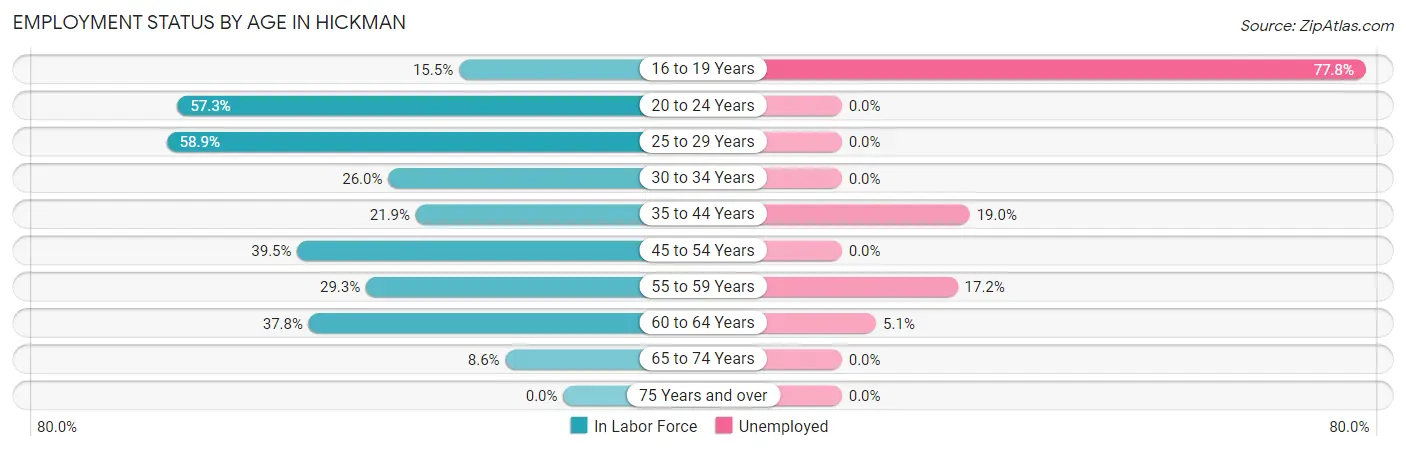
| Age Bracket | In Labor Force | Unemployed |
| 16 to 19 Years | 9 (15.5%) | 7 (77.8%) |
| 20 to 24 Years | 137 (57.3%) | 0 (0.0%) |
| 25 to 29 Years | 99 (58.9%) | 0 (0.0%) |
| 30 to 34 Years | 25 (26.0%) | 0 (0.0%) |
| 35 to 44 Years | 58 (21.9%) | 11 (19.0%) |
| 45 to 54 Years | 105 (39.5%) | 0 (0.0%) |
| 55 to 59 Years | 29 (29.3%) | 5 (17.2%) |
| 60 to 64 Years | 79 (37.8%) | 4 (5.1%) |
| 65 to 74 Years | 18 (8.6%) | 0 (0.0%) |
| 75 Years and over | 0 (0.0%) | 0 (0.0%) |
| Total | 559 (33.1%) | 27 (4.9%) |
Employment Status by Educational Attainment in Hickman
According to labor force statistics for Hickman, 35.8% of individuals (395) out of the total population between 25 and 64 years of age (1,103) are in the labor force, with 5.1% or 20 of them being unemployed. The group with the highest labor force participation rate are those with the educational attainment of bachelor's degree or higher, with 86.4% or 95 individuals in the labor force. Within the labor force, individuals with less than high school education have the highest percentage of unemployment, with 19.1% or 9 of them being unemployed.
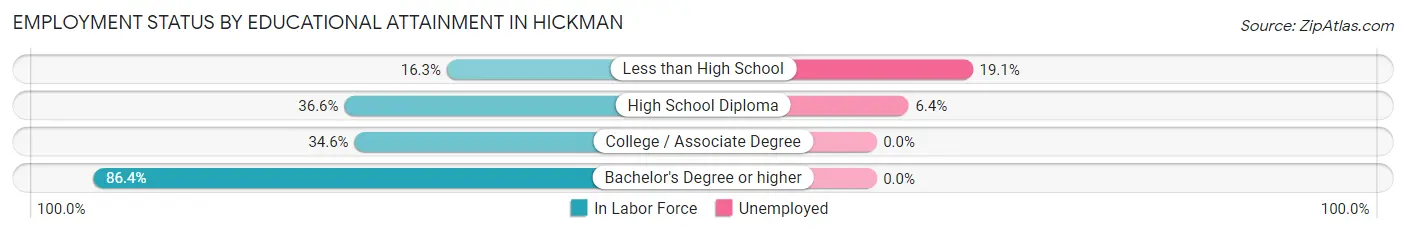
| Educational Attainment | In Labor Force | Unemployed |
| Less than High School | 47 (16.3%) | 55 (19.1%) |
| High School Diploma | 171 (36.6%) | 30 (6.4%) |
| College / Associate Degree | 82 (34.6%) | 0 (0.0%) |
| Bachelor's Degree or higher | 95 (86.4%) | 0 (0.0%) |
| Total | 395 (35.8%) | 56 (5.1%) |
Employment Occupations by Sex in Hickman
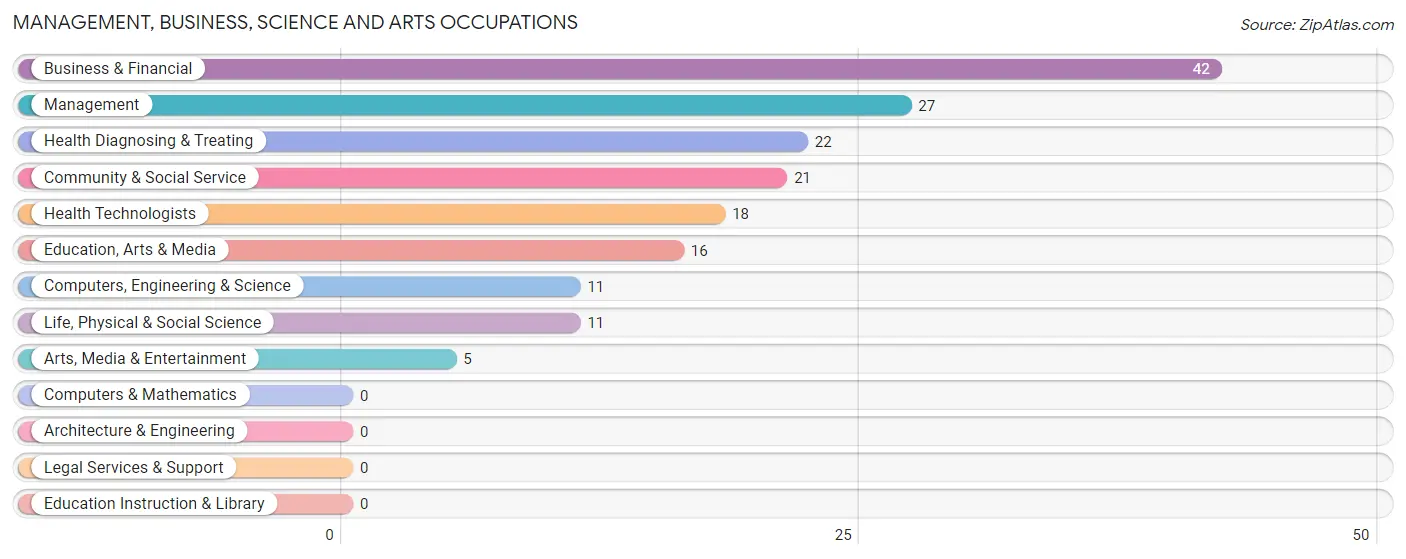
Management, Business, Science and Arts Occupations
The most common Management, Business, Science and Arts occupations in Hickman are Business & Financial (42 | 7.9%), Management (27 | 5.1%), Health Diagnosing & Treating (22 | 4.2%), Community & Social Service (21 | 4.0%), and Health Technologists (18 | 3.4%).
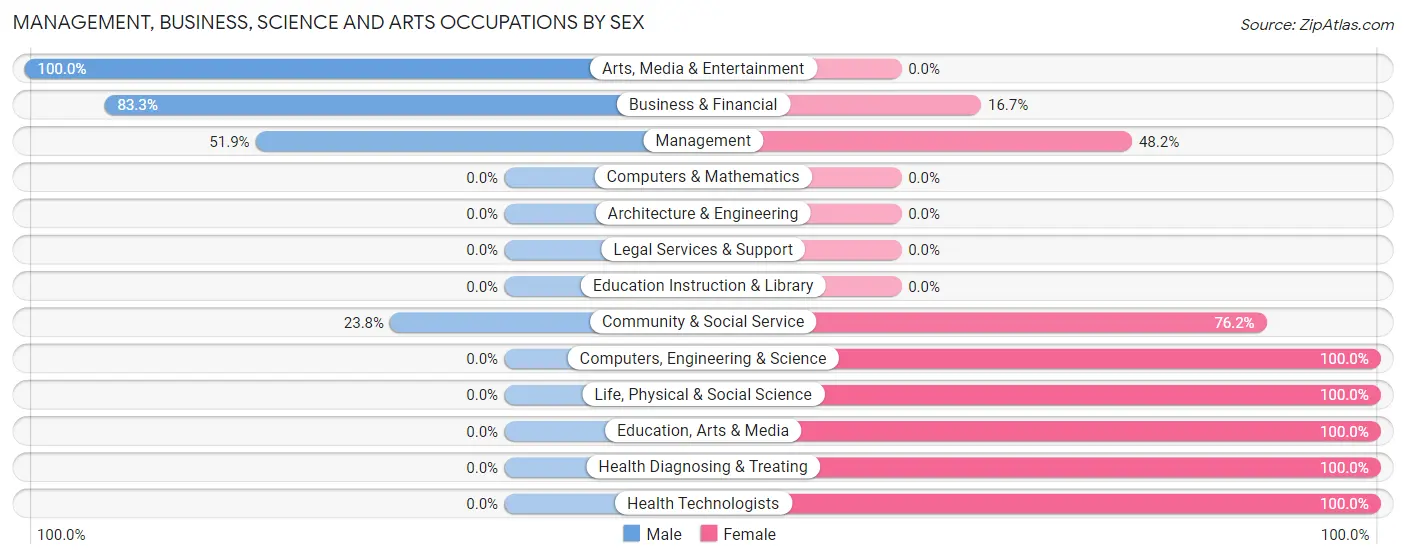
Management, Business, Science and Arts Occupations by Sex
Within the Management, Business, Science and Arts occupations in Hickman, the most male-oriented occupations are Arts, Media & Entertainment (100.0%), Business & Financial (83.3%), and Management (51.8%), while the most female-oriented occupations are Computers, Engineering & Science (100.0%), Life, Physical & Social Science (100.0%), and Education, Arts & Media (100.0%).
| Occupation | Male | Female |
| Management | 14 (51.8%) | 13 (48.1%) |
| Business & Financial | 35 (83.3%) | 7 (16.7%) |
| Computers, Engineering & Science | 0 (0.0%) | 11 (100.0%) |
| Computers & Mathematics | 0 (0.0%) | 0 (0.0%) |
| Architecture & Engineering | 0 (0.0%) | 0 (0.0%) |
| Life, Physical & Social Science | 0 (0.0%) | 11 (100.0%) |
| Community & Social Service | 5 (23.8%) | 16 (76.2%) |
| Education, Arts & Media | 0 (0.0%) | 16 (100.0%) |
| Legal Services & Support | 0 (0.0%) | 0 (0.0%) |
| Education Instruction & Library | 0 (0.0%) | 0 (0.0%) |
| Arts, Media & Entertainment | 5 (100.0%) | 0 (0.0%) |
| Health Diagnosing & Treating | 0 (0.0%) | 22 (100.0%) |
| Health Technologists | 0 (0.0%) | 18 (100.0%) |
| Total (Category) | 54 (43.9%) | 69 (56.1%) |
| Total (Overall) | 323 (61.1%) | 206 (38.9%) |
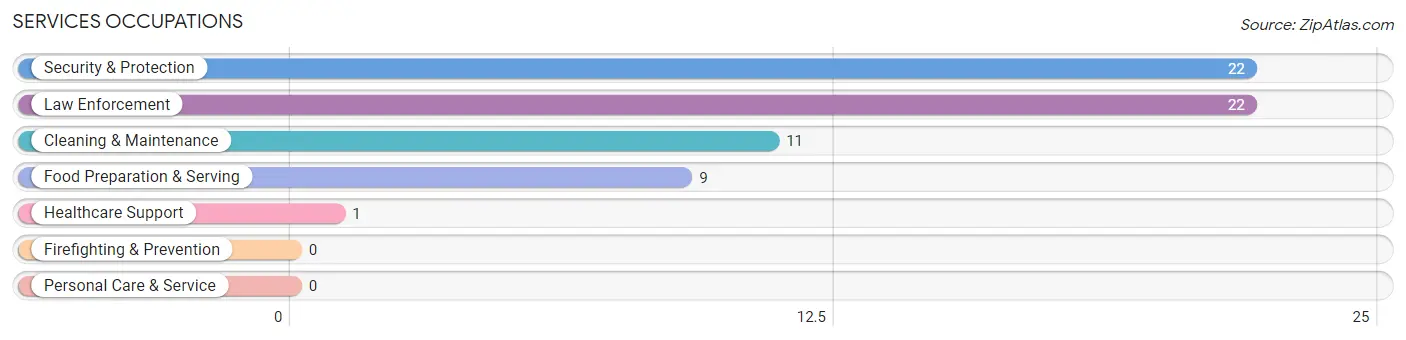
Services Occupations
The most common Services occupations in Hickman are Security & Protection (22 | 4.2%), Law Enforcement (22 | 4.2%), Cleaning & Maintenance (11 | 2.1%), Food Preparation & Serving (9 | 1.7%), and Healthcare Support (1 | 0.2%).
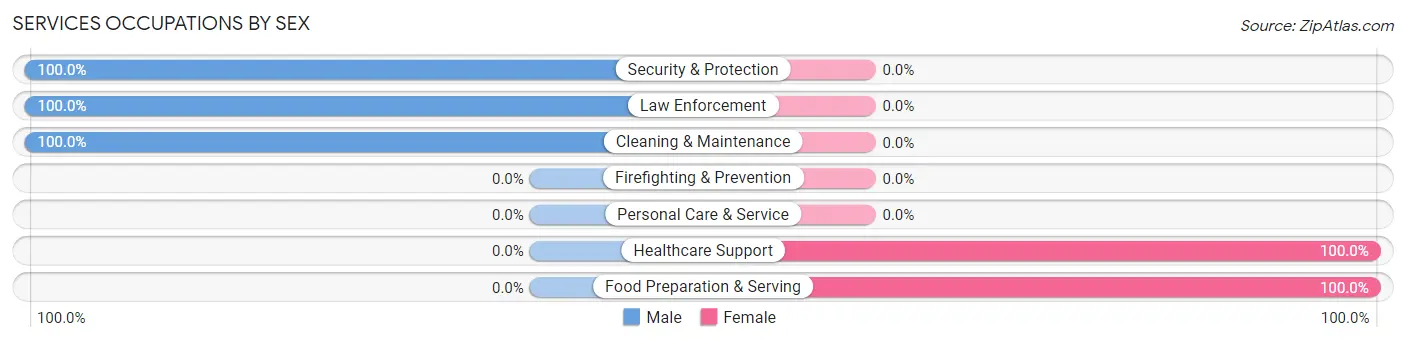
Services Occupations by Sex
Within the Services occupations in Hickman, the most male-oriented occupations are Security & Protection (100.0%), Law Enforcement (100.0%), and Cleaning & Maintenance (100.0%), while the most female-oriented occupations are Healthcare Support (100.0%), and Food Preparation & Serving (100.0%).
| Occupation | Male | Female |
| Healthcare Support | 0 (0.0%) | 1 (100.0%) |
| Security & Protection | 22 (100.0%) | 0 (0.0%) |
| Firefighting & Prevention | 0 (0.0%) | 0 (0.0%) |
| Law Enforcement | 22 (100.0%) | 0 (0.0%) |
| Food Preparation & Serving | 0 (0.0%) | 9 (100.0%) |
| Cleaning & Maintenance | 11 (100.0%) | 0 (0.0%) |
| Personal Care & Service | 0 (0.0%) | 0 (0.0%) |
| Total (Category) | 33 (76.7%) | 10 (23.3%) |
| Total (Overall) | 323 (61.1%) | 206 (38.9%) |
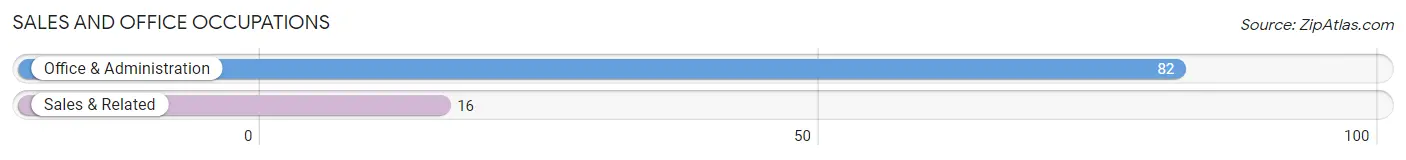
Sales and Office Occupations
The most common Sales and Office occupations in Hickman are Office & Administration (82 | 15.5%), and Sales & Related (16 | 3.0%).
Sales and Office Occupations by Sex
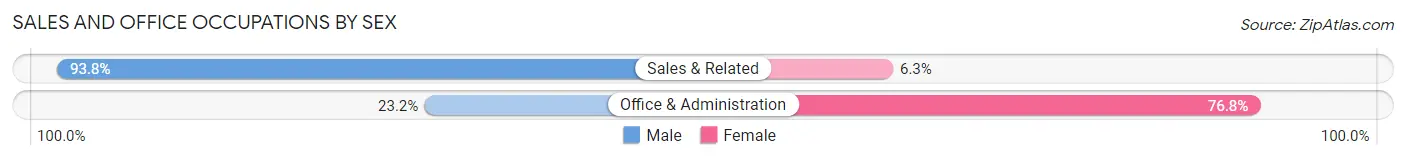
| Occupation | Male | Female |
| Sales & Related | 15 (93.8%) | 1 (6.2%) |
| Office & Administration | 19 (23.2%) | 63 (76.8%) |
| Total (Category) | 34 (34.7%) | 64 (65.3%) |
| Total (Overall) | 323 (61.1%) | 206 (38.9%) |
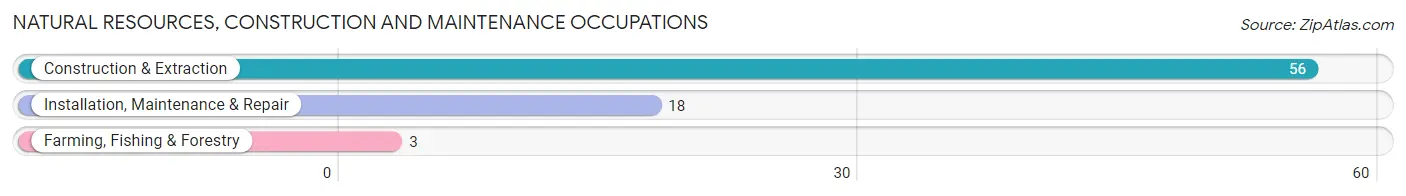
Natural Resources, Construction and Maintenance Occupations
The most common Natural Resources, Construction and Maintenance occupations in Hickman are Construction & Extraction (56 | 10.6%), Installation, Maintenance & Repair (18 | 3.4%), and Farming, Fishing & Forestry (3 | 0.6%).
Natural Resources, Construction and Maintenance Occupations by Sex
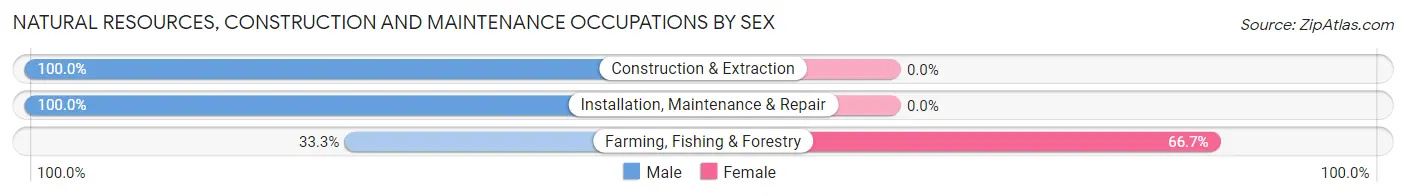
| Occupation | Male | Female |
| Farming, Fishing & Forestry | 1 (33.3%) | 2 (66.7%) |
| Construction & Extraction | 56 (100.0%) | 0 (0.0%) |
| Installation, Maintenance & Repair | 18 (100.0%) | 0 (0.0%) |
| Total (Category) | 75 (97.4%) | 2 (2.6%) |
| Total (Overall) | 323 (61.1%) | 206 (38.9%) |
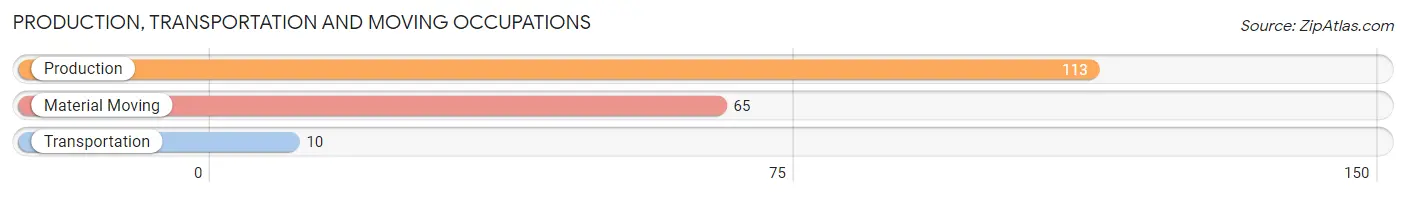
Production, Transportation and Moving Occupations
The most common Production, Transportation and Moving occupations in Hickman are Production (113 | 21.4%), Material Moving (65 | 12.3%), and Transportation (10 | 1.9%).
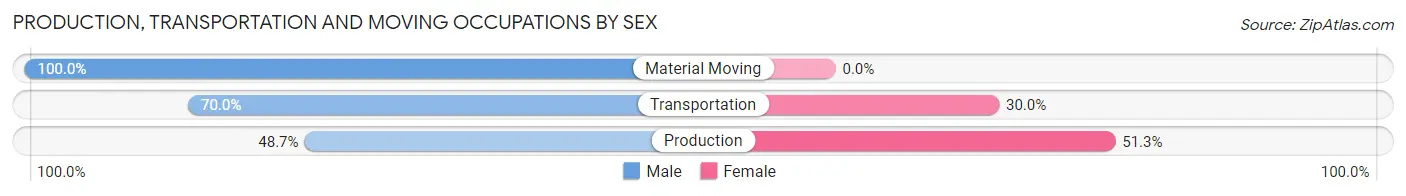
Production, Transportation and Moving Occupations by Sex
| Occupation | Male | Female |
| Production | 55 (48.7%) | 58 (51.3%) |
| Transportation | 7 (70.0%) | 3 (30.0%) |
| Material Moving | 65 (100.0%) | 0 (0.0%) |
| Total (Category) | 127 (67.5%) | 61 (32.5%) |
| Total (Overall) | 323 (61.1%) | 206 (38.9%) |
Employment Industries by Sex in Hickman
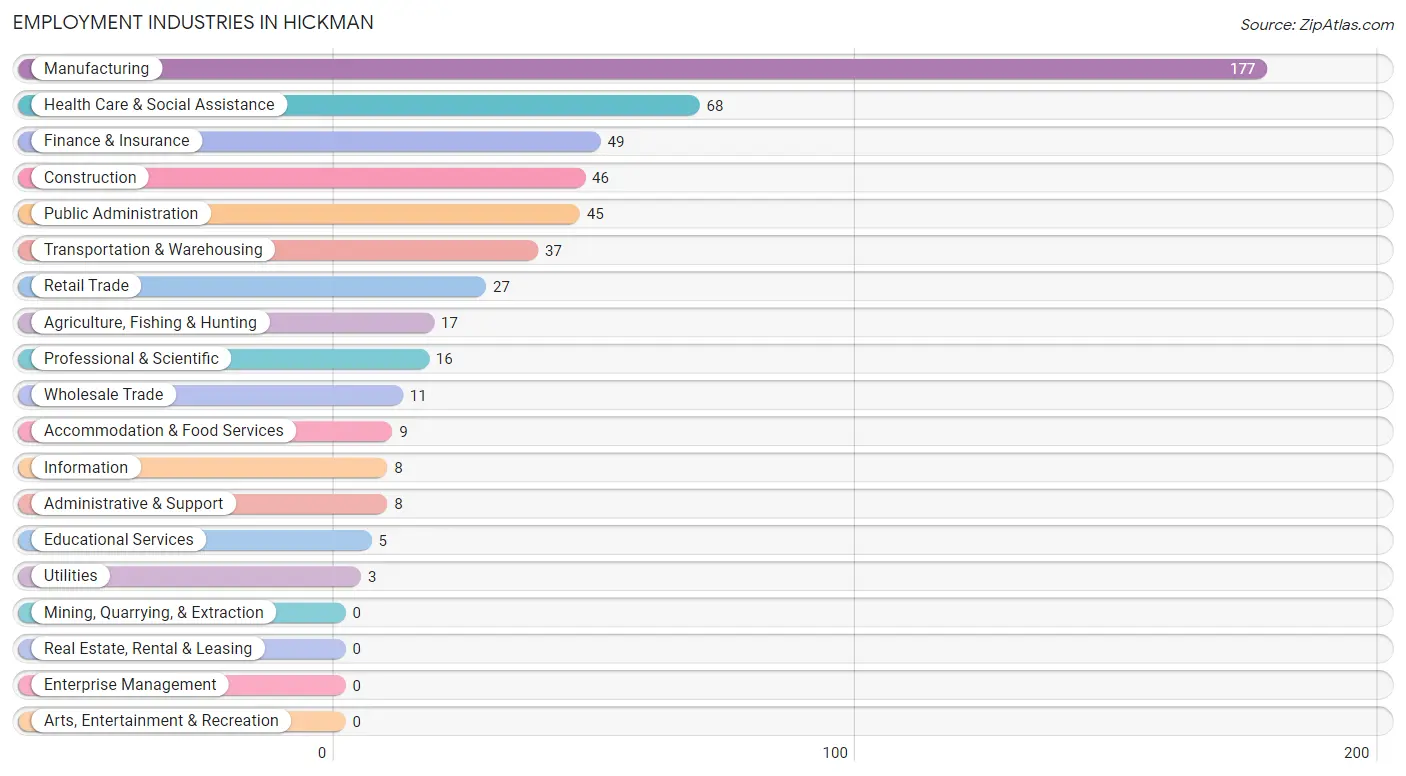
Employment Industries in Hickman
The major employment industries in Hickman include Manufacturing (177 | 33.5%), Health Care & Social Assistance (68 | 12.9%), Finance & Insurance (49 | 9.3%), Construction (46 | 8.7%), and Public Administration (45 | 8.5%).
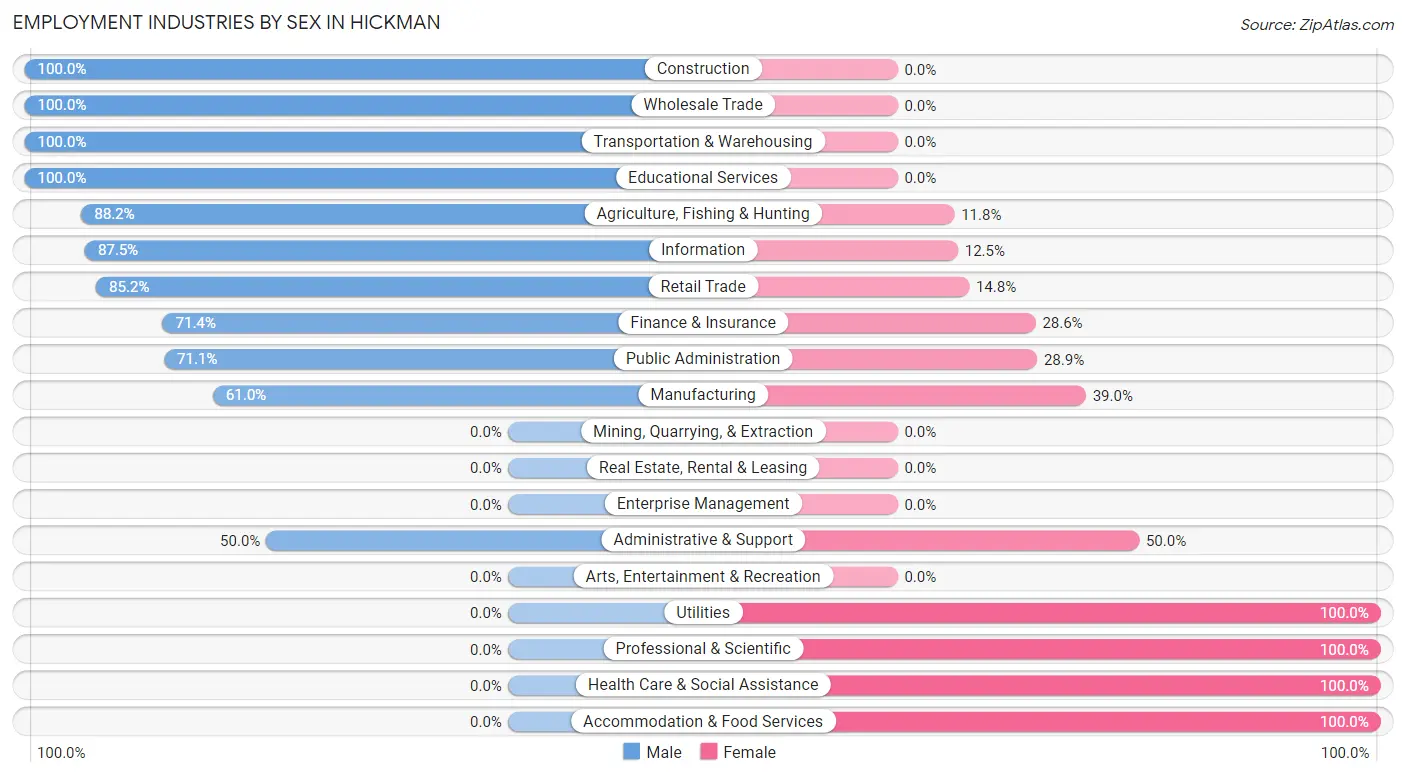
Employment Industries by Sex in Hickman
The Hickman industries that see more men than women are Construction (100.0%), Wholesale Trade (100.0%), and Transportation & Warehousing (100.0%), whereas the industries that tend to have a higher number of women are Utilities (100.0%), Professional & Scientific (100.0%), and Health Care & Social Assistance (100.0%).
| Industry | Male | Female |
| Agriculture, Fishing & Hunting | 15 (88.2%) | 2 (11.8%) |
| Mining, Quarrying, & Extraction | 0 (0.0%) | 0 (0.0%) |
| Construction | 46 (100.0%) | 0 (0.0%) |
| Manufacturing | 108 (61.0%) | 69 (39.0%) |
| Wholesale Trade | 11 (100.0%) | 0 (0.0%) |
| Retail Trade | 23 (85.2%) | 4 (14.8%) |
| Transportation & Warehousing | 37 (100.0%) | 0 (0.0%) |
| Utilities | 0 (0.0%) | 3 (100.0%) |
| Information | 7 (87.5%) | 1 (12.5%) |
| Finance & Insurance | 35 (71.4%) | 14 (28.6%) |
| Real Estate, Rental & Leasing | 0 (0.0%) | 0 (0.0%) |
| Professional & Scientific | 0 (0.0%) | 16 (100.0%) |
| Enterprise Management | 0 (0.0%) | 0 (0.0%) |
| Administrative & Support | 4 (50.0%) | 4 (50.0%) |
| Educational Services | 5 (100.0%) | 0 (0.0%) |
| Health Care & Social Assistance | 0 (0.0%) | 68 (100.0%) |
| Arts, Entertainment & Recreation | 0 (0.0%) | 0 (0.0%) |
| Accommodation & Food Services | 0 (0.0%) | 9 (100.0%) |
| Public Administration | 32 (71.1%) | 13 (28.9%) |
| Total | 323 (61.1%) | 206 (38.9%) |
Education in Hickman
School Enrollment in Hickman
The most common levels of schooling among the 234 students in Hickman are graduate / professional (85 | 36.3%), middle school (55 | 23.5%), and high school (38 | 16.2%).
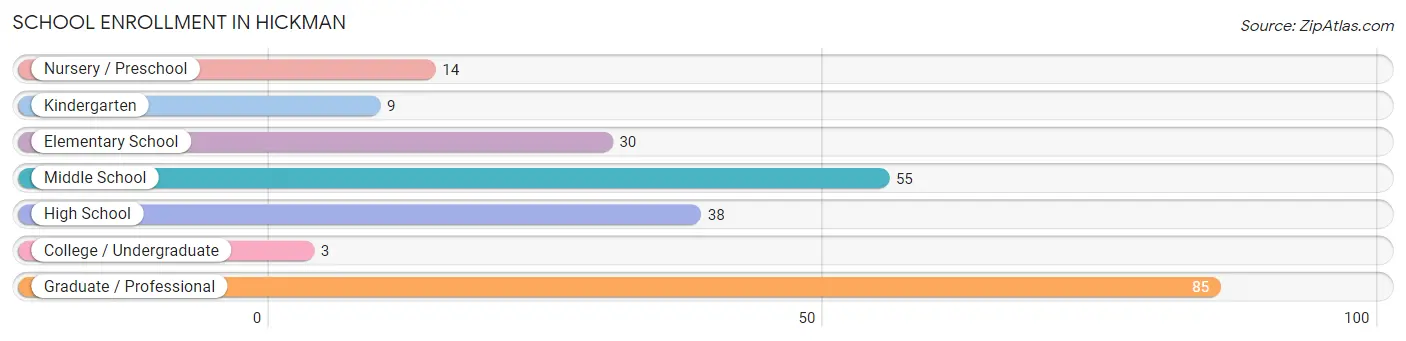
| School Level | # Students | % Students |
| Nursery / Preschool | 14 | 6.0% |
| Kindergarten | 9 | 3.8% |
| Elementary School | 30 | 12.8% |
| Middle School | 55 | 23.5% |
| High School | 38 | 16.2% |
| College / Undergraduate | 3 | 1.3% |
| Graduate / Professional | 85 | 36.3% |
| Total | 234 | 100.0% |
School Enrollment by Age by Funding Source in Hickman
Out of a total of 234 students who are enrolled in schools in Hickman, 5 (2.1%) attend a private institution, while the remaining 229 (97.9%) are enrolled in public schools. The age group of 35 years and over has the highest likelihood of being enrolled in private schools, with 5 (83.3% in the age bracket) enrolled. Conversely, the age group of 3 to 4 year olds has the lowest likelihood of being enrolled in a private school, with 14 (100.0% in the age bracket) attending a public institution.
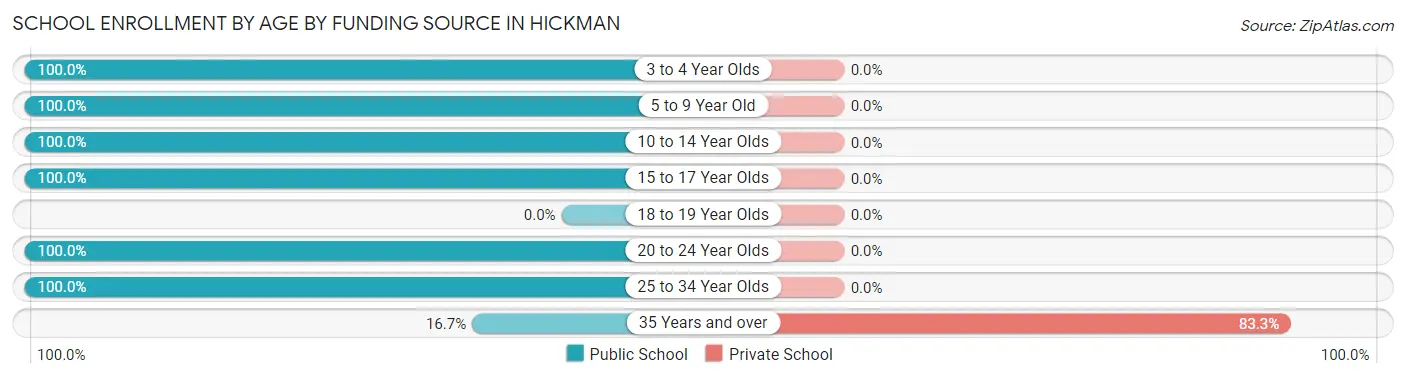
| Age Bracket | Public School | Private School |
| 3 to 4 Year Olds | 14 (100.0%) | 0 (0.0%) |
| 5 to 9 Year Old | 39 (100.0%) | 0 (0.0%) |
| 10 to 14 Year Olds | 54 (100.0%) | 0 (0.0%) |
| 15 to 17 Year Olds | 39 (100.0%) | 0 (0.0%) |
| 18 to 19 Year Olds | 0 (0.0%) | 0 (0.0%) |
| 20 to 24 Year Olds | 80 (100.0%) | 0 (0.0%) |
| 25 to 34 Year Olds | 2 (100.0%) | 0 (0.0%) |
| 35 Years and over | 1 (16.7%) | 5 (83.3%) |
| Total | 229 (97.9%) | 5 (2.1%) |
Educational Attainment by Field of Study in Hickman
Business (46 | 30.3%), science & technology (29 | 19.1%), arts & humanities (26 | 17.1%), bio, nature & agricultural (14 | 9.2%), and education (12 | 7.9%) are the most common fields of study among 152 individuals in Hickman who have obtained a bachelor's degree or higher.
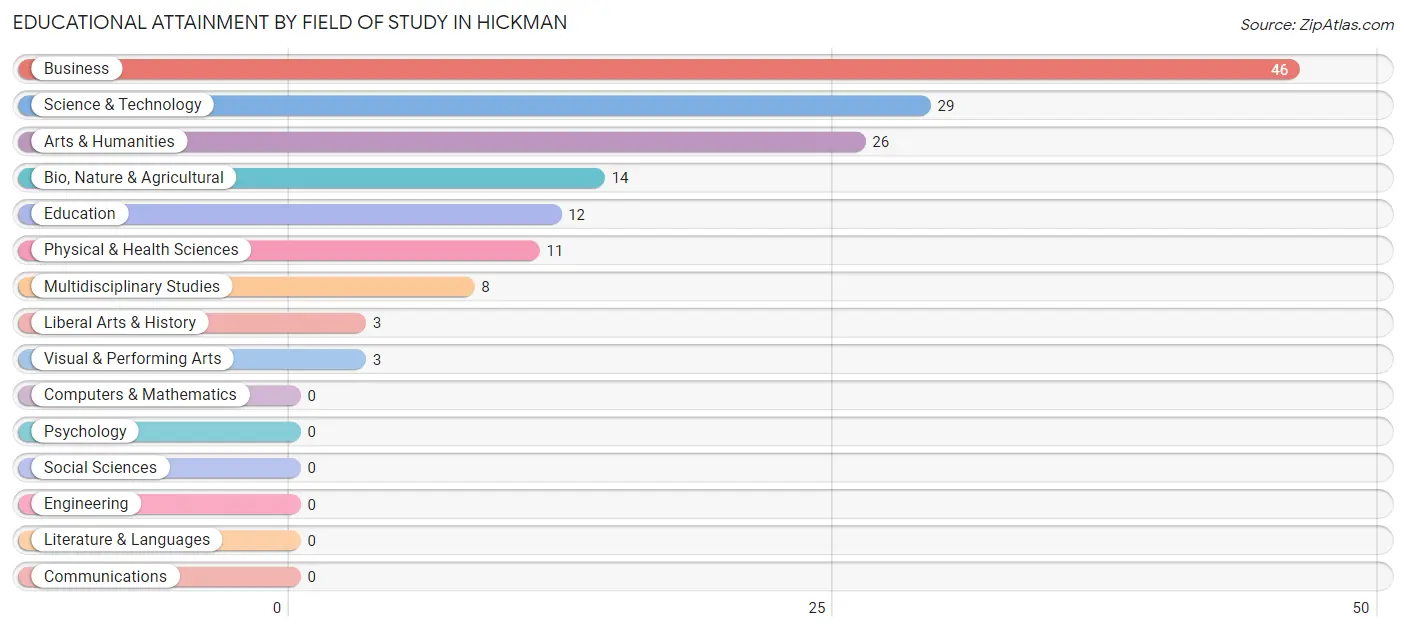
| Field of Study | # Graduates | % Graduates |
| Computers & Mathematics | 0 | 0.0% |
| Bio, Nature & Agricultural | 14 | 9.2% |
| Physical & Health Sciences | 11 | 7.2% |
| Psychology | 0 | 0.0% |
| Social Sciences | 0 | 0.0% |
| Engineering | 0 | 0.0% |
| Multidisciplinary Studies | 8 | 5.3% |
| Science & Technology | 29 | 19.1% |
| Business | 46 | 30.3% |
| Education | 12 | 7.9% |
| Literature & Languages | 0 | 0.0% |
| Liberal Arts & History | 3 | 2.0% |
| Visual & Performing Arts | 3 | 2.0% |
| Communications | 0 | 0.0% |
| Arts & Humanities | 26 | 17.1% |
| Total | 152 | 100.0% |
Transportation & Commute in Hickman
Vehicle Availability by Sex in Hickman
The most prevalent vehicle ownership categories in Hickman are males with 1 vehicle (108, accounting for 33.4%) and females with 1 vehicle (84, making up 52.2%).
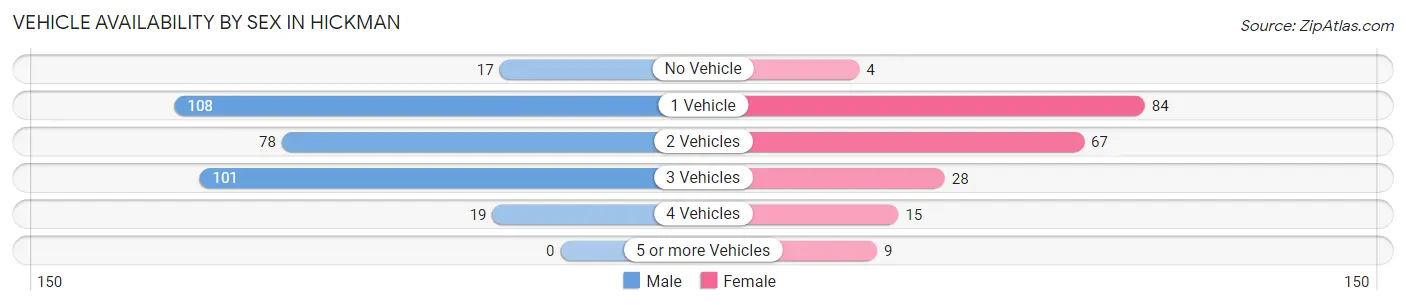
| Vehicles Available | Male | Female |
| No Vehicle | 17 (5.3%) | 4 (1.9%) |
| 1 Vehicle | 108 (33.4%) | 84 (40.6%) |
| 2 Vehicles | 78 (24.1%) | 67 (32.4%) |
| 3 Vehicles | 101 (31.3%) | 28 (13.5%) |
| 4 Vehicles | 19 (5.9%) | 15 (7.2%) |
| 5 or more Vehicles | 0 (0.0%) | 9 (4.3%) |
| Total | 323 (100.0%) | 207 (100.0%) |
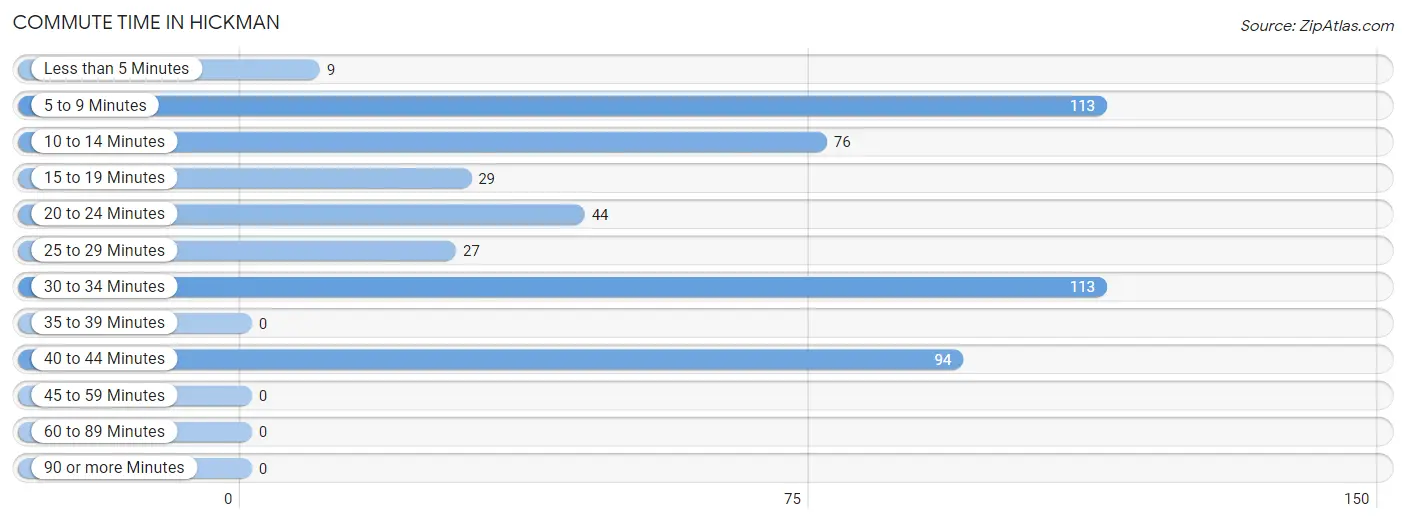
Commute Time in Hickman
The most frequently occuring commute durations in Hickman are 5 to 9 minutes (113 commuters, 22.4%), 30 to 34 minutes (113 commuters, 22.4%), and 40 to 44 minutes (94 commuters, 18.6%).
| Commute Time | # Commuters | % Commuters |
| Less than 5 Minutes | 9 | 1.8% |
| 5 to 9 Minutes | 113 | 22.4% |
| 10 to 14 Minutes | 76 | 15.0% |
| 15 to 19 Minutes | 29 | 5.7% |
| 20 to 24 Minutes | 44 | 8.7% |
| 25 to 29 Minutes | 27 | 5.3% |
| 30 to 34 Minutes | 113 | 22.4% |
| 35 to 39 Minutes | 0 | 0.0% |
| 40 to 44 Minutes | 94 | 18.6% |
| 45 to 59 Minutes | 0 | 0.0% |
| 60 to 89 Minutes | 0 | 0.0% |
| 90 or more Minutes | 0 | 0.0% |
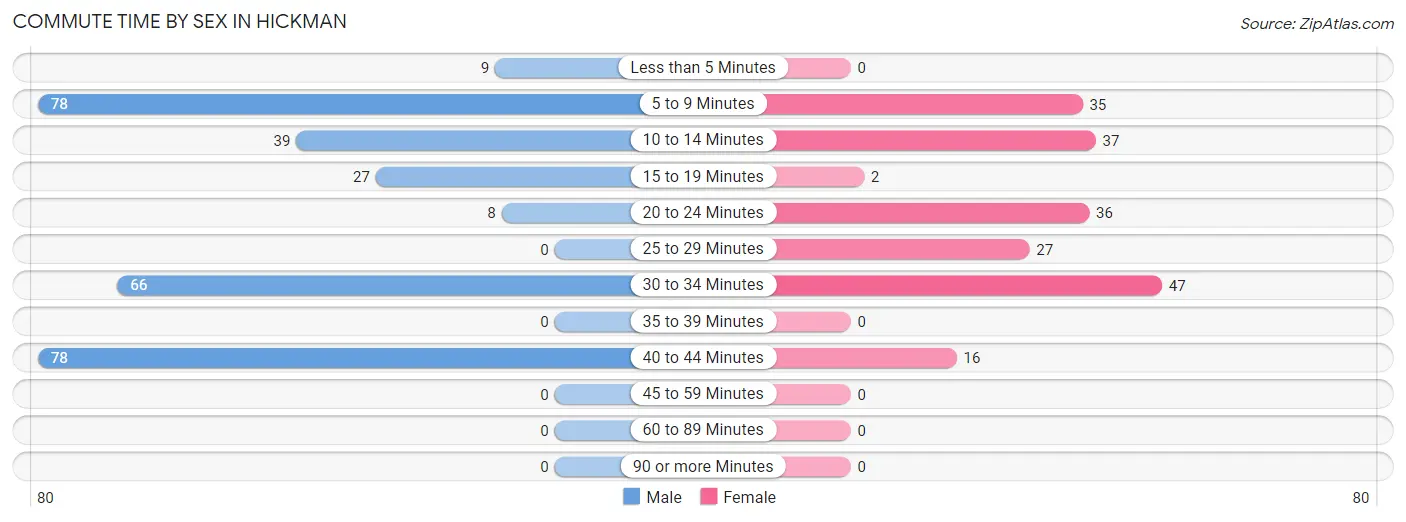
Commute Time by Sex in Hickman
The most common commute times in Hickman are 5 to 9 minutes (78 commuters, 25.6%) for males and 30 to 34 minutes (47 commuters, 23.5%) for females.
| Commute Time | Male | Female |
| Less than 5 Minutes | 9 (2.9%) | 0 (0.0%) |
| 5 to 9 Minutes | 78 (25.6%) | 35 (17.5%) |
| 10 to 14 Minutes | 39 (12.8%) | 37 (18.5%) |
| 15 to 19 Minutes | 27 (8.8%) | 2 (1.0%) |
| 20 to 24 Minutes | 8 (2.6%) | 36 (18.0%) |
| 25 to 29 Minutes | 0 (0.0%) | 27 (13.5%) |
| 30 to 34 Minutes | 66 (21.6%) | 47 (23.5%) |
| 35 to 39 Minutes | 0 (0.0%) | 0 (0.0%) |
| 40 to 44 Minutes | 78 (25.6%) | 16 (8.0%) |
| 45 to 59 Minutes | 0 (0.0%) | 0 (0.0%) |
| 60 to 89 Minutes | 0 (0.0%) | 0 (0.0%) |
| 90 or more Minutes | 0 (0.0%) | 0 (0.0%) |
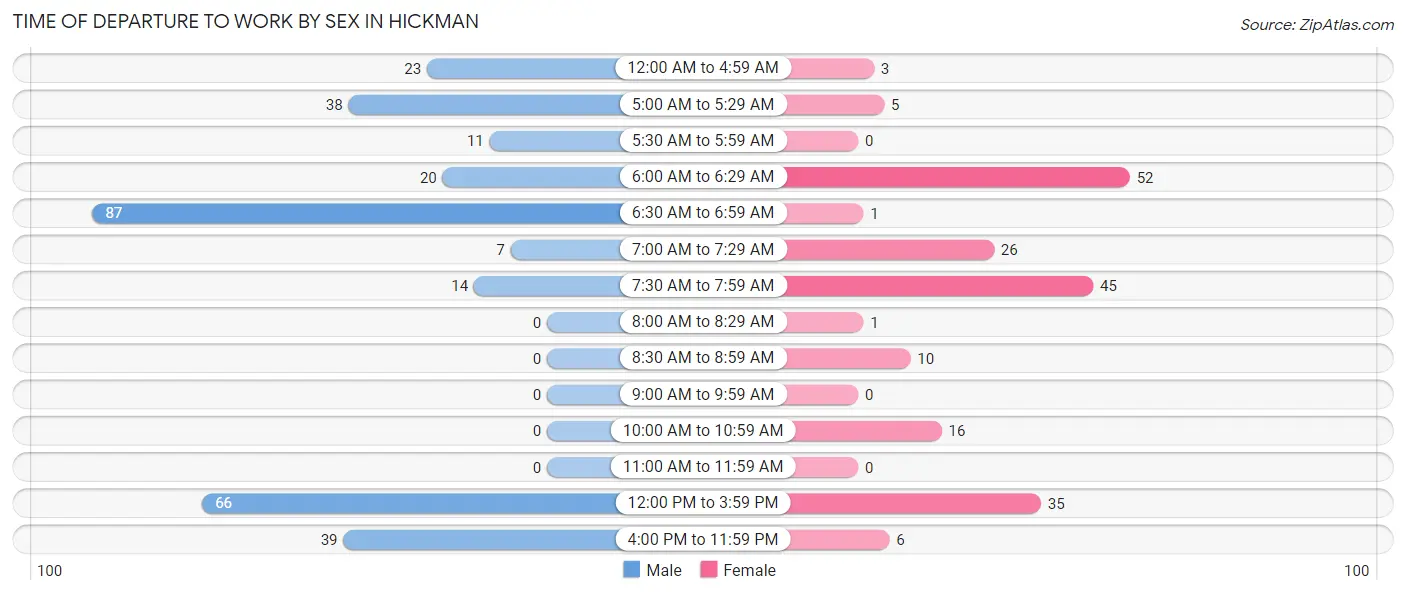
Time of Departure to Work by Sex in Hickman
The most frequent times of departure to work in Hickman are 6:30 AM to 6:59 AM (87, 28.5%) for males and 6:00 AM to 6:29 AM (52, 26.0%) for females.
| Time of Departure | Male | Female |
| 12:00 AM to 4:59 AM | 23 (7.5%) | 3 (1.5%) |
| 5:00 AM to 5:29 AM | 38 (12.5%) | 5 (2.5%) |
| 5:30 AM to 5:59 AM | 11 (3.6%) | 0 (0.0%) |
| 6:00 AM to 6:29 AM | 20 (6.6%) | 52 (26.0%) |
| 6:30 AM to 6:59 AM | 87 (28.5%) | 1 (0.5%) |
| 7:00 AM to 7:29 AM | 7 (2.3%) | 26 (13.0%) |
| 7:30 AM to 7:59 AM | 14 (4.6%) | 45 (22.5%) |
| 8:00 AM to 8:29 AM | 0 (0.0%) | 1 (0.5%) |
| 8:30 AM to 8:59 AM | 0 (0.0%) | 10 (5.0%) |
| 9:00 AM to 9:59 AM | 0 (0.0%) | 0 (0.0%) |
| 10:00 AM to 10:59 AM | 0 (0.0%) | 16 (8.0%) |
| 11:00 AM to 11:59 AM | 0 (0.0%) | 0 (0.0%) |
| 12:00 PM to 3:59 PM | 66 (21.6%) | 35 (17.5%) |
| 4:00 PM to 11:59 PM | 39 (12.8%) | 6 (3.0%) |
| Total | 305 (100.0%) | 200 (100.0%) |
Housing Occupancy in Hickman
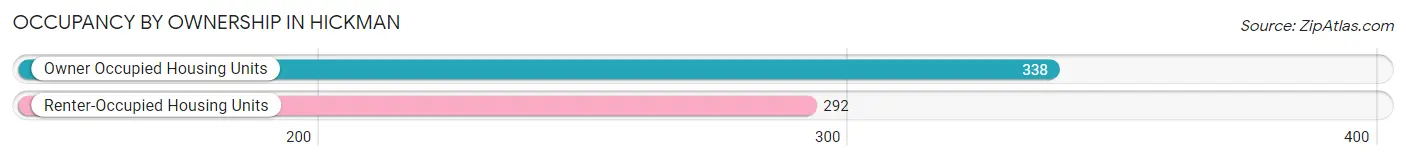
Occupancy by Ownership in Hickman
Of the total 630 dwellings in Hickman, owner-occupied units account for 338 (53.6%), while renter-occupied units make up 292 (46.4%).
| Occupancy | # Housing Units | % Housing Units |
| Owner Occupied Housing Units | 338 | 53.6% |
| Renter-Occupied Housing Units | 292 | 46.4% |
| Total Occupied Housing Units | 630 | 100.0% |
Occupancy by Household Size in Hickman
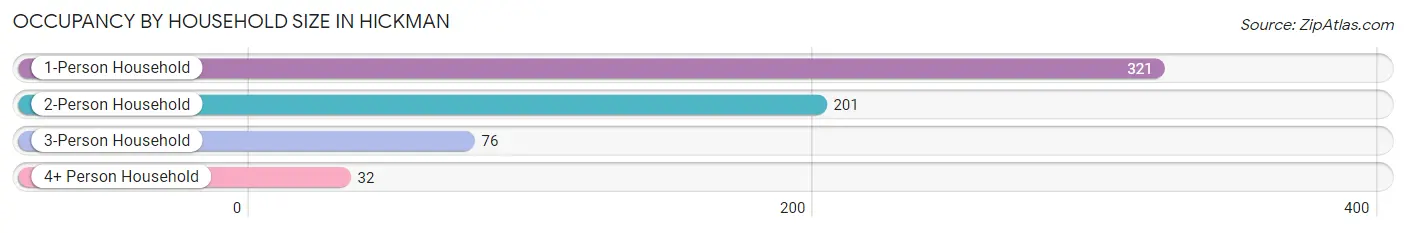
| Household Size | # Housing Units | % Housing Units |
| 1-Person Household | 321 | 50.9% |
| 2-Person Household | 201 | 31.9% |
| 3-Person Household | 76 | 12.1% |
| 4+ Person Household | 32 | 5.1% |
| Total Housing Units | 630 | 100.0% |
Occupancy by Ownership by Household Size in Hickman
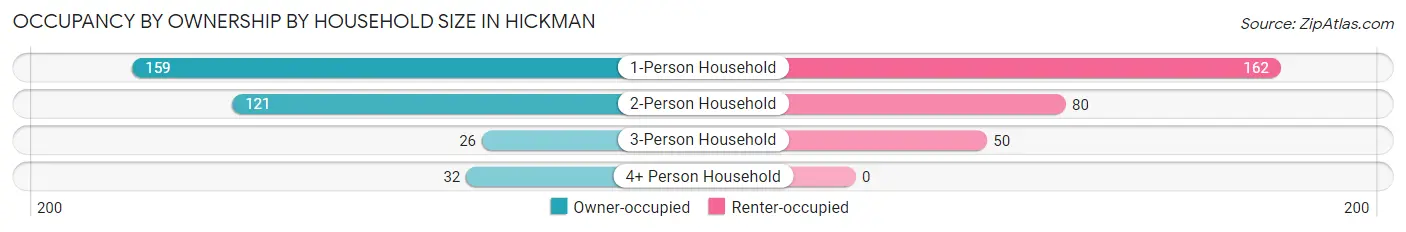
| Household Size | Owner-occupied | Renter-occupied |
| 1-Person Household | 159 (49.5%) | 162 (50.5%) |
| 2-Person Household | 121 (60.2%) | 80 (39.8%) |
| 3-Person Household | 26 (34.2%) | 50 (65.8%) |
| 4+ Person Household | 32 (100.0%) | 0 (0.0%) |
| Total Housing Units | 338 (53.6%) | 292 (46.4%) |
Occupancy by Educational Attainment in Hickman
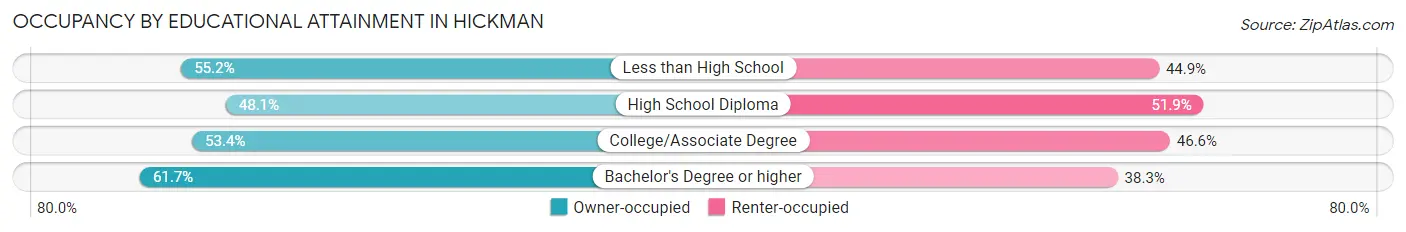
| Household Size | Owner-occupied | Renter-occupied |
| Less than High School | 107 (55.1%) | 87 (44.9%) |
| High School Diploma | 87 (48.1%) | 94 (51.9%) |
| College/Associate Degree | 86 (53.4%) | 75 (46.6%) |
| Bachelor's Degree or higher | 58 (61.7%) | 36 (38.3%) |
Occupancy by Age of Householder in Hickman
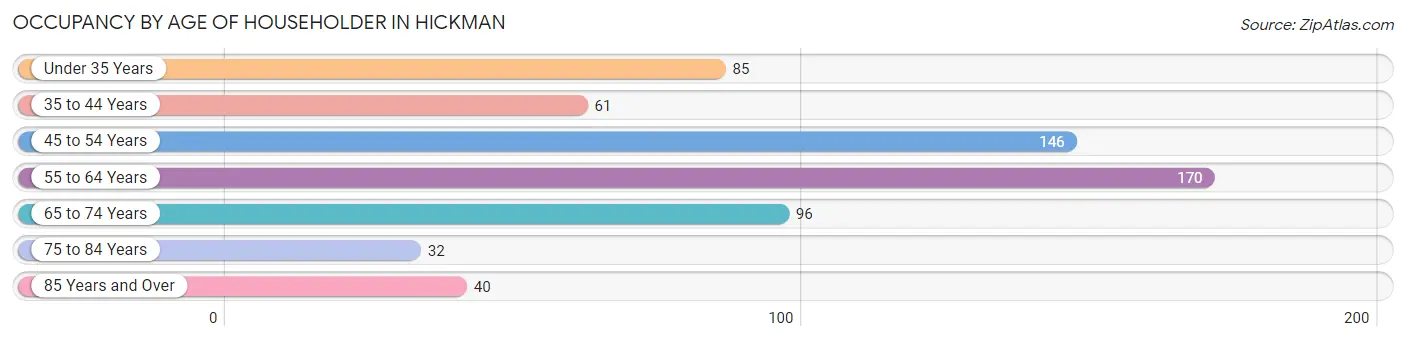
| Age Bracket | # Households | % Households |
| Under 35 Years | 85 | 13.5% |
| 35 to 44 Years | 61 | 9.7% |
| 45 to 54 Years | 146 | 23.2% |
| 55 to 64 Years | 170 | 27.0% |
| 65 to 74 Years | 96 | 15.2% |
| 75 to 84 Years | 32 | 5.1% |
| 85 Years and Over | 40 | 6.4% |
| Total | 630 | 100.0% |
Housing Finances in Hickman
Median Income by Occupancy in Hickman
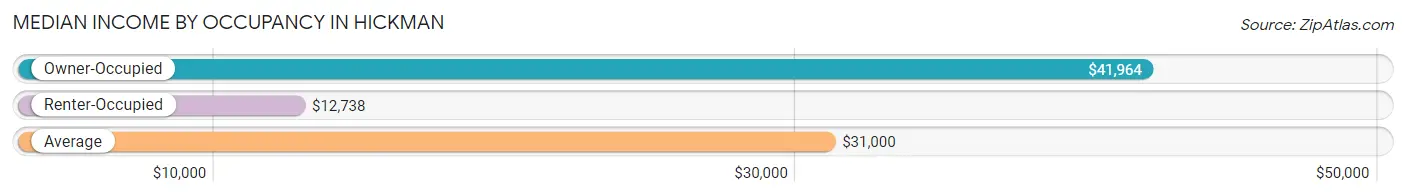
| Occupancy Type | # Households | Median Income |
| Owner-Occupied | 338 (53.6%) | $41,964 |
| Renter-Occupied | 292 (46.4%) | $12,738 |
| Average | 630 (100.0%) | $31,000 |
Occupancy by Householder Income Bracket in Hickman
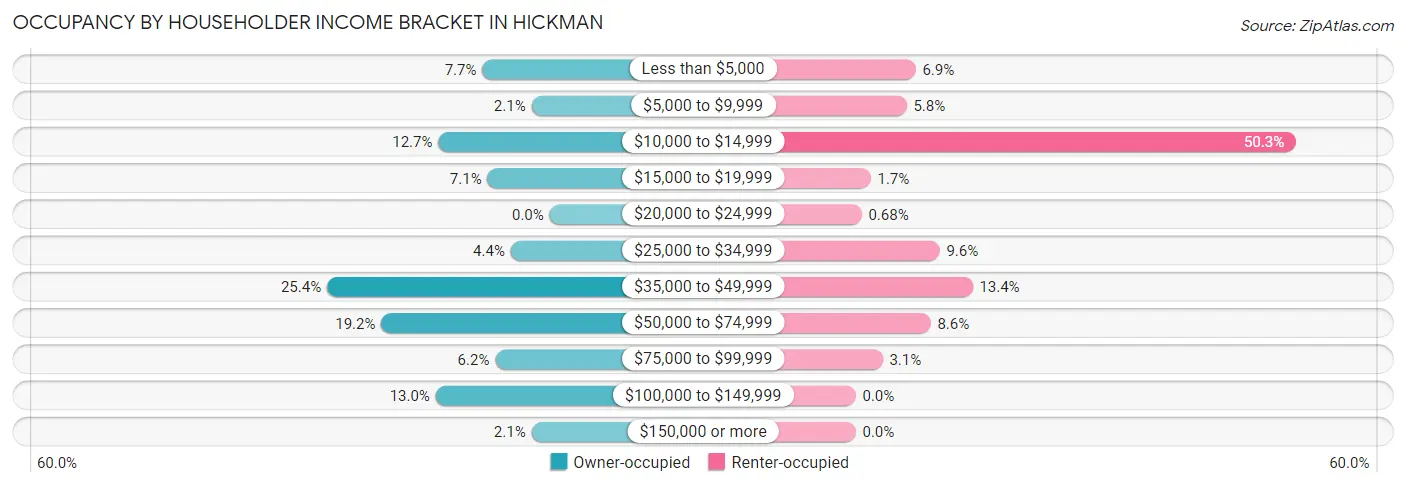
| Income Bracket | Owner-occupied | Renter-occupied |
| Less than $5,000 | 26 (7.7%) | 20 (6.9%) |
| $5,000 to $9,999 | 7 (2.1%) | 17 (5.8%) |
| $10,000 to $14,999 | 43 (12.7%) | 147 (50.3%) |
| $15,000 to $19,999 | 24 (7.1%) | 5 (1.7%) |
| $20,000 to $24,999 | 0 (0.0%) | 2 (0.7%) |
| $25,000 to $34,999 | 15 (4.4%) | 28 (9.6%) |
| $35,000 to $49,999 | 86 (25.4%) | 39 (13.4%) |
| $50,000 to $74,999 | 65 (19.2%) | 25 (8.6%) |
| $75,000 to $99,999 | 21 (6.2%) | 9 (3.1%) |
| $100,000 to $149,999 | 44 (13.0%) | 0 (0.0%) |
| $150,000 or more | 7 (2.1%) | 0 (0.0%) |
| Total | 338 (100.0%) | 292 (100.0%) |
Monthly Housing Cost Tiers in Hickman
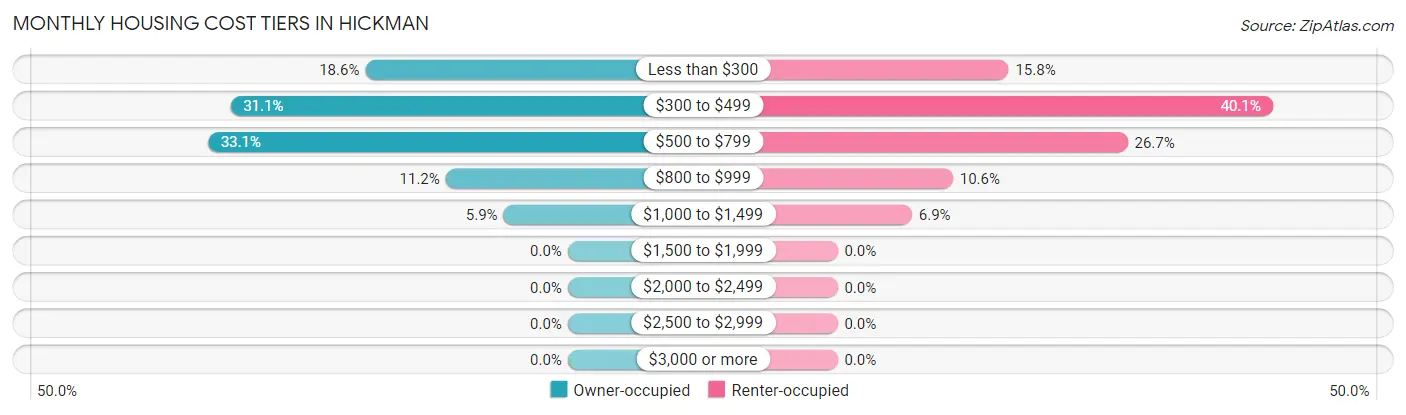
| Monthly Cost | Owner-occupied | Renter-occupied |
| Less than $300 | 63 (18.6%) | 46 (15.8%) |
| $300 to $499 | 105 (31.1%) | 117 (40.1%) |
| $500 to $799 | 112 (33.1%) | 78 (26.7%) |
| $800 to $999 | 38 (11.2%) | 31 (10.6%) |
| $1,000 to $1,499 | 20 (5.9%) | 20 (6.9%) |
| $1,500 to $1,999 | 0 (0.0%) | 0 (0.0%) |
| $2,000 to $2,499 | 0 (0.0%) | 0 (0.0%) |
| $2,500 to $2,999 | 0 (0.0%) | 0 (0.0%) |
| $3,000 or more | 0 (0.0%) | 0 (0.0%) |
| Total | 338 (100.0%) | 292 (100.0%) |
Physical Housing Characteristics in Hickman
Housing Structures in Hickman
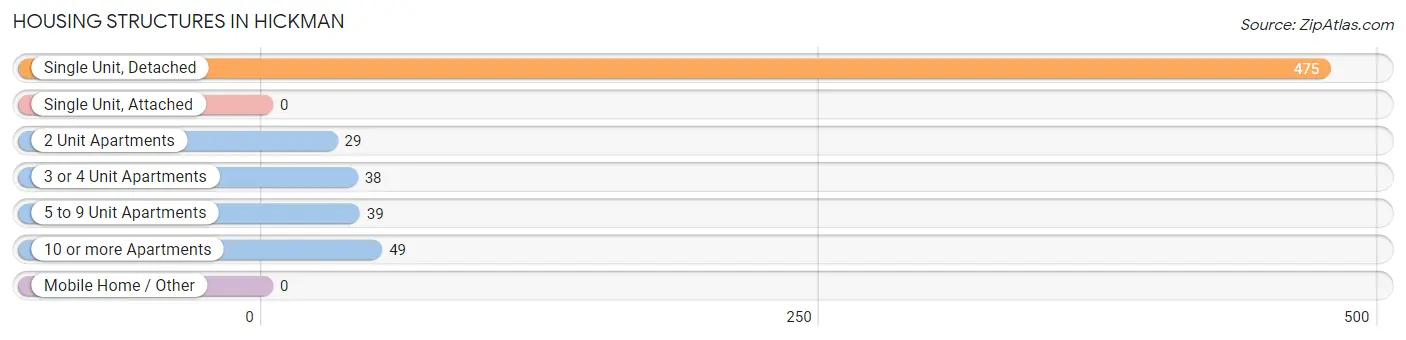
| Structure Type | # Housing Units | % Housing Units |
| Single Unit, Detached | 475 | 75.4% |
| Single Unit, Attached | 0 | 0.0% |
| 2 Unit Apartments | 29 | 4.6% |
| 3 or 4 Unit Apartments | 38 | 6.0% |
| 5 to 9 Unit Apartments | 39 | 6.2% |
| 10 or more Apartments | 49 | 7.8% |
| Mobile Home / Other | 0 | 0.0% |
| Total | 630 | 100.0% |
Housing Structures by Occupancy in Hickman
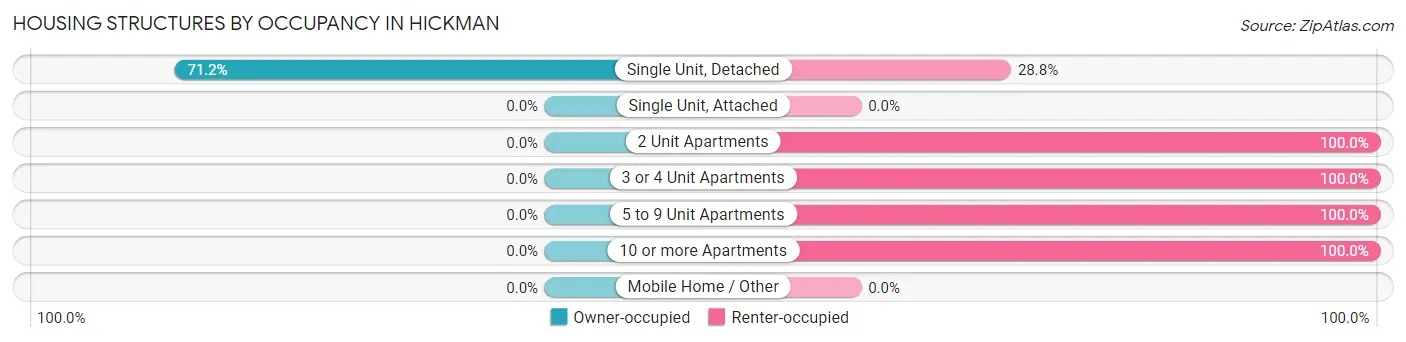
| Structure Type | Owner-occupied | Renter-occupied |
| Single Unit, Detached | 338 (71.2%) | 137 (28.8%) |
| Single Unit, Attached | 0 (0.0%) | 0 (0.0%) |
| 2 Unit Apartments | 0 (0.0%) | 29 (100.0%) |
| 3 or 4 Unit Apartments | 0 (0.0%) | 38 (100.0%) |
| 5 to 9 Unit Apartments | 0 (0.0%) | 39 (100.0%) |
| 10 or more Apartments | 0 (0.0%) | 49 (100.0%) |
| Mobile Home / Other | 0 (0.0%) | 0 (0.0%) |
| Total | 338 (53.6%) | 292 (46.4%) |
Housing Structures by Number of Rooms in Hickman
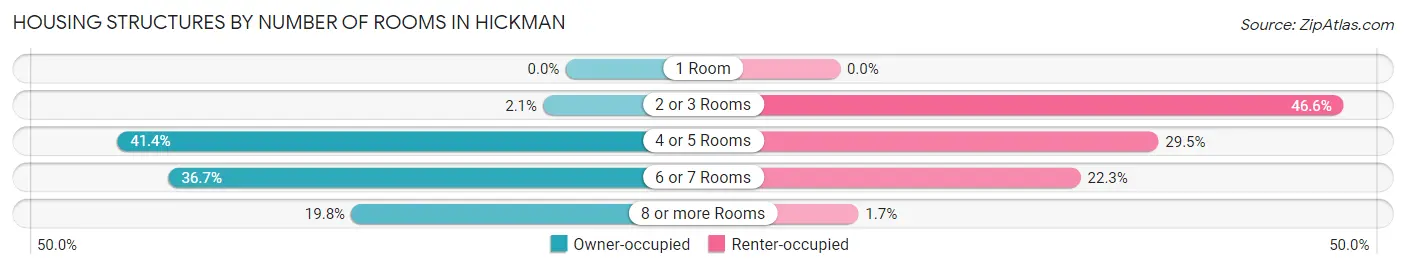
| Number of Rooms | Owner-occupied | Renter-occupied |
| 1 Room | 0 (0.0%) | 0 (0.0%) |
| 2 or 3 Rooms | 7 (2.1%) | 136 (46.6%) |
| 4 or 5 Rooms | 140 (41.4%) | 86 (29.4%) |
| 6 or 7 Rooms | 124 (36.7%) | 65 (22.3%) |
| 8 or more Rooms | 67 (19.8%) | 5 (1.7%) |
| Total | 338 (100.0%) | 292 (100.0%) |
Housing Structure by Heating Type in Hickman
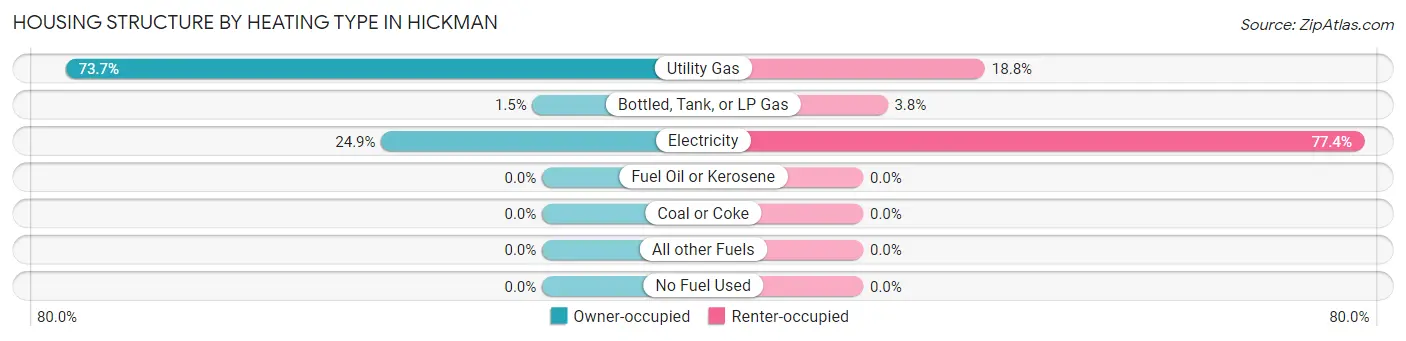
| Heating Type | Owner-occupied | Renter-occupied |
| Utility Gas | 249 (73.7%) | 55 (18.8%) |
| Bottled, Tank, or LP Gas | 5 (1.5%) | 11 (3.8%) |
| Electricity | 84 (24.8%) | 226 (77.4%) |
| Fuel Oil or Kerosene | 0 (0.0%) | 0 (0.0%) |
| Coal or Coke | 0 (0.0%) | 0 (0.0%) |
| All other Fuels | 0 (0.0%) | 0 (0.0%) |
| No Fuel Used | 0 (0.0%) | 0 (0.0%) |
| Total | 338 (100.0%) | 292 (100.0%) |
Household Vehicle Usage in Hickman
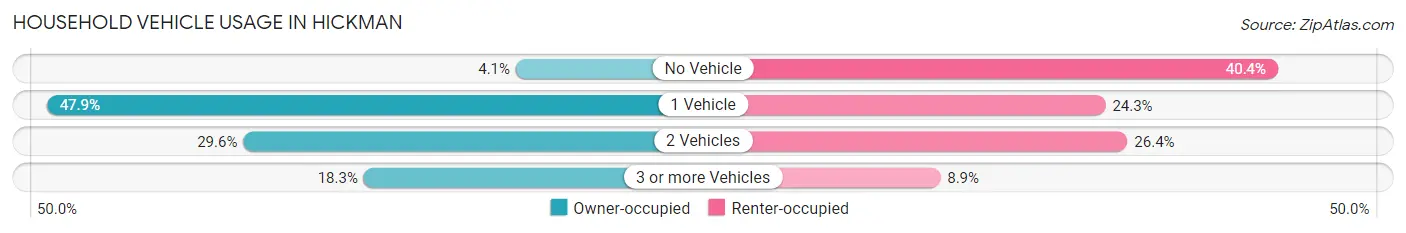
| Vehicles per Household | Owner-occupied | Renter-occupied |
| No Vehicle | 14 (4.1%) | 118 (40.4%) |
| 1 Vehicle | 162 (47.9%) | 71 (24.3%) |
| 2 Vehicles | 100 (29.6%) | 77 (26.4%) |
| 3 or more Vehicles | 62 (18.3%) | 26 (8.9%) |
| Total | 338 (100.0%) | 292 (100.0%) |
Real Estate & Mortgages in Hickman
Real Estate and Mortgage Overview in Hickman
| Characteristic | Without Mortgage | With Mortgage |
| Housing Units | 239 | 99 |
| Median Property Value | $56,000 | $70,200 |
| Median Household Income | $36,875 | $0 |
| Monthly Housing Costs | $380 | $0 |
| Real Estate Taxes | $426 | $0 |
Property Value by Mortgage Status in Hickman
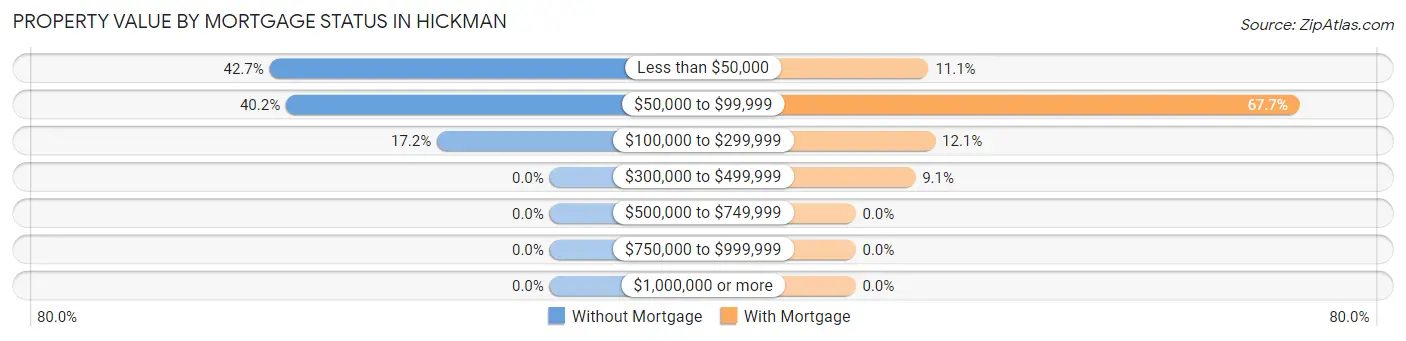
| Property Value | Without Mortgage | With Mortgage |
| Less than $50,000 | 102 (42.7%) | 11 (11.1%) |
| $50,000 to $99,999 | 96 (40.2%) | 67 (67.7%) |
| $100,000 to $299,999 | 41 (17.2%) | 12 (12.1%) |
| $300,000 to $499,999 | 0 (0.0%) | 9 (9.1%) |
| $500,000 to $749,999 | 0 (0.0%) | 0 (0.0%) |
| $750,000 to $999,999 | 0 (0.0%) | 0 (0.0%) |
| $1,000,000 or more | 0 (0.0%) | 0 (0.0%) |
| Total | 239 (100.0%) | 99 (100.0%) |
Household Income by Mortgage Status in Hickman
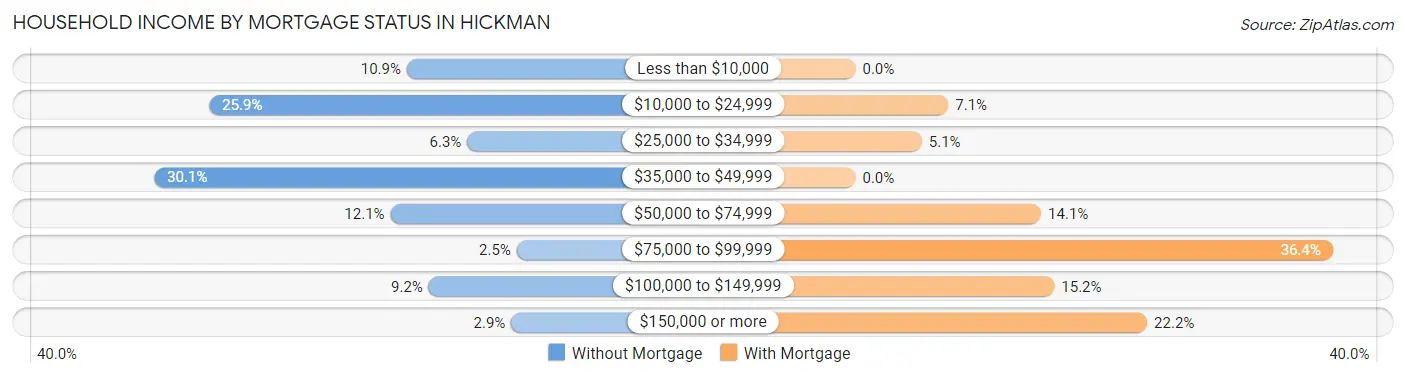
| Household Income | Without Mortgage | With Mortgage |
| Less than $10,000 | 26 (10.9%) | 0 (0.0%) |
| $10,000 to $24,999 | 62 (25.9%) | 7 (7.1%) |
| $25,000 to $34,999 | 15 (6.3%) | 5 (5.1%) |
| $35,000 to $49,999 | 72 (30.1%) | 0 (0.0%) |
| $50,000 to $74,999 | 29 (12.1%) | 14 (14.1%) |
| $75,000 to $99,999 | 6 (2.5%) | 36 (36.4%) |
| $100,000 to $149,999 | 22 (9.2%) | 15 (15.1%) |
| $150,000 or more | 7 (2.9%) | 22 (22.2%) |
| Total | 239 (100.0%) | 99 (100.0%) |
Property Value to Household Income Ratio in Hickman
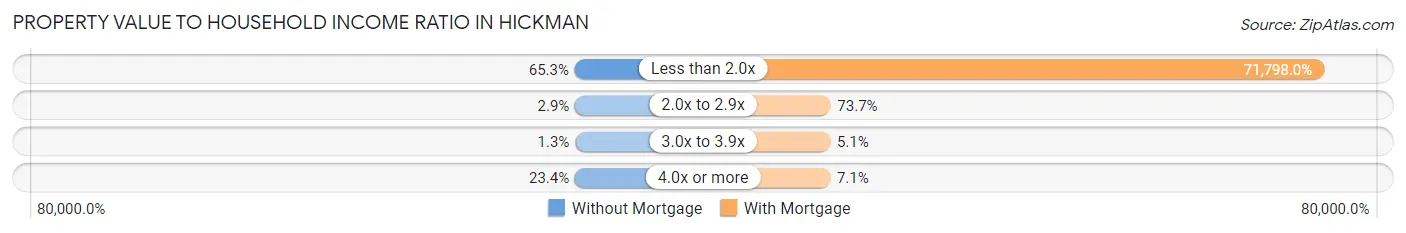
| Value-to-Income Ratio | Without Mortgage | With Mortgage |
| Less than 2.0x | 156 (65.3%) | 71,080 (71,798.0%) |
| 2.0x to 2.9x | 7 (2.9%) | 73 (73.7%) |
| 3.0x to 3.9x | 3 (1.3%) | 5 (5.1%) |
| 4.0x or more | 56 (23.4%) | 7 (7.1%) |
| Total | 239 (100.0%) | 99 (100.0%) |
Real Estate Taxes by Mortgage Status in Hickman
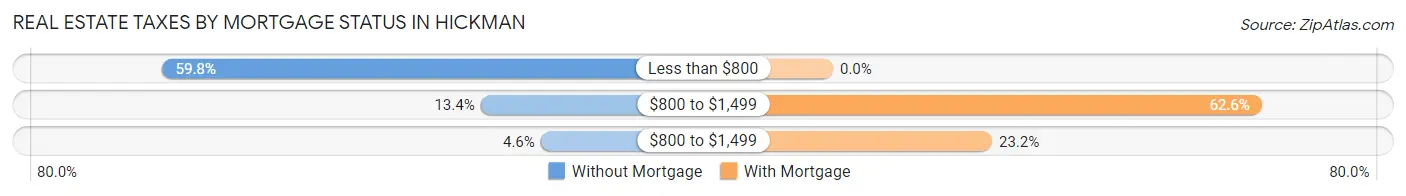
| Property Taxes | Without Mortgage | With Mortgage |
| Less than $800 | 143 (59.8%) | 0 (0.0%) |
| $800 to $1,499 | 32 (13.4%) | 62 (62.6%) |
| $800 to $1,499 | 11 (4.6%) | 23 (23.2%) |
| Total | 239 (100.0%) | 99 (100.0%) |
Health & Disability in Hickman
Health Insurance Coverage by Age in Hickman
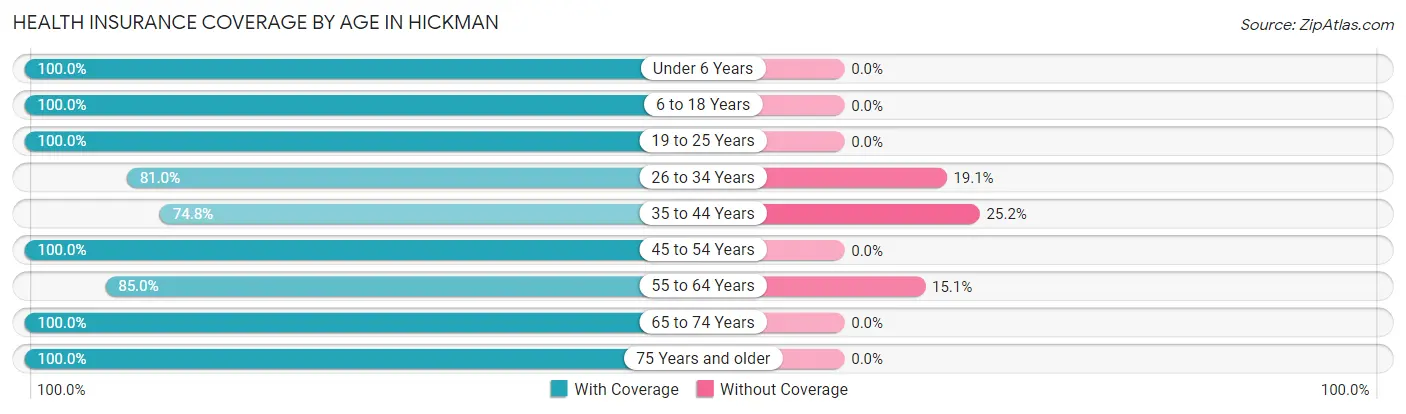
| Age Bracket | With Coverage | Without Coverage |
| Under 6 Years | 86 (100.0%) | 0 (0.0%) |
| 6 to 18 Years | 148 (100.0%) | 0 (0.0%) |
| 19 to 25 Years | 259 (100.0%) | 0 (0.0%) |
| 26 to 34 Years | 85 (80.9%) | 20 (19.1%) |
| 35 to 44 Years | 77 (74.8%) | 26 (25.2%) |
| 45 to 54 Years | 185 (100.0%) | 0 (0.0%) |
| 55 to 64 Years | 254 (85.0%) | 45 (15.0%) |
| 65 to 74 Years | 194 (100.0%) | 0 (0.0%) |
| 75 Years and older | 79 (100.0%) | 0 (0.0%) |
| Total | 1,367 (93.8%) | 91 (6.2%) |
Health Insurance Coverage by Citizenship Status in Hickman
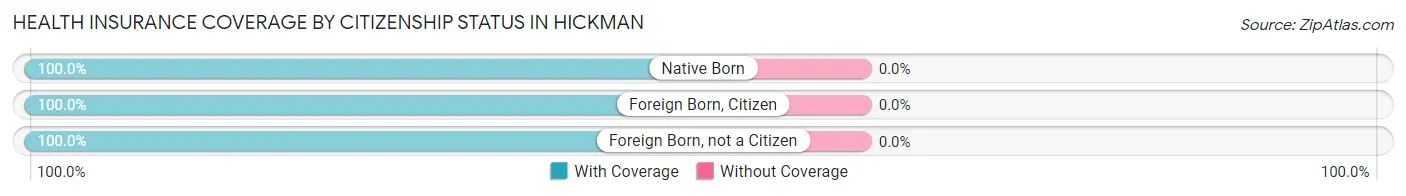
| Citizenship Status | With Coverage | Without Coverage |
| Native Born | 86 (100.0%) | 0 (0.0%) |
| Foreign Born, Citizen | 148 (100.0%) | 0 (0.0%) |
| Foreign Born, not a Citizen | 259 (100.0%) | 0 (0.0%) |
Health Insurance Coverage by Household Income in Hickman
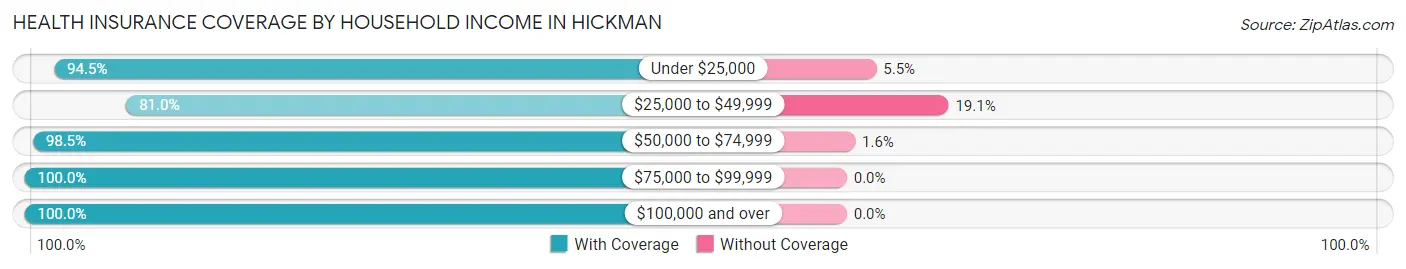
| Household Income | With Coverage | Without Coverage |
| Under $25,000 | 443 (94.5%) | 26 (5.5%) |
| $25,000 to $49,999 | 255 (80.9%) | 60 (19.1%) |
| $50,000 to $74,999 | 318 (98.5%) | 5 (1.5%) |
| $75,000 to $99,999 | 120 (100.0%) | 0 (0.0%) |
| $100,000 and over | 231 (100.0%) | 0 (0.0%) |
Public vs Private Health Insurance Coverage by Age in Hickman
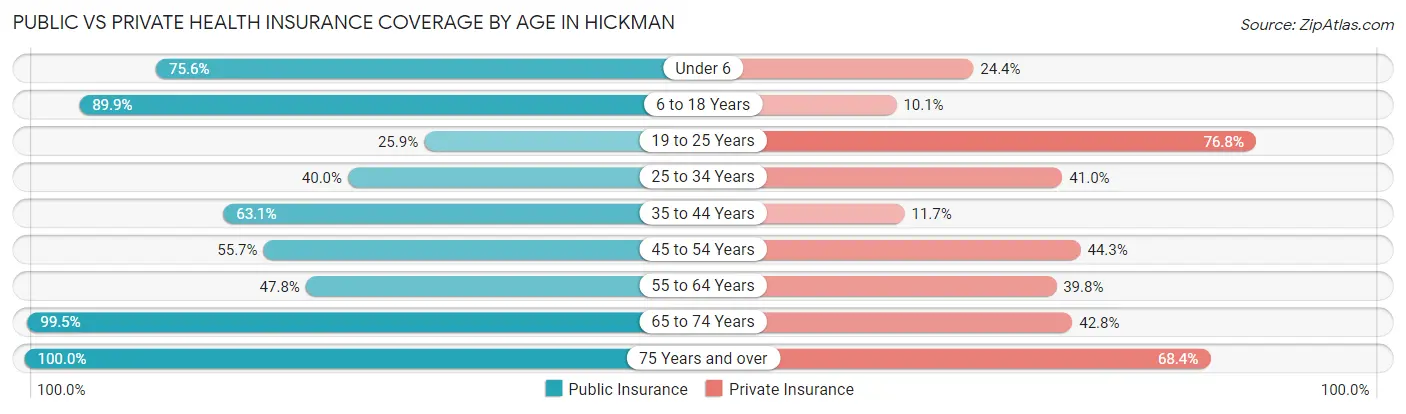
| Age Bracket | Public Insurance | Private Insurance |
| Under 6 | 65 (75.6%) | 21 (24.4%) |
| 6 to 18 Years | 133 (89.9%) | 15 (10.1%) |
| 19 to 25 Years | 67 (25.9%) | 199 (76.8%) |
| 25 to 34 Years | 42 (40.0%) | 43 (40.9%) |
| 35 to 44 Years | 65 (63.1%) | 12 (11.7%) |
| 45 to 54 Years | 103 (55.7%) | 82 (44.3%) |
| 55 to 64 Years | 143 (47.8%) | 119 (39.8%) |
| 65 to 74 Years | 193 (99.5%) | 83 (42.8%) |
| 75 Years and over | 79 (100.0%) | 54 (68.3%) |
| Total | 890 (61.0%) | 628 (43.1%) |
Disability Status by Sex by Age in Hickman
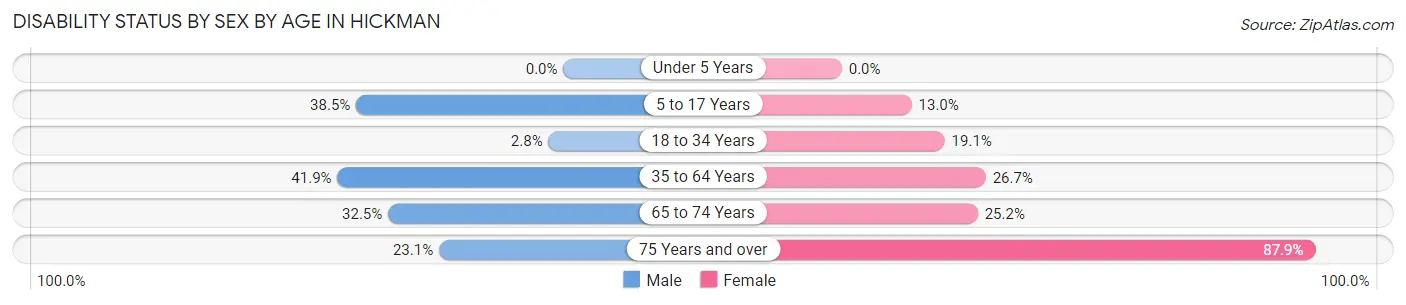
| Age Bracket | Male | Female |
| Under 5 Years | 0 (0.0%) | 0 (0.0%) |
| 5 to 17 Years | 45 (38.5%) | 7 (13.0%) |
| 18 to 34 Years | 7 (2.8%) | 21 (19.1%) |
| 35 to 64 Years | 130 (41.9%) | 74 (26.7%) |
| 65 to 74 Years | 27 (32.5%) | 28 (25.2%) |
| 75 Years and over | 3 (23.1%) | 58 (87.9%) |
Disability Class by Sex by Age in Hickman
Disability Class: Hearing Difficulty
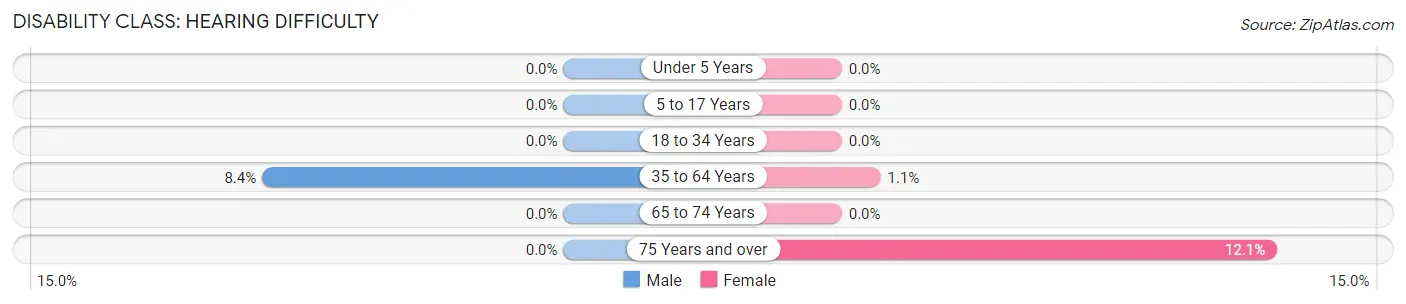
| Age Bracket | Male | Female |
| Under 5 Years | 0 (0.0%) | 0 (0.0%) |
| 5 to 17 Years | 0 (0.0%) | 0 (0.0%) |
| 18 to 34 Years | 0 (0.0%) | 0 (0.0%) |
| 35 to 64 Years | 26 (8.4%) | 3 (1.1%) |
| 65 to 74 Years | 0 (0.0%) | 0 (0.0%) |
| 75 Years and over | 0 (0.0%) | 8 (12.1%) |
Disability Class: Vision Difficulty
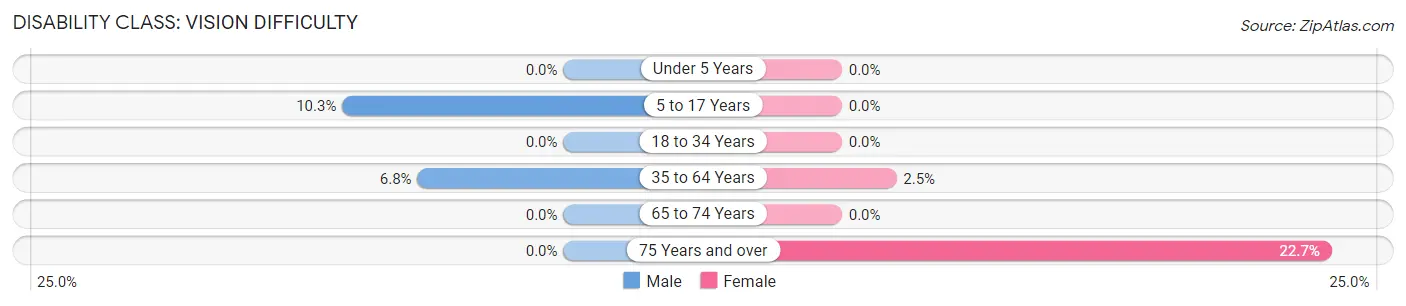
| Age Bracket | Male | Female |
| Under 5 Years | 0 (0.0%) | 0 (0.0%) |
| 5 to 17 Years | 12 (10.3%) | 0 (0.0%) |
| 18 to 34 Years | 0 (0.0%) | 0 (0.0%) |
| 35 to 64 Years | 21 (6.8%) | 7 (2.5%) |
| 65 to 74 Years | 0 (0.0%) | 0 (0.0%) |
| 75 Years and over | 0 (0.0%) | 15 (22.7%) |
Disability Class: Cognitive Difficulty
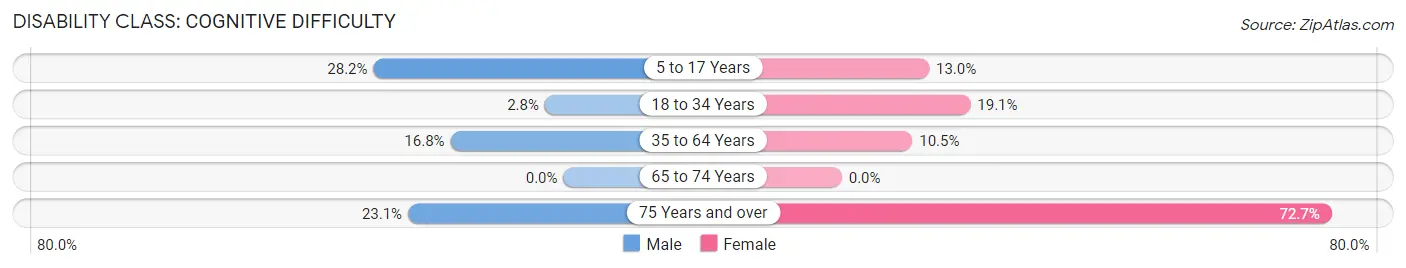
| Age Bracket | Male | Female |
| 5 to 17 Years | 33 (28.2%) | 7 (13.0%) |
| 18 to 34 Years | 7 (2.8%) | 21 (19.1%) |
| 35 to 64 Years | 52 (16.8%) | 29 (10.5%) |
| 65 to 74 Years | 0 (0.0%) | 0 (0.0%) |
| 75 Years and over | 3 (23.1%) | 48 (72.7%) |
Disability Class: Ambulatory Difficulty
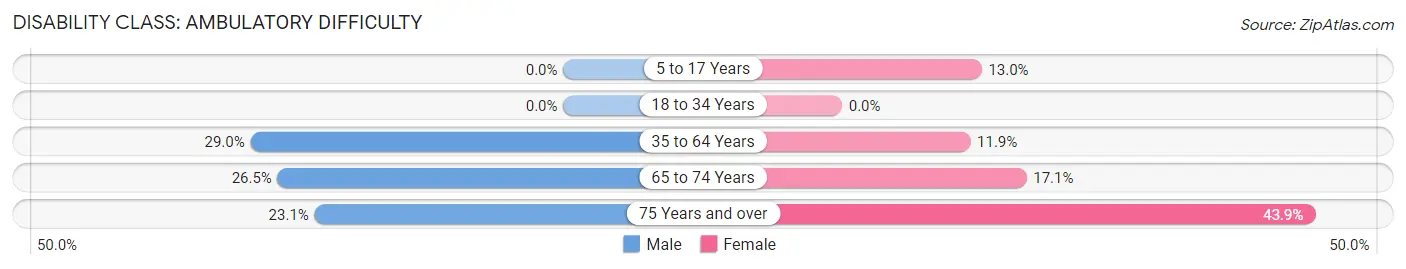
| Age Bracket | Male | Female |
| 5 to 17 Years | 0 (0.0%) | 7 (13.0%) |
| 18 to 34 Years | 0 (0.0%) | 0 (0.0%) |
| 35 to 64 Years | 90 (29.0%) | 33 (11.9%) |
| 65 to 74 Years | 22 (26.5%) | 19 (17.1%) |
| 75 Years and over | 3 (23.1%) | 29 (43.9%) |
Disability Class: Self-Care Difficulty
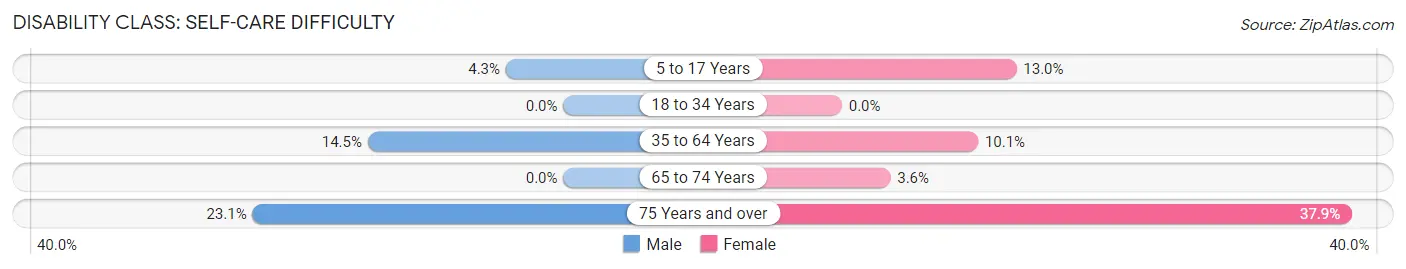
| Age Bracket | Male | Female |
| 5 to 17 Years | 5 (4.3%) | 7 (13.0%) |
| 18 to 34 Years | 0 (0.0%) | 0 (0.0%) |
| 35 to 64 Years | 45 (14.5%) | 28 (10.1%) |
| 65 to 74 Years | 0 (0.0%) | 4 (3.6%) |
| 75 Years and over | 3 (23.1%) | 25 (37.9%) |
Technology Access in Hickman
Computing Device Access in Hickman
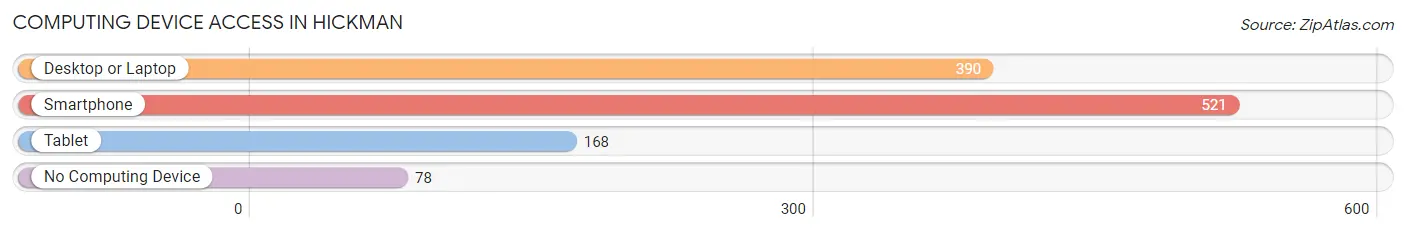
| Device Type | # Households | % Households |
| Desktop or Laptop | 390 | 61.9% |
| Smartphone | 521 | 82.7% |
| Tablet | 168 | 26.7% |
| No Computing Device | 78 | 12.4% |
| Total | 630 | 100.0% |
Internet Access in Hickman
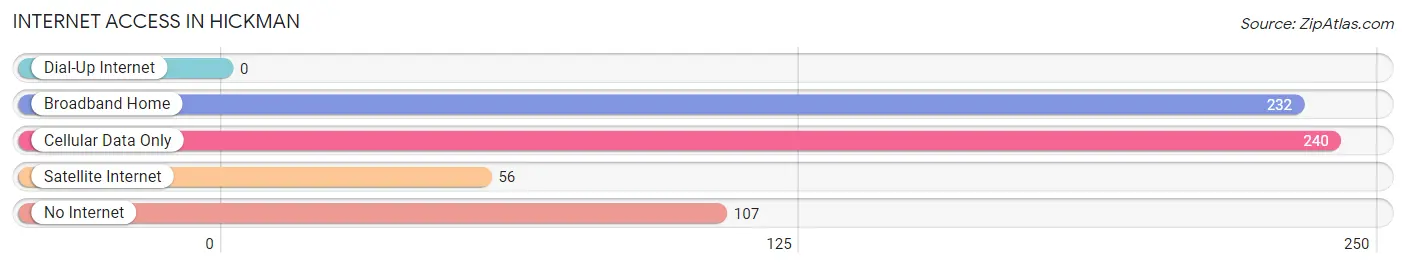
| Internet Type | # Households | % Households |
| Dial-Up Internet | 0 | 0.0% |
| Broadband Home | 232 | 36.8% |
| Cellular Data Only | 240 | 38.1% |
| Satellite Internet | 56 | 8.9% |
| No Internet | 107 | 17.0% |
| Total | 630 | 100.0% |
Hickman Summary
Hickman, Kentucky is a small city located in Fulton County, Kentucky, United States. It is situated along the Mississippi River, just south of the Kentucky-Tennessee border. The city has a population of approximately 2,000 people and is the county seat of Fulton County.
History
Hickman was founded in 1819 by William Hickman, a Revolutionary War veteran. The city was named after him and was incorporated in 1836. The city was a major port on the Mississippi River and was a major hub for the steamboat industry. The city was also a major center for the cotton industry, with many plantations located in the area.
In the late 19th century, Hickman was a major stop on the Illinois Central Railroad. The railroad brought many new people to the area, and the city grew rapidly. By the early 20th century, Hickman had become a major center for the lumber industry. The city was also home to several large manufacturing plants, including a cotton mill, a paper mill, and a furniture factory.
Geography
Hickman is located in western Kentucky, along the Mississippi River. The city is situated at the intersection of US Highway 51 and Kentucky Route 94. The city is surrounded by rolling hills and farmland. The city is located approximately 30 miles south of Paducah, Kentucky and approximately 50 miles north of Memphis, Tennessee.
Economy
Hickman’s economy is largely based on agriculture and manufacturing. The city is home to several large manufacturing plants, including a cotton mill, a paper mill, and a furniture factory. The city is also home to several large farms, which produce corn, soybeans, and other crops.
The city is also home to several small businesses, including restaurants, retail stores, and service providers. The city is also home to several tourist attractions, including the Hickman County Museum and the Hickman County Historical Society.
Demographics
As of the 2010 census, the population of Hickman was 2,000. The racial makeup of the city was 95.2% White, 2.2% African American, 0.2% Native American, 0.2% Asian, 0.2% from other races, and 1.9% from two or more races. Hispanic or Latino of any race were 0.7% of the population.
The median income for a household in the city was $30,000, and the median income for a family was $35,000. The per capita income for the city was $15,000. About 17.2% of families and 19.2% of the population were below the poverty line, including 25.2% of those under age 18 and 11.2% of those age 65 or over.
Hickman is a small city with a rich history and a diverse economy. The city is home to several large manufacturing plants and farms, as well as several small businesses. The city is also home to several tourist attractions, including the Hickman County Museum and the Hickman County Historical Society. The city has a population of approximately 2,000 people and is the county seat of Fulton County.
Common Questions
What is Per Capita Income in Hickman?
Per Capita income in Hickman is $18,976.
What is the Median Family Income in Hickman?
Median Family Income in Hickman is $57,813.
What is the Median Household income in Hickman?
Median Household Income in Hickman is $31,000.
What is Income or Wage Gap in Hickman?
Income or Wage Gap in Hickman is 13.1%.
Women in Hickman earn 86.9 cents for every dollar earned by a man.
What is Inequality or Gini Index in Hickman?
Inequality or Gini Index in Hickman is 0.49.
What is the Total Population of Hickman?
Total Population of Hickman is 1,884.
What is the Total Male Population of Hickman?
Total Male Population of Hickman is 1,194.
What is the Total Female Population of Hickman?
Total Female Population of Hickman is 690.
What is the Ratio of Males per 100 Females in Hickman?
There are 173.04 Males per 100 Females in Hickman.
What is the Ratio of Females per 100 Males in Hickman?
There are 57.79 Females per 100 Males in Hickman.
What is the Median Population Age in Hickman?
Median Population Age in Hickman is 42.8 Years.
What is the Average Family Size in Hickman
Average Family Size in Hickman is 3.9 People.
What is the Average Household Size in Hickman
Average Household Size in Hickman is 2.3 People.
How Large is the Labor Force in Hickman?
There are 559 People in the Labor Forcein in Hickman.
What is the Percentage of People in the Labor Force in Hickman?
33.1% of People are in the Labor Force in Hickman.
What is the Unemployment Rate in Hickman?
Unemployment Rate in Hickman is 4.9%.