Hawesville, KY Map & Demographics
Hawesville Map
Hawesville Overview
$34,752
PER CAPITA INCOME
$67,500
AVG FAMILY INCOME
$54,423
AVG HOUSEHOLD INCOME
13.8%
WAGE / INCOME GAP [ % ]
86.2¢/ $1
WAGE / INCOME GAP [ $ ]
0.45
INEQUALITY / GINI INDEX
1,043
TOTAL POPULATION
546
MALE POPULATION
497
FEMALE POPULATION
109.86
MALES / 100 FEMALES
91.03
FEMALES / 100 MALES
31.9
MEDIAN AGE
2.5
AVG FAMILY SIZE
2.3
AVG HOUSEHOLD SIZE
528
LABOR FORCE [ PEOPLE ]
59.6%
PERCENT IN LABOR FORCE
7.0%
UNEMPLOYMENT RATE
Hawesville Zip Codes
Hawesville Area Codes
Income in Hawesville
Income Overview in Hawesville
Per Capita Income in Hawesville is $34,752, while median incomes of families and households are $67,500 and $54,423 respectively.
| Characteristic | Number | Measure |
| Per Capita Income | 1,043 | $34,752 |
| Median Family Income | 280 | $67,500 |
| Mean Family Income | 280 | $80,762 |
| Median Household Income | 460 | $54,423 |
| Mean Household Income | 460 | $78,105 |
| Income Deficit | 280 | $0 |
| Wage / Income Gap (%) | 1,043 | 13.76% |
| Wage / Income Gap ($) | 1,043 | 86.24¢ per $1 |
| Gini / Inequality Index | 1,043 | 0.45 |
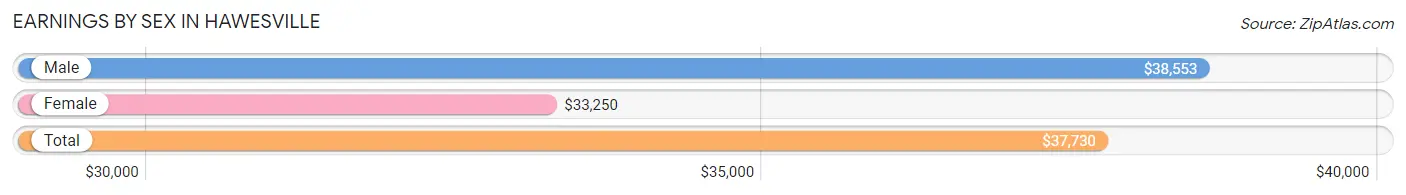
Earnings by Sex in Hawesville
Average Earnings in Hawesville are $37,730, $38,553 for men and $33,250 for women, a difference of 13.8%.
| Sex | Number | Average Earnings |
| Male | 314 (56.0%) | $38,553 |
| Female | 247 (44.0%) | $33,250 |
| Total | 561 (100.0%) | $37,730 |
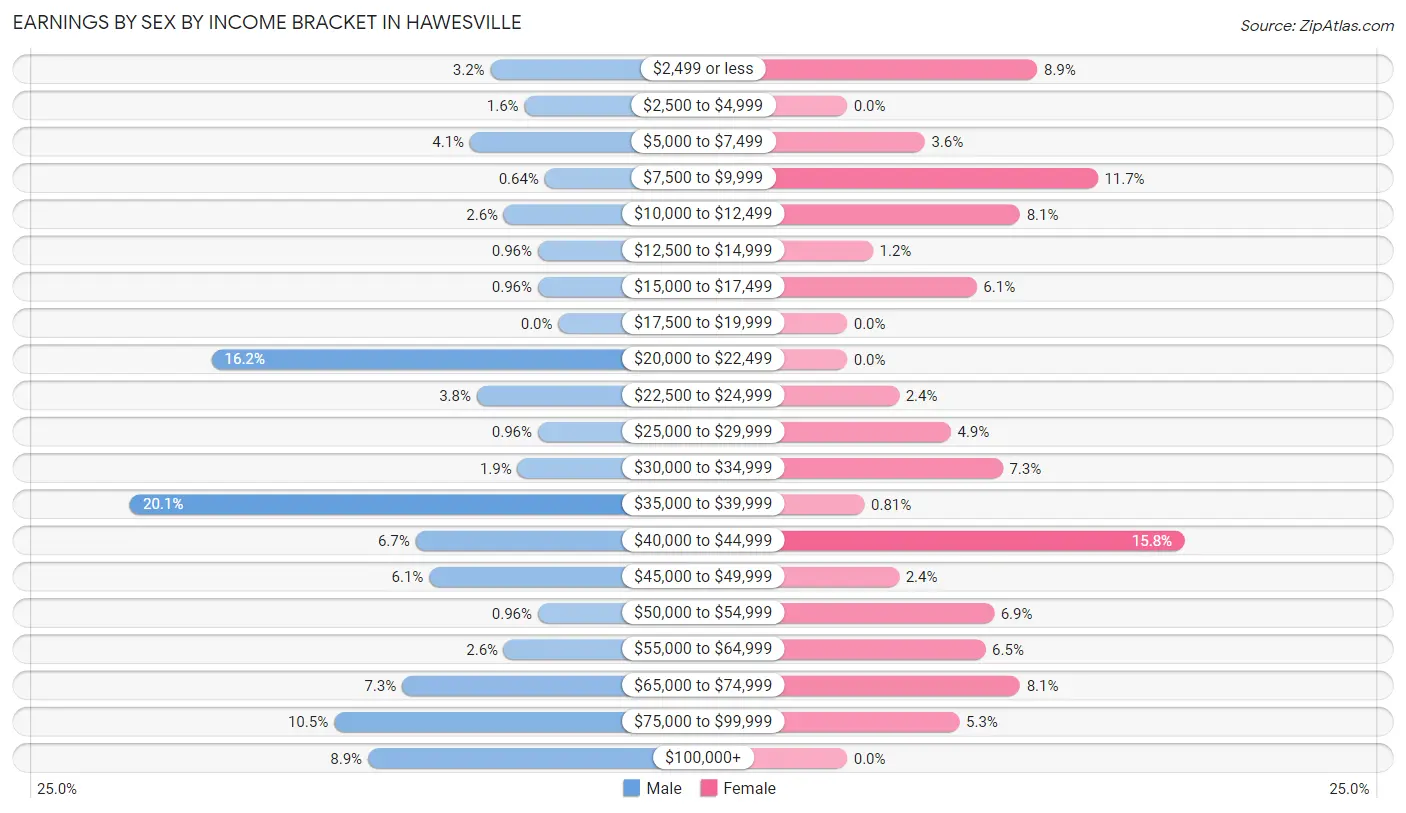
Earnings by Sex by Income Bracket in Hawesville
The most common earnings brackets in Hawesville are $35,000 to $39,999 for men (63 | 20.1%) and $40,000 to $44,999 for women (39 | 15.8%).
| Income | Male | Female |
| $2,499 or less | 10 (3.2%) | 22 (8.9%) |
| $2,500 to $4,999 | 5 (1.6%) | 0 (0.0%) |
| $5,000 to $7,499 | 13 (4.1%) | 9 (3.6%) |
| $7,500 to $9,999 | 2 (0.6%) | 29 (11.7%) |
| $10,000 to $12,499 | 8 (2.5%) | 20 (8.1%) |
| $12,500 to $14,999 | 3 (1.0%) | 3 (1.2%) |
| $15,000 to $17,499 | 3 (1.0%) | 15 (6.1%) |
| $17,500 to $19,999 | 0 (0.0%) | 0 (0.0%) |
| $20,000 to $22,499 | 51 (16.2%) | 0 (0.0%) |
| $22,500 to $24,999 | 12 (3.8%) | 6 (2.4%) |
| $25,000 to $29,999 | 3 (1.0%) | 12 (4.9%) |
| $30,000 to $34,999 | 6 (1.9%) | 18 (7.3%) |
| $35,000 to $39,999 | 63 (20.1%) | 2 (0.8%) |
| $40,000 to $44,999 | 21 (6.7%) | 39 (15.8%) |
| $45,000 to $49,999 | 19 (6.0%) | 6 (2.4%) |
| $50,000 to $54,999 | 3 (1.0%) | 17 (6.9%) |
| $55,000 to $64,999 | 8 (2.5%) | 16 (6.5%) |
| $65,000 to $74,999 | 23 (7.3%) | 20 (8.1%) |
| $75,000 to $99,999 | 33 (10.5%) | 13 (5.3%) |
| $100,000+ | 28 (8.9%) | 0 (0.0%) |
| Total | 314 (100.0%) | 247 (100.0%) |
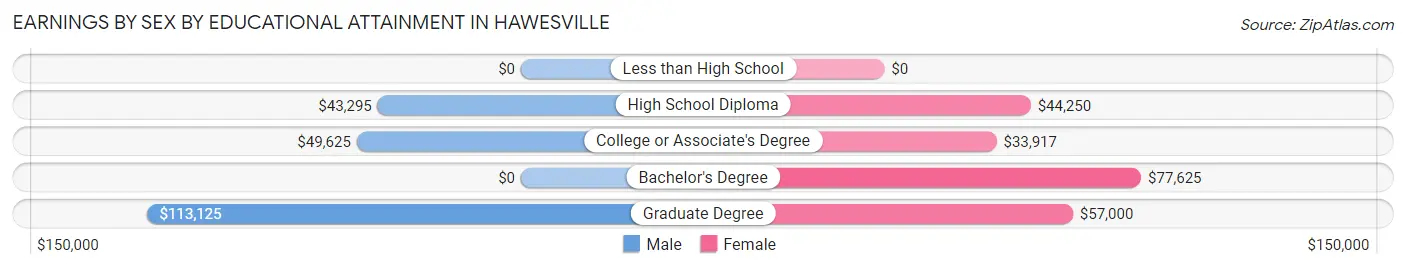
Earnings by Sex by Educational Attainment in Hawesville
Average earnings in Hawesville are $42,596 for men and $43,750 for women, a difference of 2.6%. Men with an educational attainment of graduate degree enjoy the highest average annual earnings of $113,125, while those with high school diploma education earn the least with $43,295. Women with an educational attainment of bachelor's degree earn the most with the average annual earnings of $77,625, while those with college or associate's degree education have the smallest earnings of $33,917.
| Educational Attainment | Male Income | Female Income |
| Less than High School | - | - |
| High School Diploma | $43,295 | $44,250 |
| College or Associate's Degree | $49,625 | $33,917 |
| Bachelor's Degree | - | - |
| Graduate Degree | $113,125 | $57,000 |
| Total | $42,596 | $43,750 |
Family Income in Hawesville
Family Income Brackets in Hawesville
According to the Hawesville family income data, there are 63 families falling into the $100,000 to $149,999 income range, which is the most common income bracket and makes up 22.5% of all families. Conversely, the less than $10,000 income bracket is the least frequent group with only 3 families (1.1%) belonging to this category.
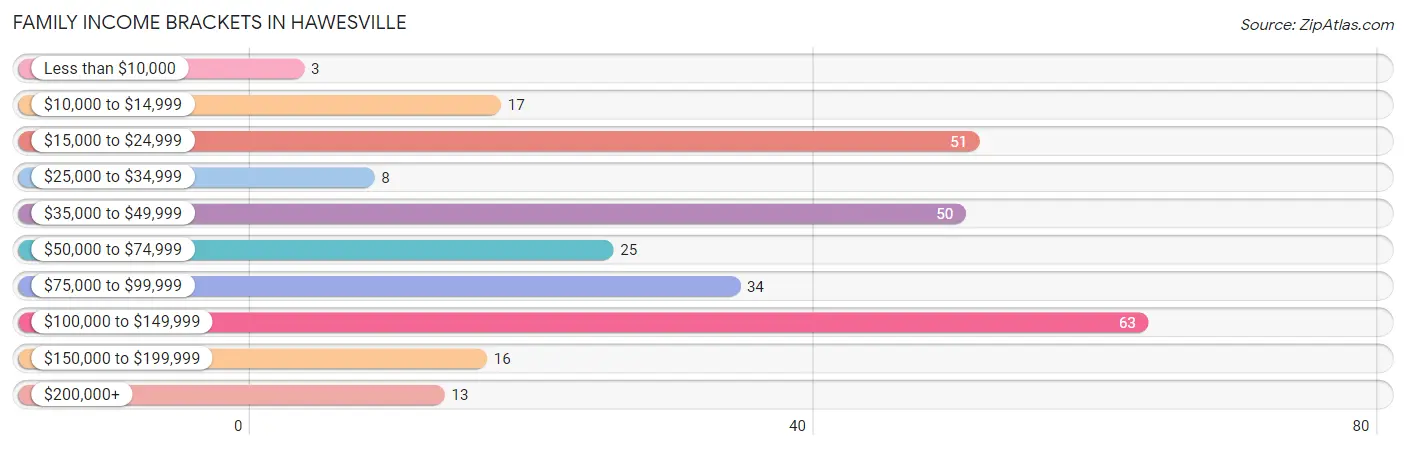
| Income Bracket | # Families | % Families |
| Less than $10,000 | 3 | 1.1% |
| $10,000 to $14,999 | 17 | 6.1% |
| $15,000 to $24,999 | 51 | 18.2% |
| $25,000 to $34,999 | 8 | 2.9% |
| $35,000 to $49,999 | 50 | 17.9% |
| $50,000 to $74,999 | 25 | 8.9% |
| $75,000 to $99,999 | 34 | 12.1% |
| $100,000 to $149,999 | 63 | 22.5% |
| $150,000 to $199,999 | 16 | 5.7% |
| $200,000+ | 13 | 4.6% |
Family Income by Famaliy Size in Hawesville
3-person families (22 | 7.9%) account for the highest median family income in Hawesville with $136,250 per family, while 3-person families (22 | 7.9%) have the highest median income of $45,417 per family member.
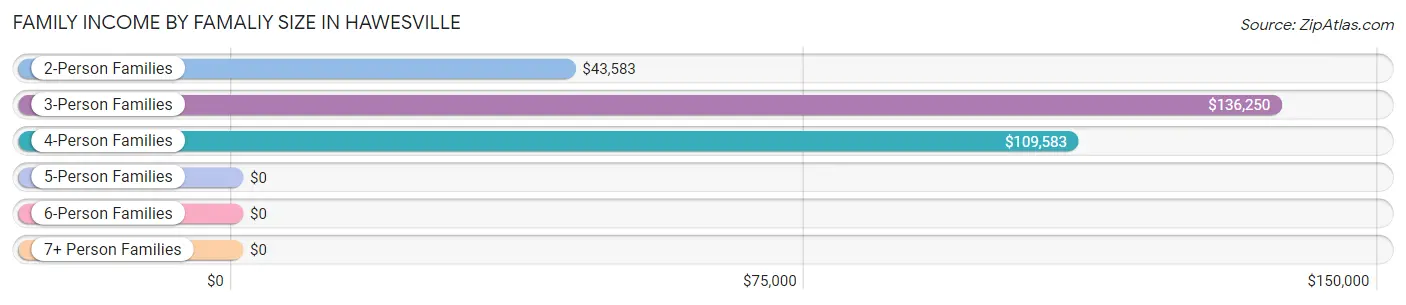
| Income Bracket | # Families | Median Income |
| 2-Person Families | 197 (70.4%) | $43,583 |
| 3-Person Families | 22 (7.9%) | $136,250 |
| 4-Person Families | 38 (13.6%) | $109,583 |
| 5-Person Families | 21 (7.5%) | $0 |
| 6-Person Families | 0 (0.0%) | $0 |
| 7+ Person Families | 2 (0.7%) | $0 |
| Total | 280 (100.0%) | $67,500 |
Family Income by Number of Earners in Hawesville
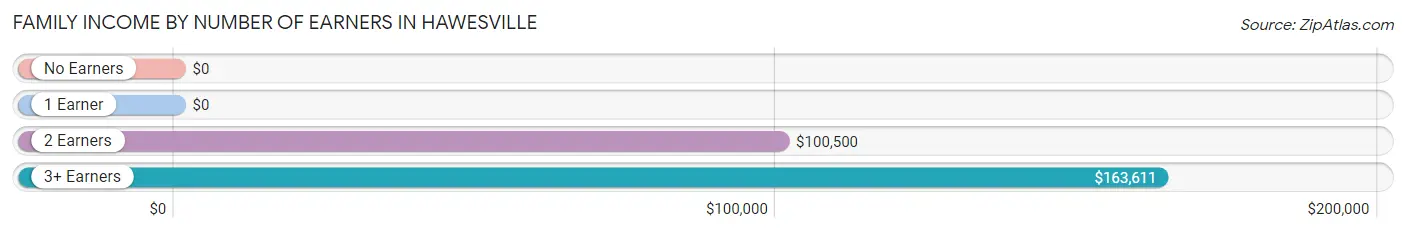
| Number of Earners | # Families | Median Income |
| No Earners | 42 (15.0%) | $0 |
| 1 Earner | 128 (45.7%) | $0 |
| 2 Earners | 66 (23.6%) | $100,500 |
| 3+ Earners | 44 (15.7%) | $163,611 |
| Total | 280 (100.0%) | $67,500 |
Household Income in Hawesville
Household Income Brackets in Hawesville
With 78 households falling in the category, the $100,000 to $149,999 income range is the most frequent in Hawesville, accounting for 17.0% of all households. In contrast, only 16 households (3.5%) fall into the less than $10,000 income bracket, making it the least populous group.
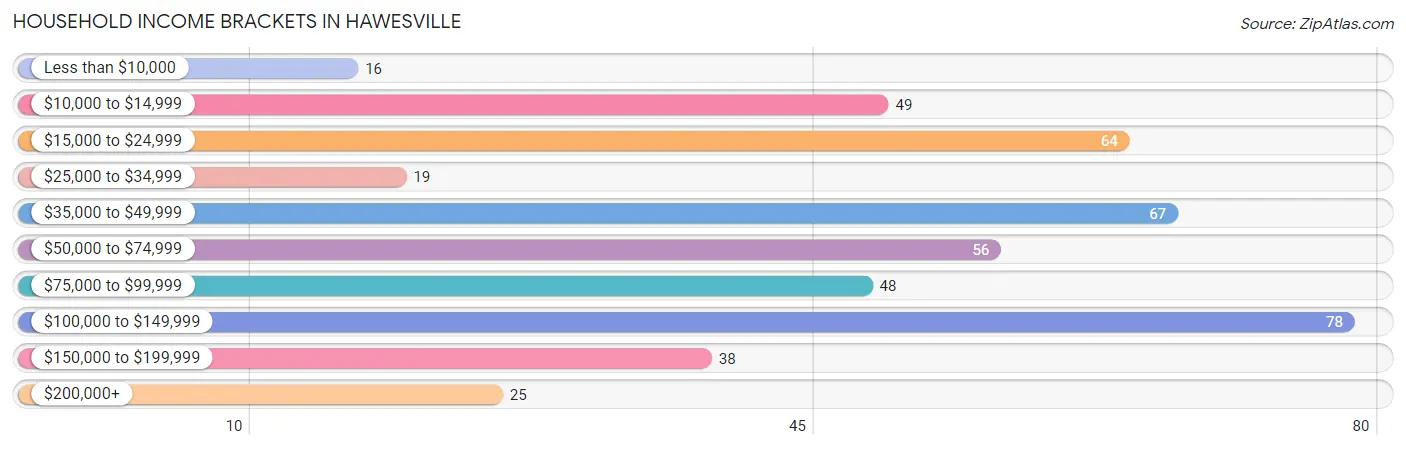
| Income Bracket | # Households | % Households |
| Less than $10,000 | 16 | 3.5% |
| $10,000 to $14,999 | 49 | 10.7% |
| $15,000 to $24,999 | 64 | 13.9% |
| $25,000 to $34,999 | 19 | 4.1% |
| $35,000 to $49,999 | 67 | 14.6% |
| $50,000 to $74,999 | 56 | 12.2% |
| $75,000 to $99,999 | 48 | 10.4% |
| $100,000 to $149,999 | 78 | 17.0% |
| $150,000 to $199,999 | 38 | 8.3% |
| $200,000+ | 25 | 5.4% |
Household Income by Householder Age in Hawesville
The median household income in Hawesville is $54,423, with the highest median household income of $84,844 found in the 65+ years age bracket for the primary householder. A total of 127 households (27.6%) fall into this category. Meanwhile, the 15 to 24 years age bracket for the primary householder has the lowest median household income of $0, with 65 households (14.1%) in this group.
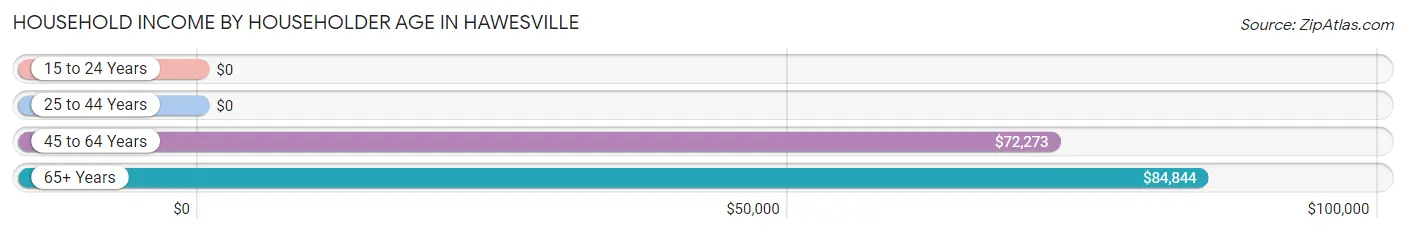
| Income Bracket | # Households | Median Income |
| 15 to 24 Years | 65 (14.1%) | $0 |
| 25 to 44 Years | 136 (29.6%) | $0 |
| 45 to 64 Years | 132 (28.7%) | $72,273 |
| 65+ Years | 127 (27.6%) | $84,844 |
| Total | 460 (100.0%) | $54,423 |
Poverty in Hawesville
Income Below Poverty by Sex and Age in Hawesville
With 18.6% poverty level for males and 27.5% for females among the residents of Hawesville, under 5 year old males and 25 to 34 year old females are the most vulnerable to poverty, with 32 males (68.1%) and 65 females (65.7%) in their respective age groups living below the poverty level.
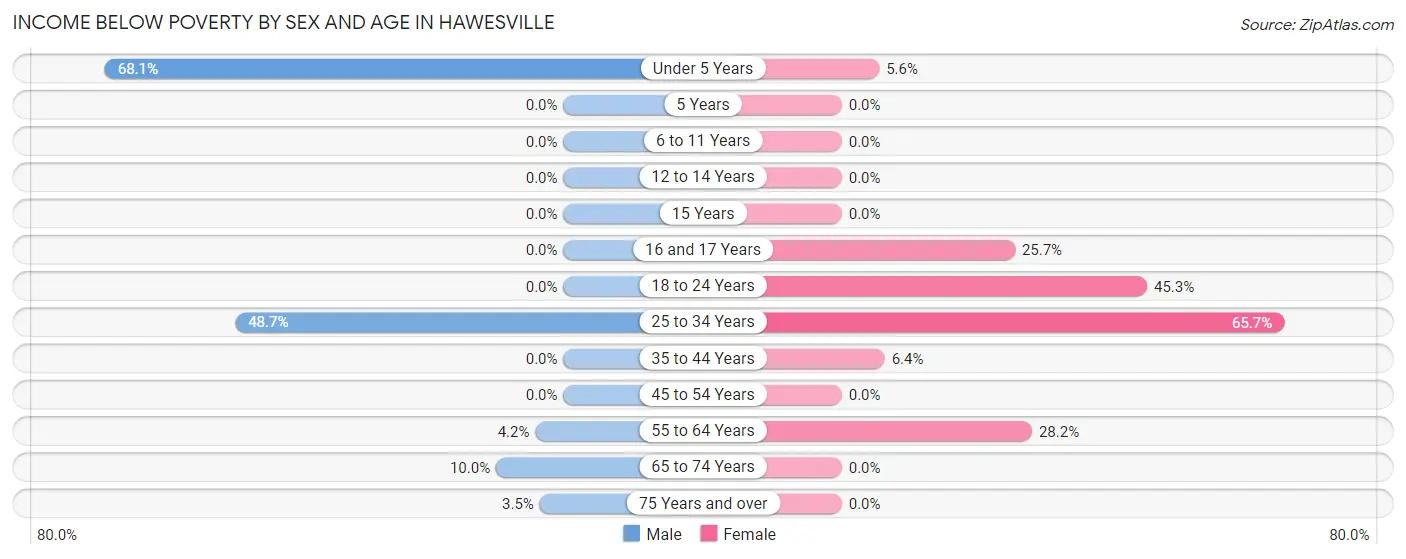
| Age Bracket | Male | Female |
| Under 5 Years | 32 (68.1%) | 1 (5.6%) |
| 5 Years | 0 (0.0%) | 0 (0.0%) |
| 6 to 11 Years | 0 (0.0%) | 0 (0.0%) |
| 12 to 14 Years | 0 (0.0%) | 0 (0.0%) |
| 15 Years | 0 (0.0%) | 0 (0.0%) |
| 16 and 17 Years | 0 (0.0%) | 9 (25.7%) |
| 18 to 24 Years | 0 (0.0%) | 34 (45.3%) |
| 25 to 34 Years | 57 (48.7%) | 65 (65.7%) |
| 35 to 44 Years | 0 (0.0%) | 3 (6.4%) |
| 45 to 54 Years | 0 (0.0%) | 0 (0.0%) |
| 55 to 64 Years | 3 (4.2%) | 24 (28.2%) |
| 65 to 74 Years | 4 (10.0%) | 0 (0.0%) |
| 75 Years and over | 2 (3.5%) | 0 (0.0%) |
| Total | 98 (18.6%) | 136 (27.5%) |
Income Above Poverty by Sex and Age in Hawesville
According to the poverty statistics in Hawesville, males aged 6 to 11 years and females aged 6 to 11 years are the age groups that are most secure financially, with 100.0% of males and 100.0% of females in these age groups living above the poverty line.
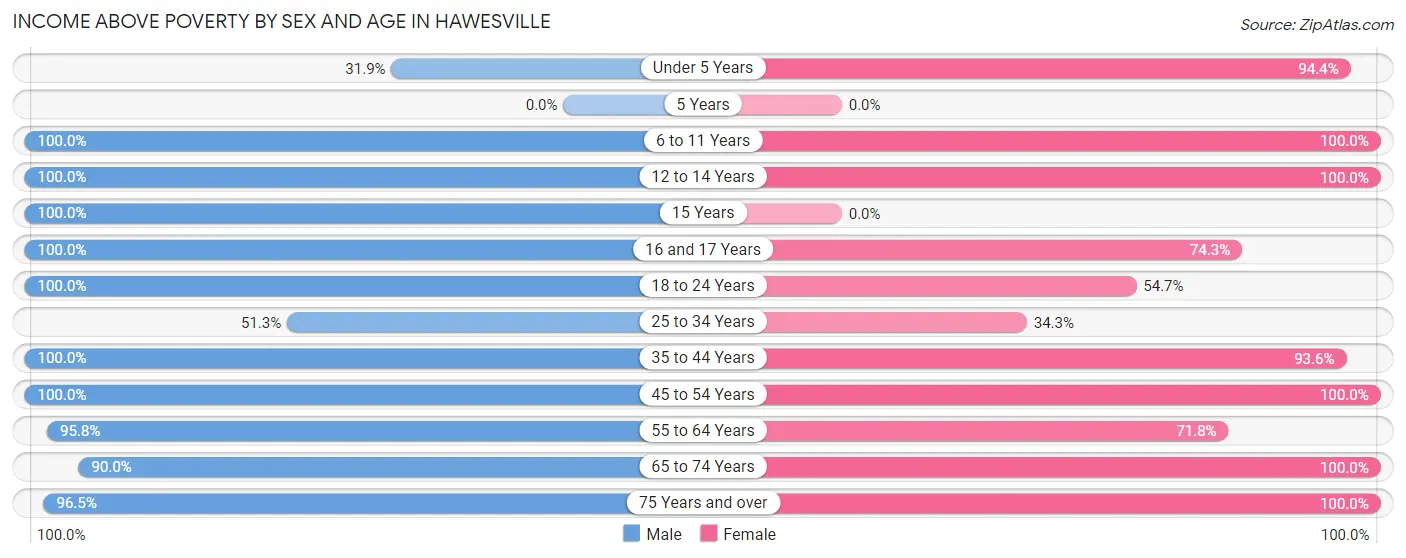
| Age Bracket | Male | Female |
| Under 5 Years | 15 (31.9%) | 17 (94.4%) |
| 5 Years | 0 (0.0%) | 0 (0.0%) |
| 6 to 11 Years | 30 (100.0%) | 8 (100.0%) |
| 12 to 14 Years | 15 (100.0%) | 6 (100.0%) |
| 15 Years | 10 (100.0%) | 0 (0.0%) |
| 16 and 17 Years | 10 (100.0%) | 26 (74.3%) |
| 18 to 24 Years | 51 (100.0%) | 41 (54.7%) |
| 25 to 34 Years | 60 (51.3%) | 34 (34.3%) |
| 35 to 44 Years | 34 (100.0%) | 44 (93.6%) |
| 45 to 54 Years | 43 (100.0%) | 37 (100.0%) |
| 55 to 64 Years | 69 (95.8%) | 61 (71.8%) |
| 65 to 74 Years | 36 (90.0%) | 47 (100.0%) |
| 75 Years and over | 55 (96.5%) | 37 (100.0%) |
| Total | 428 (81.4%) | 358 (72.5%) |
Income Below Poverty Among Married-Couple Families in Hawesville
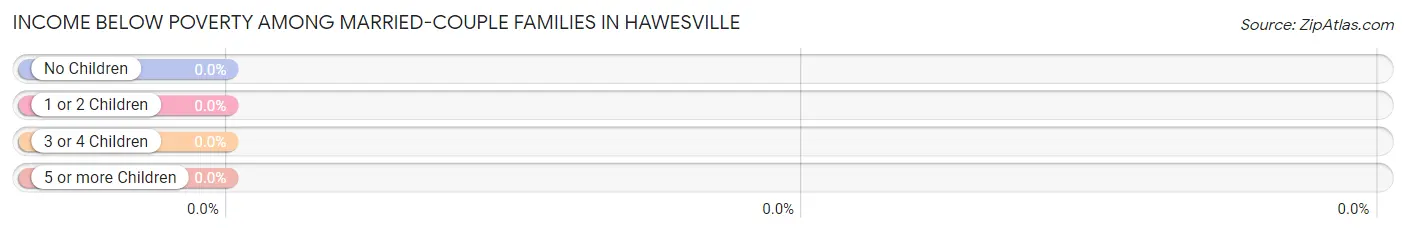
| Children | Above Poverty | Below Poverty |
| No Children | 112 (100.0%) | 0 (0.0%) |
| 1 or 2 Children | 39 (100.0%) | 0 (0.0%) |
| 3 or 4 Children | 7 (100.0%) | 0 (0.0%) |
| 5 or more Children | 2 (100.0%) | 0 (0.0%) |
| Total | 160 (100.0%) | 0 (0.0%) |
Income Below Poverty Among Single-Parent Households in Hawesville
According to the poverty data in Hawesville, 76.1% or 51 single-father households and 37.7% or 20 single-mother households are living below the poverty line. Among single-father households, those with 1 or 2 children have the highest poverty rate, with 51 households (78.5%) experiencing poverty. Likewise, among single-mother households, those with 1 or 2 children have the highest poverty rate, with 20 households (80.0%) falling below the poverty line.
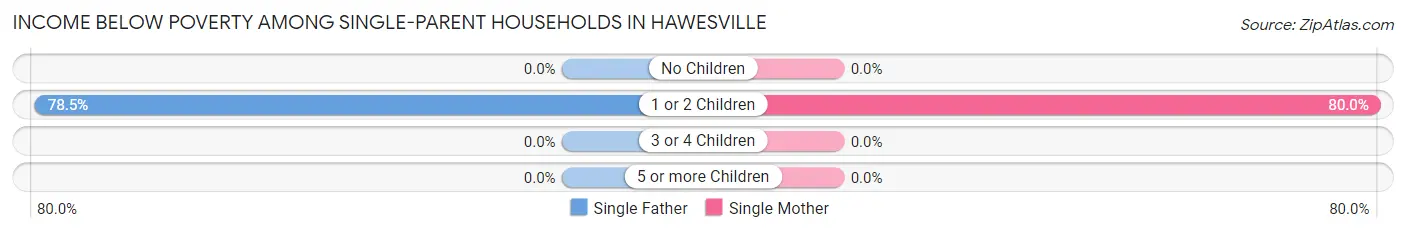
| Children | Single Father | Single Mother |
| No Children | 0 (0.0%) | 0 (0.0%) |
| 1 or 2 Children | 51 (78.5%) | 20 (80.0%) |
| 3 or 4 Children | 0 (0.0%) | 0 (0.0%) |
| 5 or more Children | 0 (0.0%) | 0 (0.0%) |
| Total | 51 (76.1%) | 20 (37.7%) |
Income Below Poverty Among Married-Couple vs Single-Parent Households in Hawesville
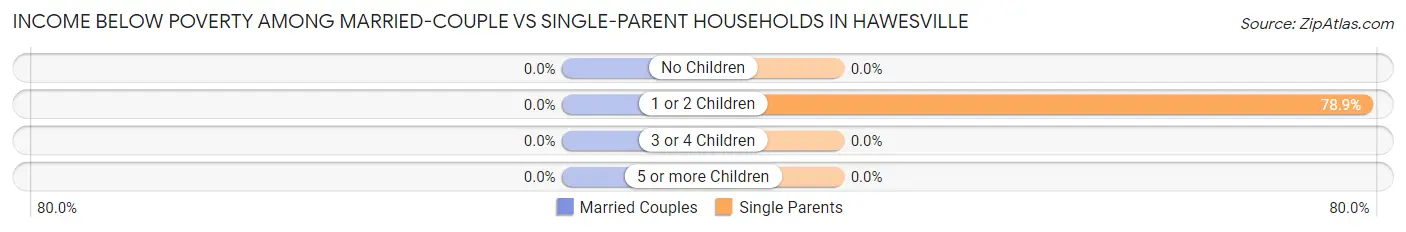
| Children | Married-Couple Families | Single-Parent Households |
| No Children | 0 (0.0%) | 0 (0.0%) |
| 1 or 2 Children | 0 (0.0%) | 71 (78.9%) |
| 3 or 4 Children | 0 (0.0%) | 0 (0.0%) |
| 5 or more Children | 0 (0.0%) | 0 (0.0%) |
| Total | 0 (0.0%) | 71 (59.2%) |
Race in Hawesville
The most populous races in Hawesville are White / Caucasian (1,010 | 96.8%), Black / African American (32 | 3.1%), and Two or more Races (1 | 0.1%).
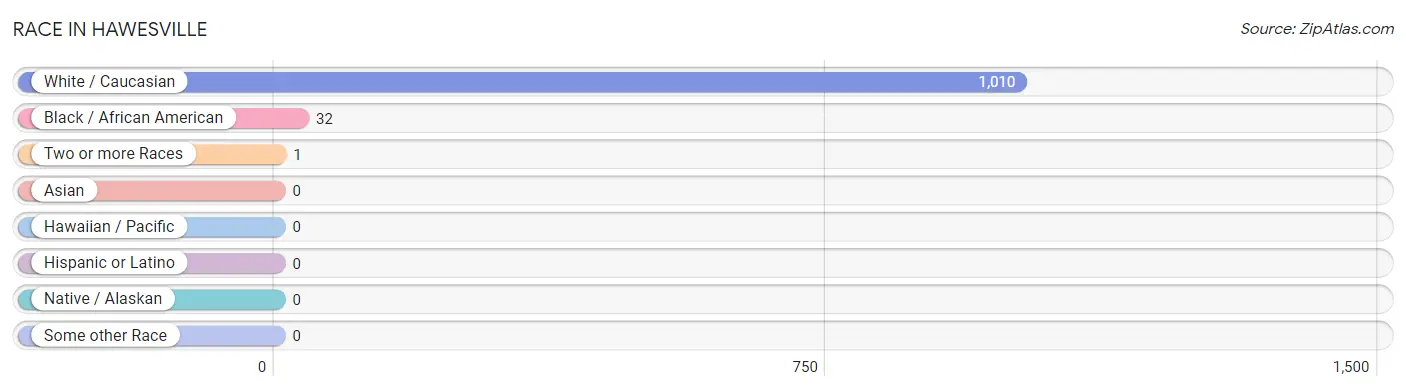
| Race | # Population | % Population |
| Asian | 0 | 0.0% |
| Black / African American | 32 | 3.1% |
| Hawaiian / Pacific | 0 | 0.0% |
| Hispanic or Latino | 0 | 0.0% |
| Native / Alaskan | 0 | 0.0% |
| White / Caucasian | 1,010 | 96.8% |
| Two or more Races | 1 | 0.1% |
| Some other Race | 0 | 0.0% |
| Total | 1,043 | 100.0% |
Ancestry in Hawesville
The most populous ancestries reported in Hawesville are German (140 | 13.4%), Irish (133 | 12.8%), American (130 | 12.5%), English (62 | 5.9%), and French (58 | 5.6%), together accounting for 50.1% of all Hawesville residents.
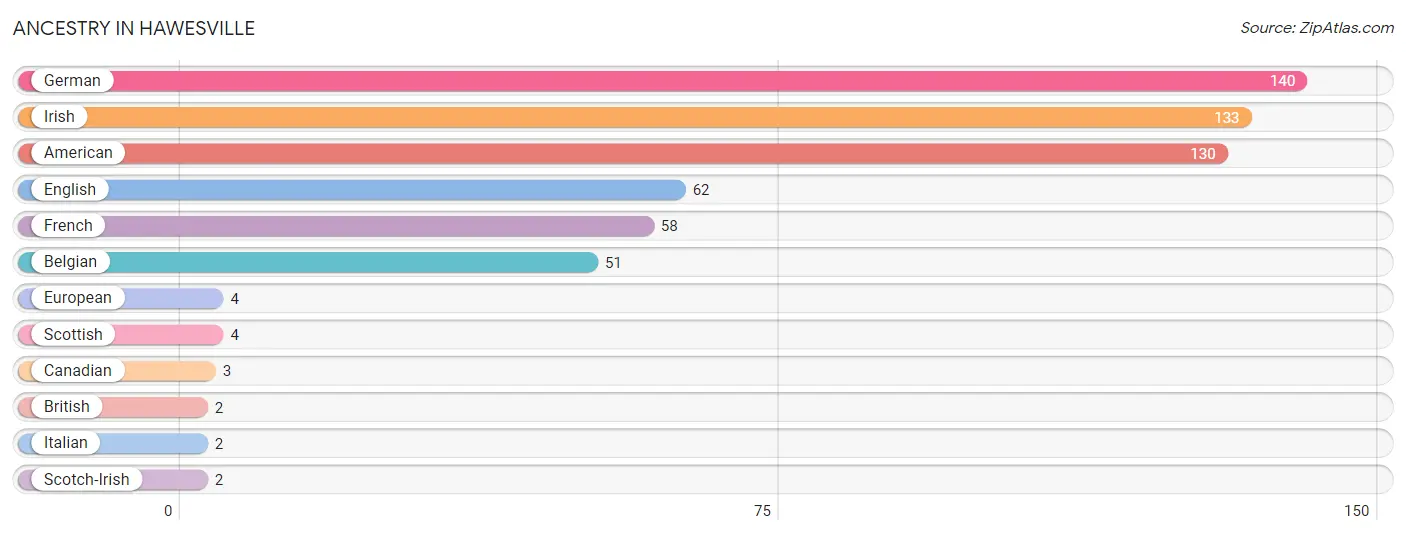
| Ancestry | # Population | % Population |
| American | 130 | 12.5% |
| Belgian | 51 | 4.9% |
| British | 2 | 0.2% |
| Canadian | 3 | 0.3% |
| English | 62 | 5.9% |
| European | 4 | 0.4% |
| French | 58 | 5.6% |
| German | 140 | 13.4% |
| Irish | 133 | 12.8% |
| Italian | 2 | 0.2% |
| Scotch-Irish | 2 | 0.2% |
| Scottish | 4 | 0.4% | View All 12 Rows |
Immigrants in Hawesville
The most numerous immigrant groups reported in Hawesville came from Europe (12 | 1.1%), Ireland (10 | 1.0%), Northern Europe (10 | 1.0%), Germany (2 | 0.2%), and Western Europe (2 | 0.2%), together accounting for 3.4% of all Hawesville residents.
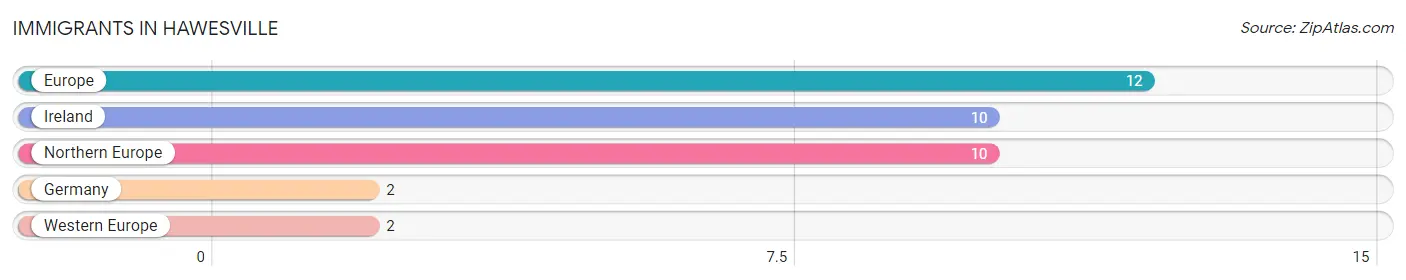
| Immigration Origin | # Population | % Population |
| Europe | 12 | 1.1% |
| Germany | 2 | 0.2% |
| Ireland | 10 | 1.0% |
| Northern Europe | 10 | 1.0% |
| Western Europe | 2 | 0.2% | View All 5 Rows |
Sex and Age in Hawesville
Sex and Age in Hawesville
The most populous age groups in Hawesville are 30 to 34 Years (67 | 12.3%) for men and 25 to 29 Years (93 | 18.7%) for women.
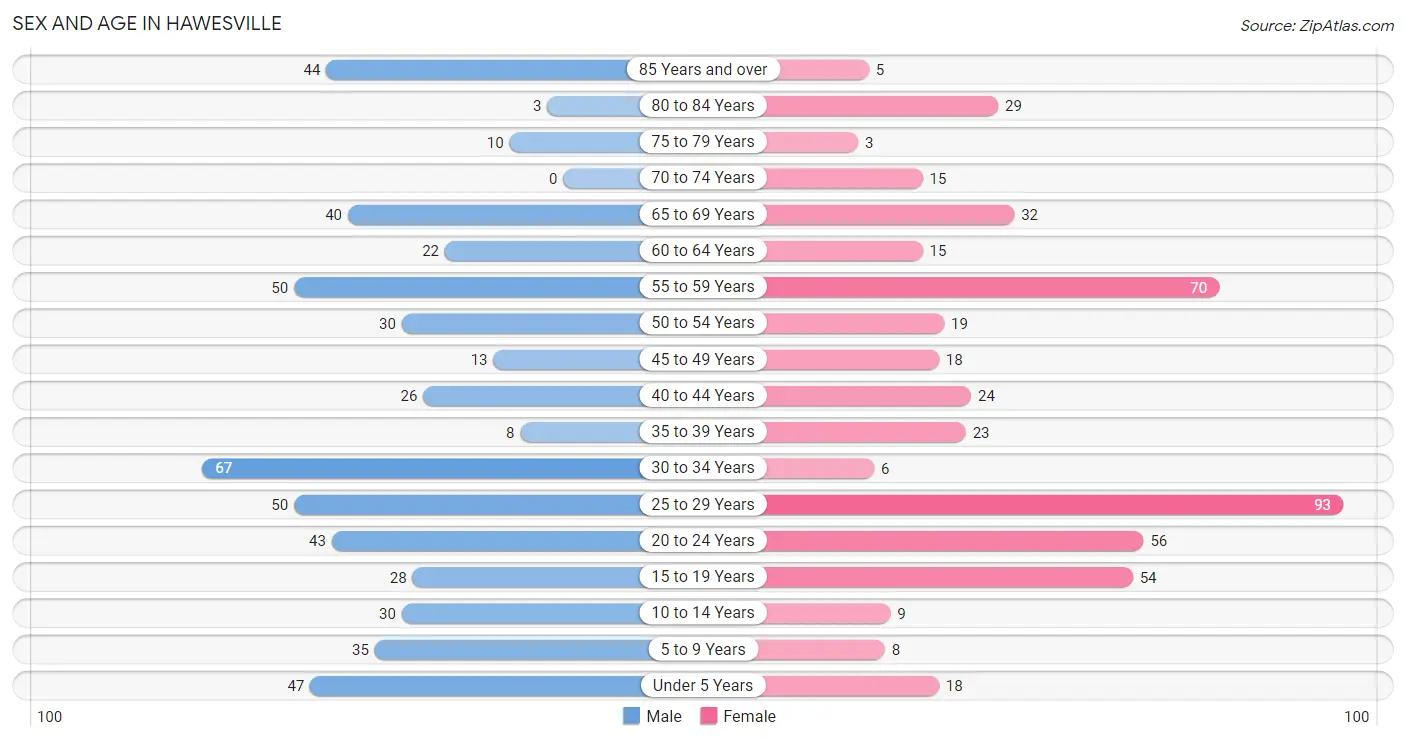
| Age Bracket | Male | Female |
| Under 5 Years | 47 (8.6%) | 18 (3.6%) |
| 5 to 9 Years | 35 (6.4%) | 8 (1.6%) |
| 10 to 14 Years | 30 (5.5%) | 9 (1.8%) |
| 15 to 19 Years | 28 (5.1%) | 54 (10.9%) |
| 20 to 24 Years | 43 (7.9%) | 56 (11.3%) |
| 25 to 29 Years | 50 (9.2%) | 93 (18.7%) |
| 30 to 34 Years | 67 (12.3%) | 6 (1.2%) |
| 35 to 39 Years | 8 (1.5%) | 23 (4.6%) |
| 40 to 44 Years | 26 (4.8%) | 24 (4.8%) |
| 45 to 49 Years | 13 (2.4%) | 18 (3.6%) |
| 50 to 54 Years | 30 (5.5%) | 19 (3.8%) |
| 55 to 59 Years | 50 (9.2%) | 70 (14.1%) |
| 60 to 64 Years | 22 (4.0%) | 15 (3.0%) |
| 65 to 69 Years | 40 (7.3%) | 32 (6.4%) |
| 70 to 74 Years | 0 (0.0%) | 15 (3.0%) |
| 75 to 79 Years | 10 (1.8%) | 3 (0.6%) |
| 80 to 84 Years | 3 (0.5%) | 29 (5.8%) |
| 85 Years and over | 44 (8.1%) | 5 (1.0%) |
| Total | 546 (100.0%) | 497 (100.0%) |
Families and Households in Hawesville
Median Family Size in Hawesville
The median family size in Hawesville is 2.50 persons per family, with married-couple families (160 | 57.1%) accounting for the largest median family size of 2.76 persons per family. On the other hand, single male/father families (67 | 23.9%) represent the smallest median family size with 1.82 persons per family.
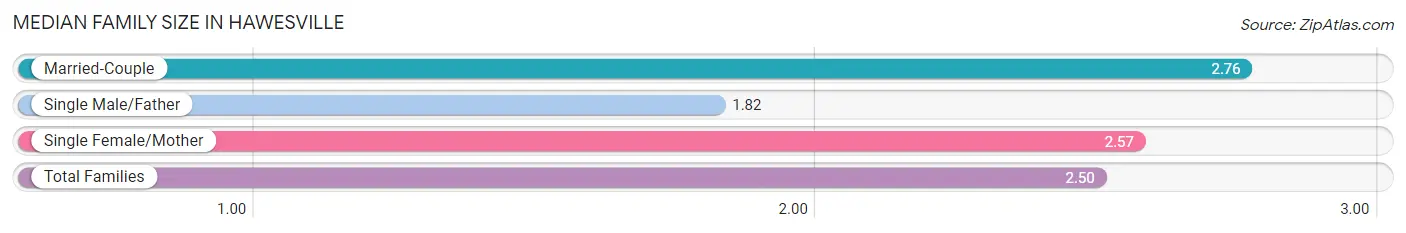
| Family Type | # Families | Family Size |
| Married-Couple | 160 (57.1%) | 2.76 |
| Single Male/Father | 67 (23.9%) | 1.82 |
| Single Female/Mother | 53 (18.9%) | 2.57 |
| Total Families | 280 (100.0%) | 2.50 |
Median Household Size in Hawesville
The median household size in Hawesville is 2.27 persons per household, with single male/father households (67 | 14.6%) accounting for the largest median household size of 2.96 persons per household. non-family households (180 | 39.1%) represent the smallest median household size with 1.43 persons per household.
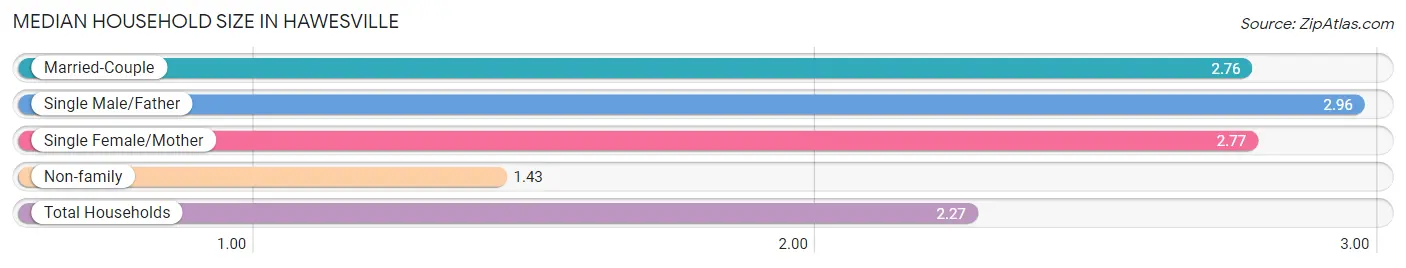
| Household Type | # Households | Household Size |
| Married-Couple | 160 (34.8%) | 2.76 |
| Single Male/Father | 67 (14.6%) | 2.96 |
| Single Female/Mother | 53 (11.5%) | 2.77 |
| Non-family | 180 (39.1%) | 1.43 |
| Total Households | 460 (100.0%) | 2.27 |
Household Size by Marriage Status in Hawesville
Out of a total of 460 households in Hawesville, 280 (60.9%) are family households, while 180 (39.1%) are nonfamily households. The most numerous type of family households are 2-person households, comprising 135, and the most common type of nonfamily households are 1-person households, comprising 134.
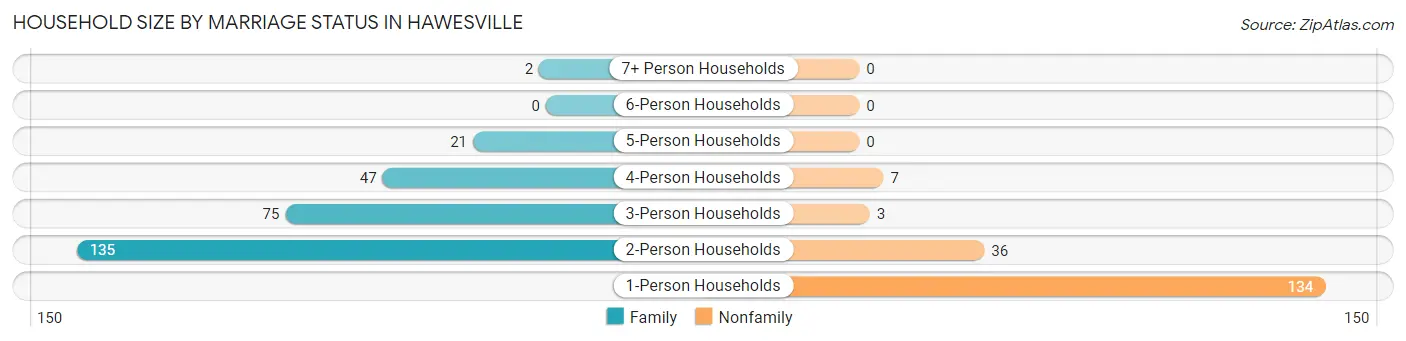
| Household Size | Family Households | Nonfamily Households |
| 1-Person Households | - | 134 (29.1%) |
| 2-Person Households | 135 (29.3%) | 36 (7.8%) |
| 3-Person Households | 75 (16.3%) | 3 (0.6%) |
| 4-Person Households | 47 (10.2%) | 7 (1.5%) |
| 5-Person Households | 21 (4.6%) | 0 (0.0%) |
| 6-Person Households | 0 (0.0%) | 0 (0.0%) |
| 7+ Person Households | 2 (0.4%) | 0 (0.0%) |
| Total | 280 (60.9%) | 180 (39.1%) |
Female Fertility in Hawesville
Fertility by Age in Hawesville
Average fertility rate in Hawesville is 108.0 births per 1,000 women. Women in the age bracket of 20 to 34 years have the highest fertility rate with 194.0 births per 1,000 women. Women in the age bracket of 20 to 34 years acount for 100.0% of all women with births.
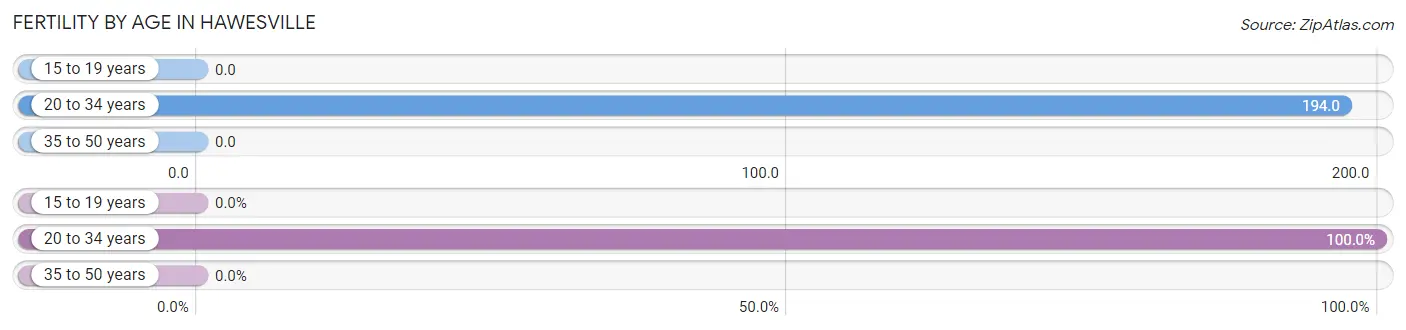
| Age Bracket | Women with Births | Births / 1,000 Women |
| 15 to 19 years | 0 (0.0%) | 0.0 |
| 20 to 34 years | 30 (100.0%) | 194.0 |
| 35 to 50 years | 0 (0.0%) | 0.0 |
| Total | 30 (100.0%) | 108.0 |
Fertility by Age by Marriage Status in Hawesville
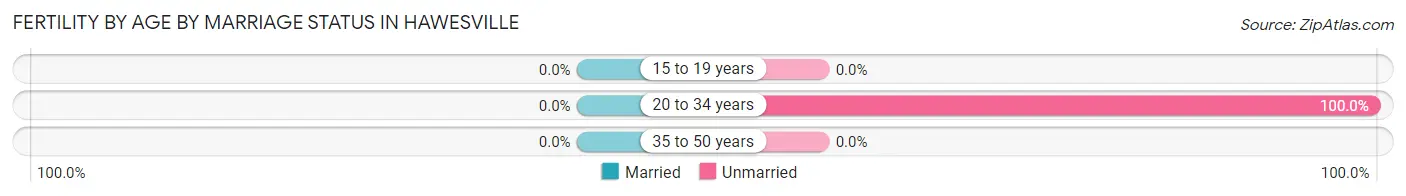
| Age Bracket | Married | Unmarried |
| 15 to 19 years | 0 (0.0%) | 0 (0.0%) |
| 20 to 34 years | 0 (0.0%) | 30 (100.0%) |
| 35 to 50 years | 0 (0.0%) | 0 (0.0%) |
| Total | 0 (0.0%) | 30 (100.0%) |
Fertility by Education in Hawesville
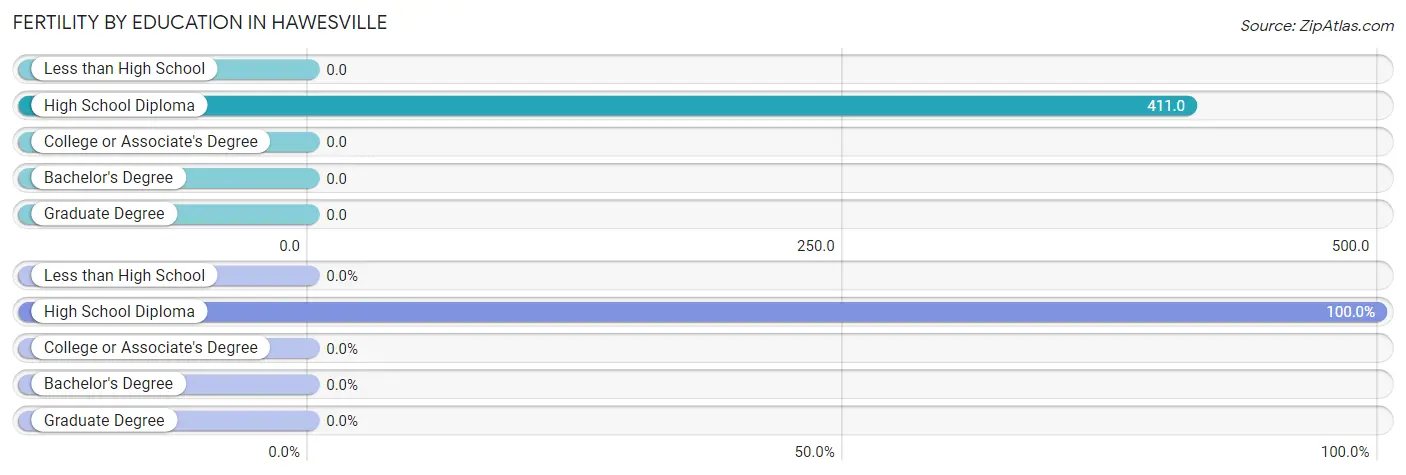
| Educational Attainment | Women with Births | Births / 1,000 Women |
| Less than High School | 0 (0.0%) | 0.0 |
| High School Diploma | 30 (100.0%) | 411.0 |
| College or Associate's Degree | 0 (0.0%) | 0.0 |
| Bachelor's Degree | 0 (0.0%) | 0.0 |
| Graduate Degree | 0 (0.0%) | 0.0 |
| Total | 30 (100.0%) | 108.0 |
Fertility by Education by Marriage Status in Hawesville
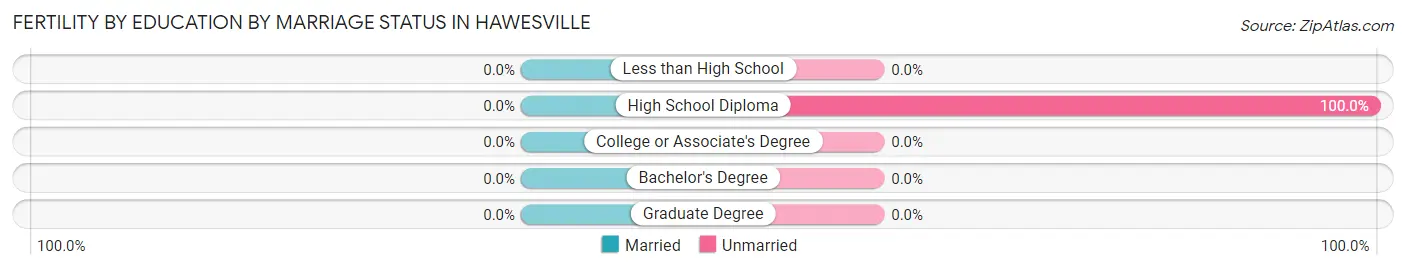
| Educational Attainment | Married | Unmarried |
| Less than High School | 0 (0.0%) | 0 (0.0%) |
| High School Diploma | 0 (0.0%) | 30 (100.0%) |
| College or Associate's Degree | 0 (0.0%) | 0 (0.0%) |
| Bachelor's Degree | 0 (0.0%) | 0 (0.0%) |
| Graduate Degree | 0 (0.0%) | 0 (0.0%) |
| Total | 0 (0.0%) | 30 (100.0%) |
Employment Characteristics in Hawesville
Employment by Class of Employer in Hawesville
Among the 475 employed individuals in Hawesville, private company employees (377 | 79.4%), local government employees (39 | 8.2%), and not-for-profit organizations (28 | 5.9%) make up the most common classes of employment.
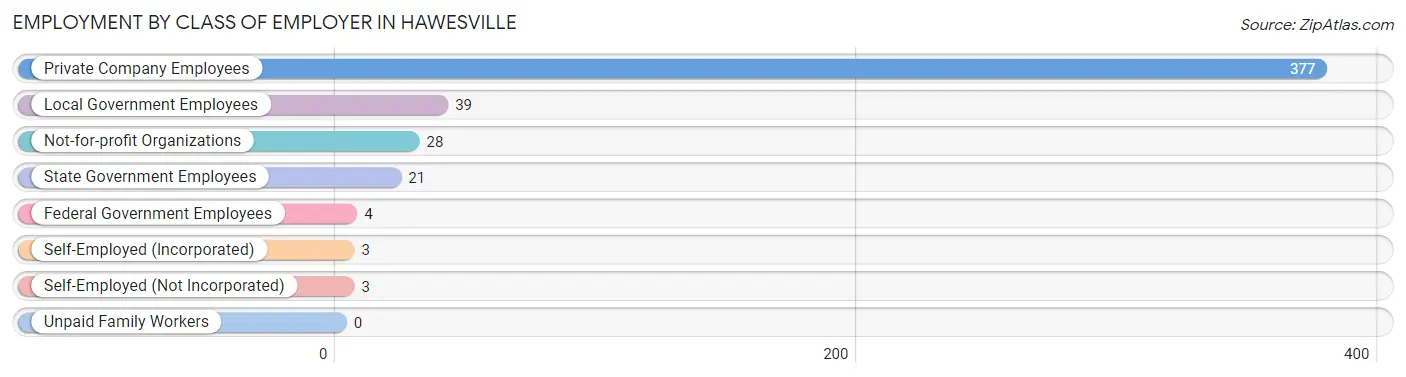
| Employer Class | # Employees | % Employees |
| Private Company Employees | 377 | 79.4% |
| Self-Employed (Incorporated) | 3 | 0.6% |
| Self-Employed (Not Incorporated) | 3 | 0.6% |
| Not-for-profit Organizations | 28 | 5.9% |
| Local Government Employees | 39 | 8.2% |
| State Government Employees | 21 | 4.4% |
| Federal Government Employees | 4 | 0.8% |
| Unpaid Family Workers | 0 | 0.0% |
| Total | 475 | 100.0% |
Employment Status by Age in Hawesville
According to the labor force statistics for Hawesville, out of the total population over 16 years of age (886), 59.6% or 528 individuals are in the labor force, with 7.0% or 37 of them unemployed. The age group with the highest labor force participation rate is 35 to 44 years, with 96.3% or 78 individuals in the labor force. Within the labor force, the 20 to 24 years age range has the highest percentage of unemployed individuals, with 21.3% or 13 of them being unemployed.
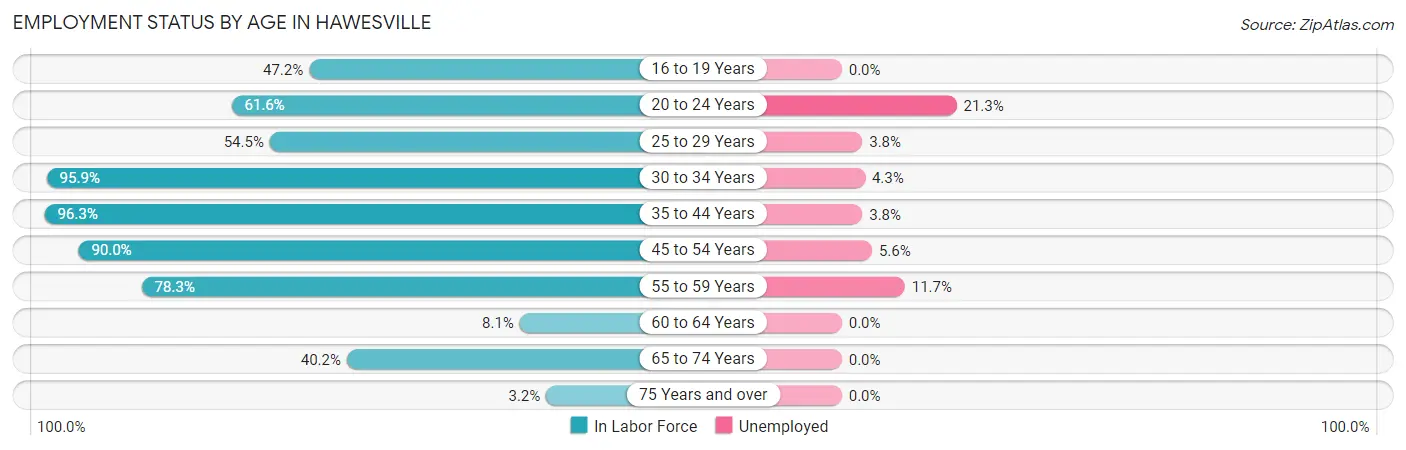
| Age Bracket | In Labor Force | Unemployed |
| 16 to 19 Years | 34 (47.2%) | 0 (0.0%) |
| 20 to 24 Years | 61 (61.6%) | 13 (21.3%) |
| 25 to 29 Years | 78 (54.5%) | 3 (3.8%) |
| 30 to 34 Years | 70 (95.9%) | 3 (4.3%) |
| 35 to 44 Years | 78 (96.3%) | 3 (3.8%) |
| 45 to 54 Years | 72 (90.0%) | 4 (5.6%) |
| 55 to 59 Years | 94 (78.3%) | 11 (11.7%) |
| 60 to 64 Years | 3 (8.1%) | 0 (0.0%) |
| 65 to 74 Years | 35 (40.2%) | 0 (0.0%) |
| 75 Years and over | 3 (3.2%) | 0 (0.0%) |
| Total | 528 (59.6%) | 37 (7.0%) |
Employment Status by Educational Attainment in Hawesville
According to labor force statistics for Hawesville, 74.0% of individuals (395) out of the total population between 25 and 64 years of age (534) are in the labor force, with 6.1% or 24 of them being unemployed. The group with the highest labor force participation rate are those with the educational attainment of bachelor's degree or higher, with 96.5% or 138 individuals in the labor force. Within the labor force, individuals with less than high school education have the highest percentage of unemployment, with 54.5% or 6 of them being unemployed.
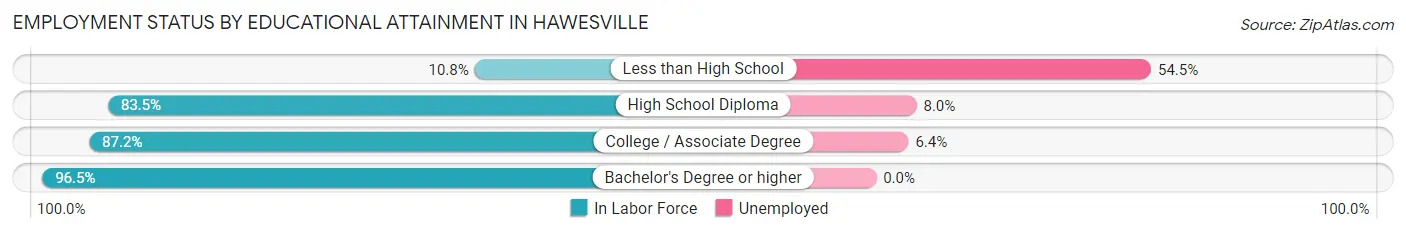
| Educational Attainment | In Labor Force | Unemployed |
| Less than High School | 11 (10.8%) | 56 (54.5%) |
| High School Diploma | 137 (83.5%) | 13 (8.0%) |
| College / Associate Degree | 109 (87.2%) | 8 (6.4%) |
| Bachelor's Degree or higher | 138 (96.5%) | 0 (0.0%) |
| Total | 395 (74.0%) | 33 (6.1%) |
Employment Occupations by Sex in Hawesville
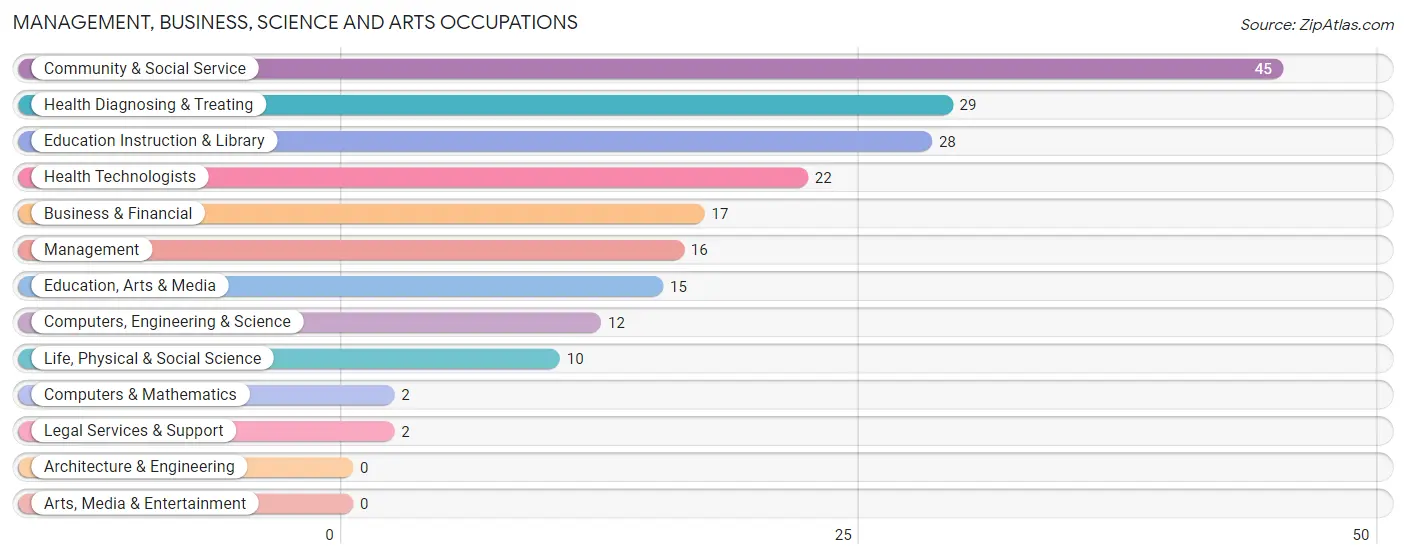
Management, Business, Science and Arts Occupations
The most common Management, Business, Science and Arts occupations in Hawesville are Community & Social Service (45 | 9.2%), Health Diagnosing & Treating (29 | 5.9%), Education Instruction & Library (28 | 5.7%), Health Technologists (22 | 4.5%), and Business & Financial (17 | 3.5%).
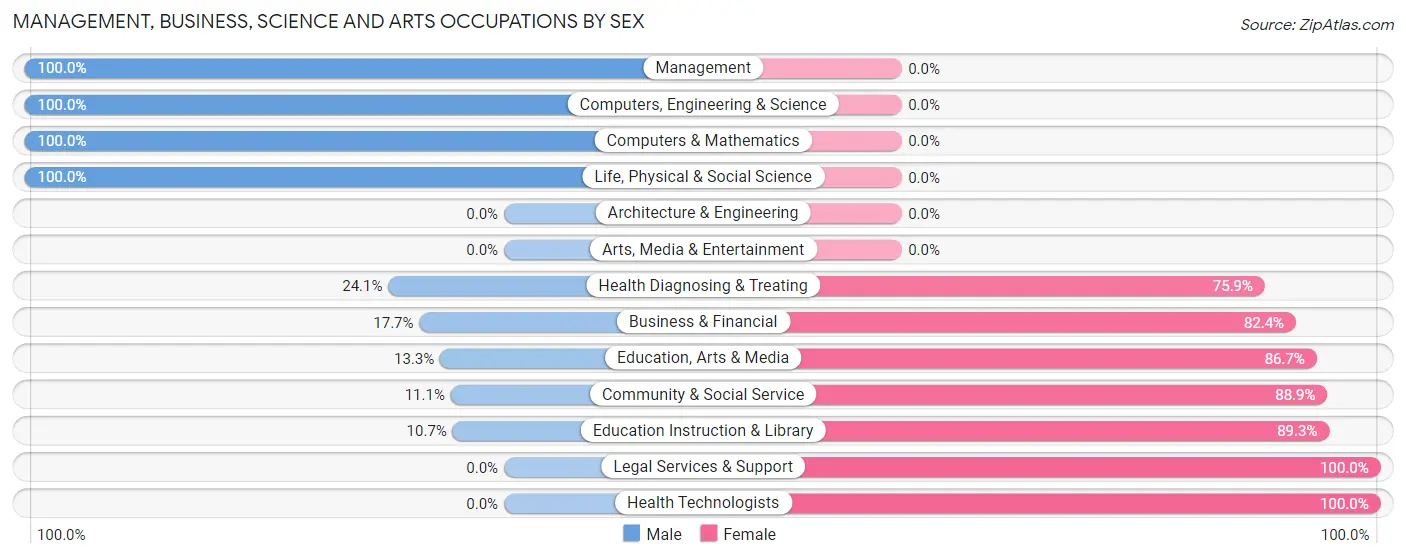
Management, Business, Science and Arts Occupations by Sex
Within the Management, Business, Science and Arts occupations in Hawesville, the most male-oriented occupations are Management (100.0%), Computers, Engineering & Science (100.0%), and Computers & Mathematics (100.0%), while the most female-oriented occupations are Legal Services & Support (100.0%), Health Technologists (100.0%), and Education Instruction & Library (89.3%).
| Occupation | Male | Female |
| Management | 16 (100.0%) | 0 (0.0%) |
| Business & Financial | 3 (17.6%) | 14 (82.4%) |
| Computers, Engineering & Science | 12 (100.0%) | 0 (0.0%) |
| Computers & Mathematics | 2 (100.0%) | 0 (0.0%) |
| Architecture & Engineering | 0 (0.0%) | 0 (0.0%) |
| Life, Physical & Social Science | 10 (100.0%) | 0 (0.0%) |
| Community & Social Service | 5 (11.1%) | 40 (88.9%) |
| Education, Arts & Media | 2 (13.3%) | 13 (86.7%) |
| Legal Services & Support | 0 (0.0%) | 2 (100.0%) |
| Education Instruction & Library | 3 (10.7%) | 25 (89.3%) |
| Arts, Media & Entertainment | 0 (0.0%) | 0 (0.0%) |
| Health Diagnosing & Treating | 7 (24.1%) | 22 (75.9%) |
| Health Technologists | 0 (0.0%) | 22 (100.0%) |
| Total (Category) | 43 (36.1%) | 76 (63.9%) |
| Total (Overall) | 294 (59.9%) | 197 (40.1%) |
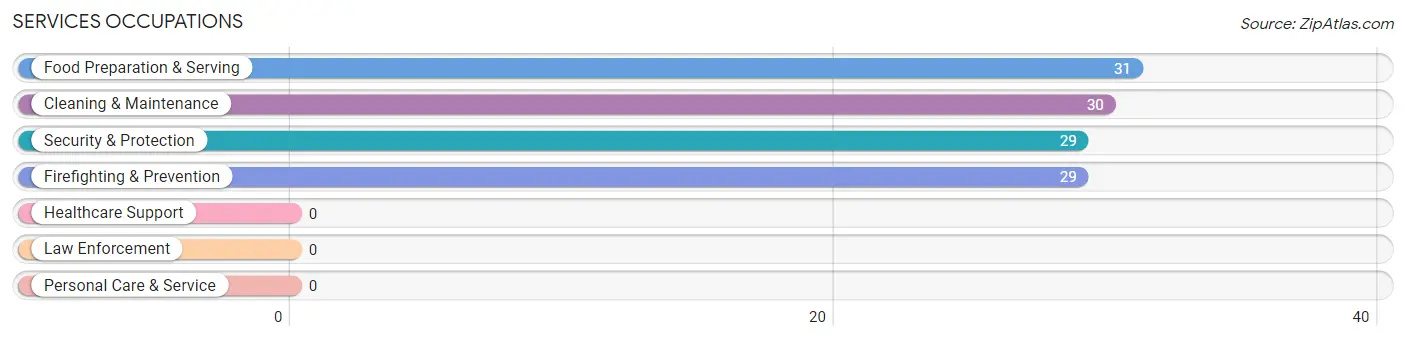
Services Occupations
The most common Services occupations in Hawesville are Food Preparation & Serving (31 | 6.3%), Cleaning & Maintenance (30 | 6.1%), Security & Protection (29 | 5.9%), and Firefighting & Prevention (29 | 5.9%).
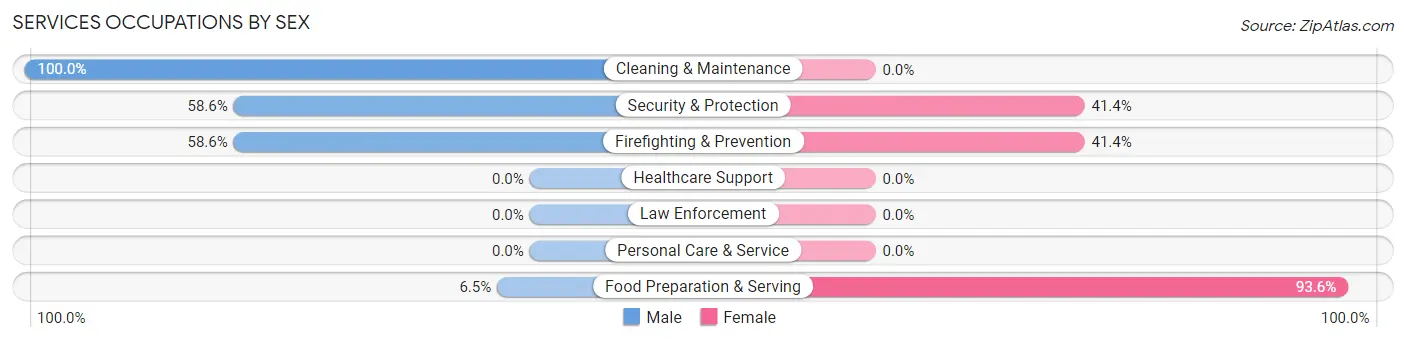
Services Occupations by Sex
Within the Services occupations in Hawesville, the most male-oriented occupations are Cleaning & Maintenance (100.0%), Security & Protection (58.6%), and Firefighting & Prevention (58.6%), while the most female-oriented occupations are Food Preparation & Serving (93.5%), Security & Protection (41.4%), and Firefighting & Prevention (41.4%).
| Occupation | Male | Female |
| Healthcare Support | 0 (0.0%) | 0 (0.0%) |
| Security & Protection | 17 (58.6%) | 12 (41.4%) |
| Firefighting & Prevention | 17 (58.6%) | 12 (41.4%) |
| Law Enforcement | 0 (0.0%) | 0 (0.0%) |
| Food Preparation & Serving | 2 (6.5%) | 29 (93.5%) |
| Cleaning & Maintenance | 30 (100.0%) | 0 (0.0%) |
| Personal Care & Service | 0 (0.0%) | 0 (0.0%) |
| Total (Category) | 49 (54.4%) | 41 (45.6%) |
| Total (Overall) | 294 (59.9%) | 197 (40.1%) |
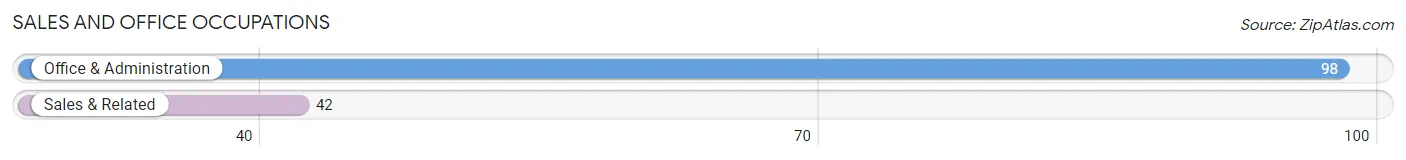
Sales and Office Occupations
The most common Sales and Office occupations in Hawesville are Office & Administration (98 | 20.0%), and Sales & Related (42 | 8.6%).
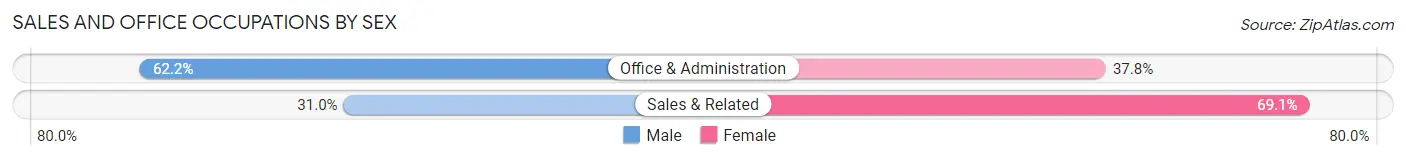
Sales and Office Occupations by Sex
| Occupation | Male | Female |
| Sales & Related | 13 (30.9%) | 29 (69.1%) |
| Office & Administration | 61 (62.2%) | 37 (37.8%) |
| Total (Category) | 74 (52.9%) | 66 (47.1%) |
| Total (Overall) | 294 (59.9%) | 197 (40.1%) |
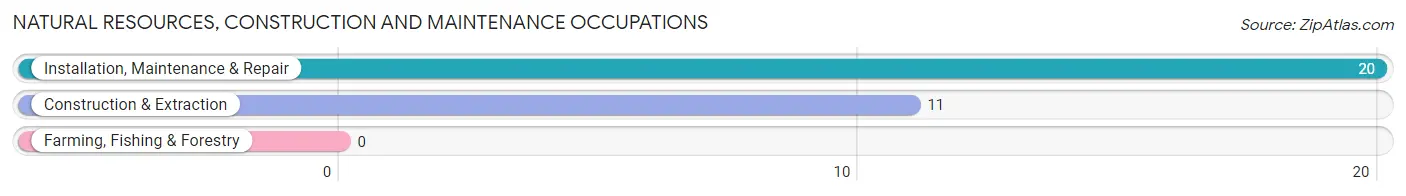
Natural Resources, Construction and Maintenance Occupations
The most common Natural Resources, Construction and Maintenance occupations in Hawesville are Installation, Maintenance & Repair (20 | 4.1%), and Construction & Extraction (11 | 2.2%).
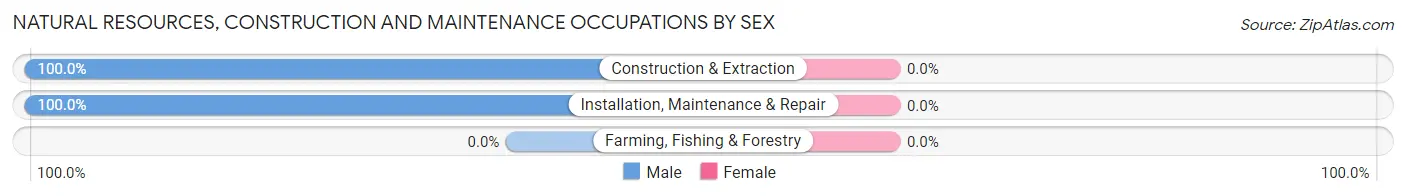
Natural Resources, Construction and Maintenance Occupations by Sex
| Occupation | Male | Female |
| Farming, Fishing & Forestry | 0 (0.0%) | 0 (0.0%) |
| Construction & Extraction | 11 (100.0%) | 0 (0.0%) |
| Installation, Maintenance & Repair | 20 (100.0%) | 0 (0.0%) |
| Total (Category) | 31 (100.0%) | 0 (0.0%) |
| Total (Overall) | 294 (59.9%) | 197 (40.1%) |
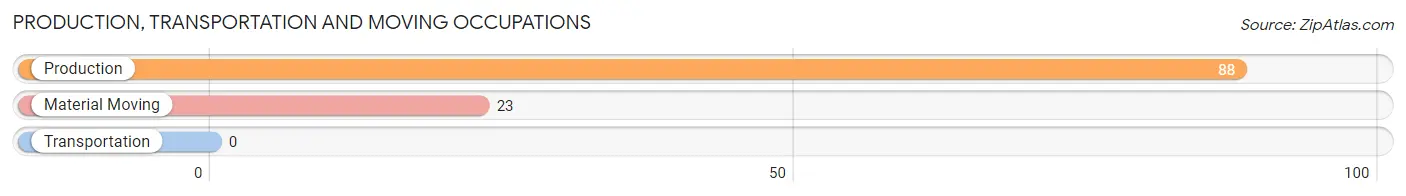
Production, Transportation and Moving Occupations
The most common Production, Transportation and Moving occupations in Hawesville are Production (88 | 17.9%), and Material Moving (23 | 4.7%).
Production, Transportation and Moving Occupations by Sex
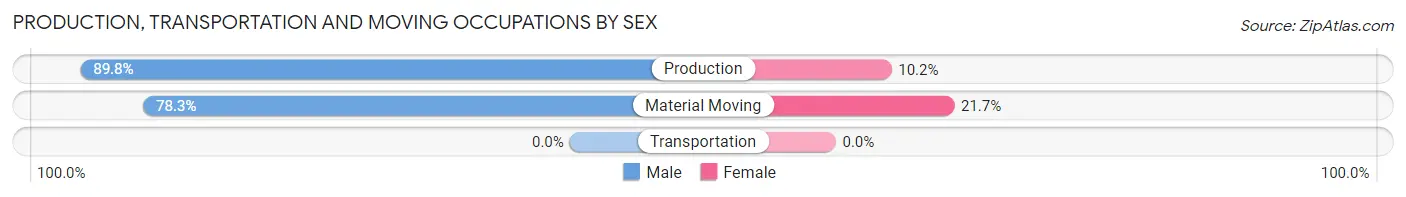
| Occupation | Male | Female |
| Production | 79 (89.8%) | 9 (10.2%) |
| Transportation | 0 (0.0%) | 0 (0.0%) |
| Material Moving | 18 (78.3%) | 5 (21.7%) |
| Total (Category) | 97 (87.4%) | 14 (12.6%) |
| Total (Overall) | 294 (59.9%) | 197 (40.1%) |
Employment Industries by Sex in Hawesville
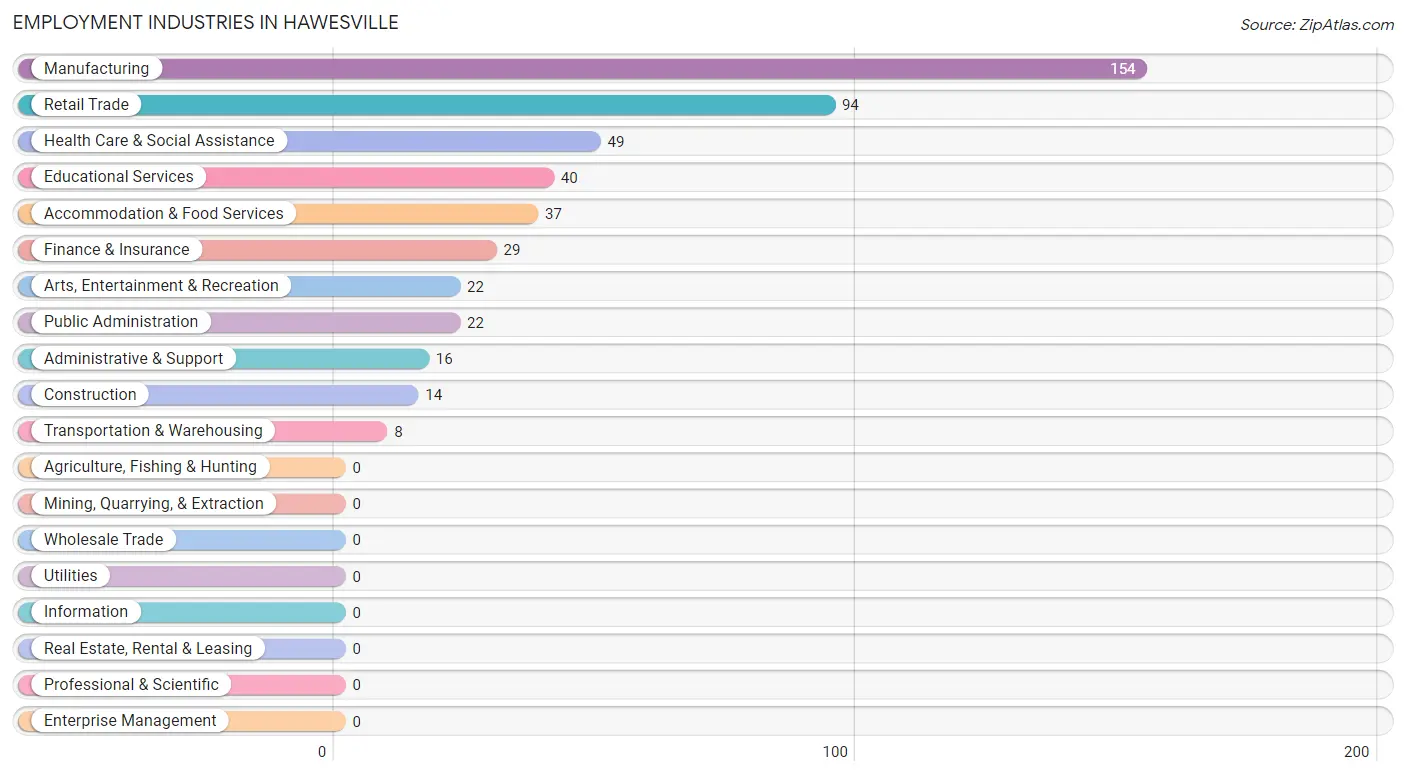
Employment Industries in Hawesville
The major employment industries in Hawesville include Manufacturing (154 | 31.4%), Retail Trade (94 | 19.1%), Health Care & Social Assistance (49 | 10.0%), Educational Services (40 | 8.2%), and Accommodation & Food Services (37 | 7.5%).
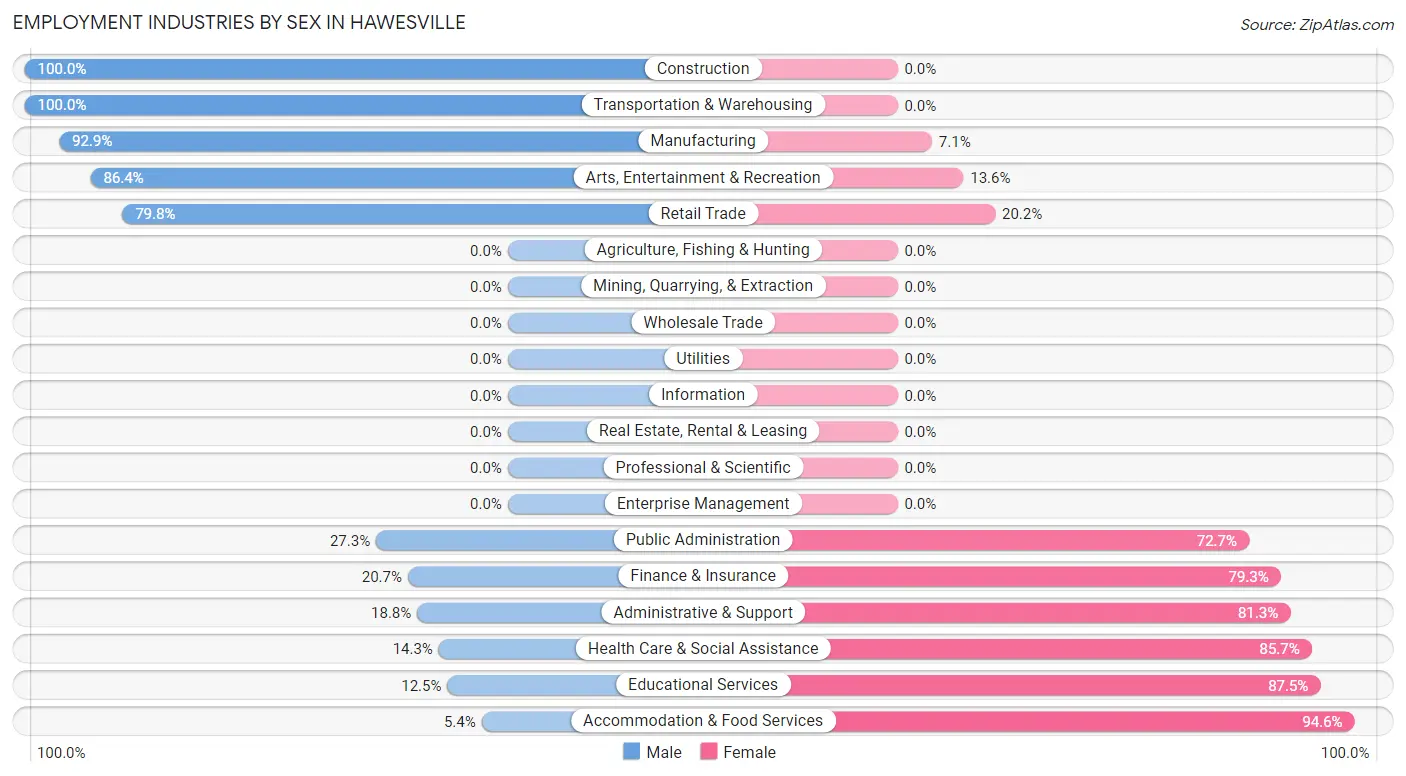
Employment Industries by Sex in Hawesville
The Hawesville industries that see more men than women are Construction (100.0%), Transportation & Warehousing (100.0%), and Manufacturing (92.9%), whereas the industries that tend to have a higher number of women are Accommodation & Food Services (94.6%), Educational Services (87.5%), and Health Care & Social Assistance (85.7%).
| Industry | Male | Female |
| Agriculture, Fishing & Hunting | 0 (0.0%) | 0 (0.0%) |
| Mining, Quarrying, & Extraction | 0 (0.0%) | 0 (0.0%) |
| Construction | 14 (100.0%) | 0 (0.0%) |
| Manufacturing | 143 (92.9%) | 11 (7.1%) |
| Wholesale Trade | 0 (0.0%) | 0 (0.0%) |
| Retail Trade | 75 (79.8%) | 19 (20.2%) |
| Transportation & Warehousing | 8 (100.0%) | 0 (0.0%) |
| Utilities | 0 (0.0%) | 0 (0.0%) |
| Information | 0 (0.0%) | 0 (0.0%) |
| Finance & Insurance | 6 (20.7%) | 23 (79.3%) |
| Real Estate, Rental & Leasing | 0 (0.0%) | 0 (0.0%) |
| Professional & Scientific | 0 (0.0%) | 0 (0.0%) |
| Enterprise Management | 0 (0.0%) | 0 (0.0%) |
| Administrative & Support | 3 (18.8%) | 13 (81.2%) |
| Educational Services | 5 (12.5%) | 35 (87.5%) |
| Health Care & Social Assistance | 7 (14.3%) | 42 (85.7%) |
| Arts, Entertainment & Recreation | 19 (86.4%) | 3 (13.6%) |
| Accommodation & Food Services | 2 (5.4%) | 35 (94.6%) |
| Public Administration | 6 (27.3%) | 16 (72.7%) |
| Total | 294 (59.9%) | 197 (40.1%) |
Education in Hawesville
School Enrollment in Hawesville
The most common levels of schooling among the 262 students in Hawesville are high school (62 | 23.7%), graduate / professional (62 | 23.7%), and elementary school (46 | 17.6%).
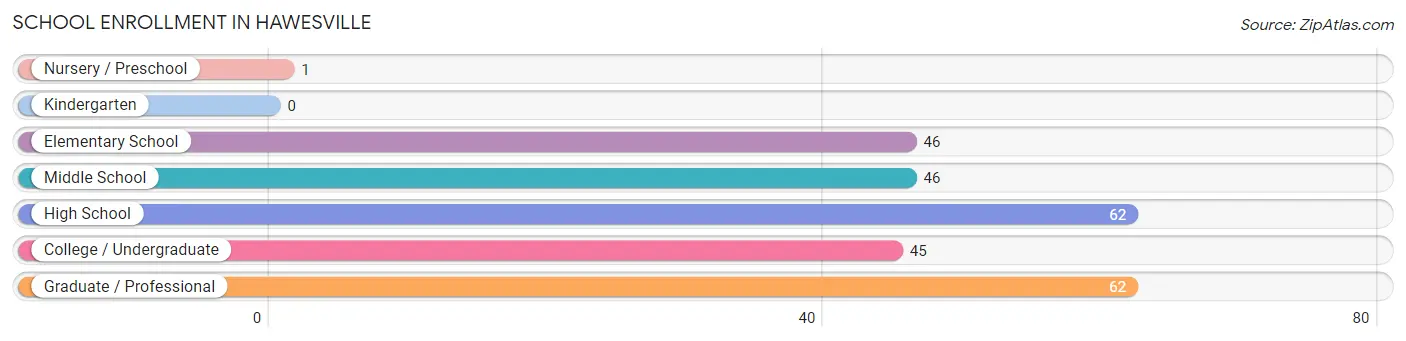
| School Level | # Students | % Students |
| Nursery / Preschool | 1 | 0.4% |
| Kindergarten | 0 | 0.0% |
| Elementary School | 46 | 17.6% |
| Middle School | 46 | 17.6% |
| High School | 62 | 23.7% |
| College / Undergraduate | 45 | 17.2% |
| Graduate / Professional | 62 | 23.7% |
| Total | 262 | 100.0% |
School Enrollment by Age by Funding Source in Hawesville
Out of a total of 262 students who are enrolled in schools in Hawesville, 9 (3.4%) attend a private institution, while the remaining 253 (96.6%) are enrolled in public schools. The age group of 18 to 19 year olds has the highest likelihood of being enrolled in private schools, with 9 (42.9% in the age bracket) enrolled. Conversely, the age group of 3 to 4 year olds has the lowest likelihood of being enrolled in a private school, with 1 (100.0% in the age bracket) attending a public institution.
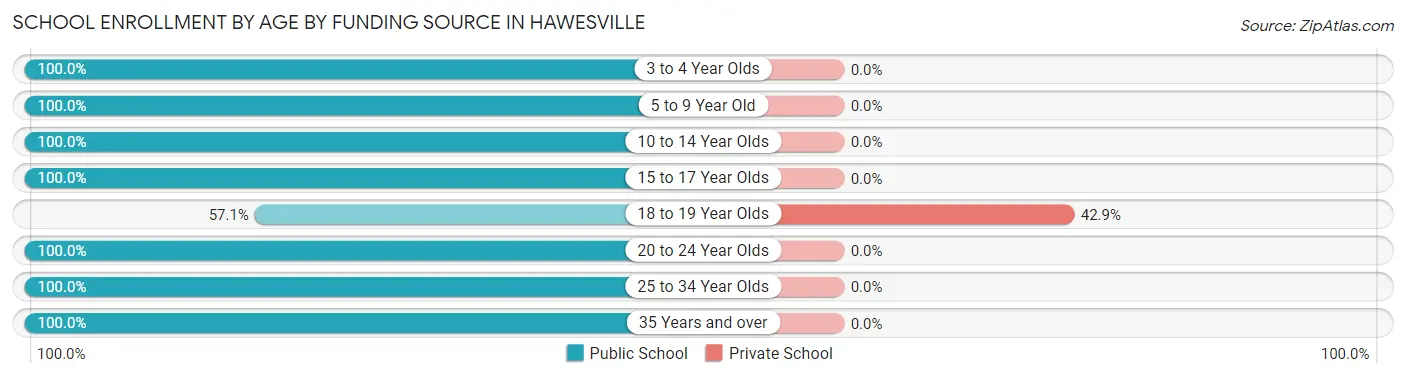
| Age Bracket | Public School | Private School |
| 3 to 4 Year Olds | 1 (100.0%) | 0 (0.0%) |
| 5 to 9 Year Old | 43 (100.0%) | 0 (0.0%) |
| 10 to 14 Year Olds | 39 (100.0%) | 0 (0.0%) |
| 15 to 17 Year Olds | 51 (100.0%) | 0 (0.0%) |
| 18 to 19 Year Olds | 12 (57.1%) | 9 (42.9%) |
| 20 to 24 Year Olds | 28 (100.0%) | 0 (0.0%) |
| 25 to 34 Year Olds | 76 (100.0%) | 0 (0.0%) |
| 35 Years and over | 3 (100.0%) | 0 (0.0%) |
| Total | 253 (96.6%) | 9 (3.4%) |
Educational Attainment by Field of Study in Hawesville
Education (79 | 38.0%), multidisciplinary studies (53 | 25.5%), business (44 | 21.1%), bio, nature & agricultural (8 | 3.8%), and psychology (5 | 2.4%) are the most common fields of study among 208 individuals in Hawesville who have obtained a bachelor's degree or higher.
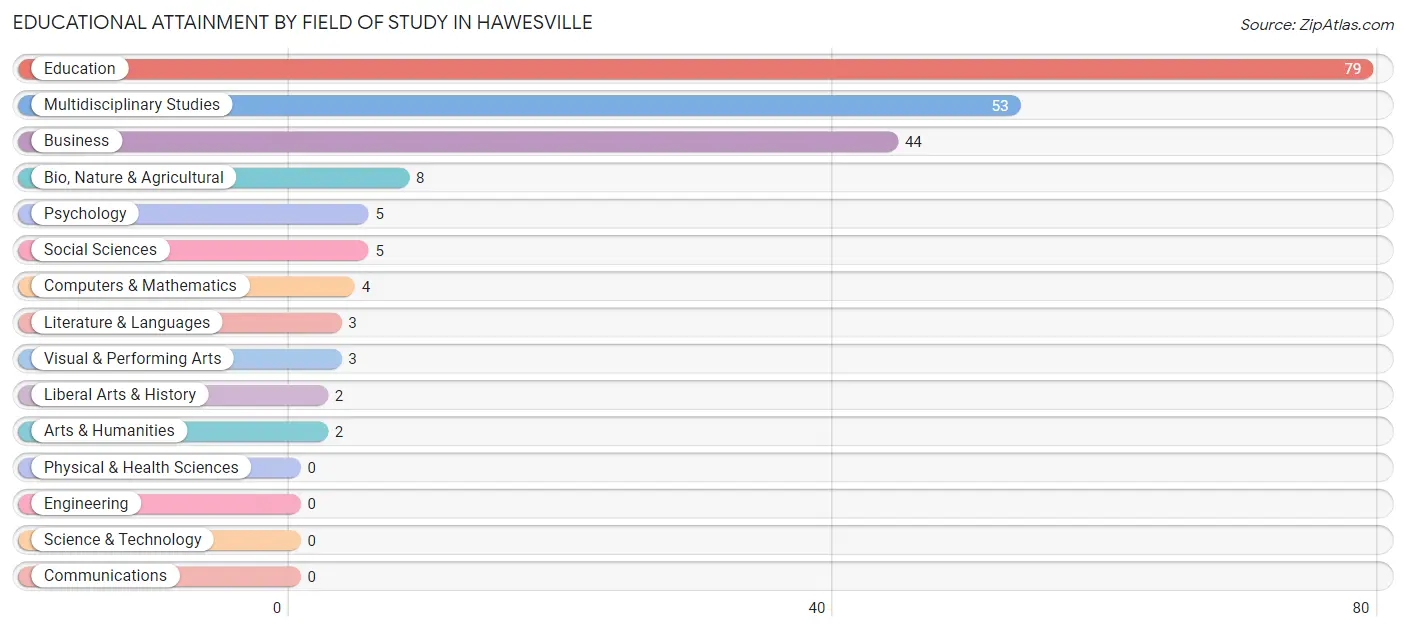
| Field of Study | # Graduates | % Graduates |
| Computers & Mathematics | 4 | 1.9% |
| Bio, Nature & Agricultural | 8 | 3.8% |
| Physical & Health Sciences | 0 | 0.0% |
| Psychology | 5 | 2.4% |
| Social Sciences | 5 | 2.4% |
| Engineering | 0 | 0.0% |
| Multidisciplinary Studies | 53 | 25.5% |
| Science & Technology | 0 | 0.0% |
| Business | 44 | 21.1% |
| Education | 79 | 38.0% |
| Literature & Languages | 3 | 1.4% |
| Liberal Arts & History | 2 | 1.0% |
| Visual & Performing Arts | 3 | 1.4% |
| Communications | 0 | 0.0% |
| Arts & Humanities | 2 | 1.0% |
| Total | 208 | 100.0% |
Transportation & Commute in Hawesville
Vehicle Availability by Sex in Hawesville
The most prevalent vehicle ownership categories in Hawesville are males with 2 vehicles (117, accounting for 39.8%) and females with 2 vehicles (37, making up 64.6%).
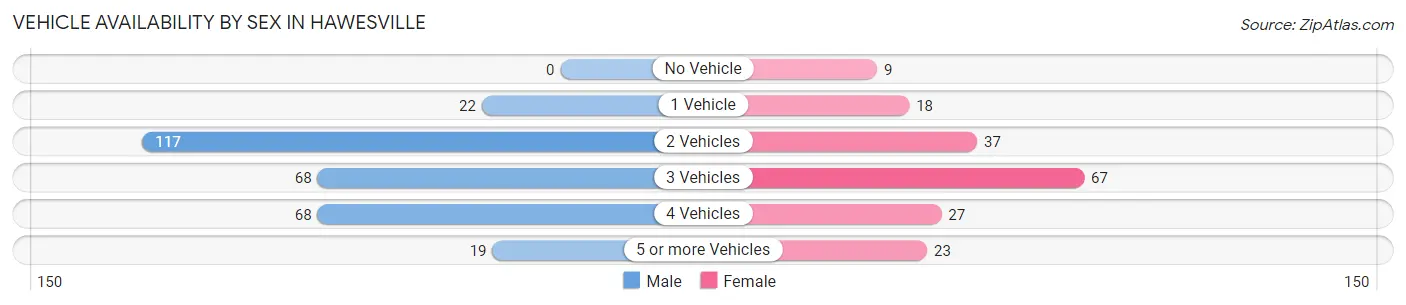
| Vehicles Available | Male | Female |
| No Vehicle | 0 (0.0%) | 9 (5.0%) |
| 1 Vehicle | 22 (7.5%) | 18 (9.9%) |
| 2 Vehicles | 117 (39.8%) | 37 (20.4%) |
| 3 Vehicles | 68 (23.1%) | 67 (37.0%) |
| 4 Vehicles | 68 (23.1%) | 27 (14.9%) |
| 5 or more Vehicles | 19 (6.5%) | 23 (12.7%) |
| Total | 294 (100.0%) | 181 (100.0%) |
Commute Time in Hawesville
The most frequently occuring commute durations in Hawesville are 5 to 9 minutes (130 commuters, 27.7%), 10 to 14 minutes (121 commuters, 25.8%), and 15 to 19 minutes (51 commuters, 10.9%).
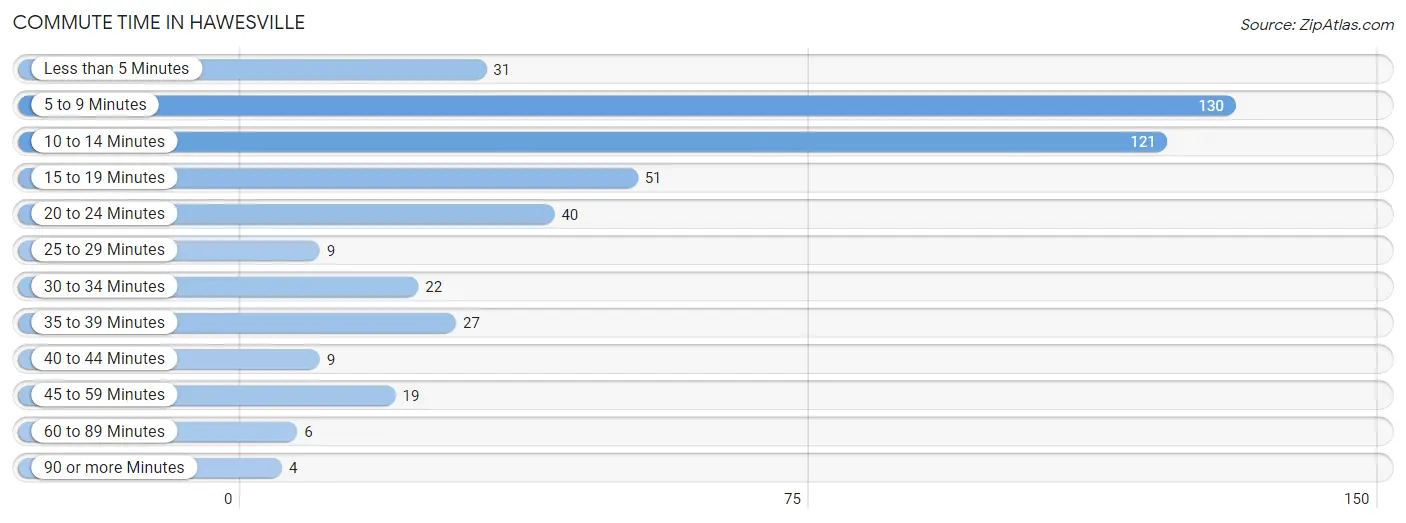
| Commute Time | # Commuters | % Commuters |
| Less than 5 Minutes | 31 | 6.6% |
| 5 to 9 Minutes | 130 | 27.7% |
| 10 to 14 Minutes | 121 | 25.8% |
| 15 to 19 Minutes | 51 | 10.9% |
| 20 to 24 Minutes | 40 | 8.5% |
| 25 to 29 Minutes | 9 | 1.9% |
| 30 to 34 Minutes | 22 | 4.7% |
| 35 to 39 Minutes | 27 | 5.8% |
| 40 to 44 Minutes | 9 | 1.9% |
| 45 to 59 Minutes | 19 | 4.1% |
| 60 to 89 Minutes | 6 | 1.3% |
| 90 or more Minutes | 4 | 0.9% |
Commute Time by Sex in Hawesville
The most common commute times in Hawesville are 10 to 14 minutes (98 commuters, 34.0%) for males and 5 to 9 minutes (67 commuters, 37.0%) for females.
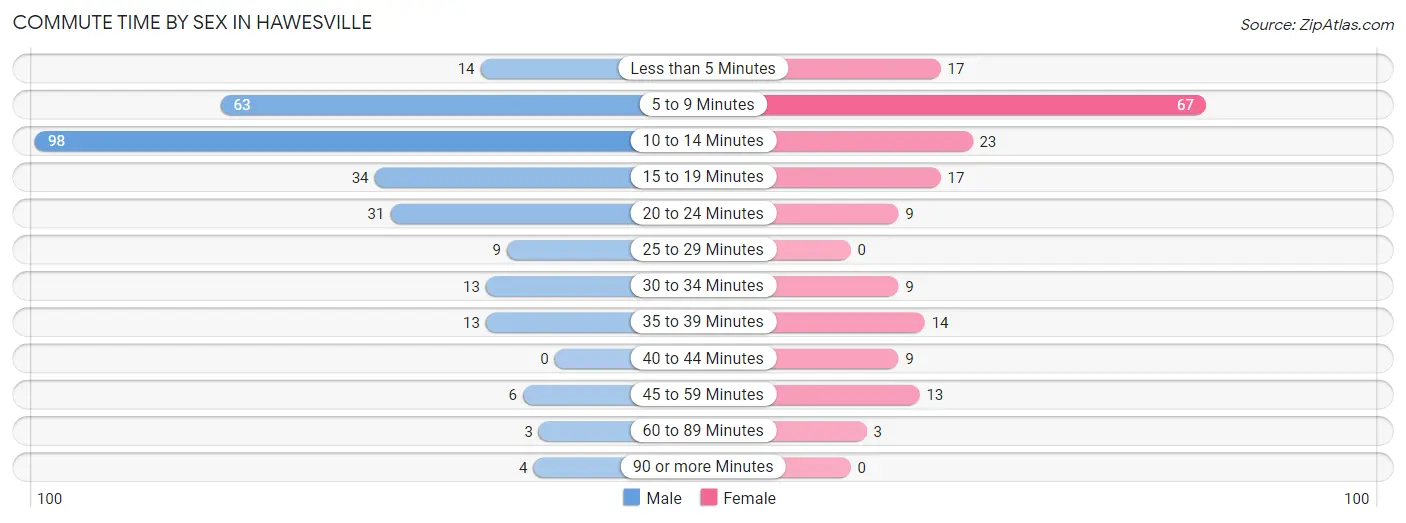
| Commute Time | Male | Female |
| Less than 5 Minutes | 14 (4.9%) | 17 (9.4%) |
| 5 to 9 Minutes | 63 (21.9%) | 67 (37.0%) |
| 10 to 14 Minutes | 98 (34.0%) | 23 (12.7%) |
| 15 to 19 Minutes | 34 (11.8%) | 17 (9.4%) |
| 20 to 24 Minutes | 31 (10.8%) | 9 (5.0%) |
| 25 to 29 Minutes | 9 (3.1%) | 0 (0.0%) |
| 30 to 34 Minutes | 13 (4.5%) | 9 (5.0%) |
| 35 to 39 Minutes | 13 (4.5%) | 14 (7.7%) |
| 40 to 44 Minutes | 0 (0.0%) | 9 (5.0%) |
| 45 to 59 Minutes | 6 (2.1%) | 13 (7.2%) |
| 60 to 89 Minutes | 3 (1.0%) | 3 (1.7%) |
| 90 or more Minutes | 4 (1.4%) | 0 (0.0%) |
Time of Departure to Work by Sex in Hawesville
The most frequent times of departure to work in Hawesville are 5:30 AM to 5:59 AM (81, 28.1%) for males and 7:00 AM to 7:29 AM (46, 25.4%) for females.
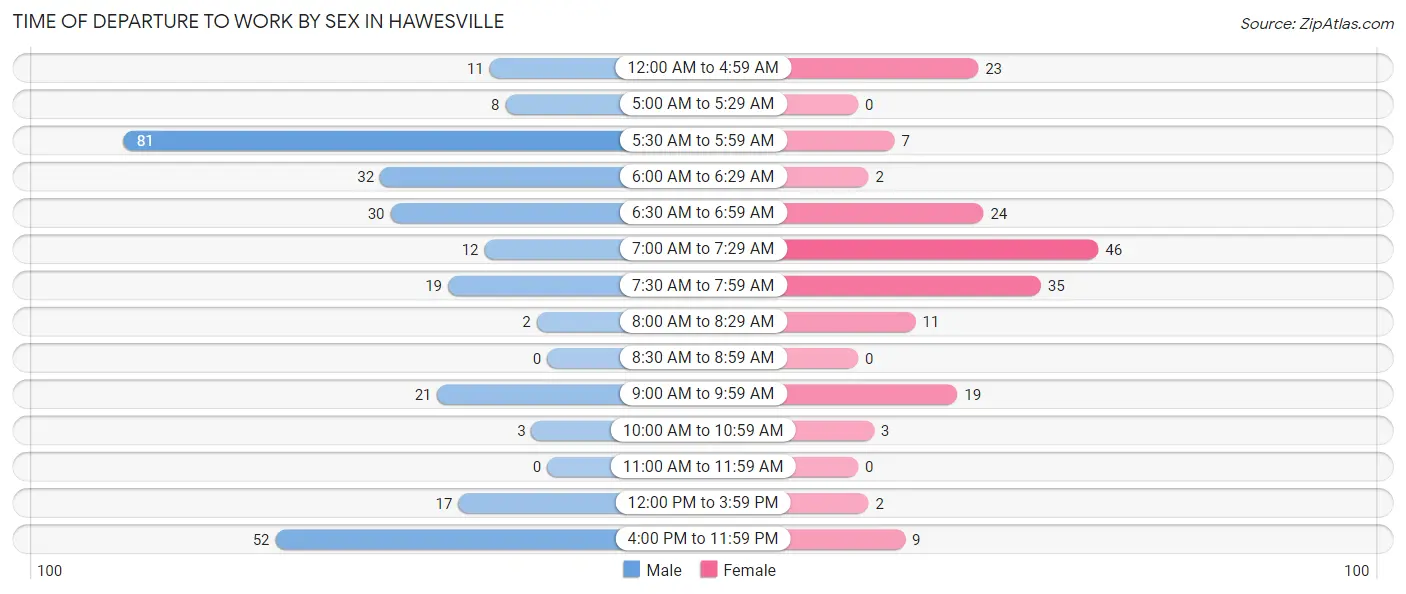
| Time of Departure | Male | Female |
| 12:00 AM to 4:59 AM | 11 (3.8%) | 23 (12.7%) |
| 5:00 AM to 5:29 AM | 8 (2.8%) | 0 (0.0%) |
| 5:30 AM to 5:59 AM | 81 (28.1%) | 7 (3.9%) |
| 6:00 AM to 6:29 AM | 32 (11.1%) | 2 (1.1%) |
| 6:30 AM to 6:59 AM | 30 (10.4%) | 24 (13.3%) |
| 7:00 AM to 7:29 AM | 12 (4.2%) | 46 (25.4%) |
| 7:30 AM to 7:59 AM | 19 (6.6%) | 35 (19.3%) |
| 8:00 AM to 8:29 AM | 2 (0.7%) | 11 (6.1%) |
| 8:30 AM to 8:59 AM | 0 (0.0%) | 0 (0.0%) |
| 9:00 AM to 9:59 AM | 21 (7.3%) | 19 (10.5%) |
| 10:00 AM to 10:59 AM | 3 (1.0%) | 3 (1.7%) |
| 11:00 AM to 11:59 AM | 0 (0.0%) | 0 (0.0%) |
| 12:00 PM to 3:59 PM | 17 (5.9%) | 2 (1.1%) |
| 4:00 PM to 11:59 PM | 52 (18.1%) | 9 (5.0%) |
| Total | 288 (100.0%) | 181 (100.0%) |
Housing Occupancy in Hawesville
Occupancy by Ownership in Hawesville
Of the total 460 dwellings in Hawesville, owner-occupied units account for 341 (74.1%), while renter-occupied units make up 119 (25.9%).
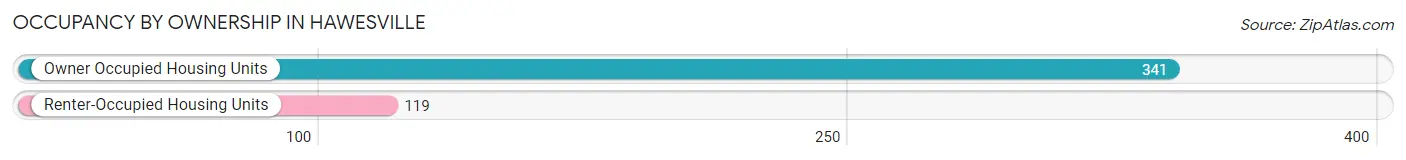
| Occupancy | # Housing Units | % Housing Units |
| Owner Occupied Housing Units | 341 | 74.1% |
| Renter-Occupied Housing Units | 119 | 25.9% |
| Total Occupied Housing Units | 460 | 100.0% |
Occupancy by Household Size in Hawesville
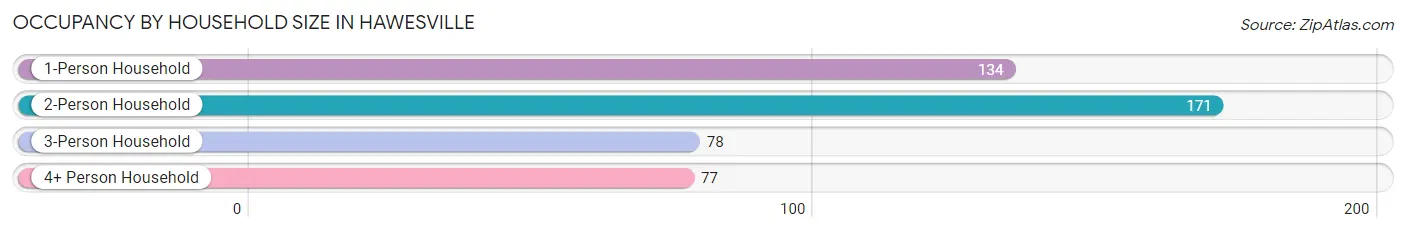
| Household Size | # Housing Units | % Housing Units |
| 1-Person Household | 134 | 29.1% |
| 2-Person Household | 171 | 37.2% |
| 3-Person Household | 78 | 17.0% |
| 4+ Person Household | 77 | 16.7% |
| Total Housing Units | 460 | 100.0% |
Occupancy by Ownership by Household Size in Hawesville
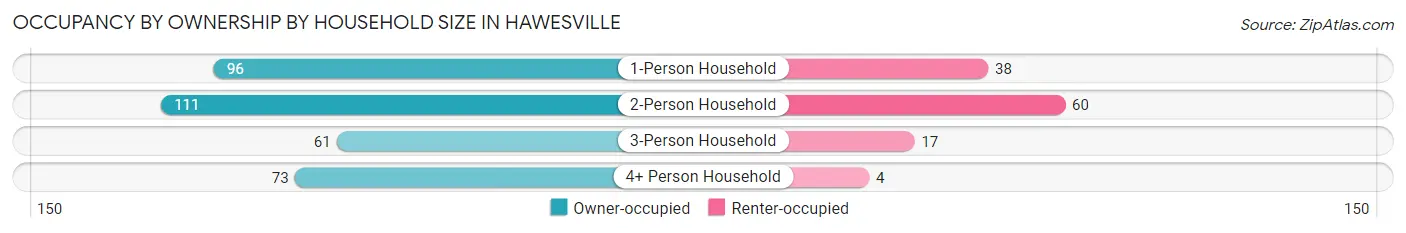
| Household Size | Owner-occupied | Renter-occupied |
| 1-Person Household | 96 (71.6%) | 38 (28.4%) |
| 2-Person Household | 111 (64.9%) | 60 (35.1%) |
| 3-Person Household | 61 (78.2%) | 17 (21.8%) |
| 4+ Person Household | 73 (94.8%) | 4 (5.2%) |
| Total Housing Units | 341 (74.1%) | 119 (25.9%) |
Occupancy by Educational Attainment in Hawesville
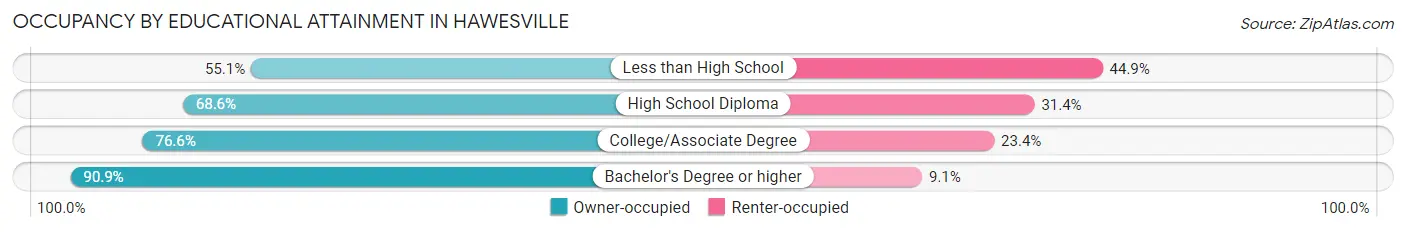
| Household Size | Owner-occupied | Renter-occupied |
| Less than High School | 27 (55.1%) | 22 (44.9%) |
| High School Diploma | 129 (68.6%) | 59 (31.4%) |
| College/Associate Degree | 95 (76.6%) | 29 (23.4%) |
| Bachelor's Degree or higher | 90 (90.9%) | 9 (9.1%) |
Occupancy by Age of Householder in Hawesville
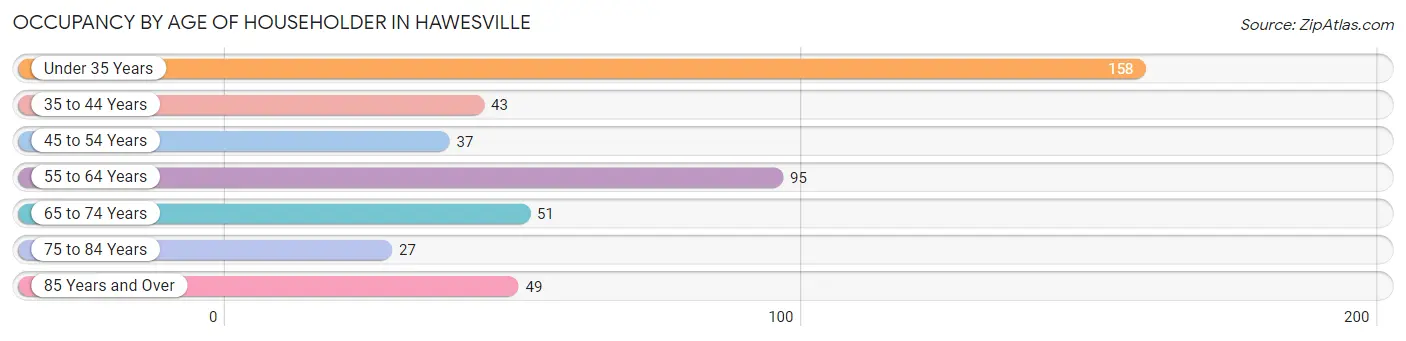
| Age Bracket | # Households | % Households |
| Under 35 Years | 158 | 34.4% |
| 35 to 44 Years | 43 | 9.3% |
| 45 to 54 Years | 37 | 8.0% |
| 55 to 64 Years | 95 | 20.6% |
| 65 to 74 Years | 51 | 11.1% |
| 75 to 84 Years | 27 | 5.9% |
| 85 Years and Over | 49 | 10.6% |
| Total | 460 | 100.0% |
Housing Finances in Hawesville
Median Income by Occupancy in Hawesville
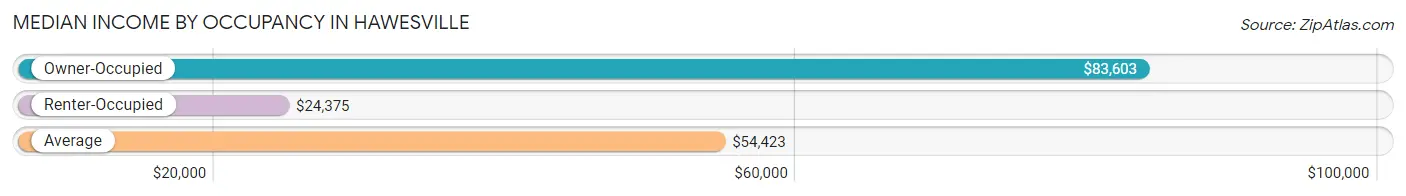
| Occupancy Type | # Households | Median Income |
| Owner-Occupied | 341 (74.1%) | $83,603 |
| Renter-Occupied | 119 (25.9%) | $24,375 |
| Average | 460 (100.0%) | $54,423 |
Occupancy by Householder Income Bracket in Hawesville
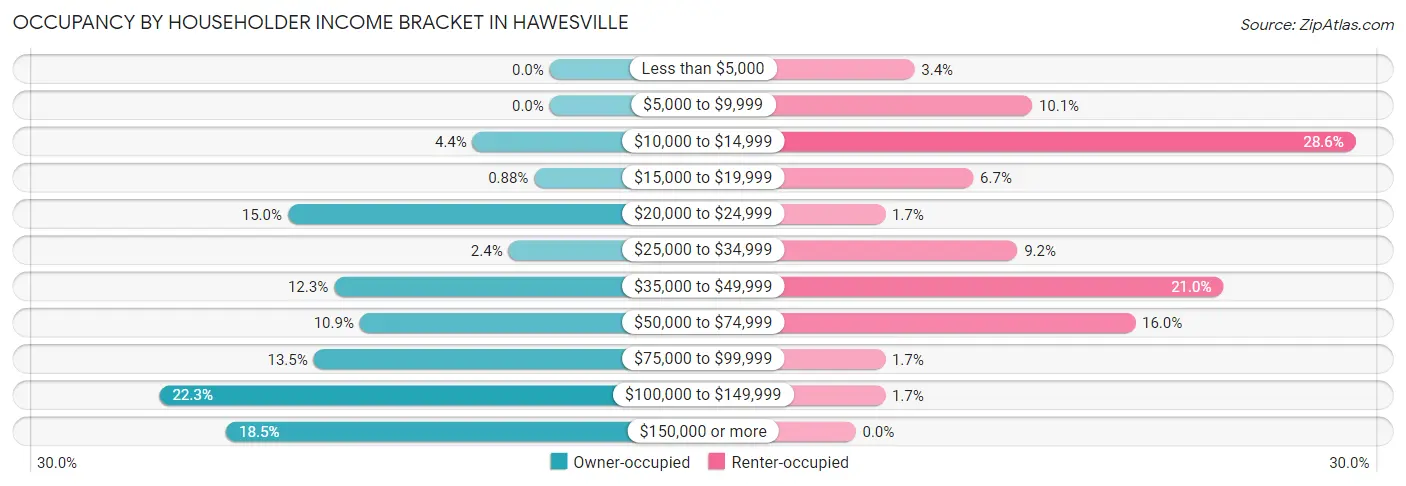
| Income Bracket | Owner-occupied | Renter-occupied |
| Less than $5,000 | 0 (0.0%) | 4 (3.4%) |
| $5,000 to $9,999 | 0 (0.0%) | 12 (10.1%) |
| $10,000 to $14,999 | 15 (4.4%) | 34 (28.6%) |
| $15,000 to $19,999 | 3 (0.9%) | 8 (6.7%) |
| $20,000 to $24,999 | 51 (15.0%) | 2 (1.7%) |
| $25,000 to $34,999 | 8 (2.4%) | 11 (9.2%) |
| $35,000 to $49,999 | 42 (12.3%) | 25 (21.0%) |
| $50,000 to $74,999 | 37 (10.8%) | 19 (16.0%) |
| $75,000 to $99,999 | 46 (13.5%) | 2 (1.7%) |
| $100,000 to $149,999 | 76 (22.3%) | 2 (1.7%) |
| $150,000 or more | 63 (18.5%) | 0 (0.0%) |
| Total | 341 (100.0%) | 119 (100.0%) |
Monthly Housing Cost Tiers in Hawesville
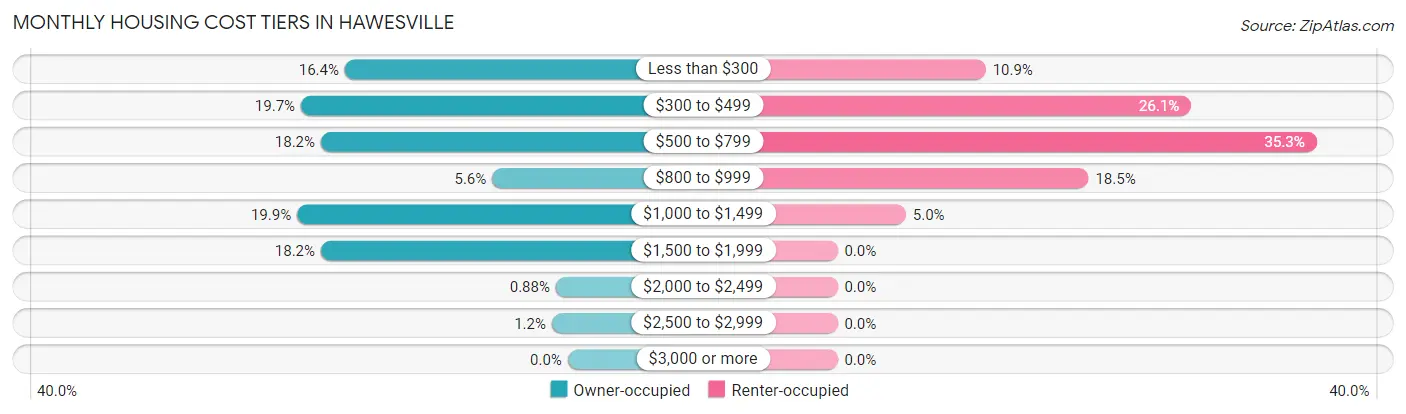
| Monthly Cost | Owner-occupied | Renter-occupied |
| Less than $300 | 56 (16.4%) | 13 (10.9%) |
| $300 to $499 | 67 (19.7%) | 31 (26.1%) |
| $500 to $799 | 62 (18.2%) | 42 (35.3%) |
| $800 to $999 | 19 (5.6%) | 22 (18.5%) |
| $1,000 to $1,499 | 68 (19.9%) | 6 (5.0%) |
| $1,500 to $1,999 | 62 (18.2%) | 0 (0.0%) |
| $2,000 to $2,499 | 3 (0.9%) | 0 (0.0%) |
| $2,500 to $2,999 | 4 (1.2%) | 0 (0.0%) |
| $3,000 or more | 0 (0.0%) | 0 (0.0%) |
| Total | 341 (100.0%) | 119 (100.0%) |
Physical Housing Characteristics in Hawesville
Housing Structures in Hawesville
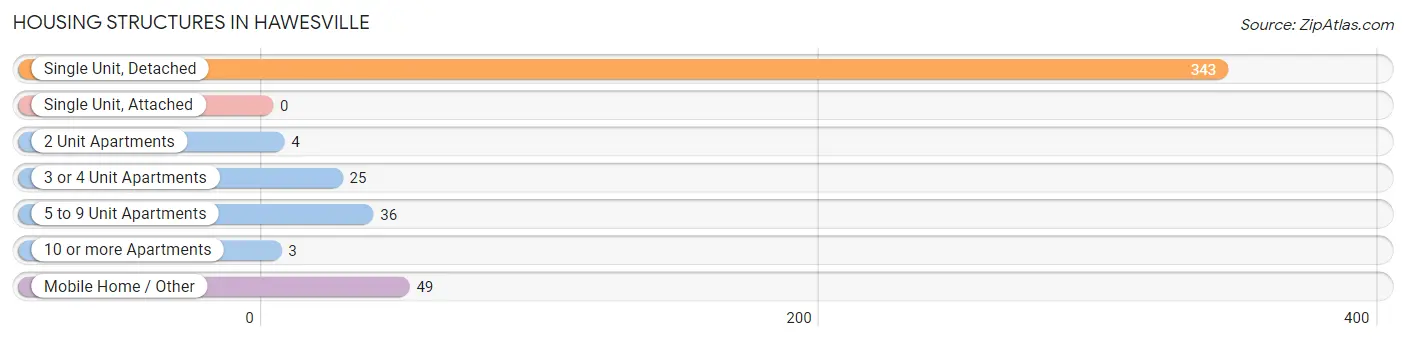
| Structure Type | # Housing Units | % Housing Units |
| Single Unit, Detached | 343 | 74.6% |
| Single Unit, Attached | 0 | 0.0% |
| 2 Unit Apartments | 4 | 0.9% |
| 3 or 4 Unit Apartments | 25 | 5.4% |
| 5 to 9 Unit Apartments | 36 | 7.8% |
| 10 or more Apartments | 3 | 0.6% |
| Mobile Home / Other | 49 | 10.6% |
| Total | 460 | 100.0% |
Housing Structures by Occupancy in Hawesville
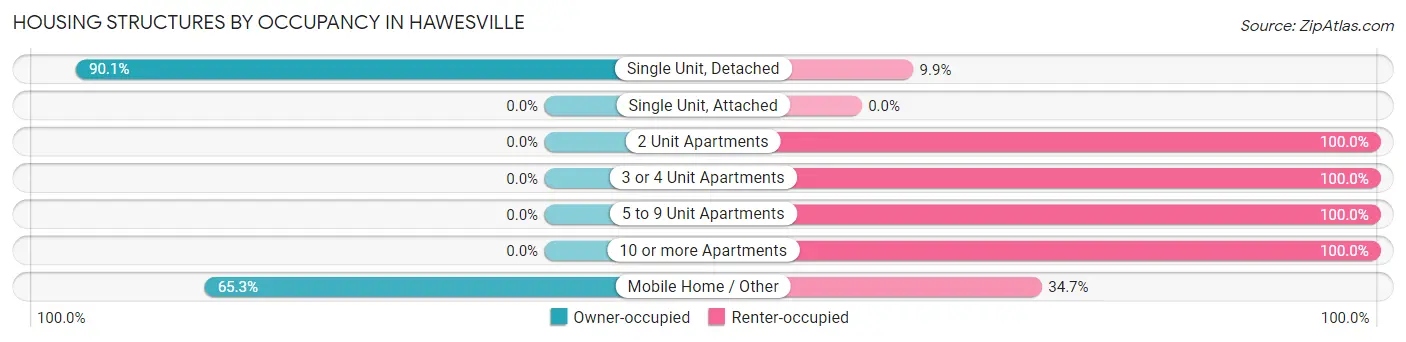
| Structure Type | Owner-occupied | Renter-occupied |
| Single Unit, Detached | 309 (90.1%) | 34 (9.9%) |
| Single Unit, Attached | 0 (0.0%) | 0 (0.0%) |
| 2 Unit Apartments | 0 (0.0%) | 4 (100.0%) |
| 3 or 4 Unit Apartments | 0 (0.0%) | 25 (100.0%) |
| 5 to 9 Unit Apartments | 0 (0.0%) | 36 (100.0%) |
| 10 or more Apartments | 0 (0.0%) | 3 (100.0%) |
| Mobile Home / Other | 32 (65.3%) | 17 (34.7%) |
| Total | 341 (74.1%) | 119 (25.9%) |
Housing Structures by Number of Rooms in Hawesville
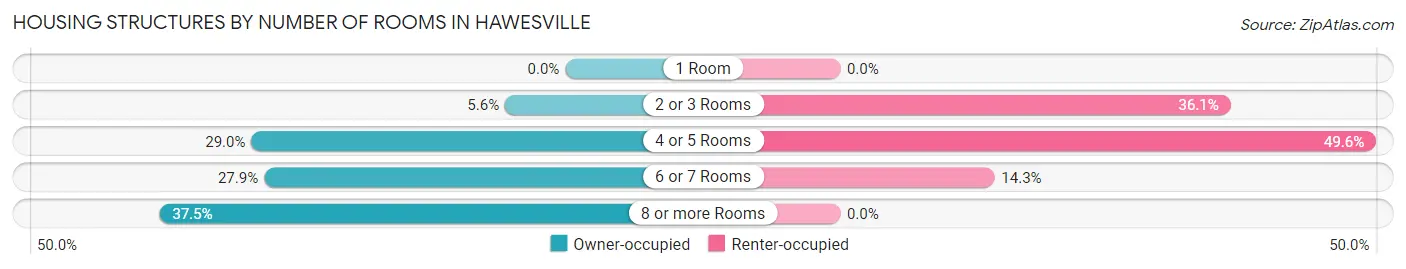
| Number of Rooms | Owner-occupied | Renter-occupied |
| 1 Room | 0 (0.0%) | 0 (0.0%) |
| 2 or 3 Rooms | 19 (5.6%) | 43 (36.1%) |
| 4 or 5 Rooms | 99 (29.0%) | 59 (49.6%) |
| 6 or 7 Rooms | 95 (27.9%) | 17 (14.3%) |
| 8 or more Rooms | 128 (37.5%) | 0 (0.0%) |
| Total | 341 (100.0%) | 119 (100.0%) |
Housing Structure by Heating Type in Hawesville
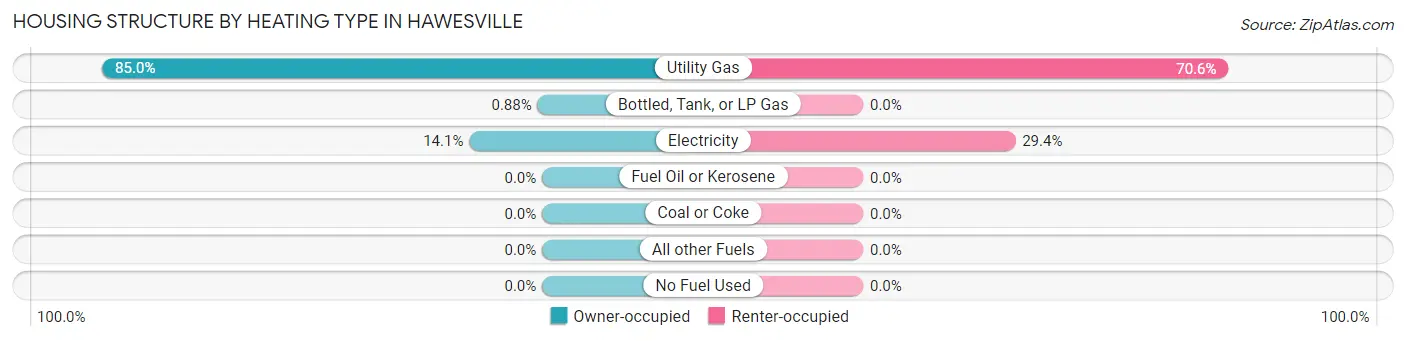
| Heating Type | Owner-occupied | Renter-occupied |
| Utility Gas | 290 (85.0%) | 84 (70.6%) |
| Bottled, Tank, or LP Gas | 3 (0.9%) | 0 (0.0%) |
| Electricity | 48 (14.1%) | 35 (29.4%) |
| Fuel Oil or Kerosene | 0 (0.0%) | 0 (0.0%) |
| Coal or Coke | 0 (0.0%) | 0 (0.0%) |
| All other Fuels | 0 (0.0%) | 0 (0.0%) |
| No Fuel Used | 0 (0.0%) | 0 (0.0%) |
| Total | 341 (100.0%) | 119 (100.0%) |
Household Vehicle Usage in Hawesville
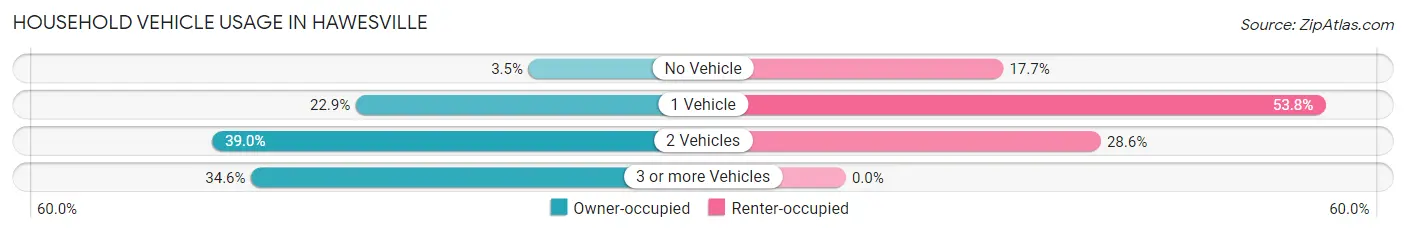
| Vehicles per Household | Owner-occupied | Renter-occupied |
| No Vehicle | 12 (3.5%) | 21 (17.6%) |
| 1 Vehicle | 78 (22.9%) | 64 (53.8%) |
| 2 Vehicles | 133 (39.0%) | 34 (28.6%) |
| 3 or more Vehicles | 118 (34.6%) | 0 (0.0%) |
| Total | 341 (100.0%) | 119 (100.0%) |
Real Estate & Mortgages in Hawesville
Real Estate and Mortgage Overview in Hawesville
| Characteristic | Without Mortgage | With Mortgage |
| Housing Units | 148 | 193 |
| Median Property Value | $127,500 | $121,100 |
| Median Household Income | $98,529 | $26 |
| Monthly Housing Costs | $402 | $0 |
| Real Estate Taxes | $579 | $0 |
Property Value by Mortgage Status in Hawesville
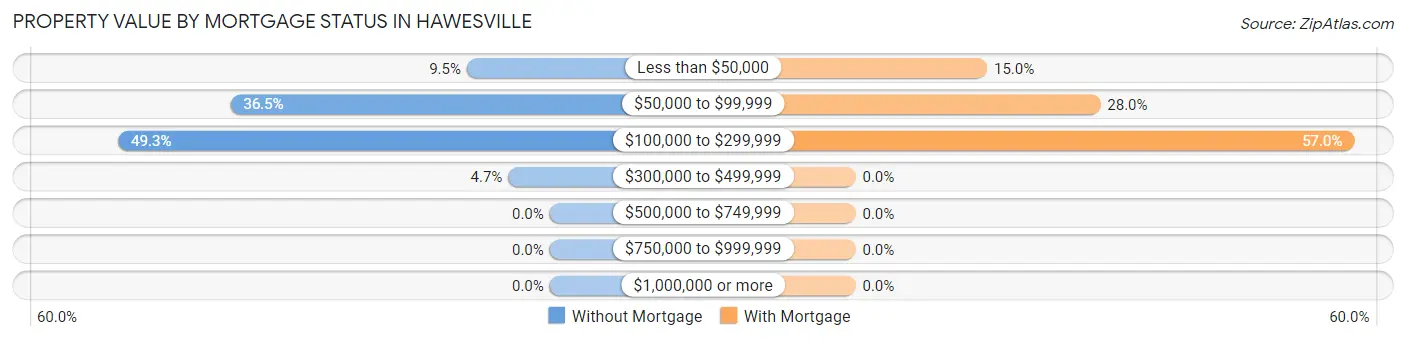
| Property Value | Without Mortgage | With Mortgage |
| Less than $50,000 | 14 (9.5%) | 29 (15.0%) |
| $50,000 to $99,999 | 54 (36.5%) | 54 (28.0%) |
| $100,000 to $299,999 | 73 (49.3%) | 110 (57.0%) |
| $300,000 to $499,999 | 7 (4.7%) | 0 (0.0%) |
| $500,000 to $749,999 | 0 (0.0%) | 0 (0.0%) |
| $750,000 to $999,999 | 0 (0.0%) | 0 (0.0%) |
| $1,000,000 or more | 0 (0.0%) | 0 (0.0%) |
| Total | 148 (100.0%) | 193 (100.0%) |
Household Income by Mortgage Status in Hawesville
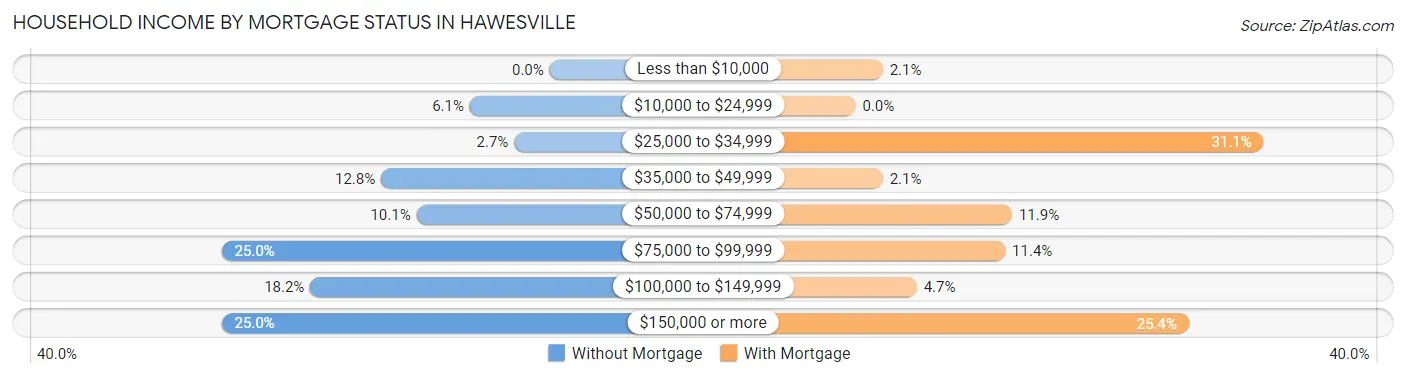
| Household Income | Without Mortgage | With Mortgage |
| Less than $10,000 | 0 (0.0%) | 4 (2.1%) |
| $10,000 to $24,999 | 9 (6.1%) | 0 (0.0%) |
| $25,000 to $34,999 | 4 (2.7%) | 60 (31.1%) |
| $35,000 to $49,999 | 19 (12.8%) | 4 (2.1%) |
| $50,000 to $74,999 | 15 (10.1%) | 23 (11.9%) |
| $75,000 to $99,999 | 37 (25.0%) | 22 (11.4%) |
| $100,000 to $149,999 | 27 (18.2%) | 9 (4.7%) |
| $150,000 or more | 37 (25.0%) | 49 (25.4%) |
| Total | 148 (100.0%) | 193 (100.0%) |
Property Value to Household Income Ratio in Hawesville
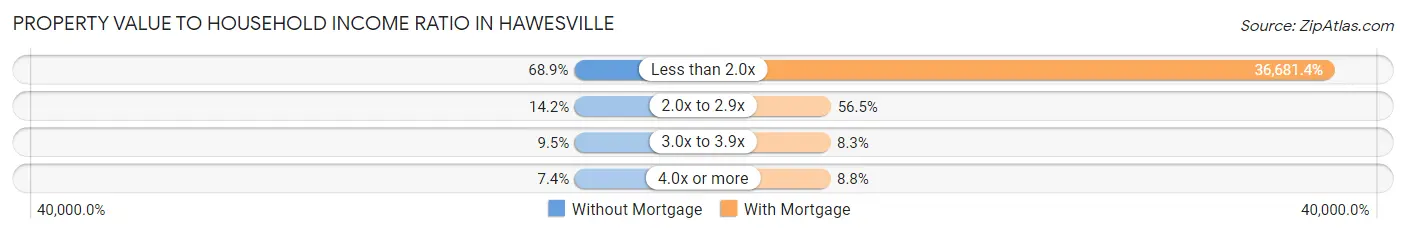
| Value-to-Income Ratio | Without Mortgage | With Mortgage |
| Less than 2.0x | 102 (68.9%) | 70,795 (36,681.3%) |
| 2.0x to 2.9x | 21 (14.2%) | 109 (56.5%) |
| 3.0x to 3.9x | 14 (9.5%) | 16 (8.3%) |
| 4.0x or more | 11 (7.4%) | 17 (8.8%) |
| Total | 148 (100.0%) | 193 (100.0%) |
Real Estate Taxes by Mortgage Status in Hawesville
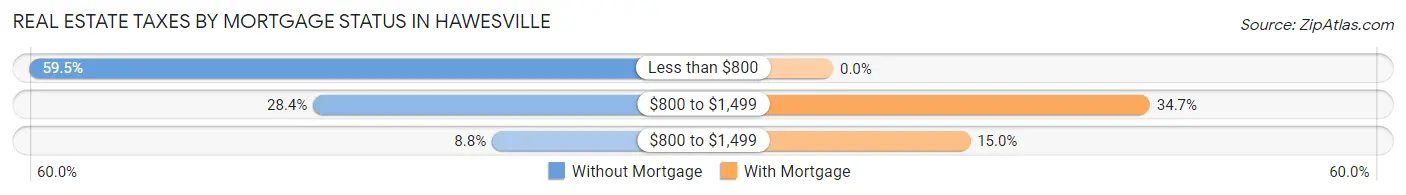
| Property Taxes | Without Mortgage | With Mortgage |
| Less than $800 | 88 (59.5%) | 0 (0.0%) |
| $800 to $1,499 | 42 (28.4%) | 67 (34.7%) |
| $800 to $1,499 | 13 (8.8%) | 29 (15.0%) |
| Total | 148 (100.0%) | 193 (100.0%) |
Health & Disability in Hawesville
Health Insurance Coverage by Age in Hawesville
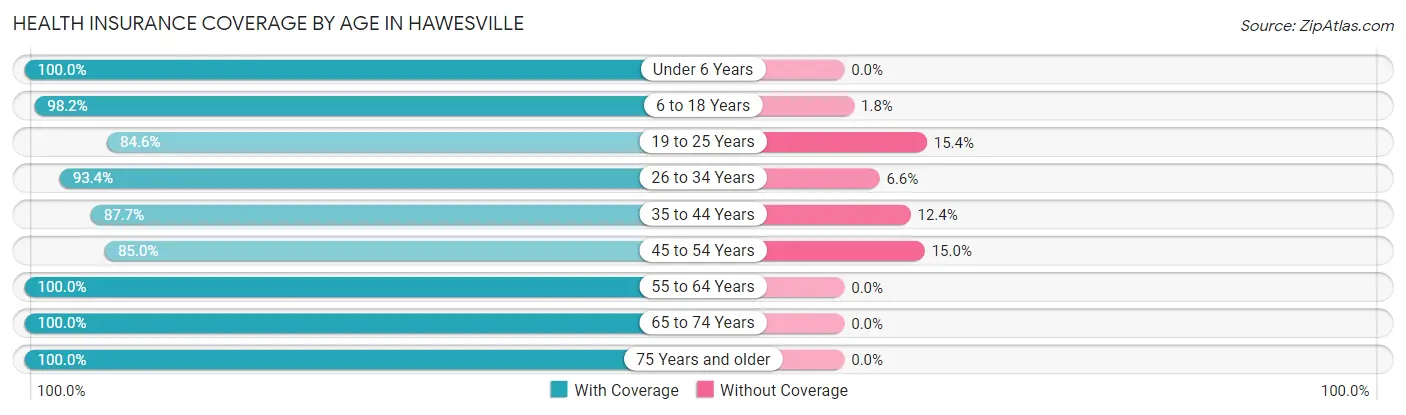
| Age Bracket | With Coverage | Without Coverage |
| Under 6 Years | 65 (100.0%) | 0 (0.0%) |
| 6 to 18 Years | 161 (98.2%) | 3 (1.8%) |
| 19 to 25 Years | 99 (84.6%) | 18 (15.4%) |
| 26 to 34 Years | 185 (93.4%) | 13 (6.6%) |
| 35 to 44 Years | 71 (87.6%) | 10 (12.3%) |
| 45 to 54 Years | 68 (85.0%) | 12 (15.0%) |
| 55 to 64 Years | 157 (100.0%) | 0 (0.0%) |
| 65 to 74 Years | 87 (100.0%) | 0 (0.0%) |
| 75 Years and older | 94 (100.0%) | 0 (0.0%) |
| Total | 987 (94.6%) | 56 (5.4%) |
Health Insurance Coverage by Citizenship Status in Hawesville
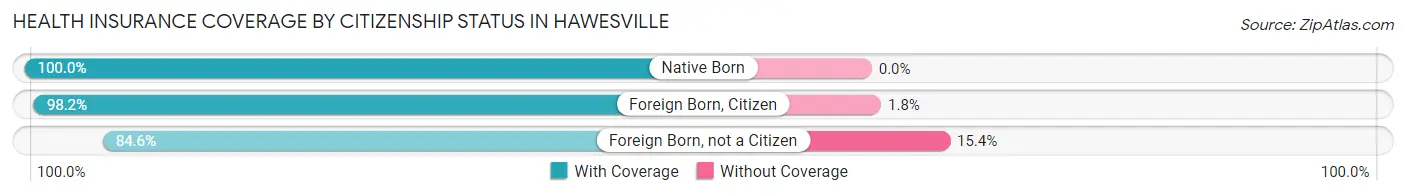
| Citizenship Status | With Coverage | Without Coverage |
| Native Born | 65 (100.0%) | 0 (0.0%) |
| Foreign Born, Citizen | 161 (98.2%) | 3 (1.8%) |
| Foreign Born, not a Citizen | 99 (84.6%) | 18 (15.4%) |
Health Insurance Coverage by Household Income in Hawesville
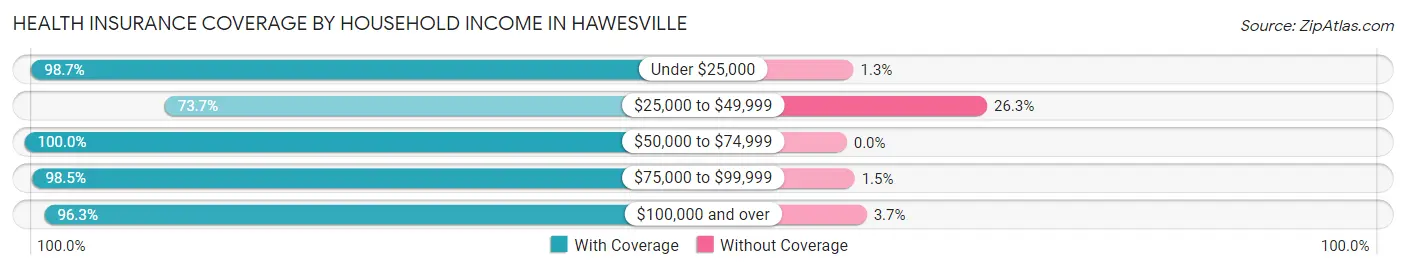
| Household Income | With Coverage | Without Coverage |
| Under $25,000 | 234 (98.7%) | 3 (1.3%) |
| $25,000 to $49,999 | 101 (73.7%) | 36 (26.3%) |
| $50,000 to $74,999 | 132 (100.0%) | 0 (0.0%) |
| $75,000 to $99,999 | 133 (98.5%) | 2 (1.5%) |
| $100,000 and over | 387 (96.3%) | 15 (3.7%) |
Public vs Private Health Insurance Coverage by Age in Hawesville
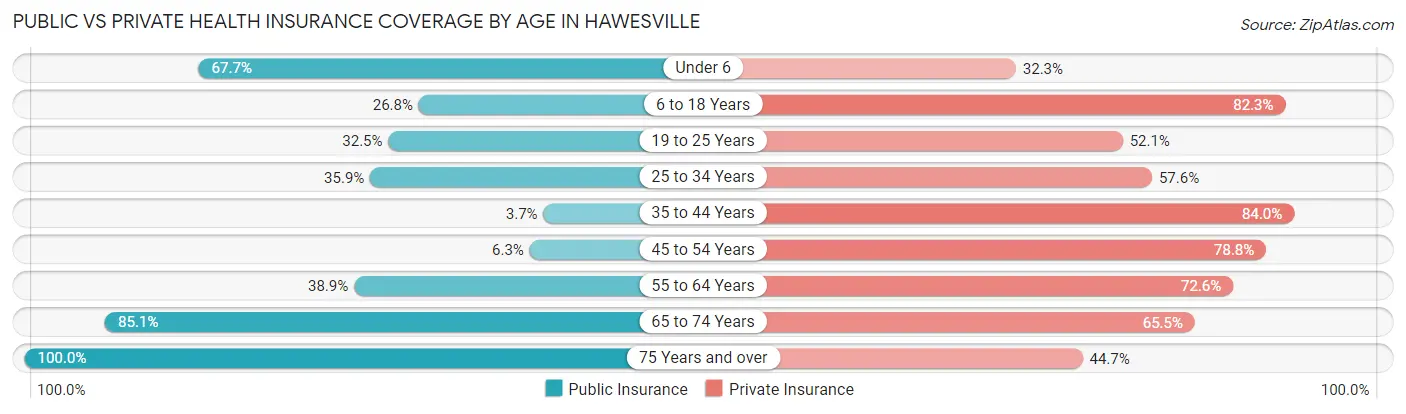
| Age Bracket | Public Insurance | Private Insurance |
| Under 6 | 44 (67.7%) | 21 (32.3%) |
| 6 to 18 Years | 44 (26.8%) | 135 (82.3%) |
| 19 to 25 Years | 38 (32.5%) | 61 (52.1%) |
| 25 to 34 Years | 71 (35.9%) | 114 (57.6%) |
| 35 to 44 Years | 3 (3.7%) | 68 (84.0%) |
| 45 to 54 Years | 5 (6.2%) | 63 (78.7%) |
| 55 to 64 Years | 61 (38.9%) | 114 (72.6%) |
| 65 to 74 Years | 74 (85.1%) | 57 (65.5%) |
| 75 Years and over | 94 (100.0%) | 42 (44.7%) |
| Total | 434 (41.6%) | 675 (64.7%) |
Disability Status by Sex by Age in Hawesville
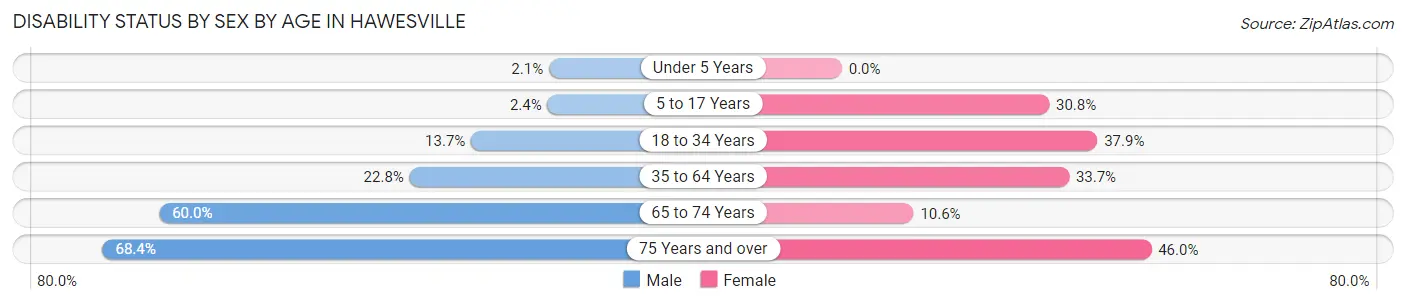
| Age Bracket | Male | Female |
| Under 5 Years | 1 (2.1%) | 0 (0.0%) |
| 5 to 17 Years | 2 (2.4%) | 16 (30.8%) |
| 18 to 34 Years | 23 (13.7%) | 66 (37.9%) |
| 35 to 64 Years | 34 (22.8%) | 57 (33.7%) |
| 65 to 74 Years | 24 (60.0%) | 5 (10.6%) |
| 75 Years and over | 39 (68.4%) | 17 (46.0%) |
Disability Class by Sex by Age in Hawesville
Disability Class: Hearing Difficulty
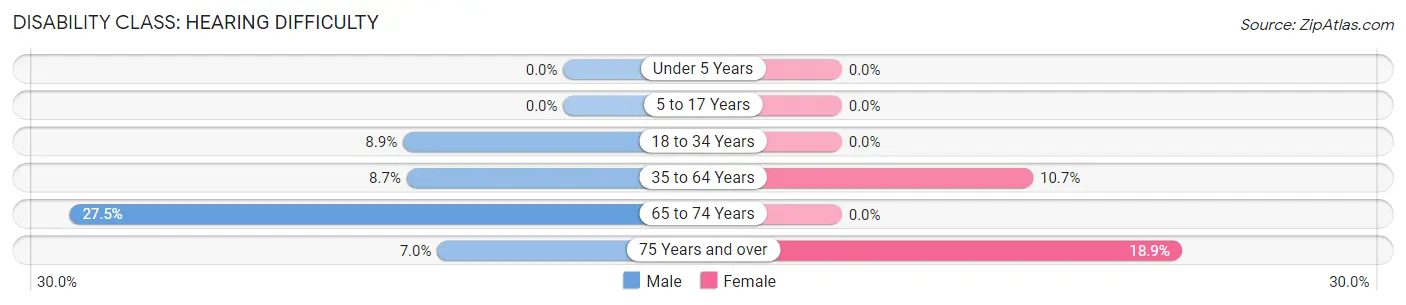
| Age Bracket | Male | Female |
| Under 5 Years | 0 (0.0%) | 0 (0.0%) |
| 5 to 17 Years | 0 (0.0%) | 0 (0.0%) |
| 18 to 34 Years | 15 (8.9%) | 0 (0.0%) |
| 35 to 64 Years | 13 (8.7%) | 18 (10.6%) |
| 65 to 74 Years | 11 (27.5%) | 0 (0.0%) |
| 75 Years and over | 4 (7.0%) | 7 (18.9%) |
Disability Class: Vision Difficulty
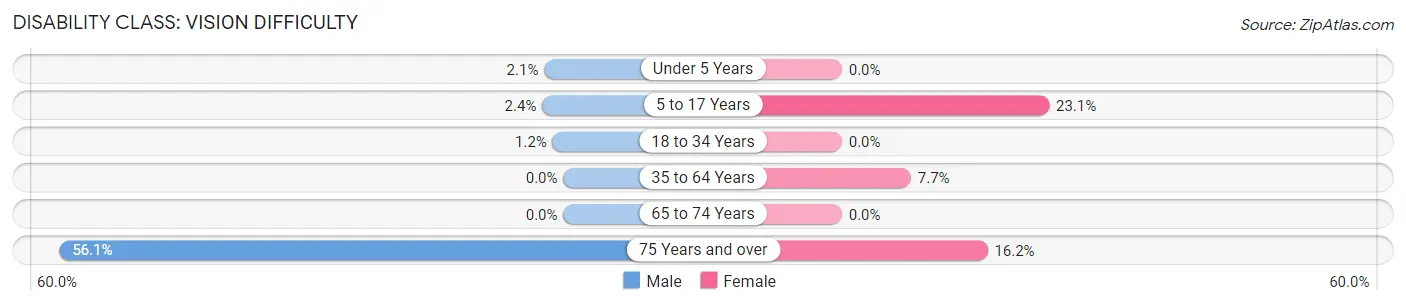
| Age Bracket | Male | Female |
| Under 5 Years | 1 (2.1%) | 0 (0.0%) |
| 5 to 17 Years | 2 (2.4%) | 12 (23.1%) |
| 18 to 34 Years | 2 (1.2%) | 0 (0.0%) |
| 35 to 64 Years | 0 (0.0%) | 13 (7.7%) |
| 65 to 74 Years | 0 (0.0%) | 0 (0.0%) |
| 75 Years and over | 32 (56.1%) | 6 (16.2%) |
Disability Class: Cognitive Difficulty
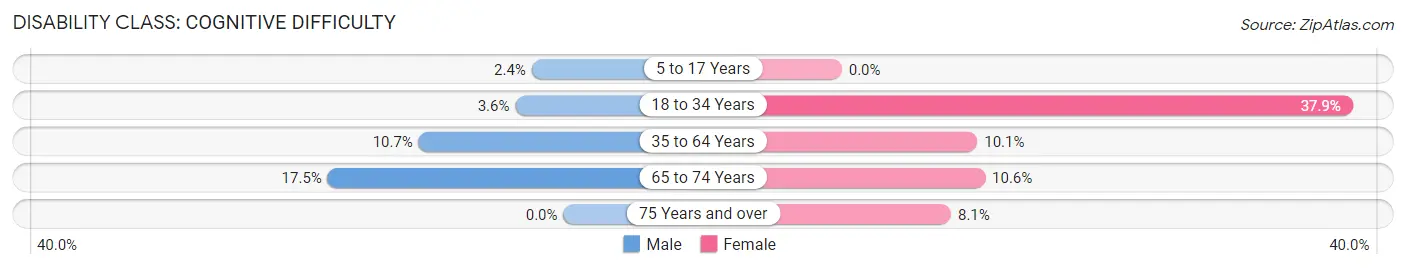
| Age Bracket | Male | Female |
| 5 to 17 Years | 2 (2.4%) | 0 (0.0%) |
| 18 to 34 Years | 6 (3.6%) | 66 (37.9%) |
| 35 to 64 Years | 16 (10.7%) | 17 (10.1%) |
| 65 to 74 Years | 7 (17.5%) | 5 (10.6%) |
| 75 Years and over | 0 (0.0%) | 3 (8.1%) |
Disability Class: Ambulatory Difficulty
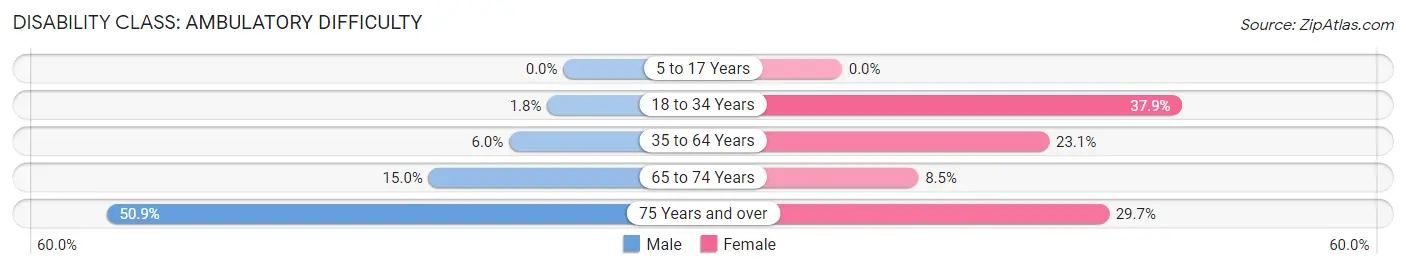
| Age Bracket | Male | Female |
| 5 to 17 Years | 0 (0.0%) | 0 (0.0%) |
| 18 to 34 Years | 3 (1.8%) | 66 (37.9%) |
| 35 to 64 Years | 9 (6.0%) | 39 (23.1%) |
| 65 to 74 Years | 6 (15.0%) | 4 (8.5%) |
| 75 Years and over | 29 (50.9%) | 11 (29.7%) |
Disability Class: Self-Care Difficulty
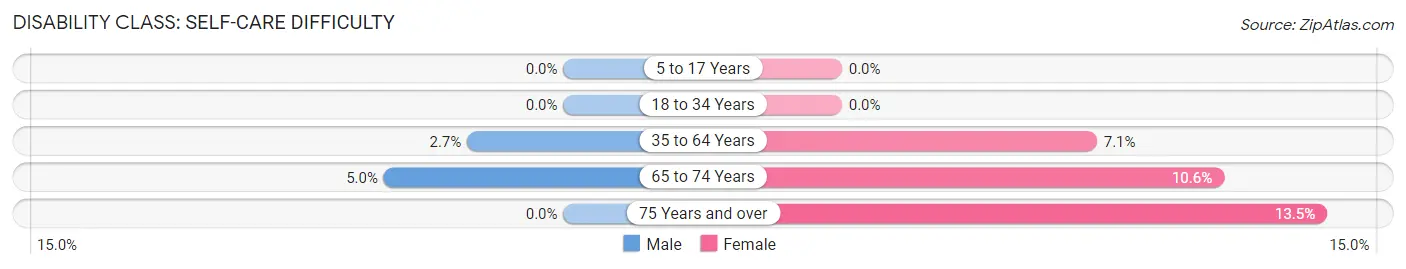
| Age Bracket | Male | Female |
| 5 to 17 Years | 0 (0.0%) | 0 (0.0%) |
| 18 to 34 Years | 0 (0.0%) | 0 (0.0%) |
| 35 to 64 Years | 4 (2.7%) | 12 (7.1%) |
| 65 to 74 Years | 2 (5.0%) | 5 (10.6%) |
| 75 Years and over | 0 (0.0%) | 5 (13.5%) |
Technology Access in Hawesville
Computing Device Access in Hawesville
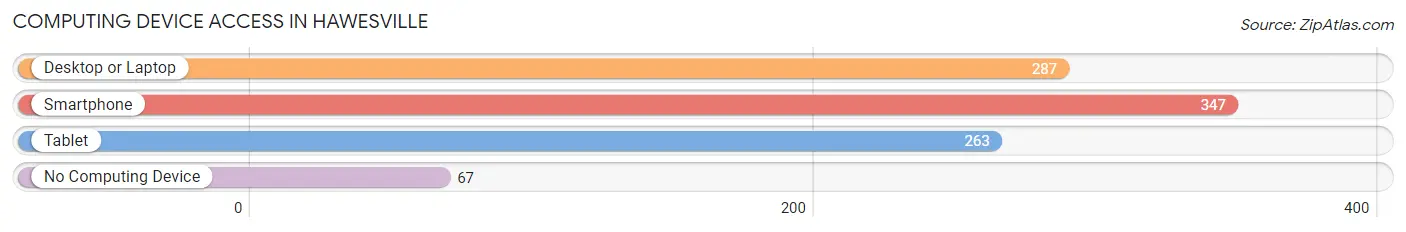
| Device Type | # Households | % Households |
| Desktop or Laptop | 287 | 62.4% |
| Smartphone | 347 | 75.4% |
| Tablet | 263 | 57.2% |
| No Computing Device | 67 | 14.6% |
| Total | 460 | 100.0% |
Internet Access in Hawesville
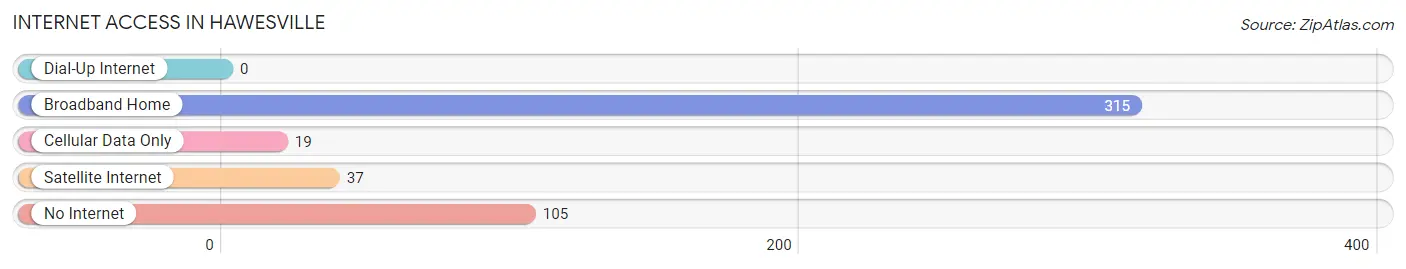
| Internet Type | # Households | % Households |
| Dial-Up Internet | 0 | 0.0% |
| Broadband Home | 315 | 68.5% |
| Cellular Data Only | 19 | 4.1% |
| Satellite Internet | 37 | 8.0% |
| No Internet | 105 | 22.8% |
| Total | 460 | 100.0% |
Hawesville Summary
Hawesville is a small city located in Hancock County, Kentucky, United States. It is situated on the banks of the Ohio River, approximately 40 miles southwest of Louisville. The city has a population of 1,092 as of the 2010 census.
History
Hawesville was founded in 1814 by William Hawkins, a Revolutionary War veteran. The city was originally known as Hawkinsville, but the name was changed to Hawesville in 1836. The city was incorporated in 1837.
Hawesville was a major port on the Ohio River during the 19th century. It was a major stop for steamboats traveling up and down the river. The city was also a major center for the production of hemp and tobacco.
Geography
Hawesville is located at 37°59'N 86°37'W (37.983, -86.619). The city has a total area of 1.2 square miles, all of which is land.
The city is situated on the banks of the Ohio River. The nearest major cities are Owensboro, Kentucky (25 miles to the west) and Louisville, Kentucky (40 miles to the northeast).
Economy
The economy of Hawesville is largely based on agriculture and manufacturing. The city is home to several manufacturing plants, including a paper mill, a steel mill, and a plastics plant.
Agriculture is also an important part of the local economy. The city is home to several farms, which produce corn, soybeans, wheat, and other crops.
Demographics
As of the 2010 census, there were 1,092 people, 441 households, and 294 families residing in the city. The population density was 902.7 people per square mile. The racial makeup of the city was 97.2% White, 0.7% African American, 0.2% Native American, 0.2% Asian, 0.2% from other races, and 1.7% from two or more races. Hispanic or Latino of any race were 0.7% of the population.
The median income for a household in the city was $30,000, and the median income for a family was $37,500. The per capita income for the city was $15,845. About 17.2% of families and 20.2% of the population were below the poverty line, including 28.3% of those under age 18 and 11.3% of those age 65 or over.
Conclusion
Hawesville is a small city located in Hancock County, Kentucky, United States. It is situated on the banks of the Ohio River, approximately 40 miles southwest of Louisville. The city has a population of 1,092 as of the 2010 census. The economy of Hawesville is largely based on agriculture and manufacturing. The city is home to several manufacturing plants, including a paper mill, a steel mill, and a plastics plant. The median income for a household in the city was $30,000, and the median income for a family was $37,500. About 17.2% of families and 20.2% of the population were below the poverty line, including 28.3% of those under age 18 and 11.3% of those age 65 or over.
Common Questions
What is Per Capita Income in Hawesville?
Per Capita income in Hawesville is $34,752.
What is the Median Family Income in Hawesville?
Median Family Income in Hawesville is $67,500.
What is the Median Household income in Hawesville?
Median Household Income in Hawesville is $54,423.
What is Income or Wage Gap in Hawesville?
Income or Wage Gap in Hawesville is 13.8%.
Women in Hawesville earn 86.2 cents for every dollar earned by a man.
What is Inequality or Gini Index in Hawesville?
Inequality or Gini Index in Hawesville is 0.45.
What is the Total Population of Hawesville?
Total Population of Hawesville is 1,043.
What is the Total Male Population of Hawesville?
Total Male Population of Hawesville is 546.
What is the Total Female Population of Hawesville?
Total Female Population of Hawesville is 497.
What is the Ratio of Males per 100 Females in Hawesville?
There are 109.86 Males per 100 Females in Hawesville.
What is the Ratio of Females per 100 Males in Hawesville?
There are 91.03 Females per 100 Males in Hawesville.
What is the Median Population Age in Hawesville?
Median Population Age in Hawesville is 31.9 Years.
What is the Average Family Size in Hawesville
Average Family Size in Hawesville is 2.5 People.
What is the Average Household Size in Hawesville
Average Household Size in Hawesville is 2.3 People.
How Large is the Labor Force in Hawesville?
There are 528 People in the Labor Forcein in Hawesville.
What is the Percentage of People in the Labor Force in Hawesville?
59.6% of People are in the Labor Force in Hawesville.
What is the Unemployment Rate in Hawesville?
Unemployment Rate in Hawesville is 7.0%.