Louisa, KY Map & Demographics
Louisa Map
Louisa Overview
$23,218
PER CAPITA INCOME
$69,167
AVG FAMILY INCOME
$49,583
AVG HOUSEHOLD INCOME
31.1%
WAGE / INCOME GAP [ % ]
68.9¢/ $1
WAGE / INCOME GAP [ $ ]
0.53
INEQUALITY / GINI INDEX
2,652
TOTAL POPULATION
1,338
MALE POPULATION
1,314
FEMALE POPULATION
101.83
MALES / 100 FEMALES
98.21
FEMALES / 100 MALES
32.9
MEDIAN AGE
4.0
AVG FAMILY SIZE
3.2
AVG HOUSEHOLD SIZE
864
LABOR FORCE [ PEOPLE ]
46.1%
PERCENT IN LABOR FORCE
7.9%
UNEMPLOYMENT RATE
Louisa Zip Codes
Louisa Area Codes
Income in Louisa
Income Overview in Louisa
Per Capita Income in Louisa is $23,218, while median incomes of families and households are $69,167 and $49,583 respectively.
| Characteristic | Number | Measure |
| Per Capita Income | 2,652 | $23,218 |
| Median Family Income | 538 | $69,167 |
| Mean Family Income | 538 | $82,755 |
| Median Household Income | 794 | $49,583 |
| Mean Household Income | 794 | $70,508 |
| Income Deficit | 538 | $0 |
| Wage / Income Gap (%) | 2,652 | 31.08% |
| Wage / Income Gap ($) | 2,652 | 68.92¢ per $1 |
| Gini / Inequality Index | 2,652 | 0.53 |
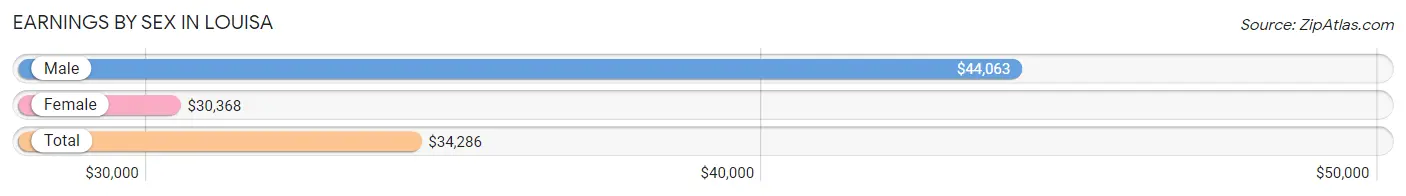
Earnings by Sex in Louisa
Average Earnings in Louisa are $34,286, $44,063 for men and $30,368 for women, a difference of 31.1%.
| Sex | Number | Average Earnings |
| Male | 435 (48.1%) | $44,063 |
| Female | 469 (51.9%) | $30,368 |
| Total | 904 (100.0%) | $34,286 |
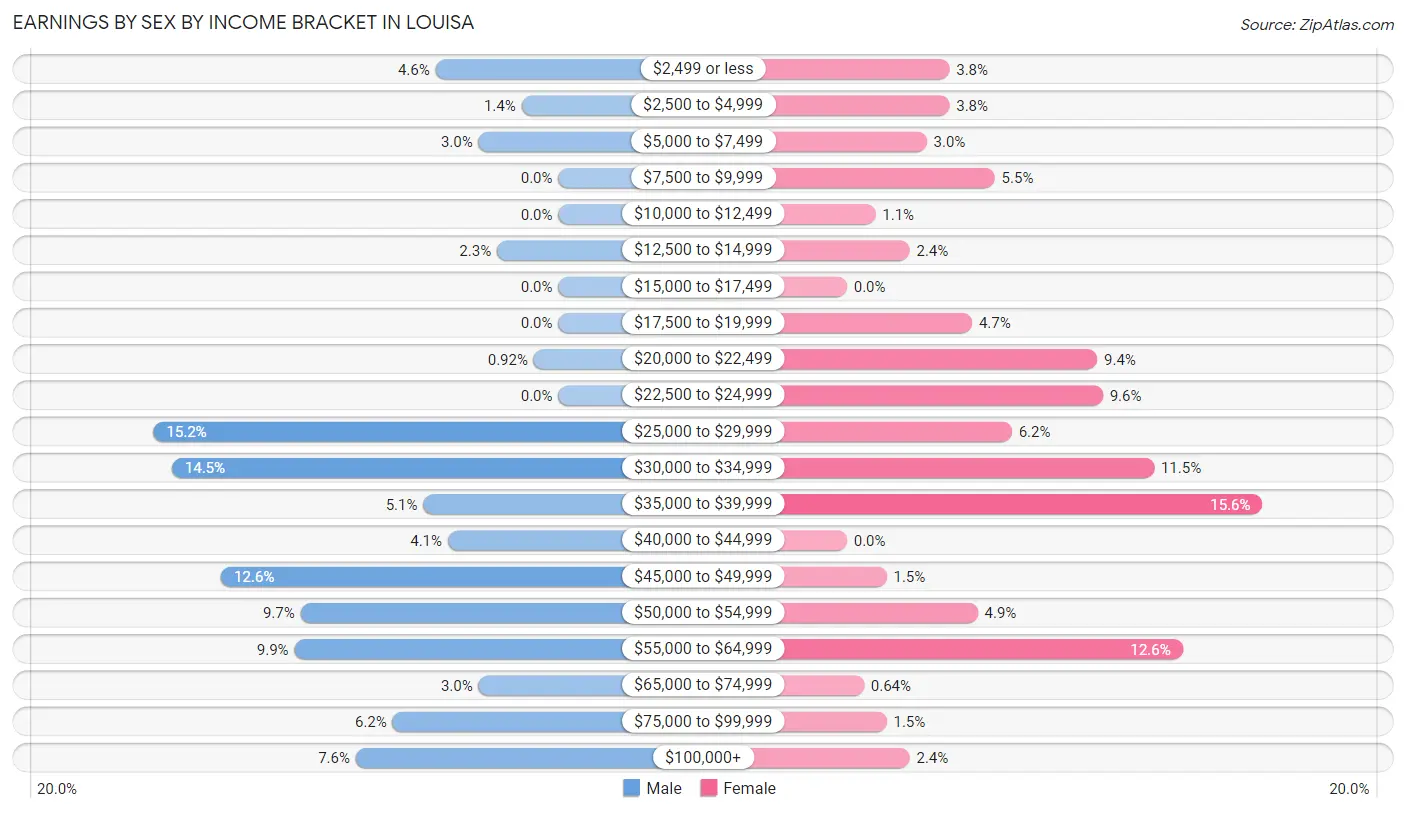
Earnings by Sex by Income Bracket in Louisa
The most common earnings brackets in Louisa are $25,000 to $29,999 for men (66 | 15.2%) and $35,000 to $39,999 for women (73 | 15.6%).
| Income | Male | Female |
| $2,499 or less | 20 (4.6%) | 18 (3.8%) |
| $2,500 to $4,999 | 6 (1.4%) | 18 (3.8%) |
| $5,000 to $7,499 | 13 (3.0%) | 14 (3.0%) |
| $7,500 to $9,999 | 0 (0.0%) | 26 (5.5%) |
| $10,000 to $12,499 | 0 (0.0%) | 5 (1.1%) |
| $12,500 to $14,999 | 10 (2.3%) | 11 (2.4%) |
| $15,000 to $17,499 | 0 (0.0%) | 0 (0.0%) |
| $17,500 to $19,999 | 0 (0.0%) | 22 (4.7%) |
| $20,000 to $22,499 | 4 (0.9%) | 44 (9.4%) |
| $22,500 to $24,999 | 0 (0.0%) | 45 (9.6%) |
| $25,000 to $29,999 | 66 (15.2%) | 29 (6.2%) |
| $30,000 to $34,999 | 63 (14.5%) | 54 (11.5%) |
| $35,000 to $39,999 | 22 (5.1%) | 73 (15.6%) |
| $40,000 to $44,999 | 18 (4.1%) | 0 (0.0%) |
| $45,000 to $49,999 | 55 (12.6%) | 7 (1.5%) |
| $50,000 to $54,999 | 42 (9.7%) | 23 (4.9%) |
| $55,000 to $64,999 | 43 (9.9%) | 59 (12.6%) |
| $65,000 to $74,999 | 13 (3.0%) | 3 (0.6%) |
| $75,000 to $99,999 | 27 (6.2%) | 7 (1.5%) |
| $100,000+ | 33 (7.6%) | 11 (2.4%) |
| Total | 435 (100.0%) | 469 (100.0%) |
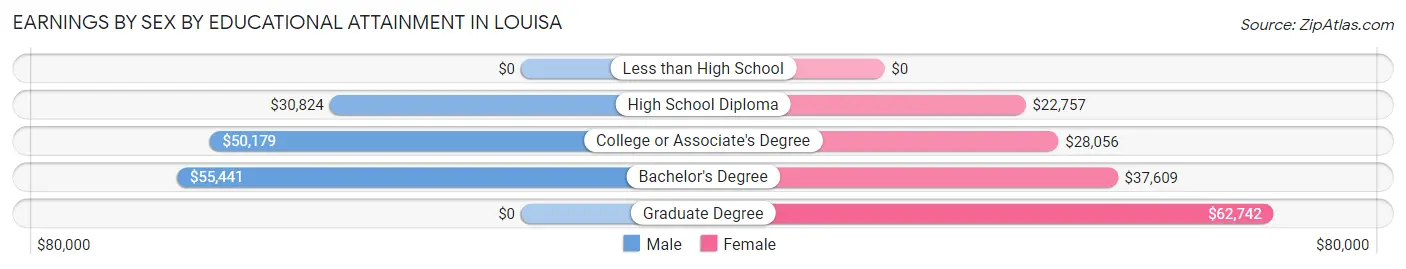
Earnings by Sex by Educational Attainment in Louisa
Average earnings in Louisa are $43,333 for men and $32,279 for women, a difference of 25.5%. Men with an educational attainment of bachelor's degree enjoy the highest average annual earnings of $55,441, while those with high school diploma education earn the least with $30,824. Women with an educational attainment of graduate degree earn the most with the average annual earnings of $62,742, while those with high school diploma education have the smallest earnings of $22,757.
| Educational Attainment | Male Income | Female Income |
| Less than High School | - | - |
| High School Diploma | $30,824 | $22,757 |
| College or Associate's Degree | $50,179 | $28,056 |
| Bachelor's Degree | $55,441 | $37,609 |
| Graduate Degree | - | - |
| Total | $43,333 | $32,279 |
Family Income in Louisa
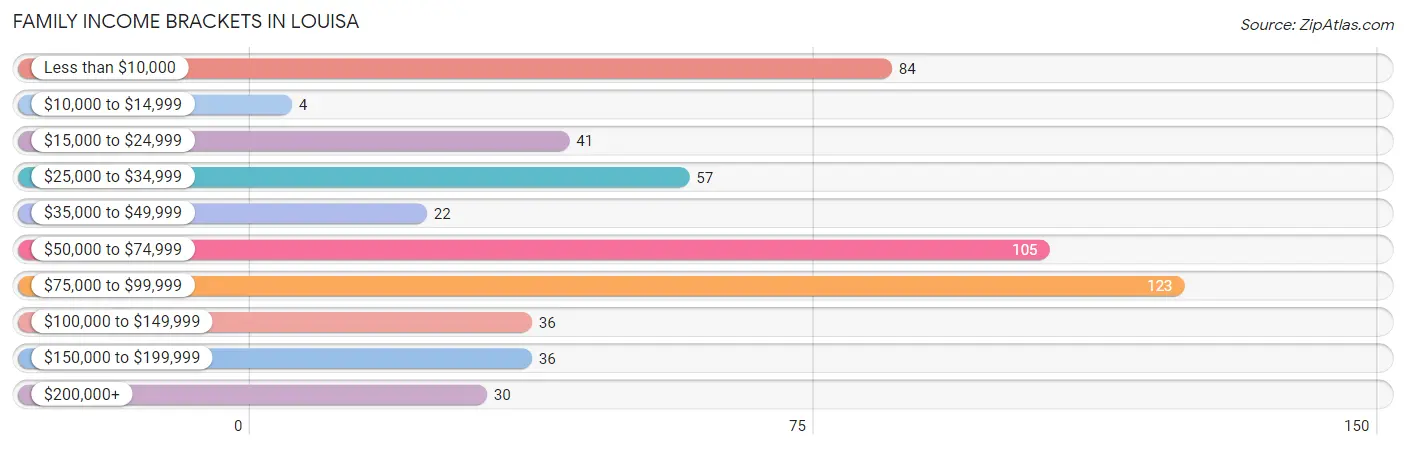
Family Income Brackets in Louisa
According to the Louisa family income data, there are 123 families falling into the $75,000 to $99,999 income range, which is the most common income bracket and makes up 22.9% of all families. Conversely, the $10,000 to $14,999 income bracket is the least frequent group with only 4 families (0.7%) belonging to this category.
| Income Bracket | # Families | % Families |
| Less than $10,000 | 84 | 15.6% |
| $10,000 to $14,999 | 4 | 0.7% |
| $15,000 to $24,999 | 41 | 7.6% |
| $25,000 to $34,999 | 57 | 10.6% |
| $35,000 to $49,999 | 22 | 4.1% |
| $50,000 to $74,999 | 105 | 19.5% |
| $75,000 to $99,999 | 123 | 22.9% |
| $100,000 to $149,999 | 36 | 6.7% |
| $150,000 to $199,999 | 36 | 6.7% |
| $200,000+ | 30 | 5.6% |
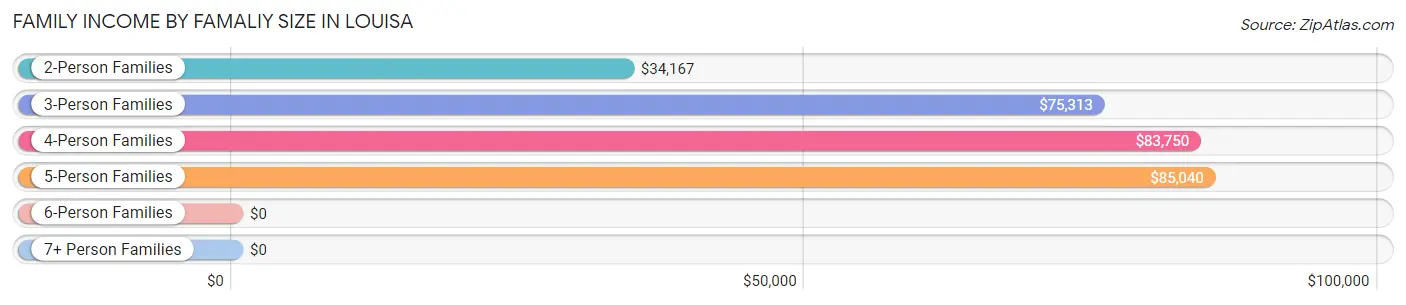
Family Income by Famaliy Size in Louisa
5-person families (103 | 19.1%) account for the highest median family income in Louisa with $85,040 per family, while 3-person families (167 | 31.0%) have the highest median income of $25,104 per family member.
| Income Bracket | # Families | Median Income |
| 2-Person Families | 200 (37.2%) | $34,167 |
| 3-Person Families | 167 (31.0%) | $75,313 |
| 4-Person Families | 45 (8.4%) | $83,750 |
| 5-Person Families | 103 (19.1%) | $85,040 |
| 6-Person Families | 23 (4.3%) | $0 |
| 7+ Person Families | 0 (0.0%) | $0 |
| Total | 538 (100.0%) | $69,167 |
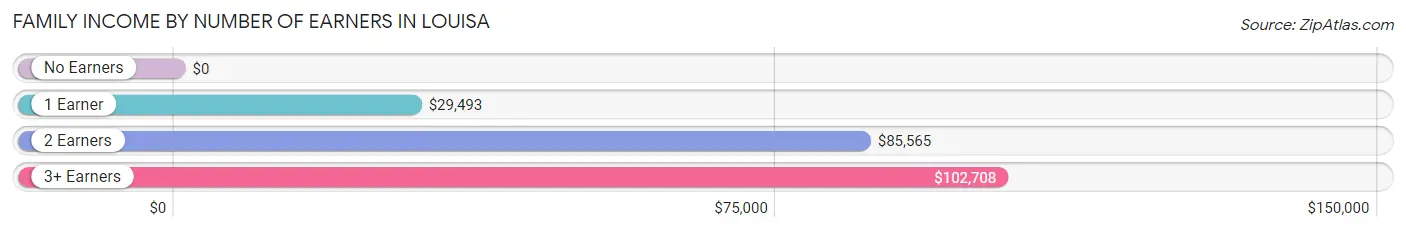
Family Income by Number of Earners in Louisa
| Number of Earners | # Families | Median Income |
| No Earners | 152 (28.2%) | $0 |
| 1 Earner | 139 (25.8%) | $29,493 |
| 2 Earners | 176 (32.7%) | $85,565 |
| 3+ Earners | 71 (13.2%) | $102,708 |
| Total | 538 (100.0%) | $69,167 |
Household Income in Louisa
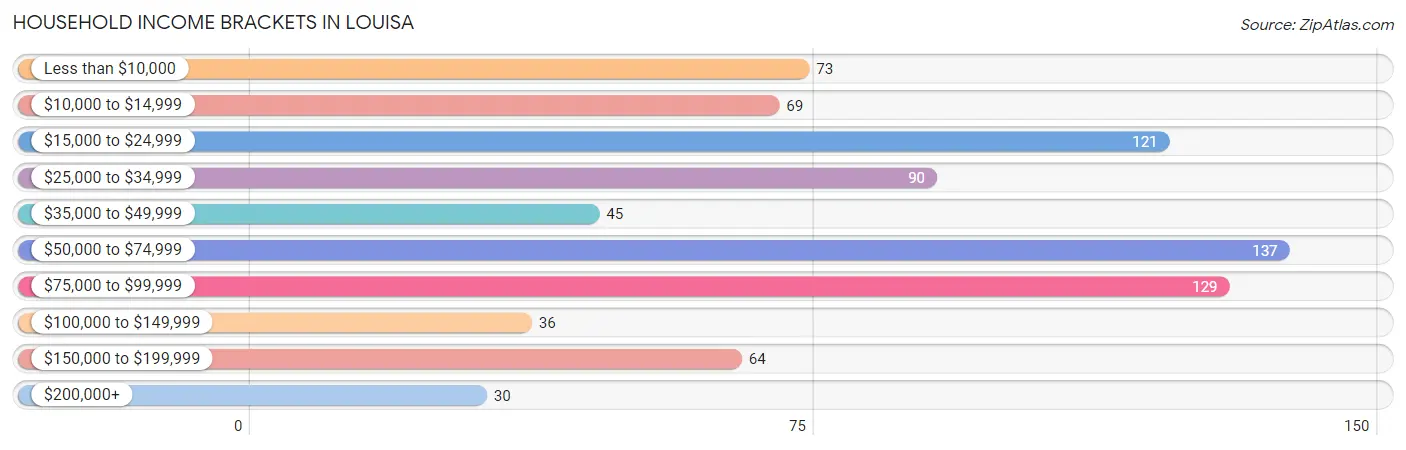
Household Income Brackets in Louisa
With 137 households falling in the category, the $50,000 to $74,999 income range is the most frequent in Louisa, accounting for 17.2% of all households. In contrast, only 30 households (3.8%) fall into the $200,000+ income bracket, making it the least populous group.
| Income Bracket | # Households | % Households |
| Less than $10,000 | 73 | 9.2% |
| $10,000 to $14,999 | 69 | 8.7% |
| $15,000 to $24,999 | 121 | 15.2% |
| $25,000 to $34,999 | 90 | 11.3% |
| $35,000 to $49,999 | 45 | 5.7% |
| $50,000 to $74,999 | 137 | 17.3% |
| $75,000 to $99,999 | 129 | 16.2% |
| $100,000 to $149,999 | 36 | 4.5% |
| $150,000 to $199,999 | 64 | 8.1% |
| $200,000+ | 30 | 3.8% |
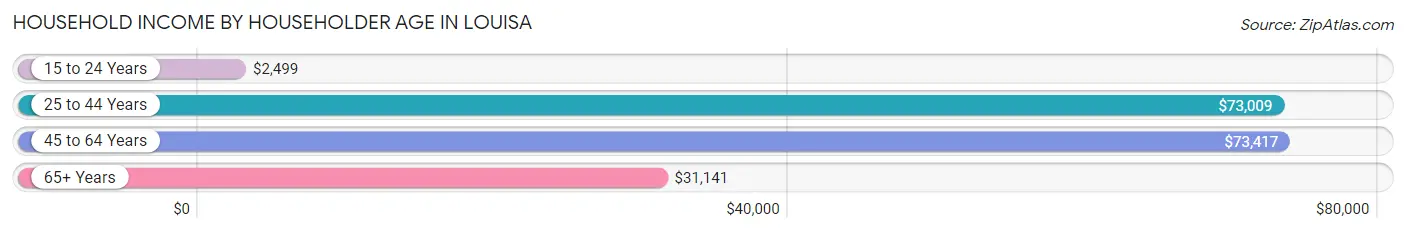
Household Income by Householder Age in Louisa
The median household income in Louisa is $49,583, with the highest median household income of $73,417 found in the 45 to 64 years age bracket for the primary householder. A total of 205 households (25.8%) fall into this category. Meanwhile, the 15 to 24 years age bracket for the primary householder has the lowest median household income of $2,499, with 33 households (4.2%) in this group.
| Income Bracket | # Households | Median Income |
| 15 to 24 Years | 33 (4.2%) | $2,499 |
| 25 to 44 Years | 277 (34.9%) | $73,009 |
| 45 to 64 Years | 205 (25.8%) | $73,417 |
| 65+ Years | 279 (35.1%) | $31,141 |
| Total | 794 (100.0%) | $49,583 |
Poverty in Louisa
Income Below Poverty by Sex and Age in Louisa
With 22.7% poverty level for males and 20.0% for females among the residents of Louisa, 5 year old males and 15 year old females are the most vulnerable to poverty, with 18 males (78.3%) and 14 females (100.0%) in their respective age groups living below the poverty level.
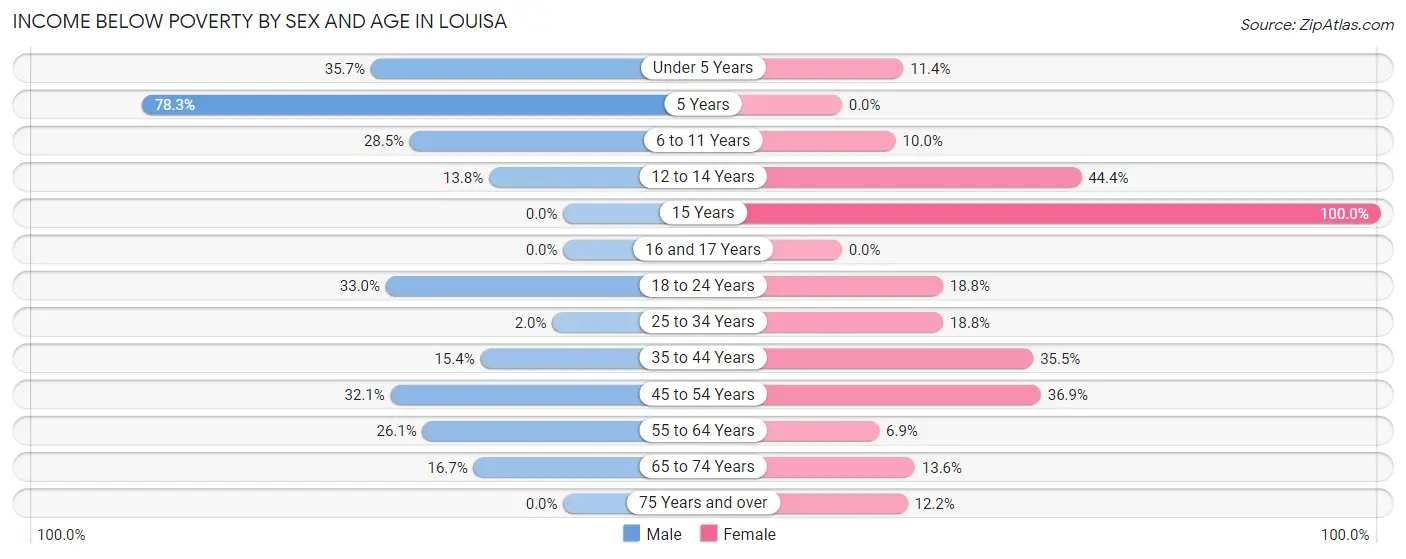
| Age Bracket | Male | Female |
| Under 5 Years | 89 (35.7%) | 21 (11.4%) |
| 5 Years | 18 (78.3%) | 0 (0.0%) |
| 6 to 11 Years | 41 (28.5%) | 7 (10.0%) |
| 12 to 14 Years | 4 (13.8%) | 4 (44.4%) |
| 15 Years | 0 (0.0%) | 14 (100.0%) |
| 16 and 17 Years | 0 (0.0%) | 0 (0.0%) |
| 18 to 24 Years | 29 (33.0%) | 6 (18.8%) |
| 25 to 34 Years | 4 (2.0%) | 58 (18.8%) |
| 35 to 44 Years | 10 (15.4%) | 27 (35.5%) |
| 45 to 54 Years | 34 (32.1%) | 82 (36.9%) |
| 55 to 64 Years | 35 (26.1%) | 11 (6.9%) |
| 65 to 74 Years | 18 (16.7%) | 16 (13.6%) |
| 75 Years and over | 0 (0.0%) | 11 (12.2%) |
| Total | 282 (22.7%) | 257 (20.0%) |
Income Above Poverty by Sex and Age in Louisa
According to the poverty statistics in Louisa, males aged 15 years and females aged 55 to 64 years are the age groups that are most secure financially, with 100.0% of males and 93.1% of females in these age groups living above the poverty line.
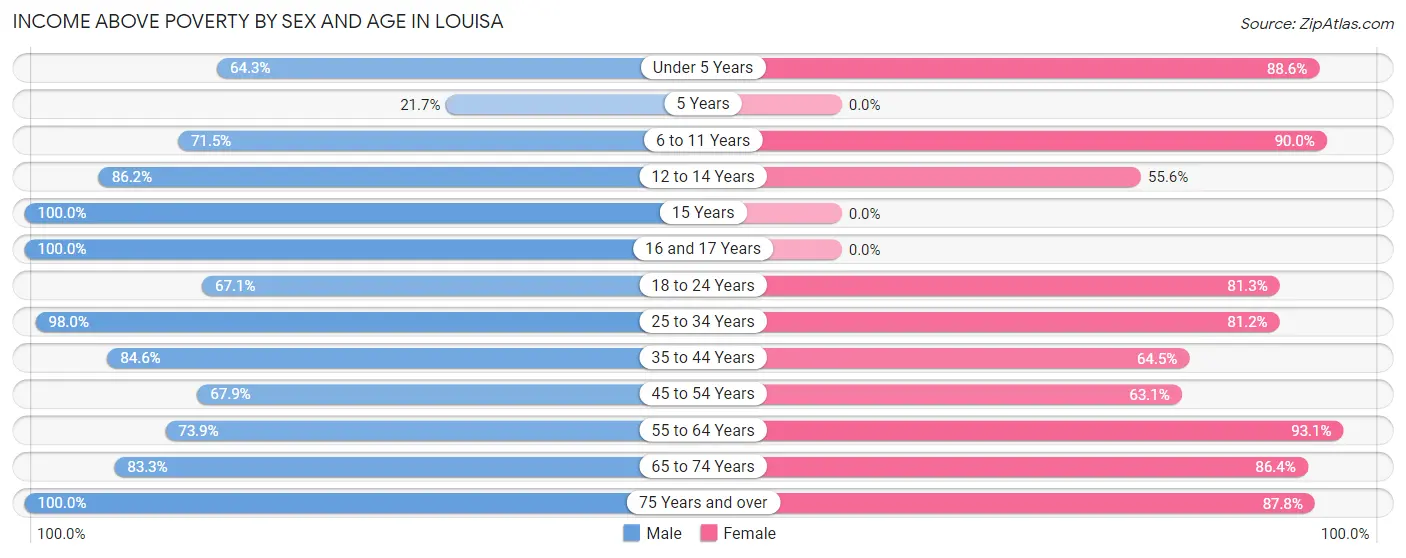
| Age Bracket | Male | Female |
| Under 5 Years | 160 (64.3%) | 163 (88.6%) |
| 5 Years | 5 (21.7%) | 0 (0.0%) |
| 6 to 11 Years | 103 (71.5%) | 63 (90.0%) |
| 12 to 14 Years | 25 (86.2%) | 5 (55.6%) |
| 15 Years | 25 (100.0%) | 0 (0.0%) |
| 16 and 17 Years | 34 (100.0%) | 0 (0.0%) |
| 18 to 24 Years | 59 (67.0%) | 26 (81.2%) |
| 25 to 34 Years | 192 (98.0%) | 251 (81.2%) |
| 35 to 44 Years | 55 (84.6%) | 49 (64.5%) |
| 45 to 54 Years | 72 (67.9%) | 140 (63.1%) |
| 55 to 64 Years | 99 (73.9%) | 148 (93.1%) |
| 65 to 74 Years | 90 (83.3%) | 102 (86.4%) |
| 75 Years and over | 41 (100.0%) | 79 (87.8%) |
| Total | 960 (77.3%) | 1,026 (80.0%) |
Income Below Poverty Among Married-Couple Families in Louisa
The poverty statistics for married-couple families in Louisa show that 6.1% or 20 of the total 330 families live below the poverty line. Families with 1 or 2 children have the highest poverty rate of 9.9%, comprising of 10 families. On the other hand, families with 3 or 4 children have the lowest poverty rate of 0.0%, which includes 0 families.
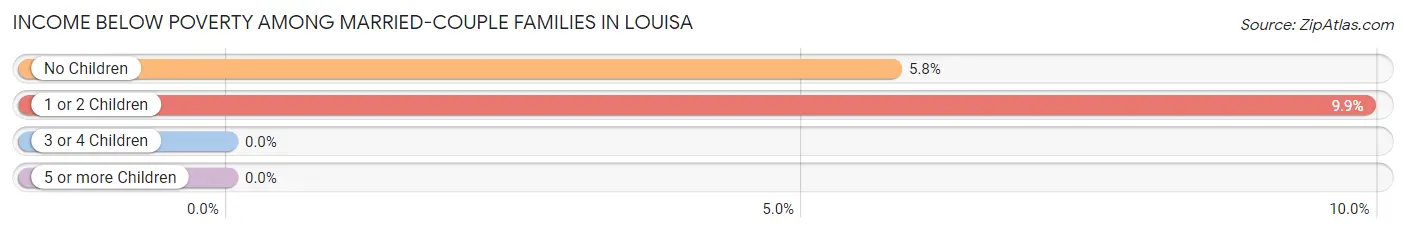
| Children | Above Poverty | Below Poverty |
| No Children | 163 (94.2%) | 10 (5.8%) |
| 1 or 2 Children | 91 (90.1%) | 10 (9.9%) |
| 3 or 4 Children | 56 (100.0%) | 0 (0.0%) |
| 5 or more Children | 0 (0.0%) | 0 (0.0%) |
| Total | 310 (93.9%) | 20 (6.1%) |
Income Below Poverty Among Single-Parent Households in Louisa
According to the poverty data in Louisa, 45.7% or 21 single-father households and 42.6% or 69 single-mother households are living below the poverty line. Among single-father households, those with 1 or 2 children have the highest poverty rate, with 4 households (57.1%) experiencing poverty. Likewise, among single-mother households, those with 1 or 2 children have the highest poverty rate, with 54 households (85.7%) falling below the poverty line.
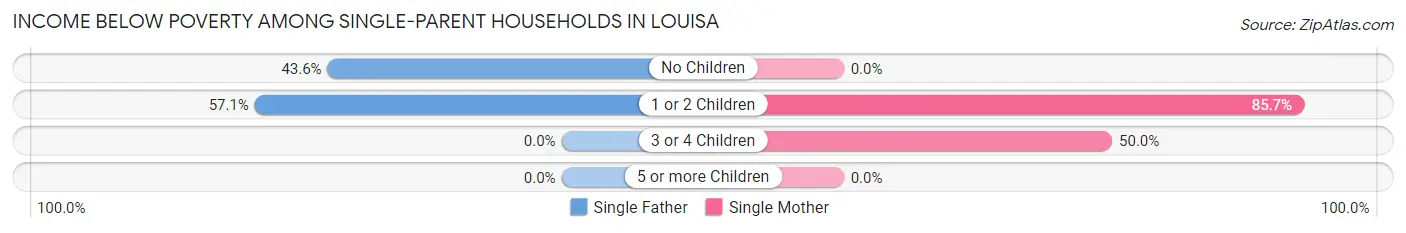
| Children | Single Father | Single Mother |
| No Children | 17 (43.6%) | 0 (0.0%) |
| 1 or 2 Children | 4 (57.1%) | 54 (85.7%) |
| 3 or 4 Children | 0 (0.0%) | 15 (50.0%) |
| 5 or more Children | 0 (0.0%) | 0 (0.0%) |
| Total | 21 (45.7%) | 69 (42.6%) |
Income Below Poverty Among Married-Couple vs Single-Parent Households in Louisa
The poverty data for Louisa shows that 20 of the married-couple family households (6.1%) and 90 of the single-parent households (43.3%) are living below the poverty level. Within the married-couple family households, those with 1 or 2 children have the highest poverty rate, with 10 households (9.9%) falling below the poverty line. Among the single-parent households, those with 1 or 2 children have the highest poverty rate, with 58 household (82.9%) living below poverty.
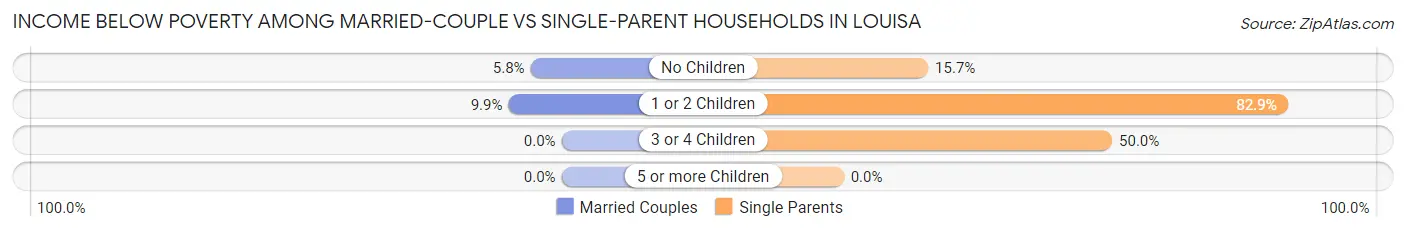
| Children | Married-Couple Families | Single-Parent Households |
| No Children | 10 (5.8%) | 17 (15.7%) |
| 1 or 2 Children | 10 (9.9%) | 58 (82.9%) |
| 3 or 4 Children | 0 (0.0%) | 15 (50.0%) |
| 5 or more Children | 0 (0.0%) | 0 (0.0%) |
| Total | 20 (6.1%) | 90 (43.3%) |
Race in Louisa
The most populous races in Louisa are White / Caucasian (2,618 | 98.7%), Hispanic or Latino (147 | 5.5%), and Black / African American (31 | 1.2%).
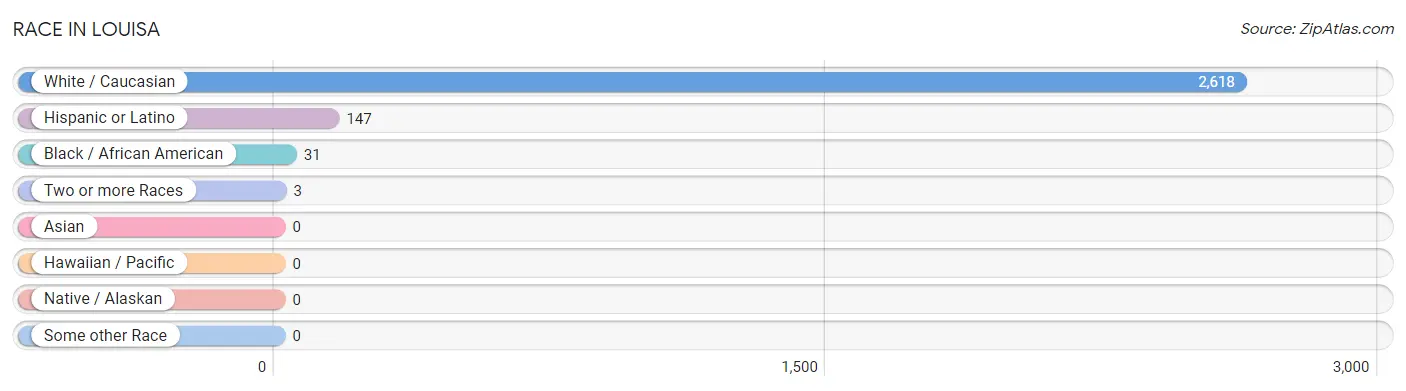
| Race | # Population | % Population |
| Asian | 0 | 0.0% |
| Black / African American | 31 | 1.2% |
| Hawaiian / Pacific | 0 | 0.0% |
| Hispanic or Latino | 147 | 5.5% |
| Native / Alaskan | 0 | 0.0% |
| White / Caucasian | 2,618 | 98.7% |
| Two or more Races | 3 | 0.1% |
| Some other Race | 0 | 0.0% |
| Total | 2,652 | 100.0% |
Ancestry in Louisa
The most populous ancestries reported in Louisa are English (457 | 17.2%), American (278 | 10.5%), Irish (234 | 8.8%), Mexican (147 | 5.5%), and German (143 | 5.4%), together accounting for 47.5% of all Louisa residents.
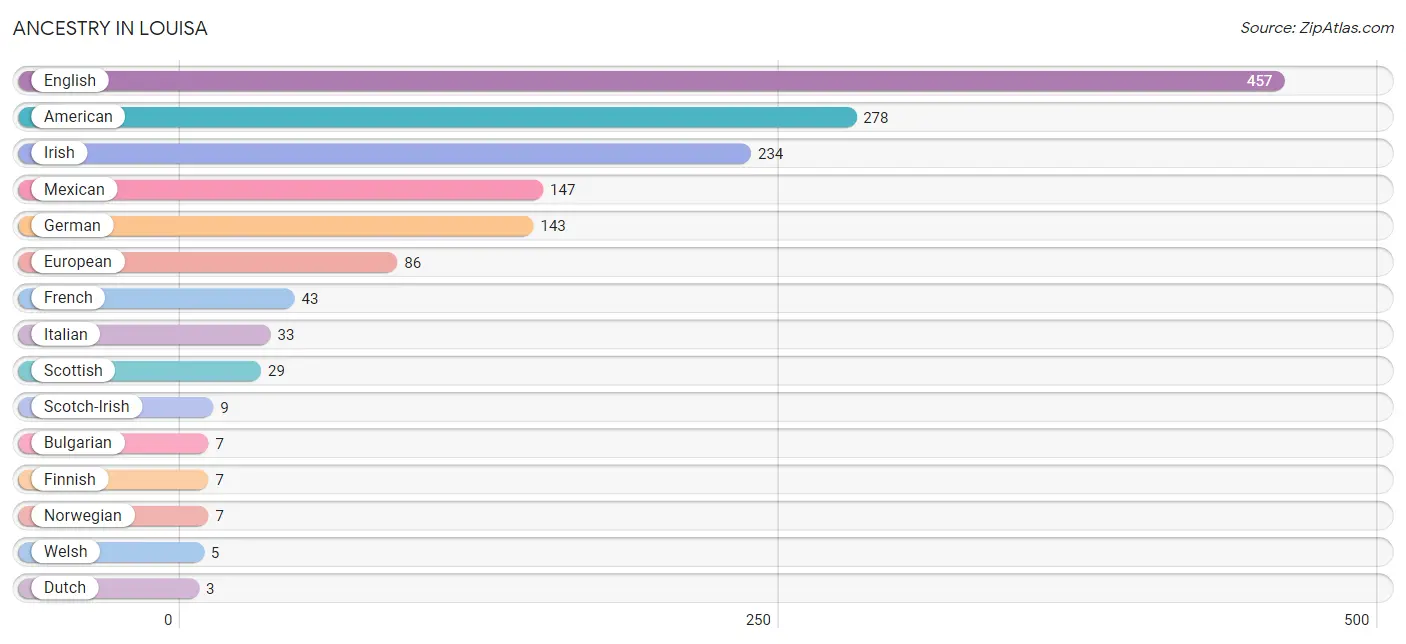
| Ancestry | # Population | % Population |
| American | 278 | 10.5% |
| Bulgarian | 7 | 0.3% |
| Dutch | 3 | 0.1% |
| English | 457 | 17.2% |
| European | 86 | 3.2% |
| Finnish | 7 | 0.3% |
| French | 43 | 1.6% |
| German | 143 | 5.4% |
| Irish | 234 | 8.8% |
| Italian | 33 | 1.2% |
| Mexican | 147 | 5.5% |
| Norwegian | 7 | 0.3% |
| Samoan | 3 | 0.1% |
| Scotch-Irish | 9 | 0.3% |
| Scottish | 29 | 1.1% |
| Welsh | 5 | 0.2% | View All 16 Rows |
Immigrants in Louisa

| Immigration Origin | # Population | % Population | View All 0 Rows |
Sex and Age in Louisa
Sex and Age in Louisa
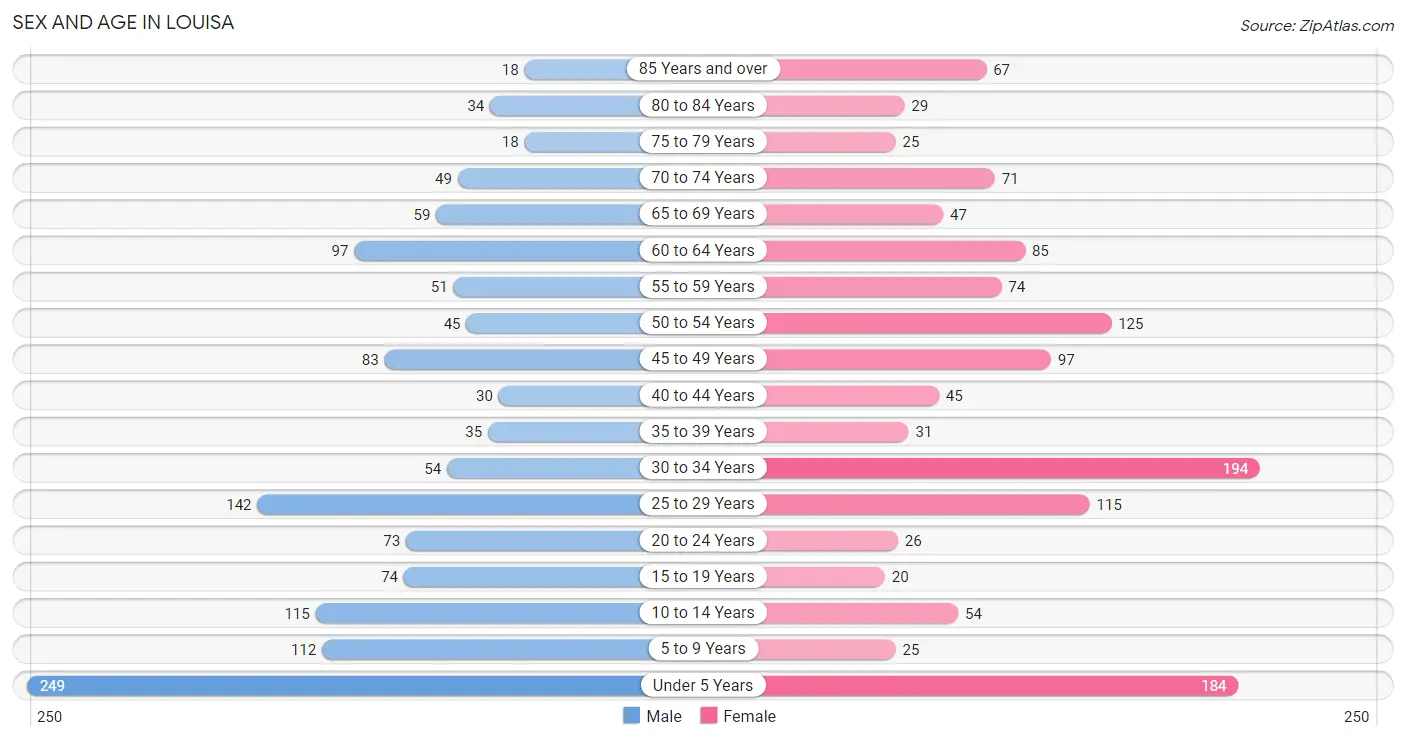
The most populous age groups in Louisa are Under 5 Years (249 | 18.6%) for men and 30 to 34 Years (194 | 14.8%) for women.
| Age Bracket | Male | Female |
| Under 5 Years | 249 (18.6%) | 184 (14.0%) |
| 5 to 9 Years | 112 (8.4%) | 25 (1.9%) |
| 10 to 14 Years | 115 (8.6%) | 54 (4.1%) |
| 15 to 19 Years | 74 (5.5%) | 20 (1.5%) |
| 20 to 24 Years | 73 (5.5%) | 26 (2.0%) |
| 25 to 29 Years | 142 (10.6%) | 115 (8.7%) |
| 30 to 34 Years | 54 (4.0%) | 194 (14.8%) |
| 35 to 39 Years | 35 (2.6%) | 31 (2.4%) |
| 40 to 44 Years | 30 (2.2%) | 45 (3.4%) |
| 45 to 49 Years | 83 (6.2%) | 97 (7.4%) |
| 50 to 54 Years | 45 (3.4%) | 125 (9.5%) |
| 55 to 59 Years | 51 (3.8%) | 74 (5.6%) |
| 60 to 64 Years | 97 (7.2%) | 85 (6.5%) |
| 65 to 69 Years | 59 (4.4%) | 47 (3.6%) |
| 70 to 74 Years | 49 (3.7%) | 71 (5.4%) |
| 75 to 79 Years | 18 (1.3%) | 25 (1.9%) |
| 80 to 84 Years | 34 (2.5%) | 29 (2.2%) |
| 85 Years and over | 18 (1.3%) | 67 (5.1%) |
| Total | 1,338 (100.0%) | 1,314 (100.0%) |
Families and Households in Louisa
Median Family Size in Louisa
The median family size in Louisa is 4.02 persons per family, with single female/mother families (162 | 30.1%) accounting for the largest median family size of 4.38 persons per family. On the other hand, single male/father families (46 | 8.6%) represent the smallest median family size with 3.46 persons per family.
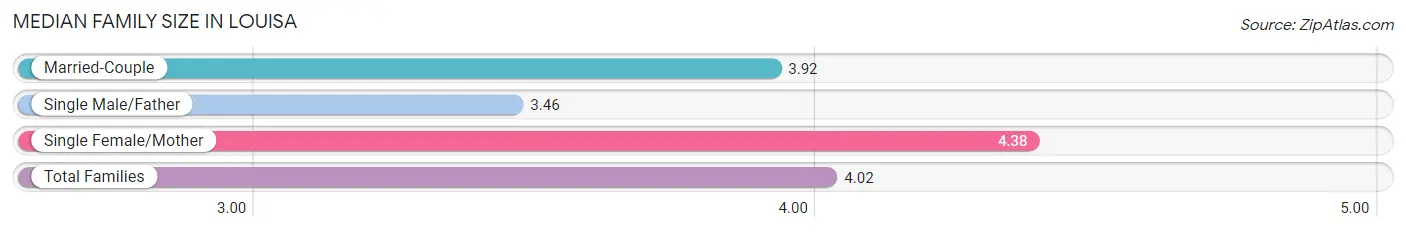
| Family Type | # Families | Family Size |
| Married-Couple | 330 (61.3%) | 3.92 |
| Single Male/Father | 46 (8.6%) | 3.46 |
| Single Female/Mother | 162 (30.1%) | 4.38 |
| Total Families | 538 (100.0%) | 4.02 |
Median Household Size in Louisa
The median household size in Louisa is 3.22 persons per household, with single female/mother households (162 | 20.4%) accounting for the largest median household size of 4.49 persons per household. non-family households (256 | 32.2%) represent the smallest median household size with 1.24 persons per household.
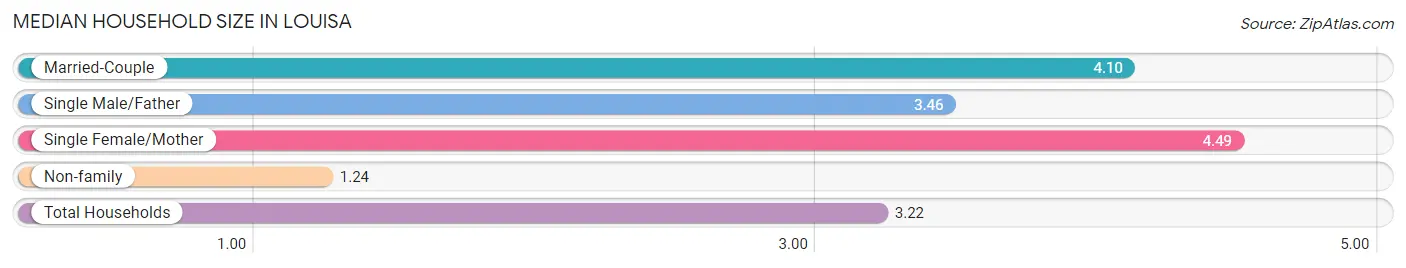
| Household Type | # Households | Household Size |
| Married-Couple | 330 (41.6%) | 4.10 |
| Single Male/Father | 46 (5.8%) | 3.46 |
| Single Female/Mother | 162 (20.4%) | 4.49 |
| Non-family | 256 (32.2%) | 1.24 |
| Total Households | 794 (100.0%) | 3.22 |
Household Size by Marriage Status in Louisa
Out of a total of 794 households in Louisa, 538 (67.8%) are family households, while 256 (32.2%) are nonfamily households. The most numerous type of family households are 2-person households, comprising 194, and the most common type of nonfamily households are 1-person households, comprising 226.
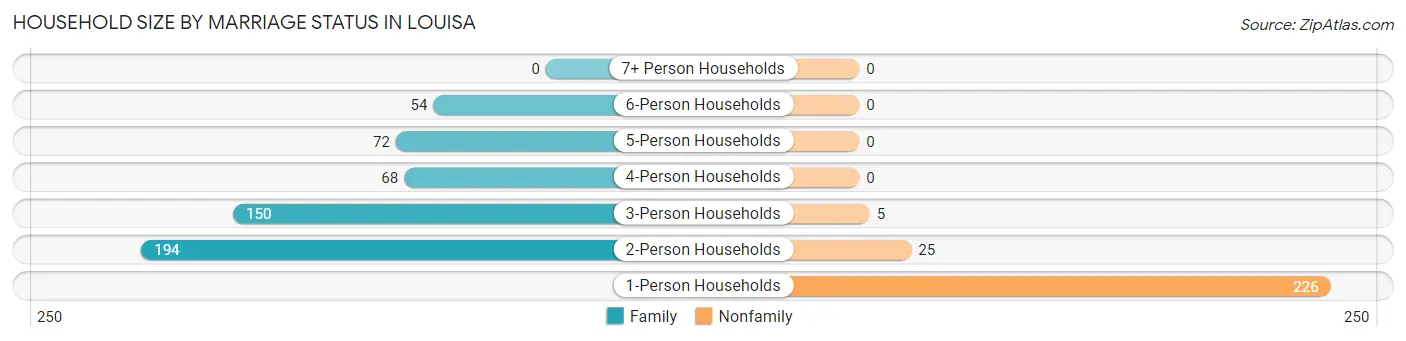
| Household Size | Family Households | Nonfamily Households |
| 1-Person Households | - | 226 (28.5%) |
| 2-Person Households | 194 (24.4%) | 25 (3.2%) |
| 3-Person Households | 150 (18.9%) | 5 (0.6%) |
| 4-Person Households | 68 (8.6%) | 0 (0.0%) |
| 5-Person Households | 72 (9.1%) | 0 (0.0%) |
| 6-Person Households | 54 (6.8%) | 0 (0.0%) |
| 7+ Person Households | 0 (0.0%) | 0 (0.0%) |
| Total | 538 (67.8%) | 256 (32.2%) |
Female Fertility in Louisa
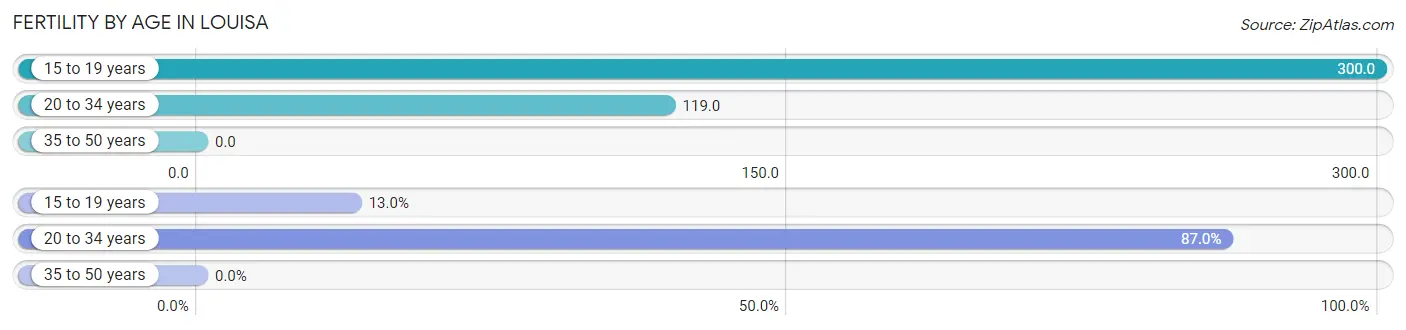
Fertility by Age in Louisa
Average fertility rate in Louisa is 83.0 births per 1,000 women. Women in the age bracket of 15 to 19 years have the highest fertility rate with 300.0 births per 1,000 women. Women in the age bracket of 20 to 34 years acount for 87.0% of all women with births.
| Age Bracket | Women with Births | Births / 1,000 Women |
| 15 to 19 years | 6 (13.0%) | 300.0 |
| 20 to 34 years | 40 (87.0%) | 119.0 |
| 35 to 50 years | 0 (0.0%) | 0.0 |
| Total | 46 (100.0%) | 83.0 |
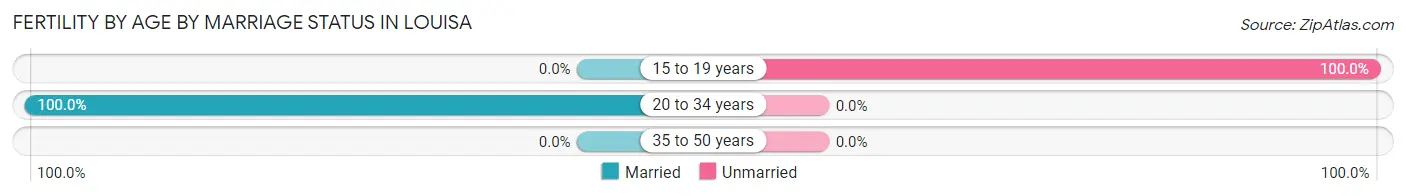
Fertility by Age by Marriage Status in Louisa
87.0% of women with births (46) in Louisa are married. The highest percentage of unmarried women with births falls into 15 to 19 years age bracket with 100.0% of them unmarried at the time of birth, while the lowest percentage of unmarried women with births belong to 20 to 34 years age bracket with 0.0% of them unmarried.
| Age Bracket | Married | Unmarried |
| 15 to 19 years | 0 (0.0%) | 6 (100.0%) |
| 20 to 34 years | 40 (100.0%) | 0 (0.0%) |
| 35 to 50 years | 0 (0.0%) | 0 (0.0%) |
| Total | 40 (87.0%) | 6 (13.0%) |
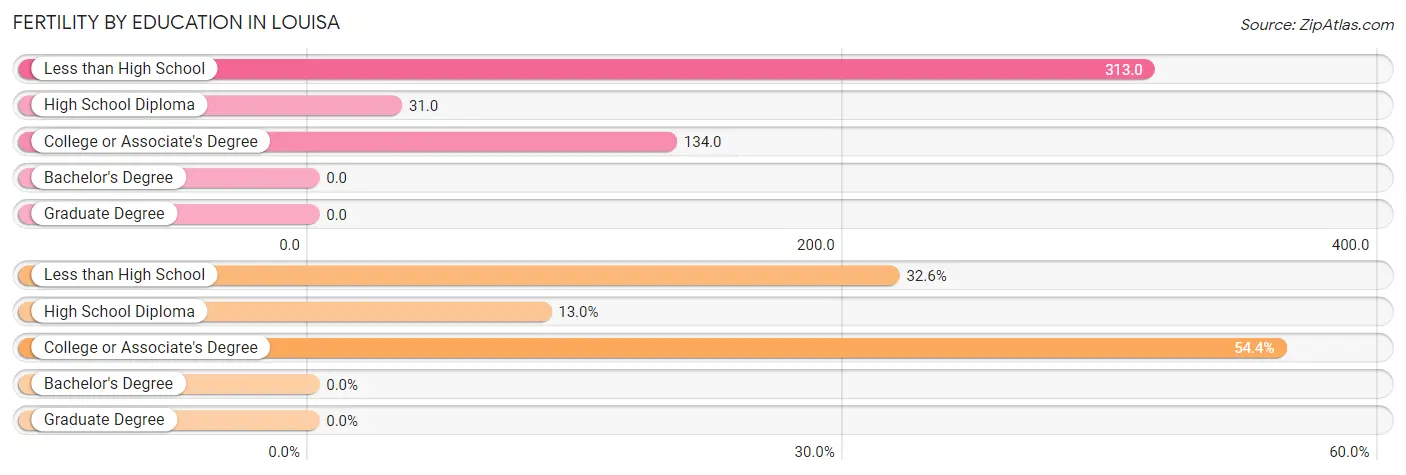
Fertility by Education in Louisa
| Educational Attainment | Women with Births | Births / 1,000 Women |
| Less than High School | 15 (32.6%) | 313.0 |
| High School Diploma | 6 (13.0%) | 31.0 |
| College or Associate's Degree | 25 (54.3%) | 134.0 |
| Bachelor's Degree | 0 (0.0%) | 0.0 |
| Graduate Degree | 0 (0.0%) | 0.0 |
| Total | 46 (100.0%) | 83.0 |
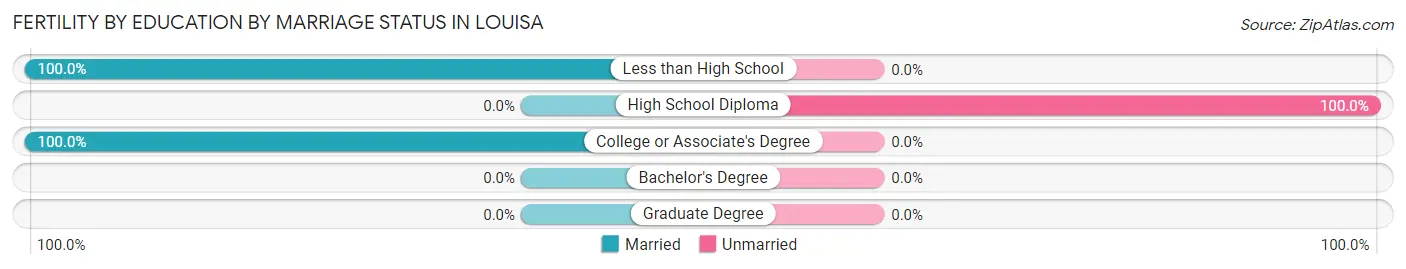
Fertility by Education by Marriage Status in Louisa
13.0% of women with births in Louisa are unmarried. Women with the educational attainment of less than high school are most likely to be married with 100.0% of them married at childbirth, while women with the educational attainment of high school diploma are least likely to be married with 100.0% of them unmarried at childbirth.
| Educational Attainment | Married | Unmarried |
| Less than High School | 15 (100.0%) | 0 (0.0%) |
| High School Diploma | 0 (0.0%) | 6 (100.0%) |
| College or Associate's Degree | 25 (100.0%) | 0 (0.0%) |
| Bachelor's Degree | 0 (0.0%) | 0 (0.0%) |
| Graduate Degree | 0 (0.0%) | 0 (0.0%) |
| Total | 40 (87.0%) | 6 (13.0%) |
Employment Characteristics in Louisa
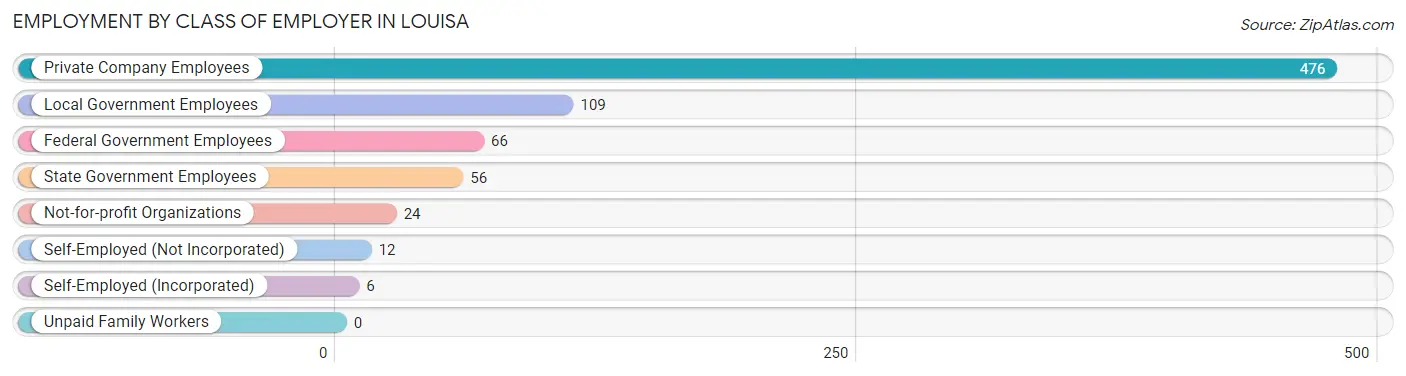
Employment by Class of Employer in Louisa
Among the 749 employed individuals in Louisa, private company employees (476 | 63.5%), local government employees (109 | 14.5%), and federal government employees (66 | 8.8%) make up the most common classes of employment.
| Employer Class | # Employees | % Employees |
| Private Company Employees | 476 | 63.5% |
| Self-Employed (Incorporated) | 6 | 0.8% |
| Self-Employed (Not Incorporated) | 12 | 1.6% |
| Not-for-profit Organizations | 24 | 3.2% |
| Local Government Employees | 109 | 14.5% |
| State Government Employees | 56 | 7.5% |
| Federal Government Employees | 66 | 8.8% |
| Unpaid Family Workers | 0 | 0.0% |
| Total | 749 | 100.0% |
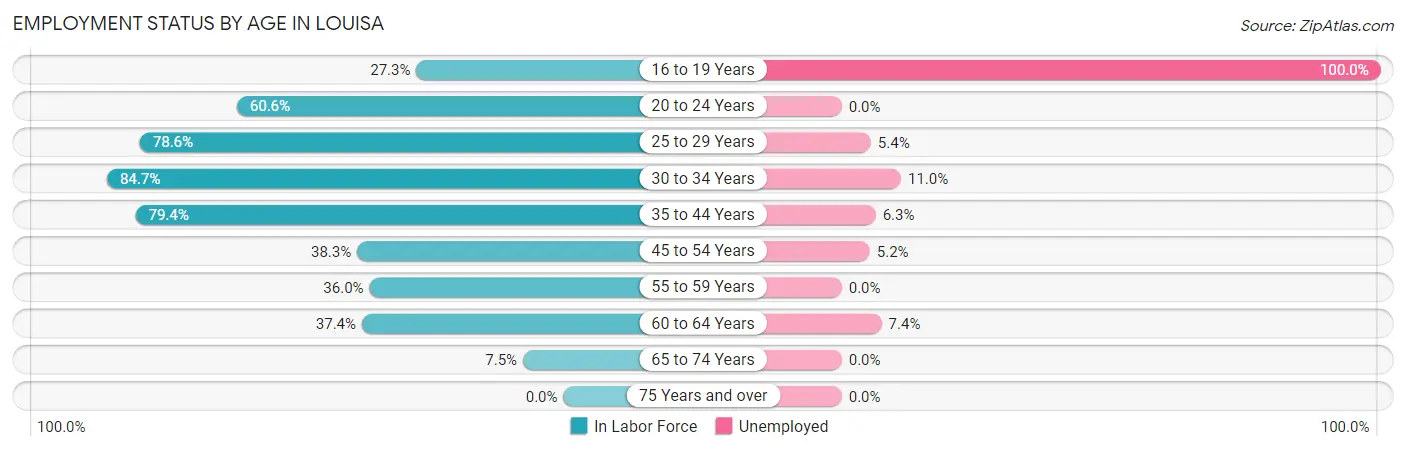
Employment Status by Age in Louisa
According to the labor force statistics for Louisa, out of the total population over 16 years of age (1,874), 46.1% or 864 individuals are in the labor force, with 7.9% or 68 of them unemployed. The age group with the highest labor force participation rate is 30 to 34 years, with 84.7% or 210 individuals in the labor force. Within the labor force, the 16 to 19 years age range has the highest percentage of unemployed individuals, with 100.0% or 15 of them being unemployed.
| Age Bracket | In Labor Force | Unemployed |
| 16 to 19 Years | 15 (27.3%) | 15 (100.0%) |
| 20 to 24 Years | 60 (60.6%) | 0 (0.0%) |
| 25 to 29 Years | 202 (78.6%) | 11 (5.4%) |
| 30 to 34 Years | 210 (84.7%) | 23 (11.0%) |
| 35 to 44 Years | 112 (79.4%) | 7 (6.3%) |
| 45 to 54 Years | 134 (38.3%) | 7 (5.2%) |
| 55 to 59 Years | 45 (36.0%) | 0 (0.0%) |
| 60 to 64 Years | 68 (37.4%) | 5 (7.4%) |
| 65 to 74 Years | 17 (7.5%) | 0 (0.0%) |
| 75 Years and over | 0 (0.0%) | 0 (0.0%) |
| Total | 864 (46.1%) | 68 (7.9%) |
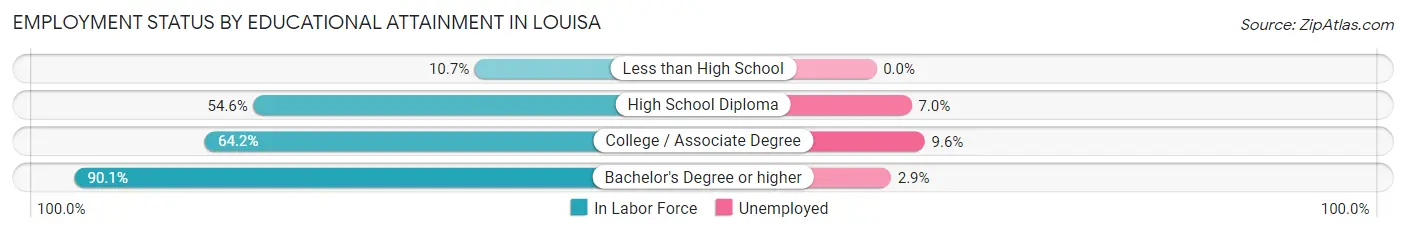
Employment Status by Educational Attainment in Louisa
According to labor force statistics for Louisa, 59.2% of individuals (771) out of the total population between 25 and 64 years of age (1,303) are in the labor force, with 6.9% or 53 of them being unemployed. The group with the highest labor force participation rate are those with the educational attainment of bachelor's degree or higher, with 90.1% or 173 individuals in the labor force. Within the labor force, individuals with college / associate degree education have the highest percentage of unemployment, with 9.6% or 26 of them being unemployed.
| Educational Attainment | In Labor Force | Unemployed |
| Less than High School | 12 (10.7%) | 0 (0.0%) |
| High School Diploma | 314 (54.6%) | 40 (7.0%) |
| College / Associate Degree | 272 (64.2%) | 41 (9.6%) |
| Bachelor's Degree or higher | 173 (90.1%) | 6 (2.9%) |
| Total | 771 (59.2%) | 90 (6.9%) |
Employment Occupations by Sex in Louisa
Management, Business, Science and Arts Occupations
The most common Management, Business, Science and Arts occupations in Louisa are Community & Social Service (118 | 14.8%), Education Instruction & Library (97 | 12.2%), Computers, Engineering & Science (81 | 10.2%), Architecture & Engineering (44 | 5.5%), and Health Diagnosing & Treating (36 | 4.5%).
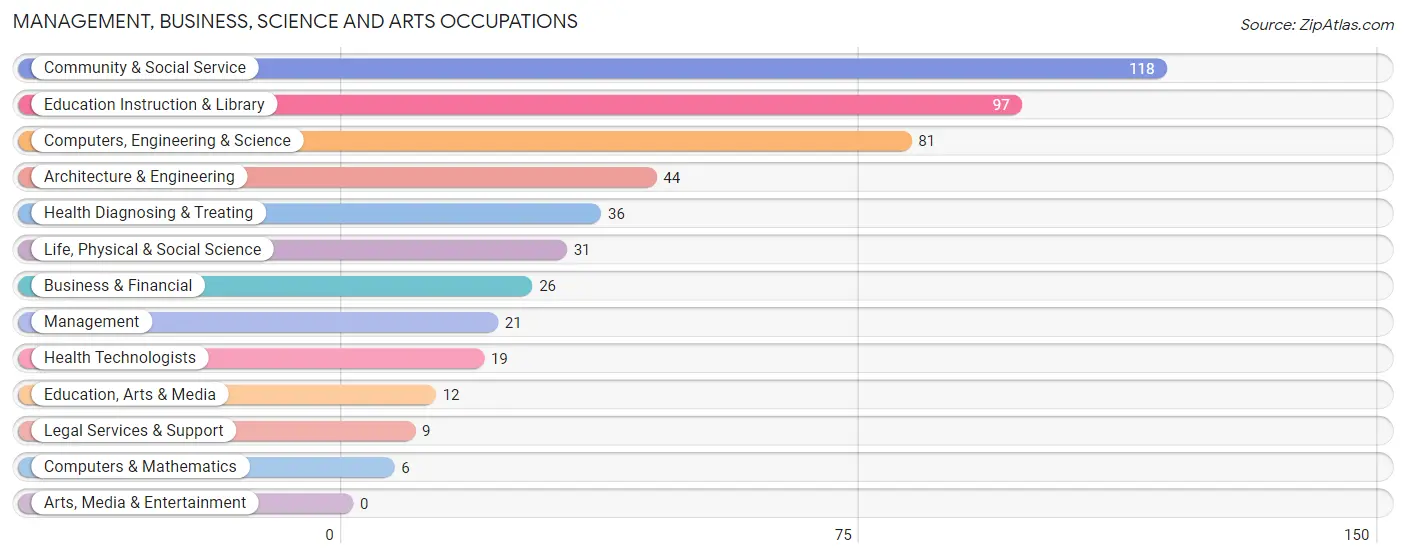
Management, Business, Science and Arts Occupations by Sex
Within the Management, Business, Science and Arts occupations in Louisa, the most male-oriented occupations are Computers & Mathematics (100.0%), Legal Services & Support (100.0%), and Business & Financial (65.4%), while the most female-oriented occupations are Life, Physical & Social Science (100.0%), Education, Arts & Media (100.0%), and Education Instruction & Library (100.0%).
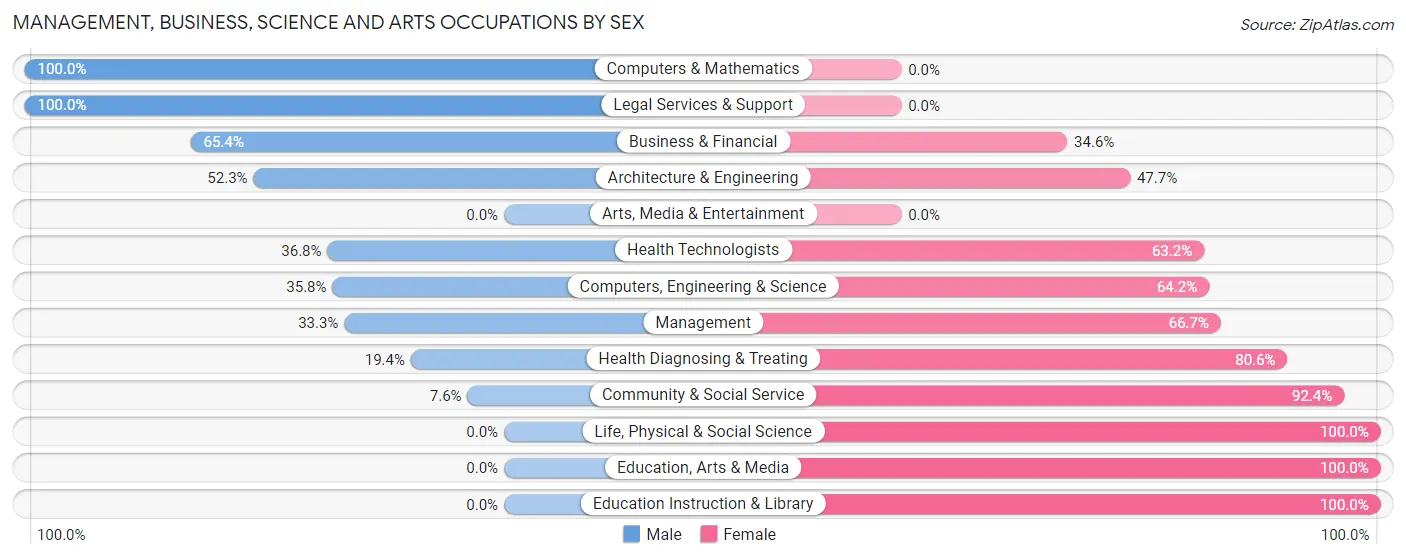
| Occupation | Male | Female |
| Management | 7 (33.3%) | 14 (66.7%) |
| Business & Financial | 17 (65.4%) | 9 (34.6%) |
| Computers, Engineering & Science | 29 (35.8%) | 52 (64.2%) |
| Computers & Mathematics | 6 (100.0%) | 0 (0.0%) |
| Architecture & Engineering | 23 (52.3%) | 21 (47.7%) |
| Life, Physical & Social Science | 0 (0.0%) | 31 (100.0%) |
| Community & Social Service | 9 (7.6%) | 109 (92.4%) |
| Education, Arts & Media | 0 (0.0%) | 12 (100.0%) |
| Legal Services & Support | 9 (100.0%) | 0 (0.0%) |
| Education Instruction & Library | 0 (0.0%) | 97 (100.0%) |
| Arts, Media & Entertainment | 0 (0.0%) | 0 (0.0%) |
| Health Diagnosing & Treating | 7 (19.4%) | 29 (80.6%) |
| Health Technologists | 7 (36.8%) | 12 (63.2%) |
| Total (Category) | 69 (24.5%) | 213 (75.5%) |
| Total (Overall) | 387 (48.7%) | 408 (51.3%) |
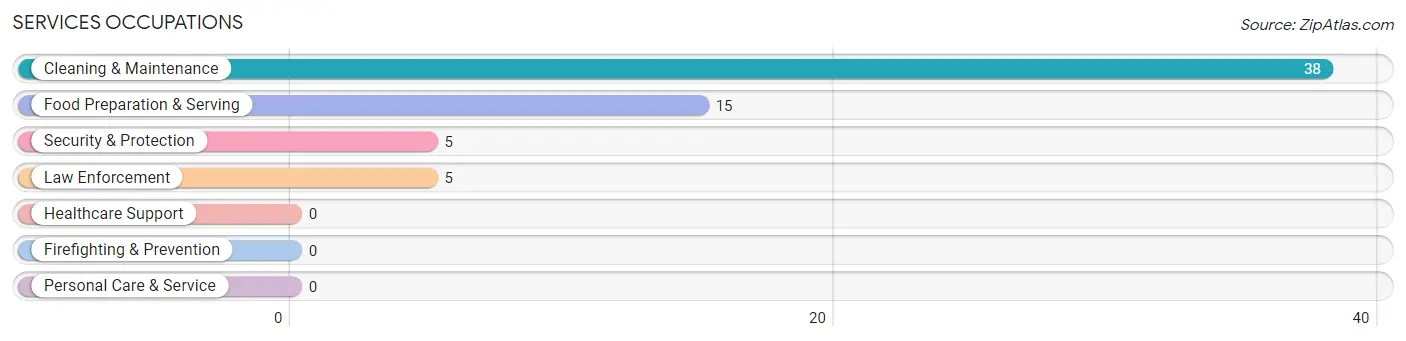
Services Occupations
The most common Services occupations in Louisa are Cleaning & Maintenance (38 | 4.8%), Food Preparation & Serving (15 | 1.9%), Security & Protection (5 | 0.6%), and Law Enforcement (5 | 0.6%).
Services Occupations by Sex
Within the Services occupations in Louisa, the most male-oriented occupations are Security & Protection (100.0%), Law Enforcement (100.0%), and Cleaning & Maintenance (60.5%), while the most female-oriented occupations are Food Preparation & Serving (100.0%), and Cleaning & Maintenance (39.5%).
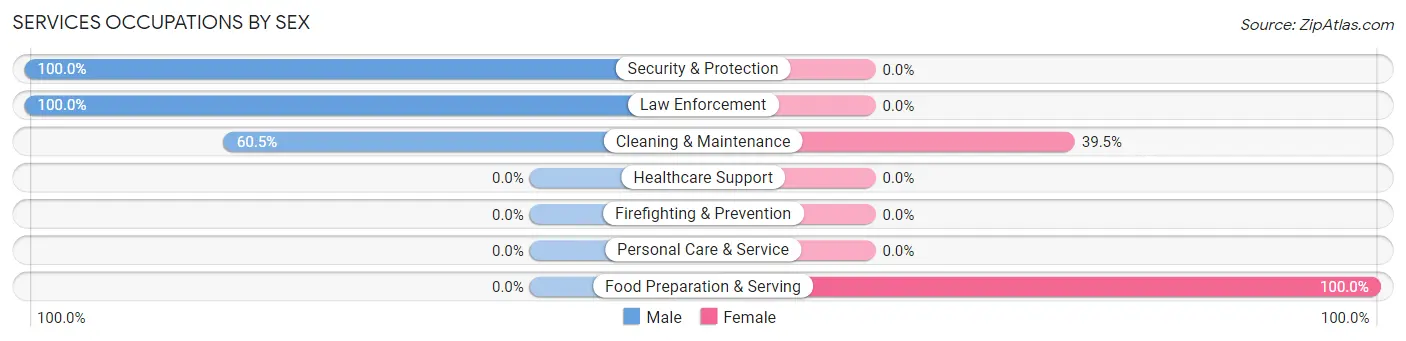
| Occupation | Male | Female |
| Healthcare Support | 0 (0.0%) | 0 (0.0%) |
| Security & Protection | 5 (100.0%) | 0 (0.0%) |
| Firefighting & Prevention | 0 (0.0%) | 0 (0.0%) |
| Law Enforcement | 5 (100.0%) | 0 (0.0%) |
| Food Preparation & Serving | 0 (0.0%) | 15 (100.0%) |
| Cleaning & Maintenance | 23 (60.5%) | 15 (39.5%) |
| Personal Care & Service | 0 (0.0%) | 0 (0.0%) |
| Total (Category) | 28 (48.3%) | 30 (51.7%) |
| Total (Overall) | 387 (48.7%) | 408 (51.3%) |
Sales and Office Occupations
The most common Sales and Office occupations in Louisa are Office & Administration (181 | 22.8%), and Sales & Related (66 | 8.3%).

Sales and Office Occupations by Sex
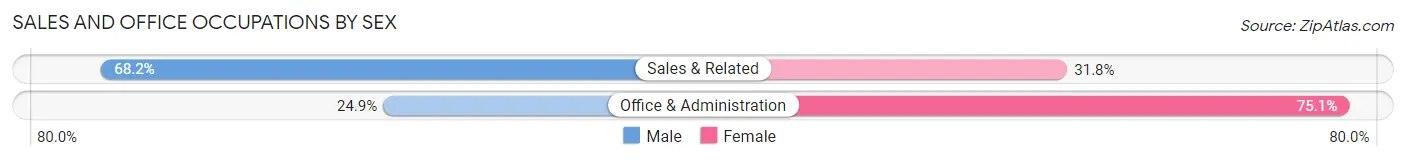
| Occupation | Male | Female |
| Sales & Related | 45 (68.2%) | 21 (31.8%) |
| Office & Administration | 45 (24.9%) | 136 (75.1%) |
| Total (Category) | 90 (36.4%) | 157 (63.6%) |
| Total (Overall) | 387 (48.7%) | 408 (51.3%) |
Natural Resources, Construction and Maintenance Occupations
The most common Natural Resources, Construction and Maintenance occupations in Louisa are Installation, Maintenance & Repair (24 | 3.0%), and Construction & Extraction (23 | 2.9%).
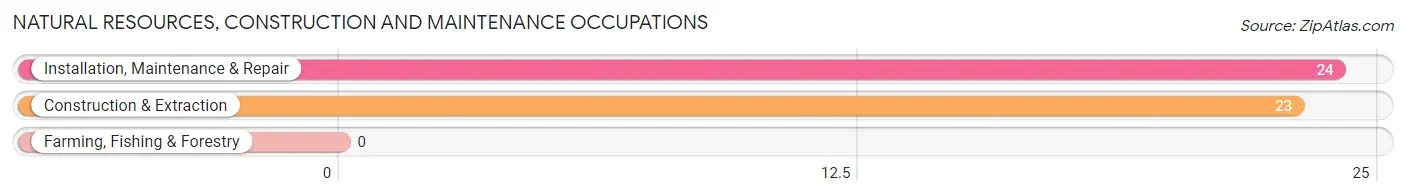
Natural Resources, Construction and Maintenance Occupations by Sex

| Occupation | Male | Female |
| Farming, Fishing & Forestry | 0 (0.0%) | 0 (0.0%) |
| Construction & Extraction | 23 (100.0%) | 0 (0.0%) |
| Installation, Maintenance & Repair | 24 (100.0%) | 0 (0.0%) |
| Total (Category) | 47 (100.0%) | 0 (0.0%) |
| Total (Overall) | 387 (48.7%) | 408 (51.3%) |
Production, Transportation and Moving Occupations
The most common Production, Transportation and Moving occupations in Louisa are Production (145 | 18.2%), Transportation (12 | 1.5%), and Material Moving (4 | 0.5%).
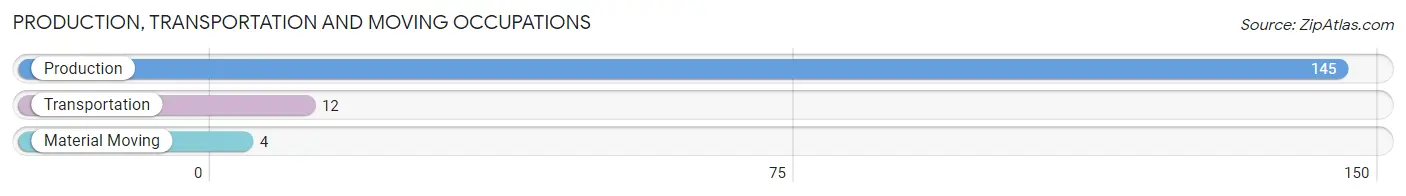
Production, Transportation and Moving Occupations by Sex
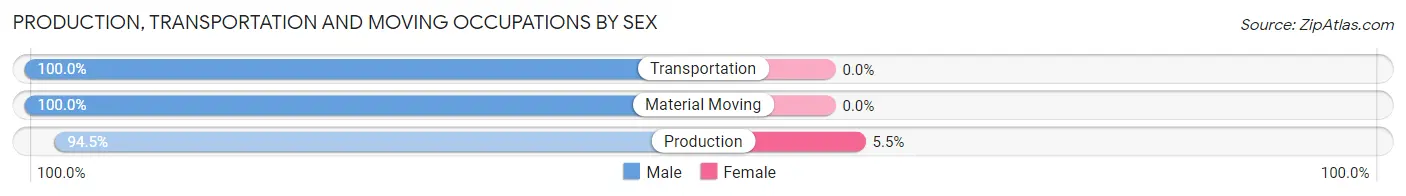
| Occupation | Male | Female |
| Production | 137 (94.5%) | 8 (5.5%) |
| Transportation | 12 (100.0%) | 0 (0.0%) |
| Material Moving | 4 (100.0%) | 0 (0.0%) |
| Total (Category) | 153 (95.0%) | 8 (5.0%) |
| Total (Overall) | 387 (48.7%) | 408 (51.3%) |
Employment Industries by Sex in Louisa
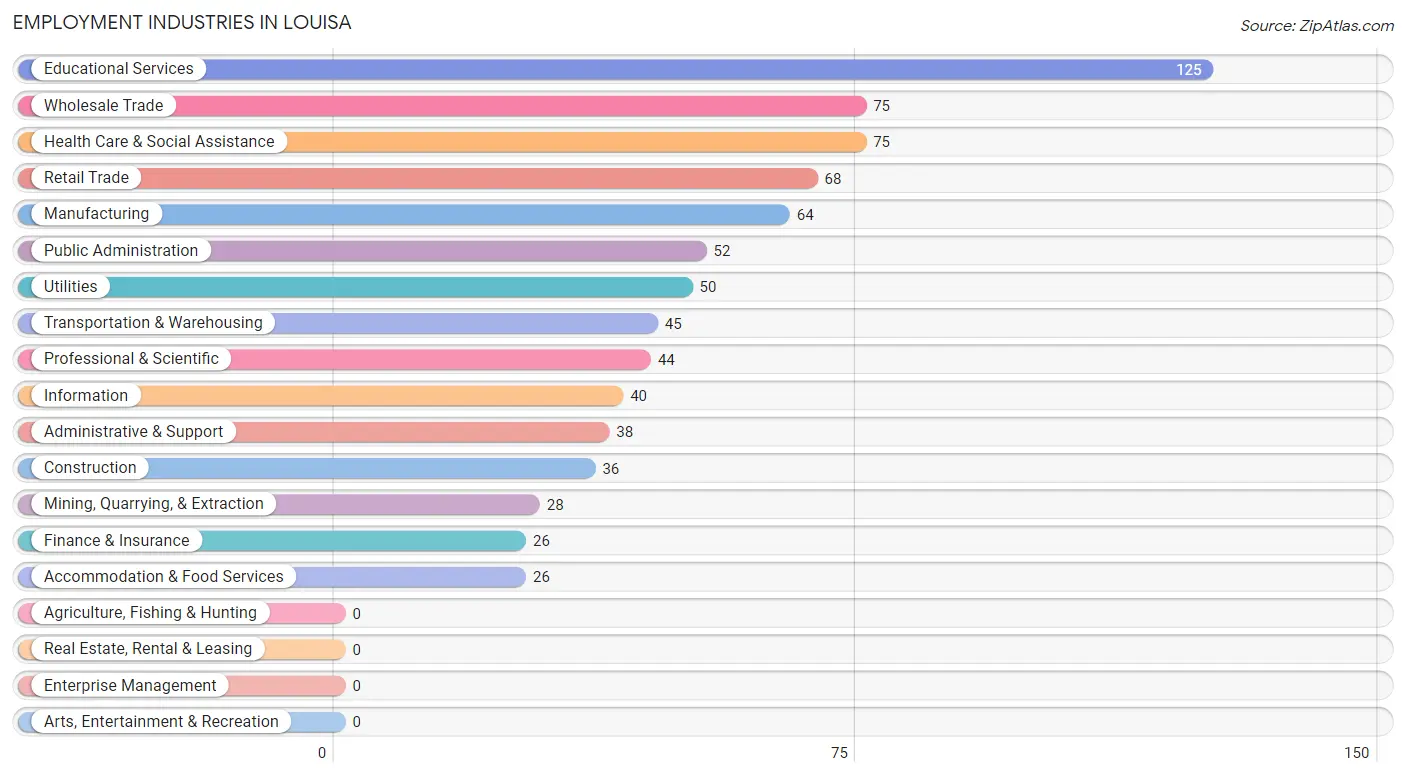
Employment Industries in Louisa
The major employment industries in Louisa include Educational Services (125 | 15.7%), Wholesale Trade (75 | 9.4%), Health Care & Social Assistance (75 | 9.4%), Retail Trade (68 | 8.6%), and Manufacturing (64 | 8.1%).
Employment Industries by Sex in Louisa
The Louisa industries that see more men than women are Mining, Quarrying, & Extraction (100.0%), Construction (100.0%), and Wholesale Trade (100.0%), whereas the industries that tend to have a higher number of women are Information (100.0%), Finance & Insurance (100.0%), and Accommodation & Food Services (100.0%).
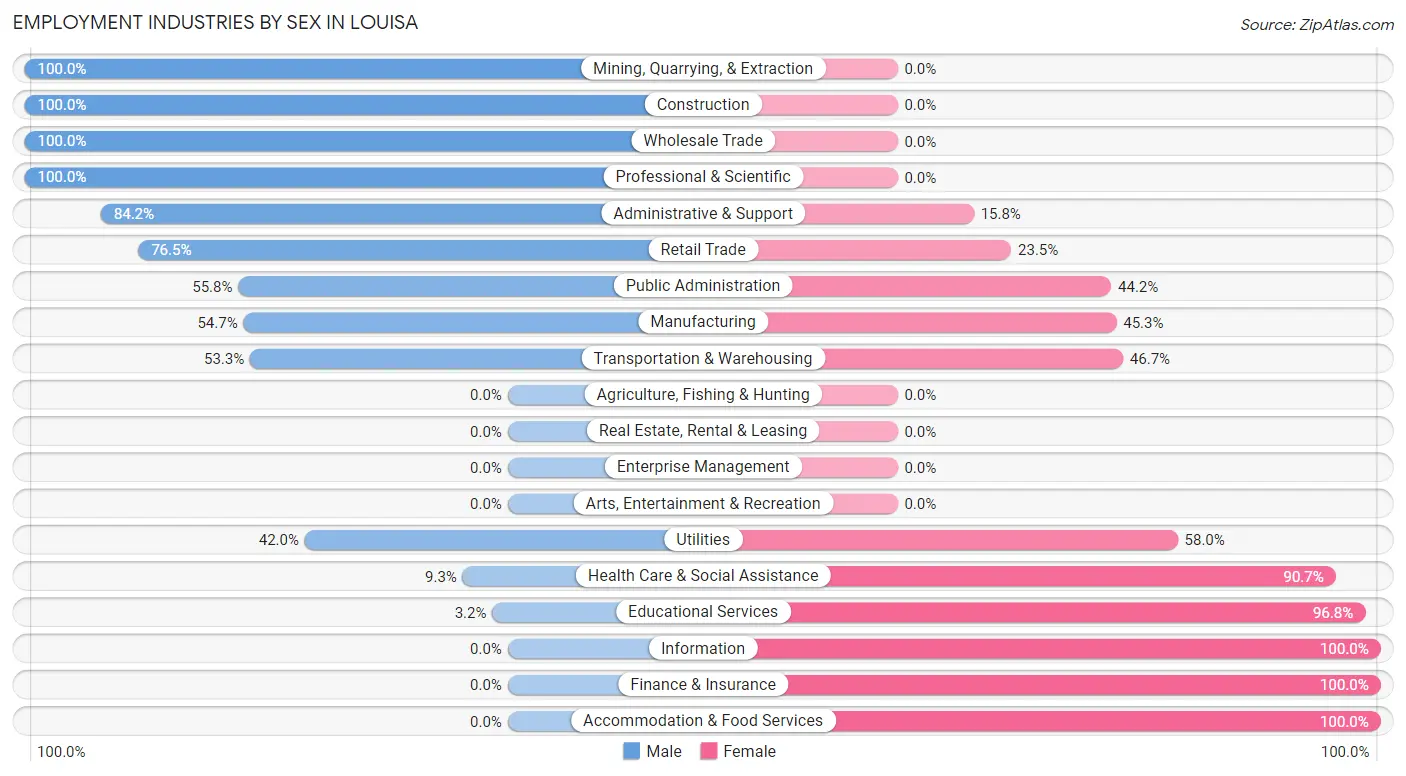
| Industry | Male | Female |
| Agriculture, Fishing & Hunting | 0 (0.0%) | 0 (0.0%) |
| Mining, Quarrying, & Extraction | 28 (100.0%) | 0 (0.0%) |
| Construction | 36 (100.0%) | 0 (0.0%) |
| Manufacturing | 35 (54.7%) | 29 (45.3%) |
| Wholesale Trade | 75 (100.0%) | 0 (0.0%) |
| Retail Trade | 52 (76.5%) | 16 (23.5%) |
| Transportation & Warehousing | 24 (53.3%) | 21 (46.7%) |
| Utilities | 21 (42.0%) | 29 (58.0%) |
| Information | 0 (0.0%) | 40 (100.0%) |
| Finance & Insurance | 0 (0.0%) | 26 (100.0%) |
| Real Estate, Rental & Leasing | 0 (0.0%) | 0 (0.0%) |
| Professional & Scientific | 44 (100.0%) | 0 (0.0%) |
| Enterprise Management | 0 (0.0%) | 0 (0.0%) |
| Administrative & Support | 32 (84.2%) | 6 (15.8%) |
| Educational Services | 4 (3.2%) | 121 (96.8%) |
| Health Care & Social Assistance | 7 (9.3%) | 68 (90.7%) |
| Arts, Entertainment & Recreation | 0 (0.0%) | 0 (0.0%) |
| Accommodation & Food Services | 0 (0.0%) | 26 (100.0%) |
| Public Administration | 29 (55.8%) | 23 (44.2%) |
| Total | 387 (48.7%) | 408 (51.3%) |
Education in Louisa
School Enrollment in Louisa
The most common levels of schooling among the 556 students in Louisa are middle school (149 | 26.8%), college / undergraduate (144 | 25.9%), and elementary school (136 | 24.5%).
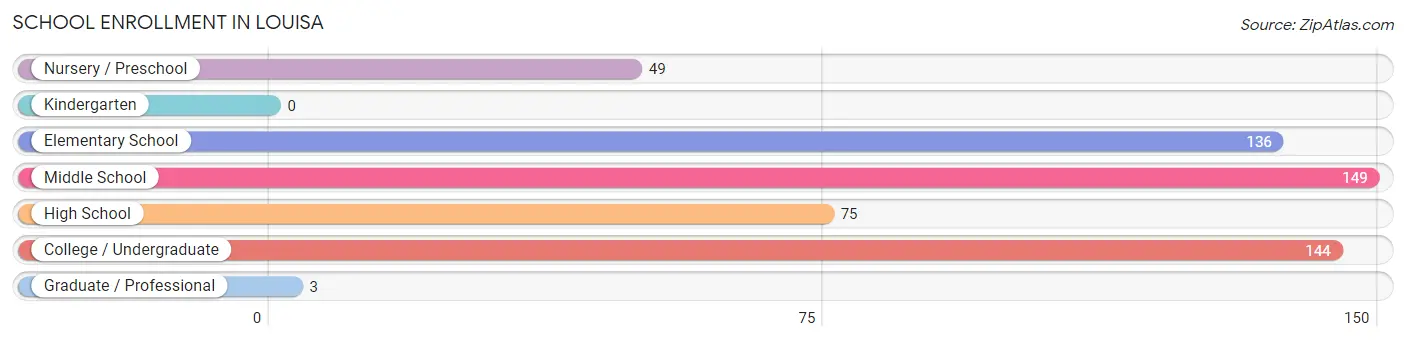
| School Level | # Students | % Students |
| Nursery / Preschool | 49 | 8.8% |
| Kindergarten | 0 | 0.0% |
| Elementary School | 136 | 24.5% |
| Middle School | 149 | 26.8% |
| High School | 75 | 13.5% |
| College / Undergraduate | 144 | 25.9% |
| Graduate / Professional | 3 | 0.5% |
| Total | 556 | 100.0% |
School Enrollment by Age by Funding Source in Louisa
Out of a total of 556 students who are enrolled in schools in Louisa, 27 (4.9%) attend a private institution, while the remaining 529 (95.1%) are enrolled in public schools. The age group of 15 to 17 year olds has the highest likelihood of being enrolled in private schools, with 23 (31.5% in the age bracket) enrolled. Conversely, the age group of 3 to 4 year olds has the lowest likelihood of being enrolled in a private school, with 26 (100.0% in the age bracket) attending a public institution.
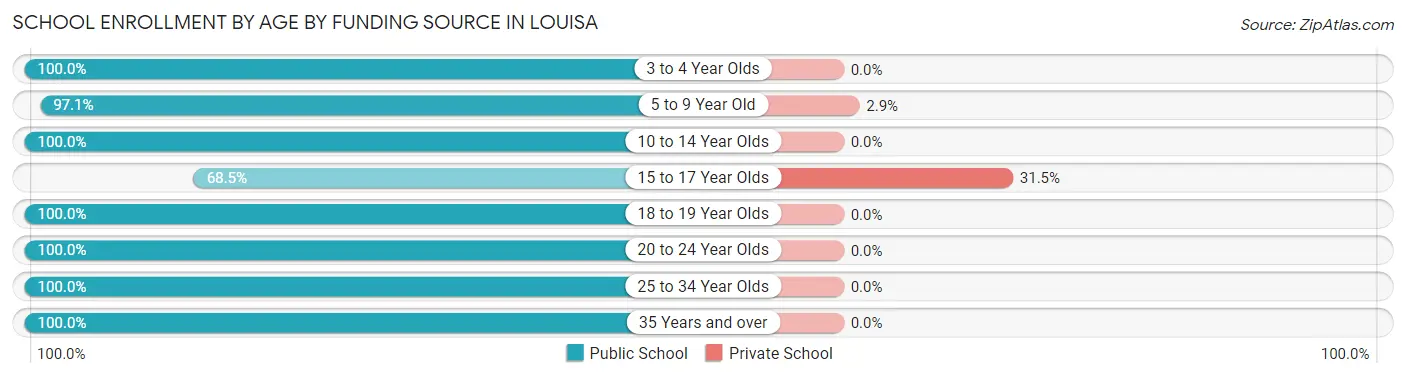
| Age Bracket | Public School | Private School |
| 3 to 4 Year Olds | 26 (100.0%) | 0 (0.0%) |
| 5 to 9 Year Old | 133 (97.1%) | 4 (2.9%) |
| 10 to 14 Year Olds | 169 (100.0%) | 0 (0.0%) |
| 15 to 17 Year Olds | 50 (68.5%) | 23 (31.5%) |
| 18 to 19 Year Olds | 13 (100.0%) | 0 (0.0%) |
| 20 to 24 Year Olds | 37 (100.0%) | 0 (0.0%) |
| 25 to 34 Year Olds | 77 (100.0%) | 0 (0.0%) |
| 35 Years and over | 24 (100.0%) | 0 (0.0%) |
| Total | 529 (95.1%) | 27 (4.9%) |
Educational Attainment by Field of Study in Louisa
Education (98 | 33.2%), psychology (43 | 14.6%), science & technology (34 | 11.5%), business (34 | 11.5%), and visual & performing arts (27 | 9.1%) are the most common fields of study among 295 individuals in Louisa who have obtained a bachelor's degree or higher.
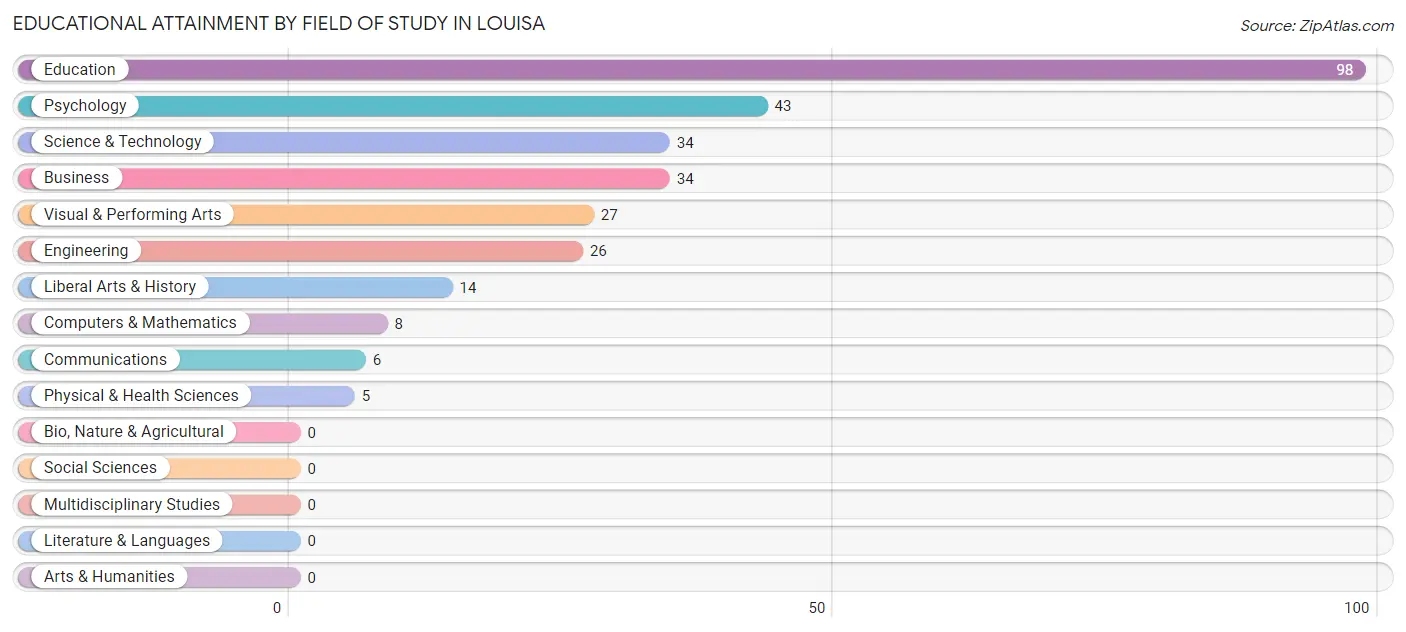
| Field of Study | # Graduates | % Graduates |
| Computers & Mathematics | 8 | 2.7% |
| Bio, Nature & Agricultural | 0 | 0.0% |
| Physical & Health Sciences | 5 | 1.7% |
| Psychology | 43 | 14.6% |
| Social Sciences | 0 | 0.0% |
| Engineering | 26 | 8.8% |
| Multidisciplinary Studies | 0 | 0.0% |
| Science & Technology | 34 | 11.5% |
| Business | 34 | 11.5% |
| Education | 98 | 33.2% |
| Literature & Languages | 0 | 0.0% |
| Liberal Arts & History | 14 | 4.8% |
| Visual & Performing Arts | 27 | 9.1% |
| Communications | 6 | 2.0% |
| Arts & Humanities | 0 | 0.0% |
| Total | 295 | 100.0% |
Transportation & Commute in Louisa
Vehicle Availability by Sex in Louisa
The most prevalent vehicle ownership categories in Louisa are males with 2 vehicles (169, accounting for 43.7%) and females with 2 vehicles (151, making up 46.7%).
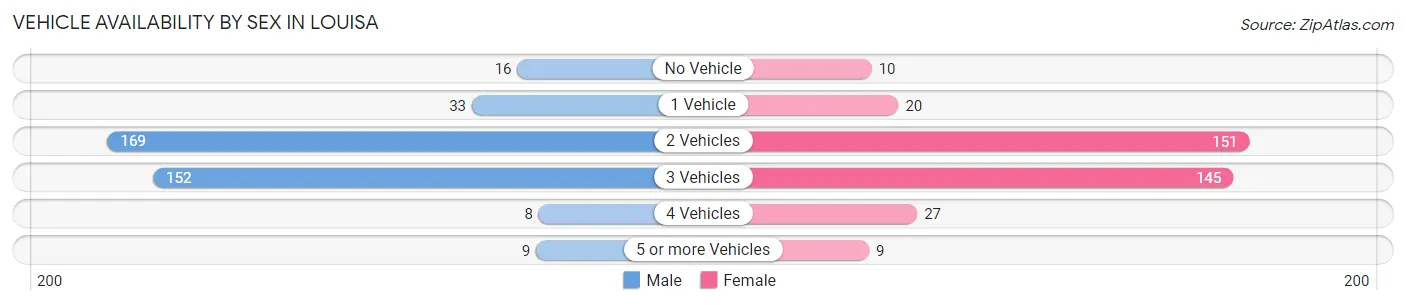
| Vehicles Available | Male | Female |
| No Vehicle | 16 (4.1%) | 10 (2.8%) |
| 1 Vehicle | 33 (8.5%) | 20 (5.5%) |
| 2 Vehicles | 169 (43.7%) | 151 (41.7%) |
| 3 Vehicles | 152 (39.3%) | 145 (40.1%) |
| 4 Vehicles | 8 (2.1%) | 27 (7.5%) |
| 5 or more Vehicles | 9 (2.3%) | 9 (2.5%) |
| Total | 387 (100.0%) | 362 (100.0%) |
Commute Time in Louisa
The most frequently occuring commute durations in Louisa are 5 to 9 minutes (151 commuters, 20.2%), 10 to 14 minutes (138 commuters, 18.5%), and less than 5 minutes (105 commuters, 14.1%).
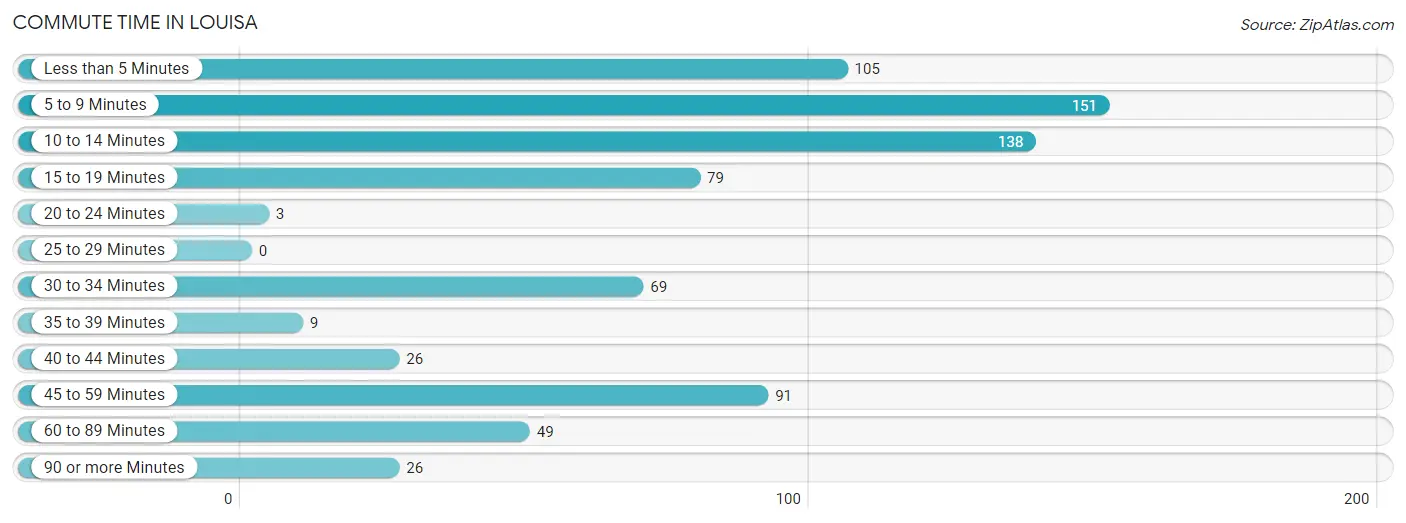
| Commute Time | # Commuters | % Commuters |
| Less than 5 Minutes | 105 | 14.1% |
| 5 to 9 Minutes | 151 | 20.2% |
| 10 to 14 Minutes | 138 | 18.5% |
| 15 to 19 Minutes | 79 | 10.6% |
| 20 to 24 Minutes | 3 | 0.4% |
| 25 to 29 Minutes | 0 | 0.0% |
| 30 to 34 Minutes | 69 | 9.2% |
| 35 to 39 Minutes | 9 | 1.2% |
| 40 to 44 Minutes | 26 | 3.5% |
| 45 to 59 Minutes | 91 | 12.2% |
| 60 to 89 Minutes | 49 | 6.6% |
| 90 or more Minutes | 26 | 3.5% |
Commute Time by Sex in Louisa
The most common commute times in Louisa are 15 to 19 minutes (72 commuters, 18.6%) for males and 5 to 9 minutes (137 commuters, 38.2%) for females.
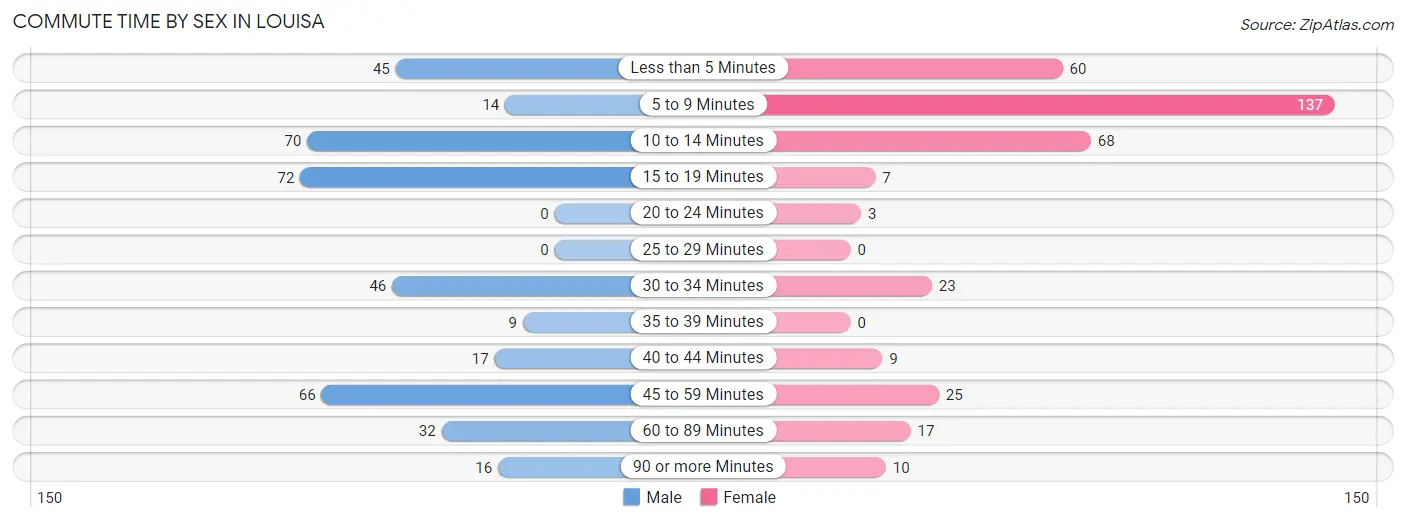
| Commute Time | Male | Female |
| Less than 5 Minutes | 45 (11.6%) | 60 (16.7%) |
| 5 to 9 Minutes | 14 (3.6%) | 137 (38.2%) |
| 10 to 14 Minutes | 70 (18.1%) | 68 (18.9%) |
| 15 to 19 Minutes | 72 (18.6%) | 7 (1.9%) |
| 20 to 24 Minutes | 0 (0.0%) | 3 (0.8%) |
| 25 to 29 Minutes | 0 (0.0%) | 0 (0.0%) |
| 30 to 34 Minutes | 46 (11.9%) | 23 (6.4%) |
| 35 to 39 Minutes | 9 (2.3%) | 0 (0.0%) |
| 40 to 44 Minutes | 17 (4.4%) | 9 (2.5%) |
| 45 to 59 Minutes | 66 (17.1%) | 25 (7.0%) |
| 60 to 89 Minutes | 32 (8.3%) | 17 (4.7%) |
| 90 or more Minutes | 16 (4.1%) | 10 (2.8%) |
Time of Departure to Work by Sex in Louisa
The most frequent times of departure to work in Louisa are 5:00 AM to 5:29 AM (96, 24.8%) for males and 8:30 AM to 8:59 AM (59, 16.4%) for females.
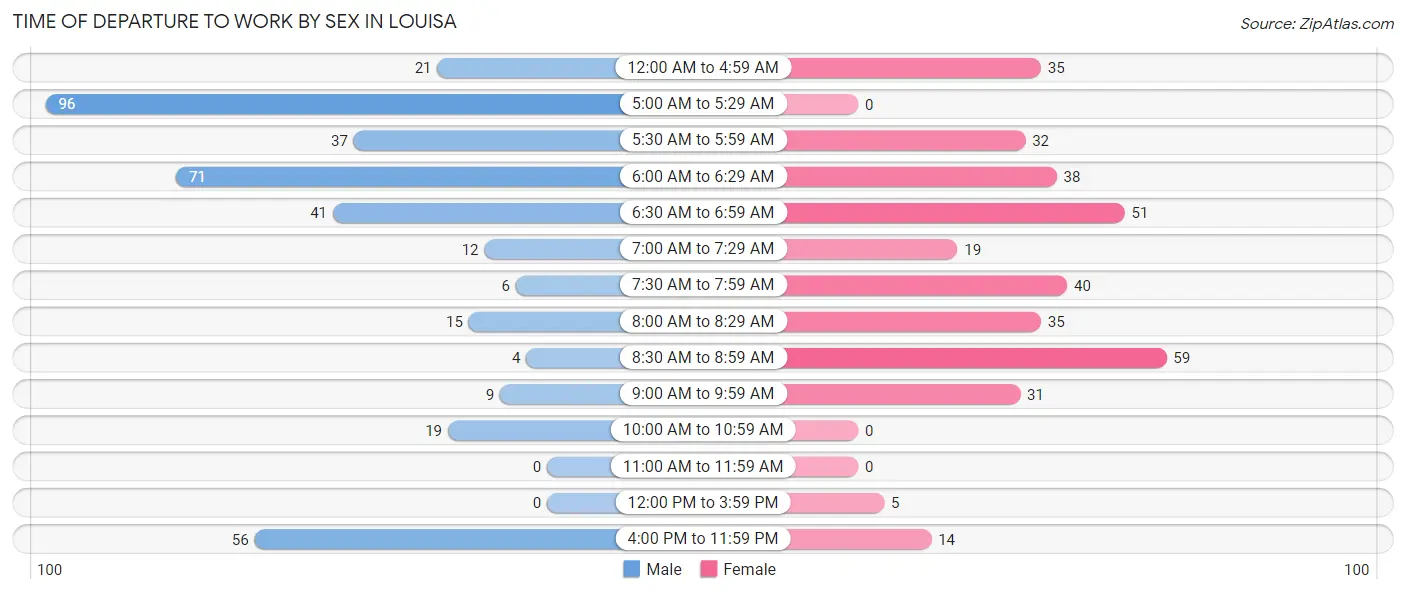
| Time of Departure | Male | Female |
| 12:00 AM to 4:59 AM | 21 (5.4%) | 35 (9.8%) |
| 5:00 AM to 5:29 AM | 96 (24.8%) | 0 (0.0%) |
| 5:30 AM to 5:59 AM | 37 (9.6%) | 32 (8.9%) |
| 6:00 AM to 6:29 AM | 71 (18.3%) | 38 (10.6%) |
| 6:30 AM to 6:59 AM | 41 (10.6%) | 51 (14.2%) |
| 7:00 AM to 7:29 AM | 12 (3.1%) | 19 (5.3%) |
| 7:30 AM to 7:59 AM | 6 (1.5%) | 40 (11.1%) |
| 8:00 AM to 8:29 AM | 15 (3.9%) | 35 (9.8%) |
| 8:30 AM to 8:59 AM | 4 (1.0%) | 59 (16.4%) |
| 9:00 AM to 9:59 AM | 9 (2.3%) | 31 (8.6%) |
| 10:00 AM to 10:59 AM | 19 (4.9%) | 0 (0.0%) |
| 11:00 AM to 11:59 AM | 0 (0.0%) | 0 (0.0%) |
| 12:00 PM to 3:59 PM | 0 (0.0%) | 5 (1.4%) |
| 4:00 PM to 11:59 PM | 56 (14.5%) | 14 (3.9%) |
| Total | 387 (100.0%) | 359 (100.0%) |
Housing Occupancy in Louisa
Occupancy by Ownership in Louisa
Of the total 794 dwellings in Louisa, owner-occupied units account for 498 (62.7%), while renter-occupied units make up 296 (37.3%).
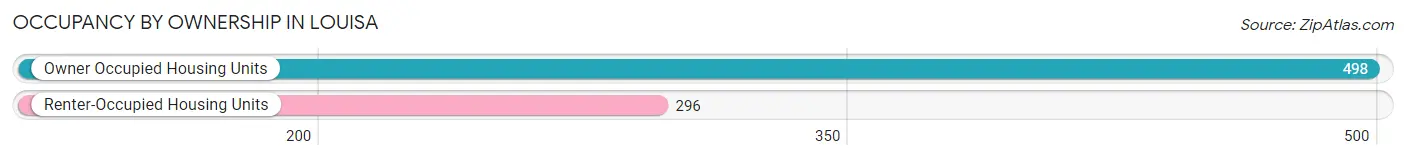
| Occupancy | # Housing Units | % Housing Units |
| Owner Occupied Housing Units | 498 | 62.7% |
| Renter-Occupied Housing Units | 296 | 37.3% |
| Total Occupied Housing Units | 794 | 100.0% |
Occupancy by Household Size in Louisa
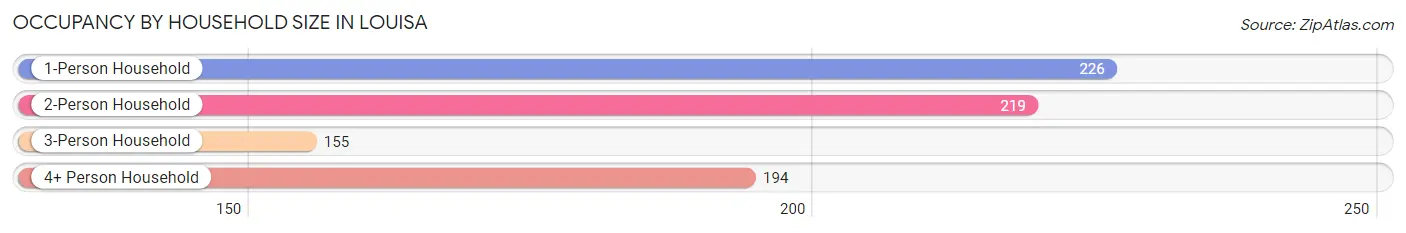
| Household Size | # Housing Units | % Housing Units |
| 1-Person Household | 226 | 28.5% |
| 2-Person Household | 219 | 27.6% |
| 3-Person Household | 155 | 19.5% |
| 4+ Person Household | 194 | 24.4% |
| Total Housing Units | 794 | 100.0% |
Occupancy by Ownership by Household Size in Louisa
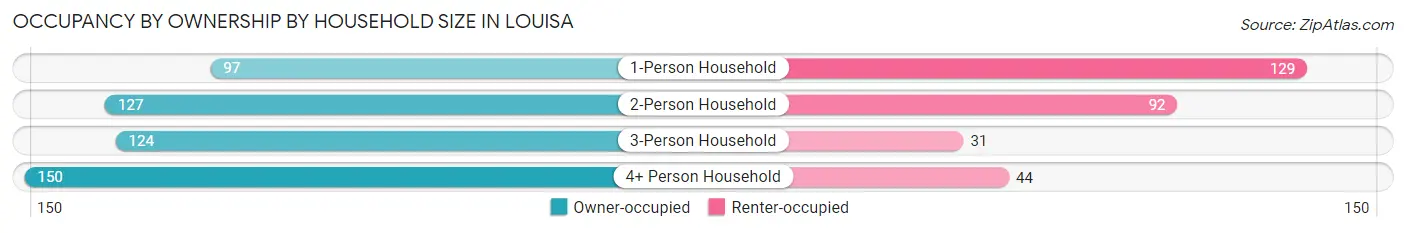
| Household Size | Owner-occupied | Renter-occupied |
| 1-Person Household | 97 (42.9%) | 129 (57.1%) |
| 2-Person Household | 127 (58.0%) | 92 (42.0%) |
| 3-Person Household | 124 (80.0%) | 31 (20.0%) |
| 4+ Person Household | 150 (77.3%) | 44 (22.7%) |
| Total Housing Units | 498 (62.7%) | 296 (37.3%) |
Occupancy by Educational Attainment in Louisa
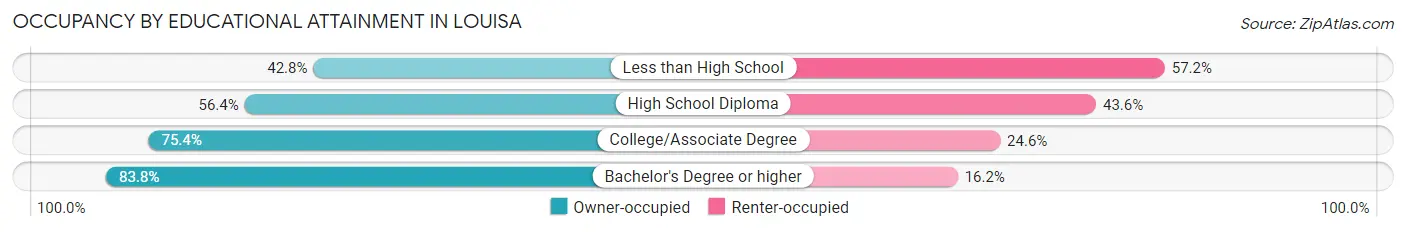
| Household Size | Owner-occupied | Renter-occupied |
| Less than High School | 71 (42.8%) | 95 (57.2%) |
| High School Diploma | 163 (56.4%) | 126 (43.6%) |
| College/Associate Degree | 181 (75.4%) | 59 (24.6%) |
| Bachelor's Degree or higher | 83 (83.8%) | 16 (16.2%) |
Occupancy by Age of Householder in Louisa
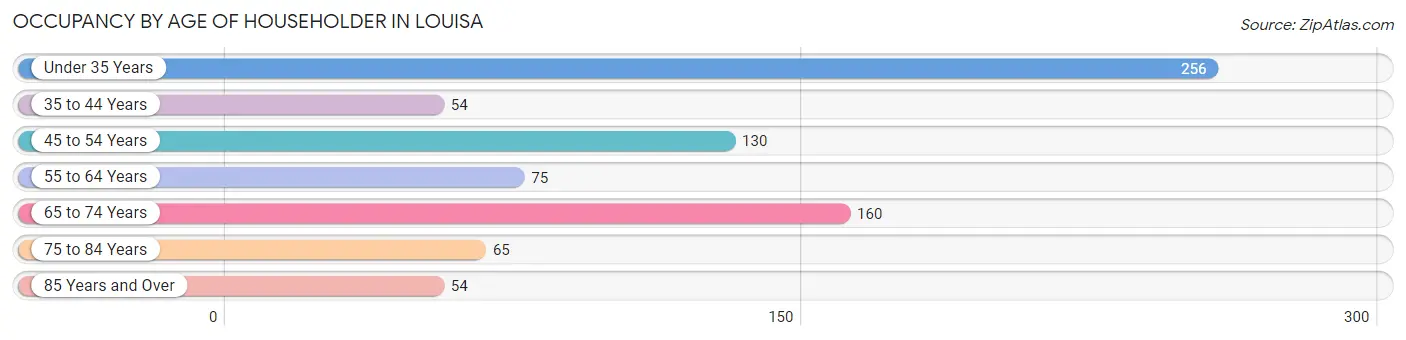
| Age Bracket | # Households | % Households |
| Under 35 Years | 256 | 32.2% |
| 35 to 44 Years | 54 | 6.8% |
| 45 to 54 Years | 130 | 16.4% |
| 55 to 64 Years | 75 | 9.5% |
| 65 to 74 Years | 160 | 20.2% |
| 75 to 84 Years | 65 | 8.2% |
| 85 Years and Over | 54 | 6.8% |
| Total | 794 | 100.0% |
Housing Finances in Louisa
Median Income by Occupancy in Louisa
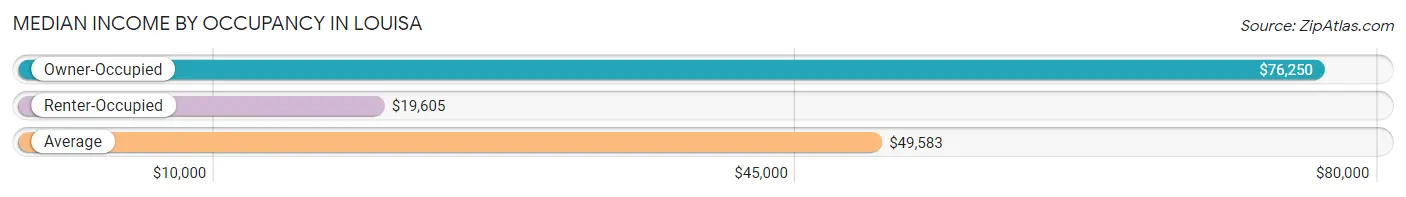
| Occupancy Type | # Households | Median Income |
| Owner-Occupied | 498 (62.7%) | $76,250 |
| Renter-Occupied | 296 (37.3%) | $19,605 |
| Average | 794 (100.0%) | $49,583 |
Occupancy by Householder Income Bracket in Louisa
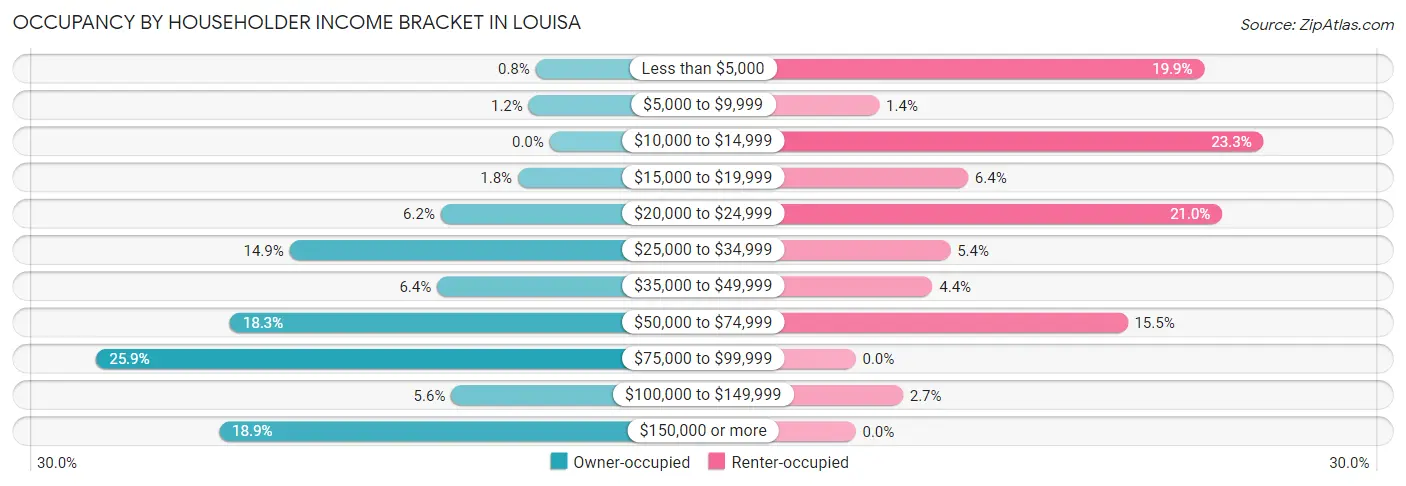
| Income Bracket | Owner-occupied | Renter-occupied |
| Less than $5,000 | 4 (0.8%) | 59 (19.9%) |
| $5,000 to $9,999 | 6 (1.2%) | 4 (1.3%) |
| $10,000 to $14,999 | 0 (0.0%) | 69 (23.3%) |
| $15,000 to $19,999 | 9 (1.8%) | 19 (6.4%) |
| $20,000 to $24,999 | 31 (6.2%) | 62 (20.9%) |
| $25,000 to $34,999 | 74 (14.9%) | 16 (5.4%) |
| $35,000 to $49,999 | 32 (6.4%) | 13 (4.4%) |
| $50,000 to $74,999 | 91 (18.3%) | 46 (15.5%) |
| $75,000 to $99,999 | 129 (25.9%) | 0 (0.0%) |
| $100,000 to $149,999 | 28 (5.6%) | 8 (2.7%) |
| $150,000 or more | 94 (18.9%) | 0 (0.0%) |
| Total | 498 (100.0%) | 296 (100.0%) |
Monthly Housing Cost Tiers in Louisa
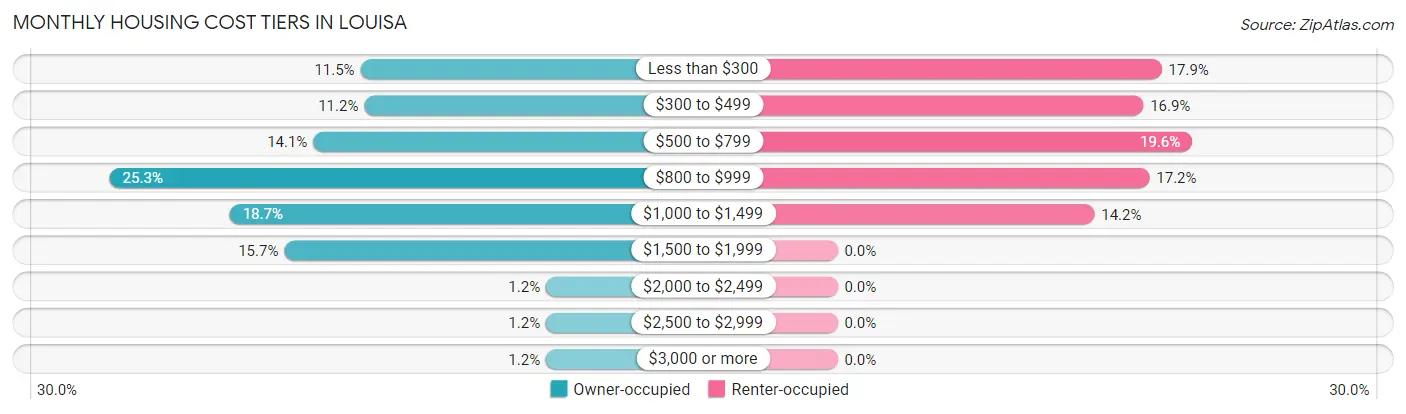
| Monthly Cost | Owner-occupied | Renter-occupied |
| Less than $300 | 57 (11.5%) | 53 (17.9%) |
| $300 to $499 | 56 (11.2%) | 50 (16.9%) |
| $500 to $799 | 70 (14.1%) | 58 (19.6%) |
| $800 to $999 | 126 (25.3%) | 51 (17.2%) |
| $1,000 to $1,499 | 93 (18.7%) | 42 (14.2%) |
| $1,500 to $1,999 | 78 (15.7%) | 0 (0.0%) |
| $2,000 to $2,499 | 6 (1.2%) | 0 (0.0%) |
| $2,500 to $2,999 | 6 (1.2%) | 0 (0.0%) |
| $3,000 or more | 6 (1.2%) | 0 (0.0%) |
| Total | 498 (100.0%) | 296 (100.0%) |
Physical Housing Characteristics in Louisa
Housing Structures in Louisa
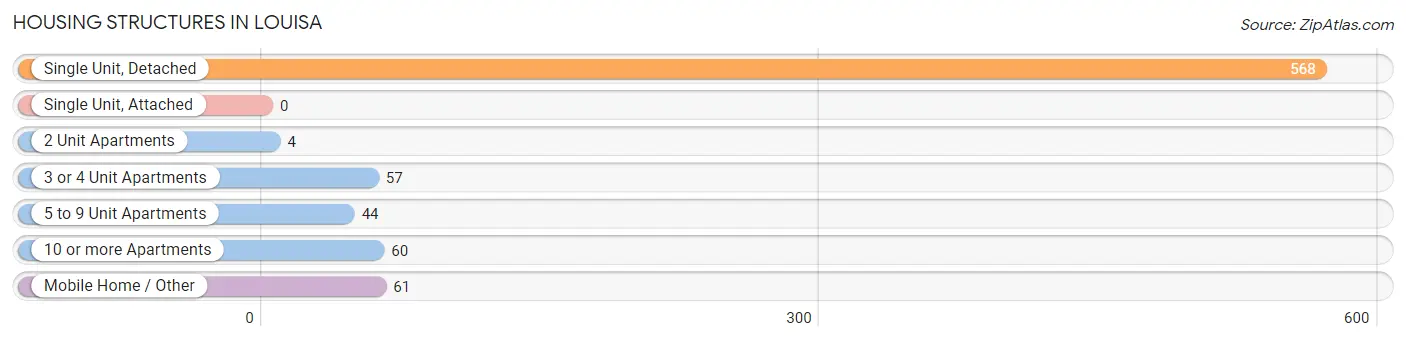
| Structure Type | # Housing Units | % Housing Units |
| Single Unit, Detached | 568 | 71.5% |
| Single Unit, Attached | 0 | 0.0% |
| 2 Unit Apartments | 4 | 0.5% |
| 3 or 4 Unit Apartments | 57 | 7.2% |
| 5 to 9 Unit Apartments | 44 | 5.5% |
| 10 or more Apartments | 60 | 7.6% |
| Mobile Home / Other | 61 | 7.7% |
| Total | 794 | 100.0% |
Housing Structures by Occupancy in Louisa
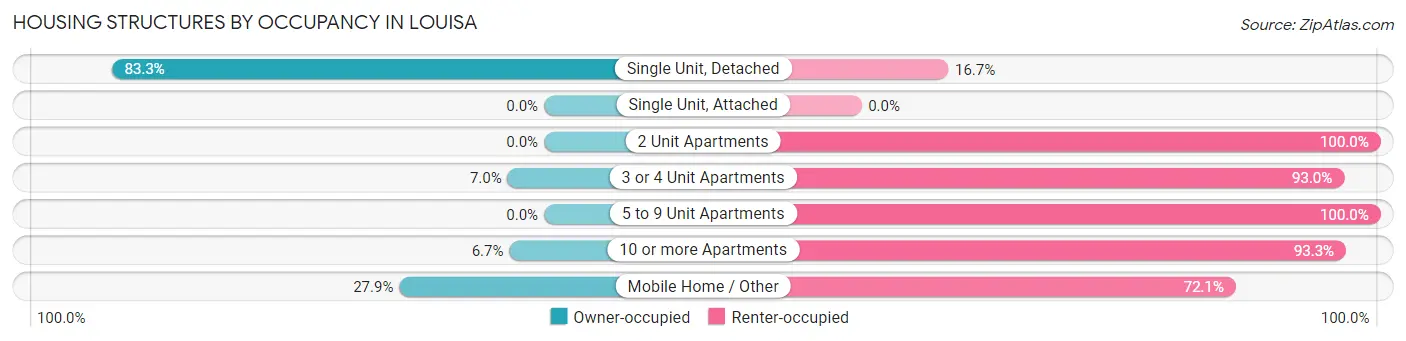
| Structure Type | Owner-occupied | Renter-occupied |
| Single Unit, Detached | 473 (83.3%) | 95 (16.7%) |
| Single Unit, Attached | 0 (0.0%) | 0 (0.0%) |
| 2 Unit Apartments | 0 (0.0%) | 4 (100.0%) |
| 3 or 4 Unit Apartments | 4 (7.0%) | 53 (93.0%) |
| 5 to 9 Unit Apartments | 0 (0.0%) | 44 (100.0%) |
| 10 or more Apartments | 4 (6.7%) | 56 (93.3%) |
| Mobile Home / Other | 17 (27.9%) | 44 (72.1%) |
| Total | 498 (62.7%) | 296 (37.3%) |
Housing Structures by Number of Rooms in Louisa
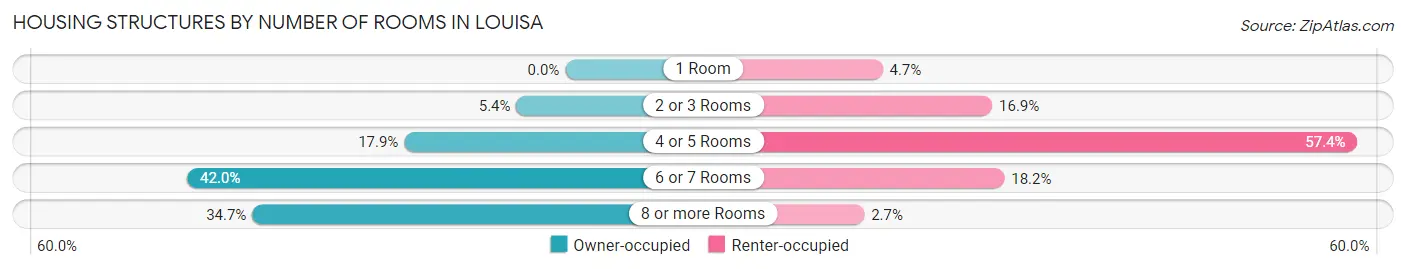
| Number of Rooms | Owner-occupied | Renter-occupied |
| 1 Room | 0 (0.0%) | 14 (4.7%) |
| 2 or 3 Rooms | 27 (5.4%) | 50 (16.9%) |
| 4 or 5 Rooms | 89 (17.9%) | 170 (57.4%) |
| 6 or 7 Rooms | 209 (42.0%) | 54 (18.2%) |
| 8 or more Rooms | 173 (34.7%) | 8 (2.7%) |
| Total | 498 (100.0%) | 296 (100.0%) |
Housing Structure by Heating Type in Louisa
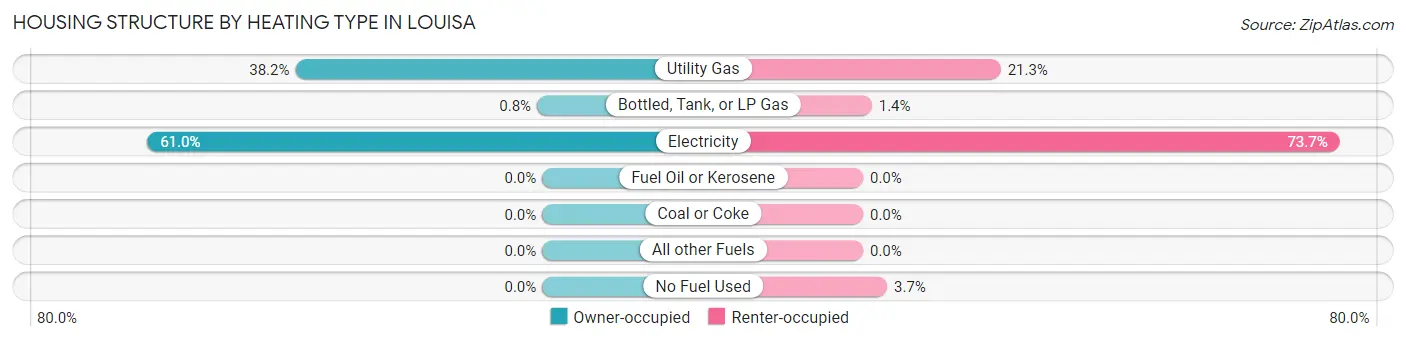
| Heating Type | Owner-occupied | Renter-occupied |
| Utility Gas | 190 (38.2%) | 63 (21.3%) |
| Bottled, Tank, or LP Gas | 4 (0.8%) | 4 (1.3%) |
| Electricity | 304 (61.0%) | 218 (73.7%) |
| Fuel Oil or Kerosene | 0 (0.0%) | 0 (0.0%) |
| Coal or Coke | 0 (0.0%) | 0 (0.0%) |
| All other Fuels | 0 (0.0%) | 0 (0.0%) |
| No Fuel Used | 0 (0.0%) | 11 (3.7%) |
| Total | 498 (100.0%) | 296 (100.0%) |
Household Vehicle Usage in Louisa
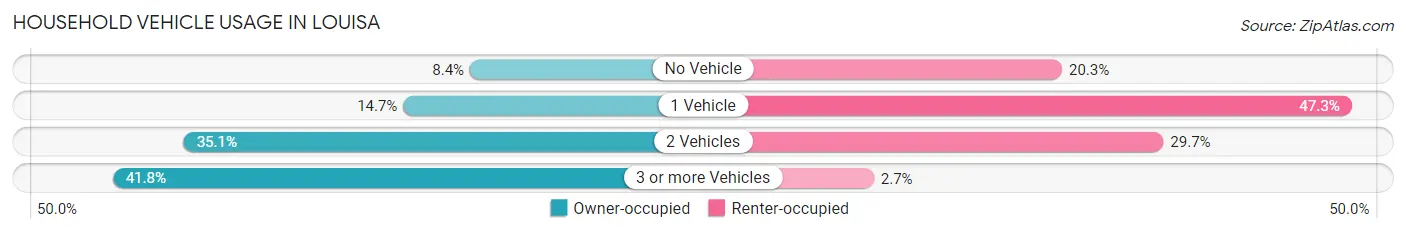
| Vehicles per Household | Owner-occupied | Renter-occupied |
| No Vehicle | 42 (8.4%) | 60 (20.3%) |
| 1 Vehicle | 73 (14.7%) | 140 (47.3%) |
| 2 Vehicles | 175 (35.1%) | 88 (29.7%) |
| 3 or more Vehicles | 208 (41.8%) | 8 (2.7%) |
| Total | 498 (100.0%) | 296 (100.0%) |
Real Estate & Mortgages in Louisa
Real Estate and Mortgage Overview in Louisa
| Characteristic | Without Mortgage | With Mortgage |
| Housing Units | 204 | 294 |
| Median Property Value | - | - |
| Median Household Income | $36,364 | $66 |
| Monthly Housing Costs | $452 | $6 |
| Real Estate Taxes | $913 | $35 |
Property Value by Mortgage Status in Louisa
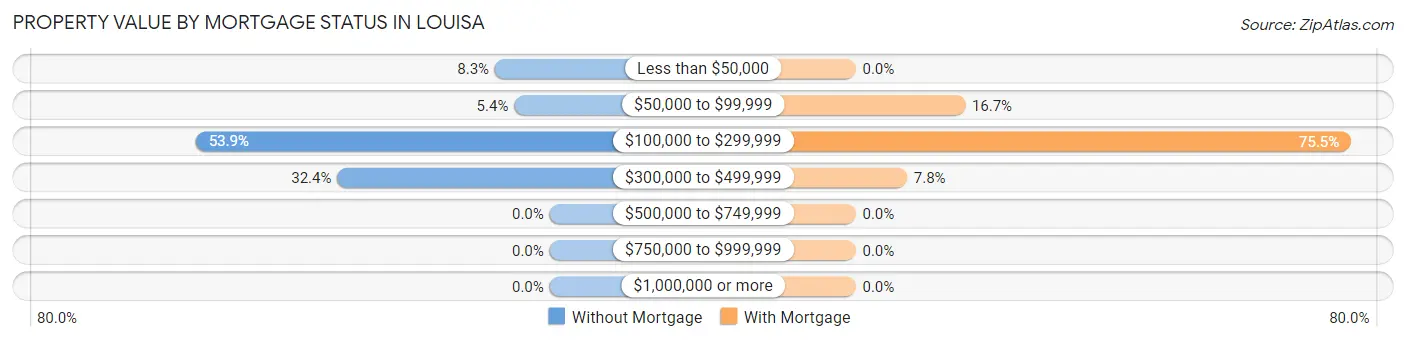
| Property Value | Without Mortgage | With Mortgage |
| Less than $50,000 | 17 (8.3%) | 0 (0.0%) |
| $50,000 to $99,999 | 11 (5.4%) | 49 (16.7%) |
| $100,000 to $299,999 | 110 (53.9%) | 222 (75.5%) |
| $300,000 to $499,999 | 66 (32.4%) | 23 (7.8%) |
| $500,000 to $749,999 | 0 (0.0%) | 0 (0.0%) |
| $750,000 to $999,999 | 0 (0.0%) | 0 (0.0%) |
| $1,000,000 or more | 0 (0.0%) | 0 (0.0%) |
| Total | 204 (100.0%) | 294 (100.0%) |
Household Income by Mortgage Status in Louisa
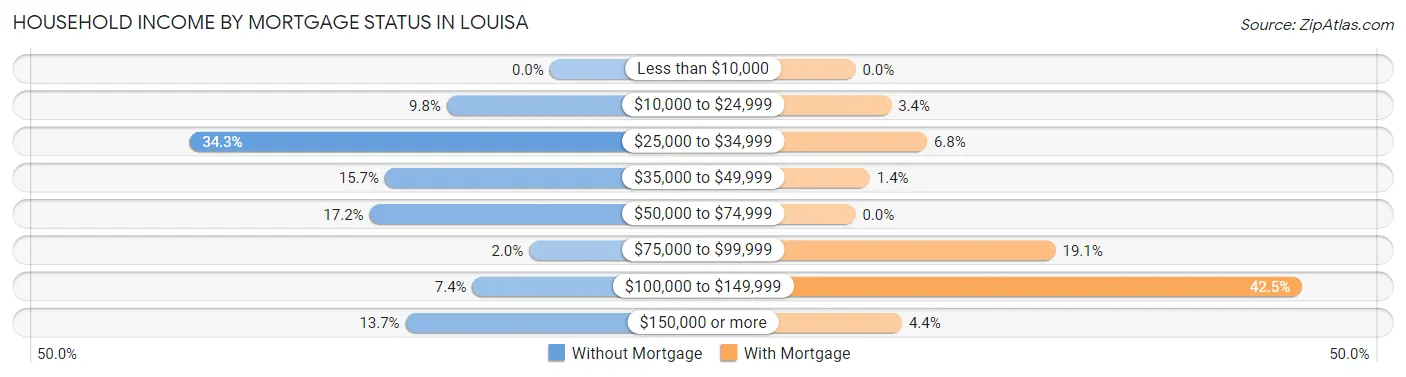
| Household Income | Without Mortgage | With Mortgage |
| Less than $10,000 | 0 (0.0%) | 0 (0.0%) |
| $10,000 to $24,999 | 20 (9.8%) | 10 (3.4%) |
| $25,000 to $34,999 | 70 (34.3%) | 20 (6.8%) |
| $35,000 to $49,999 | 32 (15.7%) | 4 (1.4%) |
| $50,000 to $74,999 | 35 (17.2%) | 0 (0.0%) |
| $75,000 to $99,999 | 4 (2.0%) | 56 (19.1%) |
| $100,000 to $149,999 | 15 (7.3%) | 125 (42.5%) |
| $150,000 or more | 28 (13.7%) | 13 (4.4%) |
| Total | 204 (100.0%) | 294 (100.0%) |
Property Value to Household Income Ratio in Louisa
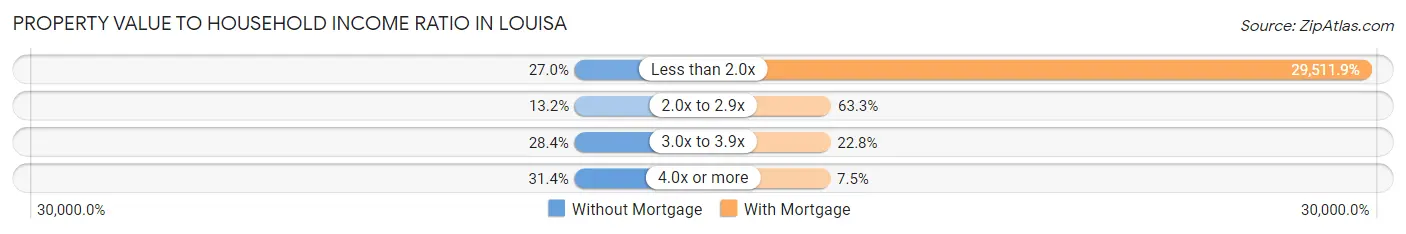
| Value-to-Income Ratio | Without Mortgage | With Mortgage |
| Less than 2.0x | 55 (27.0%) | 86,765 (29,511.9%) |
| 2.0x to 2.9x | 27 (13.2%) | 186 (63.3%) |
| 3.0x to 3.9x | 58 (28.4%) | 67 (22.8%) |
| 4.0x or more | 64 (31.4%) | 22 (7.5%) |
| Total | 204 (100.0%) | 294 (100.0%) |
Real Estate Taxes by Mortgage Status in Louisa
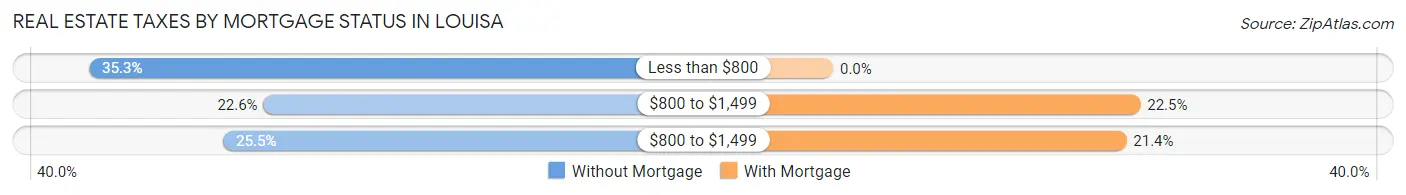
| Property Taxes | Without Mortgage | With Mortgage |
| Less than $800 | 72 (35.3%) | 0 (0.0%) |
| $800 to $1,499 | 46 (22.6%) | 66 (22.5%) |
| $800 to $1,499 | 52 (25.5%) | 63 (21.4%) |
| Total | 204 (100.0%) | 294 (100.0%) |
Health & Disability in Louisa
Health Insurance Coverage by Age in Louisa
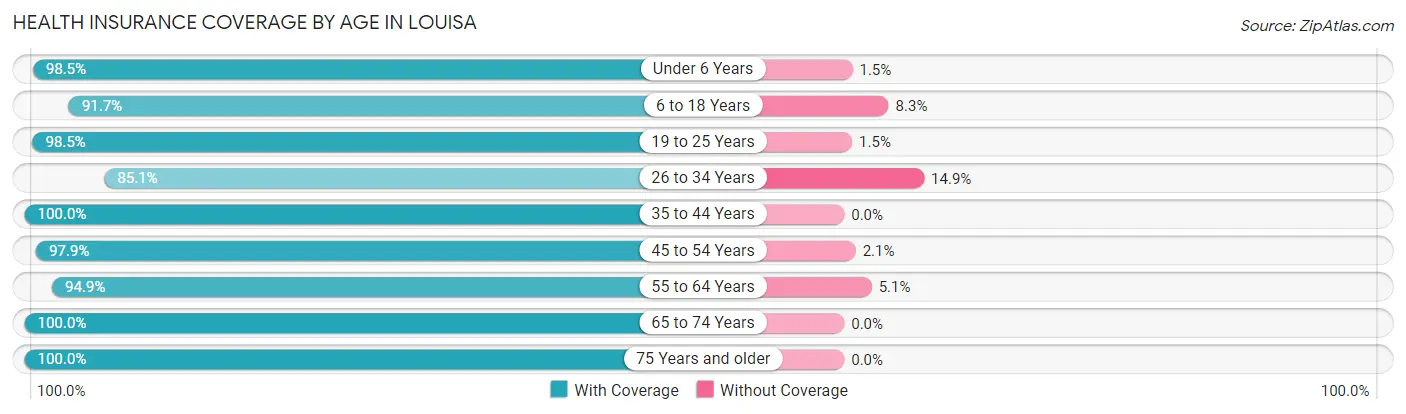
| Age Bracket | With Coverage | Without Coverage |
| Under 6 Years | 449 (98.5%) | 7 (1.5%) |
| 6 to 18 Years | 344 (91.7%) | 31 (8.3%) |
| 19 to 25 Years | 134 (98.5%) | 2 (1.5%) |
| 26 to 34 Years | 400 (85.1%) | 70 (14.9%) |
| 35 to 44 Years | 141 (100.0%) | 0 (0.0%) |
| 45 to 54 Years | 321 (97.9%) | 7 (2.1%) |
| 55 to 64 Years | 278 (94.9%) | 15 (5.1%) |
| 65 to 74 Years | 226 (100.0%) | 0 (0.0%) |
| 75 Years and older | 131 (100.0%) | 0 (0.0%) |
| Total | 2,424 (94.8%) | 132 (5.2%) |
Health Insurance Coverage by Citizenship Status in Louisa
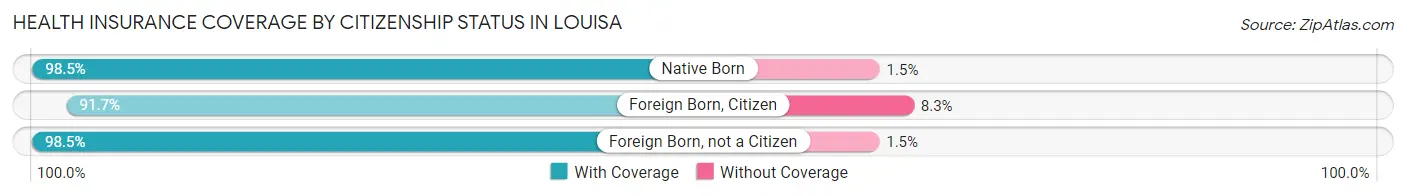
| Citizenship Status | With Coverage | Without Coverage |
| Native Born | 449 (98.5%) | 7 (1.5%) |
| Foreign Born, Citizen | 344 (91.7%) | 31 (8.3%) |
| Foreign Born, not a Citizen | 134 (98.5%) | 2 (1.5%) |
Health Insurance Coverage by Household Income in Louisa

| Household Income | With Coverage | Without Coverage |
| Under $25,000 | 462 (91.1%) | 45 (8.9%) |
| $25,000 to $49,999 | 326 (100.0%) | 0 (0.0%) |
| $50,000 to $74,999 | 596 (98.4%) | 10 (1.7%) |
| $75,000 to $99,999 | 533 (92.1%) | 46 (7.9%) |
| $100,000 and over | 507 (94.2%) | 31 (5.8%) |
Public vs Private Health Insurance Coverage by Age in Louisa
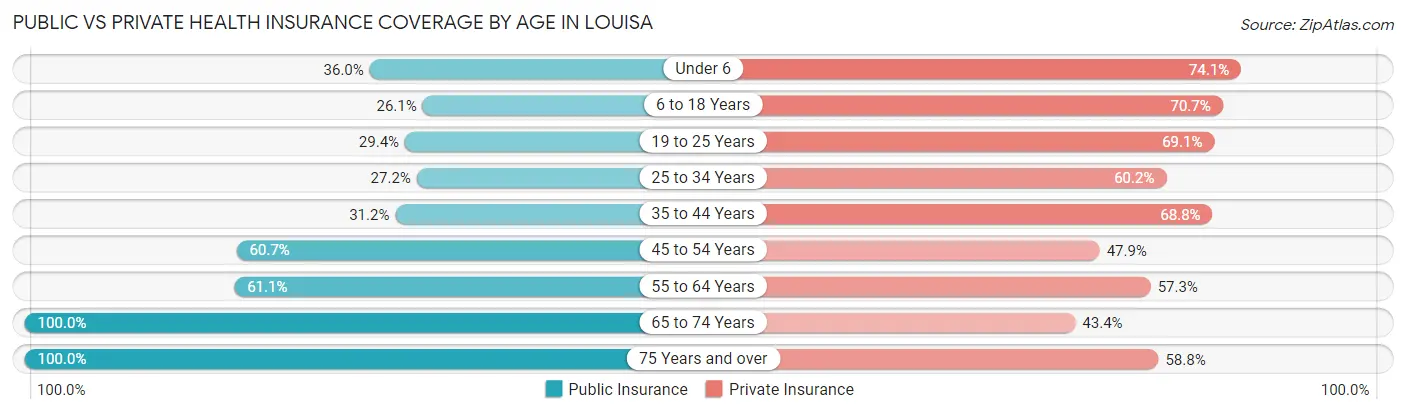
| Age Bracket | Public Insurance | Private Insurance |
| Under 6 | 164 (36.0%) | 338 (74.1%) |
| 6 to 18 Years | 98 (26.1%) | 265 (70.7%) |
| 19 to 25 Years | 40 (29.4%) | 94 (69.1%) |
| 25 to 34 Years | 128 (27.2%) | 283 (60.2%) |
| 35 to 44 Years | 44 (31.2%) | 97 (68.8%) |
| 45 to 54 Years | 199 (60.7%) | 157 (47.9%) |
| 55 to 64 Years | 179 (61.1%) | 168 (57.3%) |
| 65 to 74 Years | 226 (100.0%) | 98 (43.4%) |
| 75 Years and over | 131 (100.0%) | 77 (58.8%) |
| Total | 1,209 (47.3%) | 1,577 (61.7%) |
Disability Status by Sex by Age in Louisa
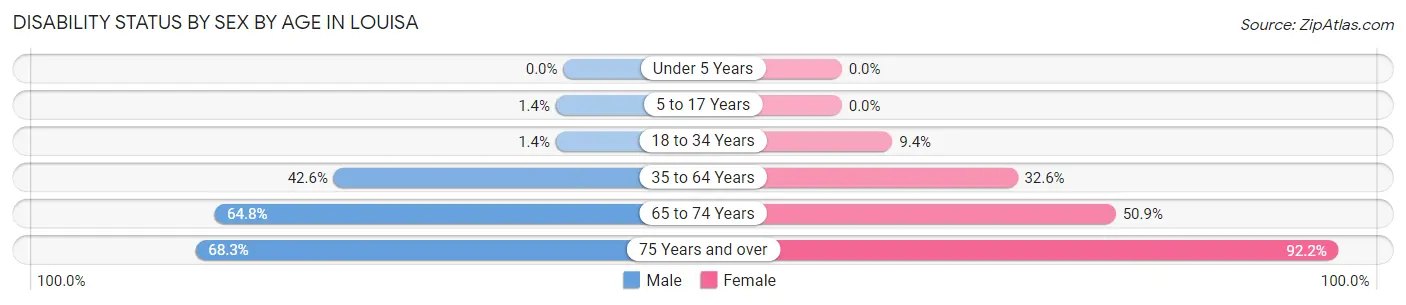
| Age Bracket | Male | Female |
| Under 5 Years | 0 (0.0%) | 0 (0.0%) |
| 5 to 17 Years | 4 (1.4%) | 0 (0.0%) |
| 18 to 34 Years | 4 (1.4%) | 32 (9.4%) |
| 35 to 64 Years | 130 (42.6%) | 149 (32.6%) |
| 65 to 74 Years | 70 (64.8%) | 60 (50.8%) |
| 75 Years and over | 28 (68.3%) | 83 (92.2%) |
Disability Class by Sex by Age in Louisa
Disability Class: Hearing Difficulty
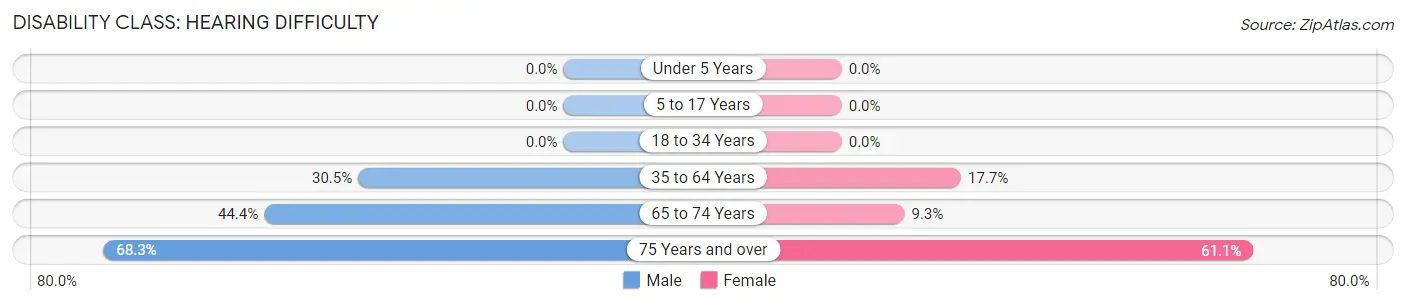
| Age Bracket | Male | Female |
| Under 5 Years | 0 (0.0%) | 0 (0.0%) |
| 5 to 17 Years | 0 (0.0%) | 0 (0.0%) |
| 18 to 34 Years | 0 (0.0%) | 0 (0.0%) |
| 35 to 64 Years | 93 (30.5%) | 81 (17.7%) |
| 65 to 74 Years | 48 (44.4%) | 11 (9.3%) |
| 75 Years and over | 28 (68.3%) | 55 (61.1%) |
Disability Class: Vision Difficulty
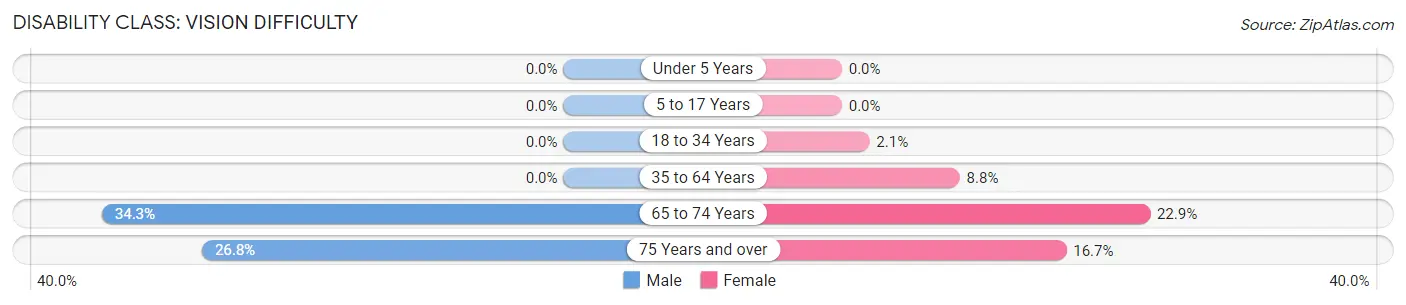
| Age Bracket | Male | Female |
| Under 5 Years | 0 (0.0%) | 0 (0.0%) |
| 5 to 17 Years | 0 (0.0%) | 0 (0.0%) |
| 18 to 34 Years | 0 (0.0%) | 7 (2.1%) |
| 35 to 64 Years | 0 (0.0%) | 40 (8.7%) |
| 65 to 74 Years | 37 (34.3%) | 27 (22.9%) |
| 75 Years and over | 11 (26.8%) | 15 (16.7%) |
Disability Class: Cognitive Difficulty
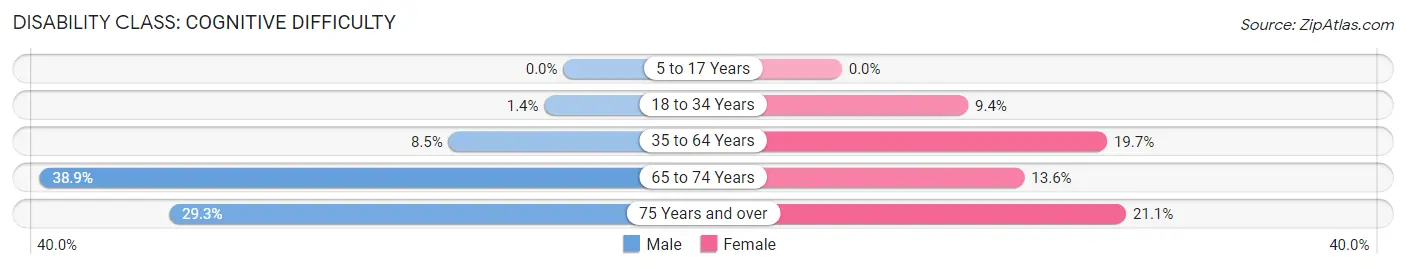
| Age Bracket | Male | Female |
| 5 to 17 Years | 0 (0.0%) | 0 (0.0%) |
| 18 to 34 Years | 4 (1.4%) | 32 (9.4%) |
| 35 to 64 Years | 26 (8.5%) | 90 (19.7%) |
| 65 to 74 Years | 42 (38.9%) | 16 (13.6%) |
| 75 Years and over | 12 (29.3%) | 19 (21.1%) |
Disability Class: Ambulatory Difficulty
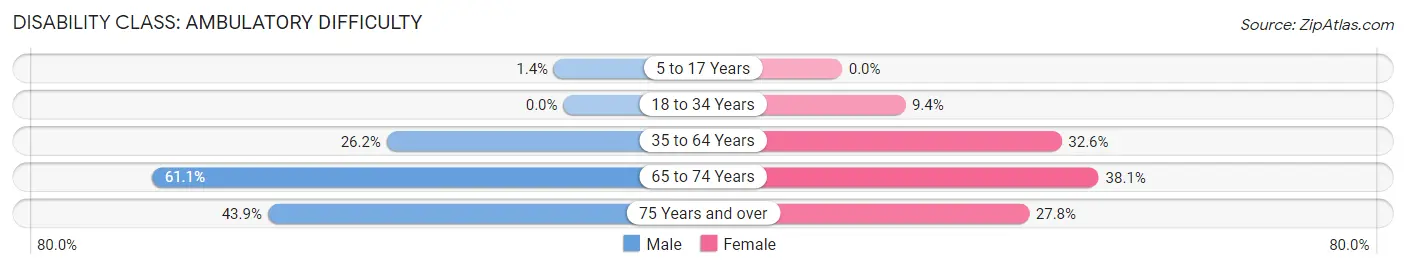
| Age Bracket | Male | Female |
| 5 to 17 Years | 4 (1.4%) | 0 (0.0%) |
| 18 to 34 Years | 0 (0.0%) | 32 (9.4%) |
| 35 to 64 Years | 80 (26.2%) | 149 (32.6%) |
| 65 to 74 Years | 66 (61.1%) | 45 (38.1%) |
| 75 Years and over | 18 (43.9%) | 25 (27.8%) |
Disability Class: Self-Care Difficulty
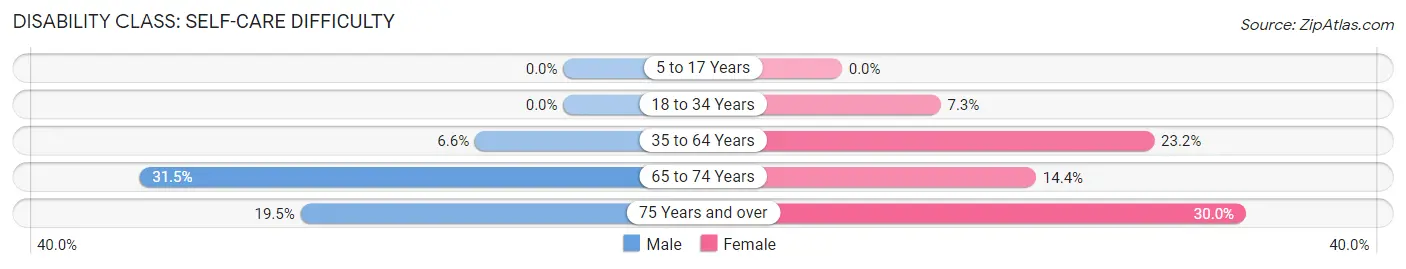
| Age Bracket | Male | Female |
| 5 to 17 Years | 0 (0.0%) | 0 (0.0%) |
| 18 to 34 Years | 0 (0.0%) | 25 (7.3%) |
| 35 to 64 Years | 20 (6.6%) | 106 (23.2%) |
| 65 to 74 Years | 34 (31.5%) | 17 (14.4%) |
| 75 Years and over | 8 (19.5%) | 27 (30.0%) |
Technology Access in Louisa
Computing Device Access in Louisa
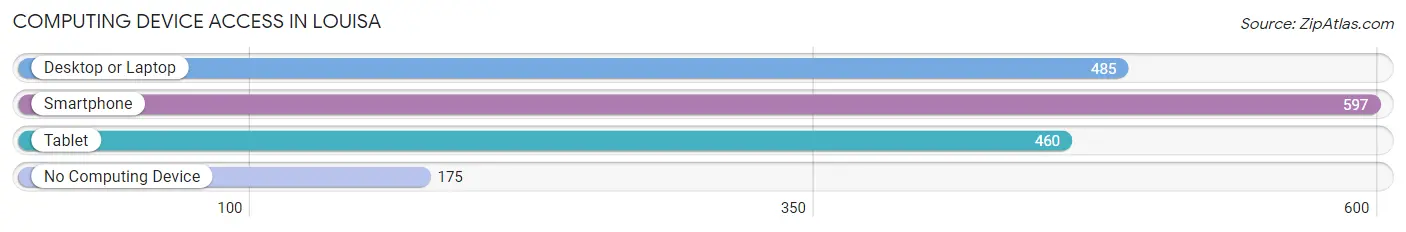
| Device Type | # Households | % Households |
| Desktop or Laptop | 485 | 61.1% |
| Smartphone | 597 | 75.2% |
| Tablet | 460 | 57.9% |
| No Computing Device | 175 | 22.0% |
| Total | 794 | 100.0% |
Internet Access in Louisa
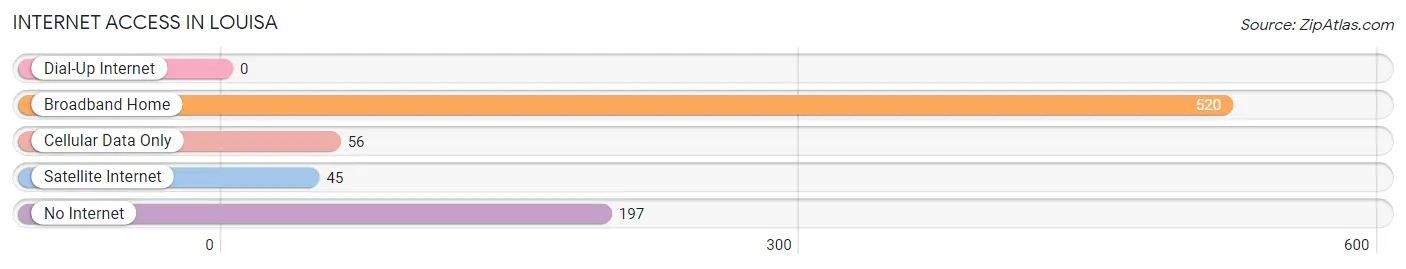
| Internet Type | # Households | % Households |
| Dial-Up Internet | 0 | 0.0% |
| Broadband Home | 520 | 65.5% |
| Cellular Data Only | 56 | 7.0% |
| Satellite Internet | 45 | 5.7% |
| No Internet | 197 | 24.8% |
| Total | 794 | 100.0% |
Louisa Summary
Louisville, Kentucky is a city located in the state of Kentucky, in the United States of America. It is the largest city in the state and the county seat of Jefferson County. Louisville is situated on the Ohio River, and is the principal city of the Louisville metropolitan area. The city has a population of approximately 600,000 people, making it the 29th most populous city in the United States.
Louisville was founded in 1778 by George Rogers Clark and named after King Louis XVI of France. It was originally a trading post and a fort, and was the site of the first permanent settlement in the state of Kentucky. The city quickly grew in size and importance, and by the mid-19th century, it had become a major center for manufacturing, shipping, and transportation. Louisville was also the site of the first Kentucky Derby, which was held in 1875.
Geographically, Louisville is located in the north-central part of the state, at the Falls of the Ohio River. It is situated on a highland plain, with the Ohio River forming the western boundary of the city. The city is divided into three distinct regions: the downtown area, the East End, and the West End. The downtown area is the most densely populated and is home to many of the city's major attractions, including the Louisville Slugger Museum, the Kentucky Derby Museum, and the Muhammad Ali Center. The East End is the oldest part of the city and is home to many of the city's historic neighborhoods. The West End is the most affluent part of the city and is home to many of the city's most affluent neighborhoods.
The economy of Louisville is largely based on manufacturing, healthcare, and tourism. The city is home to several major corporations, including Brown-Forman, Humana, and Yum! Brands. Louisville is also home to several major universities, including the University of Louisville, Bellarmine University, and Spalding University.
The demographics of Louisville are diverse. The city is home to a large African American population, as well as a large Hispanic population. The city also has a large population of immigrants from various countries, including India, China, and Mexico. The median household income in Louisville is $45,000, and the median age is 36.
Louisville is a vibrant city with a rich history and culture. It is home to a variety of attractions, including the Louisville Slugger Museum, the Kentucky Derby Museum, and the Muhammad Ali Center. The city is also home to a variety of restaurants, bars, and entertainment venues. Louisville is a great place to live, work, and visit.
Common Questions
What is Per Capita Income in Louisa?
Per Capita income in Louisa is $23,218.
What is the Median Family Income in Louisa?
Median Family Income in Louisa is $69,167.
What is the Median Household income in Louisa?
Median Household Income in Louisa is $49,583.
What is Income or Wage Gap in Louisa?
Income or Wage Gap in Louisa is 31.1%.
Women in Louisa earn 68.9 cents for every dollar earned by a man.
What is Inequality or Gini Index in Louisa?
Inequality or Gini Index in Louisa is 0.53.
What is the Total Population of Louisa?
Total Population of Louisa is 2,652.
What is the Total Male Population of Louisa?
Total Male Population of Louisa is 1,338.
What is the Total Female Population of Louisa?
Total Female Population of Louisa is 1,314.
What is the Ratio of Males per 100 Females in Louisa?
There are 101.83 Males per 100 Females in Louisa.
What is the Ratio of Females per 100 Males in Louisa?
There are 98.21 Females per 100 Males in Louisa.
What is the Median Population Age in Louisa?
Median Population Age in Louisa is 32.9 Years.
What is the Average Family Size in Louisa
Average Family Size in Louisa is 4.0 People.
What is the Average Household Size in Louisa
Average Household Size in Louisa is 3.2 People.
How Large is the Labor Force in Louisa?
There are 864 People in the Labor Forcein in Louisa.
What is the Percentage of People in the Labor Force in Louisa?
46.1% of People are in the Labor Force in Louisa.
What is the Unemployment Rate in Louisa?
Unemployment Rate in Louisa is 7.9%.