Cumberland, KY Map & Demographics
Cumberland Map
Cumberland Overview
$14,896
PER CAPITA INCOME
$34,101
AVG FAMILY INCOME
$32,716
AVG HOUSEHOLD INCOME
0.53
INEQUALITY / GINI INDEX
2,390
TOTAL POPULATION
1,035
MALE POPULATION
1,355
FEMALE POPULATION
76.38
MALES / 100 FEMALES
130.92
FEMALES / 100 MALES
33.6
MEDIAN AGE
3.7
AVG FAMILY SIZE
2.8
AVG HOUSEHOLD SIZE
591
LABOR FORCE [ PEOPLE ]
37.0%
PERCENT IN LABOR FORCE
42.5%
UNEMPLOYMENT RATE
Cumberland Zip Codes
Cumberland Area Codes
Income in Cumberland
Income Overview in Cumberland
Per Capita Income in Cumberland is $14,896, while median incomes of families and households are $34,101 and $32,716 respectively.
| Characteristic | Number | Measure |
| Per Capita Income | 2,390 | $14,896 |
| Median Family Income | 531 | $34,101 |
| Mean Family Income | 531 | $50,989 |
| Median Household Income | 829 | $32,716 |
| Mean Household Income | 829 | $42,435 |
| Income Deficit | 531 | $0 |
| Wage / Income Gap (%) | 2,390 | 0.00% |
| Wage / Income Gap ($) | 2,390 | 100.00¢ per $1 |
| Gini / Inequality Index | 2,390 | 0.53 |
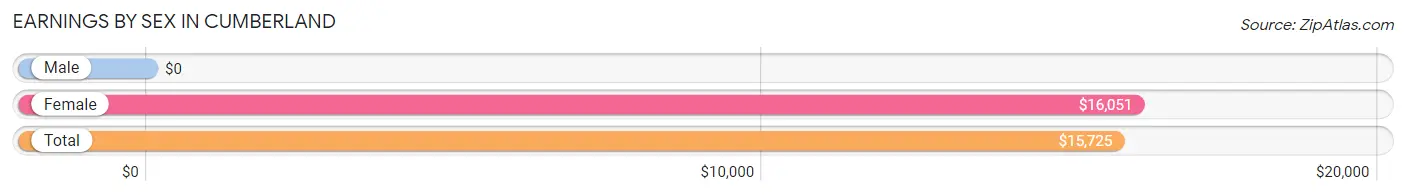
Earnings by Sex in Cumberland
| Sex | Number | Average Earnings |
| Male | 298 (53.7%) | $0 |
| Female | 257 (46.3%) | $16,051 |
| Total | 555 (100.0%) | $15,725 |
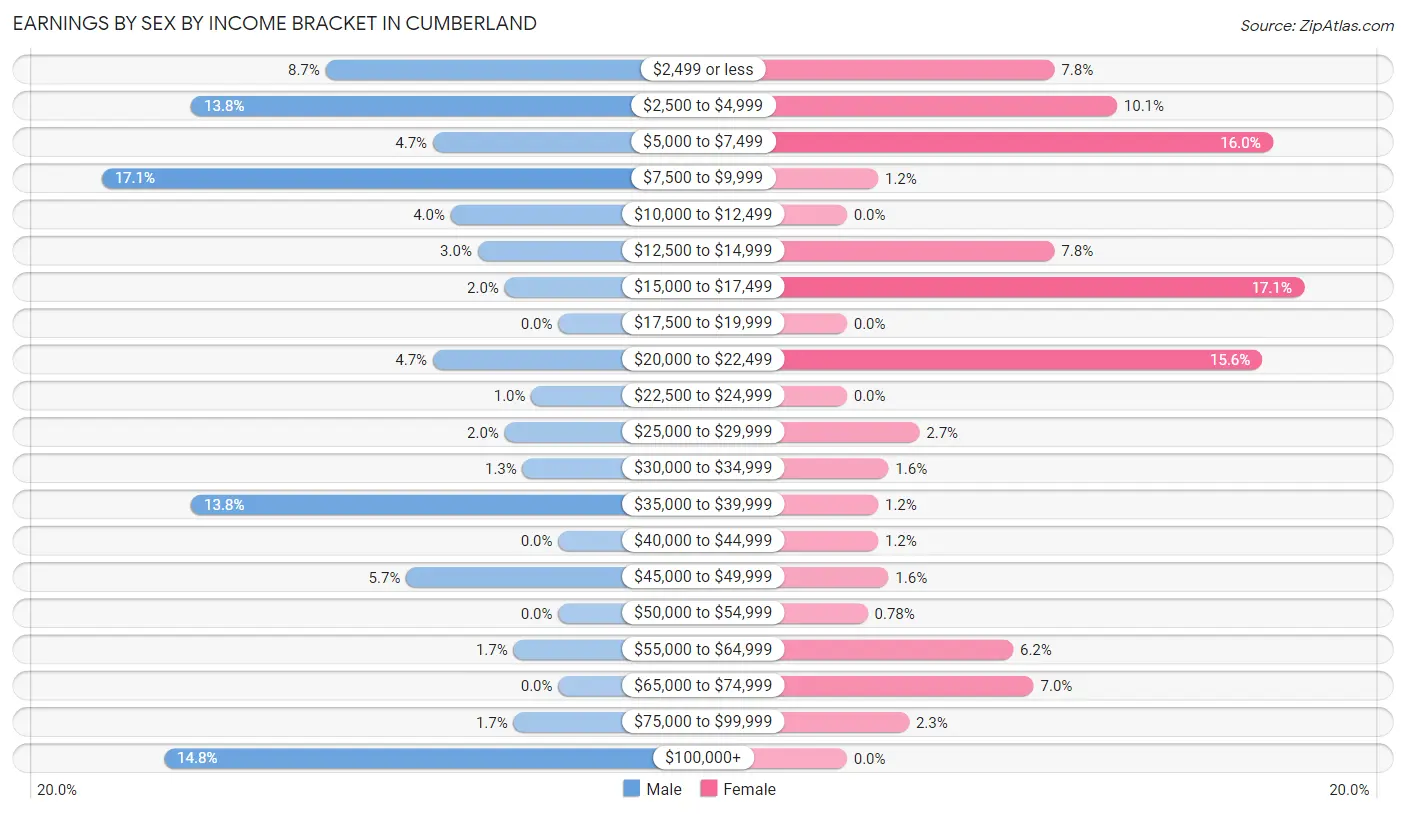
Earnings by Sex by Income Bracket in Cumberland
The most common earnings brackets in Cumberland are $7,500 to $9,999 for men (51 | 17.1%) and $15,000 to $17,499 for women (44 | 17.1%).
| Income | Male | Female |
| $2,499 or less | 26 (8.7%) | 20 (7.8%) |
| $2,500 to $4,999 | 41 (13.8%) | 26 (10.1%) |
| $5,000 to $7,499 | 14 (4.7%) | 41 (16.0%) |
| $7,500 to $9,999 | 51 (17.1%) | 3 (1.2%) |
| $10,000 to $12,499 | 12 (4.0%) | 0 (0.0%) |
| $12,500 to $14,999 | 9 (3.0%) | 20 (7.8%) |
| $15,000 to $17,499 | 6 (2.0%) | 44 (17.1%) |
| $17,500 to $19,999 | 0 (0.0%) | 0 (0.0%) |
| $20,000 to $22,499 | 14 (4.7%) | 40 (15.6%) |
| $22,500 to $24,999 | 3 (1.0%) | 0 (0.0%) |
| $25,000 to $29,999 | 6 (2.0%) | 7 (2.7%) |
| $30,000 to $34,999 | 4 (1.3%) | 4 (1.6%) |
| $35,000 to $39,999 | 41 (13.8%) | 3 (1.2%) |
| $40,000 to $44,999 | 0 (0.0%) | 3 (1.2%) |
| $45,000 to $49,999 | 17 (5.7%) | 4 (1.6%) |
| $50,000 to $54,999 | 0 (0.0%) | 2 (0.8%) |
| $55,000 to $64,999 | 5 (1.7%) | 16 (6.2%) |
| $65,000 to $74,999 | 0 (0.0%) | 18 (7.0%) |
| $75,000 to $99,999 | 5 (1.7%) | 6 (2.3%) |
| $100,000+ | 44 (14.8%) | 0 (0.0%) |
| Total | 298 (100.0%) | 257 (100.0%) |
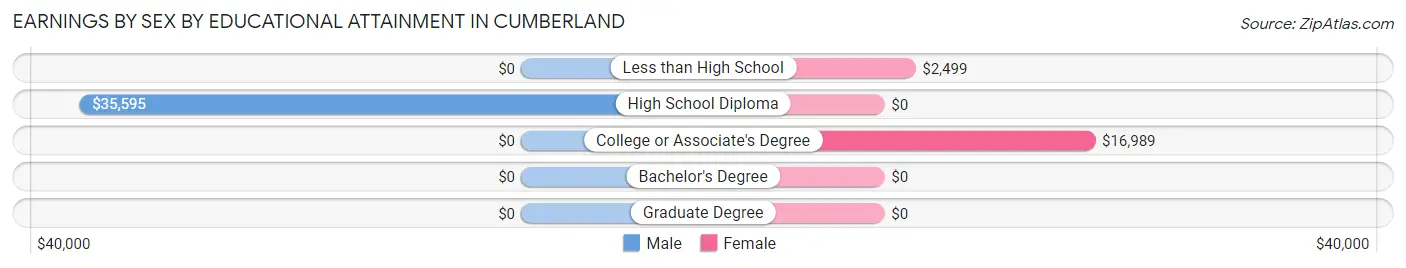
Earnings by Sex by Educational Attainment in Cumberland
| Educational Attainment | Male Income | Female Income |
| Less than High School | - | - |
| High School Diploma | $35,595 | $0 |
| College or Associate's Degree | - | - |
| Bachelor's Degree | - | - |
| Graduate Degree | - | - |
| Total | - | - |
Family Income in Cumberland
Family Income Brackets in Cumberland
According to the Cumberland family income data, there are 94 families falling into the $50,000 to $74,999 income range, which is the most common income bracket and makes up 17.7% of all families. Conversely, the $200,000+ income bracket is the least frequent group with only 6 families (1.1%) belonging to this category.
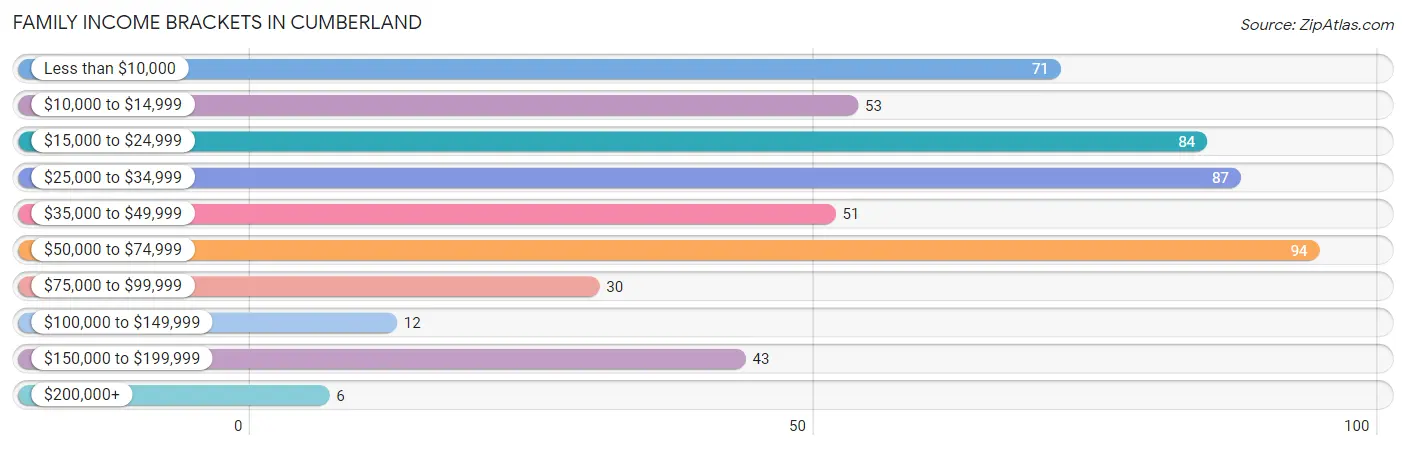
| Income Bracket | # Families | % Families |
| Less than $10,000 | 71 | 13.4% |
| $10,000 to $14,999 | 53 | 10.0% |
| $15,000 to $24,999 | 84 | 15.8% |
| $25,000 to $34,999 | 87 | 16.4% |
| $35,000 to $49,999 | 51 | 9.6% |
| $50,000 to $74,999 | 94 | 17.7% |
| $75,000 to $99,999 | 30 | 5.6% |
| $100,000 to $149,999 | 12 | 2.3% |
| $150,000 to $199,999 | 43 | 8.1% |
| $200,000+ | 6 | 1.1% |
Family Income by Famaliy Size in Cumberland
3-person families (74 | 13.9%) account for the highest median family income in Cumberland with $52,143 per family, while 2-person families (227 | 42.7%) have the highest median income of $18,812 per family member.
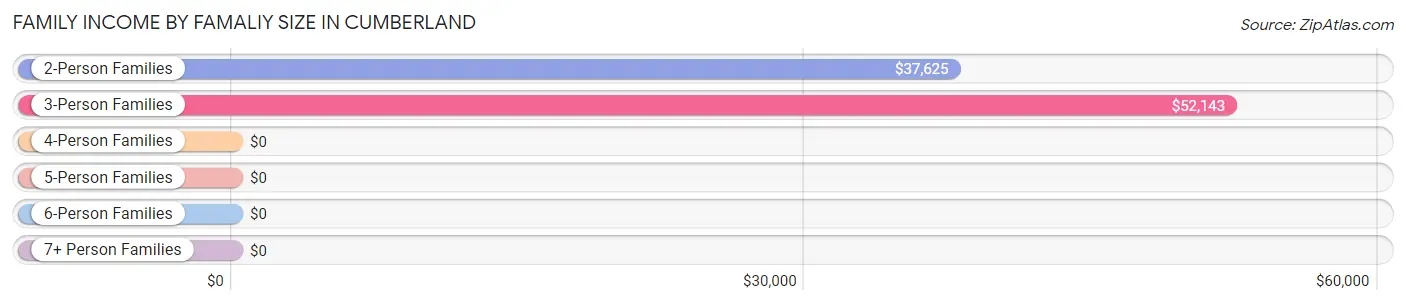
| Income Bracket | # Families | Median Income |
| 2-Person Families | 227 (42.7%) | $37,625 |
| 3-Person Families | 74 (13.9%) | $52,143 |
| 4-Person Families | 88 (16.6%) | $0 |
| 5-Person Families | 54 (10.2%) | $0 |
| 6-Person Families | 82 (15.4%) | $0 |
| 7+ Person Families | 6 (1.1%) | $0 |
| Total | 531 (100.0%) | $34,101 |
Family Income by Number of Earners in Cumberland
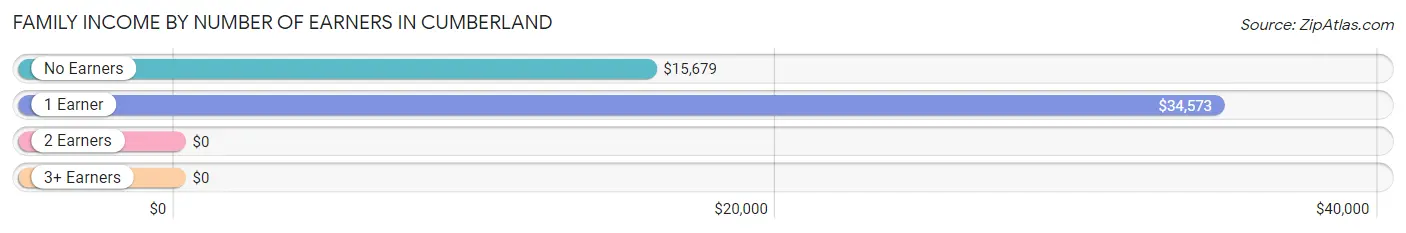
| Number of Earners | # Families | Median Income |
| No Earners | 227 (42.7%) | $15,679 |
| 1 Earner | 178 (33.5%) | $34,573 |
| 2 Earners | 119 (22.4%) | $0 |
| 3+ Earners | 7 (1.3%) | $0 |
| Total | 531 (100.0%) | $34,101 |
Household Income in Cumberland
Household Income Brackets in Cumberland
With 189 households falling in the category, the $15,000 to $24,999 income range is the most frequent in Cumberland, accounting for 22.8% of all households. In contrast, only 6 households (0.7%) fall into the $200,000+ income bracket, making it the least populous group.
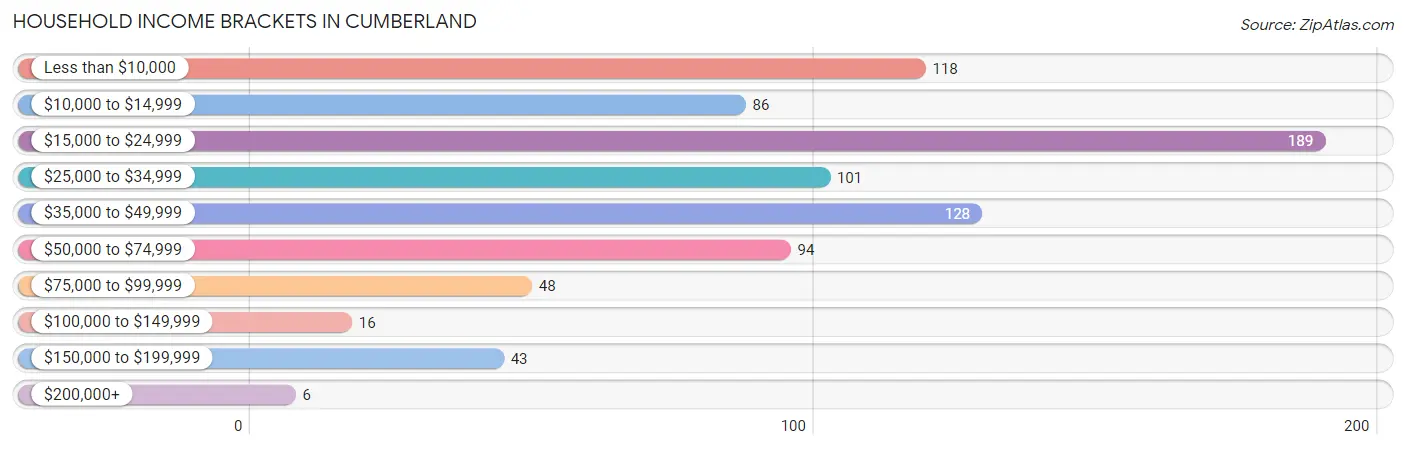
| Income Bracket | # Households | % Households |
| Less than $10,000 | 118 | 14.2% |
| $10,000 to $14,999 | 86 | 10.4% |
| $15,000 to $24,999 | 189 | 22.8% |
| $25,000 to $34,999 | 101 | 12.2% |
| $35,000 to $49,999 | 128 | 15.4% |
| $50,000 to $74,999 | 94 | 11.3% |
| $75,000 to $99,999 | 48 | 5.8% |
| $100,000 to $149,999 | 16 | 1.9% |
| $150,000 to $199,999 | 43 | 5.2% |
| $200,000+ | 6 | 0.7% |
Household Income by Householder Age in Cumberland
The median household income in Cumberland is $32,716, with the highest median household income of $36,452 found in the 65+ years age bracket for the primary householder. A total of 256 households (30.9%) fall into this category. Meanwhile, the 15 to 24 years age bracket for the primary householder has the lowest median household income of $0, with 36 households (4.3%) in this group.
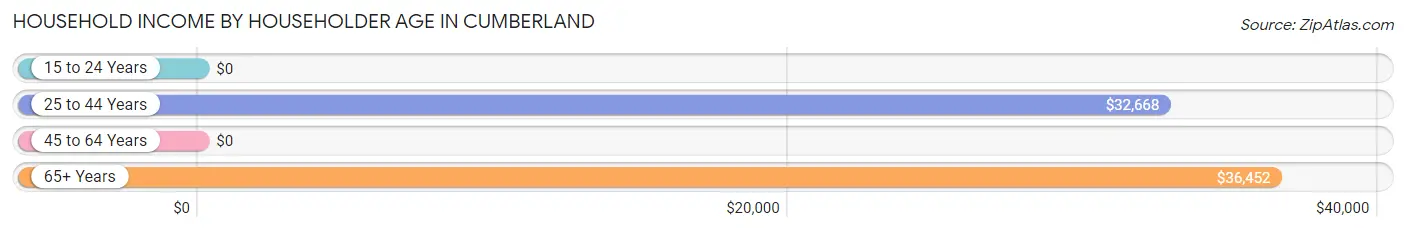
| Income Bracket | # Households | Median Income |
| 15 to 24 Years | 36 (4.3%) | $0 |
| 25 to 44 Years | 319 (38.5%) | $32,668 |
| 45 to 64 Years | 218 (26.3%) | $0 |
| 65+ Years | 256 (30.9%) | $36,452 |
| Total | 829 (100.0%) | $32,716 |
Poverty in Cumberland
Income Below Poverty by Sex and Age in Cumberland
With 54.2% poverty level for males and 64.1% for females among the residents of Cumberland, 12 to 14 year old males and 15 year old females are the most vulnerable to poverty, with 26 males (100.0%) and 19 females (100.0%) in their respective age groups living below the poverty level.
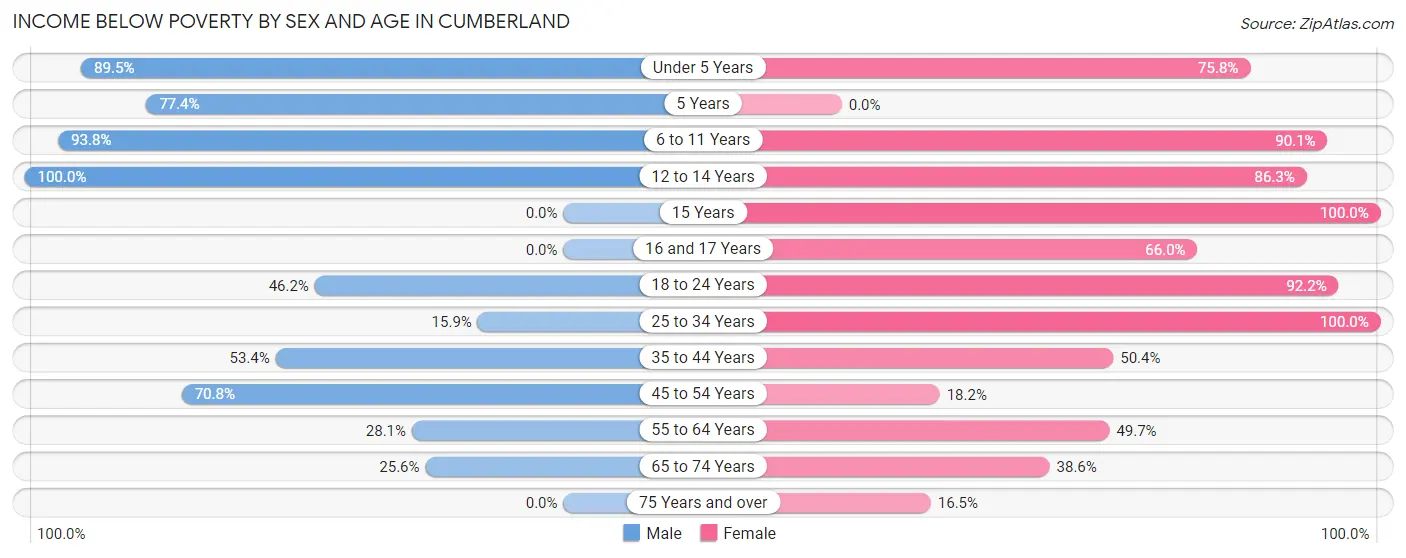
| Age Bracket | Male | Female |
| Under 5 Years | 162 (89.5%) | 72 (75.8%) |
| 5 Years | 24 (77.4%) | 0 (0.0%) |
| 6 to 11 Years | 136 (93.8%) | 210 (90.1%) |
| 12 to 14 Years | 26 (100.0%) | 44 (86.3%) |
| 15 Years | 0 (0.0%) | 19 (100.0%) |
| 16 and 17 Years | 0 (0.0%) | 33 (66.0%) |
| 18 to 24 Years | 18 (46.2%) | 59 (92.2%) |
| 25 to 34 Years | 21 (15.9%) | 166 (100.0%) |
| 35 to 44 Years | 78 (53.4%) | 65 (50.4%) |
| 45 to 54 Years | 34 (70.8%) | 14 (18.2%) |
| 55 to 64 Years | 27 (28.1%) | 78 (49.7%) |
| 65 to 74 Years | 21 (25.6%) | 54 (38.6%) |
| 75 Years and over | 0 (0.0%) | 20 (16.5%) |
| Total | 547 (54.2%) | 834 (64.1%) |
Income Above Poverty by Sex and Age in Cumberland
According to the poverty statistics in Cumberland, males aged 15 years and females aged 75 years and over are the age groups that are most secure financially, with 100.0% of males and 83.5% of females in these age groups living above the poverty line.
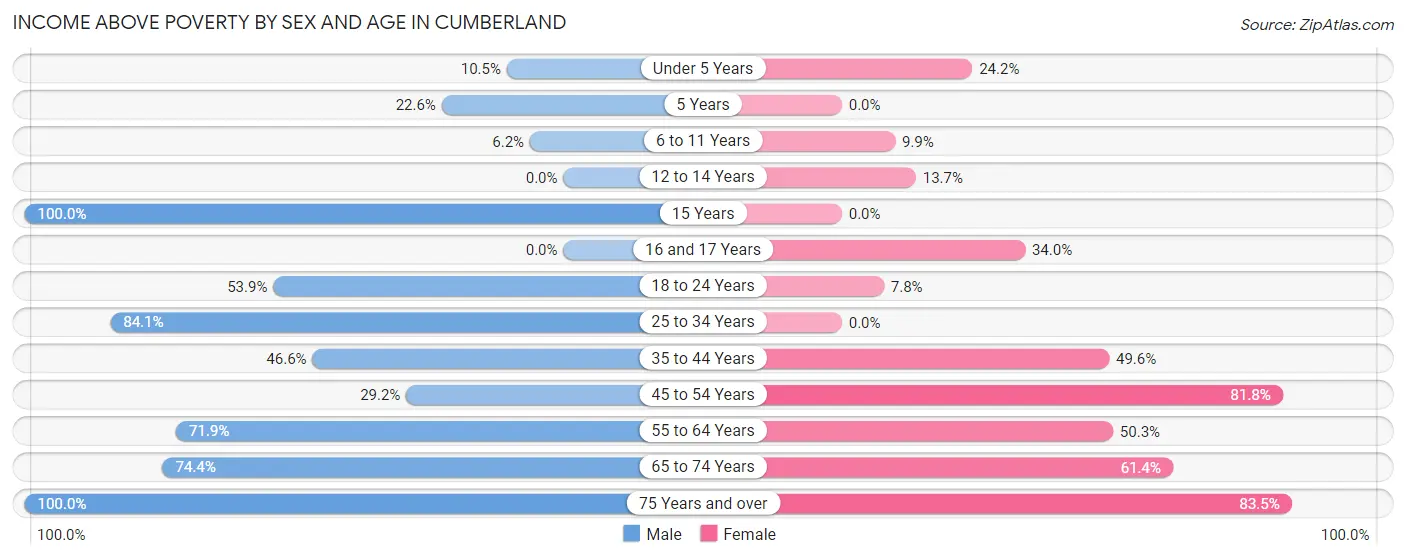
| Age Bracket | Male | Female |
| Under 5 Years | 19 (10.5%) | 23 (24.2%) |
| 5 Years | 7 (22.6%) | 0 (0.0%) |
| 6 to 11 Years | 9 (6.2%) | 23 (9.9%) |
| 12 to 14 Years | 0 (0.0%) | 7 (13.7%) |
| 15 Years | 11 (100.0%) | 0 (0.0%) |
| 16 and 17 Years | 0 (0.0%) | 17 (34.0%) |
| 18 to 24 Years | 21 (53.8%) | 5 (7.8%) |
| 25 to 34 Years | 111 (84.1%) | 0 (0.0%) |
| 35 to 44 Years | 68 (46.6%) | 64 (49.6%) |
| 45 to 54 Years | 14 (29.2%) | 63 (81.8%) |
| 55 to 64 Years | 69 (71.9%) | 79 (50.3%) |
| 65 to 74 Years | 61 (74.4%) | 86 (61.4%) |
| 75 Years and over | 72 (100.0%) | 101 (83.5%) |
| Total | 462 (45.8%) | 468 (35.9%) |
Income Below Poverty Among Married-Couple Families in Cumberland
The poverty statistics for married-couple families in Cumberland show that 41.6% or 147 of the total 353 families live below the poverty line. Families with 3 or 4 children have the highest poverty rate of 93.4%, comprising of 85 families. On the other hand, families with no children have the lowest poverty rate of 16.1%, which includes 27 families.
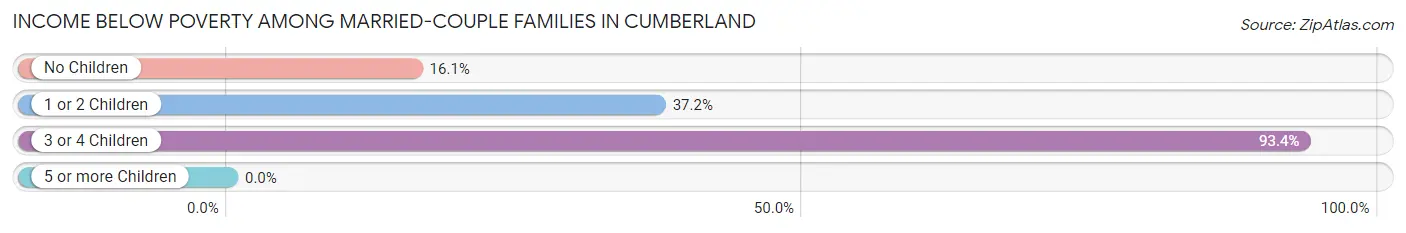
| Children | Above Poverty | Below Poverty |
| No Children | 141 (83.9%) | 27 (16.1%) |
| 1 or 2 Children | 59 (62.8%) | 35 (37.2%) |
| 3 or 4 Children | 6 (6.6%) | 85 (93.4%) |
| 5 or more Children | 0 (0.0%) | 0 (0.0%) |
| Total | 206 (58.4%) | 147 (41.6%) |
Income Below Poverty Among Single-Parent Households in Cumberland
According to the poverty data in Cumberland, 22.2% or 6 single-father households and 90.7% or 137 single-mother households are living below the poverty line. Among single-father households, those with 1 or 2 children have the highest poverty rate, with 6 households (54.5%) experiencing poverty. Likewise, among single-mother households, those with 1 or 2 children have the highest poverty rate, with 35 households (100.0%) falling below the poverty line.
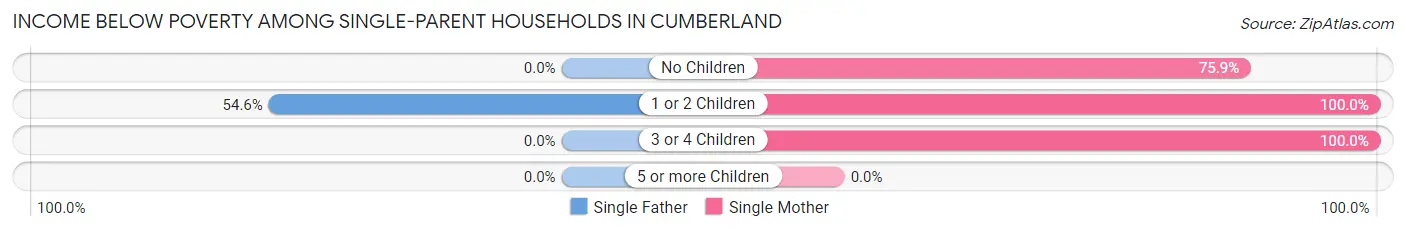
| Children | Single Father | Single Mother |
| No Children | 0 (0.0%) | 44 (75.9%) |
| 1 or 2 Children | 6 (54.5%) | 35 (100.0%) |
| 3 or 4 Children | 0 (0.0%) | 58 (100.0%) |
| 5 or more Children | 0 (0.0%) | 0 (0.0%) |
| Total | 6 (22.2%) | 137 (90.7%) |
Income Below Poverty Among Married-Couple vs Single-Parent Households in Cumberland
The poverty data for Cumberland shows that 147 of the married-couple family households (41.6%) and 143 of the single-parent households (80.3%) are living below the poverty level. Within the married-couple family households, those with 3 or 4 children have the highest poverty rate, with 85 households (93.4%) falling below the poverty line. Among the single-parent households, those with 3 or 4 children have the highest poverty rate, with 58 household (100.0%) living below poverty.
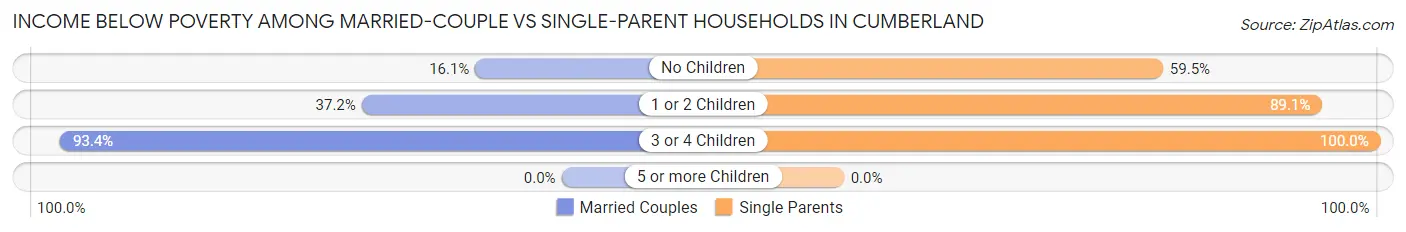
| Children | Married-Couple Families | Single-Parent Households |
| No Children | 27 (16.1%) | 44 (59.5%) |
| 1 or 2 Children | 35 (37.2%) | 41 (89.1%) |
| 3 or 4 Children | 85 (93.4%) | 58 (100.0%) |
| 5 or more Children | 0 (0.0%) | 0 (0.0%) |
| Total | 147 (41.6%) | 143 (80.3%) |
Race in Cumberland
The most populous races in Cumberland are White / Caucasian (2,126 | 88.9%), Two or more Races (198 | 8.3%), and Black / African American (62 | 2.6%).
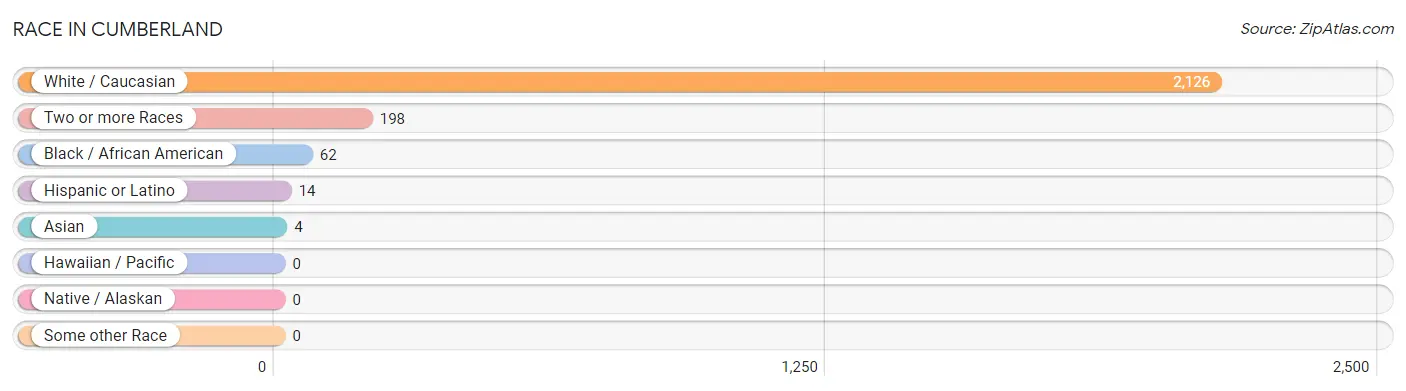
| Race | # Population | % Population |
| Asian | 4 | 0.2% |
| Black / African American | 62 | 2.6% |
| Hawaiian / Pacific | 0 | 0.0% |
| Hispanic or Latino | 14 | 0.6% |
| Native / Alaskan | 0 | 0.0% |
| White / Caucasian | 2,126 | 88.9% |
| Two or more Races | 198 | 8.3% |
| Some other Race | 0 | 0.0% |
| Total | 2,390 | 100.0% |
Ancestry in Cumberland
The most populous ancestries reported in Cumberland are Irish (547 | 22.9%), English (208 | 8.7%), American (175 | 7.3%), Italian (160 | 6.7%), and Polish (126 | 5.3%), together accounting for 50.9% of all Cumberland residents.
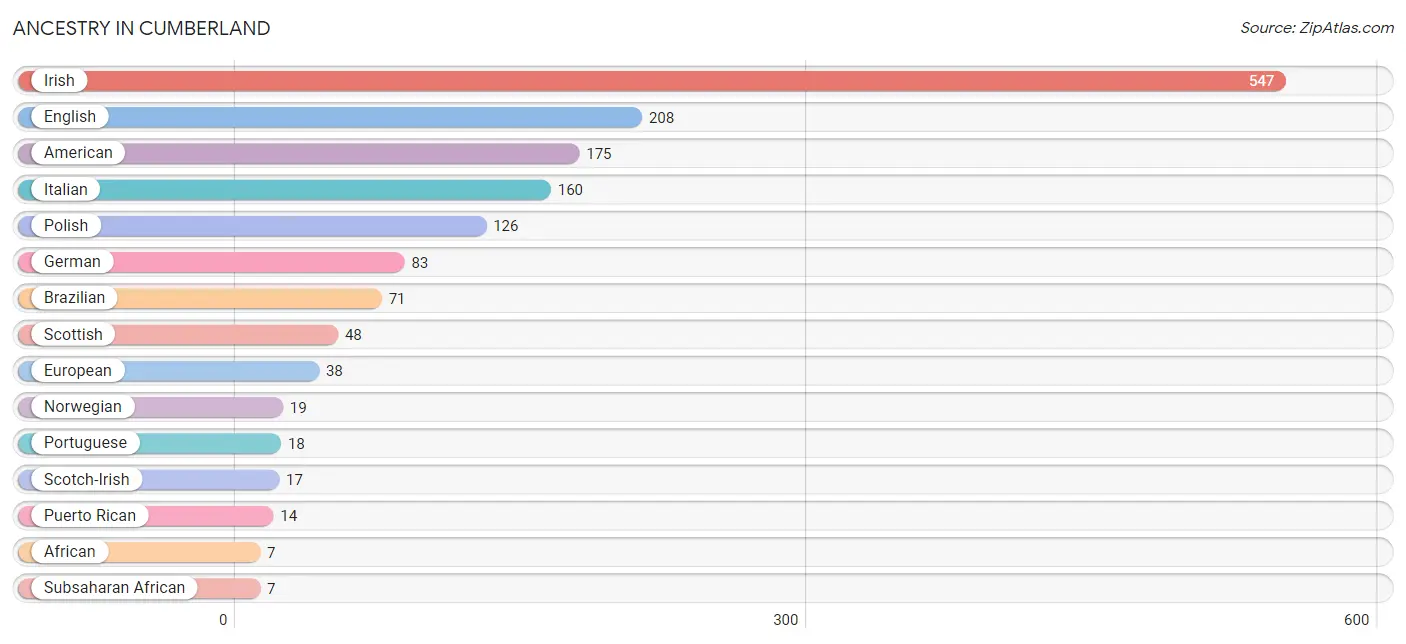
| Ancestry | # Population | % Population |
| African | 7 | 0.3% |
| American | 175 | 7.3% |
| Blackfeet | 5 | 0.2% |
| Brazilian | 71 | 3.0% |
| Choctaw | 3 | 0.1% |
| English | 208 | 8.7% |
| European | 38 | 1.6% |
| German | 83 | 3.5% |
| Irish | 547 | 22.9% |
| Italian | 160 | 6.7% |
| Korean | 4 | 0.2% |
| Norwegian | 19 | 0.8% |
| Polish | 126 | 5.3% |
| Portuguese | 18 | 0.7% |
| Puerto Rican | 14 | 0.6% |
| Scotch-Irish | 17 | 0.7% |
| Scottish | 48 | 2.0% |
| Subsaharan African | 7 | 0.3% | View All 18 Rows |
Immigrants in Cumberland
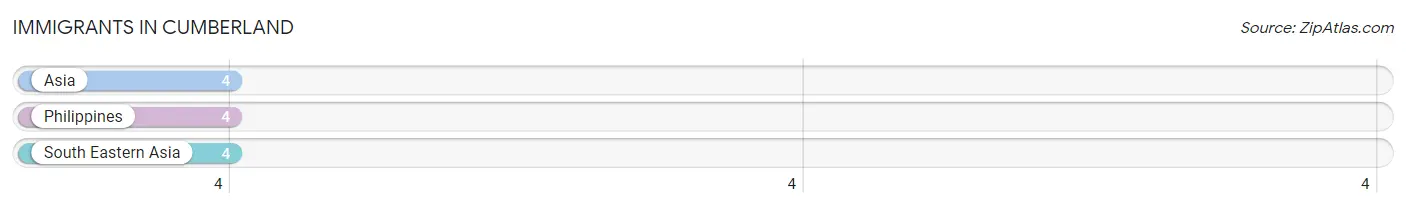
The most numerous immigrant groups reported in Cumberland came from Asia (4 | 0.2%), Philippines (4 | 0.2%), and South Eastern Asia (4 | 0.2%), together accounting for 0.5% of all Cumberland residents.
| Immigration Origin | # Population | % Population |
| Asia | 4 | 0.2% |
| Philippines | 4 | 0.2% |
| South Eastern Asia | 4 | 0.2% | View All 3 Rows |
Sex and Age in Cumberland
Sex and Age in Cumberland
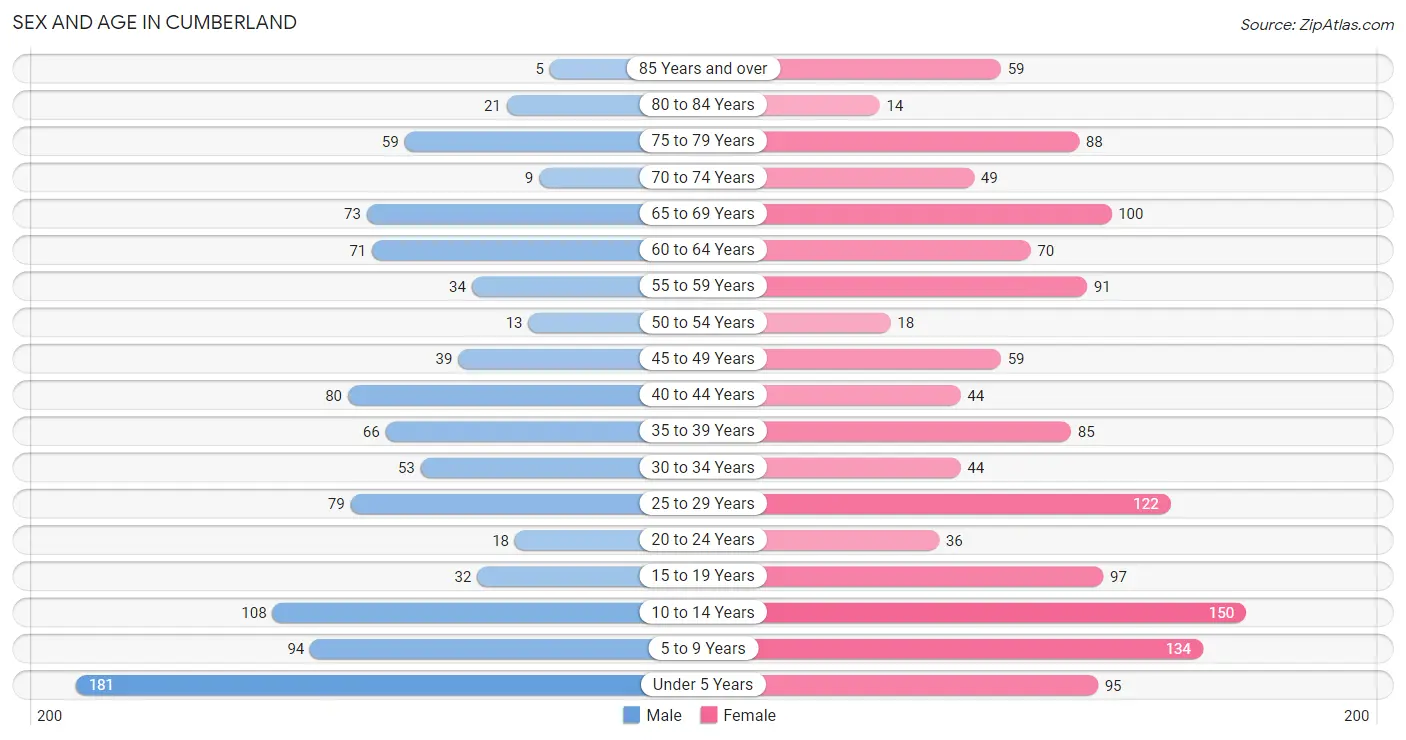
The most populous age groups in Cumberland are Under 5 Years (181 | 17.5%) for men and 10 to 14 Years (150 | 11.1%) for women.
| Age Bracket | Male | Female |
| Under 5 Years | 181 (17.5%) | 95 (7.0%) |
| 5 to 9 Years | 94 (9.1%) | 134 (9.9%) |
| 10 to 14 Years | 108 (10.4%) | 150 (11.1%) |
| 15 to 19 Years | 32 (3.1%) | 97 (7.2%) |
| 20 to 24 Years | 18 (1.7%) | 36 (2.7%) |
| 25 to 29 Years | 79 (7.6%) | 122 (9.0%) |
| 30 to 34 Years | 53 (5.1%) | 44 (3.3%) |
| 35 to 39 Years | 66 (6.4%) | 85 (6.3%) |
| 40 to 44 Years | 80 (7.7%) | 44 (3.3%) |
| 45 to 49 Years | 39 (3.8%) | 59 (4.3%) |
| 50 to 54 Years | 13 (1.3%) | 18 (1.3%) |
| 55 to 59 Years | 34 (3.3%) | 91 (6.7%) |
| 60 to 64 Years | 71 (6.9%) | 70 (5.2%) |
| 65 to 69 Years | 73 (7.0%) | 100 (7.4%) |
| 70 to 74 Years | 9 (0.9%) | 49 (3.6%) |
| 75 to 79 Years | 59 (5.7%) | 88 (6.5%) |
| 80 to 84 Years | 21 (2.0%) | 14 (1.0%) |
| 85 Years and over | 5 (0.5%) | 59 (4.3%) |
| Total | 1,035 (100.0%) | 1,355 (100.0%) |
Families and Households in Cumberland
Median Family Size in Cumberland
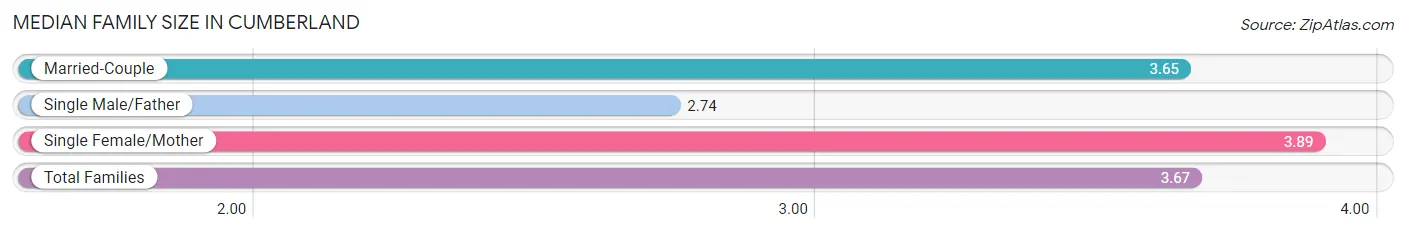
The median family size in Cumberland is 3.67 persons per family, with single female/mother families (151 | 28.4%) accounting for the largest median family size of 3.89 persons per family. On the other hand, single male/father families (27 | 5.1%) represent the smallest median family size with 2.74 persons per family.
| Family Type | # Families | Family Size |
| Married-Couple | 353 (66.5%) | 3.65 |
| Single Male/Father | 27 (5.1%) | 2.74 |
| Single Female/Mother | 151 (28.4%) | 3.89 |
| Total Families | 531 (100.0%) | 3.67 |
Median Household Size in Cumberland
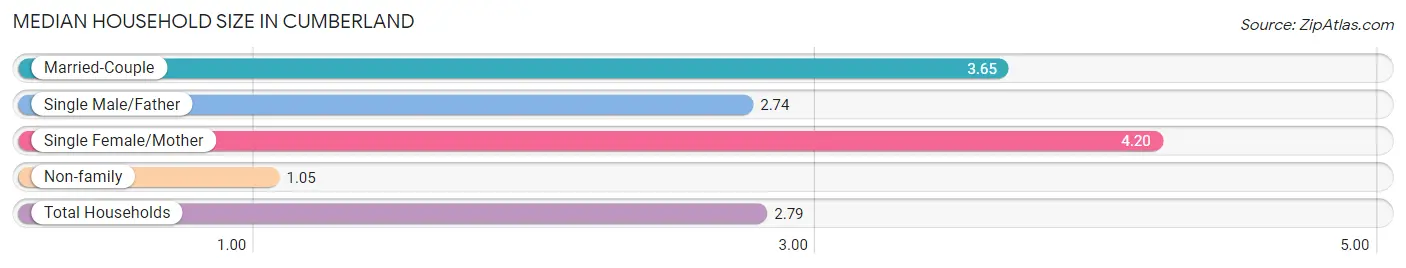
The median household size in Cumberland is 2.79 persons per household, with single female/mother households (151 | 18.2%) accounting for the largest median household size of 4.2 persons per household. non-family households (298 | 35.9%) represent the smallest median household size with 1.05 persons per household.
| Household Type | # Households | Household Size |
| Married-Couple | 353 (42.6%) | 3.65 |
| Single Male/Father | 27 (3.3%) | 2.74 |
| Single Female/Mother | 151 (18.2%) | 4.20 |
| Non-family | 298 (35.9%) | 1.05 |
| Total Households | 829 (100.0%) | 2.79 |
Household Size by Marriage Status in Cumberland
Out of a total of 829 households in Cumberland, 531 (64.0%) are family households, while 298 (35.9%) are nonfamily households. The most numerous type of family households are 2-person households, comprising 221, and the most common type of nonfamily households are 1-person households, comprising 289.
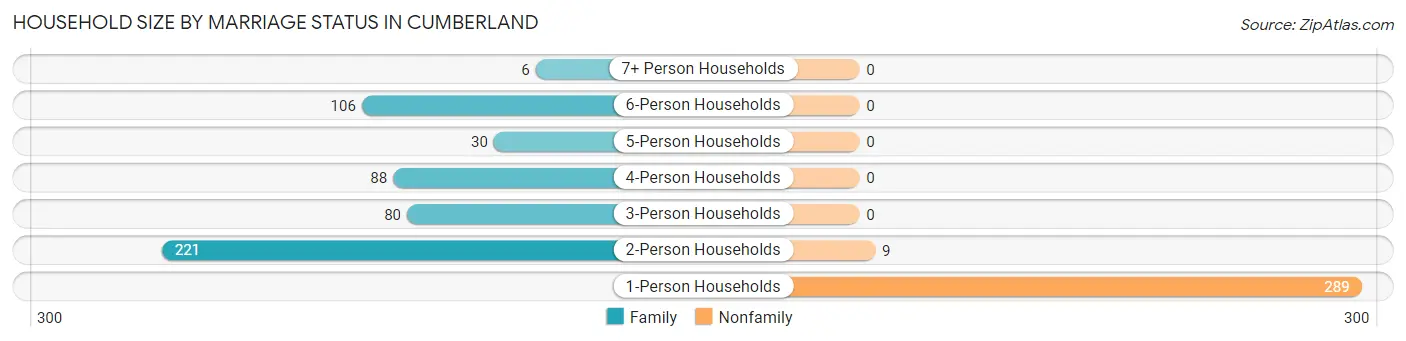
| Household Size | Family Households | Nonfamily Households |
| 1-Person Households | - | 289 (34.9%) |
| 2-Person Households | 221 (26.7%) | 9 (1.1%) |
| 3-Person Households | 80 (9.7%) | 0 (0.0%) |
| 4-Person Households | 88 (10.6%) | 0 (0.0%) |
| 5-Person Households | 30 (3.6%) | 0 (0.0%) |
| 6-Person Households | 106 (12.8%) | 0 (0.0%) |
| 7+ Person Households | 6 (0.7%) | 0 (0.0%) |
| Total | 531 (64.0%) | 298 (35.9%) |
Female Fertility in Cumberland
Fertility by Age in Cumberland
| Age Bracket | Women with Births | Births / 1,000 Women |
| 15 to 19 years | 0 (0.0%) | 0.0 |
| 20 to 34 years | 0 (0.0%) | 0.0 |
| 35 to 50 years | 0 (0.0%) | 0.0 |
| Total | 0 (0.0%) | 0.0 |
Fertility by Age by Marriage Status in Cumberland
| Age Bracket | Married | Unmarried |
| 15 to 19 years | 0 (0.0%) | 0 (0.0%) |
| 20 to 34 years | 0 (0.0%) | 0 (0.0%) |
| 35 to 50 years | 0 (0.0%) | 0 (0.0%) |
| Total | 0 (0.0%) | 0 (0.0%) |
Fertility by Education in Cumberland
| Educational Attainment | Women with Births | Births / 1,000 Women |
| Less than High School | 0 (0.0%) | 0.0 |
| High School Diploma | 0 (0.0%) | 0.0 |
| College or Associate's Degree | 0 (0.0%) | 0.0 |
| Bachelor's Degree | 0 (0.0%) | 0.0 |
| Graduate Degree | 0 (0.0%) | 0.0 |
| Total | 0 (0.0%) | 0.0 |
Fertility by Education by Marriage Status in Cumberland
| Educational Attainment | Married | Unmarried |
| Less than High School | 0 (0.0%) | 0 (0.0%) |
| High School Diploma | 0 (0.0%) | 0 (0.0%) |
| College or Associate's Degree | 0 (0.0%) | 0 (0.0%) |
| Bachelor's Degree | 0 (0.0%) | 0 (0.0%) |
| Graduate Degree | 0 (0.0%) | 0 (0.0%) |
| Total | 0 (0.0%) | 0 (0.0%) |
Employment Characteristics in Cumberland
Employment by Class of Employer in Cumberland
Among the 329 employed individuals in Cumberland, private company employees (200 | 60.8%), not-for-profit organizations (45 | 13.7%), and local government employees (29 | 8.8%) make up the most common classes of employment.
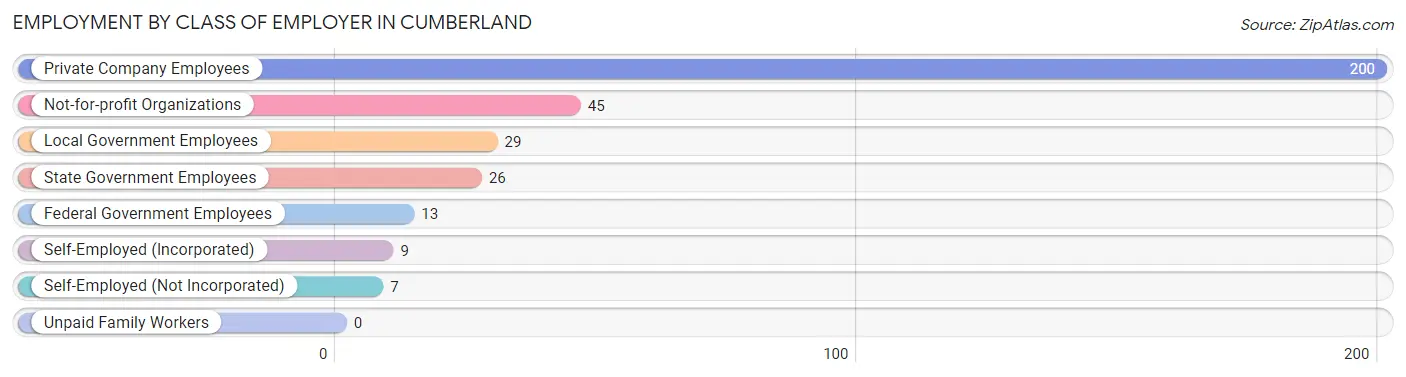
| Employer Class | # Employees | % Employees |
| Private Company Employees | 200 | 60.8% |
| Self-Employed (Incorporated) | 9 | 2.7% |
| Self-Employed (Not Incorporated) | 7 | 2.1% |
| Not-for-profit Organizations | 45 | 13.7% |
| Local Government Employees | 29 | 8.8% |
| State Government Employees | 26 | 7.9% |
| Federal Government Employees | 13 | 4.0% |
| Unpaid Family Workers | 0 | 0.0% |
| Total | 329 | 100.0% |
Employment Status by Age in Cumberland
According to the labor force statistics for Cumberland, out of the total population over 16 years of age (1,598), 37.0% or 591 individuals are in the labor force, with 42.5% or 251 of them unemployed. The age group with the highest labor force participation rate is 20 to 24 years, with 90.7% or 49 individuals in the labor force. Within the labor force, the 25 to 29 years age range has the highest percentage of unemployed individuals, with 77.0% or 47 of them being unemployed.
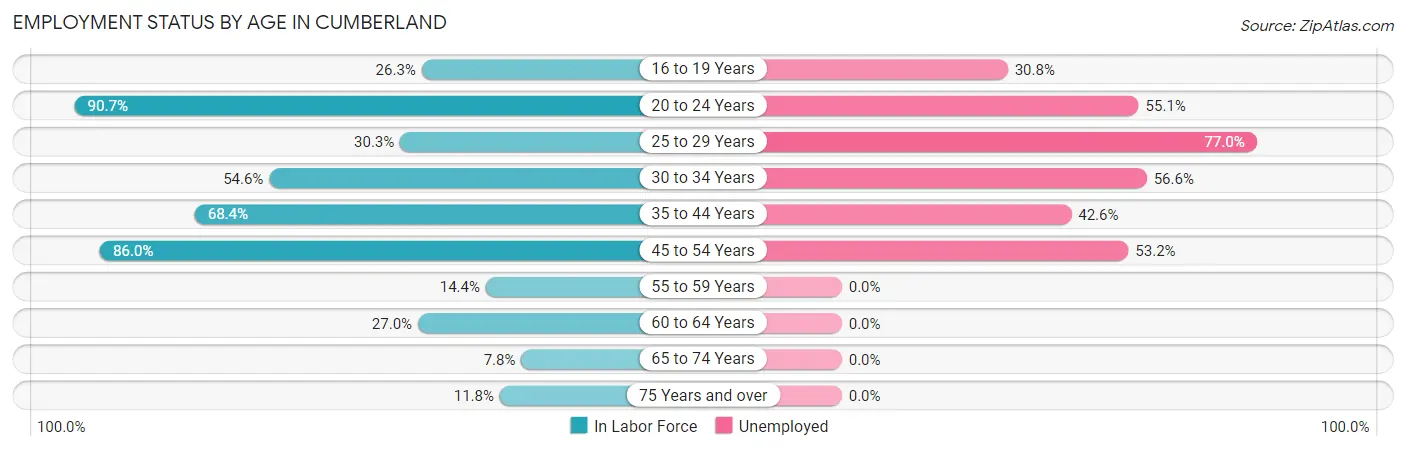
| Age Bracket | In Labor Force | Unemployed |
| 16 to 19 Years | 26 (26.3%) | 8 (30.8%) |
| 20 to 24 Years | 49 (90.7%) | 27 (55.1%) |
| 25 to 29 Years | 61 (30.3%) | 47 (77.0%) |
| 30 to 34 Years | 53 (54.6%) | 30 (56.6%) |
| 35 to 44 Years | 188 (68.4%) | 80 (42.6%) |
| 45 to 54 Years | 111 (86.0%) | 59 (53.2%) |
| 55 to 59 Years | 18 (14.4%) | 0 (0.0%) |
| 60 to 64 Years | 38 (27.0%) | 0 (0.0%) |
| 65 to 74 Years | 18 (7.8%) | 0 (0.0%) |
| 75 Years and over | 29 (11.8%) | 0 (0.0%) |
| Total | 591 (37.0%) | 251 (42.5%) |
Employment Status by Educational Attainment in Cumberland
According to labor force statistics for Cumberland, 48.5% of individuals (469) out of the total population between 25 and 64 years of age (968) are in the labor force, with 46.1% or 216 of them being unemployed. The group with the highest labor force participation rate are those with the educational attainment of bachelor's degree or higher, with 84.2% or 101 individuals in the labor force. Within the labor force, individuals with less than high school education have the highest percentage of unemployment, with 81.6% or 62 of them being unemployed.
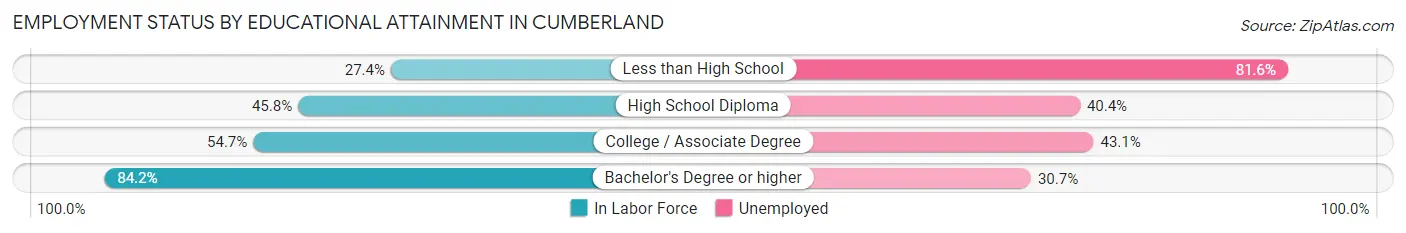
| Educational Attainment | In Labor Force | Unemployed |
| Less than High School | 76 (27.4%) | 226 (81.6%) |
| High School Diploma | 104 (45.8%) | 92 (40.4%) |
| College / Associate Degree | 188 (54.7%) | 148 (43.1%) |
| Bachelor's Degree or higher | 101 (84.2%) | 37 (30.7%) |
| Total | 469 (48.5%) | 446 (46.1%) |
Employment Occupations by Sex in Cumberland
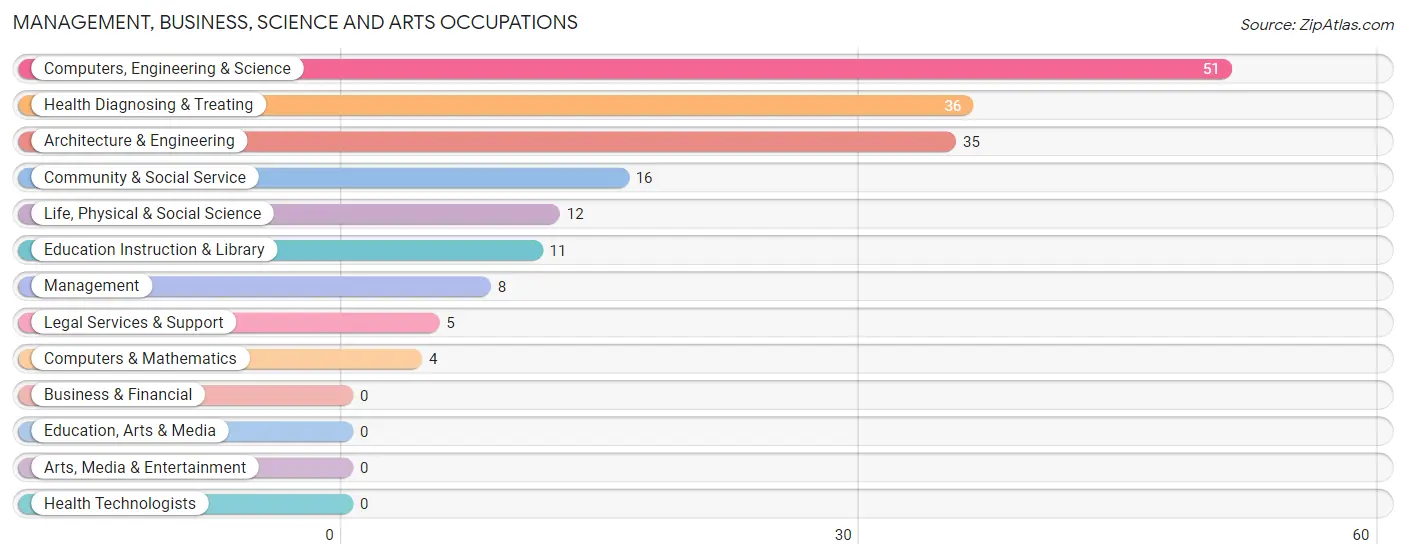
Management, Business, Science and Arts Occupations
The most common Management, Business, Science and Arts occupations in Cumberland are Computers, Engineering & Science (51 | 15.0%), Health Diagnosing & Treating (36 | 10.6%), Architecture & Engineering (35 | 10.3%), Community & Social Service (16 | 4.7%), and Life, Physical & Social Science (12 | 3.5%).
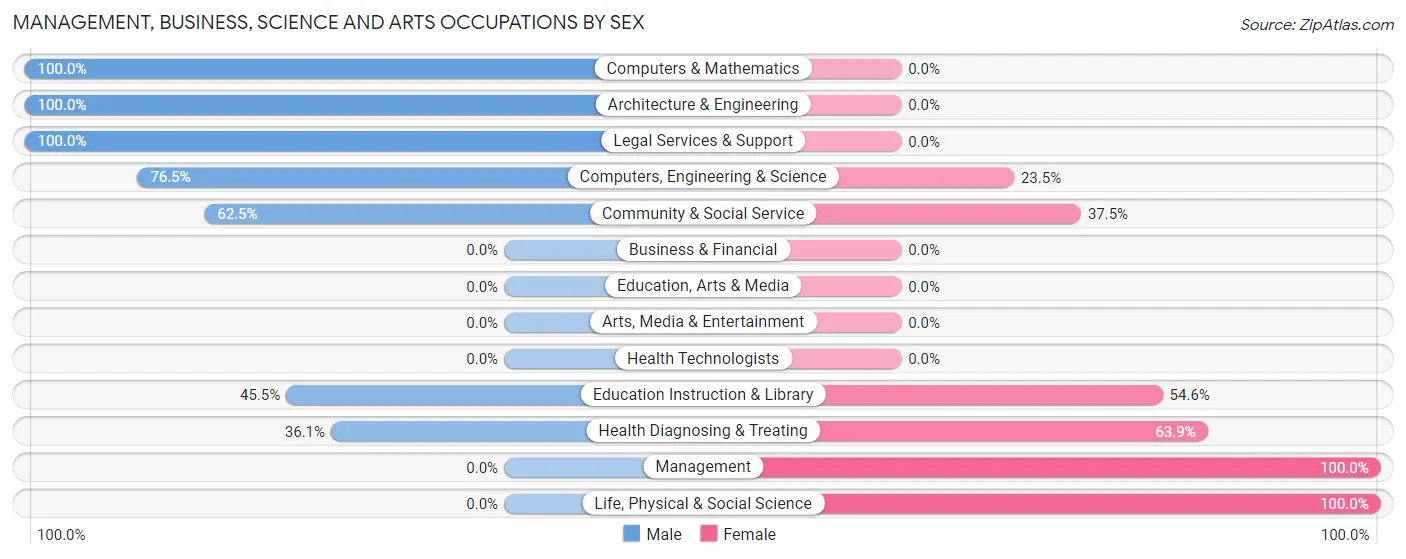
Management, Business, Science and Arts Occupations by Sex
Within the Management, Business, Science and Arts occupations in Cumberland, the most male-oriented occupations are Computers & Mathematics (100.0%), Architecture & Engineering (100.0%), and Legal Services & Support (100.0%), while the most female-oriented occupations are Management (100.0%), Life, Physical & Social Science (100.0%), and Health Diagnosing & Treating (63.9%).
| Occupation | Male | Female |
| Management | 0 (0.0%) | 8 (100.0%) |
| Business & Financial | 0 (0.0%) | 0 (0.0%) |
| Computers, Engineering & Science | 39 (76.5%) | 12 (23.5%) |
| Computers & Mathematics | 4 (100.0%) | 0 (0.0%) |
| Architecture & Engineering | 35 (100.0%) | 0 (0.0%) |
| Life, Physical & Social Science | 0 (0.0%) | 12 (100.0%) |
| Community & Social Service | 10 (62.5%) | 6 (37.5%) |
| Education, Arts & Media | 0 (0.0%) | 0 (0.0%) |
| Legal Services & Support | 5 (100.0%) | 0 (0.0%) |
| Education Instruction & Library | 5 (45.5%) | 6 (54.5%) |
| Arts, Media & Entertainment | 0 (0.0%) | 0 (0.0%) |
| Health Diagnosing & Treating | 13 (36.1%) | 23 (63.9%) |
| Health Technologists | 0 (0.0%) | 0 (0.0%) |
| Total (Category) | 62 (55.9%) | 49 (44.1%) |
| Total (Overall) | 181 (53.2%) | 159 (46.8%) |
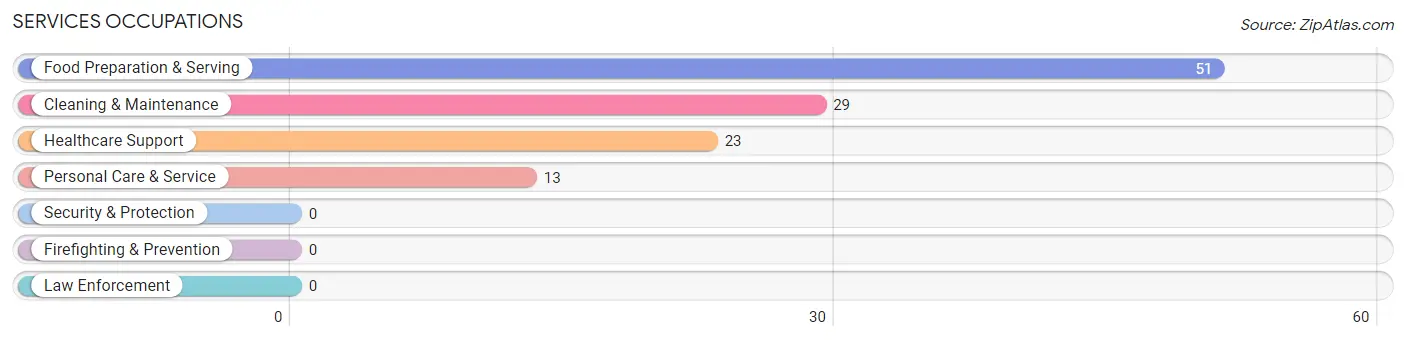
Services Occupations
The most common Services occupations in Cumberland are Food Preparation & Serving (51 | 15.0%), Cleaning & Maintenance (29 | 8.5%), Healthcare Support (23 | 6.8%), and Personal Care & Service (13 | 3.8%).
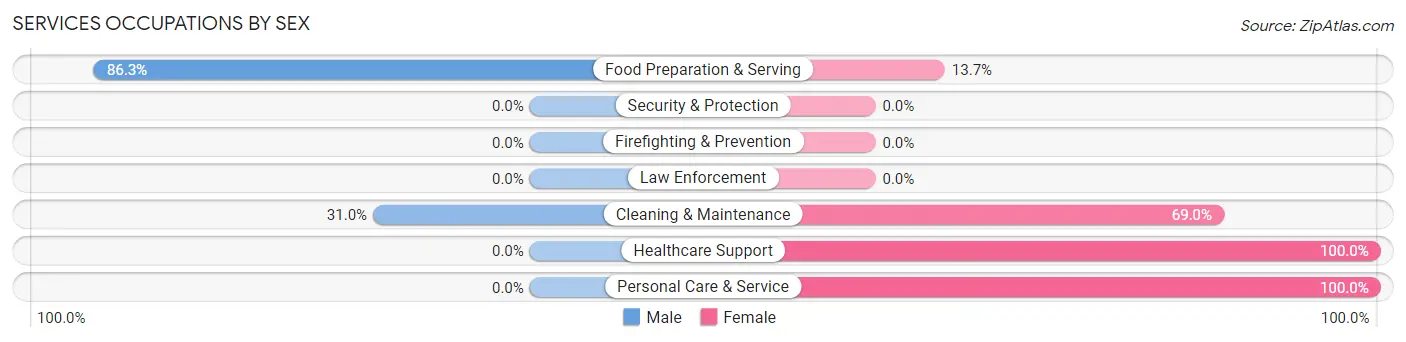
Services Occupations by Sex
Within the Services occupations in Cumberland, the most male-oriented occupations are Food Preparation & Serving (86.3%), and Cleaning & Maintenance (31.0%), while the most female-oriented occupations are Healthcare Support (100.0%), Personal Care & Service (100.0%), and Cleaning & Maintenance (69.0%).
| Occupation | Male | Female |
| Healthcare Support | 0 (0.0%) | 23 (100.0%) |
| Security & Protection | 0 (0.0%) | 0 (0.0%) |
| Firefighting & Prevention | 0 (0.0%) | 0 (0.0%) |
| Law Enforcement | 0 (0.0%) | 0 (0.0%) |
| Food Preparation & Serving | 44 (86.3%) | 7 (13.7%) |
| Cleaning & Maintenance | 9 (31.0%) | 20 (69.0%) |
| Personal Care & Service | 0 (0.0%) | 13 (100.0%) |
| Total (Category) | 53 (45.7%) | 63 (54.3%) |
| Total (Overall) | 181 (53.2%) | 159 (46.8%) |
Sales and Office Occupations
The most common Sales and Office occupations in Cumberland are Sales & Related (41 | 12.1%), and Office & Administration (13 | 3.8%).
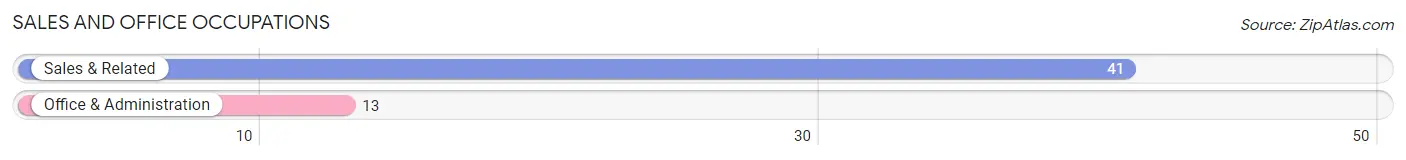
Sales and Office Occupations by Sex
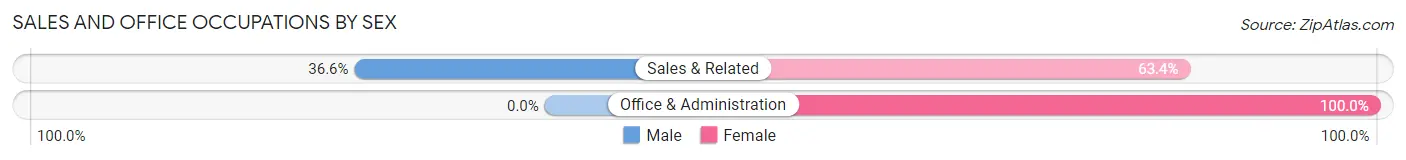
| Occupation | Male | Female |
| Sales & Related | 15 (36.6%) | 26 (63.4%) |
| Office & Administration | 0 (0.0%) | 13 (100.0%) |
| Total (Category) | 15 (27.8%) | 39 (72.2%) |
| Total (Overall) | 181 (53.2%) | 159 (46.8%) |
Natural Resources, Construction and Maintenance Occupations
The most common Natural Resources, Construction and Maintenance occupations in Cumberland are Construction & Extraction (28 | 8.2%), and Installation, Maintenance & Repair (5 | 1.5%).
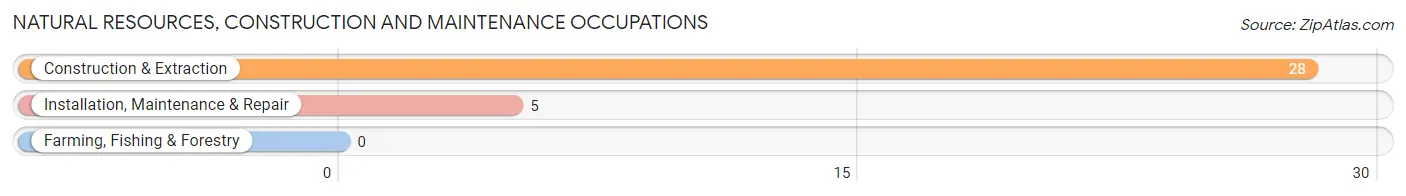
Natural Resources, Construction and Maintenance Occupations by Sex
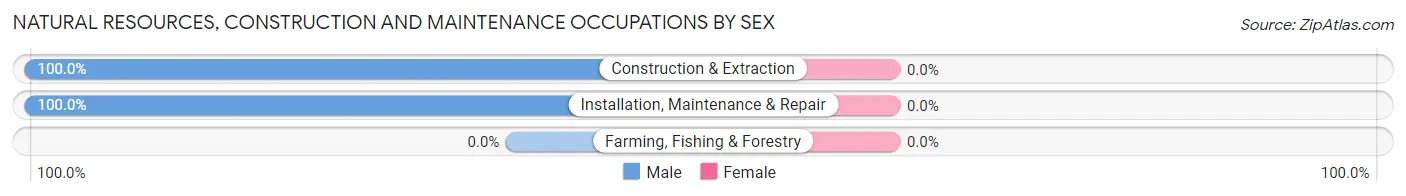
| Occupation | Male | Female |
| Farming, Fishing & Forestry | 0 (0.0%) | 0 (0.0%) |
| Construction & Extraction | 28 (100.0%) | 0 (0.0%) |
| Installation, Maintenance & Repair | 5 (100.0%) | 0 (0.0%) |
| Total (Category) | 33 (100.0%) | 0 (0.0%) |
| Total (Overall) | 181 (53.2%) | 159 (46.8%) |
Production, Transportation and Moving Occupations
The most common Production, Transportation and Moving occupations in Cumberland are , and Production (26 | 7.6%).
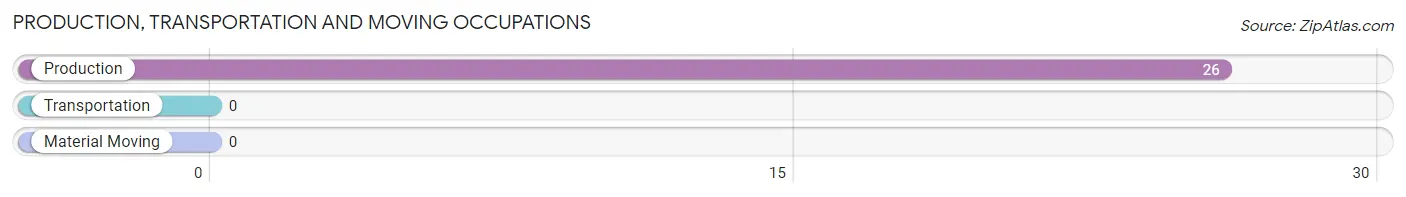
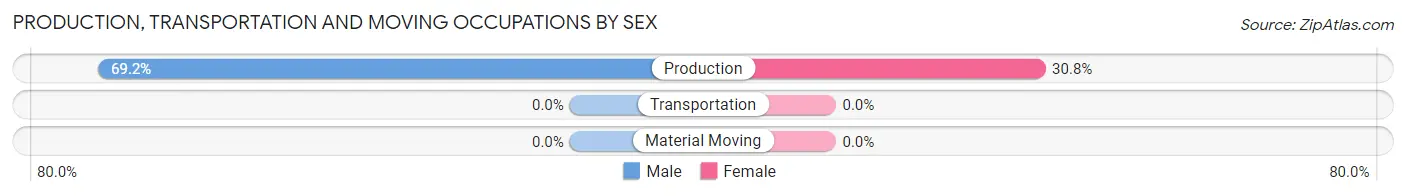
Production, Transportation and Moving Occupations by Sex
| Occupation | Male | Female |
| Production | 18 (69.2%) | 8 (30.8%) |
| Transportation | 0 (0.0%) | 0 (0.0%) |
| Material Moving | 0 (0.0%) | 0 (0.0%) |
| Total (Category) | 18 (69.2%) | 8 (30.8%) |
| Total (Overall) | 181 (53.2%) | 159 (46.8%) |
Employment Industries by Sex in Cumberland
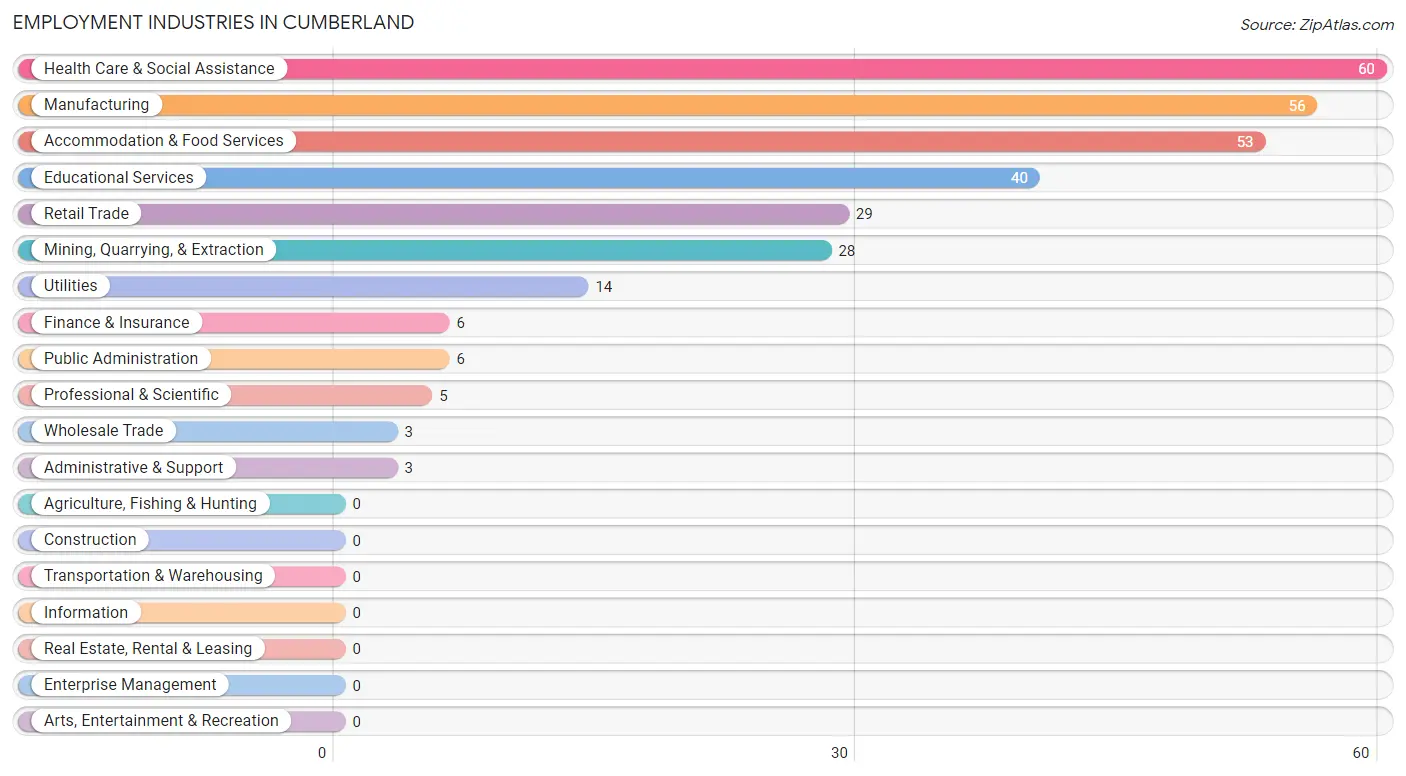
Employment Industries in Cumberland
The major employment industries in Cumberland include Health Care & Social Assistance (60 | 17.6%), Manufacturing (56 | 16.5%), Accommodation & Food Services (53 | 15.6%), Educational Services (40 | 11.8%), and Retail Trade (29 | 8.5%).
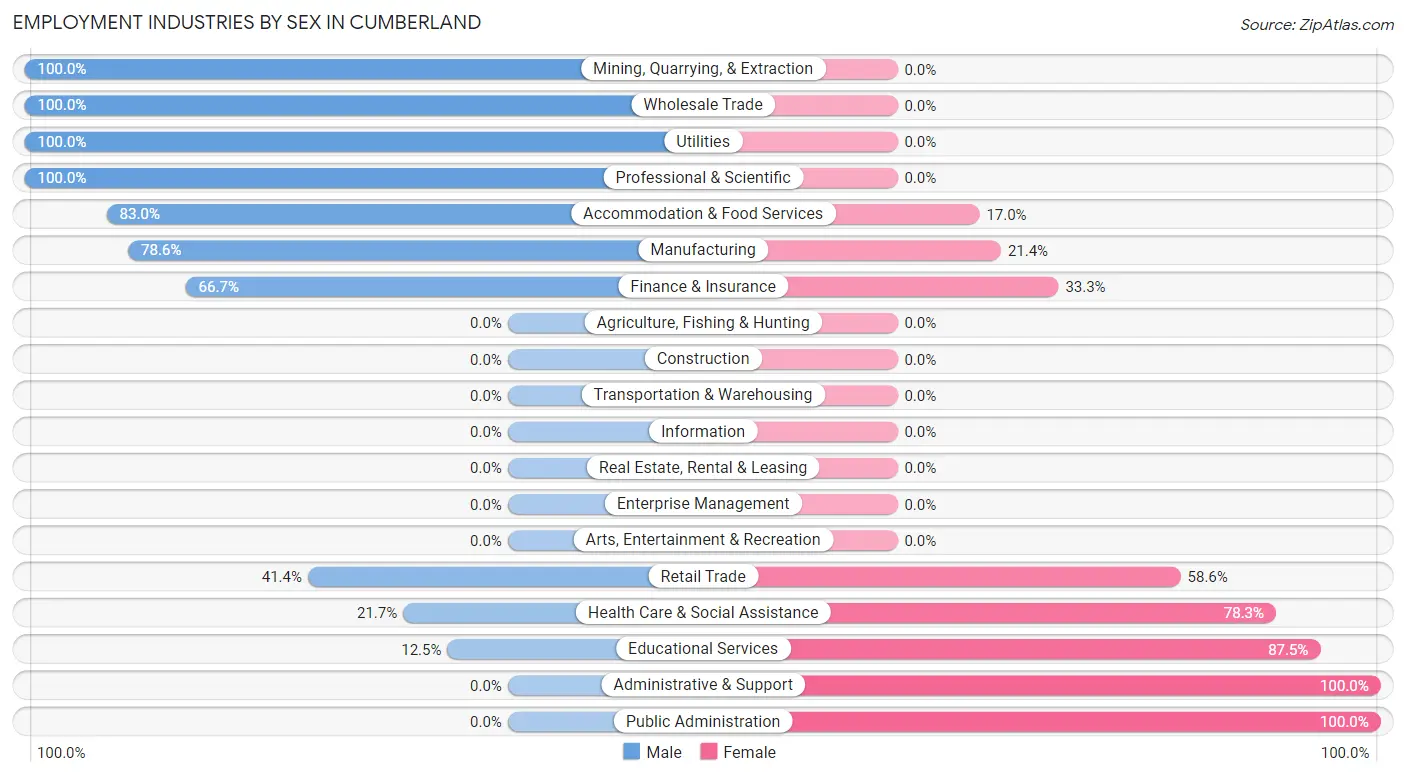
Employment Industries by Sex in Cumberland
The Cumberland industries that see more men than women are Mining, Quarrying, & Extraction (100.0%), Wholesale Trade (100.0%), and Utilities (100.0%), whereas the industries that tend to have a higher number of women are Administrative & Support (100.0%), Public Administration (100.0%), and Educational Services (87.5%).
| Industry | Male | Female |
| Agriculture, Fishing & Hunting | 0 (0.0%) | 0 (0.0%) |
| Mining, Quarrying, & Extraction | 28 (100.0%) | 0 (0.0%) |
| Construction | 0 (0.0%) | 0 (0.0%) |
| Manufacturing | 44 (78.6%) | 12 (21.4%) |
| Wholesale Trade | 3 (100.0%) | 0 (0.0%) |
| Retail Trade | 12 (41.4%) | 17 (58.6%) |
| Transportation & Warehousing | 0 (0.0%) | 0 (0.0%) |
| Utilities | 14 (100.0%) | 0 (0.0%) |
| Information | 0 (0.0%) | 0 (0.0%) |
| Finance & Insurance | 4 (66.7%) | 2 (33.3%) |
| Real Estate, Rental & Leasing | 0 (0.0%) | 0 (0.0%) |
| Professional & Scientific | 5 (100.0%) | 0 (0.0%) |
| Enterprise Management | 0 (0.0%) | 0 (0.0%) |
| Administrative & Support | 0 (0.0%) | 3 (100.0%) |
| Educational Services | 5 (12.5%) | 35 (87.5%) |
| Health Care & Social Assistance | 13 (21.7%) | 47 (78.3%) |
| Arts, Entertainment & Recreation | 0 (0.0%) | 0 (0.0%) |
| Accommodation & Food Services | 44 (83.0%) | 9 (17.0%) |
| Public Administration | 0 (0.0%) | 6 (100.0%) |
| Total | 181 (53.2%) | 159 (46.8%) |
Education in Cumberland
School Enrollment in Cumberland
The most common levels of schooling among the 618 students in Cumberland are middle school (275 | 44.5%), elementary school (186 | 30.1%), and high school (75 | 12.1%).
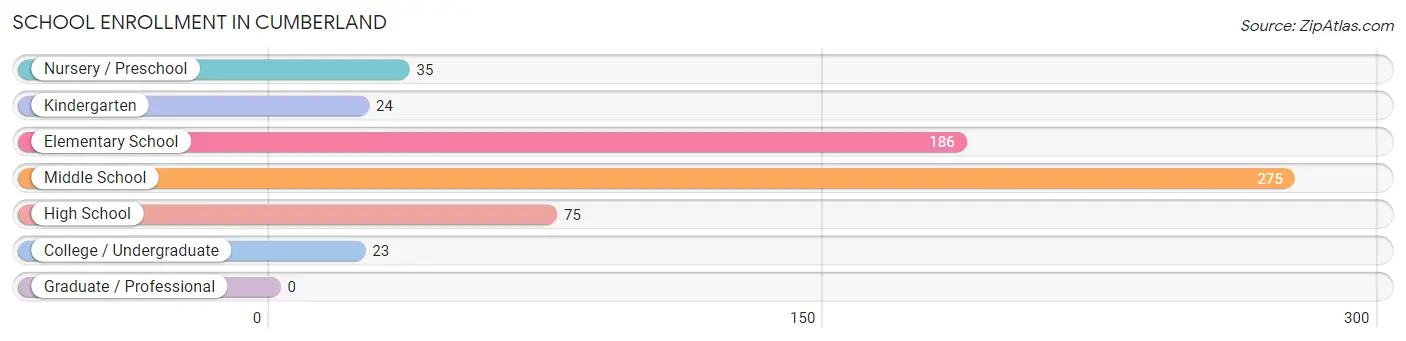
| School Level | # Students | % Students |
| Nursery / Preschool | 35 | 5.7% |
| Kindergarten | 24 | 3.9% |
| Elementary School | 186 | 30.1% |
| Middle School | 275 | 44.5% |
| High School | 75 | 12.1% |
| College / Undergraduate | 23 | 3.7% |
| Graduate / Professional | 0 | 0.0% |
| Total | 618 | 100.0% |
School Enrollment by Age by Funding Source in Cumberland
Out of a total of 618 students who are enrolled in schools in Cumberland, 58 (9.4%) attend a private institution, while the remaining 560 (90.6%) are enrolled in public schools. The age group of 3 to 4 year olds has the highest likelihood of being enrolled in private schools, with 21 (60.0% in the age bracket) enrolled. Conversely, the age group of 5 to 9 year old has the lowest likelihood of being enrolled in a private school, with 213 (100.0% in the age bracket) attending a public institution.
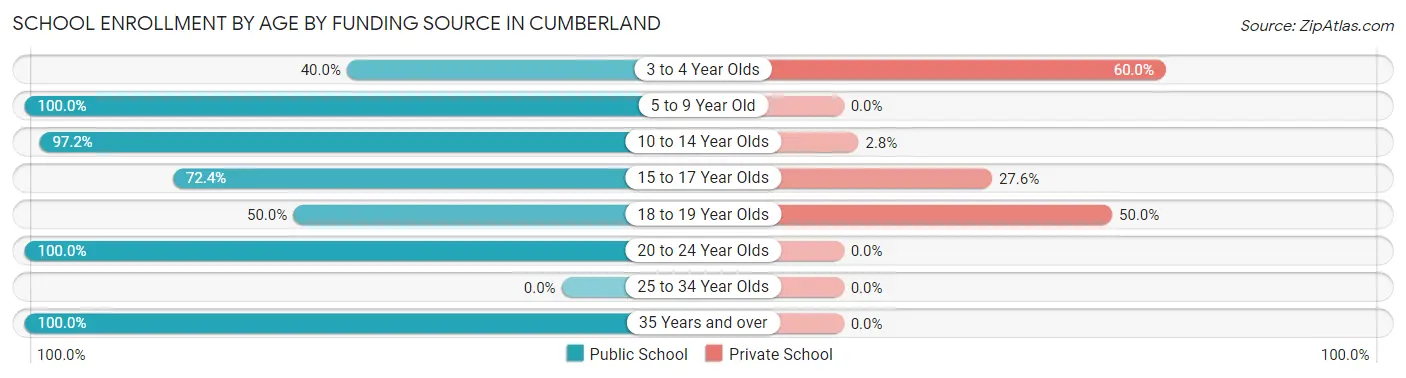
| Age Bracket | Public School | Private School |
| 3 to 4 Year Olds | 14 (40.0%) | 21 (60.0%) |
| 5 to 9 Year Old | 213 (100.0%) | 0 (0.0%) |
| 10 to 14 Year Olds | 246 (97.2%) | 7 (2.8%) |
| 15 to 17 Year Olds | 55 (72.4%) | 21 (27.6%) |
| 18 to 19 Year Olds | 9 (50.0%) | 9 (50.0%) |
| 20 to 24 Year Olds | 5 (100.0%) | 0 (0.0%) |
| 25 to 34 Year Olds | 0 (0.0%) | 0 (0.0%) |
| 35 Years and over | 18 (100.0%) | 0 (0.0%) |
| Total | 560 (90.6%) | 58 (9.4%) |
Educational Attainment by Field of Study in Cumberland
Social sciences (47 | 22.4%), arts & humanities (37 | 17.6%), engineering (35 | 16.7%), science & technology (20 | 9.5%), and education (19 | 9.0%) are the most common fields of study among 210 individuals in Cumberland who have obtained a bachelor's degree or higher.
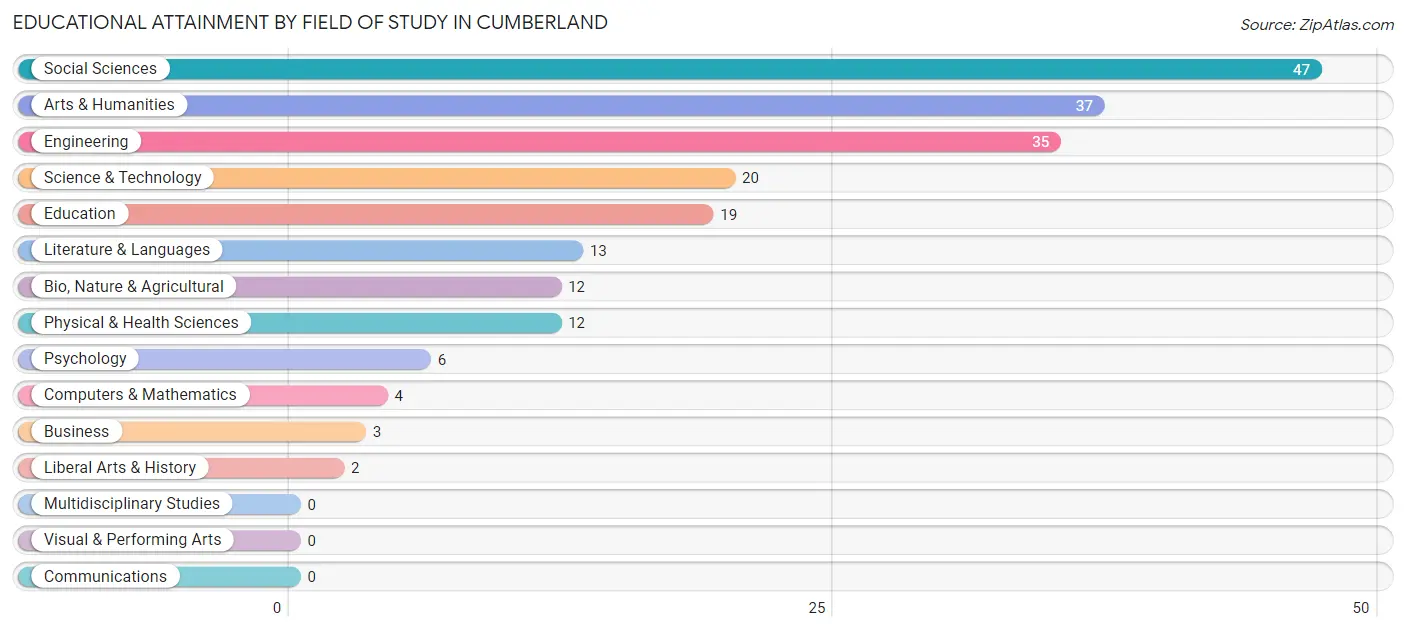
| Field of Study | # Graduates | % Graduates |
| Computers & Mathematics | 4 | 1.9% |
| Bio, Nature & Agricultural | 12 | 5.7% |
| Physical & Health Sciences | 12 | 5.7% |
| Psychology | 6 | 2.9% |
| Social Sciences | 47 | 22.4% |
| Engineering | 35 | 16.7% |
| Multidisciplinary Studies | 0 | 0.0% |
| Science & Technology | 20 | 9.5% |
| Business | 3 | 1.4% |
| Education | 19 | 9.0% |
| Literature & Languages | 13 | 6.2% |
| Liberal Arts & History | 2 | 0.9% |
| Visual & Performing Arts | 0 | 0.0% |
| Communications | 0 | 0.0% |
| Arts & Humanities | 37 | 17.6% |
| Total | 210 | 100.0% |
Transportation & Commute in Cumberland
Vehicle Availability by Sex in Cumberland
The most prevalent vehicle ownership categories in Cumberland are males with 2 vehicles (61, accounting for 35.9%) and females with 2 vehicles (43, making up 38.4%).
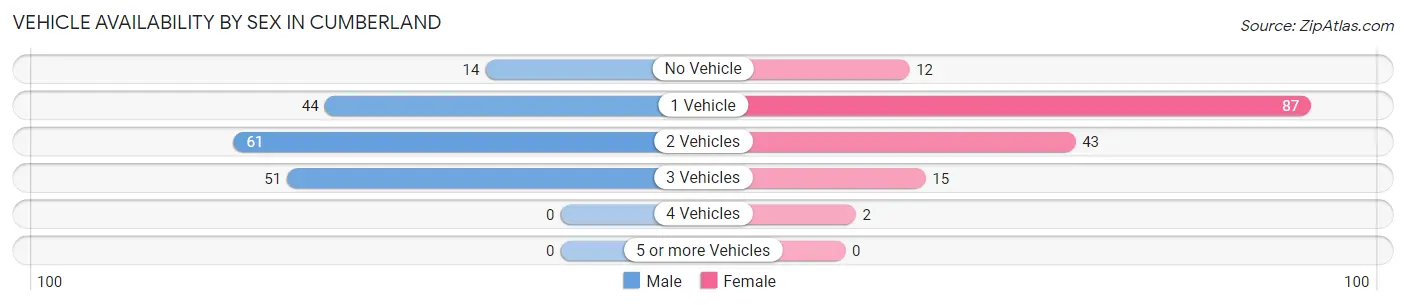
| Vehicles Available | Male | Female |
| No Vehicle | 14 (8.2%) | 12 (7.5%) |
| 1 Vehicle | 44 (25.9%) | 87 (54.7%) |
| 2 Vehicles | 61 (35.9%) | 43 (27.0%) |
| 3 Vehicles | 51 (30.0%) | 15 (9.4%) |
| 4 Vehicles | 0 (0.0%) | 2 (1.3%) |
| 5 or more Vehicles | 0 (0.0%) | 0 (0.0%) |
| Total | 170 (100.0%) | 159 (100.0%) |
Commute Time in Cumberland
The most frequently occuring commute durations in Cumberland are less than 5 minutes (73 commuters, 24.8%), 5 to 9 minutes (73 commuters, 24.8%), and 10 to 14 minutes (72 commuters, 24.5%).
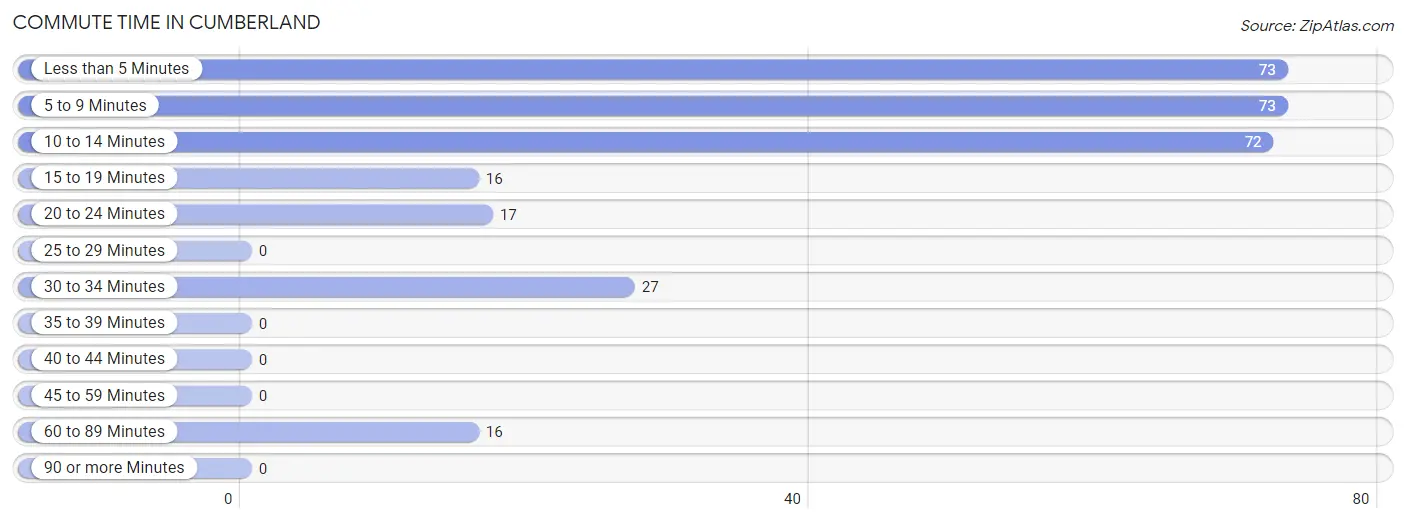
| Commute Time | # Commuters | % Commuters |
| Less than 5 Minutes | 73 | 24.8% |
| 5 to 9 Minutes | 73 | 24.8% |
| 10 to 14 Minutes | 72 | 24.5% |
| 15 to 19 Minutes | 16 | 5.4% |
| 20 to 24 Minutes | 17 | 5.8% |
| 25 to 29 Minutes | 0 | 0.0% |
| 30 to 34 Minutes | 27 | 9.2% |
| 35 to 39 Minutes | 0 | 0.0% |
| 40 to 44 Minutes | 0 | 0.0% |
| 45 to 59 Minutes | 0 | 0.0% |
| 60 to 89 Minutes | 16 | 5.4% |
| 90 or more Minutes | 0 | 0.0% |
Commute Time by Sex in Cumberland
The most common commute times in Cumberland are less than 5 minutes (32 commuters, 23.7%) for males and 10 to 14 minutes (50 commuters, 31.5%) for females.
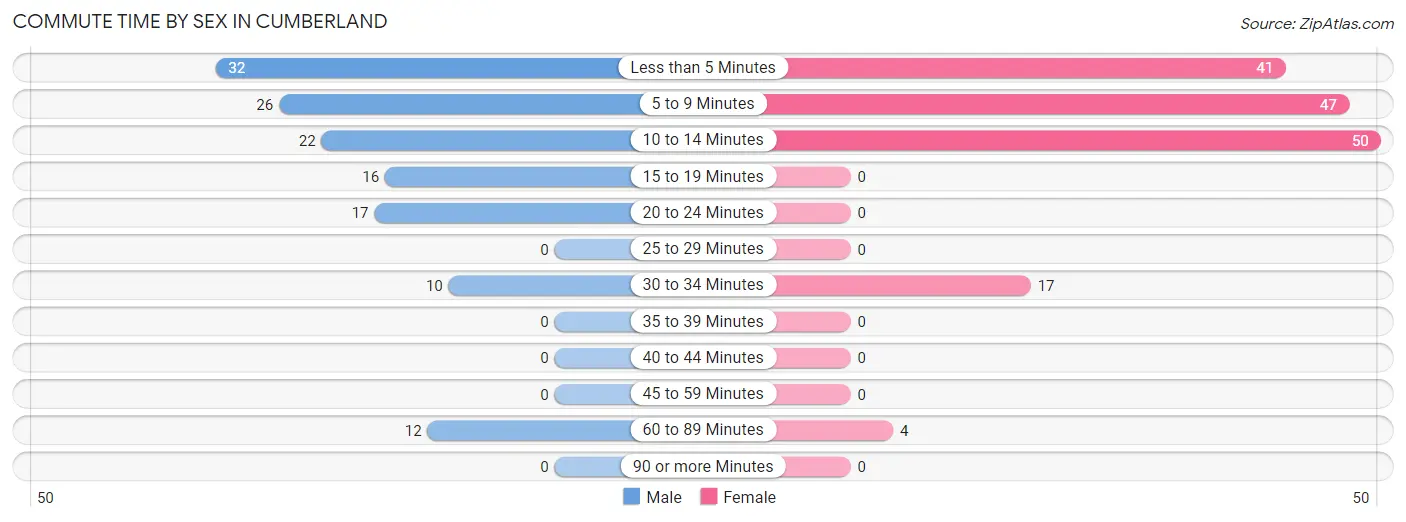
| Commute Time | Male | Female |
| Less than 5 Minutes | 32 (23.7%) | 41 (25.8%) |
| 5 to 9 Minutes | 26 (19.3%) | 47 (29.6%) |
| 10 to 14 Minutes | 22 (16.3%) | 50 (31.5%) |
| 15 to 19 Minutes | 16 (11.8%) | 0 (0.0%) |
| 20 to 24 Minutes | 17 (12.6%) | 0 (0.0%) |
| 25 to 29 Minutes | 0 (0.0%) | 0 (0.0%) |
| 30 to 34 Minutes | 10 (7.4%) | 17 (10.7%) |
| 35 to 39 Minutes | 0 (0.0%) | 0 (0.0%) |
| 40 to 44 Minutes | 0 (0.0%) | 0 (0.0%) |
| 45 to 59 Minutes | 0 (0.0%) | 0 (0.0%) |
| 60 to 89 Minutes | 12 (8.9%) | 4 (2.5%) |
| 90 or more Minutes | 0 (0.0%) | 0 (0.0%) |
Time of Departure to Work by Sex in Cumberland
The most frequent times of departure to work in Cumberland are 10:00 AM to 10:59 AM (35, 25.9%) for males and 8:00 AM to 8:29 AM (43, 27.0%) for females.
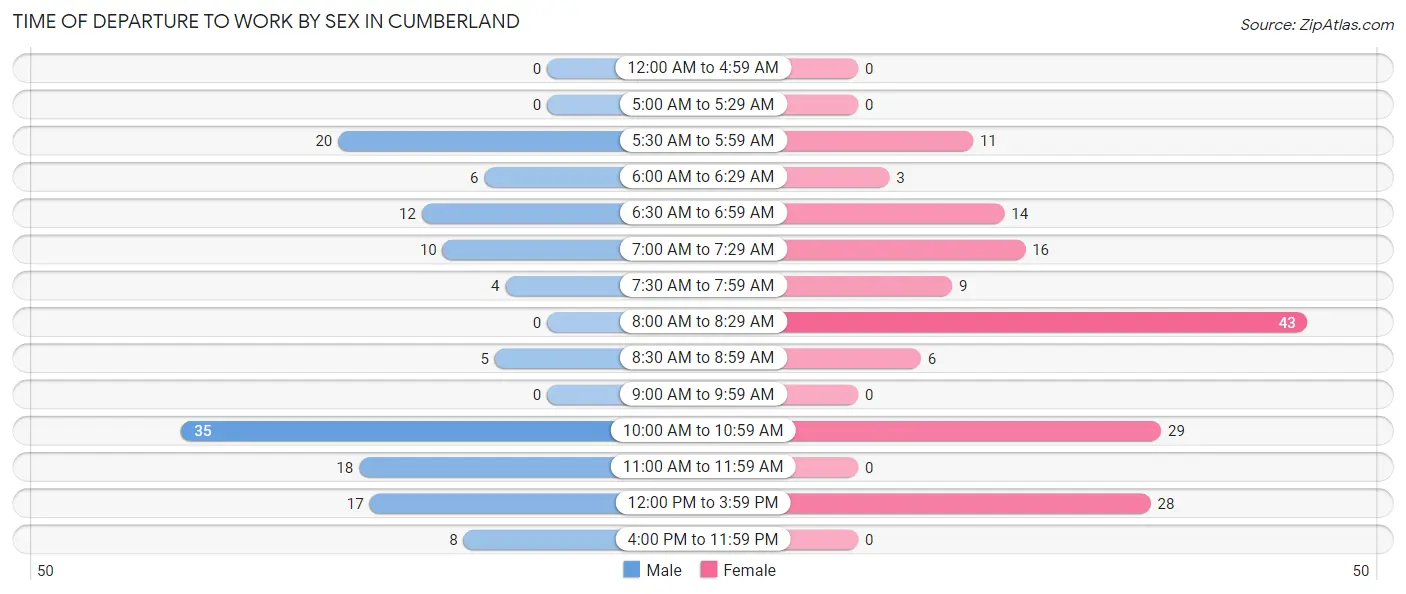
| Time of Departure | Male | Female |
| 12:00 AM to 4:59 AM | 0 (0.0%) | 0 (0.0%) |
| 5:00 AM to 5:29 AM | 0 (0.0%) | 0 (0.0%) |
| 5:30 AM to 5:59 AM | 20 (14.8%) | 11 (6.9%) |
| 6:00 AM to 6:29 AM | 6 (4.4%) | 3 (1.9%) |
| 6:30 AM to 6:59 AM | 12 (8.9%) | 14 (8.8%) |
| 7:00 AM to 7:29 AM | 10 (7.4%) | 16 (10.1%) |
| 7:30 AM to 7:59 AM | 4 (3.0%) | 9 (5.7%) |
| 8:00 AM to 8:29 AM | 0 (0.0%) | 43 (27.0%) |
| 8:30 AM to 8:59 AM | 5 (3.7%) | 6 (3.8%) |
| 9:00 AM to 9:59 AM | 0 (0.0%) | 0 (0.0%) |
| 10:00 AM to 10:59 AM | 35 (25.9%) | 29 (18.2%) |
| 11:00 AM to 11:59 AM | 18 (13.3%) | 0 (0.0%) |
| 12:00 PM to 3:59 PM | 17 (12.6%) | 28 (17.6%) |
| 4:00 PM to 11:59 PM | 8 (5.9%) | 0 (0.0%) |
| Total | 135 (100.0%) | 159 (100.0%) |
Housing Occupancy in Cumberland
Occupancy by Ownership in Cumberland
Of the total 829 dwellings in Cumberland, owner-occupied units account for 418 (50.4%), while renter-occupied units make up 411 (49.6%).
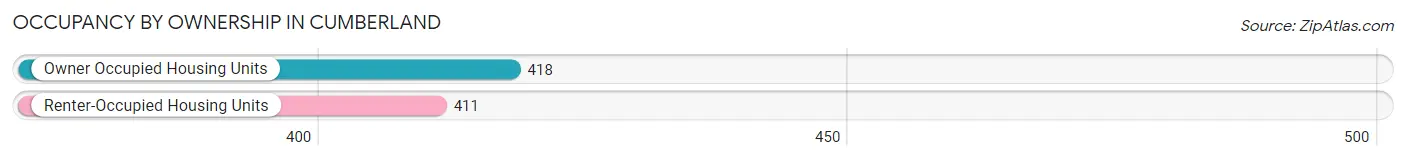
| Occupancy | # Housing Units | % Housing Units |
| Owner Occupied Housing Units | 418 | 50.4% |
| Renter-Occupied Housing Units | 411 | 49.6% |
| Total Occupied Housing Units | 829 | 100.0% |
Occupancy by Household Size in Cumberland
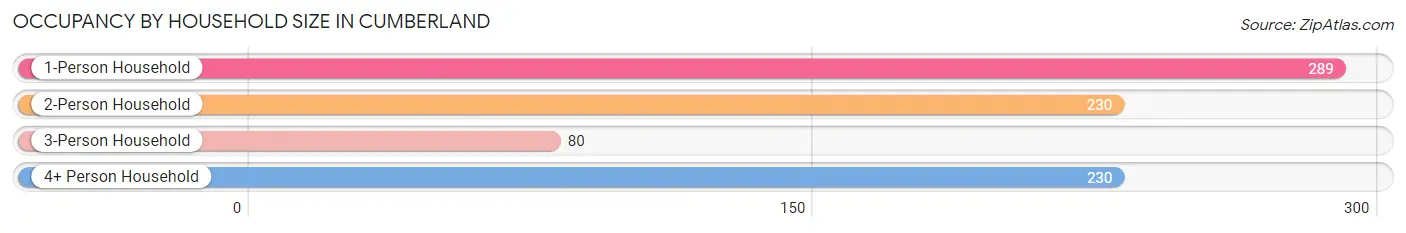
| Household Size | # Housing Units | % Housing Units |
| 1-Person Household | 289 | 34.9% |
| 2-Person Household | 230 | 27.7% |
| 3-Person Household | 80 | 9.7% |
| 4+ Person Household | 230 | 27.7% |
| Total Housing Units | 829 | 100.0% |
Occupancy by Ownership by Household Size in Cumberland
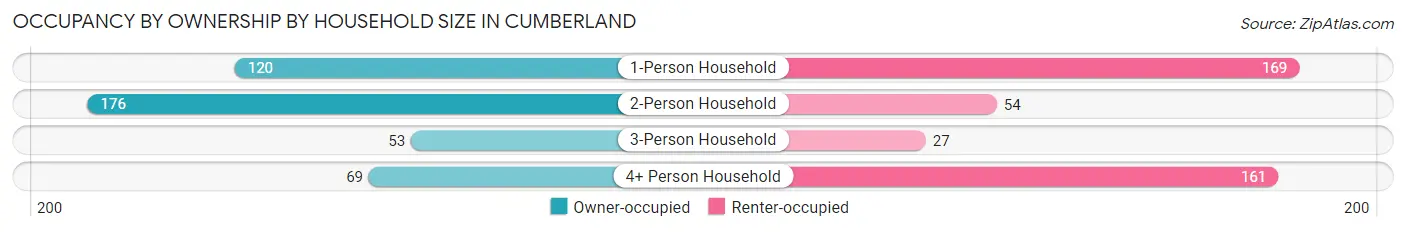
| Household Size | Owner-occupied | Renter-occupied |
| 1-Person Household | 120 (41.5%) | 169 (58.5%) |
| 2-Person Household | 176 (76.5%) | 54 (23.5%) |
| 3-Person Household | 53 (66.2%) | 27 (33.8%) |
| 4+ Person Household | 69 (30.0%) | 161 (70.0%) |
| Total Housing Units | 418 (50.4%) | 411 (49.6%) |
Occupancy by Educational Attainment in Cumberland
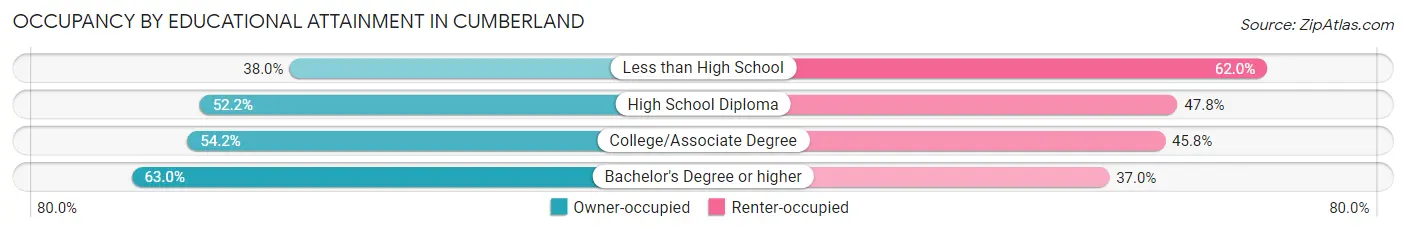
| Household Size | Owner-occupied | Renter-occupied |
| Less than High School | 84 (38.0%) | 137 (62.0%) |
| High School Diploma | 94 (52.2%) | 86 (47.8%) |
| College/Associate Degree | 182 (54.2%) | 154 (45.8%) |
| Bachelor's Degree or higher | 58 (63.0%) | 34 (37.0%) |
Occupancy by Age of Householder in Cumberland
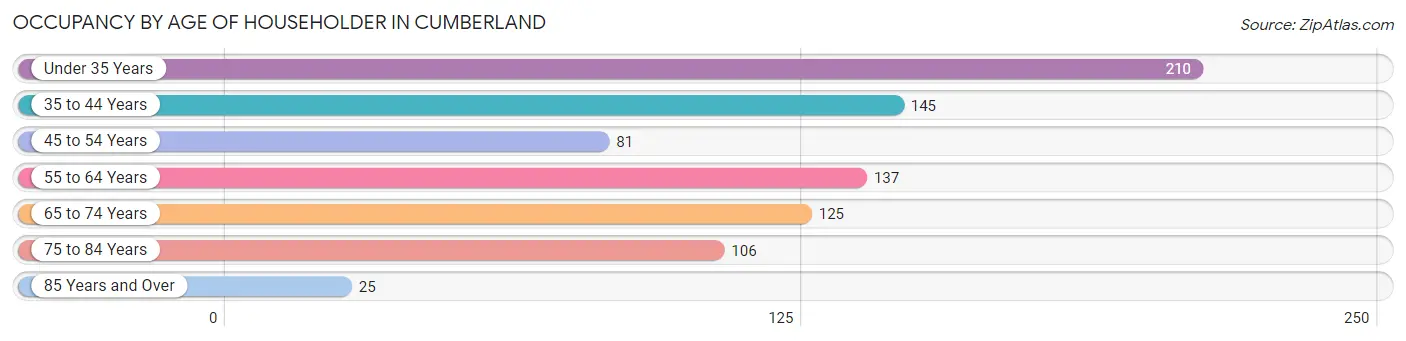
| Age Bracket | # Households | % Households |
| Under 35 Years | 210 | 25.3% |
| 35 to 44 Years | 145 | 17.5% |
| 45 to 54 Years | 81 | 9.8% |
| 55 to 64 Years | 137 | 16.5% |
| 65 to 74 Years | 125 | 15.1% |
| 75 to 84 Years | 106 | 12.8% |
| 85 Years and Over | 25 | 3.0% |
| Total | 829 | 100.0% |
Housing Finances in Cumberland
Median Income by Occupancy in Cumberland
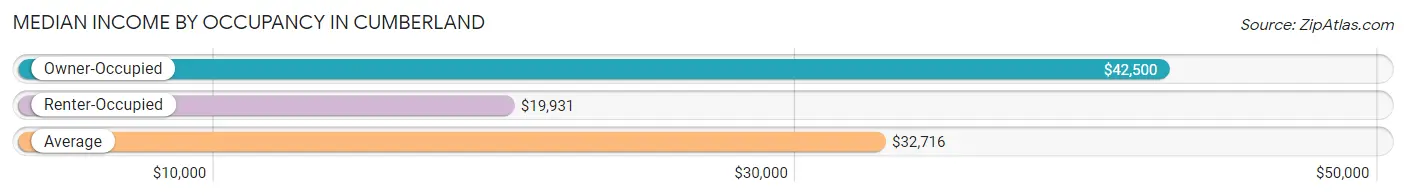
| Occupancy Type | # Households | Median Income |
| Owner-Occupied | 418 (50.4%) | $42,500 |
| Renter-Occupied | 411 (49.6%) | $19,931 |
| Average | 829 (100.0%) | $32,716 |
Occupancy by Householder Income Bracket in Cumberland
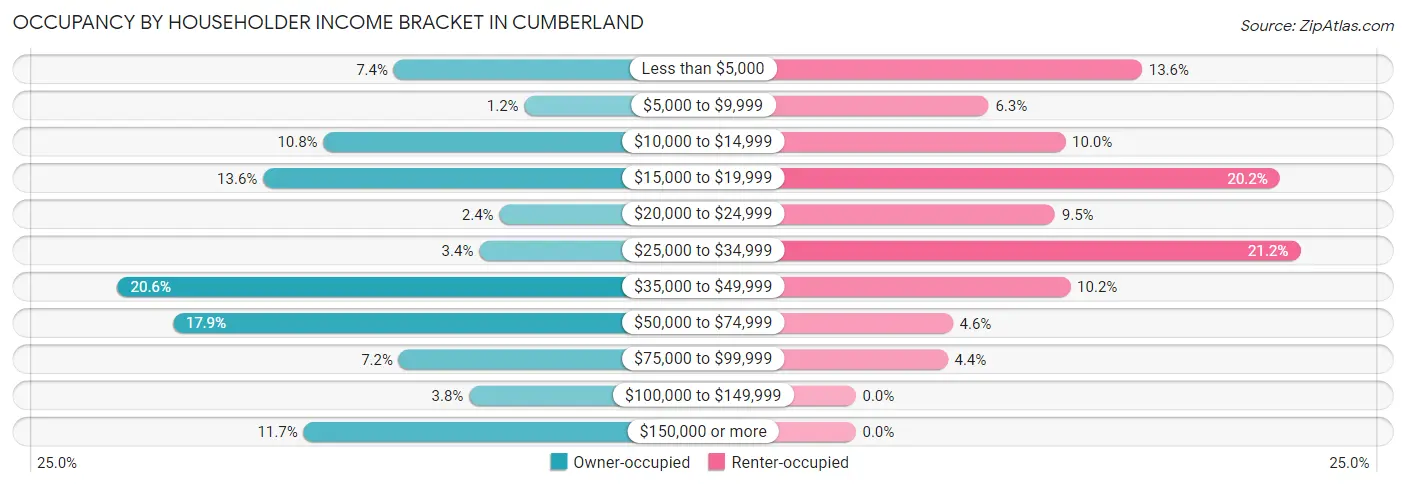
| Income Bracket | Owner-occupied | Renter-occupied |
| Less than $5,000 | 31 (7.4%) | 56 (13.6%) |
| $5,000 to $9,999 | 5 (1.2%) | 26 (6.3%) |
| $10,000 to $14,999 | 45 (10.8%) | 41 (10.0%) |
| $15,000 to $19,999 | 57 (13.6%) | 83 (20.2%) |
| $20,000 to $24,999 | 10 (2.4%) | 39 (9.5%) |
| $25,000 to $34,999 | 14 (3.4%) | 87 (21.2%) |
| $35,000 to $49,999 | 86 (20.6%) | 42 (10.2%) |
| $50,000 to $74,999 | 75 (17.9%) | 19 (4.6%) |
| $75,000 to $99,999 | 30 (7.2%) | 18 (4.4%) |
| $100,000 to $149,999 | 16 (3.8%) | 0 (0.0%) |
| $150,000 or more | 49 (11.7%) | 0 (0.0%) |
| Total | 418 (100.0%) | 411 (100.0%) |
Monthly Housing Cost Tiers in Cumberland
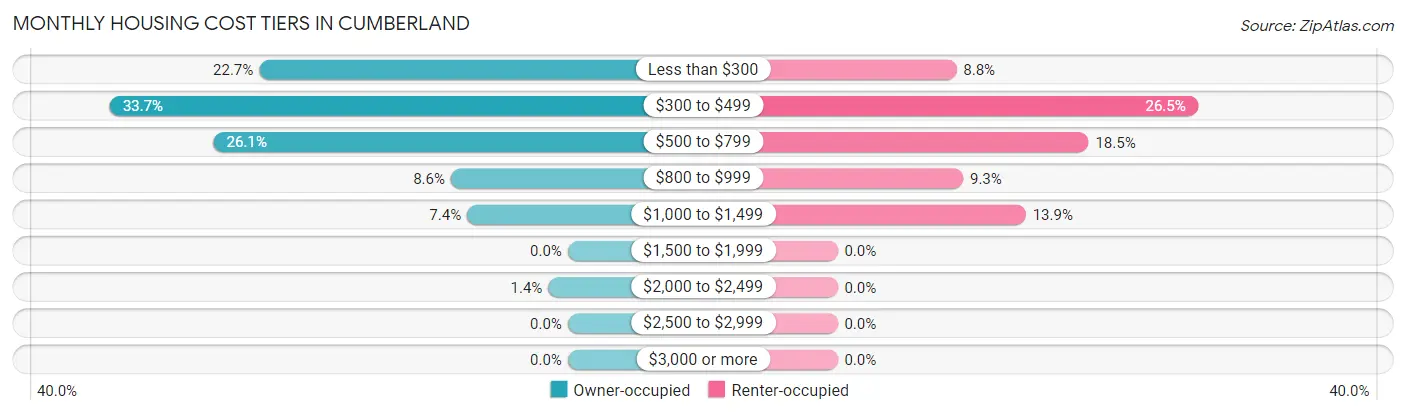
| Monthly Cost | Owner-occupied | Renter-occupied |
| Less than $300 | 95 (22.7%) | 36 (8.8%) |
| $300 to $499 | 141 (33.7%) | 109 (26.5%) |
| $500 to $799 | 109 (26.1%) | 76 (18.5%) |
| $800 to $999 | 36 (8.6%) | 38 (9.2%) |
| $1,000 to $1,499 | 31 (7.4%) | 57 (13.9%) |
| $1,500 to $1,999 | 0 (0.0%) | 0 (0.0%) |
| $2,000 to $2,499 | 6 (1.4%) | 0 (0.0%) |
| $2,500 to $2,999 | 0 (0.0%) | 0 (0.0%) |
| $3,000 or more | 0 (0.0%) | 0 (0.0%) |
| Total | 418 (100.0%) | 411 (100.0%) |
Physical Housing Characteristics in Cumberland
Housing Structures in Cumberland
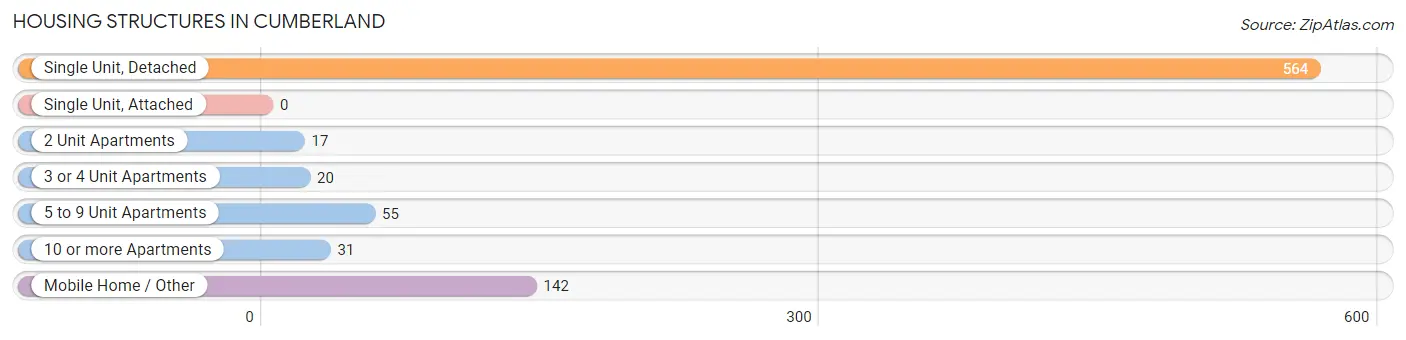
| Structure Type | # Housing Units | % Housing Units |
| Single Unit, Detached | 564 | 68.0% |
| Single Unit, Attached | 0 | 0.0% |
| 2 Unit Apartments | 17 | 2.1% |
| 3 or 4 Unit Apartments | 20 | 2.4% |
| 5 to 9 Unit Apartments | 55 | 6.6% |
| 10 or more Apartments | 31 | 3.7% |
| Mobile Home / Other | 142 | 17.1% |
| Total | 829 | 100.0% |
Housing Structures by Occupancy in Cumberland
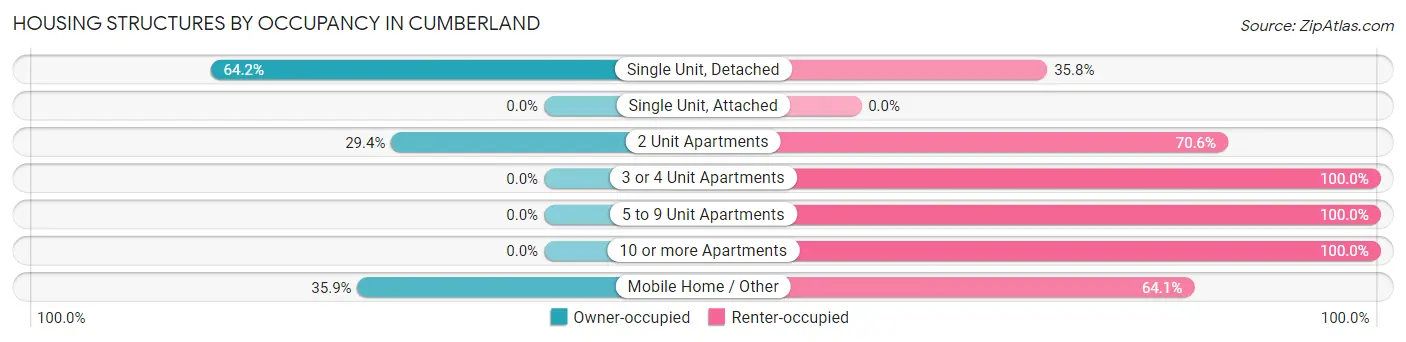
| Structure Type | Owner-occupied | Renter-occupied |
| Single Unit, Detached | 362 (64.2%) | 202 (35.8%) |
| Single Unit, Attached | 0 (0.0%) | 0 (0.0%) |
| 2 Unit Apartments | 5 (29.4%) | 12 (70.6%) |
| 3 or 4 Unit Apartments | 0 (0.0%) | 20 (100.0%) |
| 5 to 9 Unit Apartments | 0 (0.0%) | 55 (100.0%) |
| 10 or more Apartments | 0 (0.0%) | 31 (100.0%) |
| Mobile Home / Other | 51 (35.9%) | 91 (64.1%) |
| Total | 418 (50.4%) | 411 (49.6%) |
Housing Structures by Number of Rooms in Cumberland
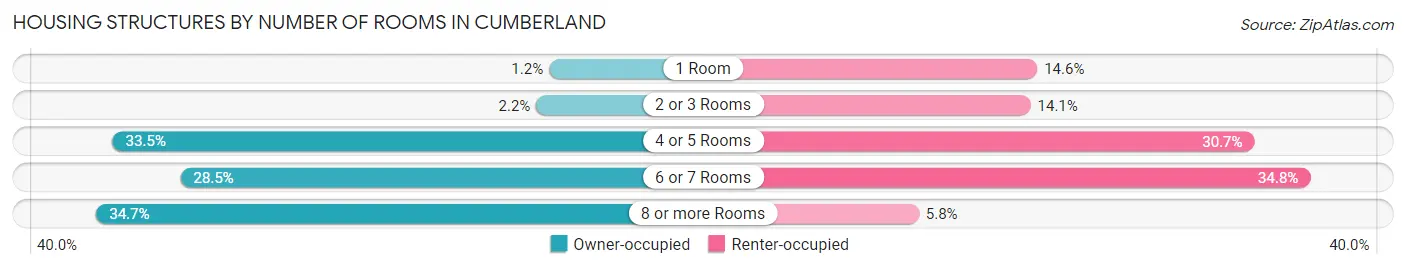
| Number of Rooms | Owner-occupied | Renter-occupied |
| 1 Room | 5 (1.2%) | 60 (14.6%) |
| 2 or 3 Rooms | 9 (2.1%) | 58 (14.1%) |
| 4 or 5 Rooms | 140 (33.5%) | 126 (30.7%) |
| 6 or 7 Rooms | 119 (28.5%) | 143 (34.8%) |
| 8 or more Rooms | 145 (34.7%) | 24 (5.8%) |
| Total | 418 (100.0%) | 411 (100.0%) |
Housing Structure by Heating Type in Cumberland
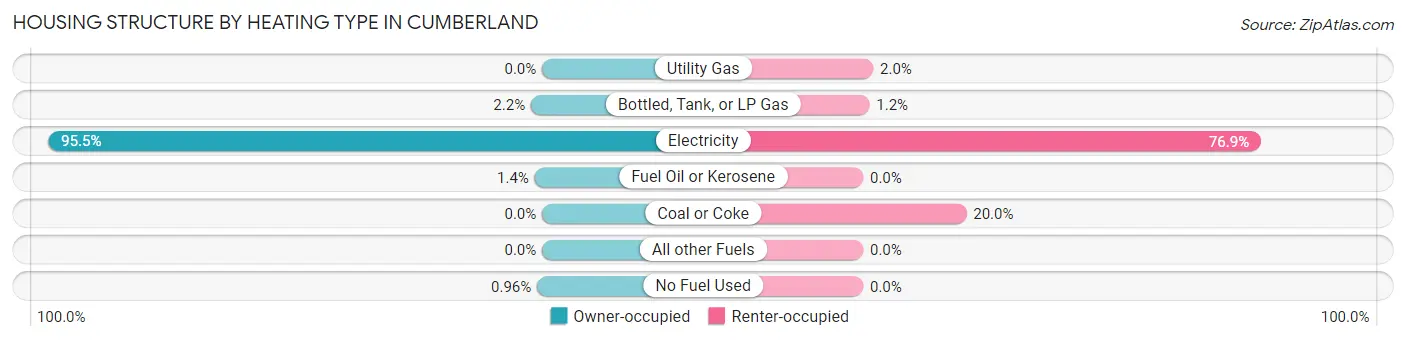
| Heating Type | Owner-occupied | Renter-occupied |
| Utility Gas | 0 (0.0%) | 8 (1.9%) |
| Bottled, Tank, or LP Gas | 9 (2.1%) | 5 (1.2%) |
| Electricity | 399 (95.5%) | 316 (76.9%) |
| Fuel Oil or Kerosene | 6 (1.4%) | 0 (0.0%) |
| Coal or Coke | 0 (0.0%) | 82 (20.0%) |
| All other Fuels | 0 (0.0%) | 0 (0.0%) |
| No Fuel Used | 4 (1.0%) | 0 (0.0%) |
| Total | 418 (100.0%) | 411 (100.0%) |
Household Vehicle Usage in Cumberland
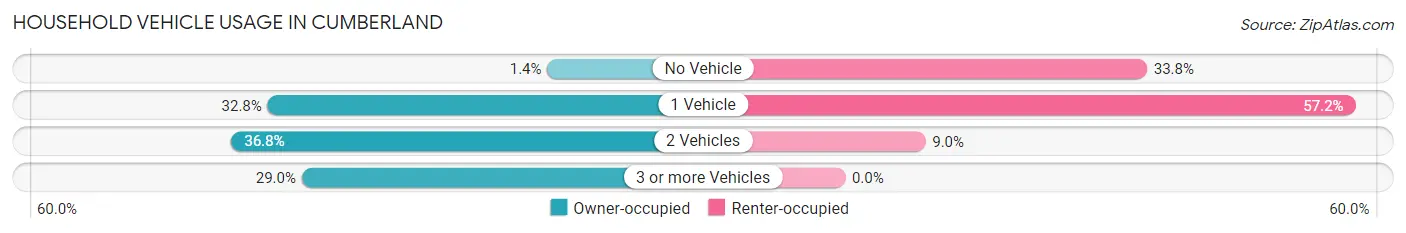
| Vehicles per Household | Owner-occupied | Renter-occupied |
| No Vehicle | 6 (1.4%) | 139 (33.8%) |
| 1 Vehicle | 137 (32.8%) | 235 (57.2%) |
| 2 Vehicles | 154 (36.8%) | 37 (9.0%) |
| 3 or more Vehicles | 121 (28.9%) | 0 (0.0%) |
| Total | 418 (100.0%) | 411 (100.0%) |
Real Estate & Mortgages in Cumberland
Real Estate and Mortgage Overview in Cumberland
| Characteristic | Without Mortgage | With Mortgage |
| Housing Units | 316 | 102 |
| Median Property Value | $60,000 | $0 |
| Median Household Income | $42,600 | $0 |
| Monthly Housing Costs | $368 | $0 |
| Real Estate Taxes | $588 | $24 |
Property Value by Mortgage Status in Cumberland
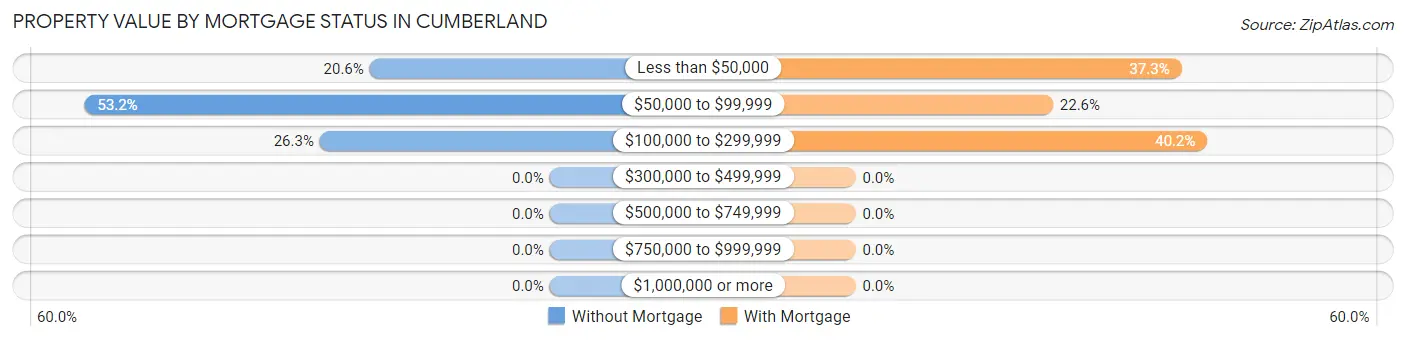
| Property Value | Without Mortgage | With Mortgage |
| Less than $50,000 | 65 (20.6%) | 38 (37.2%) |
| $50,000 to $99,999 | 168 (53.2%) | 23 (22.6%) |
| $100,000 to $299,999 | 83 (26.3%) | 41 (40.2%) |
| $300,000 to $499,999 | 0 (0.0%) | 0 (0.0%) |
| $500,000 to $749,999 | 0 (0.0%) | 0 (0.0%) |
| $750,000 to $999,999 | 0 (0.0%) | 0 (0.0%) |
| $1,000,000 or more | 0 (0.0%) | 0 (0.0%) |
| Total | 316 (100.0%) | 102 (100.0%) |
Household Income by Mortgage Status in Cumberland
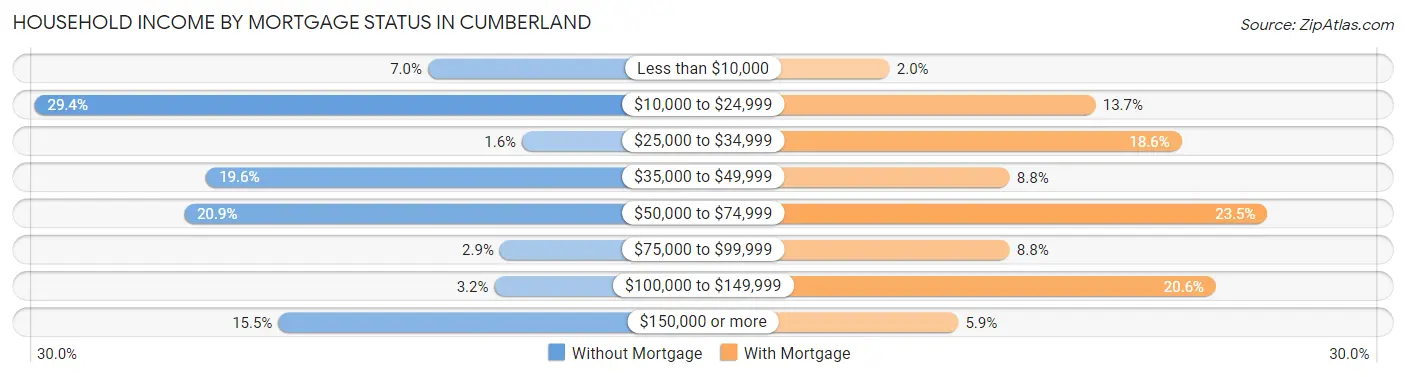
| Household Income | Without Mortgage | With Mortgage |
| Less than $10,000 | 22 (7.0%) | 2 (2.0%) |
| $10,000 to $24,999 | 93 (29.4%) | 14 (13.7%) |
| $25,000 to $34,999 | 5 (1.6%) | 19 (18.6%) |
| $35,000 to $49,999 | 62 (19.6%) | 9 (8.8%) |
| $50,000 to $74,999 | 66 (20.9%) | 24 (23.5%) |
| $75,000 to $99,999 | 9 (2.9%) | 9 (8.8%) |
| $100,000 to $149,999 | 10 (3.2%) | 21 (20.6%) |
| $150,000 or more | 49 (15.5%) | 6 (5.9%) |
| Total | 316 (100.0%) | 102 (100.0%) |
Property Value to Household Income Ratio in Cumberland
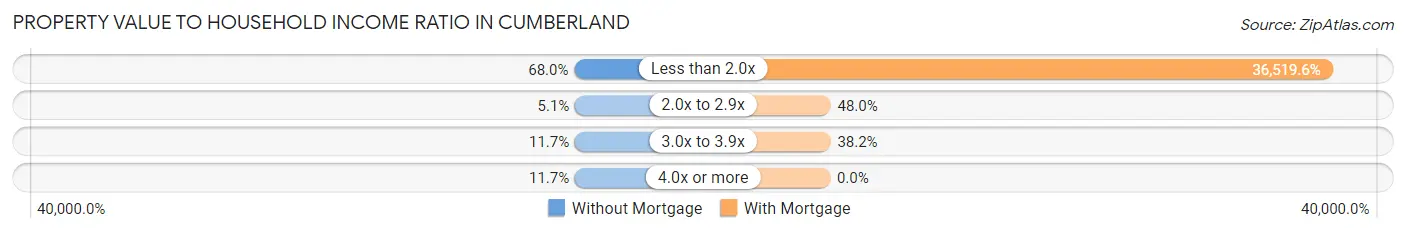
| Value-to-Income Ratio | Without Mortgage | With Mortgage |
| Less than 2.0x | 215 (68.0%) | 37,250 (36,519.6%) |
| 2.0x to 2.9x | 16 (5.1%) | 49 (48.0%) |
| 3.0x to 3.9x | 37 (11.7%) | 39 (38.2%) |
| 4.0x or more | 37 (11.7%) | 0 (0.0%) |
| Total | 316 (100.0%) | 102 (100.0%) |
Real Estate Taxes by Mortgage Status in Cumberland
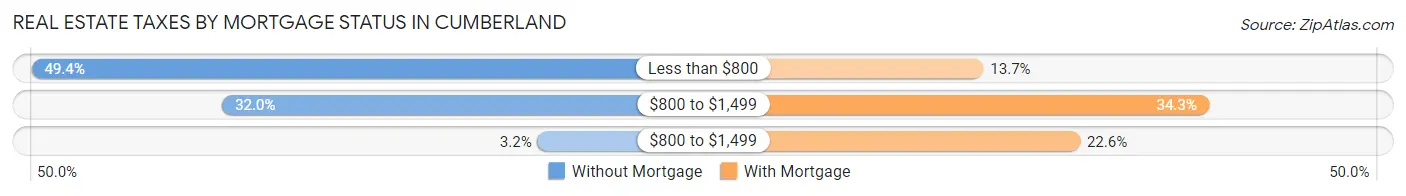
| Property Taxes | Without Mortgage | With Mortgage |
| Less than $800 | 156 (49.4%) | 14 (13.7%) |
| $800 to $1,499 | 101 (32.0%) | 35 (34.3%) |
| $800 to $1,499 | 10 (3.2%) | 23 (22.6%) |
| Total | 316 (100.0%) | 102 (100.0%) |
Health & Disability in Cumberland
Health Insurance Coverage by Age in Cumberland
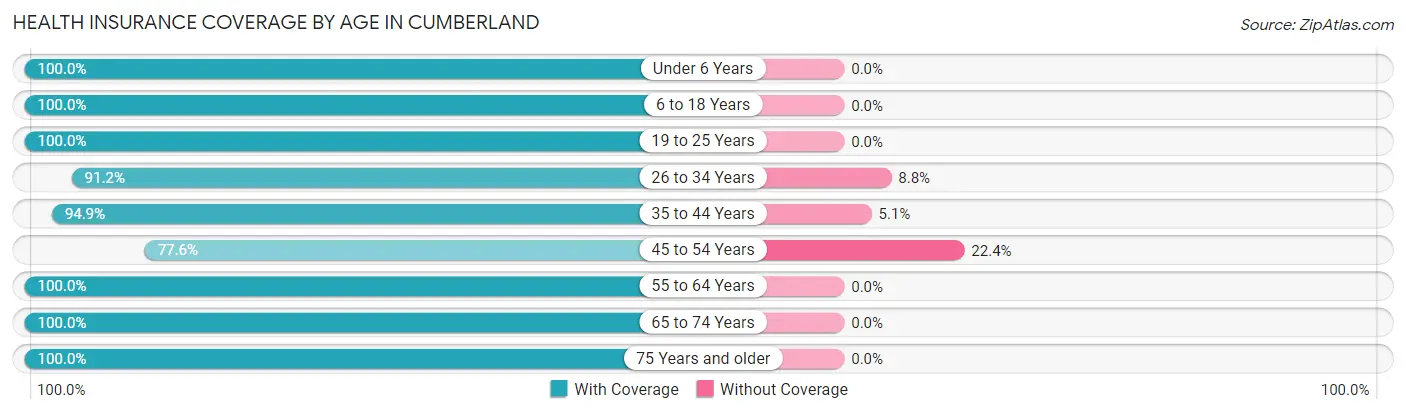
| Age Bracket | With Coverage | Without Coverage |
| Under 6 Years | 307 (100.0%) | 0 (0.0%) |
| 6 to 18 Years | 561 (100.0%) | 0 (0.0%) |
| 19 to 25 Years | 90 (100.0%) | 0 (0.0%) |
| 26 to 34 Years | 260 (91.2%) | 25 (8.8%) |
| 35 to 44 Years | 261 (94.9%) | 14 (5.1%) |
| 45 to 54 Years | 97 (77.6%) | 28 (22.4%) |
| 55 to 64 Years | 253 (100.0%) | 0 (0.0%) |
| 65 to 74 Years | 222 (100.0%) | 0 (0.0%) |
| 75 Years and older | 193 (100.0%) | 0 (0.0%) |
| Total | 2,244 (97.1%) | 67 (2.9%) |
Health Insurance Coverage by Citizenship Status in Cumberland
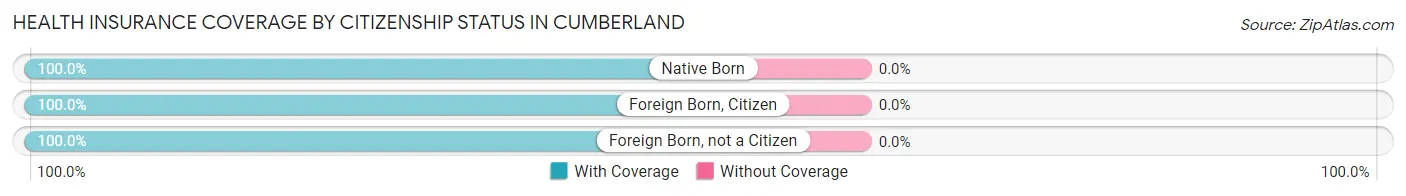
| Citizenship Status | With Coverage | Without Coverage |
| Native Born | 307 (100.0%) | 0 (0.0%) |
| Foreign Born, Citizen | 561 (100.0%) | 0 (0.0%) |
| Foreign Born, not a Citizen | 90 (100.0%) | 0 (0.0%) |
Health Insurance Coverage by Household Income in Cumberland
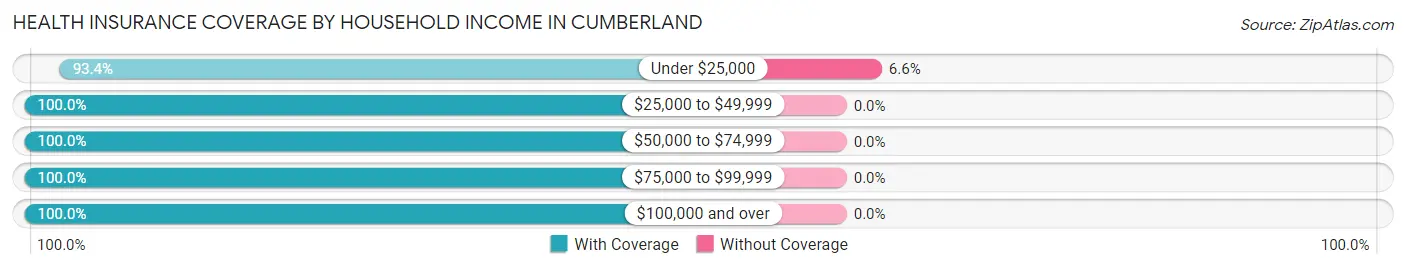
| Household Income | With Coverage | Without Coverage |
| Under $25,000 | 952 (93.4%) | 67 (6.6%) |
| $25,000 to $49,999 | 698 (100.0%) | 0 (0.0%) |
| $50,000 to $74,999 | 288 (100.0%) | 0 (0.0%) |
| $75,000 to $99,999 | 129 (100.0%) | 0 (0.0%) |
| $100,000 and over | 177 (100.0%) | 0 (0.0%) |
Public vs Private Health Insurance Coverage by Age in Cumberland
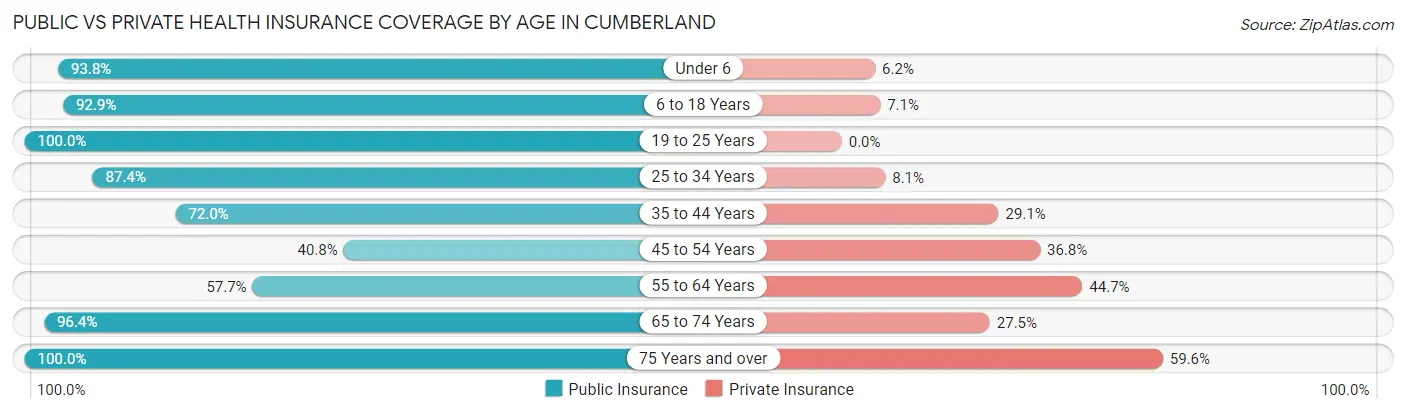
| Age Bracket | Public Insurance | Private Insurance |
| Under 6 | 288 (93.8%) | 19 (6.2%) |
| 6 to 18 Years | 521 (92.9%) | 40 (7.1%) |
| 19 to 25 Years | 90 (100.0%) | 0 (0.0%) |
| 25 to 34 Years | 249 (87.4%) | 23 (8.1%) |
| 35 to 44 Years | 198 (72.0%) | 80 (29.1%) |
| 45 to 54 Years | 51 (40.8%) | 46 (36.8%) |
| 55 to 64 Years | 146 (57.7%) | 113 (44.7%) |
| 65 to 74 Years | 214 (96.4%) | 61 (27.5%) |
| 75 Years and over | 193 (100.0%) | 115 (59.6%) |
| Total | 1,950 (84.4%) | 497 (21.5%) |
Disability Status by Sex by Age in Cumberland
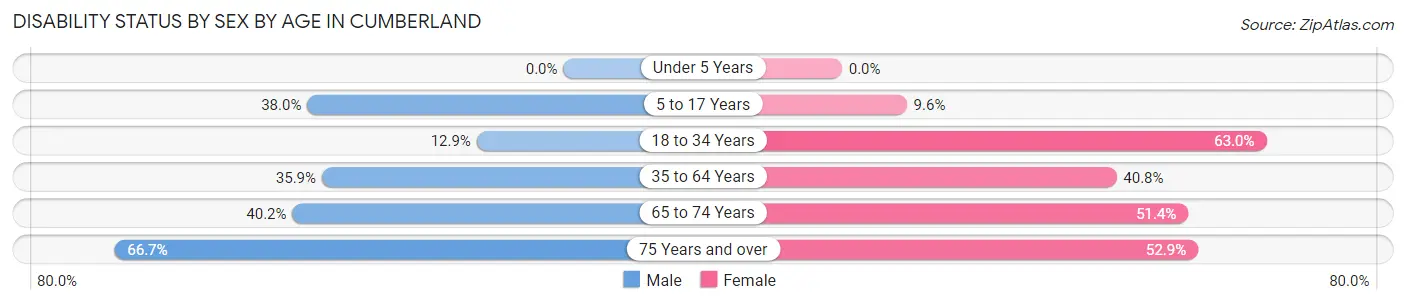
| Age Bracket | Male | Female |
| Under 5 Years | 0 (0.0%) | 0 (0.0%) |
| 5 to 17 Years | 81 (38.0%) | 34 (9.6%) |
| 18 to 34 Years | 22 (12.9%) | 145 (63.0%) |
| 35 to 64 Years | 104 (35.9%) | 148 (40.8%) |
| 65 to 74 Years | 33 (40.2%) | 72 (51.4%) |
| 75 Years and over | 48 (66.7%) | 64 (52.9%) |
Disability Class by Sex by Age in Cumberland
Disability Class: Hearing Difficulty
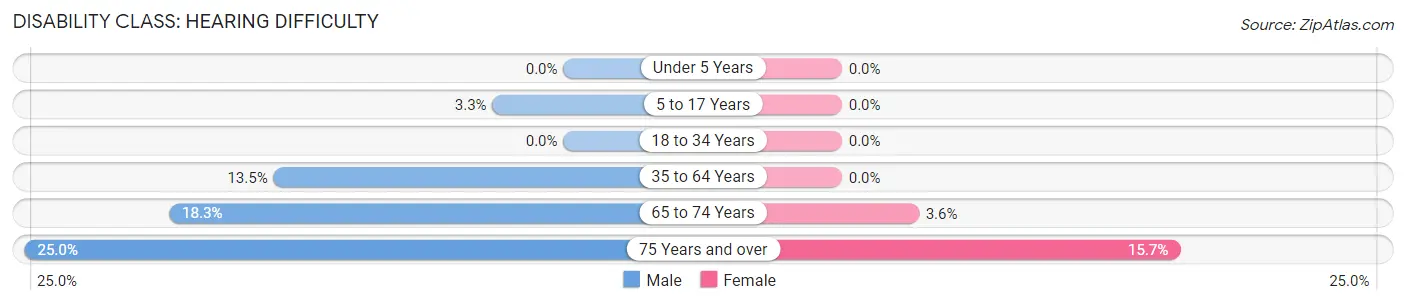
| Age Bracket | Male | Female |
| Under 5 Years | 0 (0.0%) | 0 (0.0%) |
| 5 to 17 Years | 7 (3.3%) | 0 (0.0%) |
| 18 to 34 Years | 0 (0.0%) | 0 (0.0%) |
| 35 to 64 Years | 39 (13.5%) | 0 (0.0%) |
| 65 to 74 Years | 15 (18.3%) | 5 (3.6%) |
| 75 Years and over | 18 (25.0%) | 19 (15.7%) |
Disability Class: Vision Difficulty
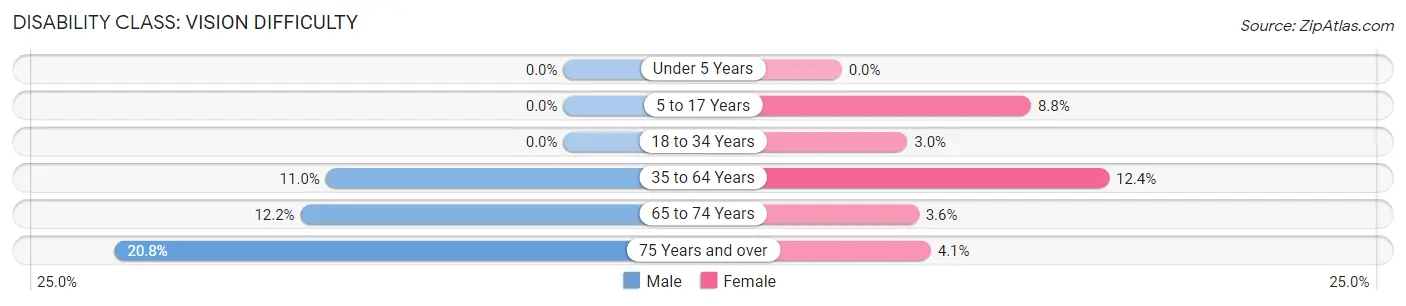
| Age Bracket | Male | Female |
| Under 5 Years | 0 (0.0%) | 0 (0.0%) |
| 5 to 17 Years | 0 (0.0%) | 31 (8.8%) |
| 18 to 34 Years | 0 (0.0%) | 7 (3.0%) |
| 35 to 64 Years | 32 (11.0%) | 45 (12.4%) |
| 65 to 74 Years | 10 (12.2%) | 5 (3.6%) |
| 75 Years and over | 15 (20.8%) | 5 (4.1%) |
Disability Class: Cognitive Difficulty
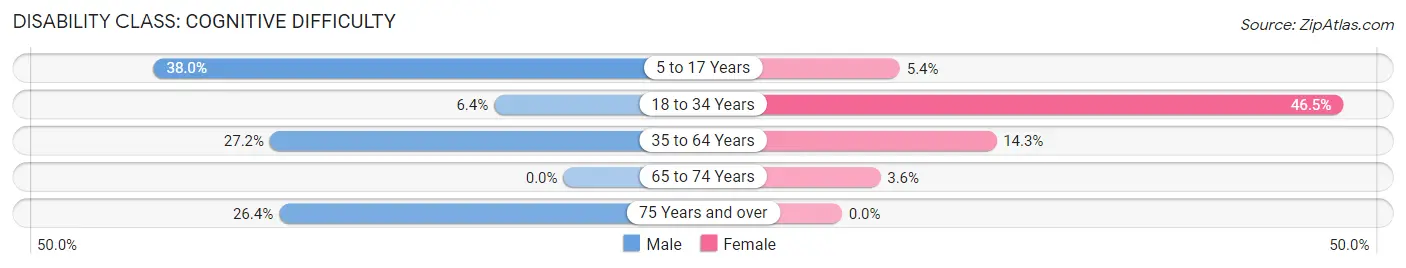
| Age Bracket | Male | Female |
| 5 to 17 Years | 81 (38.0%) | 19 (5.4%) |
| 18 to 34 Years | 11 (6.4%) | 107 (46.5%) |
| 35 to 64 Years | 79 (27.2%) | 52 (14.3%) |
| 65 to 74 Years | 0 (0.0%) | 5 (3.6%) |
| 75 Years and over | 19 (26.4%) | 0 (0.0%) |
Disability Class: Ambulatory Difficulty
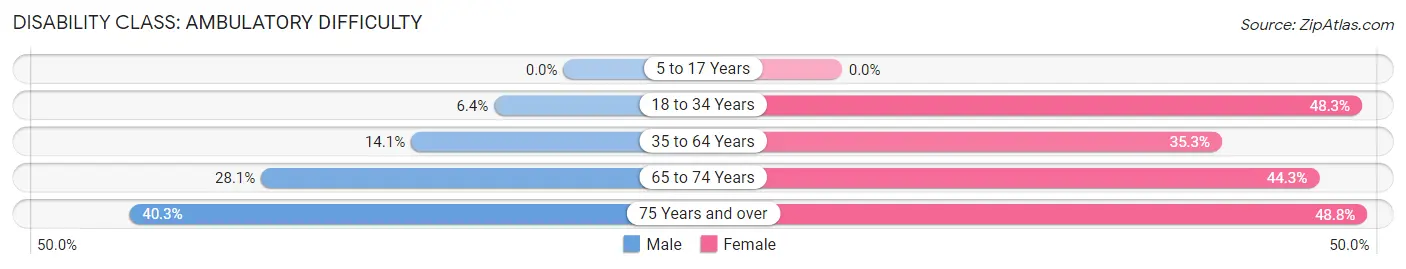
| Age Bracket | Male | Female |
| 5 to 17 Years | 0 (0.0%) | 0 (0.0%) |
| 18 to 34 Years | 11 (6.4%) | 111 (48.3%) |
| 35 to 64 Years | 41 (14.1%) | 128 (35.3%) |
| 65 to 74 Years | 23 (28.1%) | 62 (44.3%) |
| 75 Years and over | 29 (40.3%) | 59 (48.8%) |
Disability Class: Self-Care Difficulty
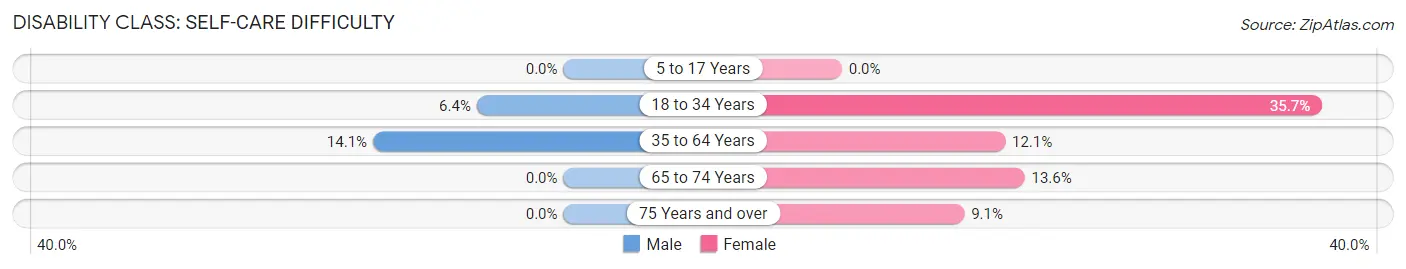
| Age Bracket | Male | Female |
| 5 to 17 Years | 0 (0.0%) | 0 (0.0%) |
| 18 to 34 Years | 11 (6.4%) | 82 (35.6%) |
| 35 to 64 Years | 41 (14.1%) | 44 (12.1%) |
| 65 to 74 Years | 0 (0.0%) | 19 (13.6%) |
| 75 Years and over | 0 (0.0%) | 11 (9.1%) |
Technology Access in Cumberland
Computing Device Access in Cumberland
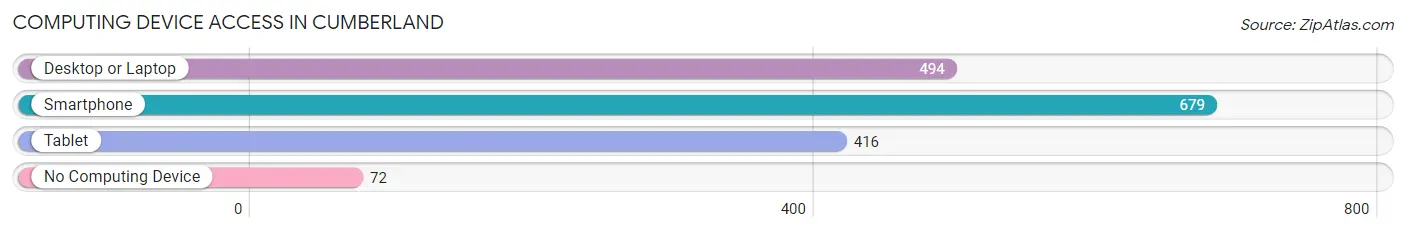
| Device Type | # Households | % Households |
| Desktop or Laptop | 494 | 59.6% |
| Smartphone | 679 | 81.9% |
| Tablet | 416 | 50.2% |
| No Computing Device | 72 | 8.7% |
| Total | 829 | 100.0% |
Internet Access in Cumberland
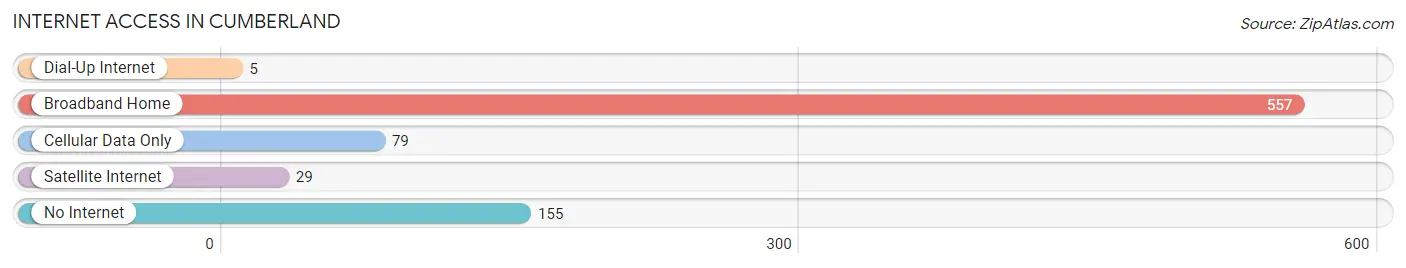
| Internet Type | # Households | % Households |
| Dial-Up Internet | 5 | 0.6% |
| Broadband Home | 557 | 67.2% |
| Cellular Data Only | 79 | 9.5% |
| Satellite Internet | 29 | 3.5% |
| No Internet | 155 | 18.7% |
| Total | 829 | 100.0% |
Cumberland Summary
Cumberland is a small town located in Harlan County, Kentucky. It is situated in the Appalachian Mountains and is surrounded by the Daniel Boone National Forest. The town has a population of approximately 1,500 people and is the county seat of Harlan County.
History
Cumberland was founded in 1810 by a group of settlers from Virginia. The town was named after the Cumberland River, which runs through the area. The town was originally a trading post and was used as a stopover for travelers heading west. In 1819, the town was officially incorporated and the first post office was established.
In the late 19th century, Cumberland became a major coal mining center. The coal industry was the main source of employment for the town’s residents. The town also had a thriving timber industry, which provided lumber for the coal mines.
In the early 20th century, Cumberland experienced a period of economic decline due to the decline of the coal industry. The town’s population decreased significantly and many of the businesses closed. In the late 20th century, the town experienced a resurgence due to the growth of tourism in the area.
Geography
Cumberland is located in the Appalachian Mountains in southeastern Kentucky. The town is situated in the Cumberland Plateau, which is a region of rolling hills and valleys. The town is surrounded by the Daniel Boone National Forest, which is a popular destination for outdoor recreation.
The town is located near the Cumberland River, which is a major tributary of the Ohio River. The town is also located near the Big South Fork National River and Recreation Area, which is a popular destination for camping, hiking, and fishing.
Economy
The economy of Cumberland is largely based on tourism. The town is a popular destination for outdoor recreation, such as camping, hiking, and fishing. The town also has a thriving arts and culture scene, with several galleries and museums.
The town is also home to several small businesses, such as restaurants, shops, and hotels. The town is also home to a number of manufacturing companies, which produce a variety of products, such as furniture, clothing, and electronics.
Demographics
As of the 2010 census, the population of Cumberland was 1,500. The town has a median household income of $30,000 and a poverty rate of 22%. The town is predominantly white, with a small African American population. The town also has a small Hispanic population.
The town is served by the Harlan County School District, which includes two elementary schools, one middle school, and one high school. The town also has a public library and a number of churches.
Conclusion
Cumberland is a small town located in Harlan County, Kentucky. The town has a population of approximately 1,500 people and is the county seat of Harlan County. The town was founded in 1810 and was originally a trading post. In the late 19th century, Cumberland became a major coal mining center. In the early 20th century, the town experienced a period of economic decline due to the decline of the coal industry. In the late 20th century, the town experienced a resurgence due to the growth of tourism in the area. The economy of Cumberland is largely based on tourism and the town is a popular destination for outdoor recreation. The town is predominantly white, with a small African American and Hispanic population. The town is served by the Harlan County School District and has a public library and a number of churches.
Common Questions
What is Per Capita Income in Cumberland?
Per Capita income in Cumberland is $14,896.
What is the Median Family Income in Cumberland?
Median Family Income in Cumberland is $34,101.
What is the Median Household income in Cumberland?
Median Household Income in Cumberland is $32,716.
What is Inequality or Gini Index in Cumberland?
Inequality or Gini Index in Cumberland is 0.53.
What is the Total Population of Cumberland?
Total Population of Cumberland is 2,390.
What is the Total Male Population of Cumberland?
Total Male Population of Cumberland is 1,035.
What is the Total Female Population of Cumberland?
Total Female Population of Cumberland is 1,355.
What is the Ratio of Males per 100 Females in Cumberland?
There are 76.38 Males per 100 Females in Cumberland.
What is the Ratio of Females per 100 Males in Cumberland?
There are 130.92 Females per 100 Males in Cumberland.
What is the Median Population Age in Cumberland?
Median Population Age in Cumberland is 33.6 Years.
What is the Average Family Size in Cumberland
Average Family Size in Cumberland is 3.7 People.
What is the Average Household Size in Cumberland
Average Household Size in Cumberland is 2.8 People.
How Large is the Labor Force in Cumberland?
There are 591 People in the Labor Forcein in Cumberland.
What is the Percentage of People in the Labor Force in Cumberland?
37.0% of People are in the Labor Force in Cumberland.
What is the Unemployment Rate in Cumberland?
Unemployment Rate in Cumberland is 42.5%.