Stanford, KY Map & Demographics
Stanford Map
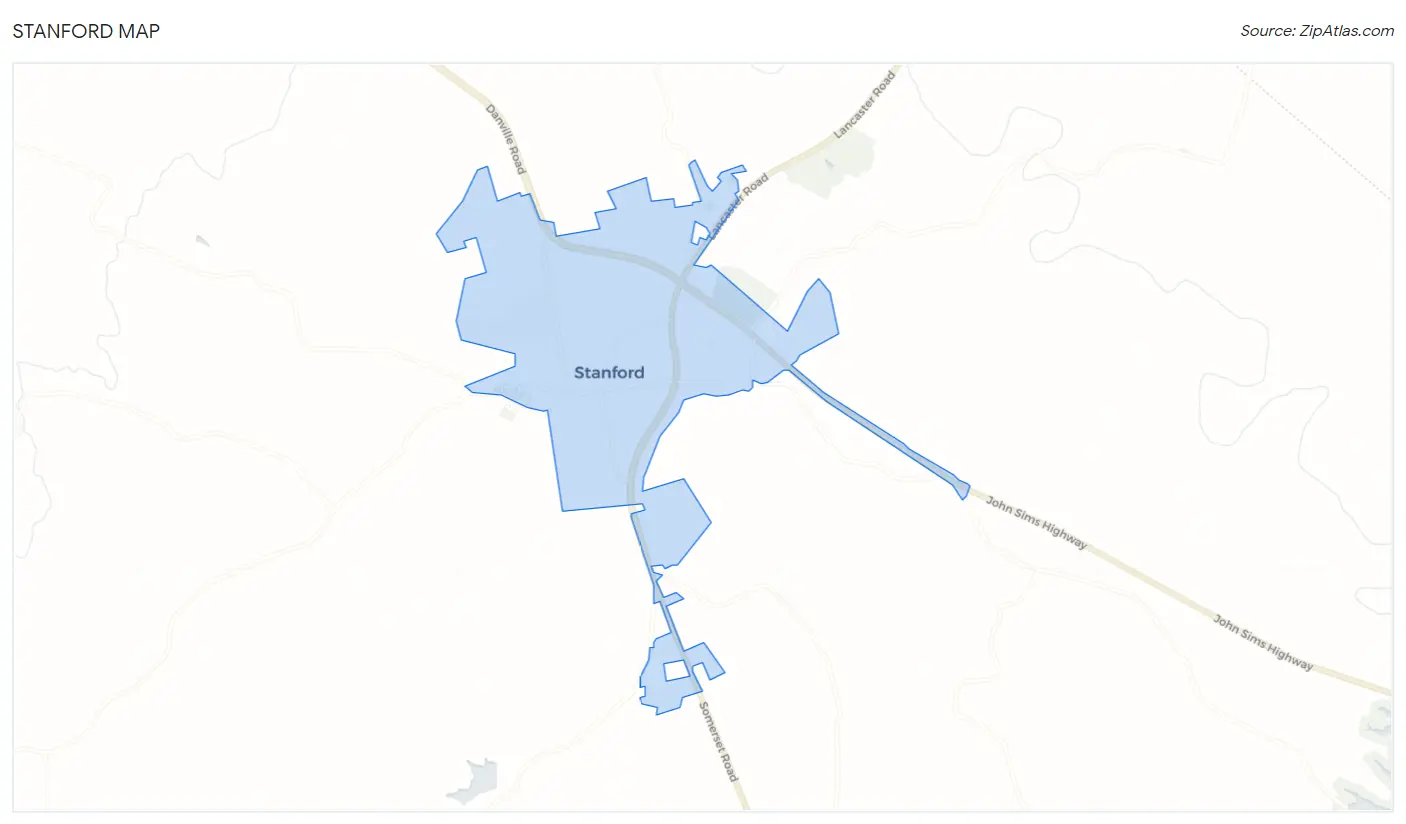
Stanford Overview
$27,942
PER CAPITA INCOME
$69,667
AVG FAMILY INCOME
$57,618
AVG HOUSEHOLD INCOME
35.3%
WAGE / INCOME GAP [ % ]
64.7¢/ $1
WAGE / INCOME GAP [ $ ]
0.46
INEQUALITY / GINI INDEX
3,654
TOTAL POPULATION
1,837
MALE POPULATION
1,817
FEMALE POPULATION
101.10
MALES / 100 FEMALES
98.91
FEMALES / 100 MALES
45.5
MEDIAN AGE
3.0
AVG FAMILY SIZE
2.4
AVG HOUSEHOLD SIZE
1,408
LABOR FORCE [ PEOPLE ]
47.3%
PERCENT IN LABOR FORCE
3.3%
UNEMPLOYMENT RATE
Stanford Zip Codes
Stanford Area Codes
Income in Stanford
Income Overview in Stanford
Per Capita Income in Stanford is $27,942, while median incomes of families and households are $69,667 and $57,618 respectively.
| Characteristic | Number | Measure |
| Per Capita Income | 3,654 | $27,942 |
| Median Family Income | 908 | $69,667 |
| Mean Family Income | 908 | $91,567 |
| Median Household Income | 1,411 | $57,618 |
| Mean Household Income | 1,411 | $70,585 |
| Income Deficit | 908 | $0 |
| Wage / Income Gap (%) | 3,654 | 35.28% |
| Wage / Income Gap ($) | 3,654 | 64.72¢ per $1 |
| Gini / Inequality Index | 3,654 | 0.46 |
Earnings by Sex in Stanford
Average Earnings in Stanford are $34,409, $41,439 for men and $26,818 for women, a difference of 35.3%.
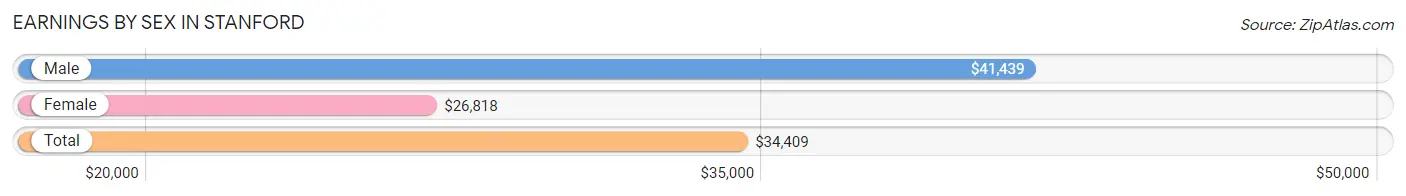
| Sex | Number | Average Earnings |
| Male | 846 (53.7%) | $41,439 |
| Female | 728 (46.3%) | $26,818 |
| Total | 1,574 (100.0%) | $34,409 |
Earnings by Sex by Income Bracket in Stanford
The most common earnings brackets in Stanford are $45,000 to $49,999 for men (141 | 16.7%) and $30,000 to $34,999 for women (87 | 11.9%).
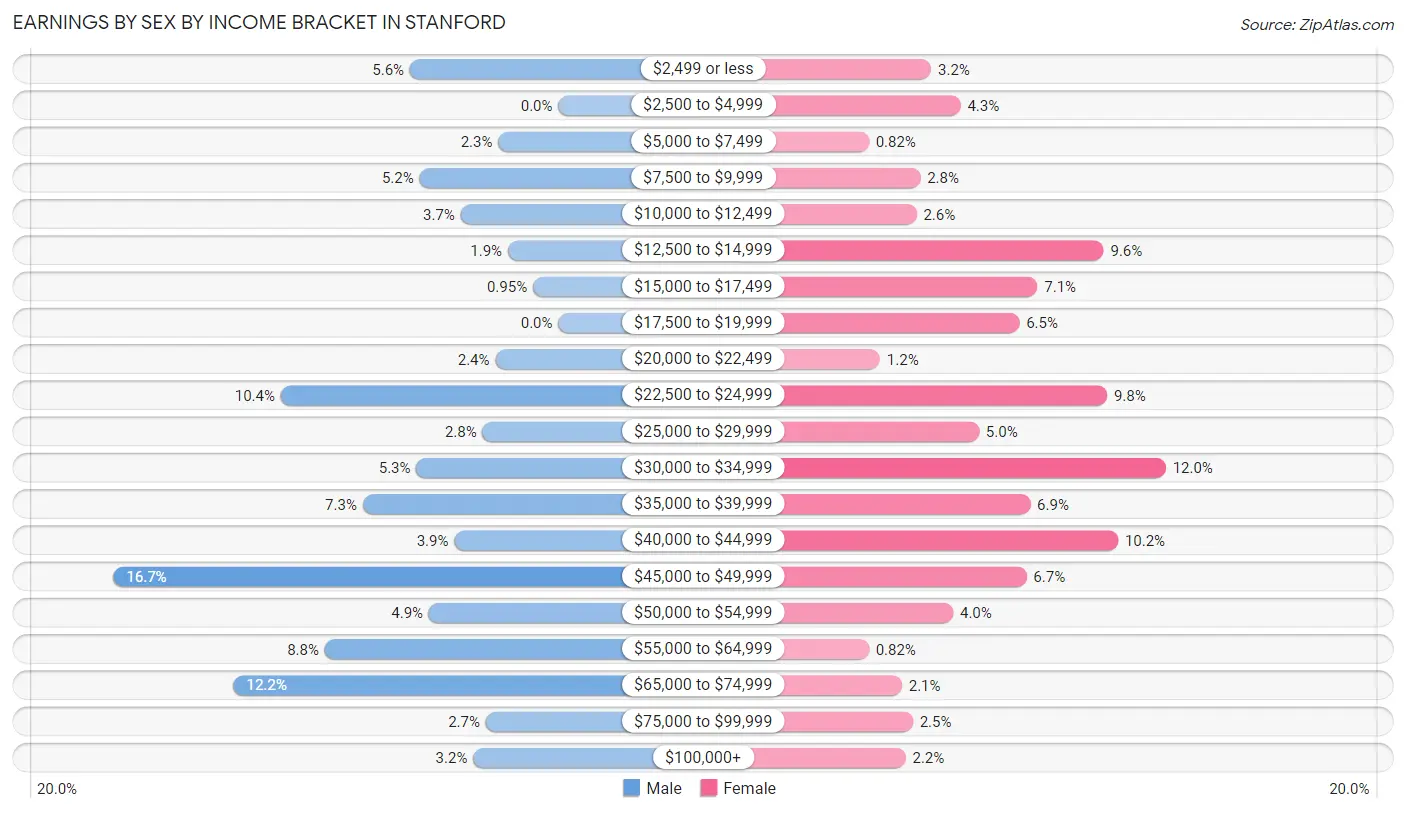
| Income | Male | Female |
| $2,499 or less | 47 (5.6%) | 23 (3.2%) |
| $2,500 to $4,999 | 0 (0.0%) | 31 (4.3%) |
| $5,000 to $7,499 | 19 (2.2%) | 6 (0.8%) |
| $7,500 to $9,999 | 44 (5.2%) | 20 (2.8%) |
| $10,000 to $12,499 | 31 (3.7%) | 19 (2.6%) |
| $12,500 to $14,999 | 16 (1.9%) | 70 (9.6%) |
| $15,000 to $17,499 | 8 (0.9%) | 52 (7.1%) |
| $17,500 to $19,999 | 0 (0.0%) | 47 (6.5%) |
| $20,000 to $22,499 | 20 (2.4%) | 9 (1.2%) |
| $22,500 to $24,999 | 88 (10.4%) | 71 (9.8%) |
| $25,000 to $29,999 | 24 (2.8%) | 36 (5.0%) |
| $30,000 to $34,999 | 45 (5.3%) | 87 (11.9%) |
| $35,000 to $39,999 | 62 (7.3%) | 50 (6.9%) |
| $40,000 to $44,999 | 33 (3.9%) | 74 (10.2%) |
| $45,000 to $49,999 | 141 (16.7%) | 49 (6.7%) |
| $50,000 to $54,999 | 41 (4.9%) | 29 (4.0%) |
| $55,000 to $64,999 | 74 (8.7%) | 6 (0.8%) |
| $65,000 to $74,999 | 103 (12.2%) | 15 (2.1%) |
| $75,000 to $99,999 | 23 (2.7%) | 18 (2.5%) |
| $100,000+ | 27 (3.2%) | 16 (2.2%) |
| Total | 846 (100.0%) | 728 (100.0%) |
Earnings by Sex by Educational Attainment in Stanford
Average earnings in Stanford are $46,524 for men and $32,746 for women, a difference of 29.6%. Men with an educational attainment of graduate degree enjoy the highest average annual earnings of $74,375, while those with less than high school education earn the least with $32,857. Women with an educational attainment of bachelor's degree earn the most with the average annual earnings of $77,841, while those with high school diploma education have the smallest earnings of $29,196.
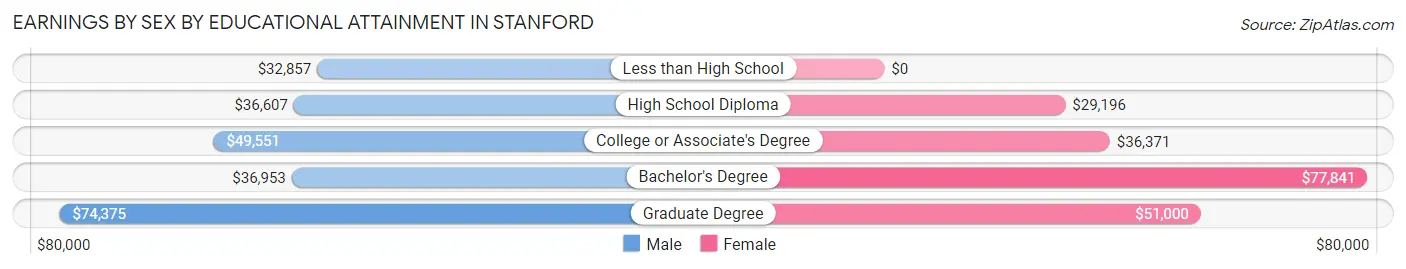
| Educational Attainment | Male Income | Female Income |
| Less than High School | $32,857 | $0 |
| High School Diploma | $36,607 | $29,196 |
| College or Associate's Degree | $49,551 | $36,371 |
| Bachelor's Degree | $36,953 | $77,841 |
| Graduate Degree | $74,375 | $51,000 |
| Total | $46,524 | $32,746 |
Family Income in Stanford
Family Income Brackets in Stanford
According to the Stanford family income data, there are 317 families falling into the $50,000 to $74,999 income range, which is the most common income bracket and makes up 34.9% of all families. Conversely, the $25,000 to $34,999 income bracket is the least frequent group with only 18 families (2.0%) belonging to this category.
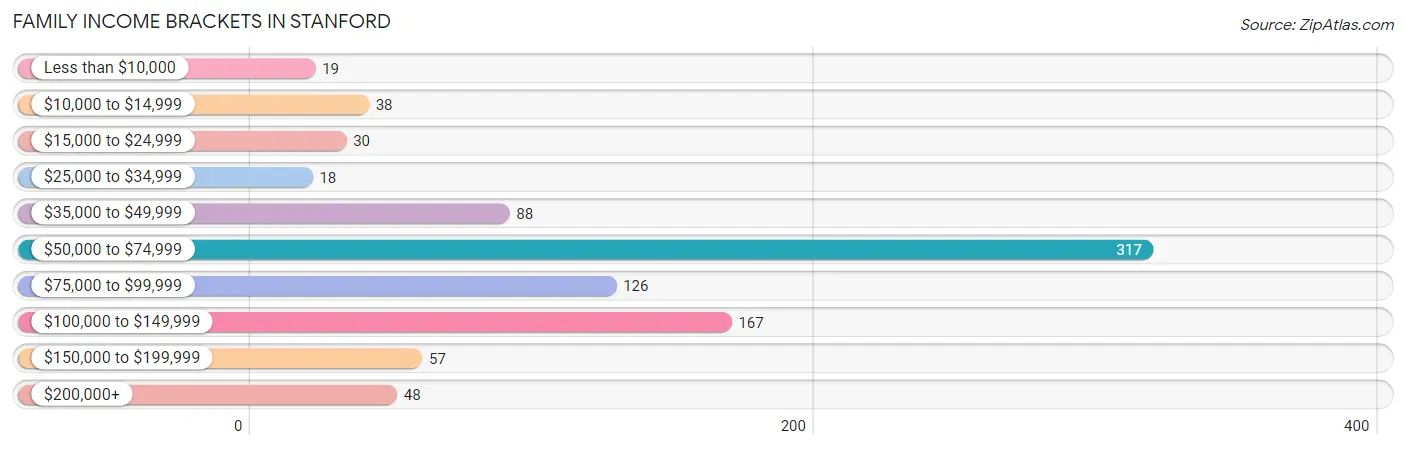
| Income Bracket | # Families | % Families |
| Less than $10,000 | 19 | 2.1% |
| $10,000 to $14,999 | 38 | 4.2% |
| $15,000 to $24,999 | 30 | 3.3% |
| $25,000 to $34,999 | 18 | 2.0% |
| $35,000 to $49,999 | 88 | 9.7% |
| $50,000 to $74,999 | 317 | 34.9% |
| $75,000 to $99,999 | 126 | 13.9% |
| $100,000 to $149,999 | 167 | 18.4% |
| $150,000 to $199,999 | 57 | 6.3% |
| $200,000+ | 48 | 5.3% |
Family Income by Famaliy Size in Stanford
5-person families (63 | 6.9%) account for the highest median family income in Stanford with $140,125 per family, while 2-person families (373 | 41.1%) have the highest median income of $29,150 per family member.
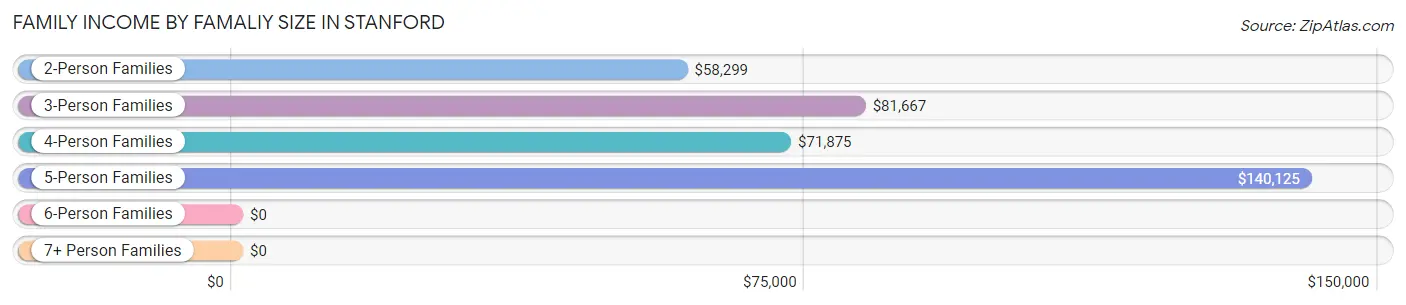
| Income Bracket | # Families | Median Income |
| 2-Person Families | 373 (41.1%) | $58,299 |
| 3-Person Families | 214 (23.6%) | $81,667 |
| 4-Person Families | 214 (23.6%) | $71,875 |
| 5-Person Families | 63 (6.9%) | $140,125 |
| 6-Person Families | 2 (0.2%) | $0 |
| 7+ Person Families | 42 (4.6%) | $0 |
| Total | 908 (100.0%) | $69,667 |
Family Income by Number of Earners in Stanford
The median family income in Stanford is $69,667, with families comprising 3+ earners (62) having the highest median family income of $166,923, while families with no earners (204) have the lowest median family income of $48,000, accounting for 6.8% and 22.5% of families, respectively.
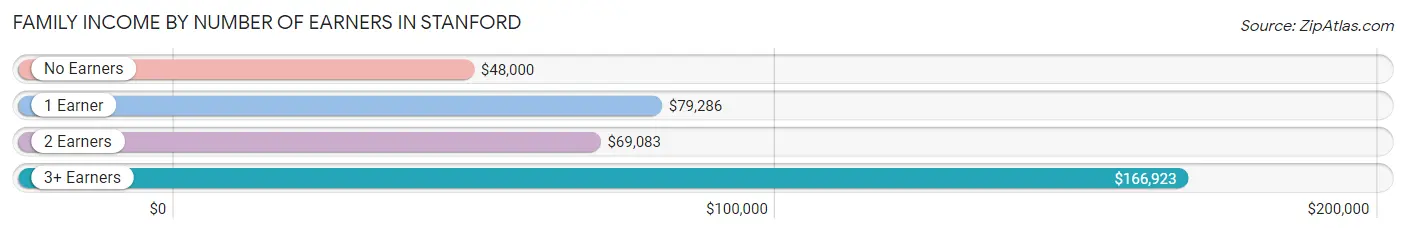
| Number of Earners | # Families | Median Income |
| No Earners | 204 (22.5%) | $48,000 |
| 1 Earner | 220 (24.2%) | $79,286 |
| 2 Earners | 422 (46.5%) | $69,083 |
| 3+ Earners | 62 (6.8%) | $166,923 |
| Total | 908 (100.0%) | $69,667 |
Household Income in Stanford
Household Income Brackets in Stanford
With 293 households falling in the category, the $50,000 to $74,999 income range is the most frequent in Stanford, accounting for 20.8% of all households. In contrast, only 48 households (3.4%) fall into the $200,000+ income bracket, making it the least populous group.
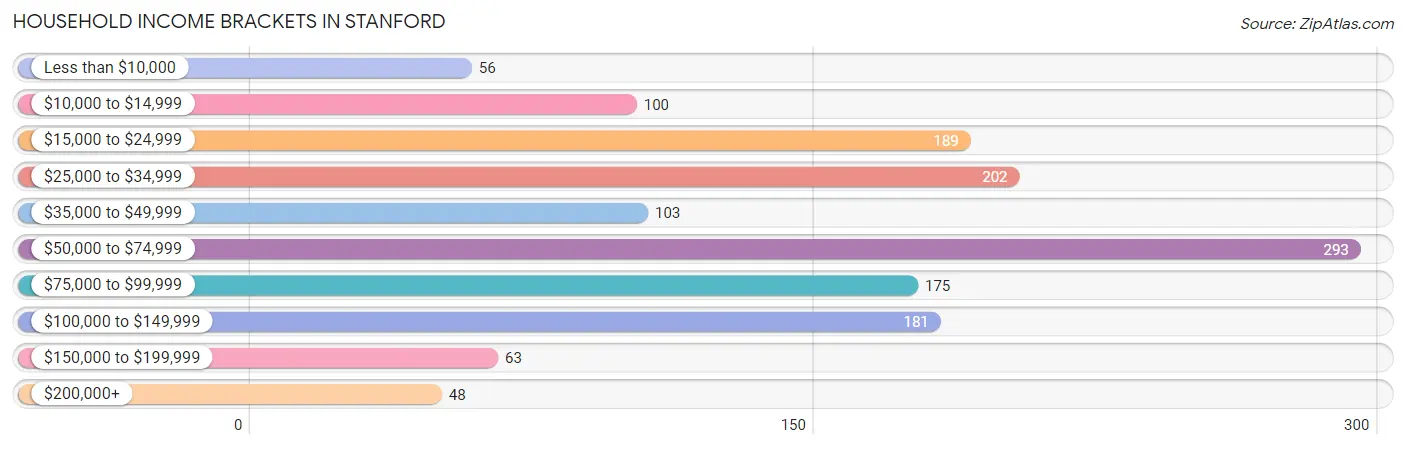
| Income Bracket | # Households | % Households |
| Less than $10,000 | 56 | 4.0% |
| $10,000 to $14,999 | 100 | 7.1% |
| $15,000 to $24,999 | 189 | 13.4% |
| $25,000 to $34,999 | 202 | 14.3% |
| $35,000 to $49,999 | 103 | 7.3% |
| $50,000 to $74,999 | 293 | 20.8% |
| $75,000 to $99,999 | 175 | 12.4% |
| $100,000 to $149,999 | 181 | 12.8% |
| $150,000 to $199,999 | 63 | 4.5% |
| $200,000+ | 48 | 3.4% |
Household Income by Householder Age in Stanford
The median household income in Stanford is $57,618, with the highest median household income of $69,250 found in the 25 to 44 years age bracket for the primary householder. A total of 298 households (21.1%) fall into this category. Meanwhile, the 15 to 24 years age bracket for the primary householder has the lowest median household income of $0, with 5 households (0.4%) in this group.
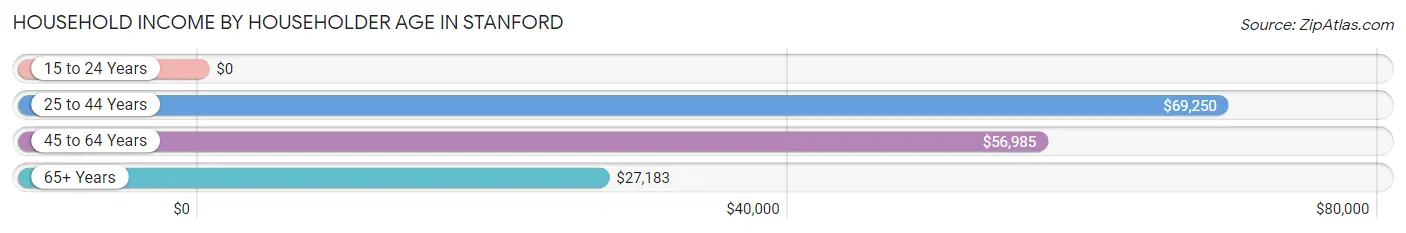
| Income Bracket | # Households | Median Income |
| 15 to 24 Years | 5 (0.4%) | $0 |
| 25 to 44 Years | 298 (21.1%) | $69,250 |
| 45 to 64 Years | 614 (43.5%) | $56,985 |
| 65+ Years | 494 (35.0%) | $27,183 |
| Total | 1,411 (100.0%) | $57,618 |
Poverty in Stanford
Income Below Poverty by Sex and Age in Stanford
With 13.1% poverty level for males and 8.6% for females among the residents of Stanford, 12 to 14 year old males and 15 year old females are the most vulnerable to poverty, with 25 males (43.9%) and 10 females (24.4%) in their respective age groups living below the poverty level.
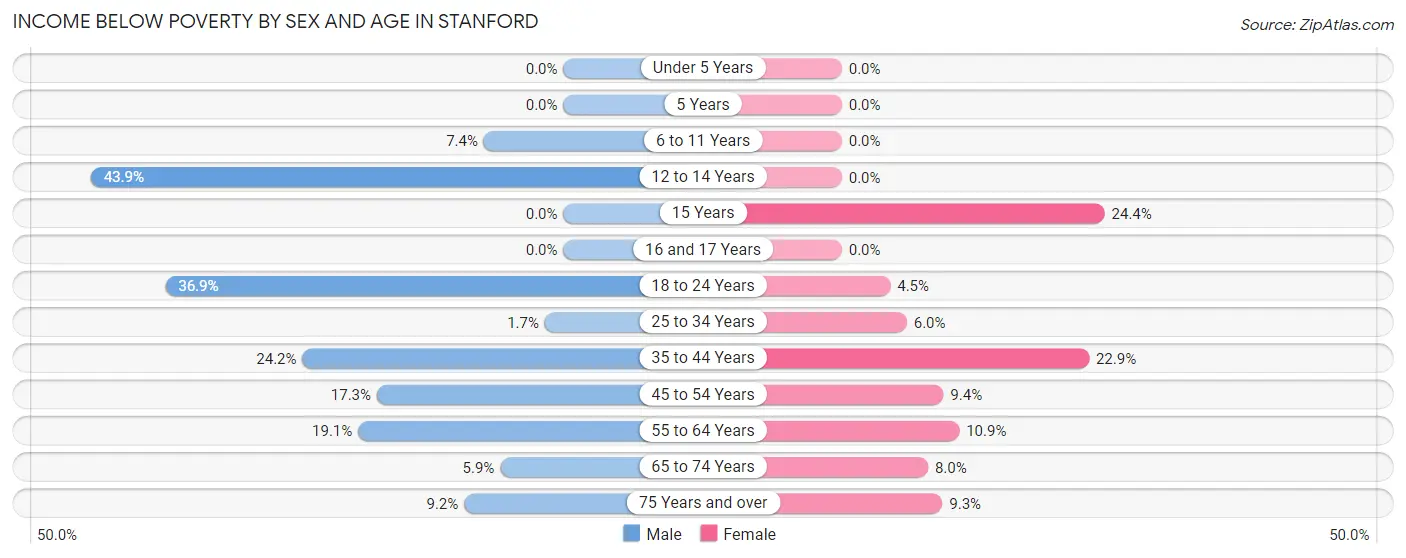
| Age Bracket | Male | Female |
| Under 5 Years | 0 (0.0%) | 0 (0.0%) |
| 5 Years | 0 (0.0%) | 0 (0.0%) |
| 6 to 11 Years | 9 (7.4%) | 0 (0.0%) |
| 12 to 14 Years | 25 (43.9%) | 0 (0.0%) |
| 15 Years | 0 (0.0%) | 10 (24.4%) |
| 16 and 17 Years | 0 (0.0%) | 0 (0.0%) |
| 18 to 24 Years | 41 (36.9%) | 5 (4.5%) |
| 25 to 34 Years | 4 (1.7%) | 12 (6.0%) |
| 35 to 44 Years | 31 (24.2%) | 39 (22.9%) |
| 45 to 54 Years | 36 (17.3%) | 20 (9.4%) |
| 55 to 64 Years | 52 (19.1%) | 29 (10.9%) |
| 65 to 74 Years | 15 (5.9%) | 16 (8.0%) |
| 75 Years and over | 7 (9.2%) | 18 (9.3%) |
| Total | 220 (13.1%) | 149 (8.6%) |
Income Above Poverty by Sex and Age in Stanford
According to the poverty statistics in Stanford, males aged under 5 years and females aged under 5 years are the age groups that are most secure financially, with 100.0% of males and 100.0% of females in these age groups living above the poverty line.
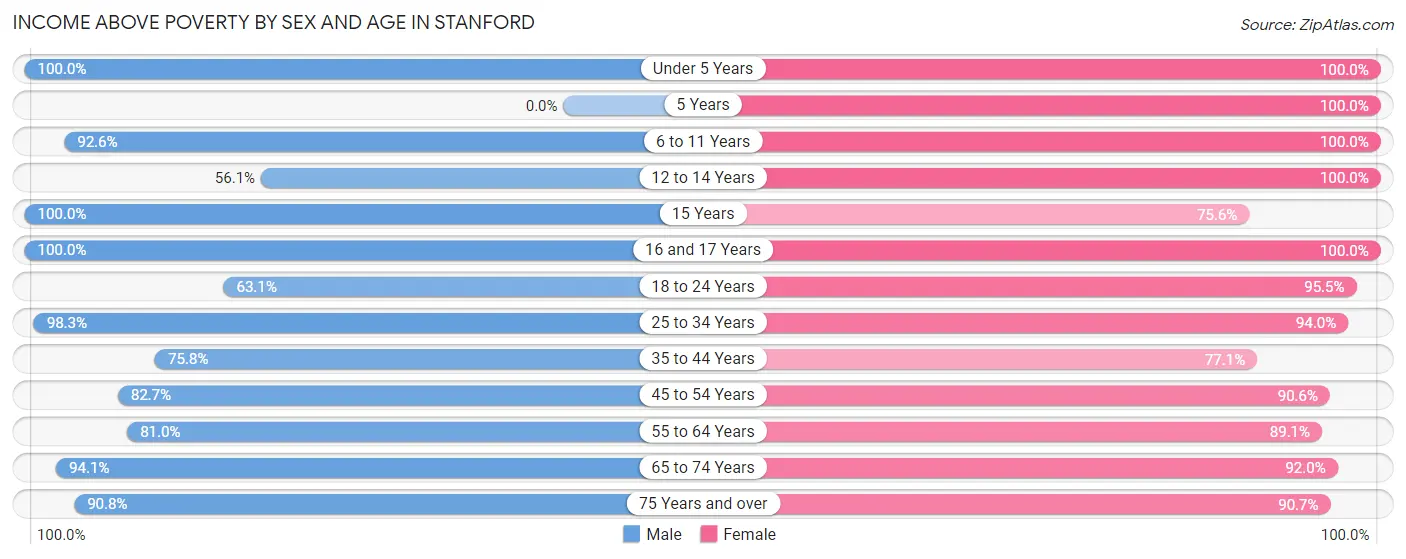
| Age Bracket | Male | Female |
| Under 5 Years | 134 (100.0%) | 28 (100.0%) |
| 5 Years | 0 (0.0%) | 11 (100.0%) |
| 6 to 11 Years | 113 (92.6%) | 209 (100.0%) |
| 12 to 14 Years | 32 (56.1%) | 40 (100.0%) |
| 15 Years | 35 (100.0%) | 31 (75.6%) |
| 16 and 17 Years | 52 (100.0%) | 56 (100.0%) |
| 18 to 24 Years | 70 (63.1%) | 106 (95.5%) |
| 25 to 34 Years | 228 (98.3%) | 187 (94.0%) |
| 35 to 44 Years | 97 (75.8%) | 131 (77.1%) |
| 45 to 54 Years | 172 (82.7%) | 192 (90.6%) |
| 55 to 64 Years | 221 (80.9%) | 237 (89.1%) |
| 65 to 74 Years | 241 (94.1%) | 184 (92.0%) |
| 75 Years and over | 69 (90.8%) | 175 (90.7%) |
| Total | 1,464 (86.9%) | 1,587 (91.4%) |
Income Below Poverty Among Married-Couple Families in Stanford
The poverty statistics for married-couple families in Stanford show that 4.4% or 29 of the total 655 families live below the poverty line. Families with no children have the highest poverty rate of 8.3%, comprising of 29 families. On the other hand, families with 1 or 2 children have the lowest poverty rate of 0.0%, which includes 0 families.
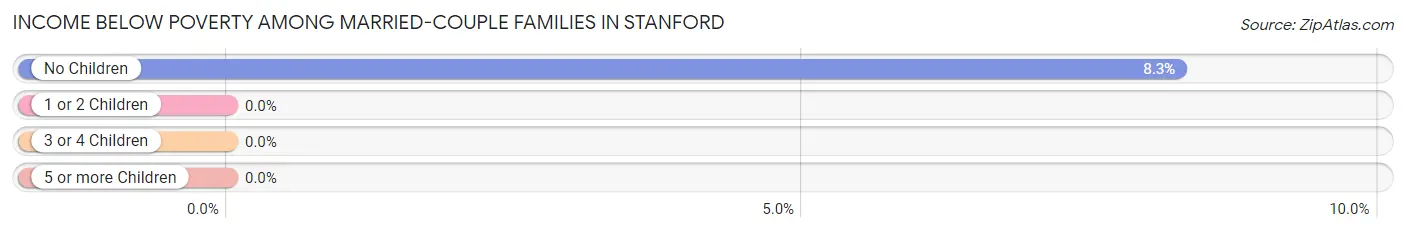
| Children | Above Poverty | Below Poverty |
| No Children | 322 (91.7%) | 29 (8.3%) |
| 1 or 2 Children | 261 (100.0%) | 0 (0.0%) |
| 3 or 4 Children | 43 (100.0%) | 0 (0.0%) |
| 5 or more Children | 0 (0.0%) | 0 (0.0%) |
| Total | 626 (95.6%) | 29 (4.4%) |
Income Below Poverty Among Single-Parent Households in Stanford
According to the poverty data in Stanford, 14.0% or 8 single-father households and 12.8% or 25 single-mother households are living below the poverty line. Among single-father households, those with no children have the highest poverty rate, with 8 households (100.0%) experiencing poverty. Likewise, among single-mother households, those with no children have the highest poverty rate, with 11 households (16.4%) falling below the poverty line.
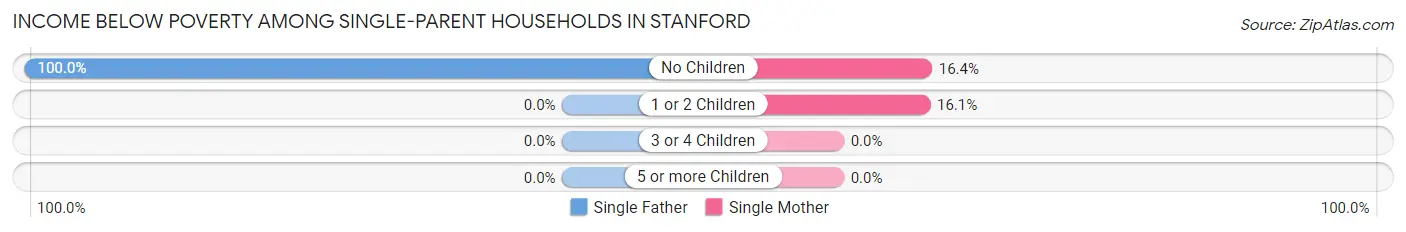
| Children | Single Father | Single Mother |
| No Children | 8 (100.0%) | 11 (16.4%) |
| 1 or 2 Children | 0 (0.0%) | 14 (16.1%) |
| 3 or 4 Children | 0 (0.0%) | 0 (0.0%) |
| 5 or more Children | 0 (0.0%) | 0 (0.0%) |
| Total | 8 (14.0%) | 25 (12.8%) |
Income Below Poverty Among Married-Couple vs Single-Parent Households in Stanford
The poverty data for Stanford shows that 29 of the married-couple family households (4.4%) and 33 of the single-parent households (13.0%) are living below the poverty level. Within the married-couple family households, those with no children have the highest poverty rate, with 29 households (8.3%) falling below the poverty line. Among the single-parent households, those with no children have the highest poverty rate, with 19 household (25.3%) living below poverty.
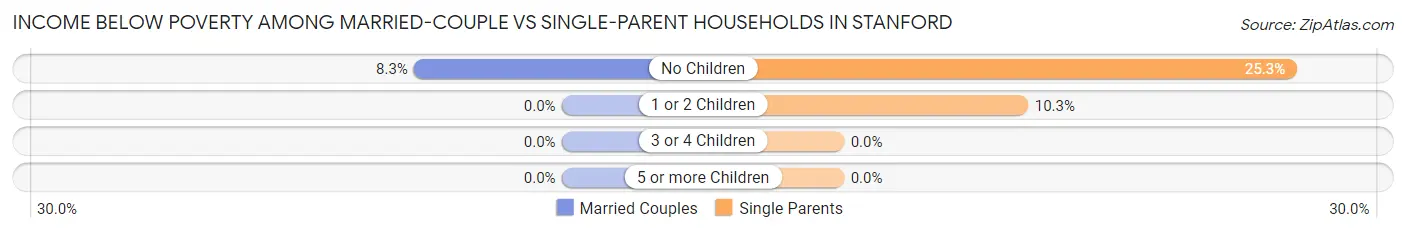
| Children | Married-Couple Families | Single-Parent Households |
| No Children | 29 (8.3%) | 19 (25.3%) |
| 1 or 2 Children | 0 (0.0%) | 14 (10.3%) |
| 3 or 4 Children | 0 (0.0%) | 0 (0.0%) |
| 5 or more Children | 0 (0.0%) | 0 (0.0%) |
| Total | 29 (4.4%) | 33 (13.0%) |
Race in Stanford
The most populous races in Stanford are White / Caucasian (3,351 | 91.7%), Black / African American (188 | 5.1%), and Hispanic or Latino (80 | 2.2%).
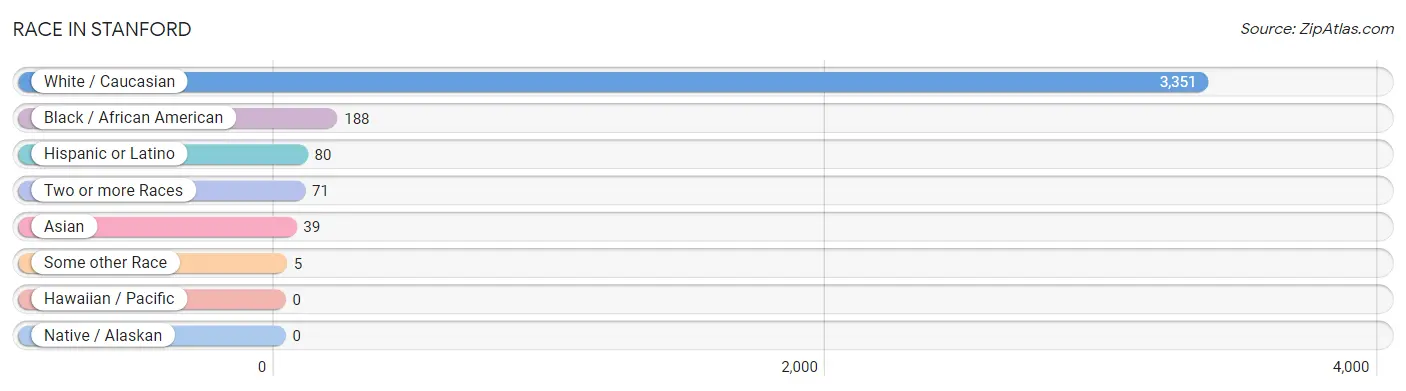
| Race | # Population | % Population |
| Asian | 39 | 1.1% |
| Black / African American | 188 | 5.1% |
| Hawaiian / Pacific | 0 | 0.0% |
| Hispanic or Latino | 80 | 2.2% |
| Native / Alaskan | 0 | 0.0% |
| White / Caucasian | 3,351 | 91.7% |
| Two or more Races | 71 | 1.9% |
| Some other Race | 5 | 0.1% |
| Total | 3,654 | 100.0% |
Ancestry in Stanford
The most populous ancestries reported in Stanford are American (1,359 | 37.2%), English (425 | 11.6%), Irish (201 | 5.5%), German (127 | 3.5%), and European (60 | 1.6%), together accounting for 59.4% of all Stanford residents.
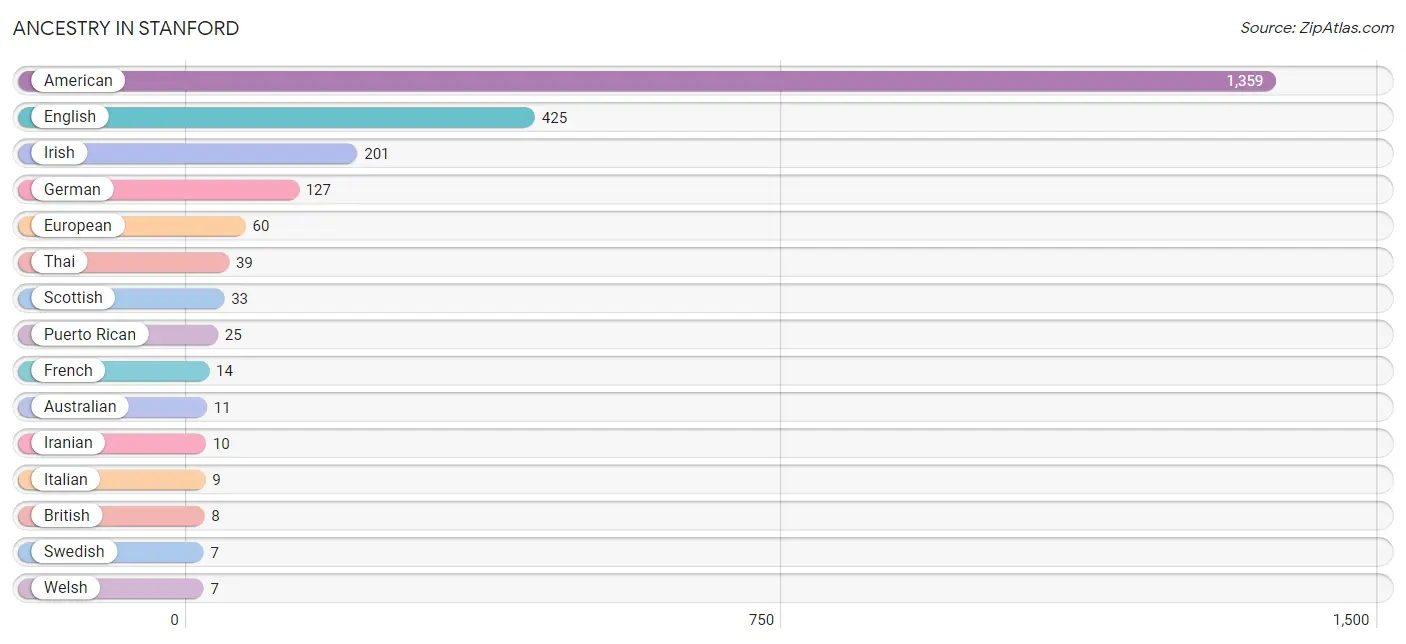
| Ancestry | # Population | % Population |
| American | 1,359 | 37.2% |
| Australian | 11 | 0.3% |
| Austrian | 5 | 0.1% |
| British | 8 | 0.2% |
| Dutch | 3 | 0.1% |
| Eastern European | 6 | 0.2% |
| English | 425 | 11.6% |
| European | 60 | 1.6% |
| French | 14 | 0.4% |
| German | 127 | 3.5% |
| Iranian | 10 | 0.3% |
| Irish | 201 | 5.5% |
| Italian | 9 | 0.3% |
| Puerto Rican | 25 | 0.7% |
| Scottish | 33 | 0.9% |
| Swedish | 7 | 0.2% |
| Thai | 39 | 1.1% |
| Welsh | 7 | 0.2% | View All 18 Rows |
Immigrants in Stanford
The most numerous immigrant groups reported in Stanford came from Asia (16 | 0.4%), South Central Asia (16 | 0.4%), Oceania (13 | 0.4%), Iran (10 | 0.3%), and India (6 | 0.2%), together accounting for 1.7% of all Stanford residents.
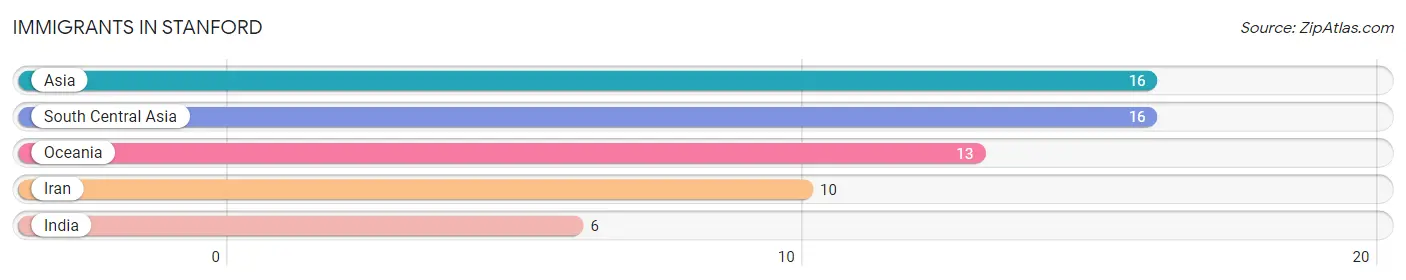
| Immigration Origin | # Population | % Population |
| Asia | 16 | 0.4% |
| India | 6 | 0.2% |
| Iran | 10 | 0.3% |
| Oceania | 13 | 0.4% |
| South Central Asia | 16 | 0.4% | View All 5 Rows |
Sex and Age in Stanford
Sex and Age in Stanford
The most populous age groups in Stanford are 25 to 29 Years (186 | 10.1%) for men and 60 to 64 Years (161 | 8.9%) for women.
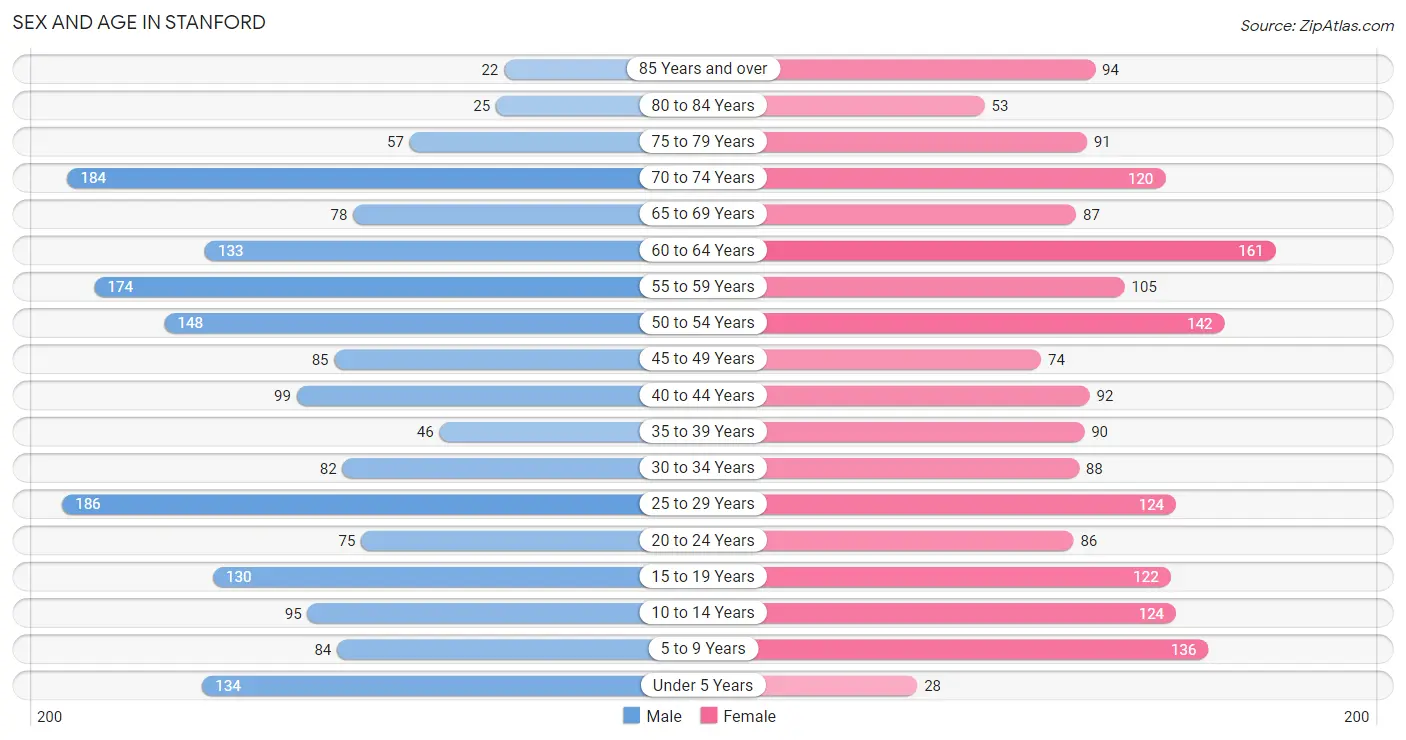
| Age Bracket | Male | Female |
| Under 5 Years | 134 (7.3%) | 28 (1.5%) |
| 5 to 9 Years | 84 (4.6%) | 136 (7.5%) |
| 10 to 14 Years | 95 (5.2%) | 124 (6.8%) |
| 15 to 19 Years | 130 (7.1%) | 122 (6.7%) |
| 20 to 24 Years | 75 (4.1%) | 86 (4.7%) |
| 25 to 29 Years | 186 (10.1%) | 124 (6.8%) |
| 30 to 34 Years | 82 (4.5%) | 88 (4.8%) |
| 35 to 39 Years | 46 (2.5%) | 90 (5.0%) |
| 40 to 44 Years | 99 (5.4%) | 92 (5.1%) |
| 45 to 49 Years | 85 (4.6%) | 74 (4.1%) |
| 50 to 54 Years | 148 (8.1%) | 142 (7.8%) |
| 55 to 59 Years | 174 (9.5%) | 105 (5.8%) |
| 60 to 64 Years | 133 (7.2%) | 161 (8.9%) |
| 65 to 69 Years | 78 (4.3%) | 87 (4.8%) |
| 70 to 74 Years | 184 (10.0%) | 120 (6.6%) |
| 75 to 79 Years | 57 (3.1%) | 91 (5.0%) |
| 80 to 84 Years | 25 (1.4%) | 53 (2.9%) |
| 85 Years and over | 22 (1.2%) | 94 (5.2%) |
| Total | 1,837 (100.0%) | 1,817 (100.0%) |
Families and Households in Stanford
Median Family Size in Stanford
The median family size in Stanford is 3.04 persons per family, with single female/mother families (196 | 21.6%) accounting for the largest median family size of 3.55 persons per family. On the other hand, single male/father families (57 | 6.3%) represent the smallest median family size with 1.82 persons per family.
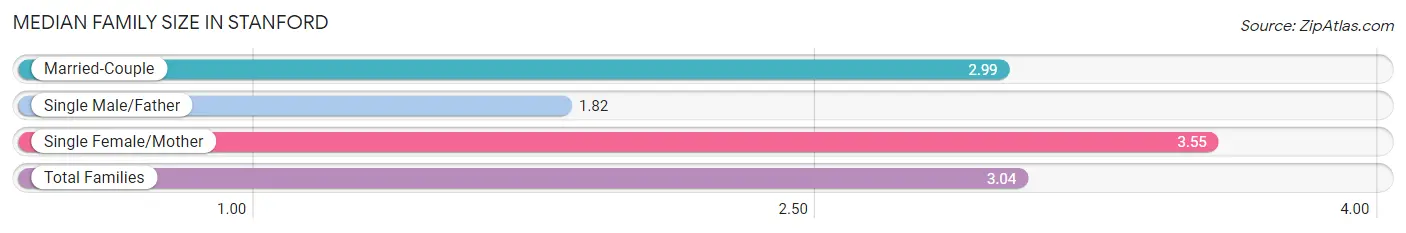
| Family Type | # Families | Family Size |
| Married-Couple | 655 (72.1%) | 2.99 |
| Single Male/Father | 57 (6.3%) | 1.82 |
| Single Female/Mother | 196 (21.6%) | 3.55 |
| Total Families | 908 (100.0%) | 3.04 |
Median Household Size in Stanford
The median household size in Stanford is 2.42 persons per household, with single female/mother households (196 | 13.9%) accounting for the largest median household size of 4.02 persons per household. non-family households (503 | 35.6%) represent the smallest median household size with 1.07 persons per household.
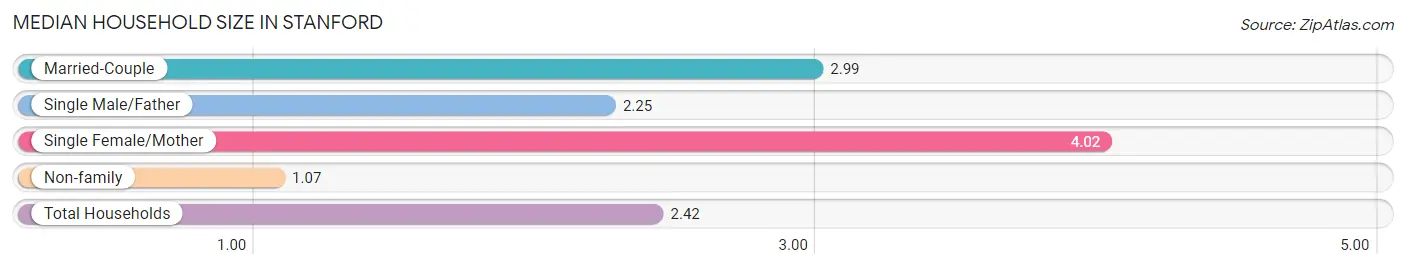
| Household Type | # Households | Household Size |
| Married-Couple | 655 (46.4%) | 2.99 |
| Single Male/Father | 57 (4.0%) | 2.25 |
| Single Female/Mother | 196 (13.9%) | 4.02 |
| Non-family | 503 (35.6%) | 1.07 |
| Total Households | 1,411 (100.0%) | 2.42 |
Household Size by Marriage Status in Stanford
Out of a total of 1,411 households in Stanford, 908 (64.3%) are family households, while 503 (35.6%) are nonfamily households. The most numerous type of family households are 2-person households, comprising 330, and the most common type of nonfamily households are 1-person households, comprising 470.
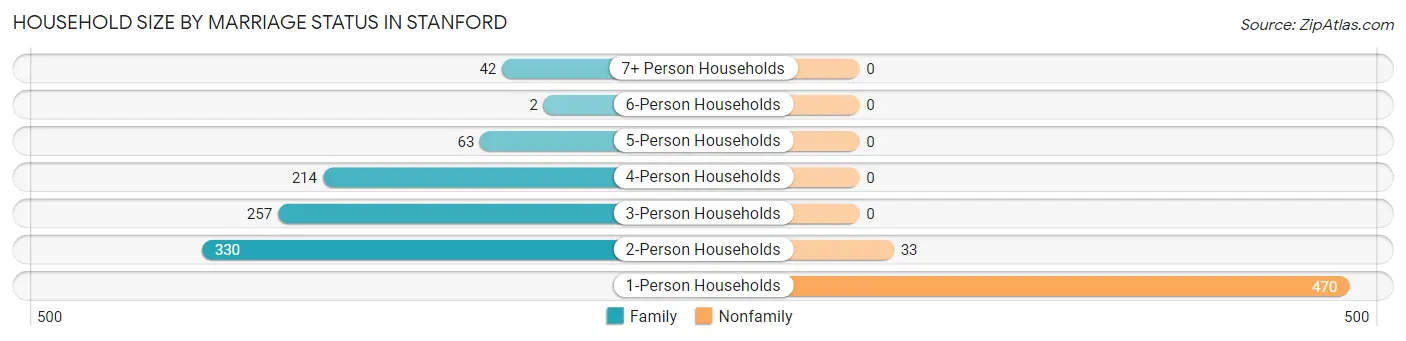
| Household Size | Family Households | Nonfamily Households |
| 1-Person Households | - | 470 (33.3%) |
| 2-Person Households | 330 (23.4%) | 33 (2.3%) |
| 3-Person Households | 257 (18.2%) | 0 (0.0%) |
| 4-Person Households | 214 (15.2%) | 0 (0.0%) |
| 5-Person Households | 63 (4.5%) | 0 (0.0%) |
| 6-Person Households | 2 (0.1%) | 0 (0.0%) |
| 7+ Person Households | 42 (3.0%) | 0 (0.0%) |
| Total | 908 (64.3%) | 503 (35.6%) |
Female Fertility in Stanford
Fertility by Age in Stanford
Average fertility rate in Stanford is 42.0 births per 1,000 women. Women in the age bracket of 20 to 34 years have the highest fertility rate with 101.0 births per 1,000 women. Women in the age bracket of 20 to 34 years acount for 100.0% of all women with births.
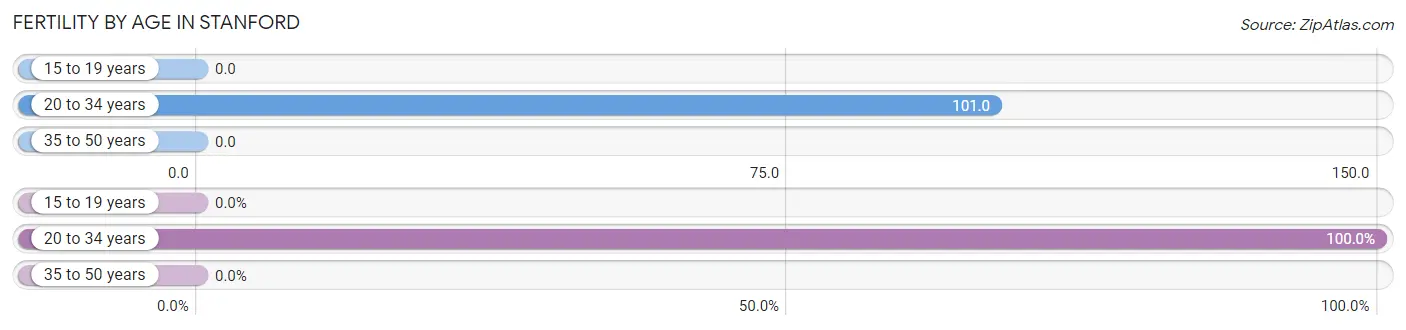
| Age Bracket | Women with Births | Births / 1,000 Women |
| 15 to 19 years | 0 (0.0%) | 0.0 |
| 20 to 34 years | 30 (100.0%) | 101.0 |
| 35 to 50 years | 0 (0.0%) | 0.0 |
| Total | 30 (100.0%) | 42.0 |
Fertility by Age by Marriage Status in Stanford
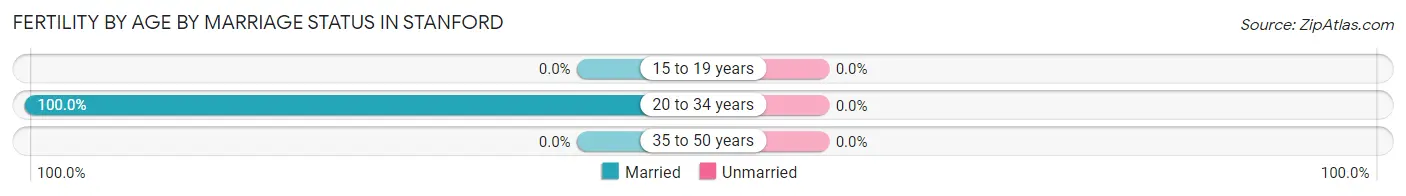
| Age Bracket | Married | Unmarried |
| 15 to 19 years | 0 (0.0%) | 0 (0.0%) |
| 20 to 34 years | 30 (100.0%) | 0 (0.0%) |
| 35 to 50 years | 0 (0.0%) | 0 (0.0%) |
| Total | 30 (100.0%) | 0 (0.0%) |
Fertility by Education in Stanford
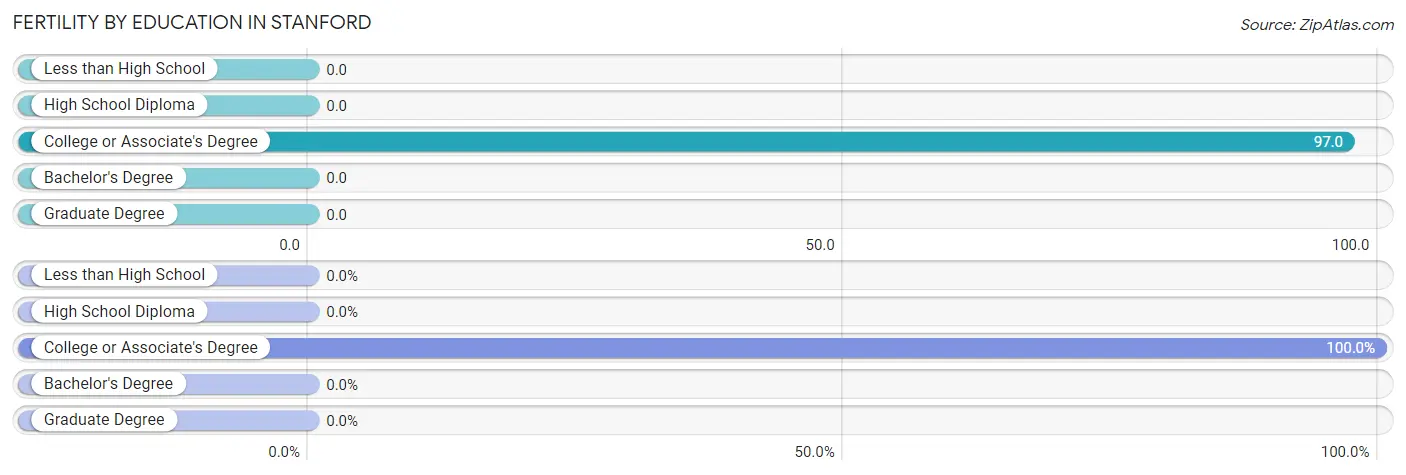
| Educational Attainment | Women with Births | Births / 1,000 Women |
| Less than High School | 0 (0.0%) | 0.0 |
| High School Diploma | 0 (0.0%) | 0.0 |
| College or Associate's Degree | 30 (100.0%) | 97.0 |
| Bachelor's Degree | 0 (0.0%) | 0.0 |
| Graduate Degree | 0 (0.0%) | 0.0 |
| Total | 30 (100.0%) | 42.0 |
Fertility by Education by Marriage Status in Stanford
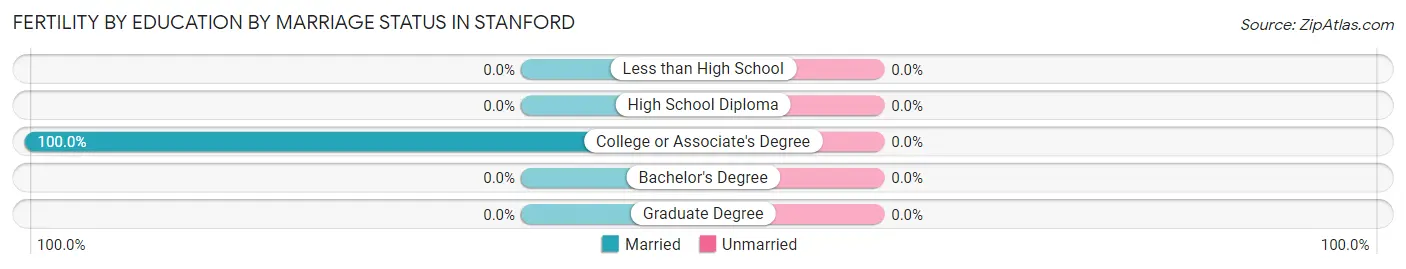
| Educational Attainment | Married | Unmarried |
| Less than High School | 0 (0.0%) | 0 (0.0%) |
| High School Diploma | 0 (0.0%) | 0 (0.0%) |
| College or Associate's Degree | 30 (100.0%) | 0 (0.0%) |
| Bachelor's Degree | 0 (0.0%) | 0 (0.0%) |
| Graduate Degree | 0 (0.0%) | 0 (0.0%) |
| Total | 30 (100.0%) | 0 (0.0%) |
Employment Characteristics in Stanford
Employment by Class of Employer in Stanford
Among the 1,326 employed individuals in Stanford, private company employees (725 | 54.7%), state government employees (245 | 18.5%), and local government employees (173 | 13.1%) make up the most common classes of employment.
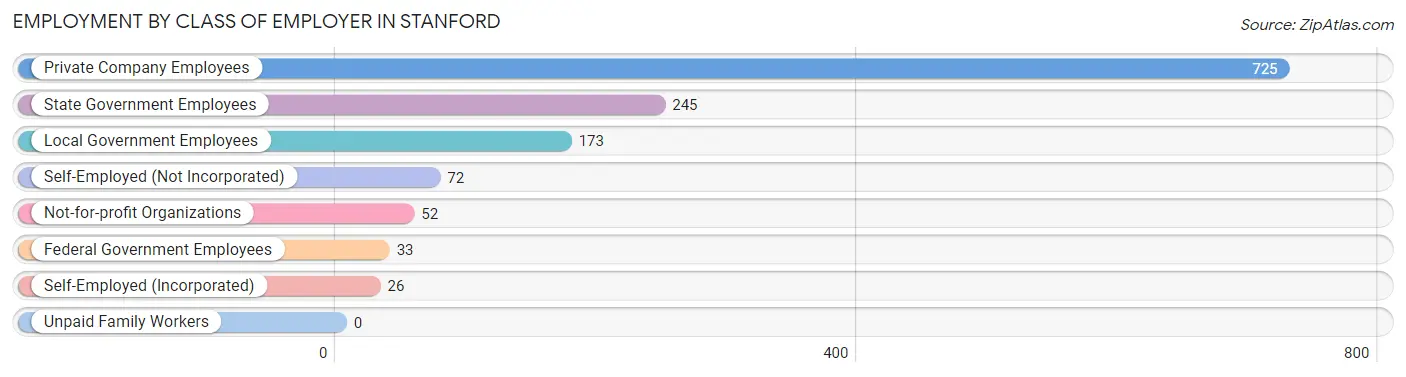
| Employer Class | # Employees | % Employees |
| Private Company Employees | 725 | 54.7% |
| Self-Employed (Incorporated) | 26 | 2.0% |
| Self-Employed (Not Incorporated) | 72 | 5.4% |
| Not-for-profit Organizations | 52 | 3.9% |
| Local Government Employees | 173 | 13.1% |
| State Government Employees | 245 | 18.5% |
| Federal Government Employees | 33 | 2.5% |
| Unpaid Family Workers | 0 | 0.0% |
| Total | 1,326 | 100.0% |
Employment Status by Age in Stanford
According to the labor force statistics for Stanford, out of the total population over 16 years of age (2,977), 47.3% or 1,408 individuals are in the labor force, with 3.3% or 46 of them unemployed. The age group with the highest labor force participation rate is 25 to 29 years, with 95.2% or 295 individuals in the labor force. Within the labor force, the 16 to 19 years age range has the highest percentage of unemployed individuals, with 44.4% or 16 of them being unemployed.
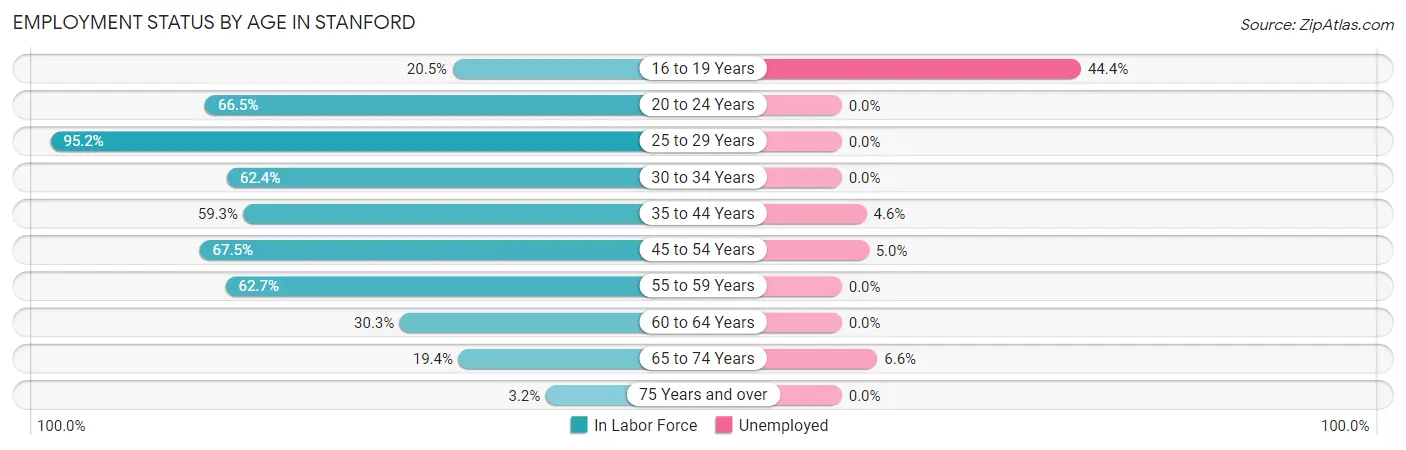
| Age Bracket | In Labor Force | Unemployed |
| 16 to 19 Years | 36 (20.5%) | 16 (44.4%) |
| 20 to 24 Years | 107 (66.5%) | 0 (0.0%) |
| 25 to 29 Years | 295 (95.2%) | 0 (0.0%) |
| 30 to 34 Years | 106 (62.4%) | 0 (0.0%) |
| 35 to 44 Years | 194 (59.3%) | 9 (4.6%) |
| 45 to 54 Years | 303 (67.5%) | 15 (5.0%) |
| 55 to 59 Years | 175 (62.7%) | 0 (0.0%) |
| 60 to 64 Years | 89 (30.3%) | 0 (0.0%) |
| 65 to 74 Years | 91 (19.4%) | 6 (6.6%) |
| 75 Years and over | 11 (3.2%) | 0 (0.0%) |
| Total | 1,408 (47.3%) | 46 (3.3%) |
Employment Status by Educational Attainment in Stanford
According to labor force statistics for Stanford, 63.5% of individuals (1,161) out of the total population between 25 and 64 years of age (1,829) are in the labor force, with 2.1% or 24 of them being unemployed. The group with the highest labor force participation rate are those with the educational attainment of college / associate degree, with 75.2% or 480 individuals in the labor force. Within the labor force, individuals with college / associate degree education have the highest percentage of unemployment, with 3.1% or 15 of them being unemployed.
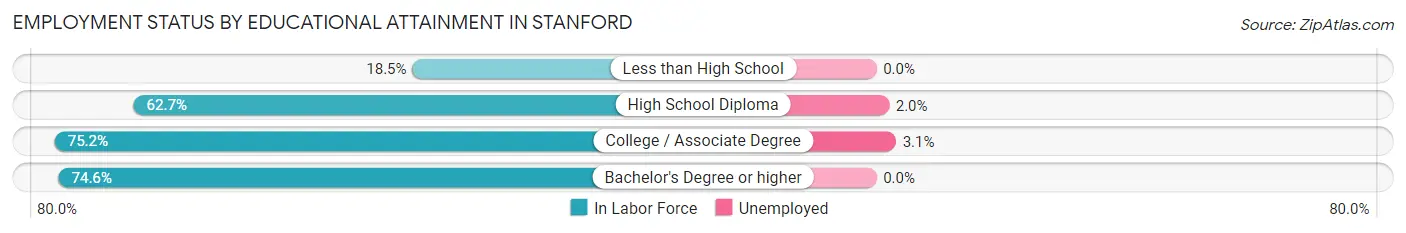
| Educational Attainment | In Labor Force | Unemployed |
| Less than High School | 40 (18.5%) | 0 (0.0%) |
| High School Diploma | 448 (62.7%) | 14 (2.0%) |
| College / Associate Degree | 480 (75.2%) | 20 (3.1%) |
| Bachelor's Degree or higher | 194 (74.6%) | 0 (0.0%) |
| Total | 1,161 (63.5%) | 38 (2.1%) |
Employment Occupations by Sex in Stanford
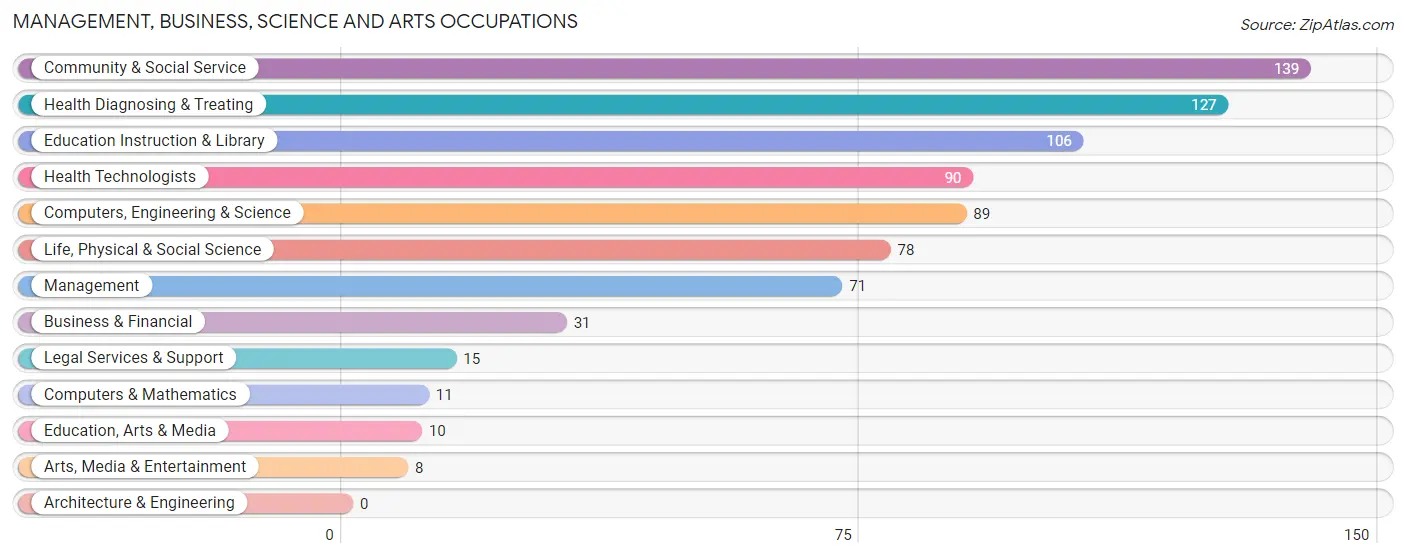
Management, Business, Science and Arts Occupations
The most common Management, Business, Science and Arts occupations in Stanford are Community & Social Service (139 | 10.2%), Health Diagnosing & Treating (127 | 9.3%), Education Instruction & Library (106 | 7.8%), Health Technologists (90 | 6.6%), and Computers, Engineering & Science (89 | 6.5%).
Management, Business, Science and Arts Occupations by Sex
Within the Management, Business, Science and Arts occupations in Stanford, the most male-oriented occupations are Computers, Engineering & Science (100.0%), Computers & Mathematics (100.0%), and Life, Physical & Social Science (100.0%), while the most female-oriented occupations are Education Instruction & Library (96.2%), Health Diagnosing & Treating (92.1%), and Health Technologists (88.9%).
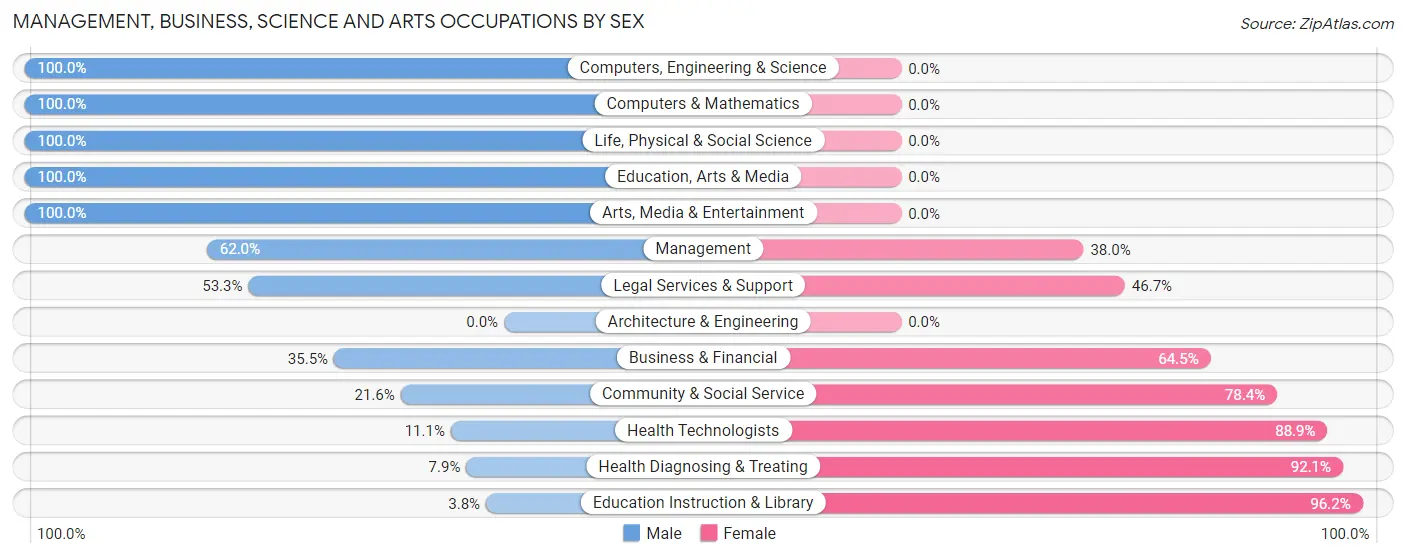
| Occupation | Male | Female |
| Management | 44 (62.0%) | 27 (38.0%) |
| Business & Financial | 11 (35.5%) | 20 (64.5%) |
| Computers, Engineering & Science | 89 (100.0%) | 0 (0.0%) |
| Computers & Mathematics | 11 (100.0%) | 0 (0.0%) |
| Architecture & Engineering | 0 (0.0%) | 0 (0.0%) |
| Life, Physical & Social Science | 78 (100.0%) | 0 (0.0%) |
| Community & Social Service | 30 (21.6%) | 109 (78.4%) |
| Education, Arts & Media | 10 (100.0%) | 0 (0.0%) |
| Legal Services & Support | 8 (53.3%) | 7 (46.7%) |
| Education Instruction & Library | 4 (3.8%) | 102 (96.2%) |
| Arts, Media & Entertainment | 8 (100.0%) | 0 (0.0%) |
| Health Diagnosing & Treating | 10 (7.9%) | 117 (92.1%) |
| Health Technologists | 10 (11.1%) | 80 (88.9%) |
| Total (Category) | 184 (40.3%) | 273 (59.7%) |
| Total (Overall) | 712 (52.3%) | 649 (47.7%) |
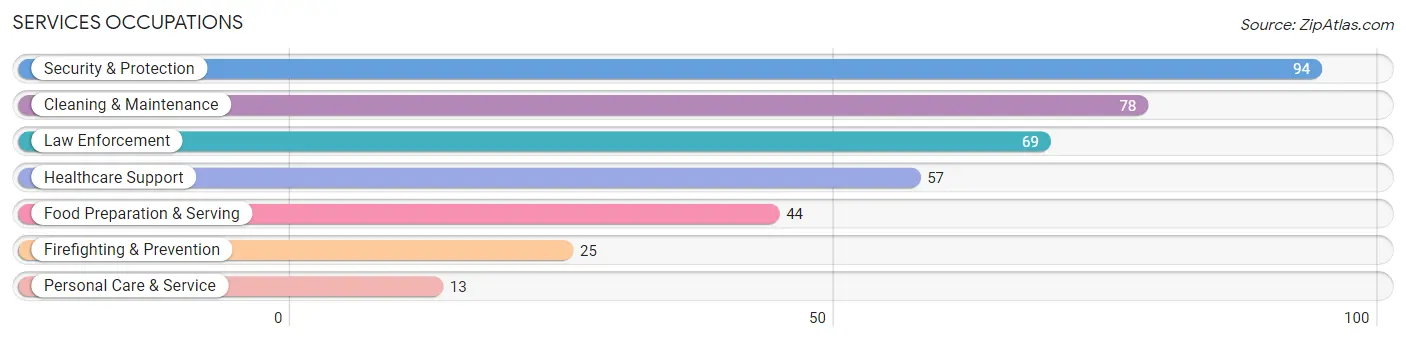
Services Occupations
The most common Services occupations in Stanford are Security & Protection (94 | 6.9%), Cleaning & Maintenance (78 | 5.7%), Law Enforcement (69 | 5.1%), Healthcare Support (57 | 4.2%), and Food Preparation & Serving (44 | 3.2%).
Services Occupations by Sex
Within the Services occupations in Stanford, the most male-oriented occupations are Law Enforcement (92.7%), Security & Protection (87.2%), and Firefighting & Prevention (72.0%), while the most female-oriented occupations are Healthcare Support (100.0%), Food Preparation & Serving (100.0%), and Personal Care & Service (100.0%).
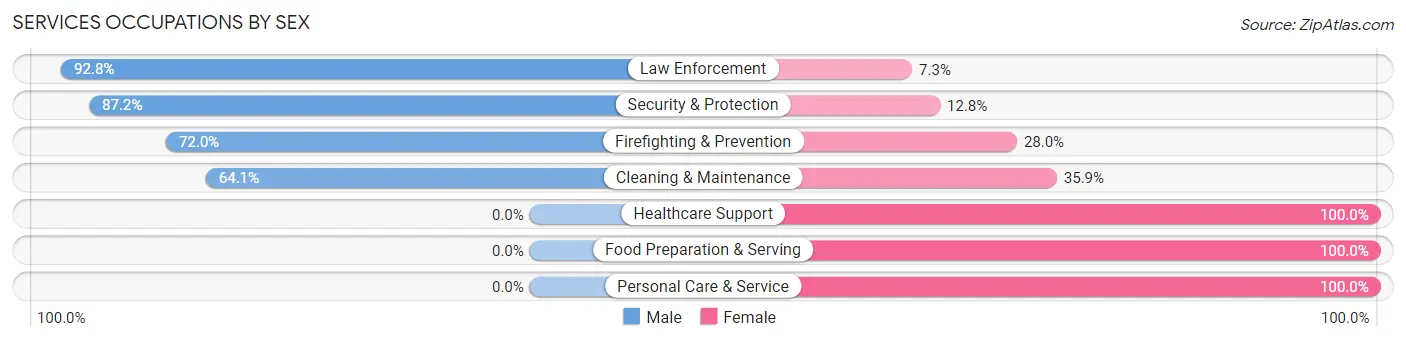
| Occupation | Male | Female |
| Healthcare Support | 0 (0.0%) | 57 (100.0%) |
| Security & Protection | 82 (87.2%) | 12 (12.8%) |
| Firefighting & Prevention | 18 (72.0%) | 7 (28.0%) |
| Law Enforcement | 64 (92.7%) | 5 (7.2%) |
| Food Preparation & Serving | 0 (0.0%) | 44 (100.0%) |
| Cleaning & Maintenance | 50 (64.1%) | 28 (35.9%) |
| Personal Care & Service | 0 (0.0%) | 13 (100.0%) |
| Total (Category) | 132 (46.2%) | 154 (53.8%) |
| Total (Overall) | 712 (52.3%) | 649 (47.7%) |
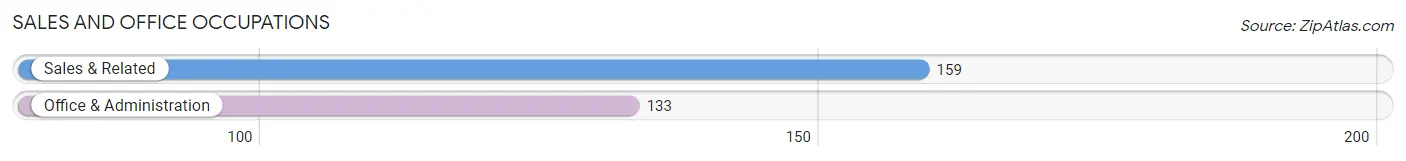
Sales and Office Occupations
The most common Sales and Office occupations in Stanford are Sales & Related (159 | 11.7%), and Office & Administration (133 | 9.8%).
Sales and Office Occupations by Sex
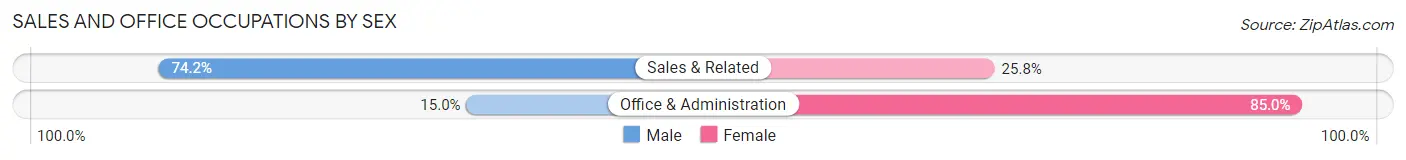
| Occupation | Male | Female |
| Sales & Related | 118 (74.2%) | 41 (25.8%) |
| Office & Administration | 20 (15.0%) | 113 (85.0%) |
| Total (Category) | 138 (47.3%) | 154 (52.7%) |
| Total (Overall) | 712 (52.3%) | 649 (47.7%) |
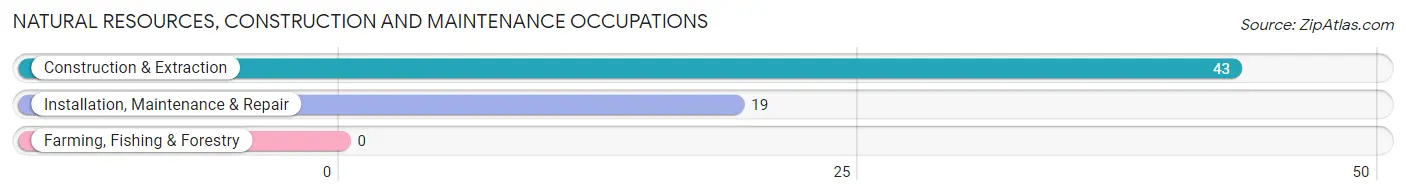
Natural Resources, Construction and Maintenance Occupations
The most common Natural Resources, Construction and Maintenance occupations in Stanford are Construction & Extraction (43 | 3.2%), and Installation, Maintenance & Repair (19 | 1.4%).
Natural Resources, Construction and Maintenance Occupations by Sex
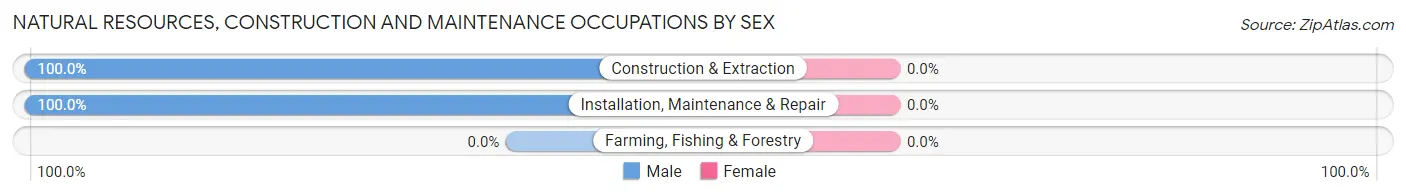
| Occupation | Male | Female |
| Farming, Fishing & Forestry | 0 (0.0%) | 0 (0.0%) |
| Construction & Extraction | 43 (100.0%) | 0 (0.0%) |
| Installation, Maintenance & Repair | 19 (100.0%) | 0 (0.0%) |
| Total (Category) | 62 (100.0%) | 0 (0.0%) |
| Total (Overall) | 712 (52.3%) | 649 (47.7%) |
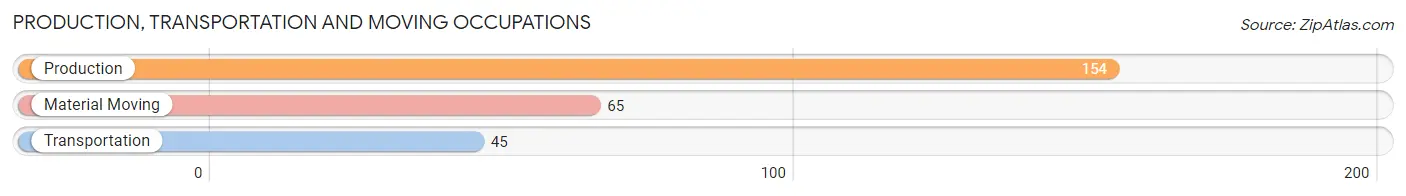
Production, Transportation and Moving Occupations
The most common Production, Transportation and Moving occupations in Stanford are Production (154 | 11.3%), Material Moving (65 | 4.8%), and Transportation (45 | 3.3%).
Production, Transportation and Moving Occupations by Sex
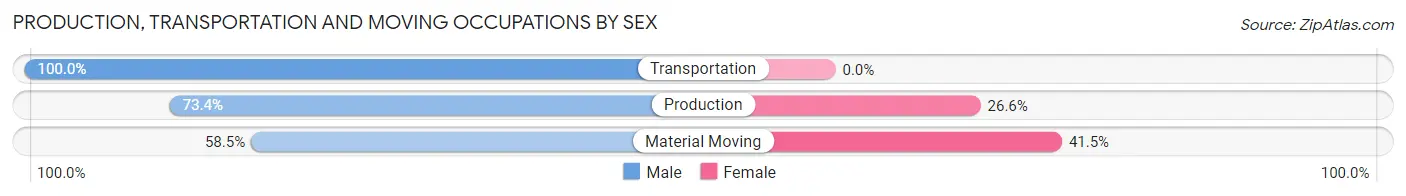
| Occupation | Male | Female |
| Production | 113 (73.4%) | 41 (26.6%) |
| Transportation | 45 (100.0%) | 0 (0.0%) |
| Material Moving | 38 (58.5%) | 27 (41.5%) |
| Total (Category) | 196 (74.2%) | 68 (25.8%) |
| Total (Overall) | 712 (52.3%) | 649 (47.7%) |
Employment Industries by Sex in Stanford
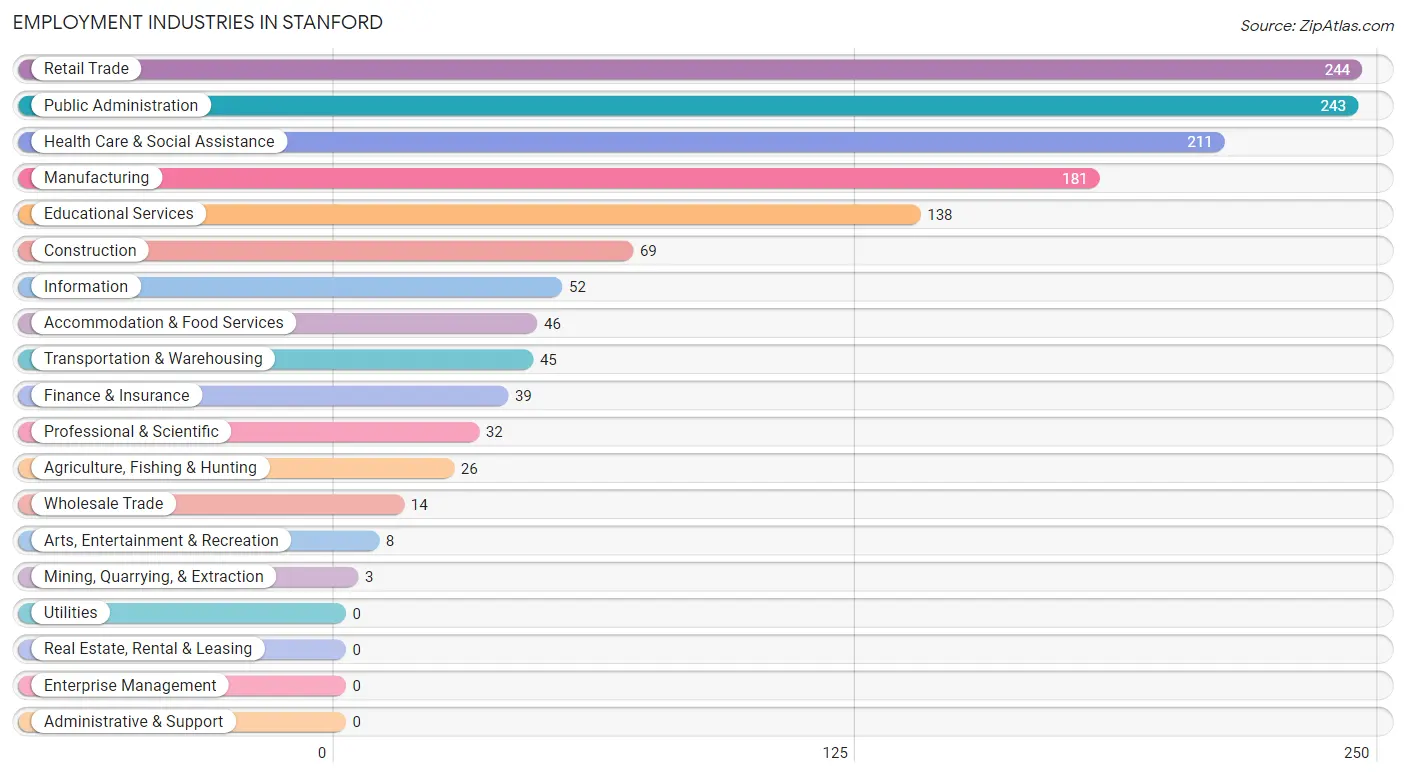
Employment Industries in Stanford
The major employment industries in Stanford include Retail Trade (244 | 17.9%), Public Administration (243 | 17.8%), Health Care & Social Assistance (211 | 15.5%), Manufacturing (181 | 13.3%), and Educational Services (138 | 10.1%).
Employment Industries by Sex in Stanford
The Stanford industries that see more men than women are Agriculture, Fishing & Hunting (100.0%), Mining, Quarrying, & Extraction (100.0%), and Wholesale Trade (100.0%), whereas the industries that tend to have a higher number of women are Arts, Entertainment & Recreation (100.0%), Health Care & Social Assistance (84.8%), and Finance & Insurance (84.6%).
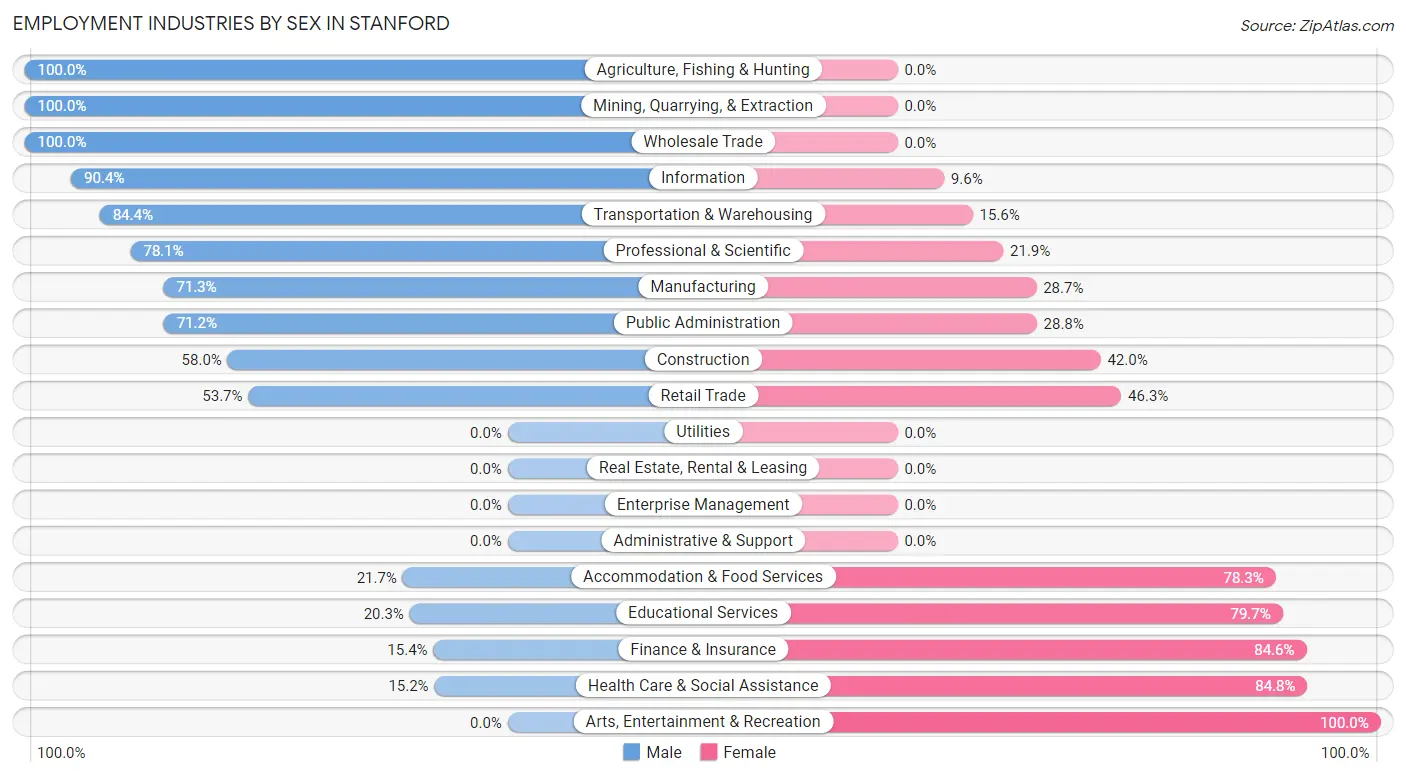
| Industry | Male | Female |
| Agriculture, Fishing & Hunting | 26 (100.0%) | 0 (0.0%) |
| Mining, Quarrying, & Extraction | 3 (100.0%) | 0 (0.0%) |
| Construction | 40 (58.0%) | 29 (42.0%) |
| Manufacturing | 129 (71.3%) | 52 (28.7%) |
| Wholesale Trade | 14 (100.0%) | 0 (0.0%) |
| Retail Trade | 131 (53.7%) | 113 (46.3%) |
| Transportation & Warehousing | 38 (84.4%) | 7 (15.6%) |
| Utilities | 0 (0.0%) | 0 (0.0%) |
| Information | 47 (90.4%) | 5 (9.6%) |
| Finance & Insurance | 6 (15.4%) | 33 (84.6%) |
| Real Estate, Rental & Leasing | 0 (0.0%) | 0 (0.0%) |
| Professional & Scientific | 25 (78.1%) | 7 (21.9%) |
| Enterprise Management | 0 (0.0%) | 0 (0.0%) |
| Administrative & Support | 0 (0.0%) | 0 (0.0%) |
| Educational Services | 28 (20.3%) | 110 (79.7%) |
| Health Care & Social Assistance | 32 (15.2%) | 179 (84.8%) |
| Arts, Entertainment & Recreation | 0 (0.0%) | 8 (100.0%) |
| Accommodation & Food Services | 10 (21.7%) | 36 (78.3%) |
| Public Administration | 173 (71.2%) | 70 (28.8%) |
| Total | 712 (52.3%) | 649 (47.7%) |
Education in Stanford
School Enrollment in Stanford
The most common levels of schooling among the 790 students in Stanford are high school (210 | 26.6%), middle school (199 | 25.2%), and elementary school (172 | 21.8%).
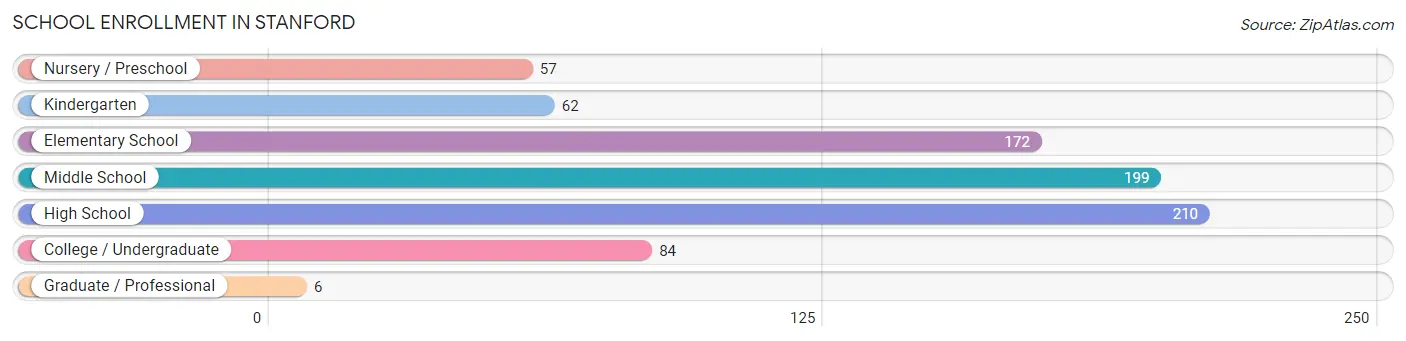
| School Level | # Students | % Students |
| Nursery / Preschool | 57 | 7.2% |
| Kindergarten | 62 | 7.9% |
| Elementary School | 172 | 21.8% |
| Middle School | 199 | 25.2% |
| High School | 210 | 26.6% |
| College / Undergraduate | 84 | 10.6% |
| Graduate / Professional | 6 | 0.8% |
| Total | 790 | 100.0% |
School Enrollment by Age by Funding Source in Stanford
Out of a total of 790 students who are enrolled in schools in Stanford, 74 (9.4%) attend a private institution, while the remaining 716 (90.6%) are enrolled in public schools. The age group of 20 to 24 year olds has the highest likelihood of being enrolled in private schools, with 33 (100.0% in the age bracket) enrolled. Conversely, the age group of 3 to 4 year olds has the lowest likelihood of being enrolled in a private school, with 57 (100.0% in the age bracket) attending a public institution.
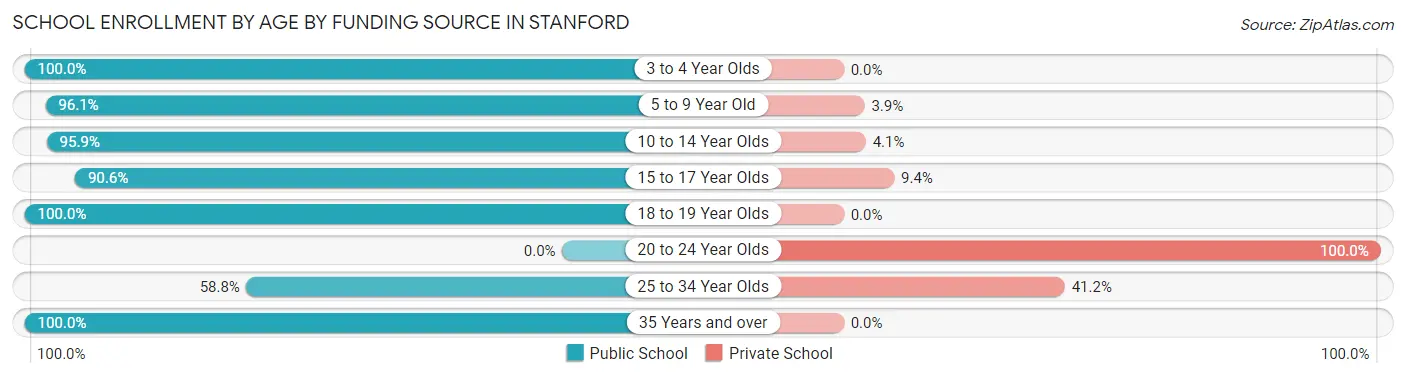
| Age Bracket | Public School | Private School |
| 3 to 4 Year Olds | 57 (100.0%) | 0 (0.0%) |
| 5 to 9 Year Old | 198 (96.1%) | 8 (3.9%) |
| 10 to 14 Year Olds | 210 (95.9%) | 9 (4.1%) |
| 15 to 17 Year Olds | 164 (90.6%) | 17 (9.4%) |
| 18 to 19 Year Olds | 61 (100.0%) | 0 (0.0%) |
| 20 to 24 Year Olds | 0 (0.0%) | 33 (100.0%) |
| 25 to 34 Year Olds | 10 (58.8%) | 7 (41.2%) |
| 35 Years and over | 16 (100.0%) | 0 (0.0%) |
| Total | 716 (90.6%) | 74 (9.4%) |
Educational Attainment by Field of Study in Stanford
Education (109 | 25.1%), business (96 | 22.1%), computers & mathematics (50 | 11.5%), arts & humanities (34 | 7.8%), and liberal arts & history (33 | 7.6%) are the most common fields of study among 435 individuals in Stanford who have obtained a bachelor's degree or higher.
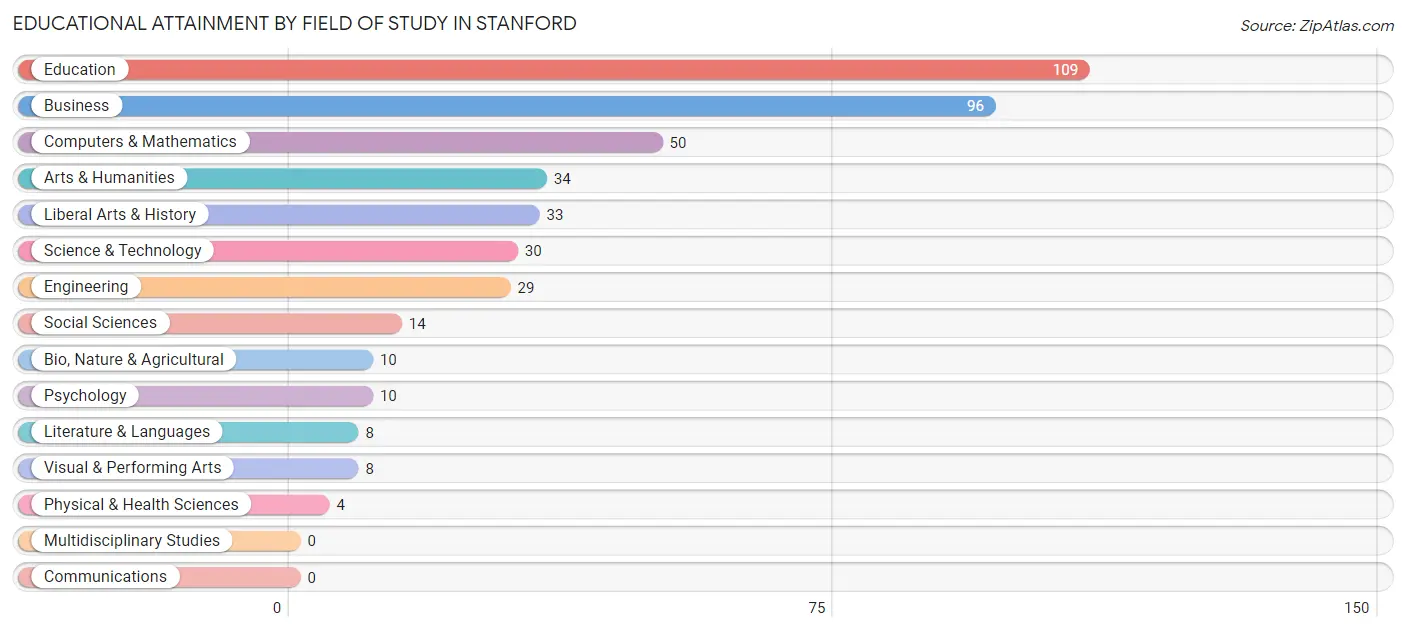
| Field of Study | # Graduates | % Graduates |
| Computers & Mathematics | 50 | 11.5% |
| Bio, Nature & Agricultural | 10 | 2.3% |
| Physical & Health Sciences | 4 | 0.9% |
| Psychology | 10 | 2.3% |
| Social Sciences | 14 | 3.2% |
| Engineering | 29 | 6.7% |
| Multidisciplinary Studies | 0 | 0.0% |
| Science & Technology | 30 | 6.9% |
| Business | 96 | 22.1% |
| Education | 109 | 25.1% |
| Literature & Languages | 8 | 1.8% |
| Liberal Arts & History | 33 | 7.6% |
| Visual & Performing Arts | 8 | 1.8% |
| Communications | 0 | 0.0% |
| Arts & Humanities | 34 | 7.8% |
| Total | 435 | 100.0% |
Transportation & Commute in Stanford
Vehicle Availability by Sex in Stanford
The most prevalent vehicle ownership categories in Stanford are males with 3 vehicles (250, accounting for 36.5%) and females with 3 vehicles (172, making up 39.1%).
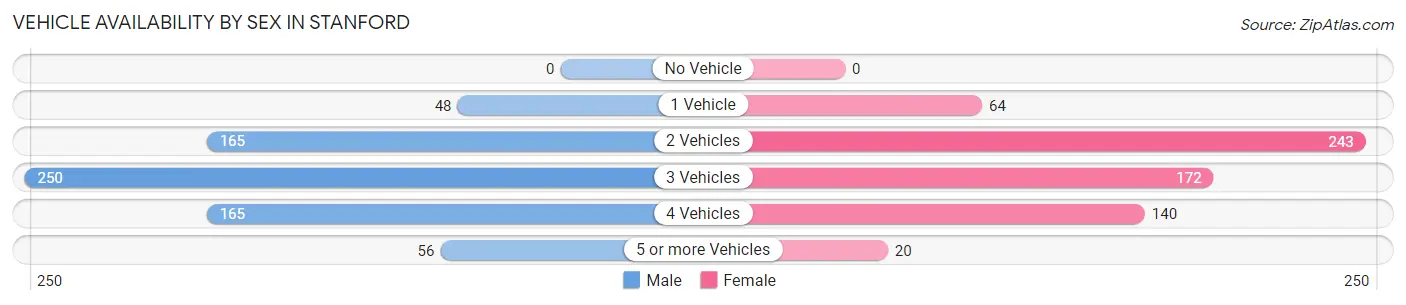
| Vehicles Available | Male | Female |
| No Vehicle | 0 (0.0%) | 0 (0.0%) |
| 1 Vehicle | 48 (7.0%) | 64 (10.0%) |
| 2 Vehicles | 165 (24.1%) | 243 (38.0%) |
| 3 Vehicles | 250 (36.5%) | 172 (26.9%) |
| 4 Vehicles | 165 (24.1%) | 140 (21.9%) |
| 5 or more Vehicles | 56 (8.2%) | 20 (3.1%) |
| Total | 684 (100.0%) | 639 (100.0%) |
Commute Time in Stanford
The most frequently occuring commute durations in Stanford are 15 to 19 minutes (231 commuters, 18.7%), 20 to 24 minutes (158 commuters, 12.8%), and 5 to 9 minutes (148 commuters, 12.0%).
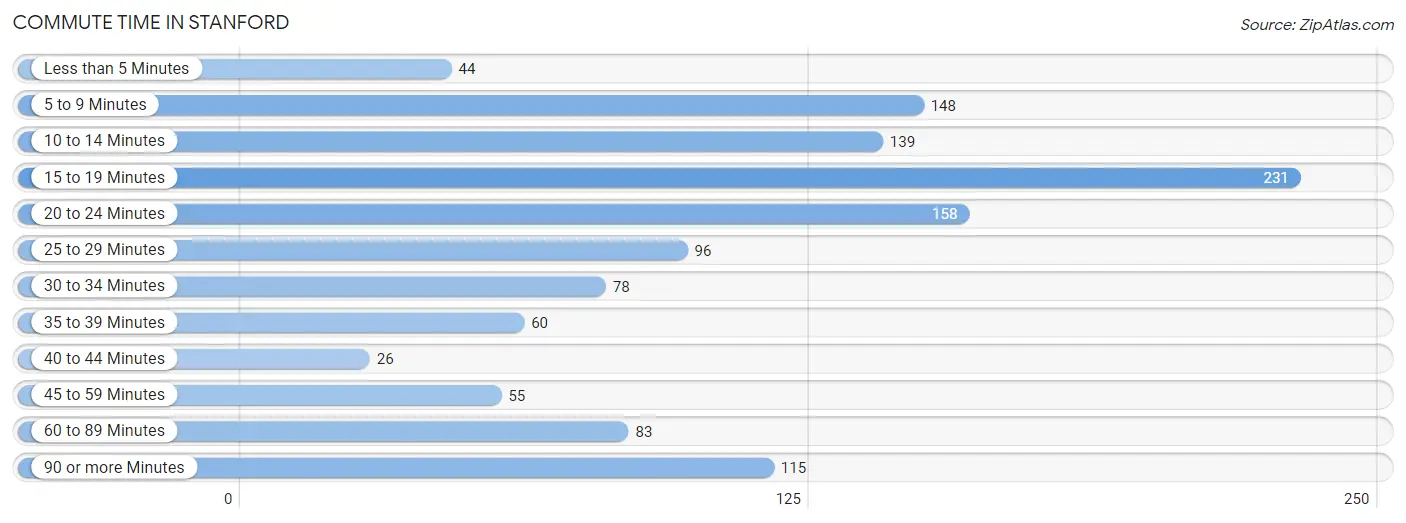
| Commute Time | # Commuters | % Commuters |
| Less than 5 Minutes | 44 | 3.6% |
| 5 to 9 Minutes | 148 | 12.0% |
| 10 to 14 Minutes | 139 | 11.3% |
| 15 to 19 Minutes | 231 | 18.7% |
| 20 to 24 Minutes | 158 | 12.8% |
| 25 to 29 Minutes | 96 | 7.8% |
| 30 to 34 Minutes | 78 | 6.3% |
| 35 to 39 Minutes | 60 | 4.9% |
| 40 to 44 Minutes | 26 | 2.1% |
| 45 to 59 Minutes | 55 | 4.5% |
| 60 to 89 Minutes | 83 | 6.7% |
| 90 or more Minutes | 115 | 9.3% |
Commute Time by Sex in Stanford
The most common commute times in Stanford are 15 to 19 minutes (114 commuters, 18.7%) for males and 15 to 19 minutes (117 commuters, 18.8%) for females.
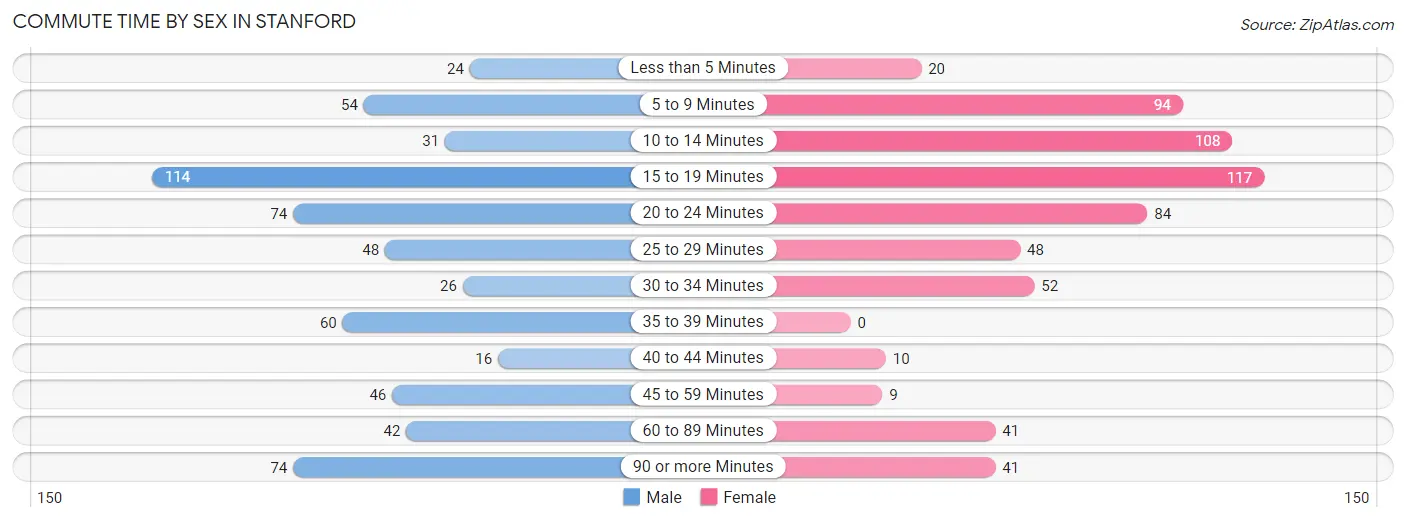
| Commute Time | Male | Female |
| Less than 5 Minutes | 24 (3.9%) | 20 (3.2%) |
| 5 to 9 Minutes | 54 (8.9%) | 94 (15.1%) |
| 10 to 14 Minutes | 31 (5.1%) | 108 (17.3%) |
| 15 to 19 Minutes | 114 (18.7%) | 117 (18.8%) |
| 20 to 24 Minutes | 74 (12.1%) | 84 (13.5%) |
| 25 to 29 Minutes | 48 (7.9%) | 48 (7.7%) |
| 30 to 34 Minutes | 26 (4.3%) | 52 (8.3%) |
| 35 to 39 Minutes | 60 (9.9%) | 0 (0.0%) |
| 40 to 44 Minutes | 16 (2.6%) | 10 (1.6%) |
| 45 to 59 Minutes | 46 (7.5%) | 9 (1.4%) |
| 60 to 89 Minutes | 42 (6.9%) | 41 (6.6%) |
| 90 or more Minutes | 74 (12.1%) | 41 (6.6%) |
Time of Departure to Work by Sex in Stanford
The most frequent times of departure to work in Stanford are 12:00 PM to 3:59 PM (92, 15.1%) for males and 8:00 AM to 8:29 AM (125, 20.0%) for females.
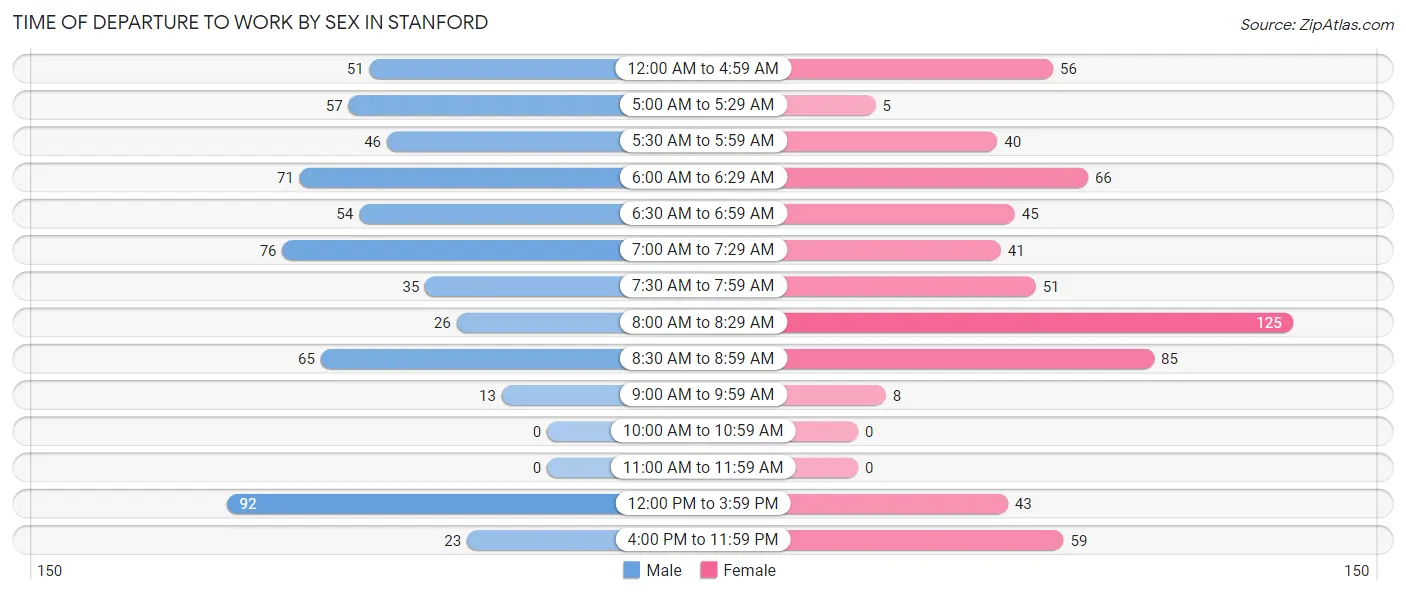
| Time of Departure | Male | Female |
| 12:00 AM to 4:59 AM | 51 (8.4%) | 56 (9.0%) |
| 5:00 AM to 5:29 AM | 57 (9.4%) | 5 (0.8%) |
| 5:30 AM to 5:59 AM | 46 (7.5%) | 40 (6.4%) |
| 6:00 AM to 6:29 AM | 71 (11.7%) | 66 (10.6%) |
| 6:30 AM to 6:59 AM | 54 (8.9%) | 45 (7.2%) |
| 7:00 AM to 7:29 AM | 76 (12.5%) | 41 (6.6%) |
| 7:30 AM to 7:59 AM | 35 (5.8%) | 51 (8.2%) |
| 8:00 AM to 8:29 AM | 26 (4.3%) | 125 (20.0%) |
| 8:30 AM to 8:59 AM | 65 (10.7%) | 85 (13.6%) |
| 9:00 AM to 9:59 AM | 13 (2.1%) | 8 (1.3%) |
| 10:00 AM to 10:59 AM | 0 (0.0%) | 0 (0.0%) |
| 11:00 AM to 11:59 AM | 0 (0.0%) | 0 (0.0%) |
| 12:00 PM to 3:59 PM | 92 (15.1%) | 43 (6.9%) |
| 4:00 PM to 11:59 PM | 23 (3.8%) | 59 (9.5%) |
| Total | 609 (100.0%) | 624 (100.0%) |
Housing Occupancy in Stanford
Occupancy by Ownership in Stanford
Of the total 1,411 dwellings in Stanford, owner-occupied units account for 908 (64.3%), while renter-occupied units make up 503 (35.6%).
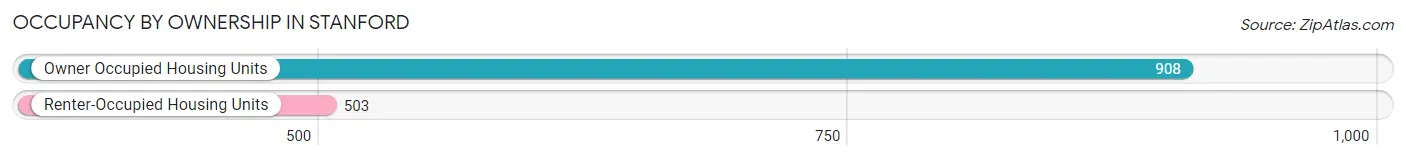
| Occupancy | # Housing Units | % Housing Units |
| Owner Occupied Housing Units | 908 | 64.3% |
| Renter-Occupied Housing Units | 503 | 35.6% |
| Total Occupied Housing Units | 1,411 | 100.0% |
Occupancy by Household Size in Stanford
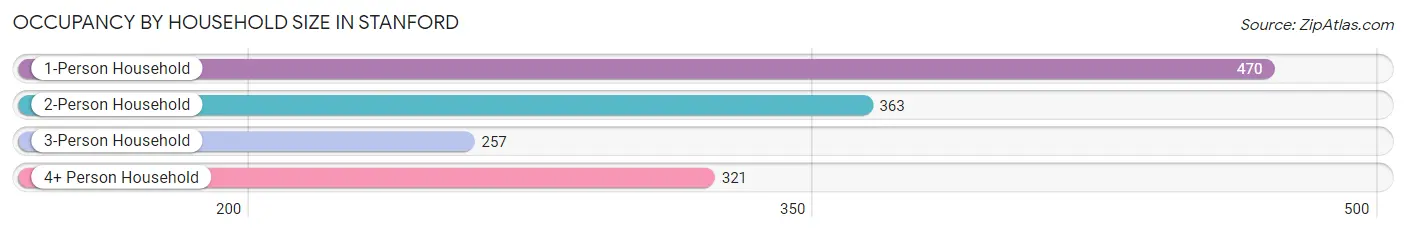
| Household Size | # Housing Units | % Housing Units |
| 1-Person Household | 470 | 33.3% |
| 2-Person Household | 363 | 25.7% |
| 3-Person Household | 257 | 18.2% |
| 4+ Person Household | 321 | 22.8% |
| Total Housing Units | 1,411 | 100.0% |
Occupancy by Ownership by Household Size in Stanford
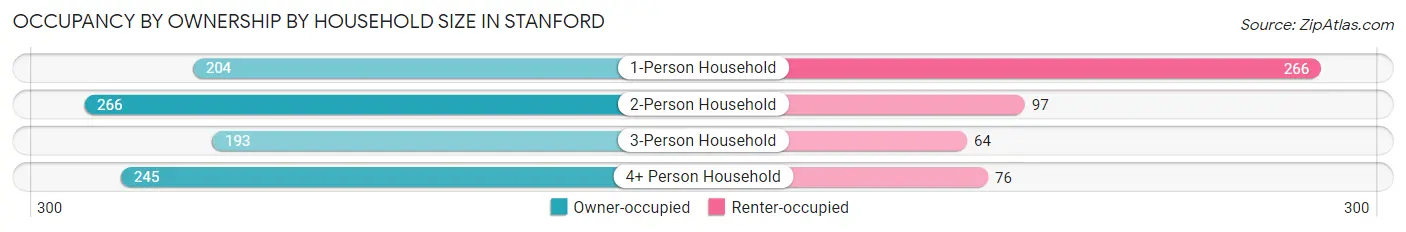
| Household Size | Owner-occupied | Renter-occupied |
| 1-Person Household | 204 (43.4%) | 266 (56.6%) |
| 2-Person Household | 266 (73.3%) | 97 (26.7%) |
| 3-Person Household | 193 (75.1%) | 64 (24.9%) |
| 4+ Person Household | 245 (76.3%) | 76 (23.7%) |
| Total Housing Units | 908 (64.3%) | 503 (35.6%) |
Occupancy by Educational Attainment in Stanford
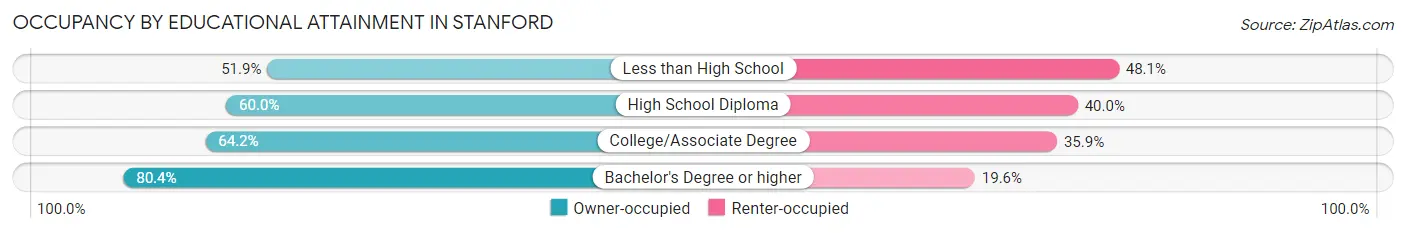
| Household Size | Owner-occupied | Renter-occupied |
| Less than High School | 96 (51.9%) | 89 (48.1%) |
| High School Diploma | 284 (60.0%) | 189 (40.0%) |
| College/Associate Degree | 306 (64.1%) | 171 (35.8%) |
| Bachelor's Degree or higher | 222 (80.4%) | 54 (19.6%) |
Occupancy by Age of Householder in Stanford
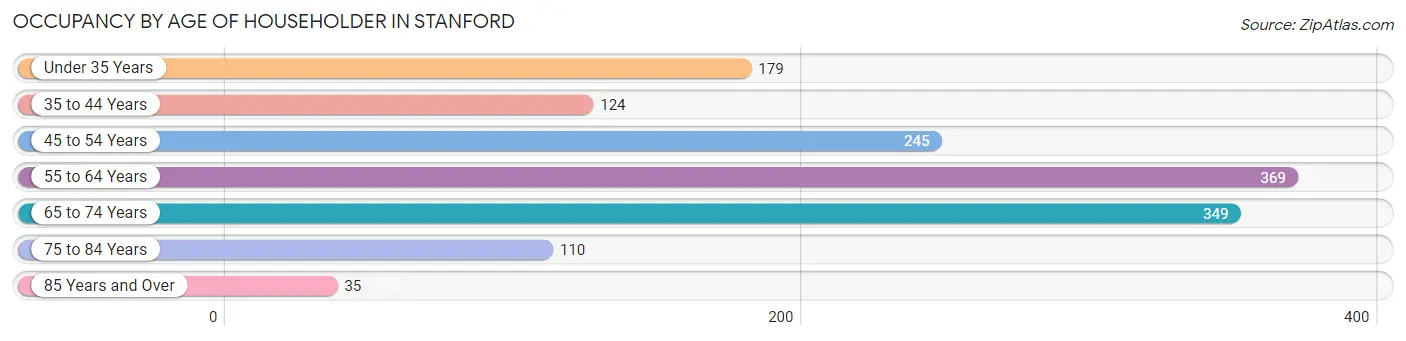
| Age Bracket | # Households | % Households |
| Under 35 Years | 179 | 12.7% |
| 35 to 44 Years | 124 | 8.8% |
| 45 to 54 Years | 245 | 17.4% |
| 55 to 64 Years | 369 | 26.2% |
| 65 to 74 Years | 349 | 24.7% |
| 75 to 84 Years | 110 | 7.8% |
| 85 Years and Over | 35 | 2.5% |
| Total | 1,411 | 100.0% |
Housing Finances in Stanford
Median Income by Occupancy in Stanford
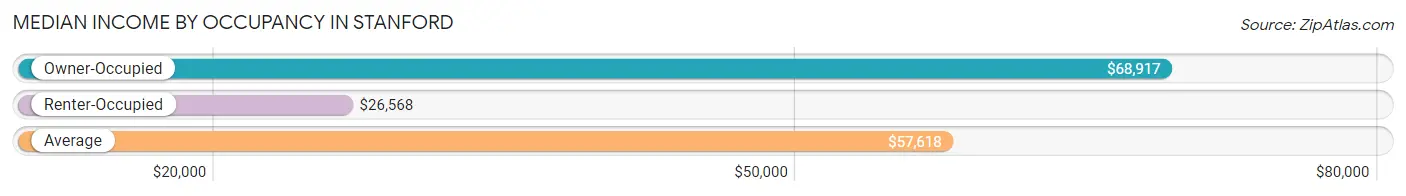
| Occupancy Type | # Households | Median Income |
| Owner-Occupied | 908 (64.3%) | $68,917 |
| Renter-Occupied | 503 (35.6%) | $26,568 |
| Average | 1,411 (100.0%) | $57,618 |
Occupancy by Householder Income Bracket in Stanford
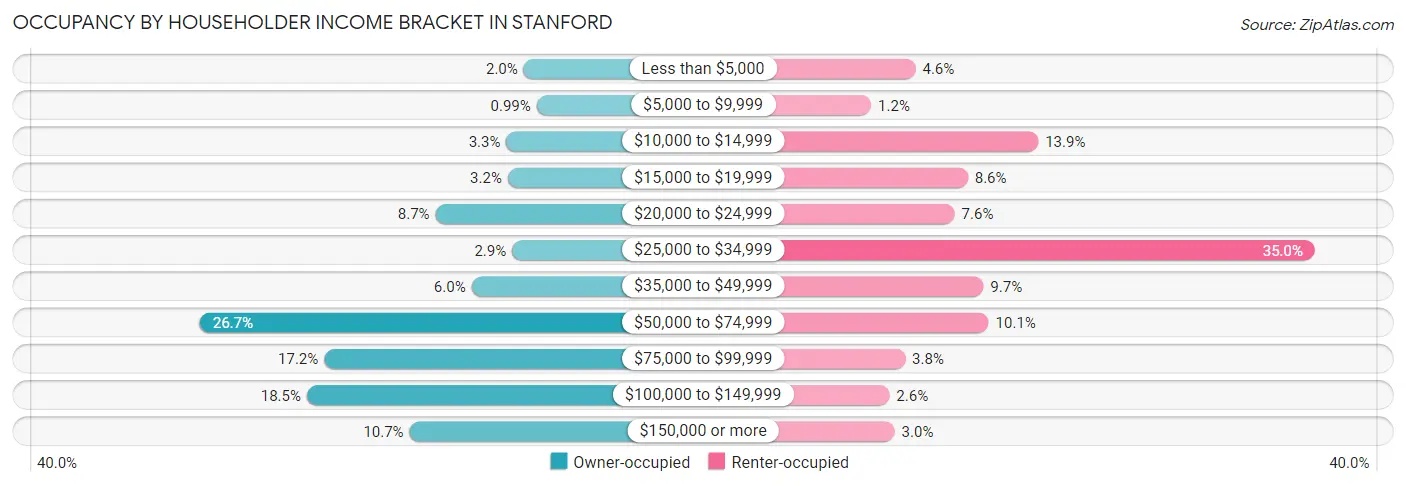
| Income Bracket | Owner-occupied | Renter-occupied |
| Less than $5,000 | 18 (2.0%) | 23 (4.6%) |
| $5,000 to $9,999 | 9 (1.0%) | 6 (1.2%) |
| $10,000 to $14,999 | 30 (3.3%) | 70 (13.9%) |
| $15,000 to $19,999 | 29 (3.2%) | 43 (8.6%) |
| $20,000 to $24,999 | 79 (8.7%) | 38 (7.5%) |
| $25,000 to $34,999 | 26 (2.9%) | 176 (35.0%) |
| $35,000 to $49,999 | 54 (5.9%) | 49 (9.7%) |
| $50,000 to $74,999 | 242 (26.7%) | 51 (10.1%) |
| $75,000 to $99,999 | 156 (17.2%) | 19 (3.8%) |
| $100,000 to $149,999 | 168 (18.5%) | 13 (2.6%) |
| $150,000 or more | 97 (10.7%) | 15 (3.0%) |
| Total | 908 (100.0%) | 503 (100.0%) |
Monthly Housing Cost Tiers in Stanford
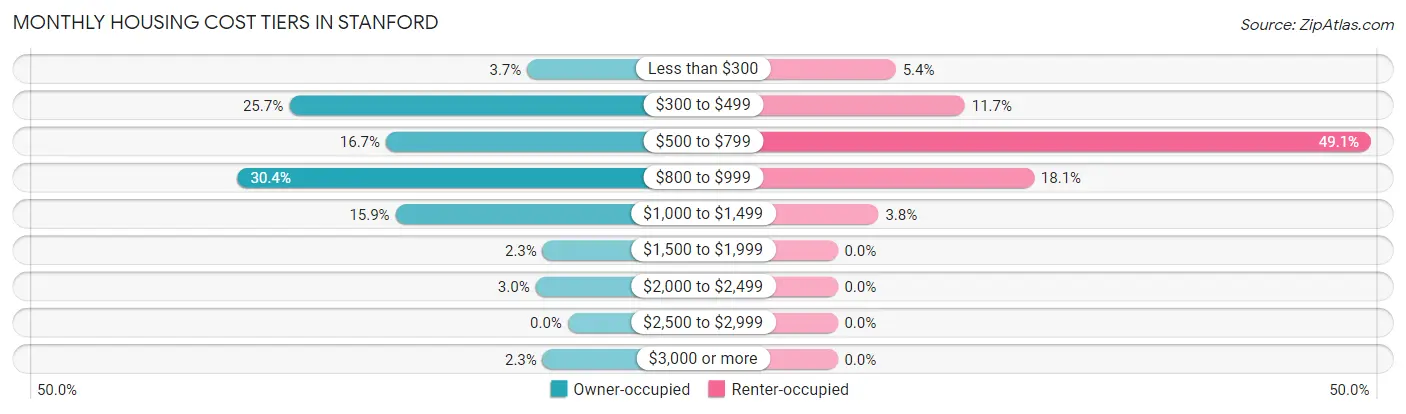
| Monthly Cost | Owner-occupied | Renter-occupied |
| Less than $300 | 34 (3.7%) | 27 (5.4%) |
| $300 to $499 | 233 (25.7%) | 59 (11.7%) |
| $500 to $799 | 152 (16.7%) | 247 (49.1%) |
| $800 to $999 | 276 (30.4%) | 91 (18.1%) |
| $1,000 to $1,499 | 144 (15.9%) | 19 (3.8%) |
| $1,500 to $1,999 | 21 (2.3%) | 0 (0.0%) |
| $2,000 to $2,499 | 27 (3.0%) | 0 (0.0%) |
| $2,500 to $2,999 | 0 (0.0%) | 0 (0.0%) |
| $3,000 or more | 21 (2.3%) | 0 (0.0%) |
| Total | 908 (100.0%) | 503 (100.0%) |
Physical Housing Characteristics in Stanford
Housing Structures in Stanford
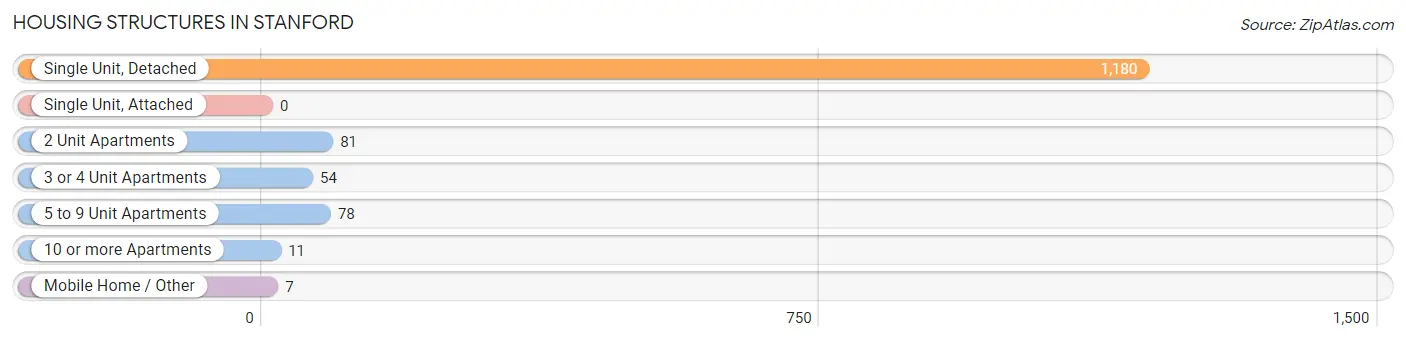
| Structure Type | # Housing Units | % Housing Units |
| Single Unit, Detached | 1,180 | 83.6% |
| Single Unit, Attached | 0 | 0.0% |
| 2 Unit Apartments | 81 | 5.7% |
| 3 or 4 Unit Apartments | 54 | 3.8% |
| 5 to 9 Unit Apartments | 78 | 5.5% |
| 10 or more Apartments | 11 | 0.8% |
| Mobile Home / Other | 7 | 0.5% |
| Total | 1,411 | 100.0% |
Housing Structures by Occupancy in Stanford
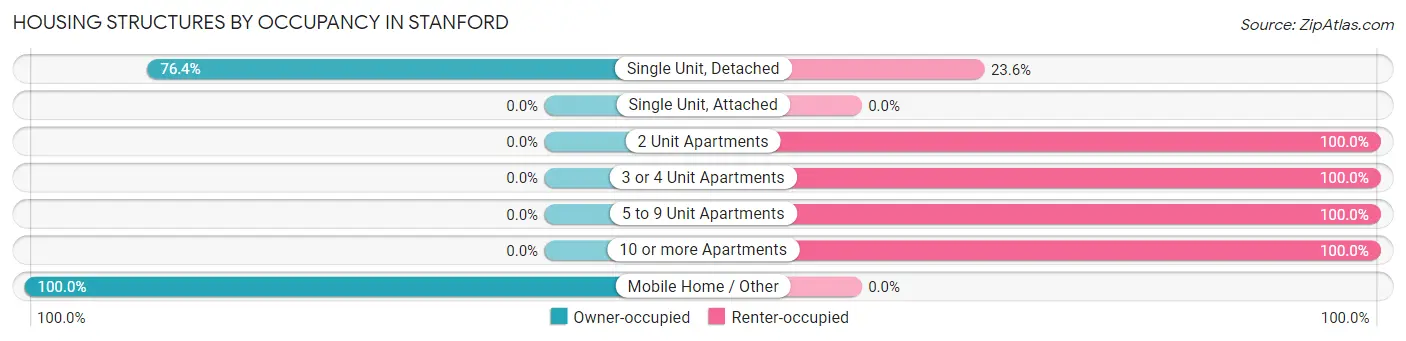
| Structure Type | Owner-occupied | Renter-occupied |
| Single Unit, Detached | 901 (76.4%) | 279 (23.6%) |
| Single Unit, Attached | 0 (0.0%) | 0 (0.0%) |
| 2 Unit Apartments | 0 (0.0%) | 81 (100.0%) |
| 3 or 4 Unit Apartments | 0 (0.0%) | 54 (100.0%) |
| 5 to 9 Unit Apartments | 0 (0.0%) | 78 (100.0%) |
| 10 or more Apartments | 0 (0.0%) | 11 (100.0%) |
| Mobile Home / Other | 7 (100.0%) | 0 (0.0%) |
| Total | 908 (64.3%) | 503 (35.6%) |
Housing Structures by Number of Rooms in Stanford
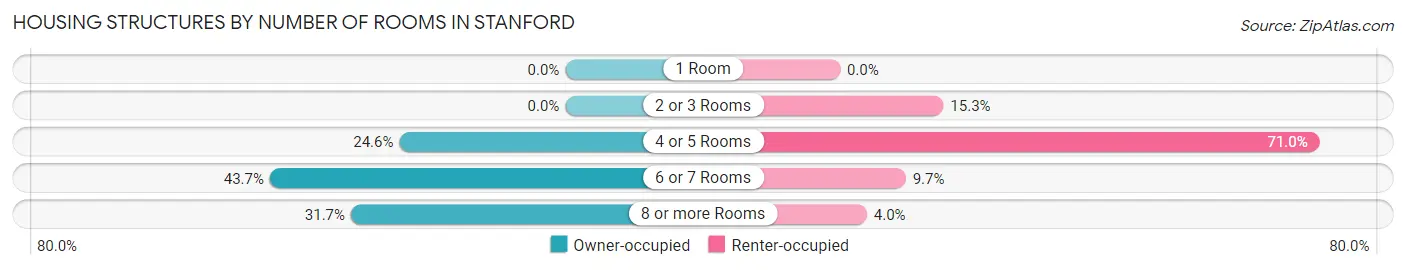
| Number of Rooms | Owner-occupied | Renter-occupied |
| 1 Room | 0 (0.0%) | 0 (0.0%) |
| 2 or 3 Rooms | 0 (0.0%) | 77 (15.3%) |
| 4 or 5 Rooms | 223 (24.6%) | 357 (71.0%) |
| 6 or 7 Rooms | 397 (43.7%) | 49 (9.7%) |
| 8 or more Rooms | 288 (31.7%) | 20 (4.0%) |
| Total | 908 (100.0%) | 503 (100.0%) |
Housing Structure by Heating Type in Stanford
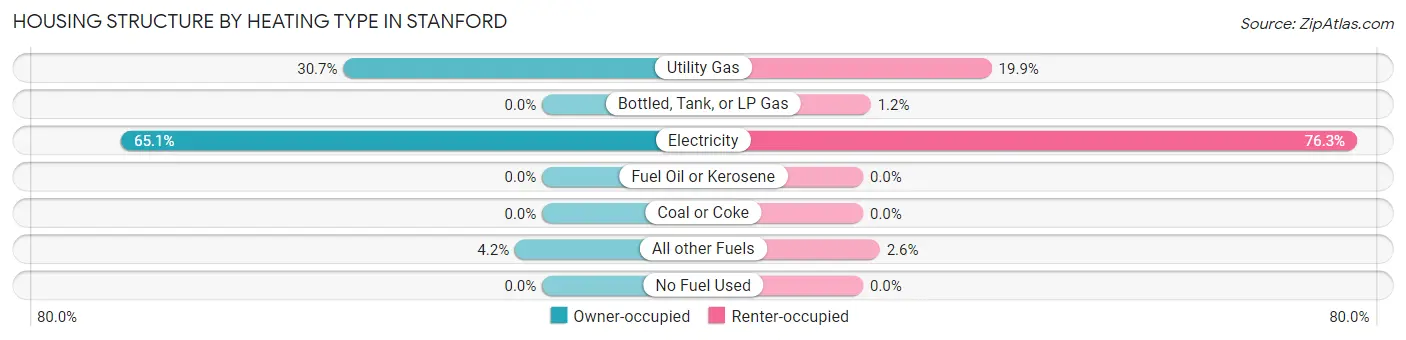
| Heating Type | Owner-occupied | Renter-occupied |
| Utility Gas | 279 (30.7%) | 100 (19.9%) |
| Bottled, Tank, or LP Gas | 0 (0.0%) | 6 (1.2%) |
| Electricity | 591 (65.1%) | 384 (76.3%) |
| Fuel Oil or Kerosene | 0 (0.0%) | 0 (0.0%) |
| Coal or Coke | 0 (0.0%) | 0 (0.0%) |
| All other Fuels | 38 (4.2%) | 13 (2.6%) |
| No Fuel Used | 0 (0.0%) | 0 (0.0%) |
| Total | 908 (100.0%) | 503 (100.0%) |
Household Vehicle Usage in Stanford
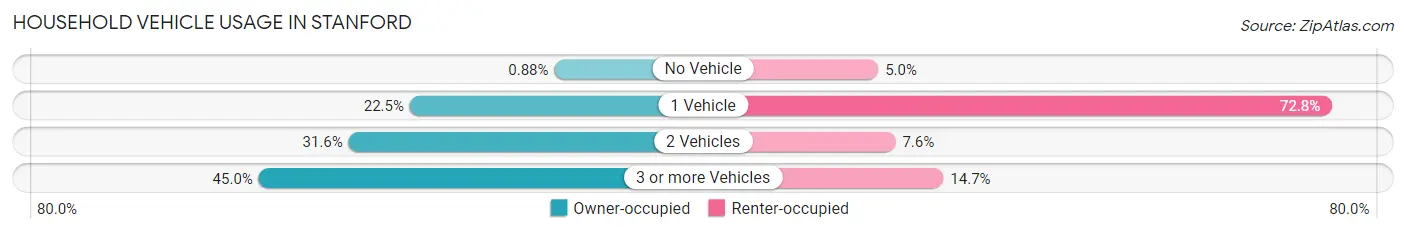
| Vehicles per Household | Owner-occupied | Renter-occupied |
| No Vehicle | 8 (0.9%) | 25 (5.0%) |
| 1 Vehicle | 204 (22.5%) | 366 (72.8%) |
| 2 Vehicles | 287 (31.6%) | 38 (7.5%) |
| 3 or more Vehicles | 409 (45.0%) | 74 (14.7%) |
| Total | 908 (100.0%) | 503 (100.0%) |
Real Estate & Mortgages in Stanford
Real Estate and Mortgage Overview in Stanford
| Characteristic | Without Mortgage | With Mortgage |
| Housing Units | 374 | 534 |
| Median Property Value | $168,400 | $140,600 |
| Median Household Income | $61,786 | $55 |
| Monthly Housing Costs | $430 | $11 |
| Real Estate Taxes | $898 | $0 |
Property Value by Mortgage Status in Stanford
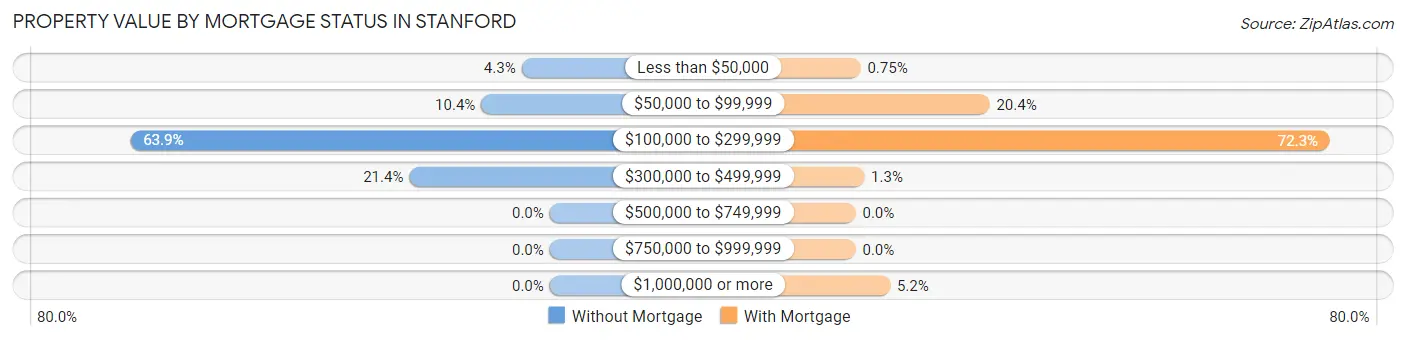
| Property Value | Without Mortgage | With Mortgage |
| Less than $50,000 | 16 (4.3%) | 4 (0.7%) |
| $50,000 to $99,999 | 39 (10.4%) | 109 (20.4%) |
| $100,000 to $299,999 | 239 (63.9%) | 386 (72.3%) |
| $300,000 to $499,999 | 80 (21.4%) | 7 (1.3%) |
| $500,000 to $749,999 | 0 (0.0%) | 0 (0.0%) |
| $750,000 to $999,999 | 0 (0.0%) | 0 (0.0%) |
| $1,000,000 or more | 0 (0.0%) | 28 (5.2%) |
| Total | 374 (100.0%) | 534 (100.0%) |
Household Income by Mortgage Status in Stanford
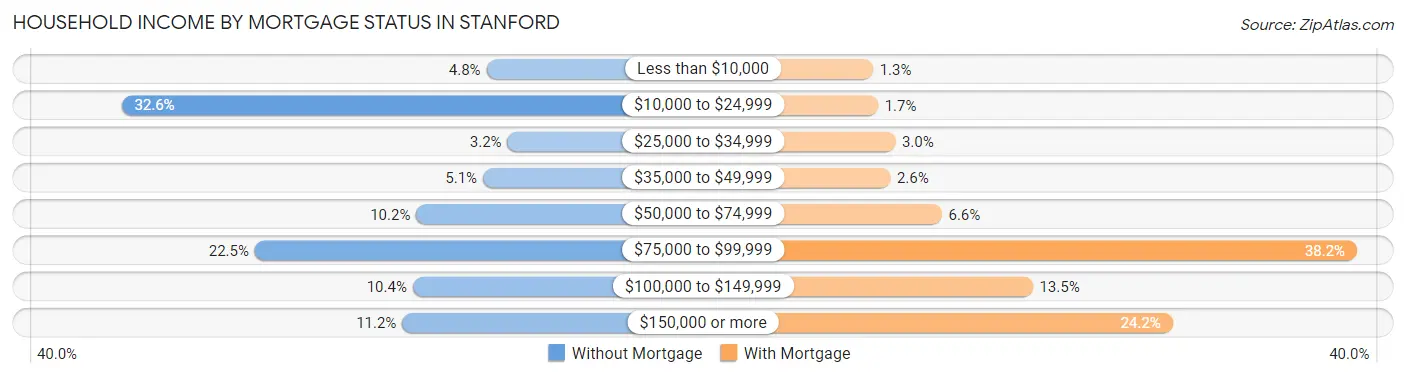
| Household Income | Without Mortgage | With Mortgage |
| Less than $10,000 | 18 (4.8%) | 7 (1.3%) |
| $10,000 to $24,999 | 122 (32.6%) | 9 (1.7%) |
| $25,000 to $34,999 | 12 (3.2%) | 16 (3.0%) |
| $35,000 to $49,999 | 19 (5.1%) | 14 (2.6%) |
| $50,000 to $74,999 | 38 (10.2%) | 35 (6.6%) |
| $75,000 to $99,999 | 84 (22.5%) | 204 (38.2%) |
| $100,000 to $149,999 | 39 (10.4%) | 72 (13.5%) |
| $150,000 or more | 42 (11.2%) | 129 (24.2%) |
| Total | 374 (100.0%) | 534 (100.0%) |
Property Value to Household Income Ratio in Stanford
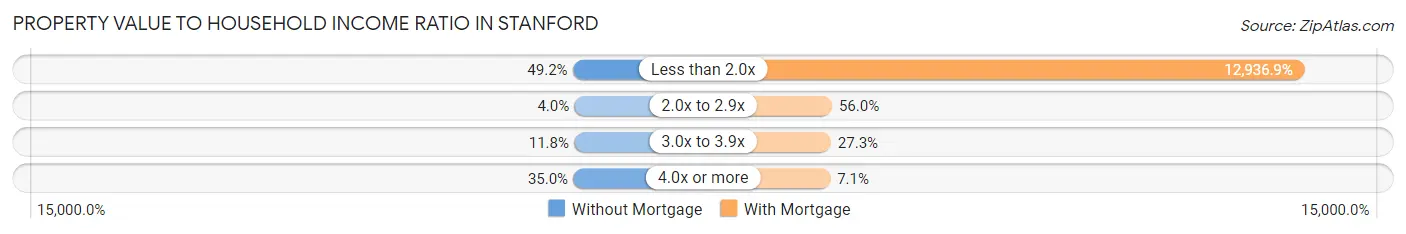
| Value-to-Income Ratio | Without Mortgage | With Mortgage |
| Less than 2.0x | 184 (49.2%) | 69,083 (12,936.9%) |
| 2.0x to 2.9x | 15 (4.0%) | 299 (56.0%) |
| 3.0x to 3.9x | 44 (11.8%) | 146 (27.3%) |
| 4.0x or more | 131 (35.0%) | 38 (7.1%) |
| Total | 374 (100.0%) | 534 (100.0%) |
Real Estate Taxes by Mortgage Status in Stanford
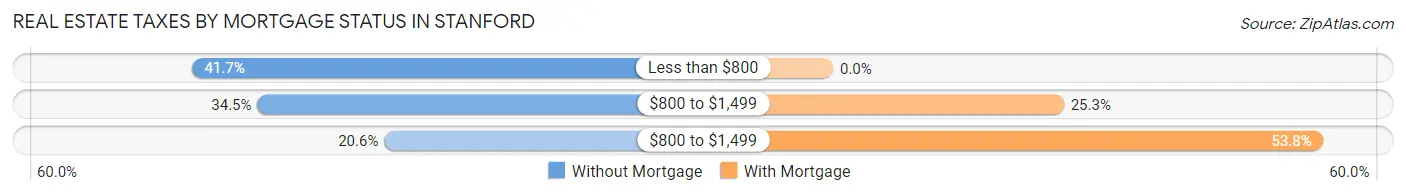
| Property Taxes | Without Mortgage | With Mortgage |
| Less than $800 | 156 (41.7%) | 0 (0.0%) |
| $800 to $1,499 | 129 (34.5%) | 135 (25.3%) |
| $800 to $1,499 | 77 (20.6%) | 287 (53.7%) |
| Total | 374 (100.0%) | 534 (100.0%) |
Health & Disability in Stanford
Health Insurance Coverage by Age in Stanford
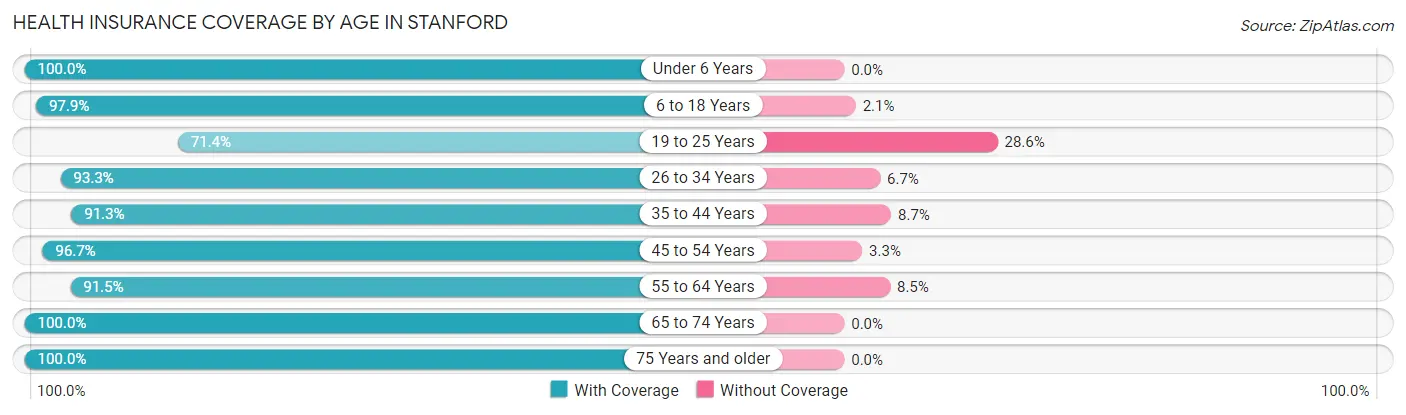
| Age Bracket | With Coverage | Without Coverage |
| Under 6 Years | 173 (100.0%) | 0 (0.0%) |
| 6 to 18 Years | 644 (97.9%) | 14 (2.1%) |
| 19 to 25 Years | 145 (71.4%) | 58 (28.6%) |
| 26 to 34 Years | 377 (93.3%) | 27 (6.7%) |
| 35 to 44 Years | 272 (91.3%) | 26 (8.7%) |
| 45 to 54 Years | 406 (96.7%) | 14 (3.3%) |
| 55 to 64 Years | 493 (91.5%) | 46 (8.5%) |
| 65 to 74 Years | 456 (100.0%) | 0 (0.0%) |
| 75 Years and older | 269 (100.0%) | 0 (0.0%) |
| Total | 3,235 (94.6%) | 185 (5.4%) |
Health Insurance Coverage by Citizenship Status in Stanford
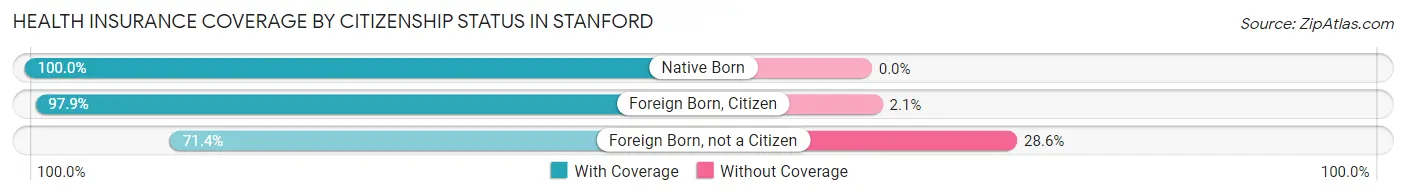
| Citizenship Status | With Coverage | Without Coverage |
| Native Born | 173 (100.0%) | 0 (0.0%) |
| Foreign Born, Citizen | 644 (97.9%) | 14 (2.1%) |
| Foreign Born, not a Citizen | 145 (71.4%) | 58 (28.6%) |
Health Insurance Coverage by Household Income in Stanford
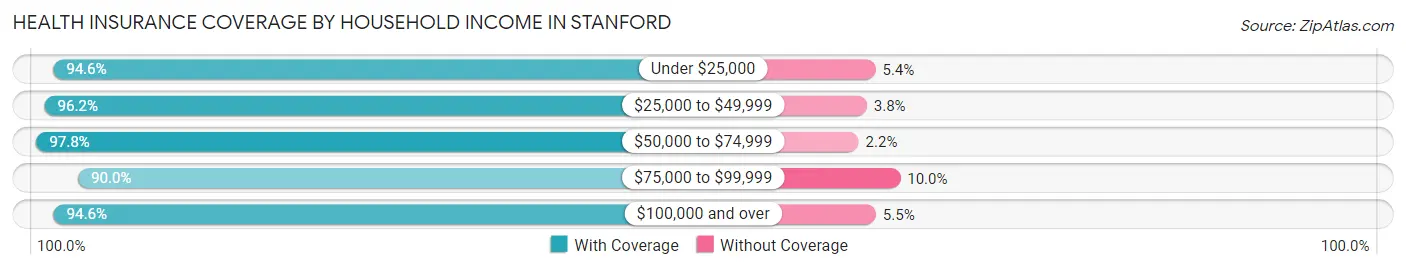
| Household Income | With Coverage | Without Coverage |
| Under $25,000 | 457 (94.6%) | 26 (5.4%) |
| $25,000 to $49,999 | 435 (96.2%) | 17 (3.8%) |
| $50,000 to $74,999 | 837 (97.8%) | 19 (2.2%) |
| $75,000 to $99,999 | 682 (90.0%) | 76 (10.0%) |
| $100,000 and over | 816 (94.6%) | 47 (5.4%) |
Public vs Private Health Insurance Coverage by Age in Stanford
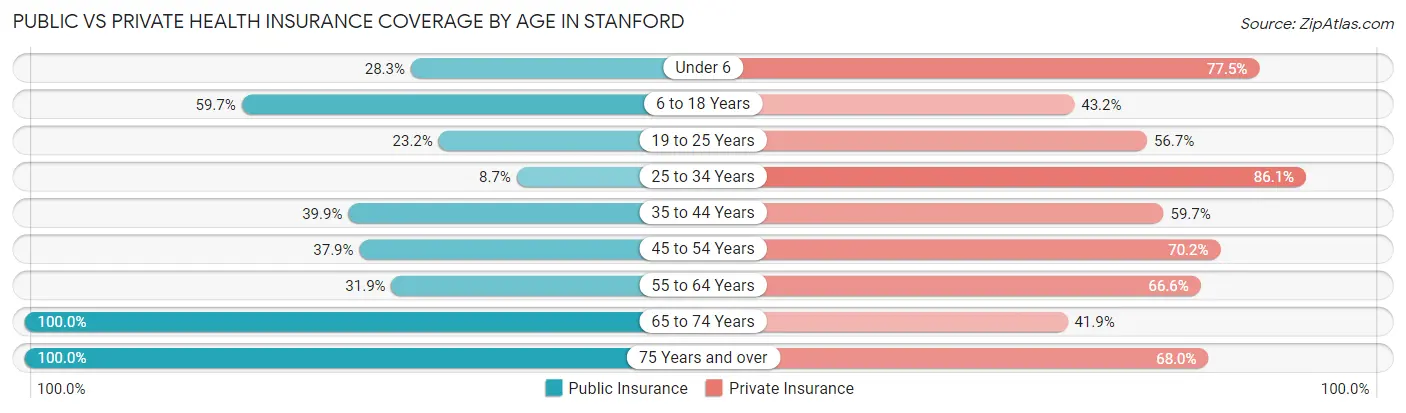
| Age Bracket | Public Insurance | Private Insurance |
| Under 6 | 49 (28.3%) | 134 (77.5%) |
| 6 to 18 Years | 393 (59.7%) | 284 (43.2%) |
| 19 to 25 Years | 47 (23.2%) | 115 (56.7%) |
| 25 to 34 Years | 35 (8.7%) | 348 (86.1%) |
| 35 to 44 Years | 119 (39.9%) | 178 (59.7%) |
| 45 to 54 Years | 159 (37.9%) | 295 (70.2%) |
| 55 to 64 Years | 172 (31.9%) | 359 (66.6%) |
| 65 to 74 Years | 456 (100.0%) | 191 (41.9%) |
| 75 Years and over | 269 (100.0%) | 183 (68.0%) |
| Total | 1,699 (49.7%) | 2,087 (61.0%) |
Disability Status by Sex by Age in Stanford
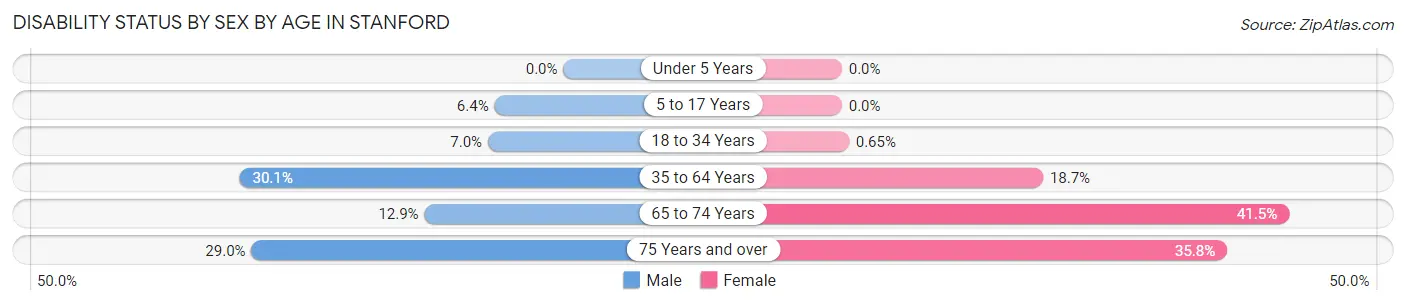
| Age Bracket | Male | Female |
| Under 5 Years | 0 (0.0%) | 0 (0.0%) |
| 5 to 17 Years | 17 (6.4%) | 0 (0.0%) |
| 18 to 34 Years | 24 (7.0%) | 2 (0.6%) |
| 35 to 64 Years | 183 (30.0%) | 121 (18.7%) |
| 65 to 74 Years | 33 (12.9%) | 83 (41.5%) |
| 75 Years and over | 22 (28.9%) | 69 (35.7%) |
Disability Class by Sex by Age in Stanford
Disability Class: Hearing Difficulty
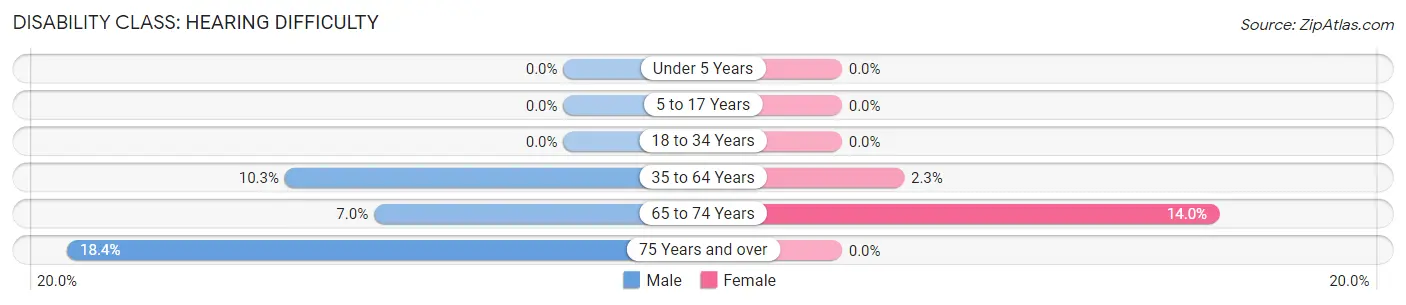
| Age Bracket | Male | Female |
| Under 5 Years | 0 (0.0%) | 0 (0.0%) |
| 5 to 17 Years | 0 (0.0%) | 0 (0.0%) |
| 18 to 34 Years | 0 (0.0%) | 0 (0.0%) |
| 35 to 64 Years | 63 (10.3%) | 15 (2.3%) |
| 65 to 74 Years | 18 (7.0%) | 28 (14.0%) |
| 75 Years and over | 14 (18.4%) | 0 (0.0%) |
Disability Class: Vision Difficulty
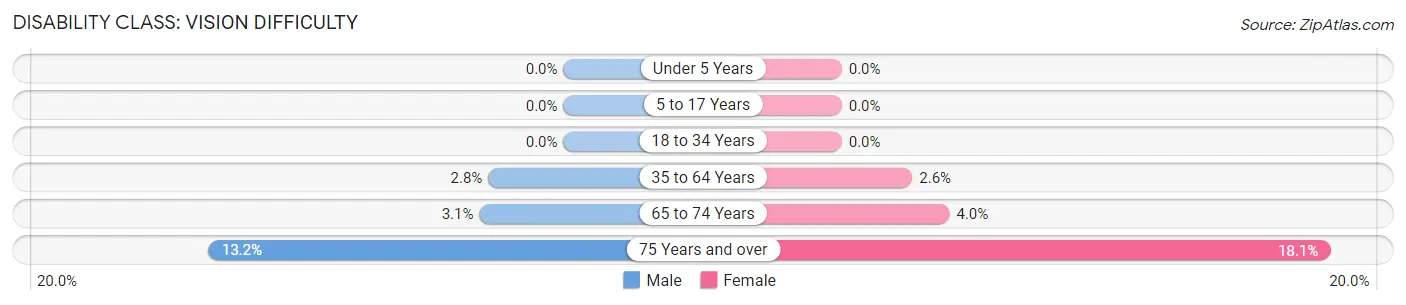
| Age Bracket | Male | Female |
| Under 5 Years | 0 (0.0%) | 0 (0.0%) |
| 5 to 17 Years | 0 (0.0%) | 0 (0.0%) |
| 18 to 34 Years | 0 (0.0%) | 0 (0.0%) |
| 35 to 64 Years | 17 (2.8%) | 17 (2.6%) |
| 65 to 74 Years | 8 (3.1%) | 8 (4.0%) |
| 75 Years and over | 10 (13.2%) | 35 (18.1%) |
Disability Class: Cognitive Difficulty
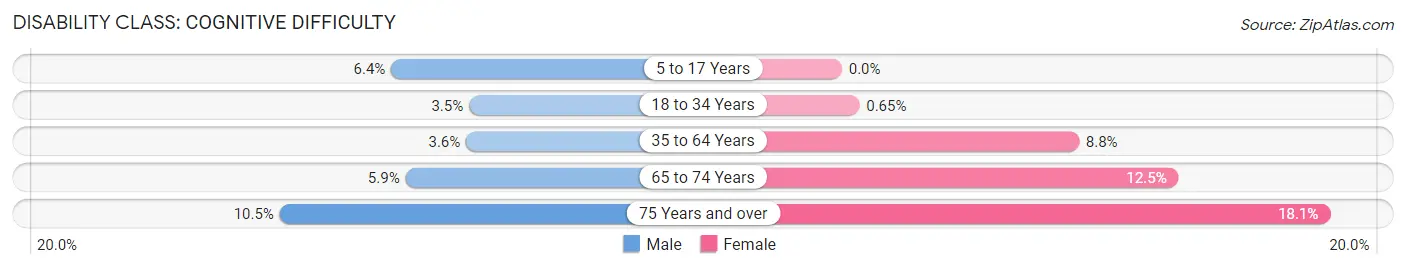
| Age Bracket | Male | Female |
| 5 to 17 Years | 17 (6.4%) | 0 (0.0%) |
| 18 to 34 Years | 12 (3.5%) | 2 (0.6%) |
| 35 to 64 Years | 22 (3.6%) | 57 (8.8%) |
| 65 to 74 Years | 15 (5.9%) | 25 (12.5%) |
| 75 Years and over | 8 (10.5%) | 35 (18.1%) |
Disability Class: Ambulatory Difficulty
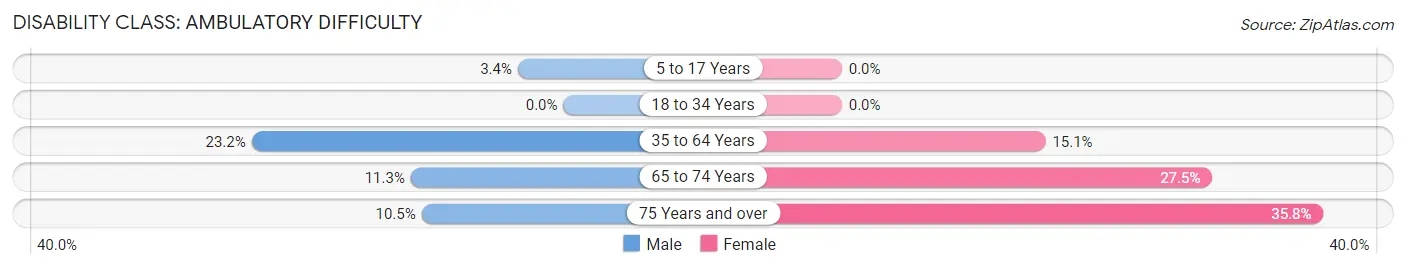
| Age Bracket | Male | Female |
| 5 to 17 Years | 9 (3.4%) | 0 (0.0%) |
| 18 to 34 Years | 0 (0.0%) | 0 (0.0%) |
| 35 to 64 Years | 141 (23.2%) | 98 (15.1%) |
| 65 to 74 Years | 29 (11.3%) | 55 (27.5%) |
| 75 Years and over | 8 (10.5%) | 69 (35.7%) |
Disability Class: Self-Care Difficulty
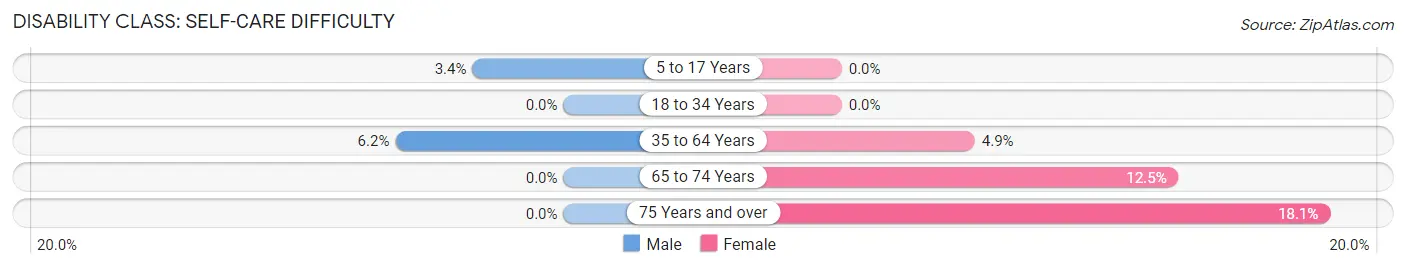
| Age Bracket | Male | Female |
| 5 to 17 Years | 9 (3.4%) | 0 (0.0%) |
| 18 to 34 Years | 0 (0.0%) | 0 (0.0%) |
| 35 to 64 Years | 38 (6.2%) | 32 (4.9%) |
| 65 to 74 Years | 0 (0.0%) | 25 (12.5%) |
| 75 Years and over | 0 (0.0%) | 35 (18.1%) |
Technology Access in Stanford
Computing Device Access in Stanford
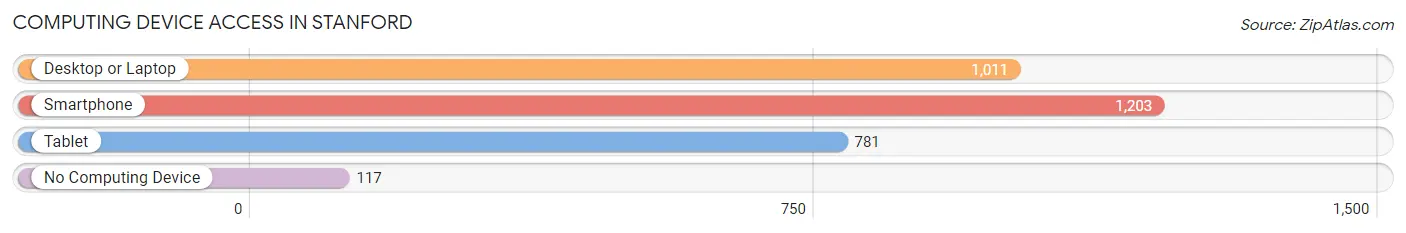
| Device Type | # Households | % Households |
| Desktop or Laptop | 1,011 | 71.7% |
| Smartphone | 1,203 | 85.3% |
| Tablet | 781 | 55.3% |
| No Computing Device | 117 | 8.3% |
| Total | 1,411 | 100.0% |
Internet Access in Stanford
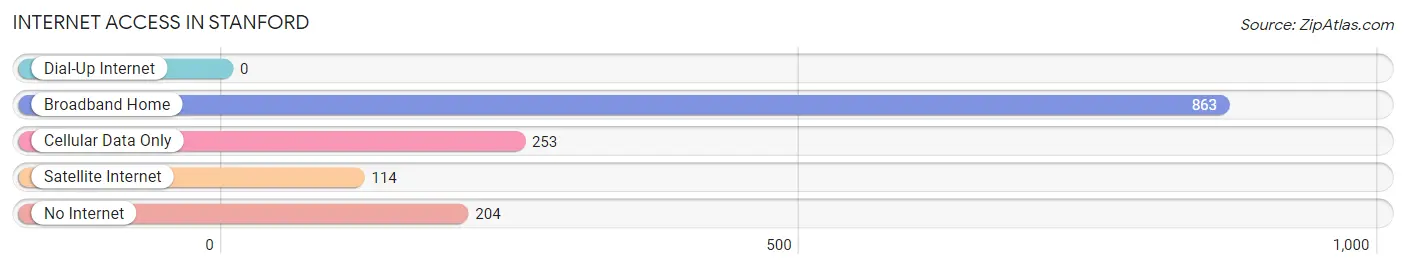
| Internet Type | # Households | % Households |
| Dial-Up Internet | 0 | 0.0% |
| Broadband Home | 863 | 61.2% |
| Cellular Data Only | 253 | 17.9% |
| Satellite Internet | 114 | 8.1% |
| No Internet | 204 | 14.5% |
| Total | 1,411 | 100.0% |
Stanford Summary
Stanford, Kentucky is a small city located in Lincoln County, Kentucky. It is the county seat of Lincoln County and is located in the heart of the Bluegrass Region. The city has a population of approximately 3,400 people and is located about 40 miles south of Lexington.
History
The area that is now Stanford was first settled in 1775 by William Stanford, a Revolutionary War veteran. Stanford was granted a land grant from the state of Virginia and established a settlement in the area. The settlement was originally known as Stanford’s Station and was a stop on the Wilderness Road, a major route for settlers heading west.
In 1836, the town was officially incorporated as Stanford and was named after William Stanford. The town quickly grew and became an important center for trade and commerce in the region. In 1854, the Louisville and Nashville Railroad was built through the town, further increasing its importance.
In the late 19th century, Stanford became a major center for the tobacco industry. The town was home to several tobacco warehouses and factories, and the industry was a major source of employment for the town’s residents.
Geography
Stanford is located in the heart of the Bluegrass Region of Kentucky. The city is situated in the rolling hills of the region and is surrounded by farmland. The city is located about 40 miles south of Lexington and is about 90 miles from Louisville.
The city is located at the intersection of US Highway 27 and Kentucky Highway 78. The city is also served by the Louisville and Nashville Railroad.
Economy
The economy of Stanford is largely based on agriculture and manufacturing. The city is home to several tobacco warehouses and factories, and the industry is still a major source of employment for the town’s residents.
The city is also home to several small businesses, including restaurants, retail stores, and service providers. The city is also home to a branch of the Lincoln County Public Library.
Demographics
As of the 2010 census, the population of Stanford was 3,400. The racial makeup of the city was 95.3% White, 2.2% African American, 0.3% Native American, 0.3% Asian, 0.1% Pacific Islander, 0.7% from other races, and 1.2% from two or more races. Hispanic or Latino of any race were 1.7% of the population.
The median household income in Stanford was $31,250, and the median family income was $37,500. The per capita income for the city was $17,845. About 17.2% of the population was below the poverty line.
Stanford is a small city with a rich history and a diverse economy. The city is home to several tobacco warehouses and factories, and the industry is still a major source of employment for the town’s residents. The city is also home to several small businesses, including restaurants, retail stores, and service providers. The city is also home to a branch of the Lincoln County Public Library. The city has a population of approximately 3,400 people and is located about 40 miles south of Lexington.
Common Questions
What is Per Capita Income in Stanford?
Per Capita income in Stanford is $27,942.
What is the Median Family Income in Stanford?
Median Family Income in Stanford is $69,667.
What is the Median Household income in Stanford?
Median Household Income in Stanford is $57,618.
What is Income or Wage Gap in Stanford?
Income or Wage Gap in Stanford is 35.3%.
Women in Stanford earn 64.7 cents for every dollar earned by a man.
What is Inequality or Gini Index in Stanford?
Inequality or Gini Index in Stanford is 0.46.
What is the Total Population of Stanford?
Total Population of Stanford is 3,654.
What is the Total Male Population of Stanford?
Total Male Population of Stanford is 1,837.
What is the Total Female Population of Stanford?
Total Female Population of Stanford is 1,817.
What is the Ratio of Males per 100 Females in Stanford?
There are 101.10 Males per 100 Females in Stanford.
What is the Ratio of Females per 100 Males in Stanford?
There are 98.91 Females per 100 Males in Stanford.
What is the Median Population Age in Stanford?
Median Population Age in Stanford is 45.5 Years.
What is the Average Family Size in Stanford
Average Family Size in Stanford is 3.0 People.
What is the Average Household Size in Stanford
Average Household Size in Stanford is 2.4 People.
How Large is the Labor Force in Stanford?
There are 1,408 People in the Labor Forcein in Stanford.
What is the Percentage of People in the Labor Force in Stanford?
47.3% of People are in the Labor Force in Stanford.
What is the Unemployment Rate in Stanford?
Unemployment Rate in Stanford is 3.3%.