Francisville, KY Map & Demographics
Francisville Map
Francisville Overview
$53,564
PER CAPITA INCOME
$145,000
AVG FAMILY INCOME
$145,304
AVG HOUSEHOLD INCOME
37.6%
WAGE / INCOME GAP [ % ]
62.4¢/ $1
WAGE / INCOME GAP [ $ ]
0.31
INEQUALITY / GINI INDEX
10,044
TOTAL POPULATION
4,913
MALE POPULATION
5,131
FEMALE POPULATION
95.75
MALES / 100 FEMALES
104.44
FEMALES / 100 MALES
40.6
MEDIAN AGE
3.2
AVG FAMILY SIZE
3.0
AVG HOUSEHOLD SIZE
5,838
LABOR FORCE [ PEOPLE ]
76.8%
PERCENT IN LABOR FORCE
2.1%
UNEMPLOYMENT RATE
Income in Francisville
Income Overview in Francisville
Per Capita Income in Francisville is $53,564, while median incomes of families and households are $145,000 and $145,304 respectively.
| Characteristic | Number | Measure |
| Per Capita Income | 10,044 | $53,564 |
| Median Family Income | 2,894 | $145,000 |
| Mean Family Income | 2,894 | $162,135 |
| Median Household Income | 3,355 | $145,304 |
| Mean Household Income | 3,355 | $156,842 |
| Income Deficit | 2,894 | $0 |
| Wage / Income Gap (%) | 10,044 | 37.62% |
| Wage / Income Gap ($) | 10,044 | 62.38¢ per $1 |
| Gini / Inequality Index | 10,044 | 0.31 |
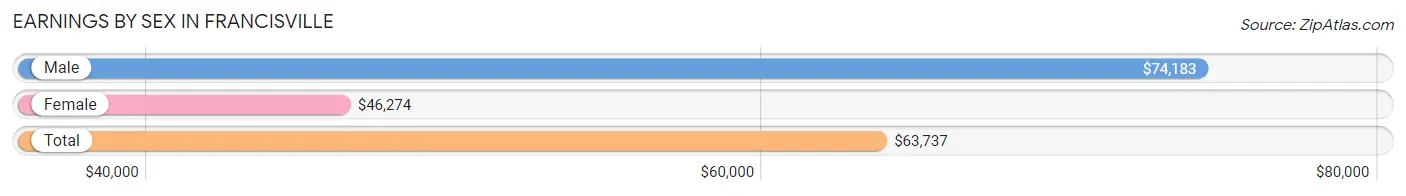
Earnings by Sex in Francisville
Average Earnings in Francisville are $63,737, $74,183 for men and $46,274 for women, a difference of 37.6%.
| Sex | Number | Average Earnings |
| Male | 3,220 (52.3%) | $74,183 |
| Female | 2,942 (47.7%) | $46,274 |
| Total | 6,162 (100.0%) | $63,737 |
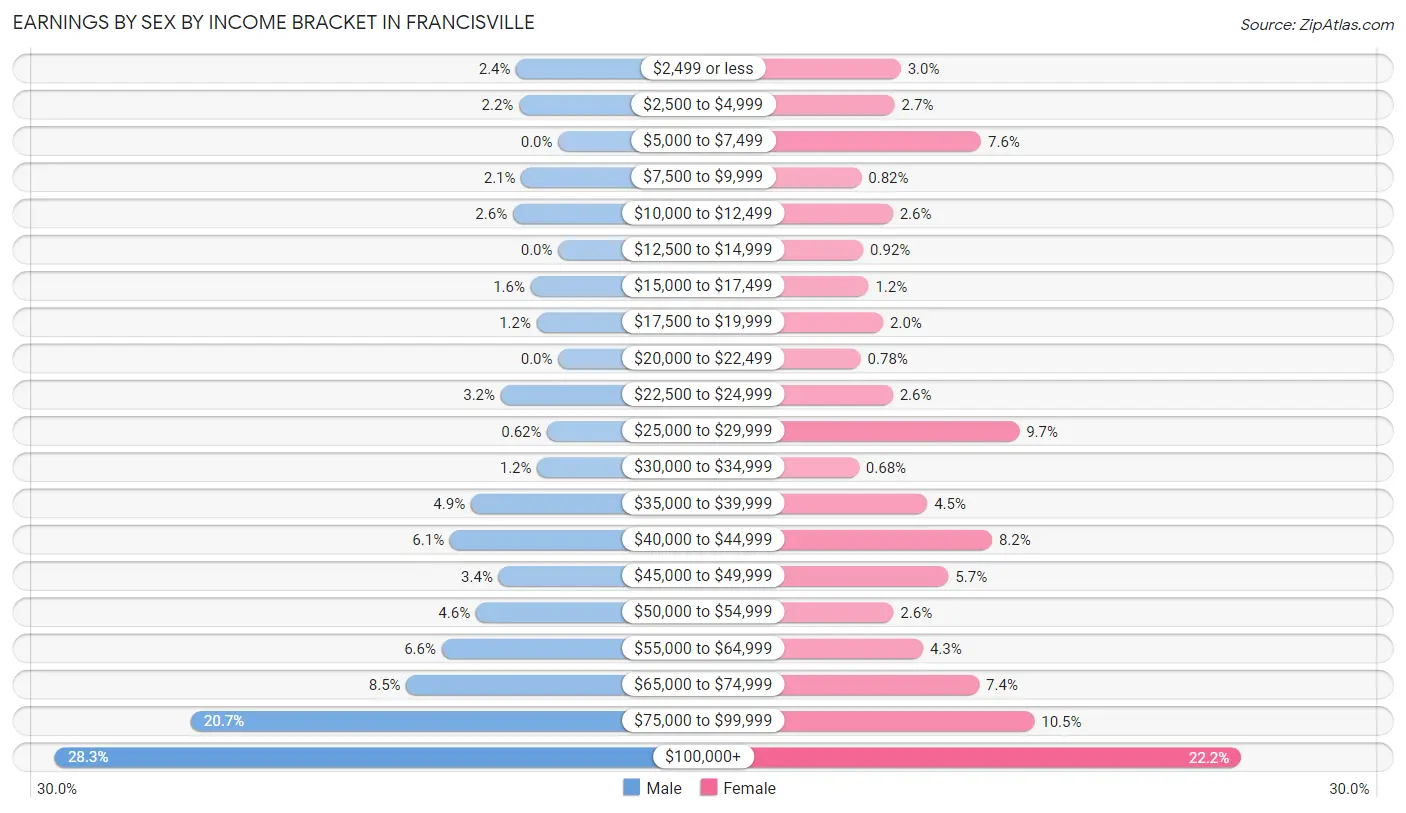
Earnings by Sex by Income Bracket in Francisville
The most common earnings brackets in Francisville are $100,000+ for men (911 | 28.3%) and $100,000+ for women (652 | 22.2%).
| Income | Male | Female |
| $2,499 or less | 76 (2.4%) | 89 (3.0%) |
| $2,500 to $4,999 | 71 (2.2%) | 79 (2.7%) |
| $5,000 to $7,499 | 0 (0.0%) | 222 (7.5%) |
| $7,500 to $9,999 | 67 (2.1%) | 24 (0.8%) |
| $10,000 to $12,499 | 82 (2.5%) | 76 (2.6%) |
| $12,500 to $14,999 | 0 (0.0%) | 27 (0.9%) |
| $15,000 to $17,499 | 50 (1.5%) | 36 (1.2%) |
| $17,500 to $19,999 | 39 (1.2%) | 60 (2.0%) |
| $20,000 to $22,499 | 0 (0.0%) | 23 (0.8%) |
| $22,500 to $24,999 | 104 (3.2%) | 76 (2.6%) |
| $25,000 to $29,999 | 20 (0.6%) | 285 (9.7%) |
| $30,000 to $34,999 | 38 (1.2%) | 20 (0.7%) |
| $35,000 to $39,999 | 158 (4.9%) | 133 (4.5%) |
| $40,000 to $44,999 | 196 (6.1%) | 240 (8.2%) |
| $45,000 to $49,999 | 108 (3.4%) | 168 (5.7%) |
| $50,000 to $54,999 | 149 (4.6%) | 77 (2.6%) |
| $55,000 to $64,999 | 211 (6.6%) | 126 (4.3%) |
| $65,000 to $74,999 | 275 (8.5%) | 219 (7.4%) |
| $75,000 to $99,999 | 665 (20.6%) | 310 (10.5%) |
| $100,000+ | 911 (28.3%) | 652 (22.2%) |
| Total | 3,220 (100.0%) | 2,942 (100.0%) |
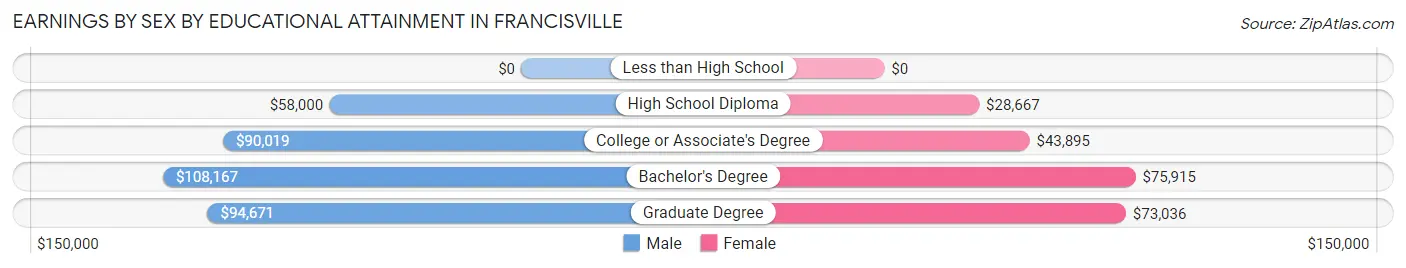
Earnings by Sex by Educational Attainment in Francisville
Average earnings in Francisville are $88,989 for men and $55,159 for women, a difference of 38.0%. Men with an educational attainment of bachelor's degree enjoy the highest average annual earnings of $108,167, while those with high school diploma education earn the least with $58,000. Women with an educational attainment of bachelor's degree earn the most with the average annual earnings of $75,915, while those with high school diploma education have the smallest earnings of $28,667.
| Educational Attainment | Male Income | Female Income |
| Less than High School | - | - |
| High School Diploma | $58,000 | $28,667 |
| College or Associate's Degree | $90,019 | $43,895 |
| Bachelor's Degree | $108,167 | $75,915 |
| Graduate Degree | $94,671 | $73,036 |
| Total | $88,989 | $55,159 |
Family Income in Francisville
Family Income Brackets in Francisville
According to the Francisville family income data, there are 949 families falling into the $100,000 to $149,999 income range, which is the most common income bracket and makes up 32.8% of all families.
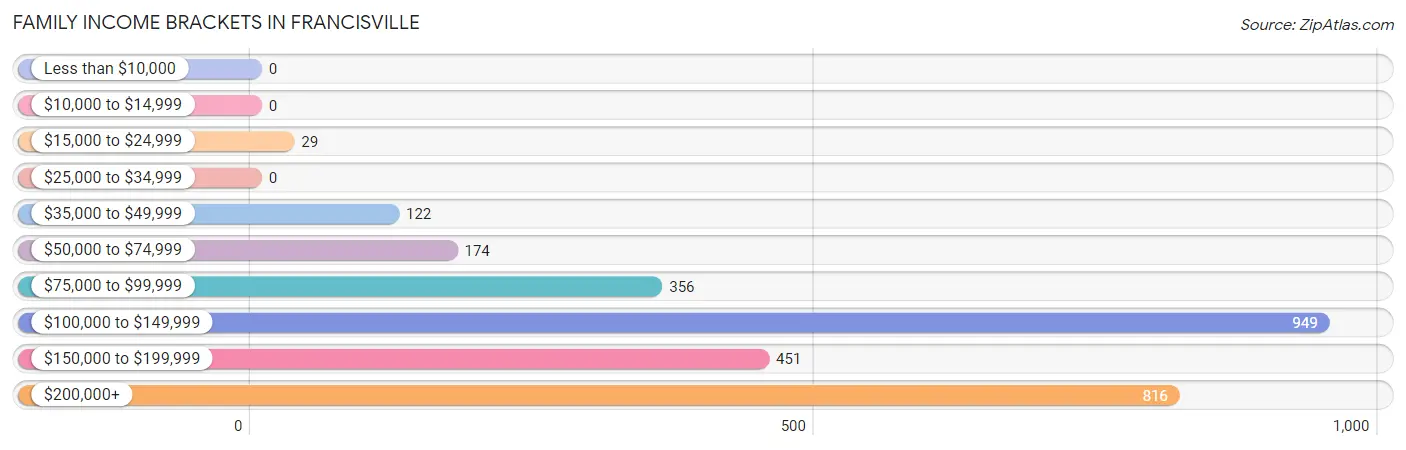
| Income Bracket | # Families | % Families |
| Less than $10,000 | 0 | 0.0% |
| $10,000 to $14,999 | 0 | 0.0% |
| $15,000 to $24,999 | 29 | 1.0% |
| $25,000 to $34,999 | 0 | 0.0% |
| $35,000 to $49,999 | 122 | 4.2% |
| $50,000 to $74,999 | 174 | 6.0% |
| $75,000 to $99,999 | 356 | 12.3% |
| $100,000 to $149,999 | 949 | 32.8% |
| $150,000 to $199,999 | 451 | 15.6% |
| $200,000+ | 816 | 28.2% |
Family Income by Famaliy Size in Francisville
7+ person families (52 | 1.8%) account for the highest median family income in Francisville with $249,286 per family, while 2-person families (1,237 | 42.7%) have the highest median income of $65,296 per family member.
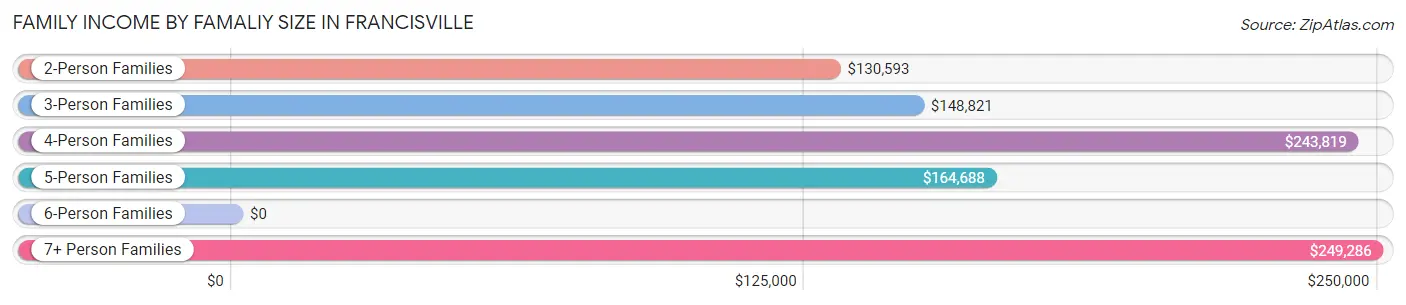
| Income Bracket | # Families | Median Income |
| 2-Person Families | 1,237 (42.7%) | $130,593 |
| 3-Person Families | 685 (23.7%) | $148,821 |
| 4-Person Families | 451 (15.6%) | $243,819 |
| 5-Person Families | 430 (14.9%) | $164,688 |
| 6-Person Families | 39 (1.3%) | $0 |
| 7+ Person Families | 52 (1.8%) | $249,286 |
| Total | 2,894 (100.0%) | $145,000 |
Family Income by Number of Earners in Francisville
The median family income in Francisville is $145,000, with families comprising 3+ earners (405) having the highest median family income of $194,693, while families with no earners (169) have the lowest median family income of $69,044, accounting for 14.0% and 5.8% of families, respectively.
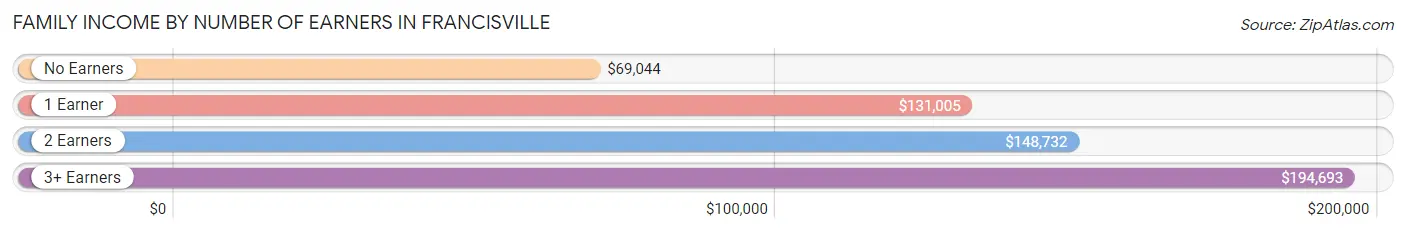
| Number of Earners | # Families | Median Income |
| No Earners | 169 (5.8%) | $69,044 |
| 1 Earner | 661 (22.8%) | $131,005 |
| 2 Earners | 1,659 (57.3%) | $148,732 |
| 3+ Earners | 405 (14.0%) | $194,693 |
| Total | 2,894 (100.0%) | $145,000 |
Household Income in Francisville
Household Income Brackets in Francisville
With 1,033 households falling in the category, the $200,000+ income range is the most frequent in Francisville, accounting for 30.8% of all households.
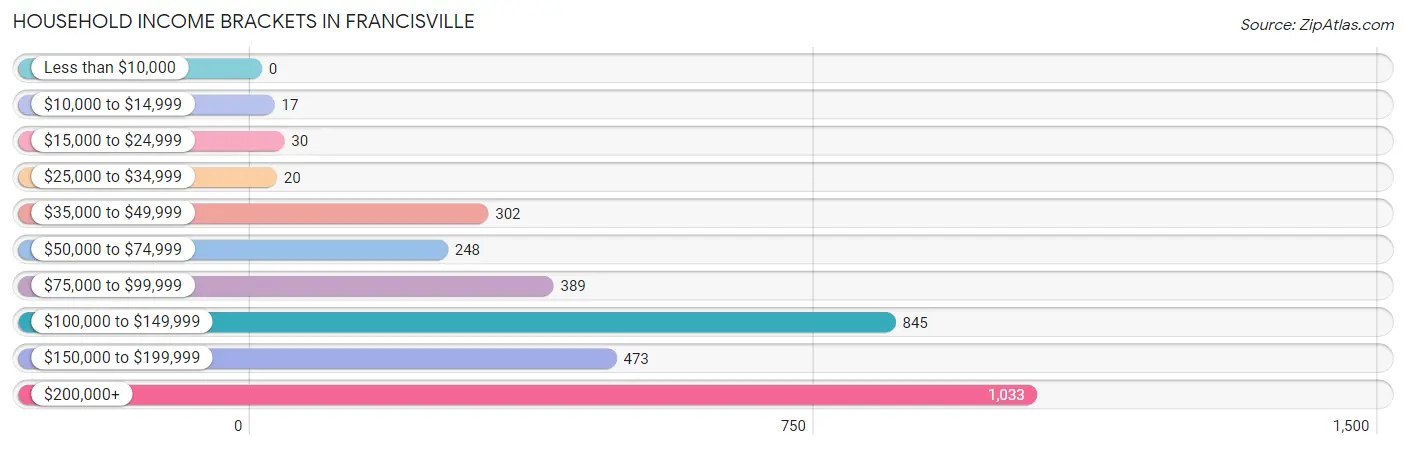
| Income Bracket | # Households | % Households |
| Less than $10,000 | 0 | 0.0% |
| $10,000 to $14,999 | 17 | 0.5% |
| $15,000 to $24,999 | 30 | 0.9% |
| $25,000 to $34,999 | 20 | 0.6% |
| $35,000 to $49,999 | 302 | 9.0% |
| $50,000 to $74,999 | 248 | 7.4% |
| $75,000 to $99,999 | 389 | 11.6% |
| $100,000 to $149,999 | 845 | 25.2% |
| $150,000 to $199,999 | 473 | 14.1% |
| $200,000+ | 1,033 | 30.8% |
Household Income by Householder Age in Francisville
The median household income in Francisville is $145,304, with the highest median household income of $161,250 found in the 25 to 44 years age bracket for the primary householder. A total of 1,250 households (37.3%) fall into this category. Meanwhile, the 15 to 24 years age bracket for the primary householder has the lowest median household income of $0, with 16 households (0.5%) in this group.
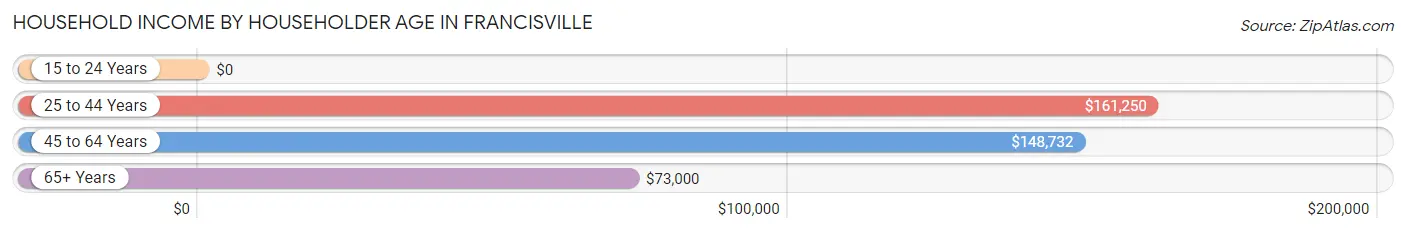
| Income Bracket | # Households | Median Income |
| 15 to 24 Years | 16 (0.5%) | $0 |
| 25 to 44 Years | 1,250 (37.3%) | $161,250 |
| 45 to 64 Years | 1,597 (47.6%) | $148,732 |
| 65+ Years | 492 (14.7%) | $73,000 |
| Total | 3,355 (100.0%) | $145,304 |
Poverty in Francisville
Income Below Poverty by Sex and Age in Francisville
With 1.5% poverty level for males and 2.2% for females among the residents of Francisville, 12 to 14 year old males and 75 year old and over females are the most vulnerable to poverty, with 19 males (8.4%) and 16 females (12.7%) in their respective age groups living below the poverty level.
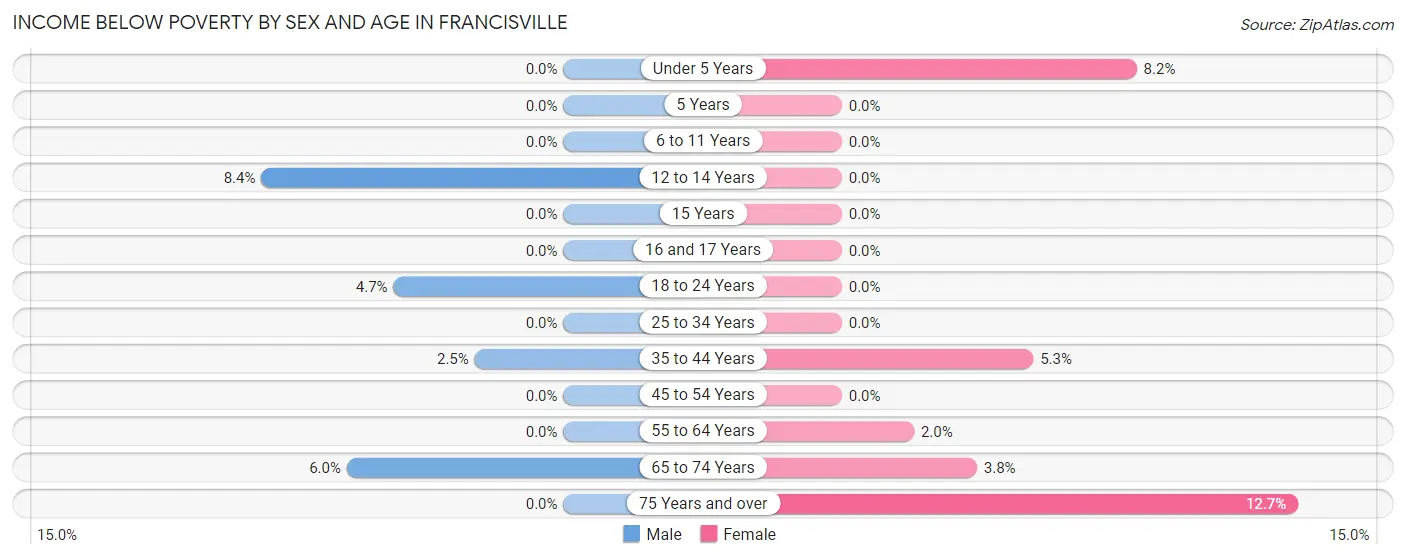
| Age Bracket | Male | Female |
| Under 5 Years | 0 (0.0%) | 17 (8.2%) |
| 5 Years | 0 (0.0%) | 0 (0.0%) |
| 6 to 11 Years | 0 (0.0%) | 0 (0.0%) |
| 12 to 14 Years | 19 (8.4%) | 0 (0.0%) |
| 15 Years | 0 (0.0%) | 0 (0.0%) |
| 16 and 17 Years | 0 (0.0%) | 0 (0.0%) |
| 18 to 24 Years | 15 (4.7%) | 0 (0.0%) |
| 25 to 34 Years | 0 (0.0%) | 0 (0.0%) |
| 35 to 44 Years | 22 (2.5%) | 50 (5.3%) |
| 45 to 54 Years | 0 (0.0%) | 0 (0.0%) |
| 55 to 64 Years | 0 (0.0%) | 16 (2.0%) |
| 65 to 74 Years | 17 (6.0%) | 12 (3.8%) |
| 75 Years and over | 0 (0.0%) | 16 (12.7%) |
| Total | 73 (1.5%) | 111 (2.2%) |
Income Above Poverty by Sex and Age in Francisville
According to the poverty statistics in Francisville, males aged under 5 years and females aged 5 years are the age groups that are most secure financially, with 100.0% of males and 100.0% of females in these age groups living above the poverty line.
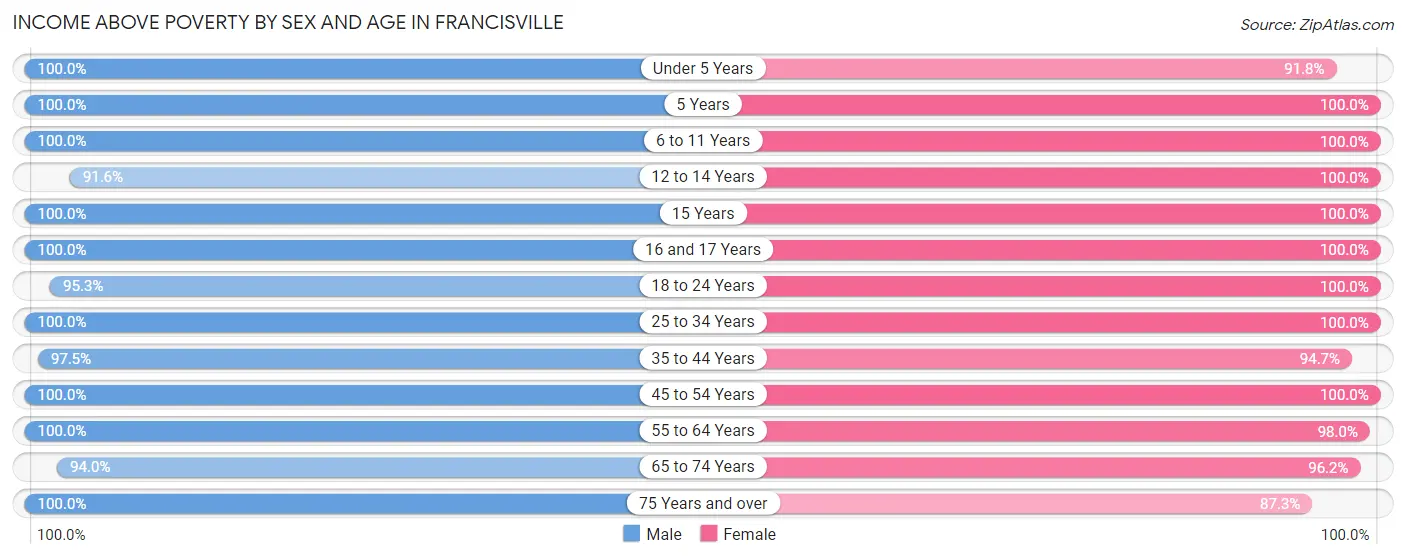
| Age Bracket | Male | Female |
| Under 5 Years | 228 (100.0%) | 190 (91.8%) |
| 5 Years | 100 (100.0%) | 77 (100.0%) |
| 6 to 11 Years | 527 (100.0%) | 584 (100.0%) |
| 12 to 14 Years | 207 (91.6%) | 318 (100.0%) |
| 15 Years | 31 (100.0%) | 63 (100.0%) |
| 16 and 17 Years | 159 (100.0%) | 131 (100.0%) |
| 18 to 24 Years | 302 (95.3%) | 264 (100.0%) |
| 25 to 34 Years | 412 (100.0%) | 479 (100.0%) |
| 35 to 44 Years | 867 (97.5%) | 888 (94.7%) |
| 45 to 54 Years | 738 (100.0%) | 787 (100.0%) |
| 55 to 64 Years | 759 (100.0%) | 781 (98.0%) |
| 65 to 74 Years | 265 (94.0%) | 307 (96.2%) |
| 75 Years and over | 205 (100.0%) | 110 (87.3%) |
| Total | 4,800 (98.5%) | 4,979 (97.8%) |
Income Below Poverty Among Married-Couple Families in Francisville
The poverty statistics for married-couple families in Francisville show that 0.7% or 17 of the total 2,433 families live below the poverty line. Families with 1 or 2 children have the highest poverty rate of 2.1%, comprising of 17 families. On the other hand, families with no children have the lowest poverty rate of 0.0%, which includes 0 families.
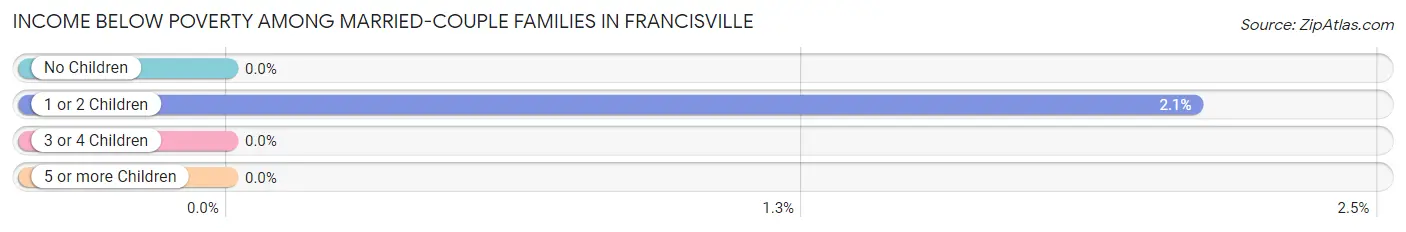
| Children | Above Poverty | Below Poverty |
| No Children | 1,263 (100.0%) | 0 (0.0%) |
| 1 or 2 Children | 792 (97.9%) | 17 (2.1%) |
| 3 or 4 Children | 361 (100.0%) | 0 (0.0%) |
| 5 or more Children | 0 (0.0%) | 0 (0.0%) |
| Total | 2,416 (99.3%) | 17 (0.7%) |
Income Below Poverty Among Single-Parent Households in Francisville
| Children | Single Father | Single Mother |
| No Children | 0 (0.0%) | 0 (0.0%) |
| 1 or 2 Children | 0 (0.0%) | 0 (0.0%) |
| 3 or 4 Children | 0 (0.0%) | 0 (0.0%) |
| 5 or more Children | 0 (0.0%) | 0 (0.0%) |
| Total | 0 (0.0%) | 0 (0.0%) |
Income Below Poverty Among Married-Couple vs Single-Parent Households in Francisville
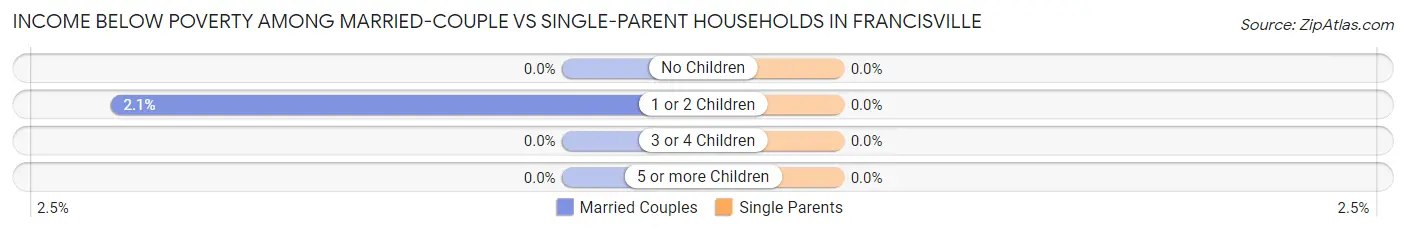
| Children | Married-Couple Families | Single-Parent Households |
| No Children | 0 (0.0%) | 0 (0.0%) |
| 1 or 2 Children | 17 (2.1%) | 0 (0.0%) |
| 3 or 4 Children | 0 (0.0%) | 0 (0.0%) |
| 5 or more Children | 0 (0.0%) | 0 (0.0%) |
| Total | 17 (0.7%) | 0 (0.0%) |
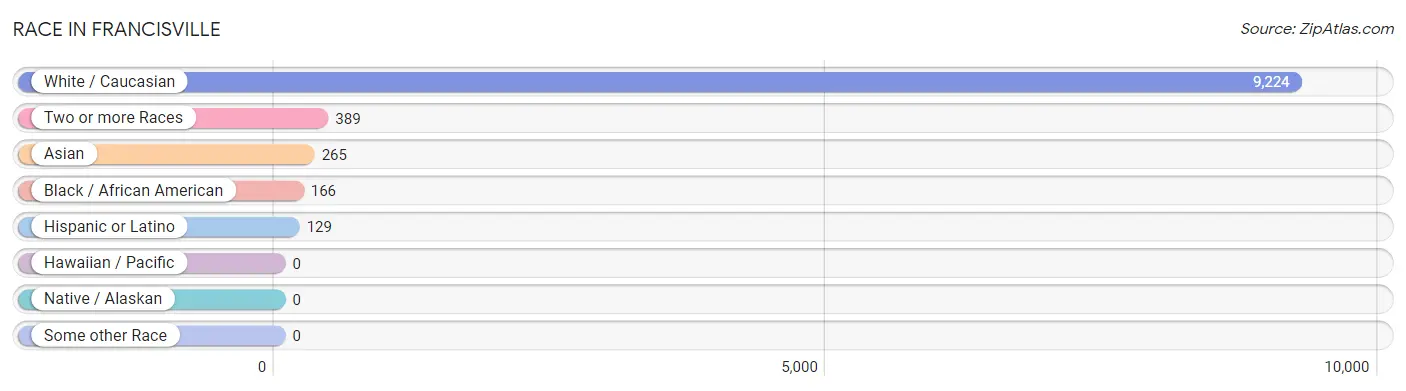
Race in Francisville
The most populous races in Francisville are White / Caucasian (9,224 | 91.8%), Two or more Races (389 | 3.9%), and Asian (265 | 2.6%).
| Race | # Population | % Population |
| Asian | 265 | 2.6% |
| Black / African American | 166 | 1.7% |
| Hawaiian / Pacific | 0 | 0.0% |
| Hispanic or Latino | 129 | 1.3% |
| Native / Alaskan | 0 | 0.0% |
| White / Caucasian | 9,224 | 91.8% |
| Two or more Races | 389 | 3.9% |
| Some other Race | 0 | 0.0% |
| Total | 10,044 | 100.0% |
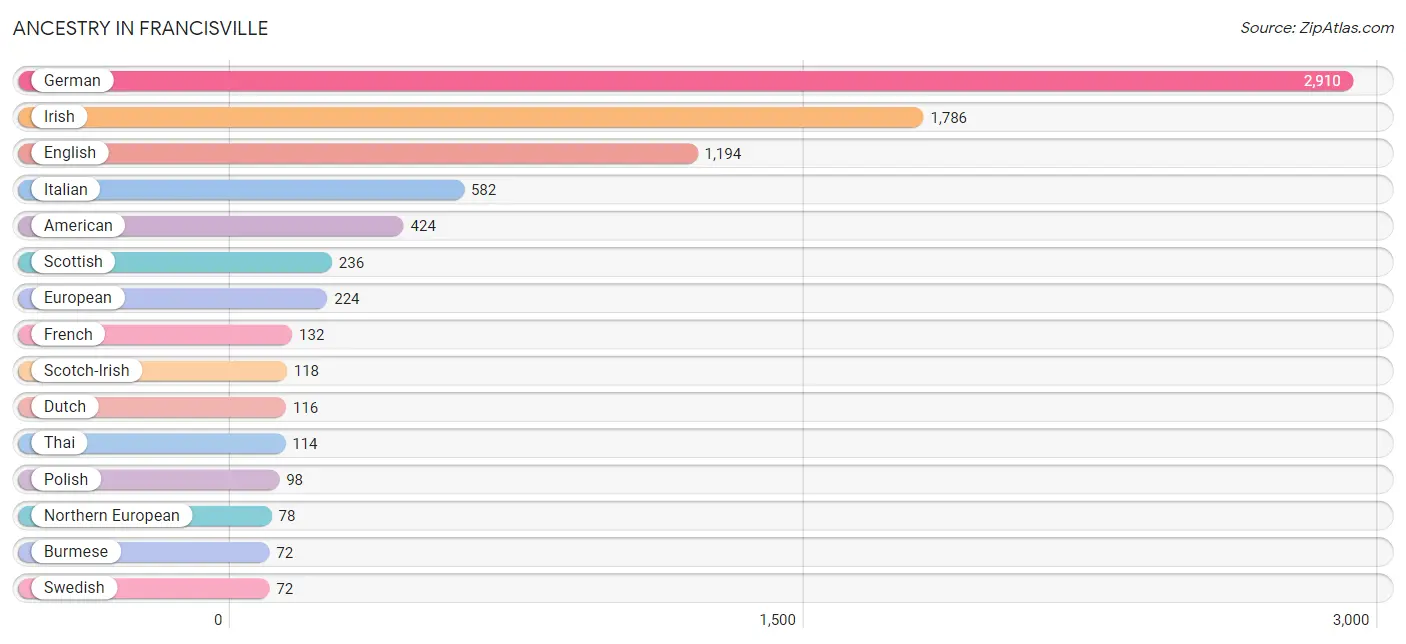
Ancestry in Francisville
The most populous ancestries reported in Francisville are German (2,910 | 29.0%), Irish (1,786 | 17.8%), English (1,194 | 11.9%), Italian (582 | 5.8%), and American (424 | 4.2%), together accounting for 68.6% of all Francisville residents.
| Ancestry | # Population | % Population |
| African | 41 | 0.4% |
| American | 424 | 4.2% |
| Arab | 41 | 0.4% |
| Austrian | 8 | 0.1% |
| British | 9 | 0.1% |
| Burmese | 72 | 0.7% |
| Canadian | 37 | 0.4% |
| Czech | 31 | 0.3% |
| Czechoslovakian | 18 | 0.2% |
| Dutch | 116 | 1.1% |
| Eastern European | 8 | 0.1% |
| English | 1,194 | 11.9% |
| European | 224 | 2.2% |
| French | 132 | 1.3% |
| French Canadian | 20 | 0.2% |
| German | 2,910 | 29.0% |
| Greek | 22 | 0.2% |
| Indian (Asian) | 37 | 0.4% |
| Irish | 1,786 | 17.8% |
| Italian | 582 | 5.8% |
| Korean | 49 | 0.5% |
| Lithuanian | 48 | 0.5% |
| Mexican | 59 | 0.6% |
| Northern European | 78 | 0.8% |
| Norwegian | 54 | 0.5% |
| Pakistani | 40 | 0.4% |
| Peruvian | 41 | 0.4% |
| Polish | 98 | 1.0% |
| Scandinavian | 24 | 0.2% |
| Scotch-Irish | 118 | 1.2% |
| Scottish | 236 | 2.4% |
| South American | 41 | 0.4% |
| Spaniard | 29 | 0.3% |
| Subsaharan African | 41 | 0.4% |
| Swedish | 72 | 0.7% |
| Thai | 114 | 1.1% |
| Welsh | 10 | 0.1% | View All 37 Rows |
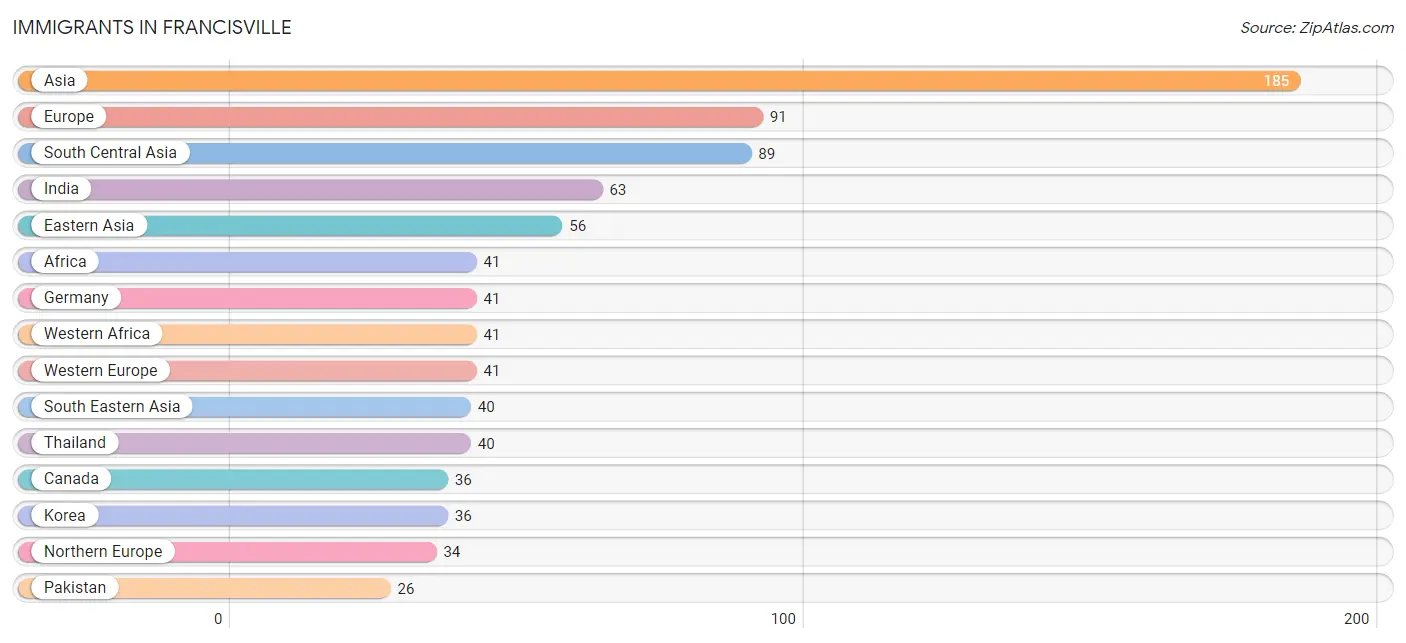
Immigrants in Francisville
The most numerous immigrant groups reported in Francisville came from Asia (185 | 1.8%), Europe (91 | 0.9%), South Central Asia (89 | 0.9%), India (63 | 0.6%), and Eastern Asia (56 | 0.6%), together accounting for 4.8% of all Francisville residents.
| Immigration Origin | # Population | % Population |
| Africa | 41 | 0.4% |
| Asia | 185 | 1.8% |
| Canada | 36 | 0.4% |
| Central America | 23 | 0.2% |
| China | 20 | 0.2% |
| Eastern Asia | 56 | 0.6% |
| England | 21 | 0.2% |
| Europe | 91 | 0.9% |
| Germany | 41 | 0.4% |
| Hong Kong | 3 | 0.0% |
| India | 63 | 0.6% |
| Italy | 16 | 0.2% |
| Korea | 36 | 0.4% |
| Latin America | 23 | 0.2% |
| Mexico | 23 | 0.2% |
| Northern Europe | 34 | 0.3% |
| Pakistan | 26 | 0.3% |
| Senegal | 24 | 0.2% |
| South Central Asia | 89 | 0.9% |
| South Eastern Asia | 40 | 0.4% |
| Southern Europe | 16 | 0.2% |
| Thailand | 40 | 0.4% |
| Western Africa | 41 | 0.4% |
| Western Europe | 41 | 0.4% | View All 24 Rows |
Sex and Age in Francisville
Sex and Age in Francisville
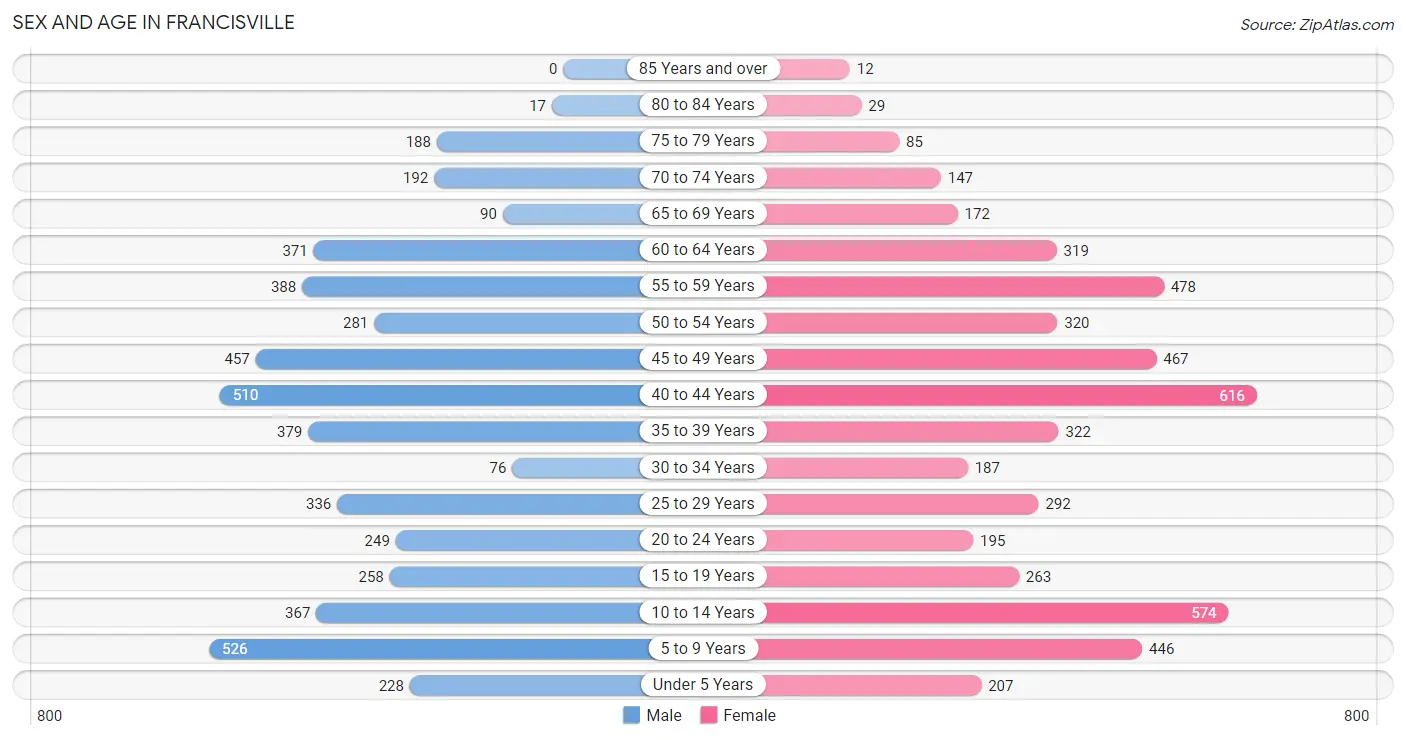
The most populous age groups in Francisville are 5 to 9 Years (526 | 10.7%) for men and 40 to 44 Years (616 | 12.0%) for women.
| Age Bracket | Male | Female |
| Under 5 Years | 228 (4.6%) | 207 (4.0%) |
| 5 to 9 Years | 526 (10.7%) | 446 (8.7%) |
| 10 to 14 Years | 367 (7.5%) | 574 (11.2%) |
| 15 to 19 Years | 258 (5.2%) | 263 (5.1%) |
| 20 to 24 Years | 249 (5.1%) | 195 (3.8%) |
| 25 to 29 Years | 336 (6.8%) | 292 (5.7%) |
| 30 to 34 Years | 76 (1.5%) | 187 (3.6%) |
| 35 to 39 Years | 379 (7.7%) | 322 (6.3%) |
| 40 to 44 Years | 510 (10.4%) | 616 (12.0%) |
| 45 to 49 Years | 457 (9.3%) | 467 (9.1%) |
| 50 to 54 Years | 281 (5.7%) | 320 (6.2%) |
| 55 to 59 Years | 388 (7.9%) | 478 (9.3%) |
| 60 to 64 Years | 371 (7.5%) | 319 (6.2%) |
| 65 to 69 Years | 90 (1.8%) | 172 (3.4%) |
| 70 to 74 Years | 192 (3.9%) | 147 (2.9%) |
| 75 to 79 Years | 188 (3.8%) | 85 (1.7%) |
| 80 to 84 Years | 17 (0.4%) | 29 (0.6%) |
| 85 Years and over | 0 (0.0%) | 12 (0.2%) |
| Total | 4,913 (100.0%) | 5,131 (100.0%) |
Families and Households in Francisville
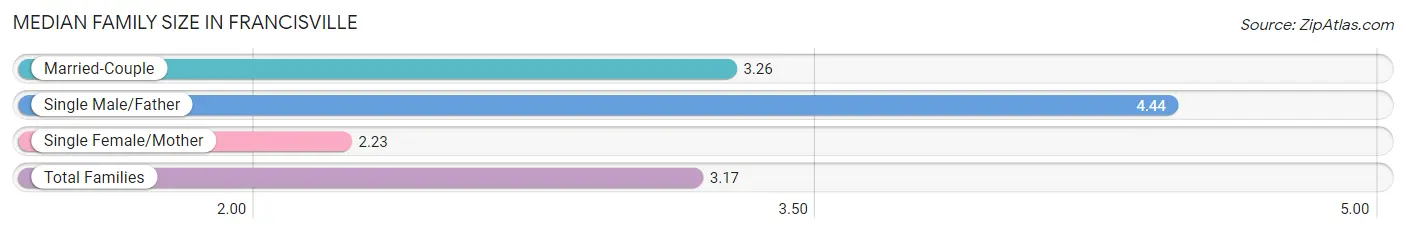
Median Family Size in Francisville
The median family size in Francisville is 3.17 persons per family, with single male/father families (98 | 3.4%) accounting for the largest median family size of 4.44 persons per family. On the other hand, single female/mother families (363 | 12.5%) represent the smallest median family size with 2.23 persons per family.
| Family Type | # Families | Family Size |
| Married-Couple | 2,433 (84.1%) | 3.26 |
| Single Male/Father | 98 (3.4%) | 4.44 |
| Single Female/Mother | 363 (12.5%) | 2.23 |
| Total Families | 2,894 (100.0%) | 3.17 |
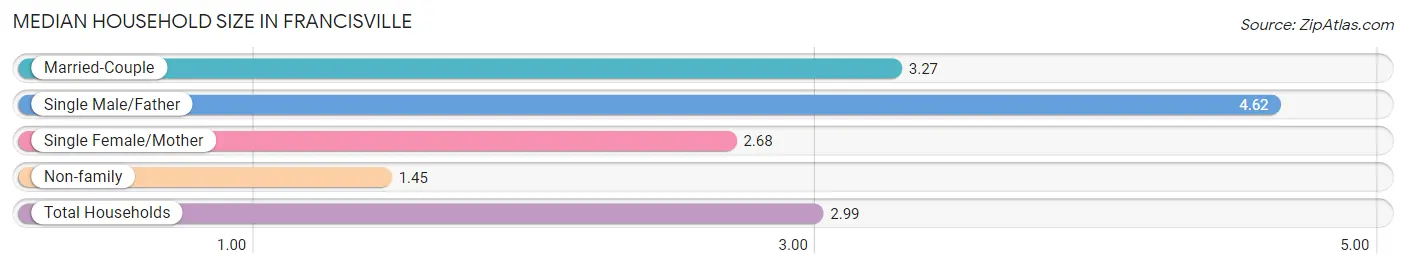
Median Household Size in Francisville
The median household size in Francisville is 2.99 persons per household, with single male/father households (98 | 2.9%) accounting for the largest median household size of 4.62 persons per household. non-family households (461 | 13.7%) represent the smallest median household size with 1.45 persons per household.
| Household Type | # Households | Household Size |
| Married-Couple | 2,433 (72.5%) | 3.27 |
| Single Male/Father | 98 (2.9%) | 4.62 |
| Single Female/Mother | 363 (10.8%) | 2.68 |
| Non-family | 461 (13.7%) | 1.45 |
| Total Households | 3,355 (100.0%) | 2.99 |
Household Size by Marriage Status in Francisville
Out of a total of 3,355 households in Francisville, 2,894 (86.3%) are family households, while 461 (13.7%) are nonfamily households. The most numerous type of family households are 2-person households, comprising 1,058, and the most common type of nonfamily households are 1-person households, comprising 331.
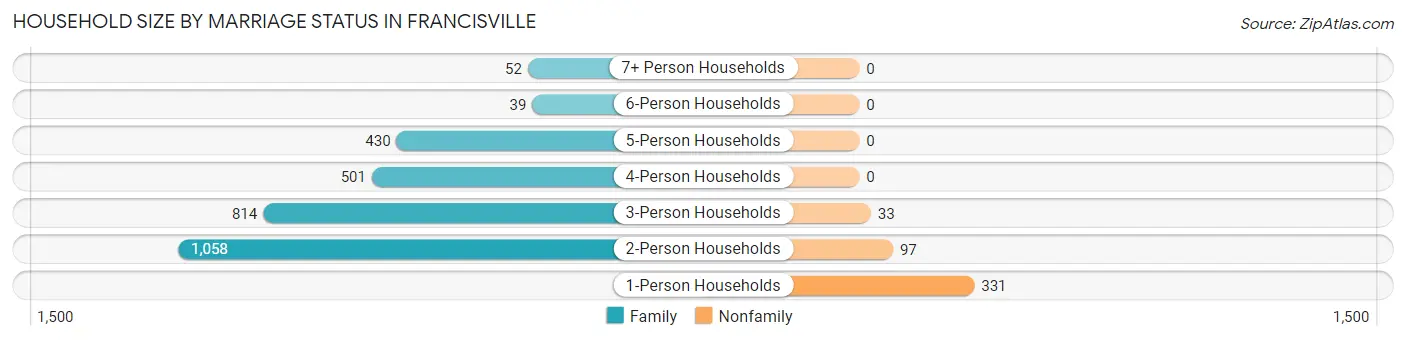
| Household Size | Family Households | Nonfamily Households |
| 1-Person Households | - | 331 (9.9%) |
| 2-Person Households | 1,058 (31.5%) | 97 (2.9%) |
| 3-Person Households | 814 (24.3%) | 33 (1.0%) |
| 4-Person Households | 501 (14.9%) | 0 (0.0%) |
| 5-Person Households | 430 (12.8%) | 0 (0.0%) |
| 6-Person Households | 39 (1.2%) | 0 (0.0%) |
| 7+ Person Households | 52 (1.5%) | 0 (0.0%) |
| Total | 2,894 (86.3%) | 461 (13.7%) |
Female Fertility in Francisville
Fertility by Age in Francisville
Average fertility rate in Francisville is 55.0 births per 1,000 women. Women in the age bracket of 20 to 34 years have the highest fertility rate with 200.0 births per 1,000 women. Women in the age bracket of 20 to 34 years acount for 100.0% of all women with births.
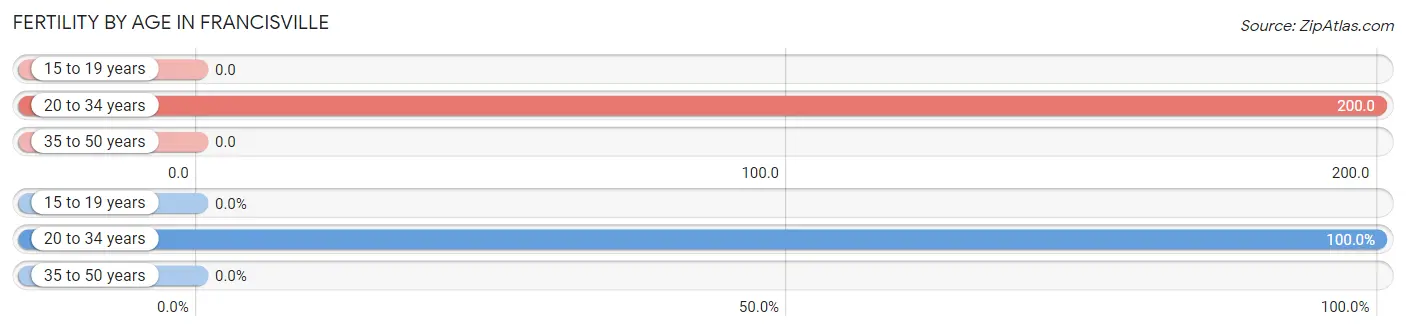
| Age Bracket | Women with Births | Births / 1,000 Women |
| 15 to 19 years | 0 (0.0%) | 0.0 |
| 20 to 34 years | 135 (100.0%) | 200.0 |
| 35 to 50 years | 0 (0.0%) | 0.0 |
| Total | 135 (100.0%) | 55.0 |
Fertility by Age by Marriage Status in Francisville
71.9% of women with births (135) in Francisville are married. The highest percentage of unmarried women with births falls into 20 to 34 years age bracket with 28.1% of them unmarried at the time of birth, while the lowest percentage of unmarried women with births belong to 20 to 34 years age bracket with 28.1% of them unmarried.
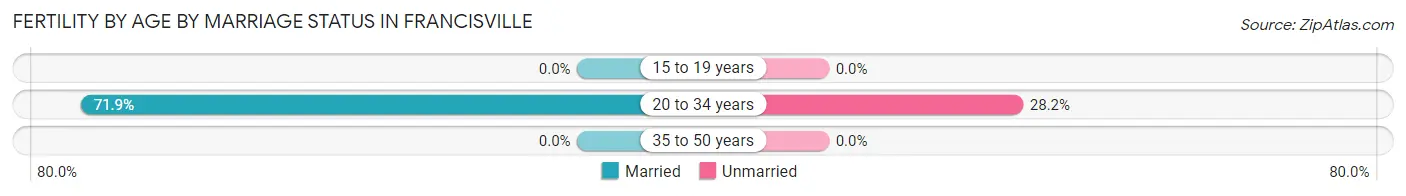
| Age Bracket | Married | Unmarried |
| 15 to 19 years | 0 (0.0%) | 0 (0.0%) |
| 20 to 34 years | 97 (71.9%) | 38 (28.1%) |
| 35 to 50 years | 0 (0.0%) | 0 (0.0%) |
| Total | 97 (71.9%) | 38 (28.1%) |
Fertility by Education in Francisville
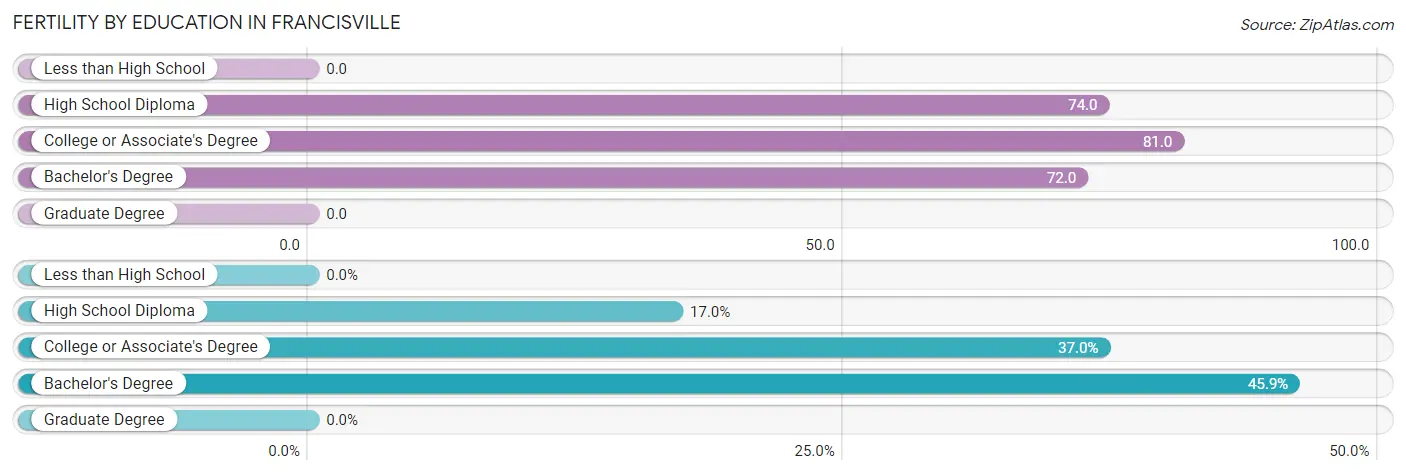
| Educational Attainment | Women with Births | Births / 1,000 Women |
| Less than High School | 0 (0.0%) | 0.0 |
| High School Diploma | 23 (17.0%) | 74.0 |
| College or Associate's Degree | 50 (37.0%) | 81.0 |
| Bachelor's Degree | 62 (45.9%) | 72.0 |
| Graduate Degree | 0 (0.0%) | 0.0 |
| Total | 135 (100.0%) | 55.0 |
Fertility by Education by Marriage Status in Francisville
28.1% of women with births in Francisville are unmarried. Women with the educational attainment of college or associate's degree are most likely to be married with 100.0% of them married at childbirth, while women with the educational attainment of high school diploma are least likely to be married with 100.0% of them unmarried at childbirth.
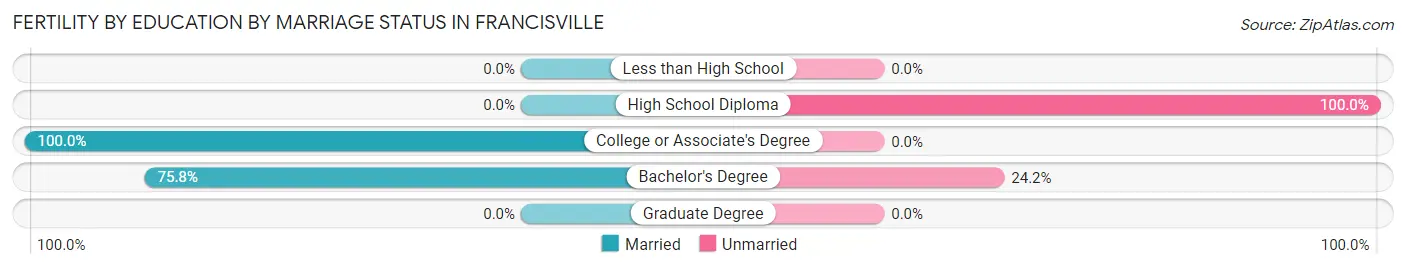
| Educational Attainment | Married | Unmarried |
| Less than High School | 0 (0.0%) | 0 (0.0%) |
| High School Diploma | 0 (0.0%) | 23 (100.0%) |
| College or Associate's Degree | 50 (100.0%) | 0 (0.0%) |
| Bachelor's Degree | 47 (75.8%) | 15 (24.2%) |
| Graduate Degree | 0 (0.0%) | 0 (0.0%) |
| Total | 97 (71.9%) | 38 (28.1%) |
Employment Characteristics in Francisville
Employment by Class of Employer in Francisville
Among the 5,690 employed individuals in Francisville, private company employees (3,937 | 69.2%), not-for-profit organizations (496 | 8.7%), and local government employees (335 | 5.9%) make up the most common classes of employment.
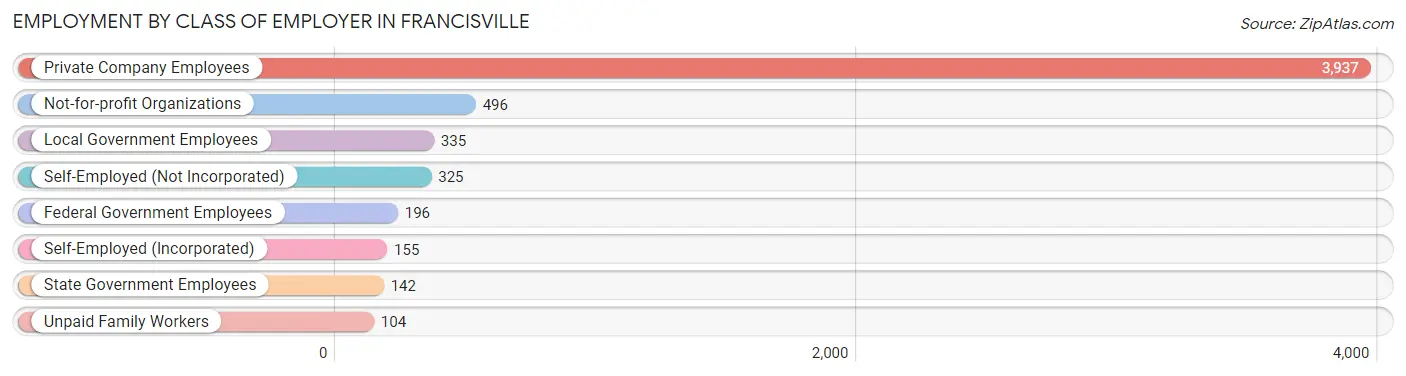
| Employer Class | # Employees | % Employees |
| Private Company Employees | 3,937 | 69.2% |
| Self-Employed (Incorporated) | 155 | 2.7% |
| Self-Employed (Not Incorporated) | 325 | 5.7% |
| Not-for-profit Organizations | 496 | 8.7% |
| Local Government Employees | 335 | 5.9% |
| State Government Employees | 142 | 2.5% |
| Federal Government Employees | 196 | 3.4% |
| Unpaid Family Workers | 104 | 1.8% |
| Total | 5,690 | 100.0% |
Employment Status by Age in Francisville
According to the labor force statistics for Francisville, out of the total population over 16 years of age (7,602), 76.8% or 5,838 individuals are in the labor force, with 2.1% or 123 of them unemployed. The age group with the highest labor force participation rate is 25 to 29 years, with 100.0% or 628 individuals in the labor force. Within the labor force, the 75 years and over age range has the highest percentage of unemployed individuals, with 14.8% or 9 of them being unemployed.
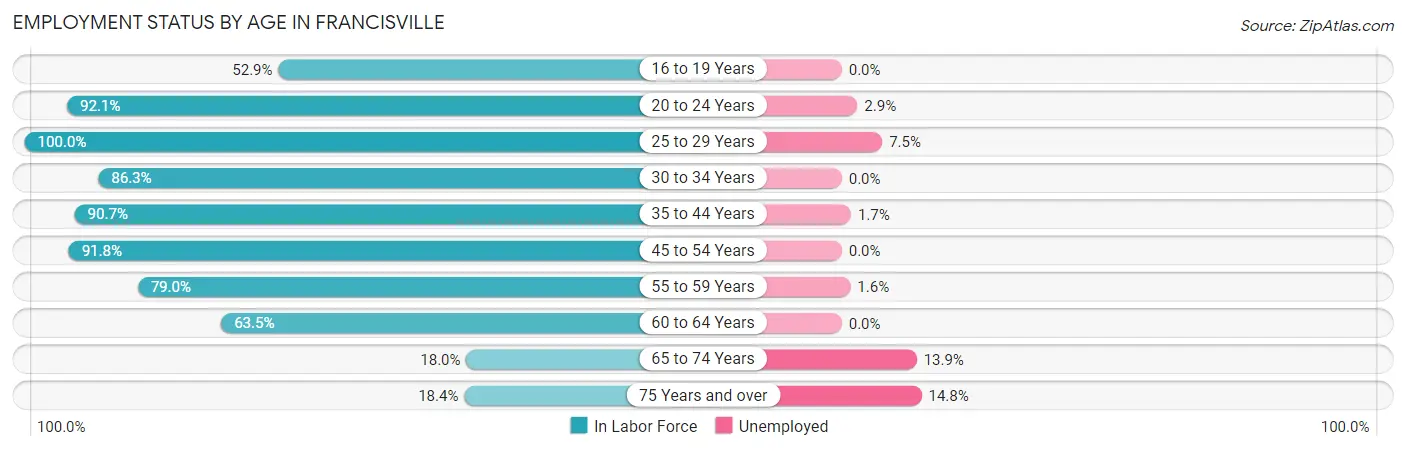
| Age Bracket | In Labor Force | Unemployed |
| 16 to 19 Years | 226 (52.9%) | 0 (0.0%) |
| 20 to 24 Years | 409 (92.1%) | 12 (2.9%) |
| 25 to 29 Years | 628 (100.0%) | 47 (7.5%) |
| 30 to 34 Years | 227 (86.3%) | 0 (0.0%) |
| 35 to 44 Years | 1,657 (90.7%) | 28 (1.7%) |
| 45 to 54 Years | 1,400 (91.8%) | 0 (0.0%) |
| 55 to 59 Years | 684 (79.0%) | 11 (1.6%) |
| 60 to 64 Years | 438 (63.5%) | 0 (0.0%) |
| 65 to 74 Years | 108 (18.0%) | 15 (13.9%) |
| 75 Years and over | 61 (18.4%) | 9 (14.8%) |
| Total | 5,838 (76.8%) | 123 (2.1%) |
Employment Status by Educational Attainment in Francisville
According to labor force statistics for Francisville, 86.8% of individuals (5,034) out of the total population between 25 and 64 years of age (5,799) are in the labor force, with 1.7% or 86 of them being unemployed. The group with the highest labor force participation rate are those with the educational attainment of bachelor's degree or higher, with 90.9% or 2,718 individuals in the labor force. Within the labor force, individuals with college / associate degree education have the highest percentage of unemployment, with 4.9% or 75 of them being unemployed.
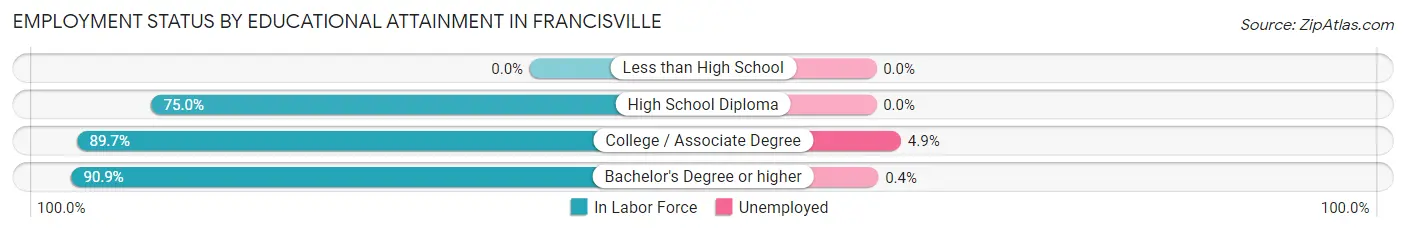
| Educational Attainment | In Labor Force | Unemployed |
| Less than High School | 0 (0.0%) | 0 (0.0%) |
| High School Diploma | 789 (75.0%) | 0 (0.0%) |
| College / Associate Degree | 1,528 (89.7%) | 83 (4.9%) |
| Bachelor's Degree or higher | 2,718 (90.9%) | 12 (0.4%) |
| Total | 5,034 (86.8%) | 99 (1.7%) |
Employment Occupations by Sex in Francisville
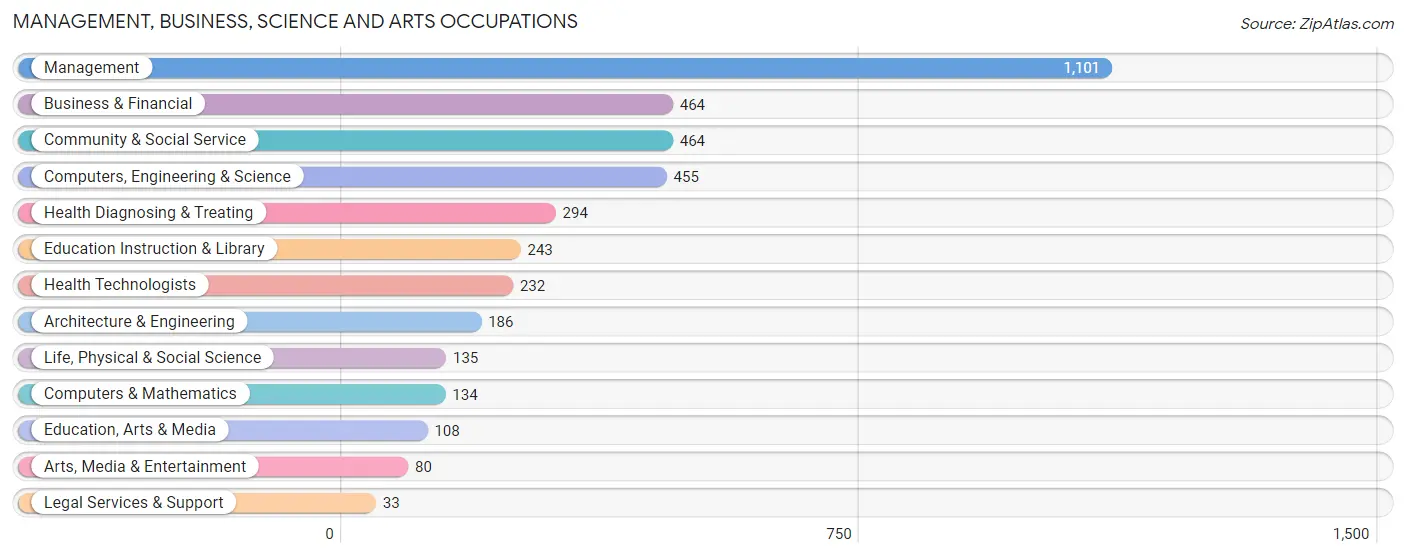
Management, Business, Science and Arts Occupations
The most common Management, Business, Science and Arts occupations in Francisville are Management (1,101 | 19.3%), Business & Financial (464 | 8.1%), Community & Social Service (464 | 8.1%), Computers, Engineering & Science (455 | 8.0%), and Health Diagnosing & Treating (294 | 5.1%).
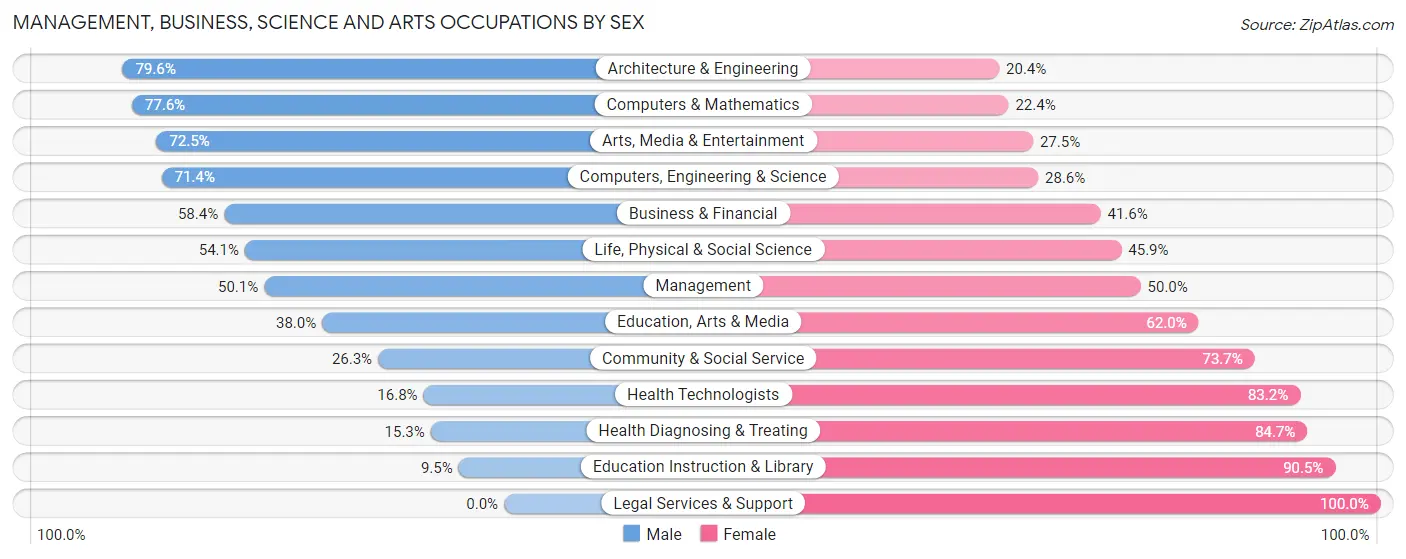
Management, Business, Science and Arts Occupations by Sex
Within the Management, Business, Science and Arts occupations in Francisville, the most male-oriented occupations are Architecture & Engineering (79.6%), Computers & Mathematics (77.6%), and Arts, Media & Entertainment (72.5%), while the most female-oriented occupations are Legal Services & Support (100.0%), Education Instruction & Library (90.5%), and Health Diagnosing & Treating (84.7%).
| Occupation | Male | Female |
| Management | 551 (50.0%) | 550 (49.9%) |
| Business & Financial | 271 (58.4%) | 193 (41.6%) |
| Computers, Engineering & Science | 325 (71.4%) | 130 (28.6%) |
| Computers & Mathematics | 104 (77.6%) | 30 (22.4%) |
| Architecture & Engineering | 148 (79.6%) | 38 (20.4%) |
| Life, Physical & Social Science | 73 (54.1%) | 62 (45.9%) |
| Community & Social Service | 122 (26.3%) | 342 (73.7%) |
| Education, Arts & Media | 41 (38.0%) | 67 (62.0%) |
| Legal Services & Support | 0 (0.0%) | 33 (100.0%) |
| Education Instruction & Library | 23 (9.5%) | 220 (90.5%) |
| Arts, Media & Entertainment | 58 (72.5%) | 22 (27.5%) |
| Health Diagnosing & Treating | 45 (15.3%) | 249 (84.7%) |
| Health Technologists | 39 (16.8%) | 193 (83.2%) |
| Total (Category) | 1,314 (47.3%) | 1,464 (52.7%) |
| Total (Overall) | 2,955 (51.7%) | 2,761 (48.3%) |
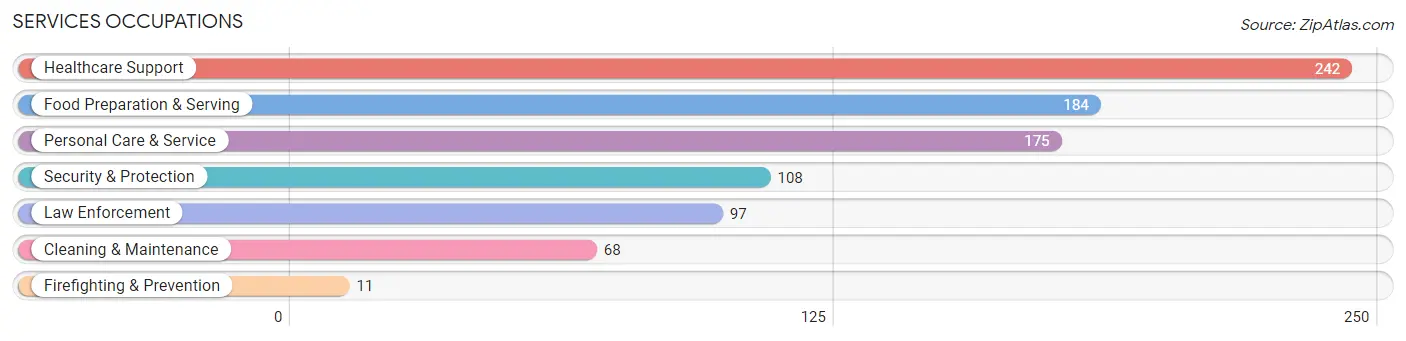
Services Occupations
The most common Services occupations in Francisville are Healthcare Support (242 | 4.2%), Food Preparation & Serving (184 | 3.2%), Personal Care & Service (175 | 3.1%), Security & Protection (108 | 1.9%), and Law Enforcement (97 | 1.7%).
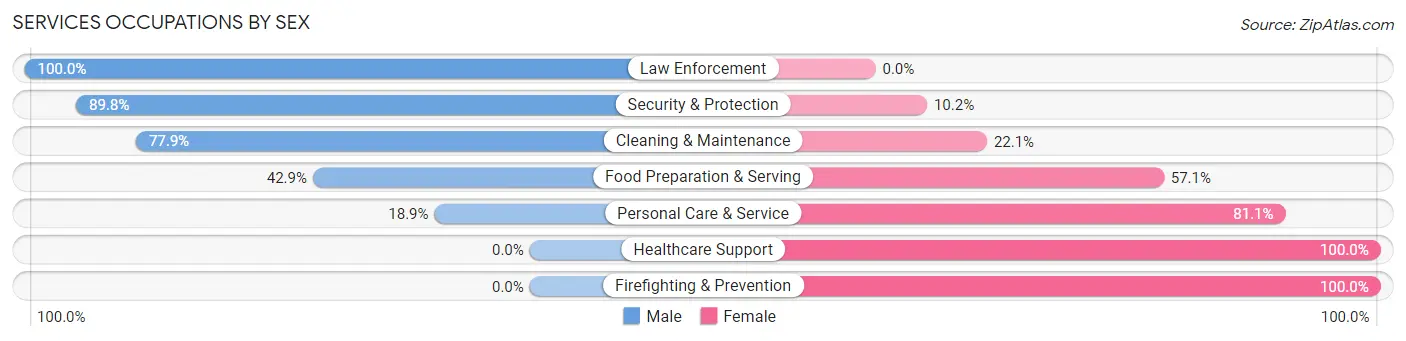
Services Occupations by Sex
Within the Services occupations in Francisville, the most male-oriented occupations are Law Enforcement (100.0%), Security & Protection (89.8%), and Cleaning & Maintenance (77.9%), while the most female-oriented occupations are Healthcare Support (100.0%), Firefighting & Prevention (100.0%), and Personal Care & Service (81.1%).
| Occupation | Male | Female |
| Healthcare Support | 0 (0.0%) | 242 (100.0%) |
| Security & Protection | 97 (89.8%) | 11 (10.2%) |
| Firefighting & Prevention | 0 (0.0%) | 11 (100.0%) |
| Law Enforcement | 97 (100.0%) | 0 (0.0%) |
| Food Preparation & Serving | 79 (42.9%) | 105 (57.1%) |
| Cleaning & Maintenance | 53 (77.9%) | 15 (22.1%) |
| Personal Care & Service | 33 (18.9%) | 142 (81.1%) |
| Total (Category) | 262 (33.7%) | 515 (66.3%) |
| Total (Overall) | 2,955 (51.7%) | 2,761 (48.3%) |
Sales and Office Occupations
The most common Sales and Office occupations in Francisville are Sales & Related (624 | 10.9%), and Office & Administration (315 | 5.5%).

Sales and Office Occupations by Sex

| Occupation | Male | Female |
| Sales & Related | 202 (32.4%) | 422 (67.6%) |
| Office & Administration | 37 (11.7%) | 278 (88.2%) |
| Total (Category) | 239 (25.5%) | 700 (74.6%) |
| Total (Overall) | 2,955 (51.7%) | 2,761 (48.3%) |
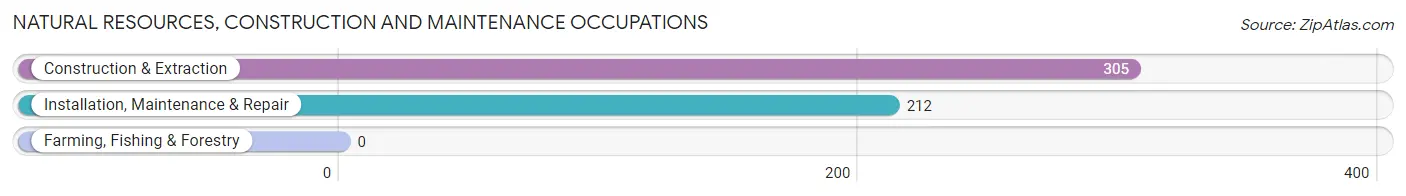
Natural Resources, Construction and Maintenance Occupations
The most common Natural Resources, Construction and Maintenance occupations in Francisville are Construction & Extraction (305 | 5.3%), and Installation, Maintenance & Repair (212 | 3.7%).
Natural Resources, Construction and Maintenance Occupations by Sex

| Occupation | Male | Female |
| Farming, Fishing & Forestry | 0 (0.0%) | 0 (0.0%) |
| Construction & Extraction | 305 (100.0%) | 0 (0.0%) |
| Installation, Maintenance & Repair | 212 (100.0%) | 0 (0.0%) |
| Total (Category) | 517 (100.0%) | 0 (0.0%) |
| Total (Overall) | 2,955 (51.7%) | 2,761 (48.3%) |
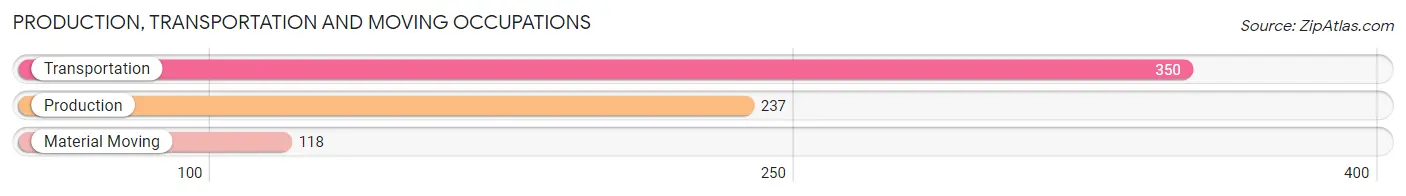
Production, Transportation and Moving Occupations
The most common Production, Transportation and Moving occupations in Francisville are Transportation (350 | 6.1%), Production (237 | 4.2%), and Material Moving (118 | 2.1%).
Production, Transportation and Moving Occupations by Sex
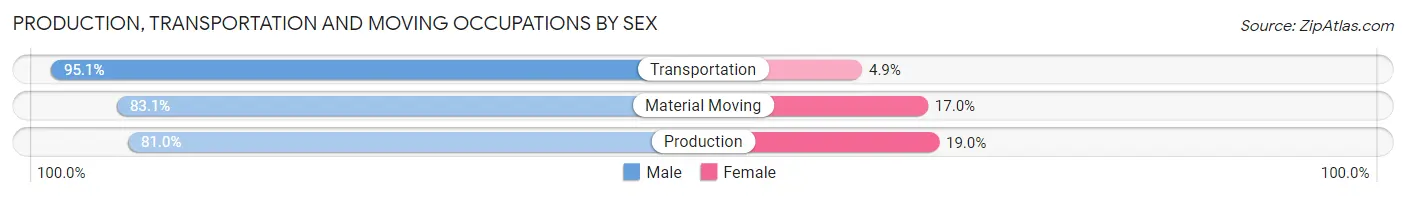
| Occupation | Male | Female |
| Production | 192 (81.0%) | 45 (19.0%) |
| Transportation | 333 (95.1%) | 17 (4.9%) |
| Material Moving | 98 (83.1%) | 20 (17.0%) |
| Total (Category) | 623 (88.4%) | 82 (11.6%) |
| Total (Overall) | 2,955 (51.7%) | 2,761 (48.3%) |
Employment Industries by Sex in Francisville
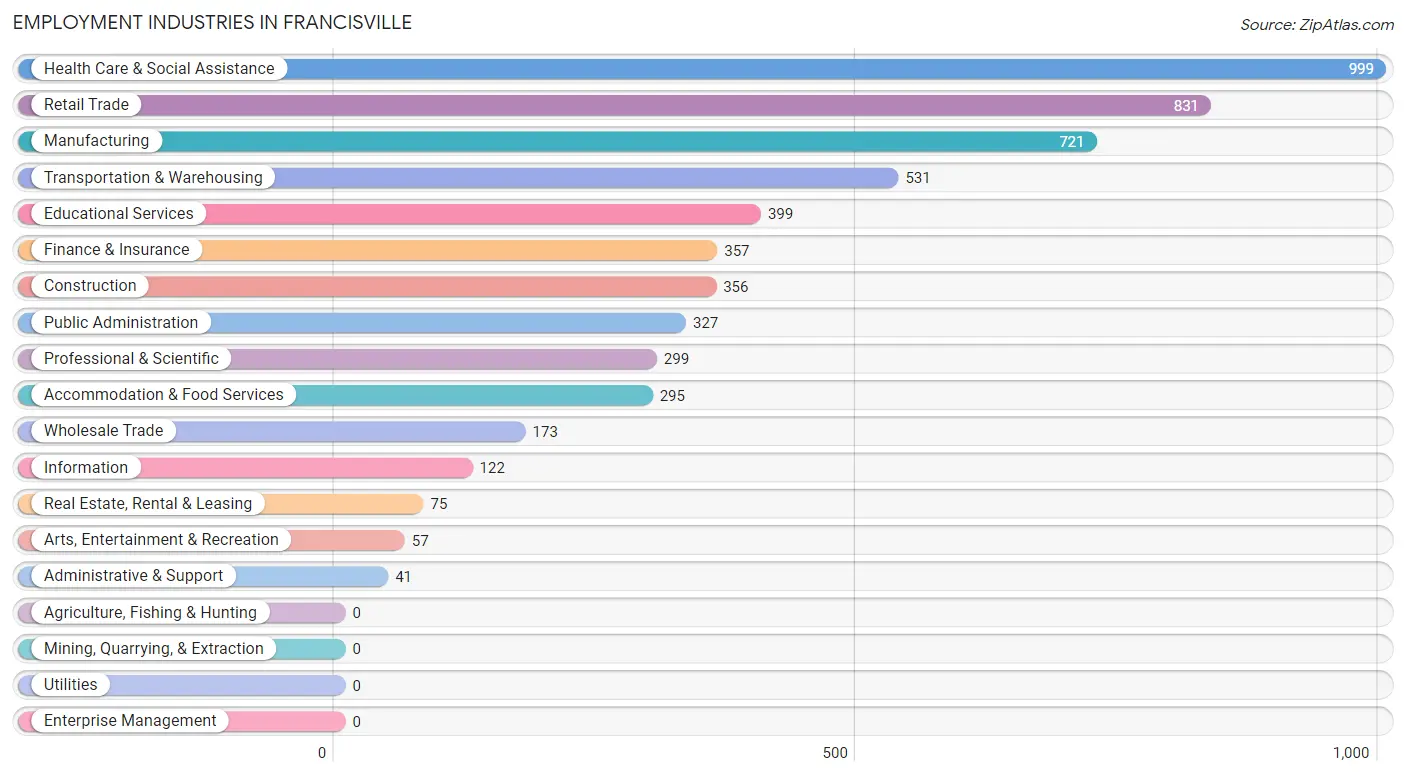
Employment Industries in Francisville
The major employment industries in Francisville include Health Care & Social Assistance (999 | 17.5%), Retail Trade (831 | 14.5%), Manufacturing (721 | 12.6%), Transportation & Warehousing (531 | 9.3%), and Educational Services (399 | 7.0%).
Employment Industries by Sex in Francisville
The Francisville industries that see more men than women are Construction (100.0%), Transportation & Warehousing (82.7%), and Professional & Scientific (75.6%), whereas the industries that tend to have a higher number of women are Health Care & Social Assistance (88.3%), Educational Services (75.9%), and Administrative & Support (75.6%).
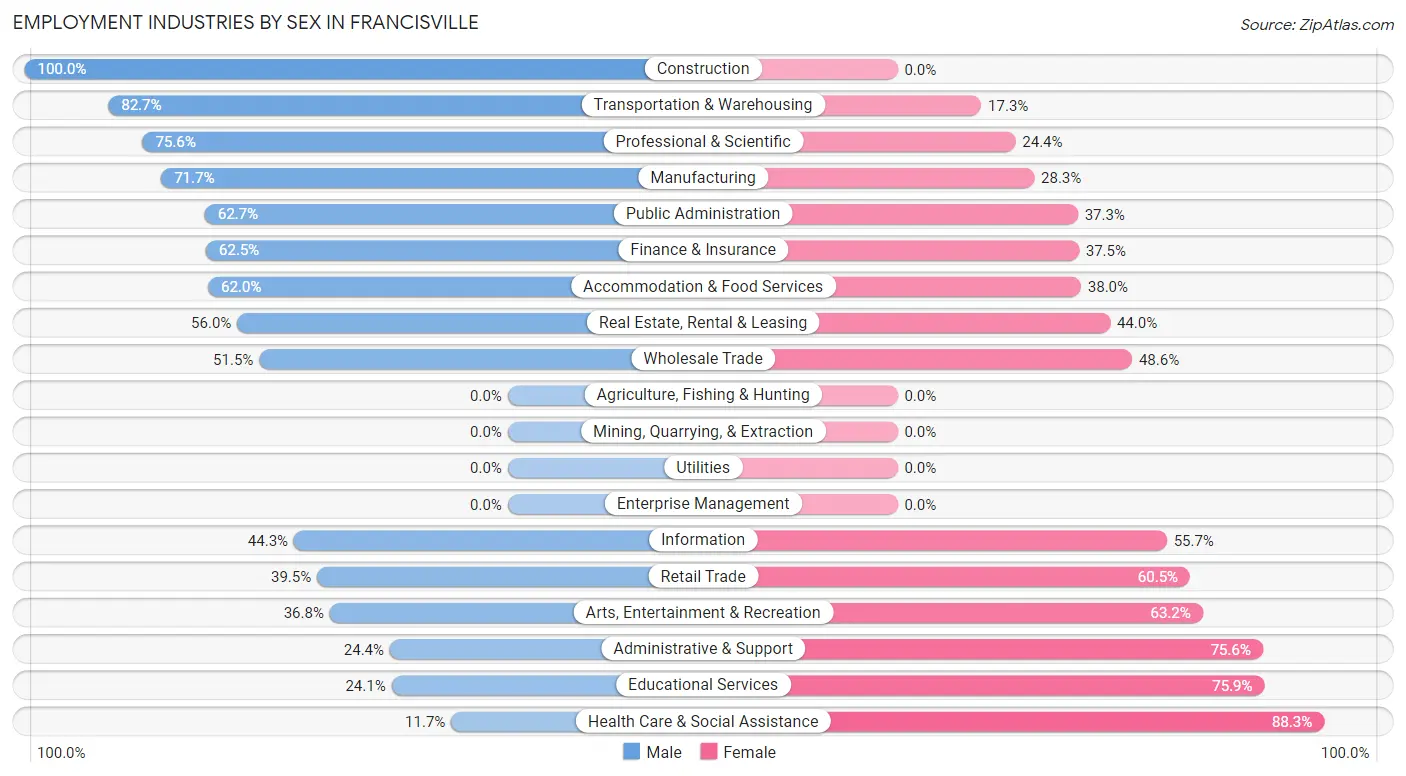
| Industry | Male | Female |
| Agriculture, Fishing & Hunting | 0 (0.0%) | 0 (0.0%) |
| Mining, Quarrying, & Extraction | 0 (0.0%) | 0 (0.0%) |
| Construction | 356 (100.0%) | 0 (0.0%) |
| Manufacturing | 517 (71.7%) | 204 (28.3%) |
| Wholesale Trade | 89 (51.4%) | 84 (48.5%) |
| Retail Trade | 328 (39.5%) | 503 (60.5%) |
| Transportation & Warehousing | 439 (82.7%) | 92 (17.3%) |
| Utilities | 0 (0.0%) | 0 (0.0%) |
| Information | 54 (44.3%) | 68 (55.7%) |
| Finance & Insurance | 223 (62.5%) | 134 (37.5%) |
| Real Estate, Rental & Leasing | 42 (56.0%) | 33 (44.0%) |
| Professional & Scientific | 226 (75.6%) | 73 (24.4%) |
| Enterprise Management | 0 (0.0%) | 0 (0.0%) |
| Administrative & Support | 10 (24.4%) | 31 (75.6%) |
| Educational Services | 96 (24.1%) | 303 (75.9%) |
| Health Care & Social Assistance | 117 (11.7%) | 882 (88.3%) |
| Arts, Entertainment & Recreation | 21 (36.8%) | 36 (63.2%) |
| Accommodation & Food Services | 183 (62.0%) | 112 (38.0%) |
| Public Administration | 205 (62.7%) | 122 (37.3%) |
| Total | 2,955 (51.7%) | 2,761 (48.3%) |
Education in Francisville
School Enrollment in Francisville
The most common levels of schooling among the 2,803 students in Francisville are middle school (730 | 26.0%), elementary school (705 | 25.2%), and high school (573 | 20.4%).
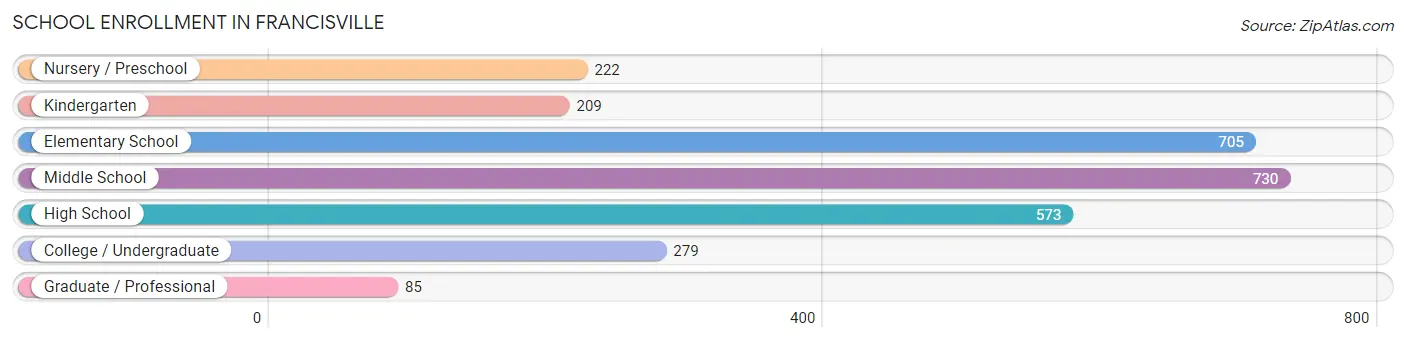
| School Level | # Students | % Students |
| Nursery / Preschool | 222 | 7.9% |
| Kindergarten | 209 | 7.5% |
| Elementary School | 705 | 25.2% |
| Middle School | 730 | 26.0% |
| High School | 573 | 20.4% |
| College / Undergraduate | 279 | 10.0% |
| Graduate / Professional | 85 | 3.0% |
| Total | 2,803 | 100.0% |
School Enrollment by Age by Funding Source in Francisville
Out of a total of 2,803 students who are enrolled in schools in Francisville, 426 (15.2%) attend a private institution, while the remaining 2,377 (84.8%) are enrolled in public schools. The age group of 3 to 4 year olds has the highest likelihood of being enrolled in private schools, with 80 (67.2% in the age bracket) enrolled. Conversely, the age group of 18 to 19 year olds has the lowest likelihood of being enrolled in a private school, with 92 (100.0% in the age bracket) attending a public institution.
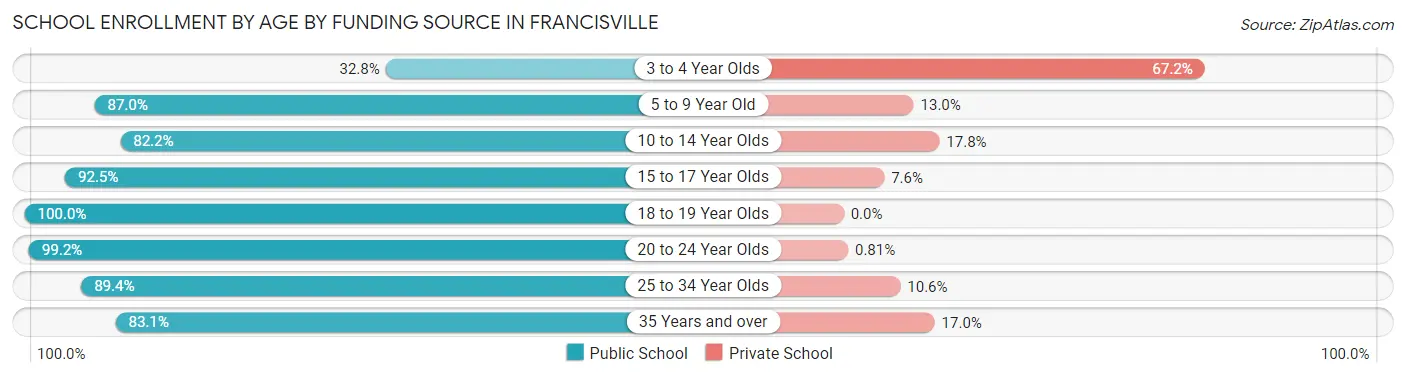
| Age Bracket | Public School | Private School |
| 3 to 4 Year Olds | 39 (32.8%) | 80 (67.2%) |
| 5 to 9 Year Old | 801 (87.0%) | 120 (13.0%) |
| 10 to 14 Year Olds | 742 (82.2%) | 161 (17.8%) |
| 15 to 17 Year Olds | 355 (92.4%) | 29 (7.5%) |
| 18 to 19 Year Olds | 92 (100.0%) | 0 (0.0%) |
| 20 to 24 Year Olds | 123 (99.2%) | 1 (0.8%) |
| 25 to 34 Year Olds | 127 (89.4%) | 15 (10.6%) |
| 35 Years and over | 98 (83.1%) | 20 (17.0%) |
| Total | 2,377 (84.8%) | 426 (15.2%) |
Educational Attainment by Field of Study in Francisville
Business (854 | 24.3%), education (533 | 15.2%), science & technology (443 | 12.6%), engineering (290 | 8.3%), and social sciences (262 | 7.5%) are the most common fields of study among 3,507 individuals in Francisville who have obtained a bachelor's degree or higher.
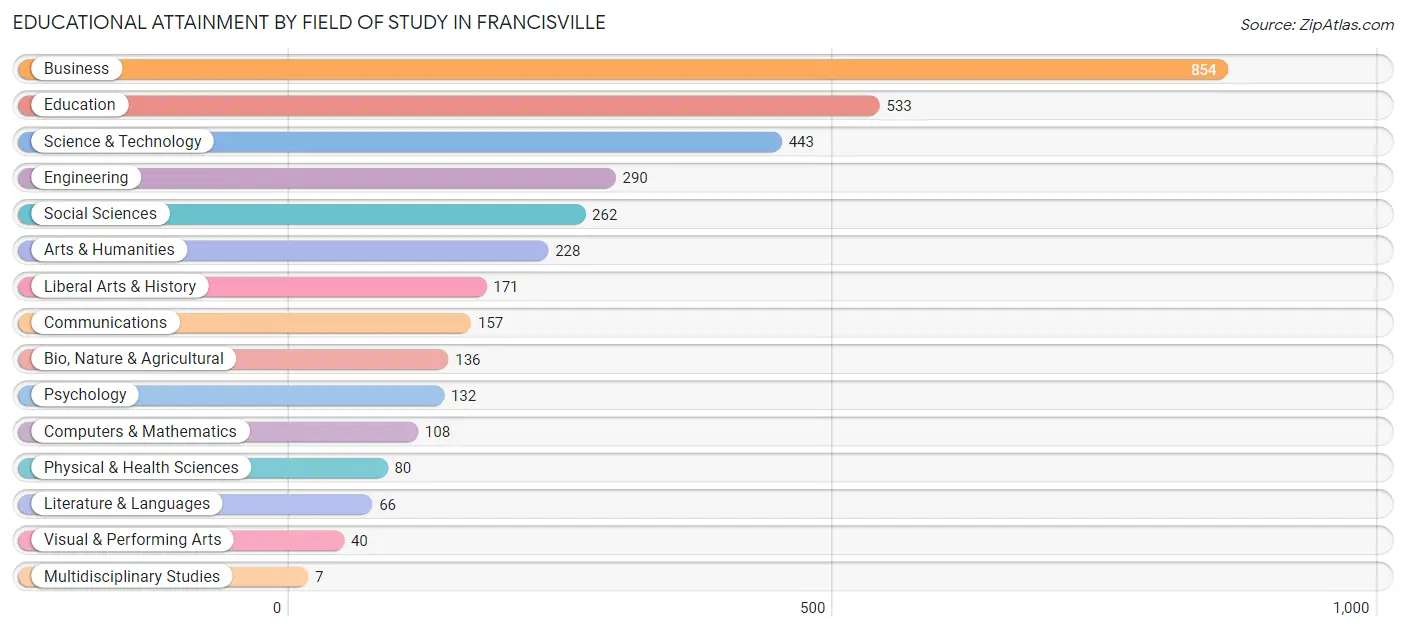
| Field of Study | # Graduates | % Graduates |
| Computers & Mathematics | 108 | 3.1% |
| Bio, Nature & Agricultural | 136 | 3.9% |
| Physical & Health Sciences | 80 | 2.3% |
| Psychology | 132 | 3.8% |
| Social Sciences | 262 | 7.5% |
| Engineering | 290 | 8.3% |
| Multidisciplinary Studies | 7 | 0.2% |
| Science & Technology | 443 | 12.6% |
| Business | 854 | 24.3% |
| Education | 533 | 15.2% |
| Literature & Languages | 66 | 1.9% |
| Liberal Arts & History | 171 | 4.9% |
| Visual & Performing Arts | 40 | 1.1% |
| Communications | 157 | 4.5% |
| Arts & Humanities | 228 | 6.5% |
| Total | 3,507 | 100.0% |
Transportation & Commute in Francisville
Vehicle Availability by Sex in Francisville
The most prevalent vehicle ownership categories in Francisville are males with 2 vehicles (1,538, accounting for 52.5%) and females with 2 vehicles (1,059, making up 55.7%).
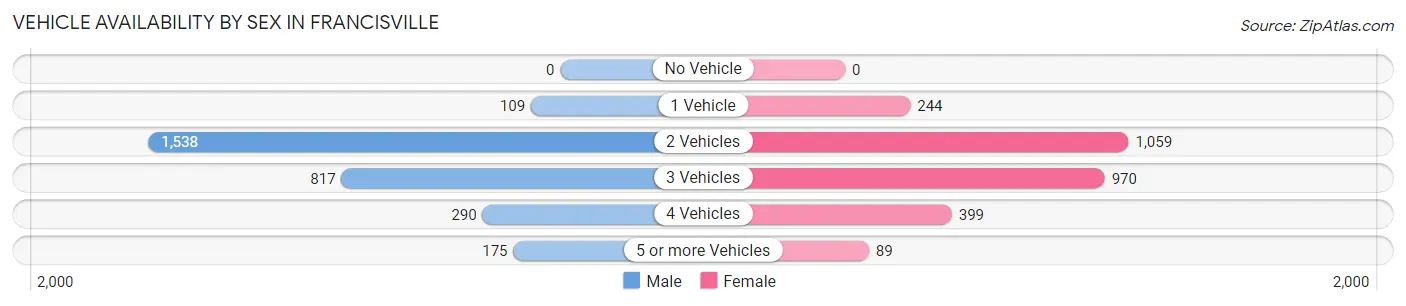
| Vehicles Available | Male | Female |
| No Vehicle | 0 (0.0%) | 0 (0.0%) |
| 1 Vehicle | 109 (3.7%) | 244 (8.8%) |
| 2 Vehicles | 1,538 (52.5%) | 1,059 (38.4%) |
| 3 Vehicles | 817 (27.9%) | 970 (35.1%) |
| 4 Vehicles | 290 (9.9%) | 399 (14.4%) |
| 5 or more Vehicles | 175 (6.0%) | 89 (3.2%) |
| Total | 2,929 (100.0%) | 2,761 (100.0%) |
Commute Time in Francisville
The most frequently occuring commute durations in Francisville are 20 to 24 minutes (954 commuters, 19.2%), 30 to 34 minutes (726 commuters, 14.6%), and 15 to 19 minutes (643 commuters, 12.9%).
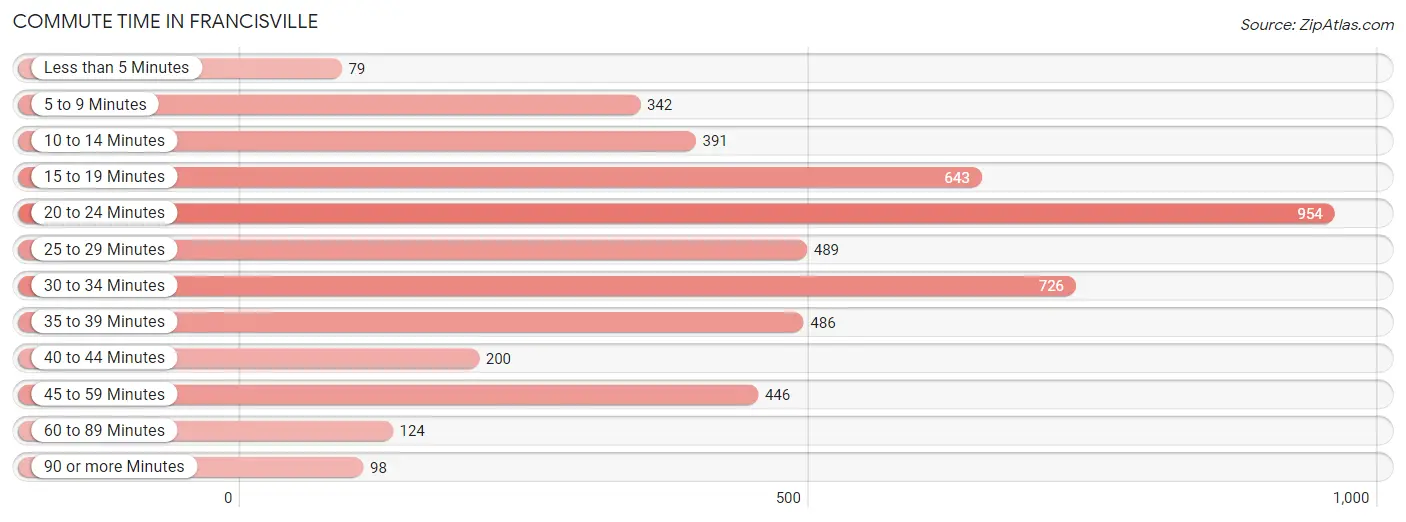
| Commute Time | # Commuters | % Commuters |
| Less than 5 Minutes | 79 | 1.6% |
| 5 to 9 Minutes | 342 | 6.9% |
| 10 to 14 Minutes | 391 | 7.9% |
| 15 to 19 Minutes | 643 | 12.9% |
| 20 to 24 Minutes | 954 | 19.2% |
| 25 to 29 Minutes | 489 | 9.8% |
| 30 to 34 Minutes | 726 | 14.6% |
| 35 to 39 Minutes | 486 | 9.8% |
| 40 to 44 Minutes | 200 | 4.0% |
| 45 to 59 Minutes | 446 | 9.0% |
| 60 to 89 Minutes | 124 | 2.5% |
| 90 or more Minutes | 98 | 2.0% |
Commute Time by Sex in Francisville
The most common commute times in Francisville are 15 to 19 minutes (495 commuters, 19.7%) for males and 20 to 24 minutes (569 commuters, 23.1%) for females.
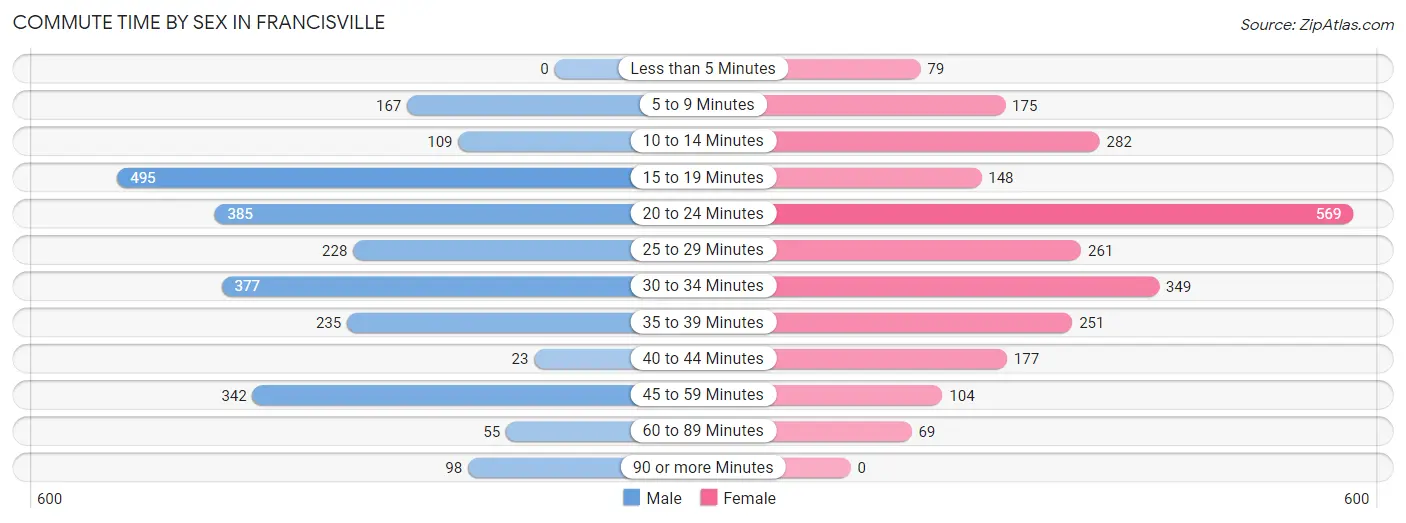
| Commute Time | Male | Female |
| Less than 5 Minutes | 0 (0.0%) | 79 (3.2%) |
| 5 to 9 Minutes | 167 (6.6%) | 175 (7.1%) |
| 10 to 14 Minutes | 109 (4.3%) | 282 (11.4%) |
| 15 to 19 Minutes | 495 (19.7%) | 148 (6.0%) |
| 20 to 24 Minutes | 385 (15.3%) | 569 (23.1%) |
| 25 to 29 Minutes | 228 (9.1%) | 261 (10.6%) |
| 30 to 34 Minutes | 377 (15.0%) | 349 (14.2%) |
| 35 to 39 Minutes | 235 (9.3%) | 251 (10.2%) |
| 40 to 44 Minutes | 23 (0.9%) | 177 (7.2%) |
| 45 to 59 Minutes | 342 (13.6%) | 104 (4.2%) |
| 60 to 89 Minutes | 55 (2.2%) | 69 (2.8%) |
| 90 or more Minutes | 98 (3.9%) | 0 (0.0%) |
Time of Departure to Work by Sex in Francisville
The most frequent times of departure to work in Francisville are 8:00 AM to 8:29 AM (445, 17.7%) for males and 7:00 AM to 7:29 AM (523, 21.2%) for females.
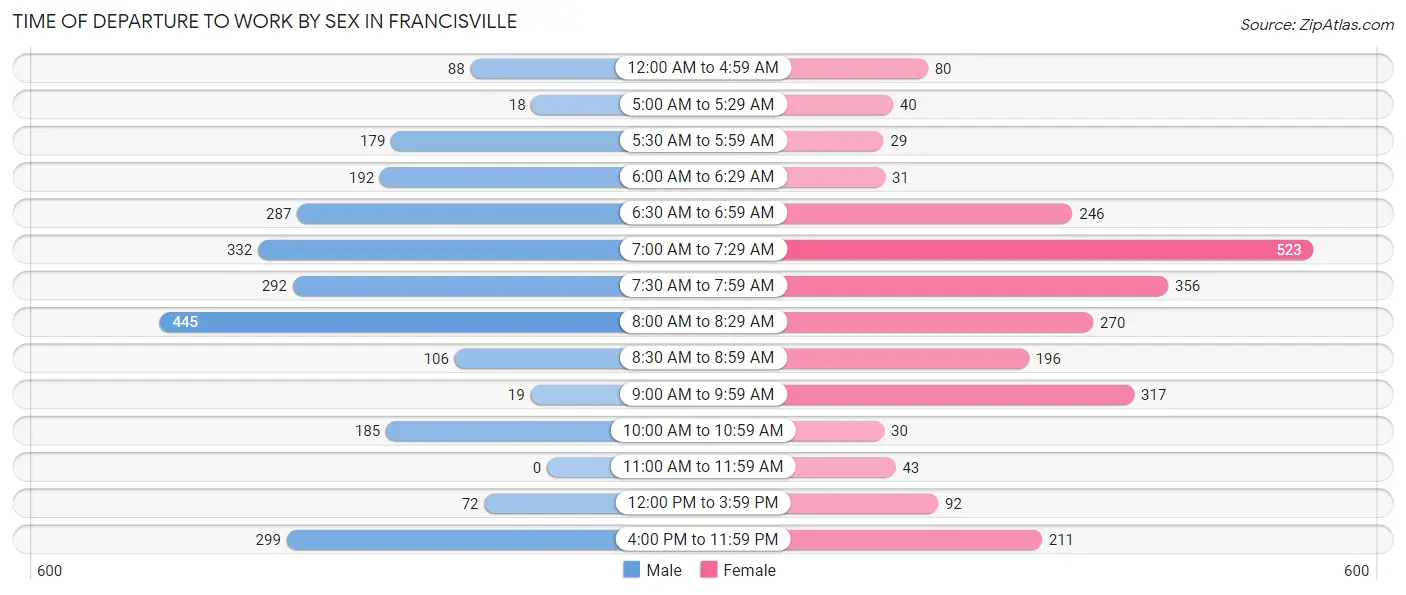
| Time of Departure | Male | Female |
| 12:00 AM to 4:59 AM | 88 (3.5%) | 80 (3.3%) |
| 5:00 AM to 5:29 AM | 18 (0.7%) | 40 (1.6%) |
| 5:30 AM to 5:59 AM | 179 (7.1%) | 29 (1.2%) |
| 6:00 AM to 6:29 AM | 192 (7.6%) | 31 (1.3%) |
| 6:30 AM to 6:59 AM | 287 (11.4%) | 246 (10.0%) |
| 7:00 AM to 7:29 AM | 332 (13.2%) | 523 (21.2%) |
| 7:30 AM to 7:59 AM | 292 (11.6%) | 356 (14.4%) |
| 8:00 AM to 8:29 AM | 445 (17.7%) | 270 (11.0%) |
| 8:30 AM to 8:59 AM | 106 (4.2%) | 196 (8.0%) |
| 9:00 AM to 9:59 AM | 19 (0.8%) | 317 (12.9%) |
| 10:00 AM to 10:59 AM | 185 (7.4%) | 30 (1.2%) |
| 11:00 AM to 11:59 AM | 0 (0.0%) | 43 (1.8%) |
| 12:00 PM to 3:59 PM | 72 (2.9%) | 92 (3.7%) |
| 4:00 PM to 11:59 PM | 299 (11.9%) | 211 (8.6%) |
| Total | 2,514 (100.0%) | 2,464 (100.0%) |
Housing Occupancy in Francisville
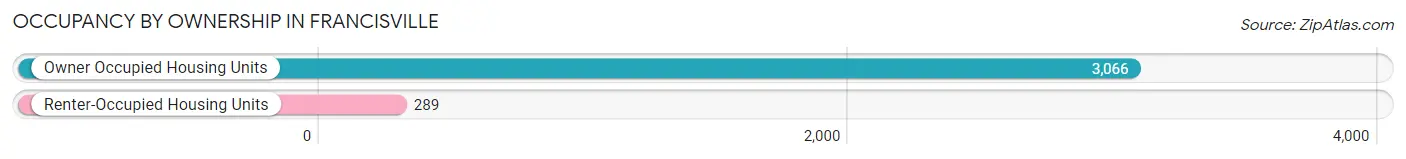
Occupancy by Ownership in Francisville
Of the total 3,355 dwellings in Francisville, owner-occupied units account for 3,066 (91.4%), while renter-occupied units make up 289 (8.6%).
| Occupancy | # Housing Units | % Housing Units |
| Owner Occupied Housing Units | 3,066 | 91.4% |
| Renter-Occupied Housing Units | 289 | 8.6% |
| Total Occupied Housing Units | 3,355 | 100.0% |
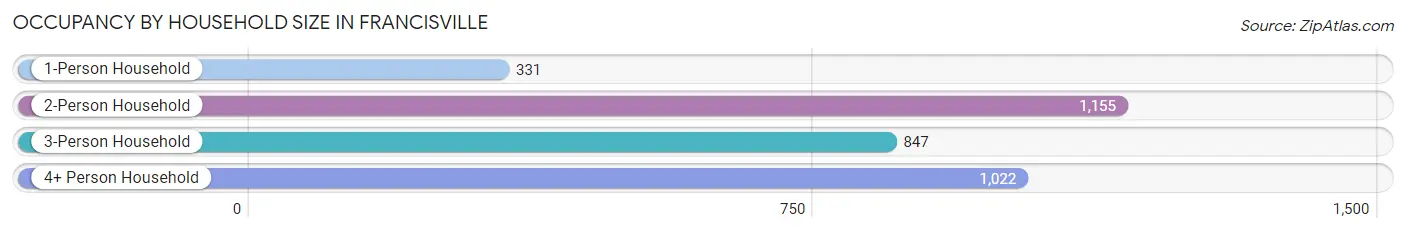
Occupancy by Household Size in Francisville
| Household Size | # Housing Units | % Housing Units |
| 1-Person Household | 331 | 9.9% |
| 2-Person Household | 1,155 | 34.4% |
| 3-Person Household | 847 | 25.3% |
| 4+ Person Household | 1,022 | 30.5% |
| Total Housing Units | 3,355 | 100.0% |
Occupancy by Ownership by Household Size in Francisville
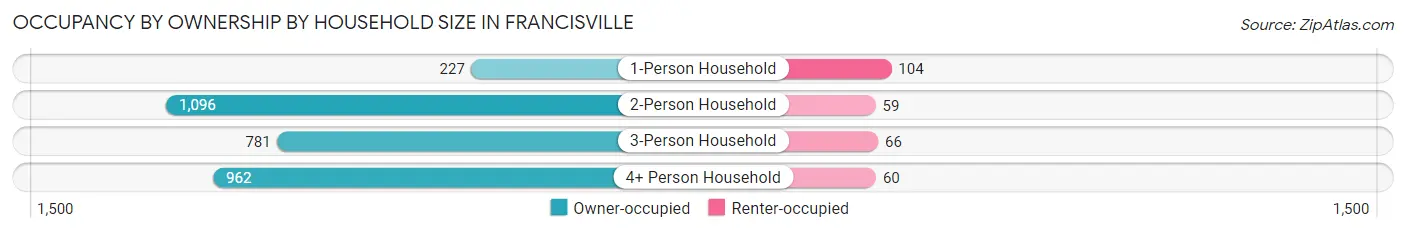
| Household Size | Owner-occupied | Renter-occupied |
| 1-Person Household | 227 (68.6%) | 104 (31.4%) |
| 2-Person Household | 1,096 (94.9%) | 59 (5.1%) |
| 3-Person Household | 781 (92.2%) | 66 (7.8%) |
| 4+ Person Household | 962 (94.1%) | 60 (5.9%) |
| Total Housing Units | 3,066 (91.4%) | 289 (8.6%) |
Occupancy by Educational Attainment in Francisville
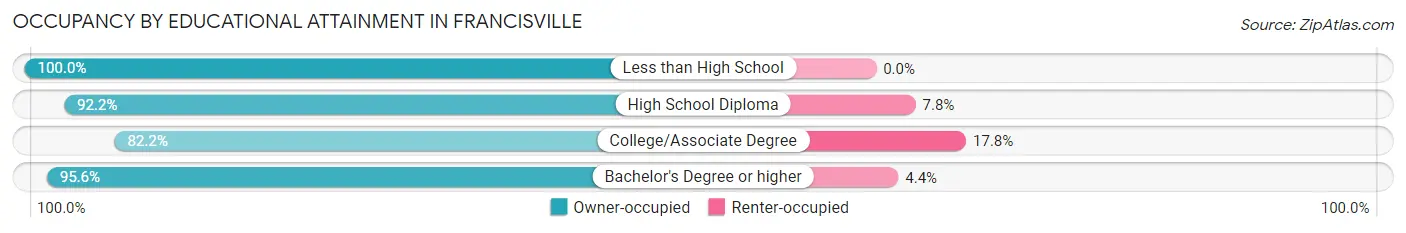
| Household Size | Owner-occupied | Renter-occupied |
| Less than High School | 12 (100.0%) | 0 (0.0%) |
| High School Diploma | 554 (92.2%) | 47 (7.8%) |
| College/Associate Degree | 742 (82.2%) | 161 (17.8%) |
| Bachelor's Degree or higher | 1,758 (95.6%) | 81 (4.4%) |
Occupancy by Age of Householder in Francisville
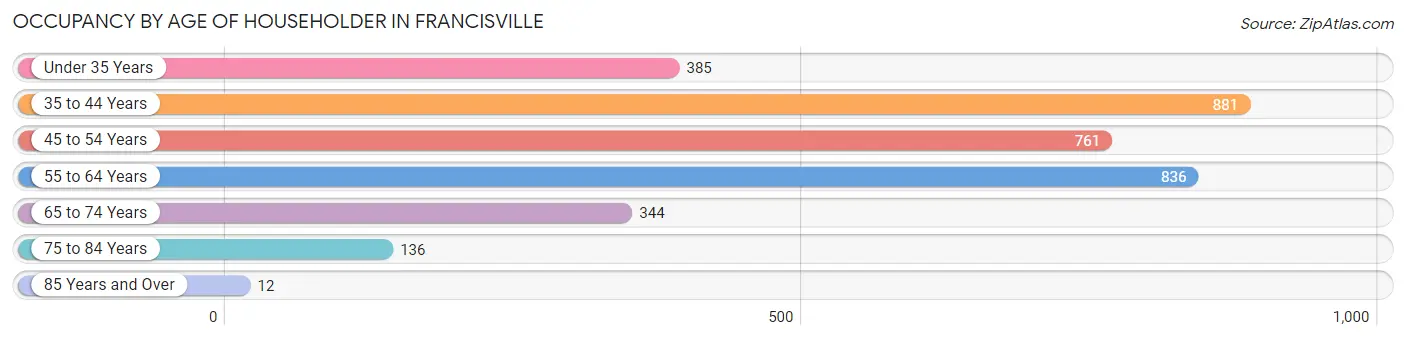
| Age Bracket | # Households | % Households |
| Under 35 Years | 385 | 11.5% |
| 35 to 44 Years | 881 | 26.3% |
| 45 to 54 Years | 761 | 22.7% |
| 55 to 64 Years | 836 | 24.9% |
| 65 to 74 Years | 344 | 10.2% |
| 75 to 84 Years | 136 | 4.1% |
| 85 Years and Over | 12 | 0.4% |
| Total | 3,355 | 100.0% |
Housing Finances in Francisville
Median Income by Occupancy in Francisville
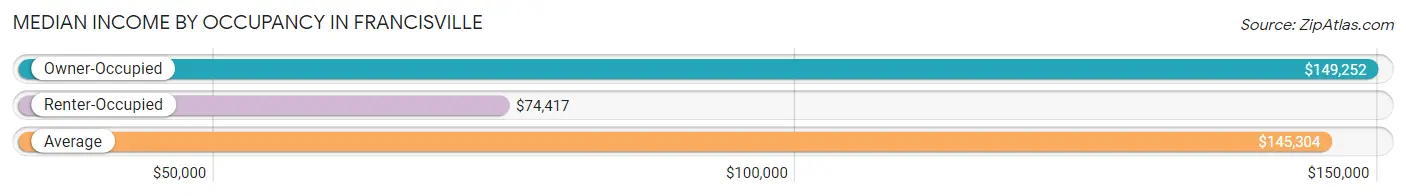
| Occupancy Type | # Households | Median Income |
| Owner-Occupied | 3,066 (91.4%) | $149,252 |
| Renter-Occupied | 289 (8.6%) | $74,417 |
| Average | 3,355 (100.0%) | $145,304 |
Occupancy by Householder Income Bracket in Francisville
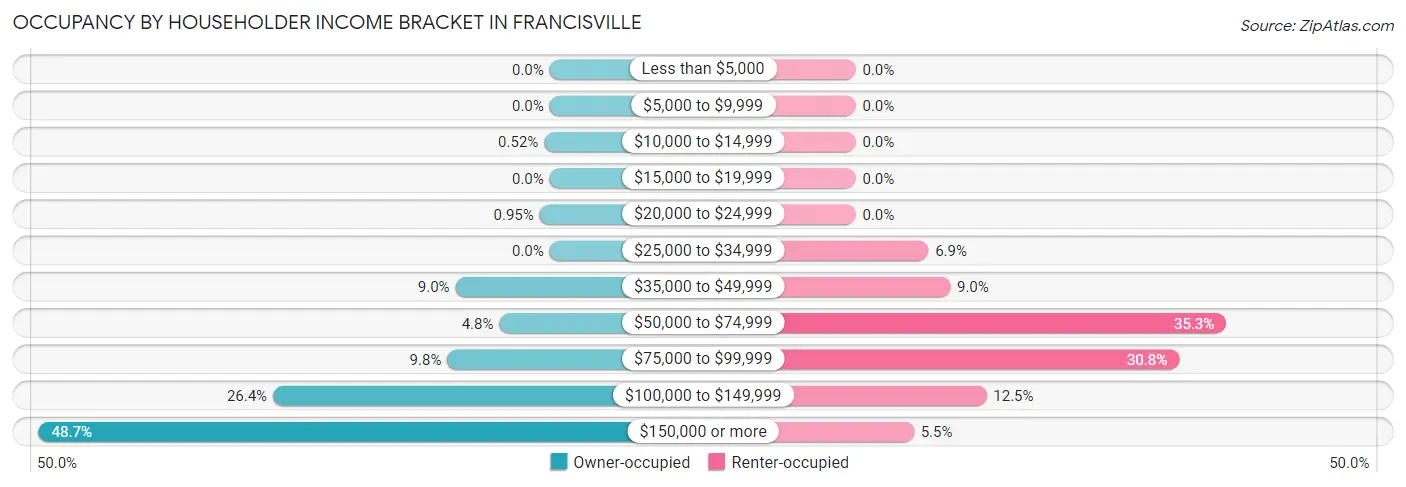
| Income Bracket | Owner-occupied | Renter-occupied |
| Less than $5,000 | 0 (0.0%) | 0 (0.0%) |
| $5,000 to $9,999 | 0 (0.0%) | 0 (0.0%) |
| $10,000 to $14,999 | 16 (0.5%) | 0 (0.0%) |
| $15,000 to $19,999 | 0 (0.0%) | 0 (0.0%) |
| $20,000 to $24,999 | 29 (0.9%) | 0 (0.0%) |
| $25,000 to $34,999 | 0 (0.0%) | 20 (6.9%) |
| $35,000 to $49,999 | 275 (9.0%) | 26 (9.0%) |
| $50,000 to $74,999 | 147 (4.8%) | 102 (35.3%) |
| $75,000 to $99,999 | 299 (9.8%) | 89 (30.8%) |
| $100,000 to $149,999 | 808 (26.4%) | 36 (12.5%) |
| $150,000 or more | 1,492 (48.7%) | 16 (5.5%) |
| Total | 3,066 (100.0%) | 289 (100.0%) |
Monthly Housing Cost Tiers in Francisville
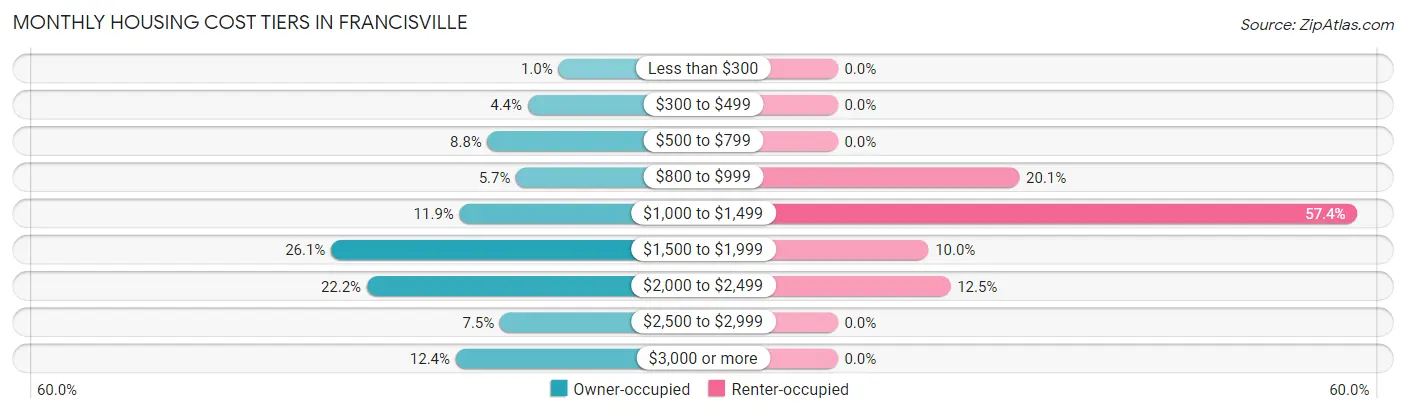
| Monthly Cost | Owner-occupied | Renter-occupied |
| Less than $300 | 31 (1.0%) | 0 (0.0%) |
| $300 to $499 | 135 (4.4%) | 0 (0.0%) |
| $500 to $799 | 271 (8.8%) | 0 (0.0%) |
| $800 to $999 | 174 (5.7%) | 58 (20.1%) |
| $1,000 to $1,499 | 366 (11.9%) | 166 (57.4%) |
| $1,500 to $1,999 | 801 (26.1%) | 29 (10.0%) |
| $2,000 to $2,499 | 680 (22.2%) | 36 (12.5%) |
| $2,500 to $2,999 | 229 (7.5%) | 0 (0.0%) |
| $3,000 or more | 379 (12.4%) | 0 (0.0%) |
| Total | 3,066 (100.0%) | 289 (100.0%) |
Physical Housing Characteristics in Francisville
Housing Structures in Francisville
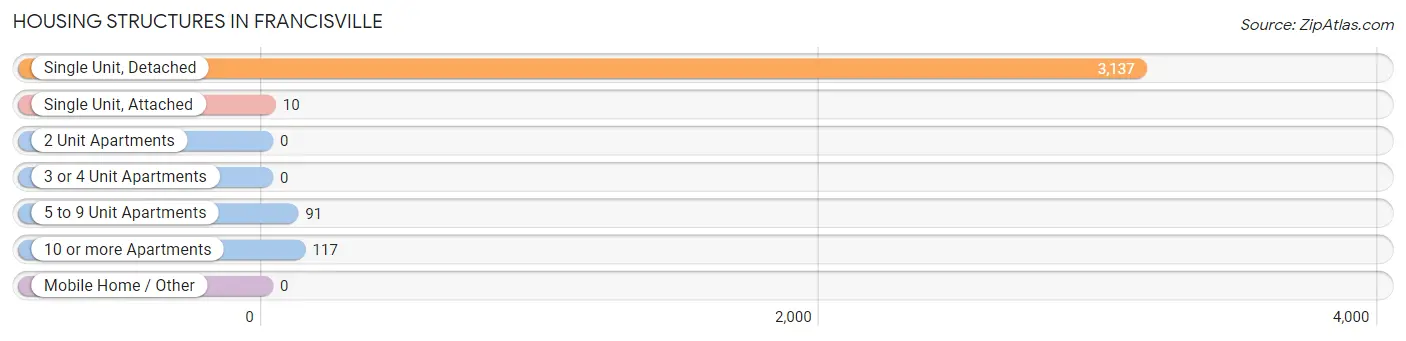
| Structure Type | # Housing Units | % Housing Units |
| Single Unit, Detached | 3,137 | 93.5% |
| Single Unit, Attached | 10 | 0.3% |
| 2 Unit Apartments | 0 | 0.0% |
| 3 or 4 Unit Apartments | 0 | 0.0% |
| 5 to 9 Unit Apartments | 91 | 2.7% |
| 10 or more Apartments | 117 | 3.5% |
| Mobile Home / Other | 0 | 0.0% |
| Total | 3,355 | 100.0% |
Housing Structures by Occupancy in Francisville
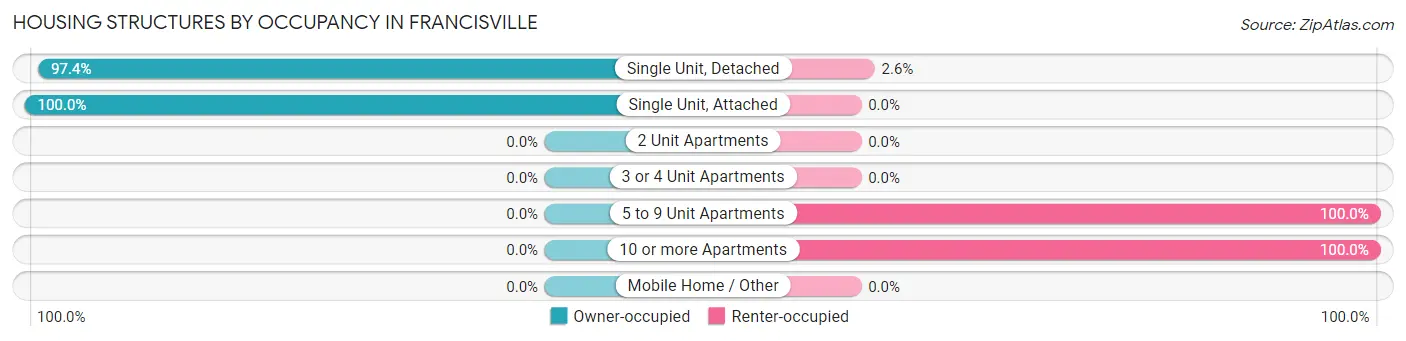
| Structure Type | Owner-occupied | Renter-occupied |
| Single Unit, Detached | 3,056 (97.4%) | 81 (2.6%) |
| Single Unit, Attached | 10 (100.0%) | 0 (0.0%) |
| 2 Unit Apartments | 0 (0.0%) | 0 (0.0%) |
| 3 or 4 Unit Apartments | 0 (0.0%) | 0 (0.0%) |
| 5 to 9 Unit Apartments | 0 (0.0%) | 91 (100.0%) |
| 10 or more Apartments | 0 (0.0%) | 117 (100.0%) |
| Mobile Home / Other | 0 (0.0%) | 0 (0.0%) |
| Total | 3,066 (91.4%) | 289 (8.6%) |
Housing Structures by Number of Rooms in Francisville
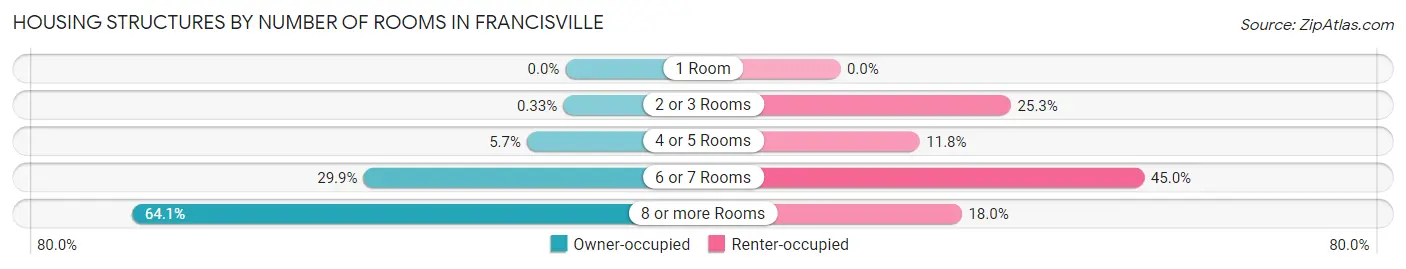
| Number of Rooms | Owner-occupied | Renter-occupied |
| 1 Room | 0 (0.0%) | 0 (0.0%) |
| 2 or 3 Rooms | 10 (0.3%) | 73 (25.3%) |
| 4 or 5 Rooms | 174 (5.7%) | 34 (11.8%) |
| 6 or 7 Rooms | 916 (29.9%) | 130 (45.0%) |
| 8 or more Rooms | 1,966 (64.1%) | 52 (18.0%) |
| Total | 3,066 (100.0%) | 289 (100.0%) |
Housing Structure by Heating Type in Francisville
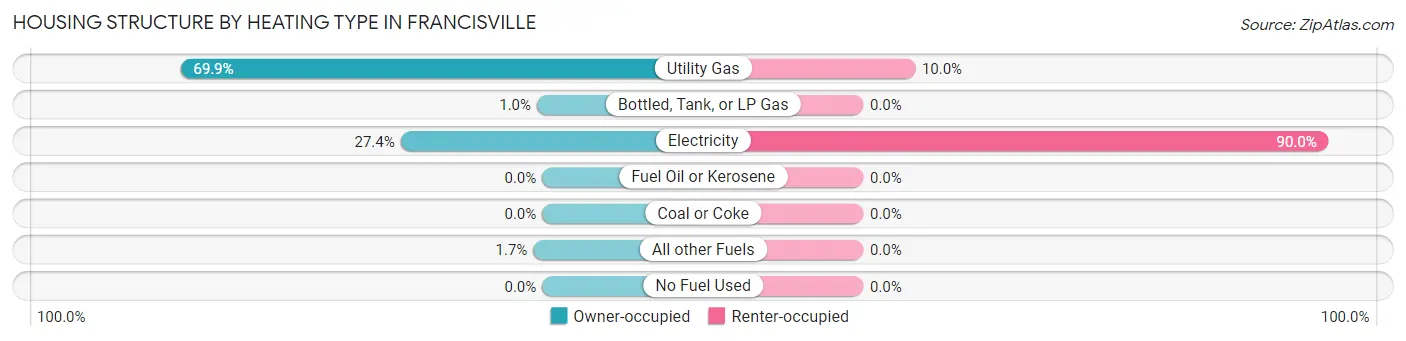
| Heating Type | Owner-occupied | Renter-occupied |
| Utility Gas | 2,143 (69.9%) | 29 (10.0%) |
| Bottled, Tank, or LP Gas | 31 (1.0%) | 0 (0.0%) |
| Electricity | 839 (27.4%) | 260 (90.0%) |
| Fuel Oil or Kerosene | 0 (0.0%) | 0 (0.0%) |
| Coal or Coke | 0 (0.0%) | 0 (0.0%) |
| All other Fuels | 53 (1.7%) | 0 (0.0%) |
| No Fuel Used | 0 (0.0%) | 0 (0.0%) |
| Total | 3,066 (100.0%) | 289 (100.0%) |
Household Vehicle Usage in Francisville
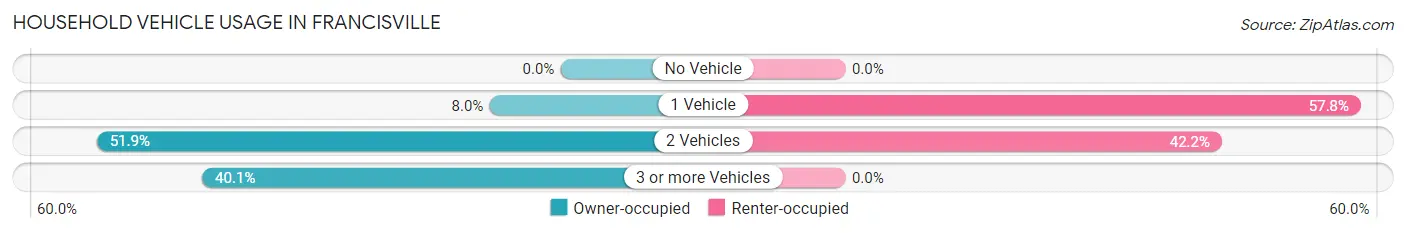
| Vehicles per Household | Owner-occupied | Renter-occupied |
| No Vehicle | 0 (0.0%) | 0 (0.0%) |
| 1 Vehicle | 244 (8.0%) | 167 (57.8%) |
| 2 Vehicles | 1,592 (51.9%) | 122 (42.2%) |
| 3 or more Vehicles | 1,230 (40.1%) | 0 (0.0%) |
| Total | 3,066 (100.0%) | 289 (100.0%) |
Real Estate & Mortgages in Francisville
Real Estate and Mortgage Overview in Francisville
| Characteristic | Without Mortgage | With Mortgage |
| Housing Units | 629 | 2,437 |
| Median Property Value | $366,800 | $359,500 |
| Median Household Income | $123,057 | $1,317 |
| Monthly Housing Costs | $745 | $379 |
| Real Estate Taxes | $3,327 | $62 |
Property Value by Mortgage Status in Francisville
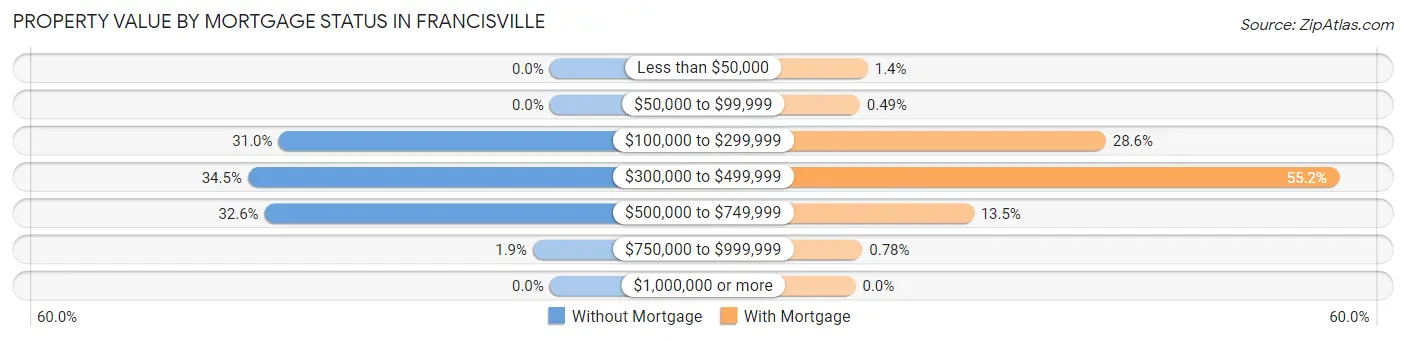
| Property Value | Without Mortgage | With Mortgage |
| Less than $50,000 | 0 (0.0%) | 34 (1.4%) |
| $50,000 to $99,999 | 0 (0.0%) | 12 (0.5%) |
| $100,000 to $299,999 | 195 (31.0%) | 697 (28.6%) |
| $300,000 to $499,999 | 217 (34.5%) | 1,346 (55.2%) |
| $500,000 to $749,999 | 205 (32.6%) | 329 (13.5%) |
| $750,000 to $999,999 | 12 (1.9%) | 19 (0.8%) |
| $1,000,000 or more | 0 (0.0%) | 0 (0.0%) |
| Total | 629 (100.0%) | 2,437 (100.0%) |
Household Income by Mortgage Status in Francisville
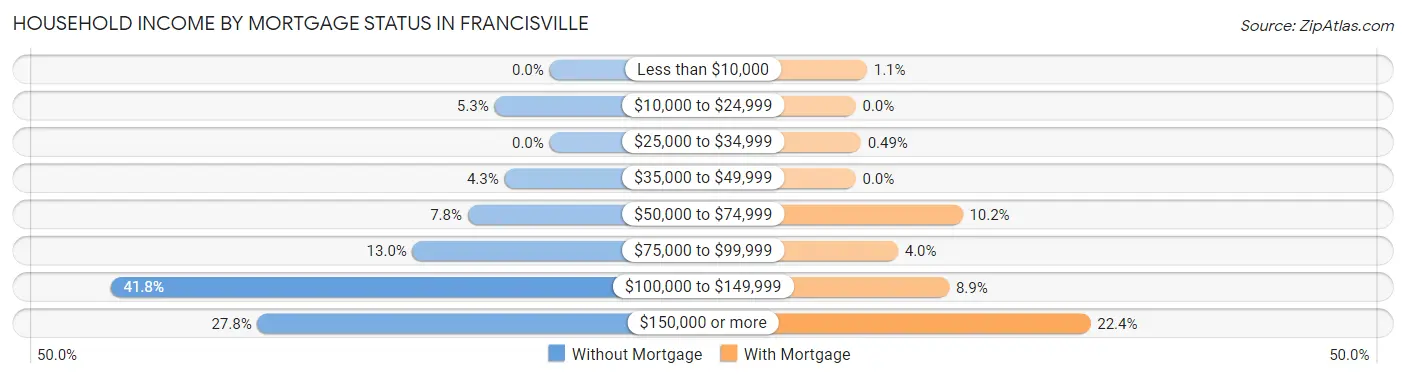
| Household Income | Without Mortgage | With Mortgage |
| Less than $10,000 | 0 (0.0%) | 26 (1.1%) |
| $10,000 to $24,999 | 33 (5.2%) | 0 (0.0%) |
| $25,000 to $34,999 | 0 (0.0%) | 12 (0.5%) |
| $35,000 to $49,999 | 27 (4.3%) | 0 (0.0%) |
| $50,000 to $74,999 | 49 (7.8%) | 248 (10.2%) |
| $75,000 to $99,999 | 82 (13.0%) | 98 (4.0%) |
| $100,000 to $149,999 | 263 (41.8%) | 217 (8.9%) |
| $150,000 or more | 175 (27.8%) | 545 (22.4%) |
| Total | 629 (100.0%) | 2,437 (100.0%) |
Property Value to Household Income Ratio in Francisville
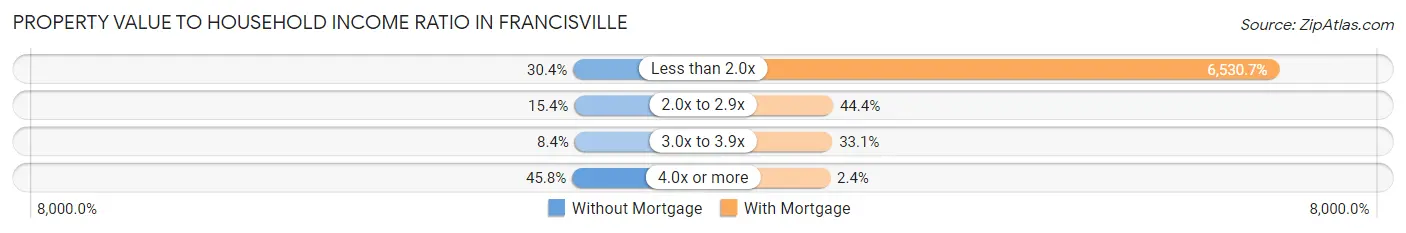
| Value-to-Income Ratio | Without Mortgage | With Mortgage |
| Less than 2.0x | 191 (30.4%) | 159,154 (6,530.7%) |
| 2.0x to 2.9x | 97 (15.4%) | 1,081 (44.4%) |
| 3.0x to 3.9x | 53 (8.4%) | 807 (33.1%) |
| 4.0x or more | 288 (45.8%) | 59 (2.4%) |
| Total | 629 (100.0%) | 2,437 (100.0%) |
Real Estate Taxes by Mortgage Status in Francisville
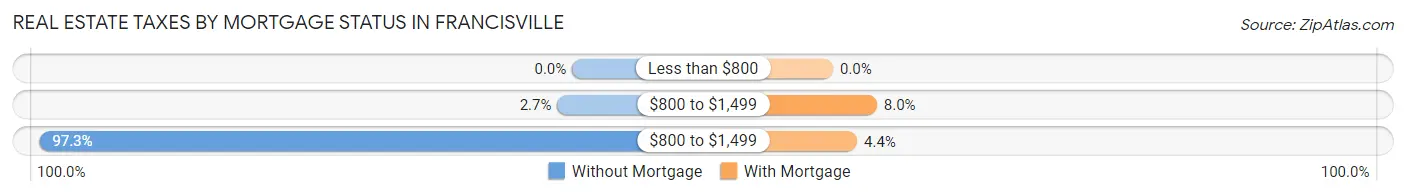
| Property Taxes | Without Mortgage | With Mortgage |
| Less than $800 | 0 (0.0%) | 0 (0.0%) |
| $800 to $1,499 | 17 (2.7%) | 195 (8.0%) |
| $800 to $1,499 | 612 (97.3%) | 107 (4.4%) |
| Total | 629 (100.0%) | 2,437 (100.0%) |
Health & Disability in Francisville
Health Insurance Coverage by Age in Francisville
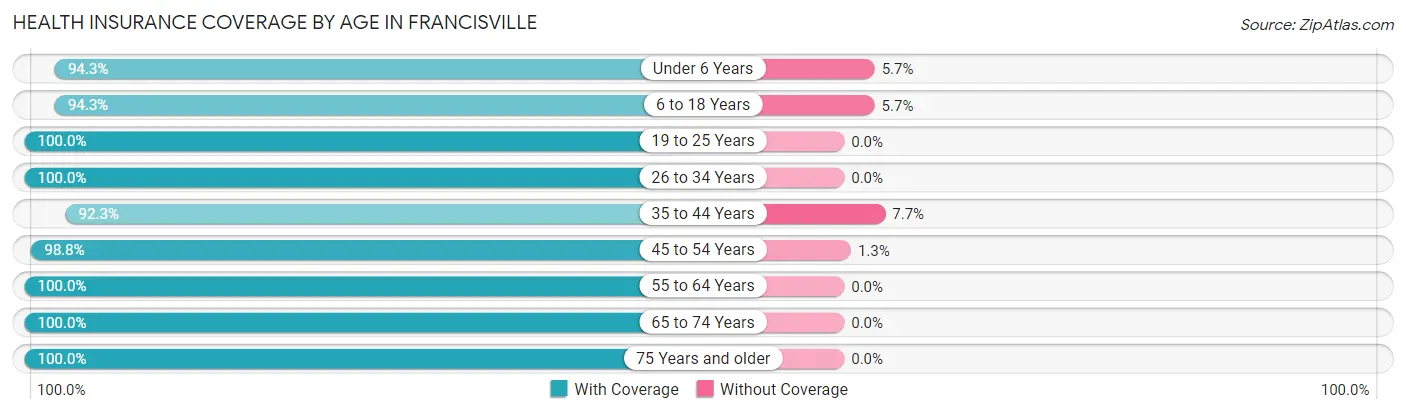
| Age Bracket | With Coverage | Without Coverage |
| Under 6 Years | 615 (94.3%) | 37 (5.7%) |
| 6 to 18 Years | 2,034 (94.3%) | 122 (5.7%) |
| 19 to 25 Years | 623 (100.0%) | 0 (0.0%) |
| 26 to 34 Years | 773 (100.0%) | 0 (0.0%) |
| 35 to 44 Years | 1,687 (92.3%) | 140 (7.7%) |
| 45 to 54 Years | 1,506 (98.8%) | 19 (1.3%) |
| 55 to 64 Years | 1,556 (100.0%) | 0 (0.0%) |
| 65 to 74 Years | 601 (100.0%) | 0 (0.0%) |
| 75 Years and older | 331 (100.0%) | 0 (0.0%) |
| Total | 9,726 (96.8%) | 318 (3.2%) |
Health Insurance Coverage by Citizenship Status in Francisville
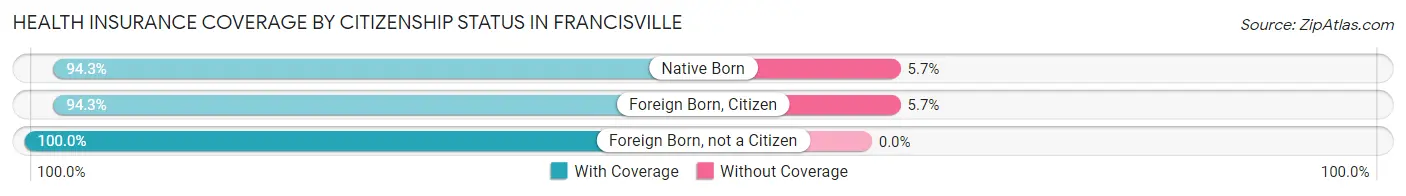
| Citizenship Status | With Coverage | Without Coverage |
| Native Born | 615 (94.3%) | 37 (5.7%) |
| Foreign Born, Citizen | 2,034 (94.3%) | 122 (5.7%) |
| Foreign Born, not a Citizen | 623 (100.0%) | 0 (0.0%) |
Health Insurance Coverage by Household Income in Francisville
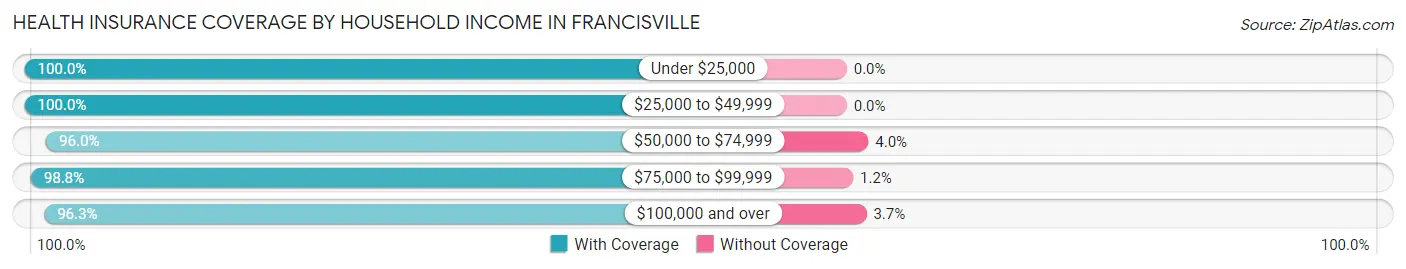
| Household Income | With Coverage | Without Coverage |
| Under $25,000 | 127 (100.0%) | 0 (0.0%) |
| $25,000 to $49,999 | 464 (100.0%) | 0 (0.0%) |
| $50,000 to $74,999 | 547 (96.0%) | 23 (4.0%) |
| $75,000 to $99,999 | 1,253 (98.8%) | 15 (1.2%) |
| $100,000 and over | 7,335 (96.3%) | 280 (3.7%) |
Public vs Private Health Insurance Coverage by Age in Francisville
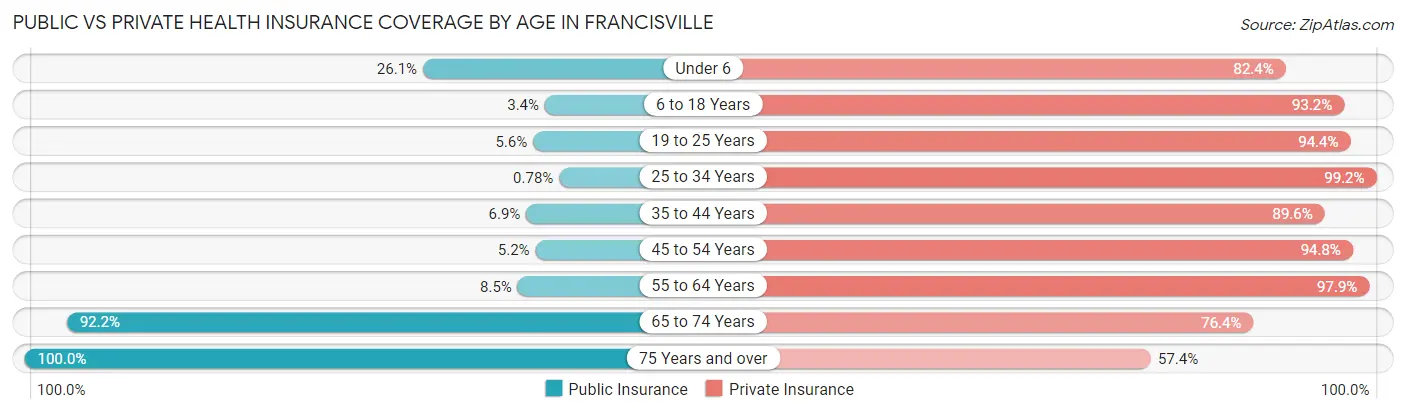
| Age Bracket | Public Insurance | Private Insurance |
| Under 6 | 170 (26.1%) | 537 (82.4%) |
| 6 to 18 Years | 74 (3.4%) | 2,010 (93.2%) |
| 19 to 25 Years | 35 (5.6%) | 588 (94.4%) |
| 25 to 34 Years | 6 (0.8%) | 767 (99.2%) |
| 35 to 44 Years | 126 (6.9%) | 1,637 (89.6%) |
| 45 to 54 Years | 79 (5.2%) | 1,446 (94.8%) |
| 55 to 64 Years | 132 (8.5%) | 1,523 (97.9%) |
| 65 to 74 Years | 554 (92.2%) | 459 (76.4%) |
| 75 Years and over | 331 (100.0%) | 190 (57.4%) |
| Total | 1,507 (15.0%) | 9,157 (91.2%) |
Disability Status by Sex by Age in Francisville
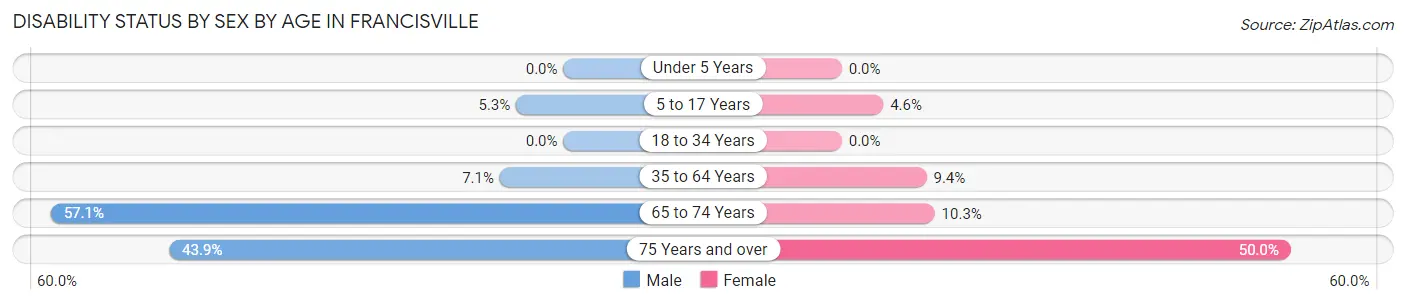
| Age Bracket | Male | Female |
| Under 5 Years | 0 (0.0%) | 0 (0.0%) |
| 5 to 17 Years | 57 (5.3%) | 56 (4.6%) |
| 18 to 34 Years | 0 (0.0%) | 0 (0.0%) |
| 35 to 64 Years | 169 (7.1%) | 238 (9.4%) |
| 65 to 74 Years | 161 (57.1%) | 33 (10.3%) |
| 75 Years and over | 90 (43.9%) | 63 (50.0%) |
Disability Class by Sex by Age in Francisville
Disability Class: Hearing Difficulty
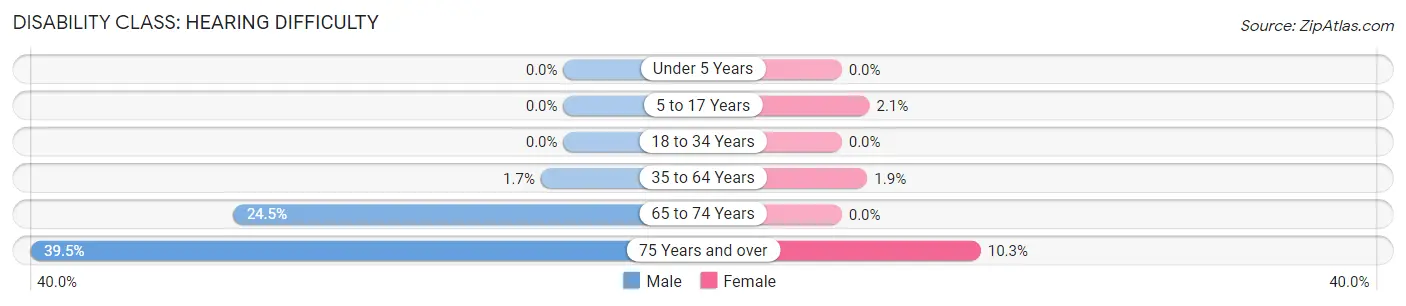
| Age Bracket | Male | Female |
| Under 5 Years | 0 (0.0%) | 0 (0.0%) |
| 5 to 17 Years | 0 (0.0%) | 25 (2.1%) |
| 18 to 34 Years | 0 (0.0%) | 0 (0.0%) |
| 35 to 64 Years | 40 (1.7%) | 48 (1.9%) |
| 65 to 74 Years | 69 (24.5%) | 0 (0.0%) |
| 75 Years and over | 81 (39.5%) | 13 (10.3%) |
Disability Class: Vision Difficulty
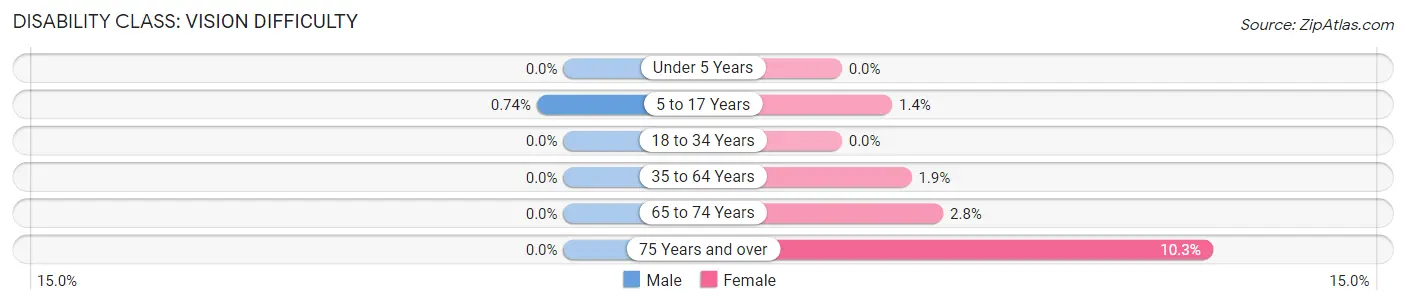
| Age Bracket | Male | Female |
| Under 5 Years | 0 (0.0%) | 0 (0.0%) |
| 5 to 17 Years | 8 (0.7%) | 17 (1.4%) |
| 18 to 34 Years | 0 (0.0%) | 0 (0.0%) |
| 35 to 64 Years | 0 (0.0%) | 49 (1.9%) |
| 65 to 74 Years | 0 (0.0%) | 9 (2.8%) |
| 75 Years and over | 0 (0.0%) | 13 (10.3%) |
Disability Class: Cognitive Difficulty
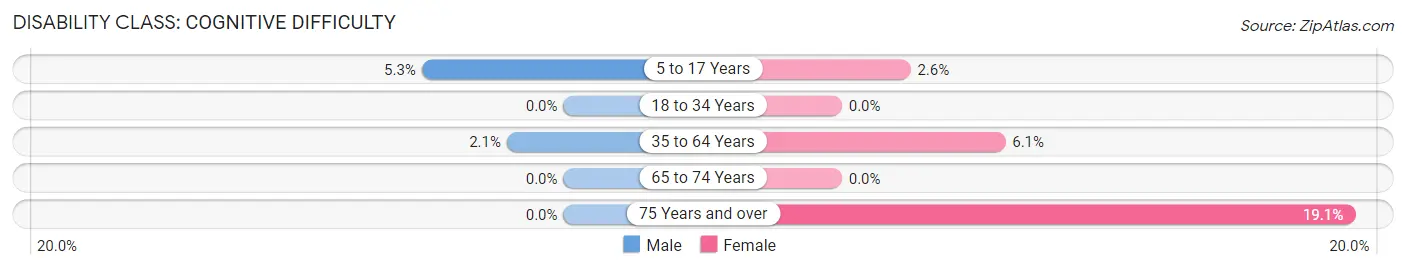
| Age Bracket | Male | Female |
| 5 to 17 Years | 57 (5.3%) | 31 (2.5%) |
| 18 to 34 Years | 0 (0.0%) | 0 (0.0%) |
| 35 to 64 Years | 50 (2.1%) | 153 (6.1%) |
| 65 to 74 Years | 0 (0.0%) | 0 (0.0%) |
| 75 Years and over | 0 (0.0%) | 24 (19.1%) |
Disability Class: Ambulatory Difficulty
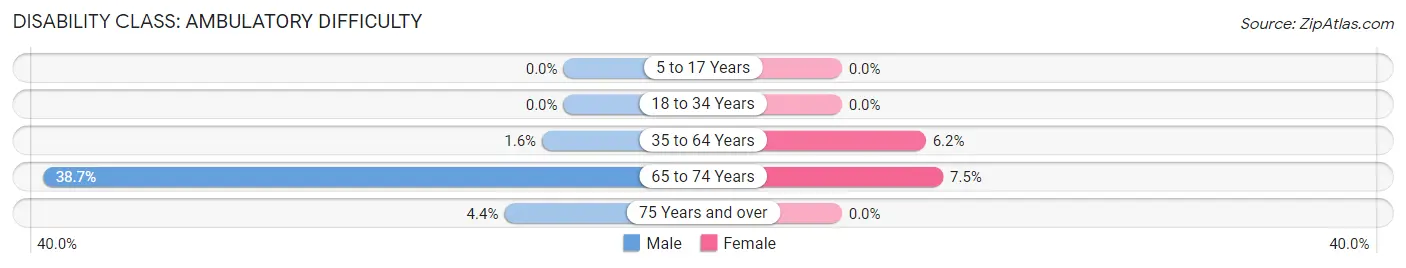
| Age Bracket | Male | Female |
| 5 to 17 Years | 0 (0.0%) | 0 (0.0%) |
| 18 to 34 Years | 0 (0.0%) | 0 (0.0%) |
| 35 to 64 Years | 38 (1.6%) | 157 (6.2%) |
| 65 to 74 Years | 109 (38.7%) | 24 (7.5%) |
| 75 Years and over | 9 (4.4%) | 0 (0.0%) |
Disability Class: Self-Care Difficulty
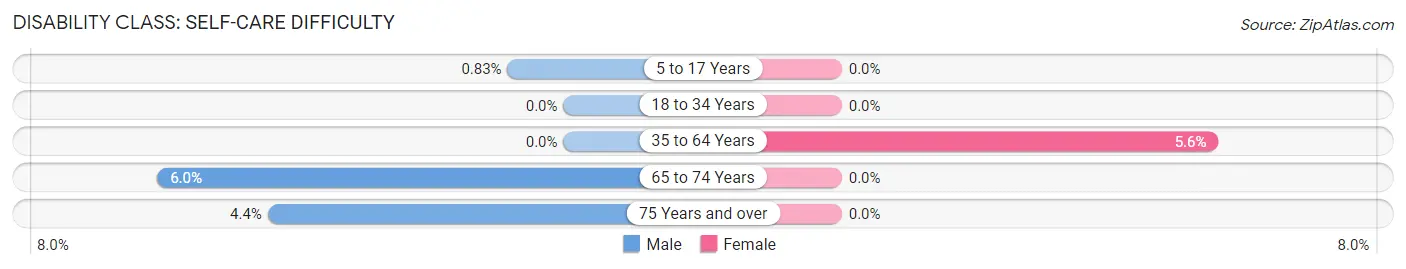
| Age Bracket | Male | Female |
| 5 to 17 Years | 9 (0.8%) | 0 (0.0%) |
| 18 to 34 Years | 0 (0.0%) | 0 (0.0%) |
| 35 to 64 Years | 0 (0.0%) | 141 (5.6%) |
| 65 to 74 Years | 17 (6.0%) | 0 (0.0%) |
| 75 Years and over | 9 (4.4%) | 0 (0.0%) |
Technology Access in Francisville
Computing Device Access in Francisville
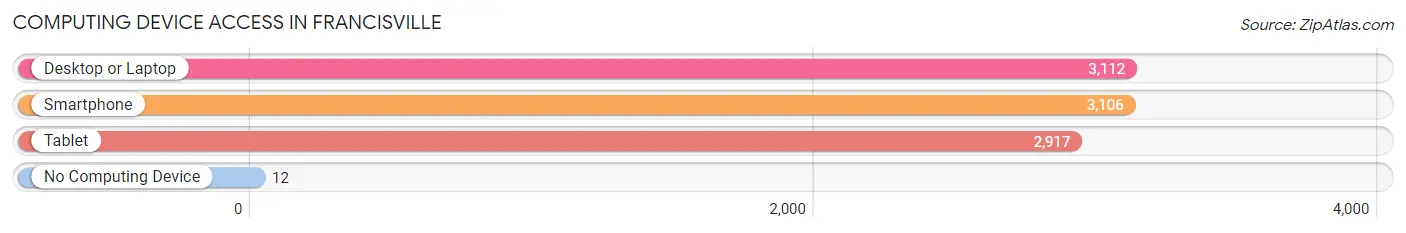
| Device Type | # Households | % Households |
| Desktop or Laptop | 3,112 | 92.8% |
| Smartphone | 3,106 | 92.6% |
| Tablet | 2,917 | 86.9% |
| No Computing Device | 12 | 0.4% |
| Total | 3,355 | 100.0% |
Internet Access in Francisville
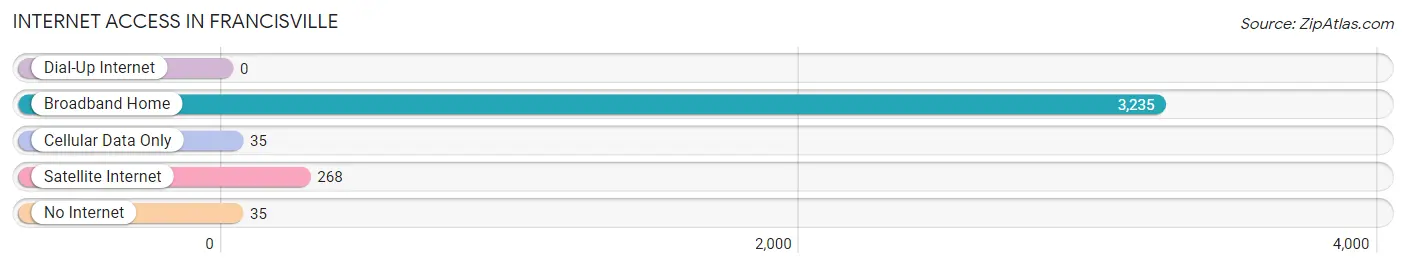
| Internet Type | # Households | % Households |
| Dial-Up Internet | 0 | 0.0% |
| Broadband Home | 3,235 | 96.4% |
| Cellular Data Only | 35 | 1.0% |
| Satellite Internet | 268 | 8.0% |
| No Internet | 35 | 1.0% |
| Total | 3,355 | 100.0% |
Francisville Summary
Francisville is a small unincorporated community located in the western part of Ballard County, Kentucky. It is situated on the banks of the Ohio River, just south of the city of Paducah. The community is named after Francisville, a small town in Pennsylvania.
History
Francisville was first settled in the early 1800s by a group of settlers from Pennsylvania. The town was originally known as “Francisville Station” and was a stop on the Paducah and Louisville Railroad. The town was officially incorporated in 1883 and was named after Francisville, Pennsylvania.
In the late 1800s, Francisville was a thriving river port town. It was home to several businesses, including a sawmill, a grist mill, a blacksmith shop, and a general store. The town also had a post office, a school, and a church.
In the early 1900s, the town began to decline as the railroad industry shifted away from the area. The town’s population decreased and many of the businesses closed. In the 1950s, the town was almost completely abandoned.
Geography
Francisville is located in the western part of Ballard County, Kentucky. It is situated on the banks of the Ohio River, just south of the city of Paducah. The town is surrounded by rolling hills and farmland. The nearest major cities are Paducah, Kentucky and Evansville, Indiana.
Economy
The economy of Francisville is largely based on agriculture. The town is home to several farms that produce corn, soybeans, wheat, and hay. There are also several small businesses in the area, including a gas station, a convenience store, and a restaurant.
Demographics
As of the 2010 census, the population of Francisville was 545. The racial makeup of the town was 97.3% White, 0.7% African American, 0.2% Native American, 0.2% Asian, and 1.6% from other races. The median household income was $31,250 and the median family income was $37,500.
Conclusion
Francisville is a small unincorporated community located in the western part of Ballard County, Kentucky. It is situated on the banks of the Ohio River, just south of the city of Paducah. The town was first settled in the early 1800s and was once a thriving river port town. Today, the economy of Francisville is largely based on agriculture and there are several small businesses in the area. The population of Francisville was 545 as of the 2010 census.
Common Questions
What is Per Capita Income in Francisville?
Per Capita income in Francisville is $53,564.
What is the Median Family Income in Francisville?
Median Family Income in Francisville is $145,000.
What is the Median Household income in Francisville?
Median Household Income in Francisville is $145,304.
What is Income or Wage Gap in Francisville?
Income or Wage Gap in Francisville is 37.6%.
Women in Francisville earn 62.4 cents for every dollar earned by a man.
What is Inequality or Gini Index in Francisville?
Inequality or Gini Index in Francisville is 0.31.
What is the Total Population of Francisville?
Total Population of Francisville is 10,044.
What is the Total Male Population of Francisville?
Total Male Population of Francisville is 4,913.
What is the Total Female Population of Francisville?
Total Female Population of Francisville is 5,131.
What is the Ratio of Males per 100 Females in Francisville?
There are 95.75 Males per 100 Females in Francisville.
What is the Ratio of Females per 100 Males in Francisville?
There are 104.44 Females per 100 Males in Francisville.
What is the Median Population Age in Francisville?
Median Population Age in Francisville is 40.6 Years.
What is the Average Family Size in Francisville
Average Family Size in Francisville is 3.2 People.
What is the Average Household Size in Francisville
Average Household Size in Francisville is 3.0 People.
How Large is the Labor Force in Francisville?
There are 5,838 People in the Labor Forcein in Francisville.
What is the Percentage of People in the Labor Force in Francisville?
76.8% of People are in the Labor Force in Francisville.
What is the Unemployment Rate in Francisville?
Unemployment Rate in Francisville is 2.1%.