Hillview, KY Map & Demographics
Hillview Map
Hillview Overview
$27,546
PER CAPITA INCOME
$69,154
AVG FAMILY INCOME
$63,578
AVG HOUSEHOLD INCOME
3.7%
WAGE / INCOME GAP [ % ]
96.3¢/ $1
WAGE / INCOME GAP [ $ ]
0.35
INEQUALITY / GINI INDEX
8,681
TOTAL POPULATION
4,594
MALE POPULATION
4,087
FEMALE POPULATION
112.41
MALES / 100 FEMALES
88.96
FEMALES / 100 MALES
35.3
MEDIAN AGE
3.2
AVG FAMILY SIZE
2.9
AVG HOUSEHOLD SIZE
4,708
LABOR FORCE [ PEOPLE ]
64.2%
PERCENT IN LABOR FORCE
3.9%
UNEMPLOYMENT RATE
Hillview Area Codes
Income in Hillview
Income Overview in Hillview
Per Capita Income in Hillview is $27,546, while median incomes of families and households are $69,154 and $63,578 respectively.
| Characteristic | Number | Measure |
| Per Capita Income | 8,681 | $27,546 |
| Median Family Income | 2,274 | $69,154 |
| Mean Family Income | 2,274 | $83,691 |
| Median Household Income | 3,043 | $63,578 |
| Mean Household Income | 3,043 | $75,920 |
| Income Deficit | 2,274 | $0 |
| Wage / Income Gap (%) | 8,681 | 3.69% |
| Wage / Income Gap ($) | 8,681 | 96.31¢ per $1 |
| Gini / Inequality Index | 8,681 | 0.35 |
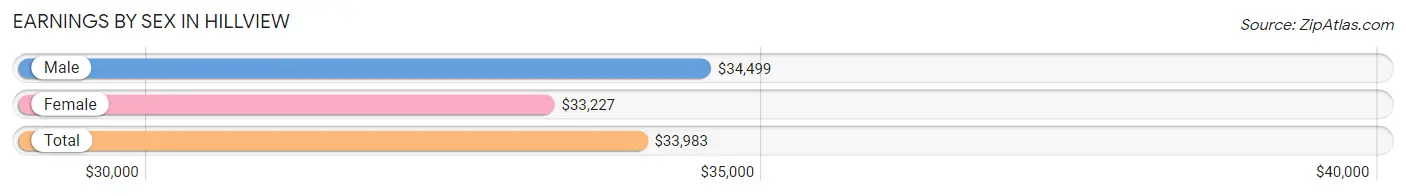
Earnings by Sex in Hillview
Average Earnings in Hillview are $33,983, $34,499 for men and $33,227 for women, a difference of 3.7%.
| Sex | Number | Average Earnings |
| Male | 2,841 (56.6%) | $34,499 |
| Female | 2,176 (43.4%) | $33,227 |
| Total | 5,017 (100.0%) | $33,983 |
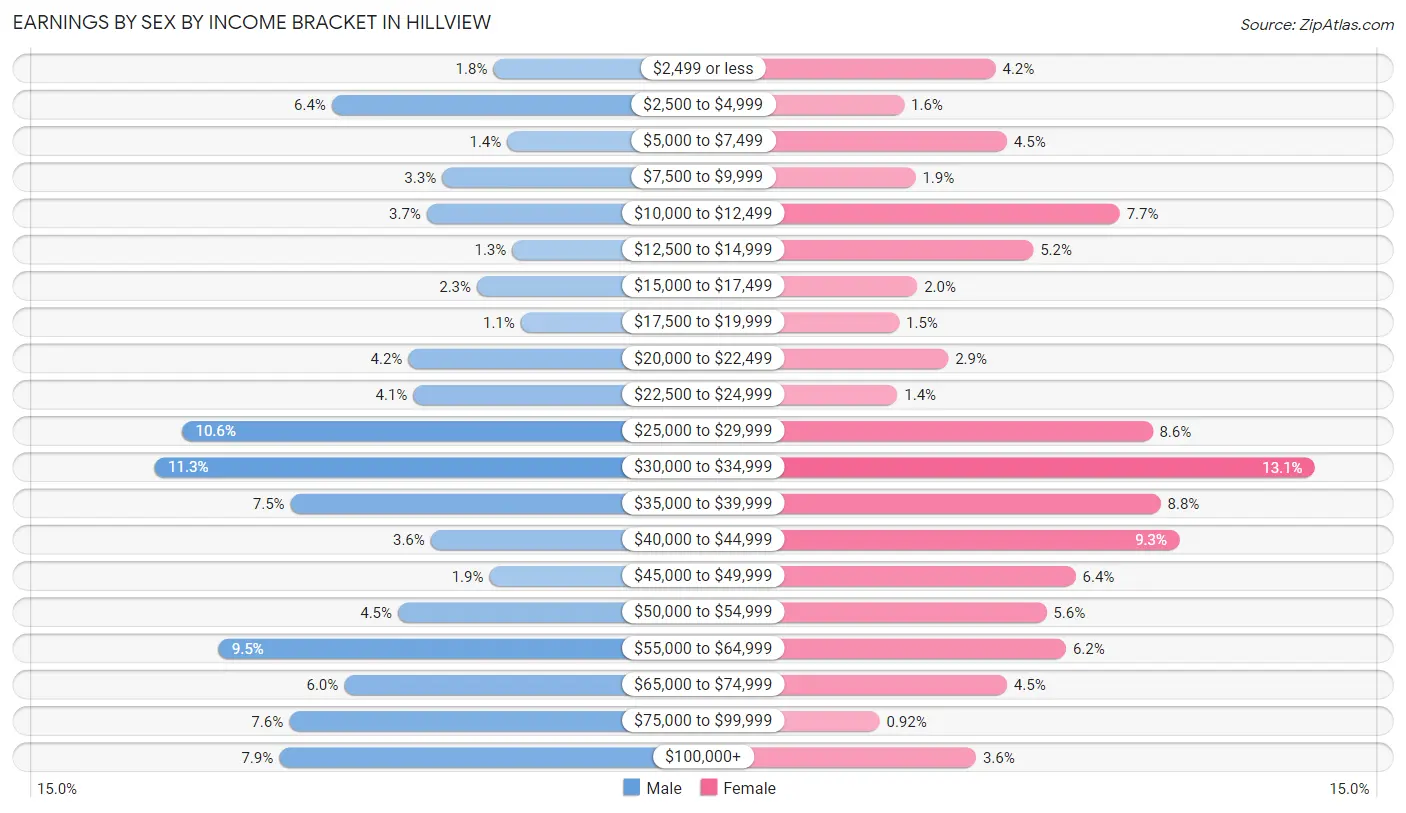
Earnings by Sex by Income Bracket in Hillview
The most common earnings brackets in Hillview are $30,000 to $34,999 for men (322 | 11.3%) and $30,000 to $34,999 for women (286 | 13.1%).
| Income | Male | Female |
| $2,499 or less | 52 (1.8%) | 91 (4.2%) |
| $2,500 to $4,999 | 181 (6.4%) | 35 (1.6%) |
| $5,000 to $7,499 | 41 (1.4%) | 98 (4.5%) |
| $7,500 to $9,999 | 93 (3.3%) | 42 (1.9%) |
| $10,000 to $12,499 | 105 (3.7%) | 167 (7.7%) |
| $12,500 to $14,999 | 37 (1.3%) | 114 (5.2%) |
| $15,000 to $17,499 | 65 (2.3%) | 43 (2.0%) |
| $17,500 to $19,999 | 30 (1.1%) | 32 (1.5%) |
| $20,000 to $22,499 | 120 (4.2%) | 62 (2.9%) |
| $22,500 to $24,999 | 116 (4.1%) | 31 (1.4%) |
| $25,000 to $29,999 | 300 (10.6%) | 187 (8.6%) |
| $30,000 to $34,999 | 322 (11.3%) | 286 (13.1%) |
| $35,000 to $39,999 | 214 (7.5%) | 192 (8.8%) |
| $40,000 to $44,999 | 102 (3.6%) | 203 (9.3%) |
| $45,000 to $49,999 | 55 (1.9%) | 140 (6.4%) |
| $50,000 to $54,999 | 128 (4.5%) | 122 (5.6%) |
| $55,000 to $64,999 | 271 (9.5%) | 134 (6.2%) |
| $65,000 to $74,999 | 171 (6.0%) | 98 (4.5%) |
| $75,000 to $99,999 | 215 (7.6%) | 20 (0.9%) |
| $100,000+ | 223 (7.9%) | 79 (3.6%) |
| Total | 2,841 (100.0%) | 2,176 (100.0%) |
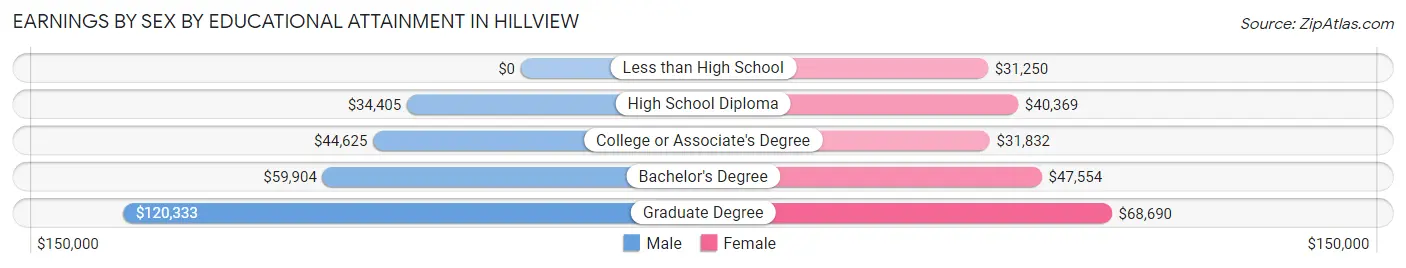
Earnings by Sex by Educational Attainment in Hillview
Average earnings in Hillview are $39,108 for men and $36,625 for women, a difference of 6.4%. Men with an educational attainment of graduate degree enjoy the highest average annual earnings of $120,333, while those with high school diploma education earn the least with $34,405. Women with an educational attainment of graduate degree earn the most with the average annual earnings of $68,690, while those with less than high school education have the smallest earnings of $31,250.
| Educational Attainment | Male Income | Female Income |
| Less than High School | - | - |
| High School Diploma | $34,405 | $40,369 |
| College or Associate's Degree | $44,625 | $31,832 |
| Bachelor's Degree | $59,904 | $47,554 |
| Graduate Degree | $120,333 | $68,690 |
| Total | $39,108 | $36,625 |
Family Income in Hillview
Family Income Brackets in Hillview
According to the Hillview family income data, there are 707 families falling into the $50,000 to $74,999 income range, which is the most common income bracket and makes up 31.1% of all families.
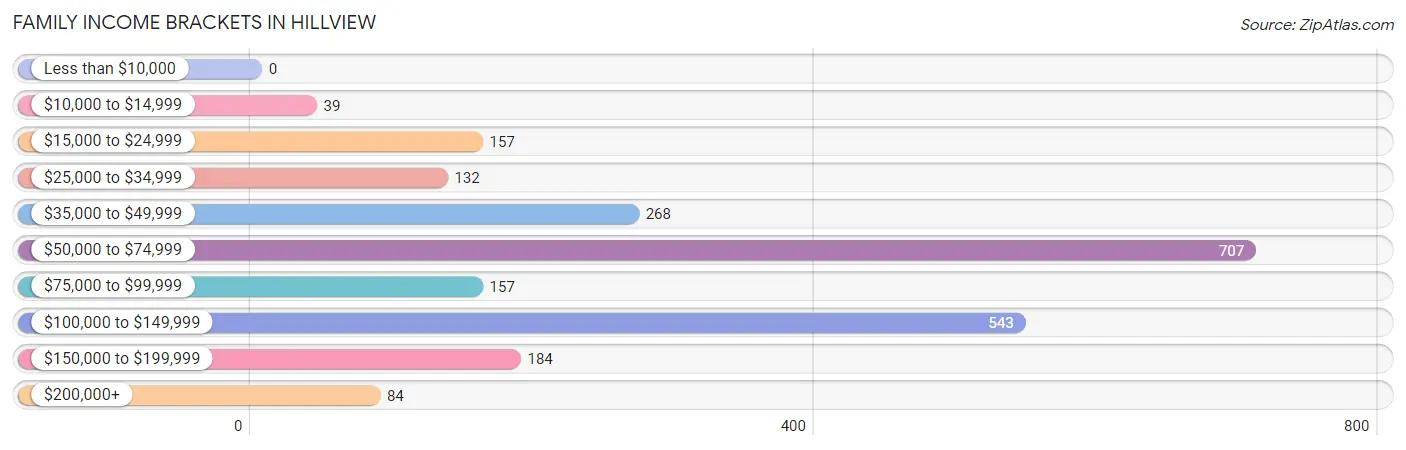
| Income Bracket | # Families | % Families |
| Less than $10,000 | 0 | 0.0% |
| $10,000 to $14,999 | 39 | 1.7% |
| $15,000 to $24,999 | 157 | 6.9% |
| $25,000 to $34,999 | 132 | 5.8% |
| $35,000 to $49,999 | 268 | 11.8% |
| $50,000 to $74,999 | 707 | 31.1% |
| $75,000 to $99,999 | 157 | 6.9% |
| $100,000 to $149,999 | 543 | 23.9% |
| $150,000 to $199,999 | 184 | 8.1% |
| $200,000+ | 84 | 3.7% |
Family Income by Famaliy Size in Hillview
3-person families (357 | 15.7%) account for the highest median family income in Hillview with $108,902 per family, while 3-person families (357 | 15.7%) have the highest median income of $36,301 per family member.
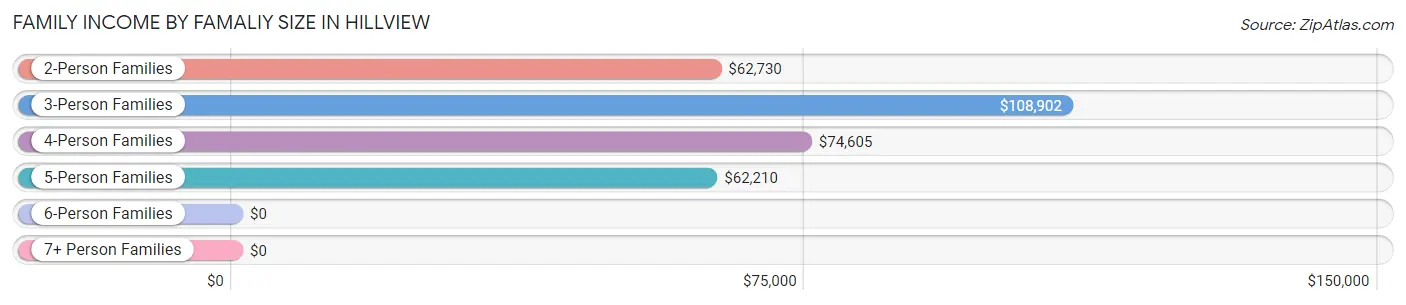
| Income Bracket | # Families | Median Income |
| 2-Person Families | 1,036 (45.6%) | $62,730 |
| 3-Person Families | 357 (15.7%) | $108,902 |
| 4-Person Families | 560 (24.6%) | $74,605 |
| 5-Person Families | 185 (8.1%) | $62,210 |
| 6-Person Families | 72 (3.2%) | $0 |
| 7+ Person Families | 64 (2.8%) | $0 |
| Total | 2,274 (100.0%) | $69,154 |
Family Income by Number of Earners in Hillview
The median family income in Hillview is $69,154, with families comprising 3+ earners (324) having the highest median family income of $101,524, while families with no earners (248) have the lowest median family income of $36,143, accounting for 14.2% and 10.9% of families, respectively.
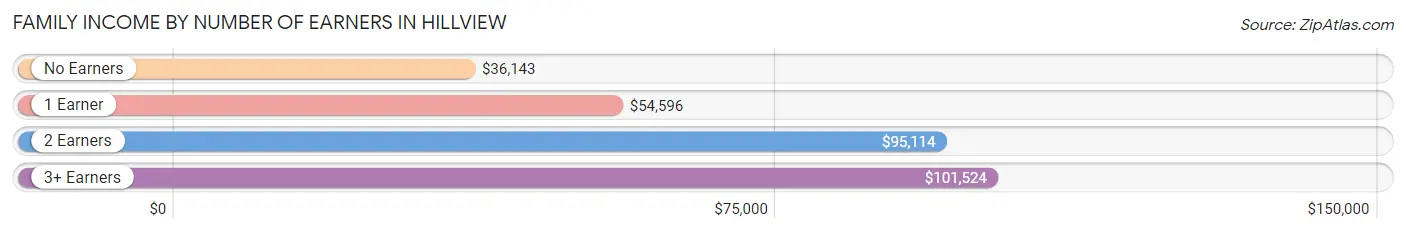
| Number of Earners | # Families | Median Income |
| No Earners | 248 (10.9%) | $36,143 |
| 1 Earner | 623 (27.4%) | $54,596 |
| 2 Earners | 1,079 (47.4%) | $95,114 |
| 3+ Earners | 324 (14.2%) | $101,524 |
| Total | 2,274 (100.0%) | $69,154 |
Household Income in Hillview
Household Income Brackets in Hillview
With 882 households falling in the category, the $50,000 to $74,999 income range is the most frequent in Hillview, accounting for 29.0% of all households. In contrast, only 27 households (0.9%) fall into the less than $10,000 income bracket, making it the least populous group.
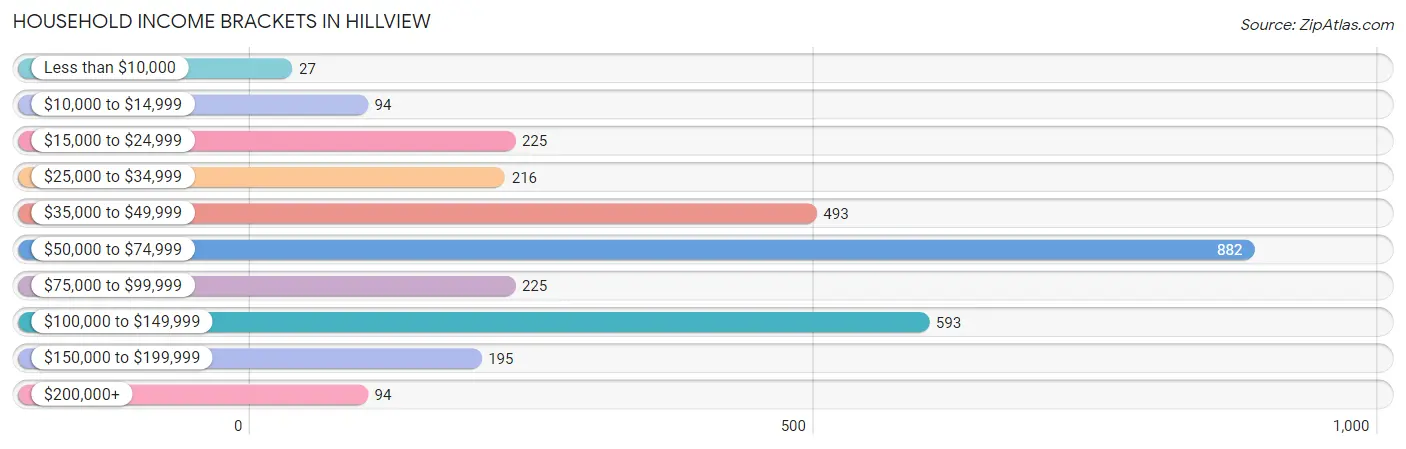
| Income Bracket | # Households | % Households |
| Less than $10,000 | 27 | 0.9% |
| $10,000 to $14,999 | 94 | 3.1% |
| $15,000 to $24,999 | 225 | 7.4% |
| $25,000 to $34,999 | 216 | 7.1% |
| $35,000 to $49,999 | 493 | 16.2% |
| $50,000 to $74,999 | 882 | 29.0% |
| $75,000 to $99,999 | 225 | 7.4% |
| $100,000 to $149,999 | 593 | 19.5% |
| $150,000 to $199,999 | 195 | 6.4% |
| $200,000+ | 94 | 3.1% |
Household Income by Householder Age in Hillview
The median household income in Hillview is $63,578, with the highest median household income of $91,518 found in the 45 to 64 years age bracket for the primary householder. A total of 912 households (30.0%) fall into this category. Meanwhile, the 65+ years age bracket for the primary householder has the lowest median household income of $35,750, with 709 households (23.3%) in this group.
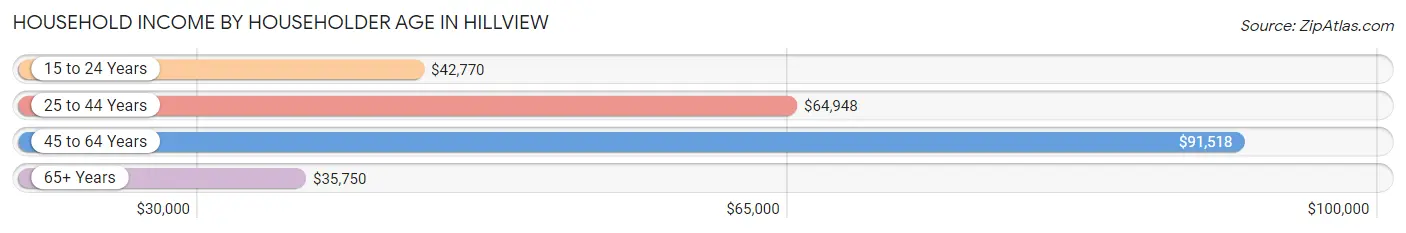
| Income Bracket | # Households | Median Income |
| 15 to 24 Years | 94 (3.1%) | $42,770 |
| 25 to 44 Years | 1,328 (43.6%) | $64,948 |
| 45 to 64 Years | 912 (30.0%) | $91,518 |
| 65+ Years | 709 (23.3%) | $35,750 |
| Total | 3,043 (100.0%) | $63,578 |
Poverty in Hillview
Income Below Poverty by Sex and Age in Hillview
With 10.5% poverty level for males and 10.0% for females among the residents of Hillview, under 5 year old males and 6 to 11 year old females are the most vulnerable to poverty, with 103 males (44.8%) and 46 females (26.4%) in their respective age groups living below the poverty level.
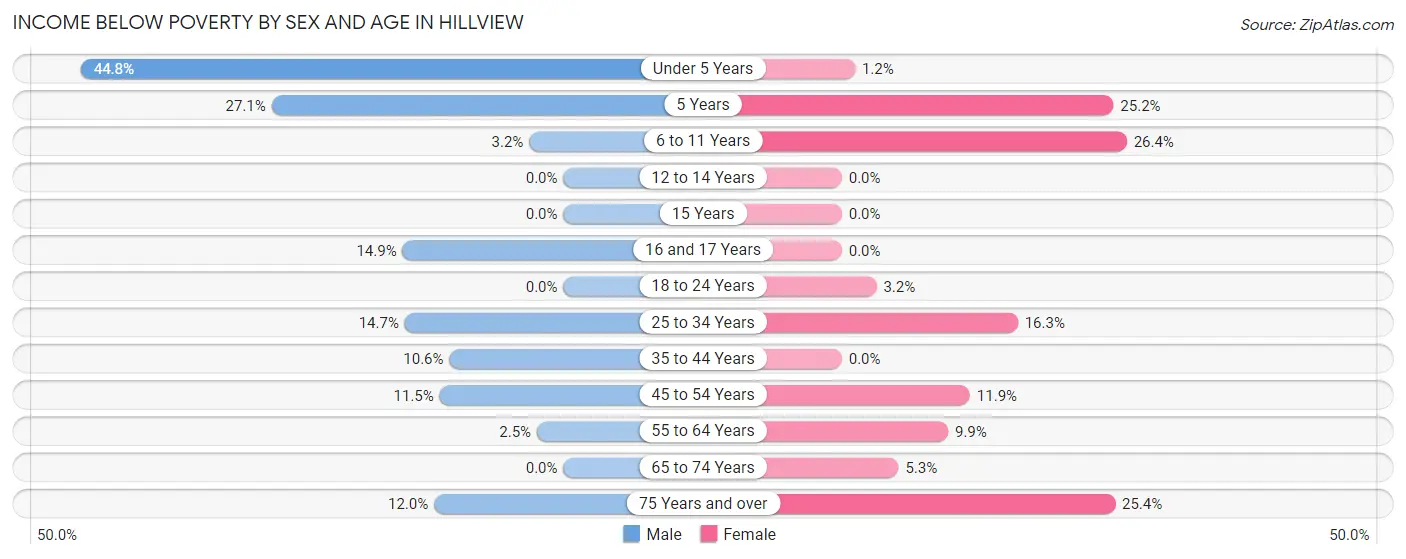
| Age Bracket | Male | Female |
| Under 5 Years | 103 (44.8%) | 1 (1.2%) |
| 5 Years | 13 (27.1%) | 30 (25.2%) |
| 6 to 11 Years | 12 (3.2%) | 46 (26.4%) |
| 12 to 14 Years | 0 (0.0%) | 0 (0.0%) |
| 15 Years | 0 (0.0%) | 0 (0.0%) |
| 16 and 17 Years | 30 (14.9%) | 0 (0.0%) |
| 18 to 24 Years | 0 (0.0%) | 14 (3.2%) |
| 25 to 34 Years | 149 (14.7%) | 112 (16.3%) |
| 35 to 44 Years | 73 (10.6%) | 0 (0.0%) |
| 45 to 54 Years | 68 (11.5%) | 78 (11.9%) |
| 55 to 64 Years | 9 (2.5%) | 43 (9.9%) |
| 65 to 74 Years | 0 (0.0%) | 14 (5.3%) |
| 75 Years and over | 27 (12.0%) | 70 (25.4%) |
| Total | 484 (10.5%) | 408 (10.0%) |
Income Above Poverty by Sex and Age in Hillview
According to the poverty statistics in Hillview, males aged 12 to 14 years and females aged 12 to 14 years are the age groups that are most secure financially, with 100.0% of males and 100.0% of females in these age groups living above the poverty line.
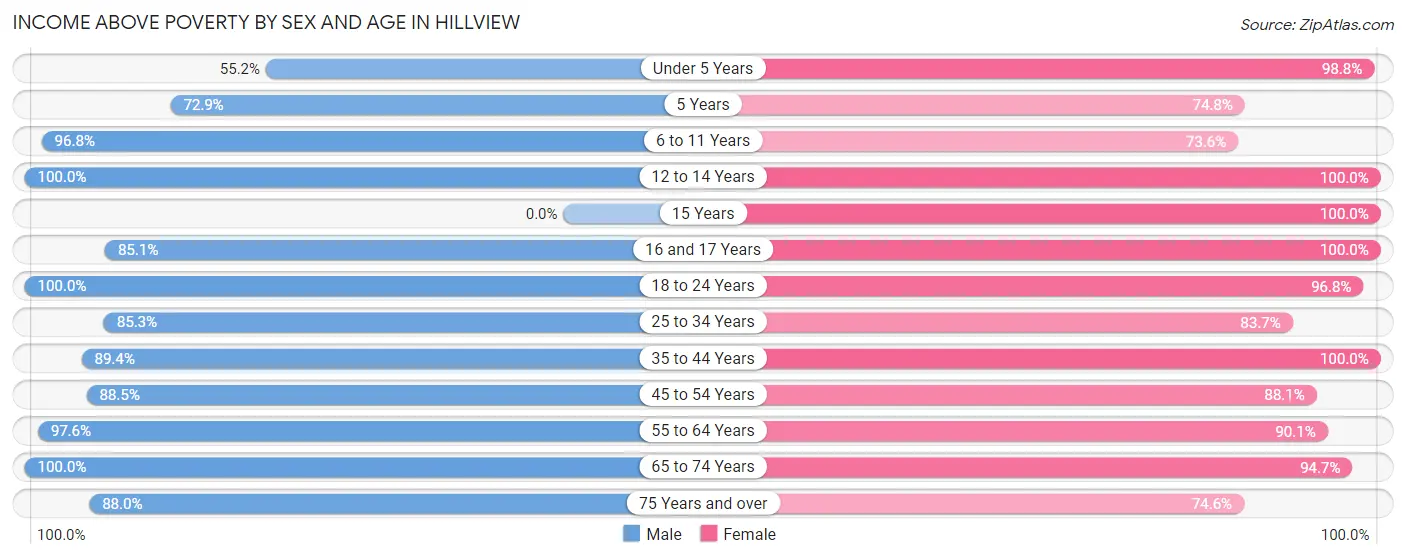
| Age Bracket | Male | Female |
| Under 5 Years | 127 (55.2%) | 81 (98.8%) |
| 5 Years | 35 (72.9%) | 89 (74.8%) |
| 6 to 11 Years | 367 (96.8%) | 128 (73.6%) |
| 12 to 14 Years | 142 (100.0%) | 140 (100.0%) |
| 15 Years | 0 (0.0%) | 34 (100.0%) |
| 16 and 17 Years | 171 (85.1%) | 156 (100.0%) |
| 18 to 24 Years | 417 (100.0%) | 421 (96.8%) |
| 25 to 34 Years | 863 (85.3%) | 574 (83.7%) |
| 35 to 44 Years | 617 (89.4%) | 627 (100.0%) |
| 45 to 54 Years | 524 (88.5%) | 578 (88.1%) |
| 55 to 64 Years | 358 (97.6%) | 393 (90.1%) |
| 65 to 74 Years | 291 (100.0%) | 252 (94.7%) |
| 75 Years and over | 198 (88.0%) | 206 (74.6%) |
| Total | 4,110 (89.5%) | 3,679 (90.0%) |
Income Below Poverty Among Married-Couple Families in Hillview
The poverty statistics for married-couple families in Hillview show that 2.9% or 50 of the total 1,741 families live below the poverty line. Families with no children have the highest poverty rate of 4.8%, comprising of 50 families. On the other hand, families with 1 or 2 children have the lowest poverty rate of 0.0%, which includes 0 families.
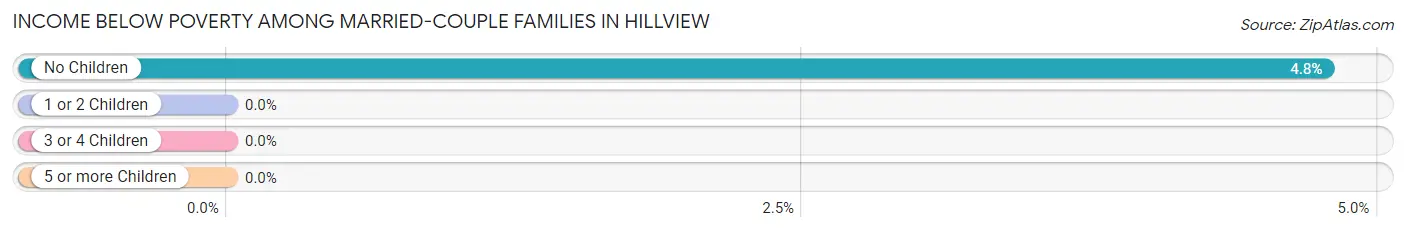
| Children | Above Poverty | Below Poverty |
| No Children | 998 (95.2%) | 50 (4.8%) |
| 1 or 2 Children | 576 (100.0%) | 0 (0.0%) |
| 3 or 4 Children | 94 (100.0%) | 0 (0.0%) |
| 5 or more Children | 23 (100.0%) | 0 (0.0%) |
| Total | 1,691 (97.1%) | 50 (2.9%) |
Income Below Poverty Among Single-Parent Households in Hillview
According to the poverty data in Hillview, 11.7% or 32 single-father households and 20.4% or 53 single-mother households are living below the poverty line. Among single-father households, those with 3 or 4 children have the highest poverty rate, with 32 households (100.0%) experiencing poverty. Likewise, among single-mother households, those with 3 or 4 children have the highest poverty rate, with 39 households (68.4%) falling below the poverty line.
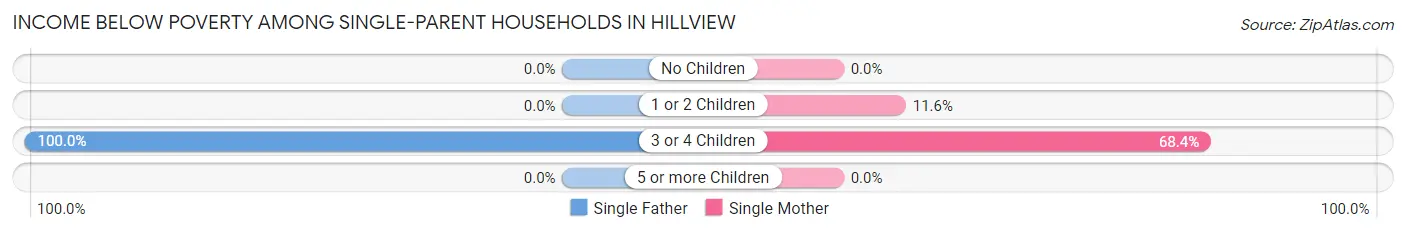
| Children | Single Father | Single Mother |
| No Children | 0 (0.0%) | 0 (0.0%) |
| 1 or 2 Children | 0 (0.0%) | 14 (11.6%) |
| 3 or 4 Children | 32 (100.0%) | 39 (68.4%) |
| 5 or more Children | 0 (0.0%) | 0 (0.0%) |
| Total | 32 (11.7%) | 53 (20.4%) |
Income Below Poverty Among Married-Couple vs Single-Parent Households in Hillview
The poverty data for Hillview shows that 50 of the married-couple family households (2.9%) and 85 of the single-parent households (16.0%) are living below the poverty level. Within the married-couple family households, those with no children have the highest poverty rate, with 50 households (4.8%) falling below the poverty line. Among the single-parent households, those with 3 or 4 children have the highest poverty rate, with 71 household (79.8%) living below poverty.
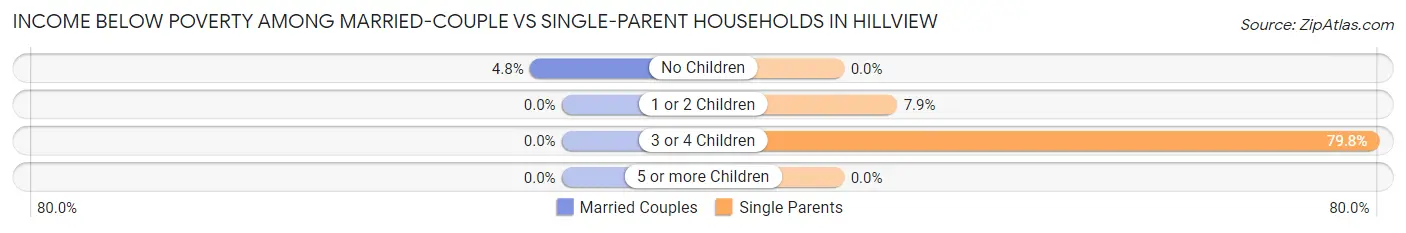
| Children | Married-Couple Families | Single-Parent Households |
| No Children | 50 (4.8%) | 0 (0.0%) |
| 1 or 2 Children | 0 (0.0%) | 14 (7.9%) |
| 3 or 4 Children | 0 (0.0%) | 71 (79.8%) |
| 5 or more Children | 0 (0.0%) | 0 (0.0%) |
| Total | 50 (2.9%) | 85 (16.0%) |
Race in Hillview
The most populous races in Hillview are White / Caucasian (6,799 | 78.3%), Two or more Races (869 | 10.0%), and Hispanic or Latino (658 | 7.6%).
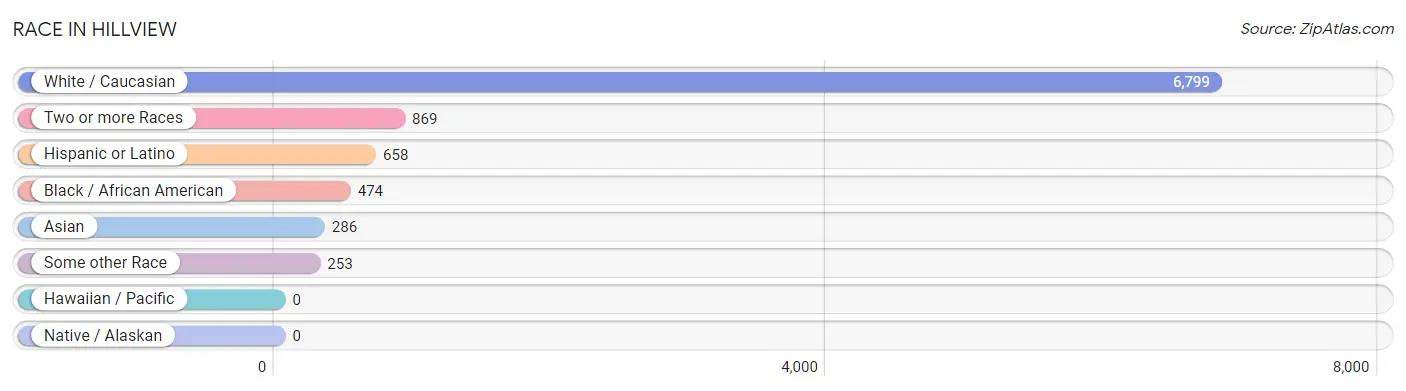
| Race | # Population | % Population |
| Asian | 286 | 3.3% |
| Black / African American | 474 | 5.5% |
| Hawaiian / Pacific | 0 | 0.0% |
| Hispanic or Latino | 658 | 7.6% |
| Native / Alaskan | 0 | 0.0% |
| White / Caucasian | 6,799 | 78.3% |
| Two or more Races | 869 | 10.0% |
| Some other Race | 253 | 2.9% |
| Total | 8,681 | 100.0% |
Ancestry in Hillview
The most populous ancestries reported in Hillview are American (1,388 | 16.0%), Irish (1,012 | 11.7%), English (853 | 9.8%), German (766 | 8.8%), and Cuban (421 | 4.9%), together accounting for 51.1% of all Hillview residents.
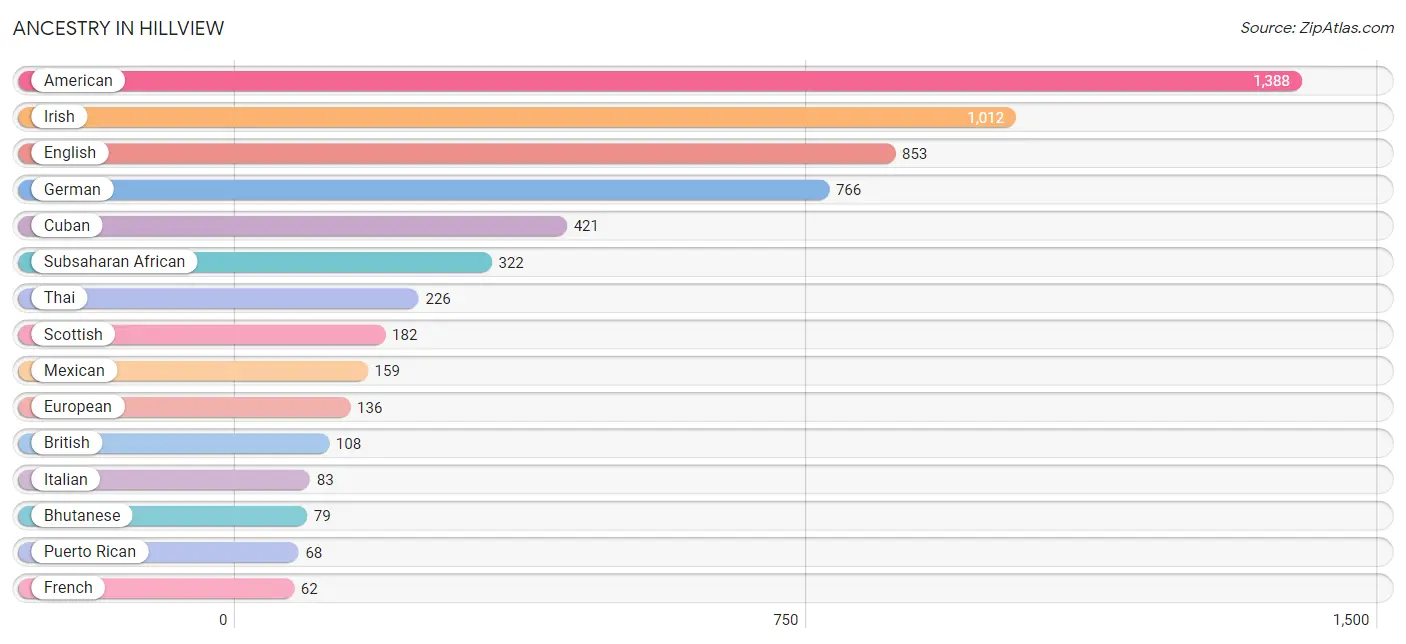
| Ancestry | # Population | % Population |
| American | 1,388 | 16.0% |
| Arab | 22 | 0.3% |
| Bhutanese | 79 | 0.9% |
| British | 108 | 1.2% |
| Burmese | 60 | 0.7% |
| Central American | 10 | 0.1% |
| Comanche | 22 | 0.3% |
| Cuban | 421 | 4.9% |
| Dutch | 23 | 0.3% |
| English | 853 | 9.8% |
| European | 136 | 1.6% |
| Finnish | 7 | 0.1% |
| French | 62 | 0.7% |
| German | 766 | 8.8% |
| Ghanaian | 17 | 0.2% |
| Guatemalan | 10 | 0.1% |
| Irish | 1,012 | 11.7% |
| Italian | 83 | 1.0% |
| Lebanese | 22 | 0.3% |
| Mexican | 159 | 1.8% |
| Norwegian | 21 | 0.2% |
| Polish | 40 | 0.5% |
| Puerto Rican | 68 | 0.8% |
| Scotch-Irish | 20 | 0.2% |
| Scottish | 182 | 2.1% |
| Subsaharan African | 322 | 3.7% |
| Swedish | 27 | 0.3% |
| Thai | 226 | 2.6% |
| Welsh | 16 | 0.2% | View All 29 Rows |
Immigrants in Hillview
The most numerous immigrant groups reported in Hillview came from Latin America (375 | 4.3%), Africa (367 | 4.2%), Asia (342 | 3.9%), India (282 | 3.3%), and South Central Asia (282 | 3.3%), together accounting for 19.0% of all Hillview residents.
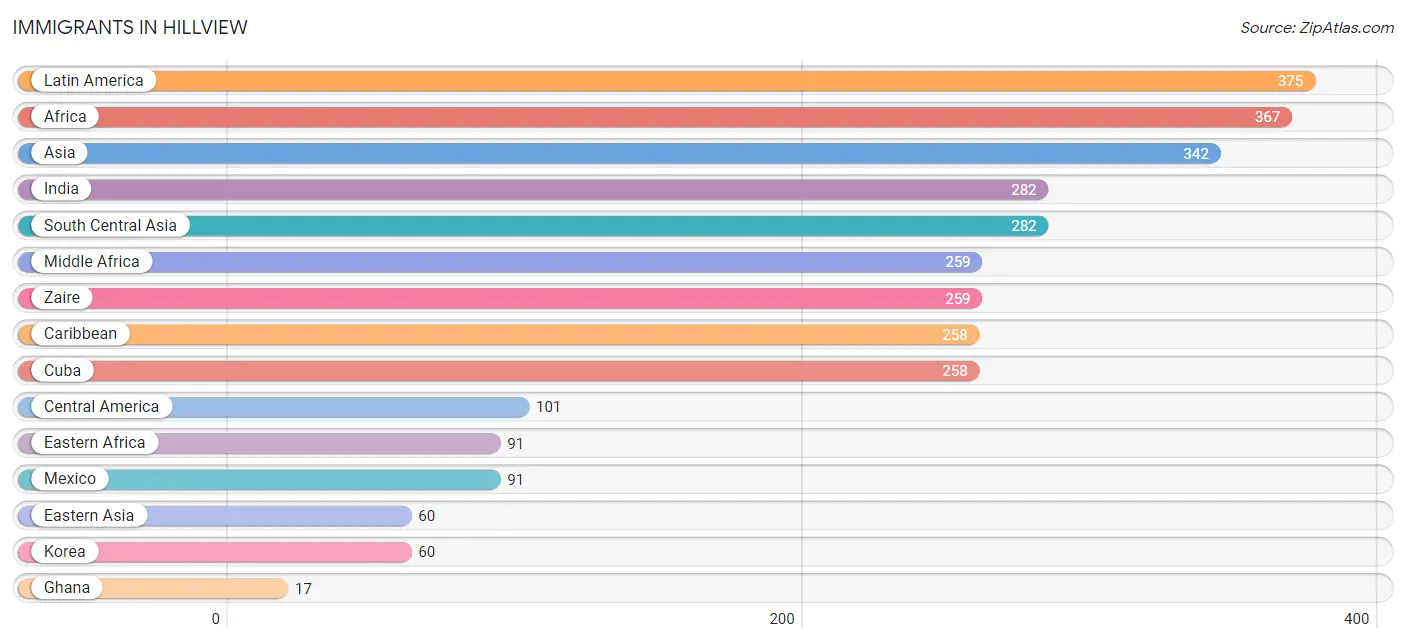
| Immigration Origin | # Population | % Population |
| Africa | 367 | 4.2% |
| Asia | 342 | 3.9% |
| Bolivia | 16 | 0.2% |
| Caribbean | 258 | 3.0% |
| Central America | 101 | 1.2% |
| Cuba | 258 | 3.0% |
| Eastern Africa | 91 | 1.1% |
| Eastern Asia | 60 | 0.7% |
| Ghana | 17 | 0.2% |
| Guatemala | 10 | 0.1% |
| India | 282 | 3.3% |
| Korea | 60 | 0.7% |
| Latin America | 375 | 4.3% |
| Mexico | 91 | 1.1% |
| Middle Africa | 259 | 3.0% |
| South America | 16 | 0.2% |
| South Central Asia | 282 | 3.3% |
| Western Africa | 17 | 0.2% |
| Zaire | 259 | 3.0% | View All 19 Rows |
Sex and Age in Hillview
Sex and Age in Hillview
The most populous age groups in Hillview are 30 to 34 Years (523 | 11.4%) for men and 30 to 34 Years (471 | 11.5%) for women.
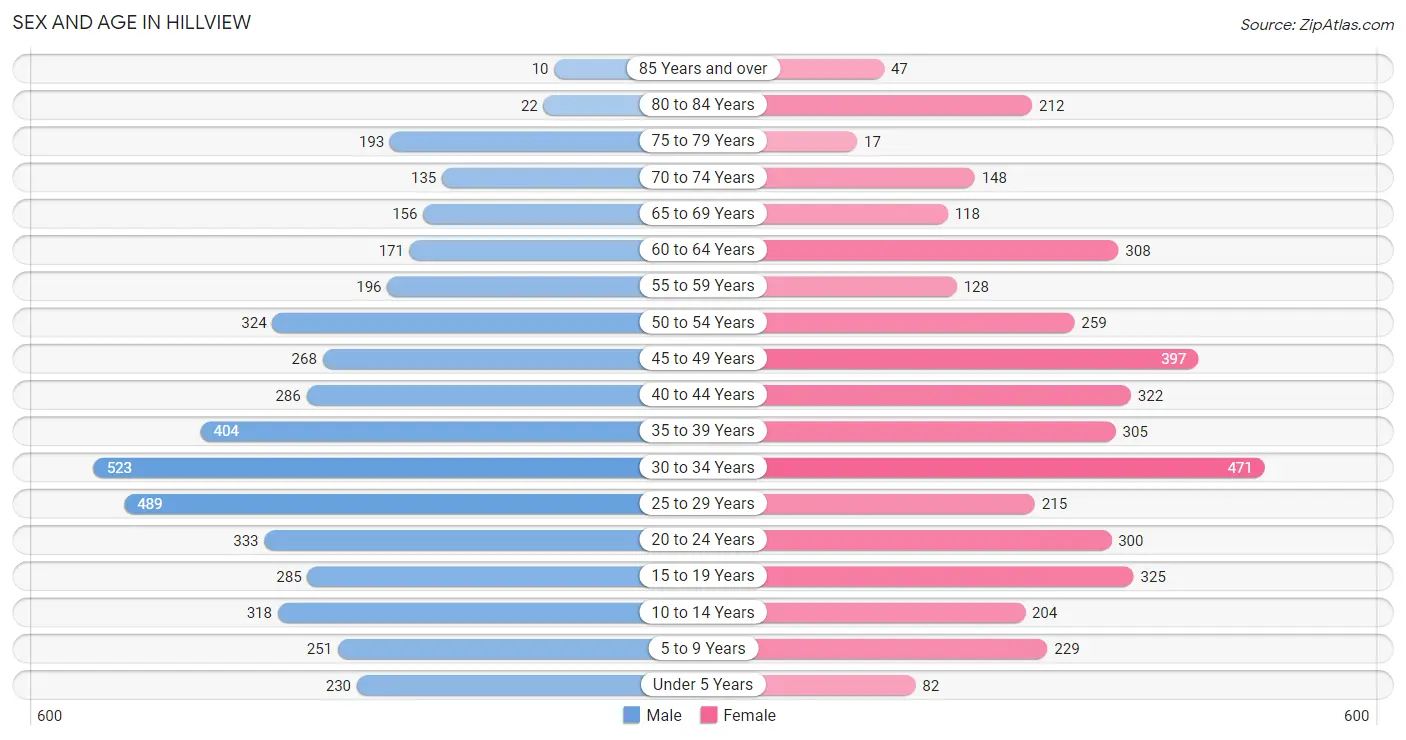
| Age Bracket | Male | Female |
| Under 5 Years | 230 (5.0%) | 82 (2.0%) |
| 5 to 9 Years | 251 (5.5%) | 229 (5.6%) |
| 10 to 14 Years | 318 (6.9%) | 204 (5.0%) |
| 15 to 19 Years | 285 (6.2%) | 325 (8.0%) |
| 20 to 24 Years | 333 (7.2%) | 300 (7.3%) |
| 25 to 29 Years | 489 (10.6%) | 215 (5.3%) |
| 30 to 34 Years | 523 (11.4%) | 471 (11.5%) |
| 35 to 39 Years | 404 (8.8%) | 305 (7.5%) |
| 40 to 44 Years | 286 (6.2%) | 322 (7.9%) |
| 45 to 49 Years | 268 (5.8%) | 397 (9.7%) |
| 50 to 54 Years | 324 (7.0%) | 259 (6.3%) |
| 55 to 59 Years | 196 (4.3%) | 128 (3.1%) |
| 60 to 64 Years | 171 (3.7%) | 308 (7.5%) |
| 65 to 69 Years | 156 (3.4%) | 118 (2.9%) |
| 70 to 74 Years | 135 (2.9%) | 148 (3.6%) |
| 75 to 79 Years | 193 (4.2%) | 17 (0.4%) |
| 80 to 84 Years | 22 (0.5%) | 212 (5.2%) |
| 85 Years and over | 10 (0.2%) | 47 (1.1%) |
| Total | 4,594 (100.0%) | 4,087 (100.0%) |
Families and Households in Hillview
Median Family Size in Hillview
The median family size in Hillview is 3.22 persons per family, with single female/mother families (260 | 11.4%) accounting for the largest median family size of 4.13 persons per family. On the other hand, married-couple families (1,741 | 76.6%) represent the smallest median family size with 3.07 persons per family.
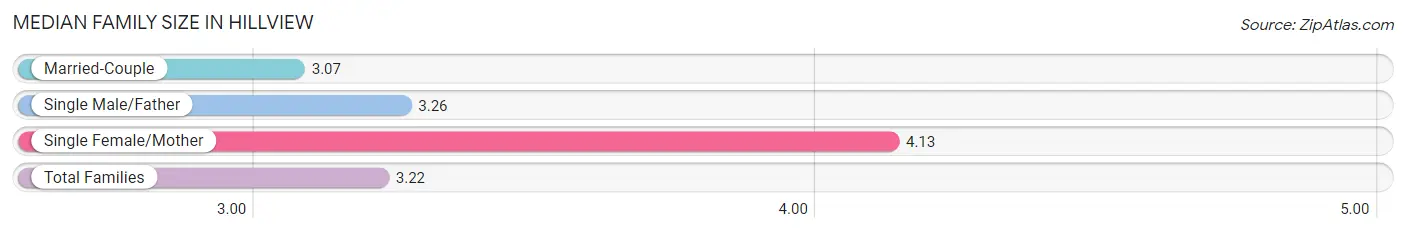
| Family Type | # Families | Family Size |
| Married-Couple | 1,741 (76.6%) | 3.07 |
| Single Male/Father | 273 (12.0%) | 3.26 |
| Single Female/Mother | 260 (11.4%) | 4.13 |
| Total Families | 2,274 (100.0%) | 3.22 |
Median Household Size in Hillview
The median household size in Hillview is 2.85 persons per household, with single female/mother households (260 | 8.5%) accounting for the largest median household size of 4.68 persons per household. non-family households (769 | 25.3%) represent the smallest median household size with 1.38 persons per household.
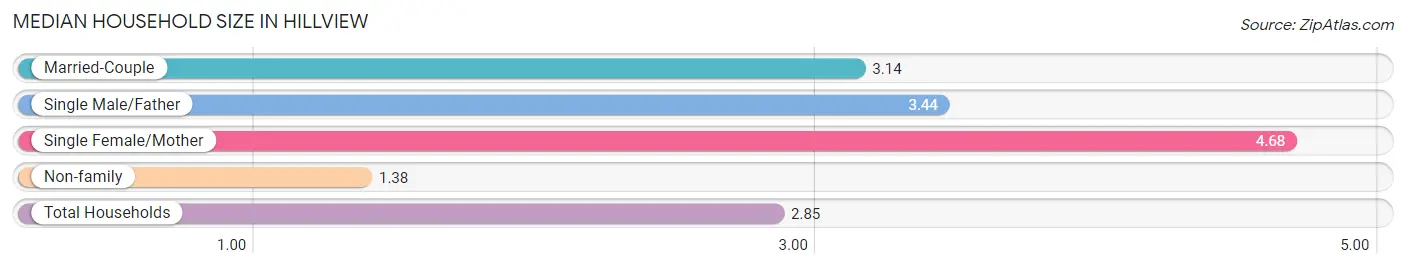
| Household Type | # Households | Household Size |
| Married-Couple | 1,741 (57.2%) | 3.14 |
| Single Male/Father | 273 (9.0%) | 3.44 |
| Single Female/Mother | 260 (8.5%) | 4.68 |
| Non-family | 769 (25.3%) | 1.38 |
| Total Households | 3,043 (100.0%) | 2.85 |
Household Size by Marriage Status in Hillview
Out of a total of 3,043 households in Hillview, 2,274 (74.7%) are family households, while 769 (25.3%) are nonfamily households. The most numerous type of family households are 2-person households, comprising 951, and the most common type of nonfamily households are 1-person households, comprising 516.
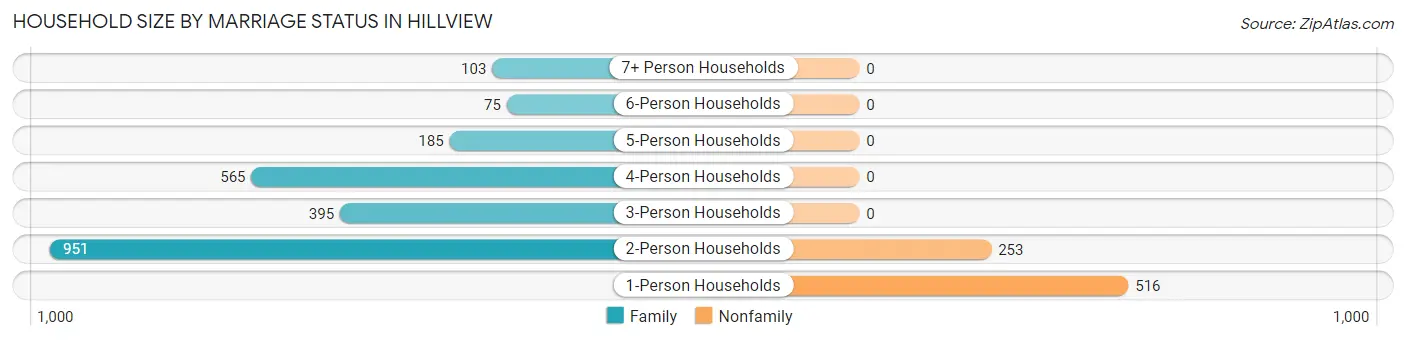
| Household Size | Family Households | Nonfamily Households |
| 1-Person Households | - | 516 (17.0%) |
| 2-Person Households | 951 (31.2%) | 253 (8.3%) |
| 3-Person Households | 395 (13.0%) | 0 (0.0%) |
| 4-Person Households | 565 (18.6%) | 0 (0.0%) |
| 5-Person Households | 185 (6.1%) | 0 (0.0%) |
| 6-Person Households | 75 (2.5%) | 0 (0.0%) |
| 7+ Person Households | 103 (3.4%) | 0 (0.0%) |
| Total | 2,274 (74.7%) | 769 (25.3%) |
Female Fertility in Hillview
Fertility by Age in Hillview
Average fertility rate in Hillview is 43.0 births per 1,000 women. Women in the age bracket of 20 to 34 years have the highest fertility rate with 101.0 births per 1,000 women. Women in the age bracket of 20 to 34 years acount for 100.0% of all women with births.
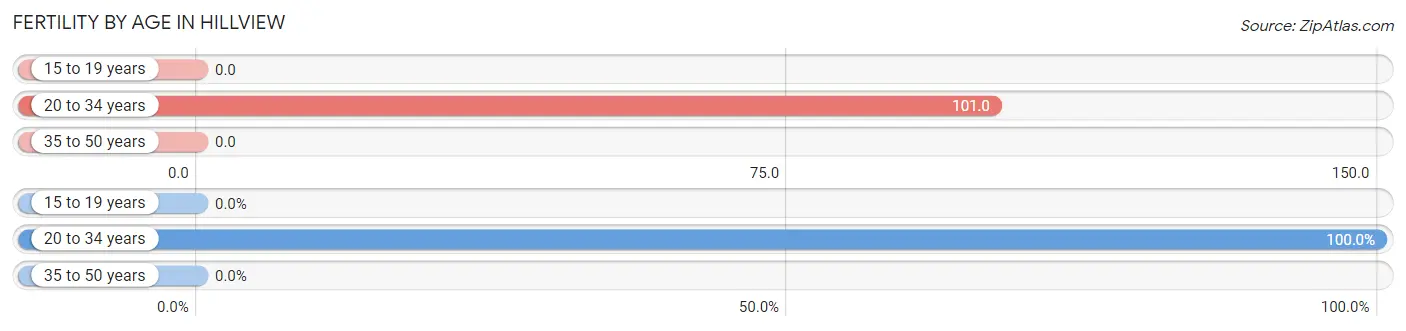
| Age Bracket | Women with Births | Births / 1,000 Women |
| 15 to 19 years | 0 (0.0%) | 0.0 |
| 20 to 34 years | 100 (100.0%) | 101.0 |
| 35 to 50 years | 0 (0.0%) | 0.0 |
| Total | 100 (100.0%) | 43.0 |
Fertility by Age by Marriage Status in Hillview
68.0% of women with births (100) in Hillview are married. The highest percentage of unmarried women with births falls into 20 to 34 years age bracket with 32.0% of them unmarried at the time of birth, while the lowest percentage of unmarried women with births belong to 20 to 34 years age bracket with 32.0% of them unmarried.
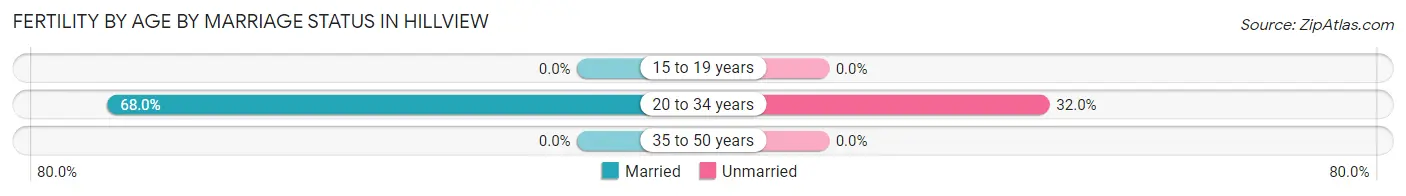
| Age Bracket | Married | Unmarried |
| 15 to 19 years | 0 (0.0%) | 0 (0.0%) |
| 20 to 34 years | 68 (68.0%) | 32 (32.0%) |
| 35 to 50 years | 0 (0.0%) | 0 (0.0%) |
| Total | 68 (68.0%) | 32 (32.0%) |
Fertility by Education in Hillview
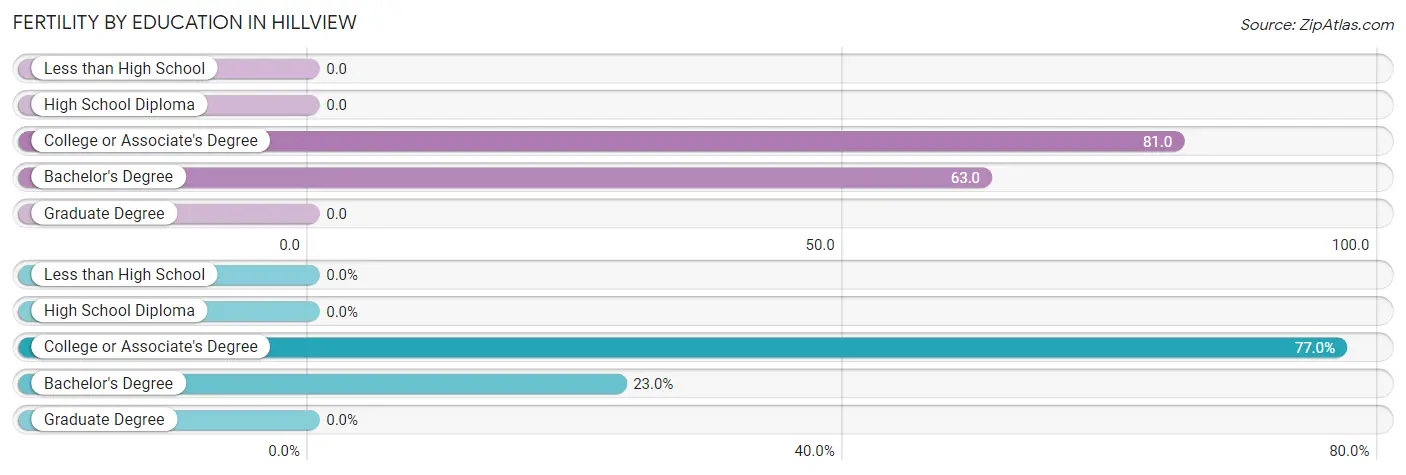
| Educational Attainment | Women with Births | Births / 1,000 Women |
| Less than High School | 0 (0.0%) | 0.0 |
| High School Diploma | 0 (0.0%) | 0.0 |
| College or Associate's Degree | 77 (77.0%) | 81.0 |
| Bachelor's Degree | 23 (23.0%) | 63.0 |
| Graduate Degree | 0 (0.0%) | 0.0 |
| Total | 100 (100.0%) | 43.0 |
Fertility by Education by Marriage Status in Hillview
32.0% of women with births in Hillview are unmarried. Women with the educational attainment of bachelor's degree are most likely to be married with 100.0% of them married at childbirth, while women with the educational attainment of college or associate's degree are least likely to be married with 41.6% of them unmarried at childbirth.
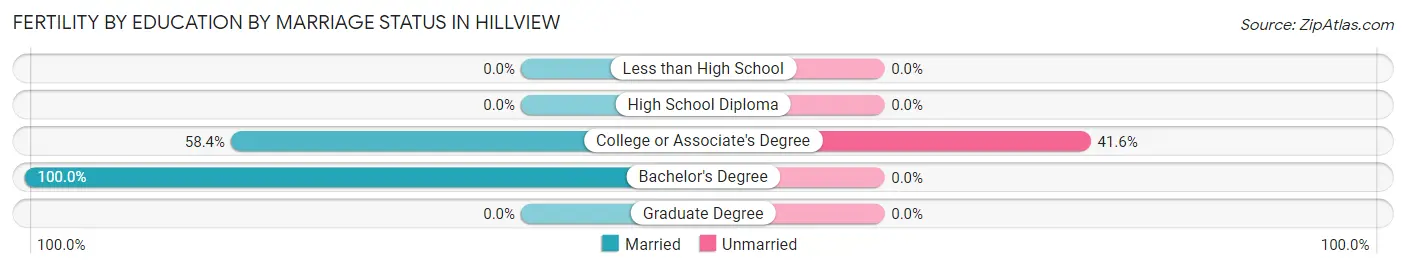
| Educational Attainment | Married | Unmarried |
| Less than High School | 0 (0.0%) | 0 (0.0%) |
| High School Diploma | 0 (0.0%) | 0 (0.0%) |
| College or Associate's Degree | 45 (58.4%) | 32 (41.6%) |
| Bachelor's Degree | 23 (100.0%) | 0 (0.0%) |
| Graduate Degree | 0 (0.0%) | 0 (0.0%) |
| Total | 68 (68.0%) | 32 (32.0%) |
Employment Characteristics in Hillview
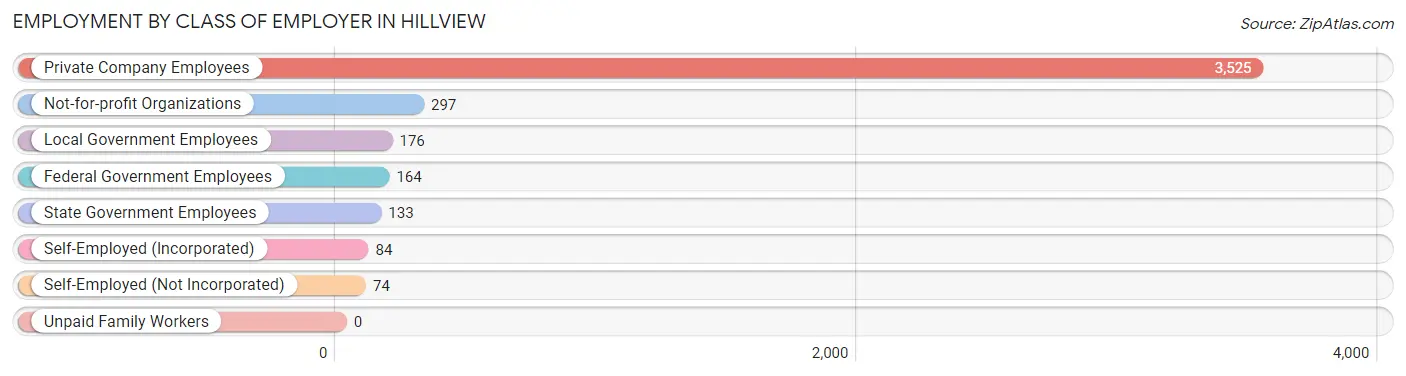
Employment by Class of Employer in Hillview
Among the 4,453 employed individuals in Hillview, private company employees (3,525 | 79.2%), not-for-profit organizations (297 | 6.7%), and local government employees (176 | 4.0%) make up the most common classes of employment.
| Employer Class | # Employees | % Employees |
| Private Company Employees | 3,525 | 79.2% |
| Self-Employed (Incorporated) | 84 | 1.9% |
| Self-Employed (Not Incorporated) | 74 | 1.7% |
| Not-for-profit Organizations | 297 | 6.7% |
| Local Government Employees | 176 | 4.0% |
| State Government Employees | 133 | 3.0% |
| Federal Government Employees | 164 | 3.7% |
| Unpaid Family Workers | 0 | 0.0% |
| Total | 4,453 | 100.0% |
Employment Status by Age in Hillview
According to the labor force statistics for Hillview, out of the total population over 16 years of age (7,333), 64.2% or 4,708 individuals are in the labor force, with 3.9% or 184 of them unemployed. The age group with the highest labor force participation rate is 25 to 29 years, with 91.3% or 643 individuals in the labor force. Within the labor force, the 16 to 19 years age range has the highest percentage of unemployed individuals, with 15.0% or 23 of them being unemployed.
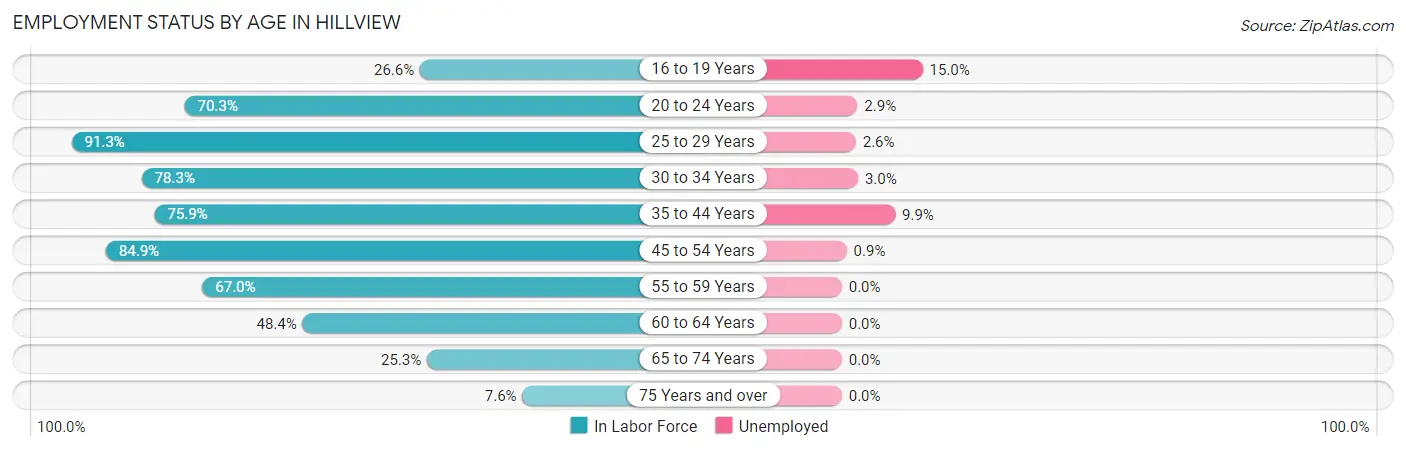
| Age Bracket | In Labor Force | Unemployed |
| 16 to 19 Years | 153 (26.6%) | 23 (15.0%) |
| 20 to 24 Years | 445 (70.3%) | 13 (2.9%) |
| 25 to 29 Years | 643 (91.3%) | 17 (2.6%) |
| 30 to 34 Years | 778 (78.3%) | 23 (3.0%) |
| 35 to 44 Years | 1,000 (75.9%) | 99 (9.9%) |
| 45 to 54 Years | 1,060 (84.9%) | 10 (0.9%) |
| 55 to 59 Years | 217 (67.0%) | 0 (0.0%) |
| 60 to 64 Years | 232 (48.4%) | 0 (0.0%) |
| 65 to 74 Years | 141 (25.3%) | 0 (0.0%) |
| 75 Years and over | 38 (7.6%) | 0 (0.0%) |
| Total | 4,708 (64.2%) | 184 (3.9%) |
Employment Status by Educational Attainment in Hillview
According to labor force statistics for Hillview, 77.6% of individuals (3,931) out of the total population between 25 and 64 years of age (5,066) are in the labor force, with 3.8% or 149 of them being unemployed. The group with the highest labor force participation rate are those with the educational attainment of bachelor's degree or higher, with 88.8% or 857 individuals in the labor force. Within the labor force, individuals with less than high school education have the highest percentage of unemployment, with 15.6% or 82 of them being unemployed.
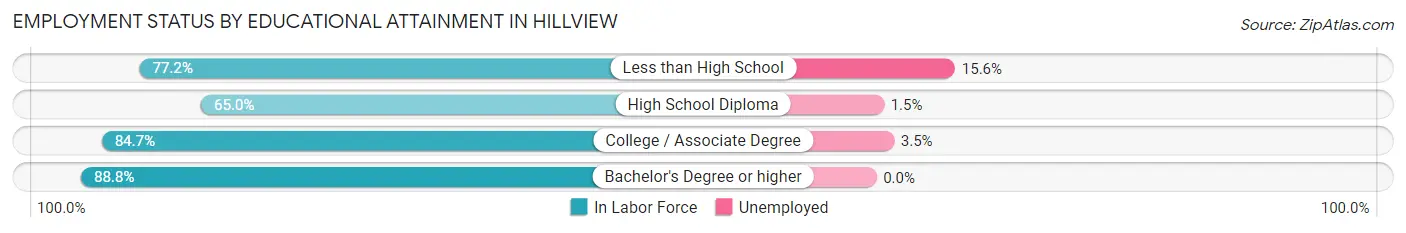
| Educational Attainment | In Labor Force | Unemployed |
| Less than High School | 527 (77.2%) | 107 (15.6%) |
| High School Diploma | 1,156 (65.0%) | 27 (1.5%) |
| College / Associate Degree | 1,389 (84.7%) | 57 (3.5%) |
| Bachelor's Degree or higher | 857 (88.8%) | 0 (0.0%) |
| Total | 3,931 (77.6%) | 193 (3.8%) |
Employment Occupations by Sex in Hillview
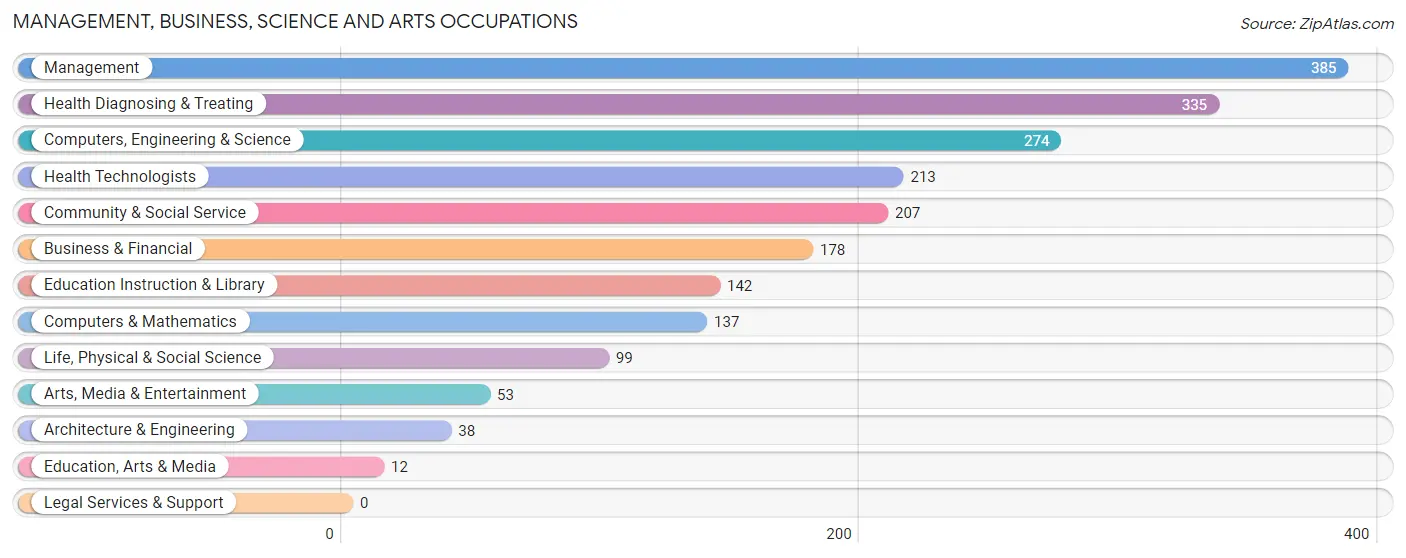
Management, Business, Science and Arts Occupations
The most common Management, Business, Science and Arts occupations in Hillview are Management (385 | 8.5%), Health Diagnosing & Treating (335 | 7.4%), Computers, Engineering & Science (274 | 6.1%), Health Technologists (213 | 4.7%), and Community & Social Service (207 | 4.6%).
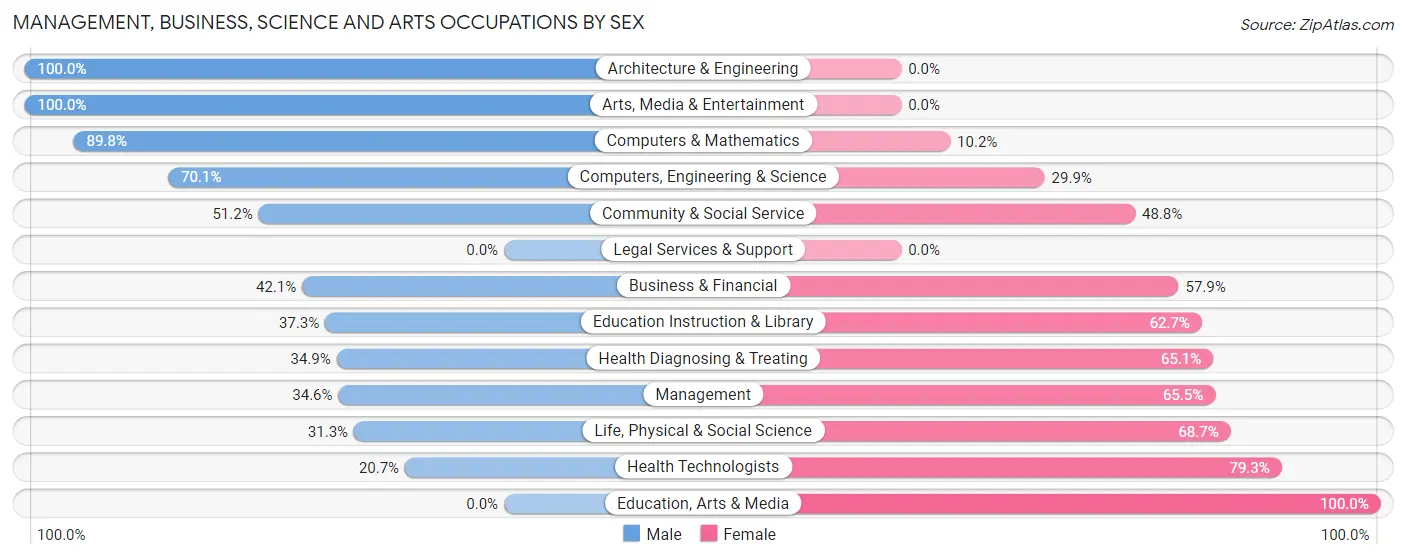
Management, Business, Science and Arts Occupations by Sex
Within the Management, Business, Science and Arts occupations in Hillview, the most male-oriented occupations are Architecture & Engineering (100.0%), Arts, Media & Entertainment (100.0%), and Computers & Mathematics (89.8%), while the most female-oriented occupations are Education, Arts & Media (100.0%), Health Technologists (79.3%), and Life, Physical & Social Science (68.7%).
| Occupation | Male | Female |
| Management | 133 (34.5%) | 252 (65.4%) |
| Business & Financial | 75 (42.1%) | 103 (57.9%) |
| Computers, Engineering & Science | 192 (70.1%) | 82 (29.9%) |
| Computers & Mathematics | 123 (89.8%) | 14 (10.2%) |
| Architecture & Engineering | 38 (100.0%) | 0 (0.0%) |
| Life, Physical & Social Science | 31 (31.3%) | 68 (68.7%) |
| Community & Social Service | 106 (51.2%) | 101 (48.8%) |
| Education, Arts & Media | 0 (0.0%) | 12 (100.0%) |
| Legal Services & Support | 0 (0.0%) | 0 (0.0%) |
| Education Instruction & Library | 53 (37.3%) | 89 (62.7%) |
| Arts, Media & Entertainment | 53 (100.0%) | 0 (0.0%) |
| Health Diagnosing & Treating | 117 (34.9%) | 218 (65.1%) |
| Health Technologists | 44 (20.7%) | 169 (79.3%) |
| Total (Category) | 623 (45.2%) | 756 (54.8%) |
| Total (Overall) | 2,592 (57.5%) | 1,915 (42.5%) |
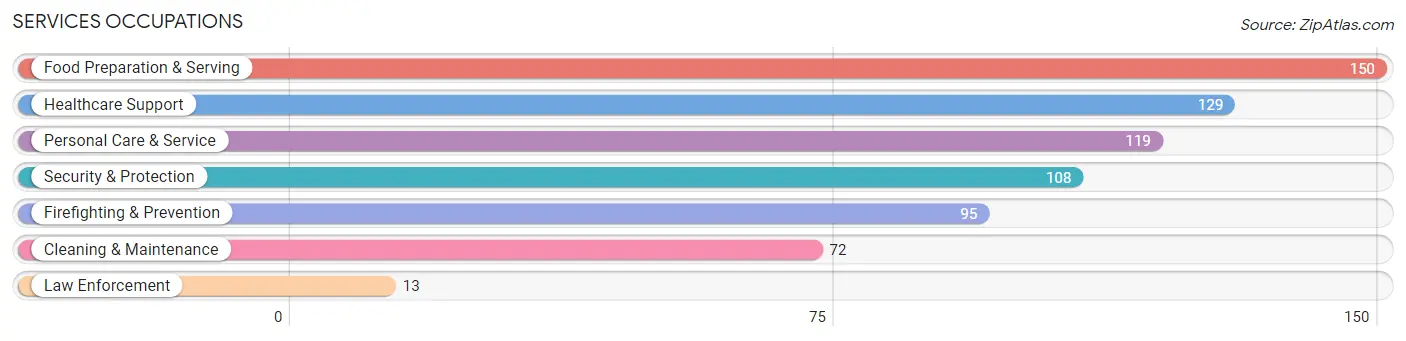
Services Occupations
The most common Services occupations in Hillview are Food Preparation & Serving (150 | 3.3%), Healthcare Support (129 | 2.9%), Personal Care & Service (119 | 2.6%), Security & Protection (108 | 2.4%), and Firefighting & Prevention (95 | 2.1%).
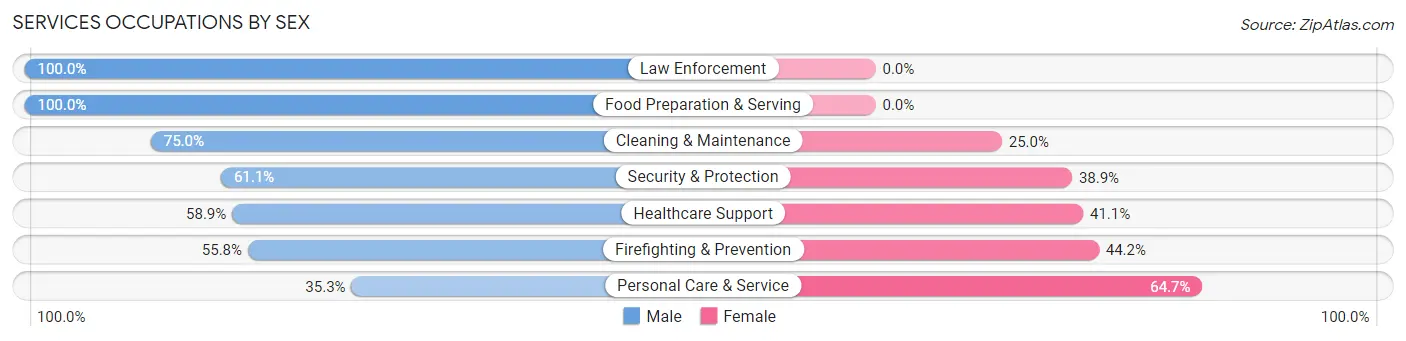
Services Occupations by Sex
Within the Services occupations in Hillview, the most male-oriented occupations are Law Enforcement (100.0%), Food Preparation & Serving (100.0%), and Cleaning & Maintenance (75.0%), while the most female-oriented occupations are Personal Care & Service (64.7%), Firefighting & Prevention (44.2%), and Healthcare Support (41.1%).
| Occupation | Male | Female |
| Healthcare Support | 76 (58.9%) | 53 (41.1%) |
| Security & Protection | 66 (61.1%) | 42 (38.9%) |
| Firefighting & Prevention | 53 (55.8%) | 42 (44.2%) |
| Law Enforcement | 13 (100.0%) | 0 (0.0%) |
| Food Preparation & Serving | 150 (100.0%) | 0 (0.0%) |
| Cleaning & Maintenance | 54 (75.0%) | 18 (25.0%) |
| Personal Care & Service | 42 (35.3%) | 77 (64.7%) |
| Total (Category) | 388 (67.1%) | 190 (32.9%) |
| Total (Overall) | 2,592 (57.5%) | 1,915 (42.5%) |
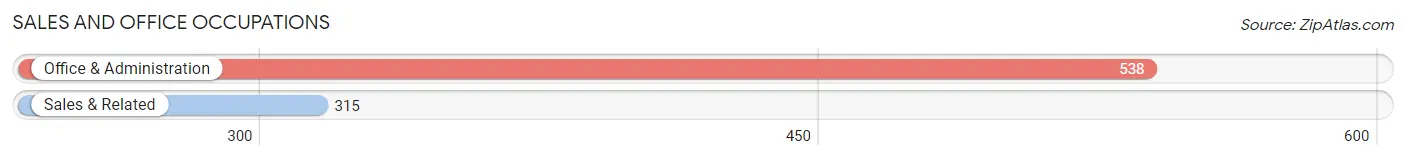
Sales and Office Occupations
The most common Sales and Office occupations in Hillview are Office & Administration (538 | 11.9%), and Sales & Related (315 | 7.0%).
Sales and Office Occupations by Sex
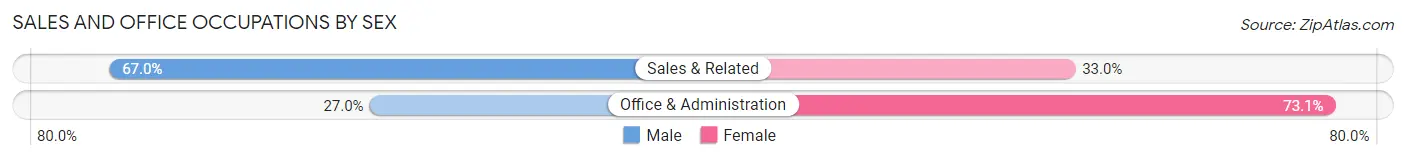
| Occupation | Male | Female |
| Sales & Related | 211 (67.0%) | 104 (33.0%) |
| Office & Administration | 145 (27.0%) | 393 (73.1%) |
| Total (Category) | 356 (41.7%) | 497 (58.3%) |
| Total (Overall) | 2,592 (57.5%) | 1,915 (42.5%) |
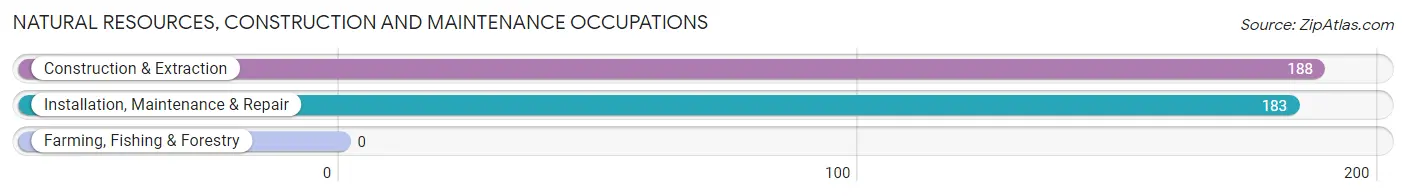
Natural Resources, Construction and Maintenance Occupations
The most common Natural Resources, Construction and Maintenance occupations in Hillview are Construction & Extraction (188 | 4.2%), and Installation, Maintenance & Repair (183 | 4.1%).
Natural Resources, Construction and Maintenance Occupations by Sex
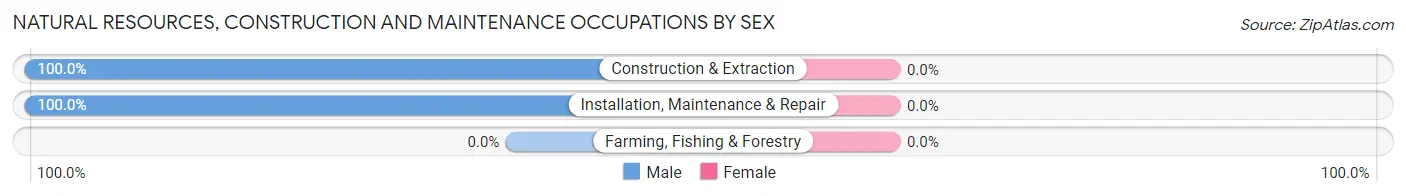
| Occupation | Male | Female |
| Farming, Fishing & Forestry | 0 (0.0%) | 0 (0.0%) |
| Construction & Extraction | 188 (100.0%) | 0 (0.0%) |
| Installation, Maintenance & Repair | 183 (100.0%) | 0 (0.0%) |
| Total (Category) | 371 (100.0%) | 0 (0.0%) |
| Total (Overall) | 2,592 (57.5%) | 1,915 (42.5%) |
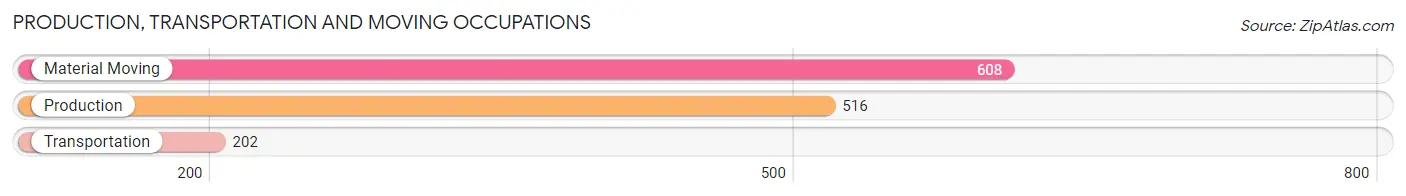
Production, Transportation and Moving Occupations
The most common Production, Transportation and Moving occupations in Hillview are Material Moving (608 | 13.5%), Production (516 | 11.5%), and Transportation (202 | 4.5%).
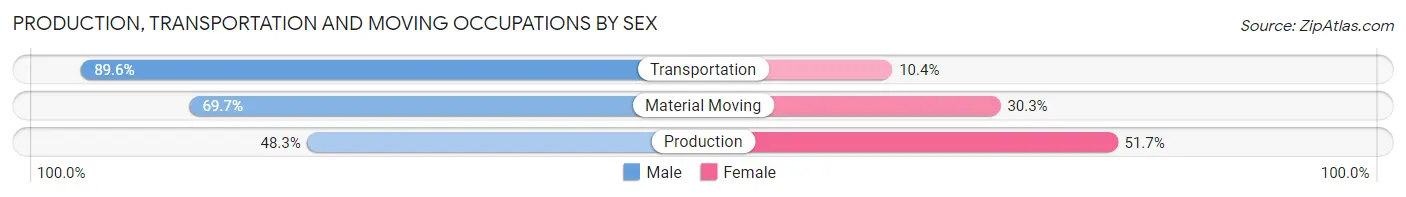
Production, Transportation and Moving Occupations by Sex
| Occupation | Male | Female |
| Production | 249 (48.3%) | 267 (51.7%) |
| Transportation | 181 (89.6%) | 21 (10.4%) |
| Material Moving | 424 (69.7%) | 184 (30.3%) |
| Total (Category) | 854 (64.4%) | 472 (35.6%) |
| Total (Overall) | 2,592 (57.5%) | 1,915 (42.5%) |
Employment Industries by Sex in Hillview
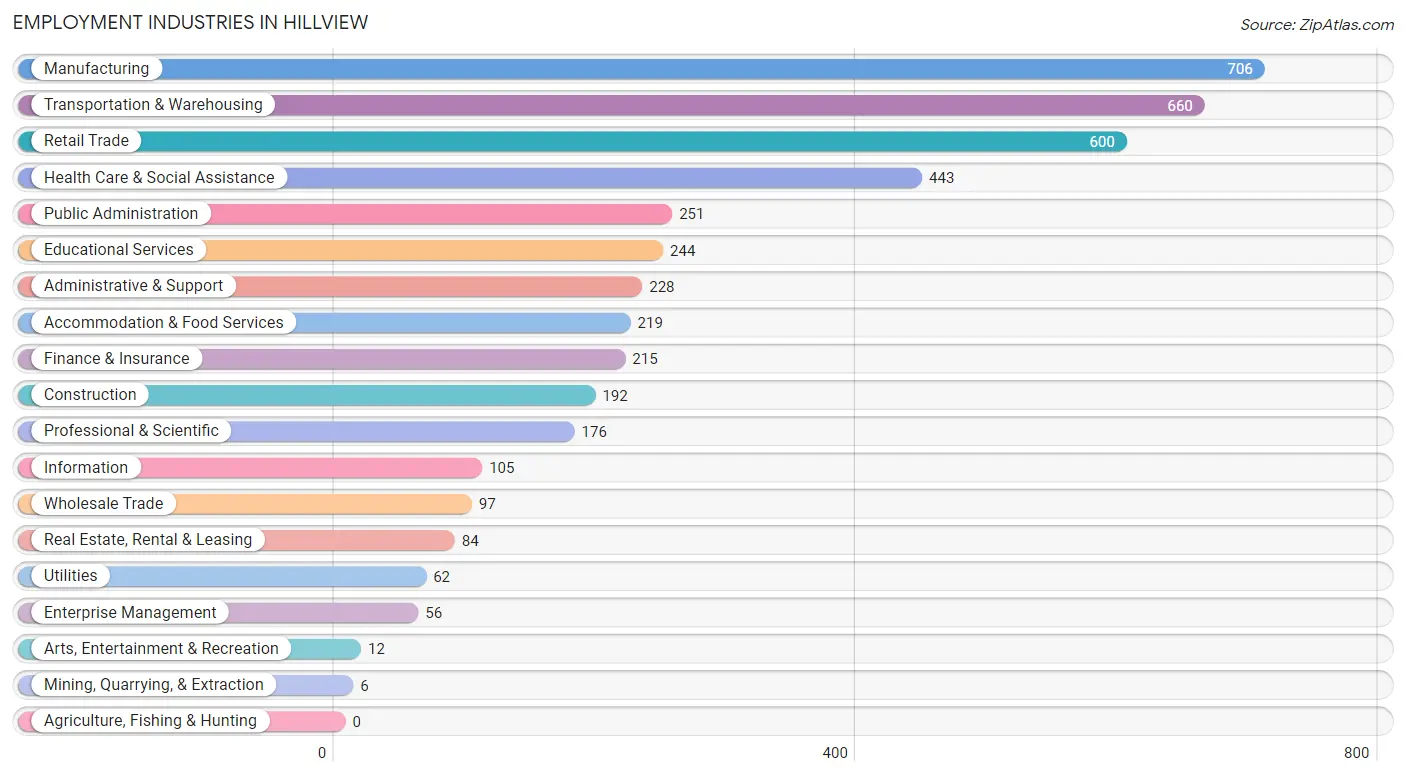
Employment Industries in Hillview
The major employment industries in Hillview include Manufacturing (706 | 15.7%), Transportation & Warehousing (660 | 14.6%), Retail Trade (600 | 13.3%), Health Care & Social Assistance (443 | 9.8%), and Public Administration (251 | 5.6%).
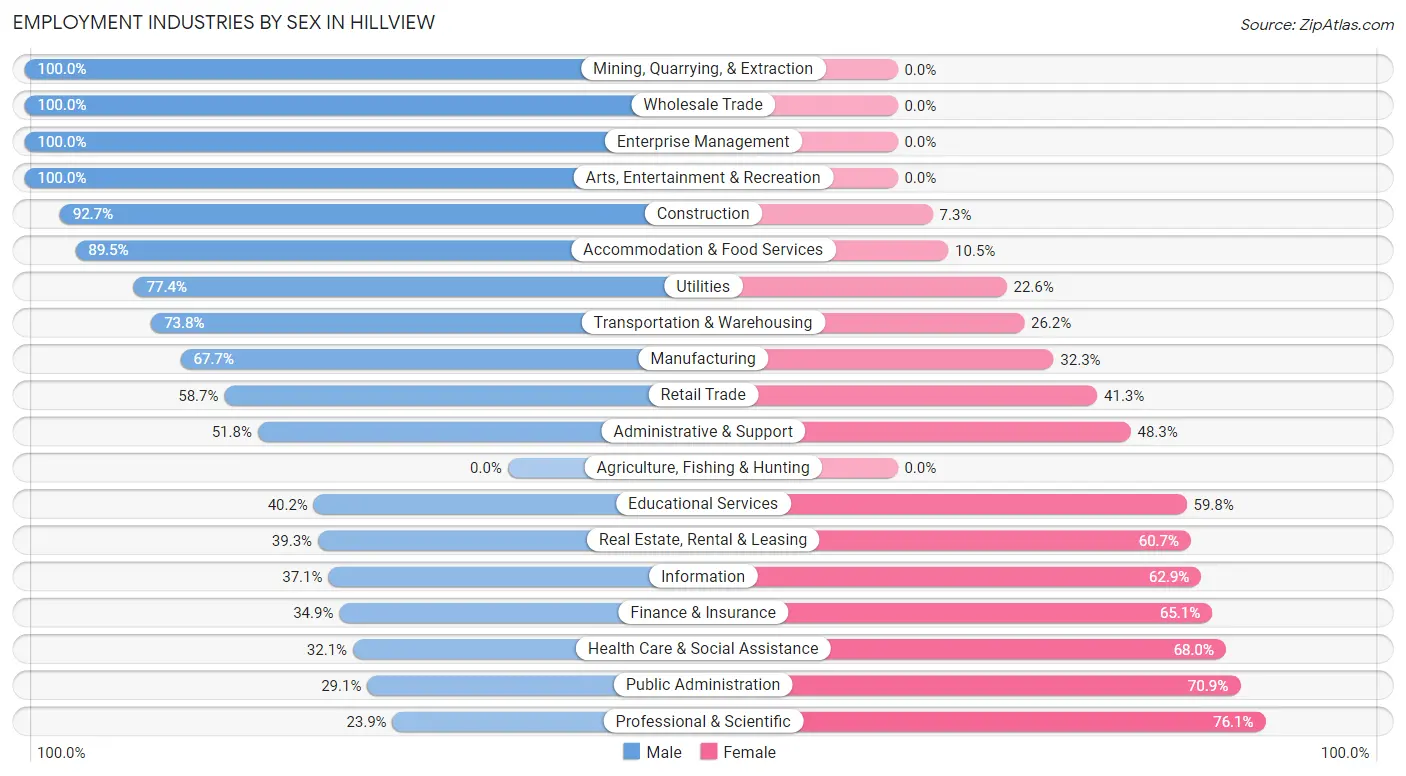
Employment Industries by Sex in Hillview
The Hillview industries that see more men than women are Mining, Quarrying, & Extraction (100.0%), Wholesale Trade (100.0%), and Enterprise Management (100.0%), whereas the industries that tend to have a higher number of women are Professional & Scientific (76.1%), Public Administration (70.9%), and Health Care & Social Assistance (67.9%).
| Industry | Male | Female |
| Agriculture, Fishing & Hunting | 0 (0.0%) | 0 (0.0%) |
| Mining, Quarrying, & Extraction | 6 (100.0%) | 0 (0.0%) |
| Construction | 178 (92.7%) | 14 (7.3%) |
| Manufacturing | 478 (67.7%) | 228 (32.3%) |
| Wholesale Trade | 97 (100.0%) | 0 (0.0%) |
| Retail Trade | 352 (58.7%) | 248 (41.3%) |
| Transportation & Warehousing | 487 (73.8%) | 173 (26.2%) |
| Utilities | 48 (77.4%) | 14 (22.6%) |
| Information | 39 (37.1%) | 66 (62.9%) |
| Finance & Insurance | 75 (34.9%) | 140 (65.1%) |
| Real Estate, Rental & Leasing | 33 (39.3%) | 51 (60.7%) |
| Professional & Scientific | 42 (23.9%) | 134 (76.1%) |
| Enterprise Management | 56 (100.0%) | 0 (0.0%) |
| Administrative & Support | 118 (51.7%) | 110 (48.2%) |
| Educational Services | 98 (40.2%) | 146 (59.8%) |
| Health Care & Social Assistance | 142 (32.1%) | 301 (67.9%) |
| Arts, Entertainment & Recreation | 12 (100.0%) | 0 (0.0%) |
| Accommodation & Food Services | 196 (89.5%) | 23 (10.5%) |
| Public Administration | 73 (29.1%) | 178 (70.9%) |
| Total | 2,592 (57.5%) | 1,915 (42.5%) |
Education in Hillview
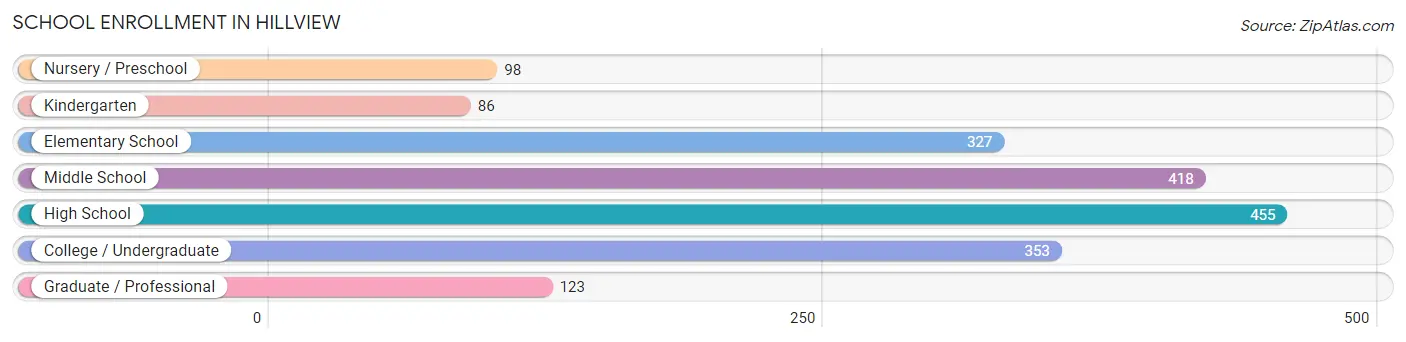
School Enrollment in Hillview
The most common levels of schooling among the 1,860 students in Hillview are high school (455 | 24.5%), middle school (418 | 22.5%), and college / undergraduate (353 | 19.0%).
| School Level | # Students | % Students |
| Nursery / Preschool | 98 | 5.3% |
| Kindergarten | 86 | 4.6% |
| Elementary School | 327 | 17.6% |
| Middle School | 418 | 22.5% |
| High School | 455 | 24.5% |
| College / Undergraduate | 353 | 19.0% |
| Graduate / Professional | 123 | 6.6% |
| Total | 1,860 | 100.0% |
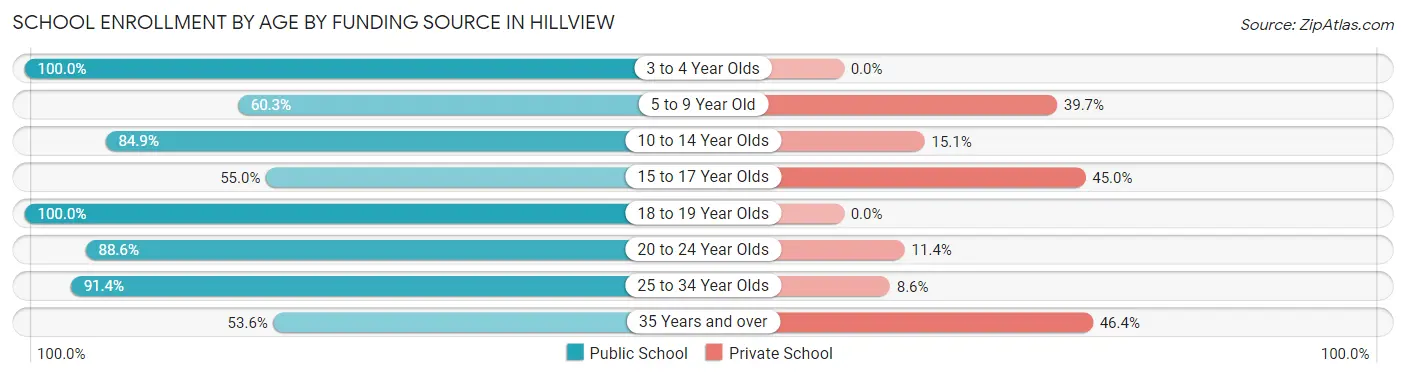
School Enrollment by Age by Funding Source in Hillview
Out of a total of 1,860 students who are enrolled in schools in Hillview, 485 (26.1%) attend a private institution, while the remaining 1,375 (73.9%) are enrolled in public schools. The age group of 35 years and over has the highest likelihood of being enrolled in private schools, with 45 (46.4% in the age bracket) enrolled. Conversely, the age group of 3 to 4 year olds has the lowest likelihood of being enrolled in a private school, with 56 (100.0% in the age bracket) attending a public institution.
| Age Bracket | Public School | Private School |
| 3 to 4 Year Olds | 56 (100.0%) | 0 (0.0%) |
| 5 to 9 Year Old | 249 (60.3%) | 164 (39.7%) |
| 10 to 14 Year Olds | 417 (84.9%) | 74 (15.1%) |
| 15 to 17 Year Olds | 215 (55.0%) | 176 (45.0%) |
| 18 to 19 Year Olds | 152 (100.0%) | 0 (0.0%) |
| 20 to 24 Year Olds | 117 (88.6%) | 15 (11.4%) |
| 25 to 34 Year Olds | 117 (91.4%) | 11 (8.6%) |
| 35 Years and over | 52 (53.6%) | 45 (46.4%) |
| Total | 1,375 (73.9%) | 485 (26.1%) |
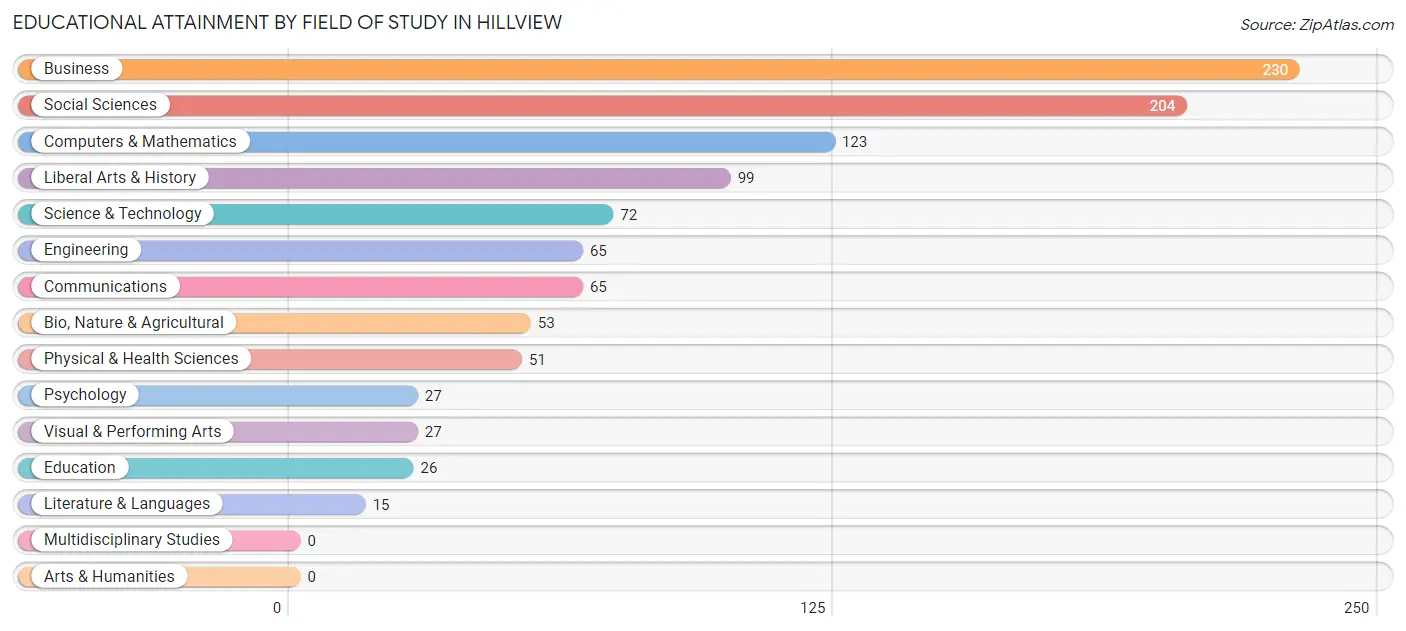
Educational Attainment by Field of Study in Hillview
Business (230 | 21.8%), social sciences (204 | 19.3%), computers & mathematics (123 | 11.6%), liberal arts & history (99 | 9.4%), and science & technology (72 | 6.8%) are the most common fields of study among 1,057 individuals in Hillview who have obtained a bachelor's degree or higher.
| Field of Study | # Graduates | % Graduates |
| Computers & Mathematics | 123 | 11.6% |
| Bio, Nature & Agricultural | 53 | 5.0% |
| Physical & Health Sciences | 51 | 4.8% |
| Psychology | 27 | 2.5% |
| Social Sciences | 204 | 19.3% |
| Engineering | 65 | 6.1% |
| Multidisciplinary Studies | 0 | 0.0% |
| Science & Technology | 72 | 6.8% |
| Business | 230 | 21.8% |
| Education | 26 | 2.5% |
| Literature & Languages | 15 | 1.4% |
| Liberal Arts & History | 99 | 9.4% |
| Visual & Performing Arts | 27 | 2.5% |
| Communications | 65 | 6.1% |
| Arts & Humanities | 0 | 0.0% |
| Total | 1,057 | 100.0% |
Transportation & Commute in Hillview
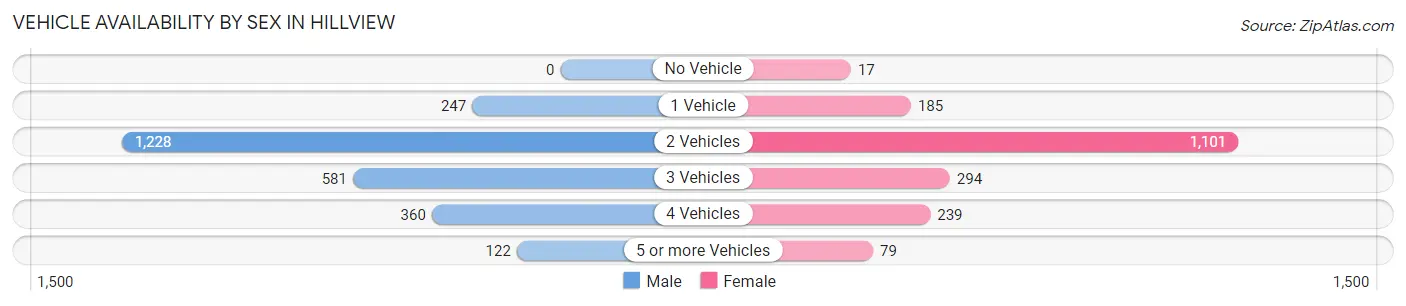
Vehicle Availability by Sex in Hillview
The most prevalent vehicle ownership categories in Hillview are males with 2 vehicles (1,228, accounting for 48.4%) and females with 2 vehicles (1,101, making up 64.1%).
| Vehicles Available | Male | Female |
| No Vehicle | 0 (0.0%) | 17 (0.9%) |
| 1 Vehicle | 247 (9.7%) | 185 (9.7%) |
| 2 Vehicles | 1,228 (48.4%) | 1,101 (57.5%) |
| 3 Vehicles | 581 (22.9%) | 294 (15.3%) |
| 4 Vehicles | 360 (14.2%) | 239 (12.5%) |
| 5 or more Vehicles | 122 (4.8%) | 79 (4.1%) |
| Total | 2,538 (100.0%) | 1,915 (100.0%) |
Commute Time in Hillview
The most frequently occuring commute durations in Hillview are 20 to 24 minutes (1,303 commuters, 31.5%), 15 to 19 minutes (758 commuters, 18.3%), and 30 to 34 minutes (696 commuters, 16.8%).
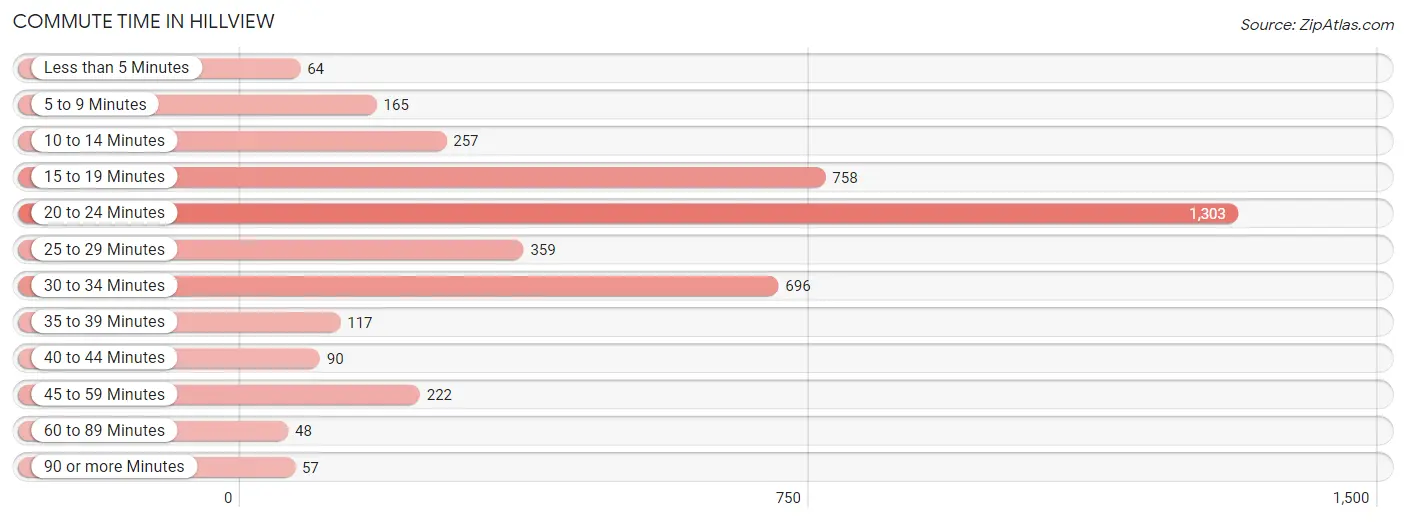
| Commute Time | # Commuters | % Commuters |
| Less than 5 Minutes | 64 | 1.5% |
| 5 to 9 Minutes | 165 | 4.0% |
| 10 to 14 Minutes | 257 | 6.2% |
| 15 to 19 Minutes | 758 | 18.3% |
| 20 to 24 Minutes | 1,303 | 31.5% |
| 25 to 29 Minutes | 359 | 8.7% |
| 30 to 34 Minutes | 696 | 16.8% |
| 35 to 39 Minutes | 117 | 2.8% |
| 40 to 44 Minutes | 90 | 2.2% |
| 45 to 59 Minutes | 222 | 5.4% |
| 60 to 89 Minutes | 48 | 1.2% |
| 90 or more Minutes | 57 | 1.4% |
Commute Time by Sex in Hillview
The most common commute times in Hillview are 20 to 24 minutes (615 commuters, 25.4%) for males and 20 to 24 minutes (688 commuters, 40.2%) for females.
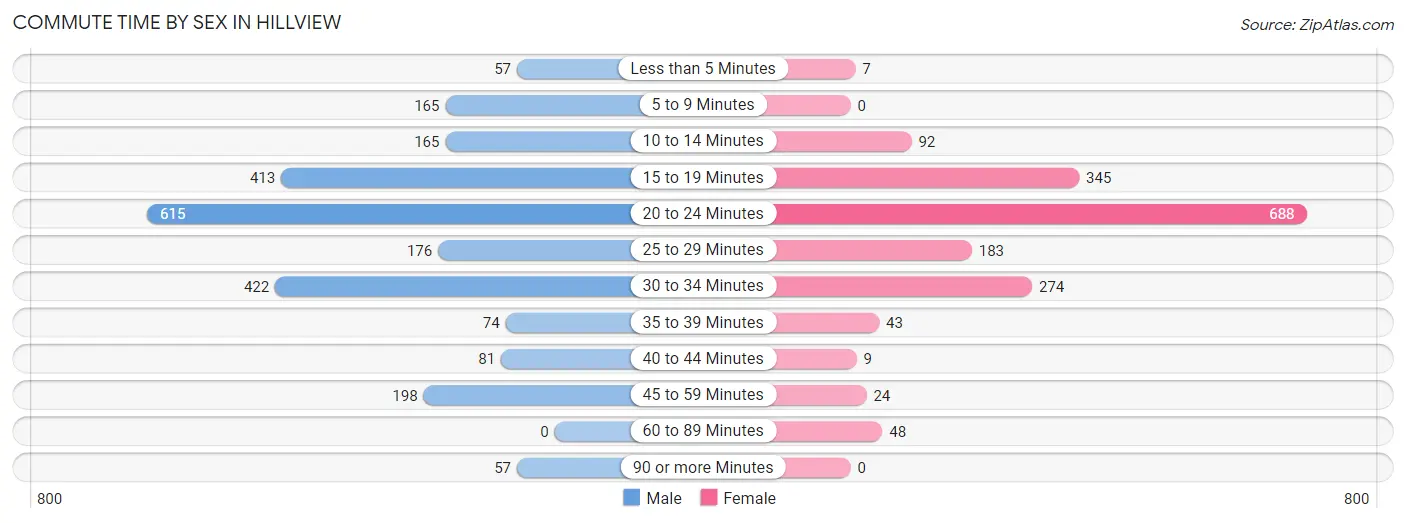
| Commute Time | Male | Female |
| Less than 5 Minutes | 57 (2.4%) | 7 (0.4%) |
| 5 to 9 Minutes | 165 (6.8%) | 0 (0.0%) |
| 10 to 14 Minutes | 165 (6.8%) | 92 (5.4%) |
| 15 to 19 Minutes | 413 (17.0%) | 345 (20.1%) |
| 20 to 24 Minutes | 615 (25.4%) | 688 (40.2%) |
| 25 to 29 Minutes | 176 (7.3%) | 183 (10.7%) |
| 30 to 34 Minutes | 422 (17.4%) | 274 (16.0%) |
| 35 to 39 Minutes | 74 (3.0%) | 43 (2.5%) |
| 40 to 44 Minutes | 81 (3.3%) | 9 (0.5%) |
| 45 to 59 Minutes | 198 (8.2%) | 24 (1.4%) |
| 60 to 89 Minutes | 0 (0.0%) | 48 (2.8%) |
| 90 or more Minutes | 57 (2.4%) | 0 (0.0%) |
Time of Departure to Work by Sex in Hillview
The most frequent times of departure to work in Hillview are 12:00 PM to 3:59 PM (378, 15.6%) for males and 6:00 AM to 6:29 AM (324, 18.9%) for females.
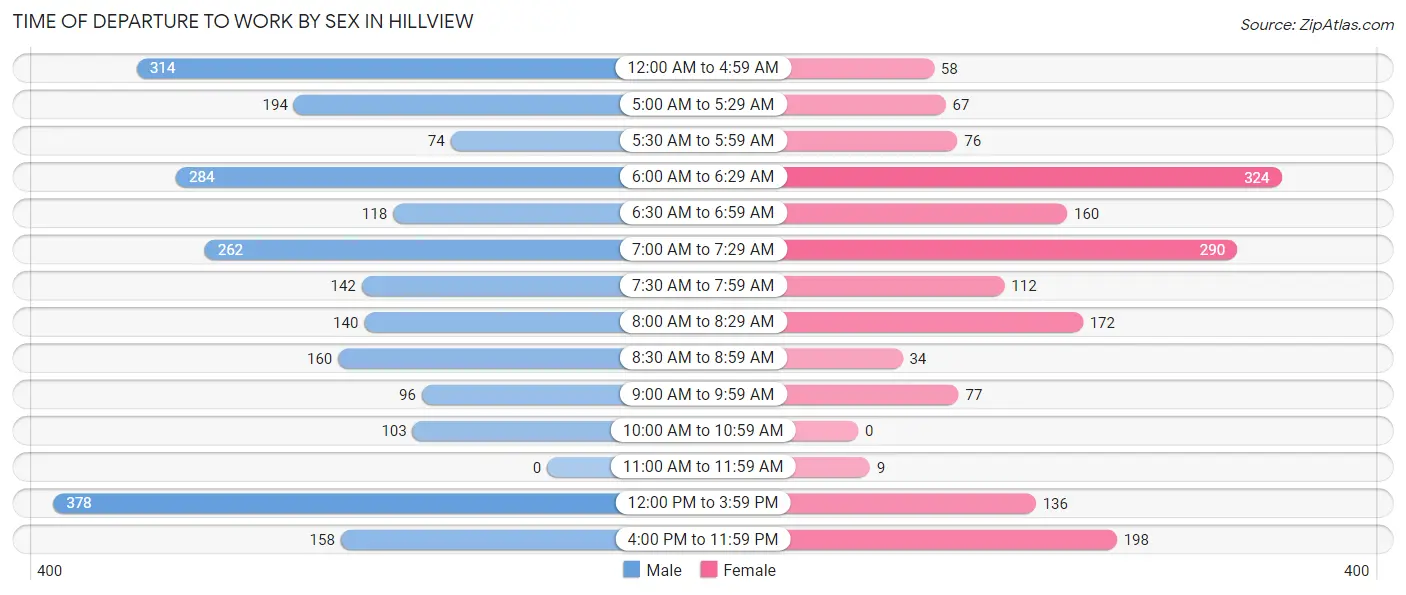
| Time of Departure | Male | Female |
| 12:00 AM to 4:59 AM | 314 (13.0%) | 58 (3.4%) |
| 5:00 AM to 5:29 AM | 194 (8.0%) | 67 (3.9%) |
| 5:30 AM to 5:59 AM | 74 (3.0%) | 76 (4.4%) |
| 6:00 AM to 6:29 AM | 284 (11.7%) | 324 (18.9%) |
| 6:30 AM to 6:59 AM | 118 (4.9%) | 160 (9.3%) |
| 7:00 AM to 7:29 AM | 262 (10.8%) | 290 (16.9%) |
| 7:30 AM to 7:59 AM | 142 (5.9%) | 112 (6.5%) |
| 8:00 AM to 8:29 AM | 140 (5.8%) | 172 (10.0%) |
| 8:30 AM to 8:59 AM | 160 (6.6%) | 34 (2.0%) |
| 9:00 AM to 9:59 AM | 96 (4.0%) | 77 (4.5%) |
| 10:00 AM to 10:59 AM | 103 (4.3%) | 0 (0.0%) |
| 11:00 AM to 11:59 AM | 0 (0.0%) | 9 (0.5%) |
| 12:00 PM to 3:59 PM | 378 (15.6%) | 136 (7.9%) |
| 4:00 PM to 11:59 PM | 158 (6.5%) | 198 (11.6%) |
| Total | 2,423 (100.0%) | 1,713 (100.0%) |
Housing Occupancy in Hillview
Occupancy by Ownership in Hillview
Of the total 3,043 dwellings in Hillview, owner-occupied units account for 2,298 (75.5%), while renter-occupied units make up 745 (24.5%).
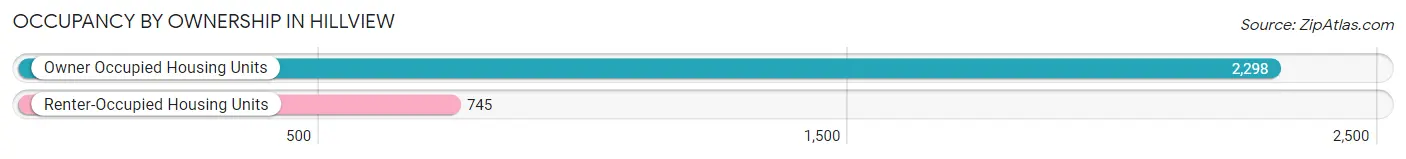
| Occupancy | # Housing Units | % Housing Units |
| Owner Occupied Housing Units | 2,298 | 75.5% |
| Renter-Occupied Housing Units | 745 | 24.5% |
| Total Occupied Housing Units | 3,043 | 100.0% |
Occupancy by Household Size in Hillview
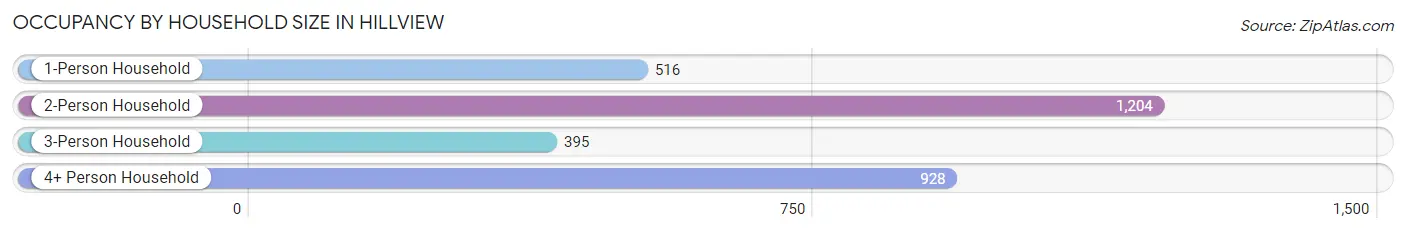
| Household Size | # Housing Units | % Housing Units |
| 1-Person Household | 516 | 17.0% |
| 2-Person Household | 1,204 | 39.6% |
| 3-Person Household | 395 | 13.0% |
| 4+ Person Household | 928 | 30.5% |
| Total Housing Units | 3,043 | 100.0% |
Occupancy by Ownership by Household Size in Hillview
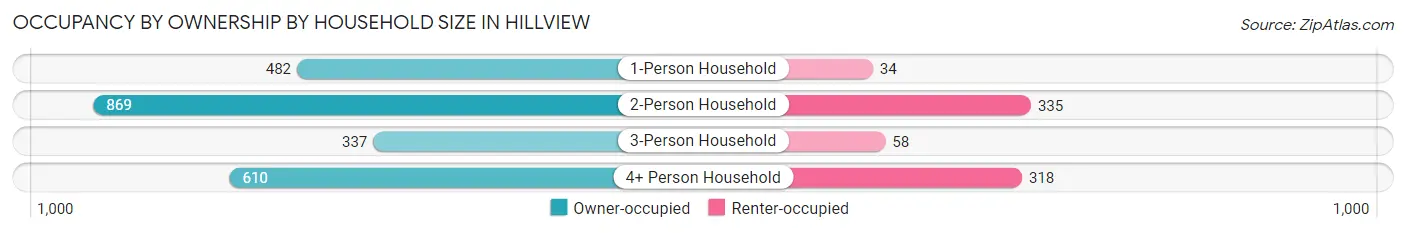
| Household Size | Owner-occupied | Renter-occupied |
| 1-Person Household | 482 (93.4%) | 34 (6.6%) |
| 2-Person Household | 869 (72.2%) | 335 (27.8%) |
| 3-Person Household | 337 (85.3%) | 58 (14.7%) |
| 4+ Person Household | 610 (65.7%) | 318 (34.3%) |
| Total Housing Units | 2,298 (75.5%) | 745 (24.5%) |
Occupancy by Educational Attainment in Hillview
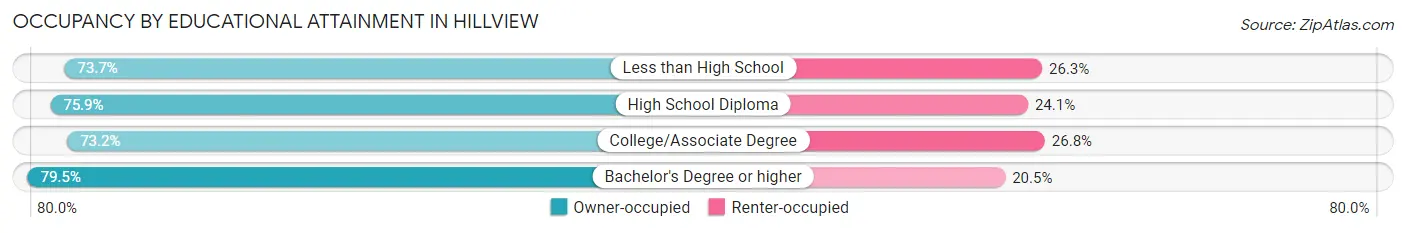
| Household Size | Owner-occupied | Renter-occupied |
| Less than High School | 252 (73.7%) | 90 (26.3%) |
| High School Diploma | 870 (75.9%) | 276 (24.1%) |
| College/Associate Degree | 706 (73.2%) | 258 (26.8%) |
| Bachelor's Degree or higher | 470 (79.5%) | 121 (20.5%) |
Occupancy by Age of Householder in Hillview
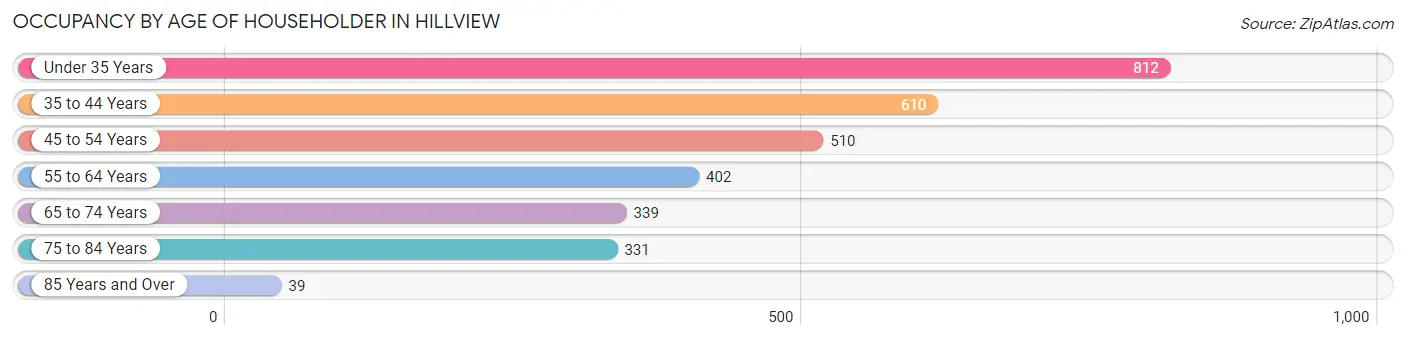
| Age Bracket | # Households | % Households |
| Under 35 Years | 812 | 26.7% |
| 35 to 44 Years | 610 | 20.1% |
| 45 to 54 Years | 510 | 16.8% |
| 55 to 64 Years | 402 | 13.2% |
| 65 to 74 Years | 339 | 11.1% |
| 75 to 84 Years | 331 | 10.9% |
| 85 Years and Over | 39 | 1.3% |
| Total | 3,043 | 100.0% |
Housing Finances in Hillview
Median Income by Occupancy in Hillview
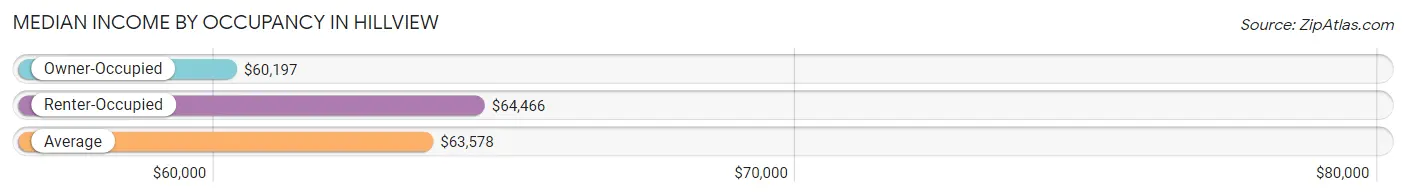
| Occupancy Type | # Households | Median Income |
| Owner-Occupied | 2,298 (75.5%) | $60,197 |
| Renter-Occupied | 745 (24.5%) | $64,466 |
| Average | 3,043 (100.0%) | $63,578 |
Occupancy by Householder Income Bracket in Hillview
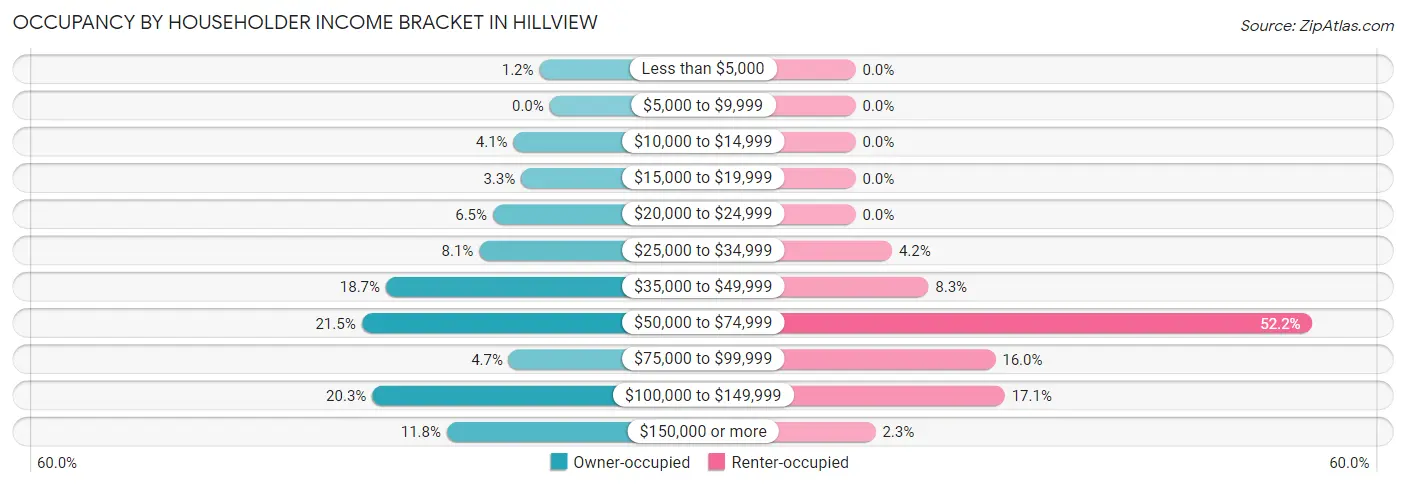
| Income Bracket | Owner-occupied | Renter-occupied |
| Less than $5,000 | 27 (1.2%) | 0 (0.0%) |
| $5,000 to $9,999 | 0 (0.0%) | 0 (0.0%) |
| $10,000 to $14,999 | 95 (4.1%) | 0 (0.0%) |
| $15,000 to $19,999 | 75 (3.3%) | 0 (0.0%) |
| $20,000 to $24,999 | 149 (6.5%) | 0 (0.0%) |
| $25,000 to $34,999 | 185 (8.1%) | 31 (4.2%) |
| $35,000 to $49,999 | 430 (18.7%) | 62 (8.3%) |
| $50,000 to $74,999 | 494 (21.5%) | 389 (52.2%) |
| $75,000 to $99,999 | 107 (4.7%) | 119 (16.0%) |
| $100,000 to $149,999 | 466 (20.3%) | 127 (17.1%) |
| $150,000 or more | 270 (11.7%) | 17 (2.3%) |
| Total | 2,298 (100.0%) | 745 (100.0%) |
Monthly Housing Cost Tiers in Hillview
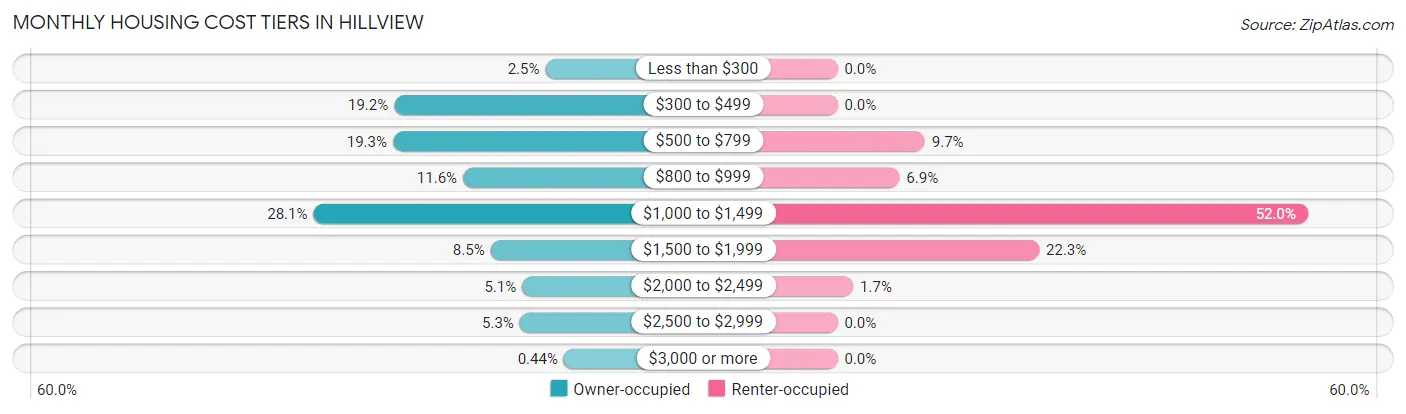
| Monthly Cost | Owner-occupied | Renter-occupied |
| Less than $300 | 57 (2.5%) | 0 (0.0%) |
| $300 to $499 | 441 (19.2%) | 0 (0.0%) |
| $500 to $799 | 444 (19.3%) | 72 (9.7%) |
| $800 to $999 | 266 (11.6%) | 51 (6.9%) |
| $1,000 to $1,499 | 646 (28.1%) | 387 (51.9%) |
| $1,500 to $1,999 | 196 (8.5%) | 166 (22.3%) |
| $2,000 to $2,499 | 116 (5.1%) | 13 (1.7%) |
| $2,500 to $2,999 | 122 (5.3%) | 0 (0.0%) |
| $3,000 or more | 10 (0.4%) | 0 (0.0%) |
| Total | 2,298 (100.0%) | 745 (100.0%) |
Physical Housing Characteristics in Hillview
Housing Structures in Hillview
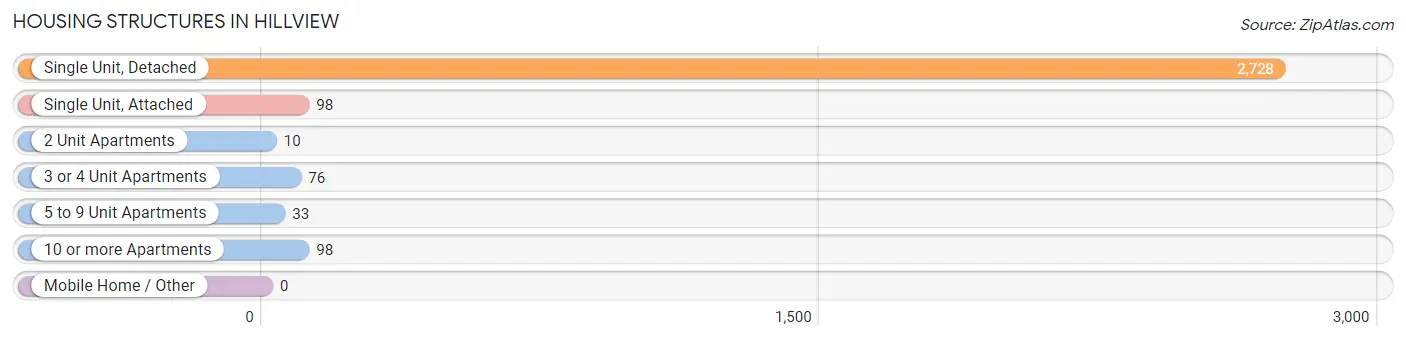
| Structure Type | # Housing Units | % Housing Units |
| Single Unit, Detached | 2,728 | 89.6% |
| Single Unit, Attached | 98 | 3.2% |
| 2 Unit Apartments | 10 | 0.3% |
| 3 or 4 Unit Apartments | 76 | 2.5% |
| 5 to 9 Unit Apartments | 33 | 1.1% |
| 10 or more Apartments | 98 | 3.2% |
| Mobile Home / Other | 0 | 0.0% |
| Total | 3,043 | 100.0% |
Housing Structures by Occupancy in Hillview
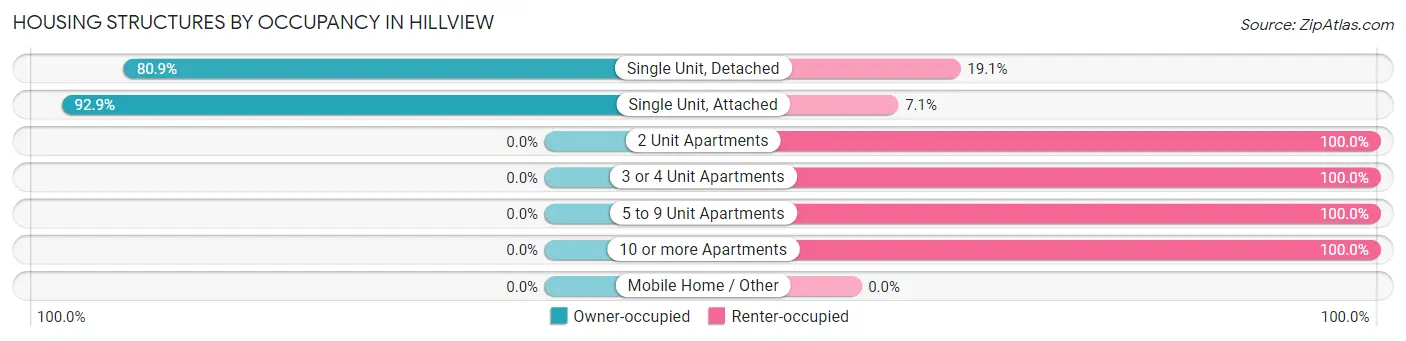
| Structure Type | Owner-occupied | Renter-occupied |
| Single Unit, Detached | 2,207 (80.9%) | 521 (19.1%) |
| Single Unit, Attached | 91 (92.9%) | 7 (7.1%) |
| 2 Unit Apartments | 0 (0.0%) | 10 (100.0%) |
| 3 or 4 Unit Apartments | 0 (0.0%) | 76 (100.0%) |
| 5 to 9 Unit Apartments | 0 (0.0%) | 33 (100.0%) |
| 10 or more Apartments | 0 (0.0%) | 98 (100.0%) |
| Mobile Home / Other | 0 (0.0%) | 0 (0.0%) |
| Total | 2,298 (75.5%) | 745 (24.5%) |
Housing Structures by Number of Rooms in Hillview
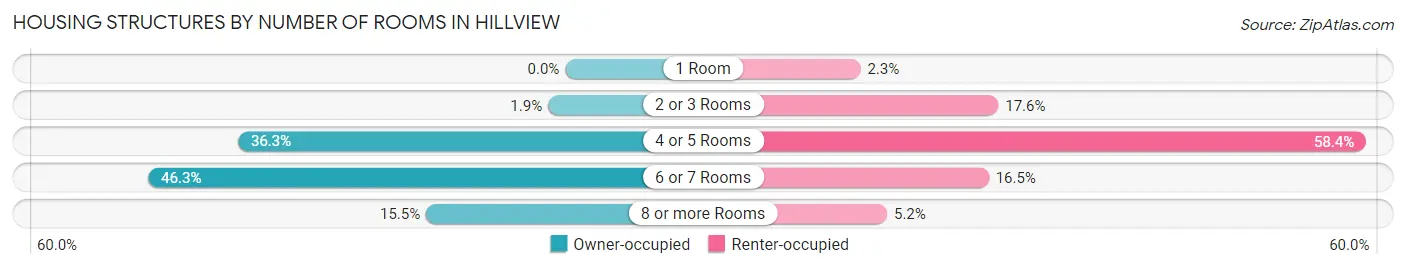
| Number of Rooms | Owner-occupied | Renter-occupied |
| 1 Room | 0 (0.0%) | 17 (2.3%) |
| 2 or 3 Rooms | 44 (1.9%) | 131 (17.6%) |
| 4 or 5 Rooms | 835 (36.3%) | 435 (58.4%) |
| 6 or 7 Rooms | 1,064 (46.3%) | 123 (16.5%) |
| 8 or more Rooms | 355 (15.4%) | 39 (5.2%) |
| Total | 2,298 (100.0%) | 745 (100.0%) |
Housing Structure by Heating Type in Hillview
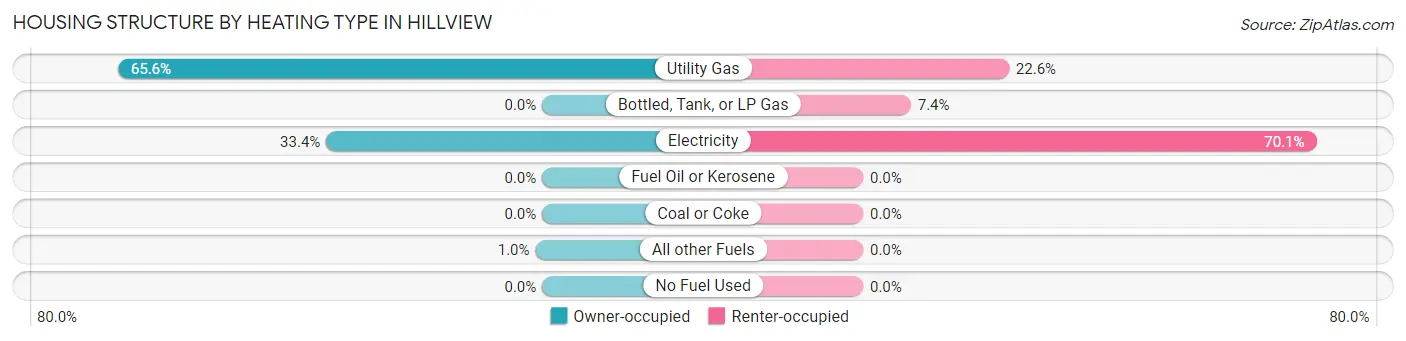
| Heating Type | Owner-occupied | Renter-occupied |
| Utility Gas | 1,507 (65.6%) | 168 (22.6%) |
| Bottled, Tank, or LP Gas | 0 (0.0%) | 55 (7.4%) |
| Electricity | 767 (33.4%) | 522 (70.1%) |
| Fuel Oil or Kerosene | 0 (0.0%) | 0 (0.0%) |
| Coal or Coke | 0 (0.0%) | 0 (0.0%) |
| All other Fuels | 24 (1.0%) | 0 (0.0%) |
| No Fuel Used | 0 (0.0%) | 0 (0.0%) |
| Total | 2,298 (100.0%) | 745 (100.0%) |
Household Vehicle Usage in Hillview
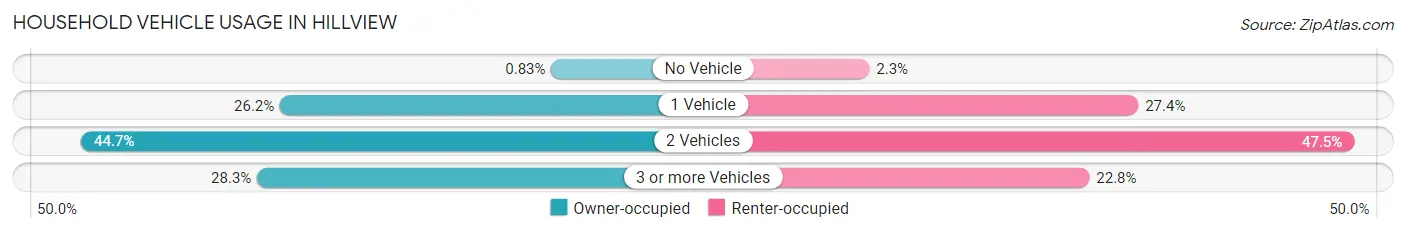
| Vehicles per Household | Owner-occupied | Renter-occupied |
| No Vehicle | 19 (0.8%) | 17 (2.3%) |
| 1 Vehicle | 601 (26.2%) | 204 (27.4%) |
| 2 Vehicles | 1,028 (44.7%) | 354 (47.5%) |
| 3 or more Vehicles | 650 (28.3%) | 170 (22.8%) |
| Total | 2,298 (100.0%) | 745 (100.0%) |
Real Estate & Mortgages in Hillview
Real Estate and Mortgage Overview in Hillview
| Characteristic | Without Mortgage | With Mortgage |
| Housing Units | 753 | 1,545 |
| Median Property Value | $153,400 | $169,700 |
| Median Household Income | $39,192 | $270 |
| Monthly Housing Costs | $466 | $10 |
| Real Estate Taxes | $1,133 | $20 |
Property Value by Mortgage Status in Hillview
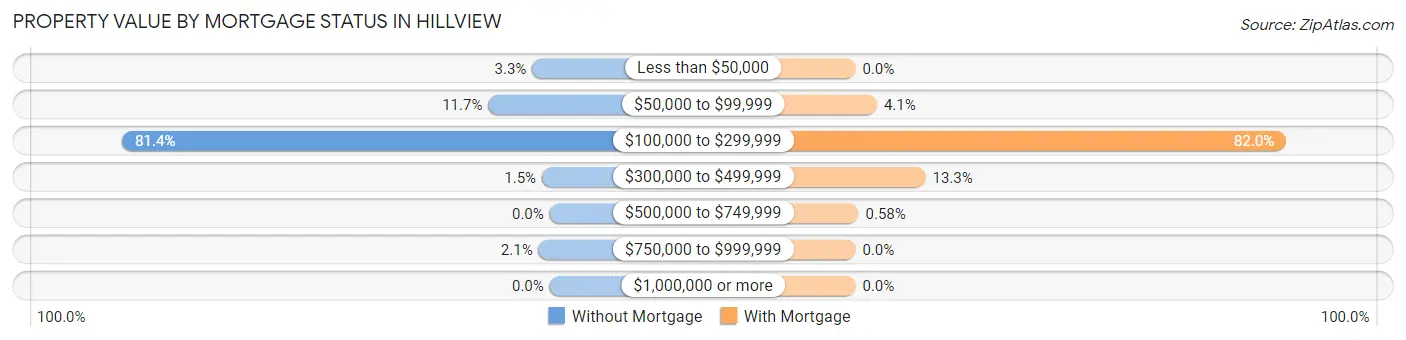
| Property Value | Without Mortgage | With Mortgage |
| Less than $50,000 | 25 (3.3%) | 0 (0.0%) |
| $50,000 to $99,999 | 88 (11.7%) | 63 (4.1%) |
| $100,000 to $299,999 | 613 (81.4%) | 1,267 (82.0%) |
| $300,000 to $499,999 | 11 (1.5%) | 206 (13.3%) |
| $500,000 to $749,999 | 0 (0.0%) | 9 (0.6%) |
| $750,000 to $999,999 | 16 (2.1%) | 0 (0.0%) |
| $1,000,000 or more | 0 (0.0%) | 0 (0.0%) |
| Total | 753 (100.0%) | 1,545 (100.0%) |
Household Income by Mortgage Status in Hillview
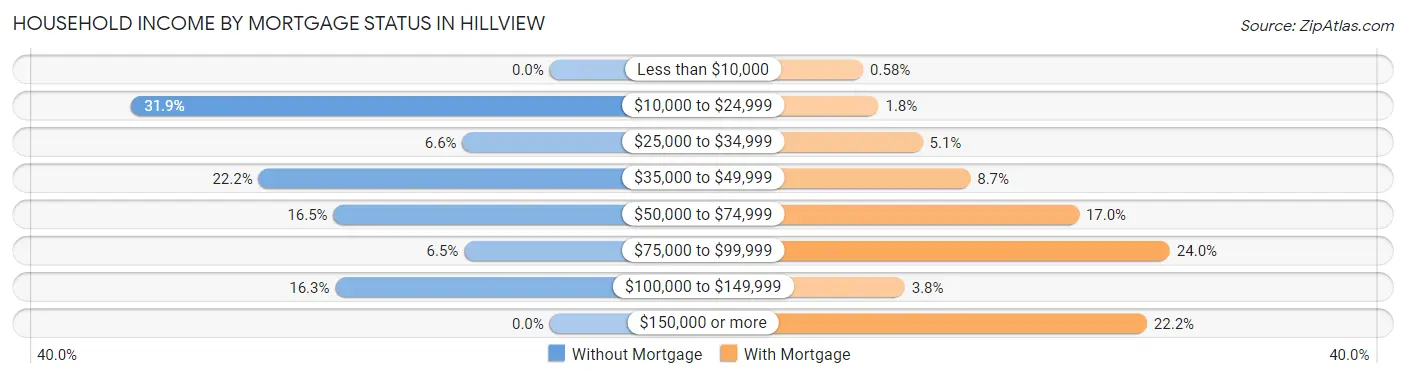
| Household Income | Without Mortgage | With Mortgage |
| Less than $10,000 | 0 (0.0%) | 9 (0.6%) |
| $10,000 to $24,999 | 240 (31.9%) | 27 (1.8%) |
| $25,000 to $34,999 | 50 (6.6%) | 79 (5.1%) |
| $35,000 to $49,999 | 167 (22.2%) | 135 (8.7%) |
| $50,000 to $74,999 | 124 (16.5%) | 263 (17.0%) |
| $75,000 to $99,999 | 49 (6.5%) | 370 (23.9%) |
| $100,000 to $149,999 | 123 (16.3%) | 58 (3.7%) |
| $150,000 or more | 0 (0.0%) | 343 (22.2%) |
| Total | 753 (100.0%) | 1,545 (100.0%) |
Property Value to Household Income Ratio in Hillview
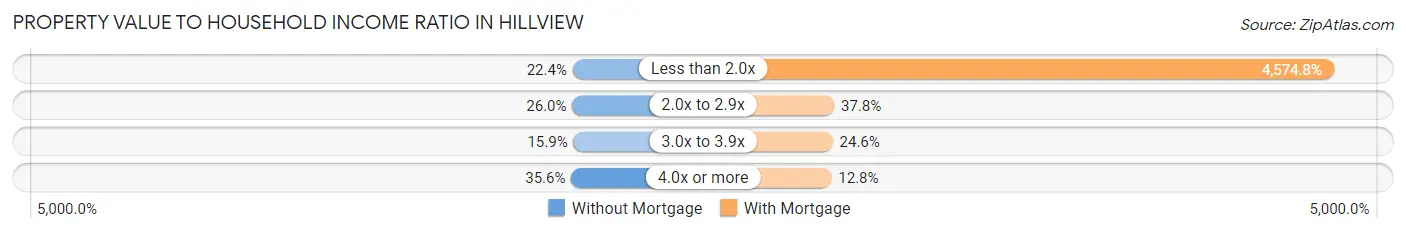
| Value-to-Income Ratio | Without Mortgage | With Mortgage |
| Less than 2.0x | 169 (22.4%) | 70,680 (4,574.8%) |
| 2.0x to 2.9x | 196 (26.0%) | 584 (37.8%) |
| 3.0x to 3.9x | 120 (15.9%) | 380 (24.6%) |
| 4.0x or more | 268 (35.6%) | 198 (12.8%) |
| Total | 753 (100.0%) | 1,545 (100.0%) |
Real Estate Taxes by Mortgage Status in Hillview
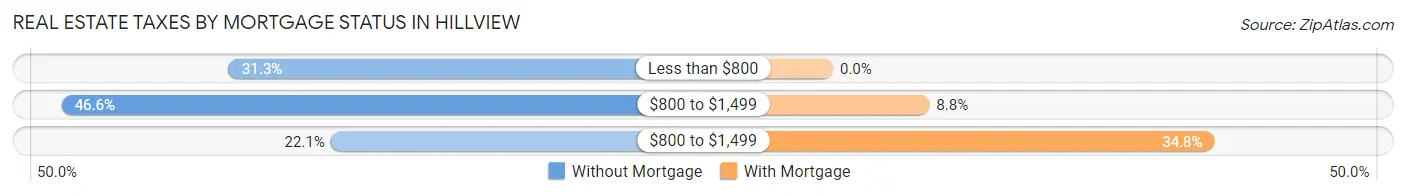
| Property Taxes | Without Mortgage | With Mortgage |
| Less than $800 | 236 (31.3%) | 0 (0.0%) |
| $800 to $1,499 | 351 (46.6%) | 136 (8.8%) |
| $800 to $1,499 | 166 (22.1%) | 538 (34.8%) |
| Total | 753 (100.0%) | 1,545 (100.0%) |
Health & Disability in Hillview
Health Insurance Coverage by Age in Hillview
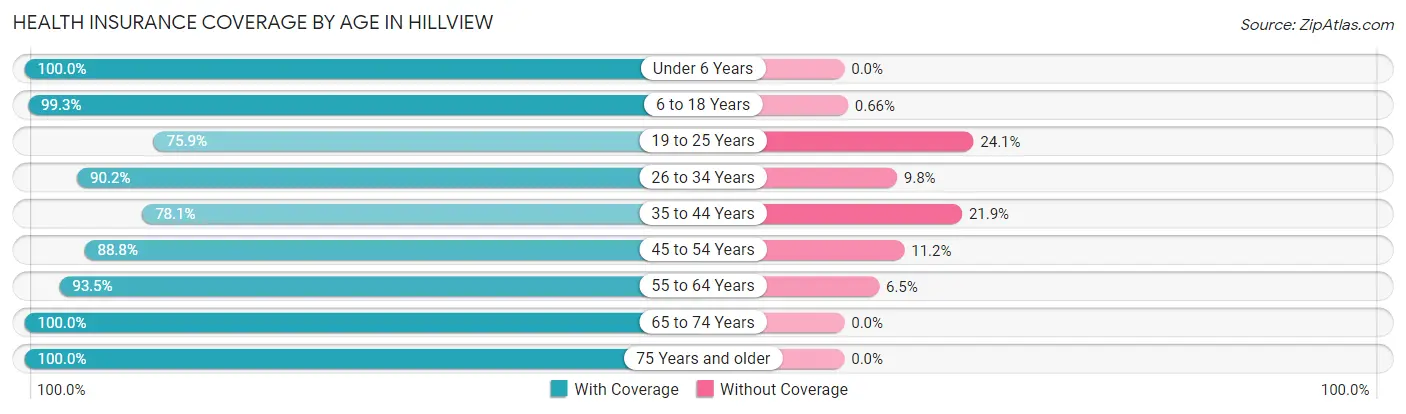
| Age Bracket | With Coverage | Without Coverage |
| Under 6 Years | 479 (100.0%) | 0 (0.0%) |
| 6 to 18 Years | 1,361 (99.3%) | 9 (0.7%) |
| 19 to 25 Years | 634 (75.9%) | 201 (24.1%) |
| 26 to 34 Years | 1,417 (90.2%) | 154 (9.8%) |
| 35 to 44 Years | 1,028 (78.1%) | 289 (21.9%) |
| 45 to 54 Years | 1,095 (88.8%) | 138 (11.2%) |
| 55 to 64 Years | 751 (93.5%) | 52 (6.5%) |
| 65 to 74 Years | 557 (100.0%) | 0 (0.0%) |
| 75 Years and older | 501 (100.0%) | 0 (0.0%) |
| Total | 7,823 (90.3%) | 843 (9.7%) |
Health Insurance Coverage by Citizenship Status in Hillview
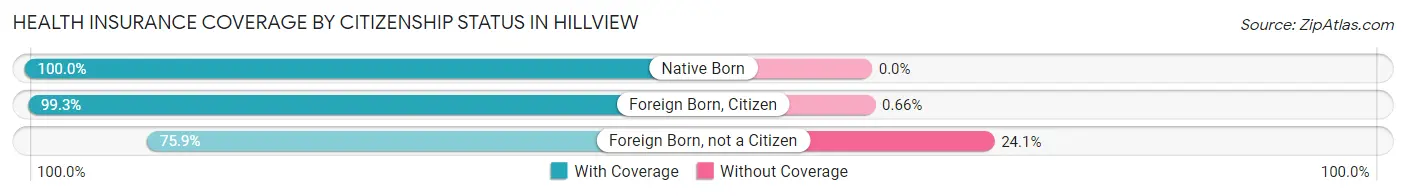
| Citizenship Status | With Coverage | Without Coverage |
| Native Born | 479 (100.0%) | 0 (0.0%) |
| Foreign Born, Citizen | 1,361 (99.3%) | 9 (0.7%) |
| Foreign Born, not a Citizen | 634 (75.9%) | 201 (24.1%) |
Health Insurance Coverage by Household Income in Hillview
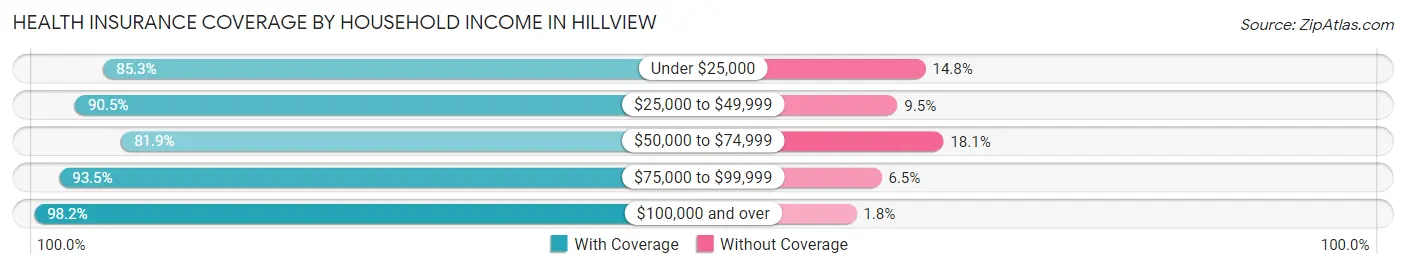
| Household Income | With Coverage | Without Coverage |
| Under $25,000 | 601 (85.3%) | 104 (14.7%) |
| $25,000 to $49,999 | 1,346 (90.5%) | 141 (9.5%) |
| $50,000 to $74,999 | 2,252 (81.9%) | 498 (18.1%) |
| $75,000 to $99,999 | 646 (93.5%) | 45 (6.5%) |
| $100,000 and over | 2,978 (98.2%) | 55 (1.8%) |
Public vs Private Health Insurance Coverage by Age in Hillview
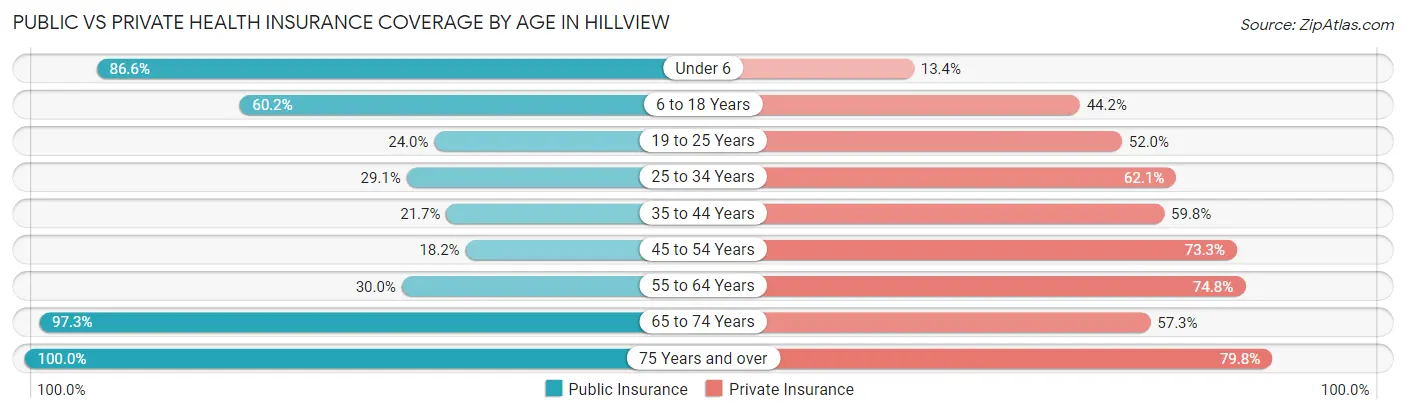
| Age Bracket | Public Insurance | Private Insurance |
| Under 6 | 415 (86.6%) | 64 (13.4%) |
| 6 to 18 Years | 824 (60.2%) | 605 (44.2%) |
| 19 to 25 Years | 200 (23.9%) | 434 (52.0%) |
| 25 to 34 Years | 457 (29.1%) | 975 (62.1%) |
| 35 to 44 Years | 286 (21.7%) | 788 (59.8%) |
| 45 to 54 Years | 224 (18.2%) | 904 (73.3%) |
| 55 to 64 Years | 241 (30.0%) | 601 (74.8%) |
| 65 to 74 Years | 542 (97.3%) | 319 (57.3%) |
| 75 Years and over | 501 (100.0%) | 400 (79.8%) |
| Total | 3,690 (42.6%) | 5,090 (58.7%) |
Disability Status by Sex by Age in Hillview
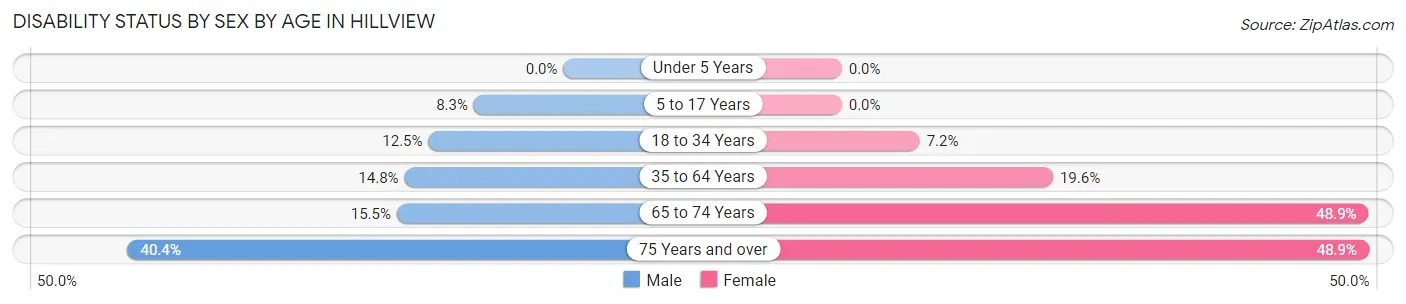
| Age Bracket | Male | Female |
| Under 5 Years | 0 (0.0%) | 0 (0.0%) |
| 5 to 17 Years | 64 (8.3%) | 0 (0.0%) |
| 18 to 34 Years | 179 (12.5%) | 81 (7.2%) |
| 35 to 64 Years | 241 (14.7%) | 337 (19.6%) |
| 65 to 74 Years | 45 (15.5%) | 130 (48.9%) |
| 75 Years and over | 91 (40.4%) | 135 (48.9%) |
Disability Class by Sex by Age in Hillview
Disability Class: Hearing Difficulty
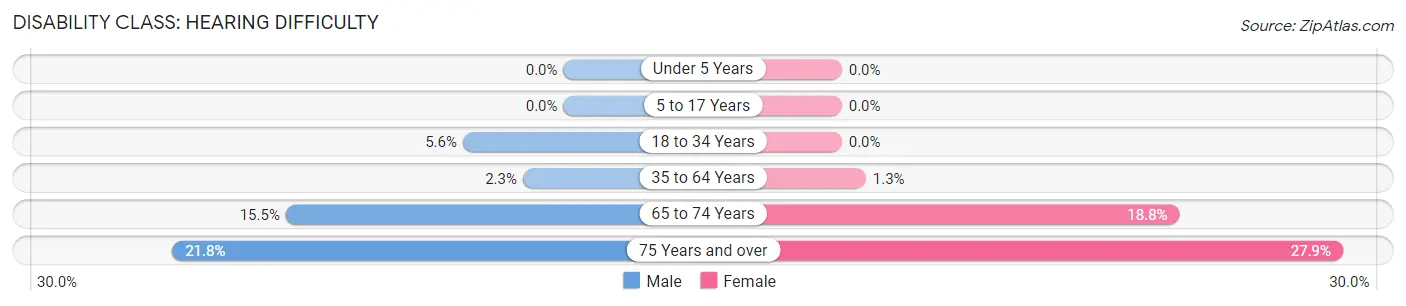
| Age Bracket | Male | Female |
| Under 5 Years | 0 (0.0%) | 0 (0.0%) |
| 5 to 17 Years | 0 (0.0%) | 0 (0.0%) |
| 18 to 34 Years | 80 (5.6%) | 0 (0.0%) |
| 35 to 64 Years | 37 (2.3%) | 23 (1.3%) |
| 65 to 74 Years | 45 (15.5%) | 50 (18.8%) |
| 75 Years and over | 49 (21.8%) | 77 (27.9%) |
Disability Class: Vision Difficulty
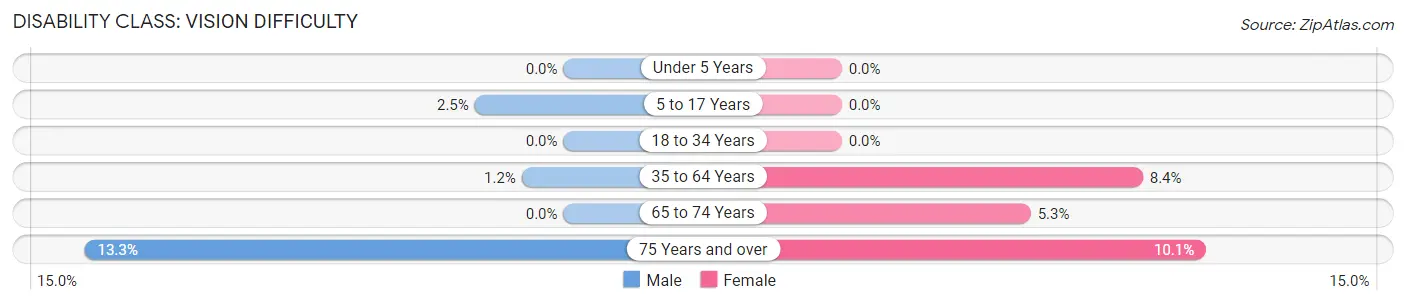
| Age Bracket | Male | Female |
| Under 5 Years | 0 (0.0%) | 0 (0.0%) |
| 5 to 17 Years | 19 (2.5%) | 0 (0.0%) |
| 18 to 34 Years | 0 (0.0%) | 0 (0.0%) |
| 35 to 64 Years | 19 (1.2%) | 144 (8.4%) |
| 65 to 74 Years | 0 (0.0%) | 14 (5.3%) |
| 75 Years and over | 30 (13.3%) | 28 (10.1%) |
Disability Class: Cognitive Difficulty
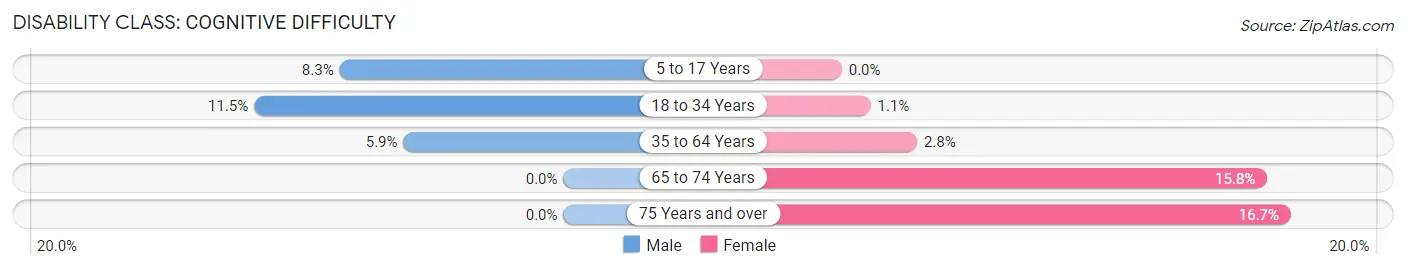
| Age Bracket | Male | Female |
| 5 to 17 Years | 64 (8.3%) | 0 (0.0%) |
| 18 to 34 Years | 164 (11.5%) | 12 (1.1%) |
| 35 to 64 Years | 97 (5.9%) | 48 (2.8%) |
| 65 to 74 Years | 0 (0.0%) | 42 (15.8%) |
| 75 Years and over | 0 (0.0%) | 46 (16.7%) |
Disability Class: Ambulatory Difficulty
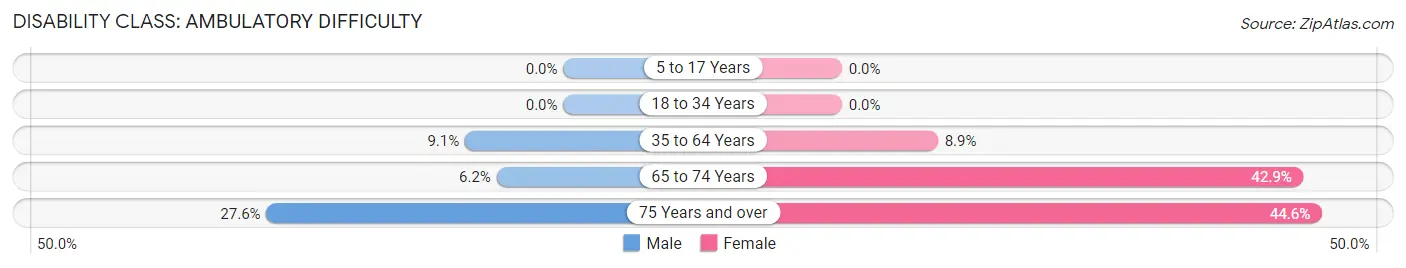
| Age Bracket | Male | Female |
| 5 to 17 Years | 0 (0.0%) | 0 (0.0%) |
| 18 to 34 Years | 0 (0.0%) | 0 (0.0%) |
| 35 to 64 Years | 149 (9.1%) | 153 (8.9%) |
| 65 to 74 Years | 18 (6.2%) | 114 (42.9%) |
| 75 Years and over | 62 (27.6%) | 123 (44.6%) |
Disability Class: Self-Care Difficulty
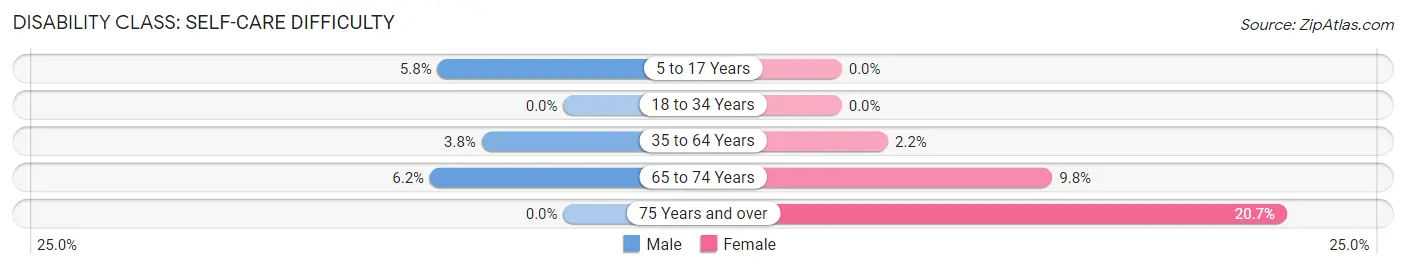
| Age Bracket | Male | Female |
| 5 to 17 Years | 45 (5.8%) | 0 (0.0%) |
| 18 to 34 Years | 0 (0.0%) | 0 (0.0%) |
| 35 to 64 Years | 62 (3.8%) | 37 (2.1%) |
| 65 to 74 Years | 18 (6.2%) | 26 (9.8%) |
| 75 Years and over | 0 (0.0%) | 57 (20.6%) |
Technology Access in Hillview
Computing Device Access in Hillview
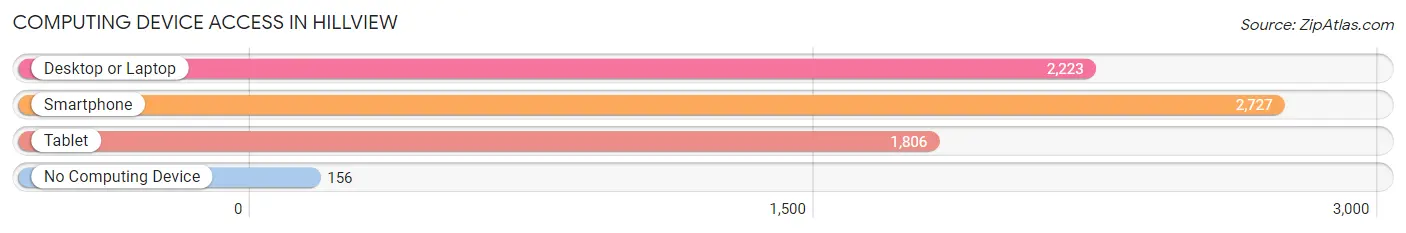
| Device Type | # Households | % Households |
| Desktop or Laptop | 2,223 | 73.1% |
| Smartphone | 2,727 | 89.6% |
| Tablet | 1,806 | 59.4% |
| No Computing Device | 156 | 5.1% |
| Total | 3,043 | 100.0% |
Internet Access in Hillview
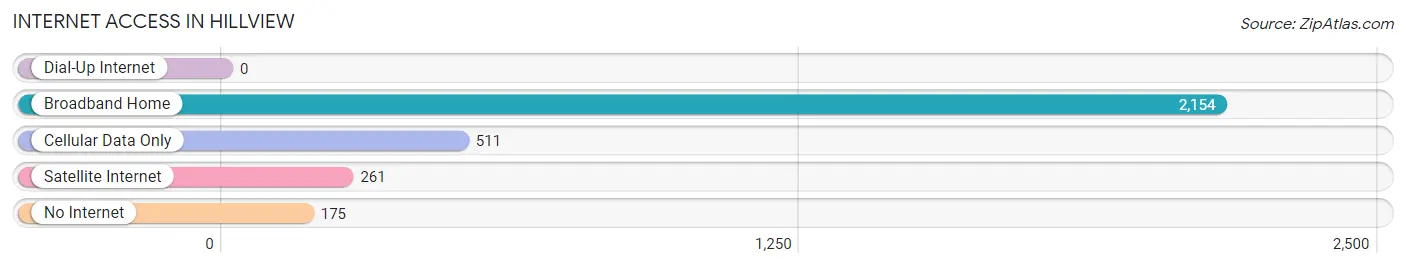
| Internet Type | # Households | % Households |
| Dial-Up Internet | 0 | 0.0% |
| Broadband Home | 2,154 | 70.8% |
| Cellular Data Only | 511 | 16.8% |
| Satellite Internet | 261 | 8.6% |
| No Internet | 175 | 5.8% |
| Total | 3,043 | 100.0% |
Hillview Summary
Hillview, Kentucky is a small city located in Bullitt County, Kentucky. It is situated about 20 miles south of Louisville and is part of the Louisville metropolitan area. The city has a population of approximately 8,000 people and is known for its rural charm and small-town atmosphere.
History
The area that is now Hillview was first settled in the early 1800s by a group of German immigrants. The town was originally known as “Hillsborough” and was later changed to “Hillview” in 1883. The town was officially incorporated in 1891.
In the early 1900s, Hillview was a thriving agricultural community. The town was home to several farms, a general store, a post office, and a school. The town also had a train station, which allowed for easy access to Louisville and other nearby cities.
In the 1950s, Hillview began to experience a population boom as people moved to the area from other parts of the state. This growth was largely due to the construction of the Hillview-Bullitt County Airport, which opened in 1954. The airport was a major economic driver for the area and helped to spur further growth.
Geography
Hillview is located in Bullitt County, Kentucky. The city is situated in the rolling hills of the Bluegrass region of the state. The city is located about 20 miles south of Louisville and is part of the Louisville metropolitan area.
The city has a total area of 4.2 square miles, all of which is land. The city is located at an elevation of 845 feet above sea level. The climate in Hillview is classified as humid subtropical, with hot, humid summers and mild winters.
Economy
The economy of Hillview is largely based on agriculture and manufacturing. The city is home to several farms, as well as a number of manufacturing plants. The city is also home to the Hillview-Bullitt County Airport, which is a major economic driver for the area.
The city is also home to several retail stores, restaurants, and other businesses. The city is also home to a number of small businesses, such as auto repair shops, beauty salons, and other services.
Demographics
As of the 2010 census, Hillview had a population of 8,000 people. The racial makeup of the city was 95.3% White, 1.7% African American, 0.3% Native American, 0.7% Asian, 0.1% Pacific Islander, and 1.8% from other races. Hispanic or Latino of any race were 2.2% of the population.
The median household income in Hillview was $45,000, and the median family income was $50,000. The per capita income in Hillview was $20,000. About 8.5% of families and 10.2% of the population were below the poverty line.
Conclusion
Hillview, Kentucky is a small city located in Bullitt County, Kentucky. It is situated about 20 miles south of Louisville and is part of the Louisville metropolitan area. The city has a population of approximately 8,000 people and is known for its rural charm and small-town atmosphere. The economy of Hillview is largely based on agriculture and manufacturing, and the city is home to several retail stores, restaurants, and other businesses. The racial makeup of the city is predominantly White, with a small percentage of African American, Native American, Asian, and Pacific Islander residents. The median household income in Hillview is $45,000, and the per capita income is $20,000.
Common Questions
What is Per Capita Income in Hillview?
Per Capita income in Hillview is $27,546.
What is the Median Family Income in Hillview?
Median Family Income in Hillview is $69,154.
What is the Median Household income in Hillview?
Median Household Income in Hillview is $63,578.
What is Income or Wage Gap in Hillview?
Income or Wage Gap in Hillview is 3.7%.
Women in Hillview earn 96.3 cents for every dollar earned by a man.
What is Inequality or Gini Index in Hillview?
Inequality or Gini Index in Hillview is 0.35.
What is the Total Population of Hillview?
Total Population of Hillview is 8,681.
What is the Total Male Population of Hillview?
Total Male Population of Hillview is 4,594.
What is the Total Female Population of Hillview?
Total Female Population of Hillview is 4,087.
What is the Ratio of Males per 100 Females in Hillview?
There are 112.41 Males per 100 Females in Hillview.
What is the Ratio of Females per 100 Males in Hillview?
There are 88.96 Females per 100 Males in Hillview.
What is the Median Population Age in Hillview?
Median Population Age in Hillview is 35.3 Years.
What is the Average Family Size in Hillview
Average Family Size in Hillview is 3.2 People.
What is the Average Household Size in Hillview
Average Household Size in Hillview is 2.9 People.
How Large is the Labor Force in Hillview?
There are 4,708 People in the Labor Forcein in Hillview.
What is the Percentage of People in the Labor Force in Hillview?
64.2% of People are in the Labor Force in Hillview.
What is the Unemployment Rate in Hillview?
Unemployment Rate in Hillview is 3.9%.