Greensburg, KY Map & Demographics
Greensburg Map
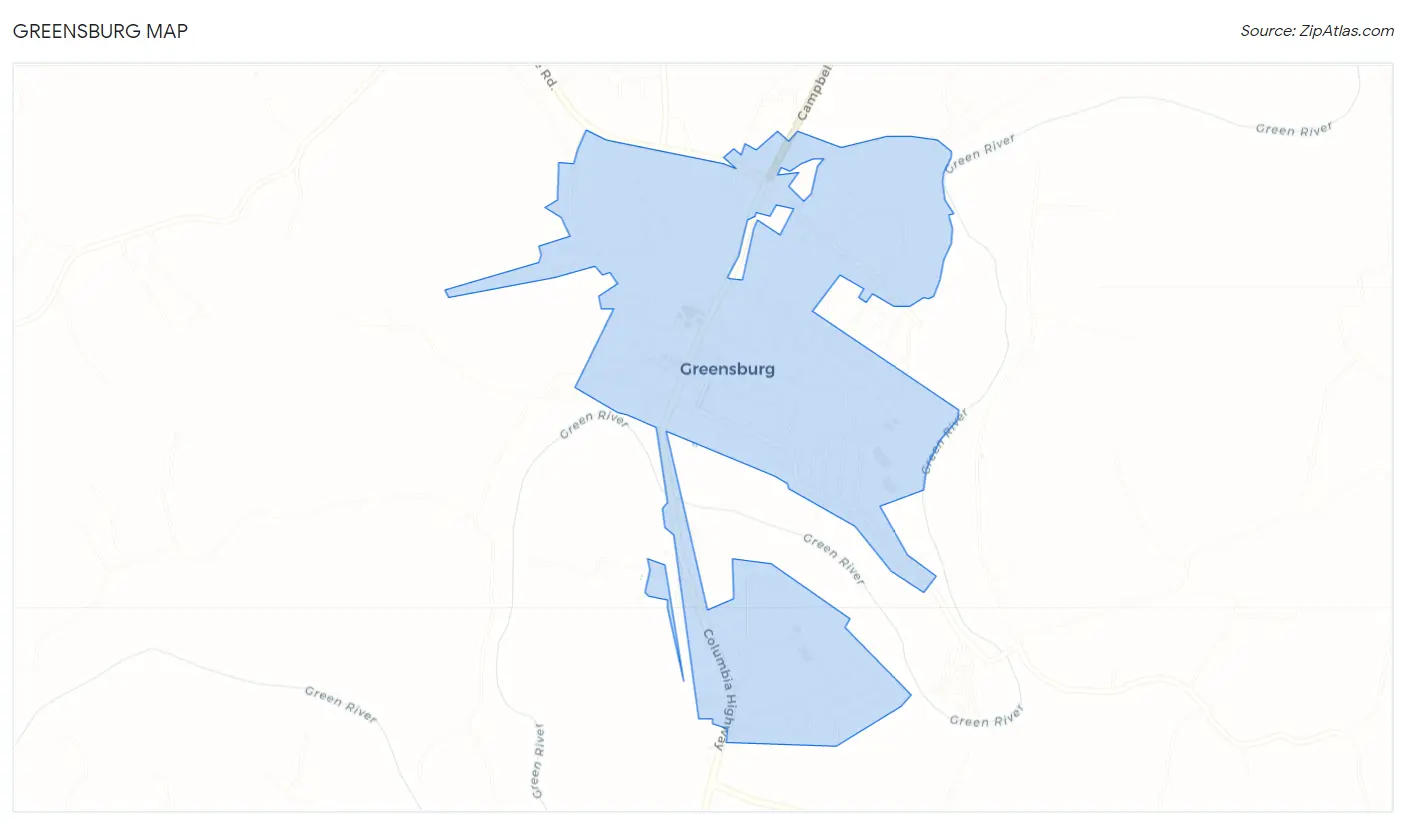
Greensburg Overview
$20,193
PER CAPITA INCOME
$46,691
AVG FAMILY INCOME
$38,571
AVG HOUSEHOLD INCOME
30.4%
WAGE / INCOME GAP [ % ]
69.6¢/ $1
WAGE / INCOME GAP [ $ ]
0.44
INEQUALITY / GINI INDEX
2,307
TOTAL POPULATION
992
MALE POPULATION
1,315
FEMALE POPULATION
75.44
MALES / 100 FEMALES
132.56
FEMALES / 100 MALES
37.8
MEDIAN AGE
3.8
AVG FAMILY SIZE
2.9
AVG HOUSEHOLD SIZE
976
LABOR FORCE [ PEOPLE ]
56.3%
PERCENT IN LABOR FORCE
18.2%
UNEMPLOYMENT RATE
Greensburg Zip Codes
Greensburg Area Codes
Income in Greensburg
Income Overview in Greensburg
Per Capita Income in Greensburg is $20,193, while median incomes of families and households are $46,691 and $38,571 respectively.
| Characteristic | Number | Measure |
| Per Capita Income | 2,307 | $20,193 |
| Median Family Income | 477 | $46,691 |
| Mean Family Income | 477 | $68,701 |
| Median Household Income | 762 | $38,571 |
| Mean Household Income | 762 | $52,720 |
| Income Deficit | 477 | $0 |
| Wage / Income Gap (%) | 2,307 | 30.37% |
| Wage / Income Gap ($) | 2,307 | 69.63¢ per $1 |
| Gini / Inequality Index | 2,307 | 0.44 |
Earnings by Sex in Greensburg
Average Earnings in Greensburg are $25,625, $31,875 for men and $22,193 for women, a difference of 30.4%.
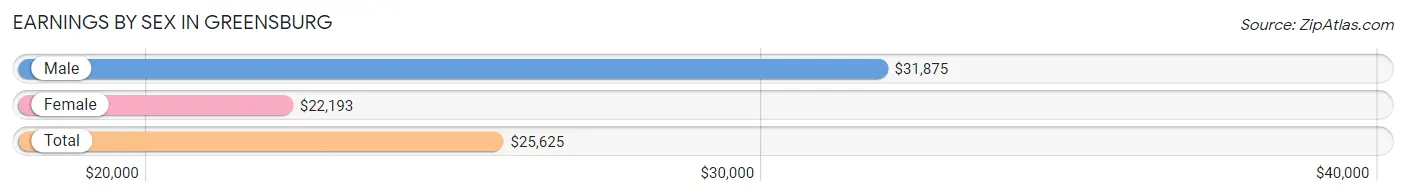
| Sex | Number | Average Earnings |
| Male | 388 (45.7%) | $31,875 |
| Female | 461 (54.3%) | $22,193 |
| Total | 849 (100.0%) | $25,625 |
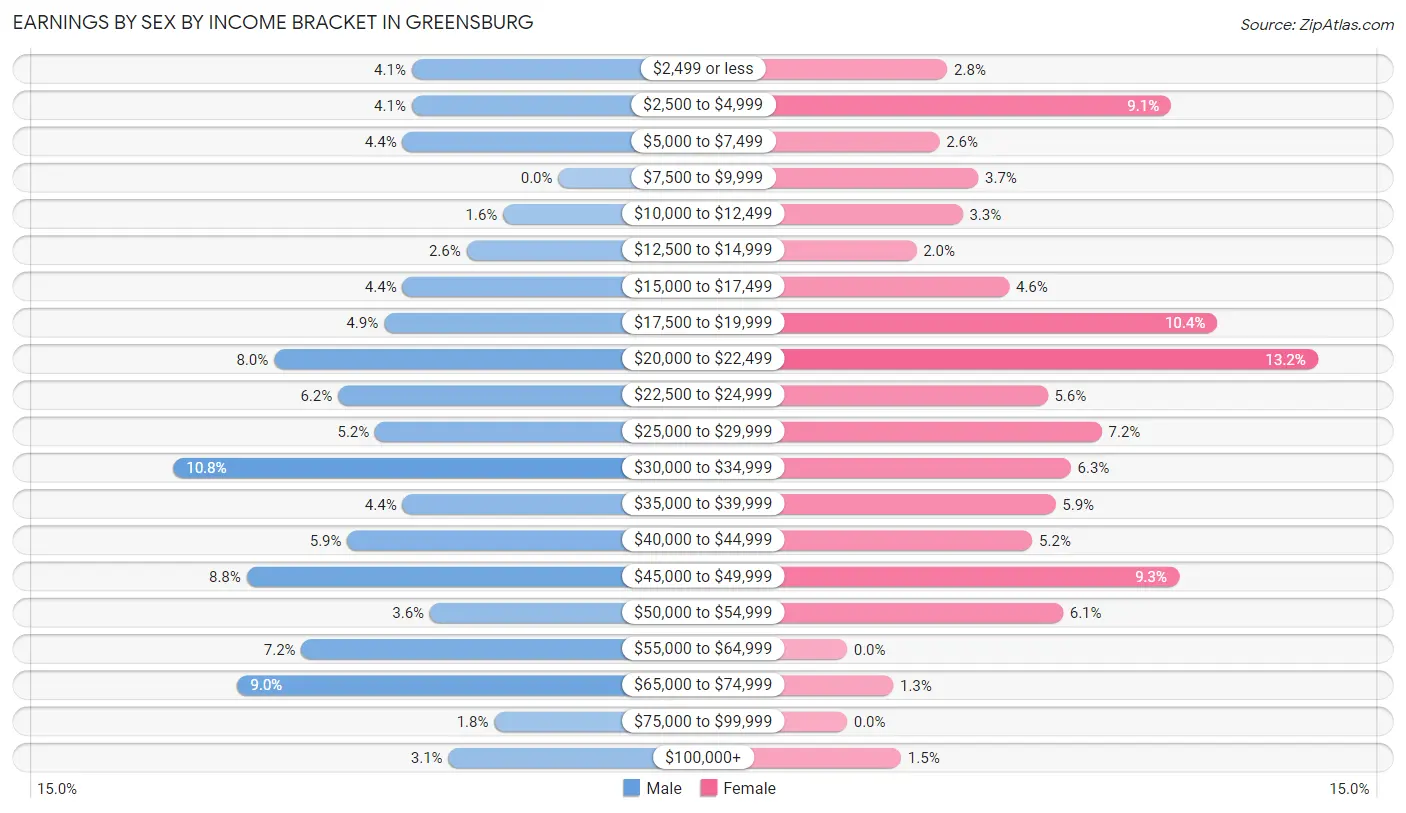
Earnings by Sex by Income Bracket in Greensburg
The most common earnings brackets in Greensburg are $30,000 to $34,999 for men (42 | 10.8%) and $20,000 to $22,499 for women (61 | 13.2%).
| Income | Male | Female |
| $2,499 or less | 16 (4.1%) | 13 (2.8%) |
| $2,500 to $4,999 | 16 (4.1%) | 42 (9.1%) |
| $5,000 to $7,499 | 17 (4.4%) | 12 (2.6%) |
| $7,500 to $9,999 | 0 (0.0%) | 17 (3.7%) |
| $10,000 to $12,499 | 6 (1.5%) | 15 (3.3%) |
| $12,500 to $14,999 | 10 (2.6%) | 9 (1.9%) |
| $15,000 to $17,499 | 17 (4.4%) | 21 (4.6%) |
| $17,500 to $19,999 | 19 (4.9%) | 48 (10.4%) |
| $20,000 to $22,499 | 31 (8.0%) | 61 (13.2%) |
| $22,500 to $24,999 | 24 (6.2%) | 26 (5.6%) |
| $25,000 to $29,999 | 20 (5.1%) | 33 (7.2%) |
| $30,000 to $34,999 | 42 (10.8%) | 29 (6.3%) |
| $35,000 to $39,999 | 17 (4.4%) | 27 (5.9%) |
| $40,000 to $44,999 | 23 (5.9%) | 24 (5.2%) |
| $45,000 to $49,999 | 34 (8.8%) | 43 (9.3%) |
| $50,000 to $54,999 | 14 (3.6%) | 28 (6.1%) |
| $55,000 to $64,999 | 28 (7.2%) | 0 (0.0%) |
| $65,000 to $74,999 | 35 (9.0%) | 6 (1.3%) |
| $75,000 to $99,999 | 7 (1.8%) | 0 (0.0%) |
| $100,000+ | 12 (3.1%) | 7 (1.5%) |
| Total | 388 (100.0%) | 461 (100.0%) |
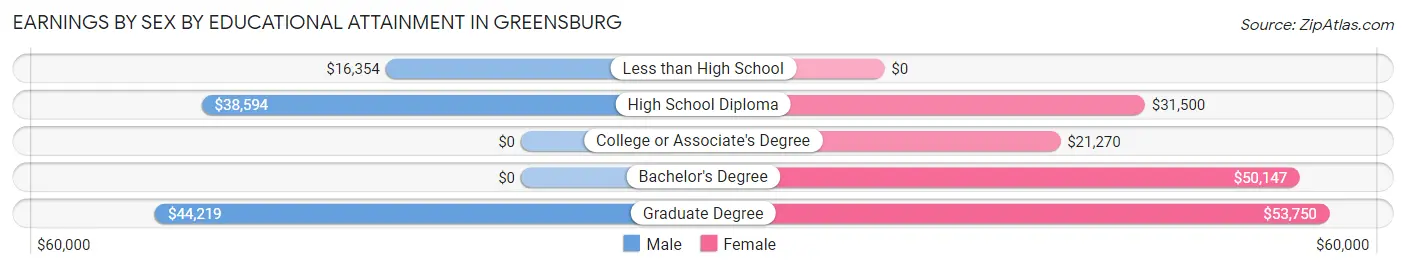
Earnings by Sex by Educational Attainment in Greensburg
Average earnings in Greensburg are $33,681 for men and $23,894 for women, a difference of 29.1%. Men with an educational attainment of graduate degree enjoy the highest average annual earnings of $44,219, while those with less than high school education earn the least with $16,354. Women with an educational attainment of graduate degree earn the most with the average annual earnings of $53,750, while those with college or associate's degree education have the smallest earnings of $21,270.
| Educational Attainment | Male Income | Female Income |
| Less than High School | $16,354 | $0 |
| High School Diploma | $38,594 | $31,500 |
| College or Associate's Degree | - | - |
| Bachelor's Degree | - | - |
| Graduate Degree | $44,219 | $53,750 |
| Total | $33,681 | $23,894 |
Family Income in Greensburg
Family Income Brackets in Greensburg
According to the Greensburg family income data, there are 167 families falling into the $35,000 to $49,999 income range, which is the most common income bracket and makes up 35.0% of all families.
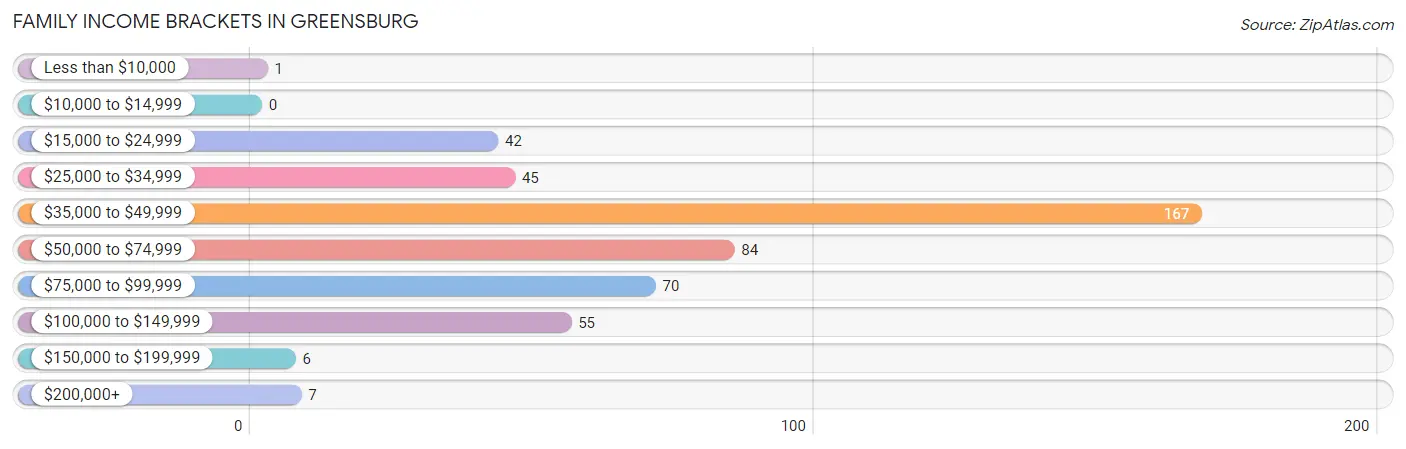
| Income Bracket | # Families | % Families |
| Less than $10,000 | 1 | 0.2% |
| $10,000 to $14,999 | 0 | 0.0% |
| $15,000 to $24,999 | 42 | 8.8% |
| $25,000 to $34,999 | 45 | 9.4% |
| $35,000 to $49,999 | 167 | 35.0% |
| $50,000 to $74,999 | 84 | 17.6% |
| $75,000 to $99,999 | 70 | 14.7% |
| $100,000 to $149,999 | 55 | 11.5% |
| $150,000 to $199,999 | 6 | 1.3% |
| $200,000+ | 7 | 1.5% |
Family Income by Famaliy Size in Greensburg
2-person families (173 | 36.3%) account for the highest median family income in Greensburg with $62,188 per family, while 2-person families (173 | 36.3%) have the highest median income of $31,094 per family member.
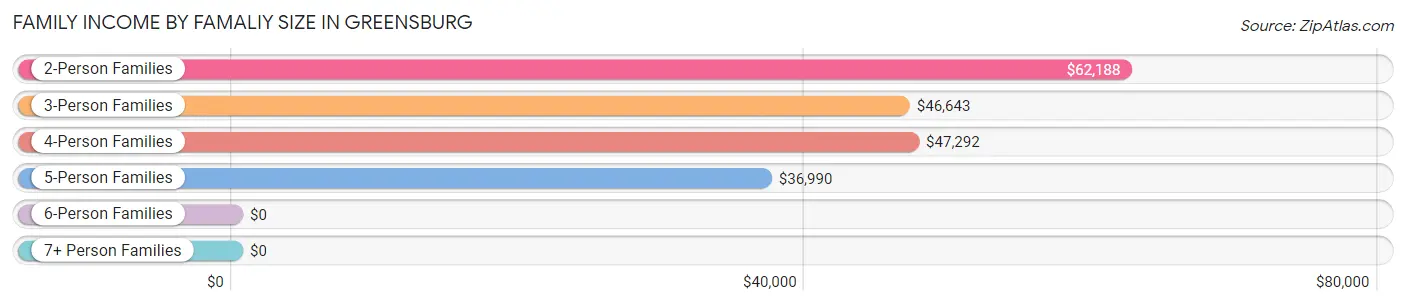
| Income Bracket | # Families | Median Income |
| 2-Person Families | 173 (36.3%) | $62,188 |
| 3-Person Families | 100 (21.0%) | $46,643 |
| 4-Person Families | 107 (22.4%) | $47,292 |
| 5-Person Families | 88 (18.4%) | $36,990 |
| 6-Person Families | 5 (1.1%) | $0 |
| 7+ Person Families | 4 (0.8%) | $0 |
| Total | 477 (100.0%) | $46,691 |
Family Income by Number of Earners in Greensburg
The median family income in Greensburg is $46,691, with families comprising 3+ earners (35) having the highest median family income of $110,208, while families with no earners (89) have the lowest median family income of $36,042, accounting for 7.3% and 18.7% of families, respectively.
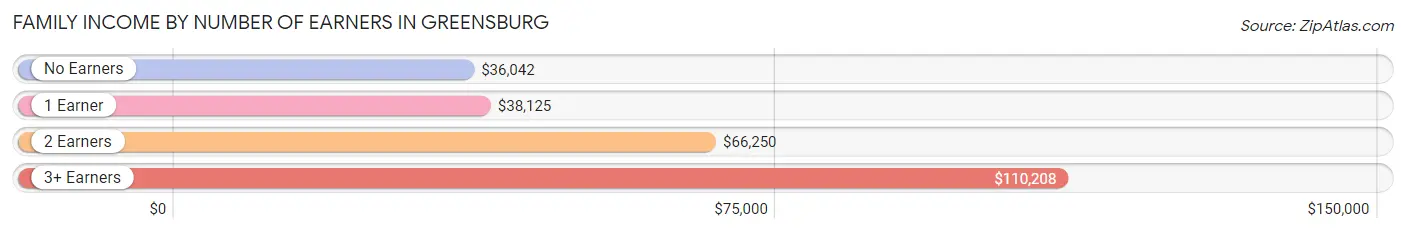
| Number of Earners | # Families | Median Income |
| No Earners | 89 (18.7%) | $36,042 |
| 1 Earner | 183 (38.4%) | $38,125 |
| 2 Earners | 170 (35.6%) | $66,250 |
| 3+ Earners | 35 (7.3%) | $110,208 |
| Total | 477 (100.0%) | $46,691 |
Household Income in Greensburg
Household Income Brackets in Greensburg
With 200 households falling in the category, the $35,000 to $49,999 income range is the most frequent in Greensburg, accounting for 26.3% of all households. In contrast, only 7 households (0.9%) fall into the $200,000+ income bracket, making it the least populous group.
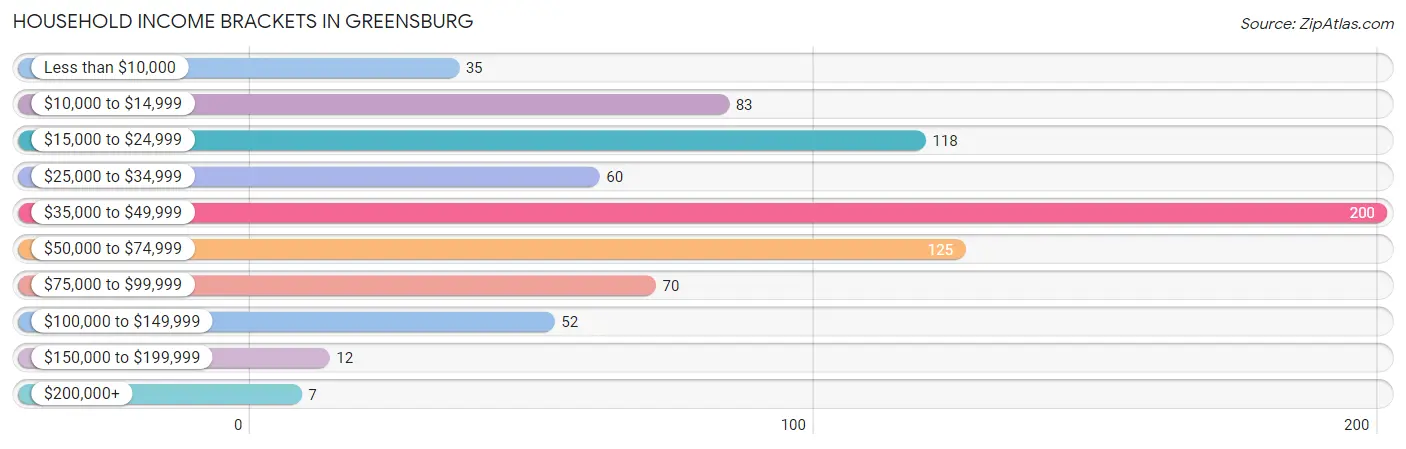
| Income Bracket | # Households | % Households |
| Less than $10,000 | 35 | 4.6% |
| $10,000 to $14,999 | 83 | 10.9% |
| $15,000 to $24,999 | 118 | 15.5% |
| $25,000 to $34,999 | 60 | 7.9% |
| $35,000 to $49,999 | 200 | 26.2% |
| $50,000 to $74,999 | 125 | 16.4% |
| $75,000 to $99,999 | 70 | 9.2% |
| $100,000 to $149,999 | 52 | 6.8% |
| $150,000 to $199,999 | 12 | 1.6% |
| $200,000+ | 7 | 0.9% |
Household Income by Householder Age in Greensburg
The median household income in Greensburg is $38,571, with the highest median household income of $62,188 found in the 15 to 24 years age bracket for the primary householder. A total of 9 households (1.2%) fall into this category. Meanwhile, the 65+ years age bracket for the primary householder has the lowest median household income of $23,413, with 243 households (31.9%) in this group.
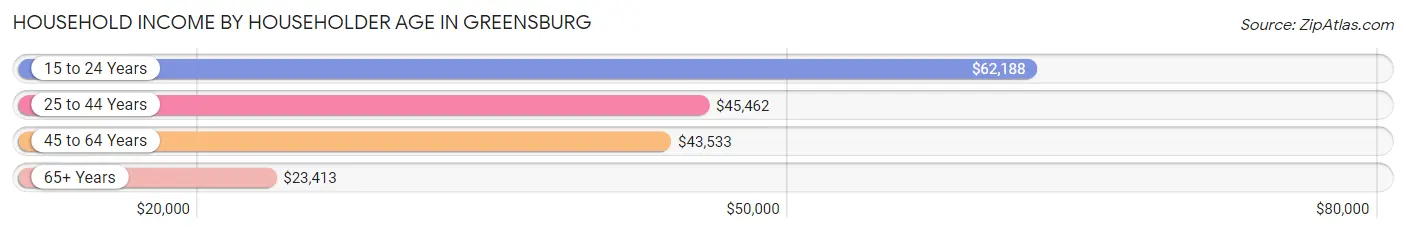
| Income Bracket | # Households | Median Income |
| 15 to 24 Years | 9 (1.2%) | $62,188 |
| 25 to 44 Years | 257 (33.7%) | $45,462 |
| 45 to 64 Years | 253 (33.2%) | $43,533 |
| 65+ Years | 243 (31.9%) | $23,413 |
| Total | 762 (100.0%) | $38,571 |
Poverty in Greensburg
Income Below Poverty by Sex and Age in Greensburg
With 16.5% poverty level for males and 16.7% for females among the residents of Greensburg, 16 and 17 year old males and 5 year old females are the most vulnerable to poverty, with 6 males (46.2%) and 13 females (38.2%) in their respective age groups living below the poverty level.
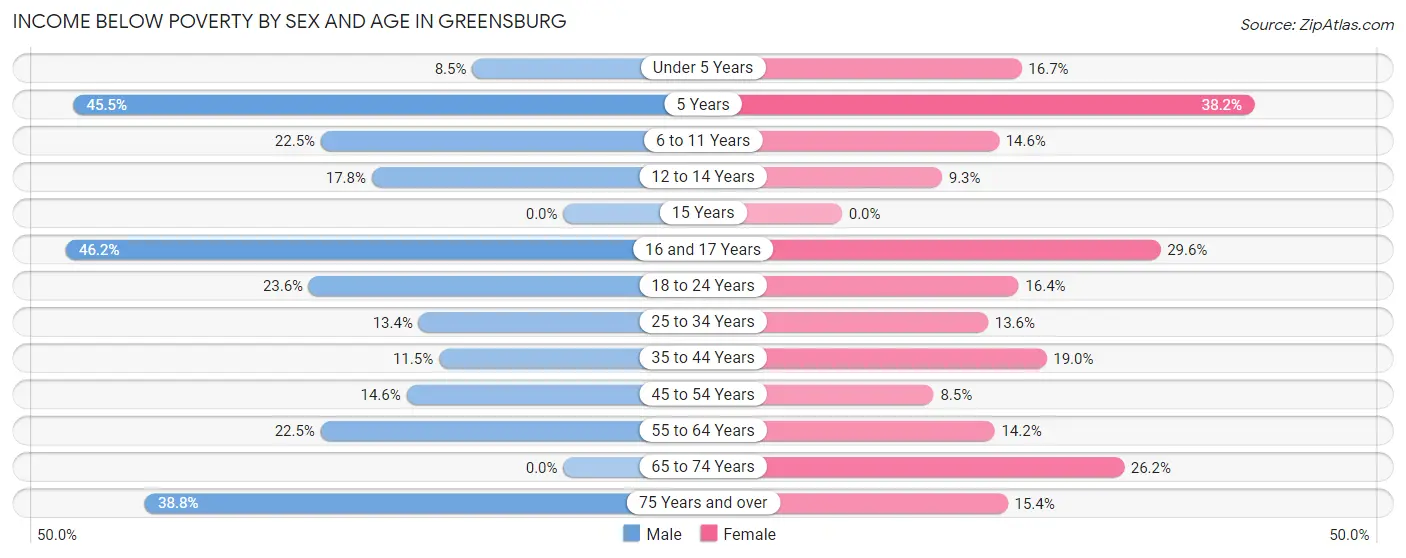
| Age Bracket | Male | Female |
| Under 5 Years | 6 (8.5%) | 21 (16.7%) |
| 5 Years | 5 (45.5%) | 13 (38.2%) |
| 6 to 11 Years | 9 (22.5%) | 15 (14.6%) |
| 12 to 14 Years | 8 (17.8%) | 9 (9.3%) |
| 15 Years | 0 (0.0%) | 0 (0.0%) |
| 16 and 17 Years | 6 (46.2%) | 13 (29.5%) |
| 18 to 24 Years | 17 (23.6%) | 10 (16.4%) |
| 25 to 34 Years | 20 (13.4%) | 21 (13.6%) |
| 35 to 44 Years | 12 (11.5%) | 26 (19.0%) |
| 45 to 54 Years | 24 (14.5%) | 8 (8.5%) |
| 55 to 64 Years | 25 (22.5%) | 17 (14.2%) |
| 65 to 74 Years | 0 (0.0%) | 39 (26.2%) |
| 75 Years and over | 26 (38.8%) | 12 (15.4%) |
| Total | 158 (16.5%) | 204 (16.7%) |
Income Above Poverty by Sex and Age in Greensburg
According to the poverty statistics in Greensburg, males aged 15 years and females aged 15 years are the age groups that are most secure financially, with 100.0% of males and 100.0% of females in these age groups living above the poverty line.
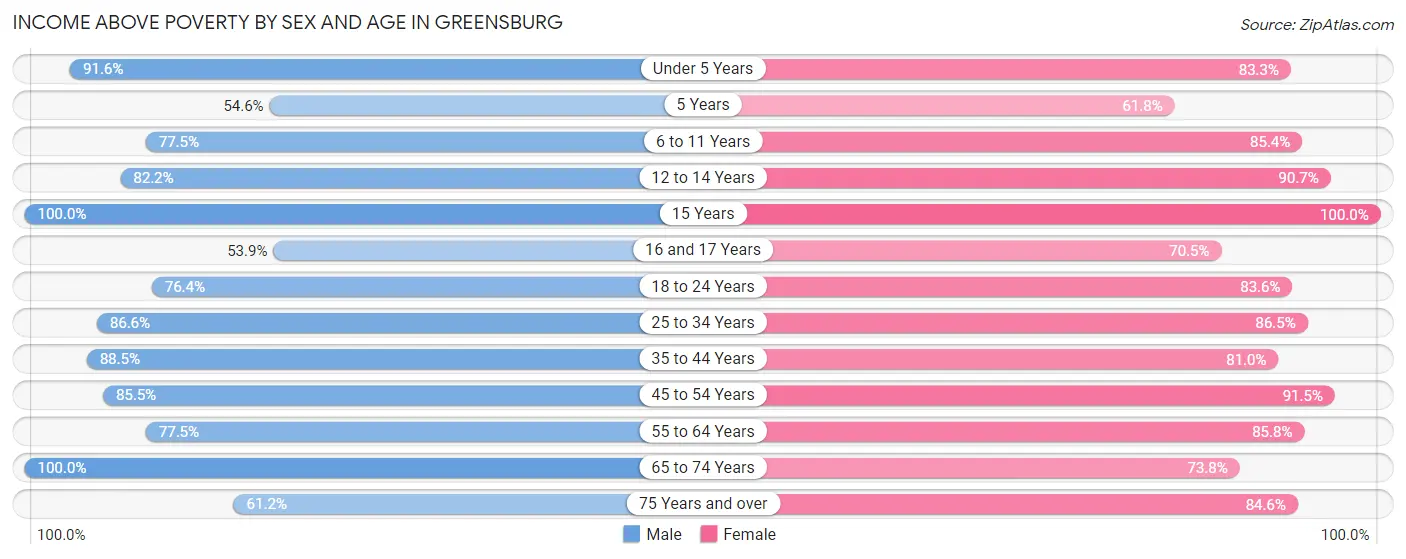
| Age Bracket | Male | Female |
| Under 5 Years | 65 (91.5%) | 105 (83.3%) |
| 5 Years | 6 (54.5%) | 21 (61.8%) |
| 6 to 11 Years | 31 (77.5%) | 88 (85.4%) |
| 12 to 14 Years | 37 (82.2%) | 88 (90.7%) |
| 15 Years | 22 (100.0%) | 24 (100.0%) |
| 16 and 17 Years | 7 (53.8%) | 31 (70.5%) |
| 18 to 24 Years | 55 (76.4%) | 51 (83.6%) |
| 25 to 34 Years | 129 (86.6%) | 134 (86.5%) |
| 35 to 44 Years | 92 (88.5%) | 111 (81.0%) |
| 45 to 54 Years | 141 (85.5%) | 86 (91.5%) |
| 55 to 64 Years | 86 (77.5%) | 103 (85.8%) |
| 65 to 74 Years | 85 (100.0%) | 110 (73.8%) |
| 75 Years and over | 41 (61.2%) | 66 (84.6%) |
| Total | 797 (83.5%) | 1,018 (83.3%) |
Income Below Poverty Among Married-Couple Families in Greensburg
The poverty statistics for married-couple families in Greensburg show that 5.5% or 19 of the total 343 families live below the poverty line. Families with 5 or more children have the highest poverty rate of 100.0%, comprising of 1 families. On the other hand, families with no children have the lowest poverty rate of 0.0%, which includes 0 families.
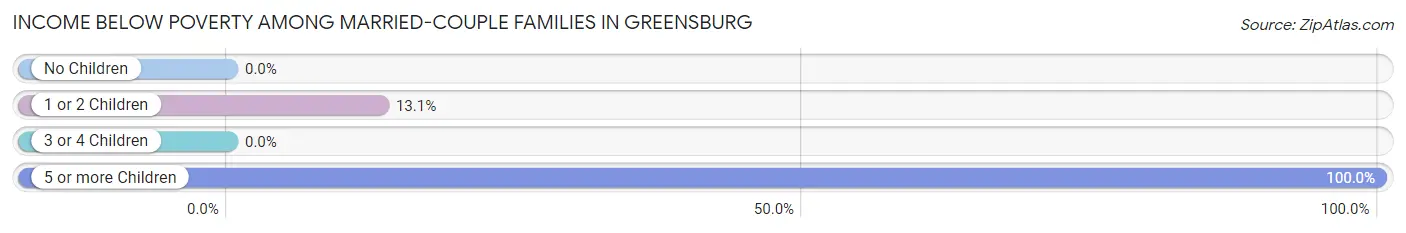
| Children | Above Poverty | Below Poverty |
| No Children | 181 (100.0%) | 0 (0.0%) |
| 1 or 2 Children | 119 (86.9%) | 18 (13.1%) |
| 3 or 4 Children | 24 (100.0%) | 0 (0.0%) |
| 5 or more Children | 0 (0.0%) | 1 (100.0%) |
| Total | 324 (94.5%) | 19 (5.5%) |
Income Below Poverty Among Single-Parent Households in Greensburg
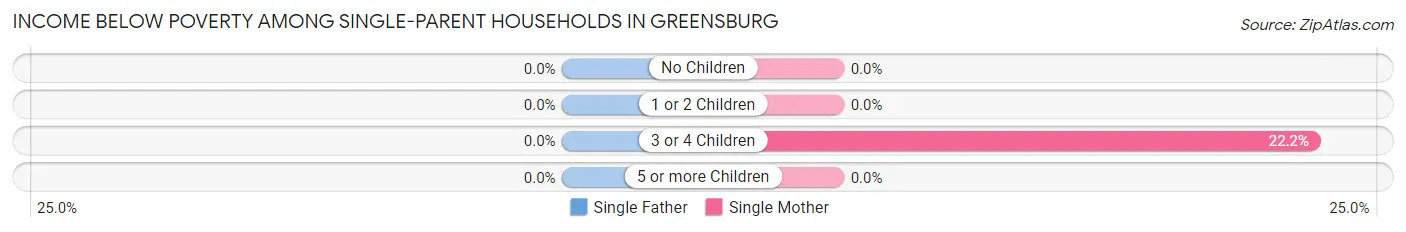
| Children | Single Father | Single Mother |
| No Children | 0 (0.0%) | 0 (0.0%) |
| 1 or 2 Children | 0 (0.0%) | 0 (0.0%) |
| 3 or 4 Children | 0 (0.0%) | 14 (22.2%) |
| 5 or more Children | 0 (0.0%) | 0 (0.0%) |
| Total | 0 (0.0%) | 14 (10.4%) |
Income Below Poverty Among Married-Couple vs Single-Parent Households in Greensburg
The poverty data for Greensburg shows that 19 of the married-couple family households (5.5%) and 14 of the single-parent households (10.4%) are living below the poverty level. Within the married-couple family households, those with 5 or more children have the highest poverty rate, with 1 households (100.0%) falling below the poverty line. Among the single-parent households, those with 3 or 4 children have the highest poverty rate, with 14 household (22.2%) living below poverty.
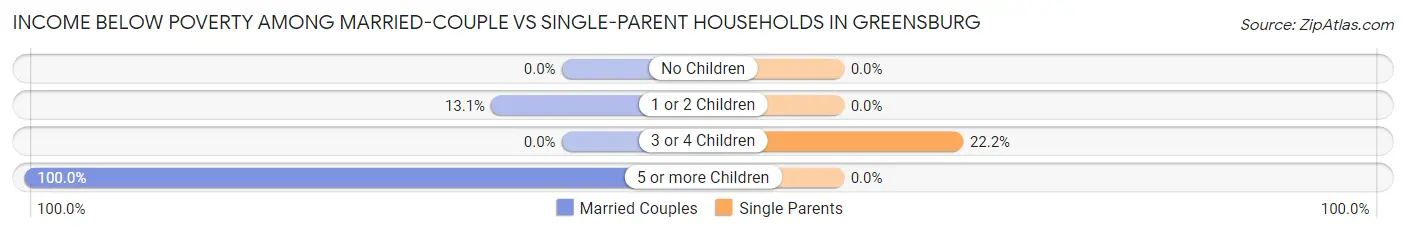
| Children | Married-Couple Families | Single-Parent Households |
| No Children | 0 (0.0%) | 0 (0.0%) |
| 1 or 2 Children | 18 (13.1%) | 0 (0.0%) |
| 3 or 4 Children | 0 (0.0%) | 14 (22.2%) |
| 5 or more Children | 1 (100.0%) | 0 (0.0%) |
| Total | 19 (5.5%) | 14 (10.4%) |
Race in Greensburg
The most populous races in Greensburg are White / Caucasian (2,138 | 92.7%), Hispanic or Latino (199 | 8.6%), and Hawaiian / Pacific (99 | 4.3%).
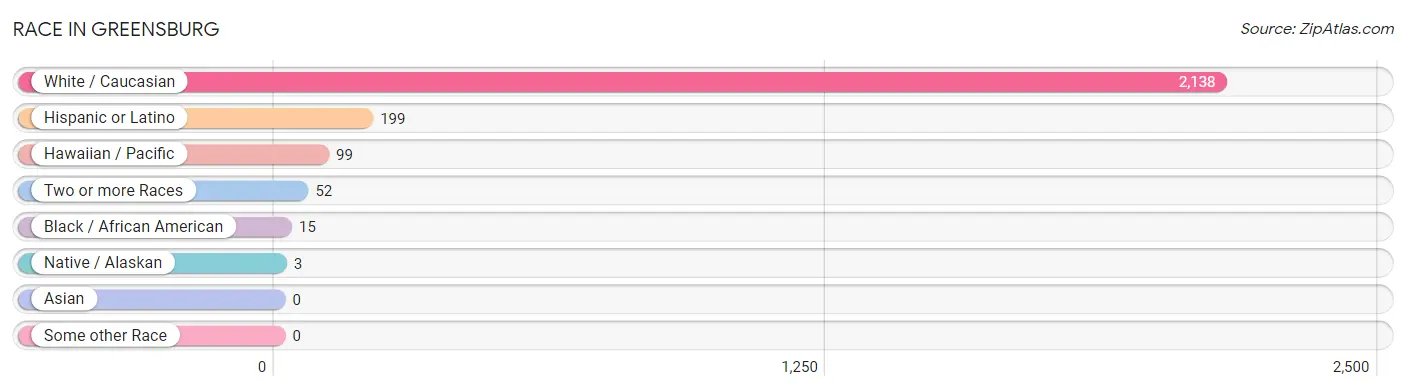
| Race | # Population | % Population |
| Asian | 0 | 0.0% |
| Black / African American | 15 | 0.6% |
| Hawaiian / Pacific | 99 | 4.3% |
| Hispanic or Latino | 199 | 8.6% |
| Native / Alaskan | 3 | 0.1% |
| White / Caucasian | 2,138 | 92.7% |
| Two or more Races | 52 | 2.2% |
| Some other Race | 0 | 0.0% |
| Total | 2,307 | 100.0% |
Ancestry in Greensburg
The most populous ancestries reported in Greensburg are American (421 | 18.2%), Irish (203 | 8.8%), English (159 | 6.9%), German (110 | 4.8%), and Mexican (100 | 4.3%), together accounting for 43.0% of all Greensburg residents.
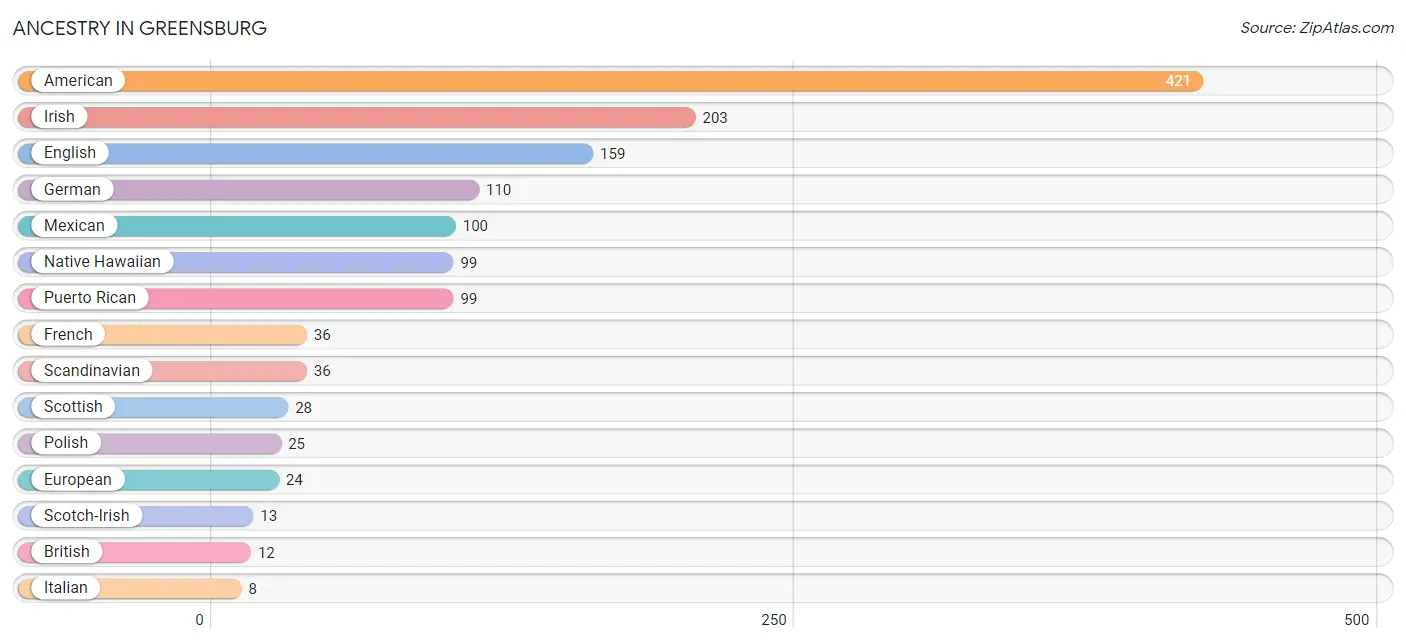
| Ancestry | # Population | % Population |
| American | 421 | 18.2% |
| British | 12 | 0.5% |
| Canadian | 4 | 0.2% |
| Cherokee | 1 | 0.0% |
| Comanche | 2 | 0.1% |
| Dutch | 5 | 0.2% |
| English | 159 | 6.9% |
| European | 24 | 1.0% |
| French | 36 | 1.6% |
| German | 110 | 4.8% |
| Irish | 203 | 8.8% |
| Italian | 8 | 0.4% |
| Mexican | 100 | 4.3% |
| Native Hawaiian | 99 | 4.3% |
| Polish | 25 | 1.1% |
| Puerto Rican | 99 | 4.3% |
| Scandinavian | 36 | 1.6% |
| Scotch-Irish | 13 | 0.6% |
| Scottish | 28 | 1.2% |
| Welsh | 5 | 0.2% | View All 20 Rows |
Immigrants in Greensburg
The most numerous immigrant groups reported in Greensburg came from Europe (9 | 0.4%), England (7 | 0.3%), Northern Europe (7 | 0.3%), Germany (2 | 0.1%), and Western Europe (2 | 0.1%), together accounting for 1.2% of all Greensburg residents.
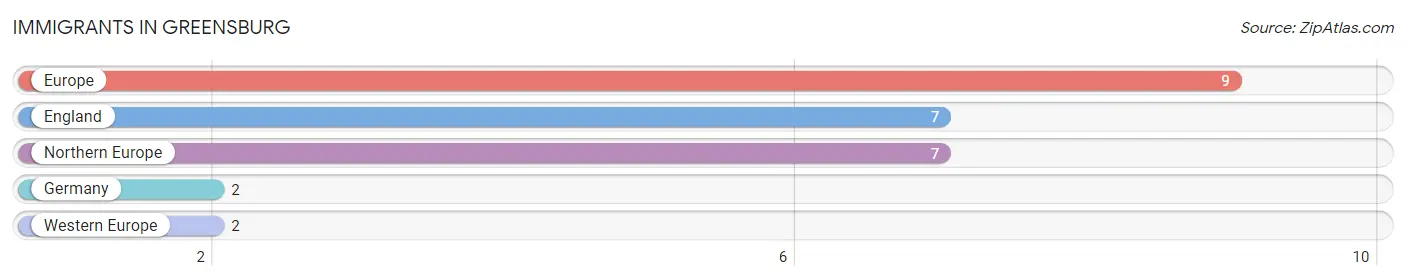
| Immigration Origin | # Population | % Population |
| England | 7 | 0.3% |
| Europe | 9 | 0.4% |
| Germany | 2 | 0.1% |
| Northern Europe | 7 | 0.3% |
| Western Europe | 2 | 0.1% | View All 5 Rows |
Sex and Age in Greensburg
Sex and Age in Greensburg
The most populous age groups in Greensburg are 45 to 49 Years (130 | 13.1%) for men and 10 to 14 Years (166 | 12.6%) for women.
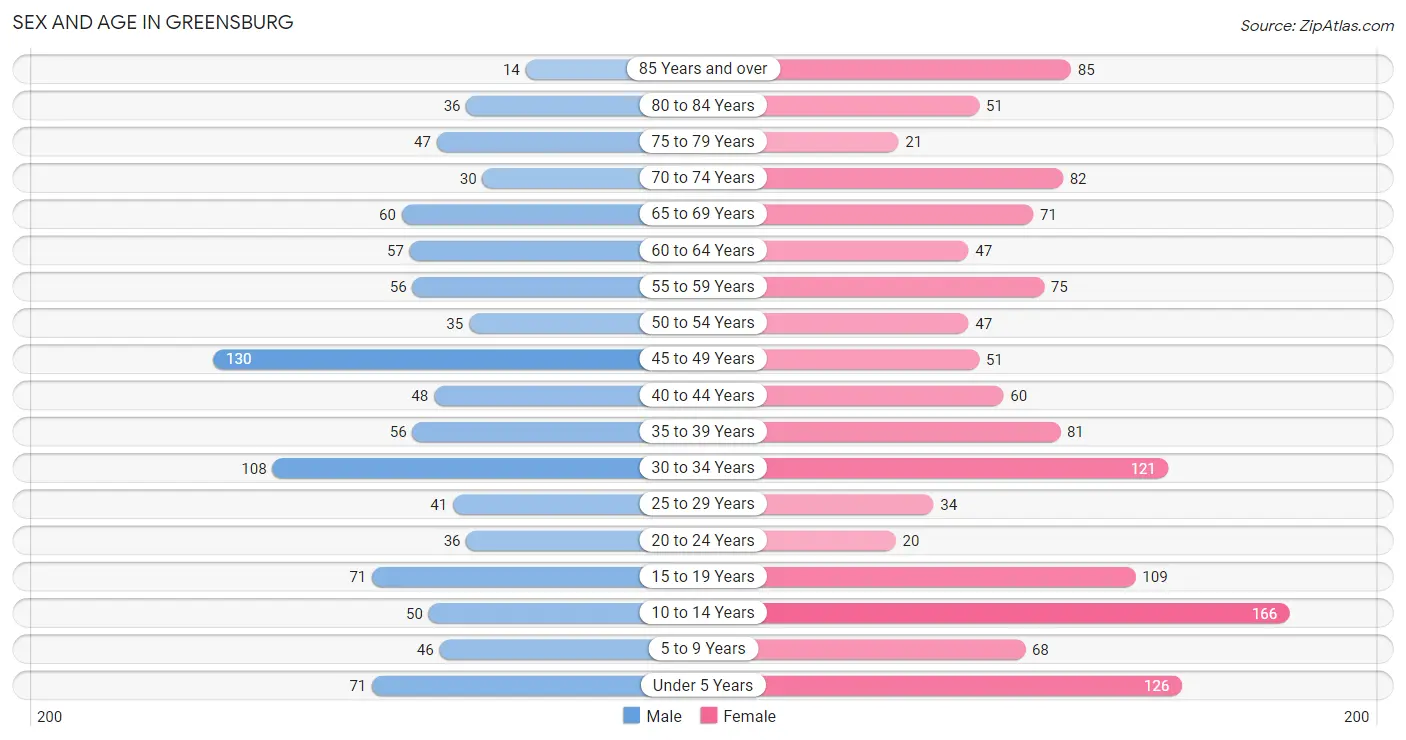
| Age Bracket | Male | Female |
| Under 5 Years | 71 (7.2%) | 126 (9.6%) |
| 5 to 9 Years | 46 (4.6%) | 68 (5.2%) |
| 10 to 14 Years | 50 (5.0%) | 166 (12.6%) |
| 15 to 19 Years | 71 (7.2%) | 109 (8.3%) |
| 20 to 24 Years | 36 (3.6%) | 20 (1.5%) |
| 25 to 29 Years | 41 (4.1%) | 34 (2.6%) |
| 30 to 34 Years | 108 (10.9%) | 121 (9.2%) |
| 35 to 39 Years | 56 (5.7%) | 81 (6.2%) |
| 40 to 44 Years | 48 (4.8%) | 60 (4.6%) |
| 45 to 49 Years | 130 (13.1%) | 51 (3.9%) |
| 50 to 54 Years | 35 (3.5%) | 47 (3.6%) |
| 55 to 59 Years | 56 (5.7%) | 75 (5.7%) |
| 60 to 64 Years | 57 (5.8%) | 47 (3.6%) |
| 65 to 69 Years | 60 (6.0%) | 71 (5.4%) |
| 70 to 74 Years | 30 (3.0%) | 82 (6.2%) |
| 75 to 79 Years | 47 (4.7%) | 21 (1.6%) |
| 80 to 84 Years | 36 (3.6%) | 51 (3.9%) |
| 85 Years and over | 14 (1.4%) | 85 (6.5%) |
| Total | 992 (100.0%) | 1,315 (100.0%) |
Families and Households in Greensburg
Median Family Size in Greensburg
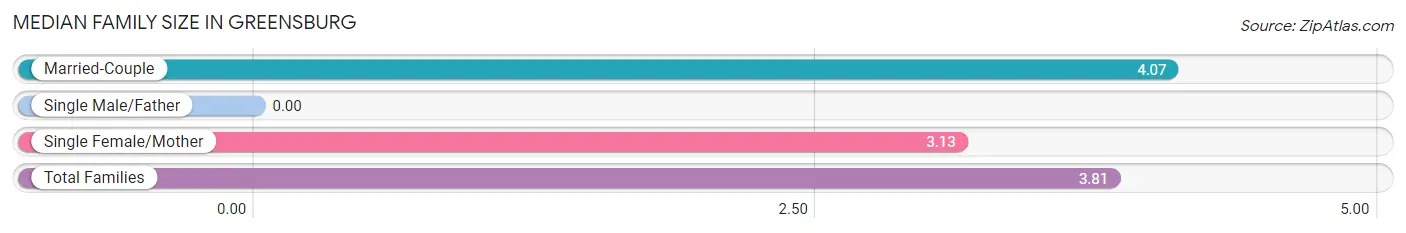
| Family Type | # Families | Family Size |
| Married-Couple | 343 (71.9%) | 4.07 |
| Single Male/Father | 0 (0.0%) | - |
| Single Female/Mother | 134 (28.1%) | 3.13 |
| Total Families | 477 (100.0%) | 3.81 |
Median Household Size in Greensburg
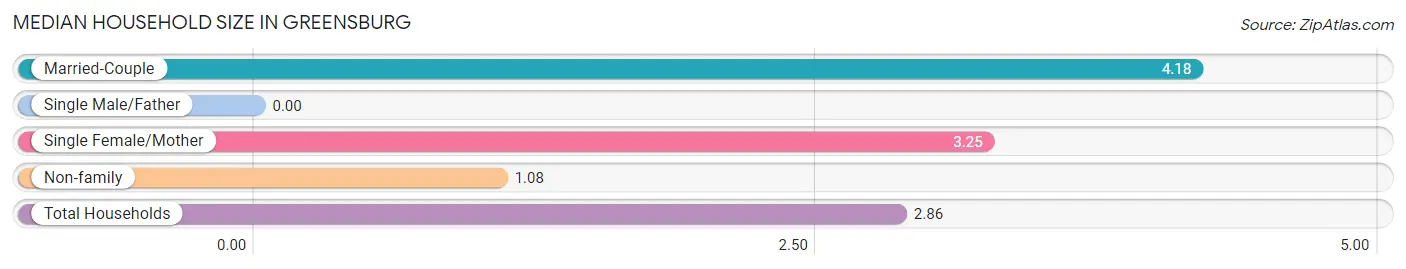
| Household Type | # Households | Household Size |
| Married-Couple | 343 (45.0%) | 4.18 |
| Single Male/Father | 0 (0.0%) | - |
| Single Female/Mother | 134 (17.6%) | 3.25 |
| Non-family | 285 (37.4%) | 1.08 |
| Total Households | 762 (100.0%) | 2.86 |
Household Size by Marriage Status in Greensburg
Out of a total of 762 households in Greensburg, 477 (62.6%) are family households, while 285 (37.4%) are nonfamily households. The most numerous type of family households are 2-person households, comprising 167, and the most common type of nonfamily households are 1-person households, comprising 249.
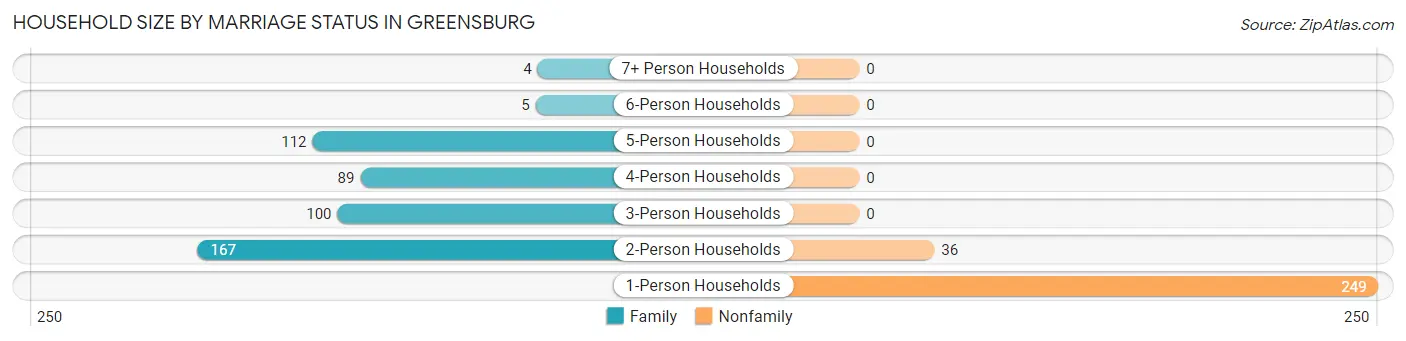
| Household Size | Family Households | Nonfamily Households |
| 1-Person Households | - | 249 (32.7%) |
| 2-Person Households | 167 (21.9%) | 36 (4.7%) |
| 3-Person Households | 100 (13.1%) | 0 (0.0%) |
| 4-Person Households | 89 (11.7%) | 0 (0.0%) |
| 5-Person Households | 112 (14.7%) | 0 (0.0%) |
| 6-Person Households | 5 (0.7%) | 0 (0.0%) |
| 7+ Person Households | 4 (0.5%) | 0 (0.0%) |
| Total | 477 (62.6%) | 285 (37.4%) |
Female Fertility in Greensburg
Fertility by Age in Greensburg
| Age Bracket | Women with Births | Births / 1,000 Women |
| 15 to 19 years | 0 (0.0%) | 0.0 |
| 20 to 34 years | 0 (0.0%) | 0.0 |
| 35 to 50 years | 0 (0.0%) | 0.0 |
| Total | 0 (0.0%) | 0.0 |
Fertility by Age by Marriage Status in Greensburg
| Age Bracket | Married | Unmarried |
| 15 to 19 years | 0 (0.0%) | 0 (0.0%) |
| 20 to 34 years | 0 (0.0%) | 0 (0.0%) |
| 35 to 50 years | 0 (0.0%) | 0 (0.0%) |
| Total | 0 (0.0%) | 0 (0.0%) |
Fertility by Education in Greensburg
| Educational Attainment | Women with Births | Births / 1,000 Women |
| Less than High School | 0 (0.0%) | 0.0 |
| High School Diploma | 0 (0.0%) | 0.0 |
| College or Associate's Degree | 0 (0.0%) | 0.0 |
| Bachelor's Degree | 0 (0.0%) | 0.0 |
| Graduate Degree | 0 (0.0%) | 0.0 |
| Total | 0 (0.0%) | 0.0 |
Fertility by Education by Marriage Status in Greensburg
| Educational Attainment | Married | Unmarried |
| Less than High School | 0 (0.0%) | 0 (0.0%) |
| High School Diploma | 0 (0.0%) | 0 (0.0%) |
| College or Associate's Degree | 0 (0.0%) | 0 (0.0%) |
| Bachelor's Degree | 0 (0.0%) | 0 (0.0%) |
| Graduate Degree | 0 (0.0%) | 0 (0.0%) |
| Total | 0 (0.0%) | 0 (0.0%) |
Employment Characteristics in Greensburg
Employment by Class of Employer in Greensburg
Among the 783 employed individuals in Greensburg, private company employees (548 | 70.0%), state government employees (83 | 10.6%), and not-for-profit organizations (59 | 7.5%) make up the most common classes of employment.
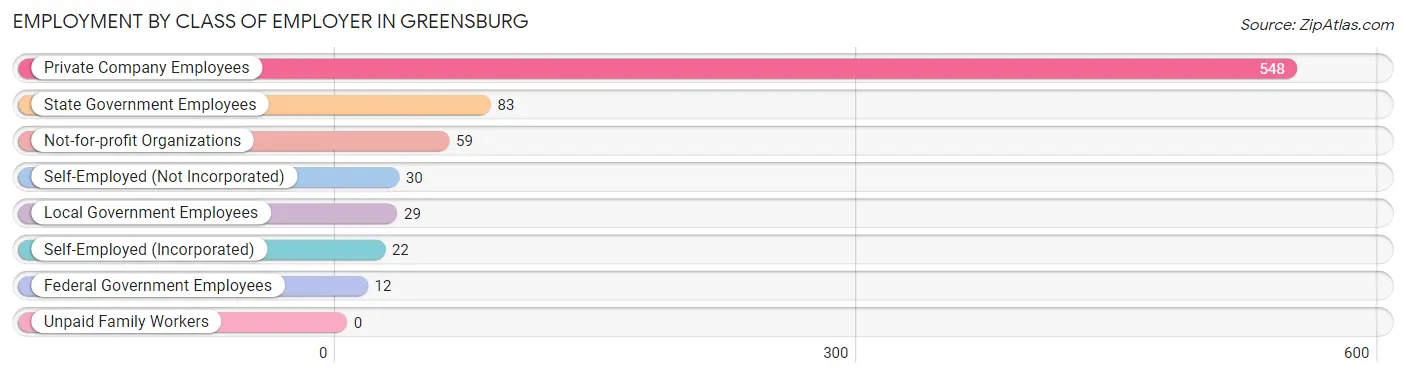
| Employer Class | # Employees | % Employees |
| Private Company Employees | 548 | 70.0% |
| Self-Employed (Incorporated) | 22 | 2.8% |
| Self-Employed (Not Incorporated) | 30 | 3.8% |
| Not-for-profit Organizations | 59 | 7.5% |
| Local Government Employees | 29 | 3.7% |
| State Government Employees | 83 | 10.6% |
| Federal Government Employees | 12 | 1.5% |
| Unpaid Family Workers | 0 | 0.0% |
| Total | 783 | 100.0% |
Employment Status by Age in Greensburg
According to the labor force statistics for Greensburg, out of the total population over 16 years of age (1,734), 56.3% or 976 individuals are in the labor force, with 18.2% or 178 of them unemployed. The age group with the highest labor force participation rate is 20 to 24 years, with 100.0% or 56 individuals in the labor force. Within the labor force, the 45 to 54 years age range has the highest percentage of unemployed individuals, with 50.3% or 99 of them being unemployed.
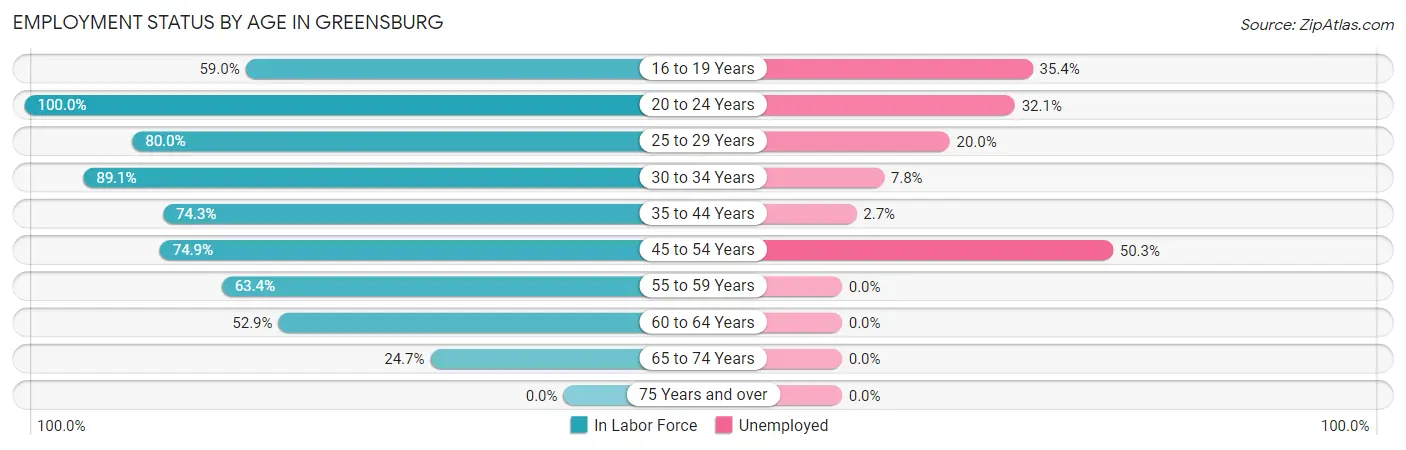
| Age Bracket | In Labor Force | Unemployed |
| 16 to 19 Years | 79 (59.0%) | 28 (35.4%) |
| 20 to 24 Years | 56 (100.0%) | 18 (32.1%) |
| 25 to 29 Years | 60 (80.0%) | 12 (20.0%) |
| 30 to 34 Years | 204 (89.1%) | 16 (7.8%) |
| 35 to 44 Years | 182 (74.3%) | 5 (2.7%) |
| 45 to 54 Years | 197 (74.9%) | 99 (50.3%) |
| 55 to 59 Years | 83 (63.4%) | 0 (0.0%) |
| 60 to 64 Years | 55 (52.9%) | 0 (0.0%) |
| 65 to 74 Years | 60 (24.7%) | 0 (0.0%) |
| 75 Years and over | 0 (0.0%) | 0 (0.0%) |
| Total | 976 (56.3%) | 178 (18.2%) |
Employment Status by Educational Attainment in Greensburg
According to labor force statistics for Greensburg, 74.6% of individuals (781) out of the total population between 25 and 64 years of age (1,047) are in the labor force, with 16.9% or 132 of them being unemployed. The group with the highest labor force participation rate are those with the educational attainment of college / associate degree, with 85.4% or 333 individuals in the labor force. Within the labor force, individuals with college / associate degree education have the highest percentage of unemployment, with 38.1% or 127 of them being unemployed.
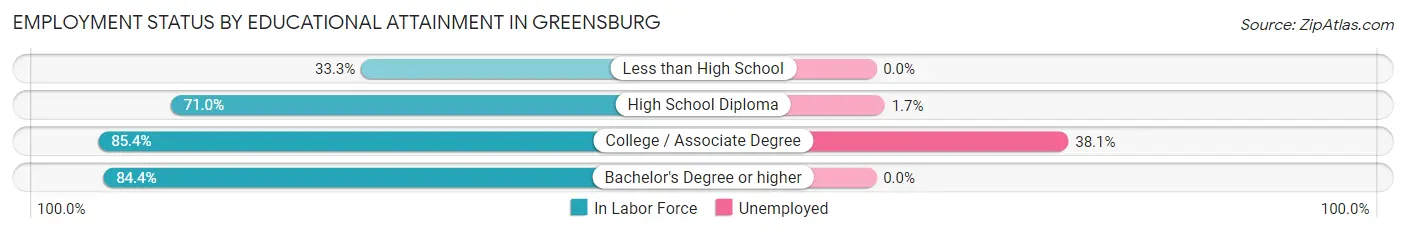
| Educational Attainment | In Labor Force | Unemployed |
| Less than High School | 33 (33.3%) | 0 (0.0%) |
| High School Diploma | 296 (71.0%) | 7 (1.7%) |
| College / Associate Degree | 333 (85.4%) | 149 (38.1%) |
| Bachelor's Degree or higher | 119 (84.4%) | 0 (0.0%) |
| Total | 781 (74.6%) | 177 (16.9%) |
Employment Occupations by Sex in Greensburg
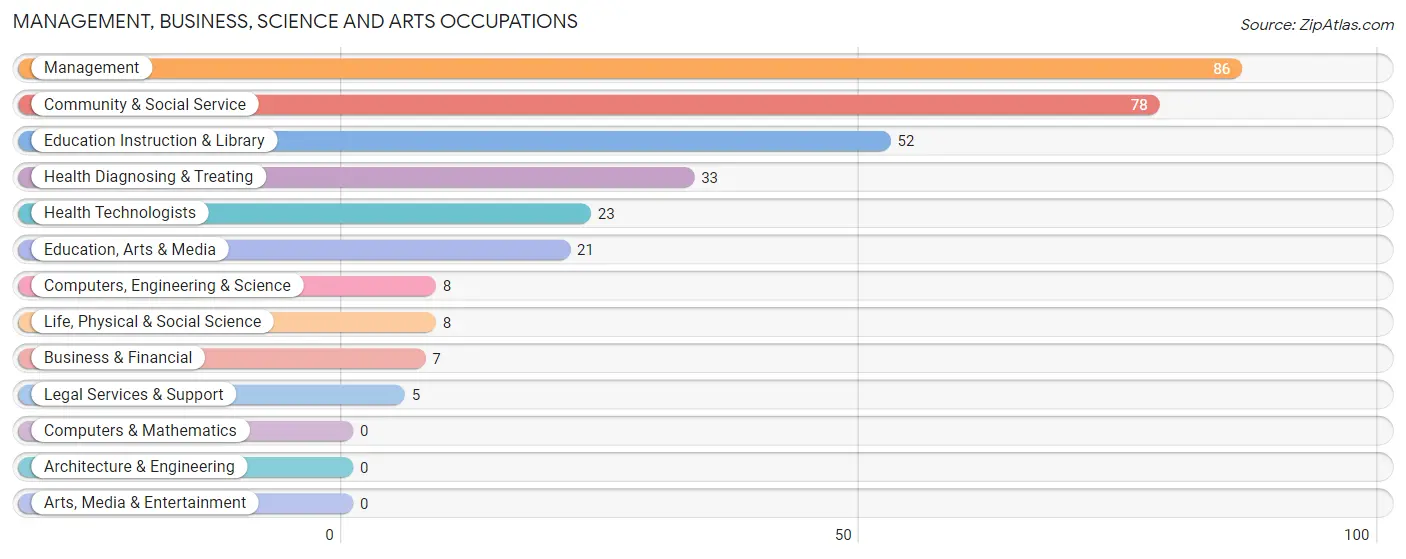
Management, Business, Science and Arts Occupations
The most common Management, Business, Science and Arts occupations in Greensburg are Management (86 | 10.8%), Community & Social Service (78 | 9.8%), Education Instruction & Library (52 | 6.5%), Health Diagnosing & Treating (33 | 4.1%), and Health Technologists (23 | 2.9%).
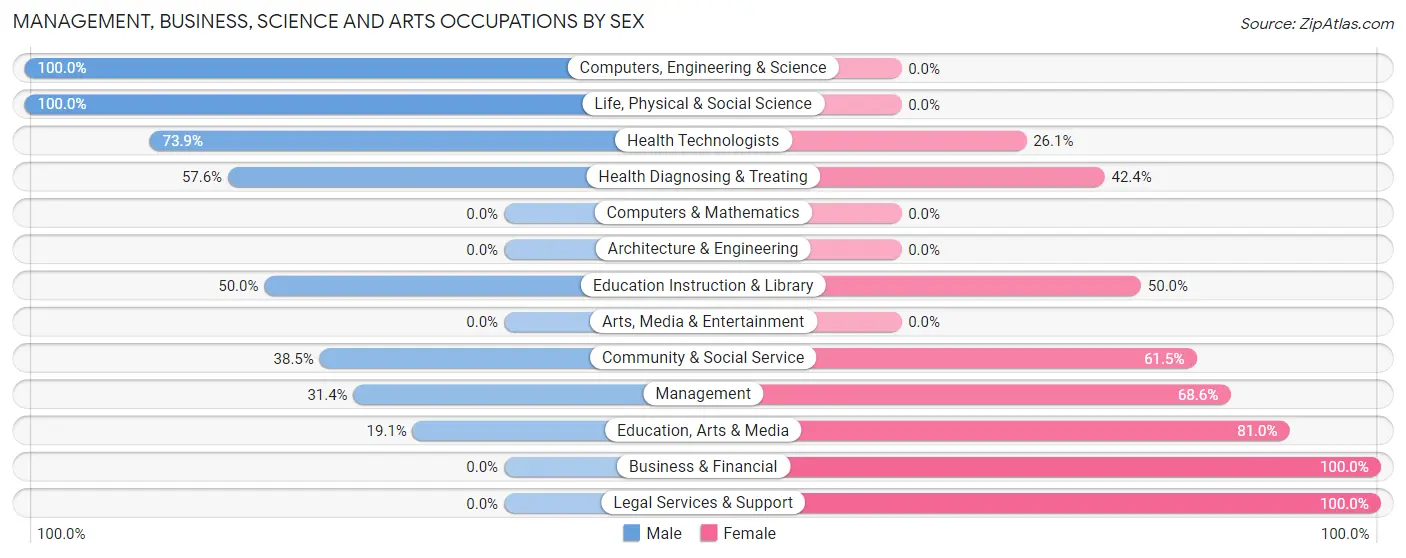
Management, Business, Science and Arts Occupations by Sex
Within the Management, Business, Science and Arts occupations in Greensburg, the most male-oriented occupations are Computers, Engineering & Science (100.0%), Life, Physical & Social Science (100.0%), and Health Technologists (73.9%), while the most female-oriented occupations are Business & Financial (100.0%), Legal Services & Support (100.0%), and Education, Arts & Media (80.9%).
| Occupation | Male | Female |
| Management | 27 (31.4%) | 59 (68.6%) |
| Business & Financial | 0 (0.0%) | 7 (100.0%) |
| Computers, Engineering & Science | 8 (100.0%) | 0 (0.0%) |
| Computers & Mathematics | 0 (0.0%) | 0 (0.0%) |
| Architecture & Engineering | 0 (0.0%) | 0 (0.0%) |
| Life, Physical & Social Science | 8 (100.0%) | 0 (0.0%) |
| Community & Social Service | 30 (38.5%) | 48 (61.5%) |
| Education, Arts & Media | 4 (19.1%) | 17 (80.9%) |
| Legal Services & Support | 0 (0.0%) | 5 (100.0%) |
| Education Instruction & Library | 26 (50.0%) | 26 (50.0%) |
| Arts, Media & Entertainment | 0 (0.0%) | 0 (0.0%) |
| Health Diagnosing & Treating | 19 (57.6%) | 14 (42.4%) |
| Health Technologists | 17 (73.9%) | 6 (26.1%) |
| Total (Category) | 84 (39.6%) | 128 (60.4%) |
| Total (Overall) | 352 (44.1%) | 446 (55.9%) |
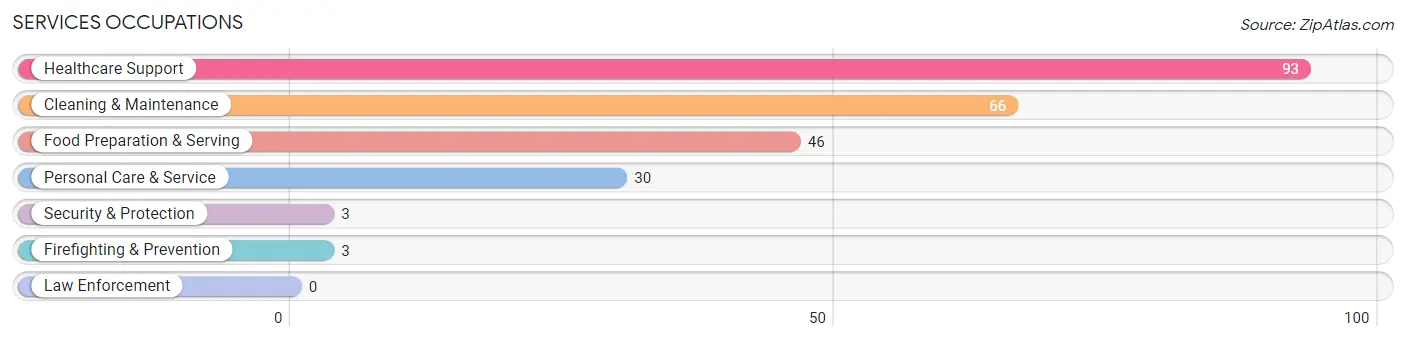
Services Occupations
The most common Services occupations in Greensburg are Healthcare Support (93 | 11.7%), Cleaning & Maintenance (66 | 8.3%), Food Preparation & Serving (46 | 5.8%), Personal Care & Service (30 | 3.8%), and Security & Protection (3 | 0.4%).
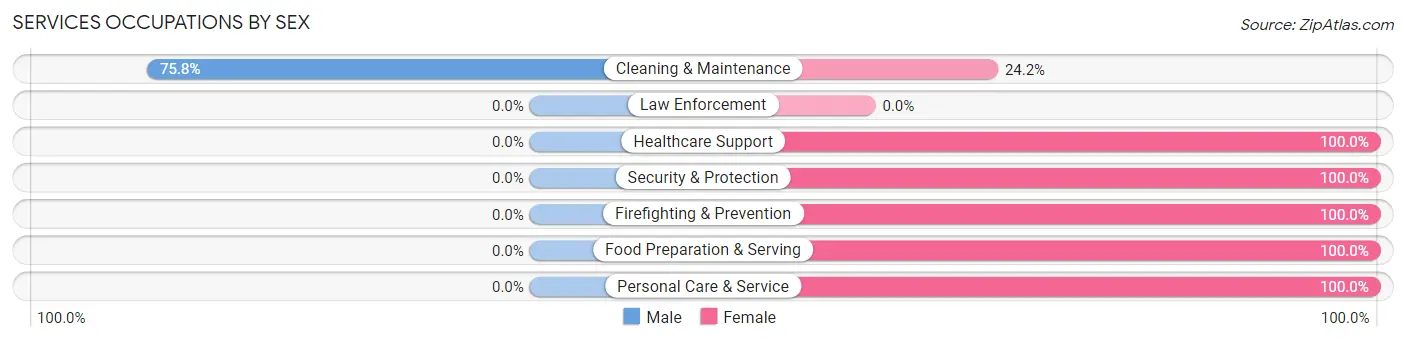
Services Occupations by Sex
| Occupation | Male | Female |
| Healthcare Support | 0 (0.0%) | 93 (100.0%) |
| Security & Protection | 0 (0.0%) | 3 (100.0%) |
| Firefighting & Prevention | 0 (0.0%) | 3 (100.0%) |
| Law Enforcement | 0 (0.0%) | 0 (0.0%) |
| Food Preparation & Serving | 0 (0.0%) | 46 (100.0%) |
| Cleaning & Maintenance | 50 (75.8%) | 16 (24.2%) |
| Personal Care & Service | 0 (0.0%) | 30 (100.0%) |
| Total (Category) | 50 (21.0%) | 188 (79.0%) |
| Total (Overall) | 352 (44.1%) | 446 (55.9%) |
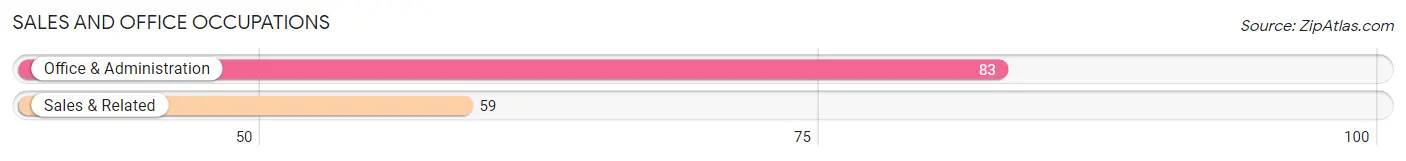
Sales and Office Occupations
The most common Sales and Office occupations in Greensburg are Office & Administration (83 | 10.4%), and Sales & Related (59 | 7.4%).
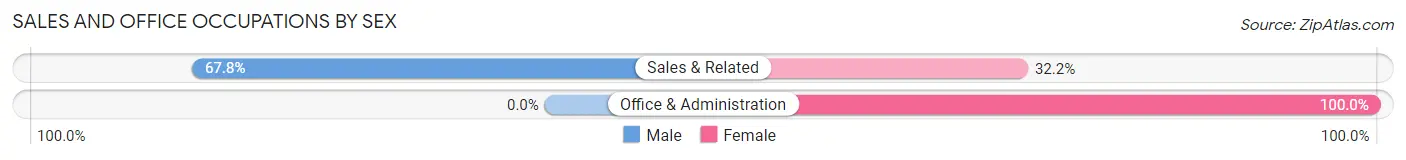
Sales and Office Occupations by Sex
| Occupation | Male | Female |
| Sales & Related | 40 (67.8%) | 19 (32.2%) |
| Office & Administration | 0 (0.0%) | 83 (100.0%) |
| Total (Category) | 40 (28.2%) | 102 (71.8%) |
| Total (Overall) | 352 (44.1%) | 446 (55.9%) |
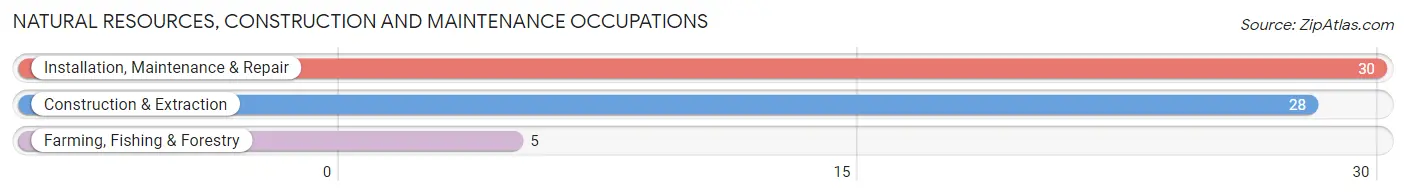
Natural Resources, Construction and Maintenance Occupations
The most common Natural Resources, Construction and Maintenance occupations in Greensburg are Installation, Maintenance & Repair (30 | 3.8%), Construction & Extraction (28 | 3.5%), and Farming, Fishing & Forestry (5 | 0.6%).
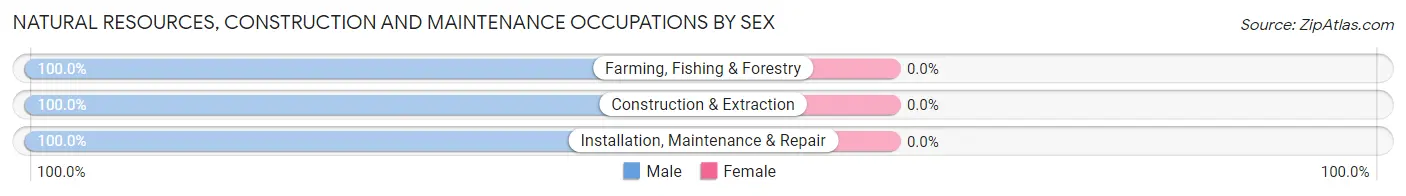
Natural Resources, Construction and Maintenance Occupations by Sex
| Occupation | Male | Female |
| Farming, Fishing & Forestry | 5 (100.0%) | 0 (0.0%) |
| Construction & Extraction | 28 (100.0%) | 0 (0.0%) |
| Installation, Maintenance & Repair | 30 (100.0%) | 0 (0.0%) |
| Total (Category) | 63 (100.0%) | 0 (0.0%) |
| Total (Overall) | 352 (44.1%) | 446 (55.9%) |
Production, Transportation and Moving Occupations
The most common Production, Transportation and Moving occupations in Greensburg are Production (80 | 10.0%), Transportation (43 | 5.4%), and Material Moving (20 | 2.5%).
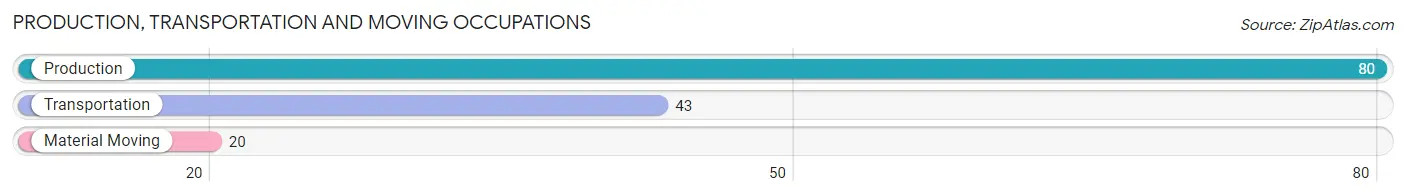
Production, Transportation and Moving Occupations by Sex
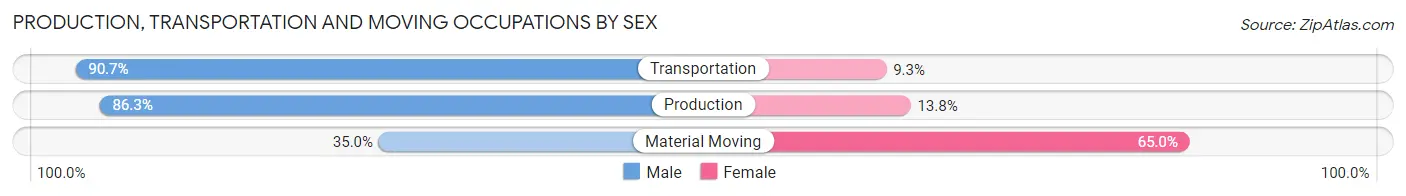
| Occupation | Male | Female |
| Production | 69 (86.3%) | 11 (13.8%) |
| Transportation | 39 (90.7%) | 4 (9.3%) |
| Material Moving | 7 (35.0%) | 13 (65.0%) |
| Total (Category) | 115 (80.4%) | 28 (19.6%) |
| Total (Overall) | 352 (44.1%) | 446 (55.9%) |
Employment Industries by Sex in Greensburg
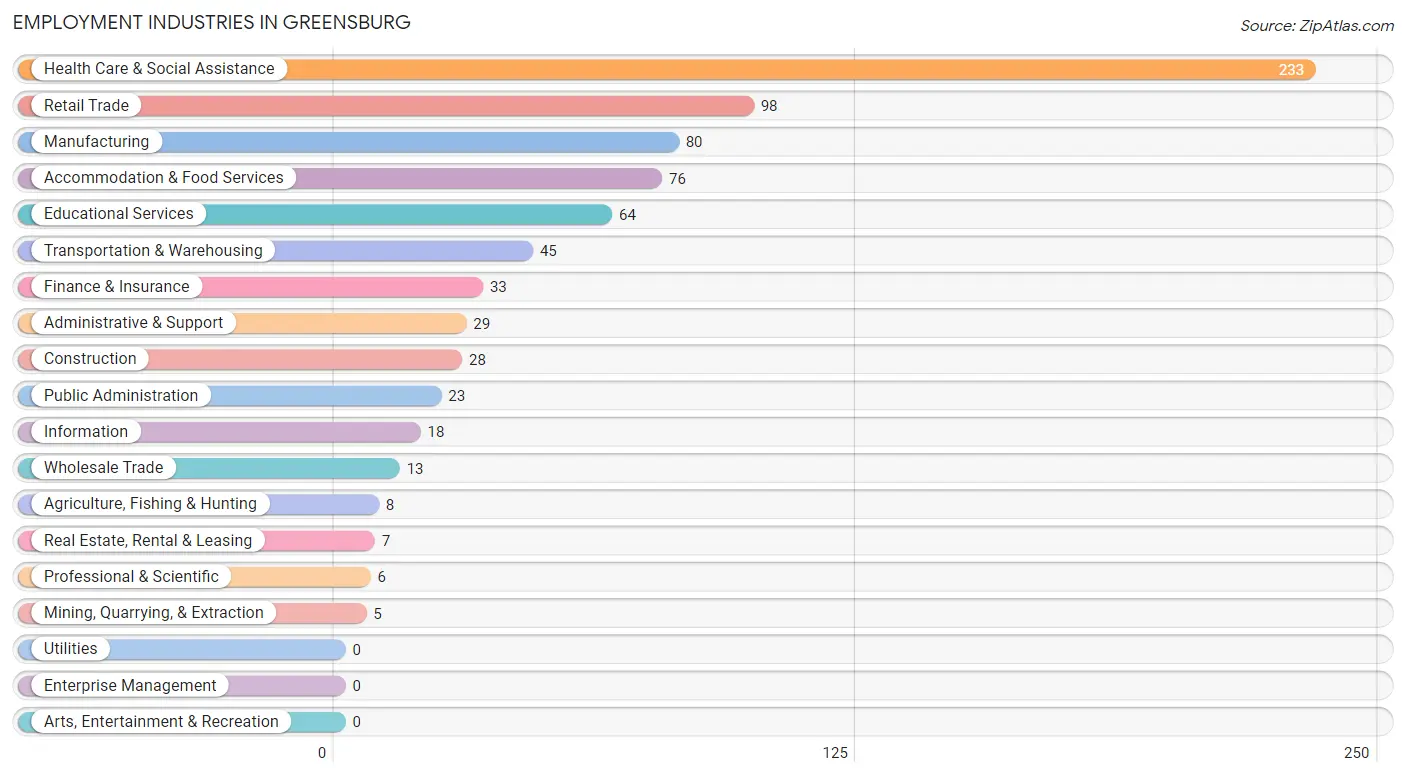
Employment Industries in Greensburg
The major employment industries in Greensburg include Health Care & Social Assistance (233 | 29.2%), Retail Trade (98 | 12.3%), Manufacturing (80 | 10.0%), Accommodation & Food Services (76 | 9.5%), and Educational Services (64 | 8.0%).
Employment Industries by Sex in Greensburg
The Greensburg industries that see more men than women are Agriculture, Fishing & Hunting (100.0%), Mining, Quarrying, & Extraction (100.0%), and Construction (100.0%), whereas the industries that tend to have a higher number of women are Finance & Insurance (100.0%), Health Care & Social Assistance (86.3%), and Accommodation & Food Services (76.3%).
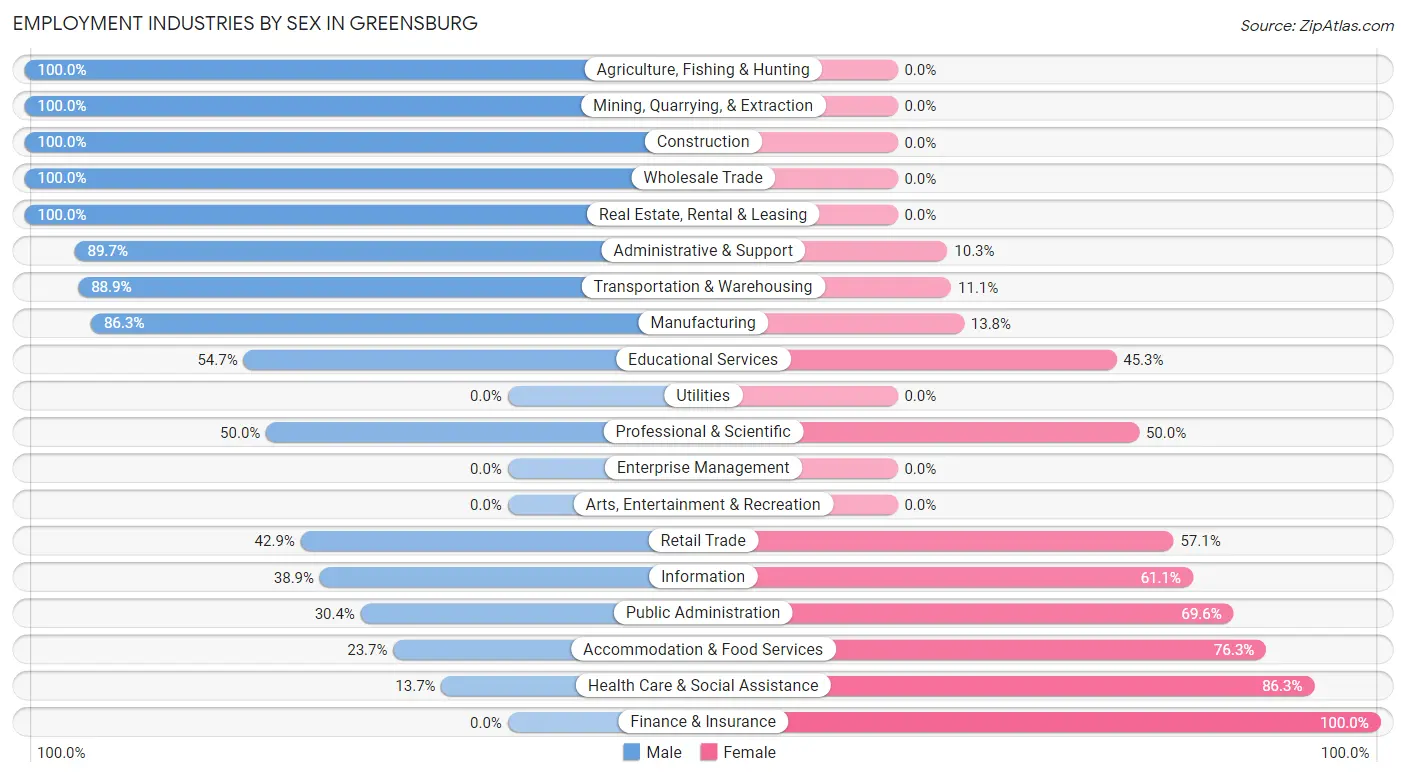
| Industry | Male | Female |
| Agriculture, Fishing & Hunting | 8 (100.0%) | 0 (0.0%) |
| Mining, Quarrying, & Extraction | 5 (100.0%) | 0 (0.0%) |
| Construction | 28 (100.0%) | 0 (0.0%) |
| Manufacturing | 69 (86.3%) | 11 (13.8%) |
| Wholesale Trade | 13 (100.0%) | 0 (0.0%) |
| Retail Trade | 42 (42.9%) | 56 (57.1%) |
| Transportation & Warehousing | 40 (88.9%) | 5 (11.1%) |
| Utilities | 0 (0.0%) | 0 (0.0%) |
| Information | 7 (38.9%) | 11 (61.1%) |
| Finance & Insurance | 0 (0.0%) | 33 (100.0%) |
| Real Estate, Rental & Leasing | 7 (100.0%) | 0 (0.0%) |
| Professional & Scientific | 3 (50.0%) | 3 (50.0%) |
| Enterprise Management | 0 (0.0%) | 0 (0.0%) |
| Administrative & Support | 26 (89.7%) | 3 (10.3%) |
| Educational Services | 35 (54.7%) | 29 (45.3%) |
| Health Care & Social Assistance | 32 (13.7%) | 201 (86.3%) |
| Arts, Entertainment & Recreation | 0 (0.0%) | 0 (0.0%) |
| Accommodation & Food Services | 18 (23.7%) | 58 (76.3%) |
| Public Administration | 7 (30.4%) | 16 (69.6%) |
| Total | 352 (44.1%) | 446 (55.9%) |
Education in Greensburg
School Enrollment in Greensburg
The most common levels of schooling among the 530 students in Greensburg are middle school (140 | 26.4%), high school (114 | 21.5%), and college / undergraduate (93 | 17.5%).
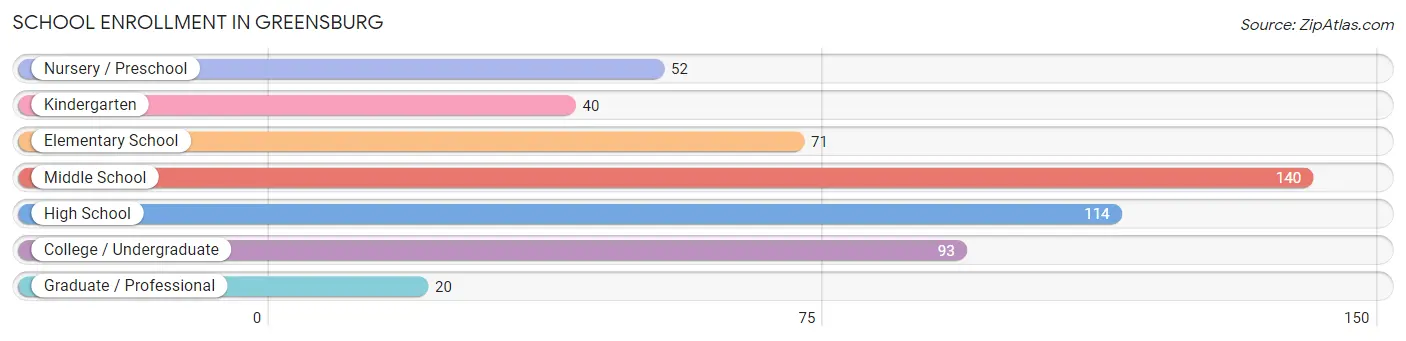
| School Level | # Students | % Students |
| Nursery / Preschool | 52 | 9.8% |
| Kindergarten | 40 | 7.5% |
| Elementary School | 71 | 13.4% |
| Middle School | 140 | 26.4% |
| High School | 114 | 21.5% |
| College / Undergraduate | 93 | 17.5% |
| Graduate / Professional | 20 | 3.8% |
| Total | 530 | 100.0% |
School Enrollment by Age by Funding Source in Greensburg
Out of a total of 530 students who are enrolled in schools in Greensburg, 34 (6.4%) attend a private institution, while the remaining 496 (93.6%) are enrolled in public schools. The age group of 25 to 34 year olds has the highest likelihood of being enrolled in private schools, with 8 (27.6% in the age bracket) enrolled. Conversely, the age group of 3 to 4 year olds has the lowest likelihood of being enrolled in a private school, with 46 (100.0% in the age bracket) attending a public institution.
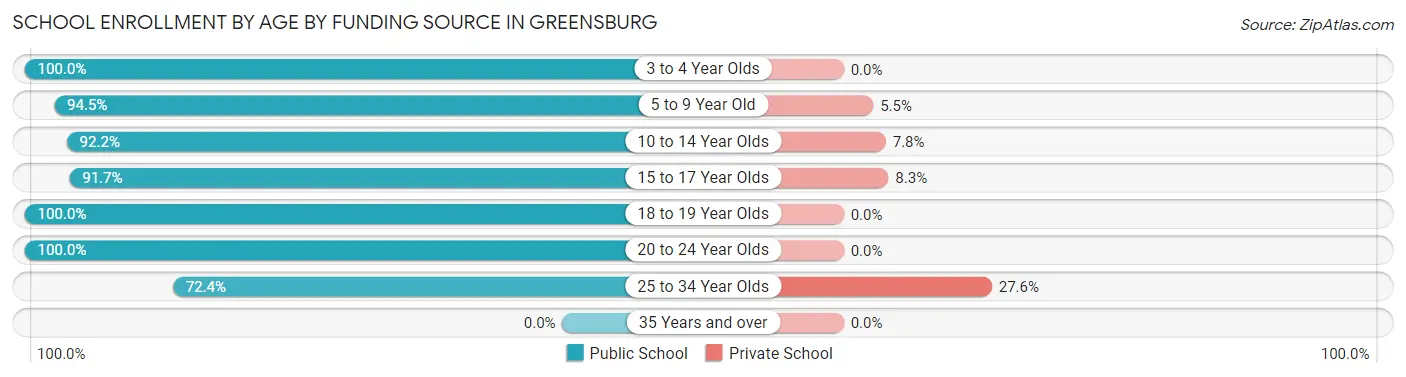
| Age Bracket | Public School | Private School |
| 3 to 4 Year Olds | 46 (100.0%) | 0 (0.0%) |
| 5 to 9 Year Old | 103 (94.5%) | 6 (5.5%) |
| 10 to 14 Year Olds | 141 (92.2%) | 12 (7.8%) |
| 15 to 17 Year Olds | 88 (91.7%) | 8 (8.3%) |
| 18 to 19 Year Olds | 67 (100.0%) | 0 (0.0%) |
| 20 to 24 Year Olds | 30 (100.0%) | 0 (0.0%) |
| 25 to 34 Year Olds | 21 (72.4%) | 8 (27.6%) |
| 35 Years and over | 0 (0.0%) | 0 (0.0%) |
| Total | 496 (93.6%) | 34 (6.4%) |
Educational Attainment by Field of Study in Greensburg
Education (59 | 29.5%), liberal arts & history (22 | 11.0%), literature & languages (21 | 10.5%), arts & humanities (21 | 10.5%), and communications (17 | 8.5%) are the most common fields of study among 200 individuals in Greensburg who have obtained a bachelor's degree or higher.
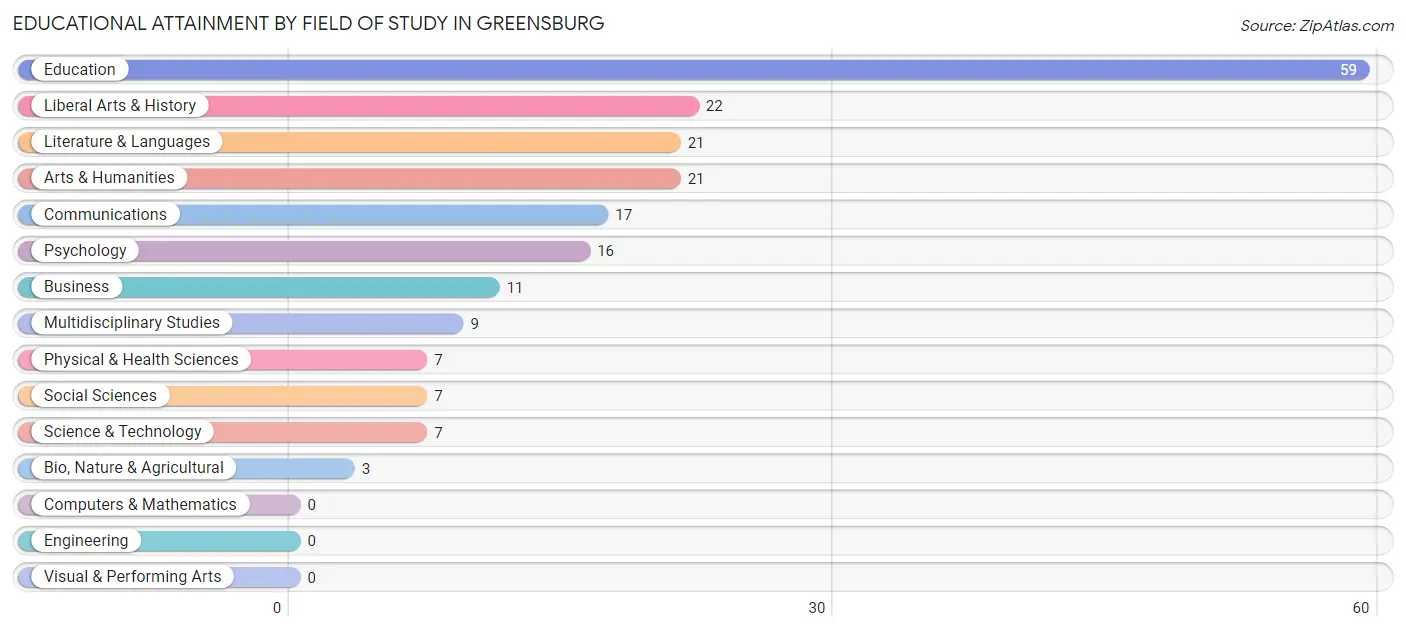
| Field of Study | # Graduates | % Graduates |
| Computers & Mathematics | 0 | 0.0% |
| Bio, Nature & Agricultural | 3 | 1.5% |
| Physical & Health Sciences | 7 | 3.5% |
| Psychology | 16 | 8.0% |
| Social Sciences | 7 | 3.5% |
| Engineering | 0 | 0.0% |
| Multidisciplinary Studies | 9 | 4.5% |
| Science & Technology | 7 | 3.5% |
| Business | 11 | 5.5% |
| Education | 59 | 29.5% |
| Literature & Languages | 21 | 10.5% |
| Liberal Arts & History | 22 | 11.0% |
| Visual & Performing Arts | 0 | 0.0% |
| Communications | 17 | 8.5% |
| Arts & Humanities | 21 | 10.5% |
| Total | 200 | 100.0% |
Transportation & Commute in Greensburg
Vehicle Availability by Sex in Greensburg
The most prevalent vehicle ownership categories in Greensburg are males with 2 vehicles (142, accounting for 41.3%) and females with 2 vehicles (148, making up 32.4%).
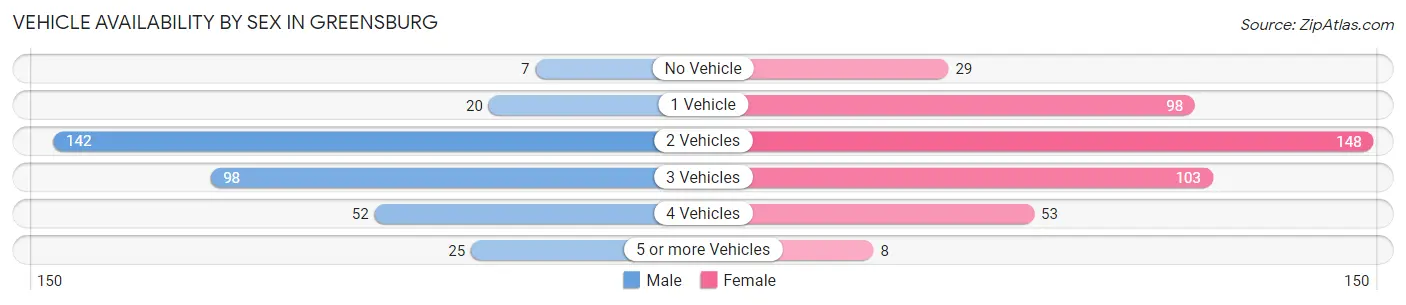
| Vehicles Available | Male | Female |
| No Vehicle | 7 (2.0%) | 29 (6.6%) |
| 1 Vehicle | 20 (5.8%) | 98 (22.3%) |
| 2 Vehicles | 142 (41.3%) | 148 (33.7%) |
| 3 Vehicles | 98 (28.5%) | 103 (23.5%) |
| 4 Vehicles | 52 (15.1%) | 53 (12.1%) |
| 5 or more Vehicles | 25 (7.3%) | 8 (1.8%) |
| Total | 344 (100.0%) | 439 (100.0%) |
Commute Time in Greensburg
The most frequently occuring commute durations in Greensburg are 5 to 9 minutes (150 commuters, 19.7%), 15 to 19 minutes (109 commuters, 14.3%), and 20 to 24 minutes (88 commuters, 11.6%).
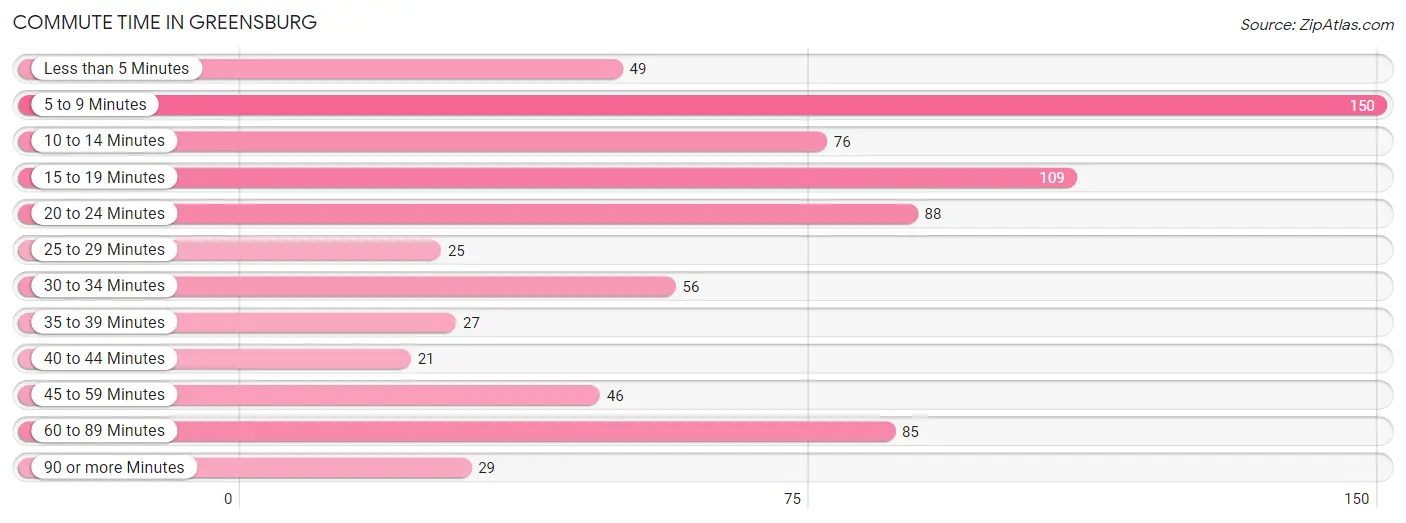
| Commute Time | # Commuters | % Commuters |
| Less than 5 Minutes | 49 | 6.4% |
| 5 to 9 Minutes | 150 | 19.7% |
| 10 to 14 Minutes | 76 | 10.0% |
| 15 to 19 Minutes | 109 | 14.3% |
| 20 to 24 Minutes | 88 | 11.6% |
| 25 to 29 Minutes | 25 | 3.3% |
| 30 to 34 Minutes | 56 | 7.4% |
| 35 to 39 Minutes | 27 | 3.5% |
| 40 to 44 Minutes | 21 | 2.8% |
| 45 to 59 Minutes | 46 | 6.0% |
| 60 to 89 Minutes | 85 | 11.2% |
| 90 or more Minutes | 29 | 3.8% |
Commute Time by Sex in Greensburg
The most common commute times in Greensburg are 15 to 19 minutes (61 commuters, 18.3%) for males and 5 to 9 minutes (91 commuters, 21.3%) for females.
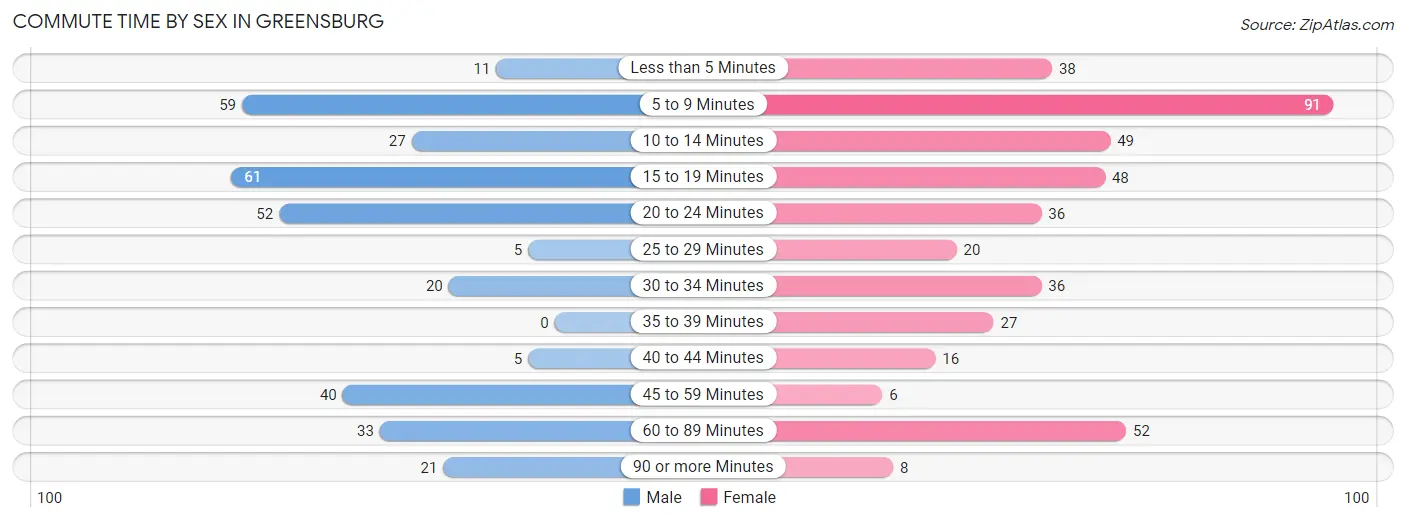
| Commute Time | Male | Female |
| Less than 5 Minutes | 11 (3.3%) | 38 (8.9%) |
| 5 to 9 Minutes | 59 (17.7%) | 91 (21.3%) |
| 10 to 14 Minutes | 27 (8.1%) | 49 (11.5%) |
| 15 to 19 Minutes | 61 (18.3%) | 48 (11.2%) |
| 20 to 24 Minutes | 52 (15.6%) | 36 (8.4%) |
| 25 to 29 Minutes | 5 (1.5%) | 20 (4.7%) |
| 30 to 34 Minutes | 20 (6.0%) | 36 (8.4%) |
| 35 to 39 Minutes | 0 (0.0%) | 27 (6.3%) |
| 40 to 44 Minutes | 5 (1.5%) | 16 (3.7%) |
| 45 to 59 Minutes | 40 (12.0%) | 6 (1.4%) |
| 60 to 89 Minutes | 33 (9.9%) | 52 (12.2%) |
| 90 or more Minutes | 21 (6.3%) | 8 (1.9%) |
Time of Departure to Work by Sex in Greensburg
The most frequent times of departure to work in Greensburg are 6:30 AM to 6:59 AM (85, 25.5%) for males and 6:30 AM to 6:59 AM (69, 16.2%) for females.
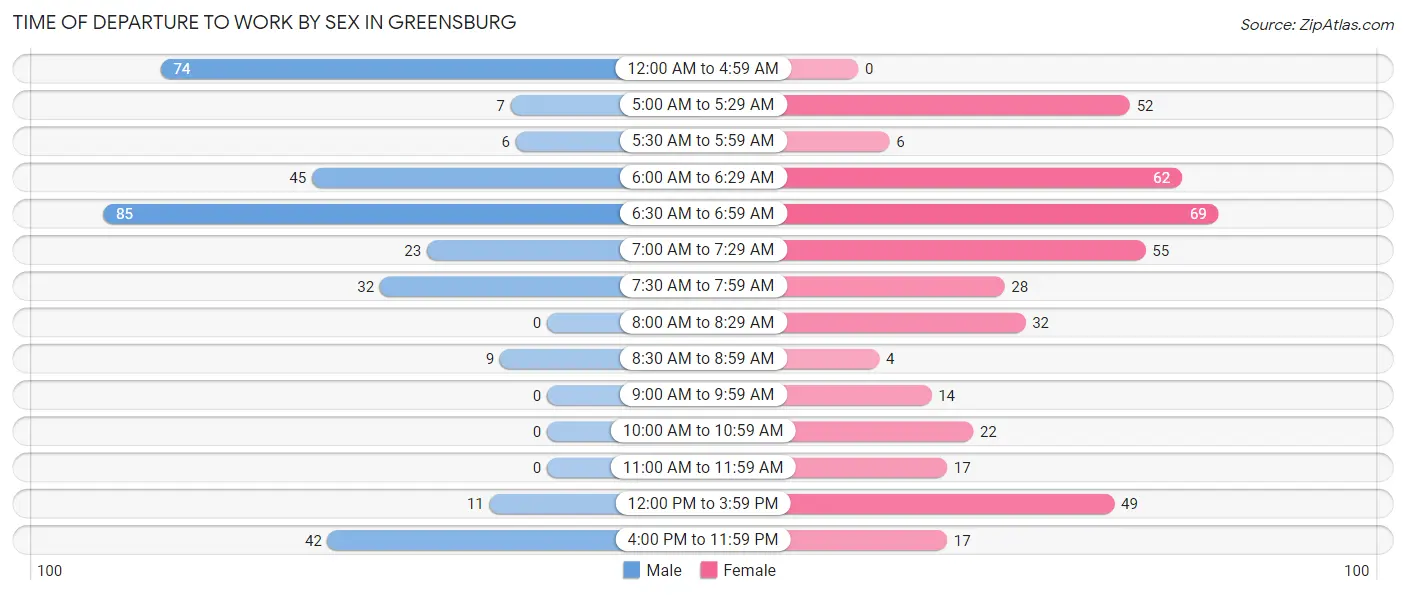
| Time of Departure | Male | Female |
| 12:00 AM to 4:59 AM | 74 (22.2%) | 0 (0.0%) |
| 5:00 AM to 5:29 AM | 7 (2.1%) | 52 (12.2%) |
| 5:30 AM to 5:59 AM | 6 (1.8%) | 6 (1.4%) |
| 6:00 AM to 6:29 AM | 45 (13.5%) | 62 (14.5%) |
| 6:30 AM to 6:59 AM | 85 (25.5%) | 69 (16.2%) |
| 7:00 AM to 7:29 AM | 23 (6.9%) | 55 (12.9%) |
| 7:30 AM to 7:59 AM | 32 (9.6%) | 28 (6.6%) |
| 8:00 AM to 8:29 AM | 0 (0.0%) | 32 (7.5%) |
| 8:30 AM to 8:59 AM | 9 (2.7%) | 4 (0.9%) |
| 9:00 AM to 9:59 AM | 0 (0.0%) | 14 (3.3%) |
| 10:00 AM to 10:59 AM | 0 (0.0%) | 22 (5.1%) |
| 11:00 AM to 11:59 AM | 0 (0.0%) | 17 (4.0%) |
| 12:00 PM to 3:59 PM | 11 (3.3%) | 49 (11.5%) |
| 4:00 PM to 11:59 PM | 42 (12.6%) | 17 (4.0%) |
| Total | 334 (100.0%) | 427 (100.0%) |
Housing Occupancy in Greensburg
Occupancy by Ownership in Greensburg
Of the total 762 dwellings in Greensburg, owner-occupied units account for 409 (53.7%), while renter-occupied units make up 353 (46.3%).
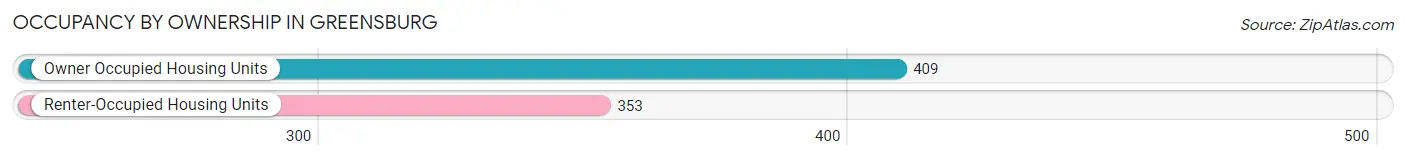
| Occupancy | # Housing Units | % Housing Units |
| Owner Occupied Housing Units | 409 | 53.7% |
| Renter-Occupied Housing Units | 353 | 46.3% |
| Total Occupied Housing Units | 762 | 100.0% |
Occupancy by Household Size in Greensburg
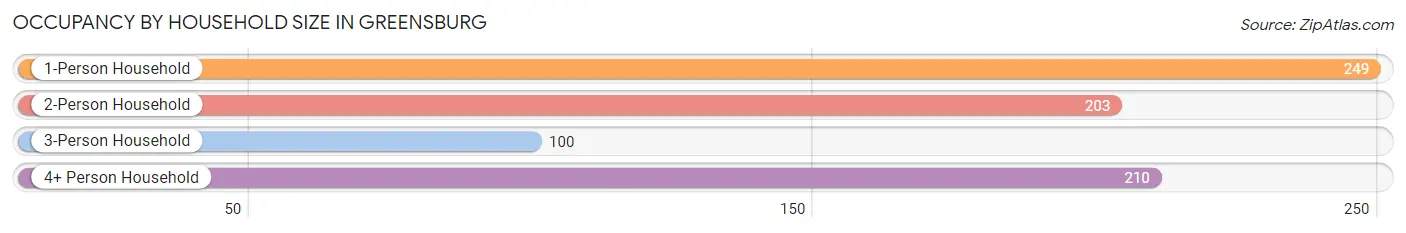
| Household Size | # Housing Units | % Housing Units |
| 1-Person Household | 249 | 32.7% |
| 2-Person Household | 203 | 26.6% |
| 3-Person Household | 100 | 13.1% |
| 4+ Person Household | 210 | 27.6% |
| Total Housing Units | 762 | 100.0% |
Occupancy by Ownership by Household Size in Greensburg
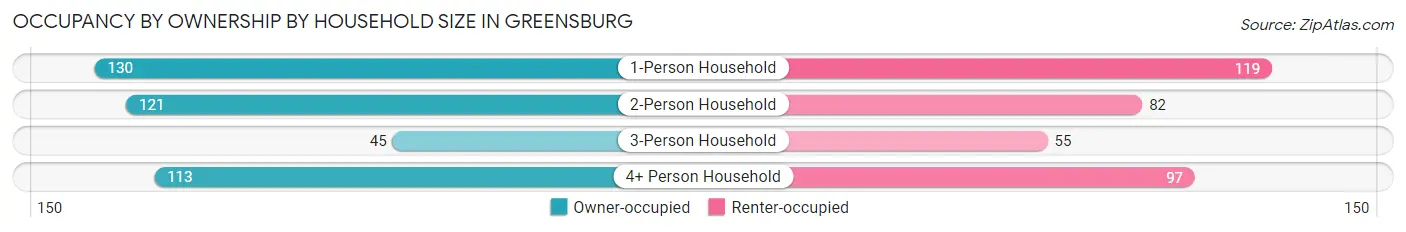
| Household Size | Owner-occupied | Renter-occupied |
| 1-Person Household | 130 (52.2%) | 119 (47.8%) |
| 2-Person Household | 121 (59.6%) | 82 (40.4%) |
| 3-Person Household | 45 (45.0%) | 55 (55.0%) |
| 4+ Person Household | 113 (53.8%) | 97 (46.2%) |
| Total Housing Units | 409 (53.7%) | 353 (46.3%) |
Occupancy by Educational Attainment in Greensburg
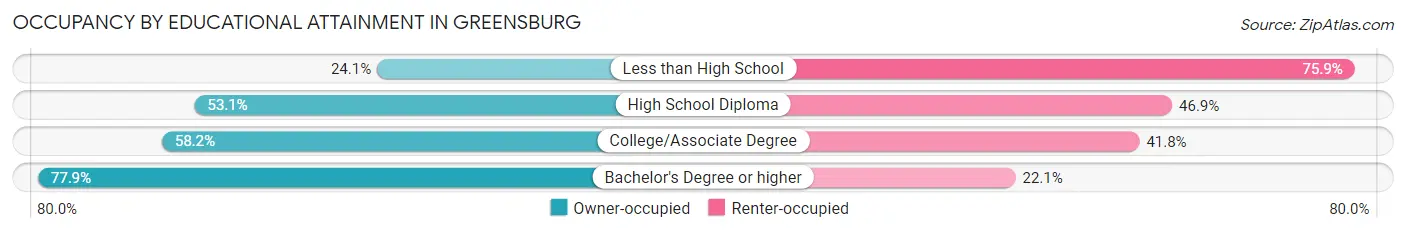
| Household Size | Owner-occupied | Renter-occupied |
| Less than High School | 27 (24.1%) | 85 (75.9%) |
| High School Diploma | 156 (53.1%) | 138 (46.9%) |
| College/Associate Degree | 152 (58.2%) | 109 (41.8%) |
| Bachelor's Degree or higher | 74 (77.9%) | 21 (22.1%) |
Occupancy by Age of Householder in Greensburg
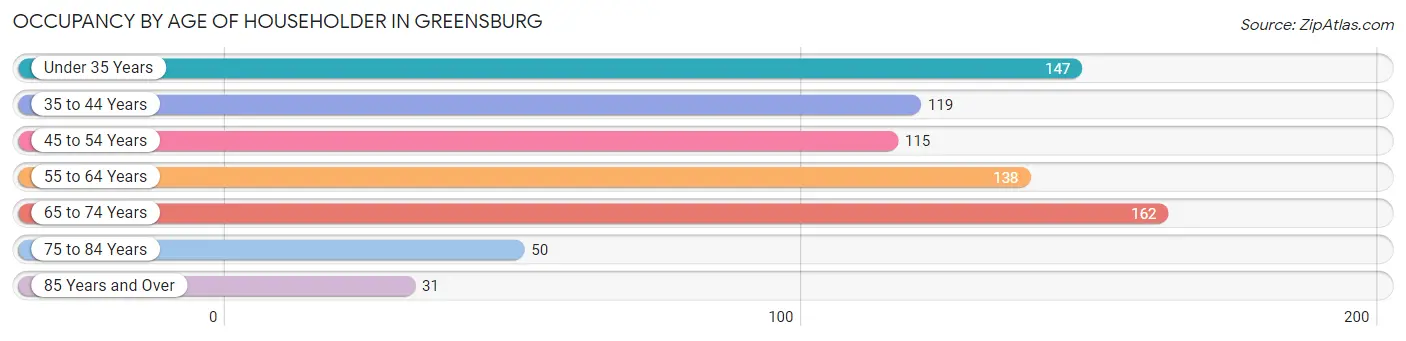
| Age Bracket | # Households | % Households |
| Under 35 Years | 147 | 19.3% |
| 35 to 44 Years | 119 | 15.6% |
| 45 to 54 Years | 115 | 15.1% |
| 55 to 64 Years | 138 | 18.1% |
| 65 to 74 Years | 162 | 21.3% |
| 75 to 84 Years | 50 | 6.6% |
| 85 Years and Over | 31 | 4.1% |
| Total | 762 | 100.0% |
Housing Finances in Greensburg
Median Income by Occupancy in Greensburg
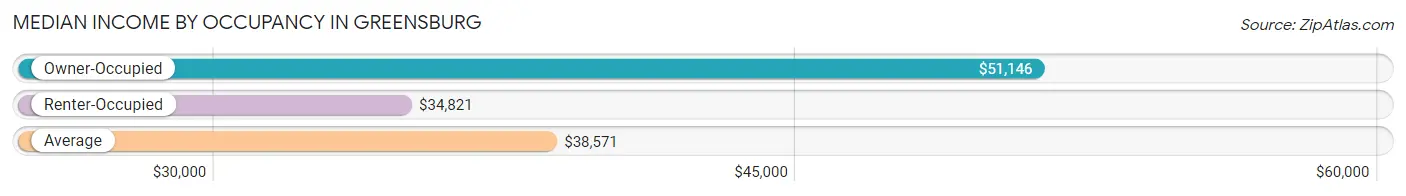
| Occupancy Type | # Households | Median Income |
| Owner-Occupied | 409 (53.7%) | $51,146 |
| Renter-Occupied | 353 (46.3%) | $34,821 |
| Average | 762 (100.0%) | $38,571 |
Occupancy by Householder Income Bracket in Greensburg
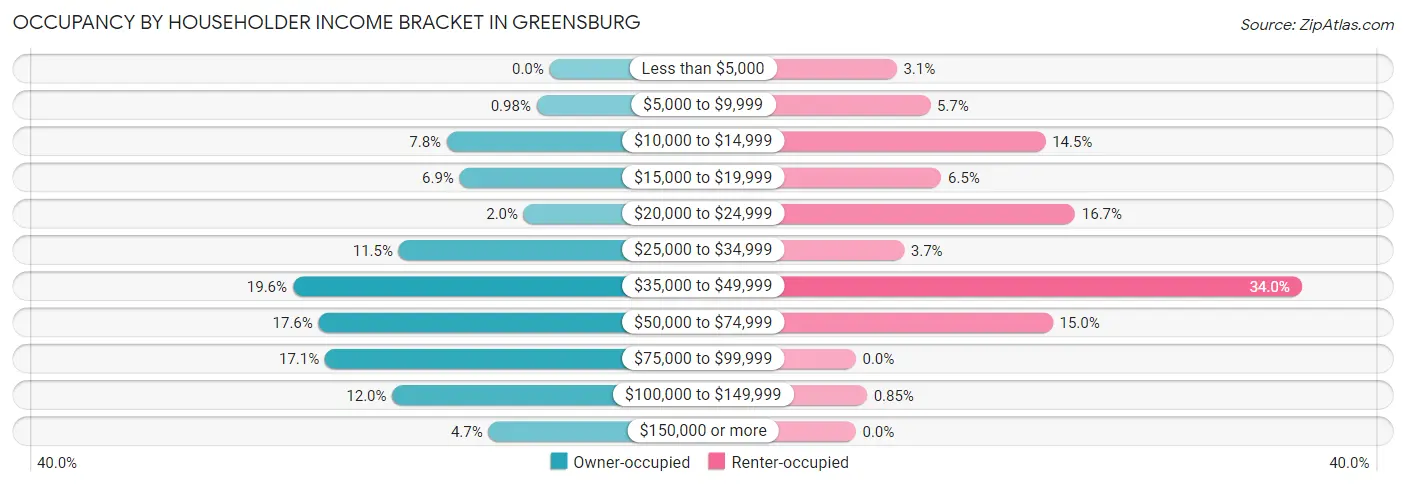
| Income Bracket | Owner-occupied | Renter-occupied |
| Less than $5,000 | 0 (0.0%) | 11 (3.1%) |
| $5,000 to $9,999 | 4 (1.0%) | 20 (5.7%) |
| $10,000 to $14,999 | 32 (7.8%) | 51 (14.4%) |
| $15,000 to $19,999 | 28 (6.9%) | 23 (6.5%) |
| $20,000 to $24,999 | 8 (2.0%) | 59 (16.7%) |
| $25,000 to $34,999 | 47 (11.5%) | 13 (3.7%) |
| $35,000 to $49,999 | 80 (19.6%) | 120 (34.0%) |
| $50,000 to $74,999 | 72 (17.6%) | 53 (15.0%) |
| $75,000 to $99,999 | 70 (17.1%) | 0 (0.0%) |
| $100,000 to $149,999 | 49 (12.0%) | 3 (0.9%) |
| $150,000 or more | 19 (4.6%) | 0 (0.0%) |
| Total | 409 (100.0%) | 353 (100.0%) |
Monthly Housing Cost Tiers in Greensburg
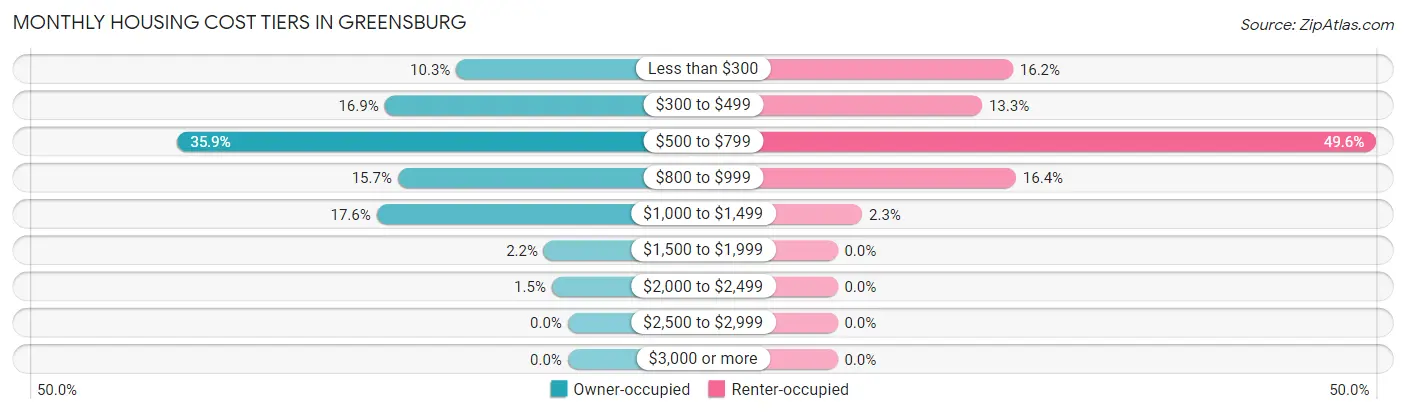
| Monthly Cost | Owner-occupied | Renter-occupied |
| Less than $300 | 42 (10.3%) | 57 (16.2%) |
| $300 to $499 | 69 (16.9%) | 47 (13.3%) |
| $500 to $799 | 147 (35.9%) | 175 (49.6%) |
| $800 to $999 | 64 (15.7%) | 58 (16.4%) |
| $1,000 to $1,499 | 72 (17.6%) | 8 (2.3%) |
| $1,500 to $1,999 | 9 (2.2%) | 0 (0.0%) |
| $2,000 to $2,499 | 6 (1.5%) | 0 (0.0%) |
| $2,500 to $2,999 | 0 (0.0%) | 0 (0.0%) |
| $3,000 or more | 0 (0.0%) | 0 (0.0%) |
| Total | 409 (100.0%) | 353 (100.0%) |
Physical Housing Characteristics in Greensburg
Housing Structures in Greensburg
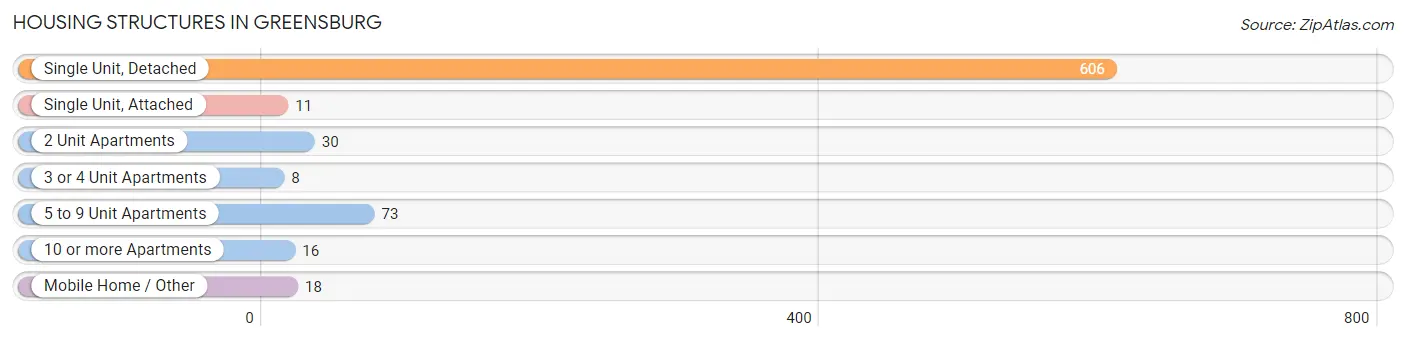
| Structure Type | # Housing Units | % Housing Units |
| Single Unit, Detached | 606 | 79.5% |
| Single Unit, Attached | 11 | 1.4% |
| 2 Unit Apartments | 30 | 3.9% |
| 3 or 4 Unit Apartments | 8 | 1.1% |
| 5 to 9 Unit Apartments | 73 | 9.6% |
| 10 or more Apartments | 16 | 2.1% |
| Mobile Home / Other | 18 | 2.4% |
| Total | 762 | 100.0% |
Housing Structures by Occupancy in Greensburg
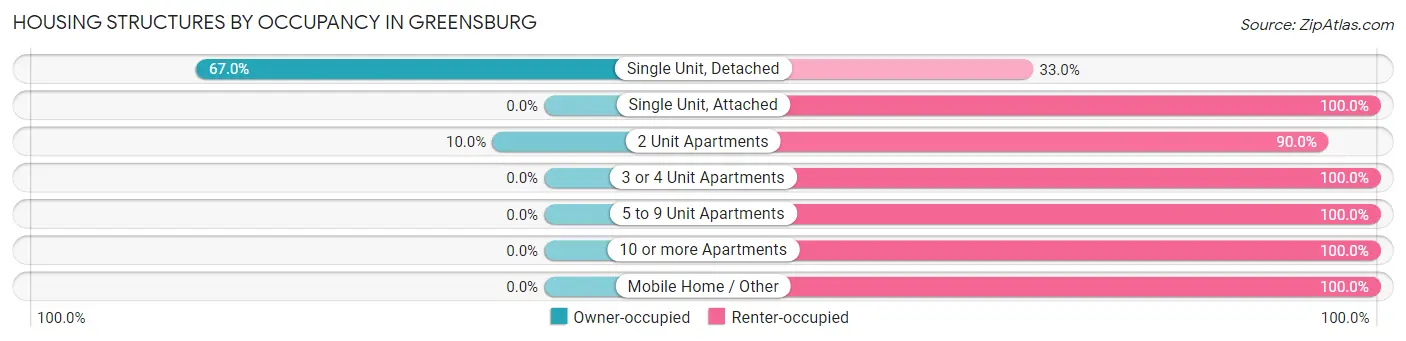
| Structure Type | Owner-occupied | Renter-occupied |
| Single Unit, Detached | 406 (67.0%) | 200 (33.0%) |
| Single Unit, Attached | 0 (0.0%) | 11 (100.0%) |
| 2 Unit Apartments | 3 (10.0%) | 27 (90.0%) |
| 3 or 4 Unit Apartments | 0 (0.0%) | 8 (100.0%) |
| 5 to 9 Unit Apartments | 0 (0.0%) | 73 (100.0%) |
| 10 or more Apartments | 0 (0.0%) | 16 (100.0%) |
| Mobile Home / Other | 0 (0.0%) | 18 (100.0%) |
| Total | 409 (53.7%) | 353 (46.3%) |
Housing Structures by Number of Rooms in Greensburg
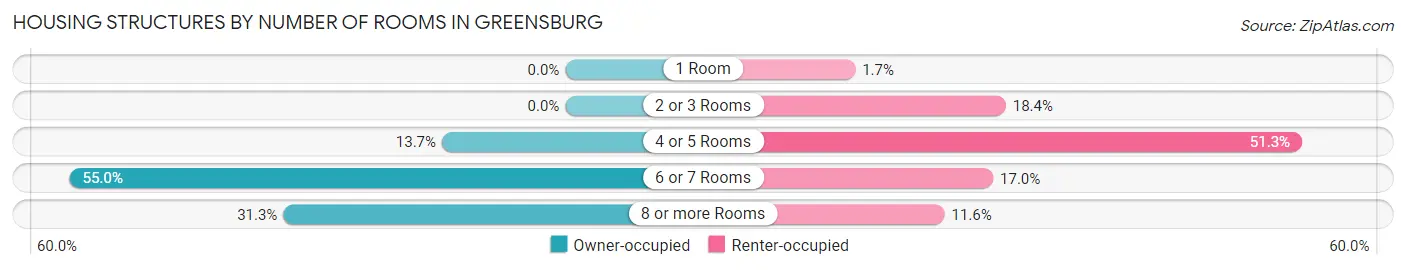
| Number of Rooms | Owner-occupied | Renter-occupied |
| 1 Room | 0 (0.0%) | 6 (1.7%) |
| 2 or 3 Rooms | 0 (0.0%) | 65 (18.4%) |
| 4 or 5 Rooms | 56 (13.7%) | 181 (51.3%) |
| 6 or 7 Rooms | 225 (55.0%) | 60 (17.0%) |
| 8 or more Rooms | 128 (31.3%) | 41 (11.6%) |
| Total | 409 (100.0%) | 353 (100.0%) |
Housing Structure by Heating Type in Greensburg
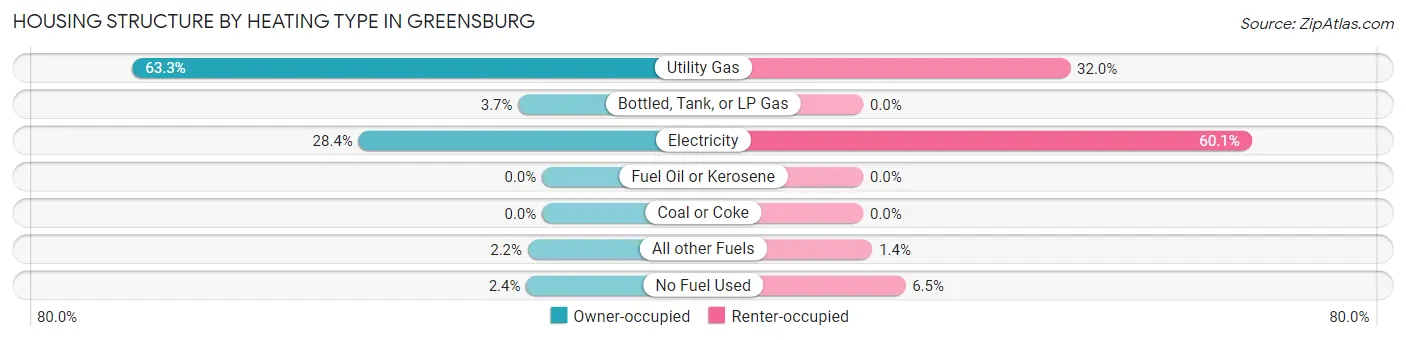
| Heating Type | Owner-occupied | Renter-occupied |
| Utility Gas | 259 (63.3%) | 113 (32.0%) |
| Bottled, Tank, or LP Gas | 15 (3.7%) | 0 (0.0%) |
| Electricity | 116 (28.4%) | 212 (60.1%) |
| Fuel Oil or Kerosene | 0 (0.0%) | 0 (0.0%) |
| Coal or Coke | 0 (0.0%) | 0 (0.0%) |
| All other Fuels | 9 (2.2%) | 5 (1.4%) |
| No Fuel Used | 10 (2.4%) | 23 (6.5%) |
| Total | 409 (100.0%) | 353 (100.0%) |
Household Vehicle Usage in Greensburg
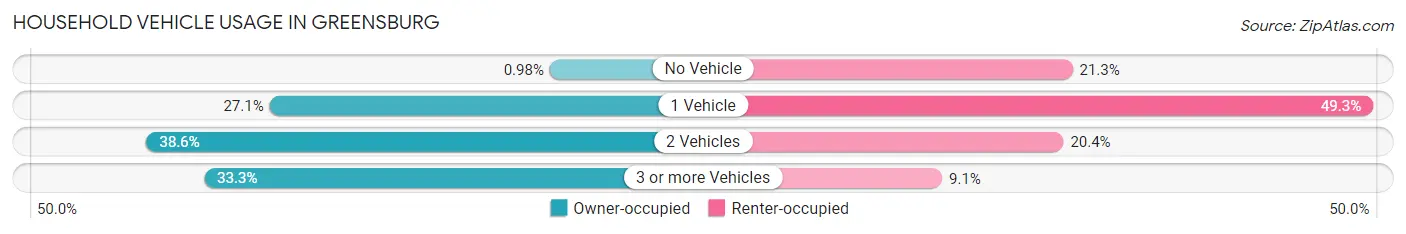
| Vehicles per Household | Owner-occupied | Renter-occupied |
| No Vehicle | 4 (1.0%) | 75 (21.2%) |
| 1 Vehicle | 111 (27.1%) | 174 (49.3%) |
| 2 Vehicles | 158 (38.6%) | 72 (20.4%) |
| 3 or more Vehicles | 136 (33.3%) | 32 (9.1%) |
| Total | 409 (100.0%) | 353 (100.0%) |
Real Estate & Mortgages in Greensburg
Real Estate and Mortgage Overview in Greensburg
| Characteristic | Without Mortgage | With Mortgage |
| Housing Units | 167 | 242 |
| Median Property Value | $127,500 | $102,500 |
| Median Household Income | $36,950 | $15 |
| Monthly Housing Costs | $432 | $0 |
| Real Estate Taxes | $914 | $0 |
Property Value by Mortgage Status in Greensburg
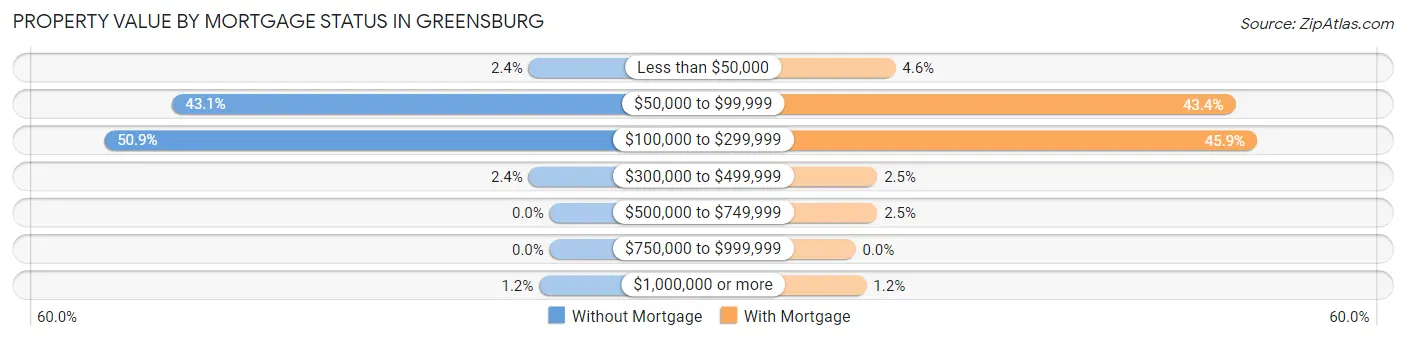
| Property Value | Without Mortgage | With Mortgage |
| Less than $50,000 | 4 (2.4%) | 11 (4.5%) |
| $50,000 to $99,999 | 72 (43.1%) | 105 (43.4%) |
| $100,000 to $299,999 | 85 (50.9%) | 111 (45.9%) |
| $300,000 to $499,999 | 4 (2.4%) | 6 (2.5%) |
| $500,000 to $749,999 | 0 (0.0%) | 6 (2.5%) |
| $750,000 to $999,999 | 0 (0.0%) | 0 (0.0%) |
| $1,000,000 or more | 2 (1.2%) | 3 (1.2%) |
| Total | 167 (100.0%) | 242 (100.0%) |
Household Income by Mortgage Status in Greensburg
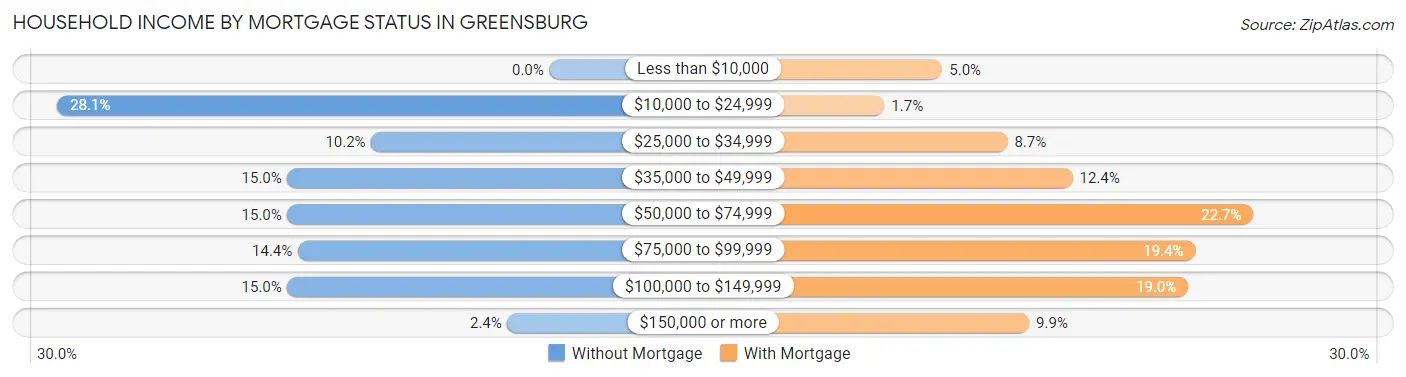
| Household Income | Without Mortgage | With Mortgage |
| Less than $10,000 | 0 (0.0%) | 12 (5.0%) |
| $10,000 to $24,999 | 47 (28.1%) | 4 (1.7%) |
| $25,000 to $34,999 | 17 (10.2%) | 21 (8.7%) |
| $35,000 to $49,999 | 25 (15.0%) | 30 (12.4%) |
| $50,000 to $74,999 | 25 (15.0%) | 55 (22.7%) |
| $75,000 to $99,999 | 24 (14.4%) | 47 (19.4%) |
| $100,000 to $149,999 | 25 (15.0%) | 46 (19.0%) |
| $150,000 or more | 4 (2.4%) | 24 (9.9%) |
| Total | 167 (100.0%) | 242 (100.0%) |
Property Value to Household Income Ratio in Greensburg
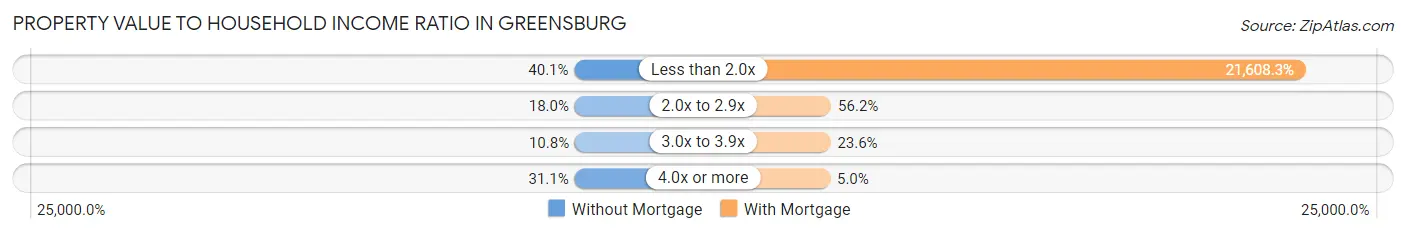
| Value-to-Income Ratio | Without Mortgage | With Mortgage |
| Less than 2.0x | 67 (40.1%) | 52,292 (21,608.3%) |
| 2.0x to 2.9x | 30 (18.0%) | 136 (56.2%) |
| 3.0x to 3.9x | 18 (10.8%) | 57 (23.5%) |
| 4.0x or more | 52 (31.1%) | 12 (5.0%) |
| Total | 167 (100.0%) | 242 (100.0%) |
Real Estate Taxes by Mortgage Status in Greensburg
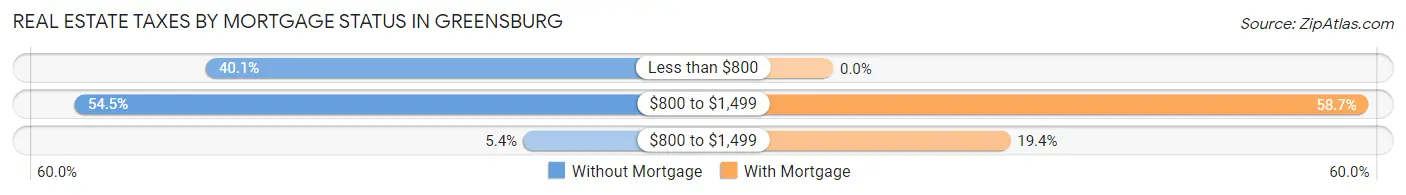
| Property Taxes | Without Mortgage | With Mortgage |
| Less than $800 | 67 (40.1%) | 0 (0.0%) |
| $800 to $1,499 | 91 (54.5%) | 142 (58.7%) |
| $800 to $1,499 | 9 (5.4%) | 47 (19.4%) |
| Total | 167 (100.0%) | 242 (100.0%) |
Health & Disability in Greensburg
Health Insurance Coverage by Age in Greensburg
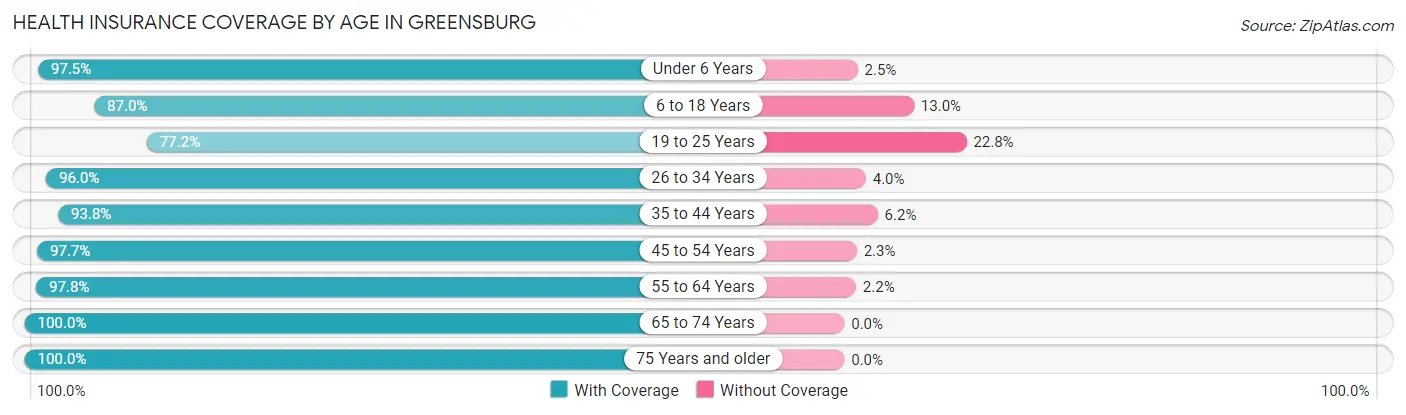
| Age Bracket | With Coverage | Without Coverage |
| Under 6 Years | 236 (97.5%) | 6 (2.5%) |
| 6 to 18 Years | 389 (87.0%) | 58 (13.0%) |
| 19 to 25 Years | 61 (77.2%) | 18 (22.8%) |
| 26 to 34 Years | 287 (96.0%) | 12 (4.0%) |
| 35 to 44 Years | 226 (93.8%) | 15 (6.2%) |
| 45 to 54 Years | 253 (97.7%) | 6 (2.3%) |
| 55 to 64 Years | 226 (97.8%) | 5 (2.2%) |
| 65 to 74 Years | 234 (100.0%) | 0 (0.0%) |
| 75 Years and older | 145 (100.0%) | 0 (0.0%) |
| Total | 2,057 (94.5%) | 120 (5.5%) |
Health Insurance Coverage by Citizenship Status in Greensburg
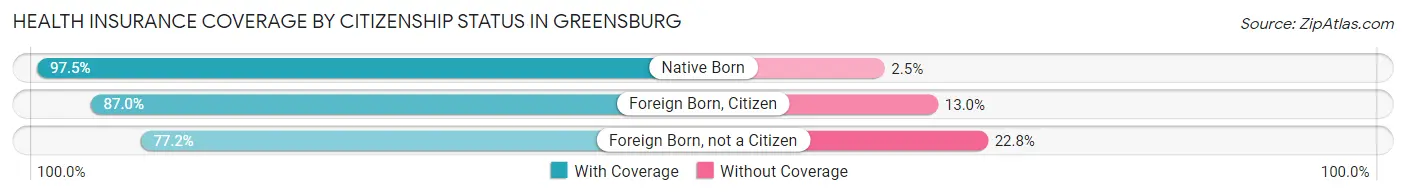
| Citizenship Status | With Coverage | Without Coverage |
| Native Born | 236 (97.5%) | 6 (2.5%) |
| Foreign Born, Citizen | 389 (87.0%) | 58 (13.0%) |
| Foreign Born, not a Citizen | 61 (77.2%) | 18 (22.8%) |
Health Insurance Coverage by Household Income in Greensburg
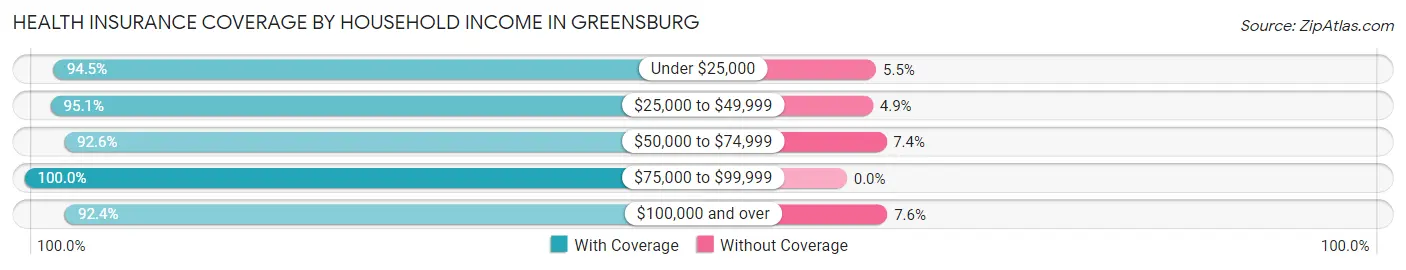
| Household Income | With Coverage | Without Coverage |
| Under $25,000 | 344 (94.5%) | 20 (5.5%) |
| $25,000 to $49,999 | 780 (95.1%) | 40 (4.9%) |
| $50,000 to $74,999 | 426 (92.6%) | 34 (7.4%) |
| $75,000 to $99,999 | 190 (100.0%) | 0 (0.0%) |
| $100,000 and over | 317 (92.4%) | 26 (7.6%) |
Public vs Private Health Insurance Coverage by Age in Greensburg
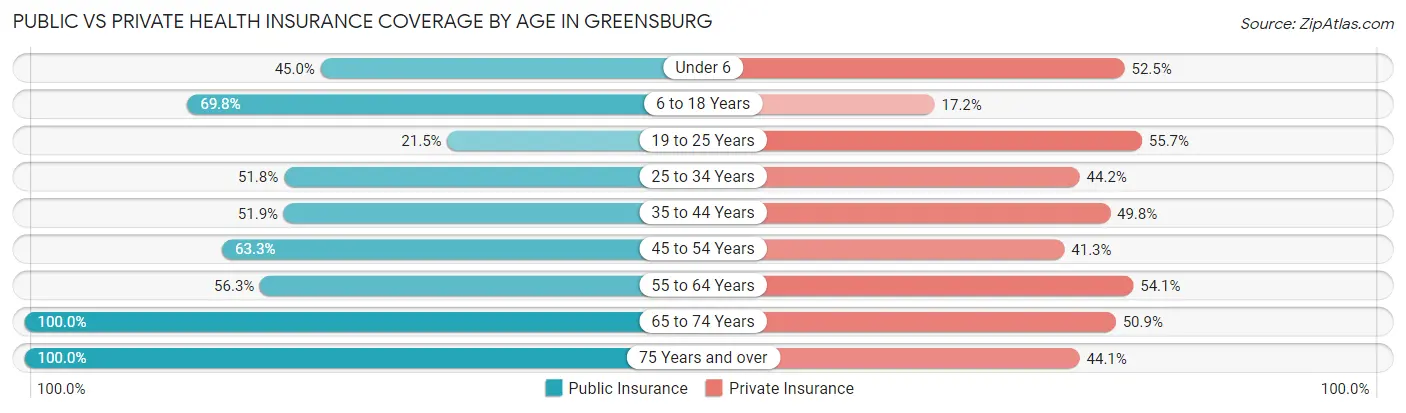
| Age Bracket | Public Insurance | Private Insurance |
| Under 6 | 109 (45.0%) | 127 (52.5%) |
| 6 to 18 Years | 312 (69.8%) | 77 (17.2%) |
| 19 to 25 Years | 17 (21.5%) | 44 (55.7%) |
| 25 to 34 Years | 155 (51.8%) | 132 (44.2%) |
| 35 to 44 Years | 125 (51.9%) | 120 (49.8%) |
| 45 to 54 Years | 164 (63.3%) | 107 (41.3%) |
| 55 to 64 Years | 130 (56.3%) | 125 (54.1%) |
| 65 to 74 Years | 234 (100.0%) | 119 (50.8%) |
| 75 Years and over | 145 (100.0%) | 64 (44.1%) |
| Total | 1,391 (63.9%) | 915 (42.0%) |
Disability Status by Sex by Age in Greensburg
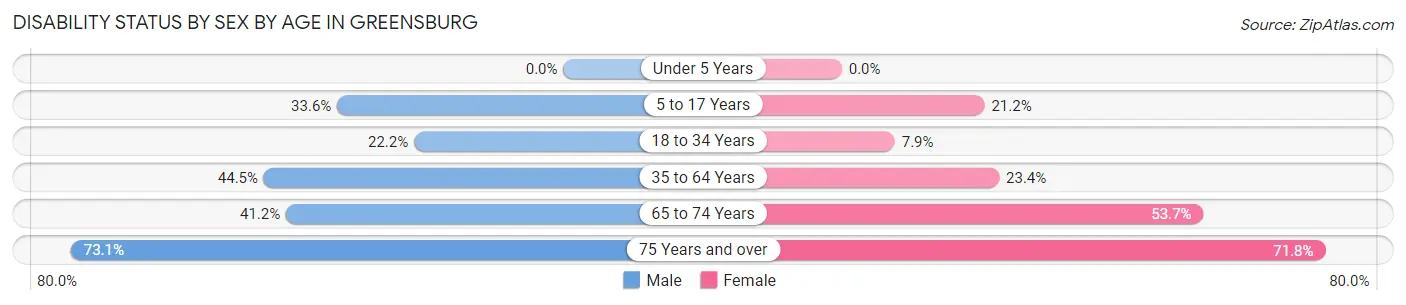
| Age Bracket | Male | Female |
| Under 5 Years | 0 (0.0%) | 0 (0.0%) |
| 5 to 17 Years | 44 (33.6%) | 64 (21.2%) |
| 18 to 34 Years | 49 (22.2%) | 17 (7.9%) |
| 35 to 64 Years | 169 (44.5%) | 82 (23.4%) |
| 65 to 74 Years | 35 (41.2%) | 80 (53.7%) |
| 75 Years and over | 49 (73.1%) | 56 (71.8%) |
Disability Class by Sex by Age in Greensburg
Disability Class: Hearing Difficulty
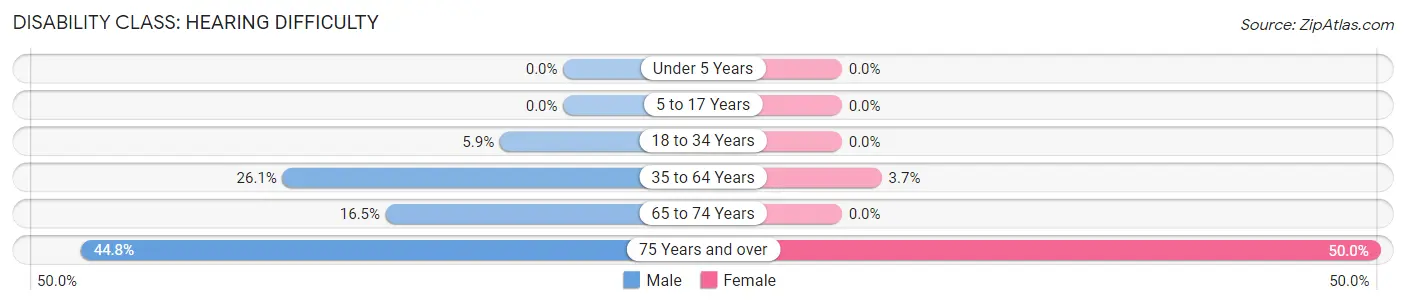
| Age Bracket | Male | Female |
| Under 5 Years | 0 (0.0%) | 0 (0.0%) |
| 5 to 17 Years | 0 (0.0%) | 0 (0.0%) |
| 18 to 34 Years | 13 (5.9%) | 0 (0.0%) |
| 35 to 64 Years | 99 (26.1%) | 13 (3.7%) |
| 65 to 74 Years | 14 (16.5%) | 0 (0.0%) |
| 75 Years and over | 30 (44.8%) | 39 (50.0%) |
Disability Class: Vision Difficulty
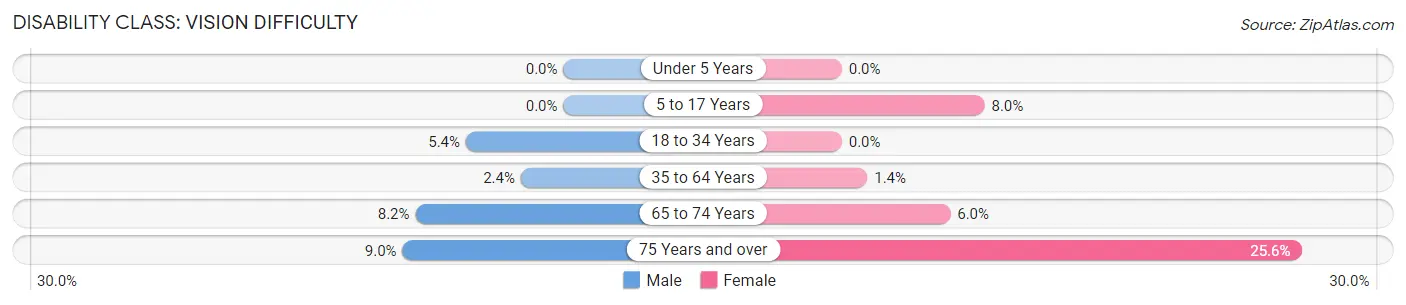
| Age Bracket | Male | Female |
| Under 5 Years | 0 (0.0%) | 0 (0.0%) |
| 5 to 17 Years | 0 (0.0%) | 24 (8.0%) |
| 18 to 34 Years | 12 (5.4%) | 0 (0.0%) |
| 35 to 64 Years | 9 (2.4%) | 5 (1.4%) |
| 65 to 74 Years | 7 (8.2%) | 9 (6.0%) |
| 75 Years and over | 6 (9.0%) | 20 (25.6%) |
Disability Class: Cognitive Difficulty
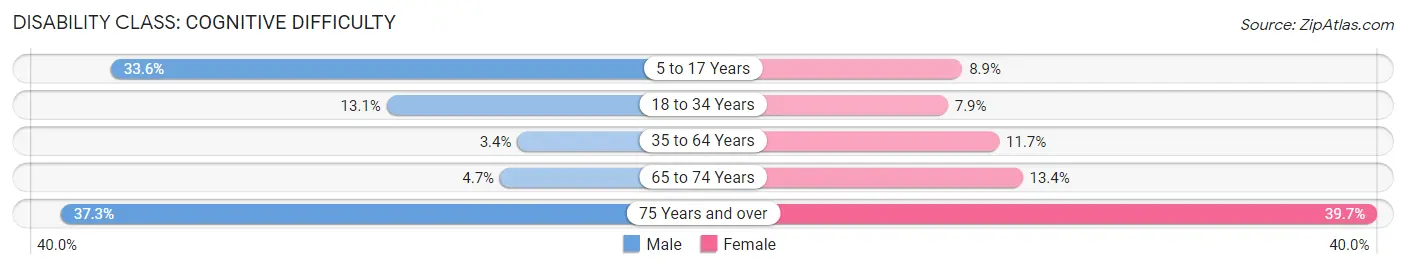
| Age Bracket | Male | Female |
| 5 to 17 Years | 44 (33.6%) | 27 (8.9%) |
| 18 to 34 Years | 29 (13.1%) | 17 (7.9%) |
| 35 to 64 Years | 13 (3.4%) | 41 (11.7%) |
| 65 to 74 Years | 4 (4.7%) | 20 (13.4%) |
| 75 Years and over | 25 (37.3%) | 31 (39.7%) |
Disability Class: Ambulatory Difficulty
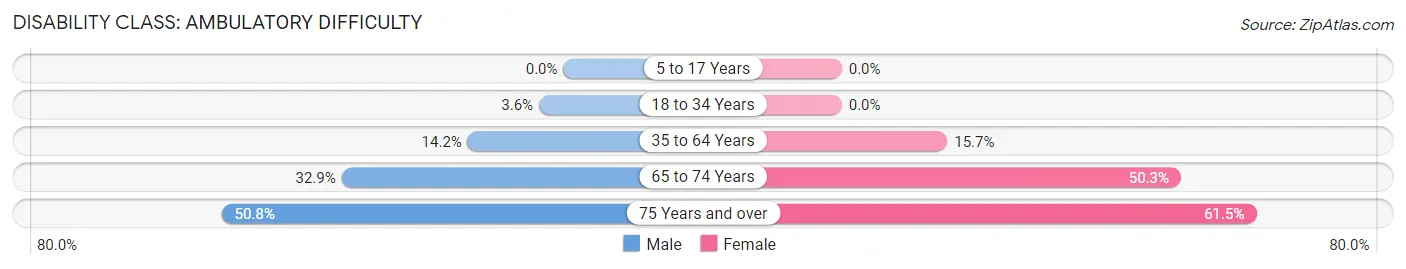
| Age Bracket | Male | Female |
| 5 to 17 Years | 0 (0.0%) | 0 (0.0%) |
| 18 to 34 Years | 8 (3.6%) | 0 (0.0%) |
| 35 to 64 Years | 54 (14.2%) | 55 (15.7%) |
| 65 to 74 Years | 28 (32.9%) | 75 (50.3%) |
| 75 Years and over | 34 (50.7%) | 48 (61.5%) |
Disability Class: Self-Care Difficulty
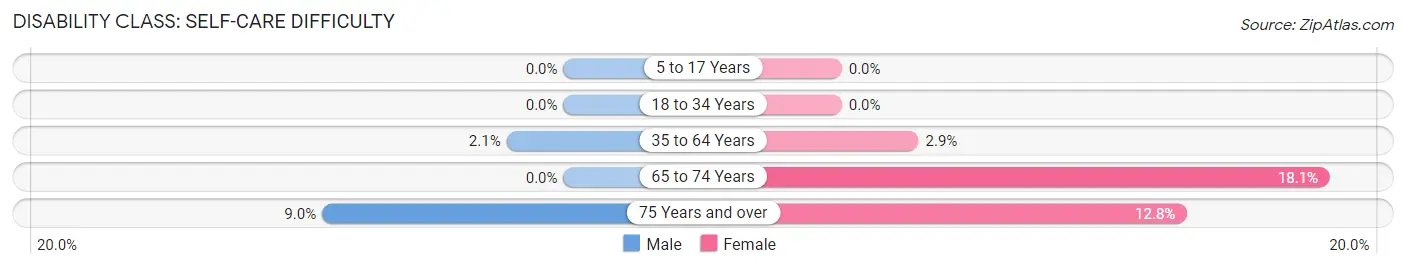
| Age Bracket | Male | Female |
| 5 to 17 Years | 0 (0.0%) | 0 (0.0%) |
| 18 to 34 Years | 0 (0.0%) | 0 (0.0%) |
| 35 to 64 Years | 8 (2.1%) | 10 (2.9%) |
| 65 to 74 Years | 0 (0.0%) | 27 (18.1%) |
| 75 Years and over | 6 (9.0%) | 10 (12.8%) |
Technology Access in Greensburg
Computing Device Access in Greensburg
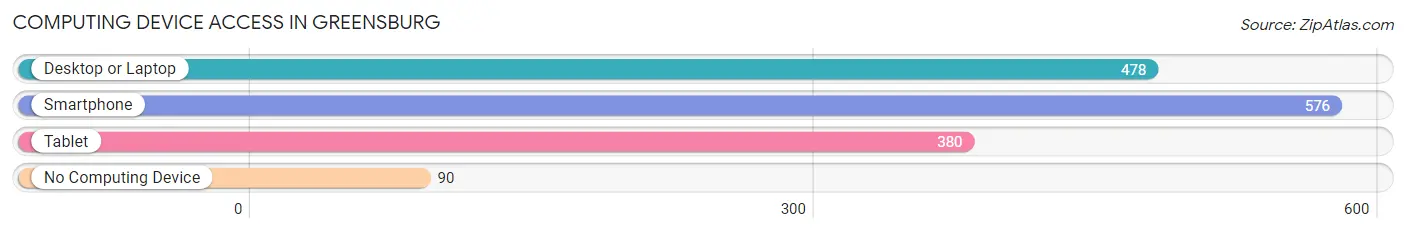
| Device Type | # Households | % Households |
| Desktop or Laptop | 478 | 62.7% |
| Smartphone | 576 | 75.6% |
| Tablet | 380 | 49.9% |
| No Computing Device | 90 | 11.8% |
| Total | 762 | 100.0% |
Internet Access in Greensburg
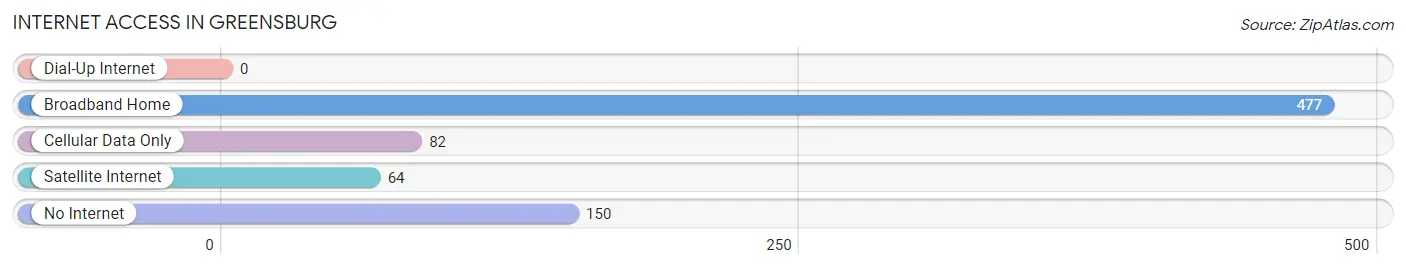
| Internet Type | # Households | % Households |
| Dial-Up Internet | 0 | 0.0% |
| Broadband Home | 477 | 62.6% |
| Cellular Data Only | 82 | 10.8% |
| Satellite Internet | 64 | 8.4% |
| No Internet | 150 | 19.7% |
| Total | 762 | 100.0% |
Greensburg Summary
Greensburg is a city in Green County, Kentucky, United States. The population was 2,168 at the 2010 census. It is the county seat of Green County.
History
Greensburg was founded in 1804 by William Green, a Revolutionary War veteran. The town was named after him and was incorporated in 1810. The town was the site of a Civil War battle in 1862, when Confederate forces under General John Hunt Morgan attacked the town. The town was also the site of a major fire in 1871 that destroyed much of the downtown area.
Geography
Greensburg is located at 37°17'25"N 85°25'45"W (37.290278, -85.429167). According to the United States Census Bureau, the city has a total area of 1.3 square miles (3.4 km2), all land.
Economy
Greensburg is the county seat of Green County and is home to many businesses and industries. The city is home to several manufacturing plants, including a paper mill, a furniture factory, and a plastics plant. The city also has a number of retail stores, restaurants, and other businesses.
Demographics
As of the census of 2000, there were 2,168 people, 890 households, and 590 families residing in the city. The population density was 1,637.2 people per square mile (631.2/km2). There were 990 housing units at an average density of 745.2 per square mile (288.2/km2). The racial makeup of the city was 97.45% White, 0.93% African American, 0.05% Native American, 0.09% Asian, 0.05% Pacific Islander, 0.93% from other races, and 0.49% from two or more races. Hispanic or Latino of any race were 1.37% of the population.
There were 890 households, out of which 28.2% had children under the age of 18 living with them, 49.9% were married couples living together, 13.2% had a female householder with no husband present, and 33.2% were non-families. 30.3% of all households were made up of individuals, and 16.2% had someone living alone who was 65 years of age or older. The average household size was 2.35 and the average family size was 2.90.
In the city, the population was spread out, with 23.2% under the age of 18, 8.2% from 18 to 24, 27.2% from 25 to 44, 22.7% from 45 to 64, and 18.7% who were 65 years of age or older. The median age was 39 years. For every 100 females, there were 87.2 males. For every 100 females age 18 and over, there were 82.3 males.
The median income for a household in the city was $25,938, and the median income for a family was $32,917. Males had a median income of $27,500 versus $20,000 for females. The per capita income for the city was $14,945. About 14.2% of families and 17.2% of the population were below the poverty line, including 22.2% of those under age 18 and 16.2% of those age 65 or over.
Common Questions
What is Per Capita Income in Greensburg?
Per Capita income in Greensburg is $20,193.
What is the Median Family Income in Greensburg?
Median Family Income in Greensburg is $46,691.
What is the Median Household income in Greensburg?
Median Household Income in Greensburg is $38,571.
What is Income or Wage Gap in Greensburg?
Income or Wage Gap in Greensburg is 30.4%.
Women in Greensburg earn 69.6 cents for every dollar earned by a man.
What is Inequality or Gini Index in Greensburg?
Inequality or Gini Index in Greensburg is 0.44.
What is the Total Population of Greensburg?
Total Population of Greensburg is 2,307.
What is the Total Male Population of Greensburg?
Total Male Population of Greensburg is 992.
What is the Total Female Population of Greensburg?
Total Female Population of Greensburg is 1,315.
What is the Ratio of Males per 100 Females in Greensburg?
There are 75.44 Males per 100 Females in Greensburg.
What is the Ratio of Females per 100 Males in Greensburg?
There are 132.56 Females per 100 Males in Greensburg.
What is the Median Population Age in Greensburg?
Median Population Age in Greensburg is 37.8 Years.
What is the Average Family Size in Greensburg
Average Family Size in Greensburg is 3.8 People.
What is the Average Household Size in Greensburg
Average Household Size in Greensburg is 2.9 People.
How Large is the Labor Force in Greensburg?
There are 976 People in the Labor Forcein in Greensburg.
What is the Percentage of People in the Labor Force in Greensburg?
56.3% of People are in the Labor Force in Greensburg.
What is the Unemployment Rate in Greensburg?
Unemployment Rate in Greensburg is 18.2%.