Cities with the Highest Percentage of Population Employed in Mining, Quarrying, & Extraction in Kentucky
RELATED REPORTS & OPTIONS
Mining, Quarrying, & Extraction
Kentucky
Compare Cities
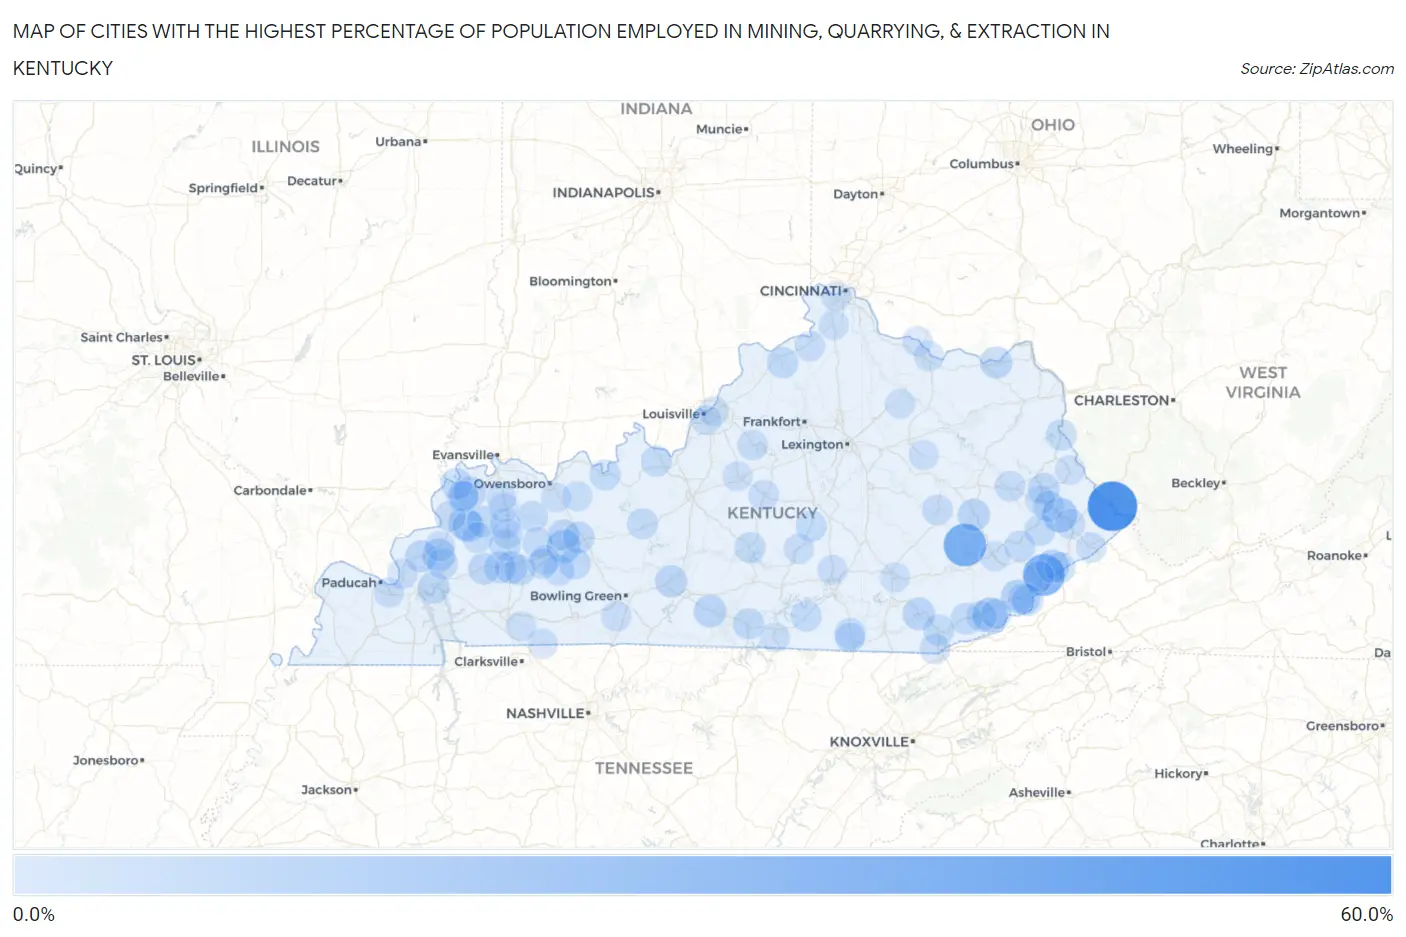
Map of Cities with the Highest Percentage of Population Employed in Mining, Quarrying, & Extraction in Kentucky
0.0%
60.0%
Cities with the Highest Percentage of Population Employed in Mining, Quarrying, & Extraction in Kentucky
| City | % Employed | vs State | vs National | |
| 1. | Mccarr | 51.9% | 0.53%(+51.4)#1 | 0.44%(+51.5)#36 |
| 2. | Buckhorn | 33.3% | 0.53%(+32.8)#2 | 0.44%(+32.9)#96 |
| 3. | Mayking | 31.0% | 0.53%(+30.4)#3 | 0.44%(+30.5)#107 |
| 4. | Betsy Layne | 12.8% | 0.53%(+12.3)#4 | 0.44%(+12.4)#544 |
| 5. | Ages | 12.4% | 0.53%(+11.9)#5 | 0.44%(+11.9)#575 |
| 6. | Van Lear | 10.9% | 0.53%(+10.4)#6 | 0.44%(+10.5)#690 |
| 7. | Rockport | 9.5% | 0.53%(+8.99)#7 | 0.44%(+9.08)#799 |
| 8. | Wheatcroft | 8.6% | 0.53%(+8.09)#8 | 0.44%(+8.18)#921 |
| 9. | Cumberland | 8.2% | 0.53%(+7.70)#9 | 0.44%(+7.80)#961 |
| 10. | Fleming Neon | 8.1% | 0.53%(+7.61)#10 | 0.44%(+7.70)#980 |
| 11. | Crayne | 7.7% | 0.53%(+7.16)#11 | 0.44%(+7.25)#1,050 |
| 12. | Barbourville | 7.1% | 0.53%(+6.52)#12 | 0.44%(+6.62)#1,146 |
| 13. | Summer Shade | 7.0% | 0.53%(+6.50)#13 | 0.44%(+6.59)#1,151 |
| 14. | Nortonville | 6.5% | 0.53%(+5.92)#14 | 0.44%(+6.01)#1,258 |
| 15. | Park City | 6.2% | 0.53%(+5.70)#15 | 0.44%(+5.79)#1,301 |
| 16. | Jackson | 6.1% | 0.53%(+5.61)#16 | 0.44%(+5.70)#1,332 |
| 17. | Waverly | 6.1% | 0.53%(+5.59)#17 | 0.44%(+5.68)#1,336 |
| 18. | Garrison | 6.1% | 0.53%(+5.53)#18 | 0.44%(+5.62)#1,341 |
| 19. | Salem | 6.0% | 0.53%(+5.50)#19 | 0.44%(+5.59)#1,349 |
| 20. | Clay | 5.4% | 0.53%(+4.87)#20 | 0.44%(+4.96)#1,501 |
| 21. | Kuttawa | 5.2% | 0.53%(+4.65)#21 | 0.44%(+4.74)#1,553 |
| 22. | Benham | 5.2% | 0.53%(+4.62)#22 | 0.44%(+4.71)#1,564 |
| 23. | Uniontown | 5.1% | 0.53%(+4.58)#23 | 0.44%(+4.67)#1,577 |
| 24. | Auxier | 5.0% | 0.53%(+4.51)#24 | 0.44%(+4.60)#1,595 |
| 25. | Morganfield | 5.0% | 0.53%(+4.50)#25 | 0.44%(+4.59)#1,598 |
| 26. | Centertown | 5.0% | 0.53%(+4.47)#26 | 0.44%(+4.56)#1,602 |
| 27. | St Charles | 4.9% | 0.53%(+4.37)#27 | 0.44%(+4.46)#1,633 |
| 28. | Beaver Dam | 4.6% | 0.53%(+4.11)#28 | 0.44%(+4.20)#1,715 |
| 29. | Dawson Springs | 4.6% | 0.53%(+4.10)#29 | 0.44%(+4.19)#1,720 |
| 30. | Coldiron | 4.6% | 0.53%(+4.04)#30 | 0.44%(+4.13)#1,732 |
| 31. | Rochester | 4.3% | 0.53%(+3.82)#31 | 0.44%(+3.91)#1,821 |
| 32. | Lynch | 4.1% | 0.53%(+3.62)#32 | 0.44%(+3.71)#1,889 |
| 33. | Worthville | 4.1% | 0.53%(+3.58)#33 | 0.44%(+3.67)#1,900 |
| 34. | Madisonville | 4.0% | 0.53%(+3.46)#34 | 0.44%(+3.55)#1,948 |
| 35. | Burkesville | 3.9% | 0.53%(+3.35)#35 | 0.44%(+3.44)#1,998 |
| 36. | Whitley City | 3.9% | 0.53%(+3.34)#36 | 0.44%(+3.43)#2,003 |
| 37. | Wayland | 3.7% | 0.53%(+3.17)#37 | 0.44%(+3.26)#2,078 |
| 38. | Allen | 3.7% | 0.53%(+3.17)#38 | 0.44%(+3.26)#2,079 |
| 39. | Beechmont | 3.6% | 0.53%(+3.12)#39 | 0.44%(+3.21)#2,095 |
| 40. | Ekron | 3.6% | 0.53%(+3.04)#40 | 0.44%(+3.13)#2,141 |
| 41. | Louisa | 3.5% | 0.53%(+2.99)#41 | 0.44%(+3.08)#2,174 |
| 42. | Pineville | 3.4% | 0.53%(+2.83)#42 | 0.44%(+2.93)#2,268 |
| 43. | Leitchfield | 3.3% | 0.53%(+2.81)#43 | 0.44%(+2.90)#2,278 |
| 44. | Cloverport | 3.3% | 0.53%(+2.77)#44 | 0.44%(+2.87)#2,300 |
| 45. | White Plains | 3.3% | 0.53%(+2.77)#45 | 0.44%(+2.87)#2,301 |
| 46. | Jenkins | 3.3% | 0.53%(+2.75)#46 | 0.44%(+2.84)#2,323 |
| 47. | Dixon | 3.2% | 0.53%(+2.69)#47 | 0.44%(+2.78)#2,355 |
| 48. | Monticello | 3.1% | 0.53%(+2.62)#48 | 0.44%(+2.71)#2,401 |
| 49. | Hustonville | 3.1% | 0.53%(+2.58)#49 | 0.44%(+2.67)#2,424 |
| 50. | Hindman | 3.1% | 0.53%(+2.57)#50 | 0.44%(+2.67)#2,426 |
| 51. | Calhoun | 3.0% | 0.53%(+2.51)#51 | 0.44%(+2.60)#2,463 |
| 52. | Campbellsville | 3.0% | 0.53%(+2.50)#52 | 0.44%(+2.59)#2,478 |
| 53. | Fredonia | 3.0% | 0.53%(+2.49)#53 | 0.44%(+2.58)#2,481 |
| 54. | Sturgis | 2.9% | 0.53%(+2.33)#54 | 0.44%(+2.42)#2,570 |
| 55. | Middlesborough | 2.8% | 0.53%(+2.32)#55 | 0.44%(+2.41)#2,588 |
| 56. | Providence | 2.7% | 0.53%(+2.15)#56 | 0.44%(+2.24)#2,707 |
| 57. | Slaughters | 2.6% | 0.53%(+2.03)#57 | 0.44%(+2.12)#2,814 |
| 58. | Harlan | 2.5% | 0.53%(+1.98)#58 | 0.44%(+2.07)#2,849 |
| 59. | Beattyville | 2.3% | 0.53%(+1.79)#59 | 0.44%(+1.88)#2,999 |
| 60. | Salyersville | 2.3% | 0.53%(+1.72)#60 | 0.44%(+1.82)#3,039 |
| 61. | Bremen | 2.2% | 0.53%(+1.69)#61 | 0.44%(+1.78)#3,073 |
| 62. | Greenville | 2.1% | 0.53%(+1.57)#62 | 0.44%(+1.66)#3,176 |
| 63. | Taylorsville | 2.1% | 0.53%(+1.53)#63 | 0.44%(+1.62)#3,207 |
| 64. | Whitesburg | 2.0% | 0.53%(+1.47)#64 | 0.44%(+1.56)#3,267 |
| 65. | Woodburn | 1.8% | 0.53%(+1.30)#65 | 0.44%(+1.39)#3,426 |
| 66. | Springfield | 1.8% | 0.53%(+1.30)#66 | 0.44%(+1.39)#3,429 |
| 67. | Liberty | 1.8% | 0.53%(+1.28)#67 | 0.44%(+1.37)#3,450 |
| 68. | Smithland | 1.7% | 0.53%(+1.21)#68 | 0.44%(+1.30)#3,524 |
| 69. | Glencoe | 1.7% | 0.53%(+1.15)#69 | 0.44%(+1.24)#3,583 |
| 70. | West Van Lear | 1.7% | 0.53%(+1.15)#70 | 0.44%(+1.24)#3,589 |
| 71. | Hanson | 1.7% | 0.53%(+1.12)#71 | 0.44%(+1.21)#3,625 |
| 72. | Evarts | 1.6% | 0.53%(+1.11)#72 | 0.44%(+1.20)#3,642 |
| 73. | Elkhorn City | 1.5% | 0.53%(+0.975)#73 | 0.44%(+1.07)#3,819 |
| 74. | Science Hill | 1.5% | 0.53%(+0.955)#74 | 0.44%(+1.05)#3,841 |
| 75. | Reidland | 1.5% | 0.53%(+0.928)#75 | 0.44%(+1.02)#3,875 |
| 76. | Pikeville | 1.5% | 0.53%(+0.920)#76 | 0.44%(+1.01)#3,882 |
| 77. | Whitesville | 1.4% | 0.53%(+0.820)#77 | 0.44%(+0.911)#4,014 |
| 78. | Maysville | 1.3% | 0.53%(+0.749)#78 | 0.44%(+0.840)#4,114 |
| 79. | Marion | 1.2% | 0.53%(+0.659)#79 | 0.44%(+0.750)#4,269 |
| 80. | Guthrie | 1.2% | 0.53%(+0.623)#80 | 0.44%(+0.714)#4,316 |
| 81. | London | 1.1% | 0.53%(+0.607)#81 | 0.44%(+0.698)#4,334 |
| 82. | Breckinridge Center | 1.1% | 0.53%(+0.601)#82 | 0.44%(+0.692)#4,347 |
| 83. | Stearns | 1.1% | 0.53%(+0.553)#83 | 0.44%(+0.644)#4,425 |
| 84. | Walton | 1.1% | 0.53%(+0.533)#84 | 0.44%(+0.624)#4,452 |
| 85. | Jeffersonville | 1.0% | 0.53%(+0.480)#85 | 0.44%(+0.571)#4,545 |
| 86. | Hazard | 1.00% | 0.53%(+0.467)#86 | 0.44%(+0.559)#4,569 |
| 87. | Sebree | 0.98% | 0.53%(+0.448)#87 | 0.44%(+0.539)#4,611 |
| 88. | Dover | 0.94% | 0.53%(+0.412)#88 | 0.44%(+0.503)#4,673 |
| 89. | Inez | 0.88% | 0.53%(+0.351)#89 | 0.44%(+0.442)#4,777 |
| 90. | Powderly | 0.88% | 0.53%(+0.350)#90 | 0.44%(+0.441)#4,779 |
| 91. | Carlisle | 0.87% | 0.53%(+0.340)#91 | 0.44%(+0.431)#4,794 |
| 92. | Rolling Fields | 0.85% | 0.53%(+0.323)#92 | 0.44%(+0.414)#4,824 |
| 93. | Masonville | 0.84% | 0.53%(+0.313)#93 | 0.44%(+0.404)#4,847 |
| 94. | Bardstown | 0.84% | 0.53%(+0.306)#94 | 0.44%(+0.397)#4,858 |
| 95. | Robards | 0.78% | 0.53%(+0.247)#95 | 0.44%(+0.338)#4,979 |
| 96. | Parkway Village | 0.77% | 0.53%(+0.242)#96 | 0.44%(+0.333)#4,990 |
| 97. | Prestonsburg | 0.76% | 0.53%(+0.228)#97 | 0.44%(+0.319)#5,029 |
| 98. | Pembroke | 0.75% | 0.53%(+0.215)#98 | 0.44%(+0.306)#5,056 |
| 99. | Albany | 0.74% | 0.53%(+0.212)#99 | 0.44%(+0.303)#5,063 |
| 100. | Villa Hills | 0.74% | 0.53%(+0.204)#100 | 0.44%(+0.295)#5,085 |
Common Questions
What are the Top 10 Cities with the Highest Percentage of Population Employed in Mining, Quarrying, & Extraction in Kentucky?
Top 10 Cities with the Highest Percentage of Population Employed in Mining, Quarrying, & Extraction in Kentucky are:
#1
51.9%
#2
33.3%
#3
31.0%
#4
12.8%
#5
12.4%
#6
9.5%
#7
8.6%
#8
8.2%
#9
8.1%
#10
7.7%
What city has the Highest Percentage of Population Employed in Mining, Quarrying, & Extraction in Kentucky?
McCarr has the Highest Percentage of Population Employed in Mining, Quarrying, & Extraction in Kentucky with 51.9%.
What is the Percentage of Population Employed in Mining, Quarrying, & Extraction in the State of Kentucky?
Percentage of Population Employed in Mining, Quarrying, & Extraction in Kentucky is 0.53%.
What is the Percentage of Population Employed in Mining, Quarrying, & Extraction in the United States?
Percentage of Population Employed in Mining, Quarrying, & Extraction in the United States is 0.44%.