Cities with the Most Immigrants from Eastern Asia in Kentucky
RELATED REPORTS & OPTIONS
Eastern Asia
Kentucky
Compare Cities
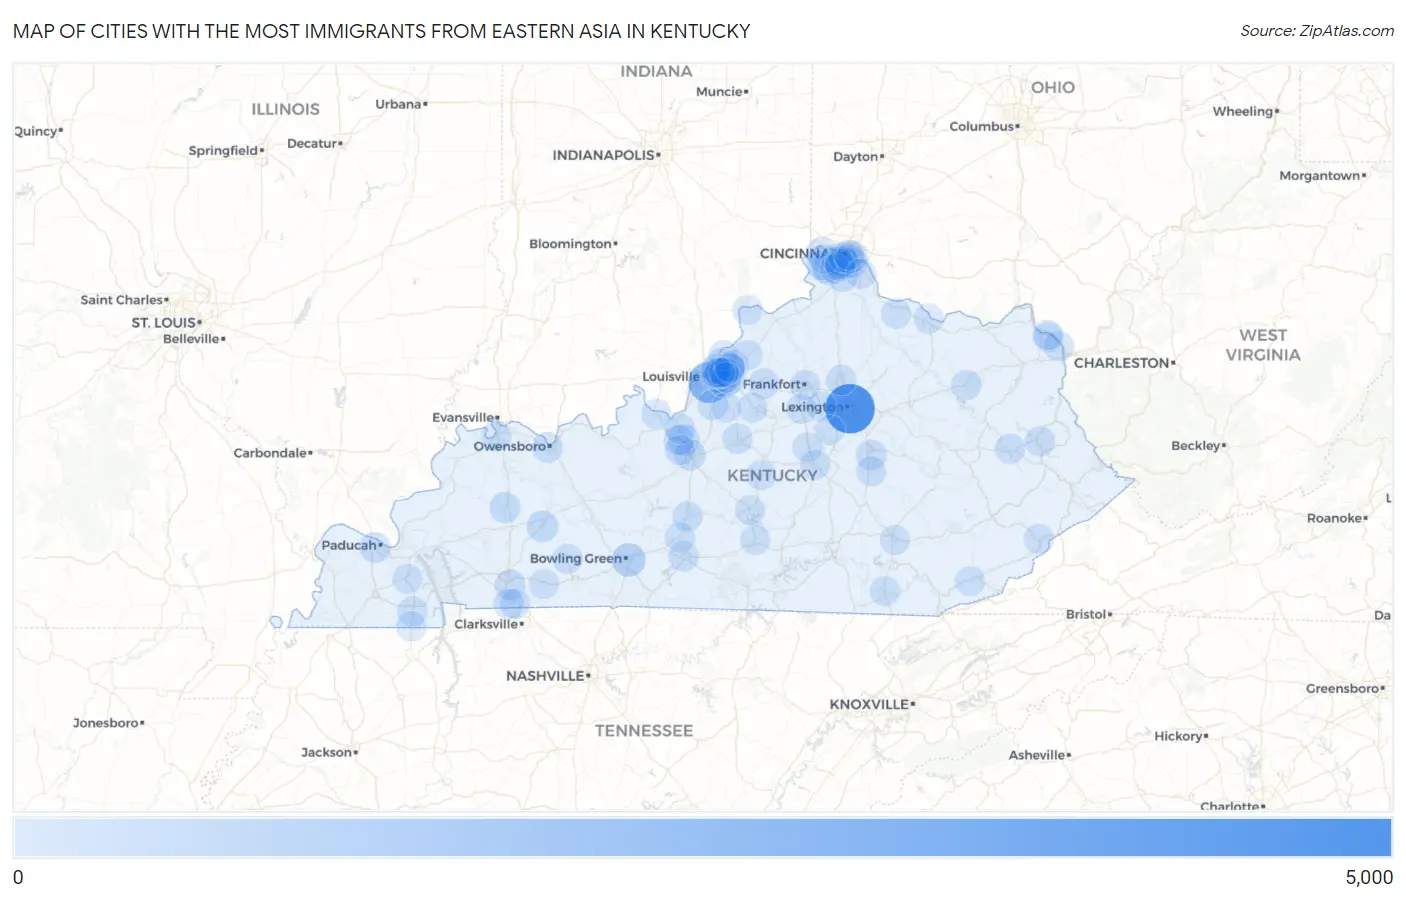
Map of Cities with the Most Immigrants from Eastern Asia in Kentucky
0
5,000
Cities with the Most Immigrants from Eastern Asia in Kentucky
| City | Eastern Asia | vs State | vs National | |
| 1. | Lexington | 4,232 | 15,426(27.43%)#1 | 4,223,726(0.10%)#140 |
| 2. | Louisville | 2,283 | 15,426(14.80%)#2 | 4,223,726(0.05%)#249 |
| 3. | Bowling Green | 727 | 15,426(4.71%)#3 | 4,223,726(0.02%)#688 |
| 4. | Greenville | 293 | 15,426(1.90%)#4 | 4,223,726(0.01%)#1,417 |
| 5. | Radcliff | 258 | 15,426(1.67%)#5 | 4,223,726(0.01%)#1,551 |
| 6. | Elizabethtown | 219 | 15,426(1.42%)#6 | 4,223,726(0.01%)#1,722 |
| 7. | Independence | 218 | 15,426(1.41%)#7 | 4,223,726(0.01%)#1,729 |
| 8. | Madisonville | 206 | 15,426(1.34%)#8 | 4,223,726(0.00%)#1,791 |
| 9. | Hopkinsville | 175 | 15,426(1.13%)#9 | 4,223,726(0.00%)#1,987 |
| 10. | Owensboro | 153 | 15,426(0.99%)#10 | 4,223,726(0.00%)#2,164 |
| 11. | Richmond | 151 | 15,426(0.98%)#11 | 4,223,726(0.00%)#2,195 |
| 12. | Paducah | 147 | 15,426(0.95%)#12 | 4,223,726(0.00%)#2,230 |
| 13. | Florence | 143 | 15,426(0.93%)#13 | 4,223,726(0.00%)#2,262 |
| 14. | Fort Thomas | 132 | 15,426(0.86%)#14 | 4,223,726(0.00%)#2,372 |
| 15. | Beechwood Village | 127 | 15,426(0.82%)#15 | 4,223,726(0.00%)#2,428 |
| 16. | Jeffersontown | 114 | 15,426(0.74%)#16 | 4,223,726(0.00%)#2,550 |
| 17. | St Matthews | 114 | 15,426(0.74%)#17 | 4,223,726(0.00%)#2,553 |
| 18. | Erlanger | 106 | 15,426(0.69%)#18 | 4,223,726(0.00%)#2,665 |
| 19. | Shelbyville | 102 | 15,426(0.66%)#19 | 4,223,726(0.00%)#2,728 |
| 20. | Fort Campbell North | 98 | 15,426(0.64%)#20 | 4,223,726(0.00%)#2,790 |
| 21. | Georgetown | 91 | 15,426(0.59%)#21 | 4,223,726(0.00%)#2,896 |
| 22. | Glasgow | 91 | 15,426(0.59%)#22 | 4,223,726(0.00%)#2,901 |
| 23. | Prospect | 90 | 15,426(0.58%)#23 | 4,223,726(0.00%)#2,924 |
| 24. | Middletown | 89 | 15,426(0.58%)#24 | 4,223,726(0.00%)#2,942 |
| 25. | Hurstbourne | 88 | 15,426(0.57%)#25 | 4,223,726(0.00%)#2,968 |
| 26. | Covington | 87 | 15,426(0.56%)#26 | 4,223,726(0.00%)#2,974 |
| 27. | Lyndon | 80 | 15,426(0.52%)#27 | 4,223,726(0.00%)#3,106 |
| 28. | Frankfort | 78 | 15,426(0.51%)#28 | 4,223,726(0.00%)#3,139 |
| 29. | Henderson | 75 | 15,426(0.49%)#29 | 4,223,726(0.00%)#3,205 |
| 30. | Vine Grove | 72 | 15,426(0.47%)#30 | 4,223,726(0.00%)#3,289 |
| 31. | Oakbrook | 71 | 15,426(0.46%)#31 | 4,223,726(0.00%)#3,313 |
| 32. | Hillview | 60 | 15,426(0.39%)#32 | 4,223,726(0.00%)#3,587 |
| 33. | Lakeside Park | 59 | 15,426(0.38%)#33 | 4,223,726(0.00%)#3,624 |
| 34. | Francisville | 56 | 15,426(0.36%)#34 | 4,223,726(0.00%)#3,705 |
| 35. | Paintsville | 55 | 15,426(0.36%)#35 | 4,223,726(0.00%)#3,749 |
| 36. | Murray | 54 | 15,426(0.35%)#36 | 4,223,726(0.00%)#3,760 |
| 37. | Bardstown | 54 | 15,426(0.35%)#37 | 4,223,726(0.00%)#3,766 |
| 38. | Rineyville | 53 | 15,426(0.34%)#38 | 4,223,726(0.00%)#3,822 |
| 39. | Salyersville | 48 | 15,426(0.31%)#39 | 4,223,726(0.00%)#4,003 |
| 40. | Ashland | 47 | 15,426(0.30%)#40 | 4,223,726(0.00%)#4,012 |
| 41. | Fort Knox | 47 | 15,426(0.30%)#41 | 4,223,726(0.00%)#4,024 |
| 42. | Danville | 46 | 15,426(0.30%)#42 | 4,223,726(0.00%)#4,061 |
| 43. | Highland Heights | 45 | 15,426(0.29%)#43 | 4,223,726(0.00%)#4,118 |
| 44. | Meadow Vale | 42 | 15,426(0.27%)#44 | 4,223,726(0.00%)#4,237 |
| 45. | Munfordville | 41 | 15,426(0.27%)#45 | 4,223,726(0.00%)#4,278 |
| 46. | Crestwood | 38 | 15,426(0.25%)#46 | 4,223,726(0.00%)#4,387 |
| 47. | Morehead | 36 | 15,426(0.23%)#47 | 4,223,726(0.00%)#4,489 |
| 48. | Graymoor Devondale | 35 | 15,426(0.23%)#48 | 4,223,726(0.00%)#4,558 |
| 49. | Maysville | 33 | 15,426(0.21%)#49 | 4,223,726(0.00%)#4,649 |
| 50. | Fort Wright | 32 | 15,426(0.21%)#50 | 4,223,726(0.00%)#4,704 |
| 51. | Williamsburg | 32 | 15,426(0.21%)#51 | 4,223,726(0.00%)#4,707 |
| 52. | Lebanon | 30 | 15,426(0.19%)#52 | 4,223,726(0.00%)#4,823 |
| 53. | Hurstbourne Acres | 30 | 15,426(0.19%)#53 | 4,223,726(0.00%)#4,850 |
| 54. | Langdon Place | 29 | 15,426(0.19%)#54 | 4,223,726(0.00%)#4,929 |
| 55. | Lawrenceburg | 28 | 15,426(0.18%)#55 | 4,223,726(0.00%)#4,951 |
| 56. | Wallins Creek | 28 | 15,426(0.18%)#56 | 4,223,726(0.00%)#5,000 |
| 57. | Berea | 27 | 15,426(0.18%)#57 | 4,223,726(0.00%)#5,010 |
| 58. | Burlington | 26 | 15,426(0.17%)#58 | 4,223,726(0.00%)#5,075 |
| 59. | Northfield | 26 | 15,426(0.17%)#59 | 4,223,726(0.00%)#5,128 |
| 60. | Cave City | 25 | 15,426(0.16%)#60 | 4,223,726(0.00%)#5,179 |
| 61. | Taylorsville | 25 | 15,426(0.16%)#61 | 4,223,726(0.00%)#5,187 |
| 62. | Villa Hills | 24 | 15,426(0.16%)#62 | 4,223,726(0.00%)#5,222 |
| 63. | Windy Hills | 24 | 15,426(0.16%)#63 | 4,223,726(0.00%)#5,255 |
| 64. | Flatwoods | 23 | 15,426(0.15%)#64 | 4,223,726(0.00%)#5,298 |
| 65. | Brandenburg | 23 | 15,426(0.15%)#65 | 4,223,726(0.00%)#5,327 |
| 66. | Versailles | 22 | 15,426(0.14%)#66 | 4,223,726(0.00%)#5,373 |
| 67. | La Grange | 22 | 15,426(0.14%)#67 | 4,223,726(0.00%)#5,374 |
| 68. | Wilmore | 21 | 15,426(0.14%)#68 | 4,223,726(0.00%)#5,456 |
| 69. | Indian Hills | 20 | 15,426(0.13%)#69 | 4,223,726(0.00%)#5,561 |
| 70. | Hebron | 18 | 15,426(0.12%)#70 | 4,223,726(0.00%)#5,712 |
| 71. | Anchorage | 18 | 15,426(0.12%)#71 | 4,223,726(0.00%)#5,748 |
| 72. | Hazel | 18 | 15,426(0.12%)#72 | 4,223,726(0.00%)#5,775 |
| 73. | Columbia | 16 | 15,426(0.10%)#73 | 4,223,726(0.00%)#5,940 |
| 74. | Elsmere | 15 | 15,426(0.10%)#74 | 4,223,726(0.00%)#6,032 |
| 75. | Orchard Grass Hills | 15 | 15,426(0.10%)#75 | 4,223,726(0.00%)#6,116 |
| 76. | Goshen | 15 | 15,426(0.10%)#76 | 4,223,726(0.00%)#6,129 |
| 77. | Crestview Hills | 14 | 15,426(0.09%)#77 | 4,223,726(0.00%)#6,215 |
| 78. | Worthington Hills | 14 | 15,426(0.09%)#78 | 4,223,726(0.00%)#6,234 |
| 79. | Brooksville | 14 | 15,426(0.09%)#79 | 4,223,726(0.00%)#6,268 |
| 80. | Mount Washington | 13 | 15,426(0.08%)#80 | 4,223,726(0.00%)#6,285 |
| 81. | Harrodsburg | 13 | 15,426(0.08%)#81 | 4,223,726(0.00%)#6,300 |
| 82. | Edgewood | 13 | 15,426(0.08%)#82 | 4,223,726(0.00%)#6,302 |
| 83. | Benton | 13 | 15,426(0.08%)#83 | 4,223,726(0.00%)#6,323 |
| 84. | Elkton | 13 | 15,426(0.08%)#84 | 4,223,726(0.00%)#6,383 |
| 85. | Campbellsville | 12 | 15,426(0.08%)#85 | 4,223,726(0.00%)#6,436 |
| 86. | Oak Grove | 12 | 15,426(0.08%)#86 | 4,223,726(0.00%)#6,451 |
| 87. | Park Hills | 12 | 15,426(0.08%)#87 | 4,223,726(0.00%)#6,490 |
| 88. | Whitesburg | 11 | 15,426(0.07%)#88 | 4,223,726(0.00%)#6,641 |
| 89. | Glenview | 11 | 15,426(0.07%)#89 | 4,223,726(0.00%)#6,677 |
| 90. | London | 10 | 15,426(0.06%)#90 | 4,223,726(0.00%)#6,730 |
| 91. | Coldstream | 10 | 15,426(0.06%)#91 | 4,223,726(0.00%)#6,824 |
| 92. | Lewisburg | 10 | 15,426(0.06%)#92 | 4,223,726(0.00%)#6,836 |
| 93. | Blue Ridge Manor | 9 | 15,426(0.06%)#93 | 4,223,726(0.00%)#7,017 |
| 94. | Southgate | 8 | 15,426(0.05%)#94 | 4,223,726(0.00%)#7,111 |
| 95. | Raceland | 8 | 15,426(0.05%)#95 | 4,223,726(0.00%)#7,147 |
| 96. | Milton | 8 | 15,426(0.05%)#96 | 4,223,726(0.00%)#7,208 |
| 97. | Newport | 7 | 15,426(0.05%)#97 | 4,223,726(0.00%)#7,239 |
| 98. | Alexandria | 7 | 15,426(0.05%)#98 | 4,223,726(0.00%)#7,244 |
| 99. | Rolling Hills | 7 | 15,426(0.05%)#99 | 4,223,726(0.00%)#7,377 |
| 100. | Bancroft | 7 | 15,426(0.05%)#100 | 4,223,726(0.00%)#7,404 |
Common Questions
What are the Top 10 Cities with the Most Immigrants from Eastern Asia in Kentucky?
Top 10 Cities with the Most Immigrants from Eastern Asia in Kentucky are:
#1
4,232
#2
2,283
#3
727
#4
293
#5
258
#6
219
#7
218
#8
206
#9
175
#10
153
What city has the Most Immigrants from Eastern Asia in Kentucky?
Lexington has the Most Immigrants from Eastern Asia in Kentucky with 4,232.
What is the Total Immigrants from Eastern Asia in the State of Kentucky?
Total Immigrants from Eastern Asia in Kentucky is 15,426.
What is the Total Immigrants from Eastern Asia in the United States?
Total Immigrants from Eastern Asia in the United States is 4,223,726.