Mount Sterling, KY Map & Demographics
Mount Sterling Map
Mount Sterling Overview
$25,914
PER CAPITA INCOME
$59,589
AVG FAMILY INCOME
$47,408
AVG HOUSEHOLD INCOME
50.7%
WAGE / INCOME GAP [ % ]
49.3¢/ $1
WAGE / INCOME GAP [ $ ]
$10,773
FAMILY INCOME DEFICIT
0.44
INEQUALITY / GINI INDEX
7,532
TOTAL POPULATION
3,692
MALE POPULATION
3,840
FEMALE POPULATION
96.15
MALES / 100 FEMALES
104.01
FEMALES / 100 MALES
40.8
MEDIAN AGE
2.7
AVG FAMILY SIZE
2.3
AVG HOUSEHOLD SIZE
3,223
LABOR FORCE [ PEOPLE ]
52.6%
PERCENT IN LABOR FORCE
5.7%
UNEMPLOYMENT RATE
Mount Sterling Zip Codes
Income in Mount Sterling
Income Overview in Mount Sterling
Per Capita Income in Mount Sterling is $25,914, while median incomes of families and households are $59,589 and $47,408 respectively.
| Characteristic | Number | Measure |
| Per Capita Income | 7,532 | $25,914 |
| Median Family Income | 2,091 | $59,589 |
| Mean Family Income | 2,091 | $66,030 |
| Median Household Income | 3,194 | $47,408 |
| Mean Household Income | 3,194 | $57,812 |
| Income Deficit | 2,091 | $10,773 |
| Wage / Income Gap (%) | 7,532 | 50.69% |
| Wage / Income Gap ($) | 7,532 | 49.31¢ per $1 |
| Gini / Inequality Index | 7,532 | 0.44 |
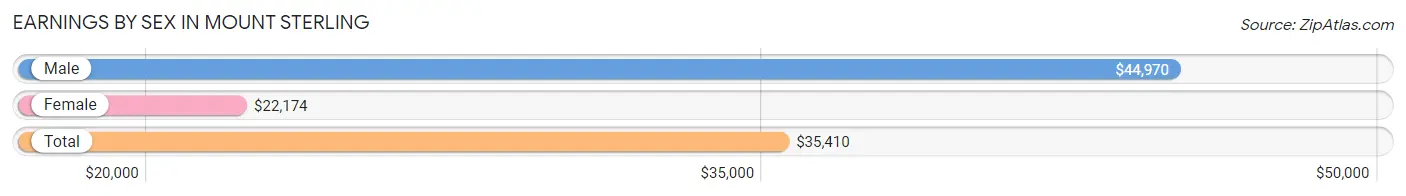
Earnings by Sex in Mount Sterling
Average Earnings in Mount Sterling are $35,410, $44,970 for men and $22,174 for women, a difference of 50.7%.
| Sex | Number | Average Earnings |
| Male | 1,948 (55.9%) | $44,970 |
| Female | 1,534 (44.1%) | $22,174 |
| Total | 3,482 (100.0%) | $35,410 |
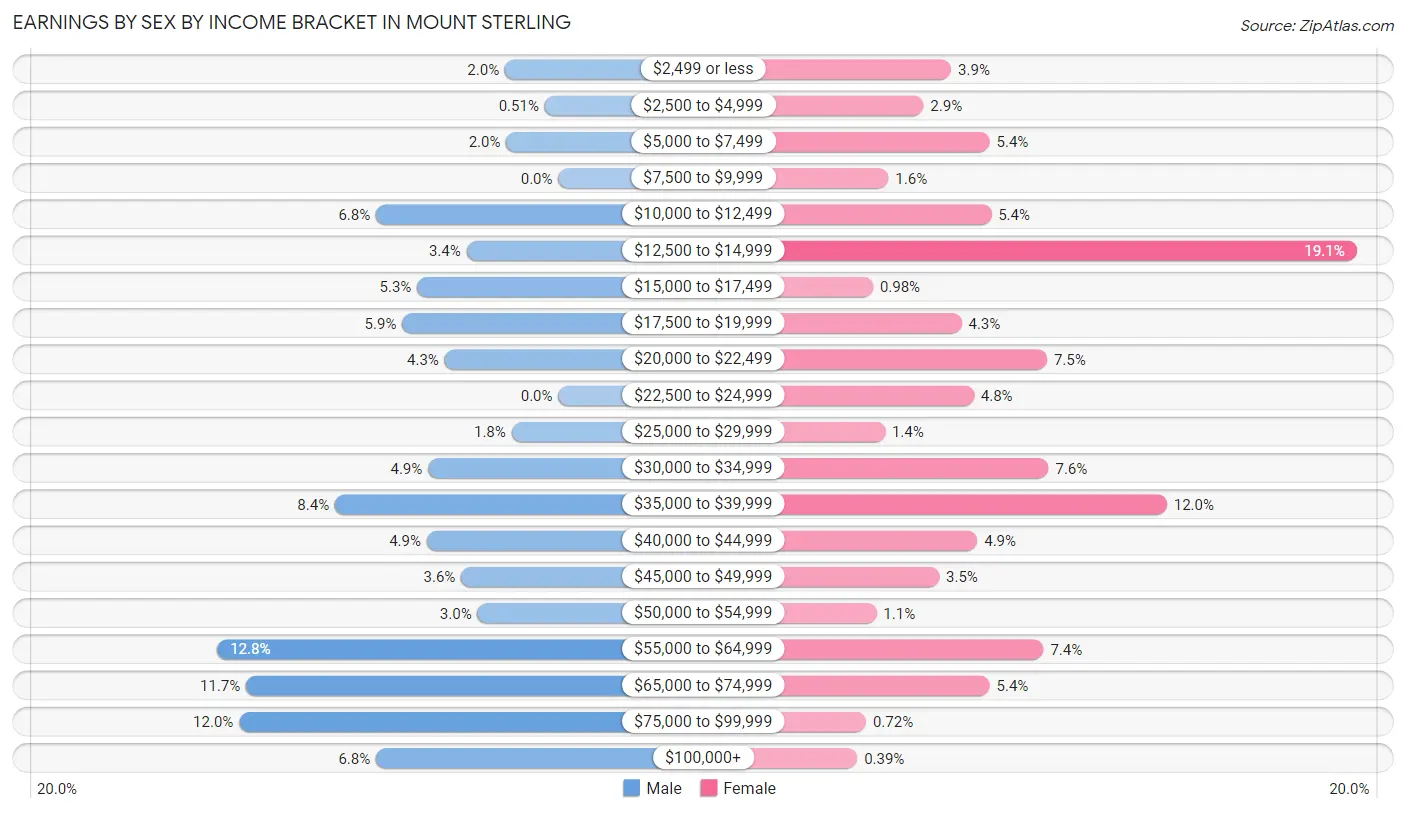
Earnings by Sex by Income Bracket in Mount Sterling
The most common earnings brackets in Mount Sterling are $55,000 to $64,999 for men (249 | 12.8%) and $12,500 to $14,999 for women (293 | 19.1%).
| Income | Male | Female |
| $2,499 or less | 39 (2.0%) | 60 (3.9%) |
| $2,500 to $4,999 | 10 (0.5%) | 44 (2.9%) |
| $5,000 to $7,499 | 38 (1.9%) | 82 (5.3%) |
| $7,500 to $9,999 | 0 (0.0%) | 24 (1.6%) |
| $10,000 to $12,499 | 133 (6.8%) | 83 (5.4%) |
| $12,500 to $14,999 | 67 (3.4%) | 293 (19.1%) |
| $15,000 to $17,499 | 103 (5.3%) | 15 (1.0%) |
| $17,500 to $19,999 | 114 (5.9%) | 66 (4.3%) |
| $20,000 to $22,499 | 83 (4.3%) | 115 (7.5%) |
| $22,500 to $24,999 | 0 (0.0%) | 73 (4.8%) |
| $25,000 to $29,999 | 34 (1.8%) | 22 (1.4%) |
| $30,000 to $34,999 | 95 (4.9%) | 116 (7.6%) |
| $35,000 to $39,999 | 163 (8.4%) | 184 (12.0%) |
| $40,000 to $44,999 | 96 (4.9%) | 75 (4.9%) |
| $45,000 to $49,999 | 71 (3.6%) | 53 (3.5%) |
| $50,000 to $54,999 | 59 (3.0%) | 17 (1.1%) |
| $55,000 to $64,999 | 249 (12.8%) | 113 (7.4%) |
| $65,000 to $74,999 | 228 (11.7%) | 82 (5.3%) |
| $75,000 to $99,999 | 233 (12.0%) | 11 (0.7%) |
| $100,000+ | 133 (6.8%) | 6 (0.4%) |
| Total | 1,948 (100.0%) | 1,534 (100.0%) |
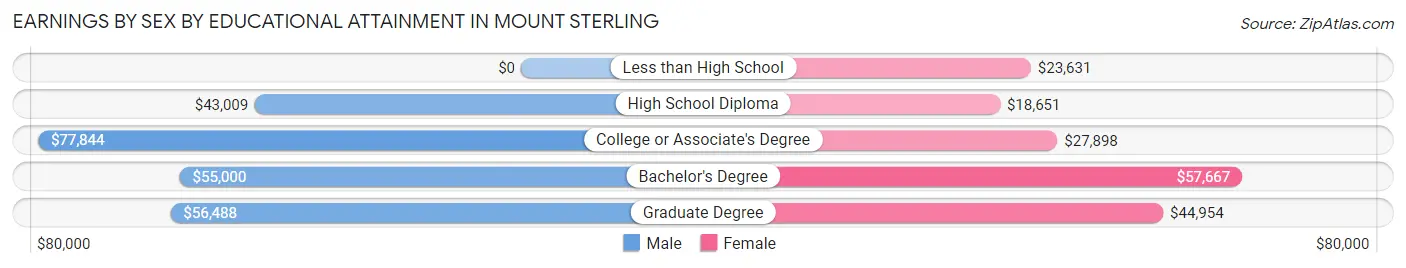
Earnings by Sex by Educational Attainment in Mount Sterling
Average earnings in Mount Sterling are $56,607 for men and $29,034 for women, a difference of 48.7%. Men with an educational attainment of college or associate's degree enjoy the highest average annual earnings of $77,844, while those with high school diploma education earn the least with $43,009. Women with an educational attainment of bachelor's degree earn the most with the average annual earnings of $57,667, while those with high school diploma education have the smallest earnings of $18,651.
| Educational Attainment | Male Income | Female Income |
| Less than High School | - | - |
| High School Diploma | $43,009 | $18,651 |
| College or Associate's Degree | $77,844 | $27,898 |
| Bachelor's Degree | $55,000 | $57,667 |
| Graduate Degree | $56,488 | $44,954 |
| Total | $56,607 | $29,034 |
Family Income in Mount Sterling
Family Income Brackets in Mount Sterling
According to the Mount Sterling family income data, there are 464 families falling into the $50,000 to $74,999 income range, which is the most common income bracket and makes up 22.2% of all families. Conversely, the $10,000 to $14,999 income bracket is the least frequent group with only 17 families (0.8%) belonging to this category.
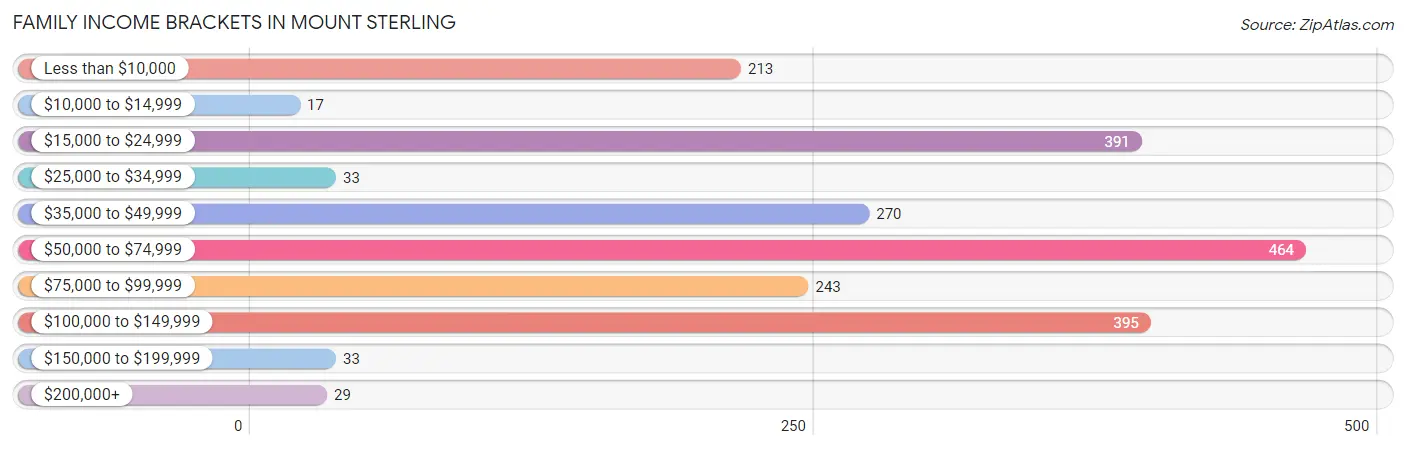
| Income Bracket | # Families | % Families |
| Less than $10,000 | 213 | 10.2% |
| $10,000 to $14,999 | 17 | 0.8% |
| $15,000 to $24,999 | 391 | 18.7% |
| $25,000 to $34,999 | 33 | 1.6% |
| $35,000 to $49,999 | 270 | 12.9% |
| $50,000 to $74,999 | 464 | 22.2% |
| $75,000 to $99,999 | 243 | 11.6% |
| $100,000 to $149,999 | 395 | 18.9% |
| $150,000 to $199,999 | 33 | 1.6% |
| $200,000+ | 29 | 1.4% |
Family Income by Famaliy Size in Mount Sterling
6-person families (30 | 1.4%) account for the highest median family income in Mount Sterling with $164,219 per family, while 2-person families (1,150 | 55.0%) have the highest median income of $28,820 per family member.
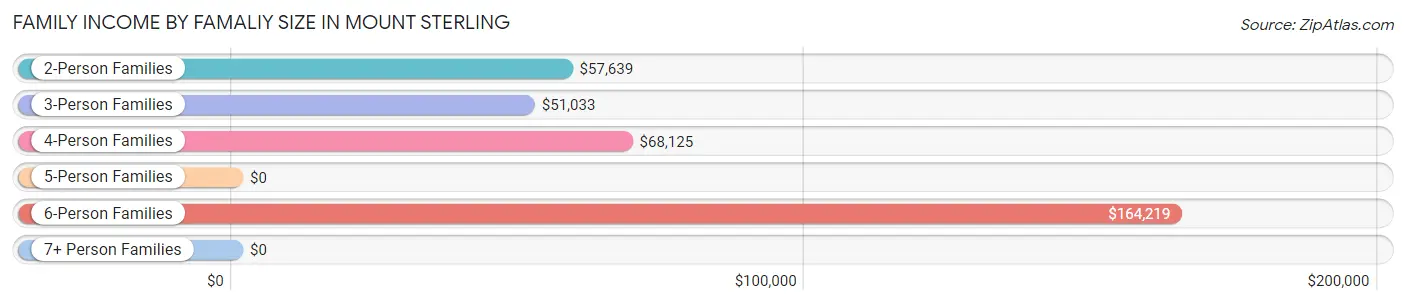
| Income Bracket | # Families | Median Income |
| 2-Person Families | 1,150 (55.0%) | $57,639 |
| 3-Person Families | 491 (23.5%) | $51,033 |
| 4-Person Families | 294 (14.1%) | $68,125 |
| 5-Person Families | 108 (5.2%) | $0 |
| 6-Person Families | 30 (1.4%) | $164,219 |
| 7+ Person Families | 18 (0.9%) | $0 |
| Total | 2,091 (100.0%) | $59,589 |
Family Income by Number of Earners in Mount Sterling
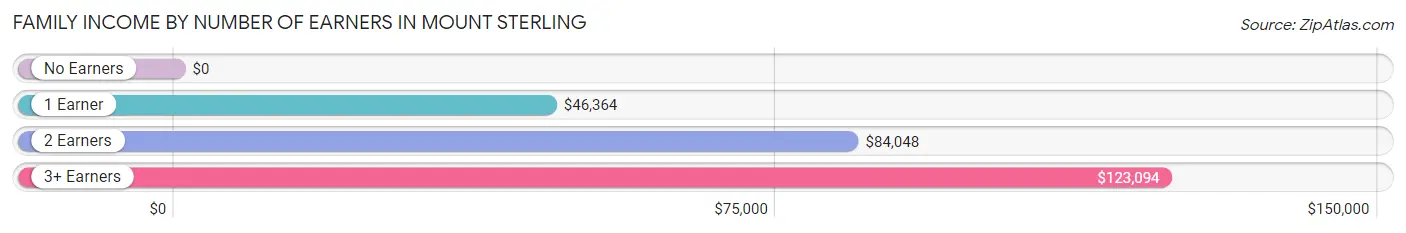
| Number of Earners | # Families | Median Income |
| No Earners | 371 (17.7%) | $0 |
| 1 Earner | 956 (45.7%) | $46,364 |
| 2 Earners | 636 (30.4%) | $84,048 |
| 3+ Earners | 128 (6.1%) | $123,094 |
| Total | 2,091 (100.0%) | $59,589 |
Household Income in Mount Sterling
Household Income Brackets in Mount Sterling
With 671 households falling in the category, the $50,000 to $74,999 income range is the most frequent in Mount Sterling, accounting for 21.0% of all households. In contrast, only 38 households (1.2%) fall into the $150,000 to $199,999 income bracket, making it the least populous group.
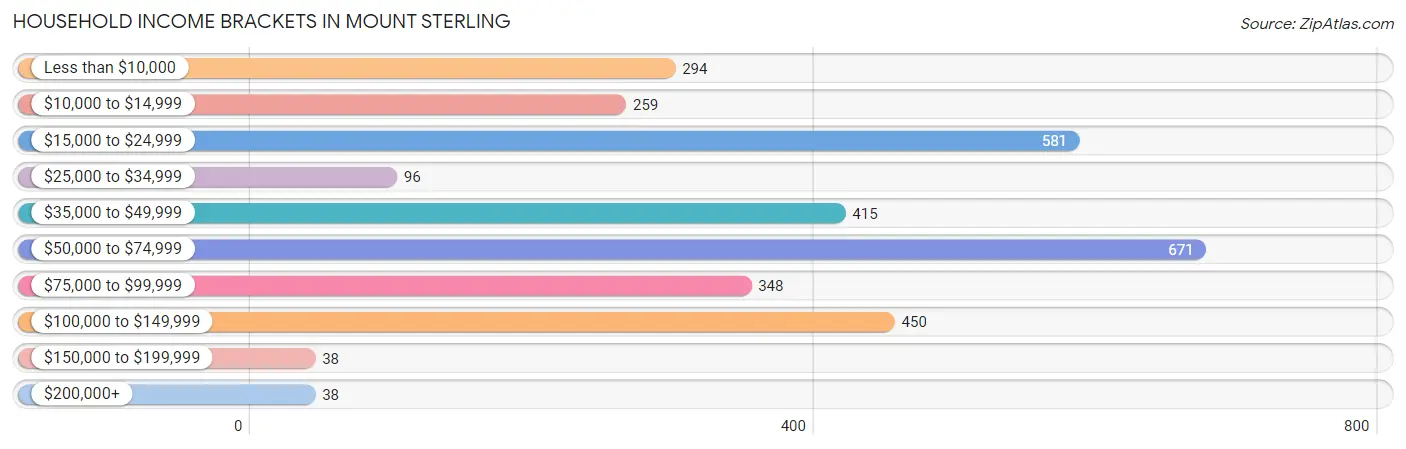
| Income Bracket | # Households | % Households |
| Less than $10,000 | 294 | 9.2% |
| $10,000 to $14,999 | 259 | 8.1% |
| $15,000 to $24,999 | 581 | 18.2% |
| $25,000 to $34,999 | 96 | 3.0% |
| $35,000 to $49,999 | 415 | 13.0% |
| $50,000 to $74,999 | 671 | 21.0% |
| $75,000 to $99,999 | 348 | 10.9% |
| $100,000 to $149,999 | 450 | 14.1% |
| $150,000 to $199,999 | 38 | 1.2% |
| $200,000+ | 38 | 1.2% |
Household Income by Householder Age in Mount Sterling
The median household income in Mount Sterling is $47,408, with the highest median household income of $73,045 found in the 45 to 64 years age bracket for the primary householder. A total of 1,093 households (34.2%) fall into this category. Meanwhile, the 15 to 24 years age bracket for the primary householder has the lowest median household income of $0, with 134 households (4.2%) in this group.
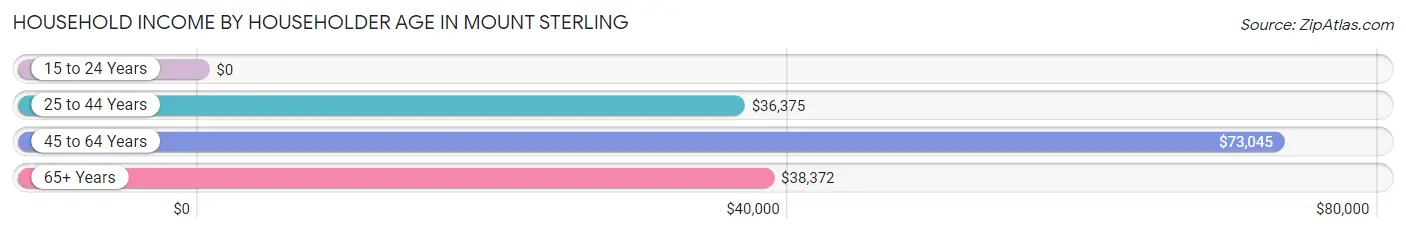
| Income Bracket | # Households | Median Income |
| 15 to 24 Years | 134 (4.2%) | $0 |
| 25 to 44 Years | 1,133 (35.5%) | $36,375 |
| 45 to 64 Years | 1,093 (34.2%) | $73,045 |
| 65+ Years | 834 (26.1%) | $38,372 |
| Total | 3,194 (100.0%) | $47,408 |
Poverty in Mount Sterling
Income Below Poverty by Sex and Age in Mount Sterling
With 21.1% poverty level for males and 28.8% for females among the residents of Mount Sterling, under 5 year old males and under 5 year old females are the most vulnerable to poverty, with 188 males (79.0%) and 126 females (77.3%) in their respective age groups living below the poverty level.
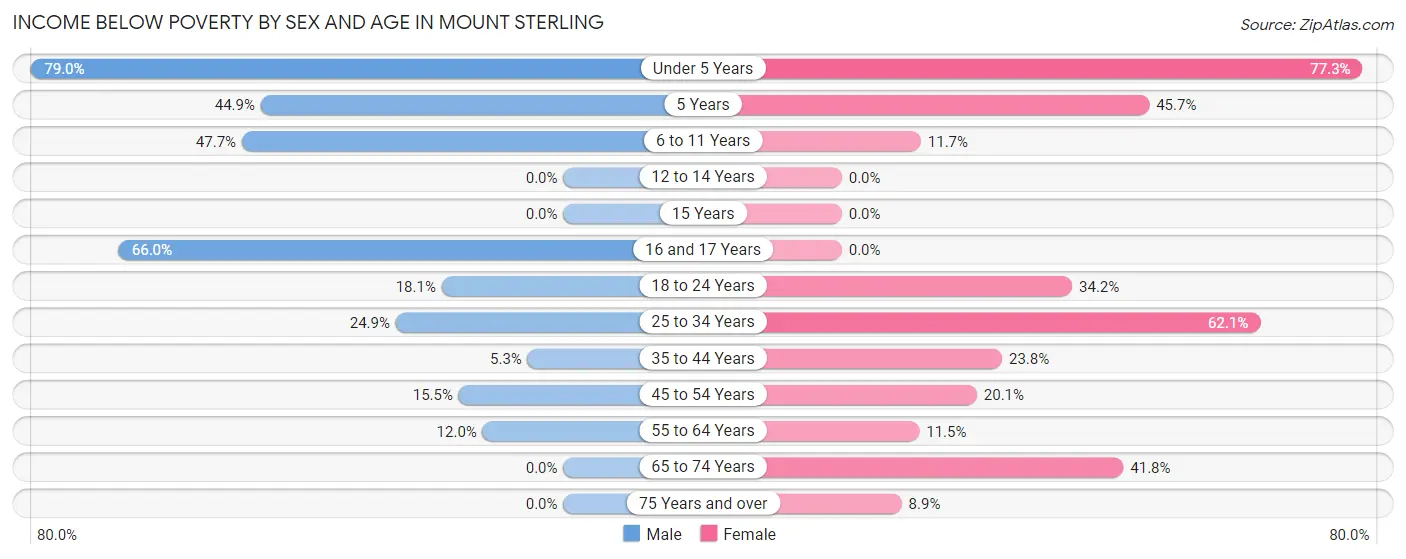
| Age Bracket | Male | Female |
| Under 5 Years | 188 (79.0%) | 126 (77.3%) |
| 5 Years | 31 (44.9%) | 21 (45.7%) |
| 6 to 11 Years | 147 (47.7%) | 31 (11.7%) |
| 12 to 14 Years | 0 (0.0%) | 0 (0.0%) |
| 15 Years | 0 (0.0%) | 0 (0.0%) |
| 16 and 17 Years | 33 (66.0%) | 0 (0.0%) |
| 18 to 24 Years | 78 (18.1%) | 131 (34.2%) |
| 25 to 34 Years | 102 (24.9%) | 287 (62.1%) |
| 35 to 44 Years | 23 (5.3%) | 149 (23.8%) |
| 45 to 54 Years | 84 (15.5%) | 71 (20.1%) |
| 55 to 64 Years | 66 (12.0%) | 64 (11.5%) |
| 65 to 74 Years | 0 (0.0%) | 166 (41.8%) |
| 75 Years and over | 0 (0.0%) | 28 (8.9%) |
| Total | 752 (21.1%) | 1,074 (28.8%) |
Income Above Poverty by Sex and Age in Mount Sterling
According to the poverty statistics in Mount Sterling, males aged 12 to 14 years and females aged 12 to 14 years are the age groups that are most secure financially, with 100.0% of males and 100.0% of females in these age groups living above the poverty line.
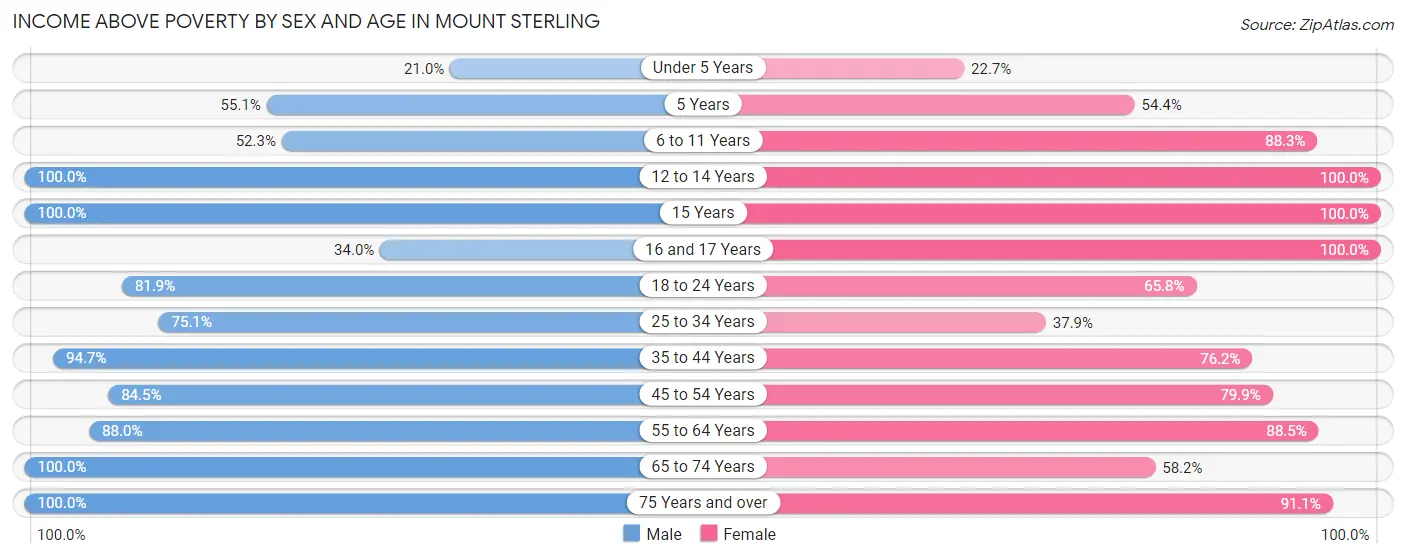
| Age Bracket | Male | Female |
| Under 5 Years | 50 (21.0%) | 37 (22.7%) |
| 5 Years | 38 (55.1%) | 25 (54.3%) |
| 6 to 11 Years | 161 (52.3%) | 233 (88.3%) |
| 12 to 14 Years | 67 (100.0%) | 110 (100.0%) |
| 15 Years | 68 (100.0%) | 6 (100.0%) |
| 16 and 17 Years | 17 (34.0%) | 44 (100.0%) |
| 18 to 24 Years | 354 (81.9%) | 252 (65.8%) |
| 25 to 34 Years | 308 (75.1%) | 175 (37.9%) |
| 35 to 44 Years | 411 (94.7%) | 477 (76.2%) |
| 45 to 54 Years | 457 (84.5%) | 283 (79.9%) |
| 55 to 64 Years | 485 (88.0%) | 492 (88.5%) |
| 65 to 74 Years | 223 (100.0%) | 231 (58.2%) |
| 75 Years and over | 165 (100.0%) | 287 (91.1%) |
| Total | 2,804 (78.8%) | 2,652 (71.2%) |
Income Below Poverty Among Married-Couple Families in Mount Sterling
The poverty statistics for married-couple families in Mount Sterling show that 8.1% or 86 of the total 1,064 families live below the poverty line. Families with 1 or 2 children have the highest poverty rate of 23.0%, comprising of 46 families. On the other hand, families with 5 or more children have the lowest poverty rate of 0.0%, which includes 0 families.
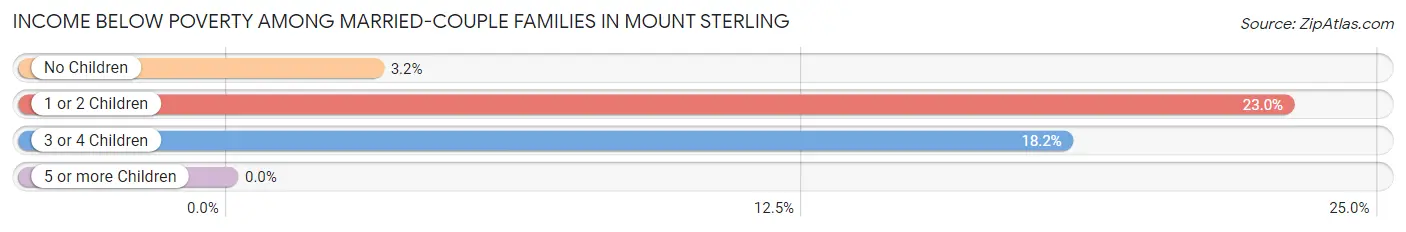
| Children | Above Poverty | Below Poverty |
| No Children | 734 (96.8%) | 24 (3.2%) |
| 1 or 2 Children | 154 (77.0%) | 46 (23.0%) |
| 3 or 4 Children | 72 (81.8%) | 16 (18.2%) |
| 5 or more Children | 18 (100.0%) | 0 (0.0%) |
| Total | 978 (91.9%) | 86 (8.1%) |
Income Below Poverty Among Single-Parent Households in Mount Sterling
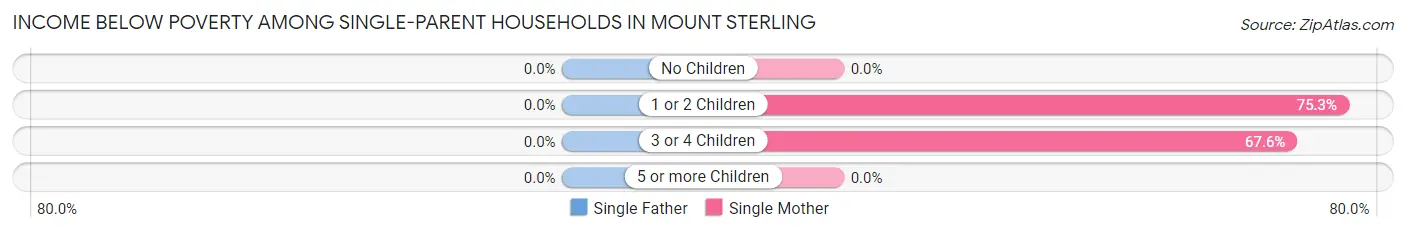
| Children | Single Father | Single Mother |
| No Children | 0 (0.0%) | 0 (0.0%) |
| 1 or 2 Children | 0 (0.0%) | 359 (75.3%) |
| 3 or 4 Children | 0 (0.0%) | 50 (67.6%) |
| 5 or more Children | 0 (0.0%) | 0 (0.0%) |
| Total | 0 (0.0%) | 409 (48.4%) |
Income Below Poverty Among Married-Couple vs Single-Parent Households in Mount Sterling
The poverty data for Mount Sterling shows that 86 of the married-couple family households (8.1%) and 409 of the single-parent households (39.8%) are living below the poverty level. Within the married-couple family households, those with 1 or 2 children have the highest poverty rate, with 46 households (23.0%) falling below the poverty line. Among the single-parent households, those with 3 or 4 children have the highest poverty rate, with 50 household (67.6%) living below poverty.
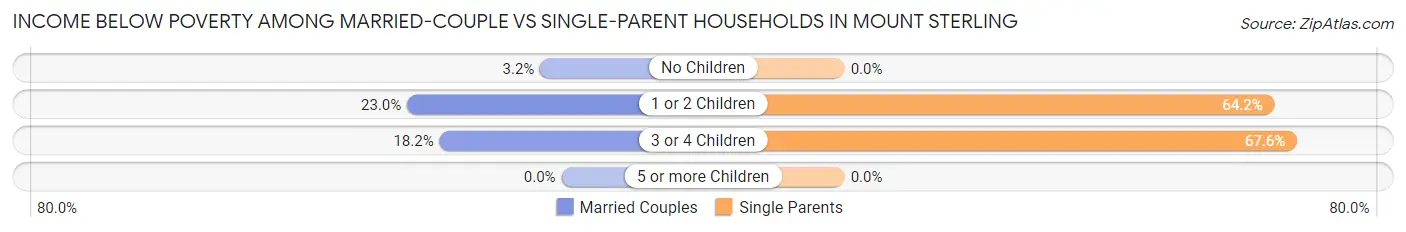
| Children | Married-Couple Families | Single-Parent Households |
| No Children | 24 (3.2%) | 0 (0.0%) |
| 1 or 2 Children | 46 (23.0%) | 359 (64.2%) |
| 3 or 4 Children | 16 (18.2%) | 50 (67.6%) |
| 5 or more Children | 0 (0.0%) | 0 (0.0%) |
| Total | 86 (8.1%) | 409 (39.8%) |
Race in Mount Sterling
The most populous races in Mount Sterling are White / Caucasian (7,117 | 94.5%), Black / African American (298 | 4.0%), and Two or more Races (117 | 1.5%).
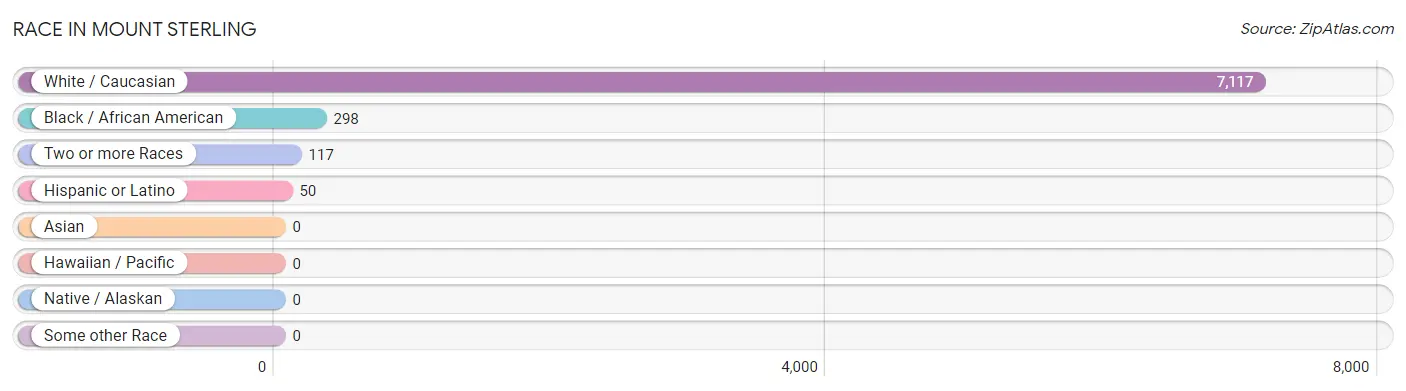
| Race | # Population | % Population |
| Asian | 0 | 0.0% |
| Black / African American | 298 | 4.0% |
| Hawaiian / Pacific | 0 | 0.0% |
| Hispanic or Latino | 50 | 0.7% |
| Native / Alaskan | 0 | 0.0% |
| White / Caucasian | 7,117 | 94.5% |
| Two or more Races | 117 | 1.5% |
| Some other Race | 0 | 0.0% |
| Total | 7,532 | 100.0% |
Ancestry in Mount Sterling
The most populous ancestries reported in Mount Sterling are American (2,533 | 33.6%), English (1,153 | 15.3%), Irish (856 | 11.4%), German (420 | 5.6%), and Scottish (87 | 1.2%), together accounting for 67.0% of all Mount Sterling residents.
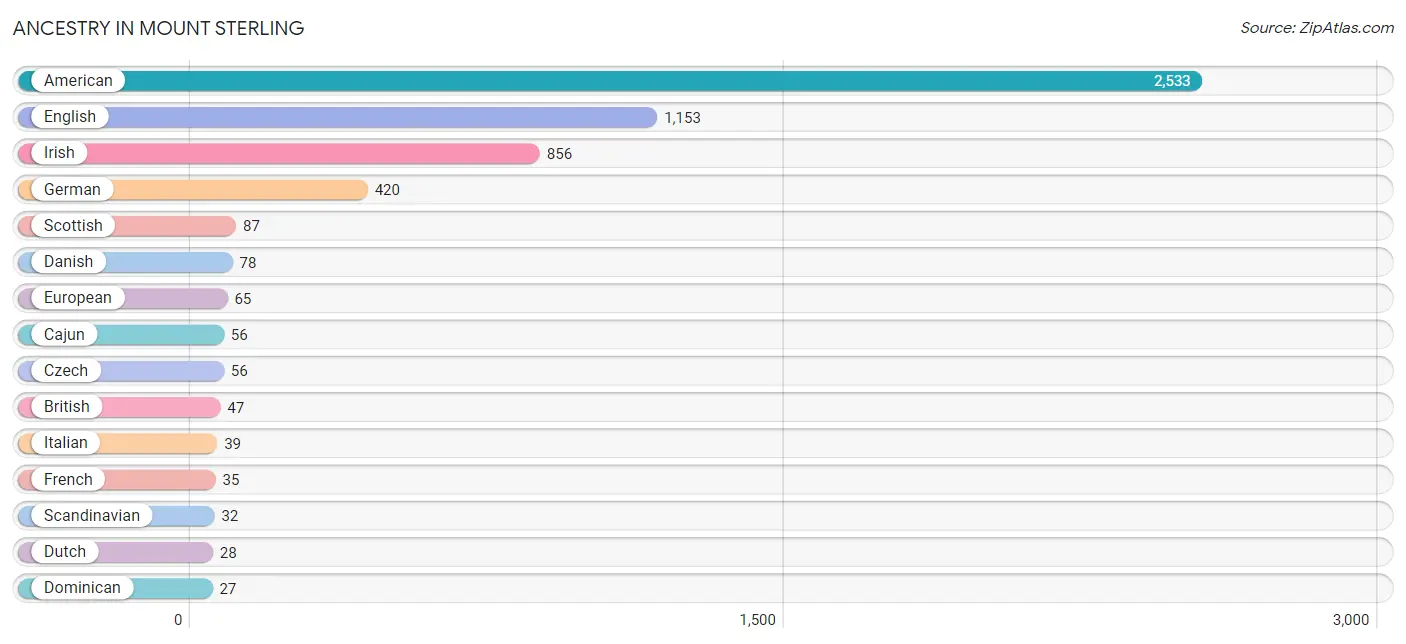
| Ancestry | # Population | % Population |
| American | 2,533 | 33.6% |
| British | 47 | 0.6% |
| Cajun | 56 | 0.7% |
| Cherokee | 9 | 0.1% |
| Cheyenne | 1 | 0.0% |
| Cuban | 23 | 0.3% |
| Czech | 56 | 0.7% |
| Danish | 78 | 1.0% |
| Dominican | 27 | 0.4% |
| Dutch | 28 | 0.4% |
| English | 1,153 | 15.3% |
| European | 65 | 0.9% |
| French | 35 | 0.5% |
| French Canadian | 12 | 0.2% |
| German | 420 | 5.6% |
| Greek | 12 | 0.2% |
| Irish | 856 | 11.4% |
| Italian | 39 | 0.5% |
| Norwegian | 22 | 0.3% |
| Polish | 12 | 0.2% |
| Scandinavian | 32 | 0.4% |
| Scotch-Irish | 17 | 0.2% |
| Scottish | 87 | 1.2% |
| Slovak | 10 | 0.1% |
| Welsh | 16 | 0.2% | View All 25 Rows |
Immigrants in Mount Sterling
The most numerous immigrant groups reported in Mount Sterling came from Europe (40 | 0.5%), Germany (17 | 0.2%), Western Europe (17 | 0.2%), Czechoslovakia (13 | 0.2%), and Eastern Europe (13 | 0.2%), together accounting for 1.3% of all Mount Sterling residents.
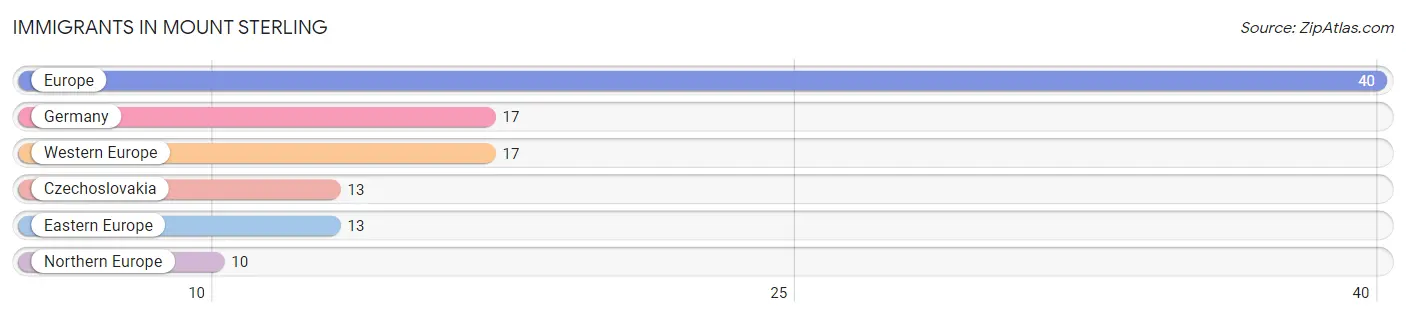
| Immigration Origin | # Population | % Population |
| Czechoslovakia | 13 | 0.2% |
| Eastern Europe | 13 | 0.2% |
| Europe | 40 | 0.5% |
| Germany | 17 | 0.2% |
| Northern Europe | 10 | 0.1% |
| Western Europe | 17 | 0.2% | View All 6 Rows |
Sex and Age in Mount Sterling
Sex and Age in Mount Sterling
The most populous age groups in Mount Sterling are 55 to 59 Years (435 | 11.8%) for men and 40 to 44 Years (523 | 13.6%) for women.
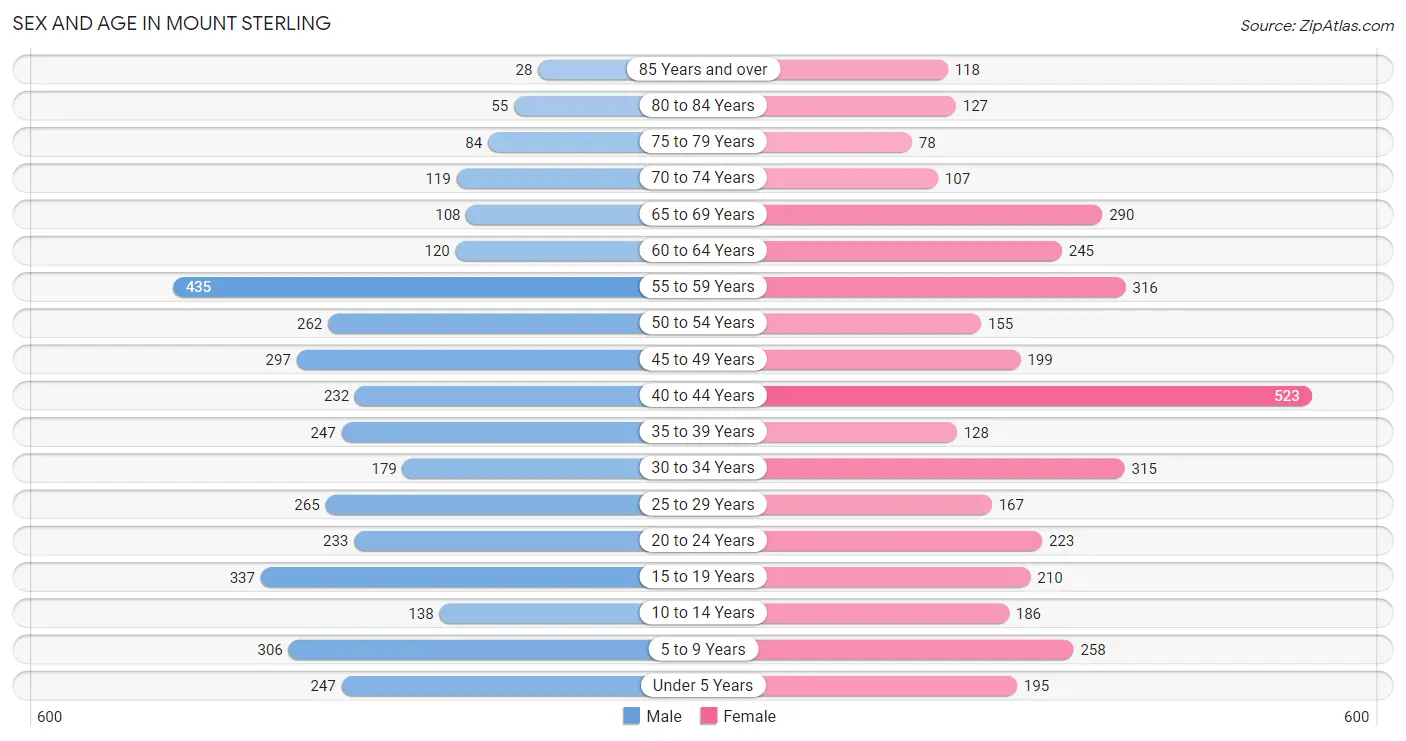
| Age Bracket | Male | Female |
| Under 5 Years | 247 (6.7%) | 195 (5.1%) |
| 5 to 9 Years | 306 (8.3%) | 258 (6.7%) |
| 10 to 14 Years | 138 (3.7%) | 186 (4.8%) |
| 15 to 19 Years | 337 (9.1%) | 210 (5.5%) |
| 20 to 24 Years | 233 (6.3%) | 223 (5.8%) |
| 25 to 29 Years | 265 (7.2%) | 167 (4.3%) |
| 30 to 34 Years | 179 (4.9%) | 315 (8.2%) |
| 35 to 39 Years | 247 (6.7%) | 128 (3.3%) |
| 40 to 44 Years | 232 (6.3%) | 523 (13.6%) |
| 45 to 49 Years | 297 (8.0%) | 199 (5.2%) |
| 50 to 54 Years | 262 (7.1%) | 155 (4.0%) |
| 55 to 59 Years | 435 (11.8%) | 316 (8.2%) |
| 60 to 64 Years | 120 (3.3%) | 245 (6.4%) |
| 65 to 69 Years | 108 (2.9%) | 290 (7.5%) |
| 70 to 74 Years | 119 (3.2%) | 107 (2.8%) |
| 75 to 79 Years | 84 (2.3%) | 78 (2.0%) |
| 80 to 84 Years | 55 (1.5%) | 127 (3.3%) |
| 85 Years and over | 28 (0.8%) | 118 (3.1%) |
| Total | 3,692 (100.0%) | 3,840 (100.0%) |
Families and Households in Mount Sterling
Median Family Size in Mount Sterling
The median family size in Mount Sterling is 2.74 persons per family, with married-couple families (1,064 | 50.9%) accounting for the largest median family size of 2.92 persons per family. On the other hand, single female/mother families (845 | 40.4%) represent the smallest median family size with 2.54 persons per family.
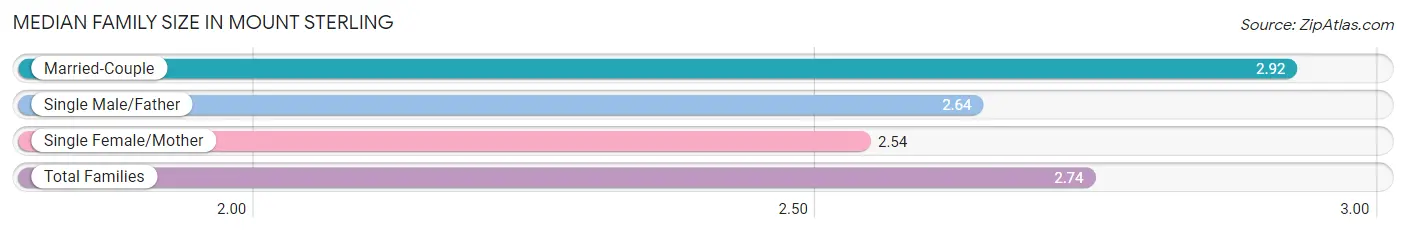
| Family Type | # Families | Family Size |
| Married-Couple | 1,064 (50.9%) | 2.92 |
| Single Male/Father | 182 (8.7%) | 2.64 |
| Single Female/Mother | 845 (40.4%) | 2.54 |
| Total Families | 2,091 (100.0%) | 2.74 |
Median Household Size in Mount Sterling
The median household size in Mount Sterling is 2.29 persons per household, with married-couple households (1,064 | 33.3%) accounting for the largest median household size of 2.97 persons per household. non-family households (1,103 | 34.5%) represent the smallest median household size with 1.30 persons per household.
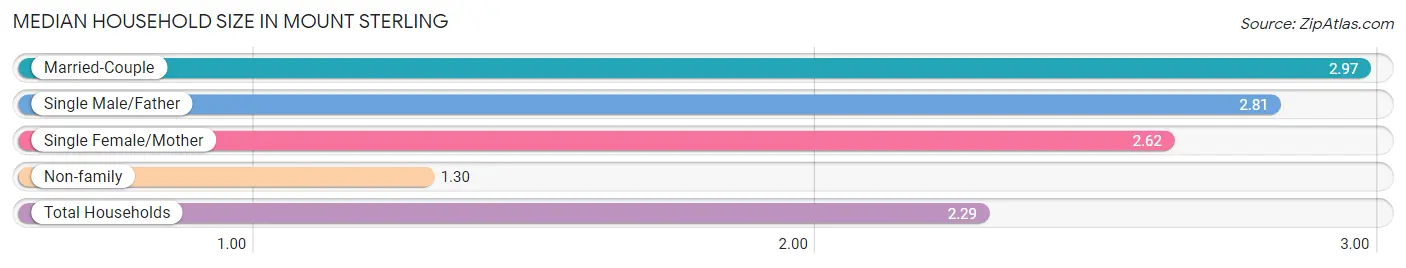
| Household Type | # Households | Household Size |
| Married-Couple | 1,064 (33.3%) | 2.97 |
| Single Male/Father | 182 (5.7%) | 2.81 |
| Single Female/Mother | 845 (26.5%) | 2.62 |
| Non-family | 1,103 (34.5%) | 1.30 |
| Total Households | 3,194 (100.0%) | 2.29 |
Household Size by Marriage Status in Mount Sterling
Out of a total of 3,194 households in Mount Sterling, 2,091 (65.5%) are family households, while 1,103 (34.5%) are nonfamily households. The most numerous type of family households are 2-person households, comprising 1,064, and the most common type of nonfamily households are 1-person households, comprising 829.
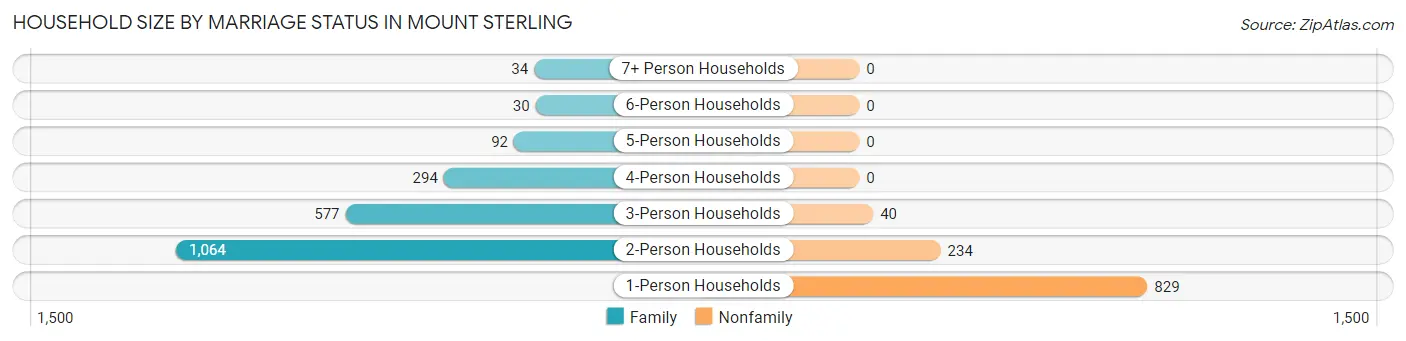
| Household Size | Family Households | Nonfamily Households |
| 1-Person Households | - | 829 (26.0%) |
| 2-Person Households | 1,064 (33.3%) | 234 (7.3%) |
| 3-Person Households | 577 (18.1%) | 40 (1.3%) |
| 4-Person Households | 294 (9.2%) | 0 (0.0%) |
| 5-Person Households | 92 (2.9%) | 0 (0.0%) |
| 6-Person Households | 30 (0.9%) | 0 (0.0%) |
| 7+ Person Households | 34 (1.1%) | 0 (0.0%) |
| Total | 2,091 (65.5%) | 1,103 (34.5%) |
Female Fertility in Mount Sterling
Fertility by Age in Mount Sterling
Average fertility rate in Mount Sterling is 45.0 births per 1,000 women. Women in the age bracket of 35 to 50 years have the highest fertility rate with 63.0 births per 1,000 women. Women in the age bracket of 35 to 50 years acount for 68.8% of all women with births.
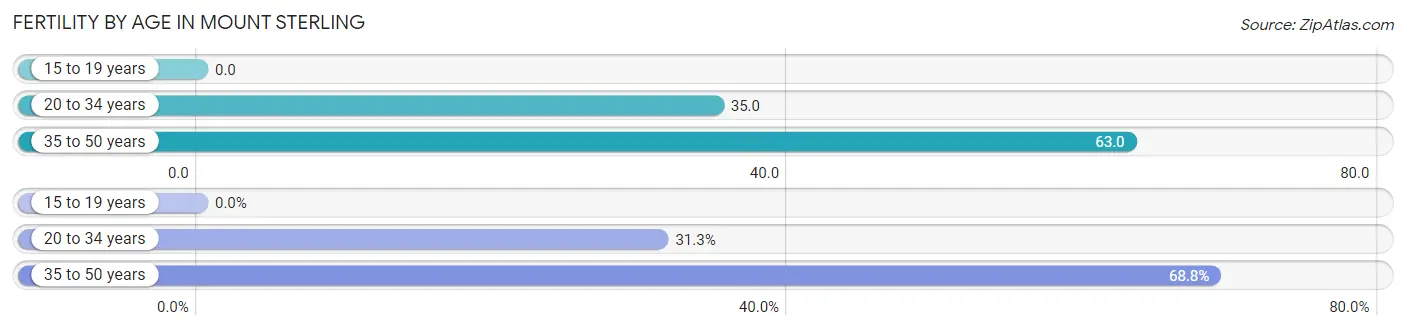
| Age Bracket | Women with Births | Births / 1,000 Women |
| 15 to 19 years | 0 (0.0%) | 0.0 |
| 20 to 34 years | 25 (31.2%) | 35.0 |
| 35 to 50 years | 55 (68.8%) | 63.0 |
| Total | 80 (100.0%) | 45.0 |
Fertility by Age by Marriage Status in Mount Sterling
85.0% of women with births (80) in Mount Sterling are married. The highest percentage of unmarried women with births falls into 20 to 34 years age bracket with 48.0% of them unmarried at the time of birth, while the lowest percentage of unmarried women with births belong to 35 to 50 years age bracket with 0.0% of them unmarried.
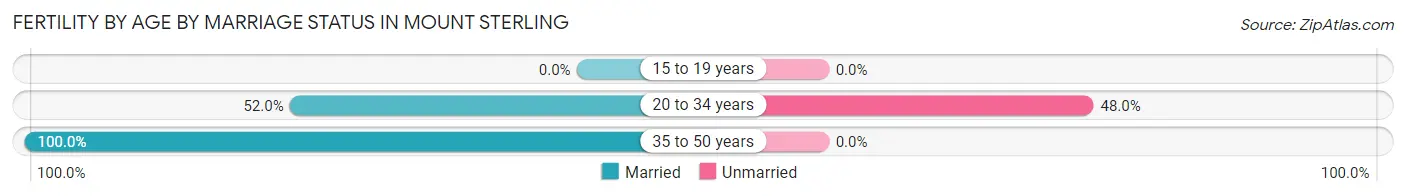
| Age Bracket | Married | Unmarried |
| 15 to 19 years | 0 (0.0%) | 0 (0.0%) |
| 20 to 34 years | 13 (52.0%) | 12 (48.0%) |
| 35 to 50 years | 55 (100.0%) | 0 (0.0%) |
| Total | 68 (85.0%) | 12 (15.0%) |
Fertility by Education in Mount Sterling
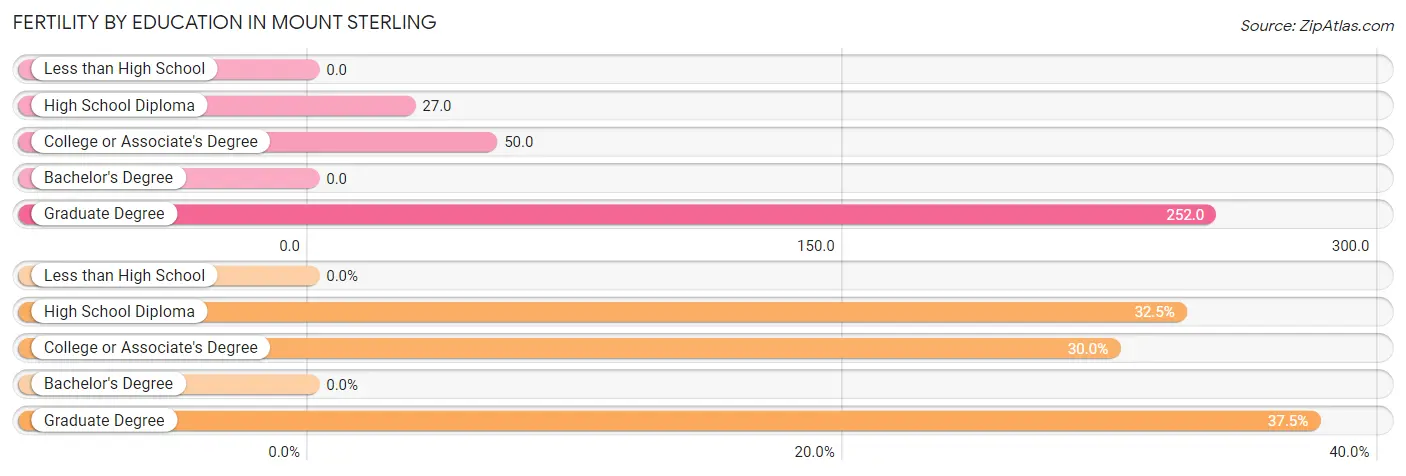
| Educational Attainment | Women with Births | Births / 1,000 Women |
| Less than High School | 0 (0.0%) | 0.0 |
| High School Diploma | 26 (32.5%) | 27.0 |
| College or Associate's Degree | 24 (30.0%) | 50.0 |
| Bachelor's Degree | 0 (0.0%) | 0.0 |
| Graduate Degree | 30 (37.5%) | 252.0 |
| Total | 80 (100.0%) | 45.0 |
Fertility by Education by Marriage Status in Mount Sterling
15.0% of women with births in Mount Sterling are unmarried. Women with the educational attainment of high school diploma are most likely to be married with 100.0% of them married at childbirth, while women with the educational attainment of graduate degree are least likely to be married with 40.0% of them unmarried at childbirth.
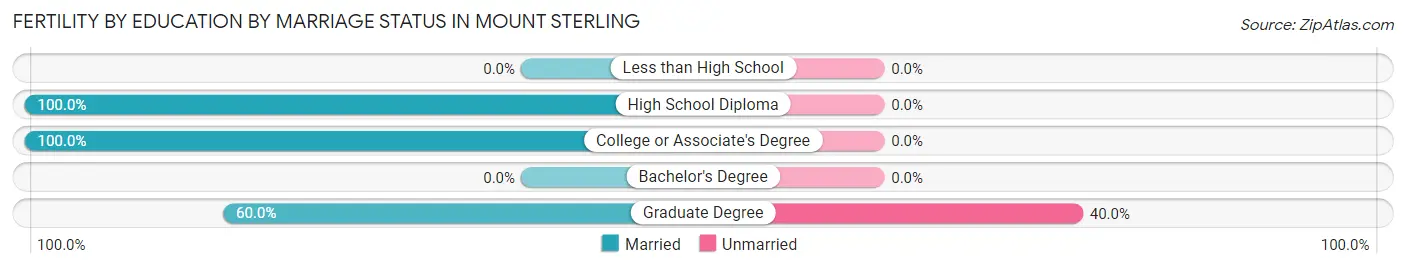
| Educational Attainment | Married | Unmarried |
| Less than High School | 0 (0.0%) | 0 (0.0%) |
| High School Diploma | 26 (100.0%) | 0 (0.0%) |
| College or Associate's Degree | 24 (100.0%) | 0 (0.0%) |
| Bachelor's Degree | 0 (0.0%) | 0 (0.0%) |
| Graduate Degree | 18 (60.0%) | 12 (40.0%) |
| Total | 68 (85.0%) | 12 (15.0%) |
Employment Characteristics in Mount Sterling
Employment by Class of Employer in Mount Sterling
Among the 2,981 employed individuals in Mount Sterling, private company employees (2,328 | 78.1%), local government employees (236 | 7.9%), and not-for-profit organizations (193 | 6.5%) make up the most common classes of employment.
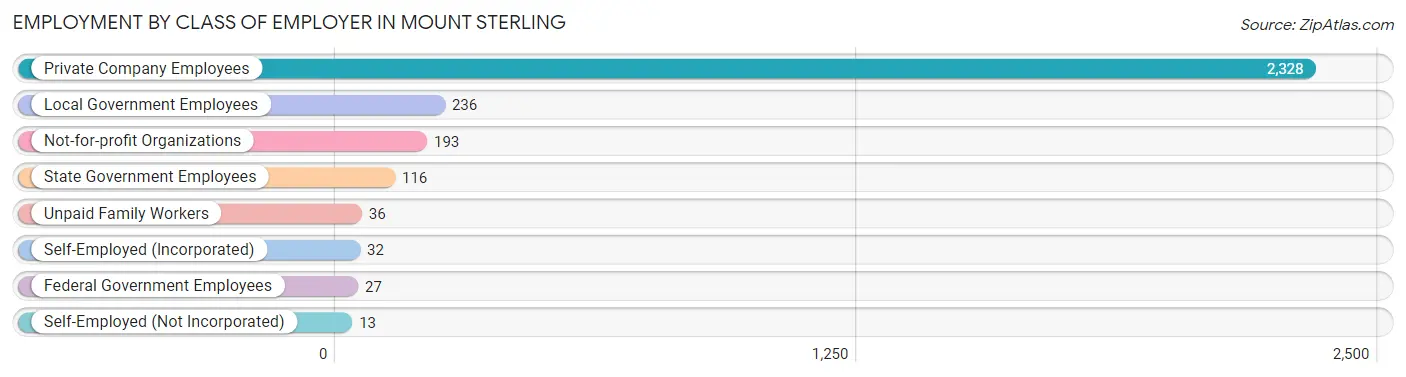
| Employer Class | # Employees | % Employees |
| Private Company Employees | 2,328 | 78.1% |
| Self-Employed (Incorporated) | 32 | 1.1% |
| Self-Employed (Not Incorporated) | 13 | 0.4% |
| Not-for-profit Organizations | 193 | 6.5% |
| Local Government Employees | 236 | 7.9% |
| State Government Employees | 116 | 3.9% |
| Federal Government Employees | 27 | 0.9% |
| Unpaid Family Workers | 36 | 1.2% |
| Total | 2,981 | 100.0% |
Employment Status by Age in Mount Sterling
According to the labor force statistics for Mount Sterling, out of the total population over 16 years of age (6,128), 52.6% or 3,223 individuals are in the labor force, with 5.7% or 184 of them unemployed. The age group with the highest labor force participation rate is 45 to 54 years, with 70.9% or 647 individuals in the labor force. Within the labor force, the 16 to 19 years age range has the highest percentage of unemployed individuals, with 18.4% or 54 of them being unemployed.
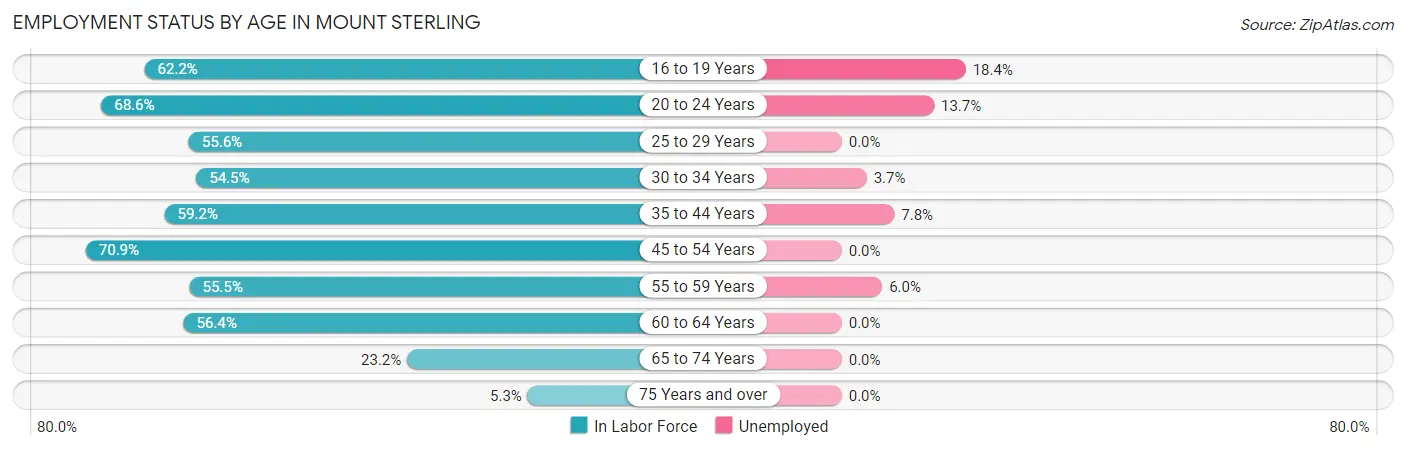
| Age Bracket | In Labor Force | Unemployed |
| 16 to 19 Years | 294 (62.2%) | 54 (18.4%) |
| 20 to 24 Years | 313 (68.6%) | 43 (13.7%) |
| 25 to 29 Years | 240 (55.6%) | 0 (0.0%) |
| 30 to 34 Years | 269 (54.5%) | 10 (3.7%) |
| 35 to 44 Years | 669 (59.2%) | 52 (7.8%) |
| 45 to 54 Years | 647 (70.9%) | 0 (0.0%) |
| 55 to 59 Years | 417 (55.5%) | 25 (6.0%) |
| 60 to 64 Years | 206 (56.4%) | 0 (0.0%) |
| 65 to 74 Years | 145 (23.2%) | 0 (0.0%) |
| 75 Years and over | 26 (5.3%) | 0 (0.0%) |
| Total | 3,223 (52.6%) | 184 (5.7%) |
Employment Status by Educational Attainment in Mount Sterling
According to labor force statistics for Mount Sterling, 59.9% of individuals (2,447) out of the total population between 25 and 64 years of age (4,085) are in the labor force, with 3.6% or 88 of them being unemployed. The group with the highest labor force participation rate are those with the educational attainment of bachelor's degree or higher, with 76.4% or 622 individuals in the labor force. Within the labor force, individuals with high school diploma education have the highest percentage of unemployment, with 7.8% or 77 of them being unemployed.
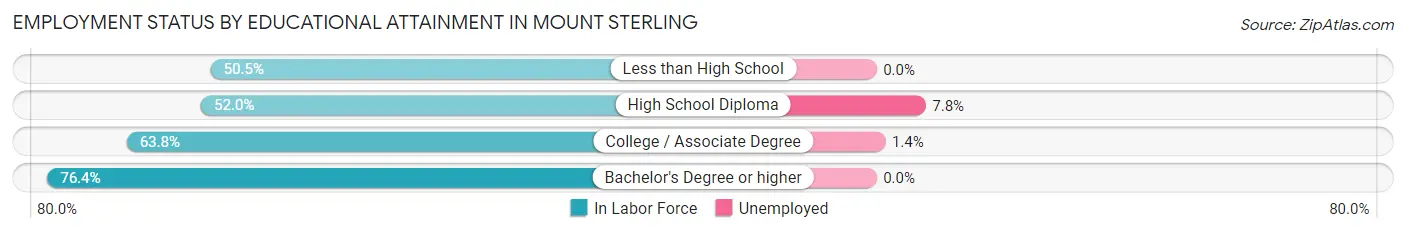
| Educational Attainment | In Labor Force | Unemployed |
| Less than High School | 146 (50.5%) | 0 (0.0%) |
| High School Diploma | 981 (52.0%) | 147 (7.8%) |
| College / Associate Degree | 699 (63.8%) | 15 (1.4%) |
| Bachelor's Degree or higher | 622 (76.4%) | 0 (0.0%) |
| Total | 2,447 (59.9%) | 147 (3.6%) |
Employment Occupations by Sex in Mount Sterling
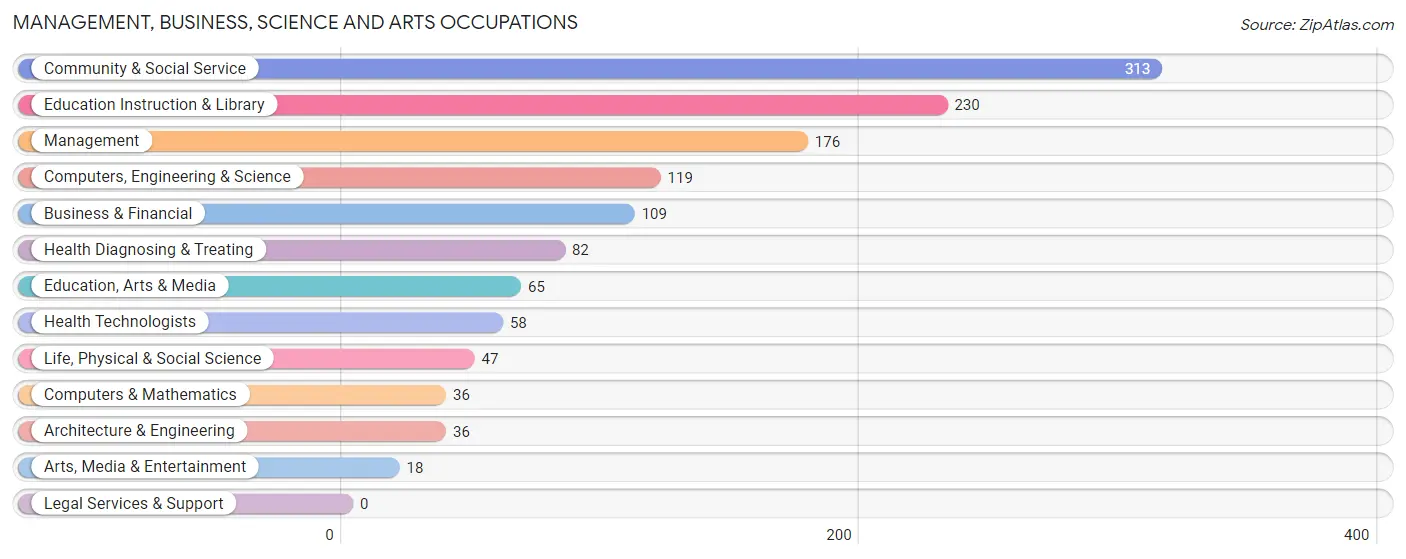
Management, Business, Science and Arts Occupations
The most common Management, Business, Science and Arts occupations in Mount Sterling are Community & Social Service (313 | 10.3%), Education Instruction & Library (230 | 7.6%), Management (176 | 5.8%), Computers, Engineering & Science (119 | 3.9%), and Business & Financial (109 | 3.6%).
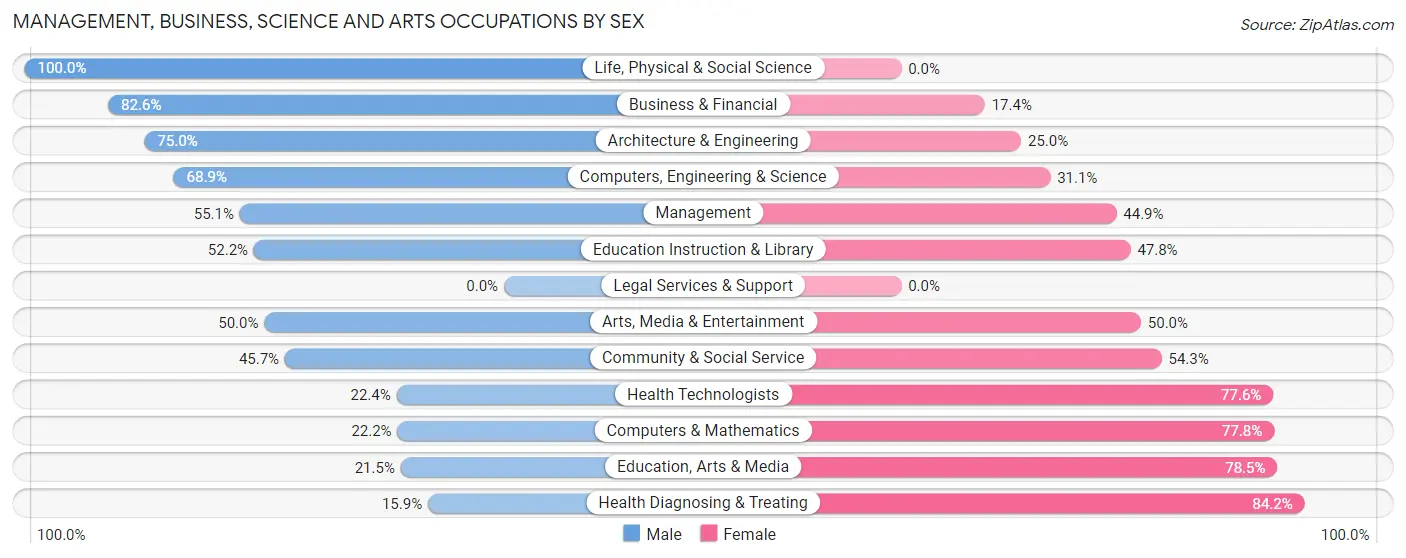
Management, Business, Science and Arts Occupations by Sex
Within the Management, Business, Science and Arts occupations in Mount Sterling, the most male-oriented occupations are Life, Physical & Social Science (100.0%), Business & Financial (82.6%), and Architecture & Engineering (75.0%), while the most female-oriented occupations are Health Diagnosing & Treating (84.2%), Education, Arts & Media (78.5%), and Computers & Mathematics (77.8%).
| Occupation | Male | Female |
| Management | 97 (55.1%) | 79 (44.9%) |
| Business & Financial | 90 (82.6%) | 19 (17.4%) |
| Computers, Engineering & Science | 82 (68.9%) | 37 (31.1%) |
| Computers & Mathematics | 8 (22.2%) | 28 (77.8%) |
| Architecture & Engineering | 27 (75.0%) | 9 (25.0%) |
| Life, Physical & Social Science | 47 (100.0%) | 0 (0.0%) |
| Community & Social Service | 143 (45.7%) | 170 (54.3%) |
| Education, Arts & Media | 14 (21.5%) | 51 (78.5%) |
| Legal Services & Support | 0 (0.0%) | 0 (0.0%) |
| Education Instruction & Library | 120 (52.2%) | 110 (47.8%) |
| Arts, Media & Entertainment | 9 (50.0%) | 9 (50.0%) |
| Health Diagnosing & Treating | 13 (15.9%) | 69 (84.2%) |
| Health Technologists | 13 (22.4%) | 45 (77.6%) |
| Total (Category) | 425 (53.2%) | 374 (46.8%) |
| Total (Overall) | 1,787 (58.7%) | 1,255 (41.3%) |
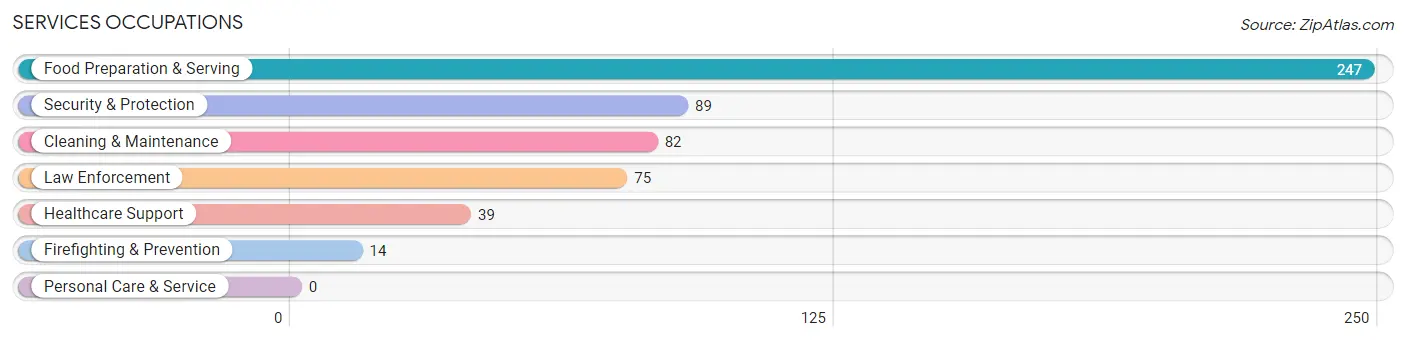
Services Occupations
The most common Services occupations in Mount Sterling are Food Preparation & Serving (247 | 8.1%), Security & Protection (89 | 2.9%), Cleaning & Maintenance (82 | 2.7%), Law Enforcement (75 | 2.5%), and Healthcare Support (39 | 1.3%).
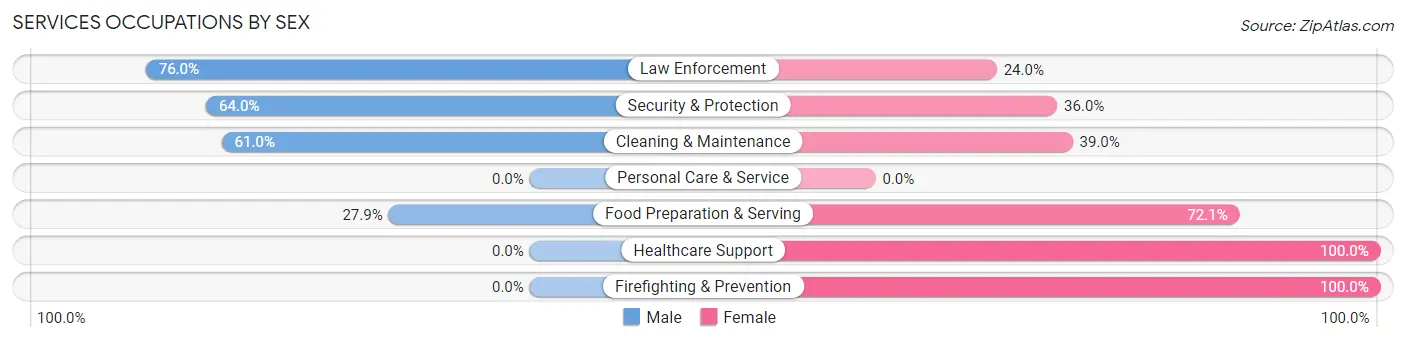
Services Occupations by Sex
Within the Services occupations in Mount Sterling, the most male-oriented occupations are Law Enforcement (76.0%), Security & Protection (64.0%), and Cleaning & Maintenance (61.0%), while the most female-oriented occupations are Healthcare Support (100.0%), Firefighting & Prevention (100.0%), and Food Preparation & Serving (72.1%).
| Occupation | Male | Female |
| Healthcare Support | 0 (0.0%) | 39 (100.0%) |
| Security & Protection | 57 (64.0%) | 32 (36.0%) |
| Firefighting & Prevention | 0 (0.0%) | 14 (100.0%) |
| Law Enforcement | 57 (76.0%) | 18 (24.0%) |
| Food Preparation & Serving | 69 (27.9%) | 178 (72.1%) |
| Cleaning & Maintenance | 50 (61.0%) | 32 (39.0%) |
| Personal Care & Service | 0 (0.0%) | 0 (0.0%) |
| Total (Category) | 176 (38.5%) | 281 (61.5%) |
| Total (Overall) | 1,787 (58.7%) | 1,255 (41.3%) |
Sales and Office Occupations
The most common Sales and Office occupations in Mount Sterling are Office & Administration (419 | 13.8%), and Sales & Related (343 | 11.3%).
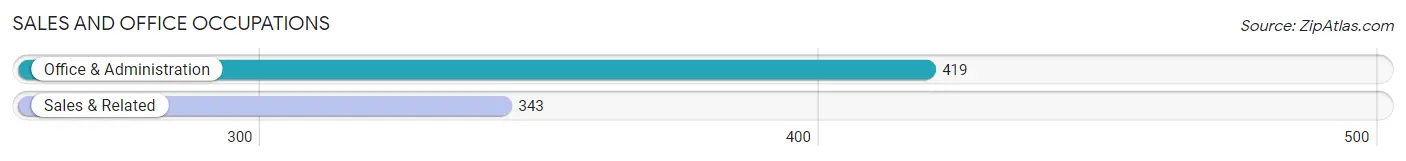
Sales and Office Occupations by Sex
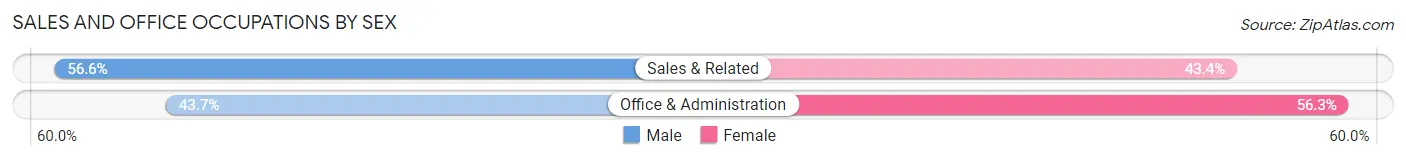
| Occupation | Male | Female |
| Sales & Related | 194 (56.6%) | 149 (43.4%) |
| Office & Administration | 183 (43.7%) | 236 (56.3%) |
| Total (Category) | 377 (49.5%) | 385 (50.5%) |
| Total (Overall) | 1,787 (58.7%) | 1,255 (41.3%) |
Natural Resources, Construction and Maintenance Occupations
The most common Natural Resources, Construction and Maintenance occupations in Mount Sterling are Installation, Maintenance & Repair (108 | 3.5%), and Construction & Extraction (104 | 3.4%).
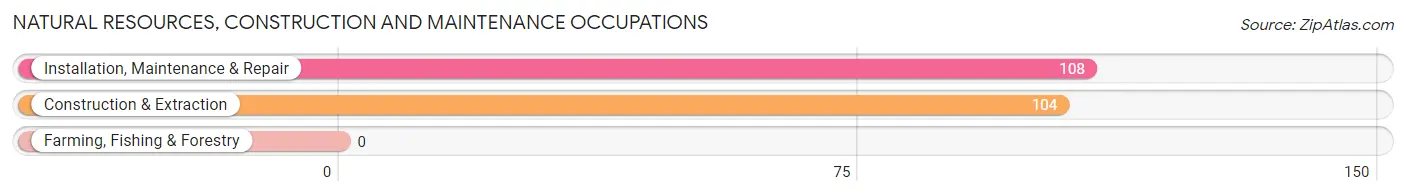
Natural Resources, Construction and Maintenance Occupations by Sex
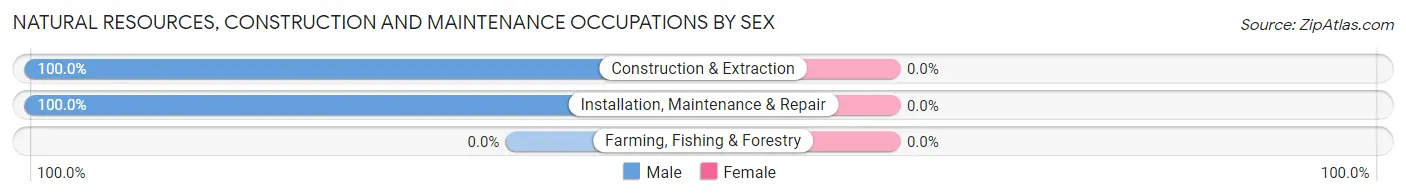
| Occupation | Male | Female |
| Farming, Fishing & Forestry | 0 (0.0%) | 0 (0.0%) |
| Construction & Extraction | 104 (100.0%) | 0 (0.0%) |
| Installation, Maintenance & Repair | 108 (100.0%) | 0 (0.0%) |
| Total (Category) | 212 (100.0%) | 0 (0.0%) |
| Total (Overall) | 1,787 (58.7%) | 1,255 (41.3%) |
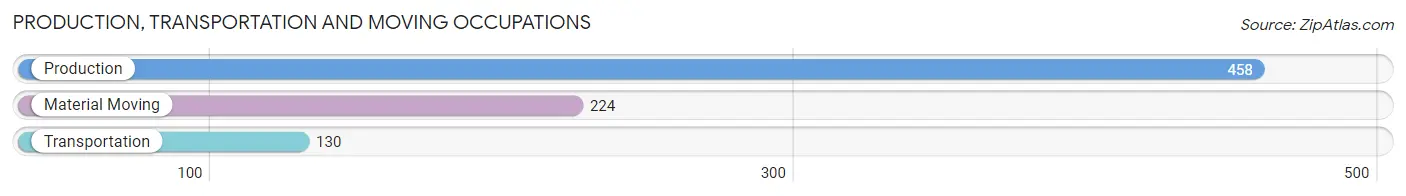
Production, Transportation and Moving Occupations
The most common Production, Transportation and Moving occupations in Mount Sterling are Production (458 | 15.1%), Material Moving (224 | 7.4%), and Transportation (130 | 4.3%).
Production, Transportation and Moving Occupations by Sex
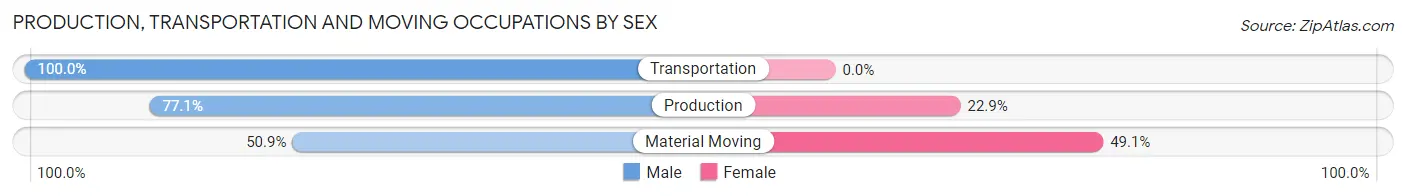
| Occupation | Male | Female |
| Production | 353 (77.1%) | 105 (22.9%) |
| Transportation | 130 (100.0%) | 0 (0.0%) |
| Material Moving | 114 (50.9%) | 110 (49.1%) |
| Total (Category) | 597 (73.5%) | 215 (26.5%) |
| Total (Overall) | 1,787 (58.7%) | 1,255 (41.3%) |
Employment Industries by Sex in Mount Sterling
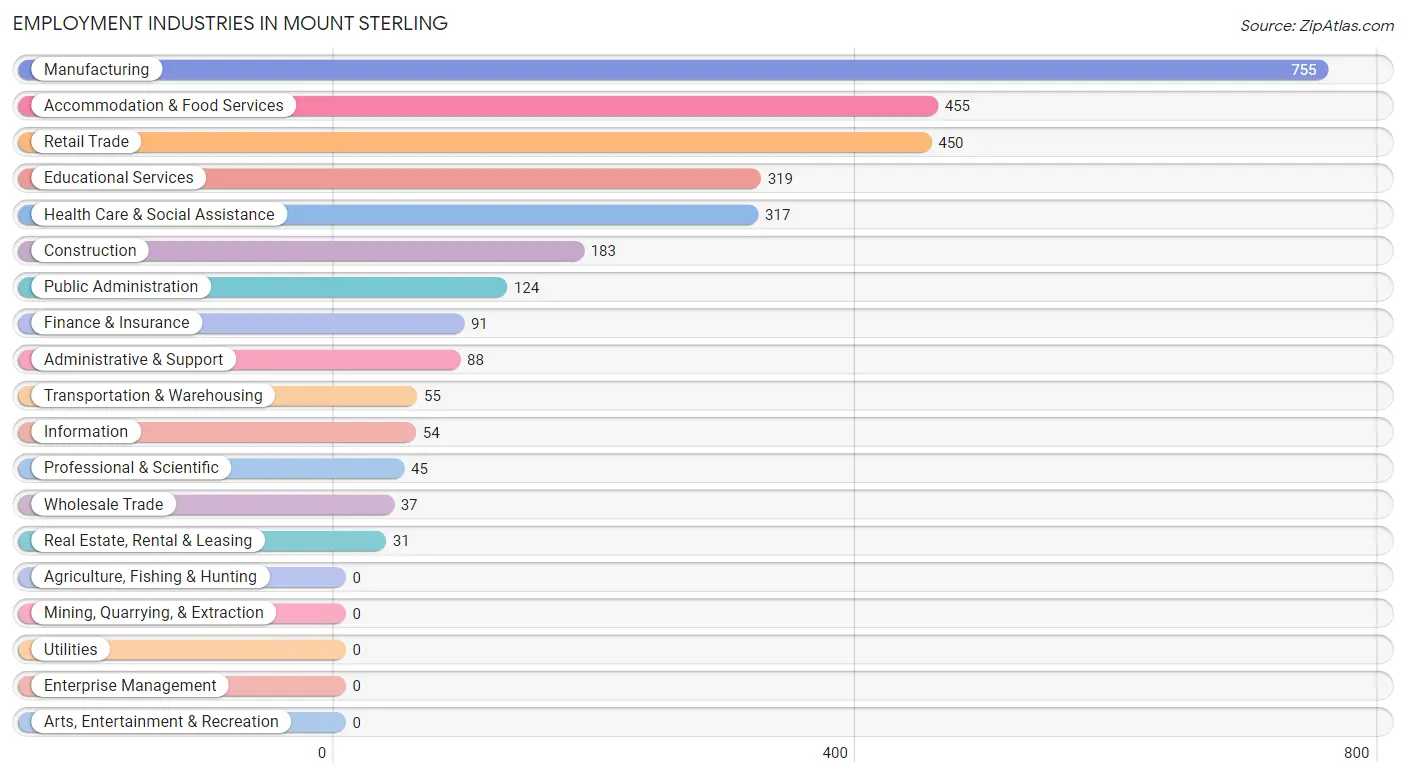
Employment Industries in Mount Sterling
The major employment industries in Mount Sterling include Manufacturing (755 | 24.8%), Accommodation & Food Services (455 | 15.0%), Retail Trade (450 | 14.8%), Educational Services (319 | 10.5%), and Health Care & Social Assistance (317 | 10.4%).
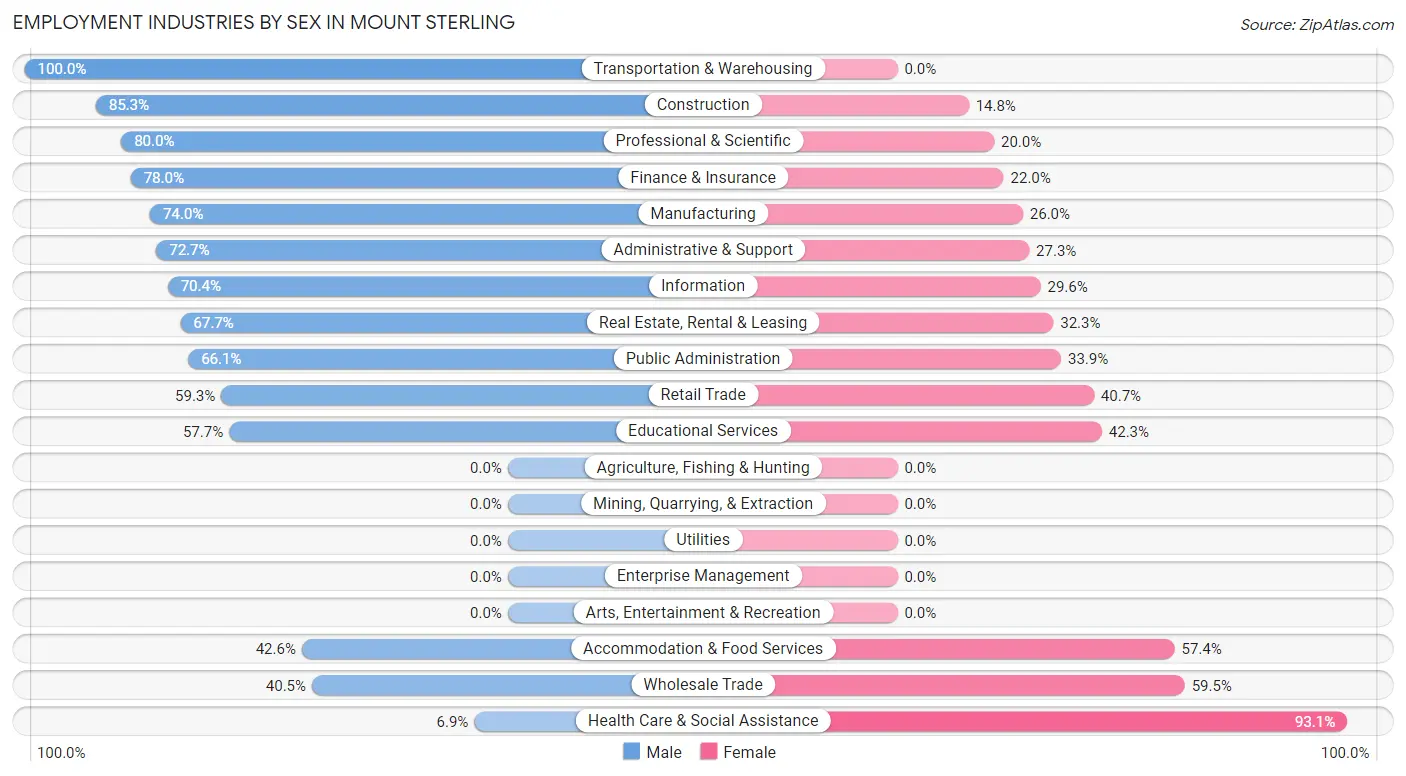
Employment Industries by Sex in Mount Sterling
The Mount Sterling industries that see more men than women are Transportation & Warehousing (100.0%), Construction (85.3%), and Professional & Scientific (80.0%), whereas the industries that tend to have a higher number of women are Health Care & Social Assistance (93.1%), Wholesale Trade (59.5%), and Accommodation & Food Services (57.4%).
| Industry | Male | Female |
| Agriculture, Fishing & Hunting | 0 (0.0%) | 0 (0.0%) |
| Mining, Quarrying, & Extraction | 0 (0.0%) | 0 (0.0%) |
| Construction | 156 (85.3%) | 27 (14.7%) |
| Manufacturing | 559 (74.0%) | 196 (26.0%) |
| Wholesale Trade | 15 (40.5%) | 22 (59.5%) |
| Retail Trade | 267 (59.3%) | 183 (40.7%) |
| Transportation & Warehousing | 55 (100.0%) | 0 (0.0%) |
| Utilities | 0 (0.0%) | 0 (0.0%) |
| Information | 38 (70.4%) | 16 (29.6%) |
| Finance & Insurance | 71 (78.0%) | 20 (22.0%) |
| Real Estate, Rental & Leasing | 21 (67.7%) | 10 (32.3%) |
| Professional & Scientific | 36 (80.0%) | 9 (20.0%) |
| Enterprise Management | 0 (0.0%) | 0 (0.0%) |
| Administrative & Support | 64 (72.7%) | 24 (27.3%) |
| Educational Services | 184 (57.7%) | 135 (42.3%) |
| Health Care & Social Assistance | 22 (6.9%) | 295 (93.1%) |
| Arts, Entertainment & Recreation | 0 (0.0%) | 0 (0.0%) |
| Accommodation & Food Services | 194 (42.6%) | 261 (57.4%) |
| Public Administration | 82 (66.1%) | 42 (33.9%) |
| Total | 1,787 (58.7%) | 1,255 (41.3%) |
Education in Mount Sterling
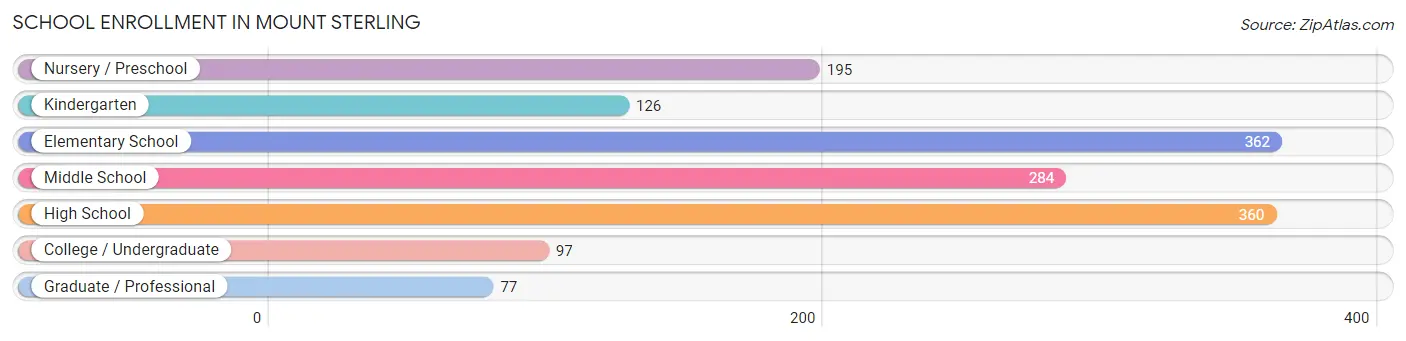
School Enrollment in Mount Sterling
The most common levels of schooling among the 1,501 students in Mount Sterling are elementary school (362 | 24.1%), high school (360 | 24.0%), and middle school (284 | 18.9%).
| School Level | # Students | % Students |
| Nursery / Preschool | 195 | 13.0% |
| Kindergarten | 126 | 8.4% |
| Elementary School | 362 | 24.1% |
| Middle School | 284 | 18.9% |
| High School | 360 | 24.0% |
| College / Undergraduate | 97 | 6.5% |
| Graduate / Professional | 77 | 5.1% |
| Total | 1,501 | 100.0% |
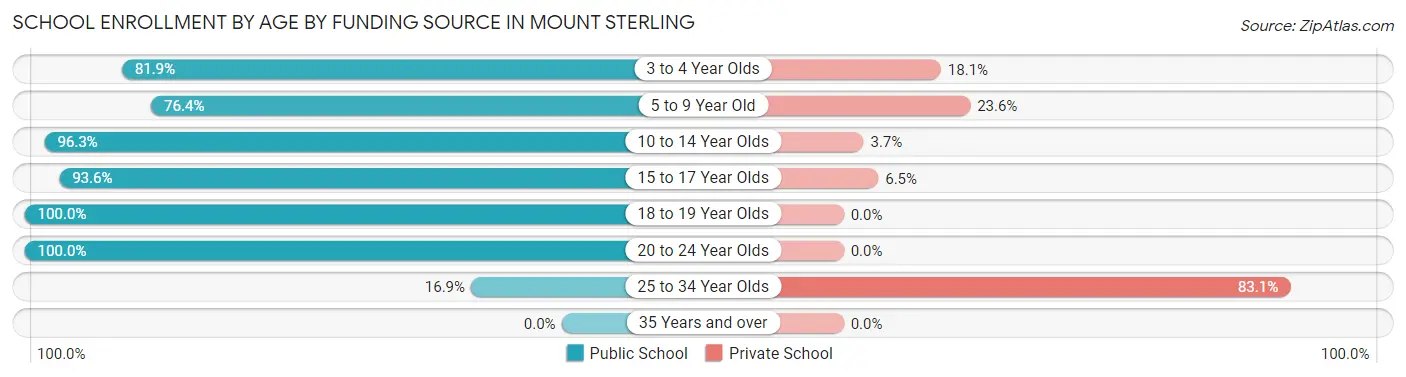
School Enrollment by Age by Funding Source in Mount Sterling
Out of a total of 1,501 students who are enrolled in schools in Mount Sterling, 233 (15.5%) attend a private institution, while the remaining 1,268 (84.5%) are enrolled in public schools. The age group of 25 to 34 year olds has the highest likelihood of being enrolled in private schools, with 64 (83.1% in the age bracket) enrolled. Conversely, the age group of 18 to 19 year olds has the lowest likelihood of being enrolled in a private school, with 276 (100.0% in the age bracket) attending a public institution.
| Age Bracket | Public School | Private School |
| 3 to 4 Year Olds | 104 (81.9%) | 23 (18.1%) |
| 5 to 9 Year Old | 402 (76.4%) | 124 (23.6%) |
| 10 to 14 Year Olds | 312 (96.3%) | 12 (3.7%) |
| 15 to 17 Year Olds | 145 (93.5%) | 10 (6.5%) |
| 18 to 19 Year Olds | 276 (100.0%) | 0 (0.0%) |
| 20 to 24 Year Olds | 16 (100.0%) | 0 (0.0%) |
| 25 to 34 Year Olds | 13 (16.9%) | 64 (83.1%) |
| 35 Years and over | 0 (0.0%) | 0 (0.0%) |
| Total | 1,268 (84.5%) | 233 (15.5%) |
Educational Attainment by Field of Study in Mount Sterling
Education (220 | 20.2%), business (180 | 16.5%), science & technology (143 | 13.1%), social sciences (114 | 10.5%), and psychology (84 | 7.7%) are the most common fields of study among 1,090 individuals in Mount Sterling who have obtained a bachelor's degree or higher.
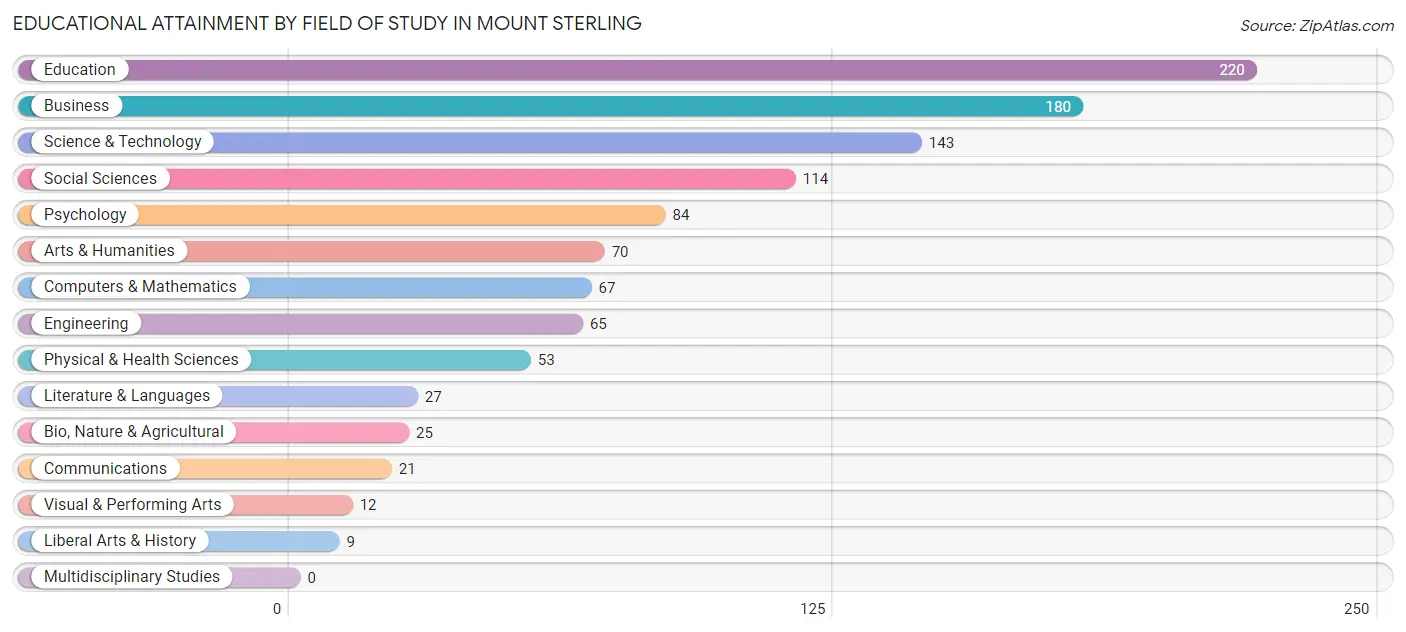
| Field of Study | # Graduates | % Graduates |
| Computers & Mathematics | 67 | 6.1% |
| Bio, Nature & Agricultural | 25 | 2.3% |
| Physical & Health Sciences | 53 | 4.9% |
| Psychology | 84 | 7.7% |
| Social Sciences | 114 | 10.5% |
| Engineering | 65 | 6.0% |
| Multidisciplinary Studies | 0 | 0.0% |
| Science & Technology | 143 | 13.1% |
| Business | 180 | 16.5% |
| Education | 220 | 20.2% |
| Literature & Languages | 27 | 2.5% |
| Liberal Arts & History | 9 | 0.8% |
| Visual & Performing Arts | 12 | 1.1% |
| Communications | 21 | 1.9% |
| Arts & Humanities | 70 | 6.4% |
| Total | 1,090 | 100.0% |
Transportation & Commute in Mount Sterling
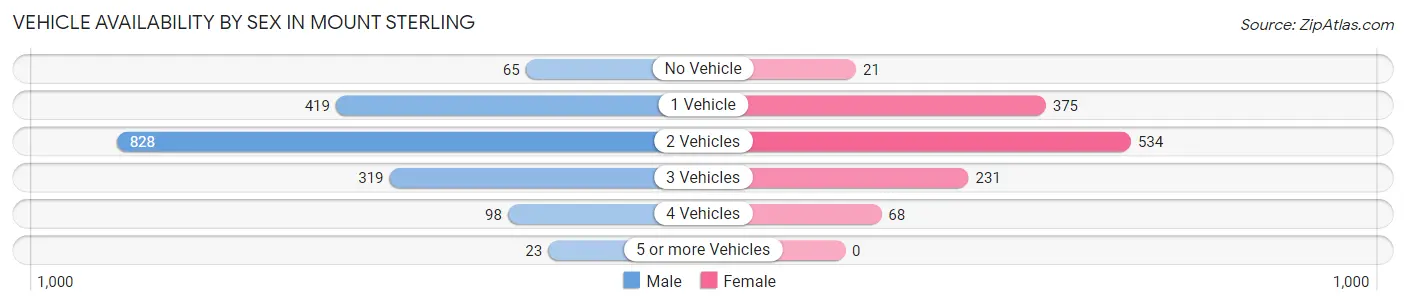
Vehicle Availability by Sex in Mount Sterling
The most prevalent vehicle ownership categories in Mount Sterling are males with 2 vehicles (828, accounting for 47.3%) and females with 2 vehicles (534, making up 67.4%).
| Vehicles Available | Male | Female |
| No Vehicle | 65 (3.7%) | 21 (1.7%) |
| 1 Vehicle | 419 (23.9%) | 375 (30.5%) |
| 2 Vehicles | 828 (47.3%) | 534 (43.4%) |
| 3 Vehicles | 319 (18.2%) | 231 (18.8%) |
| 4 Vehicles | 98 (5.6%) | 68 (5.5%) |
| 5 or more Vehicles | 23 (1.3%) | 0 (0.0%) |
| Total | 1,752 (100.0%) | 1,229 (100.0%) |
Commute Time in Mount Sterling
The most frequently occuring commute durations in Mount Sterling are 10 to 14 minutes (798 commuters, 27.9%), 5 to 9 minutes (615 commuters, 21.5%), and 45 to 59 minutes (422 commuters, 14.8%).
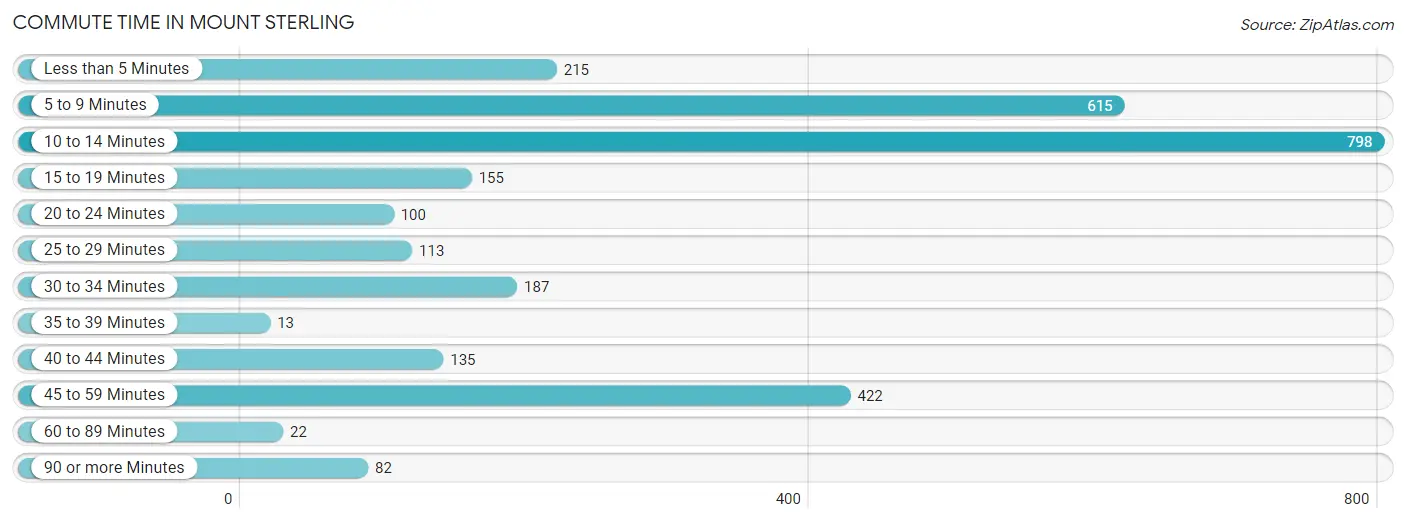
| Commute Time | # Commuters | % Commuters |
| Less than 5 Minutes | 215 | 7.5% |
| 5 to 9 Minutes | 615 | 21.5% |
| 10 to 14 Minutes | 798 | 27.9% |
| 15 to 19 Minutes | 155 | 5.4% |
| 20 to 24 Minutes | 100 | 3.5% |
| 25 to 29 Minutes | 113 | 4.0% |
| 30 to 34 Minutes | 187 | 6.6% |
| 35 to 39 Minutes | 13 | 0.5% |
| 40 to 44 Minutes | 135 | 4.7% |
| 45 to 59 Minutes | 422 | 14.8% |
| 60 to 89 Minutes | 22 | 0.8% |
| 90 or more Minutes | 82 | 2.9% |
Commute Time by Sex in Mount Sterling
The most common commute times in Mount Sterling are 10 to 14 minutes (429 commuters, 25.0%) for males and 10 to 14 minutes (369 commuters, 32.4%) for females.
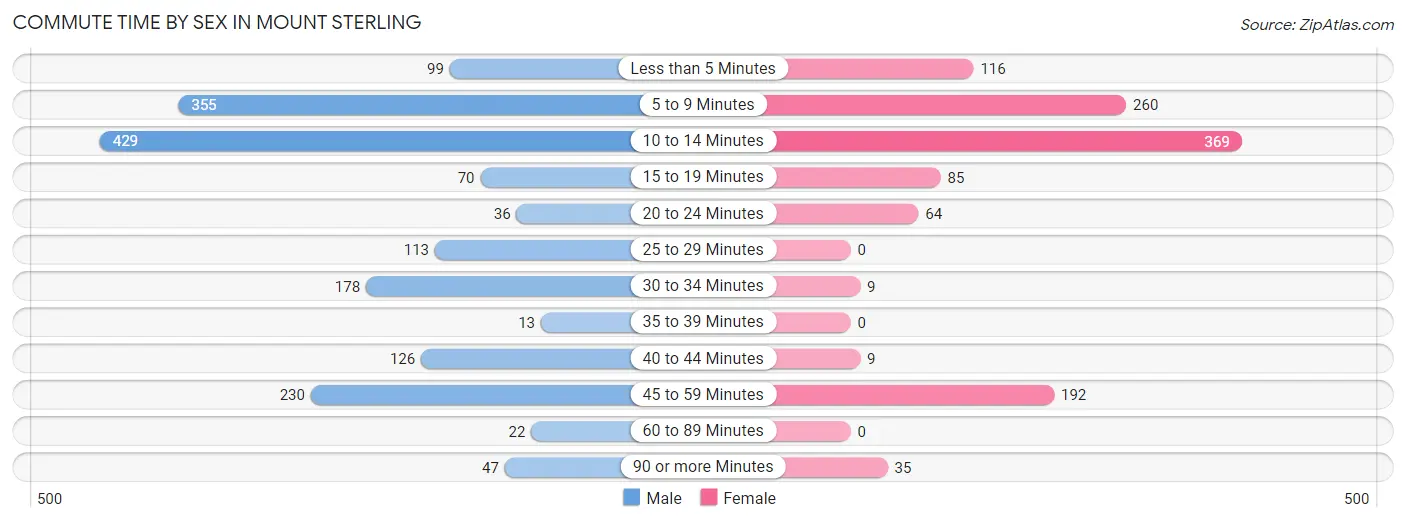
| Commute Time | Male | Female |
| Less than 5 Minutes | 99 (5.8%) | 116 (10.2%) |
| 5 to 9 Minutes | 355 (20.7%) | 260 (22.8%) |
| 10 to 14 Minutes | 429 (25.0%) | 369 (32.4%) |
| 15 to 19 Minutes | 70 (4.1%) | 85 (7.5%) |
| 20 to 24 Minutes | 36 (2.1%) | 64 (5.6%) |
| 25 to 29 Minutes | 113 (6.6%) | 0 (0.0%) |
| 30 to 34 Minutes | 178 (10.4%) | 9 (0.8%) |
| 35 to 39 Minutes | 13 (0.8%) | 0 (0.0%) |
| 40 to 44 Minutes | 126 (7.3%) | 9 (0.8%) |
| 45 to 59 Minutes | 230 (13.4%) | 192 (16.9%) |
| 60 to 89 Minutes | 22 (1.3%) | 0 (0.0%) |
| 90 or more Minutes | 47 (2.7%) | 35 (3.1%) |
Time of Departure to Work by Sex in Mount Sterling
The most frequent times of departure to work in Mount Sterling are 6:30 AM to 6:59 AM (281, 16.4%) for males and 6:30 AM to 6:59 AM (207, 18.2%) for females.
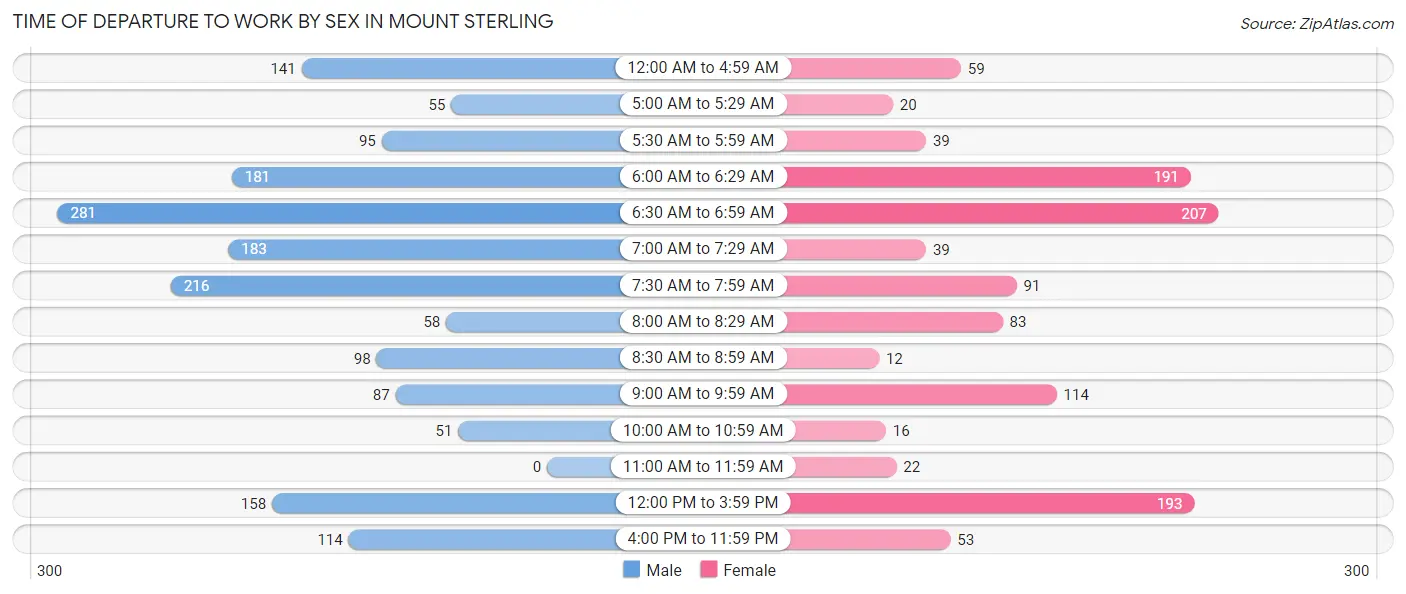
| Time of Departure | Male | Female |
| 12:00 AM to 4:59 AM | 141 (8.2%) | 59 (5.2%) |
| 5:00 AM to 5:29 AM | 55 (3.2%) | 20 (1.8%) |
| 5:30 AM to 5:59 AM | 95 (5.5%) | 39 (3.4%) |
| 6:00 AM to 6:29 AM | 181 (10.5%) | 191 (16.8%) |
| 6:30 AM to 6:59 AM | 281 (16.4%) | 207 (18.2%) |
| 7:00 AM to 7:29 AM | 183 (10.6%) | 39 (3.4%) |
| 7:30 AM to 7:59 AM | 216 (12.6%) | 91 (8.0%) |
| 8:00 AM to 8:29 AM | 58 (3.4%) | 83 (7.3%) |
| 8:30 AM to 8:59 AM | 98 (5.7%) | 12 (1.1%) |
| 9:00 AM to 9:59 AM | 87 (5.1%) | 114 (10.0%) |
| 10:00 AM to 10:59 AM | 51 (3.0%) | 16 (1.4%) |
| 11:00 AM to 11:59 AM | 0 (0.0%) | 22 (1.9%) |
| 12:00 PM to 3:59 PM | 158 (9.2%) | 193 (16.9%) |
| 4:00 PM to 11:59 PM | 114 (6.6%) | 53 (4.6%) |
| Total | 1,718 (100.0%) | 1,139 (100.0%) |
Housing Occupancy in Mount Sterling
Occupancy by Ownership in Mount Sterling
Of the total 3,194 dwellings in Mount Sterling, owner-occupied units account for 1,562 (48.9%), while renter-occupied units make up 1,632 (51.1%).
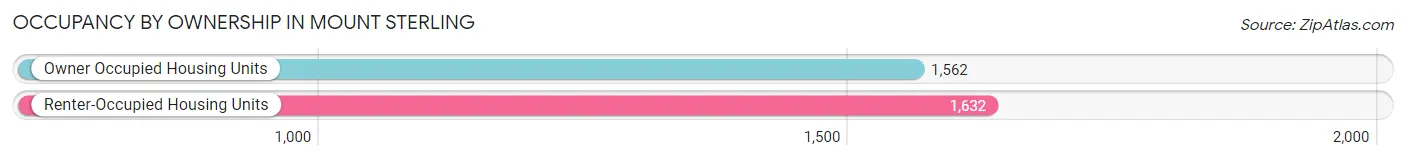
| Occupancy | # Housing Units | % Housing Units |
| Owner Occupied Housing Units | 1,562 | 48.9% |
| Renter-Occupied Housing Units | 1,632 | 51.1% |
| Total Occupied Housing Units | 3,194 | 100.0% |
Occupancy by Household Size in Mount Sterling
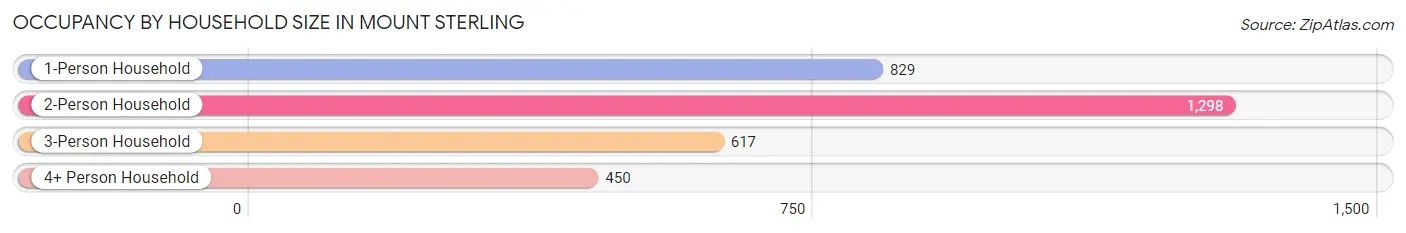
| Household Size | # Housing Units | % Housing Units |
| 1-Person Household | 829 | 26.0% |
| 2-Person Household | 1,298 | 40.6% |
| 3-Person Household | 617 | 19.3% |
| 4+ Person Household | 450 | 14.1% |
| Total Housing Units | 3,194 | 100.0% |
Occupancy by Ownership by Household Size in Mount Sterling
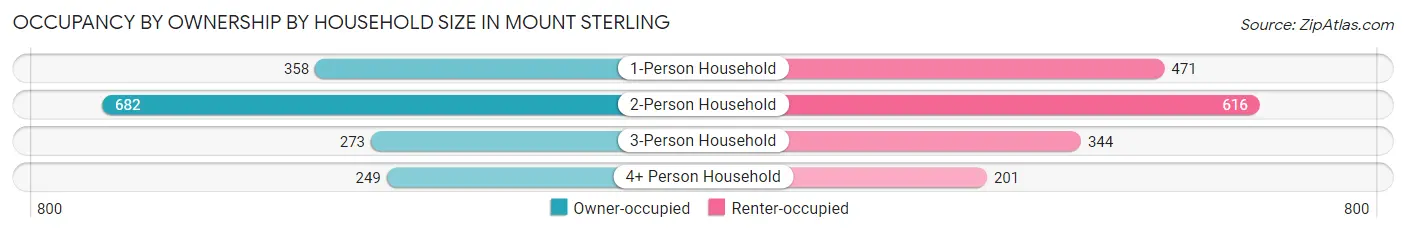
| Household Size | Owner-occupied | Renter-occupied |
| 1-Person Household | 358 (43.2%) | 471 (56.8%) |
| 2-Person Household | 682 (52.5%) | 616 (47.5%) |
| 3-Person Household | 273 (44.3%) | 344 (55.7%) |
| 4+ Person Household | 249 (55.3%) | 201 (44.7%) |
| Total Housing Units | 1,562 (48.9%) | 1,632 (51.1%) |
Occupancy by Educational Attainment in Mount Sterling
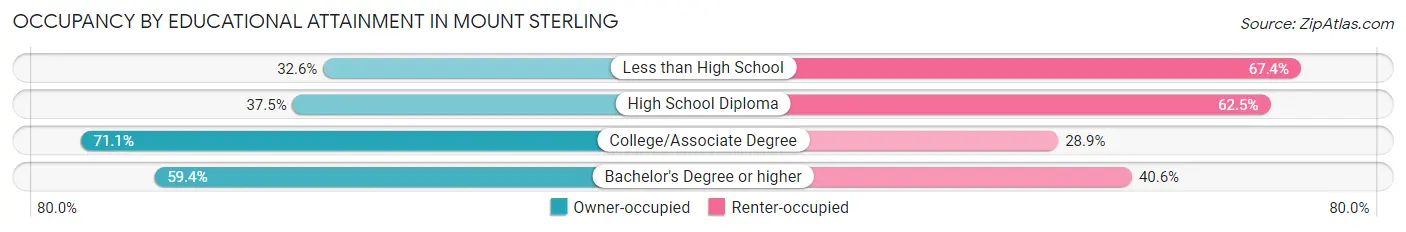
| Household Size | Owner-occupied | Renter-occupied |
| Less than High School | 110 (32.6%) | 227 (67.4%) |
| High School Diploma | 569 (37.5%) | 948 (62.5%) |
| College/Associate Degree | 527 (71.1%) | 214 (28.9%) |
| Bachelor's Degree or higher | 356 (59.4%) | 243 (40.6%) |
Occupancy by Age of Householder in Mount Sterling
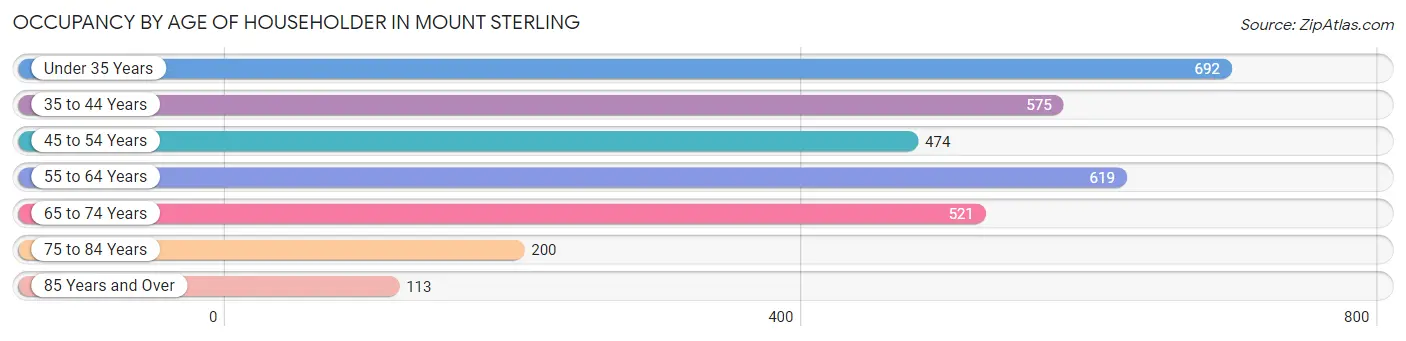
| Age Bracket | # Households | % Households |
| Under 35 Years | 692 | 21.7% |
| 35 to 44 Years | 575 | 18.0% |
| 45 to 54 Years | 474 | 14.8% |
| 55 to 64 Years | 619 | 19.4% |
| 65 to 74 Years | 521 | 16.3% |
| 75 to 84 Years | 200 | 6.3% |
| 85 Years and Over | 113 | 3.5% |
| Total | 3,194 | 100.0% |
Housing Finances in Mount Sterling
Median Income by Occupancy in Mount Sterling
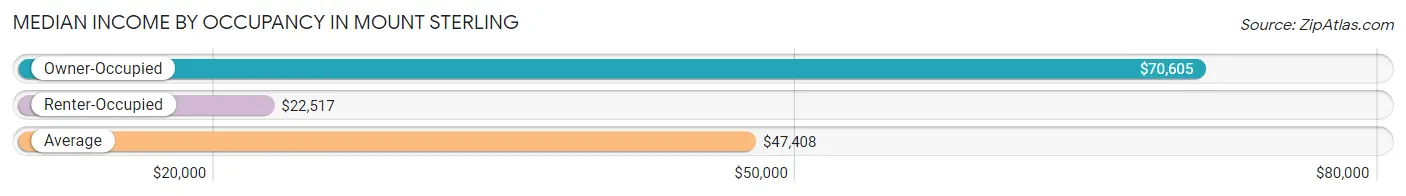
| Occupancy Type | # Households | Median Income |
| Owner-Occupied | 1,562 (48.9%) | $70,605 |
| Renter-Occupied | 1,632 (51.1%) | $22,517 |
| Average | 3,194 (100.0%) | $47,408 |
Occupancy by Householder Income Bracket in Mount Sterling
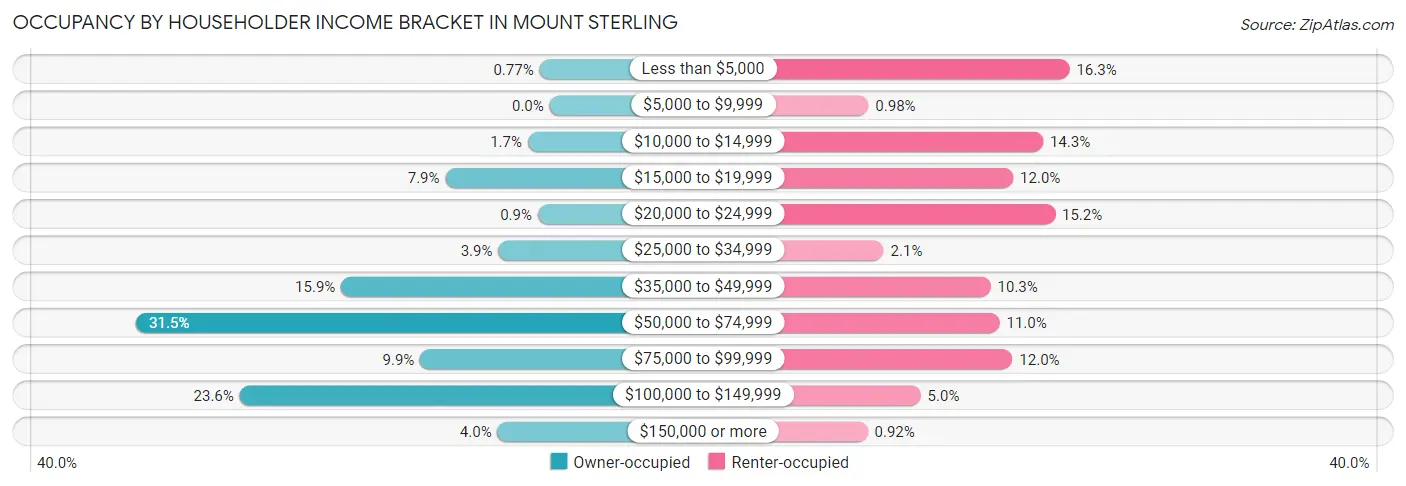
| Income Bracket | Owner-occupied | Renter-occupied |
| Less than $5,000 | 12 (0.8%) | 266 (16.3%) |
| $5,000 to $9,999 | 0 (0.0%) | 16 (1.0%) |
| $10,000 to $14,999 | 26 (1.7%) | 233 (14.3%) |
| $15,000 to $19,999 | 124 (7.9%) | 196 (12.0%) |
| $20,000 to $24,999 | 14 (0.9%) | 248 (15.2%) |
| $25,000 to $34,999 | 61 (3.9%) | 35 (2.1%) |
| $35,000 to $49,999 | 248 (15.9%) | 168 (10.3%) |
| $50,000 to $74,999 | 492 (31.5%) | 179 (11.0%) |
| $75,000 to $99,999 | 154 (9.9%) | 195 (11.9%) |
| $100,000 to $149,999 | 369 (23.6%) | 81 (5.0%) |
| $150,000 or more | 62 (4.0%) | 15 (0.9%) |
| Total | 1,562 (100.0%) | 1,632 (100.0%) |
Monthly Housing Cost Tiers in Mount Sterling
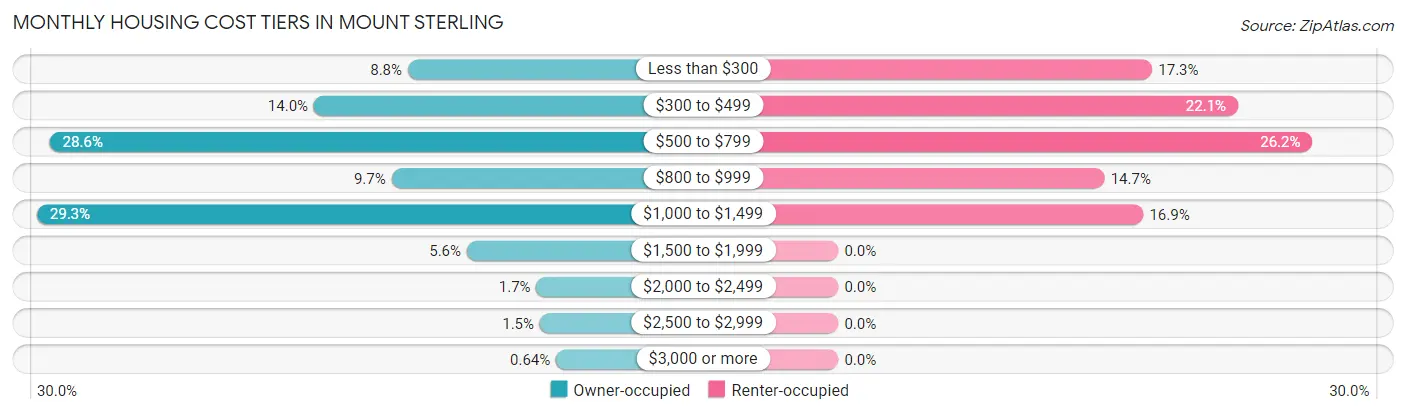
| Monthly Cost | Owner-occupied | Renter-occupied |
| Less than $300 | 138 (8.8%) | 283 (17.3%) |
| $300 to $499 | 219 (14.0%) | 361 (22.1%) |
| $500 to $799 | 447 (28.6%) | 428 (26.2%) |
| $800 to $999 | 152 (9.7%) | 240 (14.7%) |
| $1,000 to $1,499 | 458 (29.3%) | 275 (16.9%) |
| $1,500 to $1,999 | 87 (5.6%) | 0 (0.0%) |
| $2,000 to $2,499 | 27 (1.7%) | 0 (0.0%) |
| $2,500 to $2,999 | 24 (1.5%) | 0 (0.0%) |
| $3,000 or more | 10 (0.6%) | 0 (0.0%) |
| Total | 1,562 (100.0%) | 1,632 (100.0%) |
Physical Housing Characteristics in Mount Sterling
Housing Structures in Mount Sterling
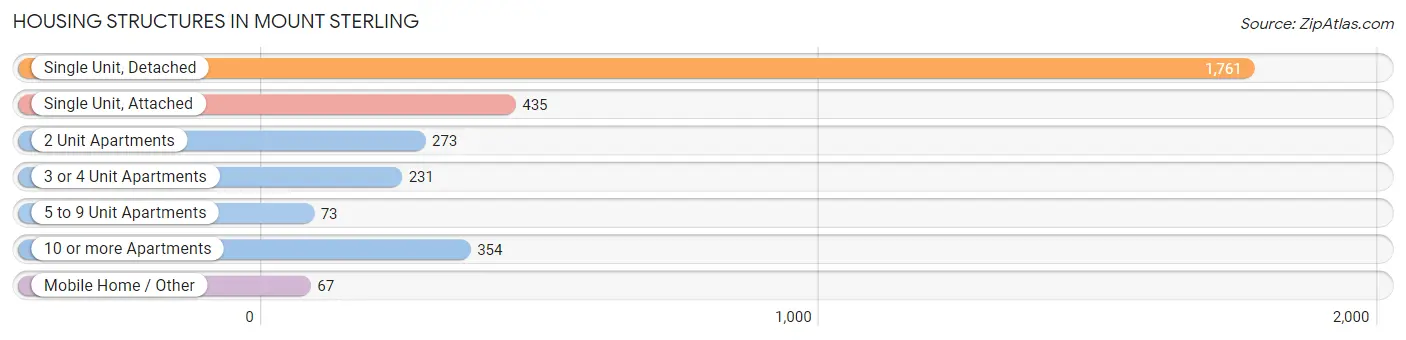
| Structure Type | # Housing Units | % Housing Units |
| Single Unit, Detached | 1,761 | 55.1% |
| Single Unit, Attached | 435 | 13.6% |
| 2 Unit Apartments | 273 | 8.6% |
| 3 or 4 Unit Apartments | 231 | 7.2% |
| 5 to 9 Unit Apartments | 73 | 2.3% |
| 10 or more Apartments | 354 | 11.1% |
| Mobile Home / Other | 67 | 2.1% |
| Total | 3,194 | 100.0% |
Housing Structures by Occupancy in Mount Sterling
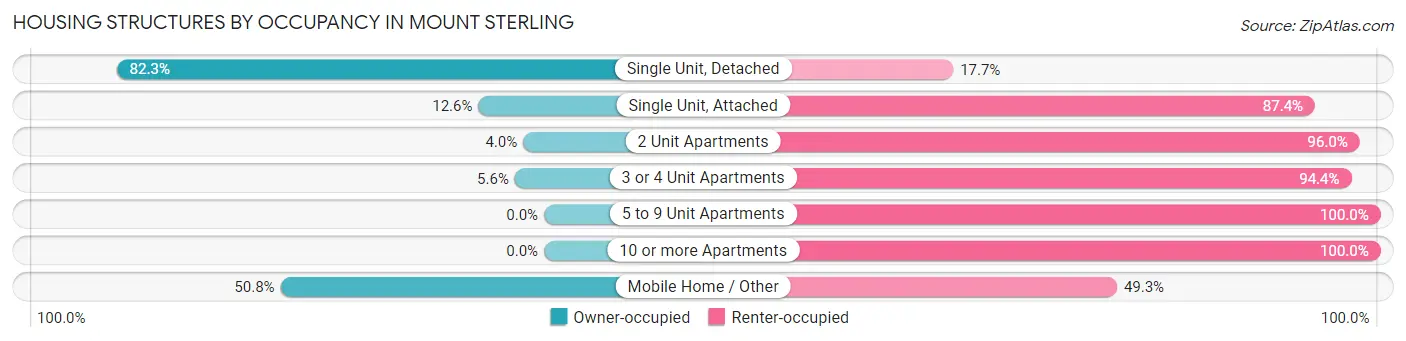
| Structure Type | Owner-occupied | Renter-occupied |
| Single Unit, Detached | 1,449 (82.3%) | 312 (17.7%) |
| Single Unit, Attached | 55 (12.6%) | 380 (87.4%) |
| 2 Unit Apartments | 11 (4.0%) | 262 (96.0%) |
| 3 or 4 Unit Apartments | 13 (5.6%) | 218 (94.4%) |
| 5 to 9 Unit Apartments | 0 (0.0%) | 73 (100.0%) |
| 10 or more Apartments | 0 (0.0%) | 354 (100.0%) |
| Mobile Home / Other | 34 (50.7%) | 33 (49.2%) |
| Total | 1,562 (48.9%) | 1,632 (51.1%) |
Housing Structures by Number of Rooms in Mount Sterling
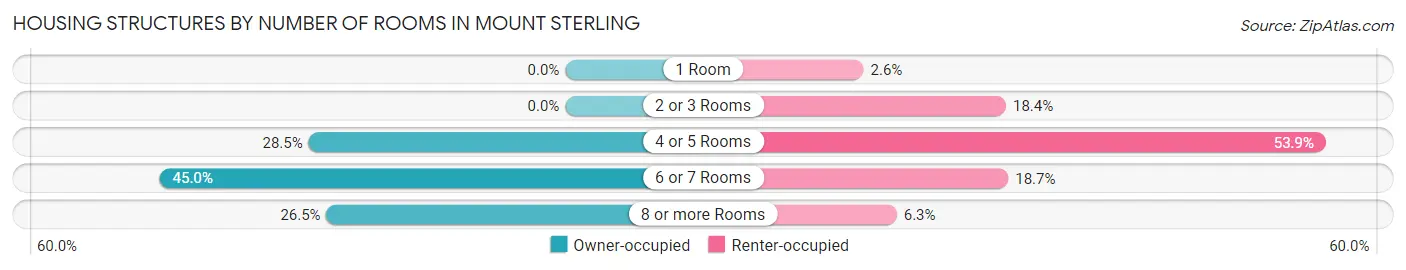
| Number of Rooms | Owner-occupied | Renter-occupied |
| 1 Room | 0 (0.0%) | 43 (2.6%) |
| 2 or 3 Rooms | 0 (0.0%) | 301 (18.4%) |
| 4 or 5 Rooms | 445 (28.5%) | 880 (53.9%) |
| 6 or 7 Rooms | 703 (45.0%) | 305 (18.7%) |
| 8 or more Rooms | 414 (26.5%) | 103 (6.3%) |
| Total | 1,562 (100.0%) | 1,632 (100.0%) |
Housing Structure by Heating Type in Mount Sterling
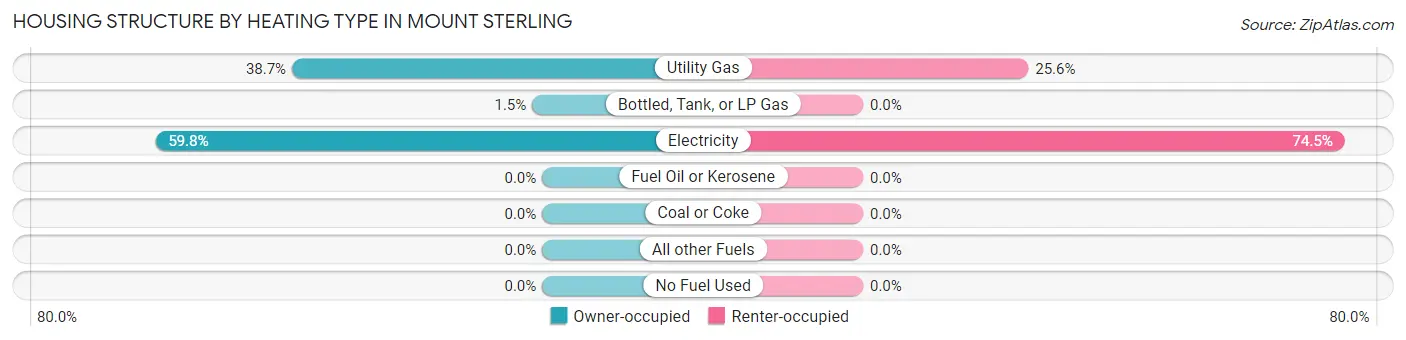
| Heating Type | Owner-occupied | Renter-occupied |
| Utility Gas | 604 (38.7%) | 417 (25.6%) |
| Bottled, Tank, or LP Gas | 24 (1.5%) | 0 (0.0%) |
| Electricity | 934 (59.8%) | 1,215 (74.5%) |
| Fuel Oil or Kerosene | 0 (0.0%) | 0 (0.0%) |
| Coal or Coke | 0 (0.0%) | 0 (0.0%) |
| All other Fuels | 0 (0.0%) | 0 (0.0%) |
| No Fuel Used | 0 (0.0%) | 0 (0.0%) |
| Total | 1,562 (100.0%) | 1,632 (100.0%) |
Household Vehicle Usage in Mount Sterling
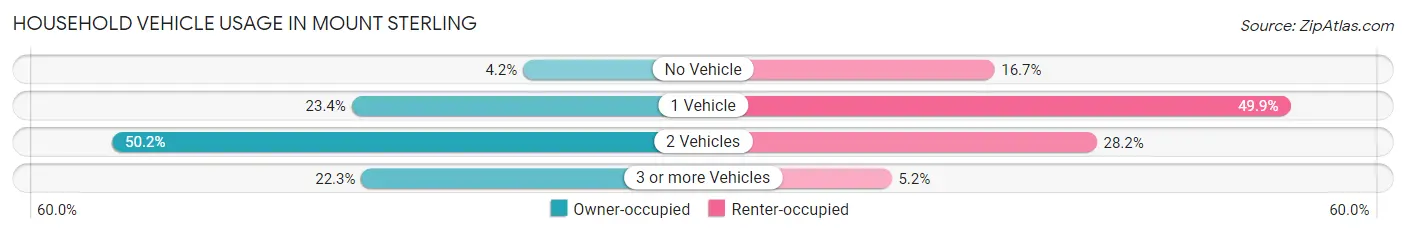
| Vehicles per Household | Owner-occupied | Renter-occupied |
| No Vehicle | 65 (4.2%) | 273 (16.7%) |
| 1 Vehicle | 365 (23.4%) | 814 (49.9%) |
| 2 Vehicles | 784 (50.2%) | 460 (28.2%) |
| 3 or more Vehicles | 348 (22.3%) | 85 (5.2%) |
| Total | 1,562 (100.0%) | 1,632 (100.0%) |
Real Estate & Mortgages in Mount Sterling
Real Estate and Mortgage Overview in Mount Sterling
| Characteristic | Without Mortgage | With Mortgage |
| Housing Units | 540 | 1,022 |
| Median Property Value | $157,400 | $178,800 |
| Median Household Income | $49,130 | $31 |
| Monthly Housing Costs | $449 | $10 |
| Real Estate Taxes | $1,043 | $44 |
Property Value by Mortgage Status in Mount Sterling
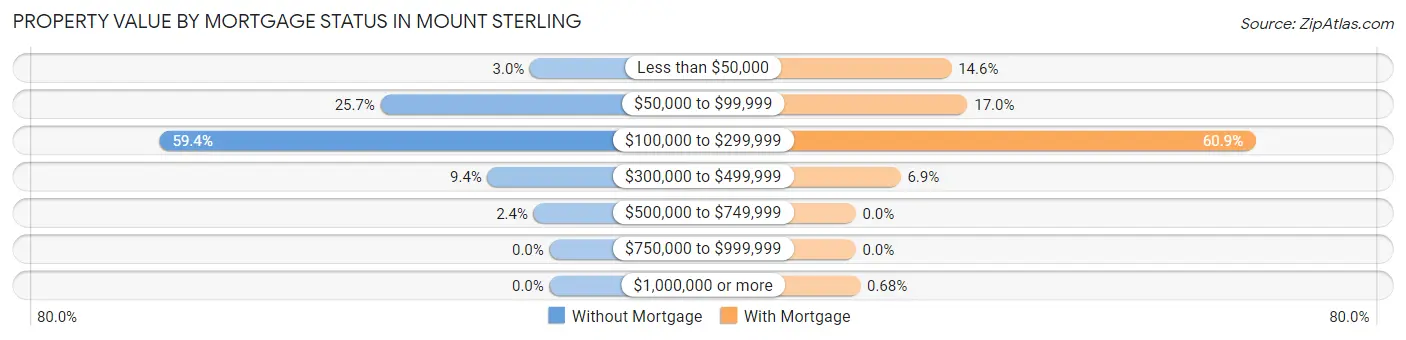
| Property Value | Without Mortgage | With Mortgage |
| Less than $50,000 | 16 (3.0%) | 149 (14.6%) |
| $50,000 to $99,999 | 139 (25.7%) | 174 (17.0%) |
| $100,000 to $299,999 | 321 (59.4%) | 622 (60.9%) |
| $300,000 to $499,999 | 51 (9.4%) | 70 (6.9%) |
| $500,000 to $749,999 | 13 (2.4%) | 0 (0.0%) |
| $750,000 to $999,999 | 0 (0.0%) | 0 (0.0%) |
| $1,000,000 or more | 0 (0.0%) | 7 (0.7%) |
| Total | 540 (100.0%) | 1,022 (100.0%) |
Household Income by Mortgage Status in Mount Sterling
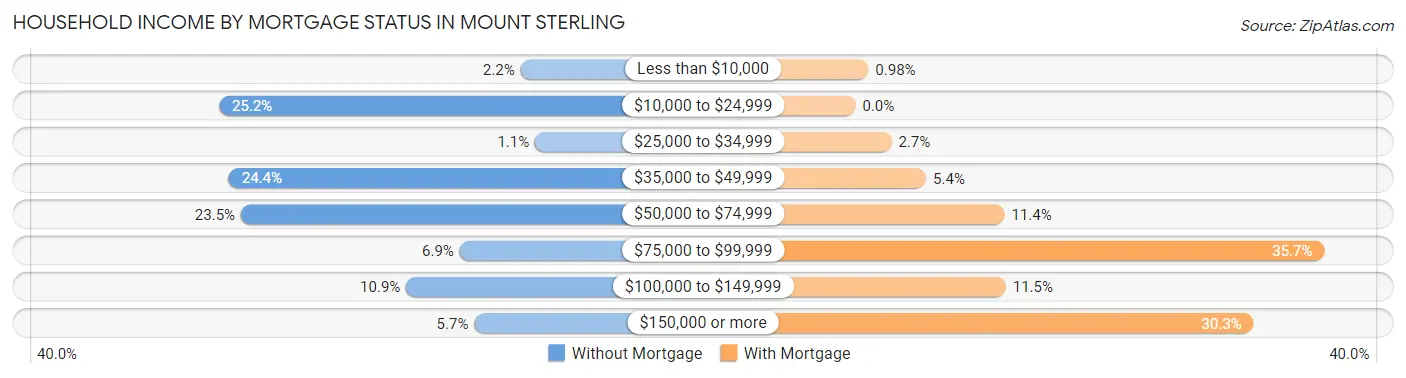
| Household Income | Without Mortgage | With Mortgage |
| Less than $10,000 | 12 (2.2%) | 10 (1.0%) |
| $10,000 to $24,999 | 136 (25.2%) | 0 (0.0%) |
| $25,000 to $34,999 | 6 (1.1%) | 28 (2.7%) |
| $35,000 to $49,999 | 132 (24.4%) | 55 (5.4%) |
| $50,000 to $74,999 | 127 (23.5%) | 116 (11.4%) |
| $75,000 to $99,999 | 37 (6.9%) | 365 (35.7%) |
| $100,000 to $149,999 | 59 (10.9%) | 117 (11.5%) |
| $150,000 or more | 31 (5.7%) | 310 (30.3%) |
| Total | 540 (100.0%) | 1,022 (100.0%) |
Property Value to Household Income Ratio in Mount Sterling
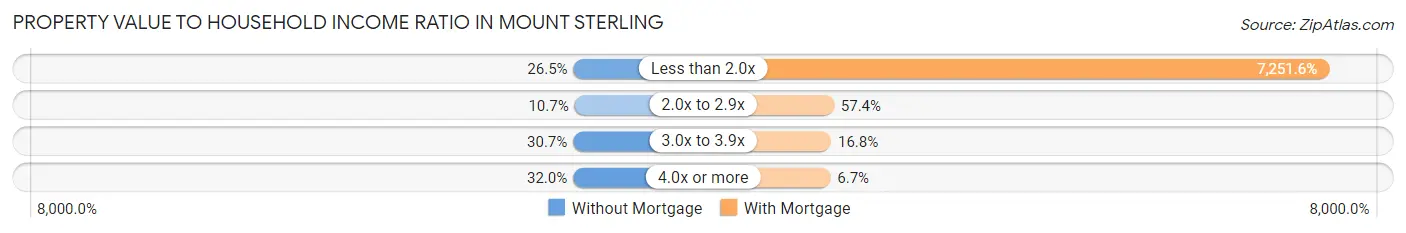
| Value-to-Income Ratio | Without Mortgage | With Mortgage |
| Less than 2.0x | 143 (26.5%) | 74,111 (7,251.6%) |
| 2.0x to 2.9x | 58 (10.7%) | 587 (57.4%) |
| 3.0x to 3.9x | 166 (30.7%) | 172 (16.8%) |
| 4.0x or more | 173 (32.0%) | 68 (6.7%) |
| Total | 540 (100.0%) | 1,022 (100.0%) |
Real Estate Taxes by Mortgage Status in Mount Sterling
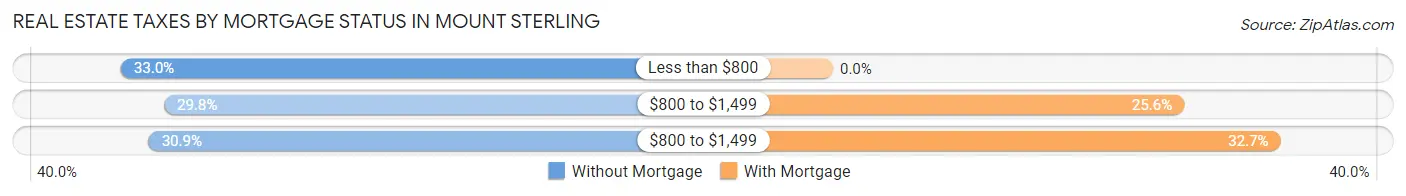
| Property Taxes | Without Mortgage | With Mortgage |
| Less than $800 | 178 (33.0%) | 0 (0.0%) |
| $800 to $1,499 | 161 (29.8%) | 262 (25.6%) |
| $800 to $1,499 | 167 (30.9%) | 334 (32.7%) |
| Total | 540 (100.0%) | 1,022 (100.0%) |
Health & Disability in Mount Sterling
Health Insurance Coverage by Age in Mount Sterling
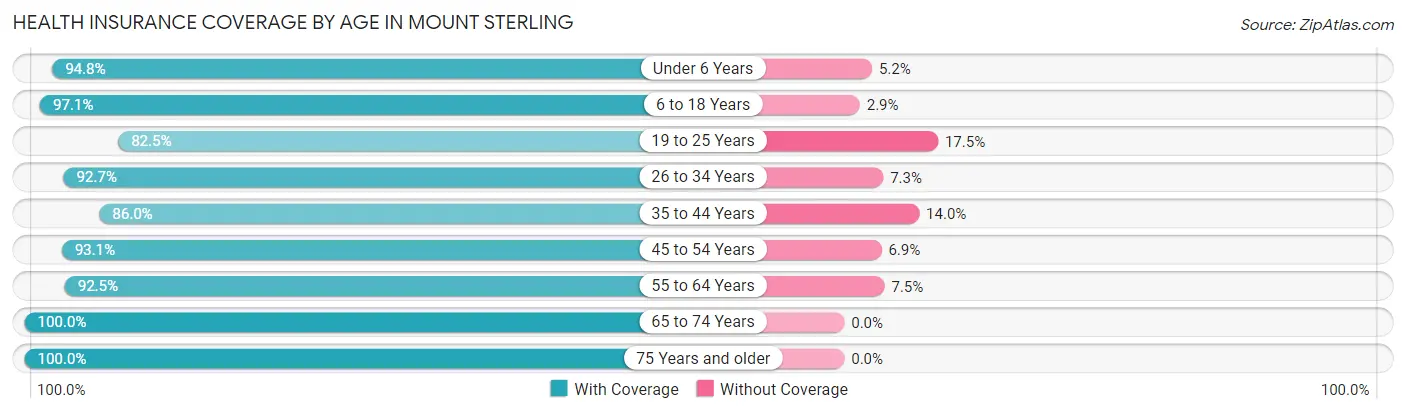
| Age Bracket | With Coverage | Without Coverage |
| Under 6 Years | 551 (94.8%) | 30 (5.2%) |
| 6 to 18 Years | 1,175 (97.1%) | 35 (2.9%) |
| 19 to 25 Years | 548 (82.5%) | 116 (17.5%) |
| 26 to 34 Years | 677 (92.7%) | 53 (7.3%) |
| 35 to 44 Years | 912 (86.0%) | 148 (14.0%) |
| 45 to 54 Years | 833 (93.1%) | 62 (6.9%) |
| 55 to 64 Years | 1,024 (92.5%) | 83 (7.5%) |
| 65 to 74 Years | 620 (100.0%) | 0 (0.0%) |
| 75 Years and older | 480 (100.0%) | 0 (0.0%) |
| Total | 6,820 (92.8%) | 527 (7.2%) |
Health Insurance Coverage by Citizenship Status in Mount Sterling
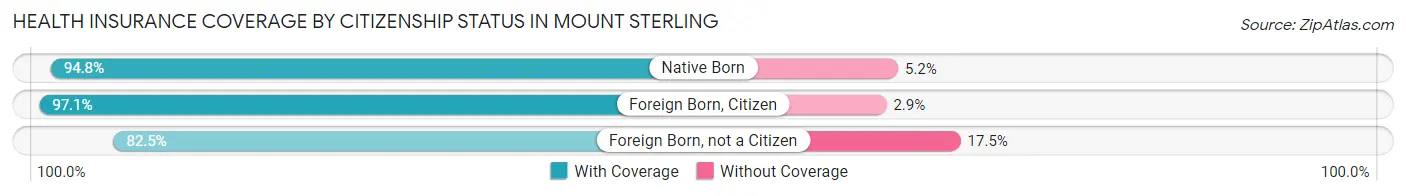
| Citizenship Status | With Coverage | Without Coverage |
| Native Born | 551 (94.8%) | 30 (5.2%) |
| Foreign Born, Citizen | 1,175 (97.1%) | 35 (2.9%) |
| Foreign Born, not a Citizen | 548 (82.5%) | 116 (17.5%) |
Health Insurance Coverage by Household Income in Mount Sterling
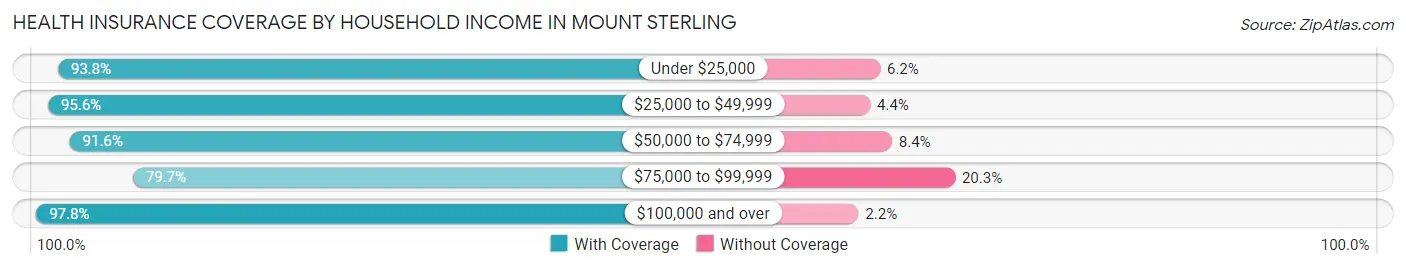
| Household Income | With Coverage | Without Coverage |
| Under $25,000 | 1,820 (93.8%) | 121 (6.2%) |
| $25,000 to $49,999 | 1,028 (95.6%) | 47 (4.4%) |
| $50,000 to $74,999 | 1,540 (91.6%) | 142 (8.4%) |
| $75,000 to $99,999 | 700 (79.7%) | 178 (20.3%) |
| $100,000 and over | 1,703 (97.8%) | 38 (2.2%) |
Public vs Private Health Insurance Coverage by Age in Mount Sterling
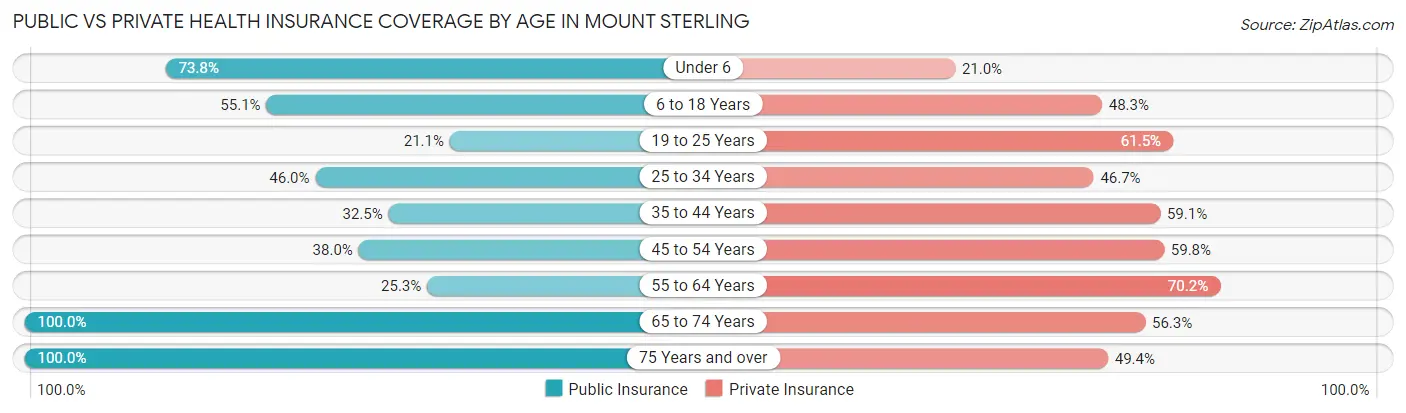
| Age Bracket | Public Insurance | Private Insurance |
| Under 6 | 429 (73.8%) | 122 (21.0%) |
| 6 to 18 Years | 667 (55.1%) | 584 (48.3%) |
| 19 to 25 Years | 140 (21.1%) | 408 (61.5%) |
| 25 to 34 Years | 336 (46.0%) | 341 (46.7%) |
| 35 to 44 Years | 344 (32.5%) | 626 (59.1%) |
| 45 to 54 Years | 340 (38.0%) | 535 (59.8%) |
| 55 to 64 Years | 280 (25.3%) | 777 (70.2%) |
| 65 to 74 Years | 620 (100.0%) | 349 (56.3%) |
| 75 Years and over | 480 (100.0%) | 237 (49.4%) |
| Total | 3,636 (49.5%) | 3,979 (54.2%) |
Disability Status by Sex by Age in Mount Sterling
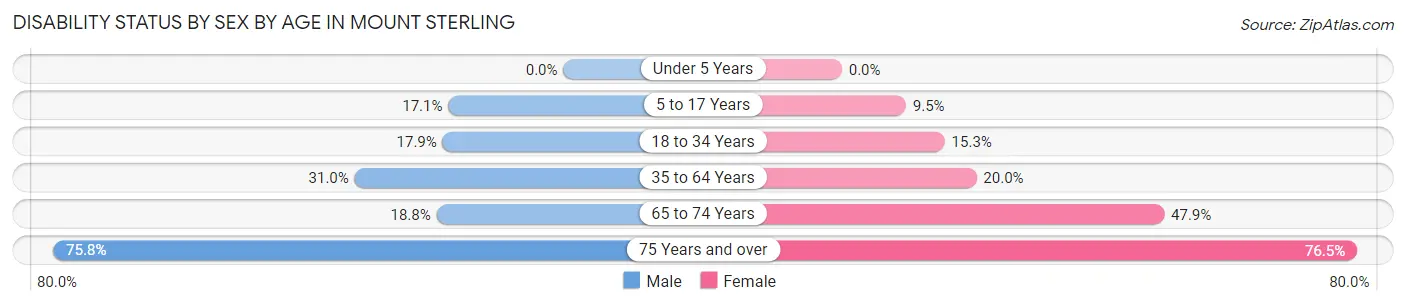
| Age Bracket | Male | Female |
| Under 5 Years | 0 (0.0%) | 0 (0.0%) |
| 5 to 17 Years | 96 (17.1%) | 47 (9.5%) |
| 18 to 34 Years | 151 (17.9%) | 129 (15.3%) |
| 35 to 64 Years | 473 (31.0%) | 307 (20.0%) |
| 65 to 74 Years | 42 (18.8%) | 190 (47.9%) |
| 75 Years and over | 125 (75.8%) | 241 (76.5%) |
Disability Class by Sex by Age in Mount Sterling
Disability Class: Hearing Difficulty
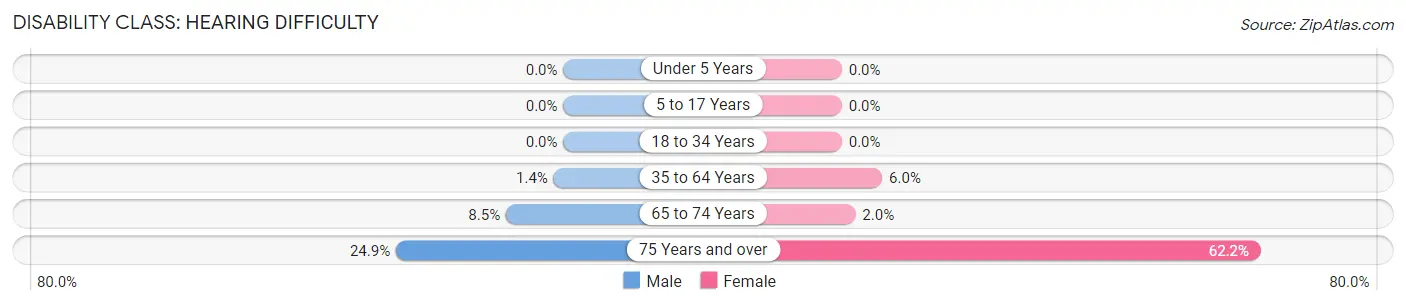
| Age Bracket | Male | Female |
| Under 5 Years | 0 (0.0%) | 0 (0.0%) |
| 5 to 17 Years | 0 (0.0%) | 0 (0.0%) |
| 18 to 34 Years | 0 (0.0%) | 0 (0.0%) |
| 35 to 64 Years | 22 (1.4%) | 92 (6.0%) |
| 65 to 74 Years | 19 (8.5%) | 8 (2.0%) |
| 75 Years and over | 41 (24.8%) | 196 (62.2%) |
Disability Class: Vision Difficulty
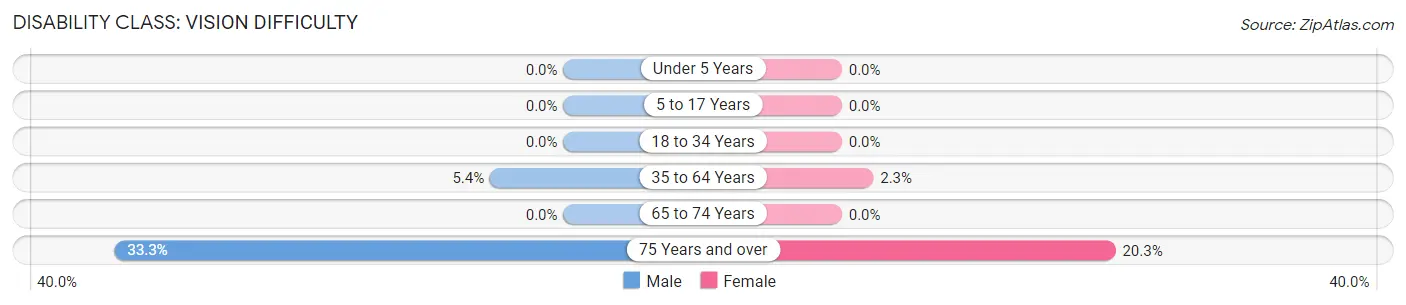
| Age Bracket | Male | Female |
| Under 5 Years | 0 (0.0%) | 0 (0.0%) |
| 5 to 17 Years | 0 (0.0%) | 0 (0.0%) |
| 18 to 34 Years | 0 (0.0%) | 0 (0.0%) |
| 35 to 64 Years | 83 (5.4%) | 36 (2.3%) |
| 65 to 74 Years | 0 (0.0%) | 0 (0.0%) |
| 75 Years and over | 55 (33.3%) | 64 (20.3%) |
Disability Class: Cognitive Difficulty
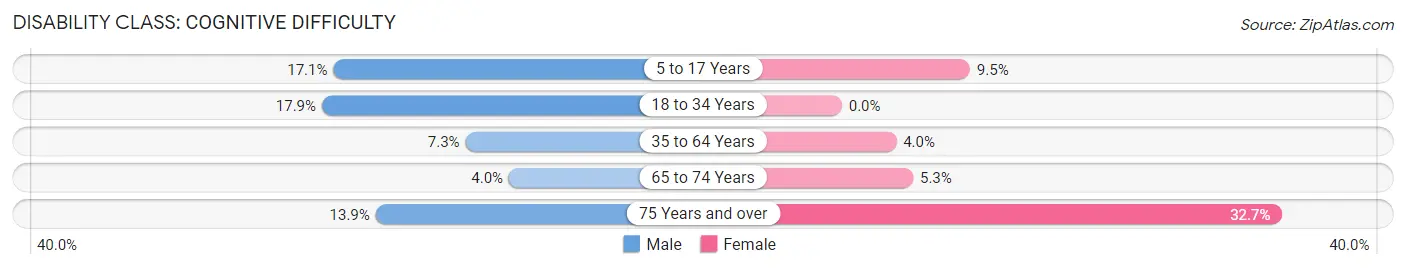
| Age Bracket | Male | Female |
| 5 to 17 Years | 96 (17.1%) | 47 (9.5%) |
| 18 to 34 Years | 151 (17.9%) | 0 (0.0%) |
| 35 to 64 Years | 111 (7.3%) | 62 (4.0%) |
| 65 to 74 Years | 9 (4.0%) | 21 (5.3%) |
| 75 Years and over | 23 (13.9%) | 103 (32.7%) |
Disability Class: Ambulatory Difficulty
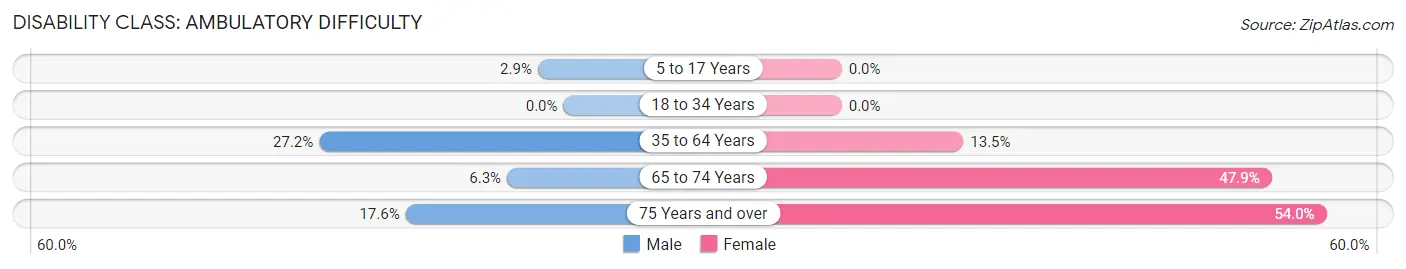
| Age Bracket | Male | Female |
| 5 to 17 Years | 16 (2.9%) | 0 (0.0%) |
| 18 to 34 Years | 0 (0.0%) | 0 (0.0%) |
| 35 to 64 Years | 415 (27.2%) | 208 (13.5%) |
| 65 to 74 Years | 14 (6.3%) | 190 (47.9%) |
| 75 Years and over | 29 (17.6%) | 170 (54.0%) |
Disability Class: Self-Care Difficulty
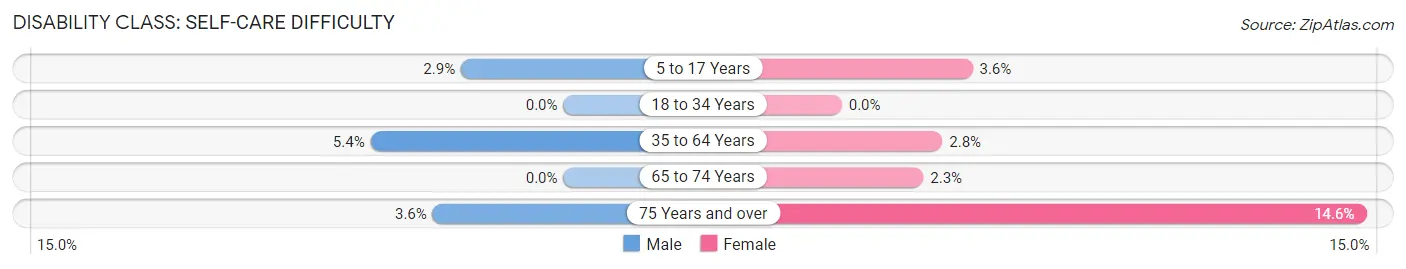
| Age Bracket | Male | Female |
| 5 to 17 Years | 16 (2.9%) | 18 (3.6%) |
| 18 to 34 Years | 0 (0.0%) | 0 (0.0%) |
| 35 to 64 Years | 82 (5.4%) | 43 (2.8%) |
| 65 to 74 Years | 0 (0.0%) | 9 (2.3%) |
| 75 Years and over | 6 (3.6%) | 46 (14.6%) |
Technology Access in Mount Sterling
Computing Device Access in Mount Sterling
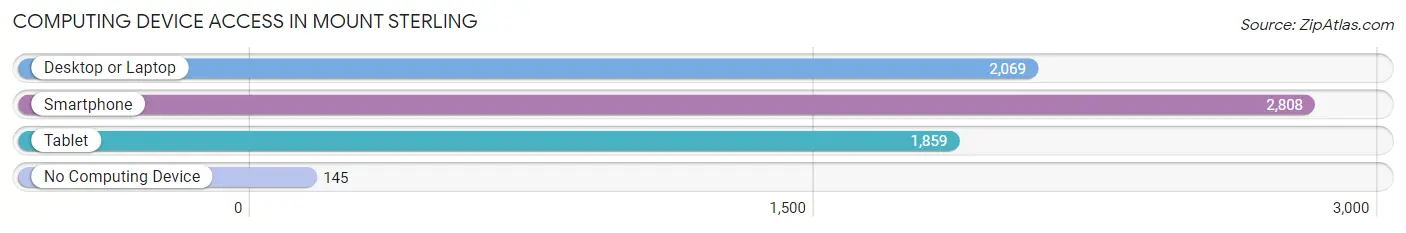
| Device Type | # Households | % Households |
| Desktop or Laptop | 2,069 | 64.8% |
| Smartphone | 2,808 | 87.9% |
| Tablet | 1,859 | 58.2% |
| No Computing Device | 145 | 4.5% |
| Total | 3,194 | 100.0% |
Internet Access in Mount Sterling
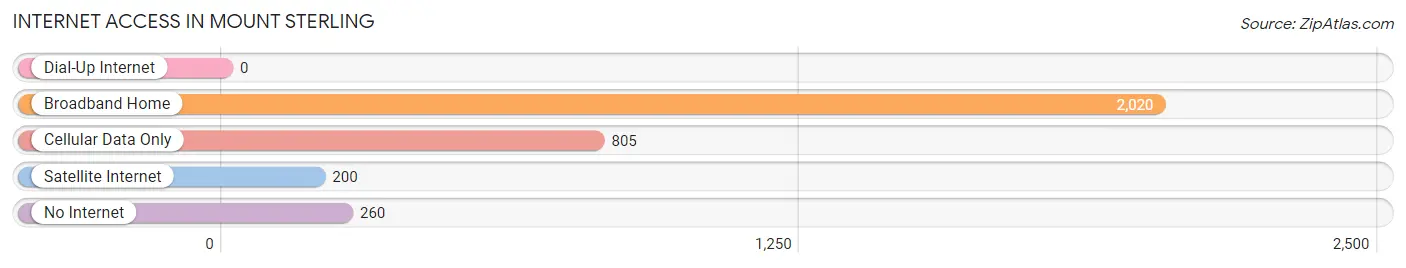
| Internet Type | # Households | % Households |
| Dial-Up Internet | 0 | 0.0% |
| Broadband Home | 2,020 | 63.2% |
| Cellular Data Only | 805 | 25.2% |
| Satellite Internet | 200 | 6.3% |
| No Internet | 260 | 8.1% |
| Total | 3,194 | 100.0% |
Mount Sterling Summary
History
Mount Sterling, Kentucky is a small city located in Montgomery County, Kentucky. It is the county seat of Montgomery County and is located in the heart of the Bluegrass Region. The city was founded in 1792 and was named after the nearby Mount Sterling, which was a prominent landmark in the area. The city was originally known as Little Mountain, but was later changed to Mount Sterling.
The city was an important trading center in the early 19th century and was the site of several battles during the Civil War. The city was also the site of the first railroad in the state of Kentucky, which was built in 1832.
Mount Sterling has a rich history and has been home to many notable people, including former Kentucky Governor and U.S. Senator John Y. Brown, Jr., and former U.S. Senator Wendell Ford.
Geography
Mount Sterling is located in the heart of the Bluegrass Region of Kentucky. The city is situated in the foothills of the Appalachian Mountains and is surrounded by rolling hills and farmland. The city is located approximately 25 miles east of Lexington and is approximately 60 miles south of Cincinnati, Ohio.
The city has a total area of 4.2 square miles, all of which is land. The city is located at an elevation of 845 feet above sea level.
Economy
Mount Sterling has a diverse economy that is largely based on agriculture and manufacturing. The city is home to several large employers, including the Montgomery County Public Schools, the Montgomery County Hospital, and the Mount Sterling-Montgomery County Industrial Park.
The city is also home to several small businesses, including restaurants, retail stores, and professional services. The city is also home to several tourist attractions, including the Montgomery County Historical Society Museum and the Mount Sterling-Montgomery County Public Library.
Demographics
As of the 2010 census, the population of Mount Sterling was 6,839. The racial makeup of the city was 92.3% White, 4.3% African American, 0.3% Native American, 0.7% Asian, 0.1% Pacific Islander, 0.7% from other races, and 1.6% from two or more races. Hispanic or Latino of any race were 1.9% of the population.
The median household income in Mount Sterling was $37,917, and the median family income was $45,917. The per capita income for the city was $20,845. About 16.2% of families and 19.2% of the population were below the poverty line, including 28.2% of those under age 18 and 11.2% of those age 65 or over.
Common Questions
What is Per Capita Income in Mount Sterling?
Per Capita income in Mount Sterling is $25,914.
What is the Median Family Income in Mount Sterling?
Median Family Income in Mount Sterling is $59,589.
What is the Median Household income in Mount Sterling?
Median Household Income in Mount Sterling is $47,408.
What is Income or Wage Gap in Mount Sterling?
Income or Wage Gap in Mount Sterling is 50.7%.
Women in Mount Sterling earn 49.3 cents for every dollar earned by a man.
What is Family Income Deficit in Mount Sterling?
Family Income Deficit in Mount Sterling is $10,773.
Families that are below poverty line in Mount Sterling earn $10,773 less on average than the poverty threshold level.
What is Inequality or Gini Index in Mount Sterling?
Inequality or Gini Index in Mount Sterling is 0.44.
What is the Total Population of Mount Sterling?
Total Population of Mount Sterling is 7,532.
What is the Total Male Population of Mount Sterling?
Total Male Population of Mount Sterling is 3,692.
What is the Total Female Population of Mount Sterling?
Total Female Population of Mount Sterling is 3,840.
What is the Ratio of Males per 100 Females in Mount Sterling?
There are 96.15 Males per 100 Females in Mount Sterling.
What is the Ratio of Females per 100 Males in Mount Sterling?
There are 104.01 Females per 100 Males in Mount Sterling.
What is the Median Population Age in Mount Sterling?
Median Population Age in Mount Sterling is 40.8 Years.
What is the Average Family Size in Mount Sterling
Average Family Size in Mount Sterling is 2.7 People.
What is the Average Household Size in Mount Sterling
Average Household Size in Mount Sterling is 2.3 People.
How Large is the Labor Force in Mount Sterling?
There are 3,223 People in the Labor Forcein in Mount Sterling.
What is the Percentage of People in the Labor Force in Mount Sterling?
52.6% of People are in the Labor Force in Mount Sterling.
What is the Unemployment Rate in Mount Sterling?
Unemployment Rate in Mount Sterling is 5.7%.