Park Hills, KY Map & Demographics
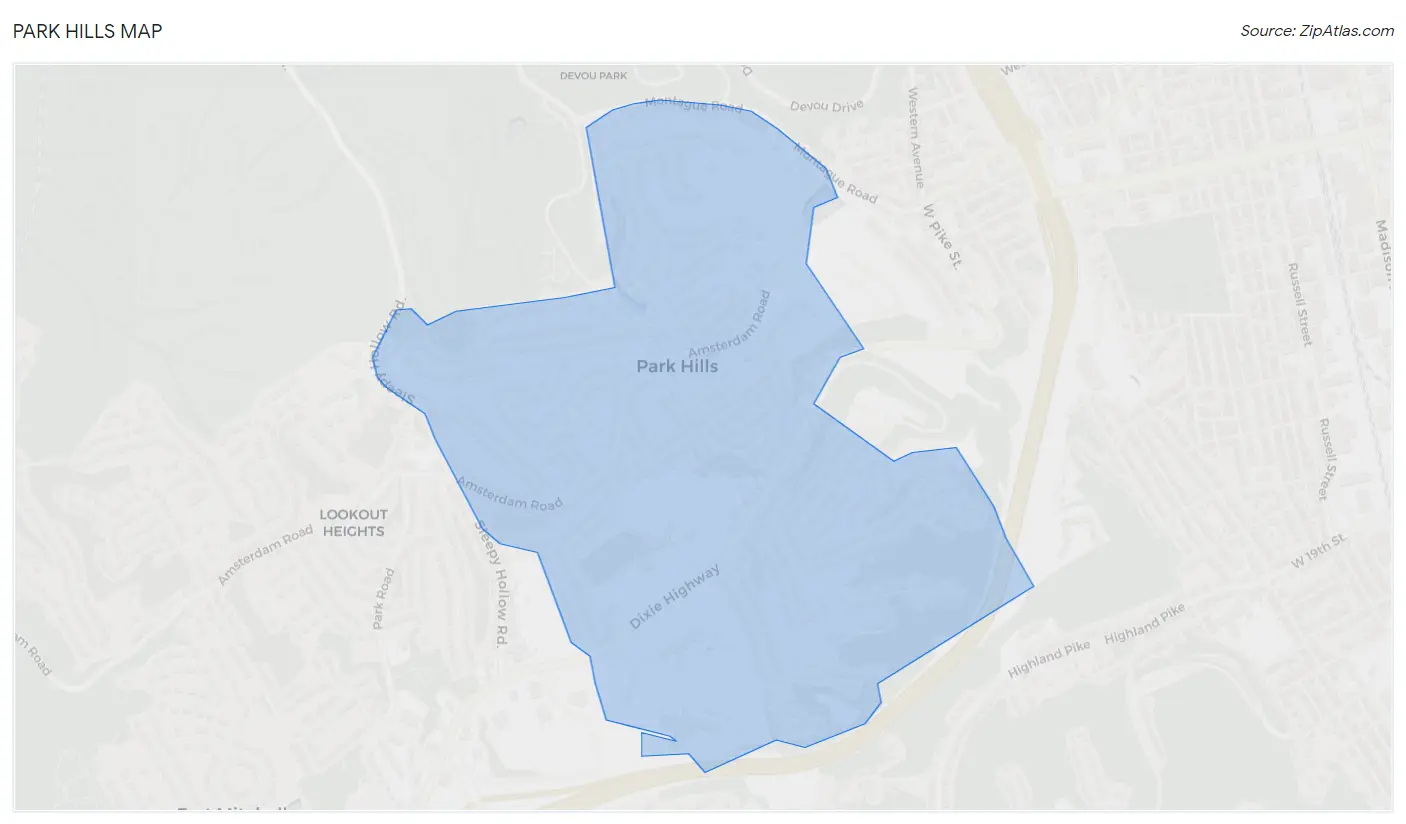
Park Hills Map
Park Hills Overview
$45,439
PER CAPITA INCOME
$127,642
AVG FAMILY INCOME
$89,167
AVG HOUSEHOLD INCOME
13.6%
WAGE / INCOME GAP [ % ]
86.4¢/ $1
WAGE / INCOME GAP [ $ ]
0.48
INEQUALITY / GINI INDEX
3,159
TOTAL POPULATION
1,505
MALE POPULATION
1,654
FEMALE POPULATION
90.99
MALES / 100 FEMALES
109.90
FEMALES / 100 MALES
30.7
MEDIAN AGE
2.9
AVG FAMILY SIZE
2.3
AVG HOUSEHOLD SIZE
1,738
LABOR FORCE [ PEOPLE ]
68.6%
PERCENT IN LABOR FORCE
4.5%
UNEMPLOYMENT RATE
Park Hills Area Codes
Income in Park Hills
Income Overview in Park Hills
Per Capita Income in Park Hills is $45,439, while median incomes of families and households are $127,642 and $89,167 respectively.
| Characteristic | Number | Measure |
| Per Capita Income | 3,159 | $45,439 |
| Median Family Income | 716 | $127,642 |
| Mean Family Income | 716 | $137,876 |
| Median Household Income | 1,324 | $89,167 |
| Mean Household Income | 1,324 | $105,569 |
| Income Deficit | 716 | $0 |
| Wage / Income Gap (%) | 3,159 | 13.63% |
| Wage / Income Gap ($) | 3,159 | 86.37¢ per $1 |
| Gini / Inequality Index | 3,159 | 0.48 |
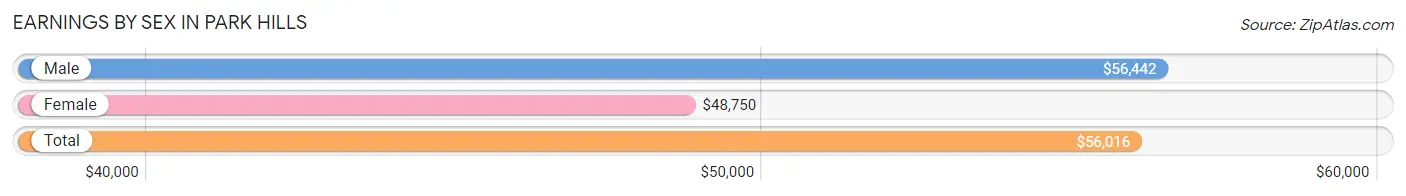
Earnings by Sex in Park Hills
Average Earnings in Park Hills are $56,016, $56,442 for men and $48,750 for women, a difference of 13.6%.
| Sex | Number | Average Earnings |
| Male | 894 (49.7%) | $56,442 |
| Female | 905 (50.3%) | $48,750 |
| Total | 1,799 (100.0%) | $56,016 |
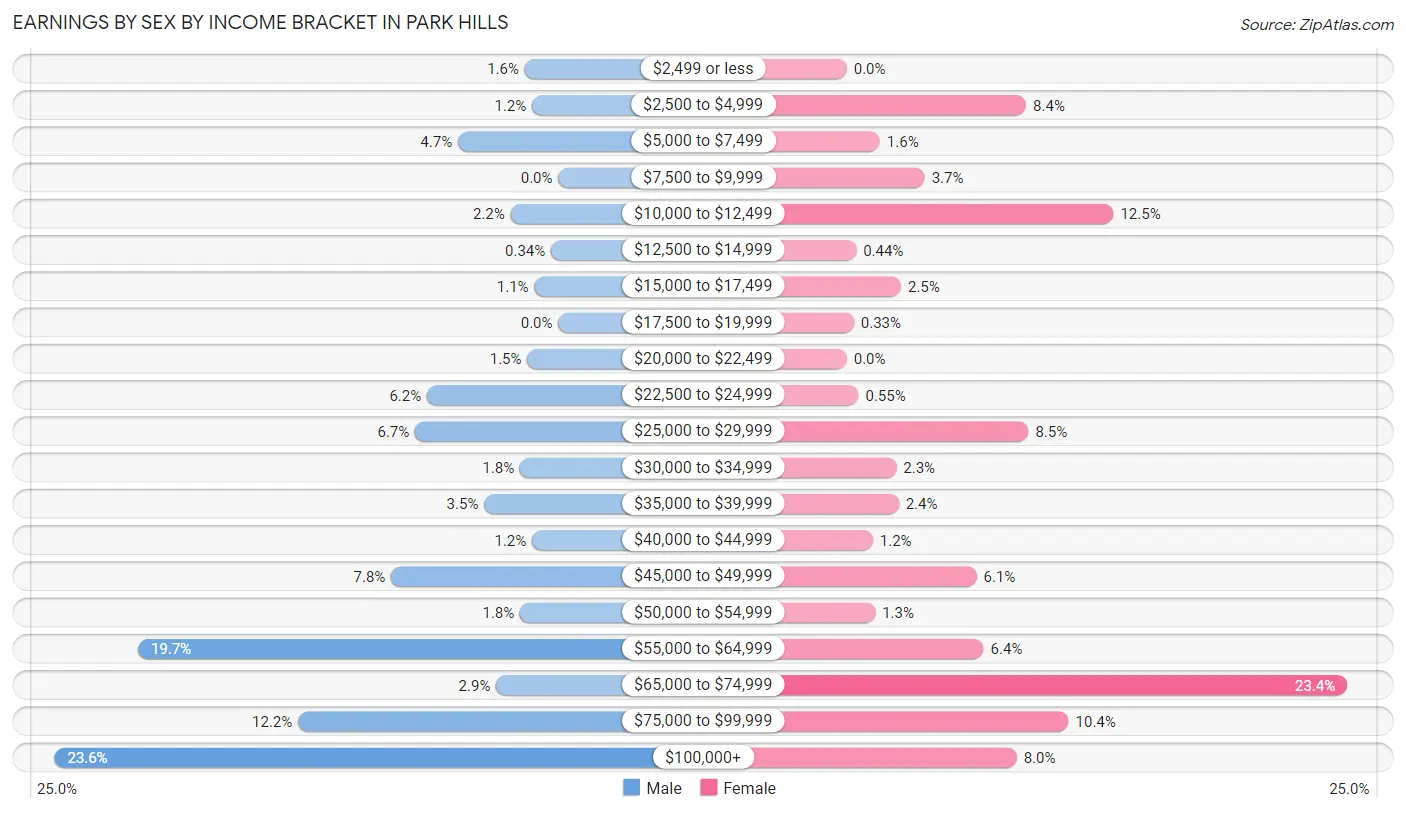
Earnings by Sex by Income Bracket in Park Hills
The most common earnings brackets in Park Hills are $100,000+ for men (211 | 23.6%) and $65,000 to $74,999 for women (212 | 23.4%).
| Income | Male | Female |
| $2,499 or less | 14 (1.6%) | 0 (0.0%) |
| $2,500 to $4,999 | 11 (1.2%) | 76 (8.4%) |
| $5,000 to $7,499 | 42 (4.7%) | 14 (1.5%) |
| $7,500 to $9,999 | 0 (0.0%) | 33 (3.6%) |
| $10,000 to $12,499 | 20 (2.2%) | 113 (12.5%) |
| $12,500 to $14,999 | 3 (0.3%) | 4 (0.4%) |
| $15,000 to $17,499 | 10 (1.1%) | 23 (2.5%) |
| $17,500 to $19,999 | 0 (0.0%) | 3 (0.3%) |
| $20,000 to $22,499 | 13 (1.5%) | 0 (0.0%) |
| $22,500 to $24,999 | 55 (6.1%) | 5 (0.5%) |
| $25,000 to $29,999 | 60 (6.7%) | 77 (8.5%) |
| $30,000 to $34,999 | 16 (1.8%) | 21 (2.3%) |
| $35,000 to $39,999 | 31 (3.5%) | 22 (2.4%) |
| $40,000 to $44,999 | 11 (1.2%) | 11 (1.2%) |
| $45,000 to $49,999 | 70 (7.8%) | 55 (6.1%) |
| $50,000 to $54,999 | 16 (1.8%) | 12 (1.3%) |
| $55,000 to $64,999 | 176 (19.7%) | 58 (6.4%) |
| $65,000 to $74,999 | 26 (2.9%) | 212 (23.4%) |
| $75,000 to $99,999 | 109 (12.2%) | 94 (10.4%) |
| $100,000+ | 211 (23.6%) | 72 (8.0%) |
| Total | 894 (100.0%) | 905 (100.0%) |
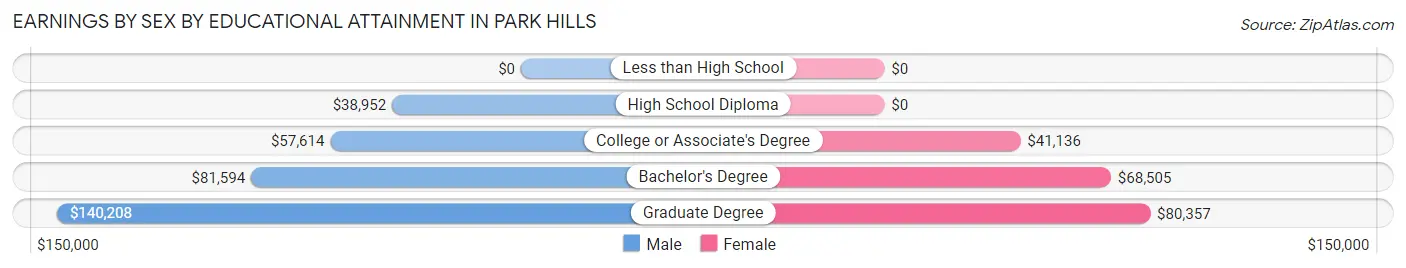
Earnings by Sex by Educational Attainment in Park Hills
Average earnings in Park Hills are $69,167 for men and $68,230 for women, a difference of 1.3%. Men with an educational attainment of graduate degree enjoy the highest average annual earnings of $140,208, while those with high school diploma education earn the least with $38,952. Women with an educational attainment of graduate degree earn the most with the average annual earnings of $80,357, while those with college or associate's degree education have the smallest earnings of $41,136.
| Educational Attainment | Male Income | Female Income |
| Less than High School | - | - |
| High School Diploma | $38,952 | $0 |
| College or Associate's Degree | $57,614 | $41,136 |
| Bachelor's Degree | $81,594 | $68,505 |
| Graduate Degree | $140,208 | $80,357 |
| Total | $69,167 | $68,230 |
Family Income in Park Hills
Family Income Brackets in Park Hills
According to the Park Hills family income data, there are 171 families falling into the $100,000 to $149,999 income range, which is the most common income bracket and makes up 23.9% of all families.
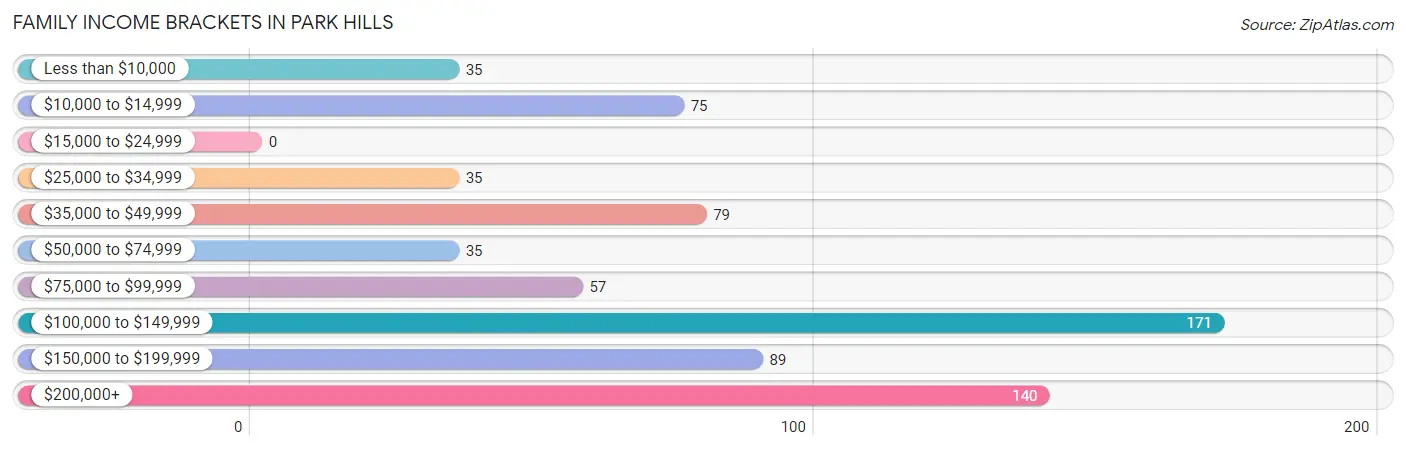
| Income Bracket | # Families | % Families |
| Less than $10,000 | 35 | 4.9% |
| $10,000 to $14,999 | 75 | 10.5% |
| $15,000 to $24,999 | 0 | 0.0% |
| $25,000 to $34,999 | 35 | 4.9% |
| $35,000 to $49,999 | 79 | 11.0% |
| $50,000 to $74,999 | 35 | 4.9% |
| $75,000 to $99,999 | 57 | 8.0% |
| $100,000 to $149,999 | 171 | 23.9% |
| $150,000 to $199,999 | 89 | 12.4% |
| $200,000+ | 140 | 19.6% |
Family Income by Famaliy Size in Park Hills
6-person families (27 | 3.8%) account for the highest median family income in Park Hills with $234,135 per family, while 3-person families (161 | 22.5%) have the highest median income of $51,622 per family member.
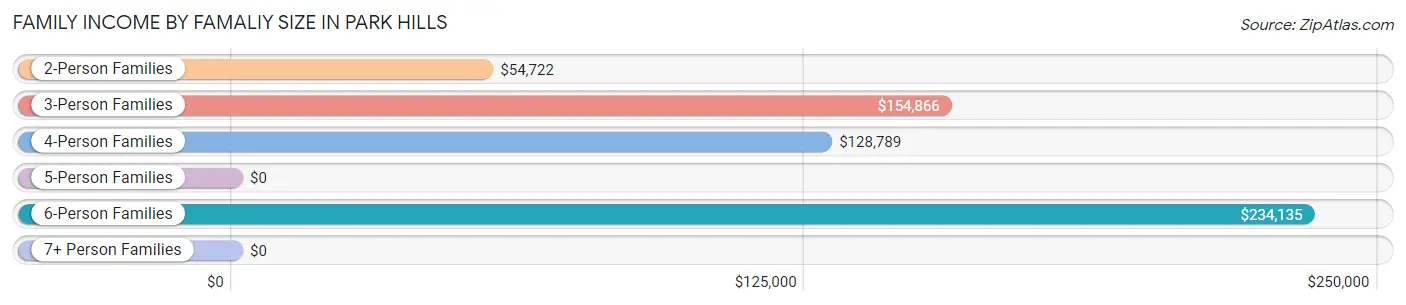
| Income Bracket | # Families | Median Income |
| 2-Person Families | 398 (55.6%) | $54,722 |
| 3-Person Families | 161 (22.5%) | $154,866 |
| 4-Person Families | 121 (16.9%) | $128,789 |
| 5-Person Families | 9 (1.3%) | $0 |
| 6-Person Families | 27 (3.8%) | $234,135 |
| 7+ Person Families | 0 (0.0%) | $0 |
| Total | 716 (100.0%) | $127,642 |
Family Income by Number of Earners in Park Hills
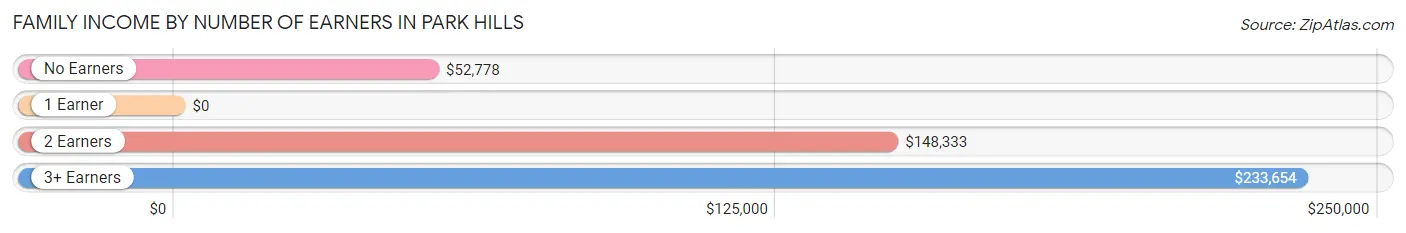
| Number of Earners | # Families | Median Income |
| No Earners | 132 (18.4%) | $52,778 |
| 1 Earner | 188 (26.3%) | $0 |
| 2 Earners | 366 (51.1%) | $148,333 |
| 3+ Earners | 30 (4.2%) | $233,654 |
| Total | 716 (100.0%) | $127,642 |
Household Income in Park Hills
Household Income Brackets in Park Hills
With 373 households falling in the category, the $100,000 to $149,999 income range is the most frequent in Park Hills, accounting for 28.2% of all households. In contrast, only 49 households (3.7%) fall into the $15,000 to $24,999 income bracket, making it the least populous group.
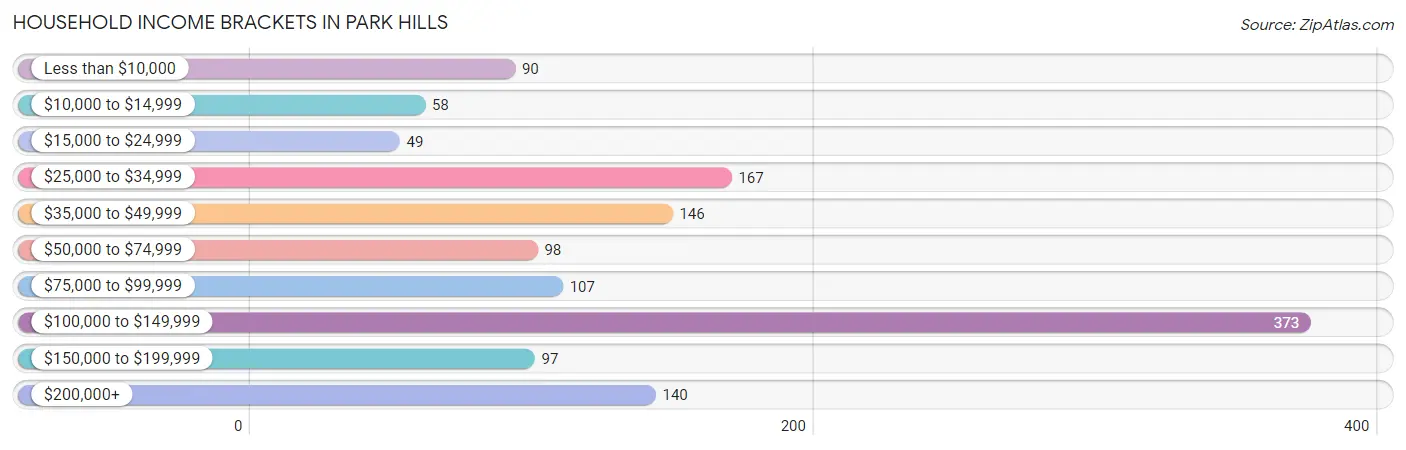
| Income Bracket | # Households | % Households |
| Less than $10,000 | 90 | 6.8% |
| $10,000 to $14,999 | 58 | 4.4% |
| $15,000 to $24,999 | 49 | 3.7% |
| $25,000 to $34,999 | 167 | 12.6% |
| $35,000 to $49,999 | 146 | 11.0% |
| $50,000 to $74,999 | 98 | 7.4% |
| $75,000 to $99,999 | 107 | 8.1% |
| $100,000 to $149,999 | 373 | 28.2% |
| $150,000 to $199,999 | 97 | 7.3% |
| $200,000+ | 140 | 10.6% |
Household Income by Householder Age in Park Hills
The median household income in Park Hills is $89,167, with the highest median household income of $108,750 found in the 25 to 44 years age bracket for the primary householder. A total of 620 households (46.8%) fall into this category. Meanwhile, the 15 to 24 years age bracket for the primary householder has the lowest median household income of $28,472, with 169 households (12.8%) in this group.
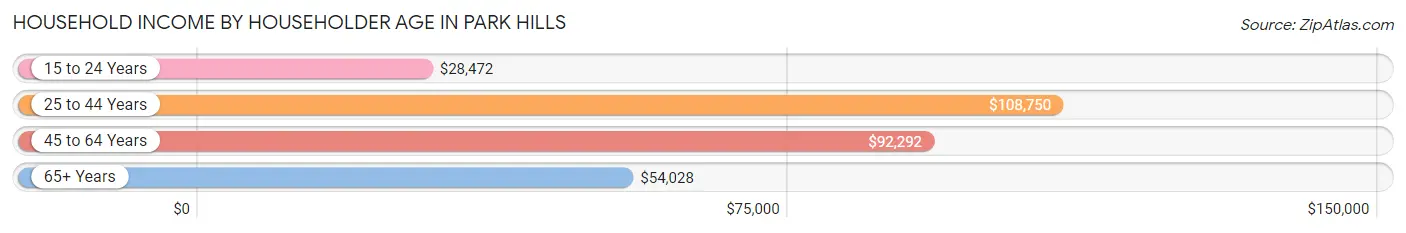
| Income Bracket | # Households | Median Income |
| 15 to 24 Years | 169 (12.8%) | $28,472 |
| 25 to 44 Years | 620 (46.8%) | $108,750 |
| 45 to 64 Years | 274 (20.7%) | $92,292 |
| 65+ Years | 261 (19.7%) | $54,028 |
| Total | 1,324 (100.0%) | $89,167 |
Poverty in Park Hills
Income Below Poverty by Sex and Age in Park Hills
With 17.4% poverty level for males and 18.2% for females among the residents of Park Hills, 5 year old males and 18 to 24 year old females are the most vulnerable to poverty, with 27 males (84.4%) and 114 females (57.3%) in their respective age groups living below the poverty level.
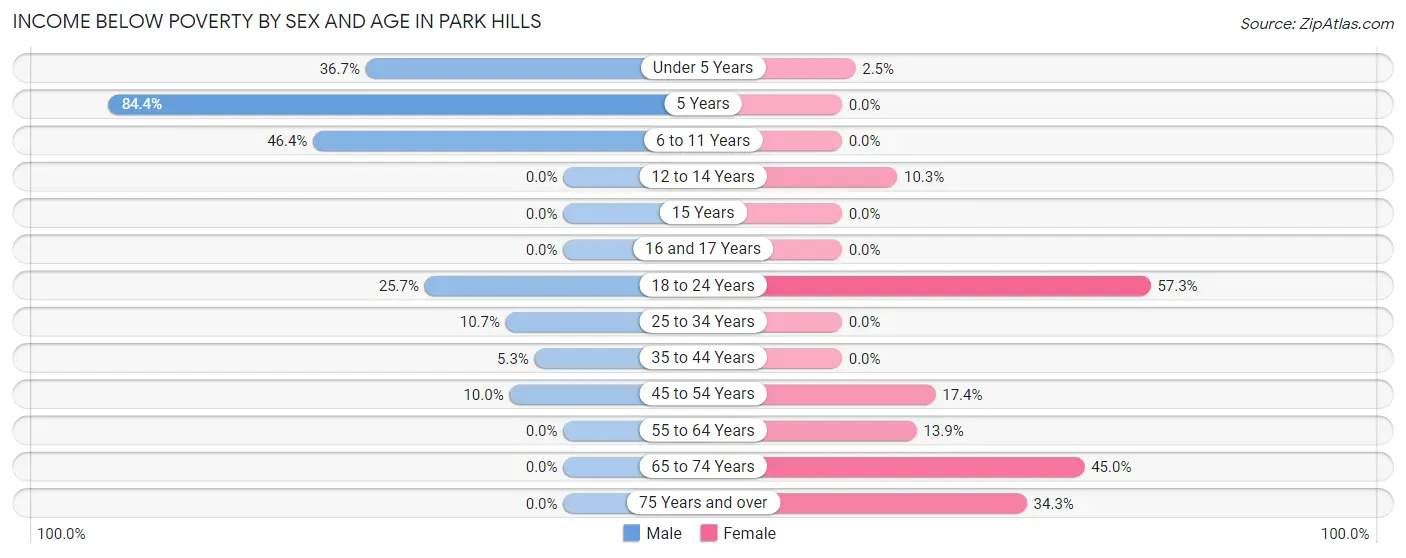
| Age Bracket | Male | Female |
| Under 5 Years | 73 (36.7%) | 1 (2.5%) |
| 5 Years | 27 (84.4%) | 0 (0.0%) |
| 6 to 11 Years | 26 (46.4%) | 0 (0.0%) |
| 12 to 14 Years | 0 (0.0%) | 8 (10.3%) |
| 15 Years | 0 (0.0%) | 0 (0.0%) |
| 16 and 17 Years | 0 (0.0%) | 0 (0.0%) |
| 18 to 24 Years | 71 (25.7%) | 114 (57.3%) |
| 25 to 34 Years | 36 (10.7%) | 0 (0.0%) |
| 35 to 44 Years | 10 (5.3%) | 0 (0.0%) |
| 45 to 54 Years | 15 (10.0%) | 21 (17.4%) |
| 55 to 64 Years | 0 (0.0%) | 23 (13.9%) |
| 65 to 74 Years | 0 (0.0%) | 54 (45.0%) |
| 75 Years and over | 0 (0.0%) | 70 (34.3%) |
| Total | 258 (17.4%) | 291 (18.2%) |
Income Above Poverty by Sex and Age in Park Hills
According to the poverty statistics in Park Hills, males aged 12 to 14 years and females aged 5 years are the age groups that are most secure financially, with 100.0% of males and 100.0% of females in these age groups living above the poverty line.
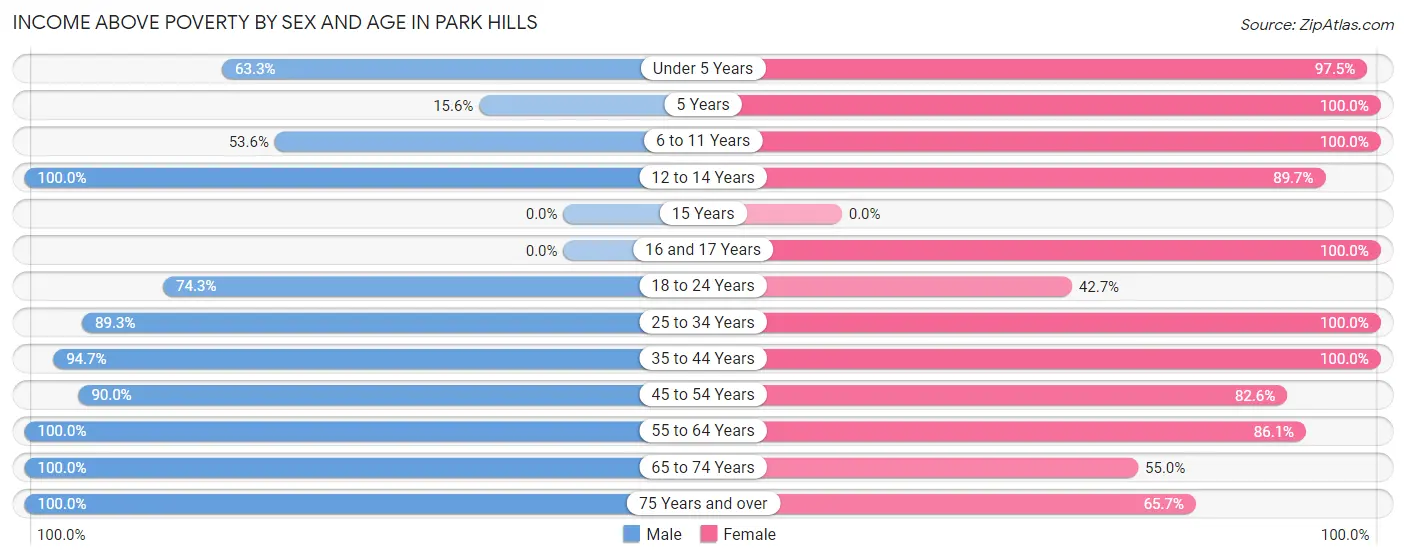
| Age Bracket | Male | Female |
| Under 5 Years | 126 (63.3%) | 39 (97.5%) |
| 5 Years | 5 (15.6%) | 1 (100.0%) |
| 6 to 11 Years | 30 (53.6%) | 118 (100.0%) |
| 12 to 14 Years | 25 (100.0%) | 70 (89.7%) |
| 15 Years | 0 (0.0%) | 0 (0.0%) |
| 16 and 17 Years | 0 (0.0%) | 79 (100.0%) |
| 18 to 24 Years | 205 (74.3%) | 85 (42.7%) |
| 25 to 34 Years | 301 (89.3%) | 286 (100.0%) |
| 35 to 44 Years | 178 (94.7%) | 188 (100.0%) |
| 45 to 54 Years | 135 (90.0%) | 100 (82.6%) |
| 55 to 64 Years | 55 (100.0%) | 143 (86.1%) |
| 65 to 74 Years | 67 (100.0%) | 66 (55.0%) |
| 75 Years and over | 98 (100.0%) | 134 (65.7%) |
| Total | 1,225 (82.6%) | 1,309 (81.8%) |
Income Below Poverty Among Married-Couple Families in Park Hills
The poverty statistics for married-couple families in Park Hills show that 6.4% or 34 of the total 529 families live below the poverty line. Families with no children have the highest poverty rate of 11.3%, comprising of 34 families. On the other hand, families with 1 or 2 children have the lowest poverty rate of 0.0%, which includes 0 families.
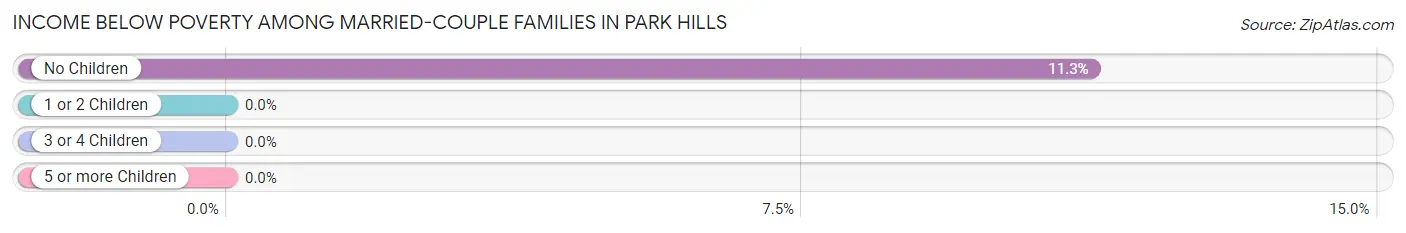
| Children | Above Poverty | Below Poverty |
| No Children | 268 (88.7%) | 34 (11.3%) |
| 1 or 2 Children | 191 (100.0%) | 0 (0.0%) |
| 3 or 4 Children | 36 (100.0%) | 0 (0.0%) |
| 5 or more Children | 0 (0.0%) | 0 (0.0%) |
| Total | 495 (93.6%) | 34 (6.4%) |
Income Below Poverty Among Single-Parent Households in Park Hills
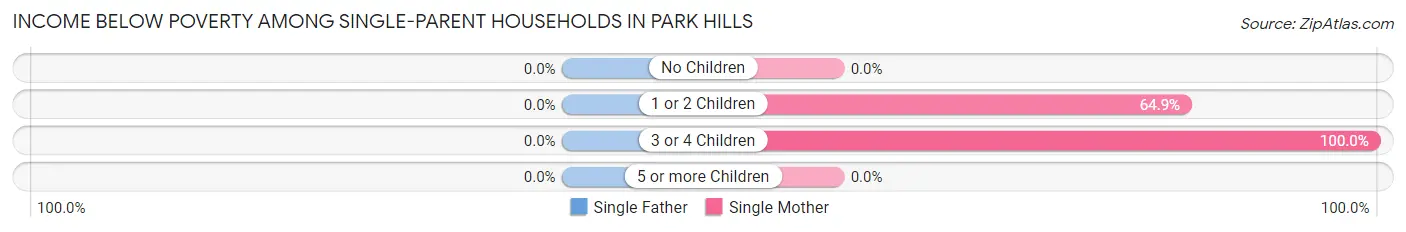
| Children | Single Father | Single Mother |
| No Children | 0 (0.0%) | 0 (0.0%) |
| 1 or 2 Children | 0 (0.0%) | 48 (64.9%) |
| 3 or 4 Children | 0 (0.0%) | 28 (100.0%) |
| 5 or more Children | 0 (0.0%) | 0 (0.0%) |
| Total | 0 (0.0%) | 76 (47.5%) |
Income Below Poverty Among Married-Couple vs Single-Parent Households in Park Hills
The poverty data for Park Hills shows that 34 of the married-couple family households (6.4%) and 76 of the single-parent households (40.6%) are living below the poverty level. Within the married-couple family households, those with no children have the highest poverty rate, with 34 households (11.3%) falling below the poverty line. Among the single-parent households, those with 3 or 4 children have the highest poverty rate, with 28 household (100.0%) living below poverty.
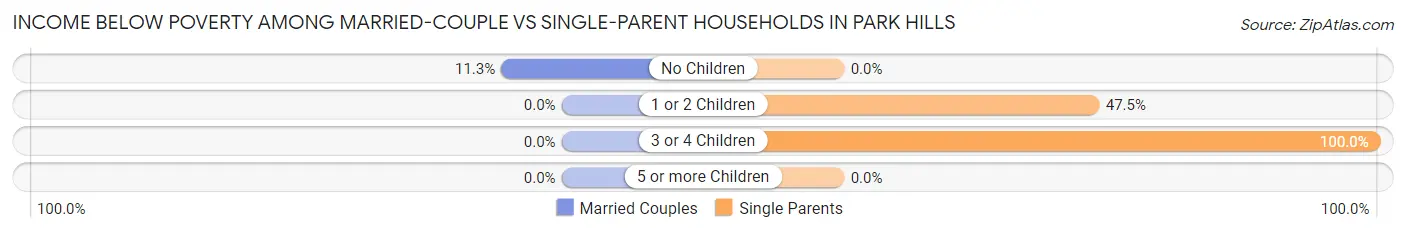
| Children | Married-Couple Families | Single-Parent Households |
| No Children | 34 (11.3%) | 0 (0.0%) |
| 1 or 2 Children | 0 (0.0%) | 48 (47.5%) |
| 3 or 4 Children | 0 (0.0%) | 28 (100.0%) |
| 5 or more Children | 0 (0.0%) | 0 (0.0%) |
| Total | 34 (6.4%) | 76 (40.6%) |
Race in Park Hills
The most populous races in Park Hills are White / Caucasian (2,662 | 84.3%), Two or more Races (318 | 10.1%), and Hispanic or Latino (138 | 4.4%).
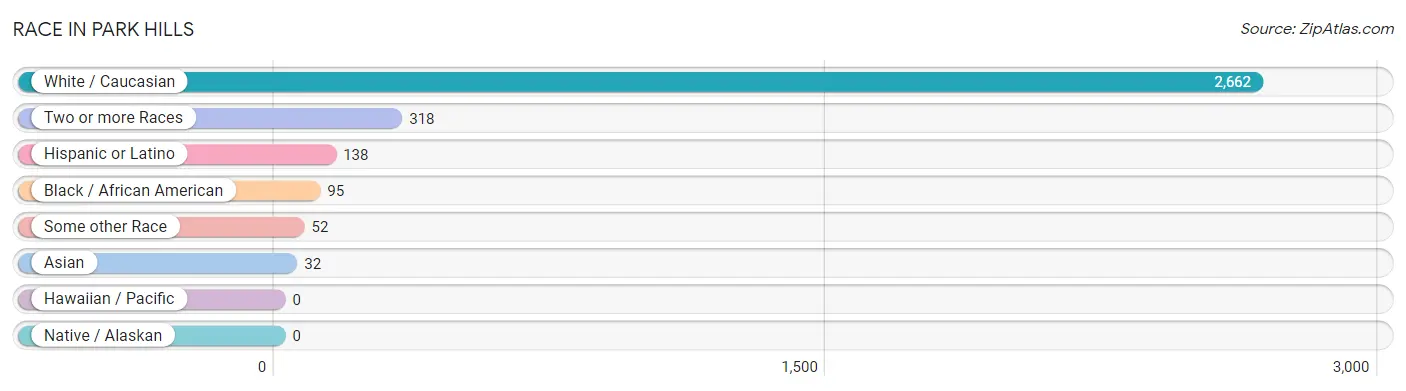
| Race | # Population | % Population |
| Asian | 32 | 1.0% |
| Black / African American | 95 | 3.0% |
| Hawaiian / Pacific | 0 | 0.0% |
| Hispanic or Latino | 138 | 4.4% |
| Native / Alaskan | 0 | 0.0% |
| White / Caucasian | 2,662 | 84.3% |
| Two or more Races | 318 | 10.1% |
| Some other Race | 52 | 1.7% |
| Total | 3,159 | 100.0% |
Ancestry in Park Hills
The most populous ancestries reported in Park Hills are German (978 | 31.0%), Irish (487 | 15.4%), English (321 | 10.2%), European (122 | 3.9%), and Italian (117 | 3.7%), together accounting for 64.1% of all Park Hills residents.
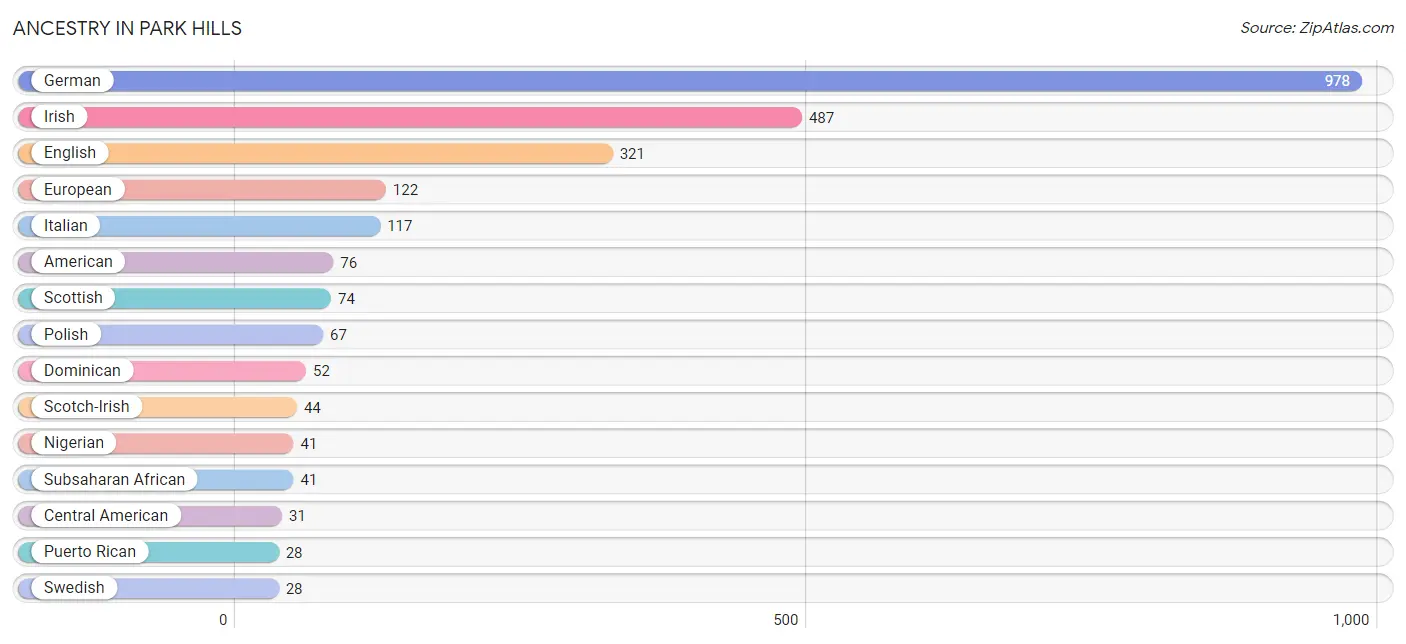
| Ancestry | # Population | % Population |
| American | 76 | 2.4% |
| Arab | 12 | 0.4% |
| Austrian | 8 | 0.3% |
| Bhutanese | 12 | 0.4% |
| Burmese | 20 | 0.6% |
| Central American | 31 | 1.0% |
| Croatian | 11 | 0.4% |
| Dominican | 52 | 1.7% |
| Dutch | 25 | 0.8% |
| Eastern European | 11 | 0.4% |
| Egyptian | 12 | 0.4% |
| English | 321 | 10.2% |
| European | 122 | 3.9% |
| French | 19 | 0.6% |
| French Canadian | 9 | 0.3% |
| German | 978 | 31.0% |
| Guatemalan | 11 | 0.4% |
| Honduran | 20 | 0.6% |
| Indian (Asian) | 11 | 0.4% |
| Irish | 487 | 15.4% |
| Italian | 117 | 3.7% |
| Latvian | 9 | 0.3% |
| Mexican | 27 | 0.9% |
| Nigerian | 41 | 1.3% |
| Norwegian | 3 | 0.1% |
| Polish | 67 | 2.1% |
| Puerto Rican | 28 | 0.9% |
| Scotch-Irish | 44 | 1.4% |
| Scottish | 74 | 2.3% |
| Slovak | 7 | 0.2% |
| Slovene | 9 | 0.3% |
| Subsaharan African | 41 | 1.3% |
| Swedish | 28 | 0.9% |
| Welsh | 27 | 0.9% | View All 34 Rows |
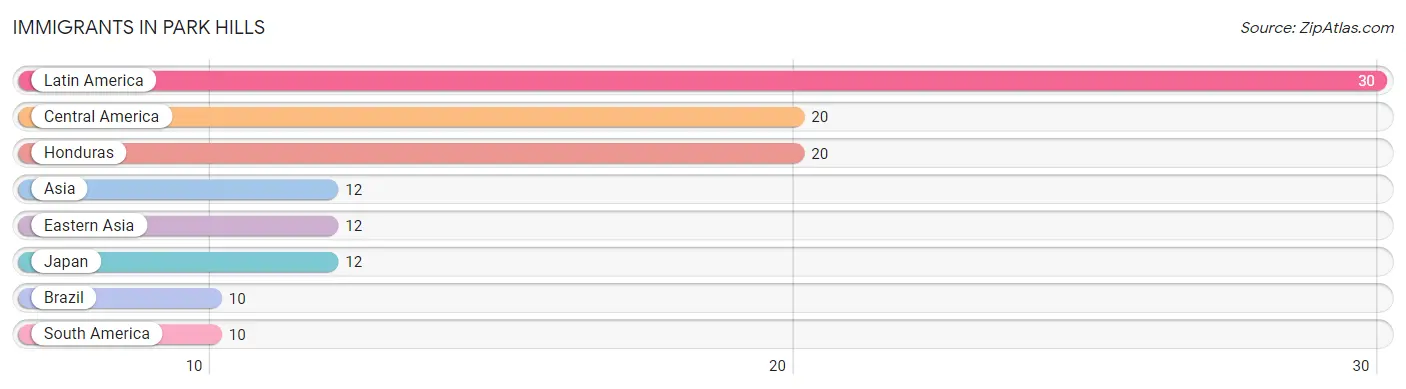
Immigrants in Park Hills
The most numerous immigrant groups reported in Park Hills came from Latin America (30 | 0.9%), Central America (20 | 0.6%), Honduras (20 | 0.6%), Asia (12 | 0.4%), and Eastern Asia (12 | 0.4%), together accounting for 3.0% of all Park Hills residents.
| Immigration Origin | # Population | % Population |
| Asia | 12 | 0.4% |
| Brazil | 10 | 0.3% |
| Central America | 20 | 0.6% |
| Eastern Asia | 12 | 0.4% |
| Honduras | 20 | 0.6% |
| Japan | 12 | 0.4% |
| Latin America | 30 | 0.9% |
| South America | 10 | 0.3% | View All 8 Rows |
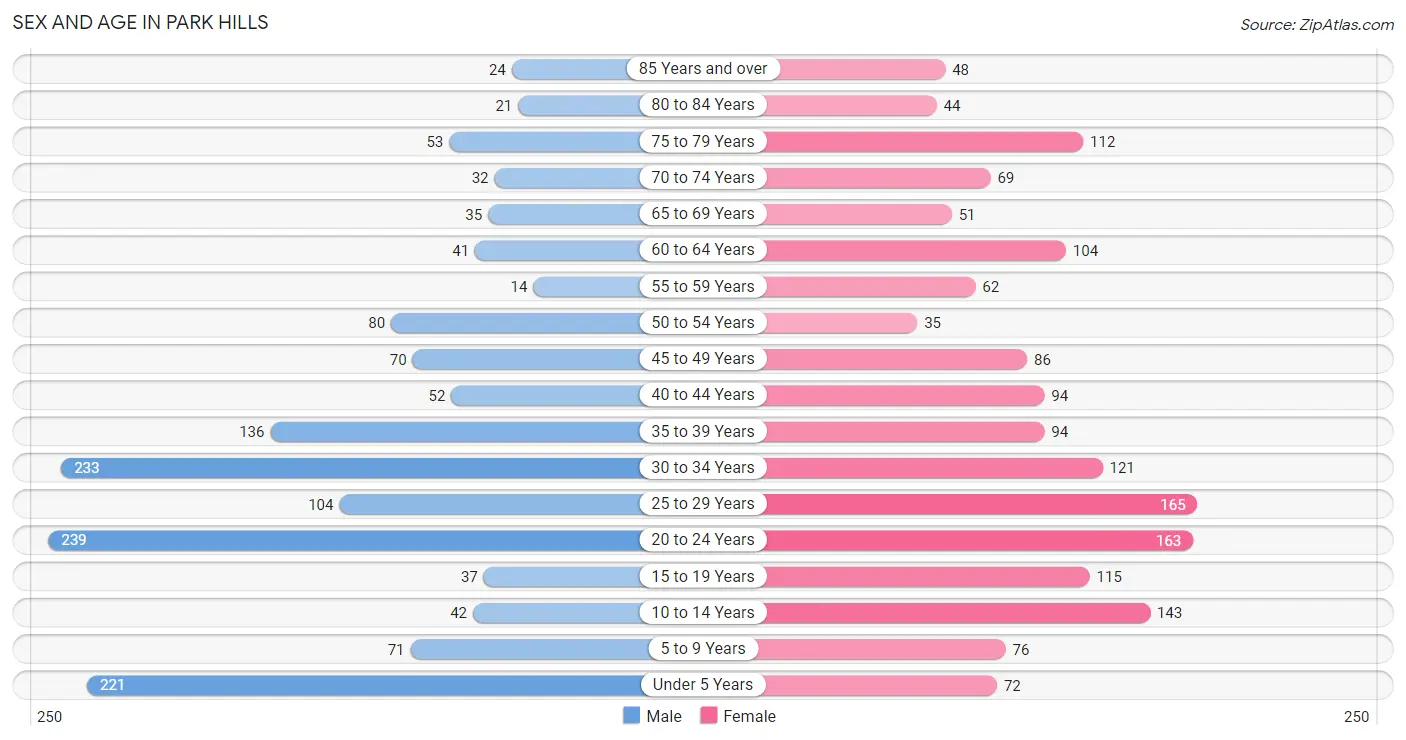
Sex and Age in Park Hills
Sex and Age in Park Hills
The most populous age groups in Park Hills are 20 to 24 Years (239 | 15.9%) for men and 25 to 29 Years (165 | 10.0%) for women.
| Age Bracket | Male | Female |
| Under 5 Years | 221 (14.7%) | 72 (4.3%) |
| 5 to 9 Years | 71 (4.7%) | 76 (4.6%) |
| 10 to 14 Years | 42 (2.8%) | 143 (8.6%) |
| 15 to 19 Years | 37 (2.5%) | 115 (7.0%) |
| 20 to 24 Years | 239 (15.9%) | 163 (9.9%) |
| 25 to 29 Years | 104 (6.9%) | 165 (10.0%) |
| 30 to 34 Years | 233 (15.5%) | 121 (7.3%) |
| 35 to 39 Years | 136 (9.0%) | 94 (5.7%) |
| 40 to 44 Years | 52 (3.5%) | 94 (5.7%) |
| 45 to 49 Years | 70 (4.6%) | 86 (5.2%) |
| 50 to 54 Years | 80 (5.3%) | 35 (2.1%) |
| 55 to 59 Years | 14 (0.9%) | 62 (3.7%) |
| 60 to 64 Years | 41 (2.7%) | 104 (6.3%) |
| 65 to 69 Years | 35 (2.3%) | 51 (3.1%) |
| 70 to 74 Years | 32 (2.1%) | 69 (4.2%) |
| 75 to 79 Years | 53 (3.5%) | 112 (6.8%) |
| 80 to 84 Years | 21 (1.4%) | 44 (2.7%) |
| 85 Years and over | 24 (1.6%) | 48 (2.9%) |
| Total | 1,505 (100.0%) | 1,654 (100.0%) |
Families and Households in Park Hills
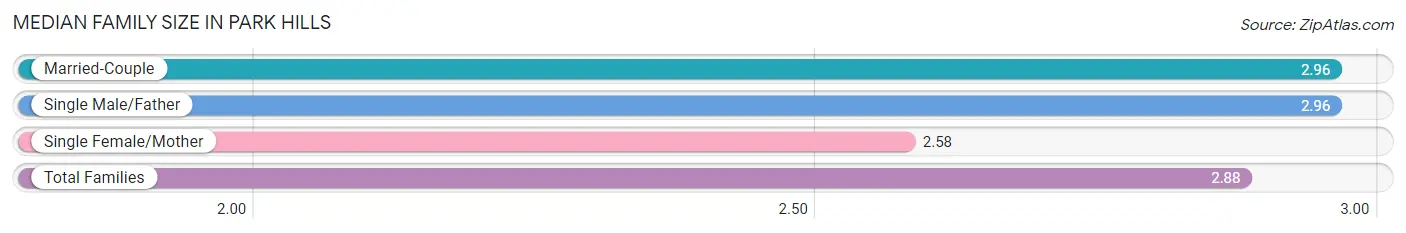
Median Family Size in Park Hills
The median family size in Park Hills is 2.88 persons per family, with married-couple families (529 | 73.9%) accounting for the largest median family size of 2.96 persons per family. On the other hand, single female/mother families (160 | 22.4%) represent the smallest median family size with 2.58 persons per family.
| Family Type | # Families | Family Size |
| Married-Couple | 529 (73.9%) | 2.96 |
| Single Male/Father | 27 (3.8%) | 2.96 |
| Single Female/Mother | 160 (22.4%) | 2.58 |
| Total Families | 716 (100.0%) | 2.88 |
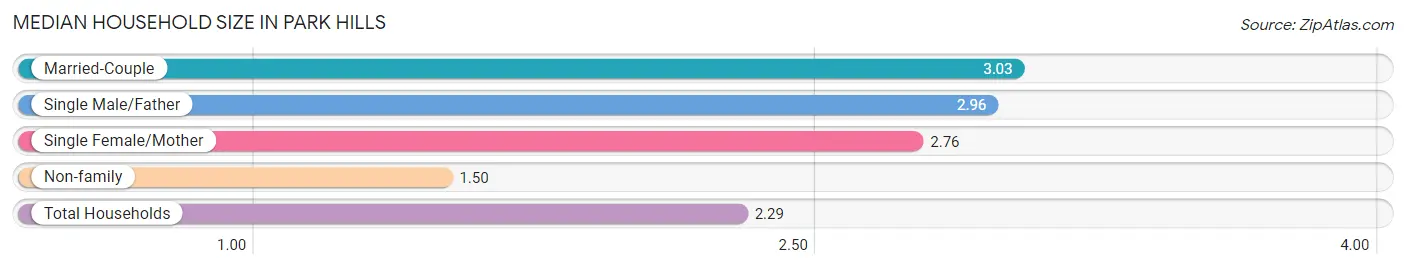
Median Household Size in Park Hills
The median household size in Park Hills is 2.29 persons per household, with married-couple households (529 | 40.0%) accounting for the largest median household size of 3.03 persons per household. non-family households (608 | 45.9%) represent the smallest median household size with 1.50 persons per household.
| Household Type | # Households | Household Size |
| Married-Couple | 529 (40.0%) | 3.03 |
| Single Male/Father | 27 (2.0%) | 2.96 |
| Single Female/Mother | 160 (12.1%) | 2.76 |
| Non-family | 608 (45.9%) | 1.50 |
| Total Households | 1,324 (100.0%) | 2.29 |
Household Size by Marriage Status in Park Hills
Out of a total of 1,324 households in Park Hills, 716 (54.1%) are family households, while 608 (45.9%) are nonfamily households. The most numerous type of family households are 2-person households, comprising 336, and the most common type of nonfamily households are 1-person households, comprising 417.
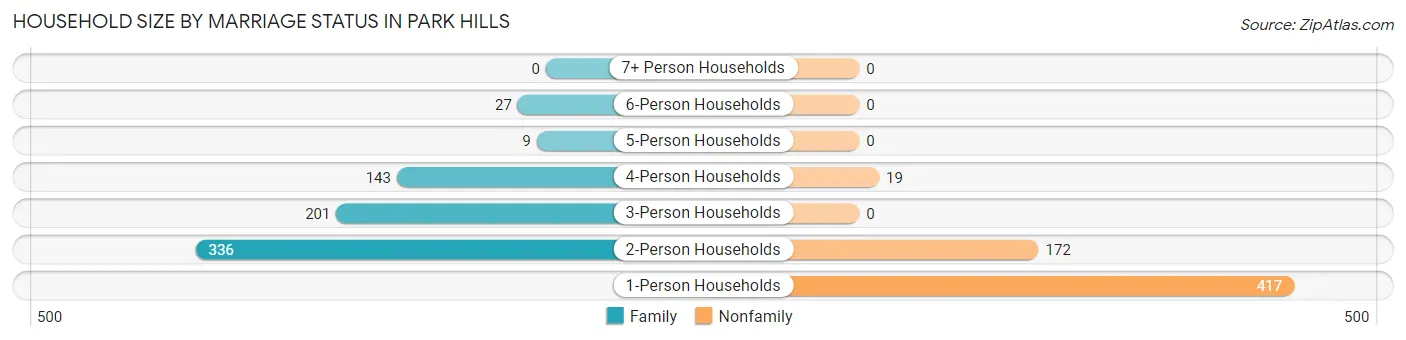
| Household Size | Family Households | Nonfamily Households |
| 1-Person Households | - | 417 (31.5%) |
| 2-Person Households | 336 (25.4%) | 172 (13.0%) |
| 3-Person Households | 201 (15.2%) | 0 (0.0%) |
| 4-Person Households | 143 (10.8%) | 19 (1.4%) |
| 5-Person Households | 9 (0.7%) | 0 (0.0%) |
| 6-Person Households | 27 (2.0%) | 0 (0.0%) |
| 7+ Person Households | 0 (0.0%) | 0 (0.0%) |
| Total | 716 (54.1%) | 608 (45.9%) |
Female Fertility in Park Hills
Fertility by Age in Park Hills
Average fertility rate in Park Hills is 120.0 births per 1,000 women. Women in the age bracket of 20 to 34 years have the highest fertility rate with 225.0 births per 1,000 women. Women in the age bracket of 20 to 34 years acount for 100.0% of all women with births.
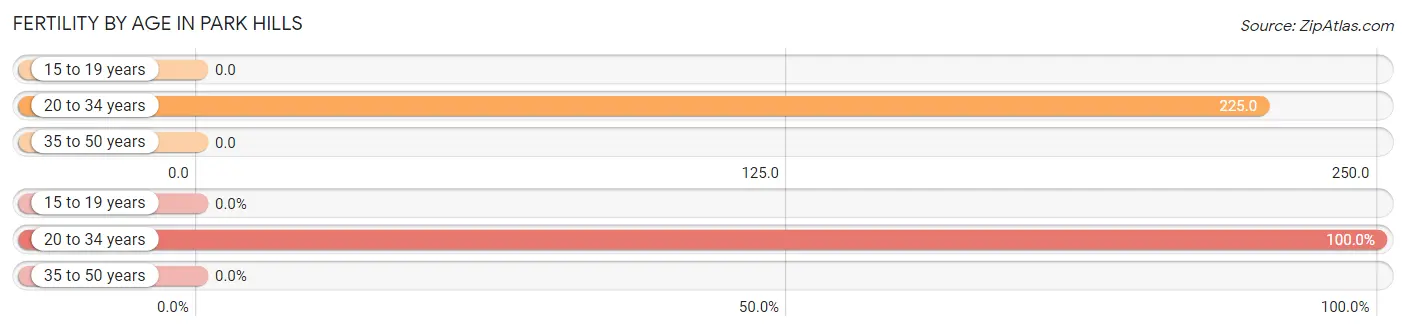
| Age Bracket | Women with Births | Births / 1,000 Women |
| 15 to 19 years | 0 (0.0%) | 0.0 |
| 20 to 34 years | 101 (100.0%) | 225.0 |
| 35 to 50 years | 0 (0.0%) | 0.0 |
| Total | 101 (100.0%) | 120.0 |
Fertility by Age by Marriage Status in Park Hills
90.1% of women with births (101) in Park Hills are married. The highest percentage of unmarried women with births falls into 20 to 34 years age bracket with 9.9% of them unmarried at the time of birth, while the lowest percentage of unmarried women with births belong to 20 to 34 years age bracket with 9.9% of them unmarried.
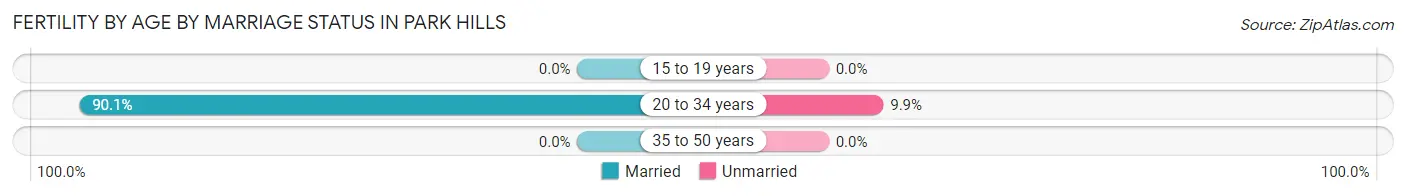
| Age Bracket | Married | Unmarried |
| 15 to 19 years | 0 (0.0%) | 0 (0.0%) |
| 20 to 34 years | 91 (90.1%) | 10 (9.9%) |
| 35 to 50 years | 0 (0.0%) | 0 (0.0%) |
| Total | 91 (90.1%) | 10 (9.9%) |
Fertility by Education in Park Hills
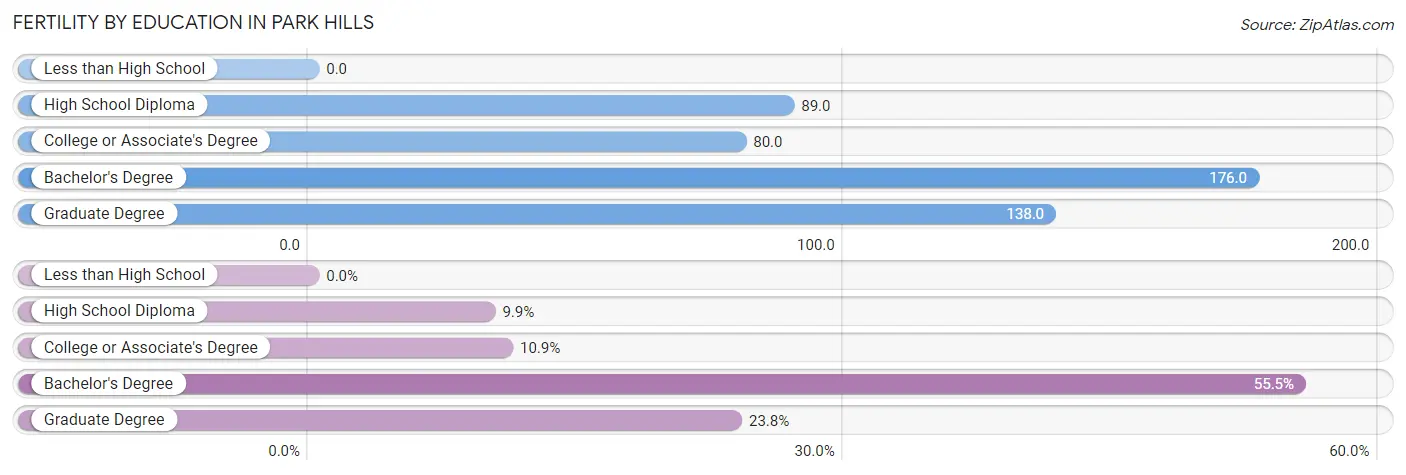
| Educational Attainment | Women with Births | Births / 1,000 Women |
| Less than High School | 0 (0.0%) | 0.0 |
| High School Diploma | 10 (9.9%) | 89.0 |
| College or Associate's Degree | 11 (10.9%) | 80.0 |
| Bachelor's Degree | 56 (55.4%) | 176.0 |
| Graduate Degree | 24 (23.8%) | 138.0 |
| Total | 101 (100.0%) | 120.0 |
Fertility by Education by Marriage Status in Park Hills
9.9% of women with births in Park Hills are unmarried. Women with the educational attainment of college or associate's degree are most likely to be married with 100.0% of them married at childbirth, while women with the educational attainment of high school diploma are least likely to be married with 100.0% of them unmarried at childbirth.
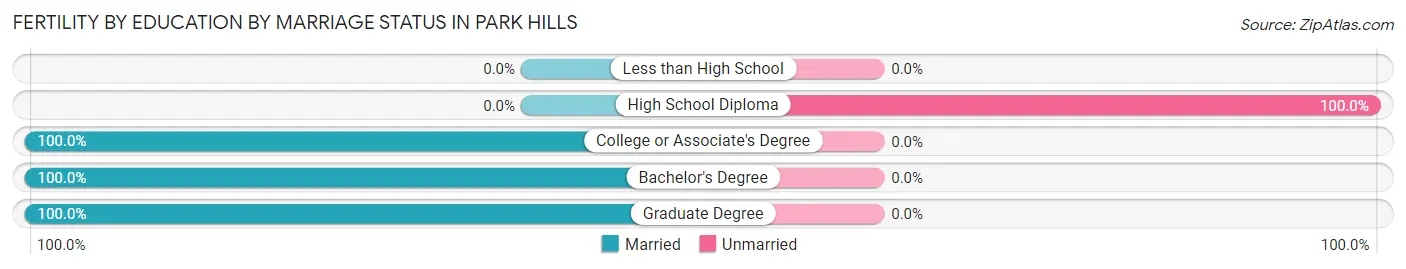
| Educational Attainment | Married | Unmarried |
| Less than High School | 0 (0.0%) | 0 (0.0%) |
| High School Diploma | 0 (0.0%) | 10 (100.0%) |
| College or Associate's Degree | 11 (100.0%) | 0 (0.0%) |
| Bachelor's Degree | 56 (100.0%) | 0 (0.0%) |
| Graduate Degree | 24 (100.0%) | 0 (0.0%) |
| Total | 91 (90.1%) | 10 (9.9%) |
Employment Characteristics in Park Hills
Employment by Class of Employer in Park Hills
Among the 1,652 employed individuals in Park Hills, private company employees (1,183 | 71.6%), not-for-profit organizations (110 | 6.7%), and self-employed (incorporated) (99 | 6.0%) make up the most common classes of employment.
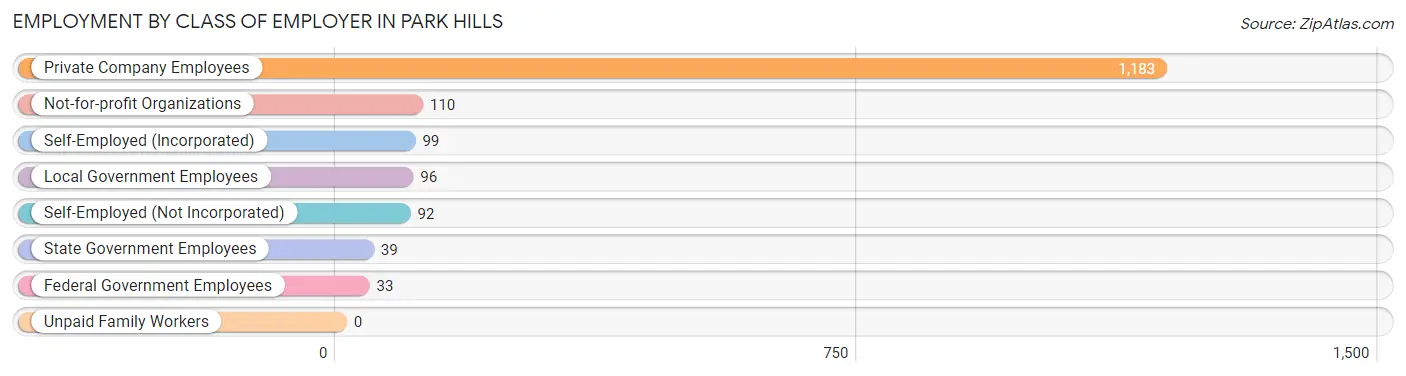
| Employer Class | # Employees | % Employees |
| Private Company Employees | 1,183 | 71.6% |
| Self-Employed (Incorporated) | 99 | 6.0% |
| Self-Employed (Not Incorporated) | 92 | 5.6% |
| Not-for-profit Organizations | 110 | 6.7% |
| Local Government Employees | 96 | 5.8% |
| State Government Employees | 39 | 2.4% |
| Federal Government Employees | 33 | 2.0% |
| Unpaid Family Workers | 0 | 0.0% |
| Total | 1,652 | 100.0% |
Employment Status by Age in Park Hills
According to the labor force statistics for Park Hills, out of the total population over 16 years of age (2,534), 68.6% or 1,738 individuals are in the labor force, with 4.5% or 78 of them unemployed. The age group with the highest labor force participation rate is 30 to 34 years, with 97.2% or 344 individuals in the labor force. Within the labor force, the 16 to 19 years age range has the highest percentage of unemployed individuals, with 32.5% or 25 of them being unemployed.
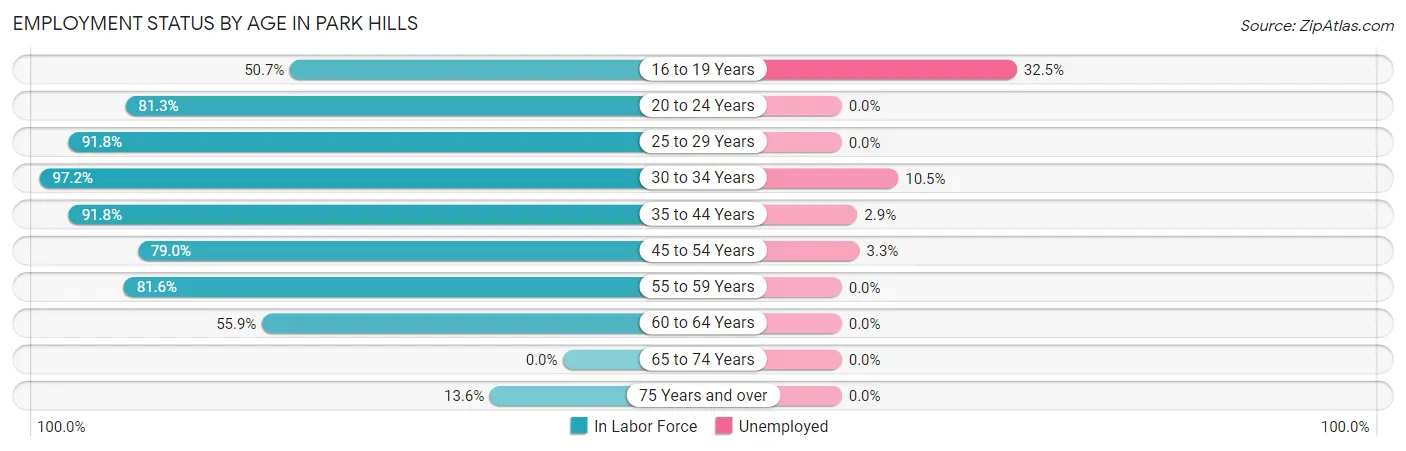
| Age Bracket | In Labor Force | Unemployed |
| 16 to 19 Years | 77 (50.7%) | 25 (32.5%) |
| 20 to 24 Years | 327 (81.3%) | 0 (0.0%) |
| 25 to 29 Years | 247 (91.8%) | 0 (0.0%) |
| 30 to 34 Years | 344 (97.2%) | 36 (10.5%) |
| 35 to 44 Years | 345 (91.8%) | 10 (2.9%) |
| 45 to 54 Years | 214 (79.0%) | 7 (3.3%) |
| 55 to 59 Years | 62 (81.6%) | 0 (0.0%) |
| 60 to 64 Years | 81 (55.9%) | 0 (0.0%) |
| 65 to 74 Years | 0 (0.0%) | 0 (0.0%) |
| 75 Years and over | 41 (13.6%) | 0 (0.0%) |
| Total | 1,738 (68.6%) | 78 (4.5%) |
Employment Status by Educational Attainment in Park Hills
According to labor force statistics for Park Hills, 86.7% of individuals (1,293) out of the total population between 25 and 64 years of age (1,491) are in the labor force, with 4.1% or 53 of them being unemployed. The group with the highest labor force participation rate are those with the educational attainment of less than high school, with 100.0% or 39 individuals in the labor force. Within the labor force, individuals with high school diploma education have the highest percentage of unemployment, with 7.6% or 10 of them being unemployed.
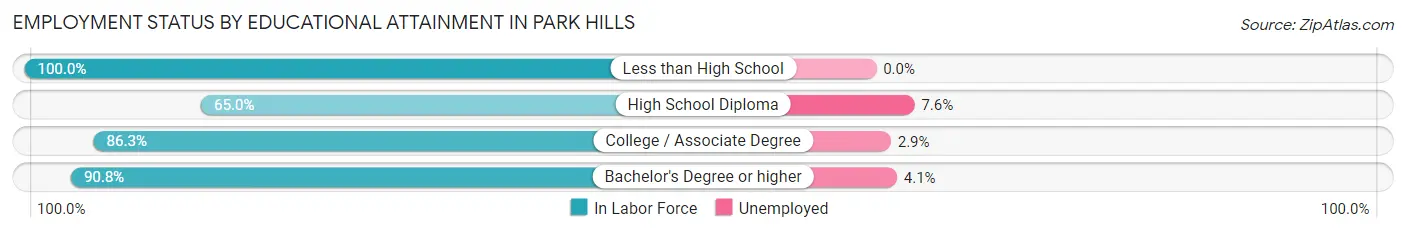
| Educational Attainment | In Labor Force | Unemployed |
| Less than High School | 39 (100.0%) | 0 (0.0%) |
| High School Diploma | 132 (65.0%) | 15 (7.6%) |
| College / Associate Degree | 240 (86.3%) | 8 (2.9%) |
| Bachelor's Degree or higher | 882 (90.8%) | 40 (4.1%) |
| Total | 1,293 (86.7%) | 61 (4.1%) |
Employment Occupations by Sex in Park Hills
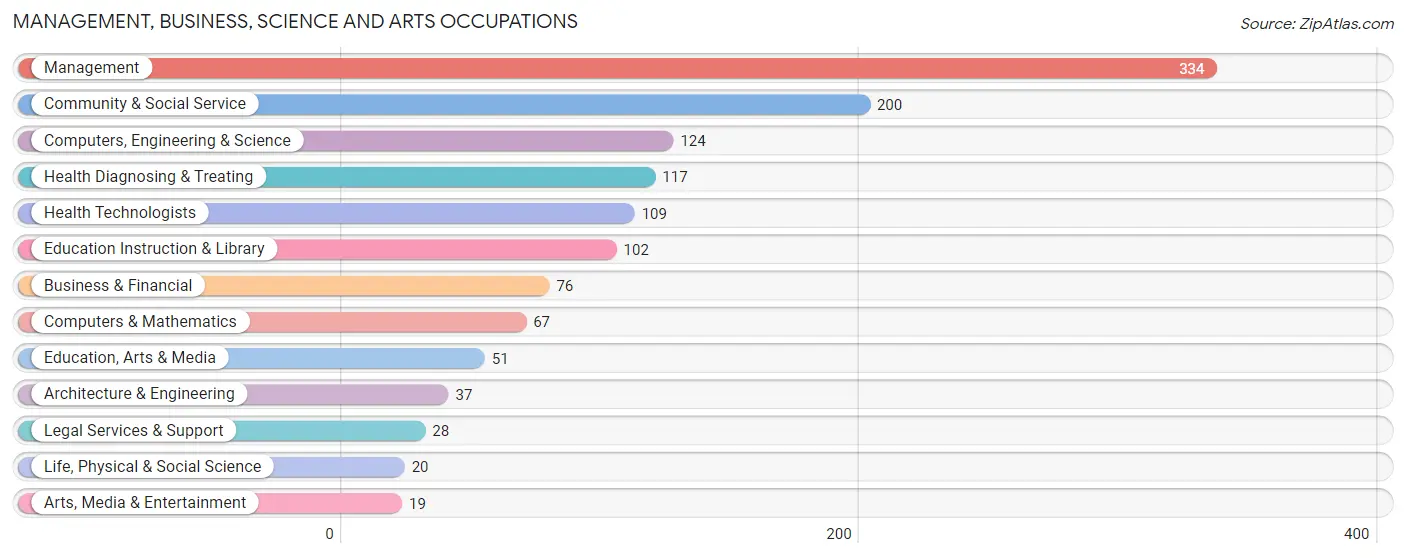
Management, Business, Science and Arts Occupations
The most common Management, Business, Science and Arts occupations in Park Hills are Management (334 | 20.1%), Community & Social Service (200 | 12.0%), Computers, Engineering & Science (124 | 7.5%), Health Diagnosing & Treating (117 | 7.0%), and Health Technologists (109 | 6.6%).
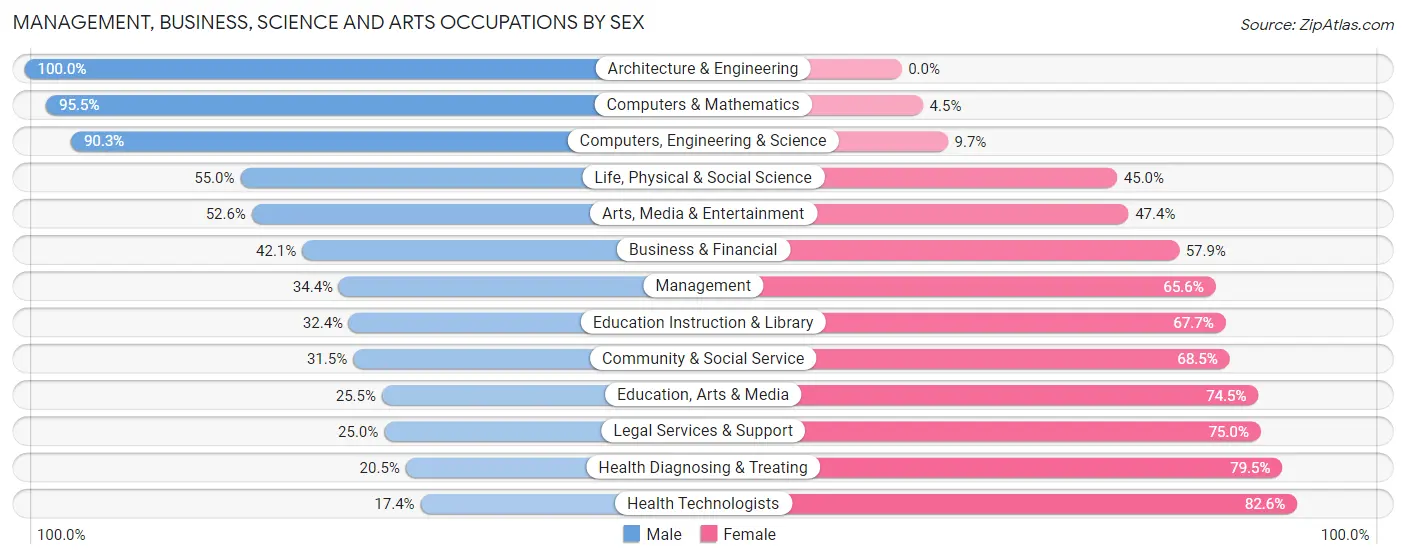
Management, Business, Science and Arts Occupations by Sex
Within the Management, Business, Science and Arts occupations in Park Hills, the most male-oriented occupations are Architecture & Engineering (100.0%), Computers & Mathematics (95.5%), and Computers, Engineering & Science (90.3%), while the most female-oriented occupations are Health Technologists (82.6%), Health Diagnosing & Treating (79.5%), and Legal Services & Support (75.0%).
| Occupation | Male | Female |
| Management | 115 (34.4%) | 219 (65.6%) |
| Business & Financial | 32 (42.1%) | 44 (57.9%) |
| Computers, Engineering & Science | 112 (90.3%) | 12 (9.7%) |
| Computers & Mathematics | 64 (95.5%) | 3 (4.5%) |
| Architecture & Engineering | 37 (100.0%) | 0 (0.0%) |
| Life, Physical & Social Science | 11 (55.0%) | 9 (45.0%) |
| Community & Social Service | 63 (31.5%) | 137 (68.5%) |
| Education, Arts & Media | 13 (25.5%) | 38 (74.5%) |
| Legal Services & Support | 7 (25.0%) | 21 (75.0%) |
| Education Instruction & Library | 33 (32.4%) | 69 (67.6%) |
| Arts, Media & Entertainment | 10 (52.6%) | 9 (47.4%) |
| Health Diagnosing & Treating | 24 (20.5%) | 93 (79.5%) |
| Health Technologists | 19 (17.4%) | 90 (82.6%) |
| Total (Category) | 346 (40.7%) | 505 (59.3%) |
| Total (Overall) | 837 (50.4%) | 823 (49.6%) |
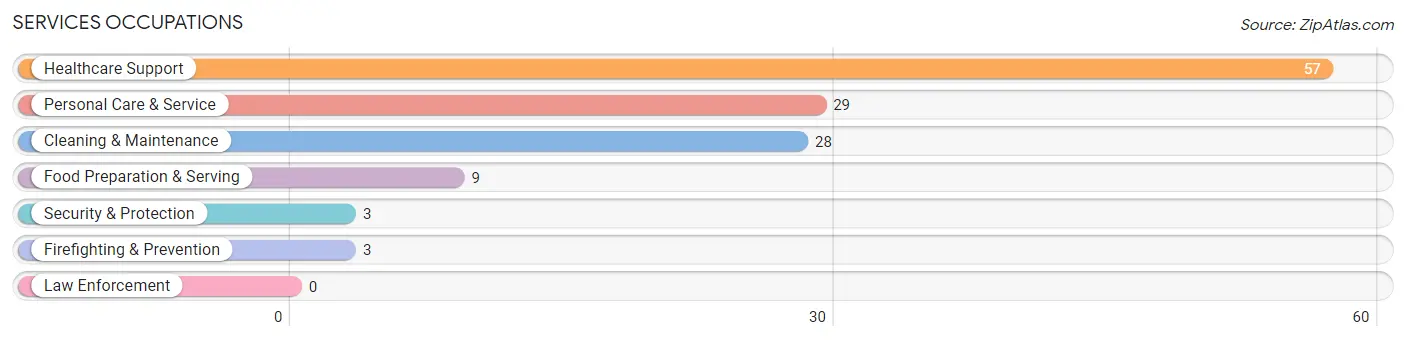
Services Occupations
The most common Services occupations in Park Hills are Healthcare Support (57 | 3.4%), Personal Care & Service (29 | 1.8%), Cleaning & Maintenance (28 | 1.7%), Food Preparation & Serving (9 | 0.5%), and Security & Protection (3 | 0.2%).
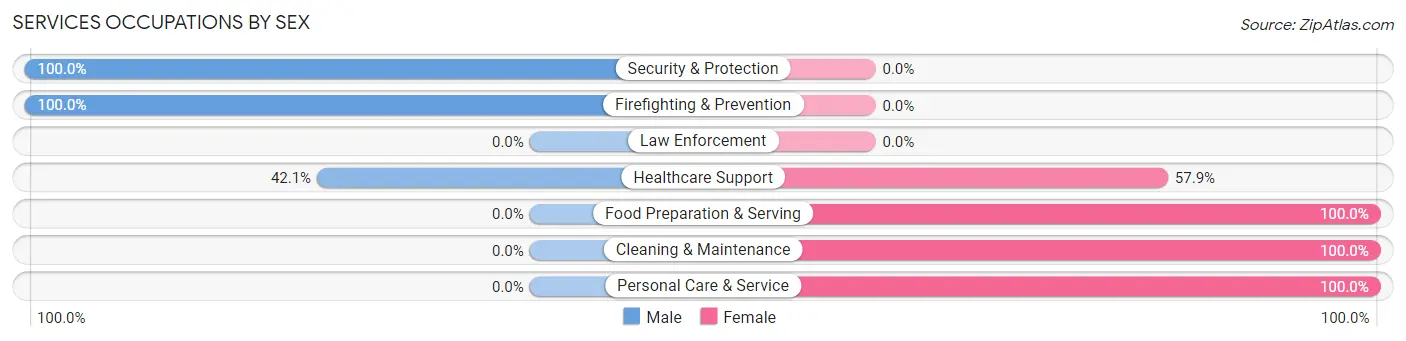
Services Occupations by Sex
Within the Services occupations in Park Hills, the most male-oriented occupations are Security & Protection (100.0%), Firefighting & Prevention (100.0%), and Healthcare Support (42.1%), while the most female-oriented occupations are Food Preparation & Serving (100.0%), Cleaning & Maintenance (100.0%), and Personal Care & Service (100.0%).
| Occupation | Male | Female |
| Healthcare Support | 24 (42.1%) | 33 (57.9%) |
| Security & Protection | 3 (100.0%) | 0 (0.0%) |
| Firefighting & Prevention | 3 (100.0%) | 0 (0.0%) |
| Law Enforcement | 0 (0.0%) | 0 (0.0%) |
| Food Preparation & Serving | 0 (0.0%) | 9 (100.0%) |
| Cleaning & Maintenance | 0 (0.0%) | 28 (100.0%) |
| Personal Care & Service | 0 (0.0%) | 29 (100.0%) |
| Total (Category) | 27 (21.4%) | 99 (78.6%) |
| Total (Overall) | 837 (50.4%) | 823 (49.6%) |
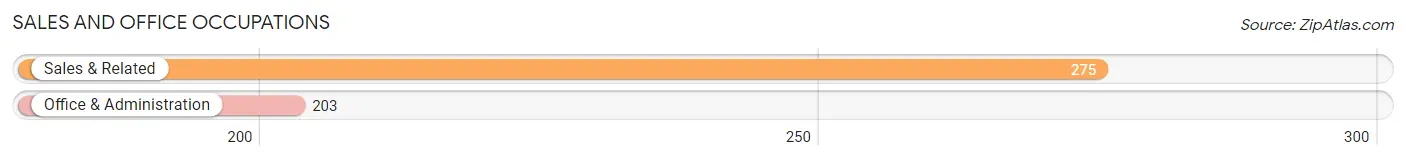
Sales and Office Occupations
The most common Sales and Office occupations in Park Hills are Sales & Related (275 | 16.6%), and Office & Administration (203 | 12.2%).
Sales and Office Occupations by Sex
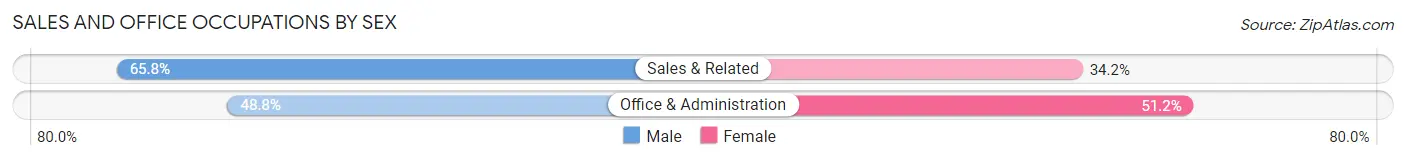
| Occupation | Male | Female |
| Sales & Related | 181 (65.8%) | 94 (34.2%) |
| Office & Administration | 99 (48.8%) | 104 (51.2%) |
| Total (Category) | 280 (58.6%) | 198 (41.4%) |
| Total (Overall) | 837 (50.4%) | 823 (49.6%) |
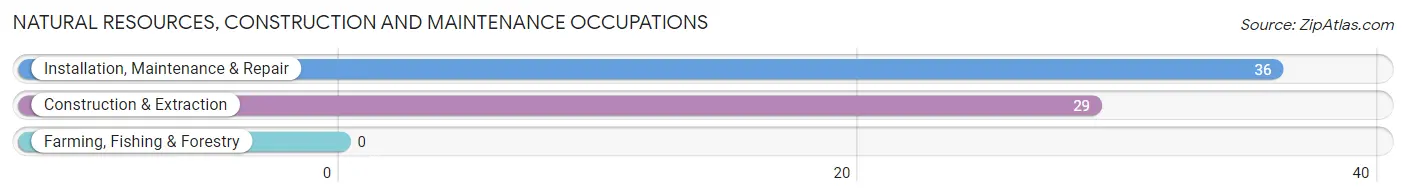
Natural Resources, Construction and Maintenance Occupations
The most common Natural Resources, Construction and Maintenance occupations in Park Hills are Installation, Maintenance & Repair (36 | 2.2%), and Construction & Extraction (29 | 1.8%).
Natural Resources, Construction and Maintenance Occupations by Sex
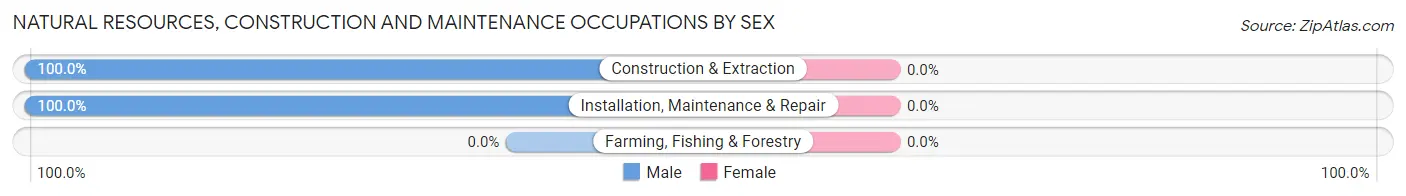
| Occupation | Male | Female |
| Farming, Fishing & Forestry | 0 (0.0%) | 0 (0.0%) |
| Construction & Extraction | 29 (100.0%) | 0 (0.0%) |
| Installation, Maintenance & Repair | 36 (100.0%) | 0 (0.0%) |
| Total (Category) | 65 (100.0%) | 0 (0.0%) |
| Total (Overall) | 837 (50.4%) | 823 (49.6%) |
Production, Transportation and Moving Occupations
The most common Production, Transportation and Moving occupations in Park Hills are Production (101 | 6.1%), and Material Moving (39 | 2.4%).
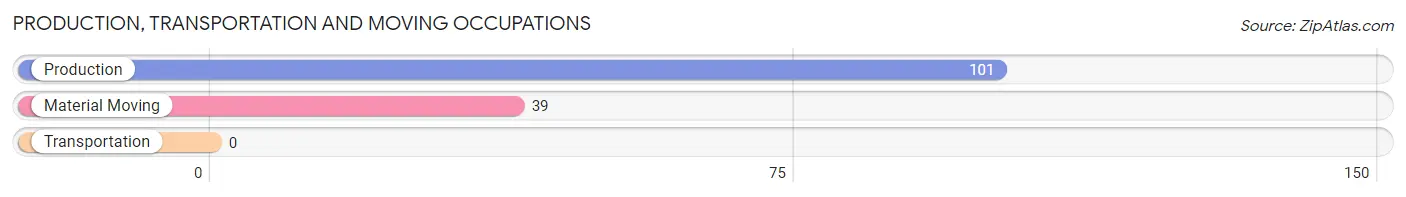
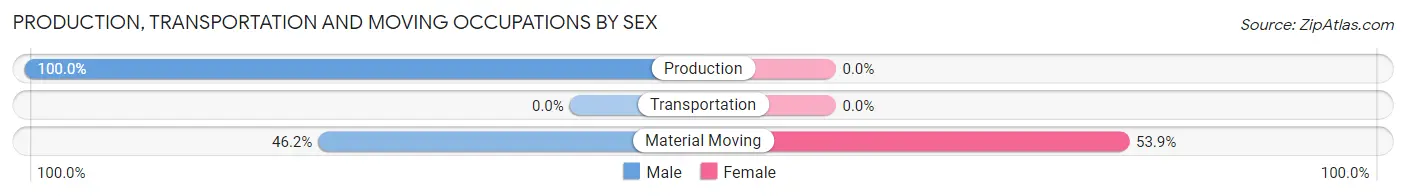
Production, Transportation and Moving Occupations by Sex
| Occupation | Male | Female |
| Production | 101 (100.0%) | 0 (0.0%) |
| Transportation | 0 (0.0%) | 0 (0.0%) |
| Material Moving | 18 (46.2%) | 21 (53.8%) |
| Total (Category) | 119 (85.0%) | 21 (15.0%) |
| Total (Overall) | 837 (50.4%) | 823 (49.6%) |
Employment Industries by Sex in Park Hills
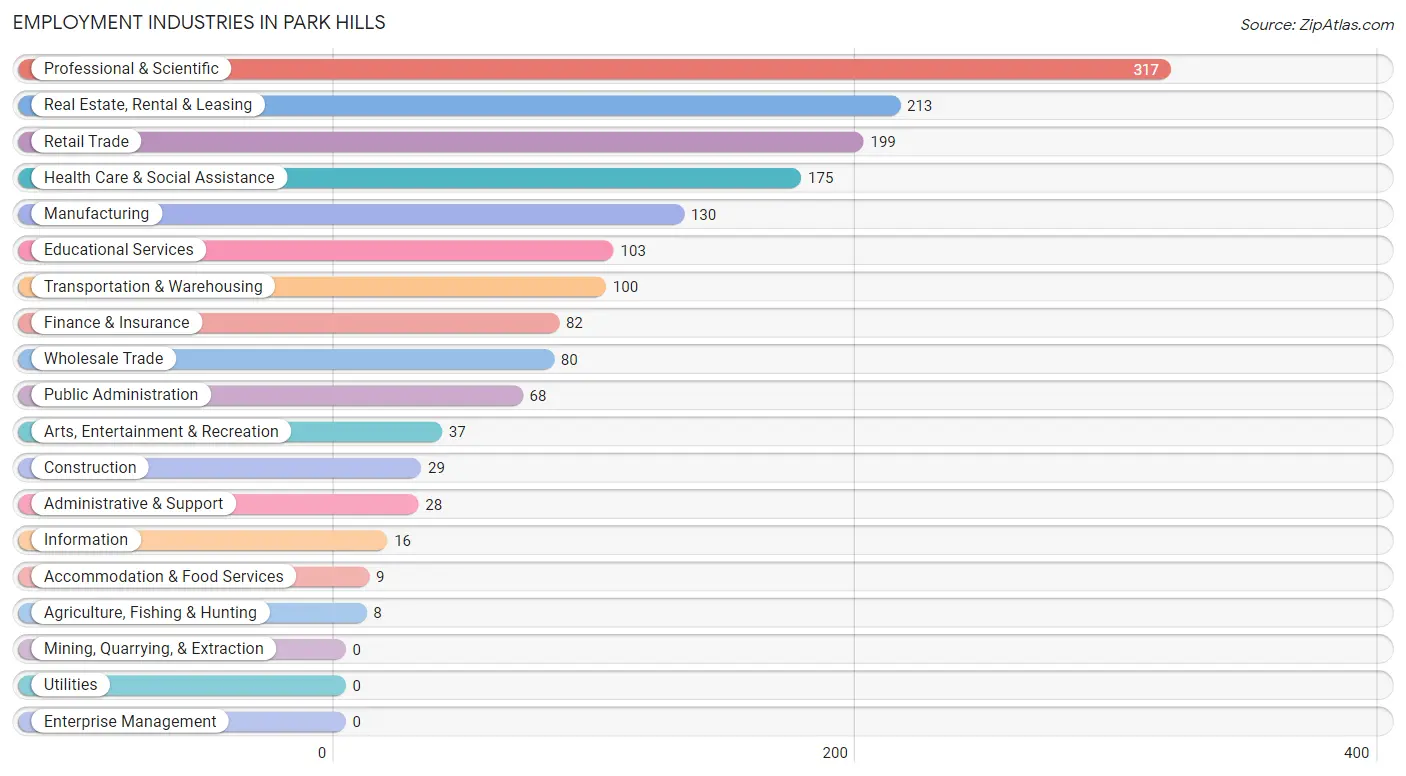
Employment Industries in Park Hills
The major employment industries in Park Hills include Professional & Scientific (317 | 19.1%), Real Estate, Rental & Leasing (213 | 12.8%), Retail Trade (199 | 12.0%), Health Care & Social Assistance (175 | 10.5%), and Manufacturing (130 | 7.8%).
Employment Industries by Sex in Park Hills
The Park Hills industries that see more men than women are Construction (100.0%), Wholesale Trade (87.5%), and Real Estate, Rental & Leasing (78.9%), whereas the industries that tend to have a higher number of women are Agriculture, Fishing & Hunting (100.0%), Administrative & Support (100.0%), and Accommodation & Food Services (100.0%).
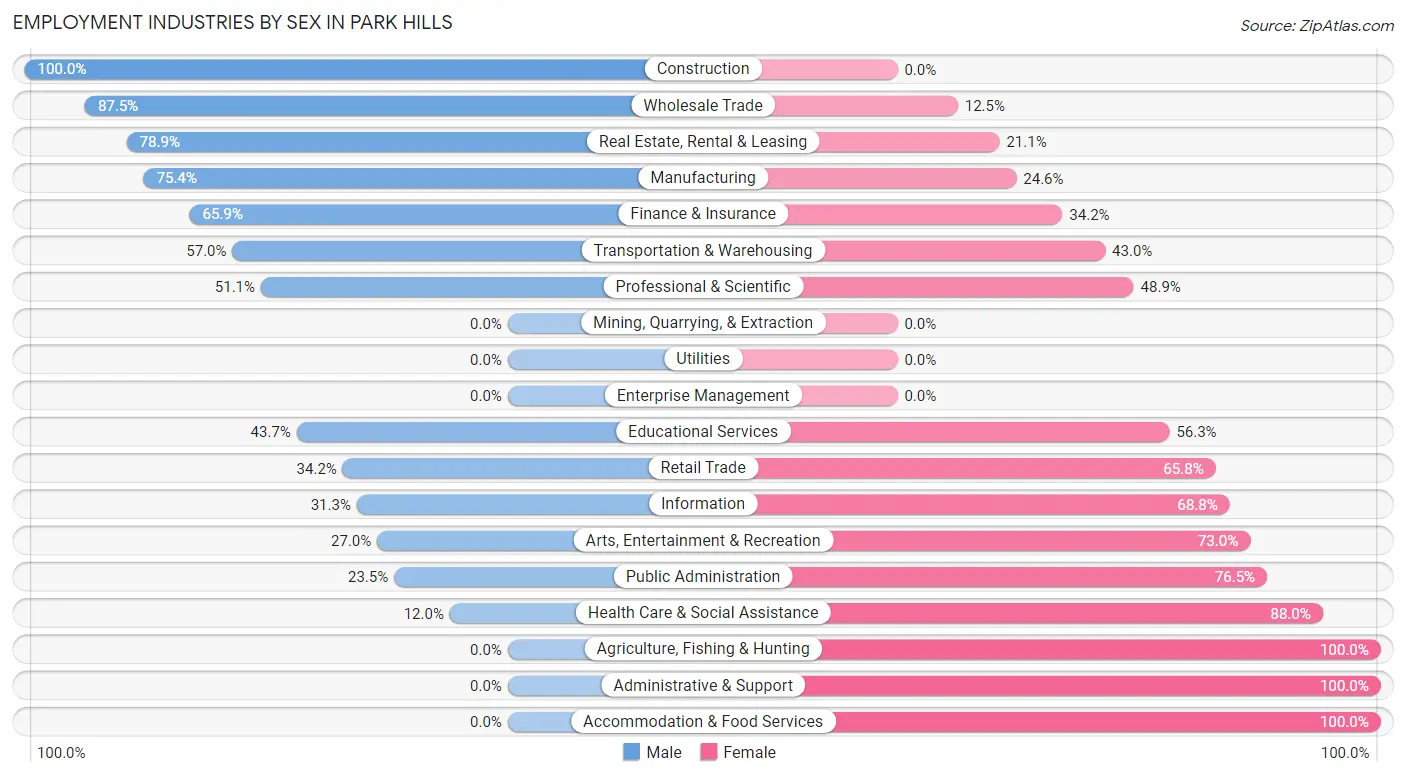
| Industry | Male | Female |
| Agriculture, Fishing & Hunting | 0 (0.0%) | 8 (100.0%) |
| Mining, Quarrying, & Extraction | 0 (0.0%) | 0 (0.0%) |
| Construction | 29 (100.0%) | 0 (0.0%) |
| Manufacturing | 98 (75.4%) | 32 (24.6%) |
| Wholesale Trade | 70 (87.5%) | 10 (12.5%) |
| Retail Trade | 68 (34.2%) | 131 (65.8%) |
| Transportation & Warehousing | 57 (57.0%) | 43 (43.0%) |
| Utilities | 0 (0.0%) | 0 (0.0%) |
| Information | 5 (31.2%) | 11 (68.8%) |
| Finance & Insurance | 54 (65.8%) | 28 (34.2%) |
| Real Estate, Rental & Leasing | 168 (78.9%) | 45 (21.1%) |
| Professional & Scientific | 162 (51.1%) | 155 (48.9%) |
| Enterprise Management | 0 (0.0%) | 0 (0.0%) |
| Administrative & Support | 0 (0.0%) | 28 (100.0%) |
| Educational Services | 45 (43.7%) | 58 (56.3%) |
| Health Care & Social Assistance | 21 (12.0%) | 154 (88.0%) |
| Arts, Entertainment & Recreation | 10 (27.0%) | 27 (73.0%) |
| Accommodation & Food Services | 0 (0.0%) | 9 (100.0%) |
| Public Administration | 16 (23.5%) | 52 (76.5%) |
| Total | 837 (50.4%) | 823 (49.6%) |
Education in Park Hills
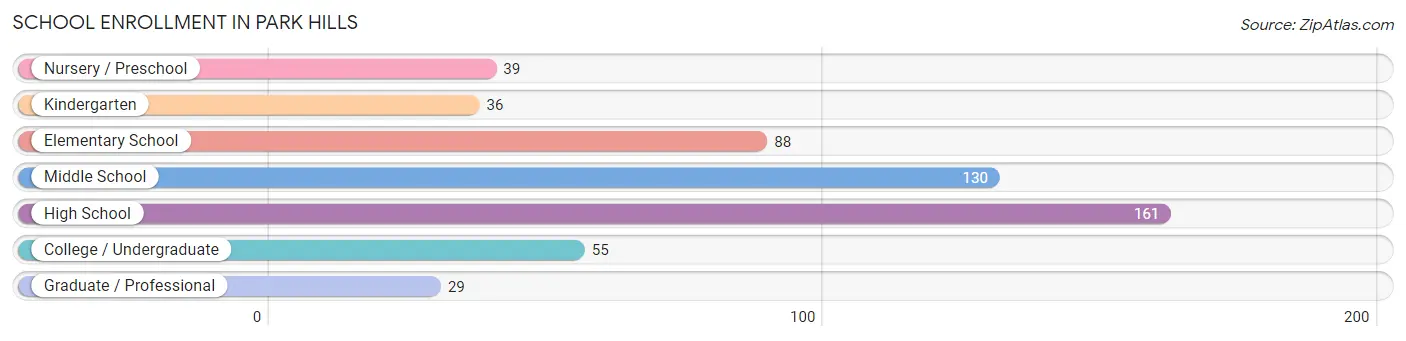
School Enrollment in Park Hills
The most common levels of schooling among the 538 students in Park Hills are high school (161 | 29.9%), middle school (130 | 24.2%), and elementary school (88 | 16.4%).
| School Level | # Students | % Students |
| Nursery / Preschool | 39 | 7.2% |
| Kindergarten | 36 | 6.7% |
| Elementary School | 88 | 16.4% |
| Middle School | 130 | 24.2% |
| High School | 161 | 29.9% |
| College / Undergraduate | 55 | 10.2% |
| Graduate / Professional | 29 | 5.4% |
| Total | 538 | 100.0% |
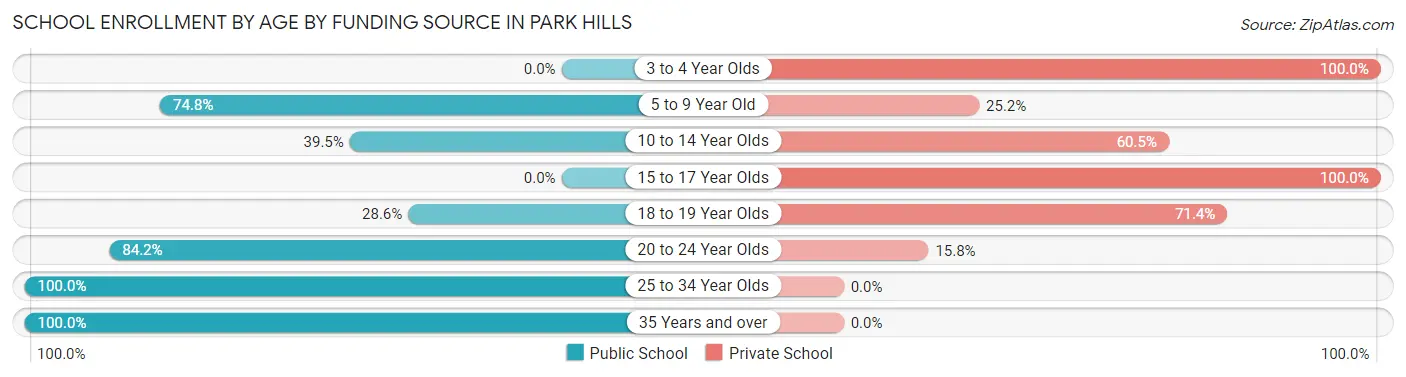
School Enrollment by Age by Funding Source in Park Hills
Out of a total of 538 students who are enrolled in schools in Park Hills, 296 (55.0%) attend a private institution, while the remaining 242 (45.0%) are enrolled in public schools. The age group of 3 to 4 year olds has the highest likelihood of being enrolled in private schools, with 34 (100.0% in the age bracket) enrolled. Conversely, the age group of 25 to 34 year olds has the lowest likelihood of being enrolled in a private school, with 23 (100.0% in the age bracket) attending a public institution.
| Age Bracket | Public School | Private School |
| 3 to 4 Year Olds | 0 (0.0%) | 34 (100.0%) |
| 5 to 9 Year Old | 80 (74.8%) | 27 (25.2%) |
| 10 to 14 Year Olds | 73 (39.5%) | 112 (60.5%) |
| 15 to 17 Year Olds | 0 (0.0%) | 79 (100.0%) |
| 18 to 19 Year Olds | 14 (28.6%) | 35 (71.4%) |
| 20 to 24 Year Olds | 48 (84.2%) | 9 (15.8%) |
| 25 to 34 Year Olds | 23 (100.0%) | 0 (0.0%) |
| 35 Years and over | 4 (100.0%) | 0 (0.0%) |
| Total | 242 (45.0%) | 296 (55.0%) |
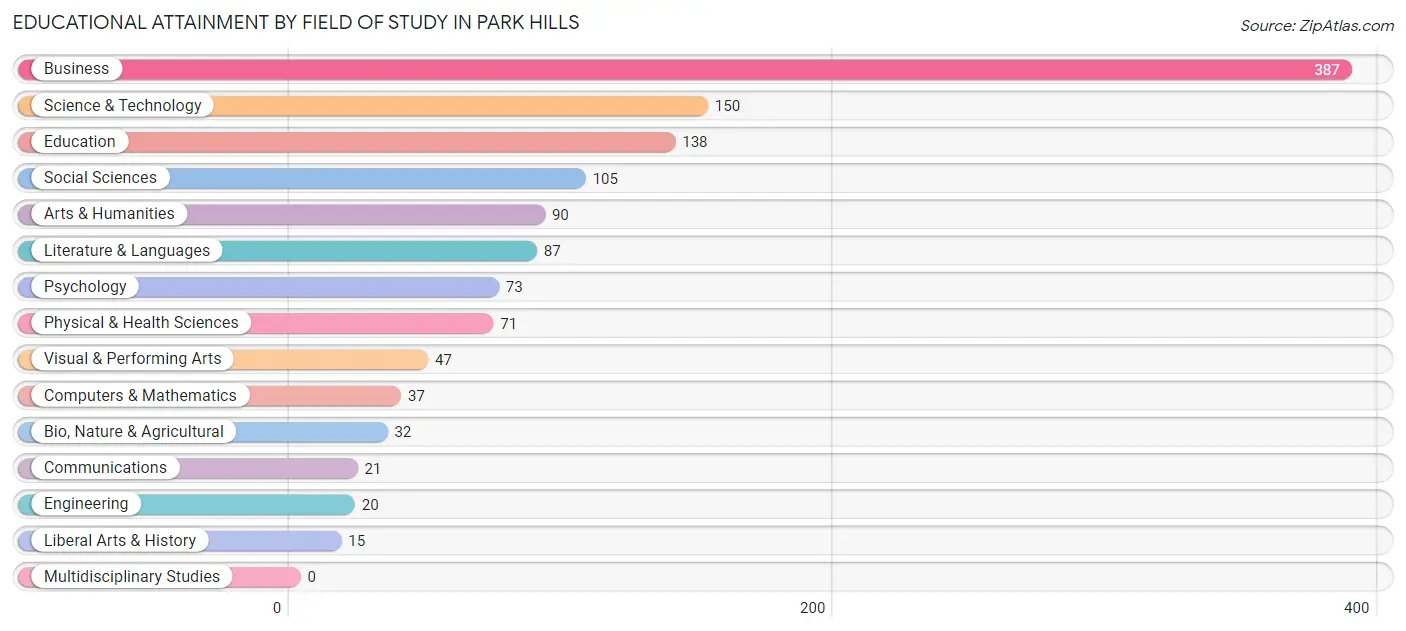
Educational Attainment by Field of Study in Park Hills
Business (387 | 30.4%), science & technology (150 | 11.8%), education (138 | 10.8%), social sciences (105 | 8.3%), and arts & humanities (90 | 7.1%) are the most common fields of study among 1,273 individuals in Park Hills who have obtained a bachelor's degree or higher.
| Field of Study | # Graduates | % Graduates |
| Computers & Mathematics | 37 | 2.9% |
| Bio, Nature & Agricultural | 32 | 2.5% |
| Physical & Health Sciences | 71 | 5.6% |
| Psychology | 73 | 5.7% |
| Social Sciences | 105 | 8.3% |
| Engineering | 20 | 1.6% |
| Multidisciplinary Studies | 0 | 0.0% |
| Science & Technology | 150 | 11.8% |
| Business | 387 | 30.4% |
| Education | 138 | 10.8% |
| Literature & Languages | 87 | 6.8% |
| Liberal Arts & History | 15 | 1.2% |
| Visual & Performing Arts | 47 | 3.7% |
| Communications | 21 | 1.7% |
| Arts & Humanities | 90 | 7.1% |
| Total | 1,273 | 100.0% |
Transportation & Commute in Park Hills
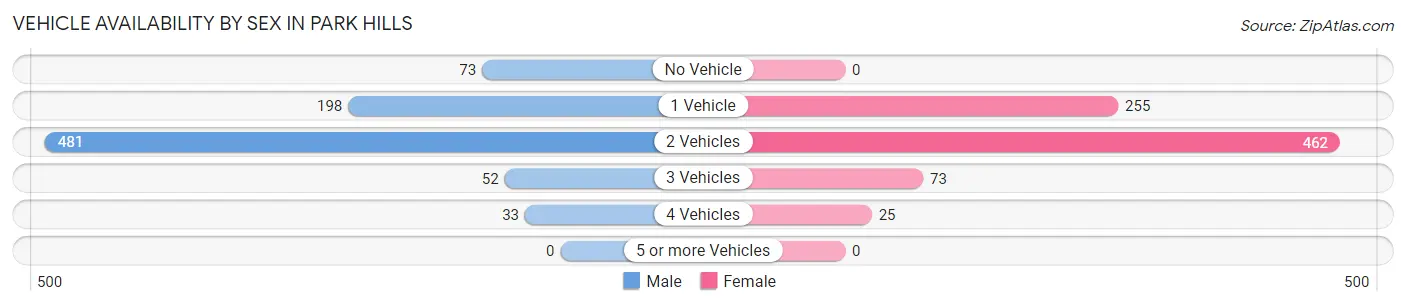
Vehicle Availability by Sex in Park Hills
The most prevalent vehicle ownership categories in Park Hills are males with 2 vehicles (481, accounting for 57.5%) and females with 2 vehicles (462, making up 59.0%).
| Vehicles Available | Male | Female |
| No Vehicle | 73 (8.7%) | 0 (0.0%) |
| 1 Vehicle | 198 (23.7%) | 255 (31.3%) |
| 2 Vehicles | 481 (57.5%) | 462 (56.7%) |
| 3 Vehicles | 52 (6.2%) | 73 (9.0%) |
| 4 Vehicles | 33 (3.9%) | 25 (3.1%) |
| 5 or more Vehicles | 0 (0.0%) | 0 (0.0%) |
| Total | 837 (100.0%) | 815 (100.0%) |
Commute Time in Park Hills
The most frequently occuring commute durations in Park Hills are 10 to 14 minutes (391 commuters, 30.6%), 15 to 19 minutes (349 commuters, 27.4%), and 20 to 24 minutes (190 commuters, 14.9%).
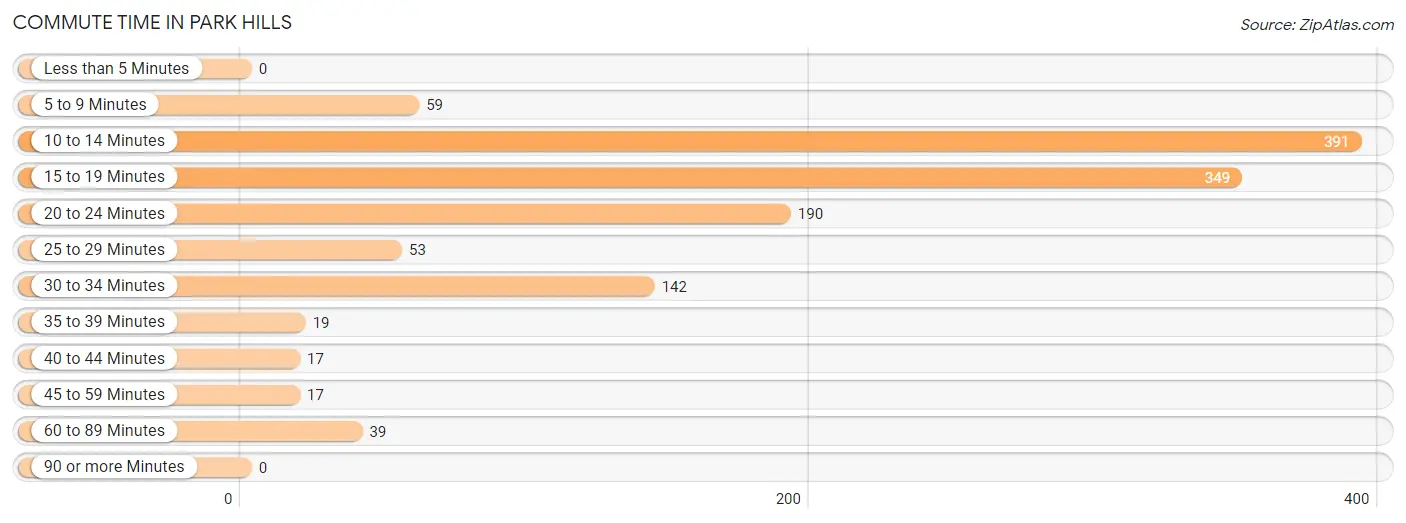
| Commute Time | # Commuters | % Commuters |
| Less than 5 Minutes | 0 | 0.0% |
| 5 to 9 Minutes | 59 | 4.6% |
| 10 to 14 Minutes | 391 | 30.6% |
| 15 to 19 Minutes | 349 | 27.4% |
| 20 to 24 Minutes | 190 | 14.9% |
| 25 to 29 Minutes | 53 | 4.2% |
| 30 to 34 Minutes | 142 | 11.1% |
| 35 to 39 Minutes | 19 | 1.5% |
| 40 to 44 Minutes | 17 | 1.3% |
| 45 to 59 Minutes | 17 | 1.3% |
| 60 to 89 Minutes | 39 | 3.1% |
| 90 or more Minutes | 0 | 0.0% |
Commute Time by Sex in Park Hills
The most common commute times in Park Hills are 10 to 14 minutes (292 commuters, 47.9%) for males and 15 to 19 minutes (279 commuters, 41.9%) for females.
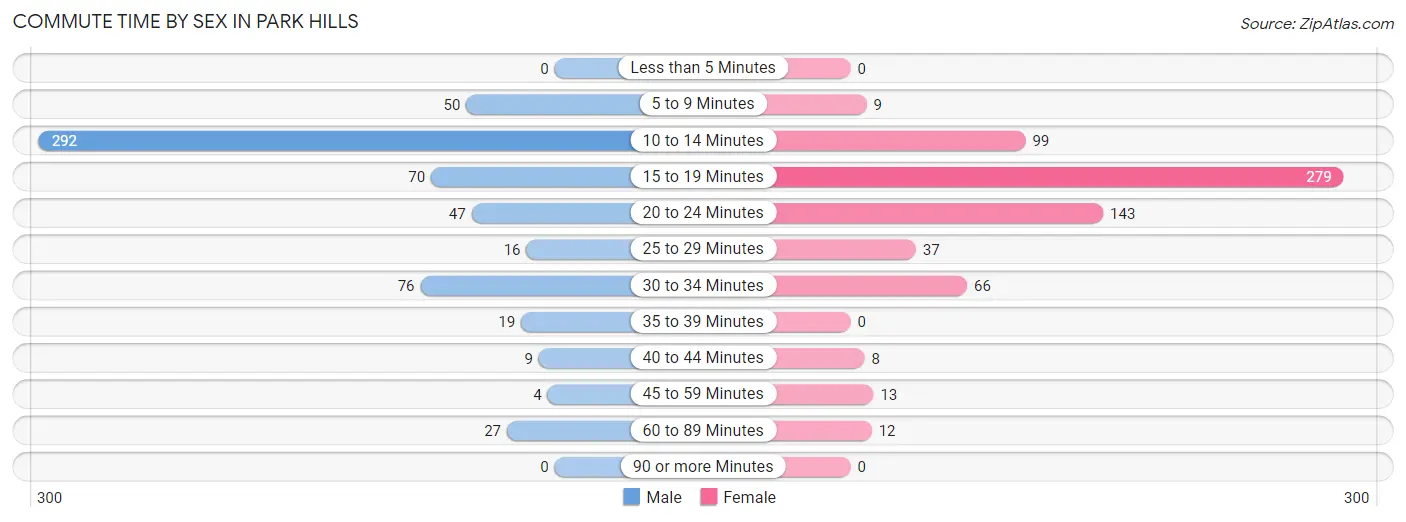
| Commute Time | Male | Female |
| Less than 5 Minutes | 0 (0.0%) | 0 (0.0%) |
| 5 to 9 Minutes | 50 (8.2%) | 9 (1.3%) |
| 10 to 14 Minutes | 292 (47.9%) | 99 (14.9%) |
| 15 to 19 Minutes | 70 (11.5%) | 279 (41.9%) |
| 20 to 24 Minutes | 47 (7.7%) | 143 (21.5%) |
| 25 to 29 Minutes | 16 (2.6%) | 37 (5.6%) |
| 30 to 34 Minutes | 76 (12.5%) | 66 (9.9%) |
| 35 to 39 Minutes | 19 (3.1%) | 0 (0.0%) |
| 40 to 44 Minutes | 9 (1.5%) | 8 (1.2%) |
| 45 to 59 Minutes | 4 (0.7%) | 13 (1.9%) |
| 60 to 89 Minutes | 27 (4.4%) | 12 (1.8%) |
| 90 or more Minutes | 0 (0.0%) | 0 (0.0%) |
Time of Departure to Work by Sex in Park Hills
The most frequent times of departure to work in Park Hills are 8:30 AM to 8:59 AM (213, 34.9%) for males and 7:30 AM to 7:59 AM (184, 27.6%) for females.
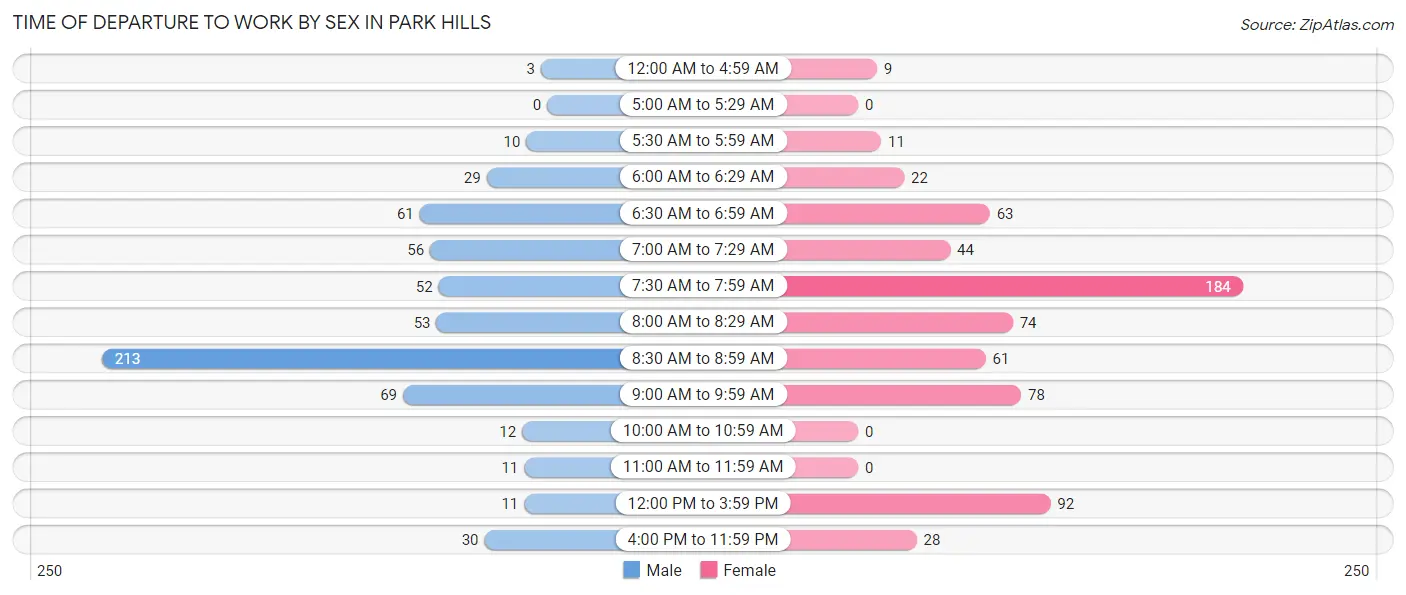
| Time of Departure | Male | Female |
| 12:00 AM to 4:59 AM | 3 (0.5%) | 9 (1.3%) |
| 5:00 AM to 5:29 AM | 0 (0.0%) | 0 (0.0%) |
| 5:30 AM to 5:59 AM | 10 (1.6%) | 11 (1.7%) |
| 6:00 AM to 6:29 AM | 29 (4.8%) | 22 (3.3%) |
| 6:30 AM to 6:59 AM | 61 (10.0%) | 63 (9.5%) |
| 7:00 AM to 7:29 AM | 56 (9.2%) | 44 (6.6%) |
| 7:30 AM to 7:59 AM | 52 (8.5%) | 184 (27.6%) |
| 8:00 AM to 8:29 AM | 53 (8.7%) | 74 (11.1%) |
| 8:30 AM to 8:59 AM | 213 (34.9%) | 61 (9.2%) |
| 9:00 AM to 9:59 AM | 69 (11.3%) | 78 (11.7%) |
| 10:00 AM to 10:59 AM | 12 (2.0%) | 0 (0.0%) |
| 11:00 AM to 11:59 AM | 11 (1.8%) | 0 (0.0%) |
| 12:00 PM to 3:59 PM | 11 (1.8%) | 92 (13.8%) |
| 4:00 PM to 11:59 PM | 30 (4.9%) | 28 (4.2%) |
| Total | 610 (100.0%) | 666 (100.0%) |
Housing Occupancy in Park Hills
Occupancy by Ownership in Park Hills
Of the total 1,324 dwellings in Park Hills, owner-occupied units account for 844 (63.7%), while renter-occupied units make up 480 (36.2%).
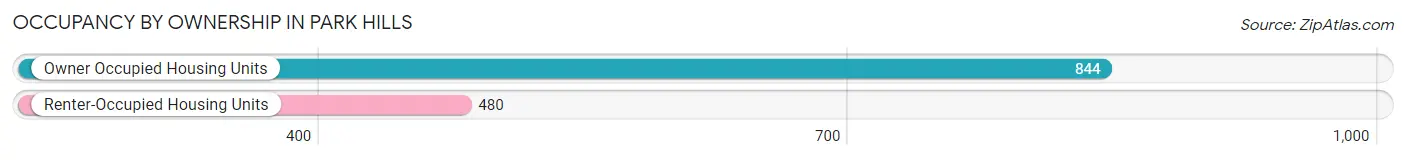
| Occupancy | # Housing Units | % Housing Units |
| Owner Occupied Housing Units | 844 | 63.7% |
| Renter-Occupied Housing Units | 480 | 36.2% |
| Total Occupied Housing Units | 1,324 | 100.0% |
Occupancy by Household Size in Park Hills
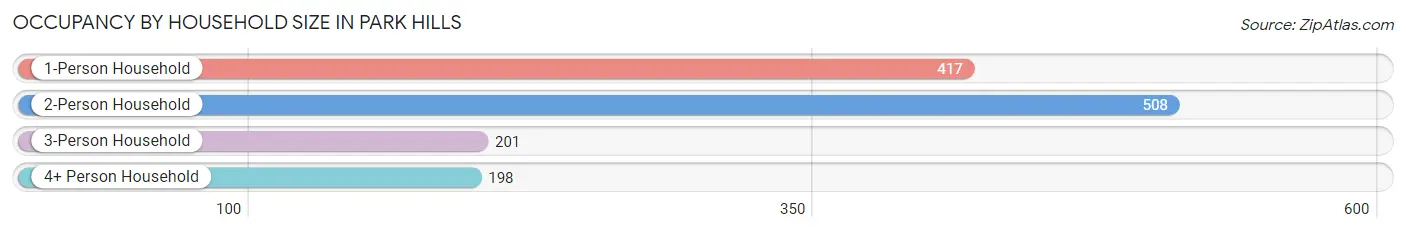
| Household Size | # Housing Units | % Housing Units |
| 1-Person Household | 417 | 31.5% |
| 2-Person Household | 508 | 38.4% |
| 3-Person Household | 201 | 15.2% |
| 4+ Person Household | 198 | 14.9% |
| Total Housing Units | 1,324 | 100.0% |
Occupancy by Ownership by Household Size in Park Hills
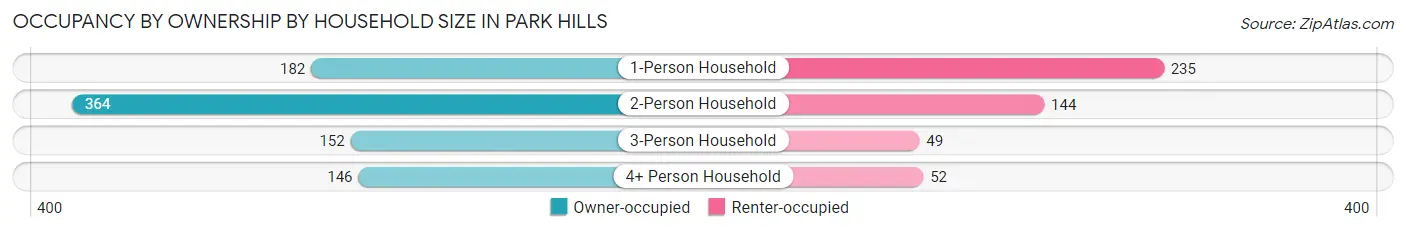
| Household Size | Owner-occupied | Renter-occupied |
| 1-Person Household | 182 (43.6%) | 235 (56.4%) |
| 2-Person Household | 364 (71.7%) | 144 (28.3%) |
| 3-Person Household | 152 (75.6%) | 49 (24.4%) |
| 4+ Person Household | 146 (73.7%) | 52 (26.3%) |
| Total Housing Units | 844 (63.7%) | 480 (36.2%) |
Occupancy by Educational Attainment in Park Hills
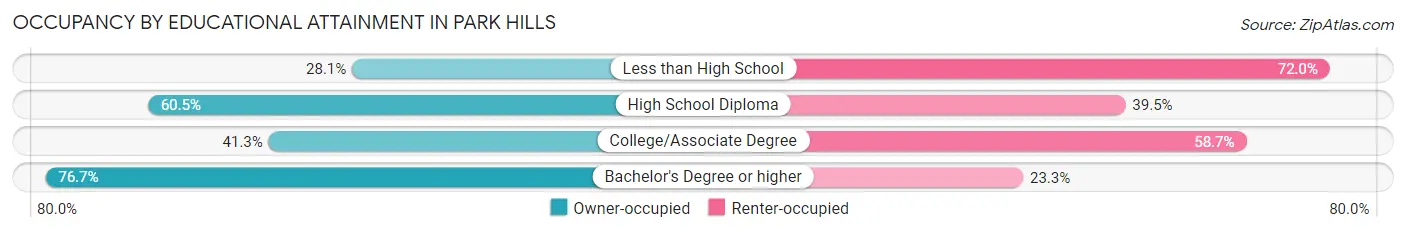
| Household Size | Owner-occupied | Renter-occupied |
| Less than High School | 23 (28.1%) | 59 (72.0%) |
| High School Diploma | 104 (60.5%) | 68 (39.5%) |
| College/Associate Degree | 121 (41.3%) | 172 (58.7%) |
| Bachelor's Degree or higher | 596 (76.7%) | 181 (23.3%) |
Occupancy by Age of Householder in Park Hills
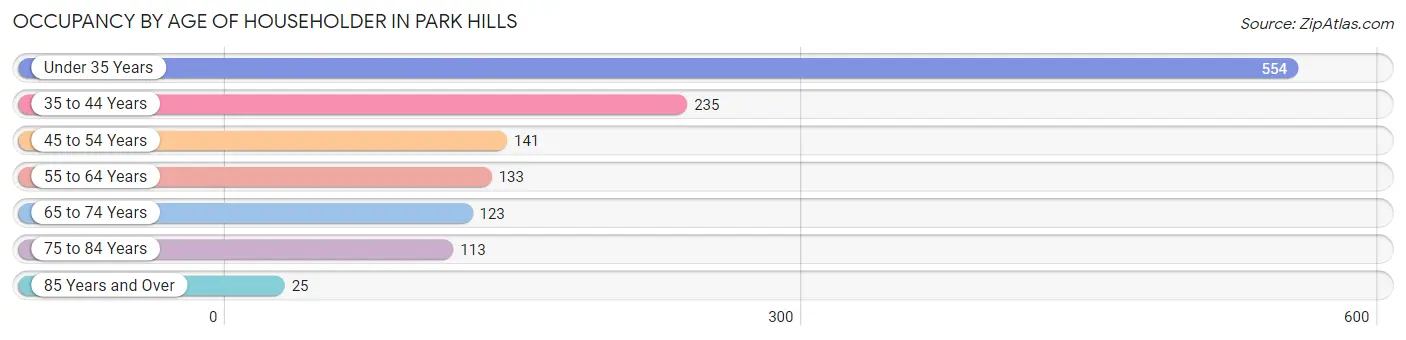
| Age Bracket | # Households | % Households |
| Under 35 Years | 554 | 41.8% |
| 35 to 44 Years | 235 | 17.7% |
| 45 to 54 Years | 141 | 10.6% |
| 55 to 64 Years | 133 | 10.1% |
| 65 to 74 Years | 123 | 9.3% |
| 75 to 84 Years | 113 | 8.5% |
| 85 Years and Over | 25 | 1.9% |
| Total | 1,324 | 100.0% |
Housing Finances in Park Hills
Median Income by Occupancy in Park Hills
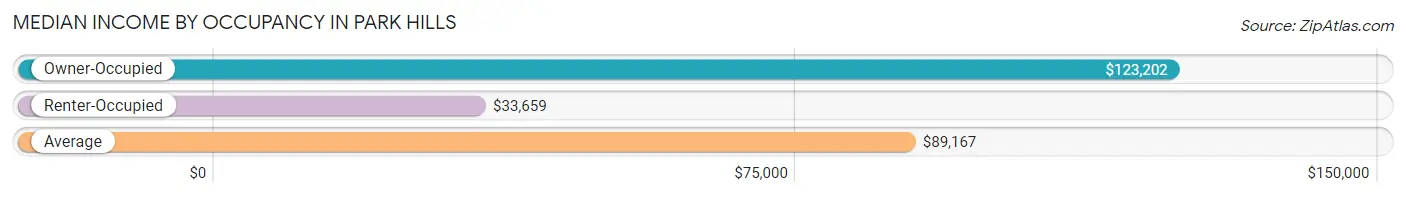
| Occupancy Type | # Households | Median Income |
| Owner-Occupied | 844 (63.7%) | $123,202 |
| Renter-Occupied | 480 (36.2%) | $33,659 |
| Average | 1,324 (100.0%) | $89,167 |
Occupancy by Householder Income Bracket in Park Hills
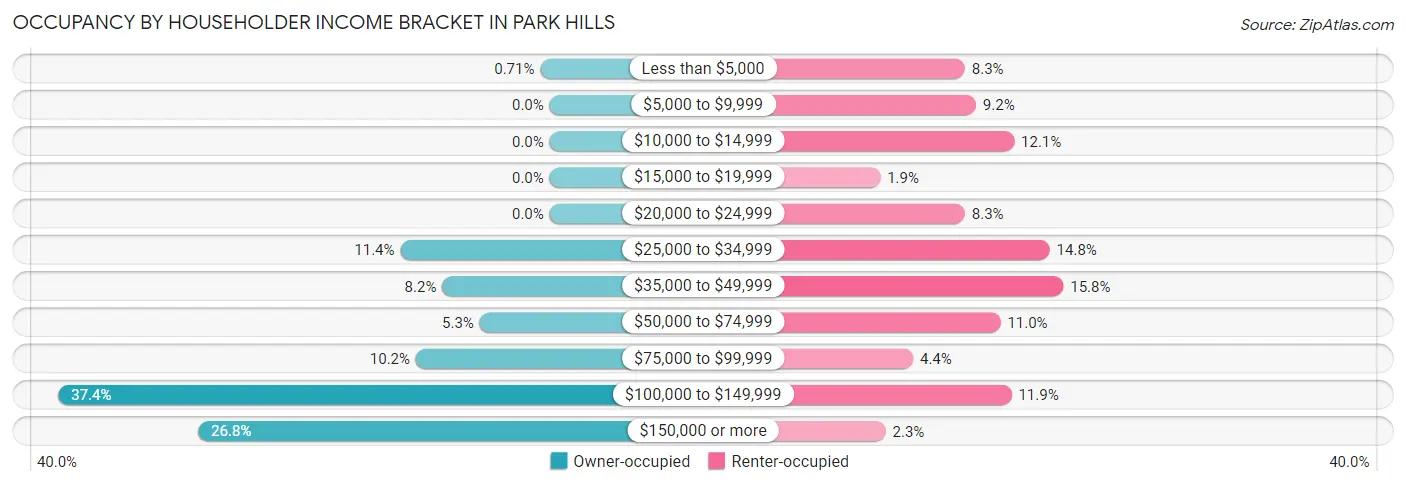
| Income Bracket | Owner-occupied | Renter-occupied |
| Less than $5,000 | 6 (0.7%) | 40 (8.3%) |
| $5,000 to $9,999 | 0 (0.0%) | 44 (9.2%) |
| $10,000 to $14,999 | 0 (0.0%) | 58 (12.1%) |
| $15,000 to $19,999 | 0 (0.0%) | 9 (1.9%) |
| $20,000 to $24,999 | 0 (0.0%) | 40 (8.3%) |
| $25,000 to $34,999 | 96 (11.4%) | 71 (14.8%) |
| $35,000 to $49,999 | 69 (8.2%) | 76 (15.8%) |
| $50,000 to $74,999 | 45 (5.3%) | 53 (11.0%) |
| $75,000 to $99,999 | 86 (10.2%) | 21 (4.4%) |
| $100,000 to $149,999 | 316 (37.4%) | 57 (11.9%) |
| $150,000 or more | 226 (26.8%) | 11 (2.3%) |
| Total | 844 (100.0%) | 480 (100.0%) |
Monthly Housing Cost Tiers in Park Hills
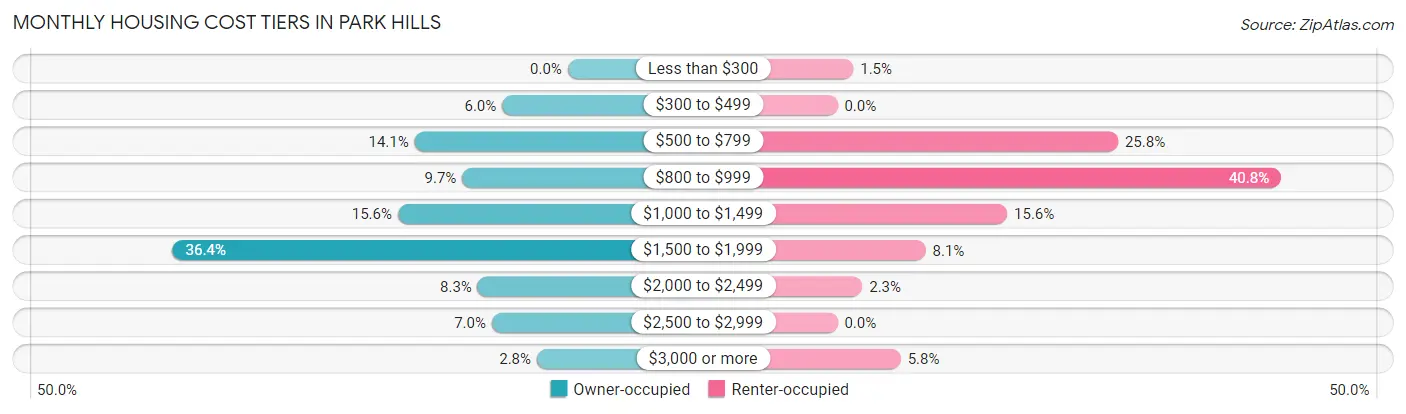
| Monthly Cost | Owner-occupied | Renter-occupied |
| Less than $300 | 0 (0.0%) | 7 (1.5%) |
| $300 to $499 | 51 (6.0%) | 0 (0.0%) |
| $500 to $799 | 119 (14.1%) | 124 (25.8%) |
| $800 to $999 | 82 (9.7%) | 196 (40.8%) |
| $1,000 to $1,499 | 132 (15.6%) | 75 (15.6%) |
| $1,500 to $1,999 | 307 (36.4%) | 39 (8.1%) |
| $2,000 to $2,499 | 70 (8.3%) | 11 (2.3%) |
| $2,500 to $2,999 | 59 (7.0%) | 0 (0.0%) |
| $3,000 or more | 24 (2.8%) | 28 (5.8%) |
| Total | 844 (100.0%) | 480 (100.0%) |
Physical Housing Characteristics in Park Hills
Housing Structures in Park Hills
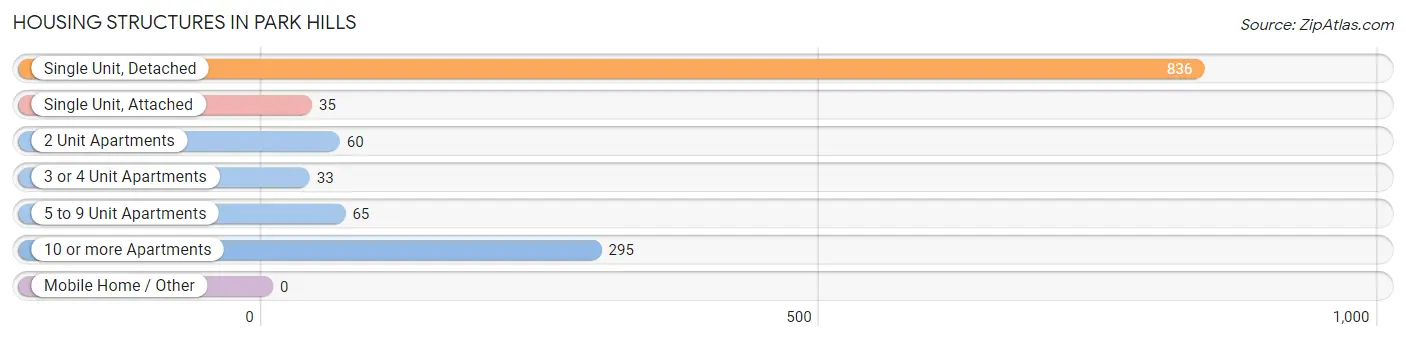
| Structure Type | # Housing Units | % Housing Units |
| Single Unit, Detached | 836 | 63.1% |
| Single Unit, Attached | 35 | 2.6% |
| 2 Unit Apartments | 60 | 4.5% |
| 3 or 4 Unit Apartments | 33 | 2.5% |
| 5 to 9 Unit Apartments | 65 | 4.9% |
| 10 or more Apartments | 295 | 22.3% |
| Mobile Home / Other | 0 | 0.0% |
| Total | 1,324 | 100.0% |
Housing Structures by Occupancy in Park Hills
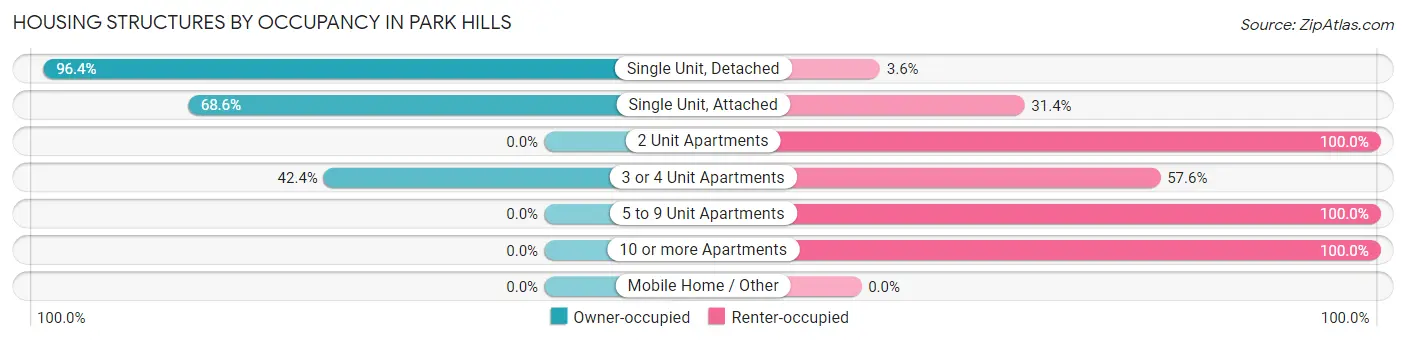
| Structure Type | Owner-occupied | Renter-occupied |
| Single Unit, Detached | 806 (96.4%) | 30 (3.6%) |
| Single Unit, Attached | 24 (68.6%) | 11 (31.4%) |
| 2 Unit Apartments | 0 (0.0%) | 60 (100.0%) |
| 3 or 4 Unit Apartments | 14 (42.4%) | 19 (57.6%) |
| 5 to 9 Unit Apartments | 0 (0.0%) | 65 (100.0%) |
| 10 or more Apartments | 0 (0.0%) | 295 (100.0%) |
| Mobile Home / Other | 0 (0.0%) | 0 (0.0%) |
| Total | 844 (63.7%) | 480 (36.2%) |
Housing Structures by Number of Rooms in Park Hills
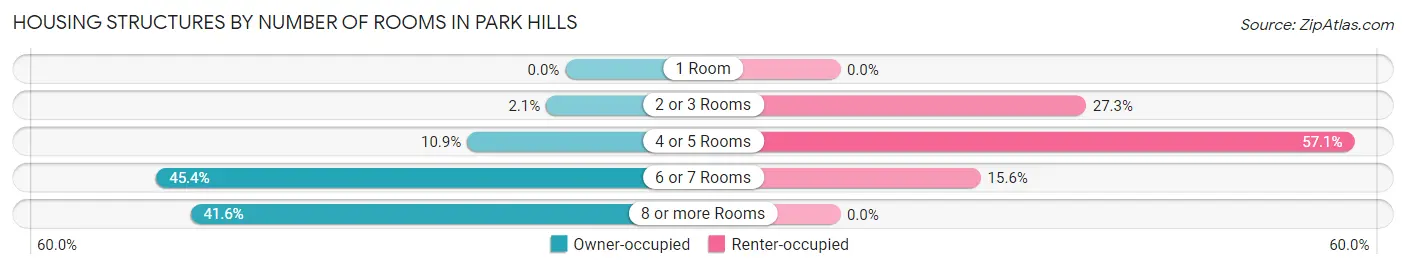
| Number of Rooms | Owner-occupied | Renter-occupied |
| 1 Room | 0 (0.0%) | 0 (0.0%) |
| 2 or 3 Rooms | 18 (2.1%) | 131 (27.3%) |
| 4 or 5 Rooms | 92 (10.9%) | 274 (57.1%) |
| 6 or 7 Rooms | 383 (45.4%) | 75 (15.6%) |
| 8 or more Rooms | 351 (41.6%) | 0 (0.0%) |
| Total | 844 (100.0%) | 480 (100.0%) |
Housing Structure by Heating Type in Park Hills
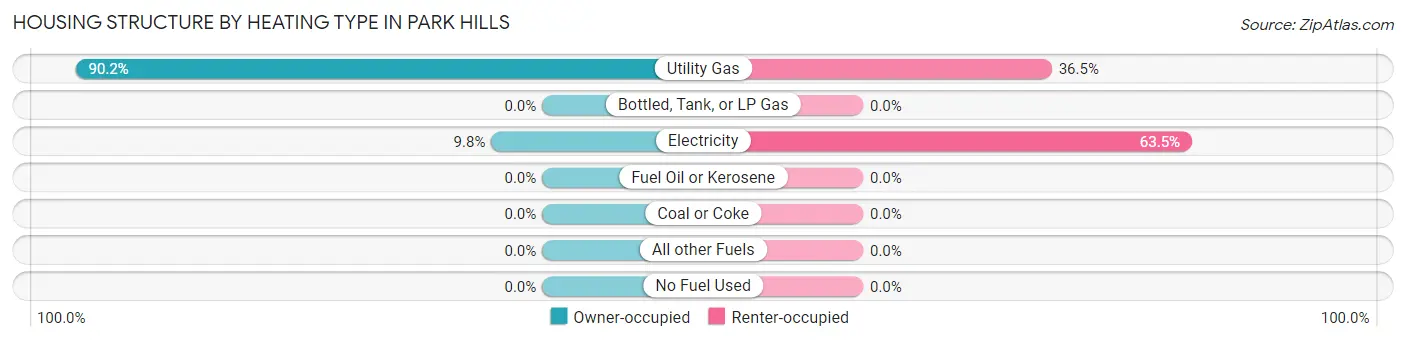
| Heating Type | Owner-occupied | Renter-occupied |
| Utility Gas | 761 (90.2%) | 175 (36.5%) |
| Bottled, Tank, or LP Gas | 0 (0.0%) | 0 (0.0%) |
| Electricity | 83 (9.8%) | 305 (63.5%) |
| Fuel Oil or Kerosene | 0 (0.0%) | 0 (0.0%) |
| Coal or Coke | 0 (0.0%) | 0 (0.0%) |
| All other Fuels | 0 (0.0%) | 0 (0.0%) |
| No Fuel Used | 0 (0.0%) | 0 (0.0%) |
| Total | 844 (100.0%) | 480 (100.0%) |
Household Vehicle Usage in Park Hills
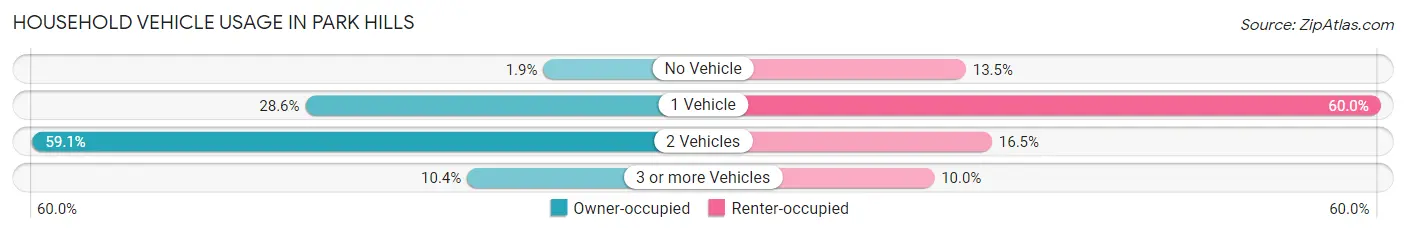
| Vehicles per Household | Owner-occupied | Renter-occupied |
| No Vehicle | 16 (1.9%) | 65 (13.5%) |
| 1 Vehicle | 241 (28.5%) | 288 (60.0%) |
| 2 Vehicles | 499 (59.1%) | 79 (16.5%) |
| 3 or more Vehicles | 88 (10.4%) | 48 (10.0%) |
| Total | 844 (100.0%) | 480 (100.0%) |
Real Estate & Mortgages in Park Hills
Real Estate and Mortgage Overview in Park Hills
| Characteristic | Without Mortgage | With Mortgage |
| Housing Units | 204 | 640 |
| Median Property Value | $261,100 | $251,000 |
| Median Household Income | - | - |
| Monthly Housing Costs | $643 | $24 |
| Real Estate Taxes | $2,111 | $0 |
Property Value by Mortgage Status in Park Hills
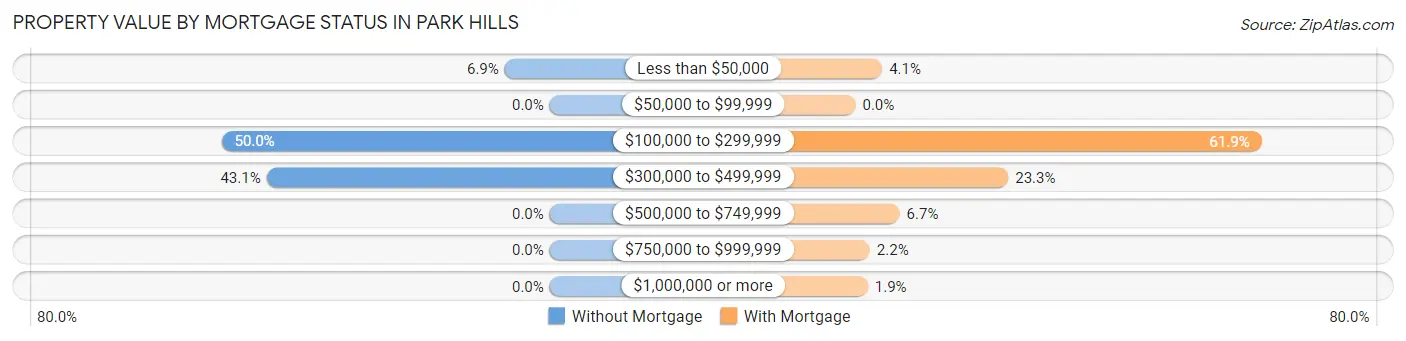
| Property Value | Without Mortgage | With Mortgage |
| Less than $50,000 | 14 (6.9%) | 26 (4.1%) |
| $50,000 to $99,999 | 0 (0.0%) | 0 (0.0%) |
| $100,000 to $299,999 | 102 (50.0%) | 396 (61.9%) |
| $300,000 to $499,999 | 88 (43.1%) | 149 (23.3%) |
| $500,000 to $749,999 | 0 (0.0%) | 43 (6.7%) |
| $750,000 to $999,999 | 0 (0.0%) | 14 (2.2%) |
| $1,000,000 or more | 0 (0.0%) | 12 (1.9%) |
| Total | 204 (100.0%) | 640 (100.0%) |
Household Income by Mortgage Status in Park Hills
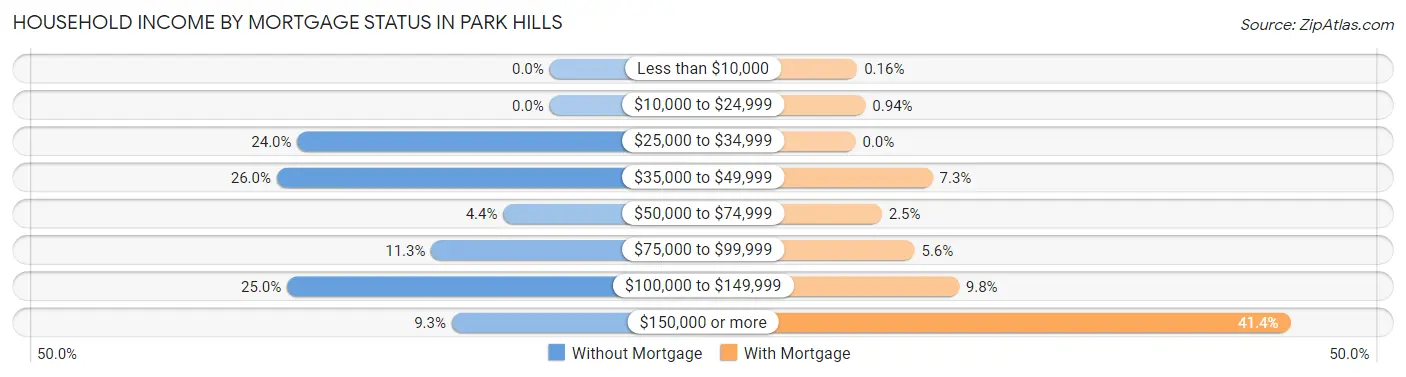
| Household Income | Without Mortgage | With Mortgage |
| Less than $10,000 | 0 (0.0%) | 1 (0.2%) |
| $10,000 to $24,999 | 0 (0.0%) | 6 (0.9%) |
| $25,000 to $34,999 | 49 (24.0%) | 0 (0.0%) |
| $35,000 to $49,999 | 53 (26.0%) | 47 (7.3%) |
| $50,000 to $74,999 | 9 (4.4%) | 16 (2.5%) |
| $75,000 to $99,999 | 23 (11.3%) | 36 (5.6%) |
| $100,000 to $149,999 | 51 (25.0%) | 63 (9.8%) |
| $150,000 or more | 19 (9.3%) | 265 (41.4%) |
| Total | 204 (100.0%) | 640 (100.0%) |
Property Value to Household Income Ratio in Park Hills
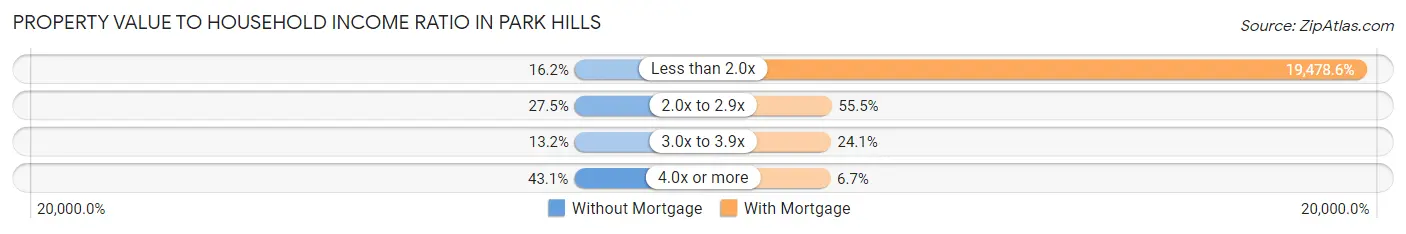
| Value-to-Income Ratio | Without Mortgage | With Mortgage |
| Less than 2.0x | 33 (16.2%) | 124,663 (19,478.6%) |
| 2.0x to 2.9x | 56 (27.5%) | 355 (55.5%) |
| 3.0x to 3.9x | 27 (13.2%) | 154 (24.1%) |
| 4.0x or more | 88 (43.1%) | 43 (6.7%) |
| Total | 204 (100.0%) | 640 (100.0%) |
Real Estate Taxes by Mortgage Status in Park Hills
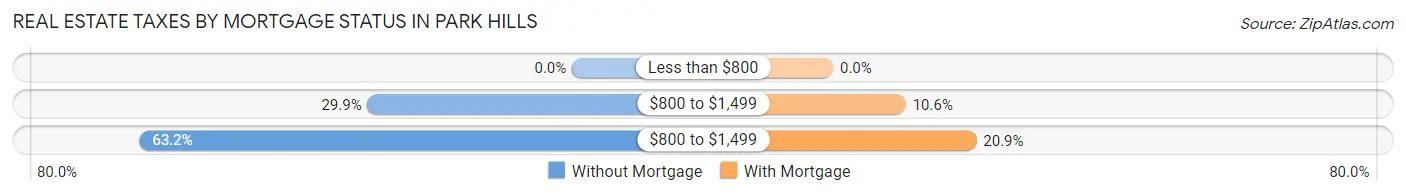
| Property Taxes | Without Mortgage | With Mortgage |
| Less than $800 | 0 (0.0%) | 0 (0.0%) |
| $800 to $1,499 | 61 (29.9%) | 68 (10.6%) |
| $800 to $1,499 | 129 (63.2%) | 134 (20.9%) |
| Total | 204 (100.0%) | 640 (100.0%) |
Health & Disability in Park Hills
Health Insurance Coverage by Age in Park Hills
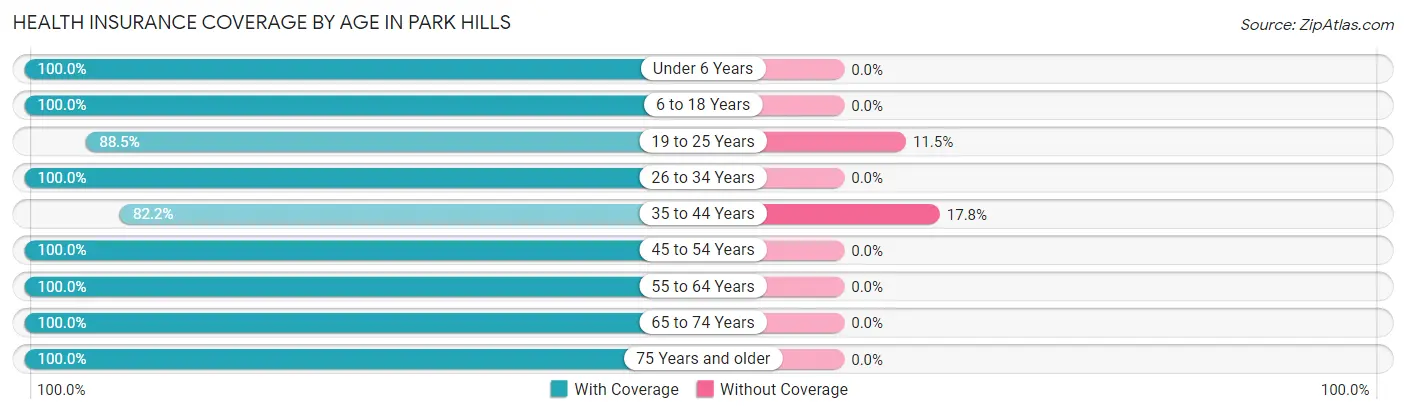
| Age Bracket | With Coverage | Without Coverage |
| Under 6 Years | 348 (100.0%) | 0 (0.0%) |
| 6 to 18 Years | 405 (100.0%) | 0 (0.0%) |
| 19 to 25 Years | 469 (88.5%) | 61 (11.5%) |
| 26 to 34 Years | 519 (100.0%) | 0 (0.0%) |
| 35 to 44 Years | 309 (82.2%) | 67 (17.8%) |
| 45 to 54 Years | 271 (100.0%) | 0 (0.0%) |
| 55 to 64 Years | 221 (100.0%) | 0 (0.0%) |
| 65 to 74 Years | 187 (100.0%) | 0 (0.0%) |
| 75 Years and older | 302 (100.0%) | 0 (0.0%) |
| Total | 3,031 (96.0%) | 128 (4.1%) |
Health Insurance Coverage by Citizenship Status in Park Hills
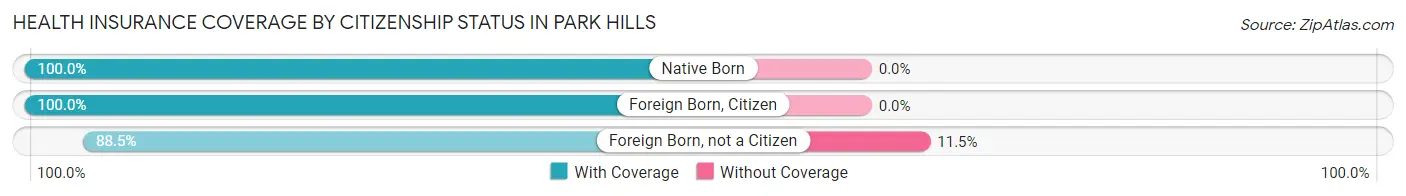
| Citizenship Status | With Coverage | Without Coverage |
| Native Born | 348 (100.0%) | 0 (0.0%) |
| Foreign Born, Citizen | 405 (100.0%) | 0 (0.0%) |
| Foreign Born, not a Citizen | 469 (88.5%) | 61 (11.5%) |
Health Insurance Coverage by Household Income in Park Hills
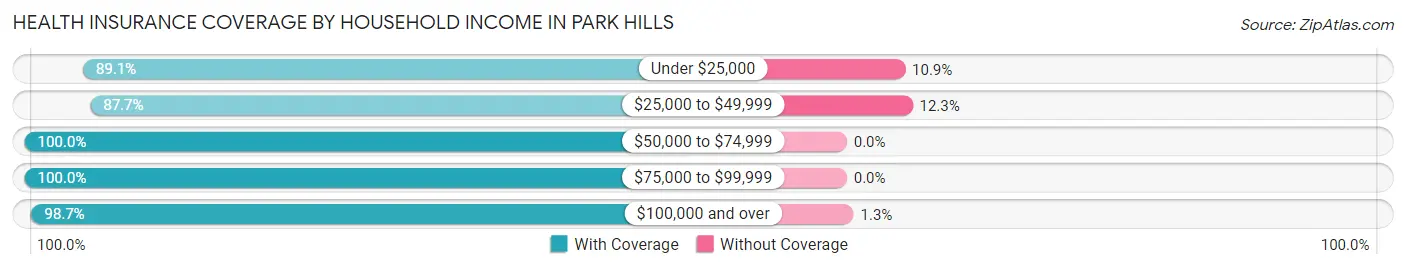
| Household Income | With Coverage | Without Coverage |
| Under $25,000 | 334 (89.1%) | 41 (10.9%) |
| $25,000 to $49,999 | 456 (87.7%) | 64 (12.3%) |
| $50,000 to $74,999 | 163 (100.0%) | 0 (0.0%) |
| $75,000 to $99,999 | 177 (100.0%) | 0 (0.0%) |
| $100,000 and over | 1,778 (98.7%) | 23 (1.3%) |
Public vs Private Health Insurance Coverage by Age in Park Hills
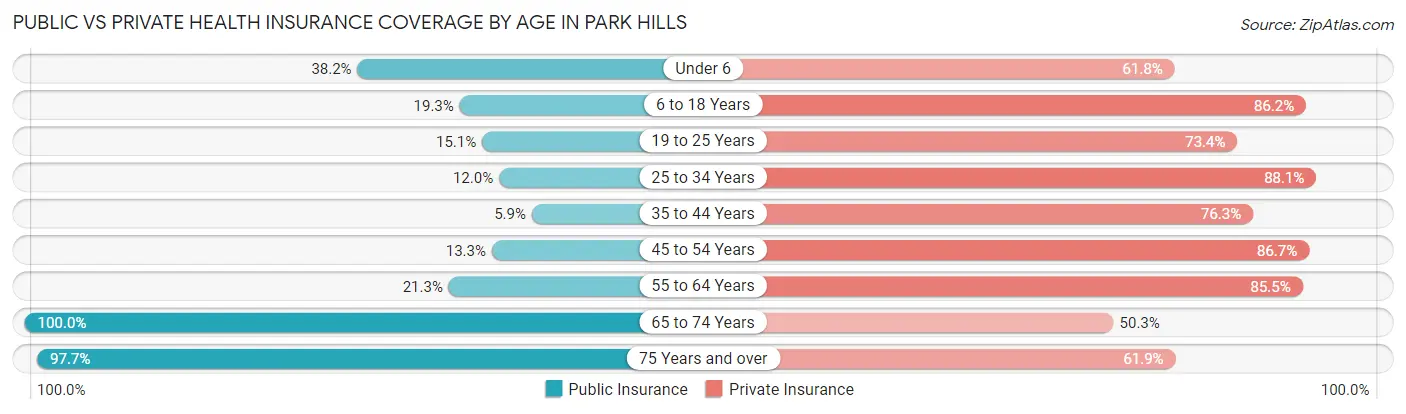
| Age Bracket | Public Insurance | Private Insurance |
| Under 6 | 133 (38.2%) | 215 (61.8%) |
| 6 to 18 Years | 78 (19.3%) | 349 (86.2%) |
| 19 to 25 Years | 80 (15.1%) | 389 (73.4%) |
| 25 to 34 Years | 62 (11.9%) | 457 (88.0%) |
| 35 to 44 Years | 22 (5.9%) | 287 (76.3%) |
| 45 to 54 Years | 36 (13.3%) | 235 (86.7%) |
| 55 to 64 Years | 47 (21.3%) | 189 (85.5%) |
| 65 to 74 Years | 187 (100.0%) | 94 (50.3%) |
| 75 Years and over | 295 (97.7%) | 187 (61.9%) |
| Total | 940 (29.8%) | 2,402 (76.0%) |
Disability Status by Sex by Age in Park Hills
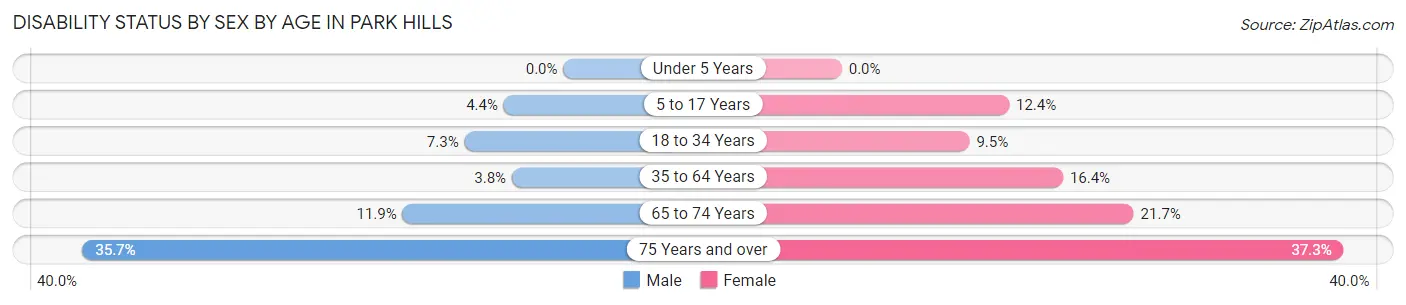
| Age Bracket | Male | Female |
| Under 5 Years | 0 (0.0%) | 0 (0.0%) |
| 5 to 17 Years | 5 (4.4%) | 37 (12.4%) |
| 18 to 34 Years | 45 (7.3%) | 46 (9.5%) |
| 35 to 64 Years | 15 (3.8%) | 78 (16.4%) |
| 65 to 74 Years | 8 (11.9%) | 26 (21.7%) |
| 75 Years and over | 35 (35.7%) | 76 (37.2%) |
Disability Class by Sex by Age in Park Hills
Disability Class: Hearing Difficulty
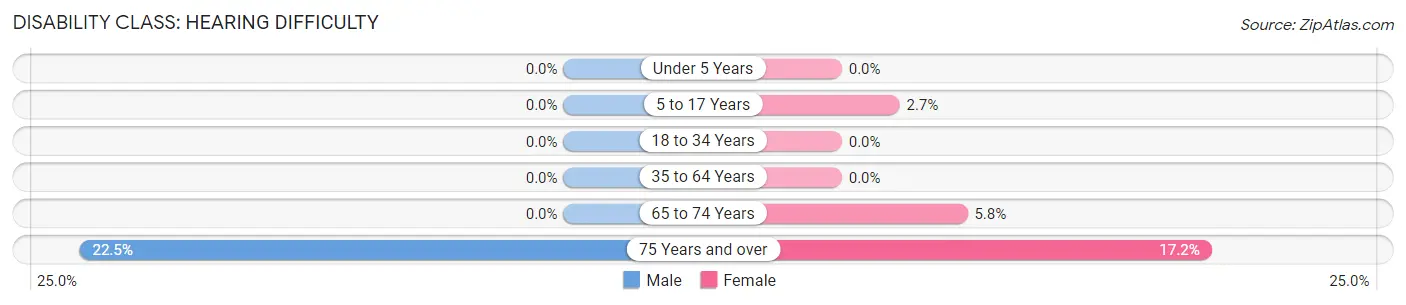
| Age Bracket | Male | Female |
| Under 5 Years | 0 (0.0%) | 0 (0.0%) |
| 5 to 17 Years | 0 (0.0%) | 8 (2.7%) |
| 18 to 34 Years | 0 (0.0%) | 0 (0.0%) |
| 35 to 64 Years | 0 (0.0%) | 0 (0.0%) |
| 65 to 74 Years | 0 (0.0%) | 7 (5.8%) |
| 75 Years and over | 22 (22.5%) | 35 (17.2%) |
Disability Class: Vision Difficulty
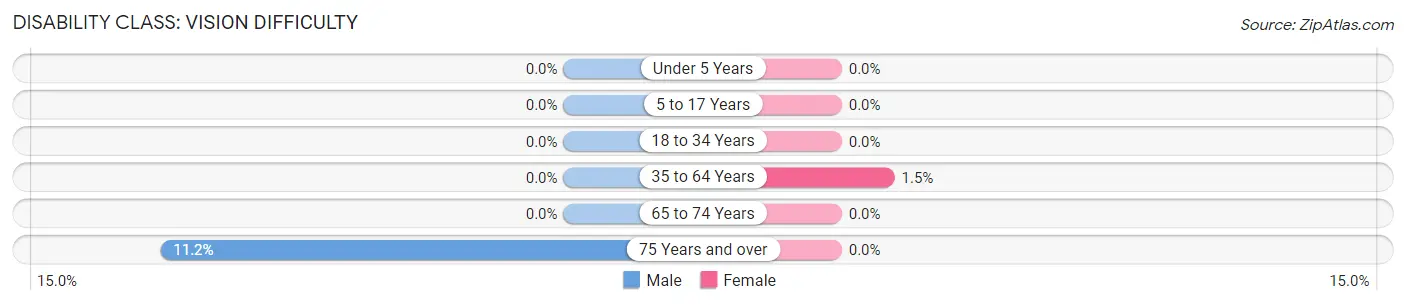
| Age Bracket | Male | Female |
| Under 5 Years | 0 (0.0%) | 0 (0.0%) |
| 5 to 17 Years | 0 (0.0%) | 0 (0.0%) |
| 18 to 34 Years | 0 (0.0%) | 0 (0.0%) |
| 35 to 64 Years | 0 (0.0%) | 7 (1.5%) |
| 65 to 74 Years | 0 (0.0%) | 0 (0.0%) |
| 75 Years and over | 11 (11.2%) | 0 (0.0%) |
Disability Class: Cognitive Difficulty
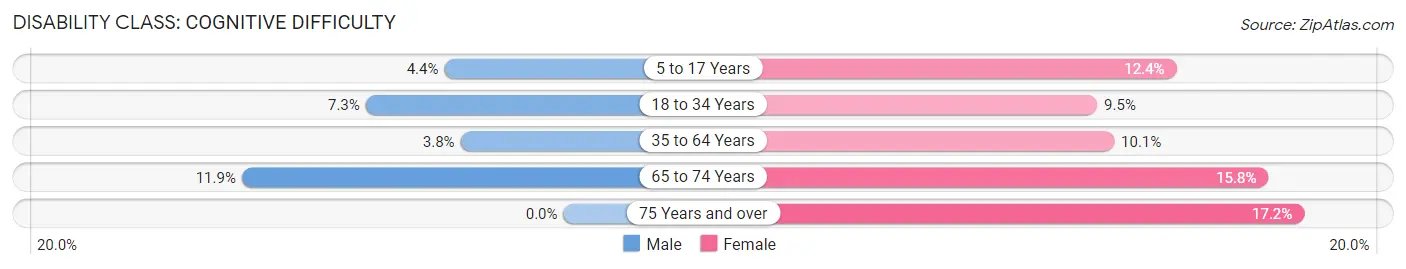
| Age Bracket | Male | Female |
| 5 to 17 Years | 5 (4.4%) | 37 (12.4%) |
| 18 to 34 Years | 45 (7.3%) | 46 (9.5%) |
| 35 to 64 Years | 15 (3.8%) | 48 (10.1%) |
| 65 to 74 Years | 8 (11.9%) | 19 (15.8%) |
| 75 Years and over | 0 (0.0%) | 35 (17.2%) |
Disability Class: Ambulatory Difficulty
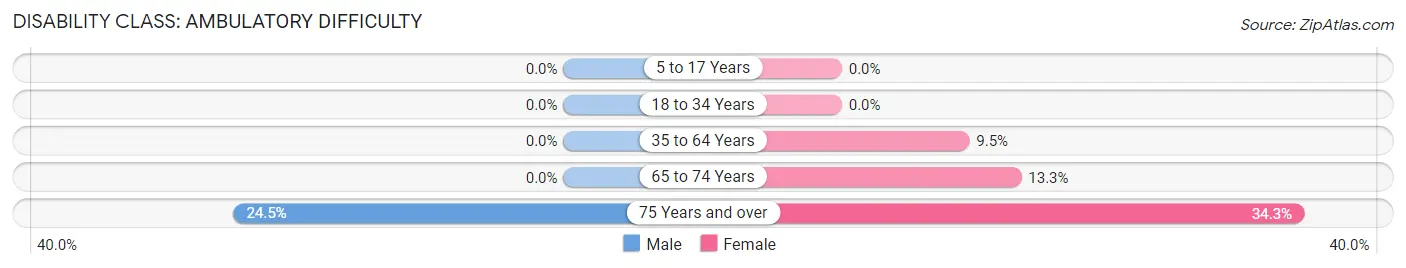
| Age Bracket | Male | Female |
| 5 to 17 Years | 0 (0.0%) | 0 (0.0%) |
| 18 to 34 Years | 0 (0.0%) | 0 (0.0%) |
| 35 to 64 Years | 0 (0.0%) | 45 (9.5%) |
| 65 to 74 Years | 0 (0.0%) | 16 (13.3%) |
| 75 Years and over | 24 (24.5%) | 70 (34.3%) |
Disability Class: Self-Care Difficulty
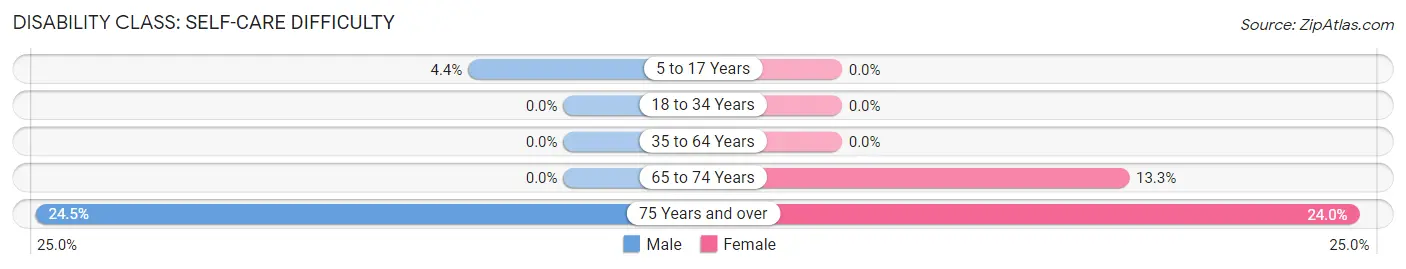
| Age Bracket | Male | Female |
| 5 to 17 Years | 5 (4.4%) | 0 (0.0%) |
| 18 to 34 Years | 0 (0.0%) | 0 (0.0%) |
| 35 to 64 Years | 0 (0.0%) | 0 (0.0%) |
| 65 to 74 Years | 0 (0.0%) | 16 (13.3%) |
| 75 Years and over | 24 (24.5%) | 49 (24.0%) |
Technology Access in Park Hills
Computing Device Access in Park Hills
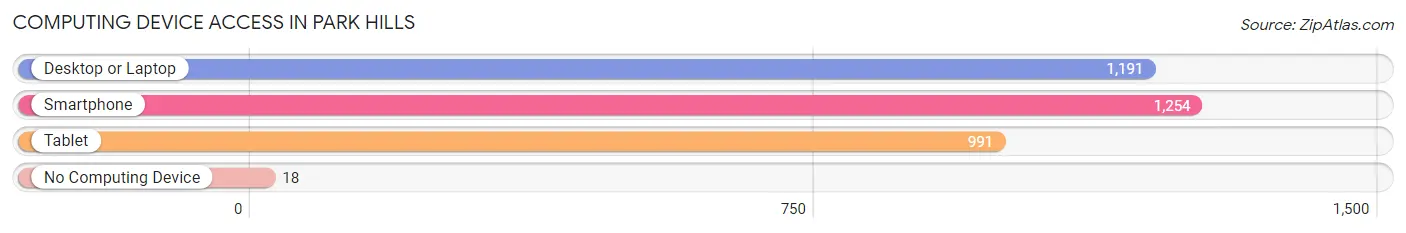
| Device Type | # Households | % Households |
| Desktop or Laptop | 1,191 | 89.9% |
| Smartphone | 1,254 | 94.7% |
| Tablet | 991 | 74.9% |
| No Computing Device | 18 | 1.4% |
| Total | 1,324 | 100.0% |
Internet Access in Park Hills
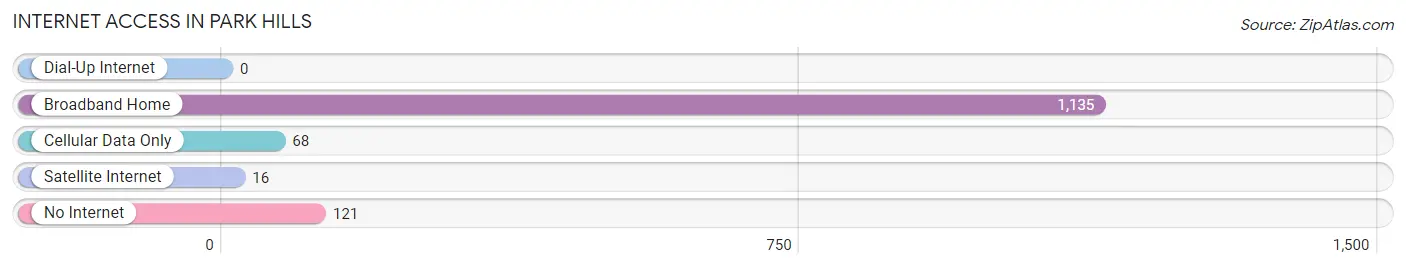
| Internet Type | # Households | % Households |
| Dial-Up Internet | 0 | 0.0% |
| Broadband Home | 1,135 | 85.7% |
| Cellular Data Only | 68 | 5.1% |
| Satellite Internet | 16 | 1.2% |
| No Internet | 121 | 9.1% |
| Total | 1,324 | 100.0% |
Park Hills Summary
History
Park Hills, Kentucky is a small city located in the northern part of the state, just south of Cincinnati, Ohio. It is part of the greater Cincinnati metropolitan area and is located in Kenton County. The city was founded in 1867 and was originally known as “The Park”. It was later renamed Park Hills in 1891.
The city was originally developed as a residential area for the wealthy and was home to many of the city’s elite. The city was also home to many of the city’s industrial workers, as well as a large number of immigrants from Germany, Ireland, and Italy.
The city was also home to a number of prominent businesses, including the Park Hills Brewery, which was founded in 1891 and was one of the largest breweries in the state. The brewery was eventually sold to the Anheuser-Busch Company in the early 1900s.
The city was also home to a number of other businesses, including the Park Hills Hotel, which was built in 1891 and was one of the largest hotels in the state. The hotel was eventually sold to the Hilton Hotel chain in the early 1900s.
The city was also home to a number of other businesses, including the Park Hills Theater, which was built in 1891 and was one of the largest theaters in the state. The theater was eventually sold to the Loews Theater chain in the early 1900s.
The city was also home to a number of other businesses, including the Park Hills Bank, which was founded in 1891 and was one of the largest banks in the state. The bank was eventually sold to the National City Bank in the early 1900s.
The city was also home to a number of other businesses, including the Park Hills Country Club, which was founded in 1891 and was one of the largest country clubs in the state. The country club was eventually sold to the Cincinnati Country Club in the early 1900s.
The city was also home to a number of other businesses, including the Park Hills Golf Course, which was founded in 1891 and was one of the largest golf courses in the state. The golf course was eventually sold to the Cincinnati Golf Club in the early 1900s.
Geography
Park Hills is located in the northern part of Kentucky, just south of Cincinnati, Ohio. It is part of the greater Cincinnati metropolitan area and is located in Kenton County. The city is situated on the banks of the Ohio River and is bordered by the cities of Covington, Fort Thomas, and Newport.
The city has a total area of 4.2 square miles, all of which is land. The city is located at an elevation of 845 feet above sea level.
Economy
The economy of Park Hills is largely based on the service industry, with many of the city’s businesses providing services to the surrounding area. The city is also home to a number of manufacturing and industrial businesses, including the Park Hills Brewery, which was founded in 1891 and is one of the largest breweries in the state.
The city is also home to a number of retail businesses, including the Park Hills Shopping Center, which was built in the early 1900s and is one of the largest shopping centers in the state. The city is also home to a number of restaurants, including the Park Hills Diner, which was founded in 1891 and is one of the oldest restaurants in the state.
Demographics
As of the 2010 census, the population of Park Hills was 8,945. The racial makeup of the city was 92.3% White, 4.2% African American, 0.3% Native American, 0.7% Asian, 0.1% Pacific Islander, 0.7% from other races, and 1.9% from two or more races. Hispanic or Latino of any race were 2.2% of the population.
The median income for a household in the city was $45,945, and the median income for a family was $54,945. The per capita income for the city was $22,945. About 8.3% of families and 10.2% of the population were below the poverty line, including 14.2% of those under age 18 and 6.2% of those age 65 or over.
Common Questions
What is Per Capita Income in Park Hills?
Per Capita income in Park Hills is $45,439.
What is the Median Family Income in Park Hills?
Median Family Income in Park Hills is $127,642.
What is the Median Household income in Park Hills?
Median Household Income in Park Hills is $89,167.
What is Income or Wage Gap in Park Hills?
Income or Wage Gap in Park Hills is 13.6%.
Women in Park Hills earn 86.4 cents for every dollar earned by a man.
What is Inequality or Gini Index in Park Hills?
Inequality or Gini Index in Park Hills is 0.48.
What is the Total Population of Park Hills?
Total Population of Park Hills is 3,159.
What is the Total Male Population of Park Hills?
Total Male Population of Park Hills is 1,505.
What is the Total Female Population of Park Hills?
Total Female Population of Park Hills is 1,654.
What is the Ratio of Males per 100 Females in Park Hills?
There are 90.99 Males per 100 Females in Park Hills.
What is the Ratio of Females per 100 Males in Park Hills?
There are 109.90 Females per 100 Males in Park Hills.
What is the Median Population Age in Park Hills?
Median Population Age in Park Hills is 30.7 Years.
What is the Average Family Size in Park Hills
Average Family Size in Park Hills is 2.9 People.
What is the Average Household Size in Park Hills
Average Household Size in Park Hills is 2.3 People.
How Large is the Labor Force in Park Hills?
There are 1,738 People in the Labor Forcein in Park Hills.
What is the Percentage of People in the Labor Force in Park Hills?
68.6% of People are in the Labor Force in Park Hills.
What is the Unemployment Rate in Park Hills?
Unemployment Rate in Park Hills is 4.5%.