Blue Ridge Manor, KY Map & Demographics
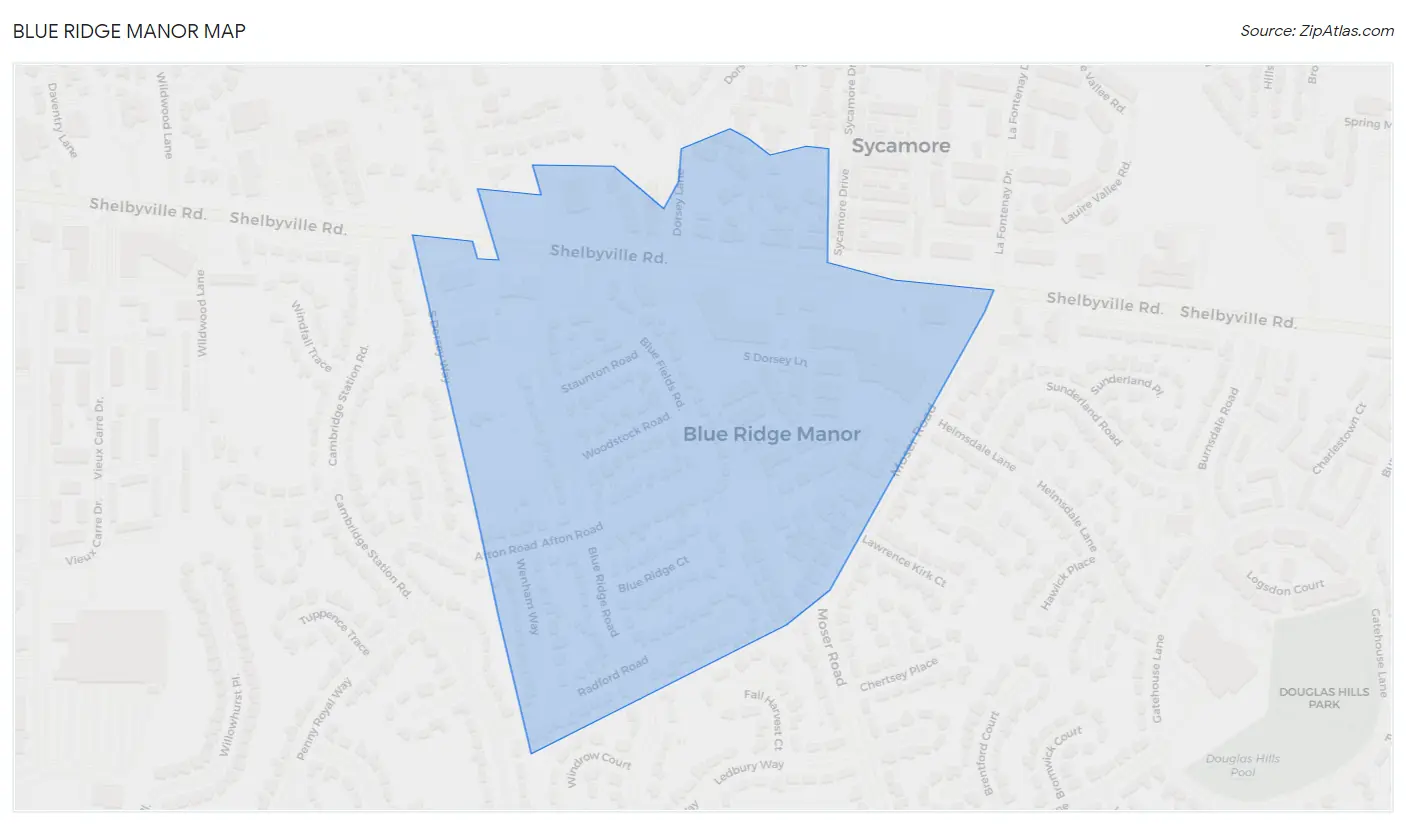
Blue Ridge Manor Map
Blue Ridge Manor Overview
$47,322
PER CAPITA INCOME
$95,625
AVG FAMILY INCOME
$70,833
AVG HOUSEHOLD INCOME
21.6%
WAGE / INCOME GAP [ % ]
78.4¢/ $1
WAGE / INCOME GAP [ $ ]
0.40
INEQUALITY / GINI INDEX
854
TOTAL POPULATION
402
MALE POPULATION
452
FEMALE POPULATION
88.94
MALES / 100 FEMALES
112.44
FEMALES / 100 MALES
49.2
MEDIAN AGE
2.7
AVG FAMILY SIZE
1.8
AVG HOUSEHOLD SIZE
513
LABOR FORCE [ PEOPLE ]
68.1%
PERCENT IN LABOR FORCE
2.9%
UNEMPLOYMENT RATE
Blue Ridge Manor Area Codes
Income in Blue Ridge Manor
Income Overview in Blue Ridge Manor
Per Capita Income in Blue Ridge Manor is $47,322, while median incomes of families and households are $95,625 and $70,833 respectively.
| Characteristic | Number | Measure |
| Per Capita Income | 854 | $47,322 |
| Median Family Income | 184 | $95,625 |
| Mean Family Income | 184 | $114,320 |
| Median Household Income | 474 | $70,833 |
| Mean Household Income | 474 | $84,766 |
| Income Deficit | 184 | $0 |
| Wage / Income Gap (%) | 854 | 21.61% |
| Wage / Income Gap ($) | 854 | 78.39¢ per $1 |
| Gini / Inequality Index | 854 | 0.40 |
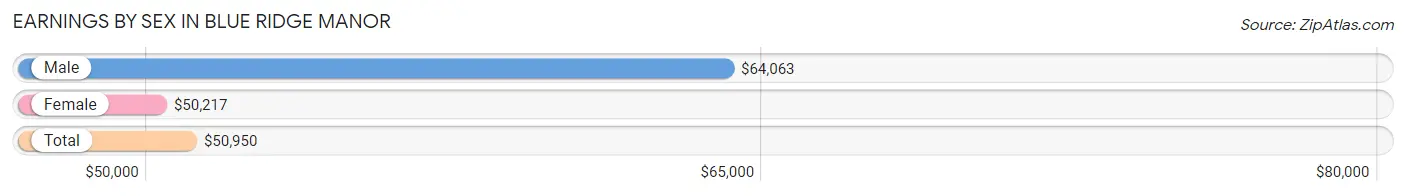
Earnings by Sex in Blue Ridge Manor
Average Earnings in Blue Ridge Manor are $50,950, $64,063 for men and $50,217 for women, a difference of 21.6%.
| Sex | Number | Average Earnings |
| Male | 255 (47.3%) | $64,063 |
| Female | 284 (52.7%) | $50,217 |
| Total | 539 (100.0%) | $50,950 |
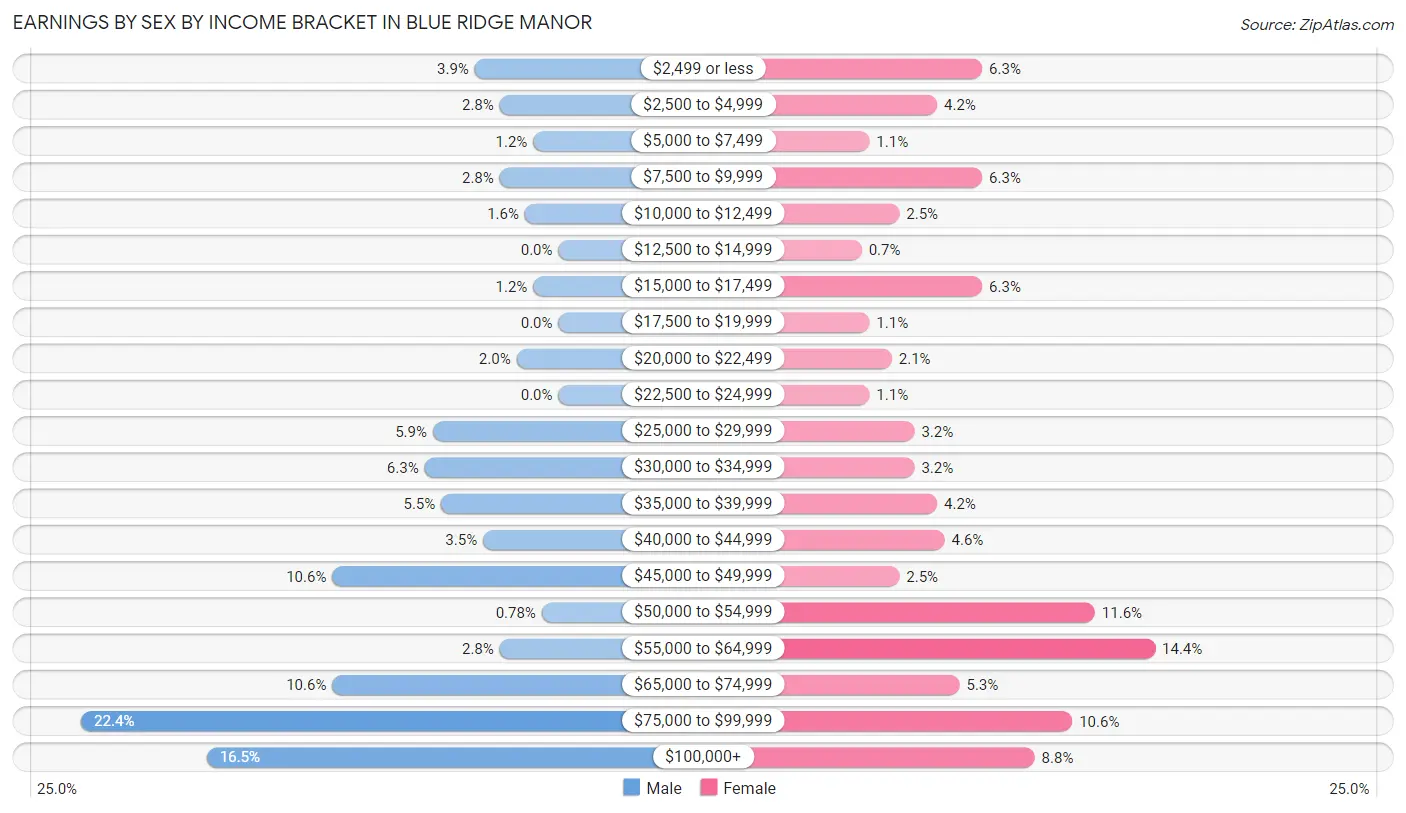
Earnings by Sex by Income Bracket in Blue Ridge Manor
The most common earnings brackets in Blue Ridge Manor are $75,000 to $99,999 for men (57 | 22.4%) and $55,000 to $64,999 for women (41 | 14.4%).
| Income | Male | Female |
| $2,499 or less | 10 (3.9%) | 18 (6.3%) |
| $2,500 to $4,999 | 7 (2.8%) | 12 (4.2%) |
| $5,000 to $7,499 | 3 (1.2%) | 3 (1.1%) |
| $7,500 to $9,999 | 7 (2.8%) | 18 (6.3%) |
| $10,000 to $12,499 | 4 (1.6%) | 7 (2.5%) |
| $12,500 to $14,999 | 0 (0.0%) | 2 (0.7%) |
| $15,000 to $17,499 | 3 (1.2%) | 18 (6.3%) |
| $17,500 to $19,999 | 0 (0.0%) | 3 (1.1%) |
| $20,000 to $22,499 | 5 (2.0%) | 6 (2.1%) |
| $22,500 to $24,999 | 0 (0.0%) | 3 (1.1%) |
| $25,000 to $29,999 | 15 (5.9%) | 9 (3.2%) |
| $30,000 to $34,999 | 16 (6.3%) | 9 (3.2%) |
| $35,000 to $39,999 | 14 (5.5%) | 12 (4.2%) |
| $40,000 to $44,999 | 9 (3.5%) | 13 (4.6%) |
| $45,000 to $49,999 | 27 (10.6%) | 7 (2.5%) |
| $50,000 to $54,999 | 2 (0.8%) | 33 (11.6%) |
| $55,000 to $64,999 | 7 (2.8%) | 41 (14.4%) |
| $65,000 to $74,999 | 27 (10.6%) | 15 (5.3%) |
| $75,000 to $99,999 | 57 (22.4%) | 30 (10.6%) |
| $100,000+ | 42 (16.5%) | 25 (8.8%) |
| Total | 255 (100.0%) | 284 (100.0%) |
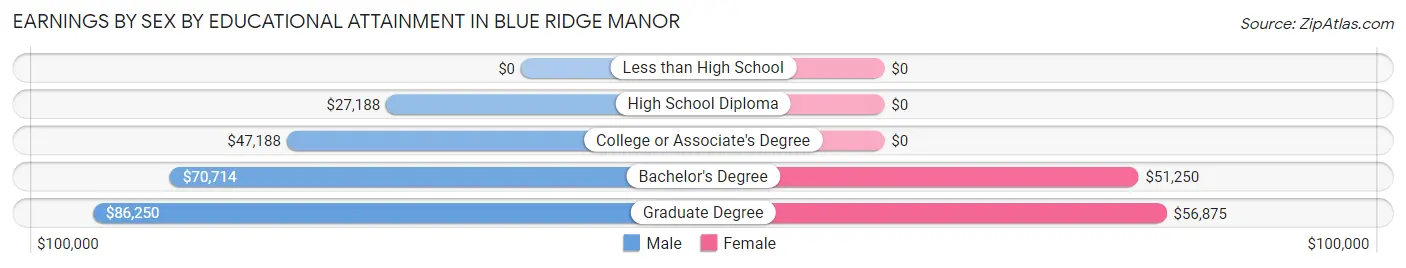
Earnings by Sex by Educational Attainment in Blue Ridge Manor
Average earnings in Blue Ridge Manor are $66,932 for men and $50,761 for women, a difference of 24.2%. Men with an educational attainment of graduate degree enjoy the highest average annual earnings of $86,250, while those with high school diploma education earn the least with $27,188. Women with an educational attainment of graduate degree earn the most with the average annual earnings of $56,875, while those with bachelor's degree education have the smallest earnings of $51,250.
| Educational Attainment | Male Income | Female Income |
| Less than High School | - | - |
| High School Diploma | $27,188 | $0 |
| College or Associate's Degree | $47,188 | $0 |
| Bachelor's Degree | $70,714 | $51,250 |
| Graduate Degree | $86,250 | $56,875 |
| Total | $66,932 | $50,761 |
Family Income in Blue Ridge Manor
Family Income Brackets in Blue Ridge Manor
According to the Blue Ridge Manor family income data, there are 47 families falling into the $100,000 to $149,999 income range, which is the most common income bracket and makes up 25.5% of all families.
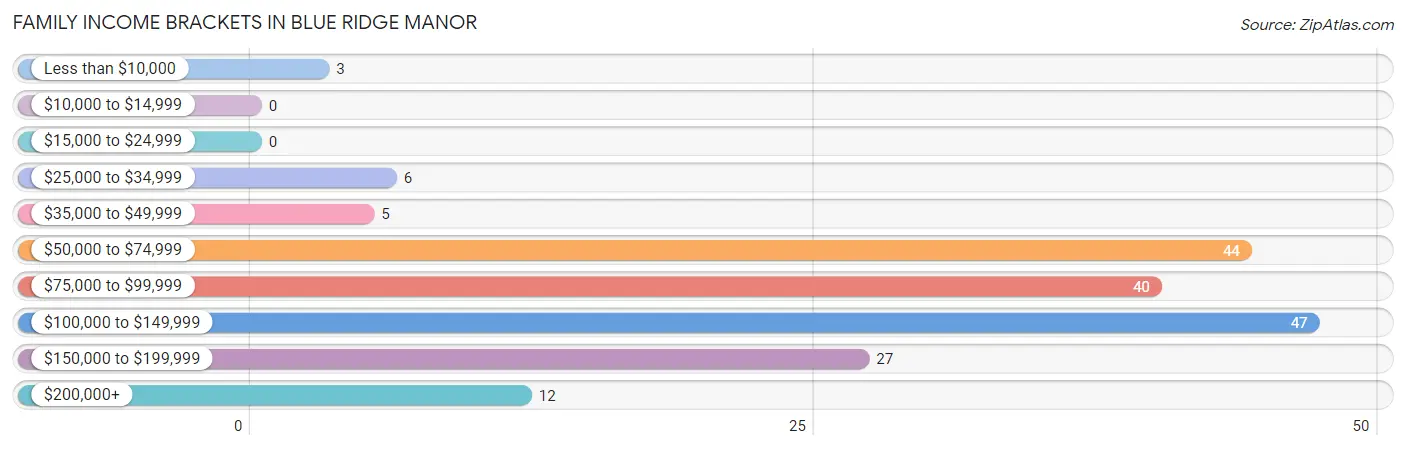
| Income Bracket | # Families | % Families |
| Less than $10,000 | 3 | 1.6% |
| $10,000 to $14,999 | 0 | 0.0% |
| $15,000 to $24,999 | 0 | 0.0% |
| $25,000 to $34,999 | 6 | 3.3% |
| $35,000 to $49,999 | 5 | 2.7% |
| $50,000 to $74,999 | 44 | 23.9% |
| $75,000 to $99,999 | 40 | 21.7% |
| $100,000 to $149,999 | 47 | 25.5% |
| $150,000 to $199,999 | 27 | 14.7% |
| $200,000+ | 12 | 6.5% |
Family Income by Famaliy Size in Blue Ridge Manor
4-person families (23 | 12.5%) account for the highest median family income in Blue Ridge Manor with $152,813 per family, while 2-person families (108 | 58.7%) have the highest median income of $42,084 per family member.
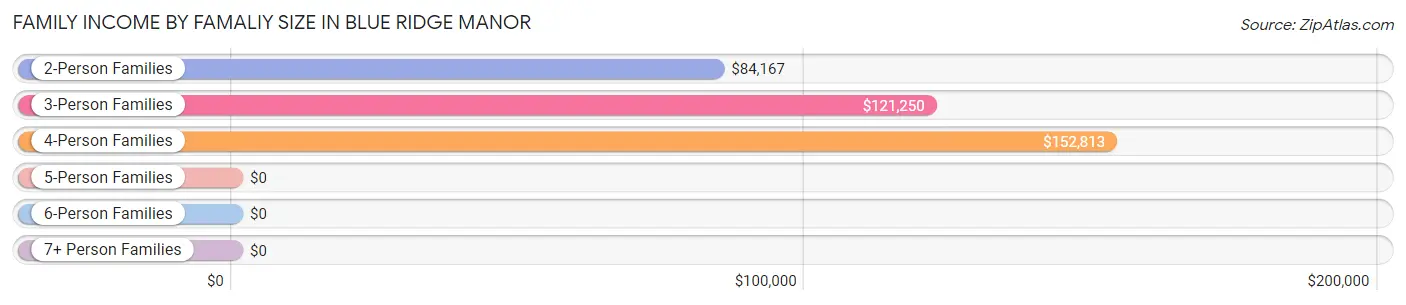
| Income Bracket | # Families | Median Income |
| 2-Person Families | 108 (58.7%) | $84,167 |
| 3-Person Families | 44 (23.9%) | $121,250 |
| 4-Person Families | 23 (12.5%) | $152,813 |
| 5-Person Families | 7 (3.8%) | $0 |
| 6-Person Families | 2 (1.1%) | $0 |
| 7+ Person Families | 0 (0.0%) | $0 |
| Total | 184 (100.0%) | $95,625 |
Family Income by Number of Earners in Blue Ridge Manor
The median family income in Blue Ridge Manor is $95,625, with families comprising 3+ earners (16) having the highest median family income of $141,667, while families with no earners (26) have the lowest median family income of $54,375, accounting for 8.7% and 14.1% of families, respectively.
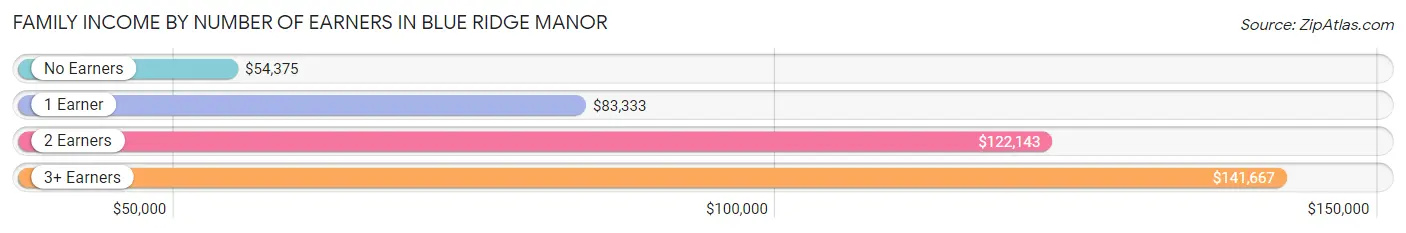
| Number of Earners | # Families | Median Income |
| No Earners | 26 (14.1%) | $54,375 |
| 1 Earner | 46 (25.0%) | $83,333 |
| 2 Earners | 96 (52.2%) | $122,143 |
| 3+ Earners | 16 (8.7%) | $141,667 |
| Total | 184 (100.0%) | $95,625 |
Household Income in Blue Ridge Manor
Household Income Brackets in Blue Ridge Manor
With 100 households falling in the category, the $50,000 to $74,999 income range is the most frequent in Blue Ridge Manor, accounting for 21.1% of all households. In contrast, only 13 households (2.7%) fall into the $10,000 to $14,999 income bracket, making it the least populous group.
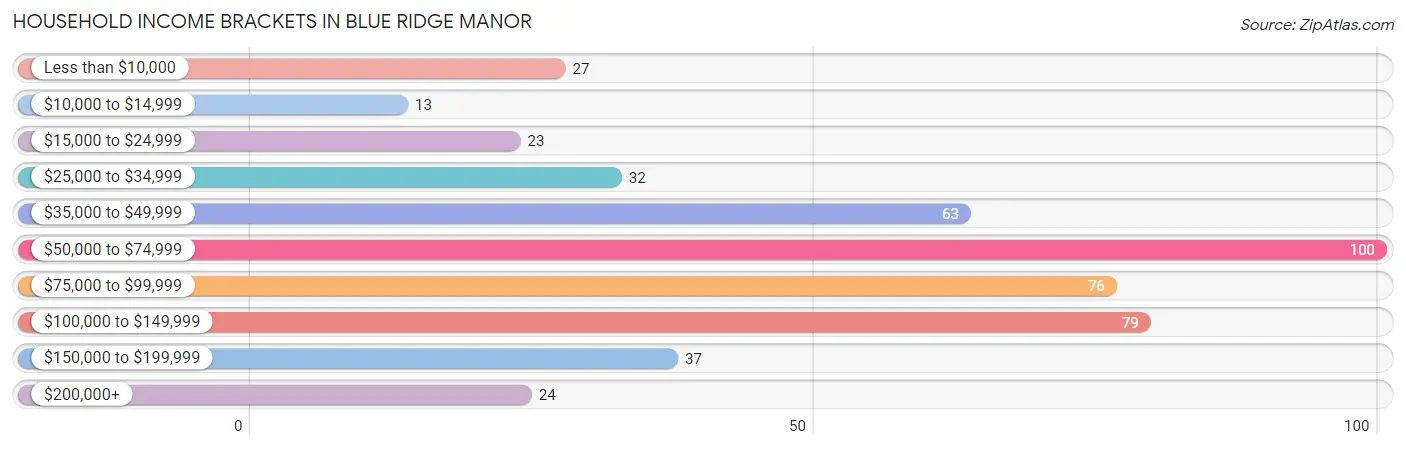
| Income Bracket | # Households | % Households |
| Less than $10,000 | 27 | 5.7% |
| $10,000 to $14,999 | 13 | 2.7% |
| $15,000 to $24,999 | 23 | 4.9% |
| $25,000 to $34,999 | 32 | 6.8% |
| $35,000 to $49,999 | 63 | 13.3% |
| $50,000 to $74,999 | 100 | 21.1% |
| $75,000 to $99,999 | 76 | 16.0% |
| $100,000 to $149,999 | 79 | 16.7% |
| $150,000 to $199,999 | 37 | 7.8% |
| $200,000+ | 24 | 5.1% |
Household Income by Householder Age in Blue Ridge Manor
The median household income in Blue Ridge Manor is $70,833, with the highest median household income of $105,417 found in the 25 to 44 years age bracket for the primary householder. A total of 139 households (29.3%) fall into this category. Meanwhile, the 15 to 24 years age bracket for the primary householder has the lowest median household income of $0, with 6 households (1.3%) in this group.
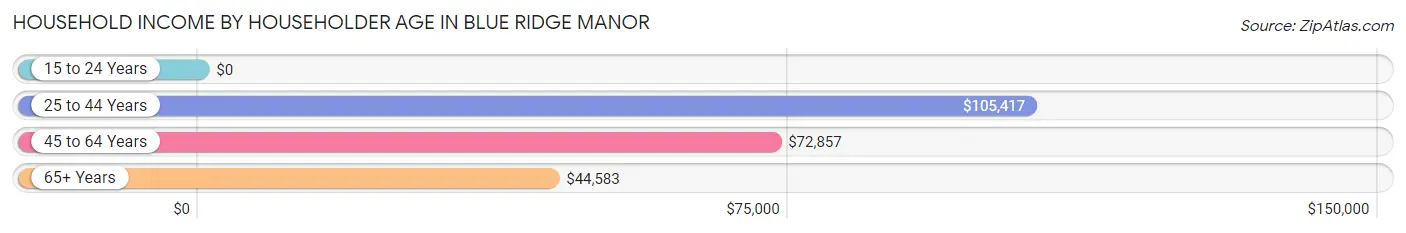
| Income Bracket | # Households | Median Income |
| 15 to 24 Years | 6 (1.3%) | $0 |
| 25 to 44 Years | 139 (29.3%) | $105,417 |
| 45 to 64 Years | 174 (36.7%) | $72,857 |
| 65+ Years | 155 (32.7%) | $44,583 |
| Total | 474 (100.0%) | $70,833 |
Poverty in Blue Ridge Manor
Income Below Poverty by Sex and Age in Blue Ridge Manor
With 7.2% poverty level for males and 8.2% for females among the residents of Blue Ridge Manor, 18 to 24 year old males and 75 year old and over females are the most vulnerable to poverty, with 3 males (15.0%) and 12 females (24.0%) in their respective age groups living below the poverty level.
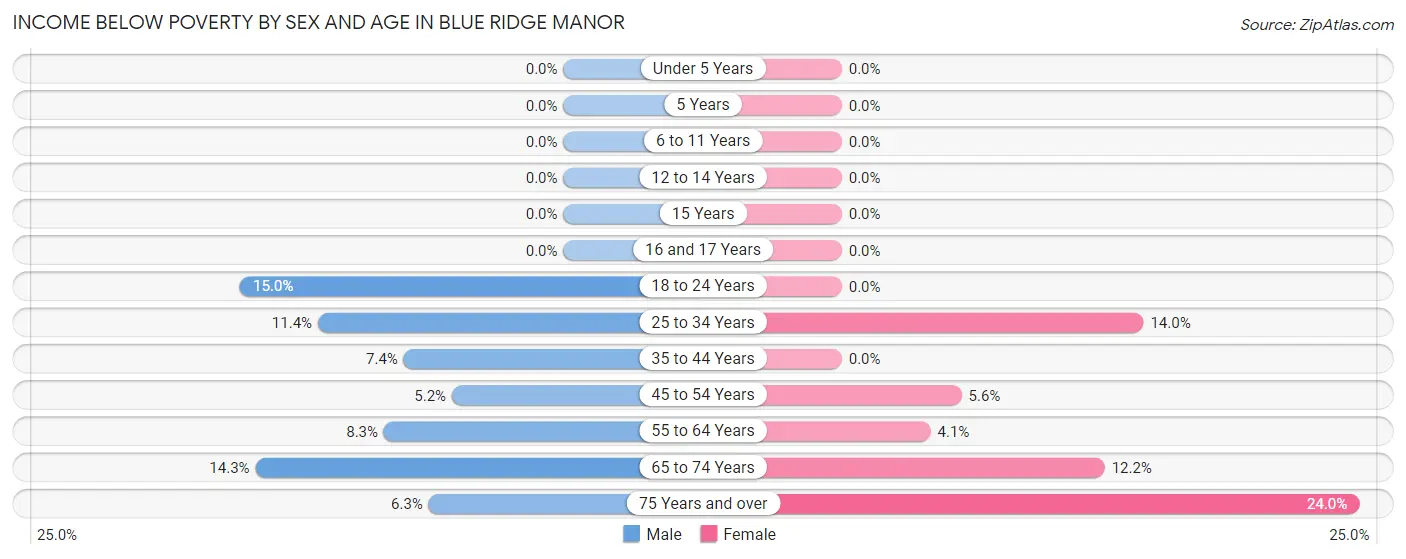
| Age Bracket | Male | Female |
| Under 5 Years | 0 (0.0%) | 0 (0.0%) |
| 5 Years | 0 (0.0%) | 0 (0.0%) |
| 6 to 11 Years | 0 (0.0%) | 0 (0.0%) |
| 12 to 14 Years | 0 (0.0%) | 0 (0.0%) |
| 15 Years | 0 (0.0%) | 0 (0.0%) |
| 16 and 17 Years | 0 (0.0%) | 0 (0.0%) |
| 18 to 24 Years | 3 (15.0%) | 0 (0.0%) |
| 25 to 34 Years | 9 (11.4%) | 7 (14.0%) |
| 35 to 44 Years | 4 (7.4%) | 0 (0.0%) |
| 45 to 54 Years | 3 (5.2%) | 4 (5.6%) |
| 55 to 64 Years | 5 (8.3%) | 4 (4.1%) |
| 65 to 74 Years | 3 (14.3%) | 10 (12.2%) |
| 75 Years and over | 2 (6.2%) | 12 (24.0%) |
| Total | 29 (7.2%) | 37 (8.2%) |
Income Above Poverty by Sex and Age in Blue Ridge Manor
According to the poverty statistics in Blue Ridge Manor, males aged under 5 years and females aged under 5 years are the age groups that are most secure financially, with 100.0% of males and 100.0% of females in these age groups living above the poverty line.
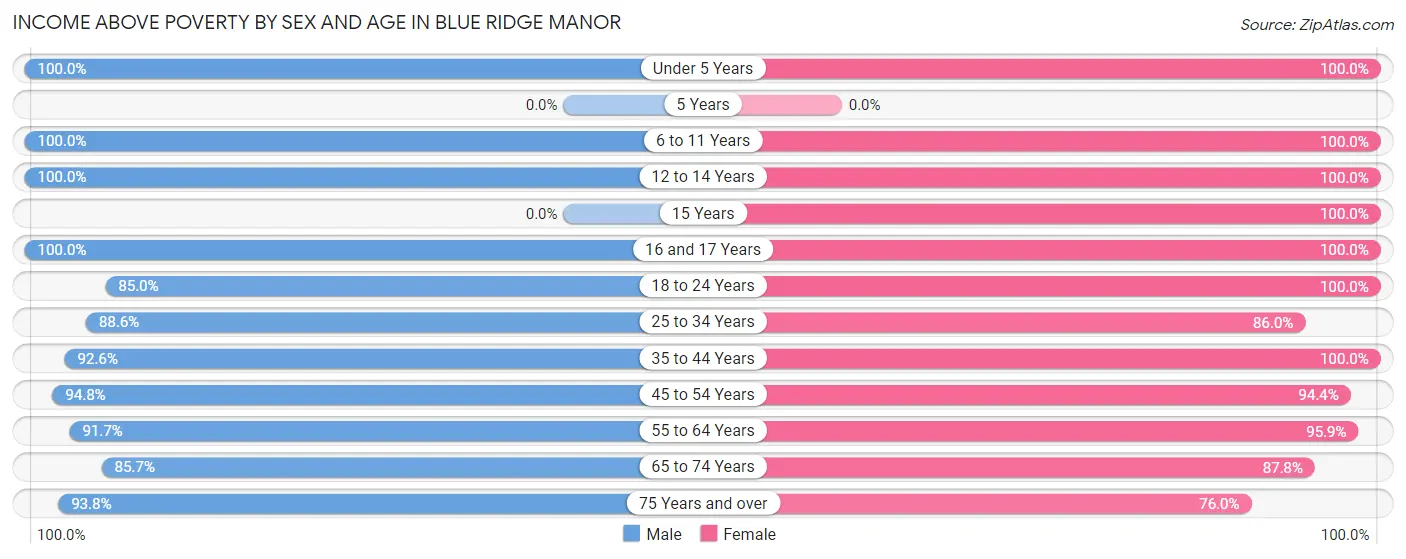
| Age Bracket | Male | Female |
| Under 5 Years | 19 (100.0%) | 10 (100.0%) |
| 5 Years | 0 (0.0%) | 0 (0.0%) |
| 6 to 11 Years | 29 (100.0%) | 16 (100.0%) |
| 12 to 14 Years | 20 (100.0%) | 4 (100.0%) |
| 15 Years | 0 (0.0%) | 3 (100.0%) |
| 16 and 17 Years | 10 (100.0%) | 4 (100.0%) |
| 18 to 24 Years | 17 (85.0%) | 12 (100.0%) |
| 25 to 34 Years | 70 (88.6%) | 43 (86.0%) |
| 35 to 44 Years | 50 (92.6%) | 52 (100.0%) |
| 45 to 54 Years | 55 (94.8%) | 68 (94.4%) |
| 55 to 64 Years | 55 (91.7%) | 93 (95.9%) |
| 65 to 74 Years | 18 (85.7%) | 72 (87.8%) |
| 75 Years and over | 30 (93.8%) | 38 (76.0%) |
| Total | 373 (92.8%) | 415 (91.8%) |
Income Below Poverty Among Married-Couple Families in Blue Ridge Manor
The poverty statistics for married-couple families in Blue Ridge Manor show that 2.0% or 3 of the total 153 families live below the poverty line. Families with no children have the highest poverty rate of 2.8%, comprising of 3 families. On the other hand, families with 1 or 2 children have the lowest poverty rate of 0.0%, which includes 0 families.
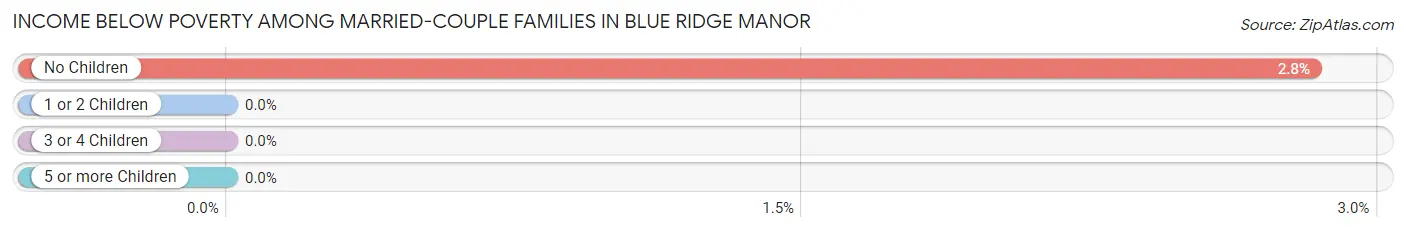
| Children | Above Poverty | Below Poverty |
| No Children | 103 (97.2%) | 3 (2.8%) |
| 1 or 2 Children | 38 (100.0%) | 0 (0.0%) |
| 3 or 4 Children | 9 (100.0%) | 0 (0.0%) |
| 5 or more Children | 0 (0.0%) | 0 (0.0%) |
| Total | 150 (98.0%) | 3 (2.0%) |
Income Below Poverty Among Single-Parent Households in Blue Ridge Manor
| Children | Single Father | Single Mother |
| No Children | 0 (0.0%) | 0 (0.0%) |
| 1 or 2 Children | 0 (0.0%) | 0 (0.0%) |
| 3 or 4 Children | 0 (0.0%) | 0 (0.0%) |
| 5 or more Children | 0 (0.0%) | 0 (0.0%) |
| Total | 0 (0.0%) | 0 (0.0%) |
Income Below Poverty Among Married-Couple vs Single-Parent Households in Blue Ridge Manor
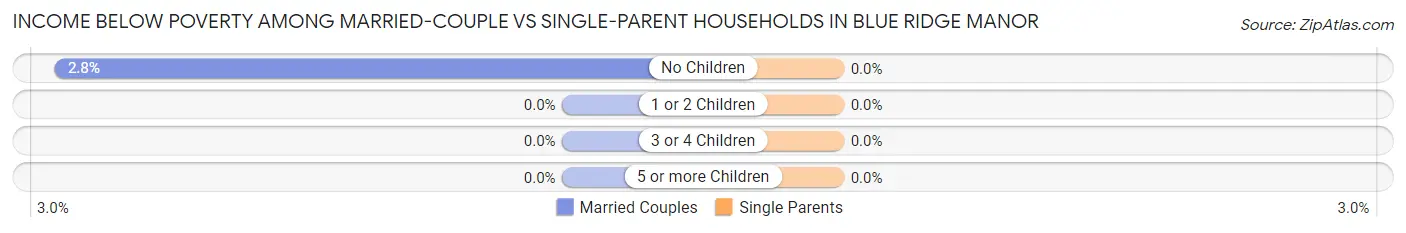
| Children | Married-Couple Families | Single-Parent Households |
| No Children | 3 (2.8%) | 0 (0.0%) |
| 1 or 2 Children | 0 (0.0%) | 0 (0.0%) |
| 3 or 4 Children | 0 (0.0%) | 0 (0.0%) |
| 5 or more Children | 0 (0.0%) | 0 (0.0%) |
| Total | 3 (2.0%) | 0 (0.0%) |
Race in Blue Ridge Manor
The most populous races in Blue Ridge Manor are White / Caucasian (749 | 87.7%), Two or more Races (63 | 7.4%), and Hispanic or Latino (37 | 4.3%).
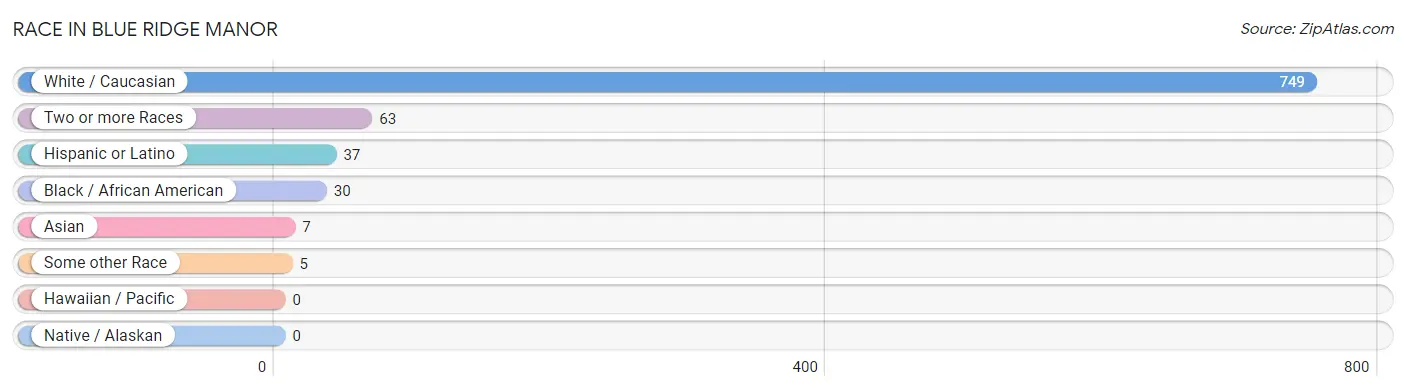
| Race | # Population | % Population |
| Asian | 7 | 0.8% |
| Black / African American | 30 | 3.5% |
| Hawaiian / Pacific | 0 | 0.0% |
| Hispanic or Latino | 37 | 4.3% |
| Native / Alaskan | 0 | 0.0% |
| White / Caucasian | 749 | 87.7% |
| Two or more Races | 63 | 7.4% |
| Some other Race | 5 | 0.6% |
| Total | 854 | 100.0% |
Ancestry in Blue Ridge Manor
The most populous ancestries reported in Blue Ridge Manor are German (199 | 23.3%), English (153 | 17.9%), Irish (135 | 15.8%), American (107 | 12.5%), and Italian (37 | 4.3%), together accounting for 73.9% of all Blue Ridge Manor residents.
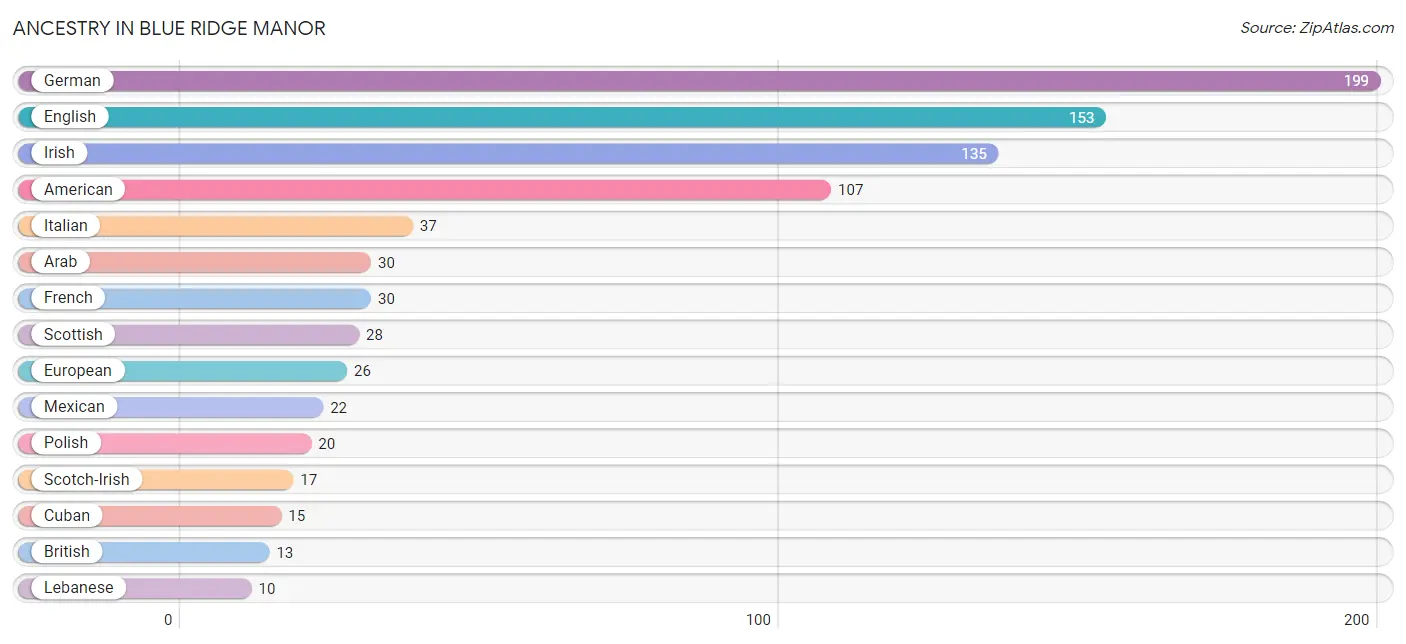
| Ancestry | # Population | % Population |
| American | 107 | 12.5% |
| Arab | 30 | 3.5% |
| British | 13 | 1.5% |
| Bulgarian | 5 | 0.6% |
| Burmese | 5 | 0.6% |
| Cuban | 15 | 1.8% |
| Czech | 3 | 0.4% |
| Dutch | 1 | 0.1% |
| Eastern European | 4 | 0.5% |
| English | 153 | 17.9% |
| European | 26 | 3.0% |
| Filipino | 6 | 0.7% |
| French | 30 | 3.5% |
| German | 199 | 23.3% |
| Hungarian | 5 | 0.6% |
| Iranian | 9 | 1.1% |
| Irish | 135 | 15.8% |
| Italian | 37 | 4.3% |
| Lebanese | 10 | 1.2% |
| Mexican | 22 | 2.6% |
| Polish | 20 | 2.3% |
| Russian | 7 | 0.8% |
| Scotch-Irish | 17 | 2.0% |
| Scottish | 28 | 3.3% |
| Serbian | 3 | 0.4% |
| Subsaharan African | 1 | 0.1% |
| Swiss | 6 | 0.7% | View All 27 Rows |
Immigrants in Blue Ridge Manor
The most numerous immigrant groups reported in Blue Ridge Manor came from Asia (23 | 2.7%), Europe (17 | 2.0%), South Central Asia (10 | 1.2%), Eastern Asia (9 | 1.1%), and Germany (9 | 1.1%), together accounting for 8.0% of all Blue Ridge Manor residents.
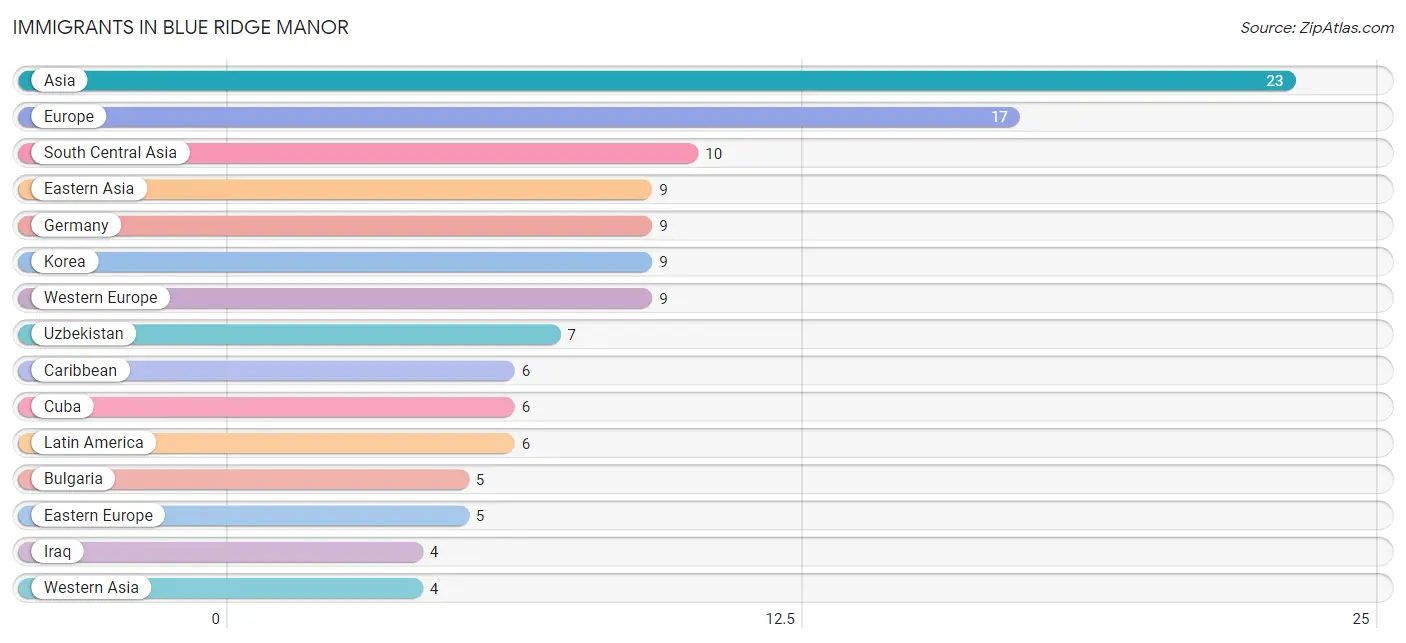
| Immigration Origin | # Population | % Population |
| Asia | 23 | 2.7% |
| Bulgaria | 5 | 0.6% |
| Caribbean | 6 | 0.7% |
| Cuba | 6 | 0.7% |
| Eastern Asia | 9 | 1.1% |
| Eastern Europe | 5 | 0.6% |
| Europe | 17 | 2.0% |
| Germany | 9 | 1.1% |
| Iran | 3 | 0.4% |
| Iraq | 4 | 0.5% |
| Ireland | 3 | 0.4% |
| Korea | 9 | 1.1% |
| Latin America | 6 | 0.7% |
| Northern Europe | 3 | 0.4% |
| South Central Asia | 10 | 1.2% |
| Uzbekistan | 7 | 0.8% |
| Western Asia | 4 | 0.5% |
| Western Europe | 9 | 1.1% | View All 18 Rows |
Sex and Age in Blue Ridge Manor
Sex and Age in Blue Ridge Manor
The most populous age groups in Blue Ridge Manor are 30 to 34 Years (44 | 11.0%) for men and 70 to 74 Years (55 | 12.2%) for women.
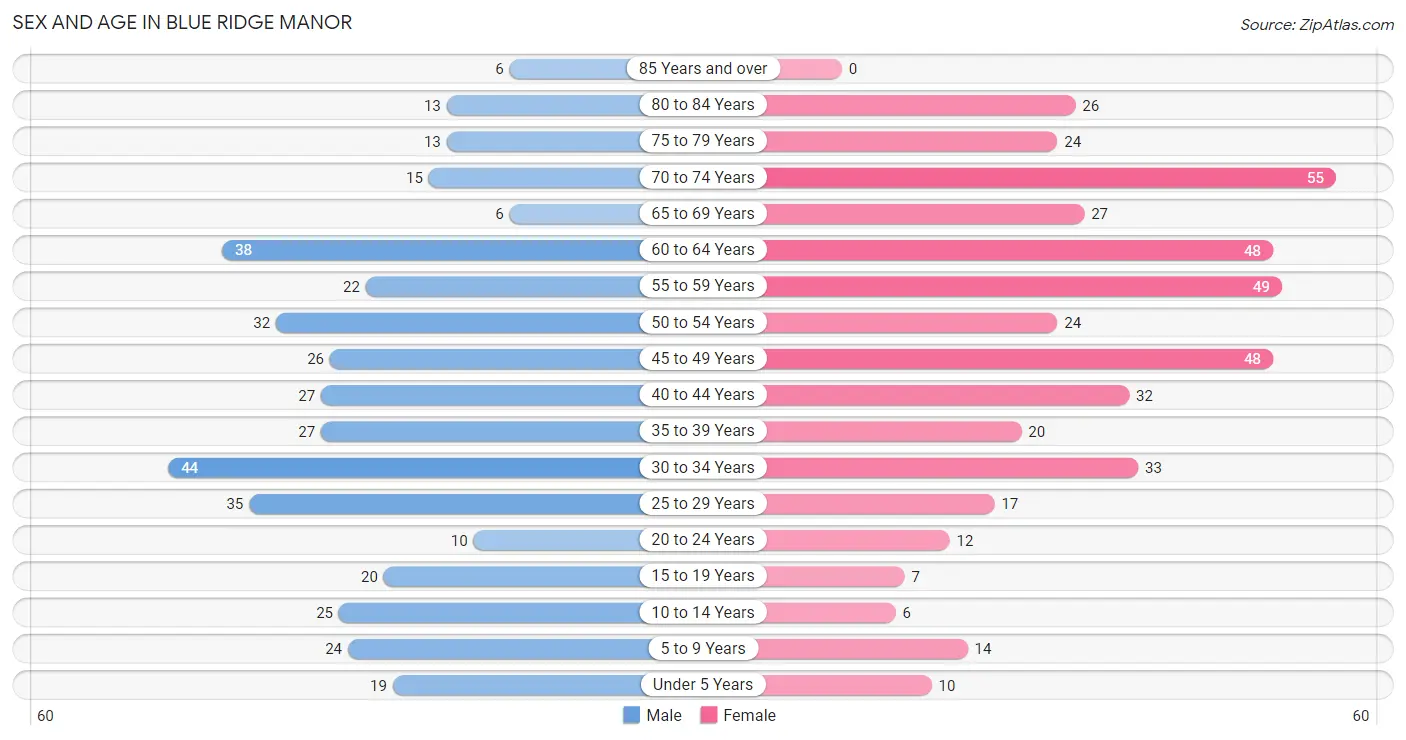
| Age Bracket | Male | Female |
| Under 5 Years | 19 (4.7%) | 10 (2.2%) |
| 5 to 9 Years | 24 (6.0%) | 14 (3.1%) |
| 10 to 14 Years | 25 (6.2%) | 6 (1.3%) |
| 15 to 19 Years | 20 (5.0%) | 7 (1.5%) |
| 20 to 24 Years | 10 (2.5%) | 12 (2.6%) |
| 25 to 29 Years | 35 (8.7%) | 17 (3.8%) |
| 30 to 34 Years | 44 (11.0%) | 33 (7.3%) |
| 35 to 39 Years | 27 (6.7%) | 20 (4.4%) |
| 40 to 44 Years | 27 (6.7%) | 32 (7.1%) |
| 45 to 49 Years | 26 (6.5%) | 48 (10.6%) |
| 50 to 54 Years | 32 (8.0%) | 24 (5.3%) |
| 55 to 59 Years | 22 (5.5%) | 49 (10.8%) |
| 60 to 64 Years | 38 (9.5%) | 48 (10.6%) |
| 65 to 69 Years | 6 (1.5%) | 27 (6.0%) |
| 70 to 74 Years | 15 (3.7%) | 55 (12.2%) |
| 75 to 79 Years | 13 (3.2%) | 24 (5.3%) |
| 80 to 84 Years | 13 (3.2%) | 26 (5.8%) |
| 85 Years and over | 6 (1.5%) | 0 (0.0%) |
| Total | 402 (100.0%) | 452 (100.0%) |
Families and Households in Blue Ridge Manor
Median Family Size in Blue Ridge Manor
The median family size in Blue Ridge Manor is 2.70 persons per family, with single female/mother families (22 | 12.0%) accounting for the largest median family size of 3.18 persons per family. On the other hand, married-couple families (153 | 83.2%) represent the smallest median family size with 2.63 persons per family.
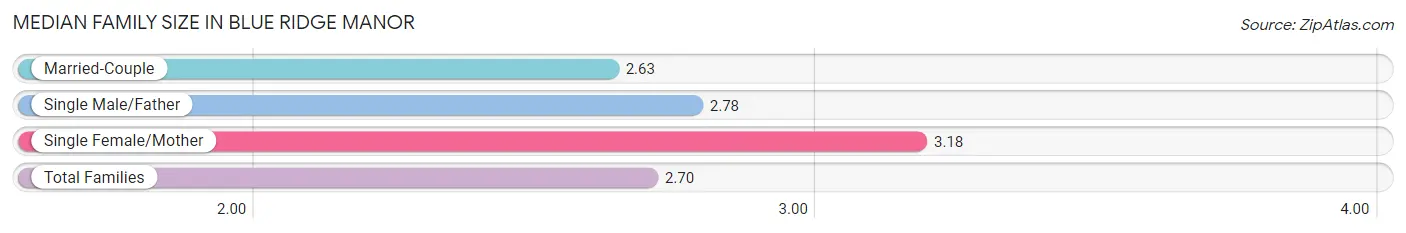
| Family Type | # Families | Family Size |
| Married-Couple | 153 (83.2%) | 2.63 |
| Single Male/Father | 9 (4.9%) | 2.78 |
| Single Female/Mother | 22 (12.0%) | 3.18 |
| Total Families | 184 (100.0%) | 2.70 |
Median Household Size in Blue Ridge Manor
The median household size in Blue Ridge Manor is 1.80 persons per household, with single female/mother households (22 | 4.6%) accounting for the largest median household size of 3.5 persons per household. non-family households (290 | 61.2%) represent the smallest median household size with 1.19 persons per household.
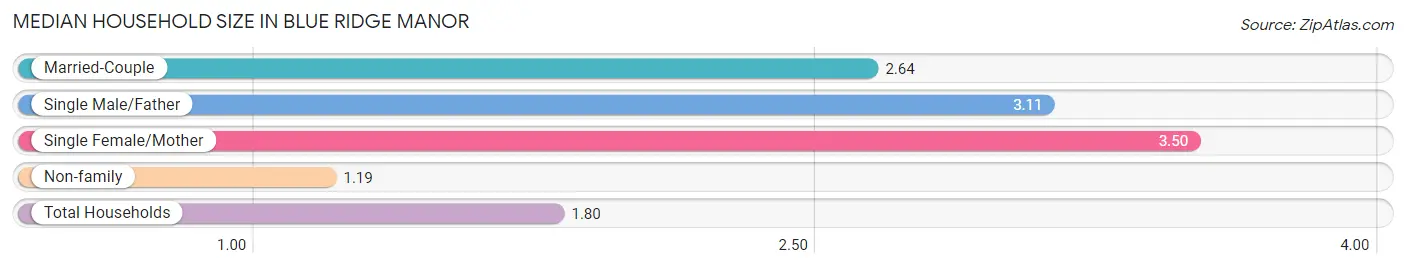
| Household Type | # Households | Household Size |
| Married-Couple | 153 (32.3%) | 2.64 |
| Single Male/Father | 9 (1.9%) | 3.11 |
| Single Female/Mother | 22 (4.6%) | 3.50 |
| Non-family | 290 (61.2%) | 1.19 |
| Total Households | 474 (100.0%) | 1.80 |
Household Size by Marriage Status in Blue Ridge Manor
Out of a total of 474 households in Blue Ridge Manor, 184 (38.8%) are family households, while 290 (61.2%) are nonfamily households. The most numerous type of family households are 2-person households, comprising 103, and the most common type of nonfamily households are 1-person households, comprising 253.
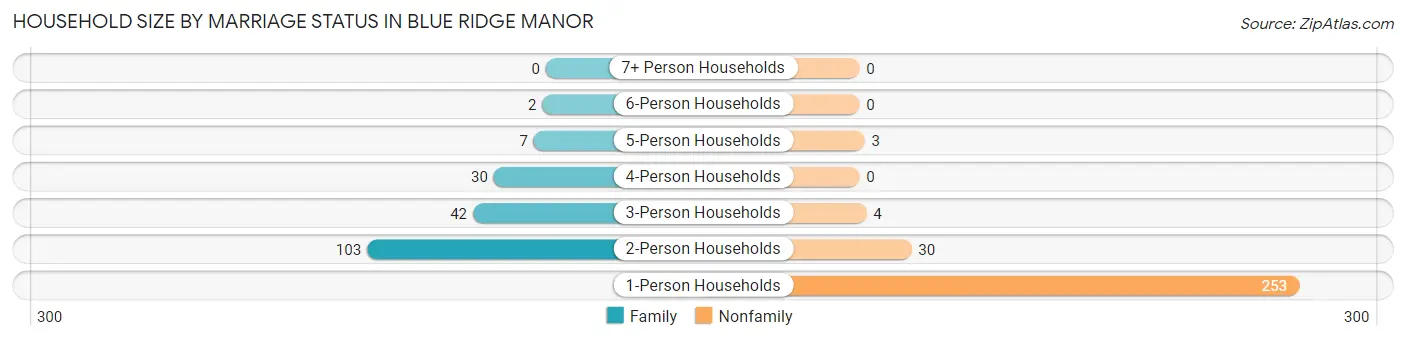
| Household Size | Family Households | Nonfamily Households |
| 1-Person Households | - | 253 (53.4%) |
| 2-Person Households | 103 (21.7%) | 30 (6.3%) |
| 3-Person Households | 42 (8.9%) | 4 (0.8%) |
| 4-Person Households | 30 (6.3%) | 0 (0.0%) |
| 5-Person Households | 7 (1.5%) | 3 (0.6%) |
| 6-Person Households | 2 (0.4%) | 0 (0.0%) |
| 7+ Person Households | 0 (0.0%) | 0 (0.0%) |
| Total | 184 (38.8%) | 290 (61.2%) |
Female Fertility in Blue Ridge Manor
Fertility by Age in Blue Ridge Manor
Average fertility rate in Blue Ridge Manor is 18.0 births per 1,000 women. Women in the age bracket of 20 to 34 years have the highest fertility rate with 48.0 births per 1,000 women. Women in the age bracket of 20 to 34 years acount for 100.0% of all women with births.
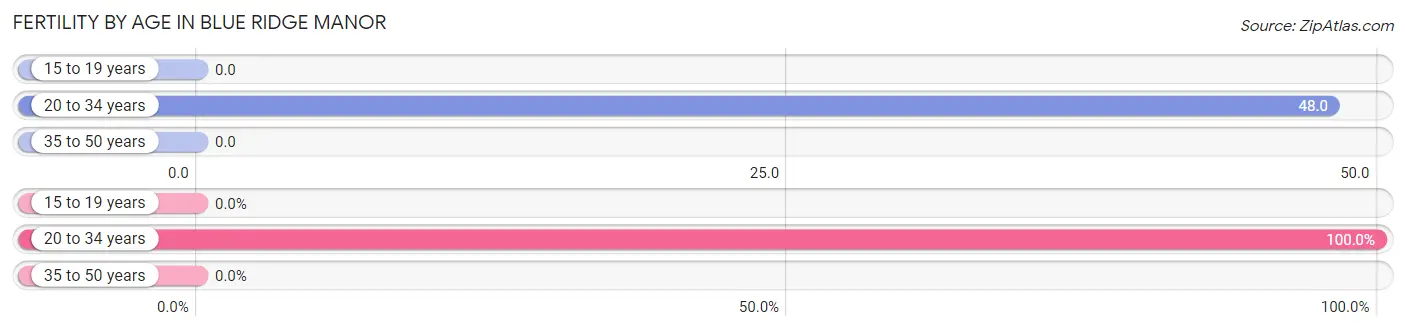
| Age Bracket | Women with Births | Births / 1,000 Women |
| 15 to 19 years | 0 (0.0%) | 0.0 |
| 20 to 34 years | 3 (100.0%) | 48.0 |
| 35 to 50 years | 0 (0.0%) | 0.0 |
| Total | 3 (100.0%) | 18.0 |
Fertility by Age by Marriage Status in Blue Ridge Manor
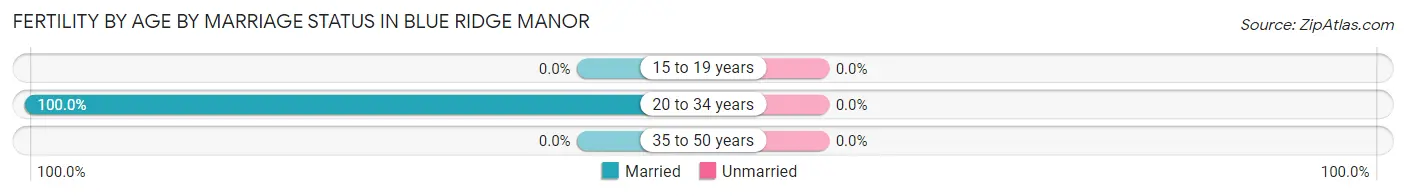
| Age Bracket | Married | Unmarried |
| 15 to 19 years | 0 (0.0%) | 0 (0.0%) |
| 20 to 34 years | 3 (100.0%) | 0 (0.0%) |
| 35 to 50 years | 0 (0.0%) | 0 (0.0%) |
| Total | 3 (100.0%) | 0 (0.0%) |
Fertility by Education in Blue Ridge Manor
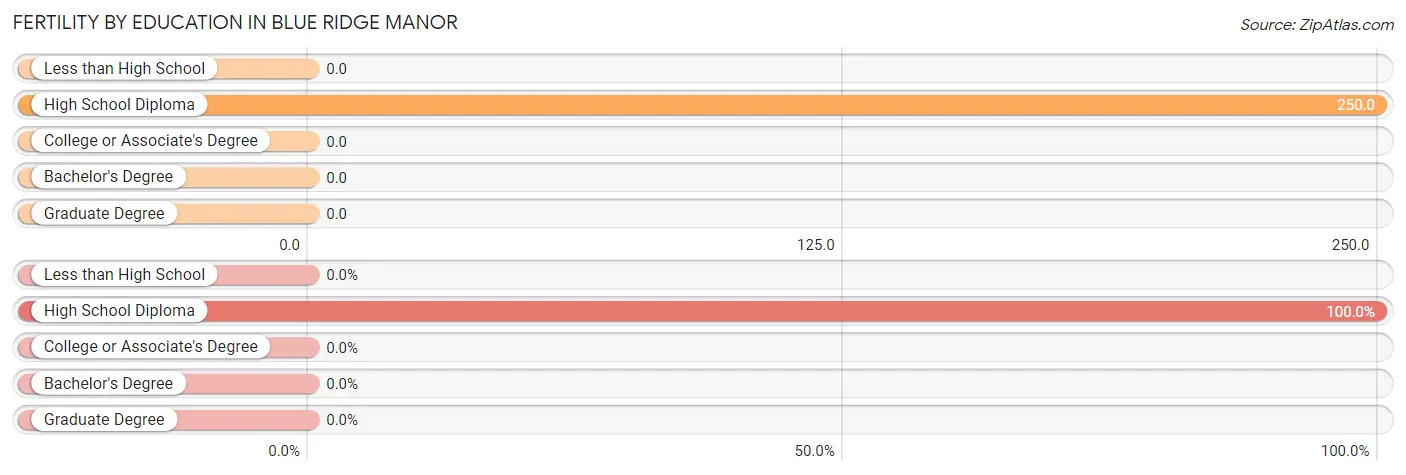
| Educational Attainment | Women with Births | Births / 1,000 Women |
| Less than High School | 0 (0.0%) | 0.0 |
| High School Diploma | 3 (100.0%) | 250.0 |
| College or Associate's Degree | 0 (0.0%) | 0.0 |
| Bachelor's Degree | 0 (0.0%) | 0.0 |
| Graduate Degree | 0 (0.0%) | 0.0 |
| Total | 3 (100.0%) | 18.0 |
Fertility by Education by Marriage Status in Blue Ridge Manor
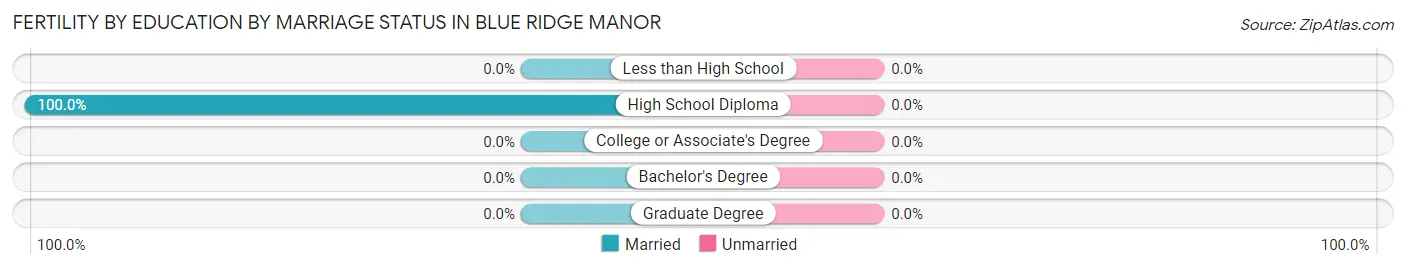
| Educational Attainment | Married | Unmarried |
| Less than High School | 0 (0.0%) | 0 (0.0%) |
| High School Diploma | 3 (100.0%) | 0 (0.0%) |
| College or Associate's Degree | 0 (0.0%) | 0 (0.0%) |
| Bachelor's Degree | 0 (0.0%) | 0 (0.0%) |
| Graduate Degree | 0 (0.0%) | 0 (0.0%) |
| Total | 3 (100.0%) | 0 (0.0%) |
Employment Characteristics in Blue Ridge Manor
Employment by Class of Employer in Blue Ridge Manor
Among the 496 employed individuals in Blue Ridge Manor, private company employees (339 | 68.3%), self-employed (not incorporated) (38 | 7.7%), and not-for-profit organizations (34 | 6.9%) make up the most common classes of employment.
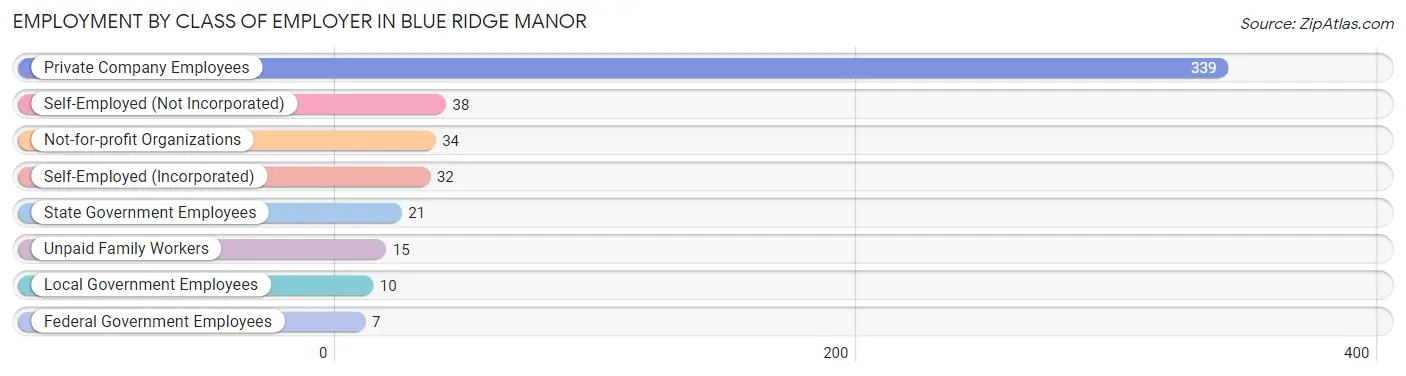
| Employer Class | # Employees | % Employees |
| Private Company Employees | 339 | 68.3% |
| Self-Employed (Incorporated) | 32 | 6.5% |
| Self-Employed (Not Incorporated) | 38 | 7.7% |
| Not-for-profit Organizations | 34 | 6.9% |
| Local Government Employees | 10 | 2.0% |
| State Government Employees | 21 | 4.2% |
| Federal Government Employees | 7 | 1.4% |
| Unpaid Family Workers | 15 | 3.0% |
| Total | 496 | 100.0% |
Employment Status by Age in Blue Ridge Manor
According to the labor force statistics for Blue Ridge Manor, out of the total population over 16 years of age (753), 68.1% or 513 individuals are in the labor force, with 2.9% or 15 of them unemployed. The age group with the highest labor force participation rate is 30 to 34 years, with 97.4% or 75 individuals in the labor force. Within the labor force, the 20 to 24 years age range has the highest percentage of unemployed individuals, with 15.8% or 3 of them being unemployed.
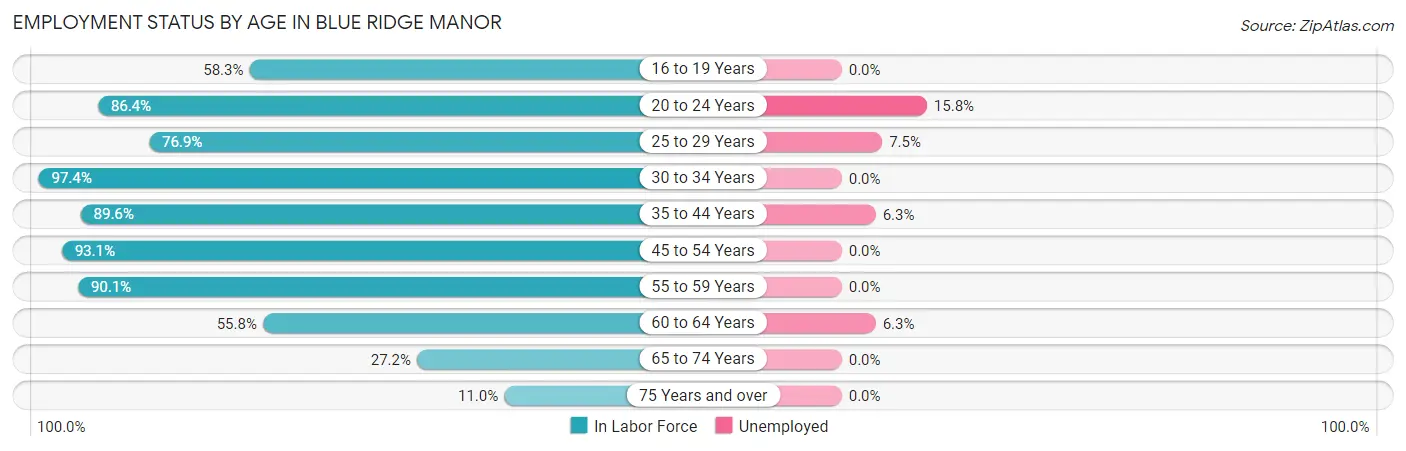
| Age Bracket | In Labor Force | Unemployed |
| 16 to 19 Years | 14 (58.3%) | 0 (0.0%) |
| 20 to 24 Years | 19 (86.4%) | 3 (15.8%) |
| 25 to 29 Years | 40 (76.9%) | 3 (7.5%) |
| 30 to 34 Years | 75 (97.4%) | 0 (0.0%) |
| 35 to 44 Years | 95 (89.6%) | 6 (6.3%) |
| 45 to 54 Years | 121 (93.1%) | 0 (0.0%) |
| 55 to 59 Years | 64 (90.1%) | 0 (0.0%) |
| 60 to 64 Years | 48 (55.8%) | 3 (6.3%) |
| 65 to 74 Years | 28 (27.2%) | 0 (0.0%) |
| 75 Years and over | 9 (11.0%) | 0 (0.0%) |
| Total | 513 (68.1%) | 15 (2.9%) |
Employment Status by Educational Attainment in Blue Ridge Manor
According to labor force statistics for Blue Ridge Manor, 84.9% of individuals (443) out of the total population between 25 and 64 years of age (522) are in the labor force, with 2.7% or 12 of them being unemployed. The group with the highest labor force participation rate are those with the educational attainment of college / associate degree, with 91.3% or 105 individuals in the labor force. Within the labor force, individuals with high school diploma education have the highest percentage of unemployment, with 4.9% or 2 of them being unemployed.
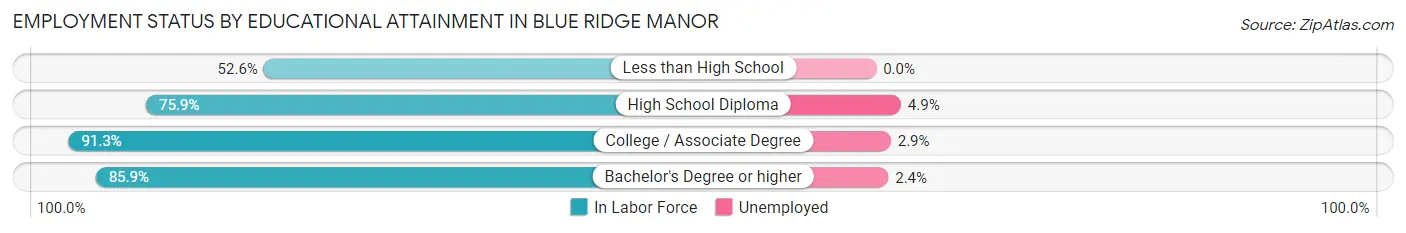
| Educational Attainment | In Labor Force | Unemployed |
| Less than High School | 10 (52.6%) | 0 (0.0%) |
| High School Diploma | 41 (75.9%) | 3 (4.9%) |
| College / Associate Degree | 105 (91.3%) | 3 (2.9%) |
| Bachelor's Degree or higher | 287 (85.9%) | 8 (2.4%) |
| Total | 443 (84.9%) | 14 (2.7%) |
Employment Occupations by Sex in Blue Ridge Manor
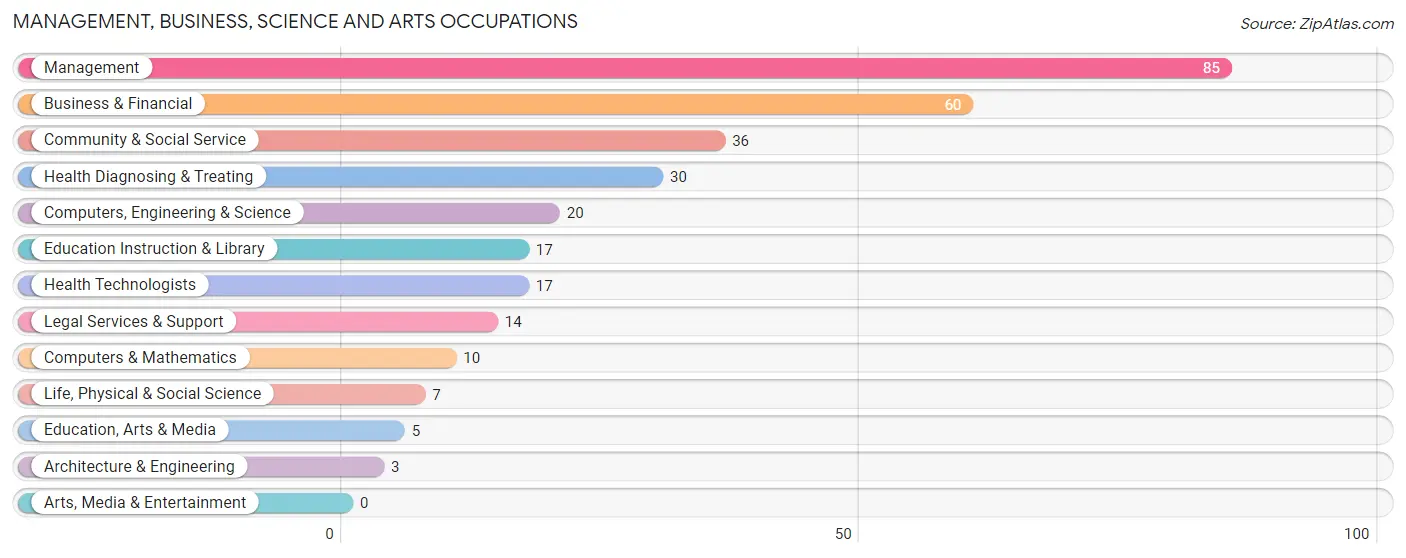
Management, Business, Science and Arts Occupations
The most common Management, Business, Science and Arts occupations in Blue Ridge Manor are Management (85 | 17.1%), Business & Financial (60 | 12.0%), Community & Social Service (36 | 7.2%), Health Diagnosing & Treating (30 | 6.0%), and Computers, Engineering & Science (20 | 4.0%).
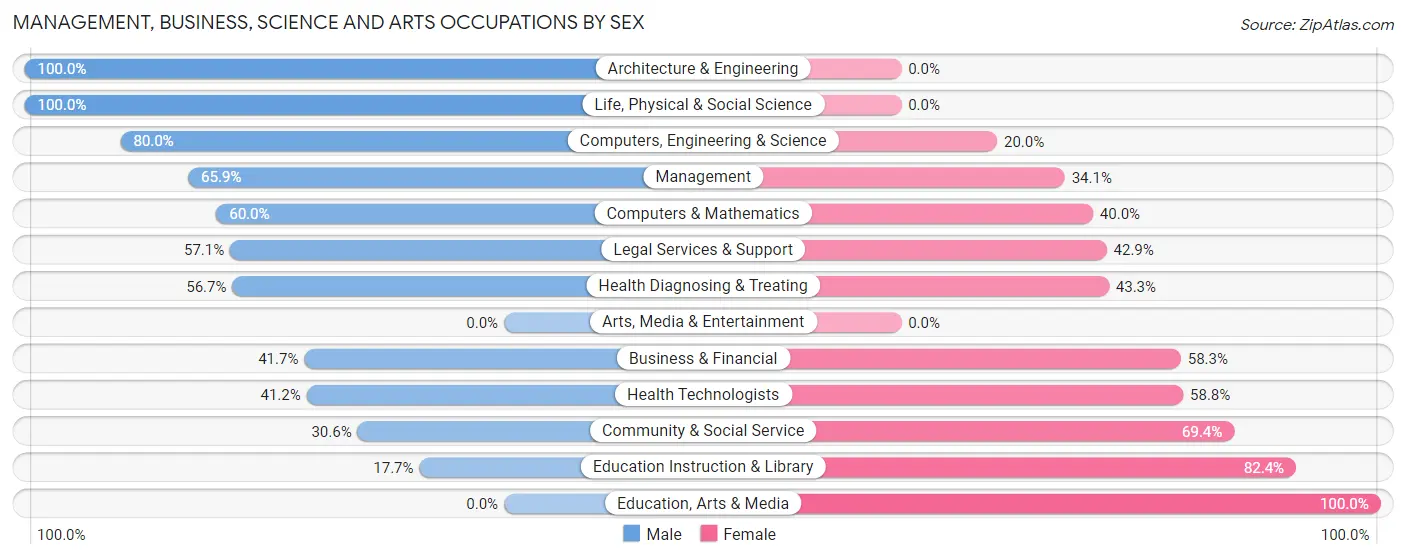
Management, Business, Science and Arts Occupations by Sex
Within the Management, Business, Science and Arts occupations in Blue Ridge Manor, the most male-oriented occupations are Architecture & Engineering (100.0%), Life, Physical & Social Science (100.0%), and Computers, Engineering & Science (80.0%), while the most female-oriented occupations are Education, Arts & Media (100.0%), Education Instruction & Library (82.4%), and Community & Social Service (69.4%).
| Occupation | Male | Female |
| Management | 56 (65.9%) | 29 (34.1%) |
| Business & Financial | 25 (41.7%) | 35 (58.3%) |
| Computers, Engineering & Science | 16 (80.0%) | 4 (20.0%) |
| Computers & Mathematics | 6 (60.0%) | 4 (40.0%) |
| Architecture & Engineering | 3 (100.0%) | 0 (0.0%) |
| Life, Physical & Social Science | 7 (100.0%) | 0 (0.0%) |
| Community & Social Service | 11 (30.6%) | 25 (69.4%) |
| Education, Arts & Media | 0 (0.0%) | 5 (100.0%) |
| Legal Services & Support | 8 (57.1%) | 6 (42.9%) |
| Education Instruction & Library | 3 (17.6%) | 14 (82.4%) |
| Arts, Media & Entertainment | 0 (0.0%) | 0 (0.0%) |
| Health Diagnosing & Treating | 17 (56.7%) | 13 (43.3%) |
| Health Technologists | 7 (41.2%) | 10 (58.8%) |
| Total (Category) | 125 (54.1%) | 106 (45.9%) |
| Total (Overall) | 246 (49.4%) | 252 (50.6%) |
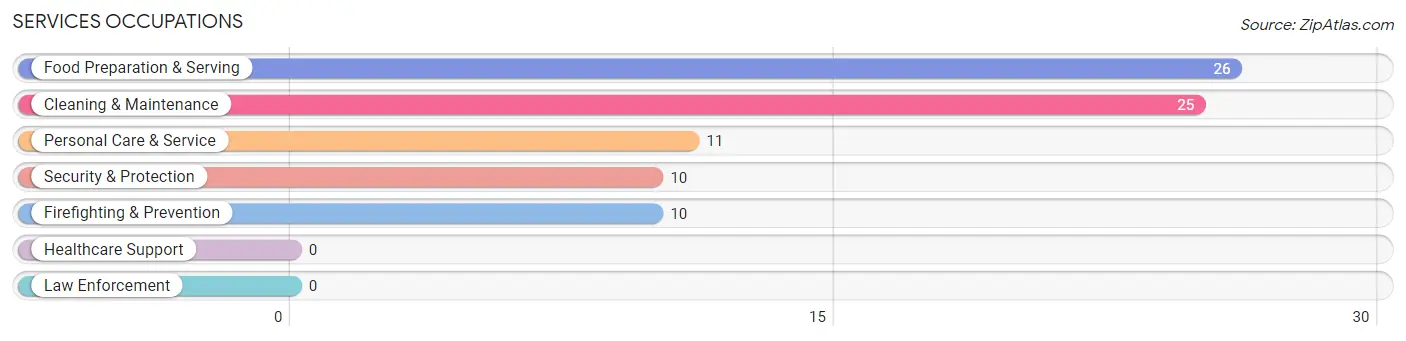
Services Occupations
The most common Services occupations in Blue Ridge Manor are Food Preparation & Serving (26 | 5.2%), Cleaning & Maintenance (25 | 5.0%), Personal Care & Service (11 | 2.2%), Security & Protection (10 | 2.0%), and Firefighting & Prevention (10 | 2.0%).
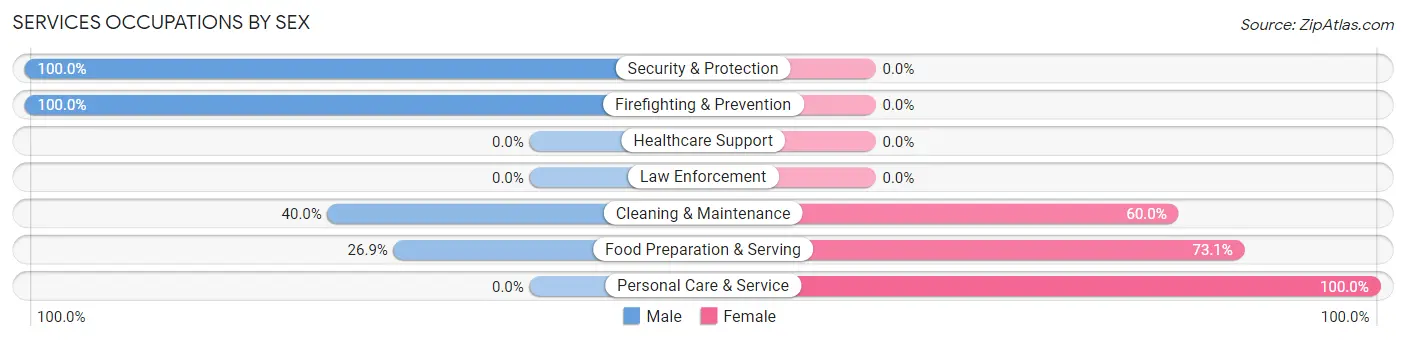
Services Occupations by Sex
Within the Services occupations in Blue Ridge Manor, the most male-oriented occupations are Security & Protection (100.0%), Firefighting & Prevention (100.0%), and Cleaning & Maintenance (40.0%), while the most female-oriented occupations are Personal Care & Service (100.0%), Food Preparation & Serving (73.1%), and Cleaning & Maintenance (60.0%).
| Occupation | Male | Female |
| Healthcare Support | 0 (0.0%) | 0 (0.0%) |
| Security & Protection | 10 (100.0%) | 0 (0.0%) |
| Firefighting & Prevention | 10 (100.0%) | 0 (0.0%) |
| Law Enforcement | 0 (0.0%) | 0 (0.0%) |
| Food Preparation & Serving | 7 (26.9%) | 19 (73.1%) |
| Cleaning & Maintenance | 10 (40.0%) | 15 (60.0%) |
| Personal Care & Service | 0 (0.0%) | 11 (100.0%) |
| Total (Category) | 27 (37.5%) | 45 (62.5%) |
| Total (Overall) | 246 (49.4%) | 252 (50.6%) |
Sales and Office Occupations
The most common Sales and Office occupations in Blue Ridge Manor are Sales & Related (84 | 16.9%), and Office & Administration (78 | 15.7%).

Sales and Office Occupations by Sex
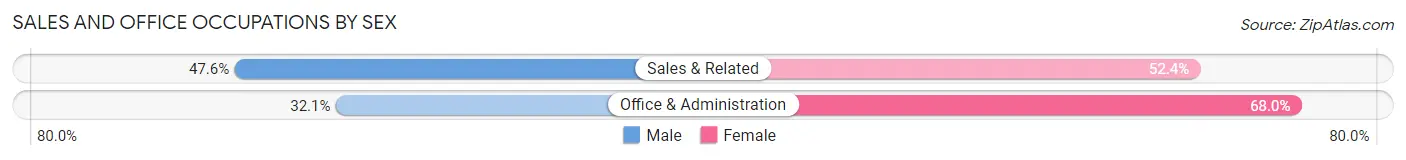
| Occupation | Male | Female |
| Sales & Related | 40 (47.6%) | 44 (52.4%) |
| Office & Administration | 25 (32.1%) | 53 (67.9%) |
| Total (Category) | 65 (40.1%) | 97 (59.9%) |
| Total (Overall) | 246 (49.4%) | 252 (50.6%) |
Natural Resources, Construction and Maintenance Occupations
The most common Natural Resources, Construction and Maintenance occupations in Blue Ridge Manor are Construction & Extraction (4 | 0.8%), and Installation, Maintenance & Repair (1 | 0.2%).

Natural Resources, Construction and Maintenance Occupations by Sex

| Occupation | Male | Female |
| Farming, Fishing & Forestry | 0 (0.0%) | 0 (0.0%) |
| Construction & Extraction | 4 (100.0%) | 0 (0.0%) |
| Installation, Maintenance & Repair | 1 (100.0%) | 0 (0.0%) |
| Total (Category) | 5 (100.0%) | 0 (0.0%) |
| Total (Overall) | 246 (49.4%) | 252 (50.6%) |
Production, Transportation and Moving Occupations
The most common Production, Transportation and Moving occupations in Blue Ridge Manor are Production (13 | 2.6%), Material Moving (11 | 2.2%), and Transportation (4 | 0.8%).
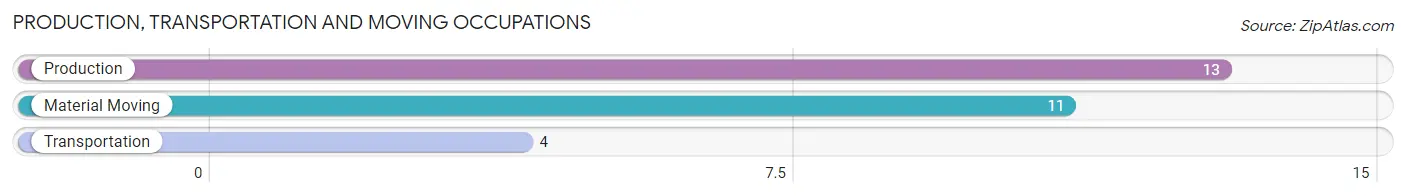
Production, Transportation and Moving Occupations by Sex

| Occupation | Male | Female |
| Production | 13 (100.0%) | 0 (0.0%) |
| Transportation | 4 (100.0%) | 0 (0.0%) |
| Material Moving | 7 (63.6%) | 4 (36.4%) |
| Total (Category) | 24 (85.7%) | 4 (14.3%) |
| Total (Overall) | 246 (49.4%) | 252 (50.6%) |
Employment Industries by Sex in Blue Ridge Manor
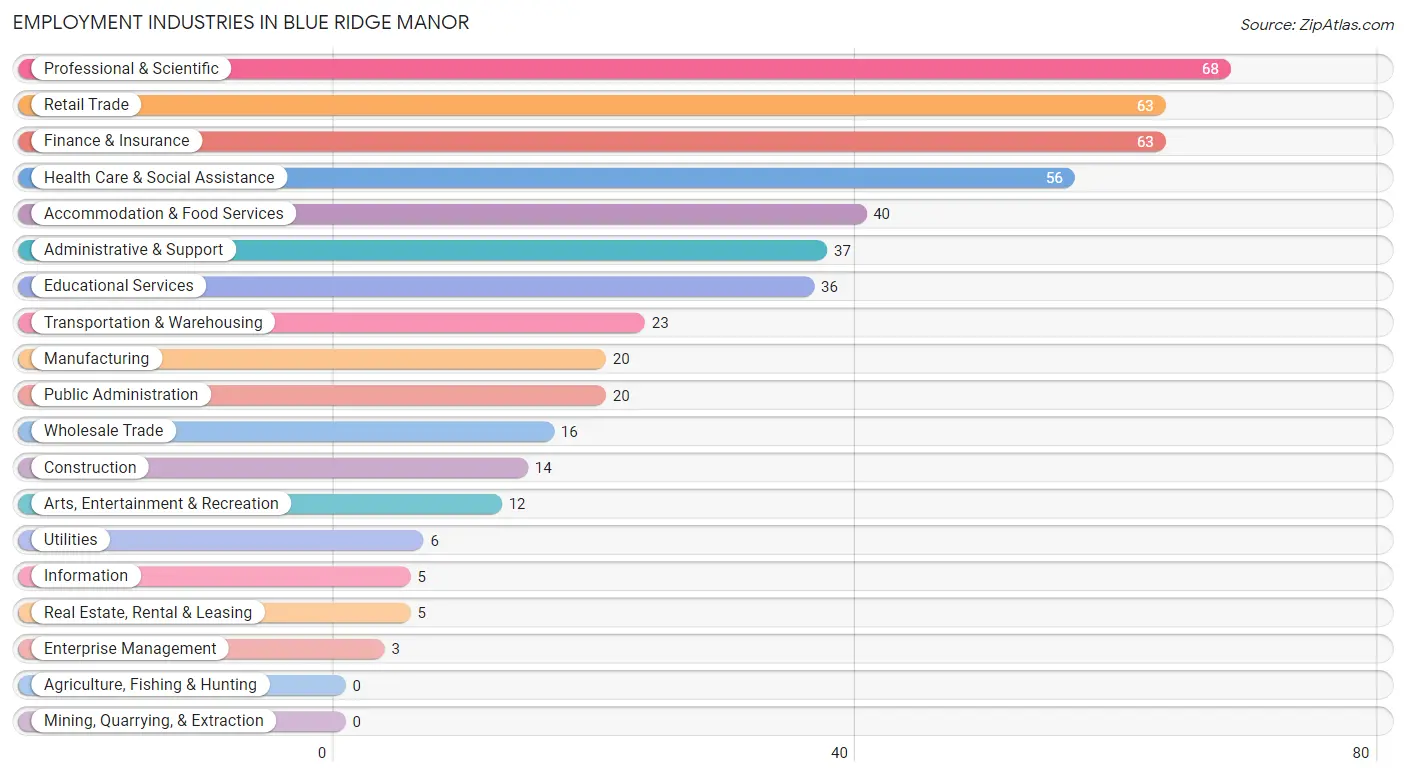
Employment Industries in Blue Ridge Manor
The major employment industries in Blue Ridge Manor include Professional & Scientific (68 | 13.7%), Retail Trade (63 | 12.7%), Finance & Insurance (63 | 12.7%), Health Care & Social Assistance (56 | 11.2%), and Accommodation & Food Services (40 | 8.0%).
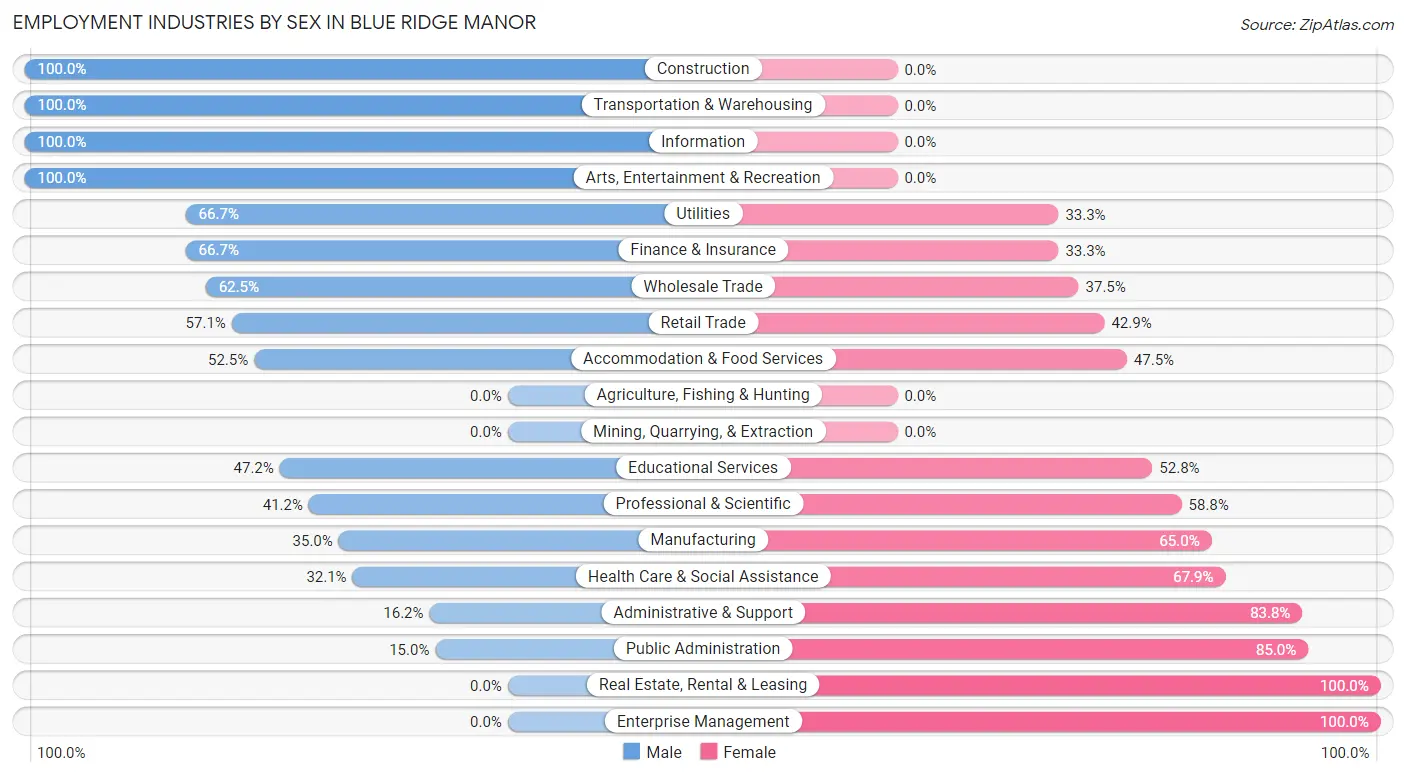
Employment Industries by Sex in Blue Ridge Manor
The Blue Ridge Manor industries that see more men than women are Construction (100.0%), Transportation & Warehousing (100.0%), and Information (100.0%), whereas the industries that tend to have a higher number of women are Real Estate, Rental & Leasing (100.0%), Enterprise Management (100.0%), and Public Administration (85.0%).
| Industry | Male | Female |
| Agriculture, Fishing & Hunting | 0 (0.0%) | 0 (0.0%) |
| Mining, Quarrying, & Extraction | 0 (0.0%) | 0 (0.0%) |
| Construction | 14 (100.0%) | 0 (0.0%) |
| Manufacturing | 7 (35.0%) | 13 (65.0%) |
| Wholesale Trade | 10 (62.5%) | 6 (37.5%) |
| Retail Trade | 36 (57.1%) | 27 (42.9%) |
| Transportation & Warehousing | 23 (100.0%) | 0 (0.0%) |
| Utilities | 4 (66.7%) | 2 (33.3%) |
| Information | 5 (100.0%) | 0 (0.0%) |
| Finance & Insurance | 42 (66.7%) | 21 (33.3%) |
| Real Estate, Rental & Leasing | 0 (0.0%) | 5 (100.0%) |
| Professional & Scientific | 28 (41.2%) | 40 (58.8%) |
| Enterprise Management | 0 (0.0%) | 3 (100.0%) |
| Administrative & Support | 6 (16.2%) | 31 (83.8%) |
| Educational Services | 17 (47.2%) | 19 (52.8%) |
| Health Care & Social Assistance | 18 (32.1%) | 38 (67.9%) |
| Arts, Entertainment & Recreation | 12 (100.0%) | 0 (0.0%) |
| Accommodation & Food Services | 21 (52.5%) | 19 (47.5%) |
| Public Administration | 3 (15.0%) | 17 (85.0%) |
| Total | 246 (49.4%) | 252 (50.6%) |
Education in Blue Ridge Manor
School Enrollment in Blue Ridge Manor
The most common levels of schooling among the 121 students in Blue Ridge Manor are elementary school (36 | 29.7%), high school (28 | 23.1%), and middle school (22 | 18.2%).
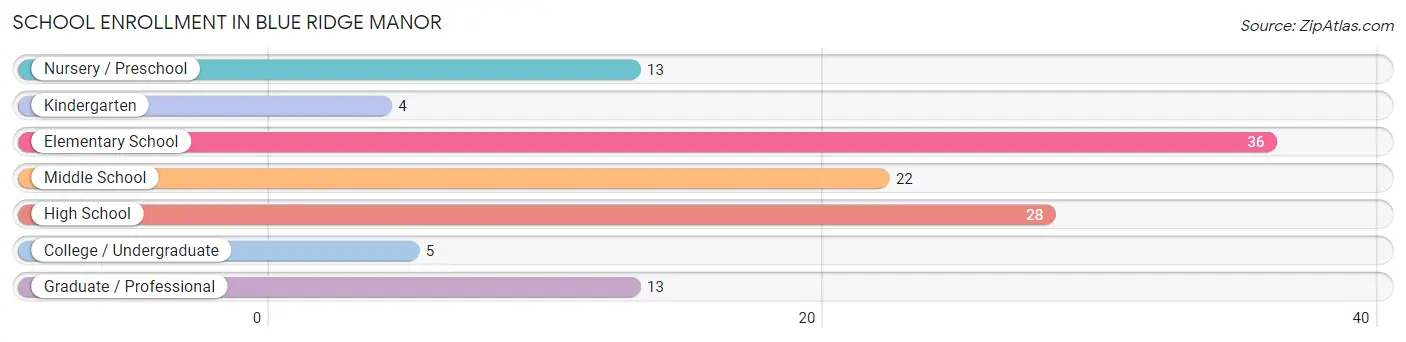
| School Level | # Students | % Students |
| Nursery / Preschool | 13 | 10.7% |
| Kindergarten | 4 | 3.3% |
| Elementary School | 36 | 29.7% |
| Middle School | 22 | 18.2% |
| High School | 28 | 23.1% |
| College / Undergraduate | 5 | 4.1% |
| Graduate / Professional | 13 | 10.7% |
| Total | 121 | 100.0% |
School Enrollment by Age by Funding Source in Blue Ridge Manor
Out of a total of 121 students who are enrolled in schools in Blue Ridge Manor, 42 (34.7%) attend a private institution, while the remaining 79 (65.3%) are enrolled in public schools. The age group of 35 years and over has the highest likelihood of being enrolled in private schools, with 2 (100.0% in the age bracket) enrolled. Conversely, the age group of 20 to 24 year olds has the lowest likelihood of being enrolled in a private school, with 3 (100.0% in the age bracket) attending a public institution.
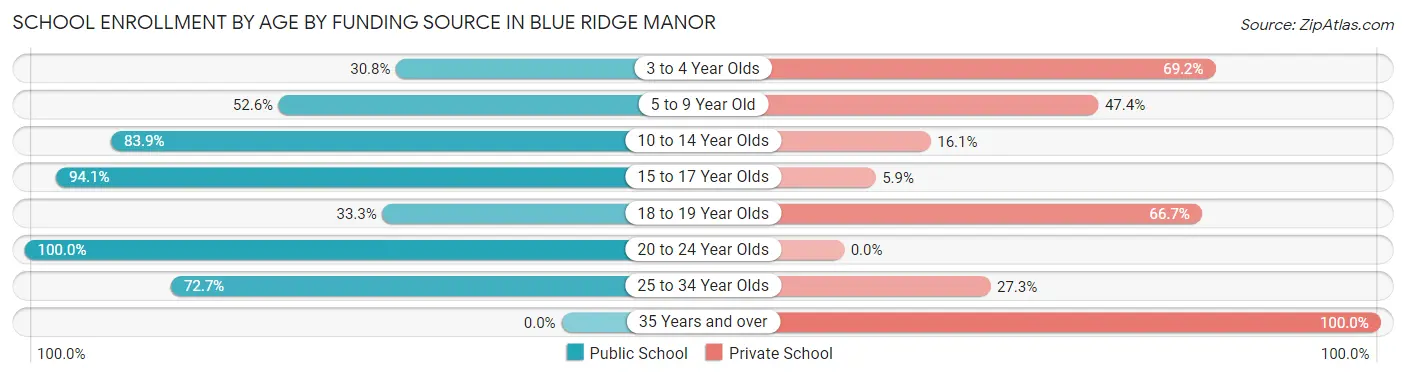
| Age Bracket | Public School | Private School |
| 3 to 4 Year Olds | 4 (30.8%) | 9 (69.2%) |
| 5 to 9 Year Old | 20 (52.6%) | 18 (47.4%) |
| 10 to 14 Year Olds | 26 (83.9%) | 5 (16.1%) |
| 15 to 17 Year Olds | 16 (94.1%) | 1 (5.9%) |
| 18 to 19 Year Olds | 2 (33.3%) | 4 (66.7%) |
| 20 to 24 Year Olds | 3 (100.0%) | 0 (0.0%) |
| 25 to 34 Year Olds | 8 (72.7%) | 3 (27.3%) |
| 35 Years and over | 0 (0.0%) | 2 (100.0%) |
| Total | 79 (65.3%) | 42 (34.7%) |
Educational Attainment by Field of Study in Blue Ridge Manor
Business (100 | 22.9%), education (52 | 11.9%), arts & humanities (51 | 11.7%), liberal arts & history (39 | 8.9%), and communications (30 | 6.9%) are the most common fields of study among 437 individuals in Blue Ridge Manor who have obtained a bachelor's degree or higher.
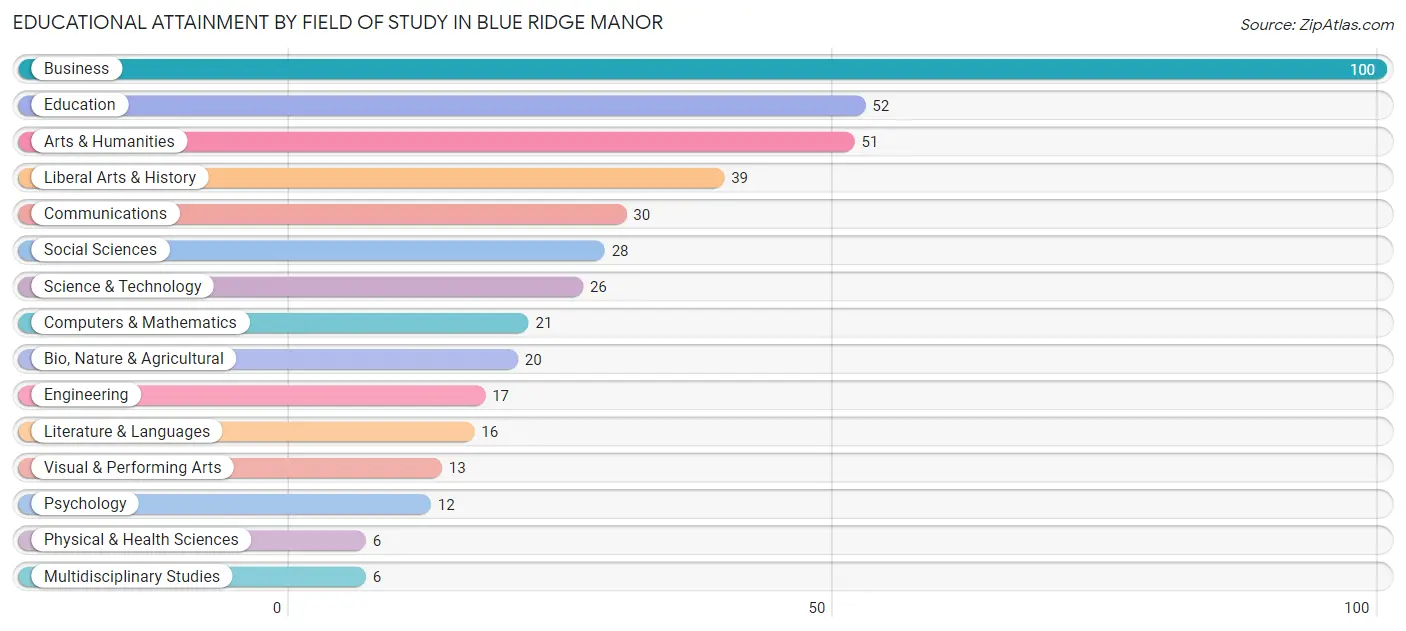
| Field of Study | # Graduates | % Graduates |
| Computers & Mathematics | 21 | 4.8% |
| Bio, Nature & Agricultural | 20 | 4.6% |
| Physical & Health Sciences | 6 | 1.4% |
| Psychology | 12 | 2.8% |
| Social Sciences | 28 | 6.4% |
| Engineering | 17 | 3.9% |
| Multidisciplinary Studies | 6 | 1.4% |
| Science & Technology | 26 | 5.9% |
| Business | 100 | 22.9% |
| Education | 52 | 11.9% |
| Literature & Languages | 16 | 3.7% |
| Liberal Arts & History | 39 | 8.9% |
| Visual & Performing Arts | 13 | 3.0% |
| Communications | 30 | 6.9% |
| Arts & Humanities | 51 | 11.7% |
| Total | 437 | 100.0% |
Transportation & Commute in Blue Ridge Manor
Vehicle Availability by Sex in Blue Ridge Manor
The most prevalent vehicle ownership categories in Blue Ridge Manor are males with 2 vehicles (143, accounting for 58.1%) and females with 2 vehicles (130, making up 57.2%).
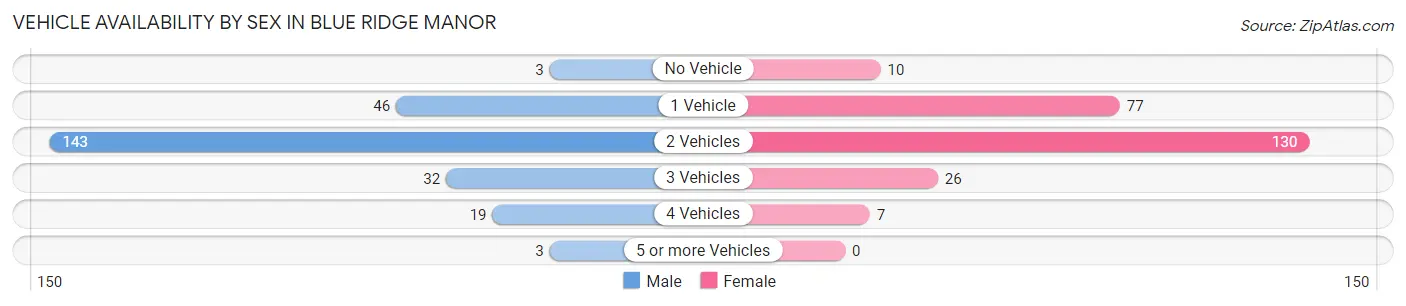
| Vehicles Available | Male | Female |
| No Vehicle | 3 (1.2%) | 10 (4.0%) |
| 1 Vehicle | 46 (18.7%) | 77 (30.8%) |
| 2 Vehicles | 143 (58.1%) | 130 (52.0%) |
| 3 Vehicles | 32 (13.0%) | 26 (10.4%) |
| 4 Vehicles | 19 (7.7%) | 7 (2.8%) |
| 5 or more Vehicles | 3 (1.2%) | 0 (0.0%) |
| Total | 246 (100.0%) | 250 (100.0%) |
Commute Time in Blue Ridge Manor
The most frequently occuring commute durations in Blue Ridge Manor are 15 to 19 minutes (84 commuters, 20.2%), 20 to 24 minutes (78 commuters, 18.8%), and 5 to 9 minutes (64 commuters, 15.4%).
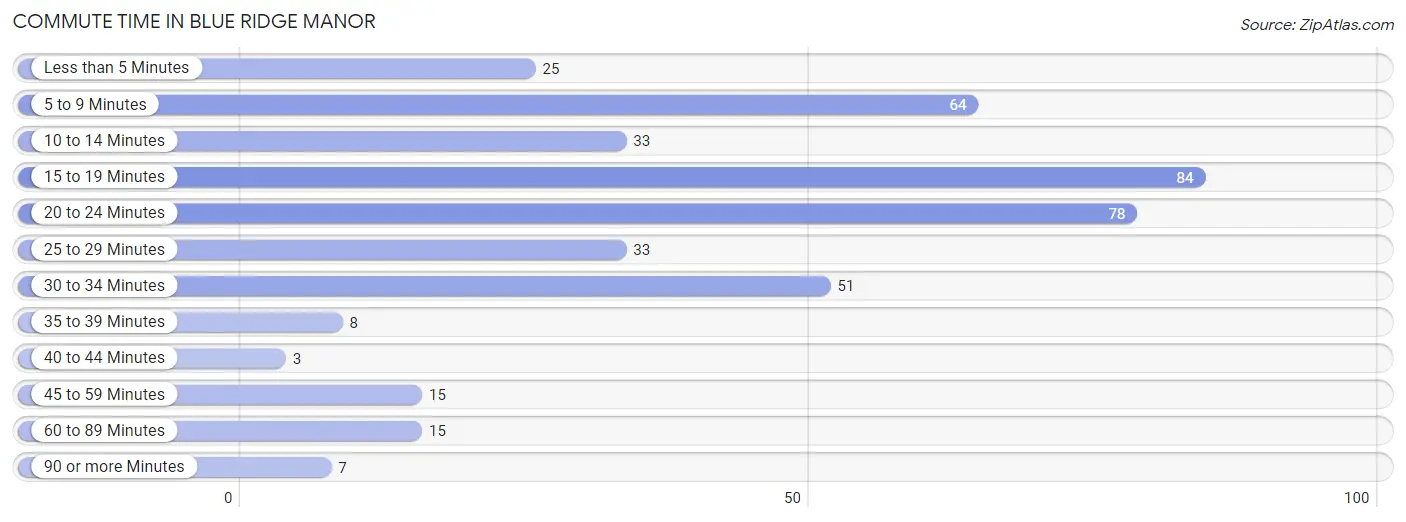
| Commute Time | # Commuters | % Commuters |
| Less than 5 Minutes | 25 | 6.0% |
| 5 to 9 Minutes | 64 | 15.4% |
| 10 to 14 Minutes | 33 | 7.9% |
| 15 to 19 Minutes | 84 | 20.2% |
| 20 to 24 Minutes | 78 | 18.8% |
| 25 to 29 Minutes | 33 | 7.9% |
| 30 to 34 Minutes | 51 | 12.3% |
| 35 to 39 Minutes | 8 | 1.9% |
| 40 to 44 Minutes | 3 | 0.7% |
| 45 to 59 Minutes | 15 | 3.6% |
| 60 to 89 Minutes | 15 | 3.6% |
| 90 or more Minutes | 7 | 1.7% |
Commute Time by Sex in Blue Ridge Manor
The most common commute times in Blue Ridge Manor are 15 to 19 minutes (46 commuters, 22.3%) for males and 15 to 19 minutes (38 commuters, 18.1%) for females.
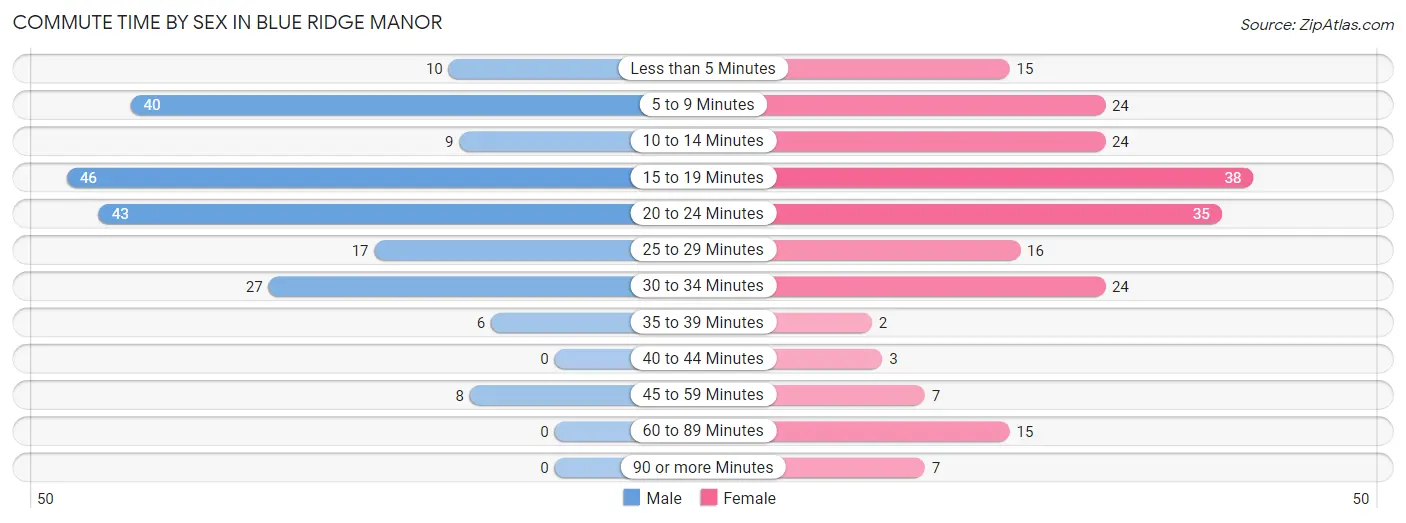
| Commute Time | Male | Female |
| Less than 5 Minutes | 10 (4.9%) | 15 (7.1%) |
| 5 to 9 Minutes | 40 (19.4%) | 24 (11.4%) |
| 10 to 14 Minutes | 9 (4.4%) | 24 (11.4%) |
| 15 to 19 Minutes | 46 (22.3%) | 38 (18.1%) |
| 20 to 24 Minutes | 43 (20.9%) | 35 (16.7%) |
| 25 to 29 Minutes | 17 (8.3%) | 16 (7.6%) |
| 30 to 34 Minutes | 27 (13.1%) | 24 (11.4%) |
| 35 to 39 Minutes | 6 (2.9%) | 2 (0.9%) |
| 40 to 44 Minutes | 0 (0.0%) | 3 (1.4%) |
| 45 to 59 Minutes | 8 (3.9%) | 7 (3.3%) |
| 60 to 89 Minutes | 0 (0.0%) | 15 (7.1%) |
| 90 or more Minutes | 0 (0.0%) | 7 (3.3%) |
Time of Departure to Work by Sex in Blue Ridge Manor
The most frequent times of departure to work in Blue Ridge Manor are 7:30 AM to 7:59 AM (54, 26.2%) for males and 8:00 AM to 8:29 AM (40, 19.1%) for females.
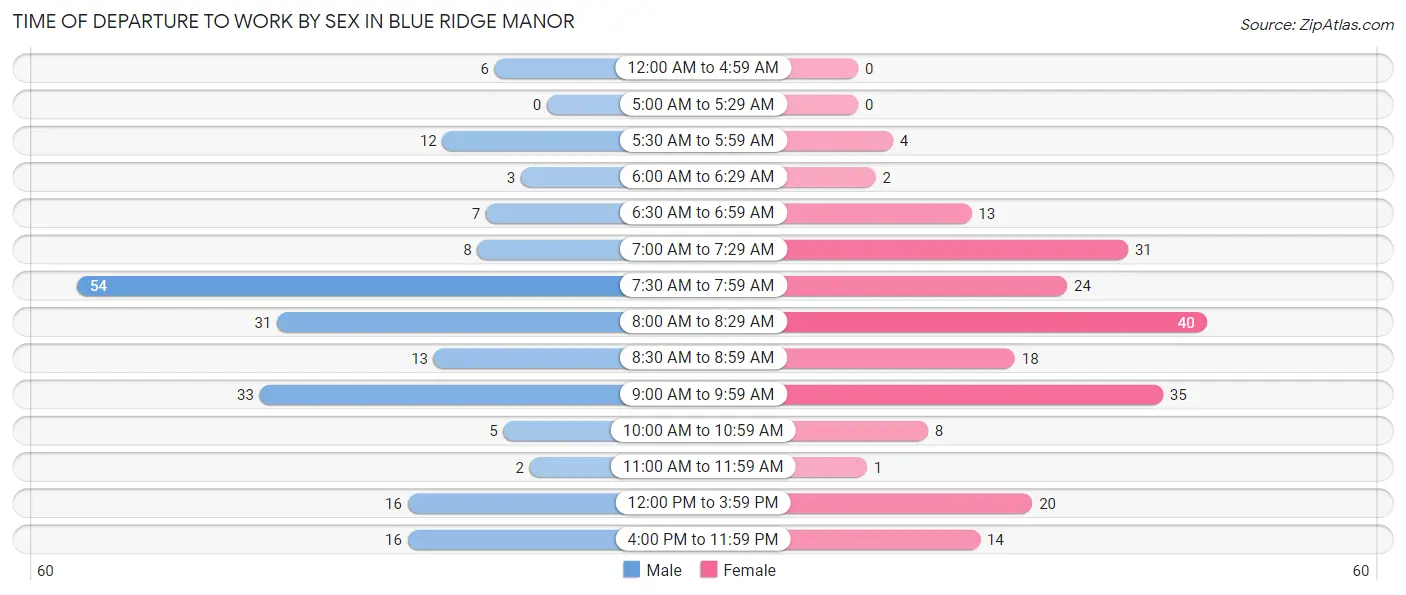
| Time of Departure | Male | Female |
| 12:00 AM to 4:59 AM | 6 (2.9%) | 0 (0.0%) |
| 5:00 AM to 5:29 AM | 0 (0.0%) | 0 (0.0%) |
| 5:30 AM to 5:59 AM | 12 (5.8%) | 4 (1.9%) |
| 6:00 AM to 6:29 AM | 3 (1.5%) | 2 (0.9%) |
| 6:30 AM to 6:59 AM | 7 (3.4%) | 13 (6.2%) |
| 7:00 AM to 7:29 AM | 8 (3.9%) | 31 (14.8%) |
| 7:30 AM to 7:59 AM | 54 (26.2%) | 24 (11.4%) |
| 8:00 AM to 8:29 AM | 31 (15.0%) | 40 (19.1%) |
| 8:30 AM to 8:59 AM | 13 (6.3%) | 18 (8.6%) |
| 9:00 AM to 9:59 AM | 33 (16.0%) | 35 (16.7%) |
| 10:00 AM to 10:59 AM | 5 (2.4%) | 8 (3.8%) |
| 11:00 AM to 11:59 AM | 2 (1.0%) | 1 (0.5%) |
| 12:00 PM to 3:59 PM | 16 (7.8%) | 20 (9.5%) |
| 4:00 PM to 11:59 PM | 16 (7.8%) | 14 (6.7%) |
| Total | 206 (100.0%) | 210 (100.0%) |
Housing Occupancy in Blue Ridge Manor
Occupancy by Ownership in Blue Ridge Manor
Of the total 474 dwellings in Blue Ridge Manor, owner-occupied units account for 410 (86.5%), while renter-occupied units make up 64 (13.5%).
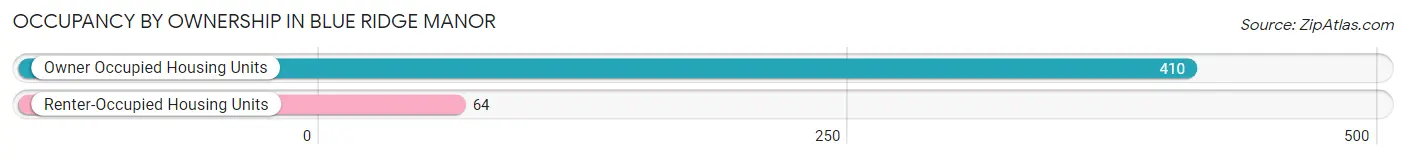
| Occupancy | # Housing Units | % Housing Units |
| Owner Occupied Housing Units | 410 | 86.5% |
| Renter-Occupied Housing Units | 64 | 13.5% |
| Total Occupied Housing Units | 474 | 100.0% |
Occupancy by Household Size in Blue Ridge Manor
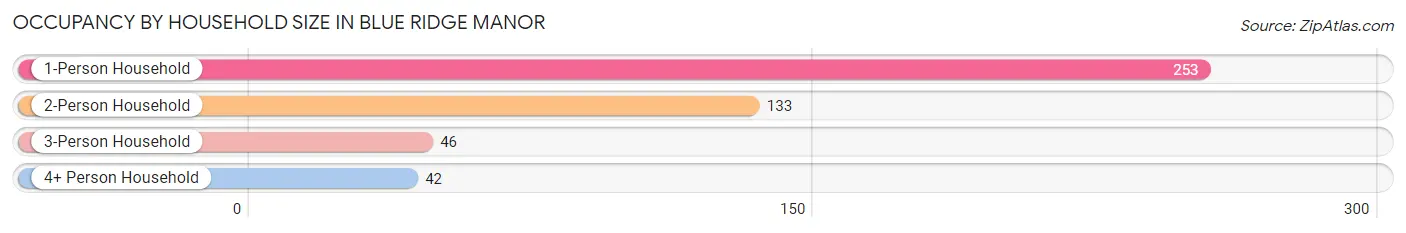
| Household Size | # Housing Units | % Housing Units |
| 1-Person Household | 253 | 53.4% |
| 2-Person Household | 133 | 28.1% |
| 3-Person Household | 46 | 9.7% |
| 4+ Person Household | 42 | 8.9% |
| Total Housing Units | 474 | 100.0% |
Occupancy by Ownership by Household Size in Blue Ridge Manor
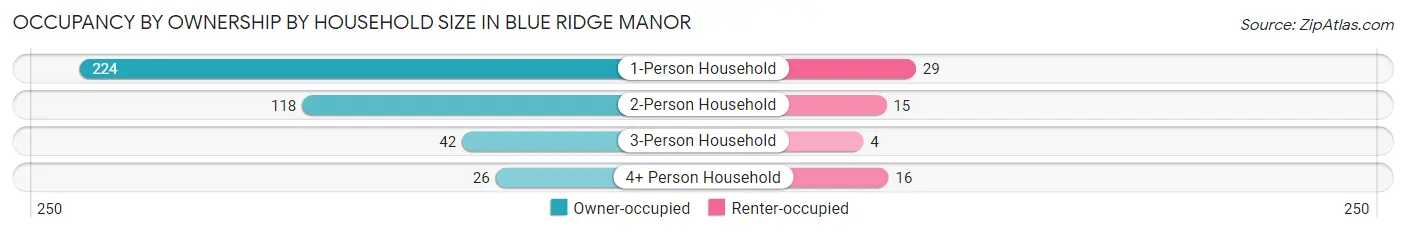
| Household Size | Owner-occupied | Renter-occupied |
| 1-Person Household | 224 (88.5%) | 29 (11.5%) |
| 2-Person Household | 118 (88.7%) | 15 (11.3%) |
| 3-Person Household | 42 (91.3%) | 4 (8.7%) |
| 4+ Person Household | 26 (61.9%) | 16 (38.1%) |
| Total Housing Units | 410 (86.5%) | 64 (13.5%) |
Occupancy by Educational Attainment in Blue Ridge Manor
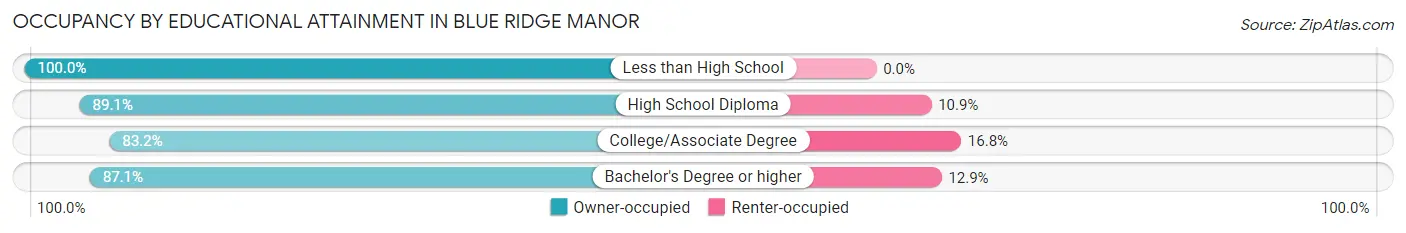
| Household Size | Owner-occupied | Renter-occupied |
| Less than High School | 8 (100.0%) | 0 (0.0%) |
| High School Diploma | 49 (89.1%) | 6 (10.9%) |
| College/Associate Degree | 104 (83.2%) | 21 (16.8%) |
| Bachelor's Degree or higher | 249 (87.1%) | 37 (12.9%) |
Occupancy by Age of Householder in Blue Ridge Manor
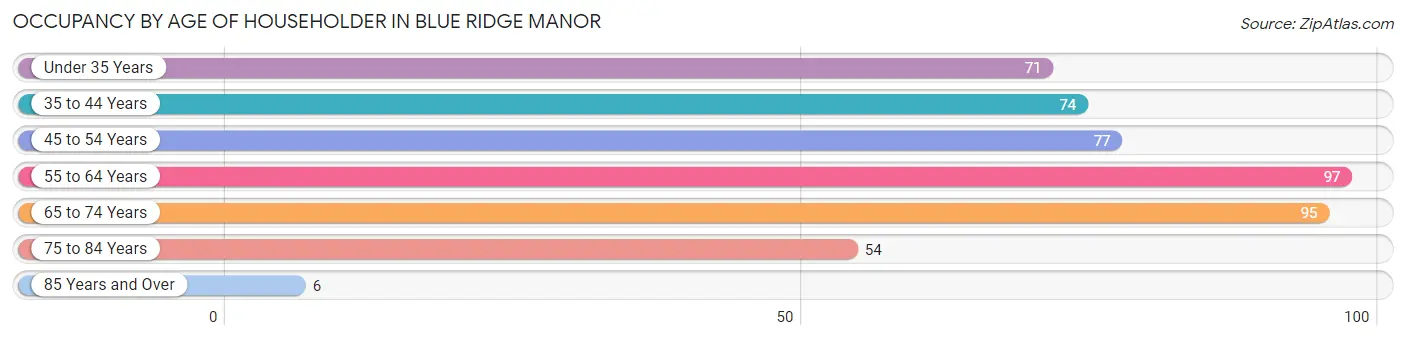
| Age Bracket | # Households | % Households |
| Under 35 Years | 71 | 15.0% |
| 35 to 44 Years | 74 | 15.6% |
| 45 to 54 Years | 77 | 16.2% |
| 55 to 64 Years | 97 | 20.5% |
| 65 to 74 Years | 95 | 20.0% |
| 75 to 84 Years | 54 | 11.4% |
| 85 Years and Over | 6 | 1.3% |
| Total | 474 | 100.0% |
Housing Finances in Blue Ridge Manor
Median Income by Occupancy in Blue Ridge Manor
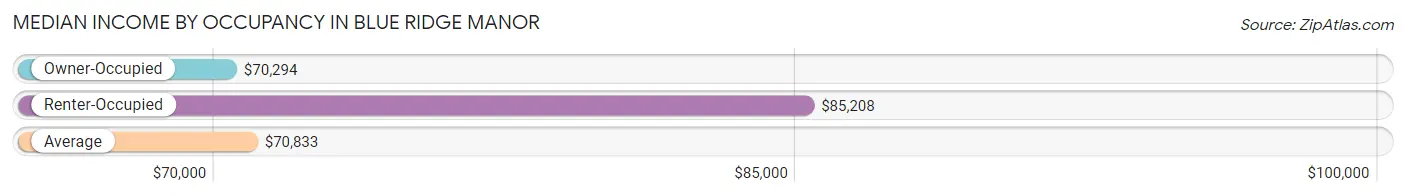
| Occupancy Type | # Households | Median Income |
| Owner-Occupied | 410 (86.5%) | $70,294 |
| Renter-Occupied | 64 (13.5%) | $85,208 |
| Average | 474 (100.0%) | $70,833 |
Occupancy by Householder Income Bracket in Blue Ridge Manor
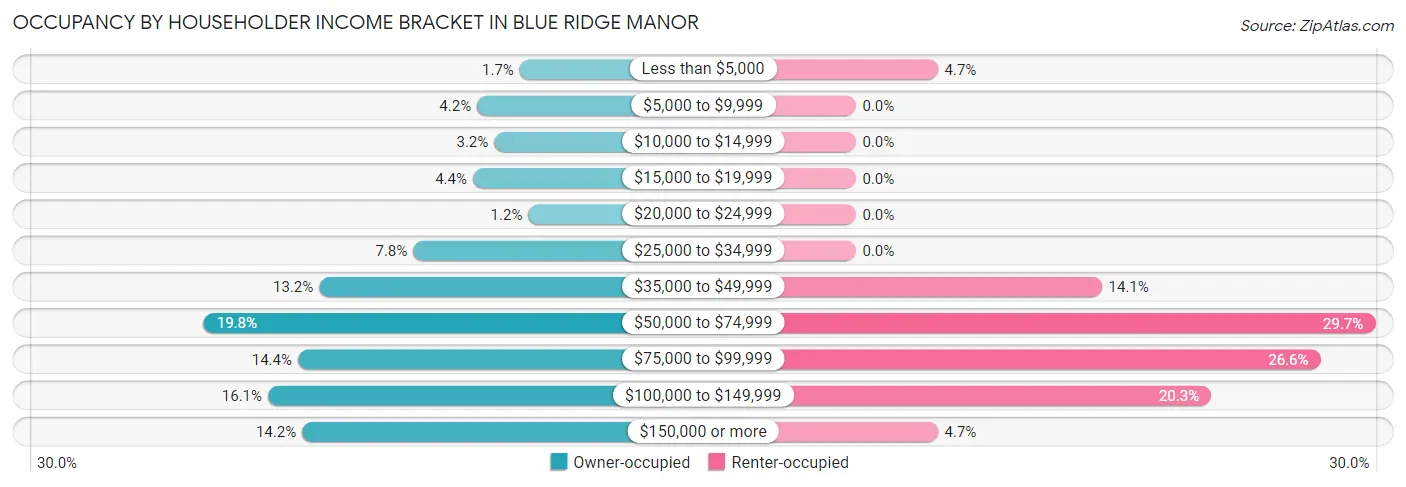
| Income Bracket | Owner-occupied | Renter-occupied |
| Less than $5,000 | 7 (1.7%) | 3 (4.7%) |
| $5,000 to $9,999 | 17 (4.2%) | 0 (0.0%) |
| $10,000 to $14,999 | 13 (3.2%) | 0 (0.0%) |
| $15,000 to $19,999 | 18 (4.4%) | 0 (0.0%) |
| $20,000 to $24,999 | 5 (1.2%) | 0 (0.0%) |
| $25,000 to $34,999 | 32 (7.8%) | 0 (0.0%) |
| $35,000 to $49,999 | 54 (13.2%) | 9 (14.1%) |
| $50,000 to $74,999 | 81 (19.8%) | 19 (29.7%) |
| $75,000 to $99,999 | 59 (14.4%) | 17 (26.6%) |
| $100,000 to $149,999 | 66 (16.1%) | 13 (20.3%) |
| $150,000 or more | 58 (14.1%) | 3 (4.7%) |
| Total | 410 (100.0%) | 64 (100.0%) |
Monthly Housing Cost Tiers in Blue Ridge Manor
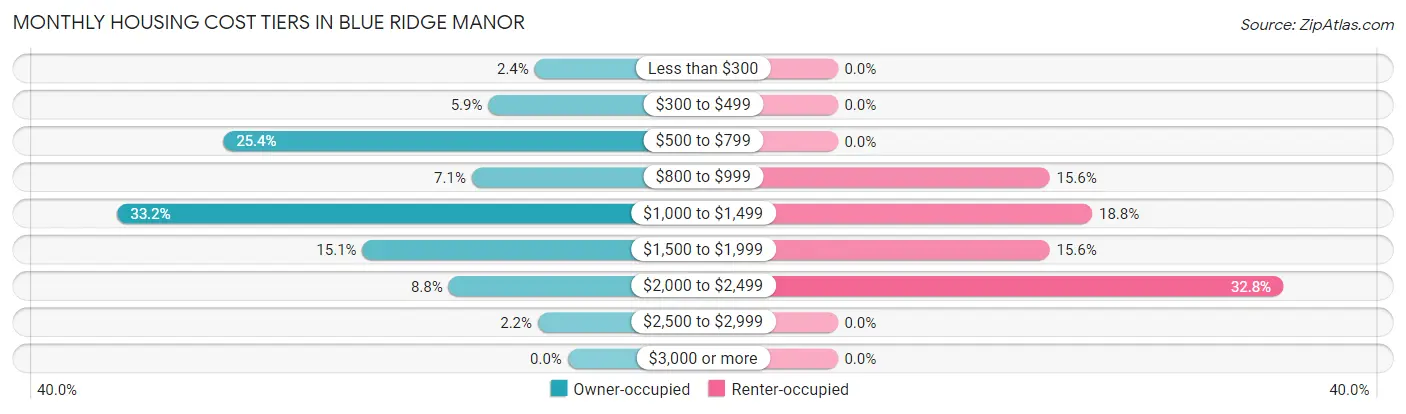
| Monthly Cost | Owner-occupied | Renter-occupied |
| Less than $300 | 10 (2.4%) | 0 (0.0%) |
| $300 to $499 | 24 (5.9%) | 0 (0.0%) |
| $500 to $799 | 104 (25.4%) | 0 (0.0%) |
| $800 to $999 | 29 (7.1%) | 10 (15.6%) |
| $1,000 to $1,499 | 136 (33.2%) | 12 (18.8%) |
| $1,500 to $1,999 | 62 (15.1%) | 10 (15.6%) |
| $2,000 to $2,499 | 36 (8.8%) | 21 (32.8%) |
| $2,500 to $2,999 | 9 (2.2%) | 0 (0.0%) |
| $3,000 or more | 0 (0.0%) | 0 (0.0%) |
| Total | 410 (100.0%) | 64 (100.0%) |
Physical Housing Characteristics in Blue Ridge Manor
Housing Structures in Blue Ridge Manor
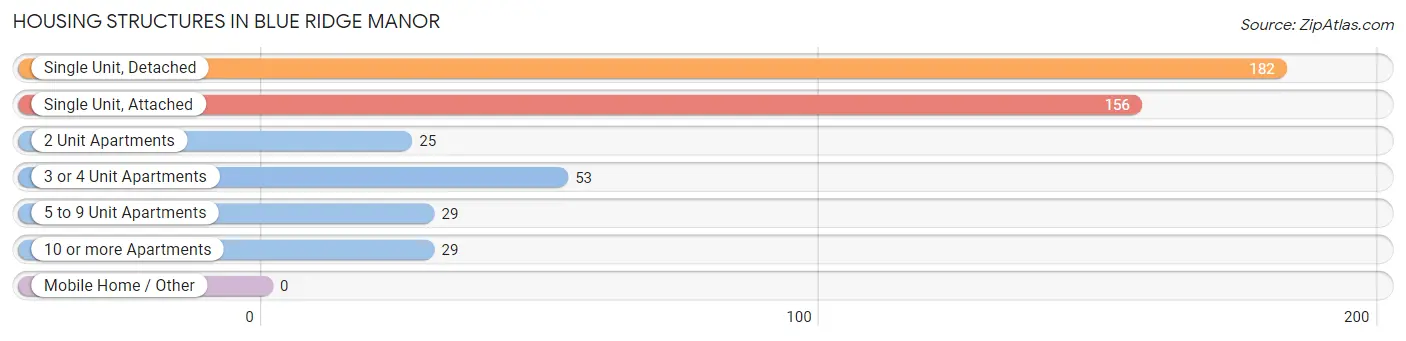
| Structure Type | # Housing Units | % Housing Units |
| Single Unit, Detached | 182 | 38.4% |
| Single Unit, Attached | 156 | 32.9% |
| 2 Unit Apartments | 25 | 5.3% |
| 3 or 4 Unit Apartments | 53 | 11.2% |
| 5 to 9 Unit Apartments | 29 | 6.1% |
| 10 or more Apartments | 29 | 6.1% |
| Mobile Home / Other | 0 | 0.0% |
| Total | 474 | 100.0% |
Housing Structures by Occupancy in Blue Ridge Manor
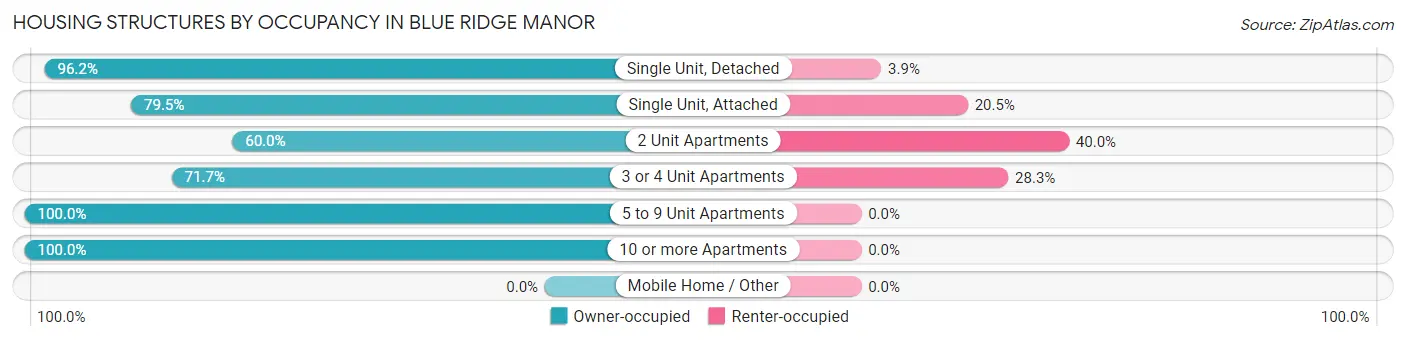
| Structure Type | Owner-occupied | Renter-occupied |
| Single Unit, Detached | 175 (96.2%) | 7 (3.8%) |
| Single Unit, Attached | 124 (79.5%) | 32 (20.5%) |
| 2 Unit Apartments | 15 (60.0%) | 10 (40.0%) |
| 3 or 4 Unit Apartments | 38 (71.7%) | 15 (28.3%) |
| 5 to 9 Unit Apartments | 29 (100.0%) | 0 (0.0%) |
| 10 or more Apartments | 29 (100.0%) | 0 (0.0%) |
| Mobile Home / Other | 0 (0.0%) | 0 (0.0%) |
| Total | 410 (86.5%) | 64 (13.5%) |
Housing Structures by Number of Rooms in Blue Ridge Manor
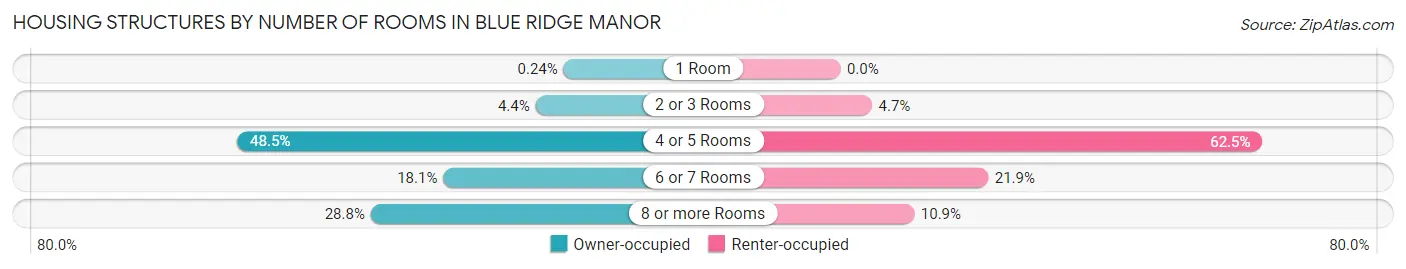
| Number of Rooms | Owner-occupied | Renter-occupied |
| 1 Room | 1 (0.2%) | 0 (0.0%) |
| 2 or 3 Rooms | 18 (4.4%) | 3 (4.7%) |
| 4 or 5 Rooms | 199 (48.5%) | 40 (62.5%) |
| 6 or 7 Rooms | 74 (18.0%) | 14 (21.9%) |
| 8 or more Rooms | 118 (28.8%) | 7 (10.9%) |
| Total | 410 (100.0%) | 64 (100.0%) |
Housing Structure by Heating Type in Blue Ridge Manor
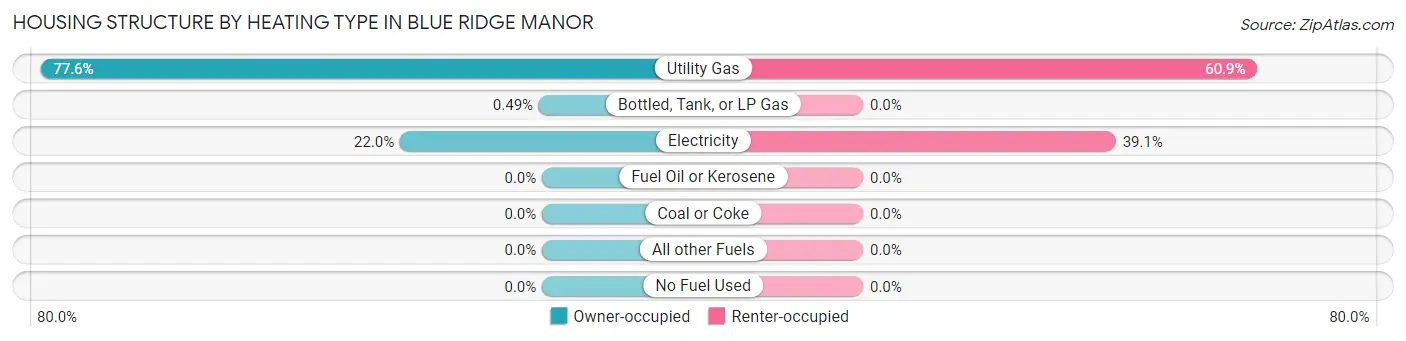
| Heating Type | Owner-occupied | Renter-occupied |
| Utility Gas | 318 (77.6%) | 39 (60.9%) |
| Bottled, Tank, or LP Gas | 2 (0.5%) | 0 (0.0%) |
| Electricity | 90 (22.0%) | 25 (39.1%) |
| Fuel Oil or Kerosene | 0 (0.0%) | 0 (0.0%) |
| Coal or Coke | 0 (0.0%) | 0 (0.0%) |
| All other Fuels | 0 (0.0%) | 0 (0.0%) |
| No Fuel Used | 0 (0.0%) | 0 (0.0%) |
| Total | 410 (100.0%) | 64 (100.0%) |
Household Vehicle Usage in Blue Ridge Manor
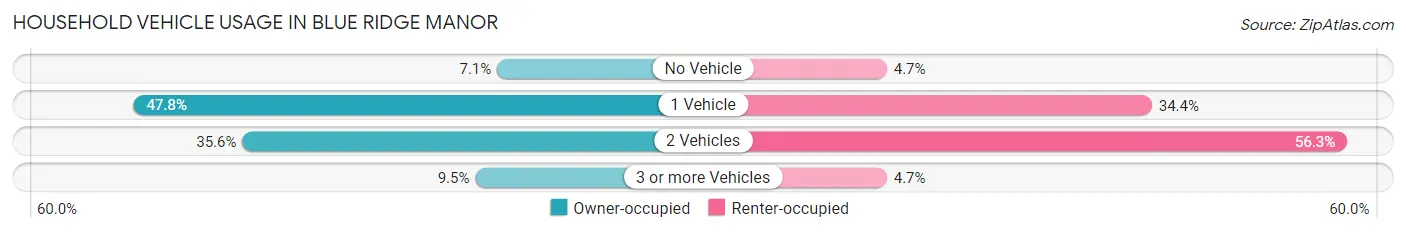
| Vehicles per Household | Owner-occupied | Renter-occupied |
| No Vehicle | 29 (7.1%) | 3 (4.7%) |
| 1 Vehicle | 196 (47.8%) | 22 (34.4%) |
| 2 Vehicles | 146 (35.6%) | 36 (56.2%) |
| 3 or more Vehicles | 39 (9.5%) | 3 (4.7%) |
| Total | 410 (100.0%) | 64 (100.0%) |
Real Estate & Mortgages in Blue Ridge Manor
Real Estate and Mortgage Overview in Blue Ridge Manor
| Characteristic | Without Mortgage | With Mortgage |
| Housing Units | 154 | 256 |
| Median Property Value | $196,300 | $197,700 |
| Median Household Income | $42,344 | $52 |
| Monthly Housing Costs | $558 | $0 |
| Real Estate Taxes | $1,736 | $3 |
Property Value by Mortgage Status in Blue Ridge Manor
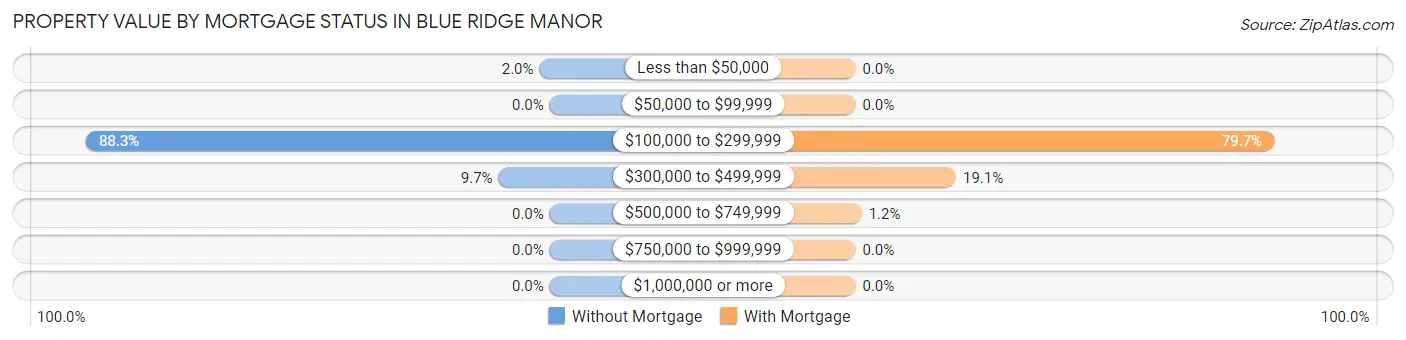
| Property Value | Without Mortgage | With Mortgage |
| Less than $50,000 | 3 (1.9%) | 0 (0.0%) |
| $50,000 to $99,999 | 0 (0.0%) | 0 (0.0%) |
| $100,000 to $299,999 | 136 (88.3%) | 204 (79.7%) |
| $300,000 to $499,999 | 15 (9.7%) | 49 (19.1%) |
| $500,000 to $749,999 | 0 (0.0%) | 3 (1.2%) |
| $750,000 to $999,999 | 0 (0.0%) | 0 (0.0%) |
| $1,000,000 or more | 0 (0.0%) | 0 (0.0%) |
| Total | 154 (100.0%) | 256 (100.0%) |
Household Income by Mortgage Status in Blue Ridge Manor
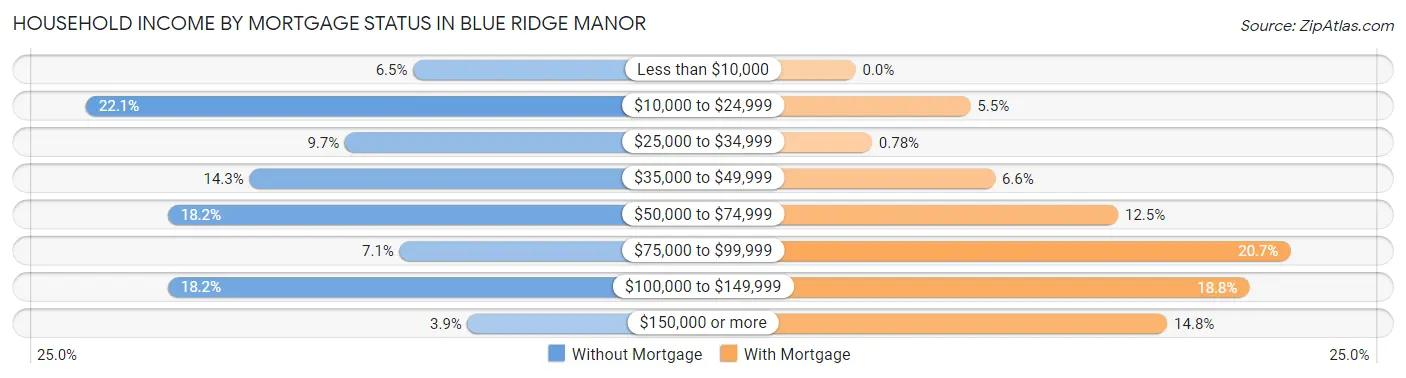
| Household Income | Without Mortgage | With Mortgage |
| Less than $10,000 | 10 (6.5%) | 0 (0.0%) |
| $10,000 to $24,999 | 34 (22.1%) | 14 (5.5%) |
| $25,000 to $34,999 | 15 (9.7%) | 2 (0.8%) |
| $35,000 to $49,999 | 22 (14.3%) | 17 (6.6%) |
| $50,000 to $74,999 | 28 (18.2%) | 32 (12.5%) |
| $75,000 to $99,999 | 11 (7.1%) | 53 (20.7%) |
| $100,000 to $149,999 | 28 (18.2%) | 48 (18.8%) |
| $150,000 or more | 6 (3.9%) | 38 (14.8%) |
| Total | 154 (100.0%) | 256 (100.0%) |
Property Value to Household Income Ratio in Blue Ridge Manor
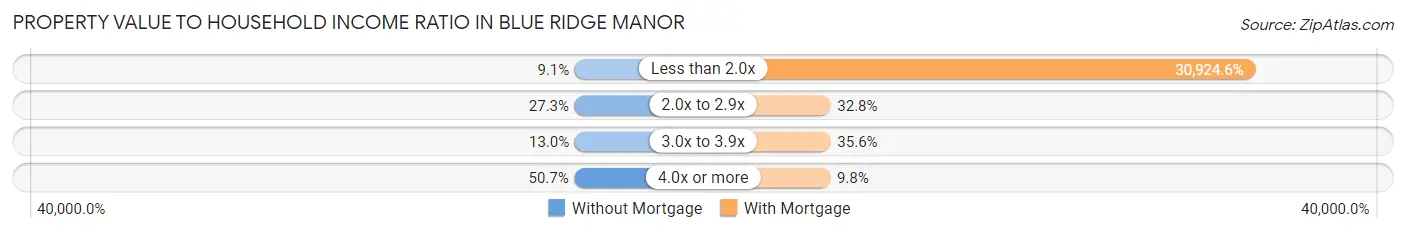
| Value-to-Income Ratio | Without Mortgage | With Mortgage |
| Less than 2.0x | 14 (9.1%) | 79,167 (30,924.6%) |
| 2.0x to 2.9x | 42 (27.3%) | 84 (32.8%) |
| 3.0x to 3.9x | 20 (13.0%) | 91 (35.5%) |
| 4.0x or more | 78 (50.6%) | 25 (9.8%) |
| Total | 154 (100.0%) | 256 (100.0%) |
Real Estate Taxes by Mortgage Status in Blue Ridge Manor
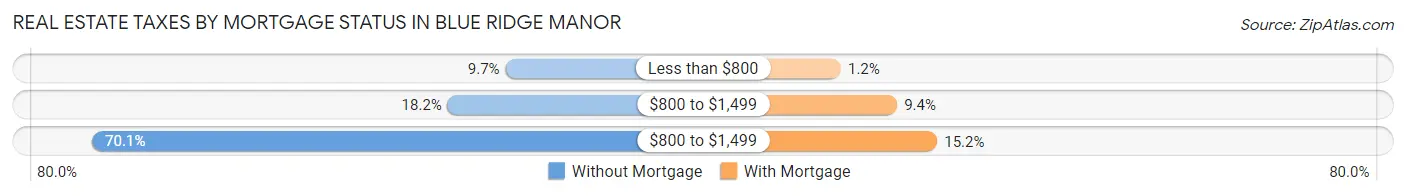
| Property Taxes | Without Mortgage | With Mortgage |
| Less than $800 | 15 (9.7%) | 3 (1.2%) |
| $800 to $1,499 | 28 (18.2%) | 24 (9.4%) |
| $800 to $1,499 | 108 (70.1%) | 39 (15.2%) |
| Total | 154 (100.0%) | 256 (100.0%) |
Health & Disability in Blue Ridge Manor
Health Insurance Coverage by Age in Blue Ridge Manor
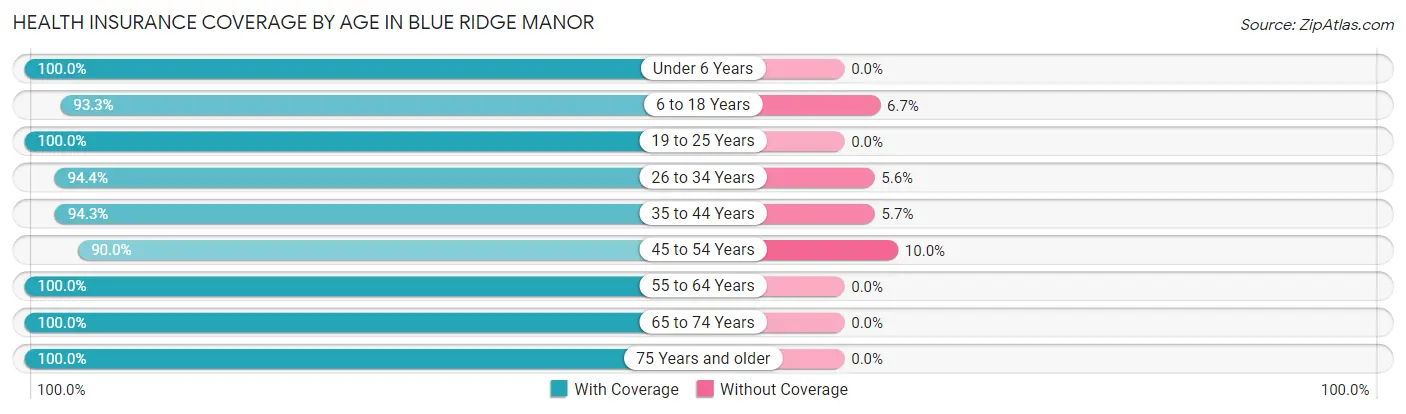
| Age Bracket | With Coverage | Without Coverage |
| Under 6 Years | 29 (100.0%) | 0 (0.0%) |
| 6 to 18 Years | 84 (93.3%) | 6 (6.7%) |
| 19 to 25 Years | 32 (100.0%) | 0 (0.0%) |
| 26 to 34 Years | 118 (94.4%) | 7 (5.6%) |
| 35 to 44 Years | 100 (94.3%) | 6 (5.7%) |
| 45 to 54 Years | 117 (90.0%) | 13 (10.0%) |
| 55 to 64 Years | 157 (100.0%) | 0 (0.0%) |
| 65 to 74 Years | 103 (100.0%) | 0 (0.0%) |
| 75 Years and older | 82 (100.0%) | 0 (0.0%) |
| Total | 822 (96.3%) | 32 (3.7%) |
Health Insurance Coverage by Citizenship Status in Blue Ridge Manor
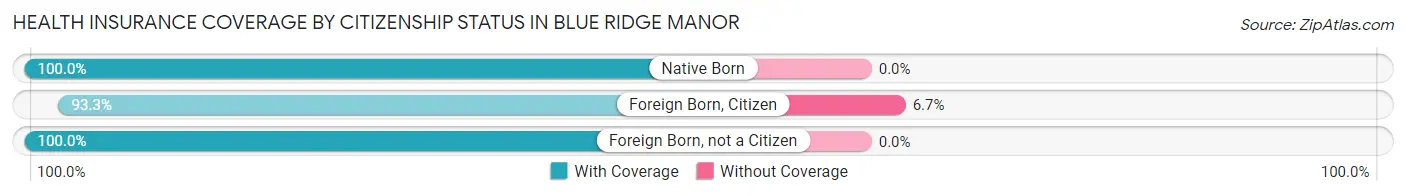
| Citizenship Status | With Coverage | Without Coverage |
| Native Born | 29 (100.0%) | 0 (0.0%) |
| Foreign Born, Citizen | 84 (93.3%) | 6 (6.7%) |
| Foreign Born, not a Citizen | 32 (100.0%) | 0 (0.0%) |
Health Insurance Coverage by Household Income in Blue Ridge Manor
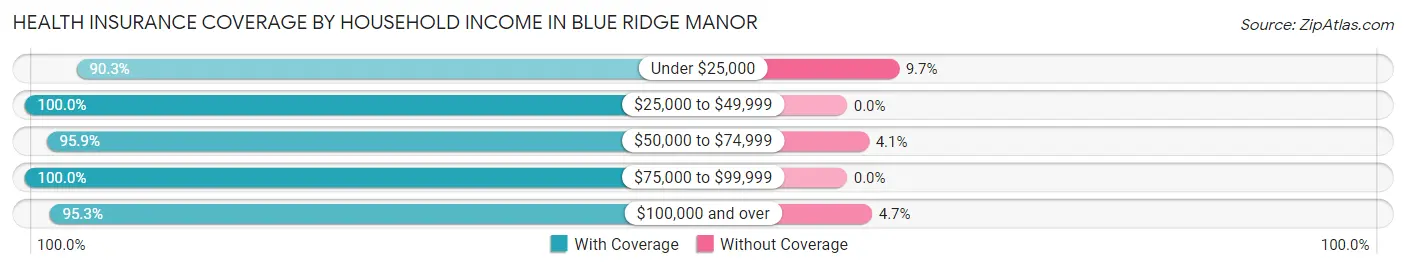
| Household Income | With Coverage | Without Coverage |
| Under $25,000 | 65 (90.3%) | 7 (9.7%) |
| $25,000 to $49,999 | 111 (100.0%) | 0 (0.0%) |
| $50,000 to $74,999 | 140 (95.9%) | 6 (4.1%) |
| $75,000 to $99,999 | 119 (100.0%) | 0 (0.0%) |
| $100,000 and over | 387 (95.3%) | 19 (4.7%) |
Public vs Private Health Insurance Coverage by Age in Blue Ridge Manor
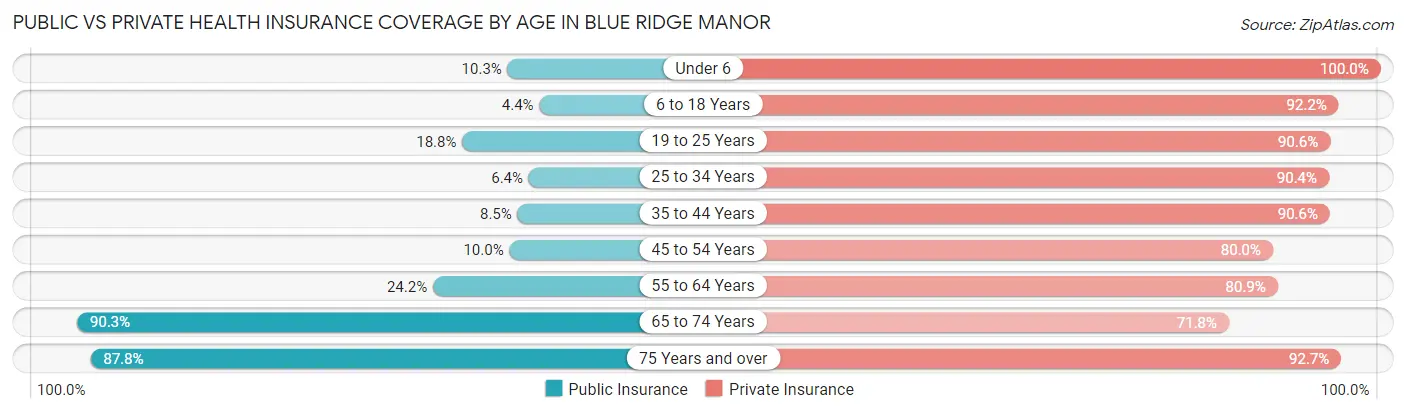
| Age Bracket | Public Insurance | Private Insurance |
| Under 6 | 3 (10.3%) | 29 (100.0%) |
| 6 to 18 Years | 4 (4.4%) | 83 (92.2%) |
| 19 to 25 Years | 6 (18.8%) | 29 (90.6%) |
| 25 to 34 Years | 8 (6.4%) | 113 (90.4%) |
| 35 to 44 Years | 9 (8.5%) | 96 (90.6%) |
| 45 to 54 Years | 13 (10.0%) | 104 (80.0%) |
| 55 to 64 Years | 38 (24.2%) | 127 (80.9%) |
| 65 to 74 Years | 93 (90.3%) | 74 (71.8%) |
| 75 Years and over | 72 (87.8%) | 76 (92.7%) |
| Total | 246 (28.8%) | 731 (85.6%) |
Disability Status by Sex by Age in Blue Ridge Manor
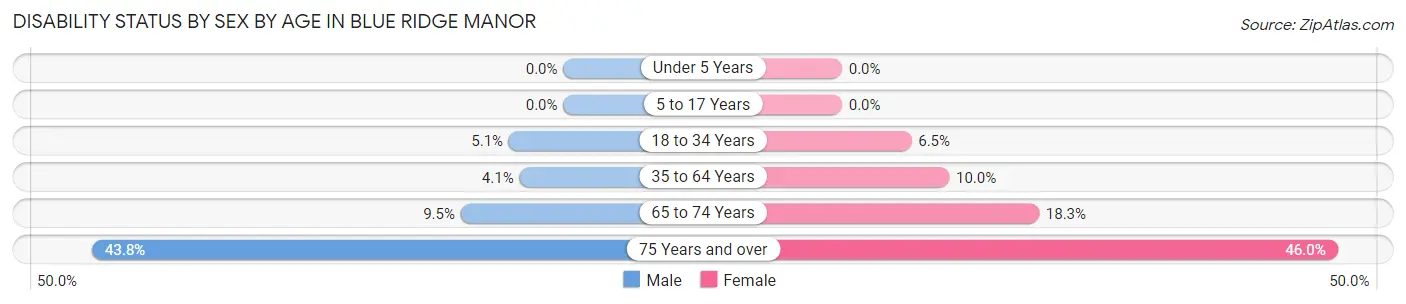
| Age Bracket | Male | Female |
| Under 5 Years | 0 (0.0%) | 0 (0.0%) |
| 5 to 17 Years | 0 (0.0%) | 0 (0.0%) |
| 18 to 34 Years | 5 (5.1%) | 4 (6.5%) |
| 35 to 64 Years | 7 (4.1%) | 22 (10.0%) |
| 65 to 74 Years | 2 (9.5%) | 15 (18.3%) |
| 75 Years and over | 14 (43.8%) | 23 (46.0%) |
Disability Class by Sex by Age in Blue Ridge Manor
Disability Class: Hearing Difficulty
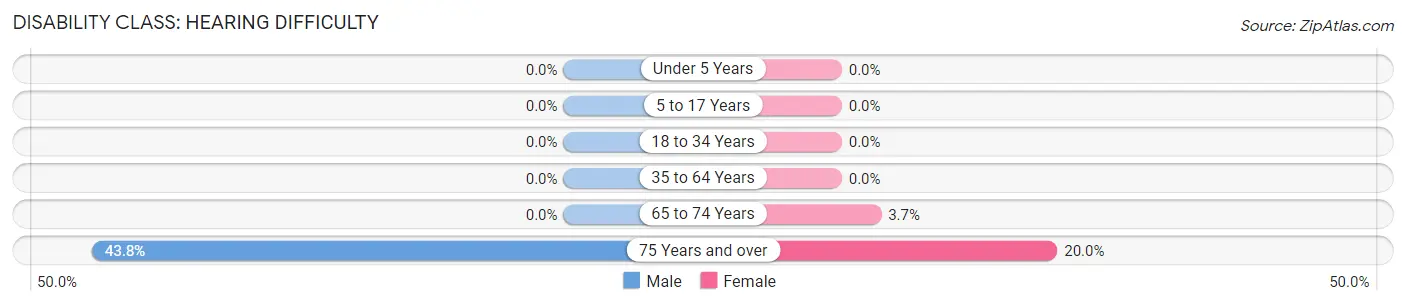
| Age Bracket | Male | Female |
| Under 5 Years | 0 (0.0%) | 0 (0.0%) |
| 5 to 17 Years | 0 (0.0%) | 0 (0.0%) |
| 18 to 34 Years | 0 (0.0%) | 0 (0.0%) |
| 35 to 64 Years | 0 (0.0%) | 0 (0.0%) |
| 65 to 74 Years | 0 (0.0%) | 3 (3.7%) |
| 75 Years and over | 14 (43.8%) | 10 (20.0%) |
Disability Class: Vision Difficulty
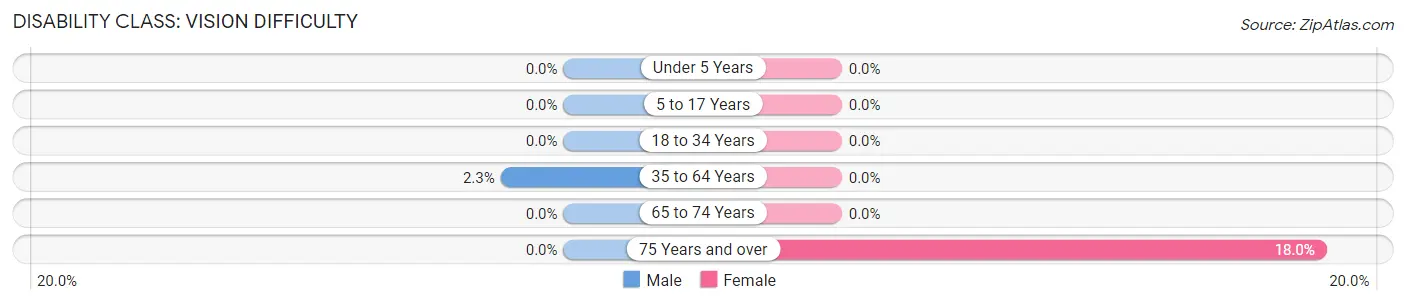
| Age Bracket | Male | Female |
| Under 5 Years | 0 (0.0%) | 0 (0.0%) |
| 5 to 17 Years | 0 (0.0%) | 0 (0.0%) |
| 18 to 34 Years | 0 (0.0%) | 0 (0.0%) |
| 35 to 64 Years | 4 (2.3%) | 0 (0.0%) |
| 65 to 74 Years | 0 (0.0%) | 0 (0.0%) |
| 75 Years and over | 0 (0.0%) | 9 (18.0%) |
Disability Class: Cognitive Difficulty
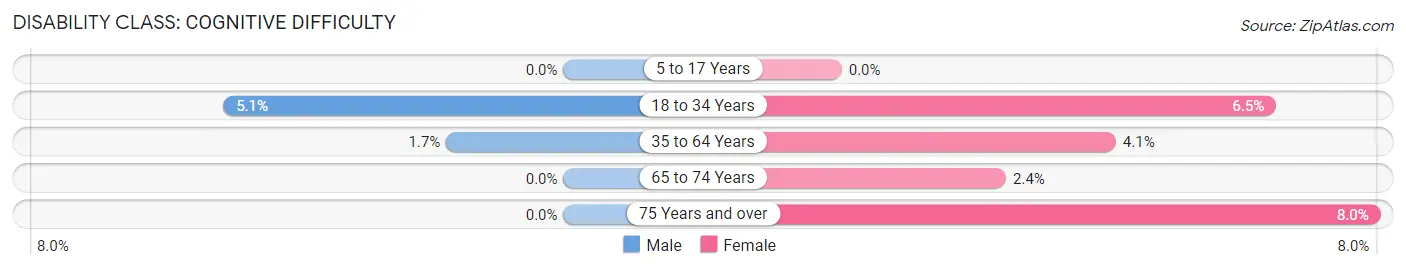
| Age Bracket | Male | Female |
| 5 to 17 Years | 0 (0.0%) | 0 (0.0%) |
| 18 to 34 Years | 5 (5.1%) | 4 (6.5%) |
| 35 to 64 Years | 3 (1.7%) | 9 (4.1%) |
| 65 to 74 Years | 0 (0.0%) | 2 (2.4%) |
| 75 Years and over | 0 (0.0%) | 4 (8.0%) |
Disability Class: Ambulatory Difficulty
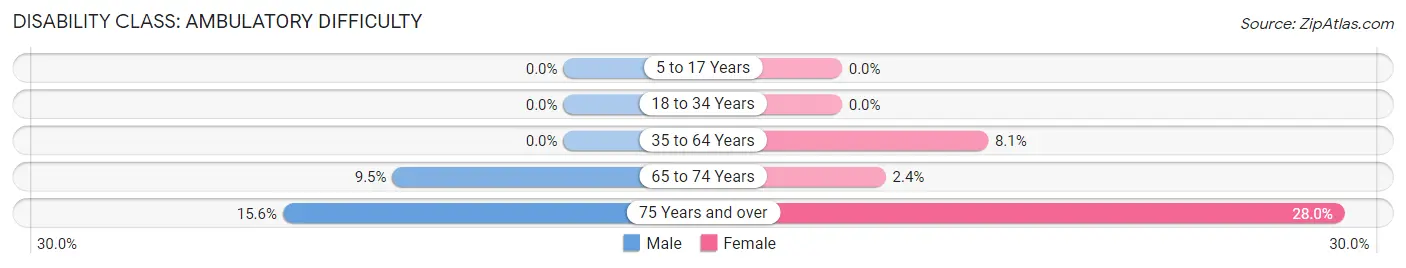
| Age Bracket | Male | Female |
| 5 to 17 Years | 0 (0.0%) | 0 (0.0%) |
| 18 to 34 Years | 0 (0.0%) | 0 (0.0%) |
| 35 to 64 Years | 0 (0.0%) | 18 (8.1%) |
| 65 to 74 Years | 2 (9.5%) | 2 (2.4%) |
| 75 Years and over | 5 (15.6%) | 14 (28.0%) |
Disability Class: Self-Care Difficulty
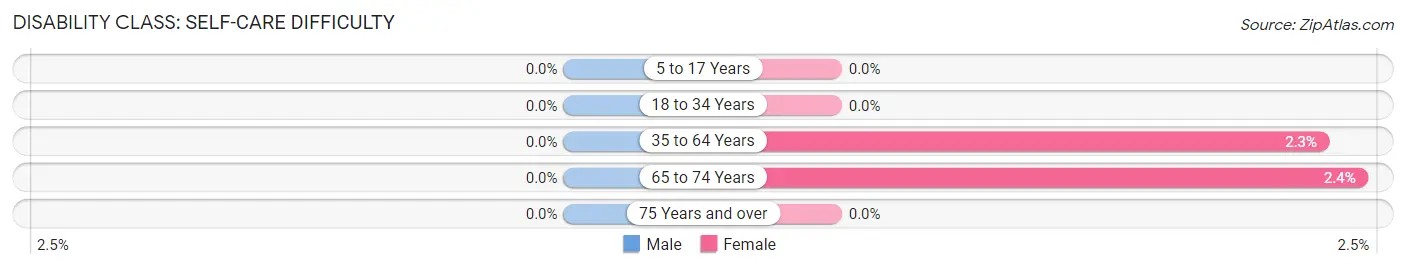
| Age Bracket | Male | Female |
| 5 to 17 Years | 0 (0.0%) | 0 (0.0%) |
| 18 to 34 Years | 0 (0.0%) | 0 (0.0%) |
| 35 to 64 Years | 0 (0.0%) | 5 (2.3%) |
| 65 to 74 Years | 0 (0.0%) | 2 (2.4%) |
| 75 Years and over | 0 (0.0%) | 0 (0.0%) |
Technology Access in Blue Ridge Manor
Computing Device Access in Blue Ridge Manor
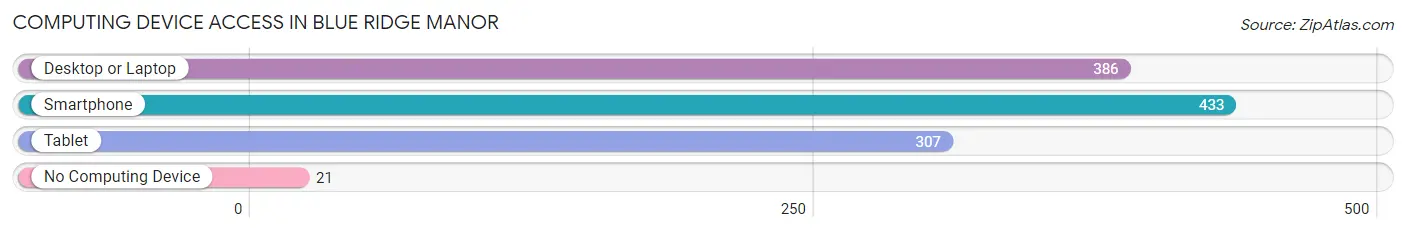
| Device Type | # Households | % Households |
| Desktop or Laptop | 386 | 81.4% |
| Smartphone | 433 | 91.3% |
| Tablet | 307 | 64.8% |
| No Computing Device | 21 | 4.4% |
| Total | 474 | 100.0% |
Internet Access in Blue Ridge Manor
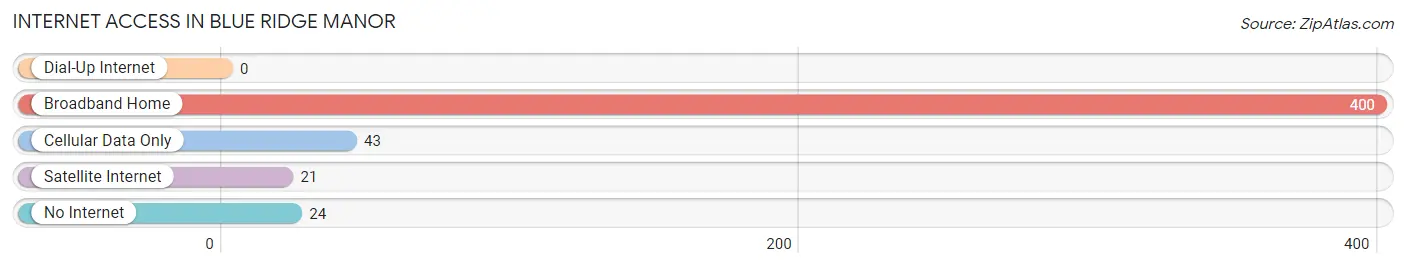
| Internet Type | # Households | % Households |
| Dial-Up Internet | 0 | 0.0% |
| Broadband Home | 400 | 84.4% |
| Cellular Data Only | 43 | 9.1% |
| Satellite Internet | 21 | 4.4% |
| No Internet | 24 | 5.1% |
| Total | 474 | 100.0% |
Blue Ridge Manor Summary
Introduction
Blue Ridge Manor is a small unincorporated community located in Jefferson County, Kentucky. It is situated on the banks of the Ohio River, just south of Louisville. The community is home to a diverse population of approximately 1,000 people. The area is known for its rural charm and its proximity to the city of Louisville.
History
Blue Ridge Manor was first settled in the early 1800s by a group of German immigrants. The area was originally known as “Blue Ridge” and was part of a larger area known as “The German Settlement”. The area was home to a number of small farms and businesses, and the community grew steadily over the years.
In the late 1800s, the area was annexed by the city of Louisville and became known as “Blue Ridge Manor”. The area was home to a number of small businesses, including a general store, a blacksmith shop, and a post office. The area was also home to a number of churches, including the Blue Ridge Manor Methodist Church, which was founded in 1883.
In the early 1900s, the area began to experience a period of rapid growth. The population of Blue Ridge Manor increased from just over 500 in 1900 to nearly 1,000 by the mid-1920s. The area was home to a number of small businesses, including a grocery store, a barber shop, and a movie theater.
Geography
Blue Ridge Manor is located in Jefferson County, Kentucky, on the banks of the Ohio River. The area is situated just south of Louisville and is bordered by the cities of St. Matthews and Jeffersontown. The area is characterized by rolling hills and lush green fields. The area is home to a number of small creeks and streams, as well as a number of small lakes.
Economy
Blue Ridge Manor is home to a number of small businesses, including a grocery store, a barber shop, and a movie theater. The area is also home to a number of small farms, which produce a variety of crops, including corn, soybeans, and wheat. The area is also home to a number of small manufacturing businesses, which produce a variety of products, including furniture, clothing, and automotive parts.
Demographics
As of the 2010 census, the population of Blue Ridge Manor was 1,000. The population is primarily white (90.2%), with a small percentage of African Americans (4.2%) and Hispanics (2.2%). The median household income in the area is $45,000, and the median home value is $150,000. The area is home to a number of small businesses, including a grocery store, a barber shop, and a movie theater.
Conclusion
Blue Ridge Manor is a small unincorporated community located in Jefferson County, Kentucky. The area is known for its rural charm and its proximity to the city of Louisville. The area is home to a diverse population of approximately 1,000 people, and is home to a number of small businesses, including a grocery store, a barber shop, and a movie theater. The area is also home to a number of small farms, which produce a variety of crops, including corn, soybeans, and wheat. The area is characterized by rolling hills and lush green fields, and is home to a number of small creeks and streams, as well as a number of small lakes.
Common Questions
What is Per Capita Income in Blue Ridge Manor?
Per Capita income in Blue Ridge Manor is $47,322.
What is the Median Family Income in Blue Ridge Manor?
Median Family Income in Blue Ridge Manor is $95,625.
What is the Median Household income in Blue Ridge Manor?
Median Household Income in Blue Ridge Manor is $70,833.
What is Income or Wage Gap in Blue Ridge Manor?
Income or Wage Gap in Blue Ridge Manor is 21.6%.
Women in Blue Ridge Manor earn 78.4 cents for every dollar earned by a man.
What is Inequality or Gini Index in Blue Ridge Manor?
Inequality or Gini Index in Blue Ridge Manor is 0.40.
What is the Total Population of Blue Ridge Manor?
Total Population of Blue Ridge Manor is 854.
What is the Total Male Population of Blue Ridge Manor?
Total Male Population of Blue Ridge Manor is 402.
What is the Total Female Population of Blue Ridge Manor?
Total Female Population of Blue Ridge Manor is 452.
What is the Ratio of Males per 100 Females in Blue Ridge Manor?
There are 88.94 Males per 100 Females in Blue Ridge Manor.
What is the Ratio of Females per 100 Males in Blue Ridge Manor?
There are 112.44 Females per 100 Males in Blue Ridge Manor.
What is the Median Population Age in Blue Ridge Manor?
Median Population Age in Blue Ridge Manor is 49.2 Years.
What is the Average Family Size in Blue Ridge Manor
Average Family Size in Blue Ridge Manor is 2.7 People.
What is the Average Household Size in Blue Ridge Manor
Average Household Size in Blue Ridge Manor is 1.8 People.
How Large is the Labor Force in Blue Ridge Manor?
There are 513 People in the Labor Forcein in Blue Ridge Manor.
What is the Percentage of People in the Labor Force in Blue Ridge Manor?
68.1% of People are in the Labor Force in Blue Ridge Manor.
What is the Unemployment Rate in Blue Ridge Manor?
Unemployment Rate in Blue Ridge Manor is 2.9%.