Walton, KY Map & Demographics
Walton Map
Walton Overview
$30,197
PER CAPITA INCOME
$93,370
AVG FAMILY INCOME
$79,811
AVG HOUSEHOLD INCOME
39.4%
WAGE / INCOME GAP [ % ]
60.6¢/ $1
WAGE / INCOME GAP [ $ ]
0.33
INEQUALITY / GINI INDEX
5,492
TOTAL POPULATION
2,628
MALE POPULATION
2,864
FEMALE POPULATION
91.76
MALES / 100 FEMALES
108.98
FEMALES / 100 MALES
31.5
MEDIAN AGE
3.6
AVG FAMILY SIZE
3.0
AVG HOUSEHOLD SIZE
2,765
LABOR FORCE [ PEOPLE ]
73.7%
PERCENT IN LABOR FORCE
1.6%
UNEMPLOYMENT RATE
Walton Zip Codes
Walton Area Codes
Income in Walton
Income Overview in Walton
Per Capita Income in Walton is $30,197, while median incomes of families and households are $93,370 and $79,811 respectively.
| Characteristic | Number | Measure |
| Per Capita Income | 5,492 | $30,197 |
| Median Family Income | 1,356 | $93,370 |
| Mean Family Income | 1,356 | $97,651 |
| Median Household Income | 1,800 | $79,811 |
| Mean Household Income | 1,800 | $89,226 |
| Income Deficit | 1,356 | $0 |
| Wage / Income Gap (%) | 5,492 | 39.39% |
| Wage / Income Gap ($) | 5,492 | 60.61¢ per $1 |
| Gini / Inequality Index | 5,492 | 0.33 |
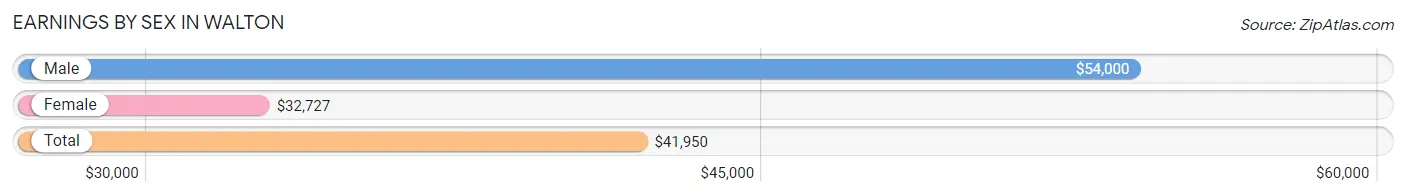
Earnings by Sex in Walton
Average Earnings in Walton are $41,950, $54,000 for men and $32,727 for women, a difference of 39.4%.
| Sex | Number | Average Earnings |
| Male | 1,538 (53.7%) | $54,000 |
| Female | 1,326 (46.3%) | $32,727 |
| Total | 2,864 (100.0%) | $41,950 |
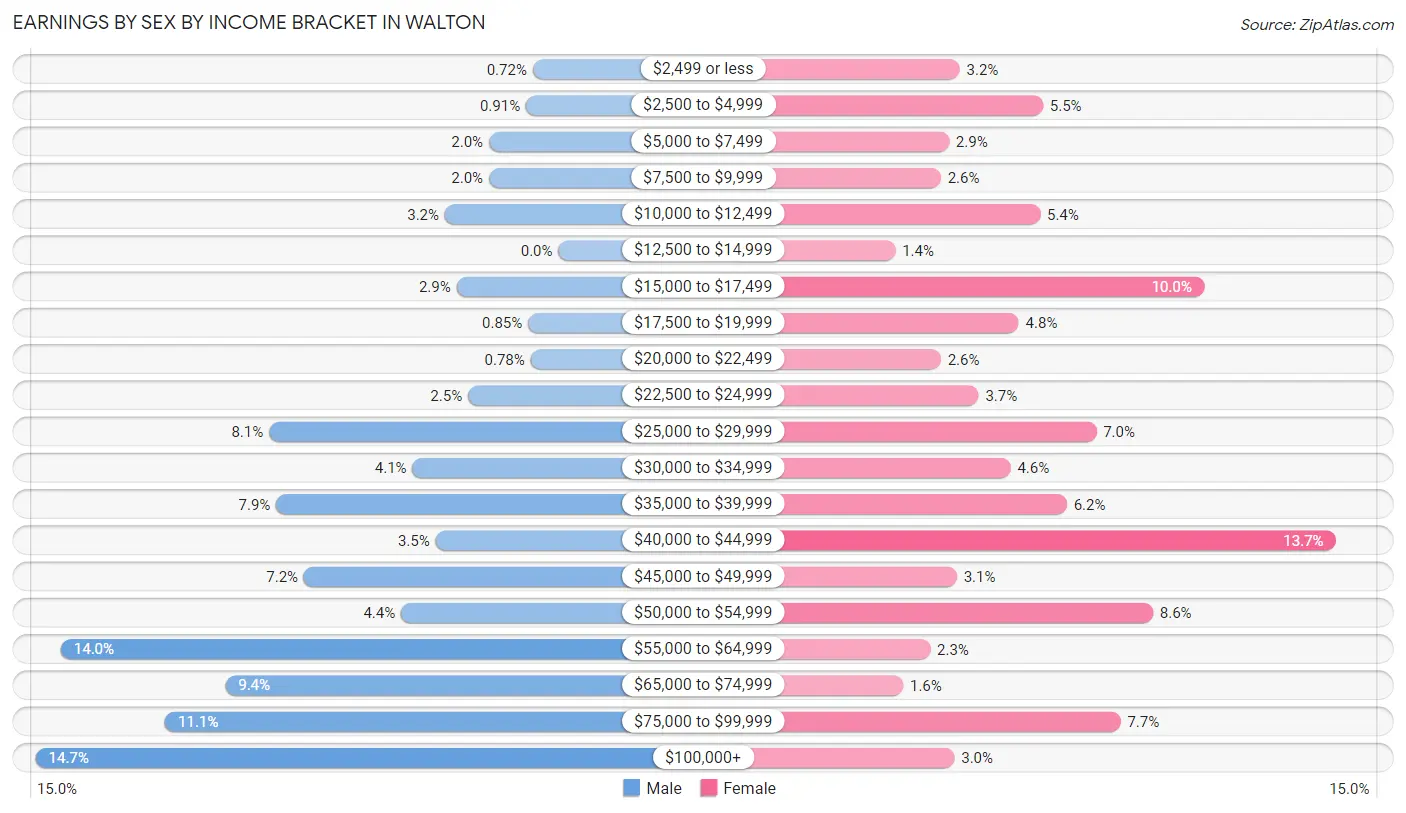
Earnings by Sex by Income Bracket in Walton
The most common earnings brackets in Walton are $100,000+ for men (226 | 14.7%) and $40,000 to $44,999 for women (182 | 13.7%).
| Income | Male | Female |
| $2,499 or less | 11 (0.7%) | 42 (3.2%) |
| $2,500 to $4,999 | 14 (0.9%) | 73 (5.5%) |
| $5,000 to $7,499 | 30 (1.9%) | 38 (2.9%) |
| $7,500 to $9,999 | 30 (1.9%) | 35 (2.6%) |
| $10,000 to $12,499 | 49 (3.2%) | 72 (5.4%) |
| $12,500 to $14,999 | 0 (0.0%) | 18 (1.4%) |
| $15,000 to $17,499 | 44 (2.9%) | 133 (10.0%) |
| $17,500 to $19,999 | 13 (0.9%) | 64 (4.8%) |
| $20,000 to $22,499 | 12 (0.8%) | 35 (2.6%) |
| $22,500 to $24,999 | 39 (2.5%) | 49 (3.7%) |
| $25,000 to $29,999 | 125 (8.1%) | 93 (7.0%) |
| $30,000 to $34,999 | 63 (4.1%) | 61 (4.6%) |
| $35,000 to $39,999 | 122 (7.9%) | 82 (6.2%) |
| $40,000 to $44,999 | 53 (3.5%) | 182 (13.7%) |
| $45,000 to $49,999 | 110 (7.1%) | 41 (3.1%) |
| $50,000 to $54,999 | 68 (4.4%) | 114 (8.6%) |
| $55,000 to $64,999 | 215 (14.0%) | 31 (2.3%) |
| $65,000 to $74,999 | 144 (9.4%) | 21 (1.6%) |
| $75,000 to $99,999 | 170 (11.1%) | 102 (7.7%) |
| $100,000+ | 226 (14.7%) | 40 (3.0%) |
| Total | 1,538 (100.0%) | 1,326 (100.0%) |
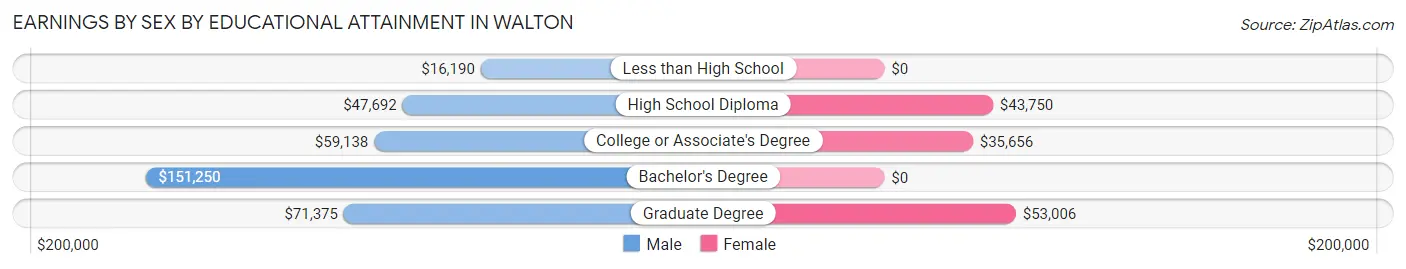
Earnings by Sex by Educational Attainment in Walton
Average earnings in Walton are $57,042 for men and $36,189 for women, a difference of 36.6%. Men with an educational attainment of bachelor's degree enjoy the highest average annual earnings of $151,250, while those with less than high school education earn the least with $16,190. Women with an educational attainment of graduate degree earn the most with the average annual earnings of $53,006, while those with college or associate's degree education have the smallest earnings of $35,656.
| Educational Attainment | Male Income | Female Income |
| Less than High School | $16,190 | $0 |
| High School Diploma | $47,692 | $43,750 |
| College or Associate's Degree | $59,138 | $35,656 |
| Bachelor's Degree | $151,250 | $0 |
| Graduate Degree | $71,375 | $53,006 |
| Total | $57,042 | $36,189 |
Family Income in Walton
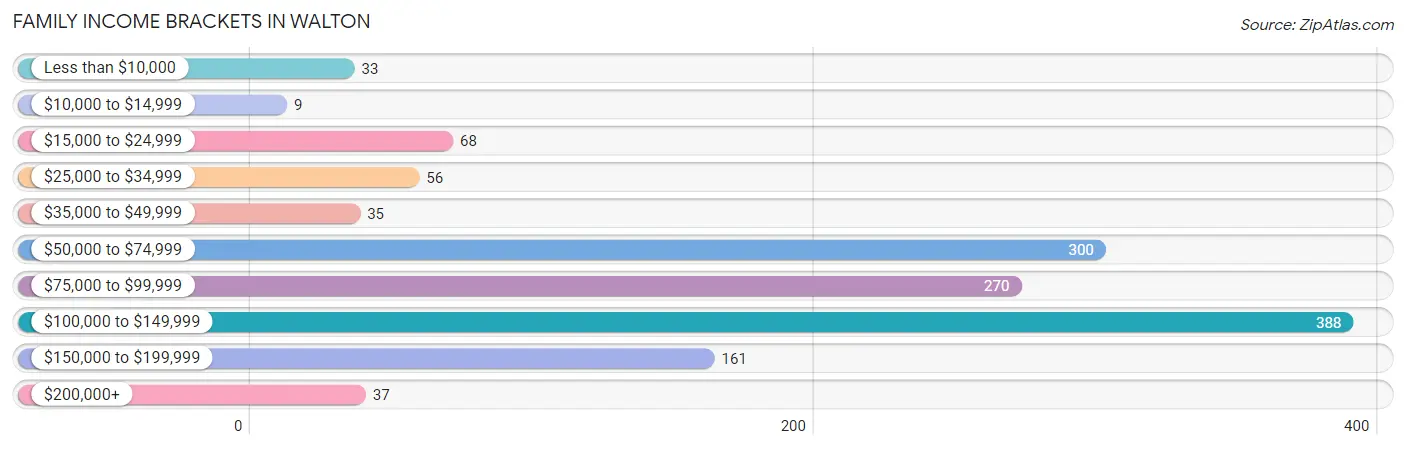
Family Income Brackets in Walton
According to the Walton family income data, there are 388 families falling into the $100,000 to $149,999 income range, which is the most common income bracket and makes up 28.6% of all families. Conversely, the $10,000 to $14,999 income bracket is the least frequent group with only 9 families (0.7%) belonging to this category.
| Income Bracket | # Families | % Families |
| Less than $10,000 | 33 | 2.4% |
| $10,000 to $14,999 | 9 | 0.7% |
| $15,000 to $24,999 | 68 | 5.0% |
| $25,000 to $34,999 | 56 | 4.1% |
| $35,000 to $49,999 | 35 | 2.6% |
| $50,000 to $74,999 | 300 | 22.1% |
| $75,000 to $99,999 | 270 | 19.9% |
| $100,000 to $149,999 | 388 | 28.6% |
| $150,000 to $199,999 | 161 | 11.9% |
| $200,000+ | 37 | 2.7% |
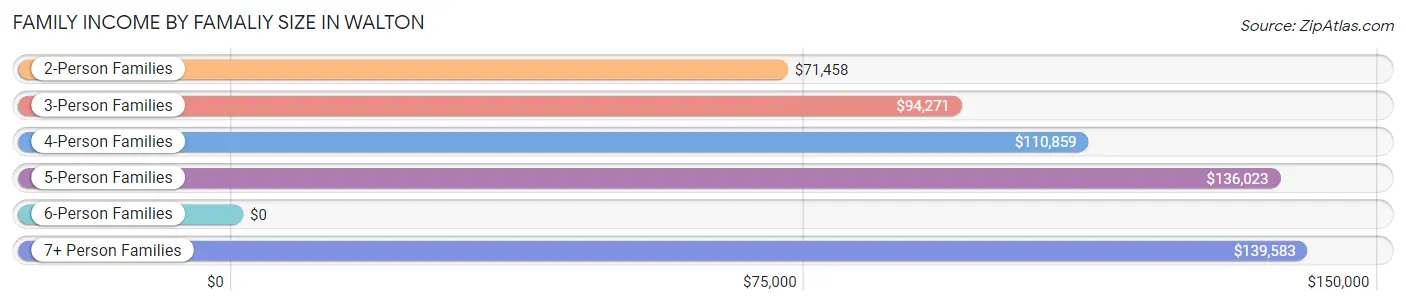
Family Income by Famaliy Size in Walton
7+ person families (32 | 2.4%) account for the highest median family income in Walton with $139,583 per family, while 2-person families (546 | 40.3%) have the highest median income of $35,729 per family member.
| Income Bracket | # Families | Median Income |
| 2-Person Families | 546 (40.3%) | $71,458 |
| 3-Person Families | 320 (23.6%) | $94,271 |
| 4-Person Families | 192 (14.2%) | $110,859 |
| 5-Person Families | 140 (10.3%) | $136,023 |
| 6-Person Families | 126 (9.3%) | $0 |
| 7+ Person Families | 32 (2.4%) | $139,583 |
| Total | 1,356 (100.0%) | $93,370 |
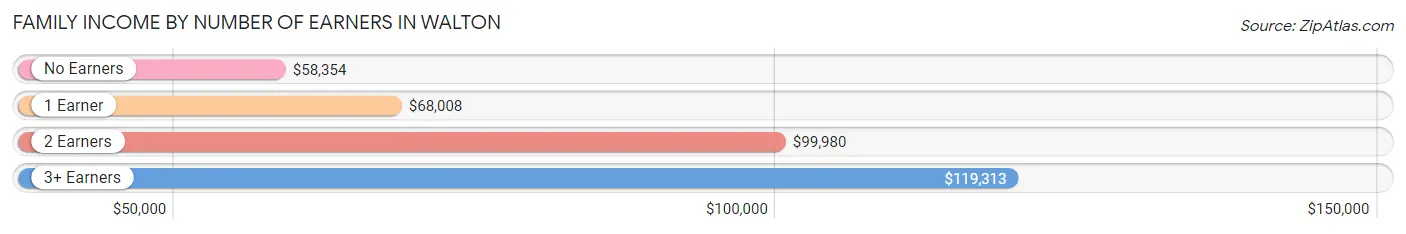
Family Income by Number of Earners in Walton
The median family income in Walton is $93,370, with families comprising 3+ earners (131) having the highest median family income of $119,313, while families with no earners (138) have the lowest median family income of $58,354, accounting for 9.7% and 10.2% of families, respectively.
| Number of Earners | # Families | Median Income |
| No Earners | 138 (10.2%) | $58,354 |
| 1 Earner | 334 (24.6%) | $68,008 |
| 2 Earners | 753 (55.5%) | $99,980 |
| 3+ Earners | 131 (9.7%) | $119,313 |
| Total | 1,356 (100.0%) | $93,370 |
Household Income in Walton
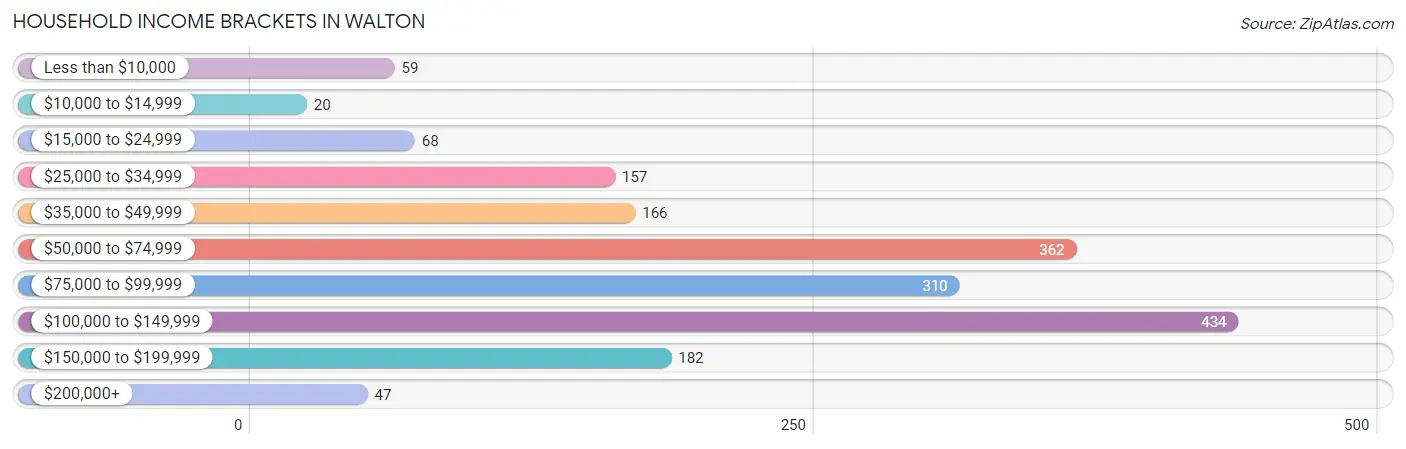
Household Income Brackets in Walton
With 434 households falling in the category, the $100,000 to $149,999 income range is the most frequent in Walton, accounting for 24.1% of all households. In contrast, only 20 households (1.1%) fall into the $10,000 to $14,999 income bracket, making it the least populous group.
| Income Bracket | # Households | % Households |
| Less than $10,000 | 59 | 3.3% |
| $10,000 to $14,999 | 20 | 1.1% |
| $15,000 to $24,999 | 68 | 3.8% |
| $25,000 to $34,999 | 157 | 8.7% |
| $35,000 to $49,999 | 166 | 9.2% |
| $50,000 to $74,999 | 362 | 20.1% |
| $75,000 to $99,999 | 310 | 17.2% |
| $100,000 to $149,999 | 434 | 24.1% |
| $150,000 to $199,999 | 182 | 10.1% |
| $200,000+ | 47 | 2.6% |
Household Income by Householder Age in Walton
The median household income in Walton is $79,811, with the highest median household income of $94,063 found in the 25 to 44 years age bracket for the primary householder. A total of 806 households (44.8%) fall into this category. Meanwhile, the 15 to 24 years age bracket for the primary householder has the lowest median household income of $0, with 5 households (0.3%) in this group.
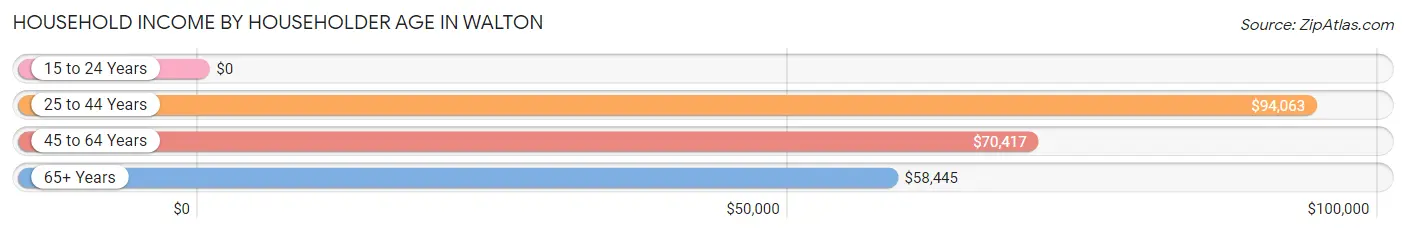
| Income Bracket | # Households | Median Income |
| 15 to 24 Years | 5 (0.3%) | $0 |
| 25 to 44 Years | 806 (44.8%) | $94,063 |
| 45 to 64 Years | 766 (42.6%) | $70,417 |
| 65+ Years | 223 (12.4%) | $58,445 |
| Total | 1,800 (100.0%) | $79,811 |
Poverty in Walton
Income Below Poverty by Sex and Age in Walton
With 5.1% poverty level for males and 8.3% for females among the residents of Walton, 65 to 74 year old males and 5 year old females are the most vulnerable to poverty, with 28 males (44.4%) and 11 females (25.0%) in their respective age groups living below the poverty level.
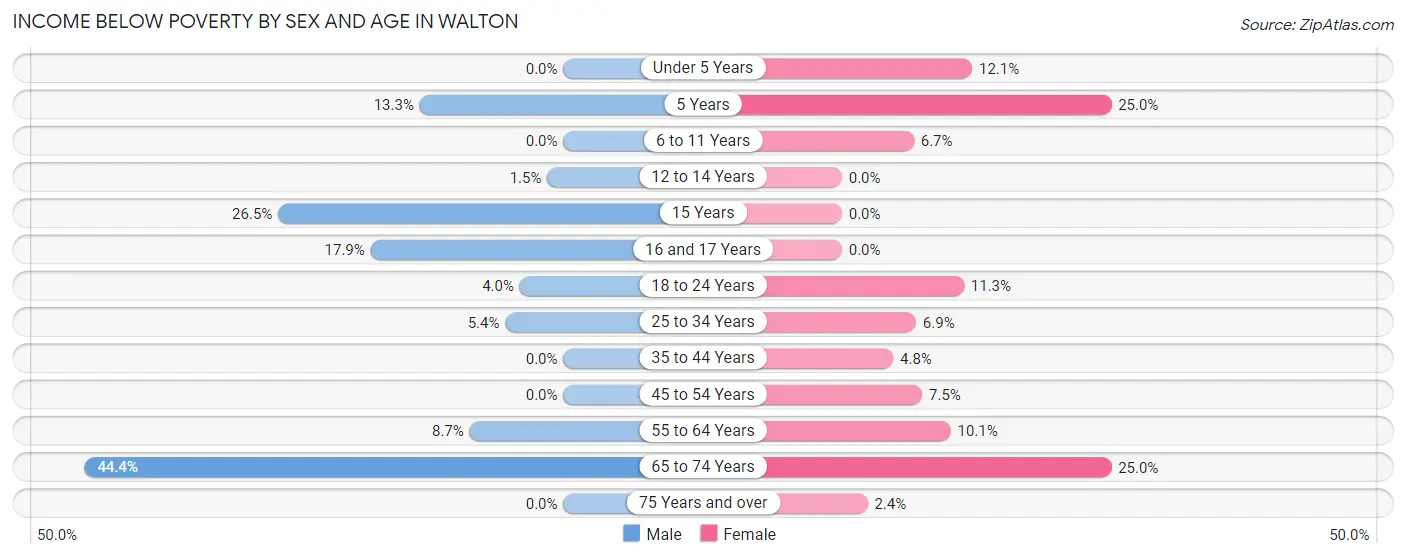
| Age Bracket | Male | Female |
| Under 5 Years | 0 (0.0%) | 33 (12.1%) |
| 5 Years | 10 (13.3%) | 11 (25.0%) |
| 6 to 11 Years | 0 (0.0%) | 31 (6.7%) |
| 12 to 14 Years | 3 (1.5%) | 0 (0.0%) |
| 15 Years | 18 (26.5%) | 0 (0.0%) |
| 16 and 17 Years | 22 (17.9%) | 0 (0.0%) |
| 18 to 24 Years | 4 (4.0%) | 17 (11.3%) |
| 25 to 34 Years | 20 (5.4%) | 37 (6.9%) |
| 35 to 44 Years | 0 (0.0%) | 13 (4.8%) |
| 45 to 54 Years | 0 (0.0%) | 19 (7.4%) |
| 55 to 64 Years | 30 (8.7%) | 33 (10.1%) |
| 65 to 74 Years | 28 (44.4%) | 40 (25.0%) |
| 75 Years and over | 0 (0.0%) | 3 (2.4%) |
| Total | 135 (5.1%) | 237 (8.3%) |
Income Above Poverty by Sex and Age in Walton
According to the poverty statistics in Walton, males aged under 5 years and females aged 12 to 14 years are the age groups that are most secure financially, with 100.0% of males and 100.0% of females in these age groups living above the poverty line.
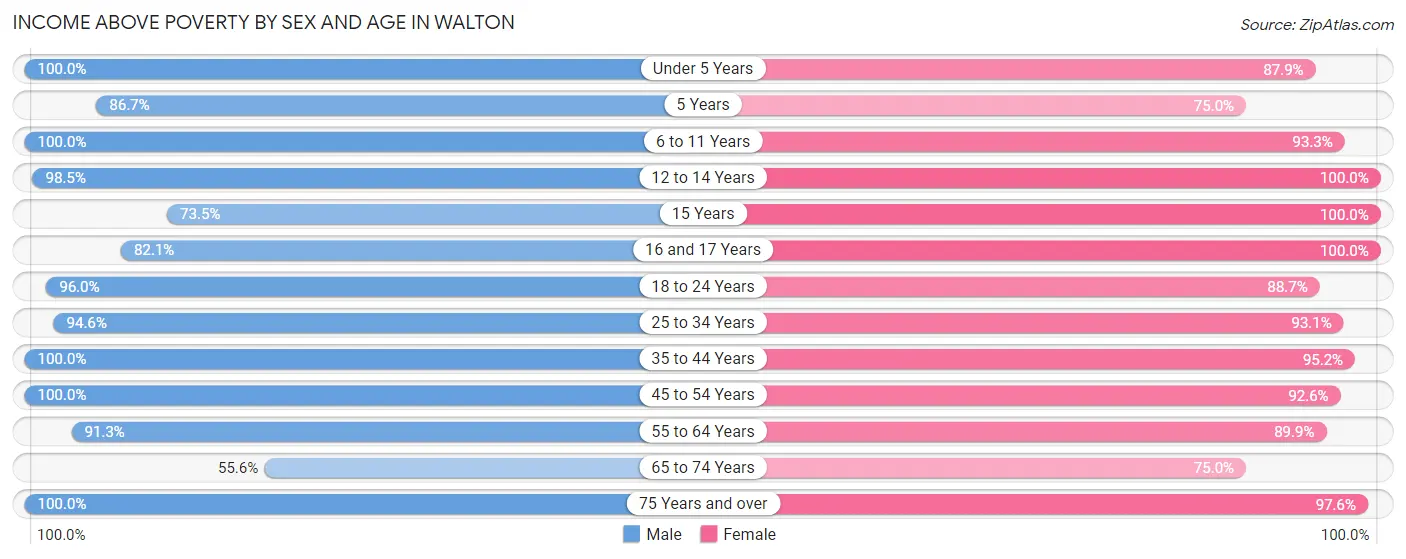
| Age Bracket | Male | Female |
| Under 5 Years | 259 (100.0%) | 240 (87.9%) |
| 5 Years | 65 (86.7%) | 33 (75.0%) |
| 6 to 11 Years | 159 (100.0%) | 433 (93.3%) |
| 12 to 14 Years | 198 (98.5%) | 145 (100.0%) |
| 15 Years | 50 (73.5%) | 41 (100.0%) |
| 16 and 17 Years | 101 (82.1%) | 57 (100.0%) |
| 18 to 24 Years | 95 (96.0%) | 133 (88.7%) |
| 25 to 34 Years | 351 (94.6%) | 501 (93.1%) |
| 35 to 44 Years | 417 (100.0%) | 260 (95.2%) |
| 45 to 54 Years | 394 (100.0%) | 236 (92.5%) |
| 55 to 64 Years | 315 (91.3%) | 294 (89.9%) |
| 65 to 74 Years | 35 (55.6%) | 120 (75.0%) |
| 75 Years and over | 54 (100.0%) | 123 (97.6%) |
| Total | 2,493 (94.9%) | 2,616 (91.7%) |
Income Below Poverty Among Married-Couple Families in Walton
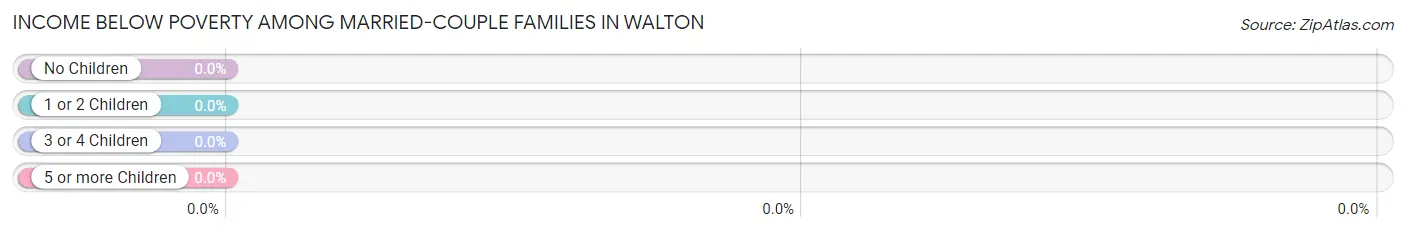
| Children | Above Poverty | Below Poverty |
| No Children | 529 (100.0%) | 0 (0.0%) |
| 1 or 2 Children | 309 (100.0%) | 0 (0.0%) |
| 3 or 4 Children | 243 (100.0%) | 0 (0.0%) |
| 5 or more Children | 20 (100.0%) | 0 (0.0%) |
| Total | 1,101 (100.0%) | 0 (0.0%) |
Income Below Poverty Among Single-Parent Households in Walton
According to the poverty data in Walton, 56.6% or 30 single-father households and 32.7% or 66 single-mother households are living below the poverty line. Among single-father households, those with 1 or 2 children have the highest poverty rate, with 30 households (69.8%) experiencing poverty. Likewise, among single-mother households, those with 1 or 2 children have the highest poverty rate, with 56 households (40.9%) falling below the poverty line.
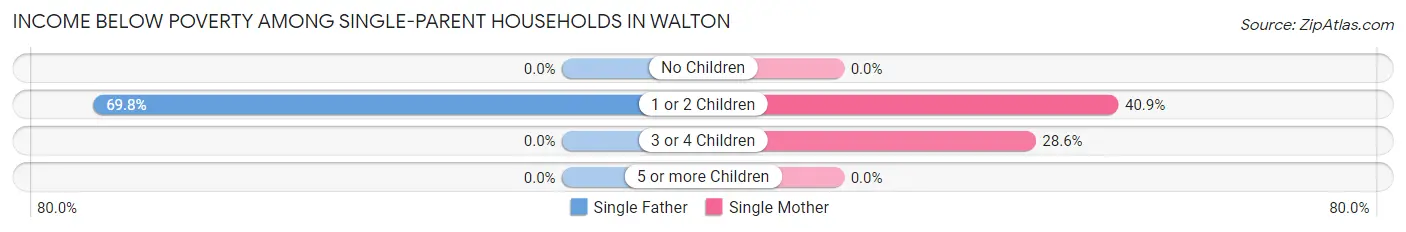
| Children | Single Father | Single Mother |
| No Children | 0 (0.0%) | 0 (0.0%) |
| 1 or 2 Children | 30 (69.8%) | 56 (40.9%) |
| 3 or 4 Children | 0 (0.0%) | 10 (28.6%) |
| 5 or more Children | 0 (0.0%) | 0 (0.0%) |
| Total | 30 (56.6%) | 66 (32.7%) |
Income Below Poverty Among Married-Couple vs Single-Parent Households in Walton
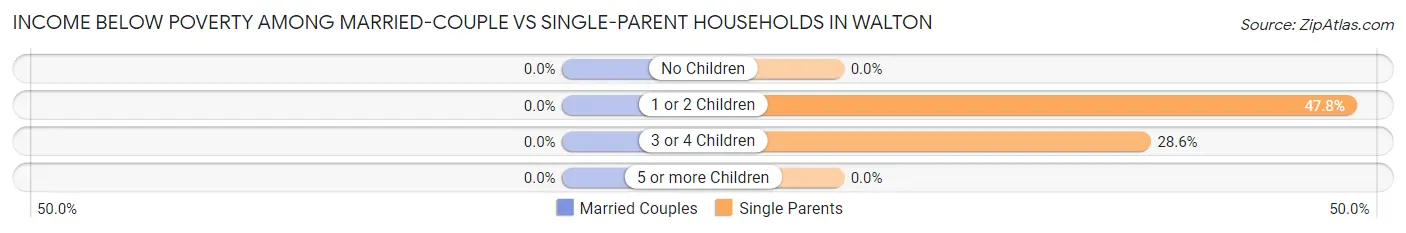
| Children | Married-Couple Families | Single-Parent Households |
| No Children | 0 (0.0%) | 0 (0.0%) |
| 1 or 2 Children | 0 (0.0%) | 86 (47.8%) |
| 3 or 4 Children | 0 (0.0%) | 10 (28.6%) |
| 5 or more Children | 0 (0.0%) | 0 (0.0%) |
| Total | 0 (0.0%) | 96 (37.7%) |
Race in Walton
The most populous races in Walton are White / Caucasian (4,872 | 88.7%), Two or more Races (393 | 7.2%), and Hawaiian / Pacific (203 | 3.7%).
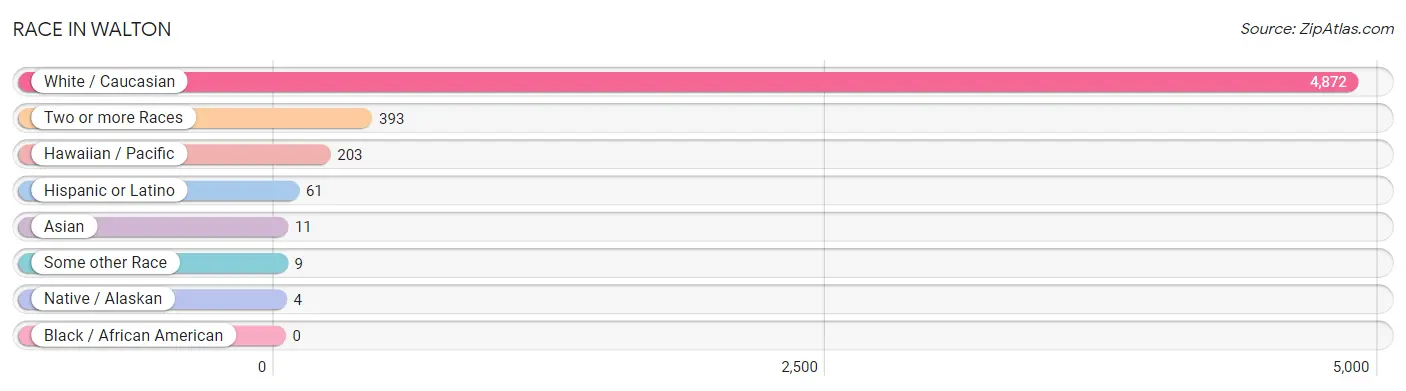
| Race | # Population | % Population |
| Asian | 11 | 0.2% |
| Black / African American | 0 | 0.0% |
| Hawaiian / Pacific | 203 | 3.7% |
| Hispanic or Latino | 61 | 1.1% |
| Native / Alaskan | 4 | 0.1% |
| White / Caucasian | 4,872 | 88.7% |
| Two or more Races | 393 | 7.2% |
| Some other Race | 9 | 0.2% |
| Total | 5,492 | 100.0% |
Ancestry in Walton
The most populous ancestries reported in Walton are German (1,128 | 20.5%), Irish (1,063 | 19.4%), English (610 | 11.1%), American (343 | 6.2%), and Italian (124 | 2.3%), together accounting for 59.5% of all Walton residents.
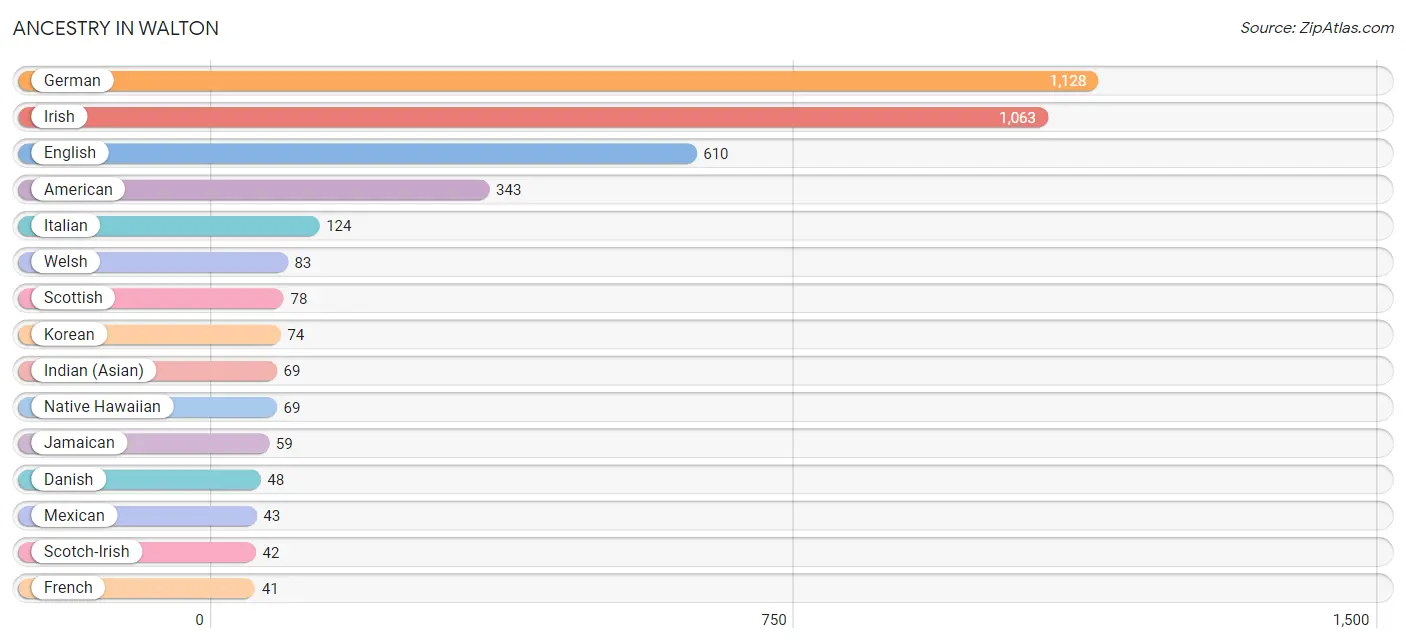
| Ancestry | # Population | % Population |
| African | 12 | 0.2% |
| American | 343 | 6.2% |
| Belgian | 11 | 0.2% |
| Celtic | 25 | 0.5% |
| Danish | 48 | 0.9% |
| Dutch | 12 | 0.2% |
| English | 610 | 11.1% |
| French | 41 | 0.7% |
| German | 1,128 | 20.5% |
| Hungarian | 10 | 0.2% |
| Indian (Asian) | 69 | 1.3% |
| Inupiat | 4 | 0.1% |
| Irish | 1,063 | 19.4% |
| Italian | 124 | 2.3% |
| Jamaican | 59 | 1.1% |
| Korean | 74 | 1.3% |
| Mexican | 43 | 0.8% |
| Native Hawaiian | 69 | 1.3% |
| Norwegian | 23 | 0.4% |
| Polish | 30 | 0.5% |
| Puerto Rican | 18 | 0.3% |
| Romanian | 12 | 0.2% |
| Russian | 11 | 0.2% |
| Scandinavian | 29 | 0.5% |
| Scotch-Irish | 42 | 0.8% |
| Scottish | 78 | 1.4% |
| Slovak | 12 | 0.2% |
| Subsaharan African | 12 | 0.2% |
| Swedish | 18 | 0.3% |
| Swiss | 10 | 0.2% |
| Thai | 11 | 0.2% |
| Trinidadian and Tobagonian | 32 | 0.6% |
| Welsh | 83 | 1.5% | View All 33 Rows |
Immigrants in Walton
The most numerous immigrant groups reported in Walton came from Micronesia (203 | 3.7%), Oceania (203 | 3.7%), Latin America (14 | 0.3%), Asia (11 | 0.2%), and Belgium (11 | 0.2%), together accounting for 8.1% of all Walton residents.
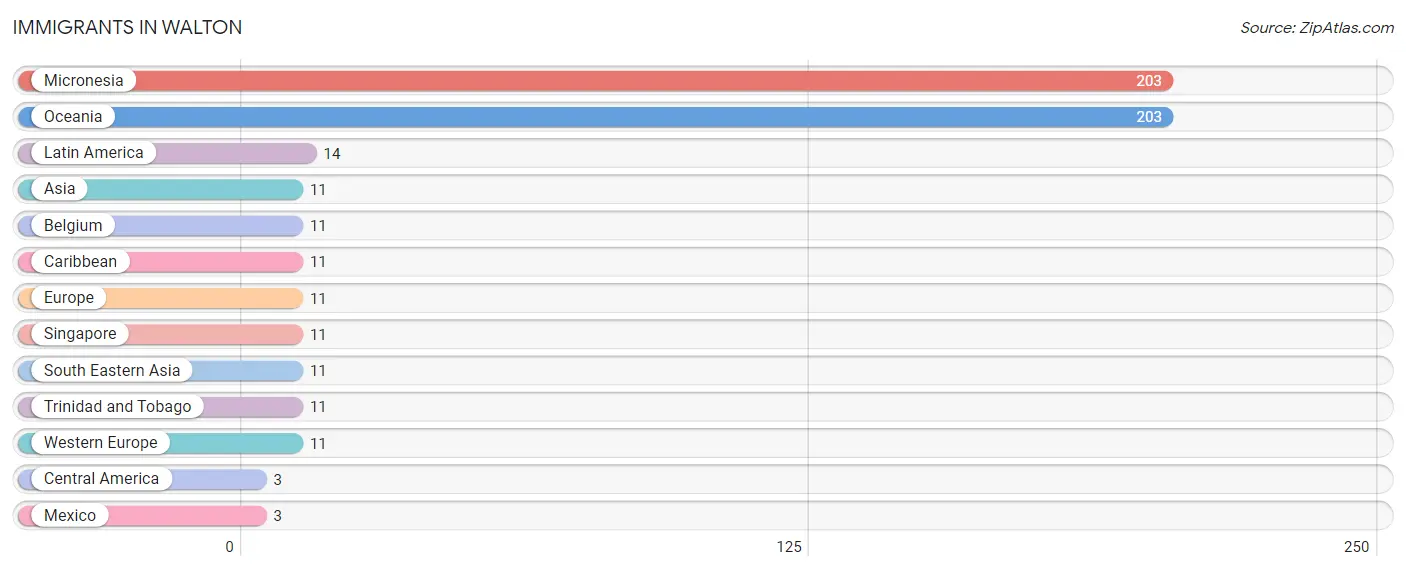
| Immigration Origin | # Population | % Population |
| Asia | 11 | 0.2% |
| Belgium | 11 | 0.2% |
| Caribbean | 11 | 0.2% |
| Central America | 3 | 0.1% |
| Europe | 11 | 0.2% |
| Latin America | 14 | 0.3% |
| Mexico | 3 | 0.1% |
| Micronesia | 203 | 3.7% |
| Oceania | 203 | 3.7% |
| Singapore | 11 | 0.2% |
| South Eastern Asia | 11 | 0.2% |
| Trinidad and Tobago | 11 | 0.2% |
| Western Europe | 11 | 0.2% | View All 13 Rows |
Sex and Age in Walton
Sex and Age in Walton
The most populous age groups in Walton are Under 5 Years (259 | 9.9%) for men and 5 to 9 Years (429 | 15.0%) for women.
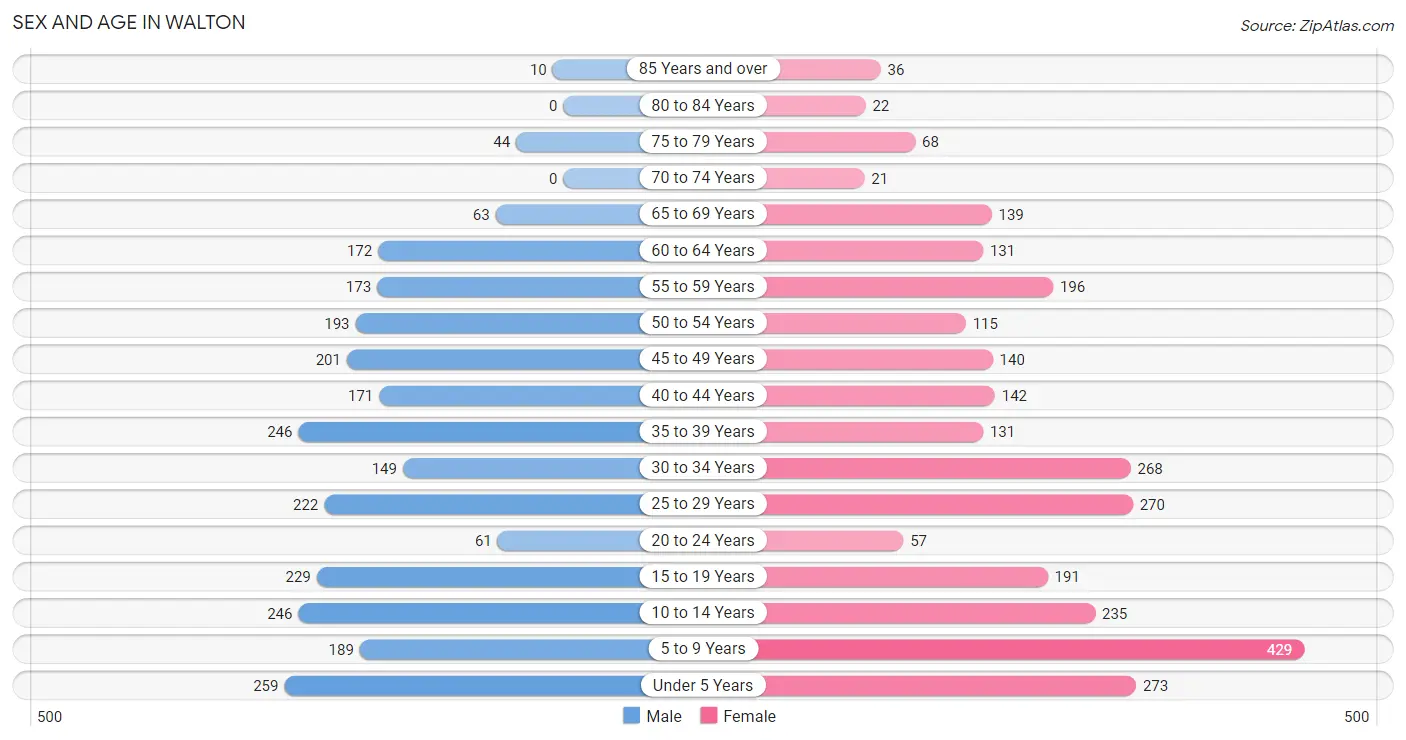
| Age Bracket | Male | Female |
| Under 5 Years | 259 (9.9%) | 273 (9.5%) |
| 5 to 9 Years | 189 (7.2%) | 429 (15.0%) |
| 10 to 14 Years | 246 (9.4%) | 235 (8.2%) |
| 15 to 19 Years | 229 (8.7%) | 191 (6.7%) |
| 20 to 24 Years | 61 (2.3%) | 57 (2.0%) |
| 25 to 29 Years | 222 (8.5%) | 270 (9.4%) |
| 30 to 34 Years | 149 (5.7%) | 268 (9.4%) |
| 35 to 39 Years | 246 (9.4%) | 131 (4.6%) |
| 40 to 44 Years | 171 (6.5%) | 142 (5.0%) |
| 45 to 49 Years | 201 (7.6%) | 140 (4.9%) |
| 50 to 54 Years | 193 (7.3%) | 115 (4.0%) |
| 55 to 59 Years | 173 (6.6%) | 196 (6.8%) |
| 60 to 64 Years | 172 (6.5%) | 131 (4.6%) |
| 65 to 69 Years | 63 (2.4%) | 139 (4.9%) |
| 70 to 74 Years | 0 (0.0%) | 21 (0.7%) |
| 75 to 79 Years | 44 (1.7%) | 68 (2.4%) |
| 80 to 84 Years | 0 (0.0%) | 22 (0.8%) |
| 85 Years and over | 10 (0.4%) | 36 (1.3%) |
| Total | 2,628 (100.0%) | 2,864 (100.0%) |
Families and Households in Walton
Median Family Size in Walton
The median family size in Walton is 3.58 persons per family, with single male/father families (53 | 3.9%) accounting for the largest median family size of 3.68 persons per family. On the other hand, single female/mother families (202 | 14.9%) represent the smallest median family size with 3.06 persons per family.
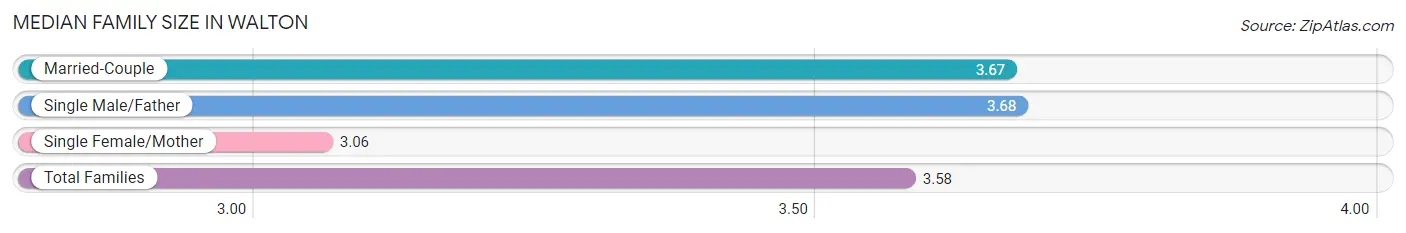
| Family Type | # Families | Family Size |
| Married-Couple | 1,101 (81.2%) | 3.67 |
| Single Male/Father | 53 (3.9%) | 3.68 |
| Single Female/Mother | 202 (14.9%) | 3.06 |
| Total Families | 1,356 (100.0%) | 3.58 |
Median Household Size in Walton
The median household size in Walton is 3.04 persons per household, with single male/father households (53 | 2.9%) accounting for the largest median household size of 4.3 persons per household. non-family households (444 | 24.7%) represent the smallest median household size with 1.16 persons per household.
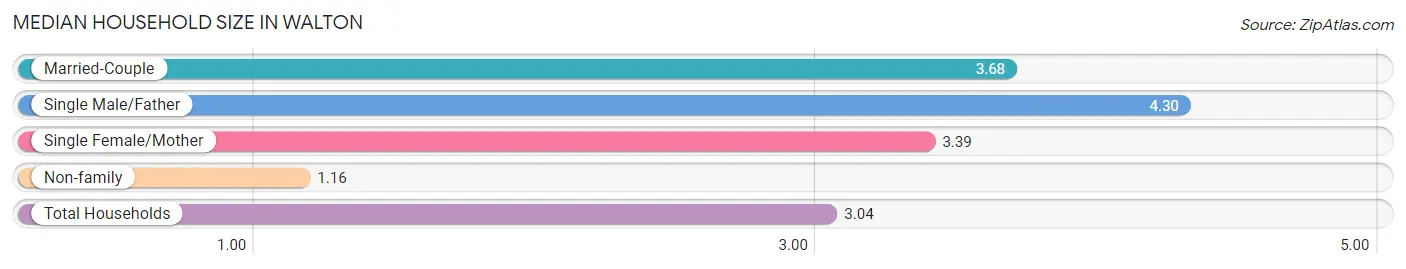
| Household Type | # Households | Household Size |
| Married-Couple | 1,101 (61.2%) | 3.68 |
| Single Male/Father | 53 (2.9%) | 4.30 |
| Single Female/Mother | 202 (11.2%) | 3.39 |
| Non-family | 444 (24.7%) | 1.16 |
| Total Households | 1,800 (100.0%) | 3.04 |
Household Size by Marriage Status in Walton
Out of a total of 1,800 households in Walton, 1,356 (75.3%) are family households, while 444 (24.7%) are nonfamily households. The most numerous type of family households are 2-person households, comprising 501, and the most common type of nonfamily households are 1-person households, comprising 391.
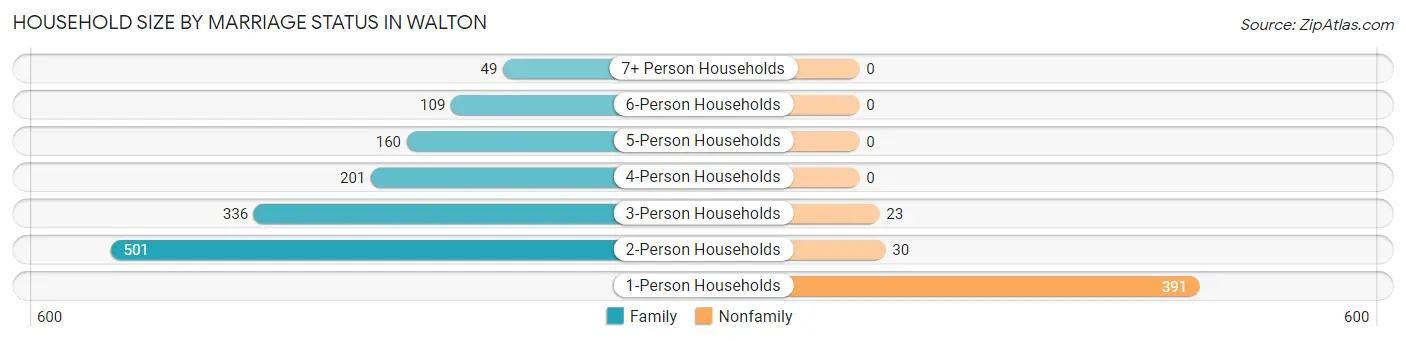
| Household Size | Family Households | Nonfamily Households |
| 1-Person Households | - | 391 (21.7%) |
| 2-Person Households | 501 (27.8%) | 30 (1.7%) |
| 3-Person Households | 336 (18.7%) | 23 (1.3%) |
| 4-Person Households | 201 (11.2%) | 0 (0.0%) |
| 5-Person Households | 160 (8.9%) | 0 (0.0%) |
| 6-Person Households | 109 (6.1%) | 0 (0.0%) |
| 7+ Person Households | 49 (2.7%) | 0 (0.0%) |
| Total | 1,356 (75.3%) | 444 (24.7%) |
Female Fertility in Walton
Fertility by Age in Walton
Average fertility rate in Walton is 69.0 births per 1,000 women. Women in the age bracket of 20 to 34 years have the highest fertility rate with 141.0 births per 1,000 women. Women in the age bracket of 20 to 34 years acount for 100.0% of all women with births.
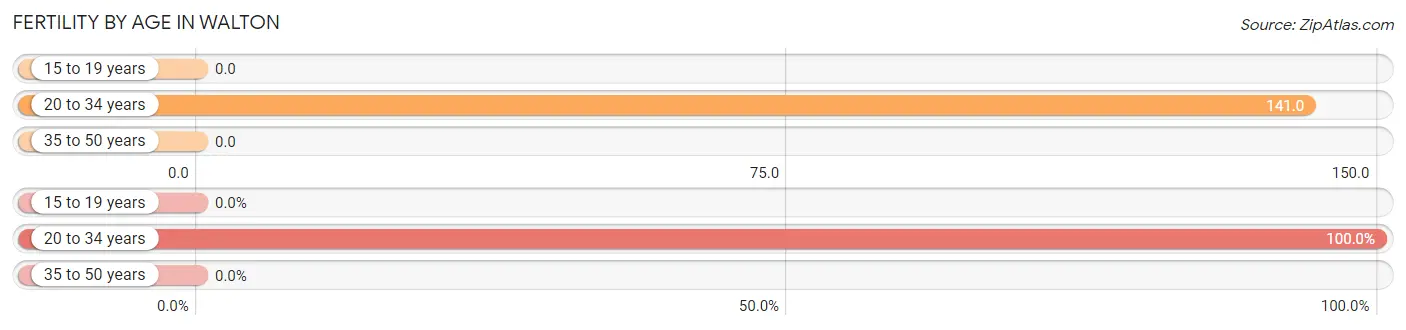
| Age Bracket | Women with Births | Births / 1,000 Women |
| 15 to 19 years | 0 (0.0%) | 0.0 |
| 20 to 34 years | 84 (100.0%) | 141.0 |
| 35 to 50 years | 0 (0.0%) | 0.0 |
| Total | 84 (100.0%) | 69.0 |
Fertility by Age by Marriage Status in Walton
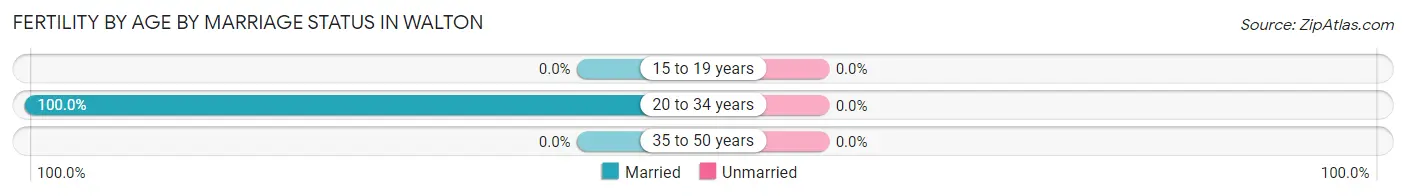
| Age Bracket | Married | Unmarried |
| 15 to 19 years | 0 (0.0%) | 0 (0.0%) |
| 20 to 34 years | 84 (100.0%) | 0 (0.0%) |
| 35 to 50 years | 0 (0.0%) | 0 (0.0%) |
| Total | 84 (100.0%) | 0 (0.0%) |
Fertility by Education in Walton
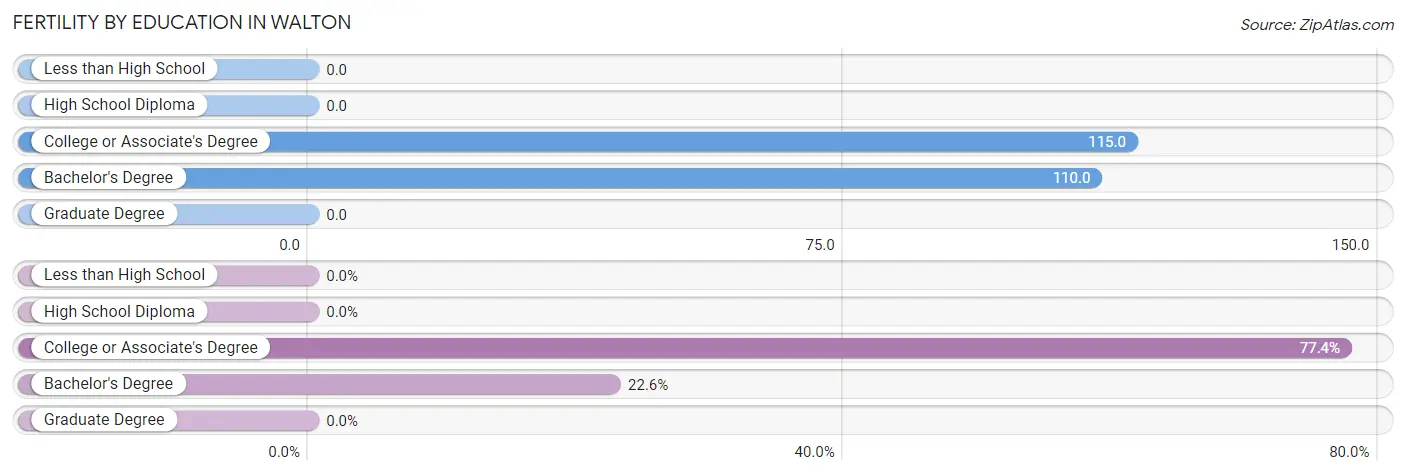
| Educational Attainment | Women with Births | Births / 1,000 Women |
| Less than High School | 0 (0.0%) | 0.0 |
| High School Diploma | 0 (0.0%) | 0.0 |
| College or Associate's Degree | 65 (77.4%) | 115.0 |
| Bachelor's Degree | 19 (22.6%) | 110.0 |
| Graduate Degree | 0 (0.0%) | 0.0 |
| Total | 84 (100.0%) | 69.0 |
Fertility by Education by Marriage Status in Walton
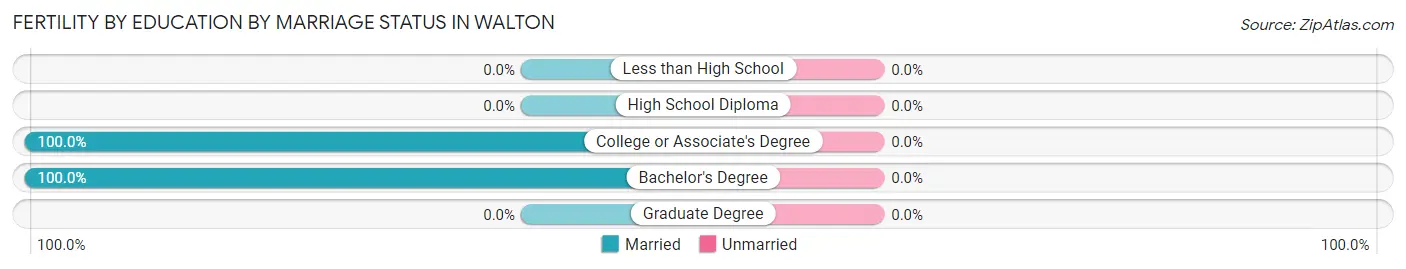
| Educational Attainment | Married | Unmarried |
| Less than High School | 0 (0.0%) | 0 (0.0%) |
| High School Diploma | 0 (0.0%) | 0 (0.0%) |
| College or Associate's Degree | 65 (100.0%) | 0 (0.0%) |
| Bachelor's Degree | 19 (100.0%) | 0 (0.0%) |
| Graduate Degree | 0 (0.0%) | 0 (0.0%) |
| Total | 84 (100.0%) | 0 (0.0%) |
Employment Characteristics in Walton
Employment by Class of Employer in Walton
Among the 2,703 employed individuals in Walton, private company employees (2,148 | 79.5%), self-employed (not incorporated) (173 | 6.4%), and local government employees (151 | 5.6%) make up the most common classes of employment.
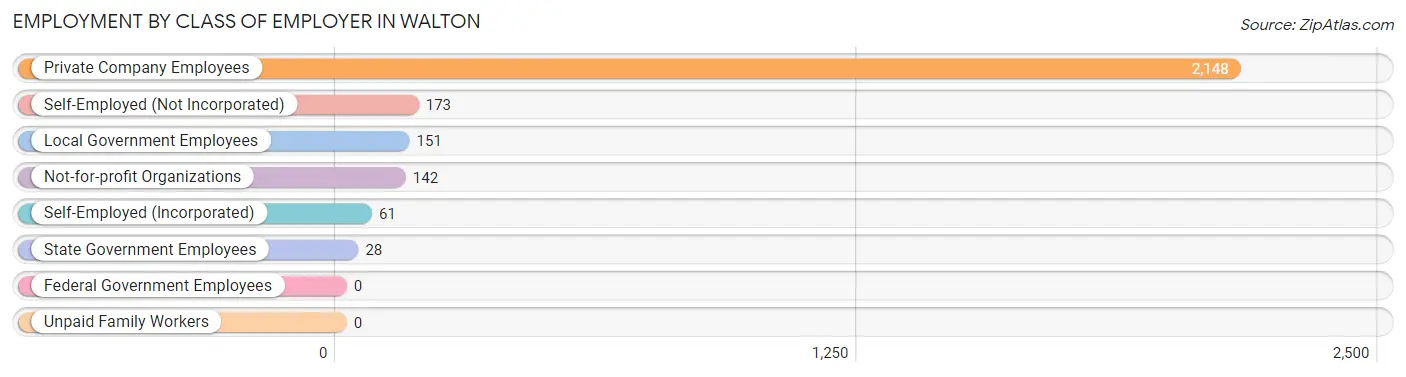
| Employer Class | # Employees | % Employees |
| Private Company Employees | 2,148 | 79.5% |
| Self-Employed (Incorporated) | 61 | 2.3% |
| Self-Employed (Not Incorporated) | 173 | 6.4% |
| Not-for-profit Organizations | 142 | 5.2% |
| Local Government Employees | 151 | 5.6% |
| State Government Employees | 28 | 1.0% |
| Federal Government Employees | 0 | 0.0% |
| Unpaid Family Workers | 0 | 0.0% |
| Total | 2,703 | 100.0% |
Employment Status by Age in Walton
According to the labor force statistics for Walton, out of the total population over 16 years of age (3,752), 73.7% or 2,765 individuals are in the labor force, with 1.6% or 44 of them unemployed. The age group with the highest labor force participation rate is 25 to 29 years, with 100.0% or 492 individuals in the labor force. Within the labor force, the 30 to 34 years age range has the highest percentage of unemployed individuals, with 5.9% or 18 of them being unemployed.
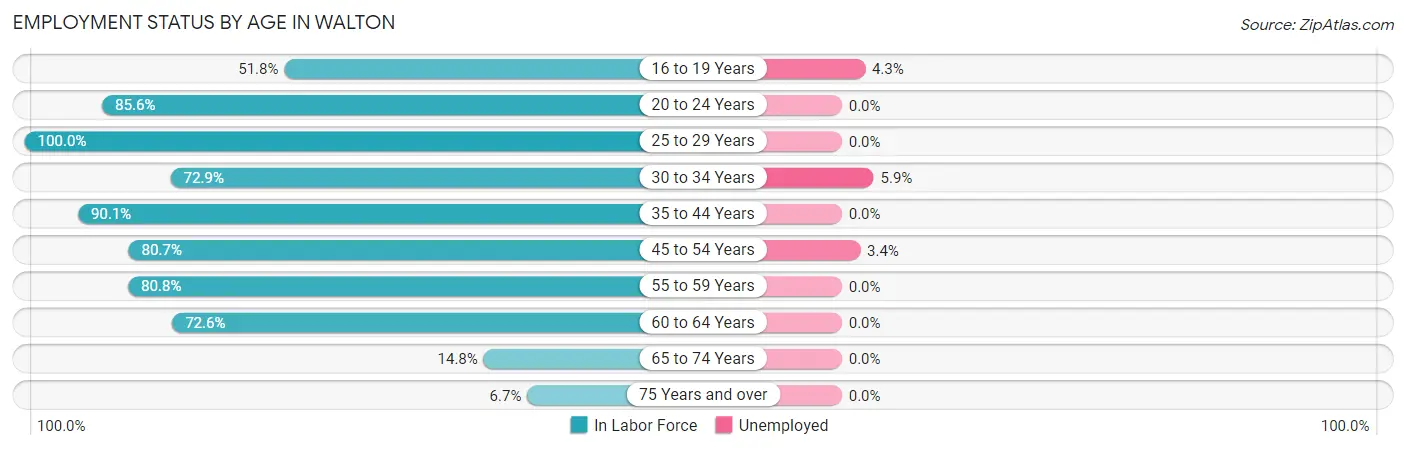
| Age Bracket | In Labor Force | Unemployed |
| 16 to 19 Years | 161 (51.8%) | 7 (4.3%) |
| 20 to 24 Years | 101 (85.6%) | 0 (0.0%) |
| 25 to 29 Years | 492 (100.0%) | 0 (0.0%) |
| 30 to 34 Years | 304 (72.9%) | 18 (5.9%) |
| 35 to 44 Years | 622 (90.1%) | 0 (0.0%) |
| 45 to 54 Years | 524 (80.7%) | 18 (3.4%) |
| 55 to 59 Years | 298 (80.8%) | 0 (0.0%) |
| 60 to 64 Years | 220 (72.6%) | 0 (0.0%) |
| 65 to 74 Years | 33 (14.8%) | 0 (0.0%) |
| 75 Years and over | 12 (6.7%) | 0 (0.0%) |
| Total | 2,765 (73.7%) | 44 (1.6%) |
Employment Status by Educational Attainment in Walton
According to labor force statistics for Walton, 84.2% of individuals (2,459) out of the total population between 25 and 64 years of age (2,920) are in the labor force, with 1.5% or 37 of them being unemployed. The group with the highest labor force participation rate are those with the educational attainment of high school diploma, with 88.9% or 832 individuals in the labor force. Within the labor force, individuals with college / associate degree education have the highest percentage of unemployment, with 1.8% or 14 of them being unemployed.
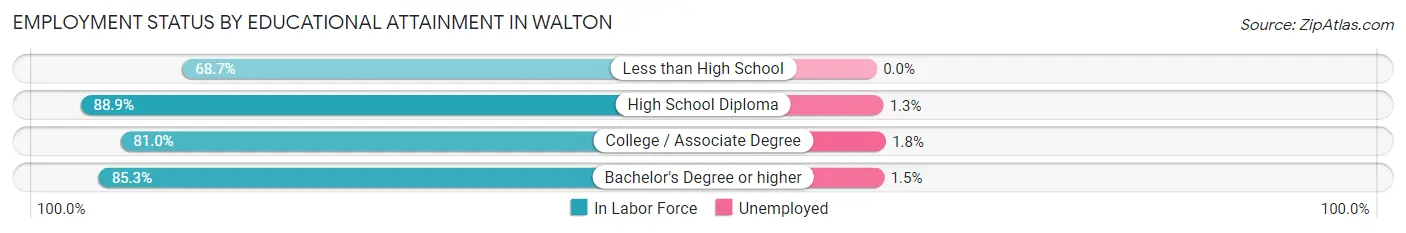
| Educational Attainment | In Labor Force | Unemployed |
| Less than High School | 90 (68.7%) | 0 (0.0%) |
| High School Diploma | 832 (88.9%) | 12 (1.3%) |
| College / Associate Degree | 792 (81.0%) | 18 (1.8%) |
| Bachelor's Degree or higher | 746 (85.3%) | 13 (1.5%) |
| Total | 2,459 (84.2%) | 44 (1.5%) |
Employment Occupations by Sex in Walton
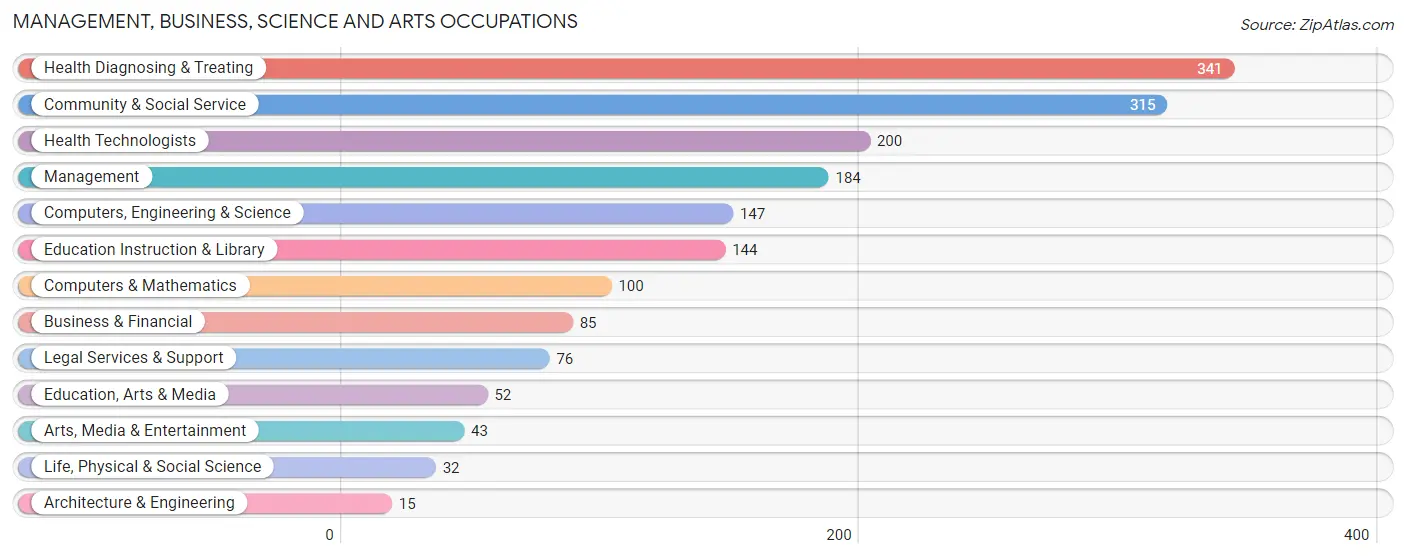
Management, Business, Science and Arts Occupations
The most common Management, Business, Science and Arts occupations in Walton are Health Diagnosing & Treating (341 | 12.5%), Community & Social Service (315 | 11.6%), Health Technologists (200 | 7.3%), Management (184 | 6.8%), and Computers, Engineering & Science (147 | 5.4%).
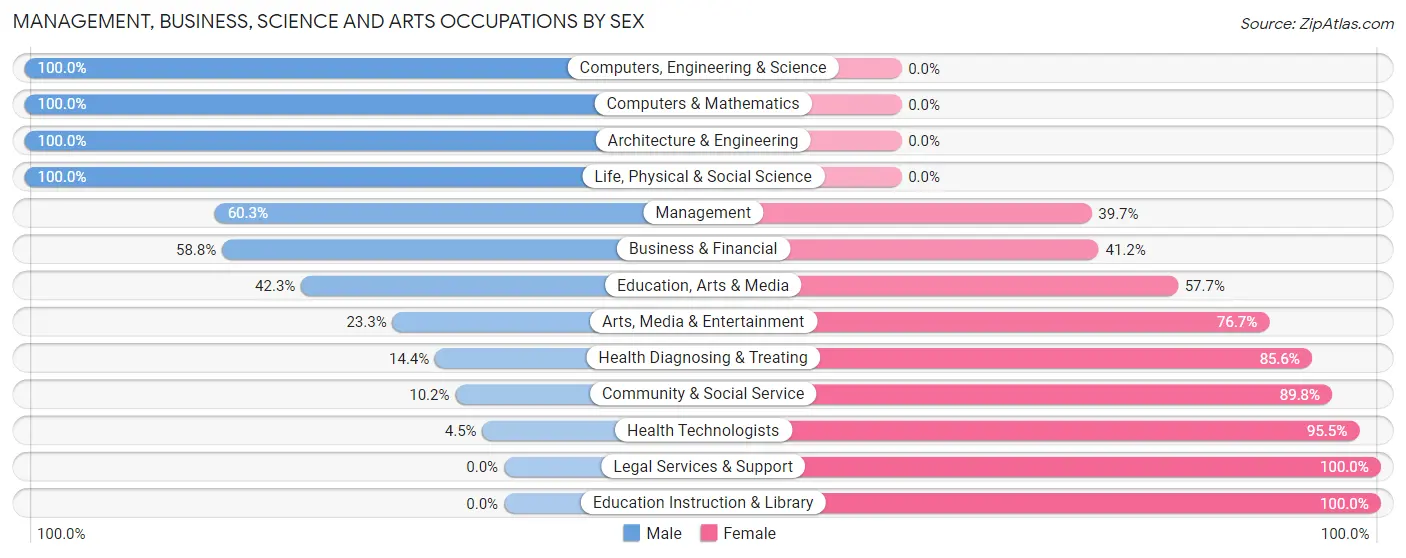
Management, Business, Science and Arts Occupations by Sex
Within the Management, Business, Science and Arts occupations in Walton, the most male-oriented occupations are Computers, Engineering & Science (100.0%), Computers & Mathematics (100.0%), and Architecture & Engineering (100.0%), while the most female-oriented occupations are Legal Services & Support (100.0%), Education Instruction & Library (100.0%), and Health Technologists (95.5%).
| Occupation | Male | Female |
| Management | 111 (60.3%) | 73 (39.7%) |
| Business & Financial | 50 (58.8%) | 35 (41.2%) |
| Computers, Engineering & Science | 147 (100.0%) | 0 (0.0%) |
| Computers & Mathematics | 100 (100.0%) | 0 (0.0%) |
| Architecture & Engineering | 15 (100.0%) | 0 (0.0%) |
| Life, Physical & Social Science | 32 (100.0%) | 0 (0.0%) |
| Community & Social Service | 32 (10.2%) | 283 (89.8%) |
| Education, Arts & Media | 22 (42.3%) | 30 (57.7%) |
| Legal Services & Support | 0 (0.0%) | 76 (100.0%) |
| Education Instruction & Library | 0 (0.0%) | 144 (100.0%) |
| Arts, Media & Entertainment | 10 (23.3%) | 33 (76.7%) |
| Health Diagnosing & Treating | 49 (14.4%) | 292 (85.6%) |
| Health Technologists | 9 (4.5%) | 191 (95.5%) |
| Total (Category) | 389 (36.3%) | 683 (63.7%) |
| Total (Overall) | 1,471 (54.0%) | 1,253 (46.0%) |
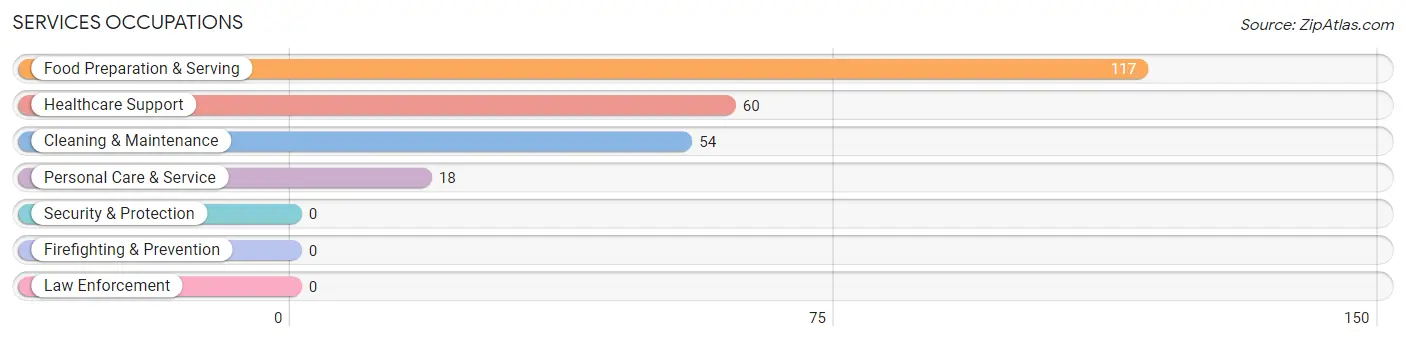
Services Occupations
The most common Services occupations in Walton are Food Preparation & Serving (117 | 4.3%), Healthcare Support (60 | 2.2%), Cleaning & Maintenance (54 | 2.0%), and Personal Care & Service (18 | 0.7%).
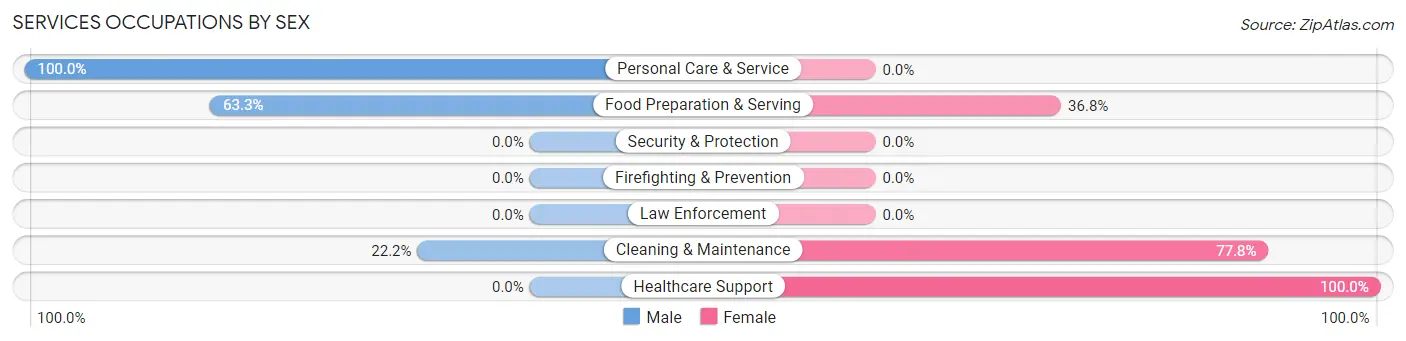
Services Occupations by Sex
Within the Services occupations in Walton, the most male-oriented occupations are Personal Care & Service (100.0%), Food Preparation & Serving (63.2%), and Cleaning & Maintenance (22.2%), while the most female-oriented occupations are Healthcare Support (100.0%), Cleaning & Maintenance (77.8%), and Food Preparation & Serving (36.7%).
| Occupation | Male | Female |
| Healthcare Support | 0 (0.0%) | 60 (100.0%) |
| Security & Protection | 0 (0.0%) | 0 (0.0%) |
| Firefighting & Prevention | 0 (0.0%) | 0 (0.0%) |
| Law Enforcement | 0 (0.0%) | 0 (0.0%) |
| Food Preparation & Serving | 74 (63.2%) | 43 (36.7%) |
| Cleaning & Maintenance | 12 (22.2%) | 42 (77.8%) |
| Personal Care & Service | 18 (100.0%) | 0 (0.0%) |
| Total (Category) | 104 (41.8%) | 145 (58.2%) |
| Total (Overall) | 1,471 (54.0%) | 1,253 (46.0%) |
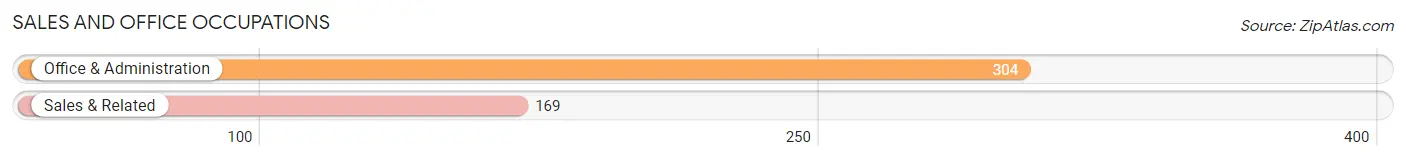
Sales and Office Occupations
The most common Sales and Office occupations in Walton are Office & Administration (304 | 11.2%), and Sales & Related (169 | 6.2%).
Sales and Office Occupations by Sex
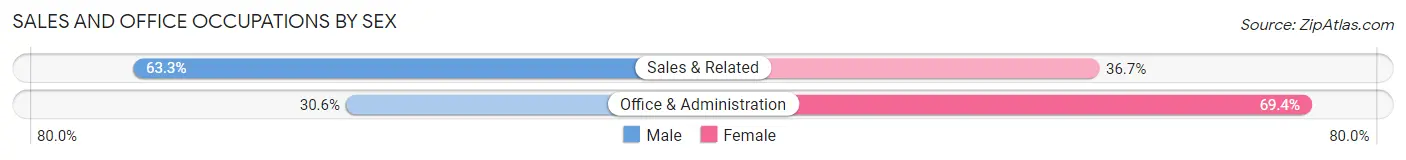
| Occupation | Male | Female |
| Sales & Related | 107 (63.3%) | 62 (36.7%) |
| Office & Administration | 93 (30.6%) | 211 (69.4%) |
| Total (Category) | 200 (42.3%) | 273 (57.7%) |
| Total (Overall) | 1,471 (54.0%) | 1,253 (46.0%) |
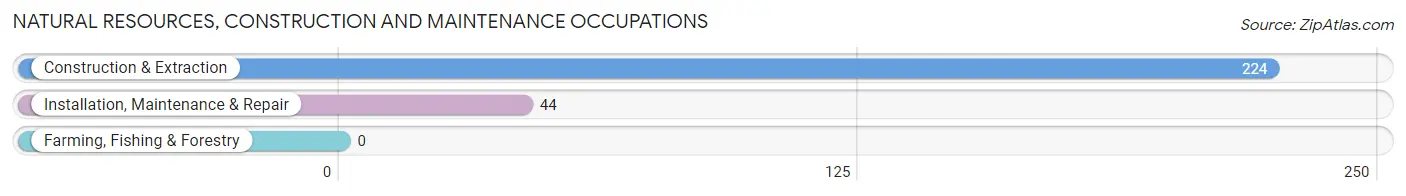
Natural Resources, Construction and Maintenance Occupations
The most common Natural Resources, Construction and Maintenance occupations in Walton are Construction & Extraction (224 | 8.2%), and Installation, Maintenance & Repair (44 | 1.6%).
Natural Resources, Construction and Maintenance Occupations by Sex
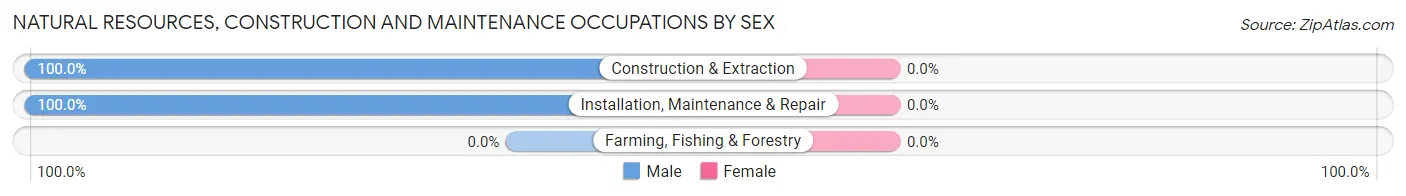
| Occupation | Male | Female |
| Farming, Fishing & Forestry | 0 (0.0%) | 0 (0.0%) |
| Construction & Extraction | 224 (100.0%) | 0 (0.0%) |
| Installation, Maintenance & Repair | 44 (100.0%) | 0 (0.0%) |
| Total (Category) | 268 (100.0%) | 0 (0.0%) |
| Total (Overall) | 1,471 (54.0%) | 1,253 (46.0%) |
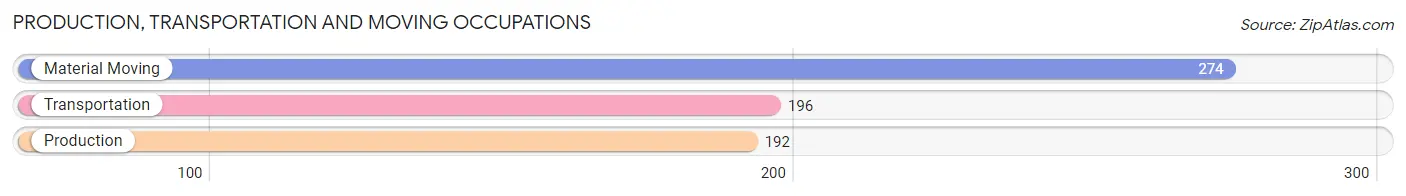
Production, Transportation and Moving Occupations
The most common Production, Transportation and Moving occupations in Walton are Material Moving (274 | 10.1%), Transportation (196 | 7.2%), and Production (192 | 7.0%).
Production, Transportation and Moving Occupations by Sex
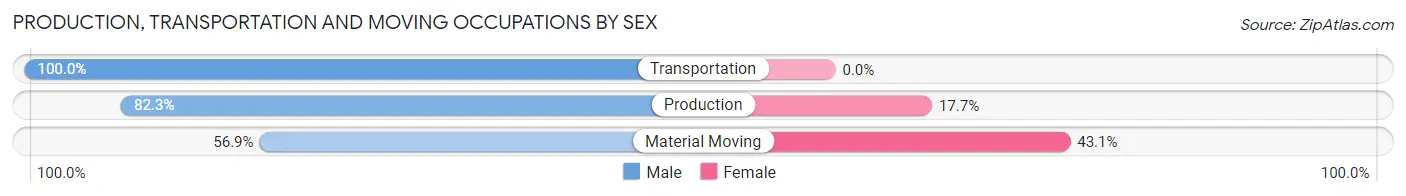
| Occupation | Male | Female |
| Production | 158 (82.3%) | 34 (17.7%) |
| Transportation | 196 (100.0%) | 0 (0.0%) |
| Material Moving | 156 (56.9%) | 118 (43.1%) |
| Total (Category) | 510 (77.0%) | 152 (23.0%) |
| Total (Overall) | 1,471 (54.0%) | 1,253 (46.0%) |
Employment Industries by Sex in Walton
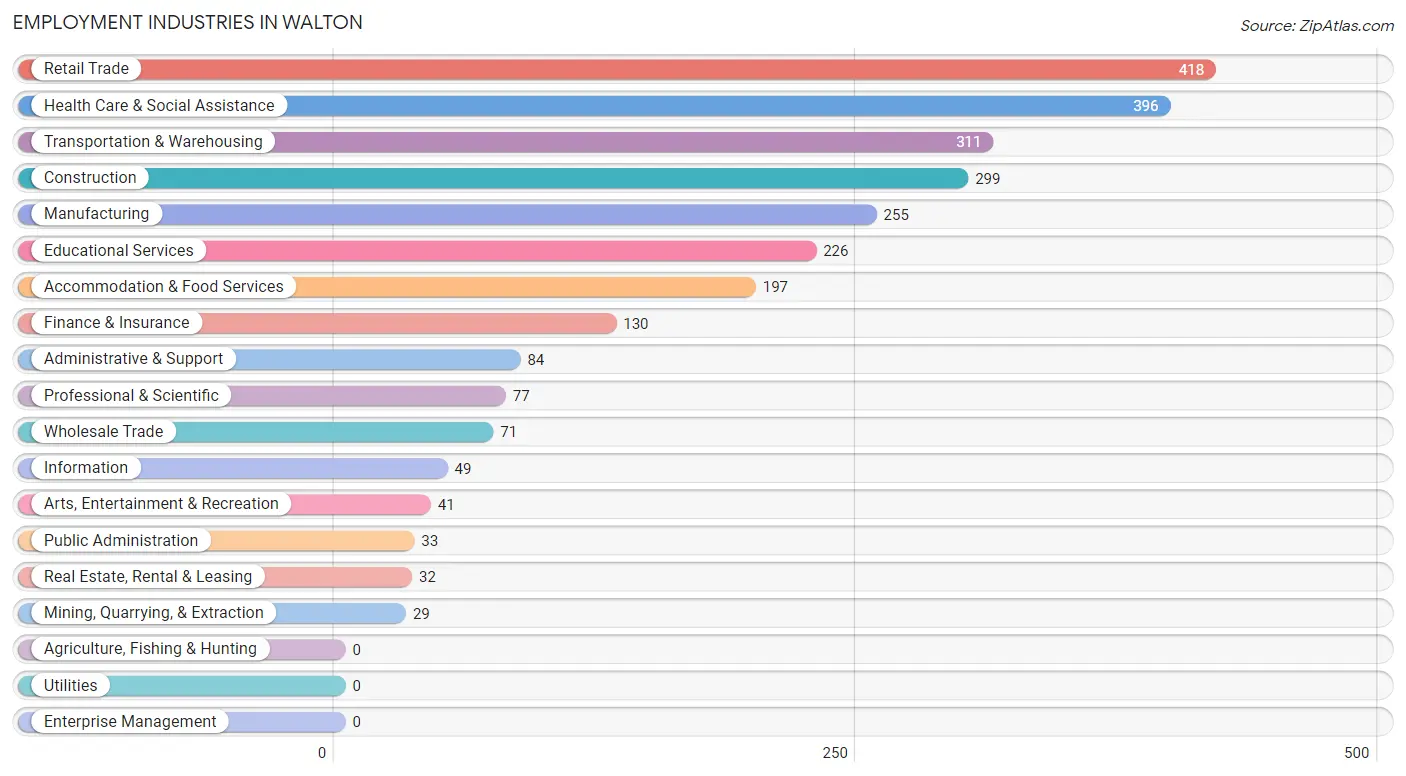
Employment Industries in Walton
The major employment industries in Walton include Retail Trade (418 | 15.3%), Health Care & Social Assistance (396 | 14.5%), Transportation & Warehousing (311 | 11.4%), Construction (299 | 11.0%), and Manufacturing (255 | 9.4%).
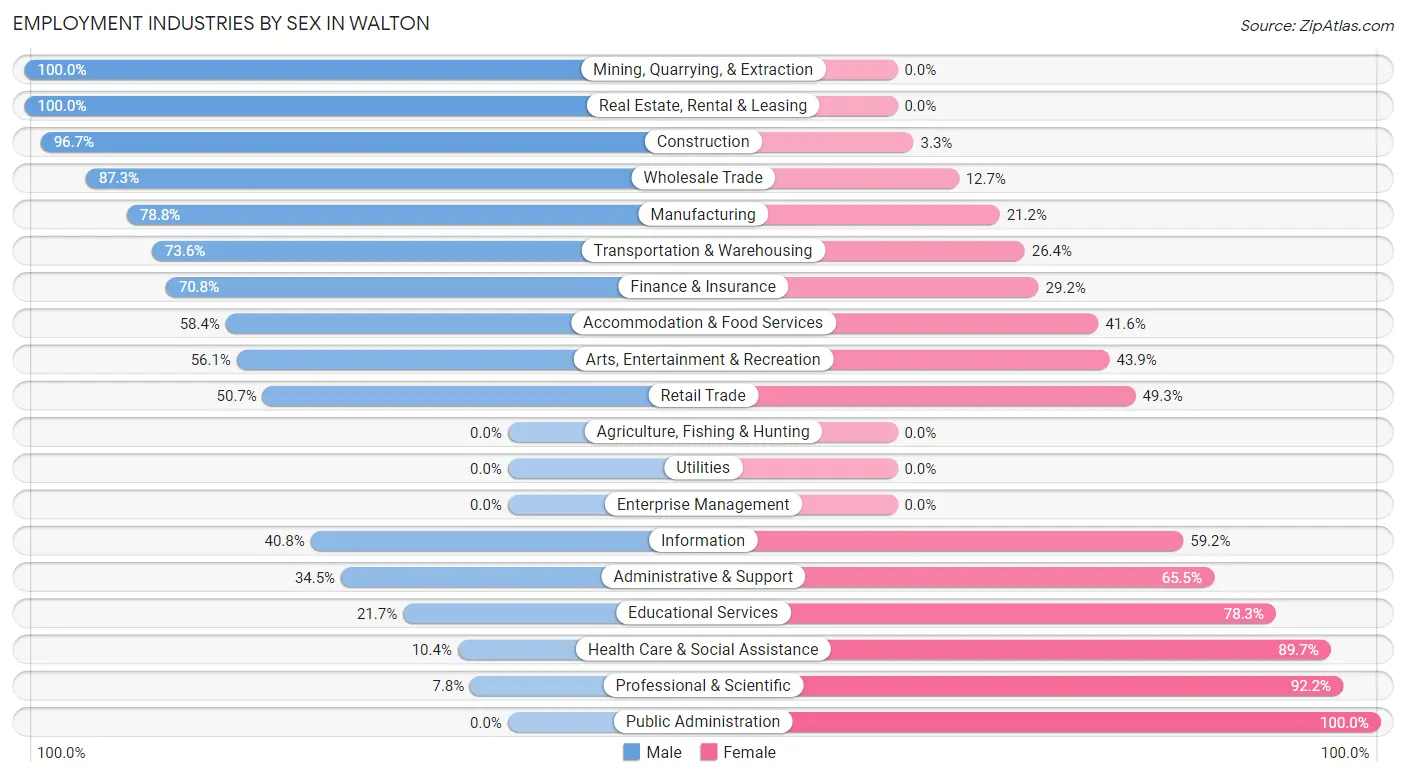
Employment Industries by Sex in Walton
The Walton industries that see more men than women are Mining, Quarrying, & Extraction (100.0%), Real Estate, Rental & Leasing (100.0%), and Construction (96.7%), whereas the industries that tend to have a higher number of women are Public Administration (100.0%), Professional & Scientific (92.2%), and Health Care & Social Assistance (89.6%).
| Industry | Male | Female |
| Agriculture, Fishing & Hunting | 0 (0.0%) | 0 (0.0%) |
| Mining, Quarrying, & Extraction | 29 (100.0%) | 0 (0.0%) |
| Construction | 289 (96.7%) | 10 (3.3%) |
| Manufacturing | 201 (78.8%) | 54 (21.2%) |
| Wholesale Trade | 62 (87.3%) | 9 (12.7%) |
| Retail Trade | 212 (50.7%) | 206 (49.3%) |
| Transportation & Warehousing | 229 (73.6%) | 82 (26.4%) |
| Utilities | 0 (0.0%) | 0 (0.0%) |
| Information | 20 (40.8%) | 29 (59.2%) |
| Finance & Insurance | 92 (70.8%) | 38 (29.2%) |
| Real Estate, Rental & Leasing | 32 (100.0%) | 0 (0.0%) |
| Professional & Scientific | 6 (7.8%) | 71 (92.2%) |
| Enterprise Management | 0 (0.0%) | 0 (0.0%) |
| Administrative & Support | 29 (34.5%) | 55 (65.5%) |
| Educational Services | 49 (21.7%) | 177 (78.3%) |
| Health Care & Social Assistance | 41 (10.3%) | 355 (89.6%) |
| Arts, Entertainment & Recreation | 23 (56.1%) | 18 (43.9%) |
| Accommodation & Food Services | 115 (58.4%) | 82 (41.6%) |
| Public Administration | 0 (0.0%) | 33 (100.0%) |
| Total | 1,471 (54.0%) | 1,253 (46.0%) |
Education in Walton
School Enrollment in Walton
The most common levels of schooling among the 1,528 students in Walton are elementary school (331 | 21.7%), middle school (317 | 20.7%), and high school (287 | 18.8%).
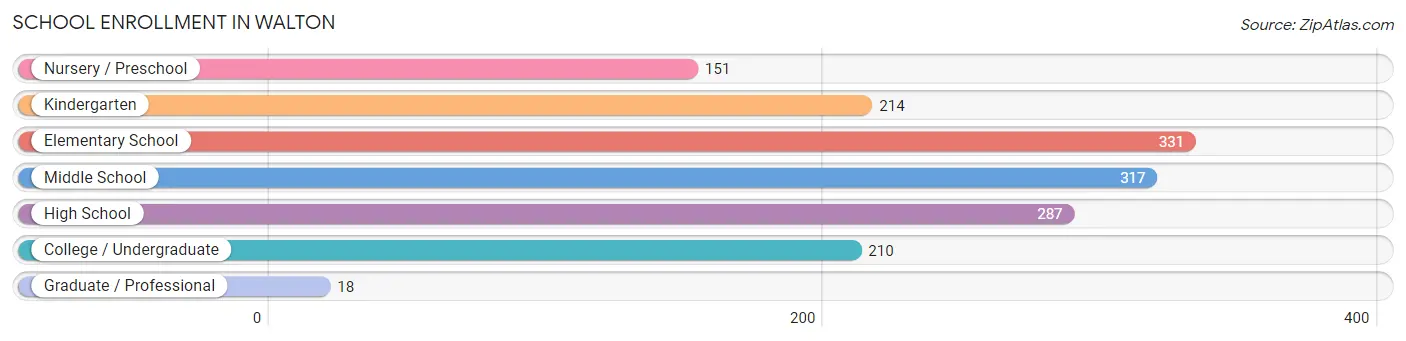
| School Level | # Students | % Students |
| Nursery / Preschool | 151 | 9.9% |
| Kindergarten | 214 | 14.0% |
| Elementary School | 331 | 21.7% |
| Middle School | 317 | 20.7% |
| High School | 287 | 18.8% |
| College / Undergraduate | 210 | 13.7% |
| Graduate / Professional | 18 | 1.2% |
| Total | 1,528 | 100.0% |
School Enrollment by Age by Funding Source in Walton
Out of a total of 1,528 students who are enrolled in schools in Walton, 206 (13.5%) attend a private institution, while the remaining 1,322 (86.5%) are enrolled in public schools. The age group of 35 years and over has the highest likelihood of being enrolled in private schools, with 41 (47.7% in the age bracket) enrolled. Conversely, the age group of 15 to 17 year olds has the lowest likelihood of being enrolled in a private school, with 256 (100.0% in the age bracket) attending a public institution.
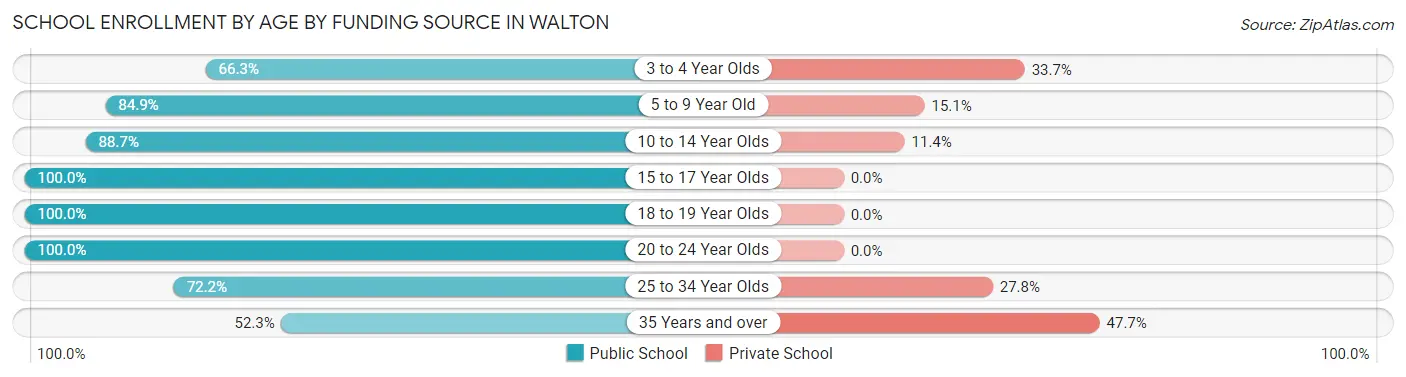
| Age Bracket | Public School | Private School |
| 3 to 4 Year Olds | 57 (66.3%) | 29 (33.7%) |
| 5 to 9 Year Old | 468 (84.9%) | 83 (15.1%) |
| 10 to 14 Year Olds | 336 (88.6%) | 43 (11.4%) |
| 15 to 17 Year Olds | 256 (100.0%) | 0 (0.0%) |
| 18 to 19 Year Olds | 97 (100.0%) | 0 (0.0%) |
| 20 to 24 Year Olds | 37 (100.0%) | 0 (0.0%) |
| 25 to 34 Year Olds | 26 (72.2%) | 10 (27.8%) |
| 35 Years and over | 45 (52.3%) | 41 (47.7%) |
| Total | 1,322 (86.5%) | 206 (13.5%) |
Educational Attainment by Field of Study in Walton
Business (190 | 19.7%), education (180 | 18.7%), science & technology (155 | 16.1%), social sciences (119 | 12.4%), and arts & humanities (69 | 7.2%) are the most common fields of study among 963 individuals in Walton who have obtained a bachelor's degree or higher.
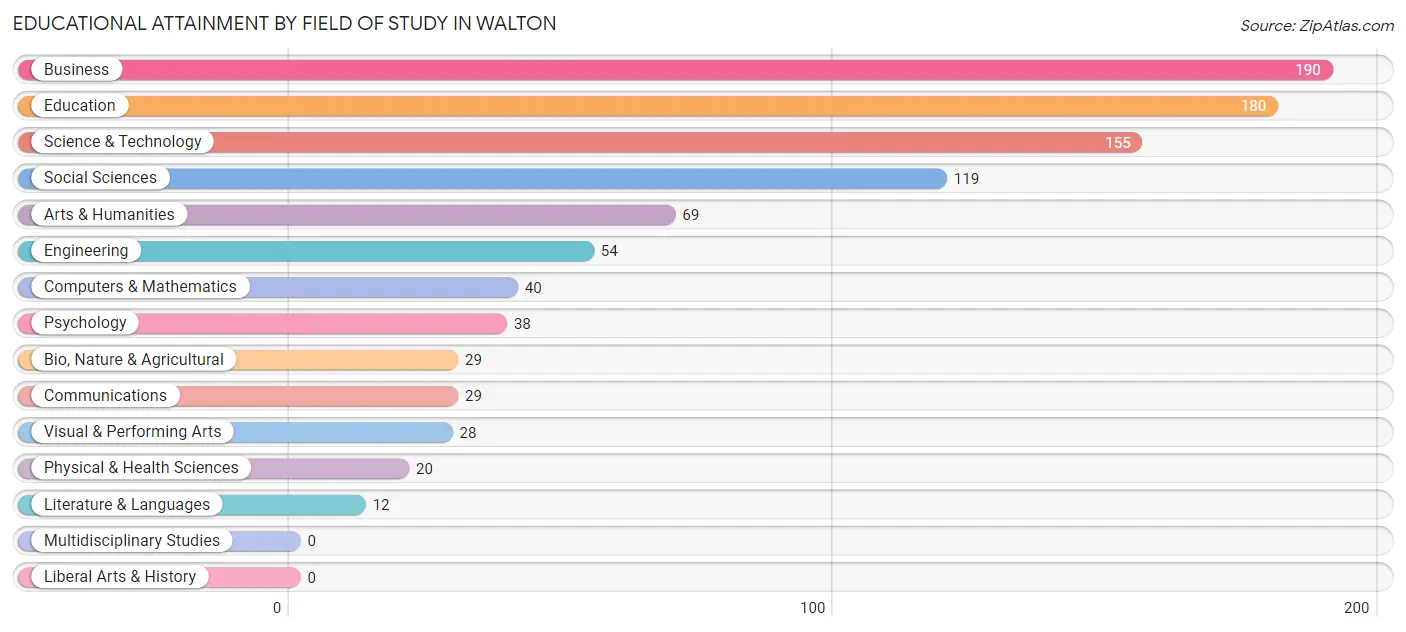
| Field of Study | # Graduates | % Graduates |
| Computers & Mathematics | 40 | 4.2% |
| Bio, Nature & Agricultural | 29 | 3.0% |
| Physical & Health Sciences | 20 | 2.1% |
| Psychology | 38 | 4.0% |
| Social Sciences | 119 | 12.4% |
| Engineering | 54 | 5.6% |
| Multidisciplinary Studies | 0 | 0.0% |
| Science & Technology | 155 | 16.1% |
| Business | 190 | 19.7% |
| Education | 180 | 18.7% |
| Literature & Languages | 12 | 1.3% |
| Liberal Arts & History | 0 | 0.0% |
| Visual & Performing Arts | 28 | 2.9% |
| Communications | 29 | 3.0% |
| Arts & Humanities | 69 | 7.2% |
| Total | 963 | 100.0% |
Transportation & Commute in Walton
Vehicle Availability by Sex in Walton
The most prevalent vehicle ownership categories in Walton are males with 2 vehicles (750, accounting for 51.0%) and females with 2 vehicles (679, making up 60.9%).
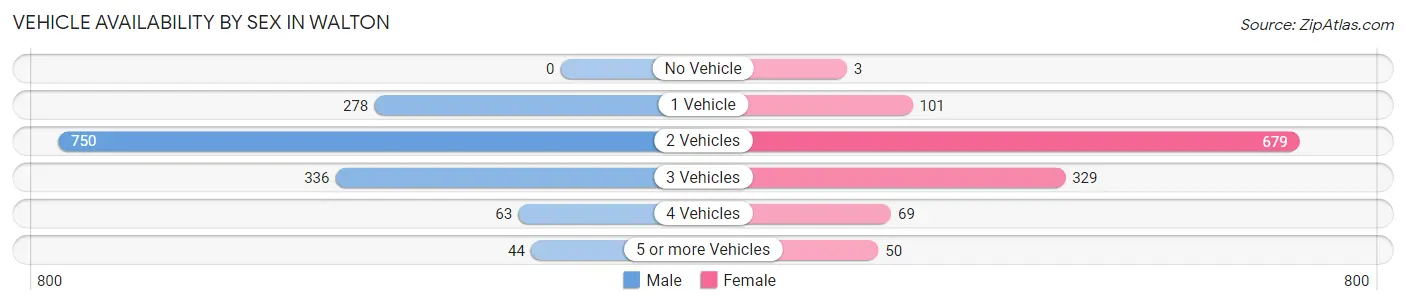
| Vehicles Available | Male | Female |
| No Vehicle | 0 (0.0%) | 3 (0.2%) |
| 1 Vehicle | 278 (18.9%) | 101 (8.2%) |
| 2 Vehicles | 750 (51.0%) | 679 (55.2%) |
| 3 Vehicles | 336 (22.8%) | 329 (26.7%) |
| 4 Vehicles | 63 (4.3%) | 69 (5.6%) |
| 5 or more Vehicles | 44 (3.0%) | 50 (4.1%) |
| Total | 1,471 (100.0%) | 1,231 (100.0%) |
Commute Time in Walton
The most frequently occuring commute durations in Walton are 20 to 24 minutes (578 commuters, 22.9%), 30 to 34 minutes (399 commuters, 15.8%), and 15 to 19 minutes (388 commuters, 15.3%).
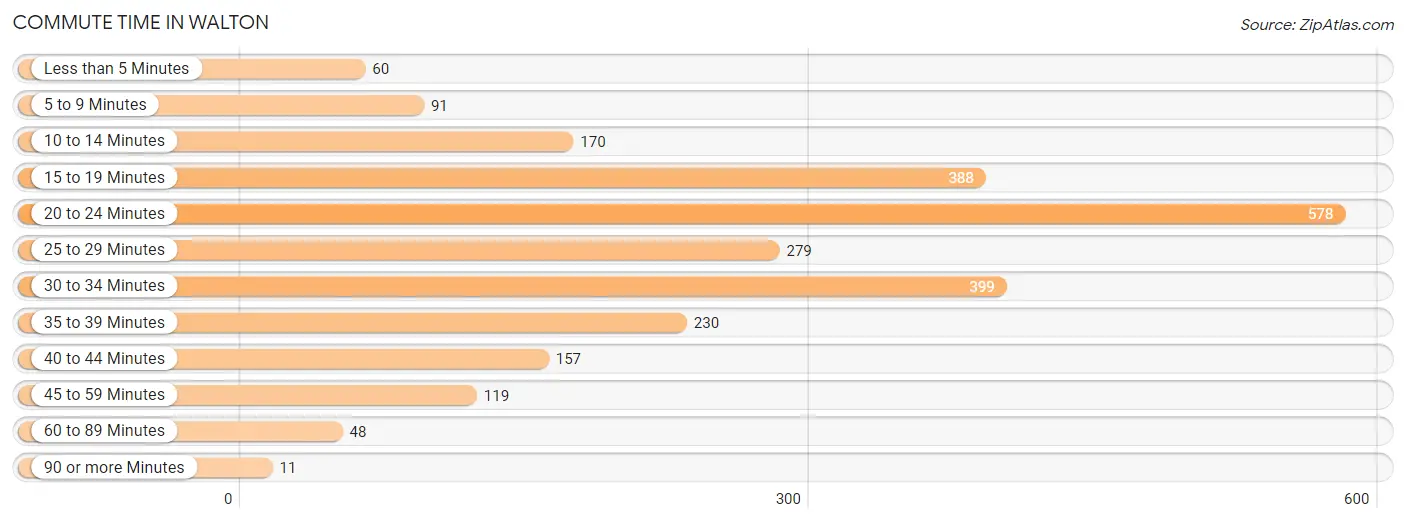
| Commute Time | # Commuters | % Commuters |
| Less than 5 Minutes | 60 | 2.4% |
| 5 to 9 Minutes | 91 | 3.6% |
| 10 to 14 Minutes | 170 | 6.7% |
| 15 to 19 Minutes | 388 | 15.3% |
| 20 to 24 Minutes | 578 | 22.9% |
| 25 to 29 Minutes | 279 | 11.0% |
| 30 to 34 Minutes | 399 | 15.8% |
| 35 to 39 Minutes | 230 | 9.1% |
| 40 to 44 Minutes | 157 | 6.2% |
| 45 to 59 Minutes | 119 | 4.7% |
| 60 to 89 Minutes | 48 | 1.9% |
| 90 or more Minutes | 11 | 0.4% |
Commute Time by Sex in Walton
The most common commute times in Walton are 20 to 24 minutes (272 commuters, 20.0%) for males and 20 to 24 minutes (306 commuters, 26.2%) for females.
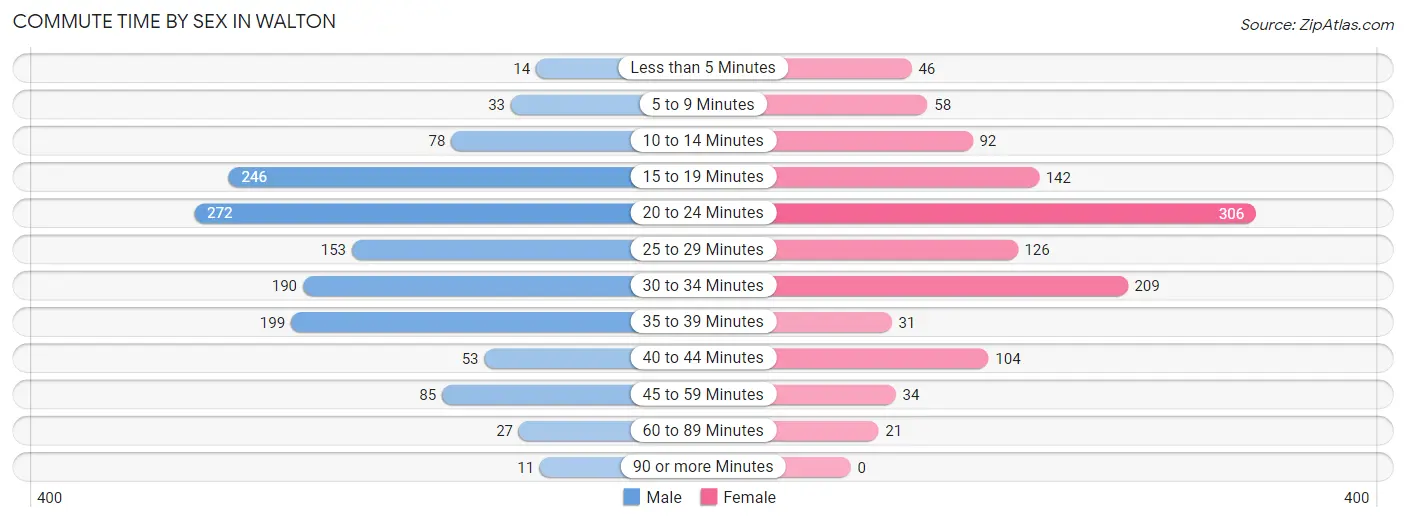
| Commute Time | Male | Female |
| Less than 5 Minutes | 14 (1.0%) | 46 (3.9%) |
| 5 to 9 Minutes | 33 (2.4%) | 58 (5.0%) |
| 10 to 14 Minutes | 78 (5.7%) | 92 (7.9%) |
| 15 to 19 Minutes | 246 (18.1%) | 142 (12.1%) |
| 20 to 24 Minutes | 272 (20.0%) | 306 (26.2%) |
| 25 to 29 Minutes | 153 (11.2%) | 126 (10.8%) |
| 30 to 34 Minutes | 190 (14.0%) | 209 (17.9%) |
| 35 to 39 Minutes | 199 (14.6%) | 31 (2.6%) |
| 40 to 44 Minutes | 53 (3.9%) | 104 (8.9%) |
| 45 to 59 Minutes | 85 (6.2%) | 34 (2.9%) |
| 60 to 89 Minutes | 27 (2.0%) | 21 (1.8%) |
| 90 or more Minutes | 11 (0.8%) | 0 (0.0%) |
Time of Departure to Work by Sex in Walton
The most frequent times of departure to work in Walton are 6:00 AM to 6:29 AM (348, 25.6%) for males and 12:00 PM to 3:59 PM (181, 15.5%) for females.
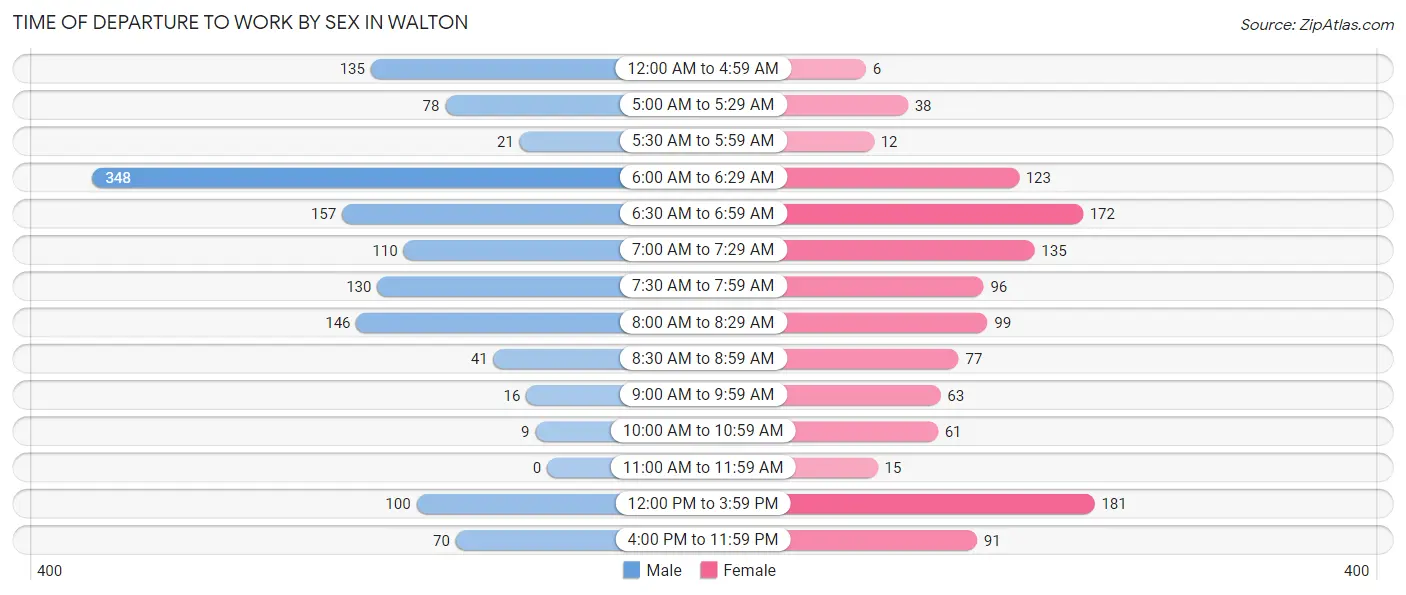
| Time of Departure | Male | Female |
| 12:00 AM to 4:59 AM | 135 (9.9%) | 6 (0.5%) |
| 5:00 AM to 5:29 AM | 78 (5.7%) | 38 (3.3%) |
| 5:30 AM to 5:59 AM | 21 (1.5%) | 12 (1.0%) |
| 6:00 AM to 6:29 AM | 348 (25.6%) | 123 (10.5%) |
| 6:30 AM to 6:59 AM | 157 (11.5%) | 172 (14.7%) |
| 7:00 AM to 7:29 AM | 110 (8.1%) | 135 (11.6%) |
| 7:30 AM to 7:59 AM | 130 (9.6%) | 96 (8.2%) |
| 8:00 AM to 8:29 AM | 146 (10.7%) | 99 (8.5%) |
| 8:30 AM to 8:59 AM | 41 (3.0%) | 77 (6.6%) |
| 9:00 AM to 9:59 AM | 16 (1.2%) | 63 (5.4%) |
| 10:00 AM to 10:59 AM | 9 (0.7%) | 61 (5.2%) |
| 11:00 AM to 11:59 AM | 0 (0.0%) | 15 (1.3%) |
| 12:00 PM to 3:59 PM | 100 (7.3%) | 181 (15.5%) |
| 4:00 PM to 11:59 PM | 70 (5.1%) | 91 (7.8%) |
| Total | 1,361 (100.0%) | 1,169 (100.0%) |
Housing Occupancy in Walton
Occupancy by Ownership in Walton
Of the total 1,800 dwellings in Walton, owner-occupied units account for 1,311 (72.8%), while renter-occupied units make up 489 (27.2%).
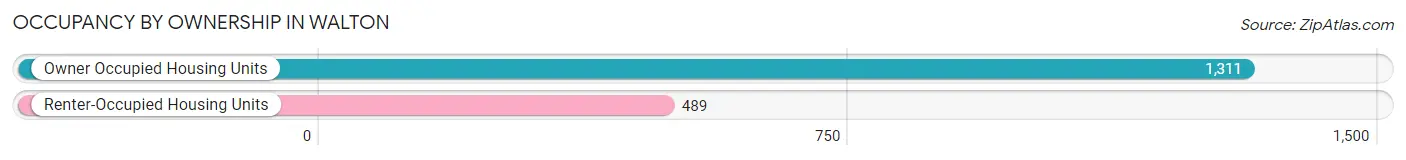
| Occupancy | # Housing Units | % Housing Units |
| Owner Occupied Housing Units | 1,311 | 72.8% |
| Renter-Occupied Housing Units | 489 | 27.2% |
| Total Occupied Housing Units | 1,800 | 100.0% |
Occupancy by Household Size in Walton
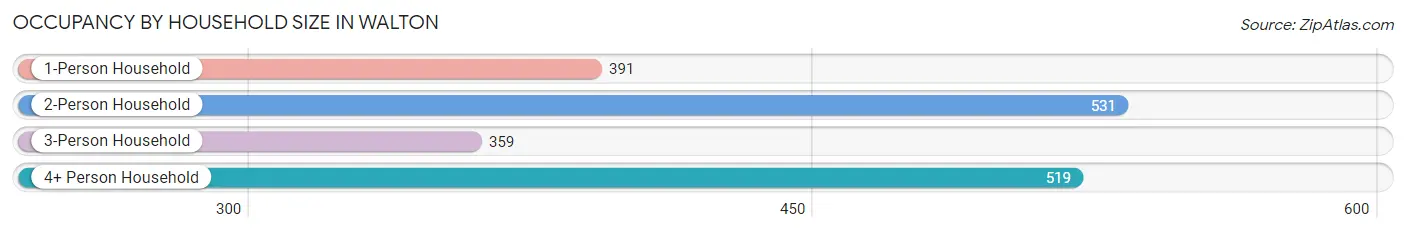
| Household Size | # Housing Units | % Housing Units |
| 1-Person Household | 391 | 21.7% |
| 2-Person Household | 531 | 29.5% |
| 3-Person Household | 359 | 19.9% |
| 4+ Person Household | 519 | 28.8% |
| Total Housing Units | 1,800 | 100.0% |
Occupancy by Ownership by Household Size in Walton
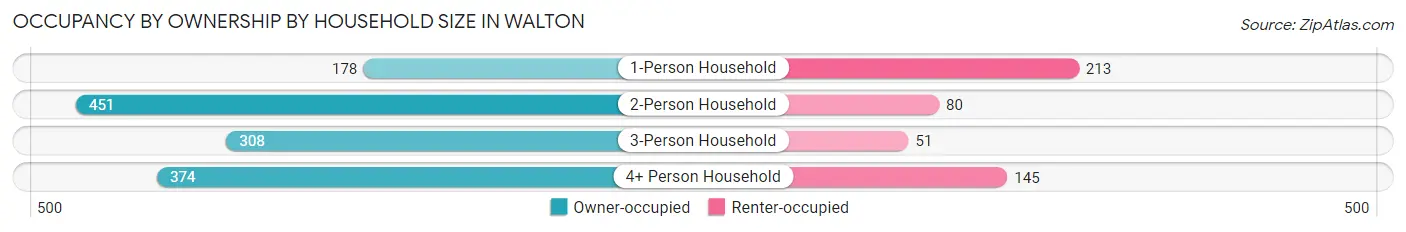
| Household Size | Owner-occupied | Renter-occupied |
| 1-Person Household | 178 (45.5%) | 213 (54.5%) |
| 2-Person Household | 451 (84.9%) | 80 (15.1%) |
| 3-Person Household | 308 (85.8%) | 51 (14.2%) |
| 4+ Person Household | 374 (72.1%) | 145 (27.9%) |
| Total Housing Units | 1,311 (72.8%) | 489 (27.2%) |
Occupancy by Educational Attainment in Walton
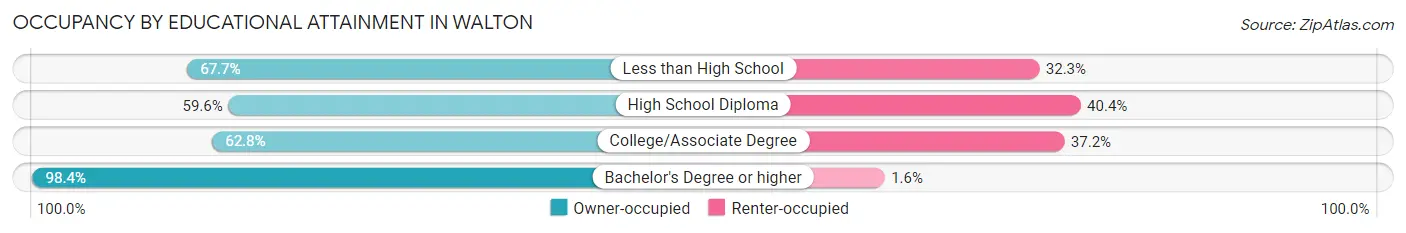
| Household Size | Owner-occupied | Renter-occupied |
| Less than High School | 42 (67.7%) | 20 (32.3%) |
| High School Diploma | 405 (59.6%) | 275 (40.4%) |
| College/Associate Degree | 312 (62.8%) | 185 (37.2%) |
| Bachelor's Degree or higher | 552 (98.4%) | 9 (1.6%) |
Occupancy by Age of Householder in Walton
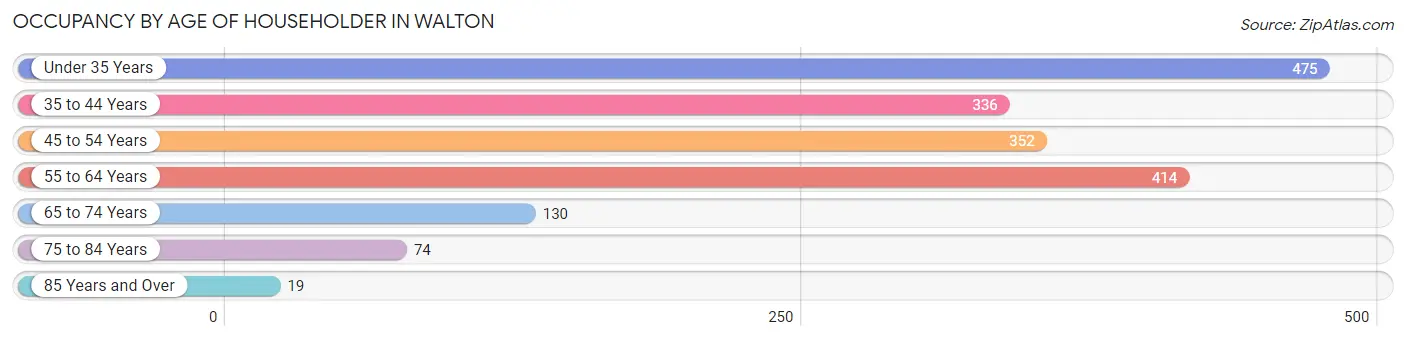
| Age Bracket | # Households | % Households |
| Under 35 Years | 475 | 26.4% |
| 35 to 44 Years | 336 | 18.7% |
| 45 to 54 Years | 352 | 19.6% |
| 55 to 64 Years | 414 | 23.0% |
| 65 to 74 Years | 130 | 7.2% |
| 75 to 84 Years | 74 | 4.1% |
| 85 Years and Over | 19 | 1.1% |
| Total | 1,800 | 100.0% |
Housing Finances in Walton
Median Income by Occupancy in Walton
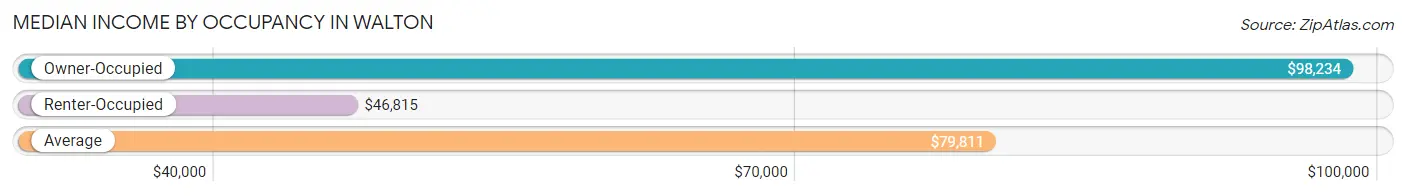
| Occupancy Type | # Households | Median Income |
| Owner-Occupied | 1,311 (72.8%) | $98,234 |
| Renter-Occupied | 489 (27.2%) | $46,815 |
| Average | 1,800 (100.0%) | $79,811 |
Occupancy by Householder Income Bracket in Walton
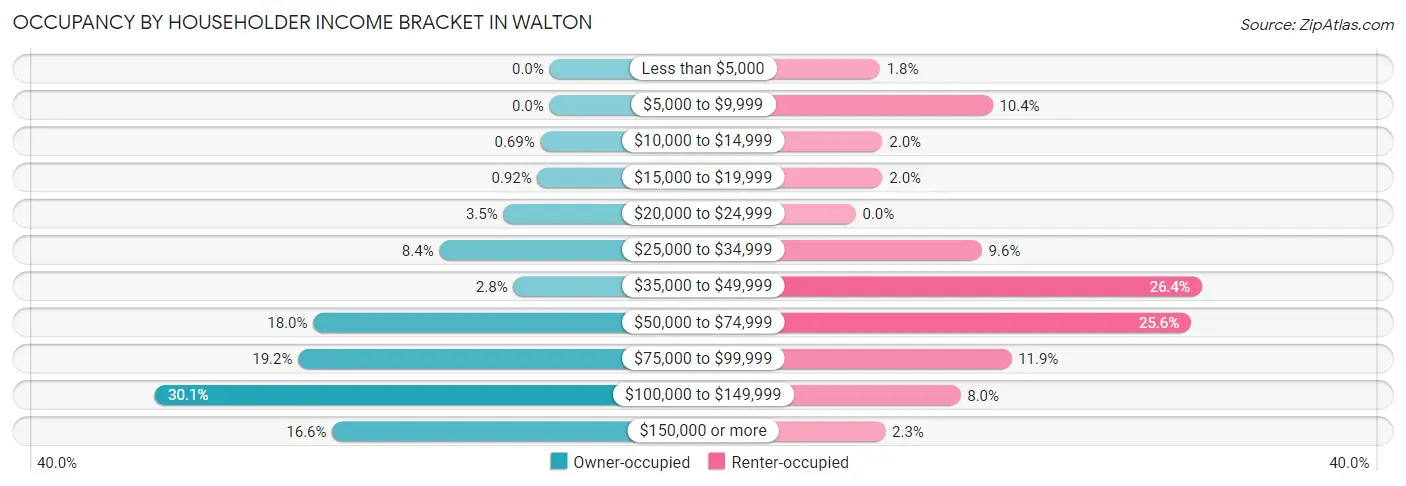
| Income Bracket | Owner-occupied | Renter-occupied |
| Less than $5,000 | 0 (0.0%) | 9 (1.8%) |
| $5,000 to $9,999 | 0 (0.0%) | 51 (10.4%) |
| $10,000 to $14,999 | 9 (0.7%) | 10 (2.0%) |
| $15,000 to $19,999 | 12 (0.9%) | 10 (2.0%) |
| $20,000 to $24,999 | 46 (3.5%) | 0 (0.0%) |
| $25,000 to $34,999 | 110 (8.4%) | 47 (9.6%) |
| $35,000 to $49,999 | 36 (2.8%) | 129 (26.4%) |
| $50,000 to $74,999 | 236 (18.0%) | 125 (25.6%) |
| $75,000 to $99,999 | 251 (19.2%) | 58 (11.9%) |
| $100,000 to $149,999 | 394 (30.0%) | 39 (8.0%) |
| $150,000 or more | 217 (16.6%) | 11 (2.2%) |
| Total | 1,311 (100.0%) | 489 (100.0%) |
Monthly Housing Cost Tiers in Walton
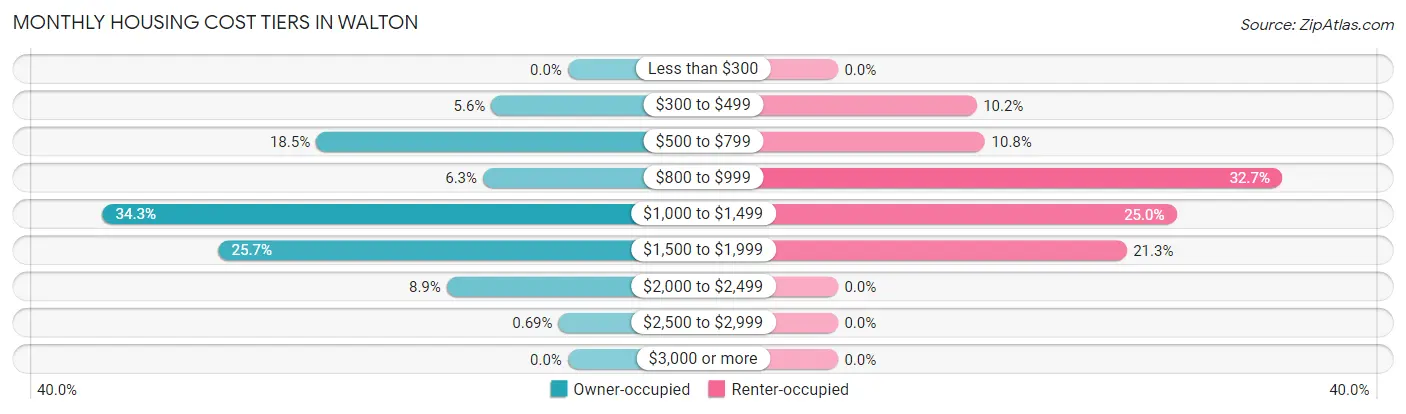
| Monthly Cost | Owner-occupied | Renter-occupied |
| Less than $300 | 0 (0.0%) | 0 (0.0%) |
| $300 to $499 | 74 (5.6%) | 50 (10.2%) |
| $500 to $799 | 243 (18.5%) | 53 (10.8%) |
| $800 to $999 | 82 (6.2%) | 160 (32.7%) |
| $1,000 to $1,499 | 449 (34.3%) | 122 (24.9%) |
| $1,500 to $1,999 | 337 (25.7%) | 104 (21.3%) |
| $2,000 to $2,499 | 117 (8.9%) | 0 (0.0%) |
| $2,500 to $2,999 | 9 (0.7%) | 0 (0.0%) |
| $3,000 or more | 0 (0.0%) | 0 (0.0%) |
| Total | 1,311 (100.0%) | 489 (100.0%) |
Physical Housing Characteristics in Walton
Housing Structures in Walton
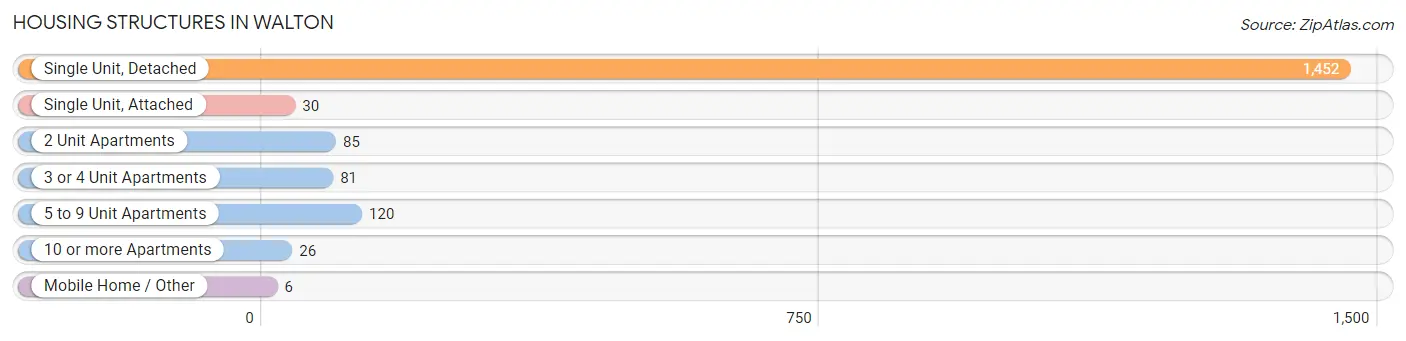
| Structure Type | # Housing Units | % Housing Units |
| Single Unit, Detached | 1,452 | 80.7% |
| Single Unit, Attached | 30 | 1.7% |
| 2 Unit Apartments | 85 | 4.7% |
| 3 or 4 Unit Apartments | 81 | 4.5% |
| 5 to 9 Unit Apartments | 120 | 6.7% |
| 10 or more Apartments | 26 | 1.4% |
| Mobile Home / Other | 6 | 0.3% |
| Total | 1,800 | 100.0% |
Housing Structures by Occupancy in Walton
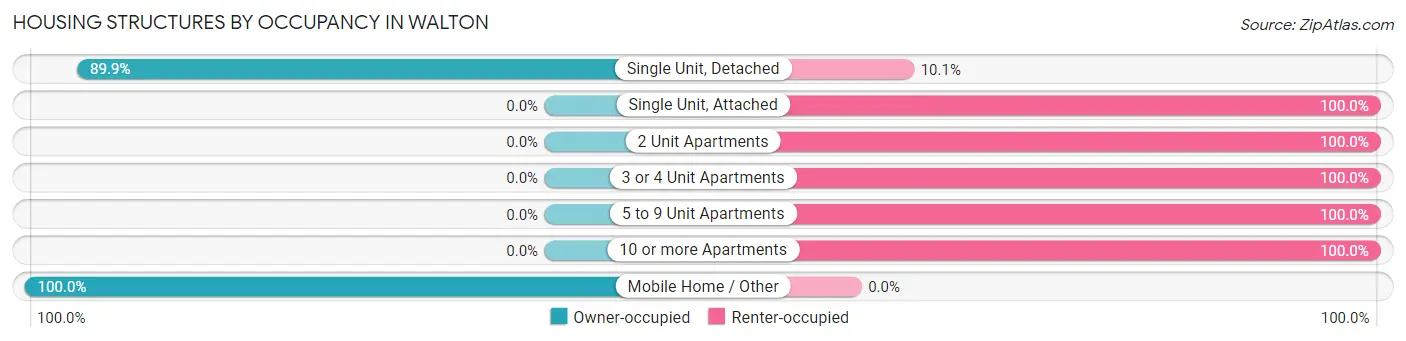
| Structure Type | Owner-occupied | Renter-occupied |
| Single Unit, Detached | 1,305 (89.9%) | 147 (10.1%) |
| Single Unit, Attached | 0 (0.0%) | 30 (100.0%) |
| 2 Unit Apartments | 0 (0.0%) | 85 (100.0%) |
| 3 or 4 Unit Apartments | 0 (0.0%) | 81 (100.0%) |
| 5 to 9 Unit Apartments | 0 (0.0%) | 120 (100.0%) |
| 10 or more Apartments | 0 (0.0%) | 26 (100.0%) |
| Mobile Home / Other | 6 (100.0%) | 0 (0.0%) |
| Total | 1,311 (72.8%) | 489 (27.2%) |
Housing Structures by Number of Rooms in Walton
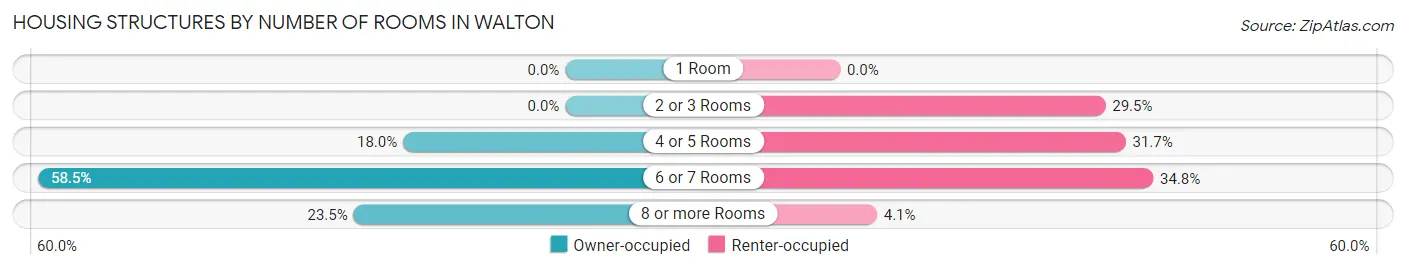
| Number of Rooms | Owner-occupied | Renter-occupied |
| 1 Room | 0 (0.0%) | 0 (0.0%) |
| 2 or 3 Rooms | 0 (0.0%) | 144 (29.4%) |
| 4 or 5 Rooms | 236 (18.0%) | 155 (31.7%) |
| 6 or 7 Rooms | 767 (58.5%) | 170 (34.8%) |
| 8 or more Rooms | 308 (23.5%) | 20 (4.1%) |
| Total | 1,311 (100.0%) | 489 (100.0%) |
Housing Structure by Heating Type in Walton
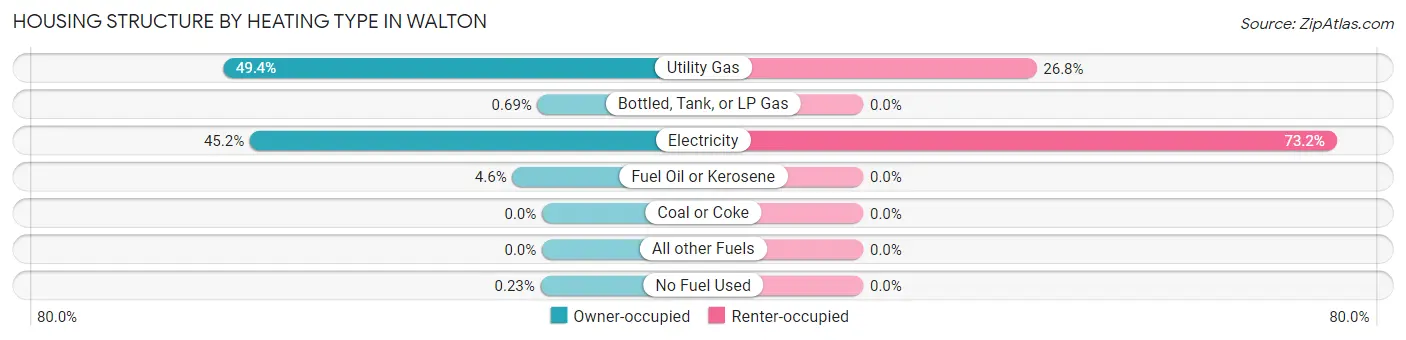
| Heating Type | Owner-occupied | Renter-occupied |
| Utility Gas | 647 (49.3%) | 131 (26.8%) |
| Bottled, Tank, or LP Gas | 9 (0.7%) | 0 (0.0%) |
| Electricity | 592 (45.2%) | 358 (73.2%) |
| Fuel Oil or Kerosene | 60 (4.6%) | 0 (0.0%) |
| Coal or Coke | 0 (0.0%) | 0 (0.0%) |
| All other Fuels | 0 (0.0%) | 0 (0.0%) |
| No Fuel Used | 3 (0.2%) | 0 (0.0%) |
| Total | 1,311 (100.0%) | 489 (100.0%) |
Household Vehicle Usage in Walton
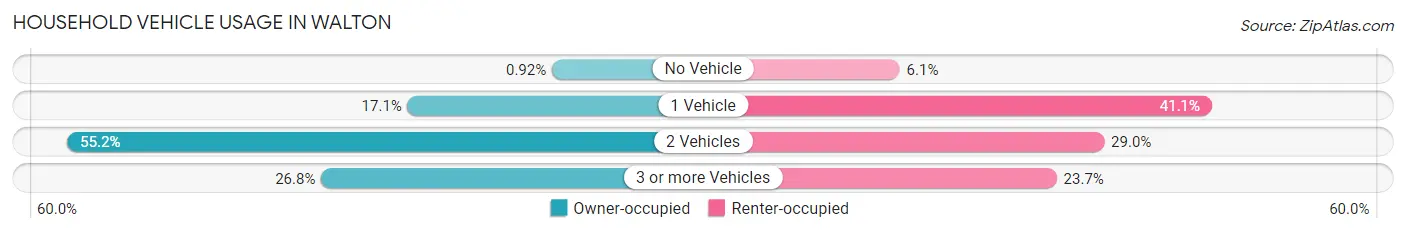
| Vehicles per Household | Owner-occupied | Renter-occupied |
| No Vehicle | 12 (0.9%) | 30 (6.1%) |
| 1 Vehicle | 224 (17.1%) | 201 (41.1%) |
| 2 Vehicles | 724 (55.2%) | 142 (29.0%) |
| 3 or more Vehicles | 351 (26.8%) | 116 (23.7%) |
| Total | 1,311 (100.0%) | 489 (100.0%) |
Real Estate & Mortgages in Walton
Real Estate and Mortgage Overview in Walton
| Characteristic | Without Mortgage | With Mortgage |
| Housing Units | 283 | 1,028 |
| Median Property Value | $232,200 | $212,200 |
| Median Household Income | $76,607 | $197 |
| Monthly Housing Costs | $624 | $0 |
| Real Estate Taxes | $3,083 | $53 |
Property Value by Mortgage Status in Walton
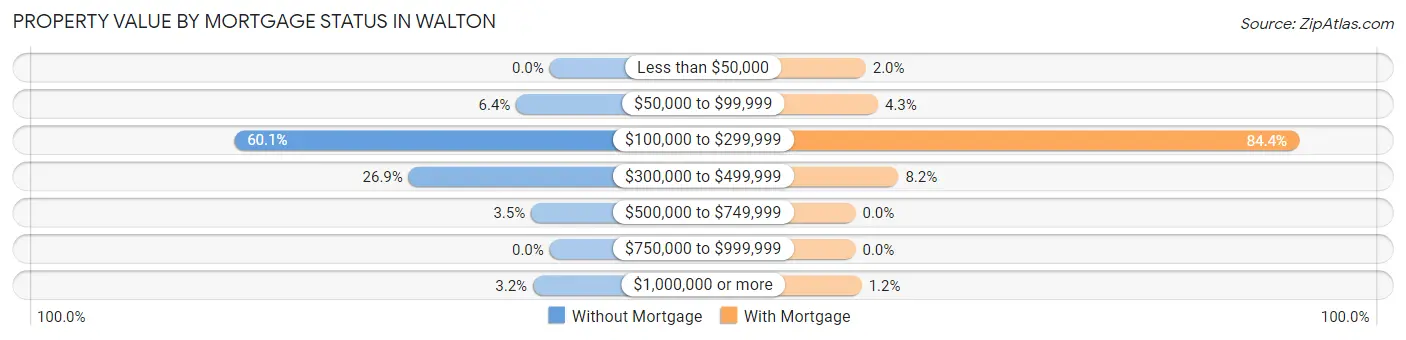
| Property Value | Without Mortgage | With Mortgage |
| Less than $50,000 | 0 (0.0%) | 20 (1.9%) |
| $50,000 to $99,999 | 18 (6.4%) | 44 (4.3%) |
| $100,000 to $299,999 | 170 (60.1%) | 868 (84.4%) |
| $300,000 to $499,999 | 76 (26.9%) | 84 (8.2%) |
| $500,000 to $749,999 | 10 (3.5%) | 0 (0.0%) |
| $750,000 to $999,999 | 0 (0.0%) | 0 (0.0%) |
| $1,000,000 or more | 9 (3.2%) | 12 (1.2%) |
| Total | 283 (100.0%) | 1,028 (100.0%) |
Household Income by Mortgage Status in Walton
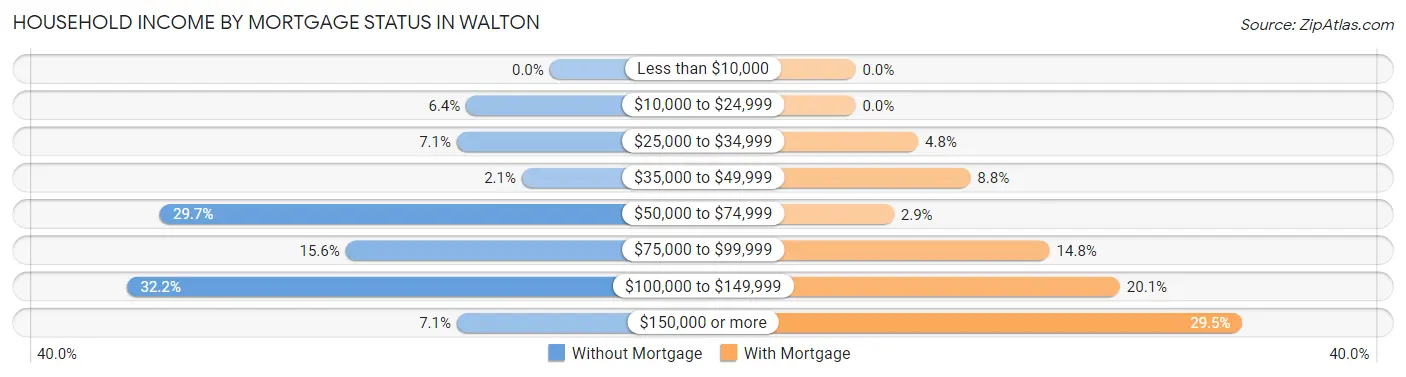
| Household Income | Without Mortgage | With Mortgage |
| Less than $10,000 | 0 (0.0%) | 0 (0.0%) |
| $10,000 to $24,999 | 18 (6.4%) | 0 (0.0%) |
| $25,000 to $34,999 | 20 (7.1%) | 49 (4.8%) |
| $35,000 to $49,999 | 6 (2.1%) | 90 (8.7%) |
| $50,000 to $74,999 | 84 (29.7%) | 30 (2.9%) |
| $75,000 to $99,999 | 44 (15.5%) | 152 (14.8%) |
| $100,000 to $149,999 | 91 (32.2%) | 207 (20.1%) |
| $150,000 or more | 20 (7.1%) | 303 (29.5%) |
| Total | 283 (100.0%) | 1,028 (100.0%) |
Property Value to Household Income Ratio in Walton
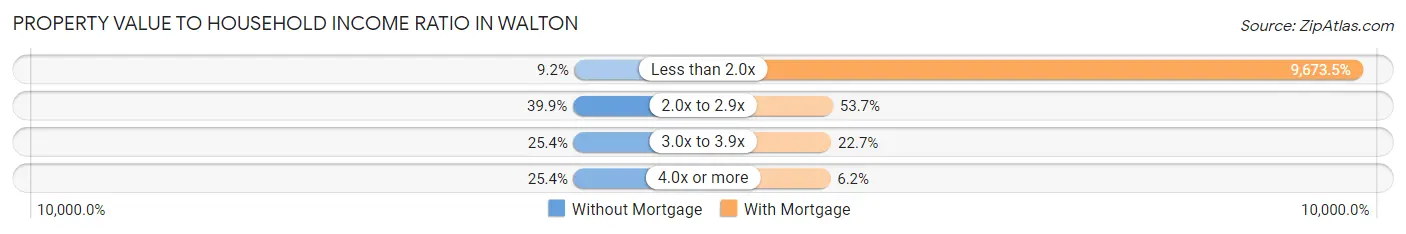
| Value-to-Income Ratio | Without Mortgage | With Mortgage |
| Less than 2.0x | 26 (9.2%) | 99,444 (9,673.5%) |
| 2.0x to 2.9x | 113 (39.9%) | 552 (53.7%) |
| 3.0x to 3.9x | 72 (25.4%) | 233 (22.7%) |
| 4.0x or more | 72 (25.4%) | 64 (6.2%) |
| Total | 283 (100.0%) | 1,028 (100.0%) |
Real Estate Taxes by Mortgage Status in Walton
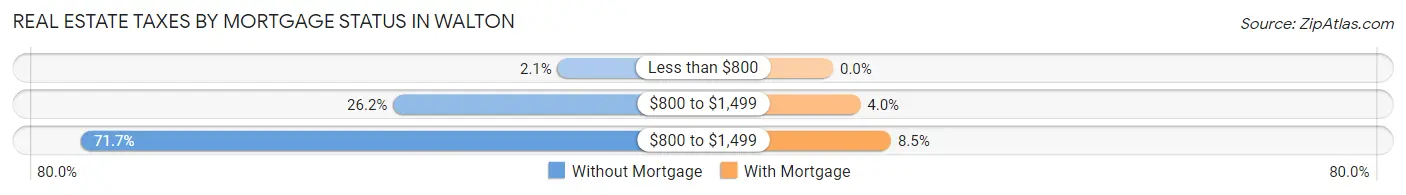
| Property Taxes | Without Mortgage | With Mortgage |
| Less than $800 | 6 (2.1%) | 0 (0.0%) |
| $800 to $1,499 | 74 (26.2%) | 41 (4.0%) |
| $800 to $1,499 | 203 (71.7%) | 87 (8.5%) |
| Total | 283 (100.0%) | 1,028 (100.0%) |
Health & Disability in Walton
Health Insurance Coverage by Age in Walton
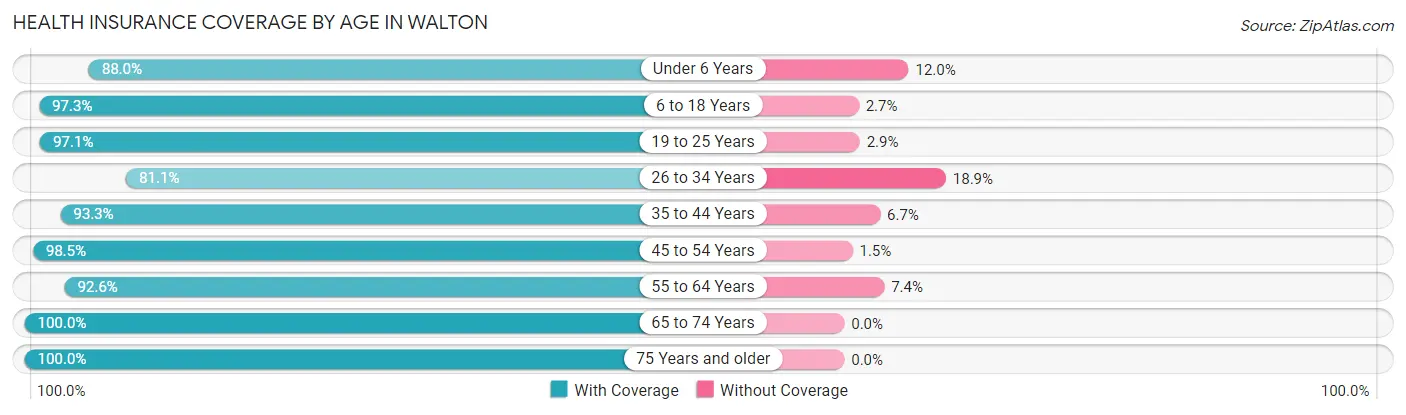
| Age Bracket | With Coverage | Without Coverage |
| Under 6 Years | 573 (88.0%) | 78 (12.0%) |
| 6 to 18 Years | 1,266 (97.3%) | 35 (2.7%) |
| 19 to 25 Years | 304 (97.1%) | 9 (2.9%) |
| 26 to 34 Years | 659 (81.1%) | 154 (18.9%) |
| 35 to 44 Years | 644 (93.3%) | 46 (6.7%) |
| 45 to 54 Years | 639 (98.5%) | 10 (1.5%) |
| 55 to 64 Years | 622 (92.6%) | 50 (7.4%) |
| 65 to 74 Years | 223 (100.0%) | 0 (0.0%) |
| 75 Years and older | 180 (100.0%) | 0 (0.0%) |
| Total | 5,110 (93.0%) | 382 (7.0%) |
Health Insurance Coverage by Citizenship Status in Walton
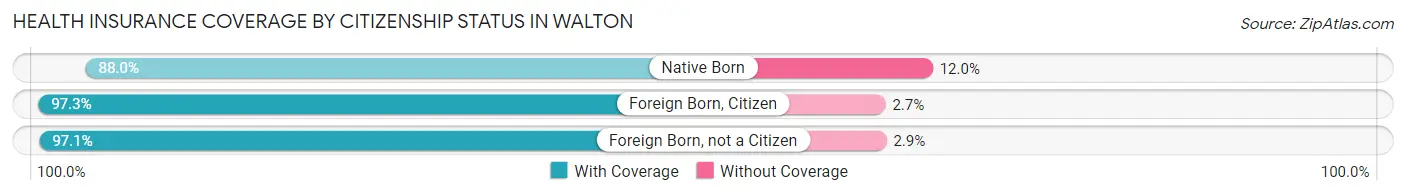
| Citizenship Status | With Coverage | Without Coverage |
| Native Born | 573 (88.0%) | 78 (12.0%) |
| Foreign Born, Citizen | 1,266 (97.3%) | 35 (2.7%) |
| Foreign Born, not a Citizen | 304 (97.1%) | 9 (2.9%) |
Health Insurance Coverage by Household Income in Walton
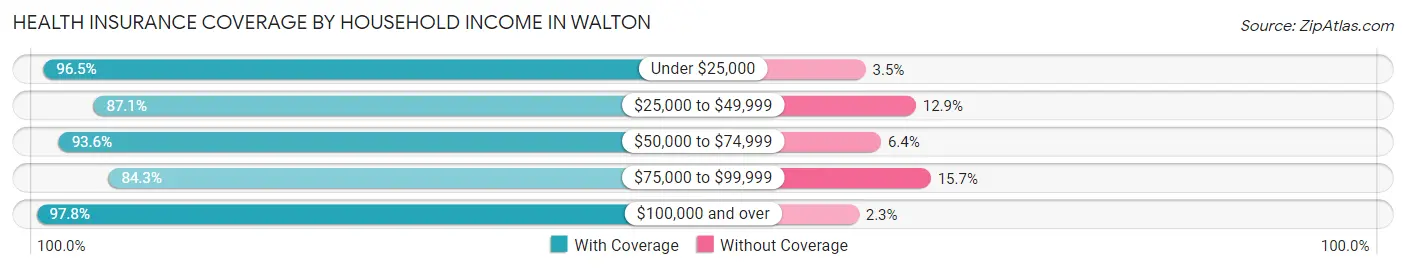
| Household Income | With Coverage | Without Coverage |
| Under $25,000 | 247 (96.5%) | 9 (3.5%) |
| $25,000 to $49,999 | 431 (87.1%) | 64 (12.9%) |
| $50,000 to $74,999 | 1,053 (93.6%) | 72 (6.4%) |
| $75,000 to $99,999 | 975 (84.3%) | 182 (15.7%) |
| $100,000 and over | 2,392 (97.8%) | 55 (2.2%) |
Public vs Private Health Insurance Coverage by Age in Walton
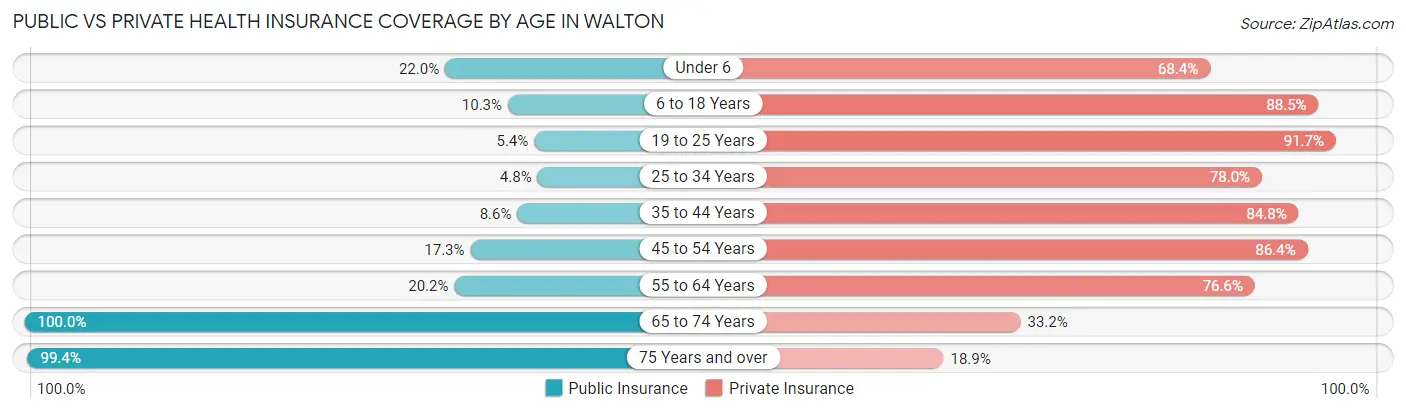
| Age Bracket | Public Insurance | Private Insurance |
| Under 6 | 143 (22.0%) | 445 (68.4%) |
| 6 to 18 Years | 134 (10.3%) | 1,151 (88.5%) |
| 19 to 25 Years | 17 (5.4%) | 287 (91.7%) |
| 25 to 34 Years | 39 (4.8%) | 634 (78.0%) |
| 35 to 44 Years | 59 (8.6%) | 585 (84.8%) |
| 45 to 54 Years | 112 (17.3%) | 561 (86.4%) |
| 55 to 64 Years | 136 (20.2%) | 515 (76.6%) |
| 65 to 74 Years | 223 (100.0%) | 74 (33.2%) |
| 75 Years and over | 179 (99.4%) | 34 (18.9%) |
| Total | 1,042 (19.0%) | 4,286 (78.0%) |
Disability Status by Sex by Age in Walton
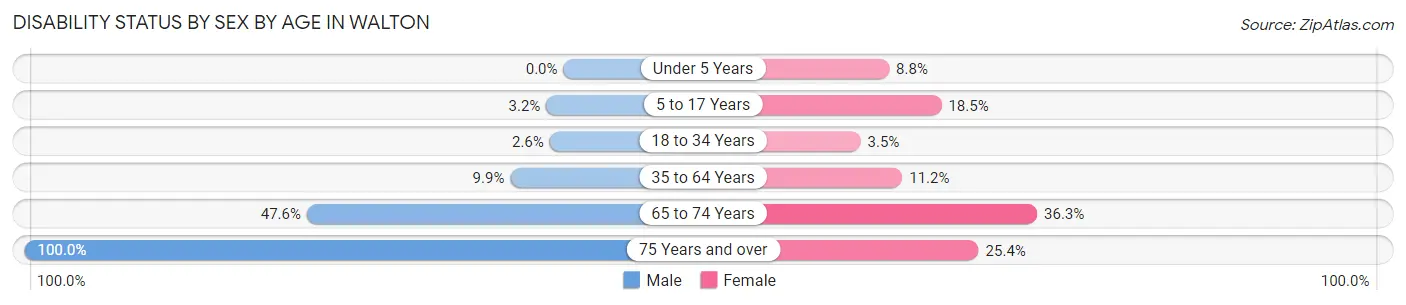
| Age Bracket | Male | Female |
| Under 5 Years | 0 (0.0%) | 24 (8.8%) |
| 5 to 17 Years | 20 (3.2%) | 141 (18.5%) |
| 18 to 34 Years | 12 (2.5%) | 24 (3.5%) |
| 35 to 64 Years | 114 (9.9%) | 96 (11.2%) |
| 65 to 74 Years | 30 (47.6%) | 58 (36.2%) |
| 75 Years and over | 54 (100.0%) | 32 (25.4%) |
Disability Class by Sex by Age in Walton
Disability Class: Hearing Difficulty
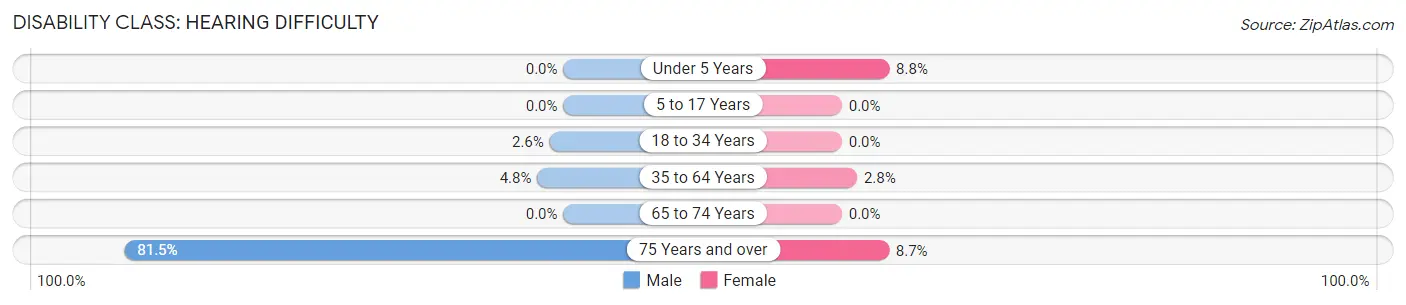
| Age Bracket | Male | Female |
| Under 5 Years | 0 (0.0%) | 24 (8.8%) |
| 5 to 17 Years | 0 (0.0%) | 0 (0.0%) |
| 18 to 34 Years | 12 (2.5%) | 0 (0.0%) |
| 35 to 64 Years | 56 (4.8%) | 24 (2.8%) |
| 65 to 74 Years | 0 (0.0%) | 0 (0.0%) |
| 75 Years and over | 44 (81.5%) | 11 (8.7%) |
Disability Class: Vision Difficulty
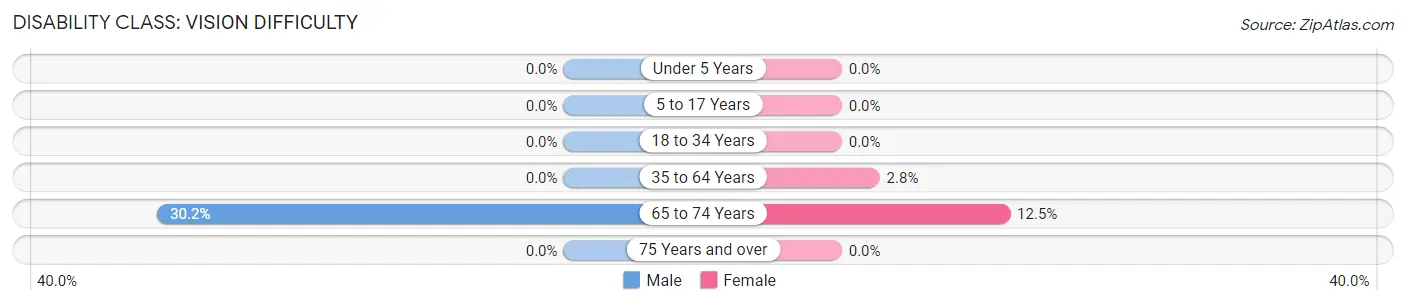
| Age Bracket | Male | Female |
| Under 5 Years | 0 (0.0%) | 0 (0.0%) |
| 5 to 17 Years | 0 (0.0%) | 0 (0.0%) |
| 18 to 34 Years | 0 (0.0%) | 0 (0.0%) |
| 35 to 64 Years | 0 (0.0%) | 24 (2.8%) |
| 65 to 74 Years | 19 (30.2%) | 20 (12.5%) |
| 75 Years and over | 0 (0.0%) | 0 (0.0%) |
Disability Class: Cognitive Difficulty
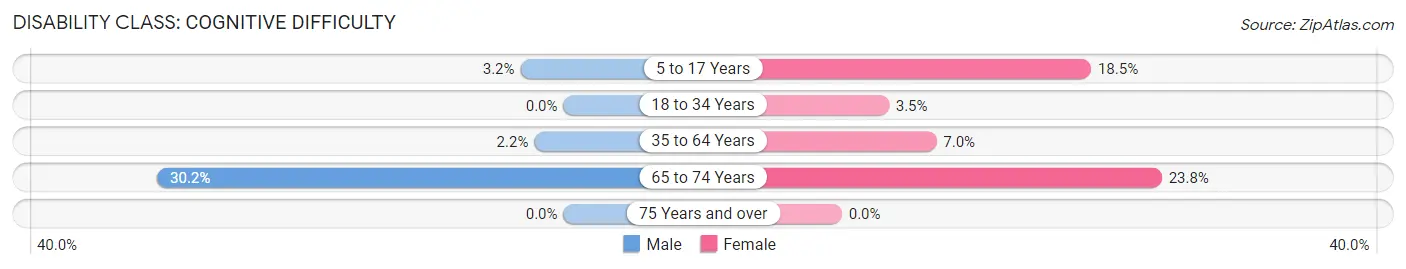
| Age Bracket | Male | Female |
| 5 to 17 Years | 20 (3.2%) | 141 (18.5%) |
| 18 to 34 Years | 0 (0.0%) | 24 (3.5%) |
| 35 to 64 Years | 25 (2.2%) | 60 (7.0%) |
| 65 to 74 Years | 19 (30.2%) | 38 (23.7%) |
| 75 Years and over | 0 (0.0%) | 0 (0.0%) |
Disability Class: Ambulatory Difficulty
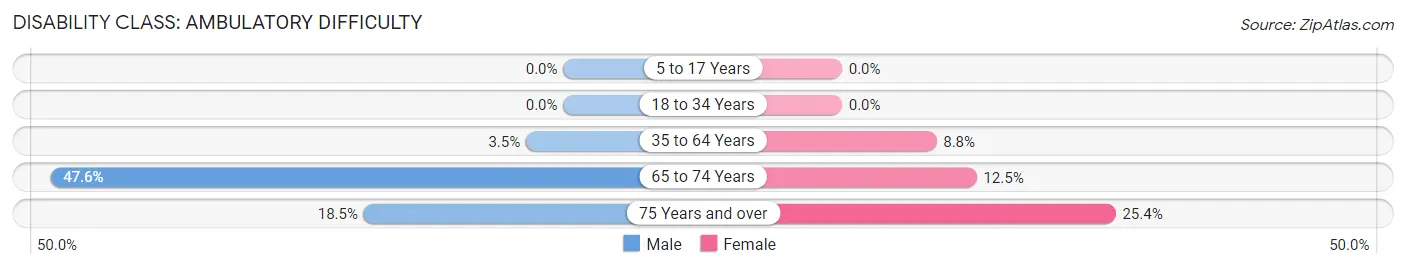
| Age Bracket | Male | Female |
| 5 to 17 Years | 0 (0.0%) | 0 (0.0%) |
| 18 to 34 Years | 0 (0.0%) | 0 (0.0%) |
| 35 to 64 Years | 40 (3.5%) | 75 (8.8%) |
| 65 to 74 Years | 30 (47.6%) | 20 (12.5%) |
| 75 Years and over | 10 (18.5%) | 32 (25.4%) |
Disability Class: Self-Care Difficulty
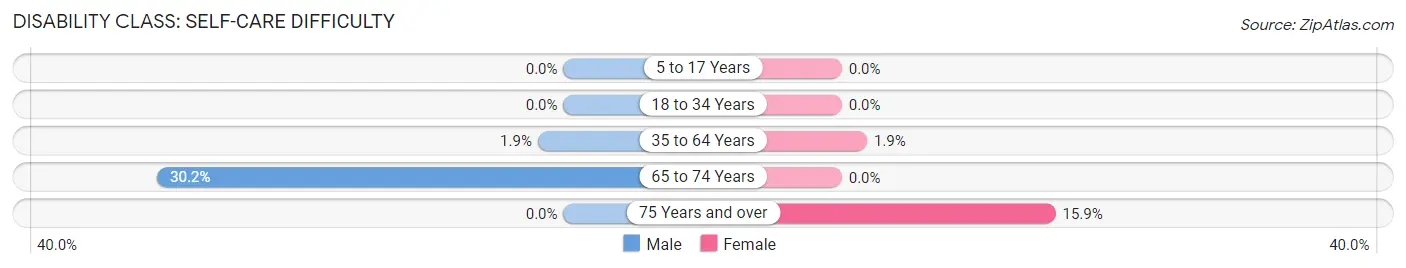
| Age Bracket | Male | Female |
| 5 to 17 Years | 0 (0.0%) | 0 (0.0%) |
| 18 to 34 Years | 0 (0.0%) | 0 (0.0%) |
| 35 to 64 Years | 22 (1.9%) | 16 (1.9%) |
| 65 to 74 Years | 19 (30.2%) | 0 (0.0%) |
| 75 Years and over | 0 (0.0%) | 20 (15.9%) |
Technology Access in Walton
Computing Device Access in Walton
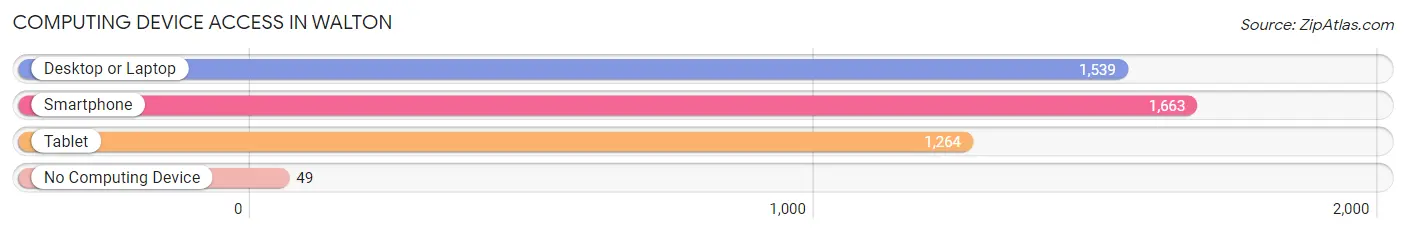
| Device Type | # Households | % Households |
| Desktop or Laptop | 1,539 | 85.5% |
| Smartphone | 1,663 | 92.4% |
| Tablet | 1,264 | 70.2% |
| No Computing Device | 49 | 2.7% |
| Total | 1,800 | 100.0% |
Internet Access in Walton
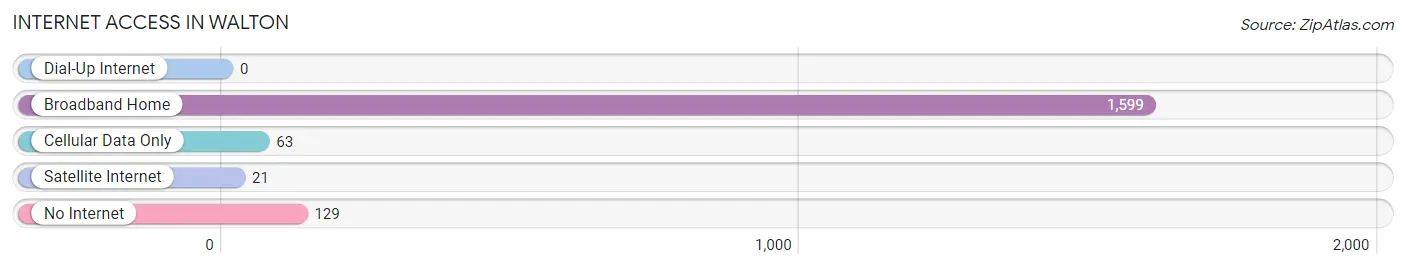
| Internet Type | # Households | % Households |
| Dial-Up Internet | 0 | 0.0% |
| Broadband Home | 1,599 | 88.8% |
| Cellular Data Only | 63 | 3.5% |
| Satellite Internet | 21 | 1.2% |
| No Internet | 129 | 7.2% |
| Total | 1,800 | 100.0% |
Walton Summary
Walton, Kentucky is a small city located in Boone County, Kentucky. It is situated on the banks of the Ohio River, approximately 20 miles south of Cincinnati, Ohio. The city has a population of approximately 5,000 people and is part of the Cincinnati metropolitan area.
History
Walton was founded in 1817 by William Walton, a Revolutionary War veteran. The city was originally known as Walton’s Station, and was a stop on the Cincinnati-Lexington stagecoach line. In 1820, Walton was incorporated as a city.
During the Civil War, Walton was a major supply depot for the Union Army. The city was also the site of a major battle in 1862, when Confederate forces attempted to capture the city. The Union forces were successful in defending the city, and the Confederate forces retreated.
In the late 19th century, Walton was a major center for the tobacco industry. The city was home to several tobacco warehouses and factories, and was a major supplier of tobacco to the rest of the country.
Geography
Walton is located in Boone County, Kentucky, on the banks of the Ohio River. The city is situated approximately 20 miles south of Cincinnati, Ohio. The city has a total area of 2.2 square miles, all of which is land.
The city is located in a hilly region, with the highest point being the summit of Walton Hill, which is located in the center of the city. The city is also located near several major highways, including Interstate 75 and US Route 25.
Economy
The economy of Walton is largely based on manufacturing and retail. The city is home to several manufacturing companies, including a plastics factory, a paper mill, and a metal fabrication plant. The city is also home to several retail stores, including a Walmart Supercenter, a Kroger grocery store, and several other smaller stores.
The city is also home to several small businesses, including restaurants, bars, and other service-oriented businesses. The city is also home to several medical facilities, including a hospital and several clinics.
Demographics
As of the 2010 census, the population of Walton was 5,000. The racial makeup of the city was 95.3% White, 1.7% African American, 0.3% Native American, 0.7% Asian, 0.1% Pacific Islander, and 1.8% from other races. Hispanic or Latino of any race were 2.2% of the population.
The median household income in Walton was $45,000, and the median family income was $50,000. The per capita income in Walton was $20,000. Approximately 10.3% of the population was below the poverty line.
Walton is served by the Boone County School District, which includes two elementary schools, one middle school, and one high school. The city is also home to several private schools, including a Catholic school and a Christian school.
Common Questions
What is Per Capita Income in Walton?
Per Capita income in Walton is $30,197.
What is the Median Family Income in Walton?
Median Family Income in Walton is $93,370.
What is the Median Household income in Walton?
Median Household Income in Walton is $79,811.
What is Income or Wage Gap in Walton?
Income or Wage Gap in Walton is 39.4%.
Women in Walton earn 60.6 cents for every dollar earned by a man.
What is Inequality or Gini Index in Walton?
Inequality or Gini Index in Walton is 0.33.
What is the Total Population of Walton?
Total Population of Walton is 5,492.
What is the Total Male Population of Walton?
Total Male Population of Walton is 2,628.
What is the Total Female Population of Walton?
Total Female Population of Walton is 2,864.
What is the Ratio of Males per 100 Females in Walton?
There are 91.76 Males per 100 Females in Walton.
What is the Ratio of Females per 100 Males in Walton?
There are 108.98 Females per 100 Males in Walton.
What is the Median Population Age in Walton?
Median Population Age in Walton is 31.5 Years.
What is the Average Family Size in Walton
Average Family Size in Walton is 3.6 People.
What is the Average Household Size in Walton
Average Household Size in Walton is 3.0 People.
How Large is the Labor Force in Walton?
There are 2,765 People in the Labor Forcein in Walton.
What is the Percentage of People in the Labor Force in Walton?
73.7% of People are in the Labor Force in Walton.
What is the Unemployment Rate in Walton?
Unemployment Rate in Walton is 1.6%.