Pineville, KY Map & Demographics
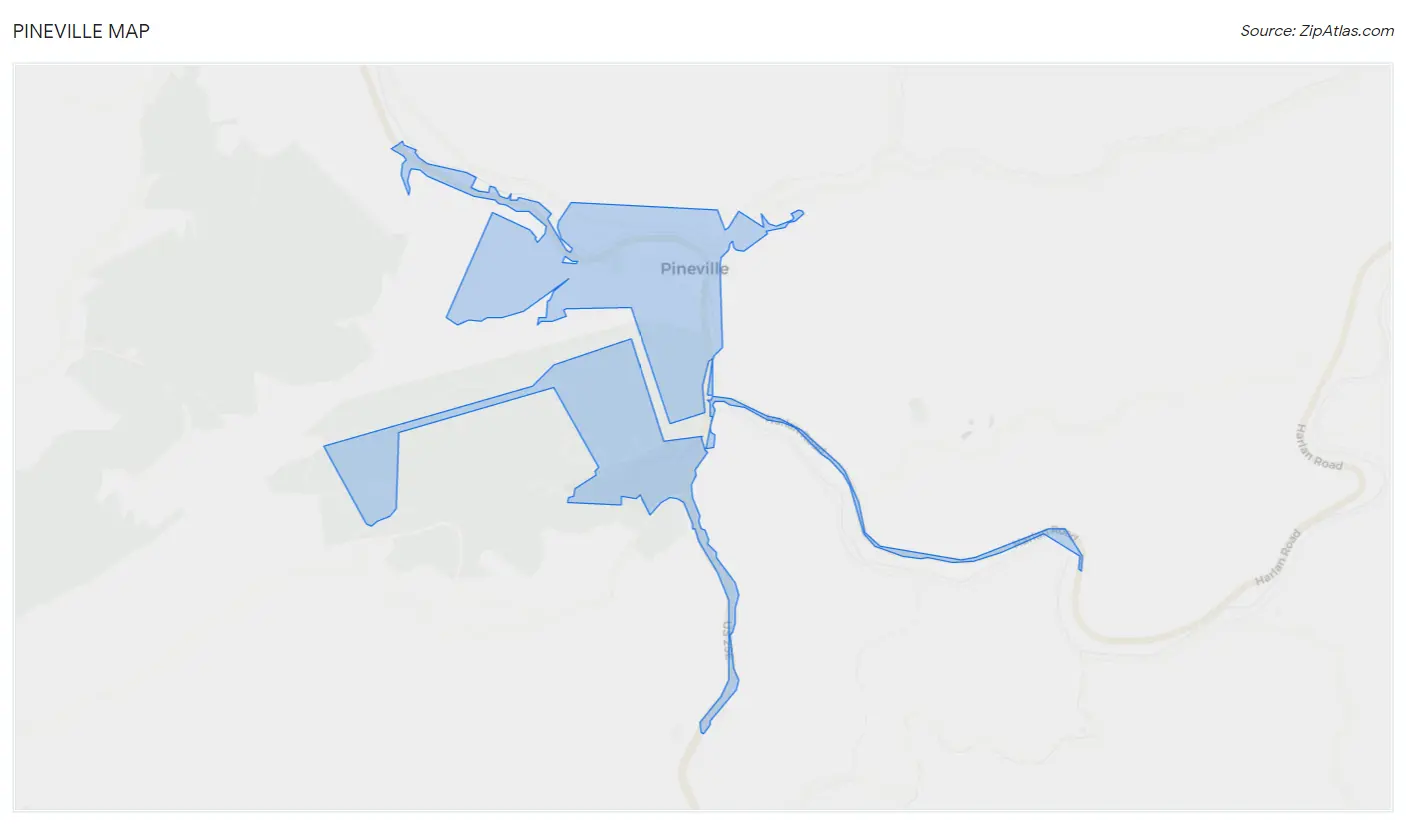
Pineville Map
Pineville Overview
$21,578
PER CAPITA INCOME
$58,125
AVG FAMILY INCOME
$27,159
AVG HOUSEHOLD INCOME
28.7%
WAGE / INCOME GAP [ % ]
71.3¢/ $1
WAGE / INCOME GAP [ $ ]
$13,105
FAMILY INCOME DEFICIT
0.57
INEQUALITY / GINI INDEX
1,796
TOTAL POPULATION
919
MALE POPULATION
877
FEMALE POPULATION
104.79
MALES / 100 FEMALES
95.43
FEMALES / 100 MALES
39.6
MEDIAN AGE
3.3
AVG FAMILY SIZE
2.4
AVG HOUSEHOLD SIZE
572
LABOR FORCE [ PEOPLE ]
39.2%
PERCENT IN LABOR FORCE
11.7%
UNEMPLOYMENT RATE
Pineville Zip Codes
Pineville Area Codes
Income in Pineville
Income Overview in Pineville
Per Capita Income in Pineville is $21,578, while median incomes of families and households are $58,125 and $27,159 respectively.
| Characteristic | Number | Measure |
| Per Capita Income | 1,796 | $21,578 |
| Median Family Income | 383 | $58,125 |
| Mean Family Income | 383 | $77,415 |
| Median Household Income | 688 | $27,159 |
| Mean Household Income | 688 | $53,628 |
| Income Deficit | 383 | $13,105 |
| Wage / Income Gap (%) | 1,796 | 28.68% |
| Wage / Income Gap ($) | 1,796 | 71.32¢ per $1 |
| Gini / Inequality Index | 1,796 | 0.57 |
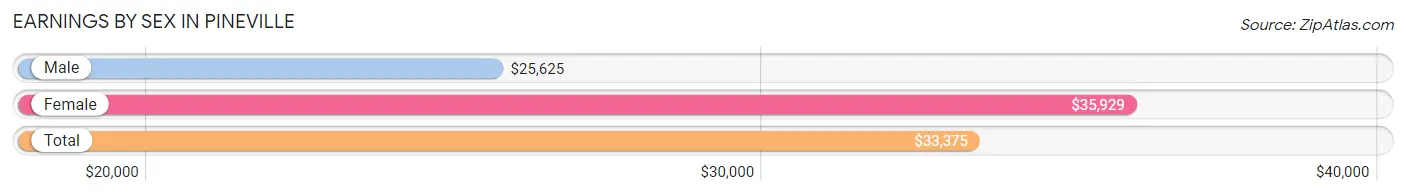
Earnings by Sex in Pineville
Average Earnings in Pineville are $33,375, $25,625 for men and $35,929 for women, a difference of 28.7%.
| Sex | Number | Average Earnings |
| Male | 287 (46.7%) | $25,625 |
| Female | 327 (53.3%) | $35,929 |
| Total | 614 (100.0%) | $33,375 |
Earnings by Sex by Income Bracket in Pineville
The most common earnings brackets in Pineville are $2,499 or less for men (43 | 15.0%) and $45,000 to $49,999 for women (52 | 15.9%).
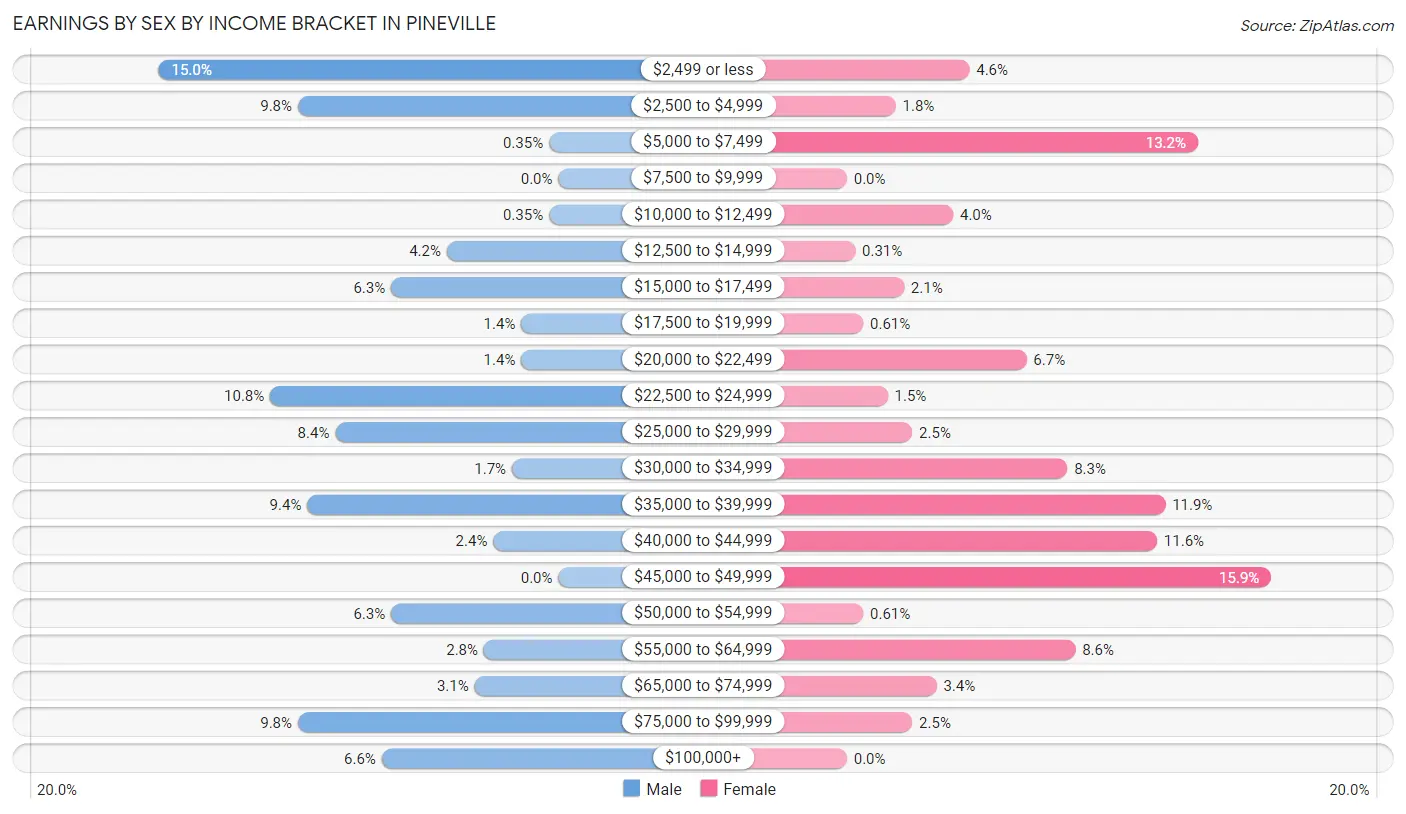
| Income | Male | Female |
| $2,499 or less | 43 (15.0%) | 15 (4.6%) |
| $2,500 to $4,999 | 28 (9.8%) | 6 (1.8%) |
| $5,000 to $7,499 | 1 (0.4%) | 43 (13.2%) |
| $7,500 to $9,999 | 0 (0.0%) | 0 (0.0%) |
| $10,000 to $12,499 | 1 (0.4%) | 13 (4.0%) |
| $12,500 to $14,999 | 12 (4.2%) | 1 (0.3%) |
| $15,000 to $17,499 | 18 (6.3%) | 7 (2.1%) |
| $17,500 to $19,999 | 4 (1.4%) | 2 (0.6%) |
| $20,000 to $22,499 | 4 (1.4%) | 22 (6.7%) |
| $22,500 to $24,999 | 31 (10.8%) | 5 (1.5%) |
| $25,000 to $29,999 | 24 (8.4%) | 8 (2.5%) |
| $30,000 to $34,999 | 5 (1.7%) | 27 (8.3%) |
| $35,000 to $39,999 | 27 (9.4%) | 39 (11.9%) |
| $40,000 to $44,999 | 7 (2.4%) | 38 (11.6%) |
| $45,000 to $49,999 | 0 (0.0%) | 52 (15.9%) |
| $50,000 to $54,999 | 18 (6.3%) | 2 (0.6%) |
| $55,000 to $64,999 | 8 (2.8%) | 28 (8.6%) |
| $65,000 to $74,999 | 9 (3.1%) | 11 (3.4%) |
| $75,000 to $99,999 | 28 (9.8%) | 8 (2.5%) |
| $100,000+ | 19 (6.6%) | 0 (0.0%) |
| Total | 287 (100.0%) | 327 (100.0%) |
Earnings by Sex by Educational Attainment in Pineville
Average earnings in Pineville are $29,583 for men and $35,875 for women, a difference of 17.5%. Men with an educational attainment of college or associate's degree enjoy the highest average annual earnings of $59,063, while those with less than high school education earn the least with $17,031. Women with an educational attainment of college or associate's degree earn the most with the average annual earnings of $48,125, while those with bachelor's degree education have the smallest earnings of $26,250.
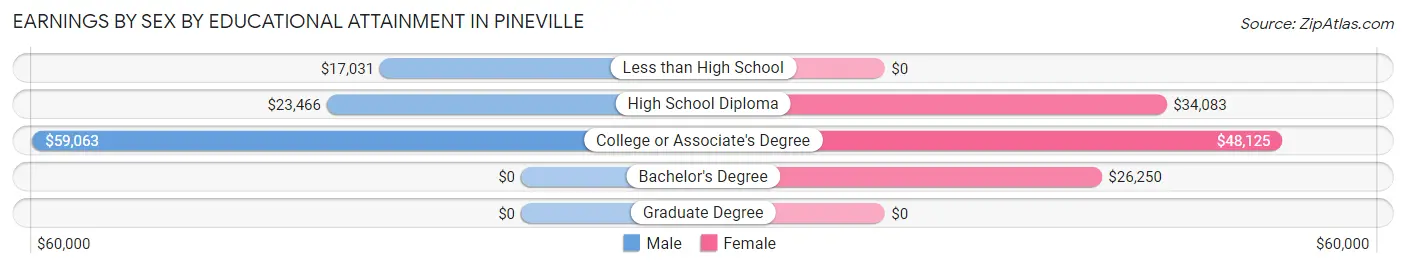
| Educational Attainment | Male Income | Female Income |
| Less than High School | $17,031 | $0 |
| High School Diploma | $23,466 | $34,083 |
| College or Associate's Degree | $59,063 | $48,125 |
| Bachelor's Degree | - | - |
| Graduate Degree | - | - |
| Total | $29,583 | $35,875 |
Family Income in Pineville
Family Income Brackets in Pineville
According to the Pineville family income data, there are 76 families falling into the $50,000 to $74,999 income range, which is the most common income bracket and makes up 19.8% of all families. Conversely, the $100,000 to $149,999 income bracket is the least frequent group with only 15 families (3.9%) belonging to this category.
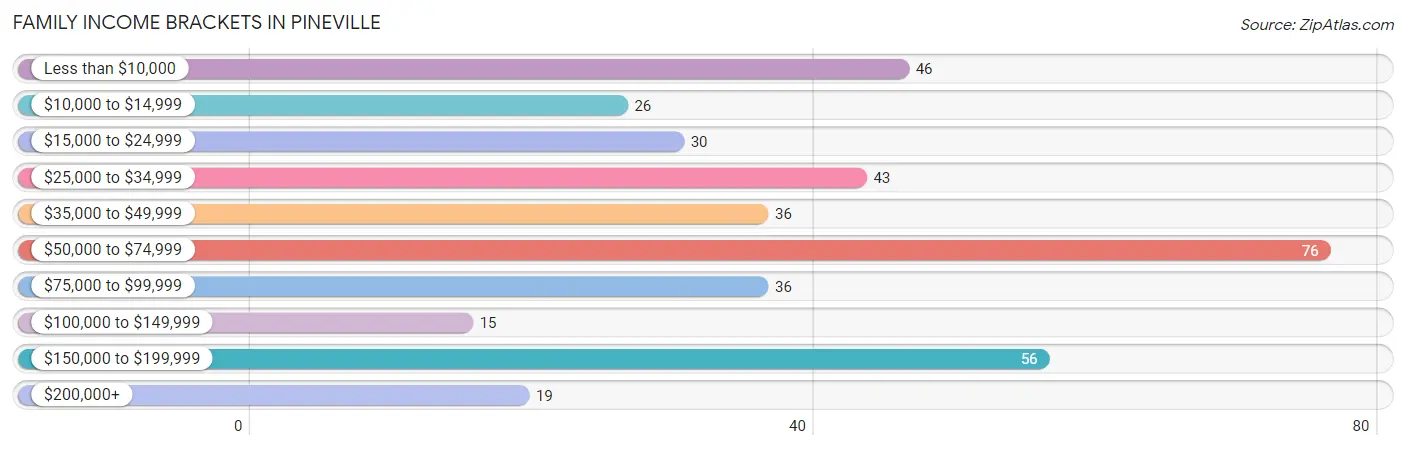
| Income Bracket | # Families | % Families |
| Less than $10,000 | 46 | 12.0% |
| $10,000 to $14,999 | 26 | 6.8% |
| $15,000 to $24,999 | 30 | 7.8% |
| $25,000 to $34,999 | 43 | 11.2% |
| $35,000 to $49,999 | 36 | 9.4% |
| $50,000 to $74,999 | 76 | 19.8% |
| $75,000 to $99,999 | 36 | 9.4% |
| $100,000 to $149,999 | 15 | 3.9% |
| $150,000 to $199,999 | 56 | 14.6% |
| $200,000+ | 19 | 5.0% |
Family Income by Famaliy Size in Pineville
4-person families (126 | 32.9%) account for the highest median family income in Pineville with $93,661 per family, while 4-person families (126 | 32.9%) have the highest median income of $23,415 per family member.
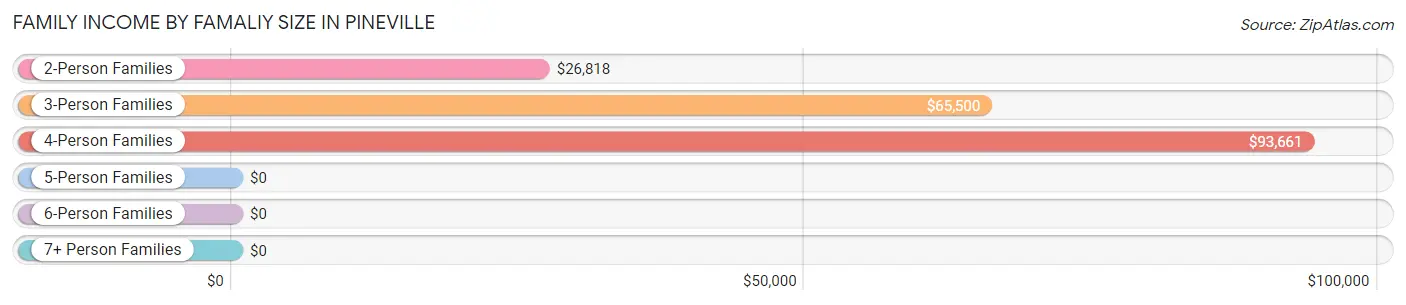
| Income Bracket | # Families | Median Income |
| 2-Person Families | 142 (37.1%) | $26,818 |
| 3-Person Families | 106 (27.7%) | $65,500 |
| 4-Person Families | 126 (32.9%) | $93,661 |
| 5-Person Families | 4 (1.0%) | $0 |
| 6-Person Families | 0 (0.0%) | $0 |
| 7+ Person Families | 5 (1.3%) | $0 |
| Total | 383 (100.0%) | $58,125 |
Family Income by Number of Earners in Pineville
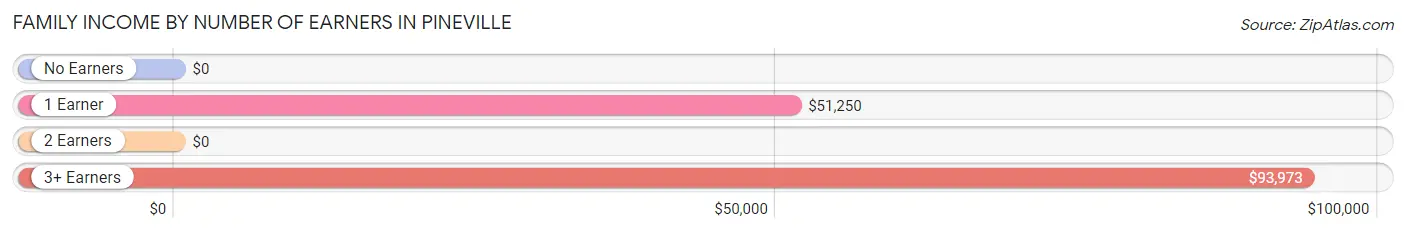
| Number of Earners | # Families | Median Income |
| No Earners | 113 (29.5%) | $0 |
| 1 Earner | 132 (34.5%) | $51,250 |
| 2 Earners | 105 (27.4%) | $0 |
| 3+ Earners | 33 (8.6%) | $93,973 |
| Total | 383 (100.0%) | $58,125 |
Household Income in Pineville
Household Income Brackets in Pineville
With 122 households falling in the category, the $10,000 to $14,999 income range is the most frequent in Pineville, accounting for 17.7% of all households. In contrast, only 18 households (2.6%) fall into the $100,000 to $149,999 income bracket, making it the least populous group.
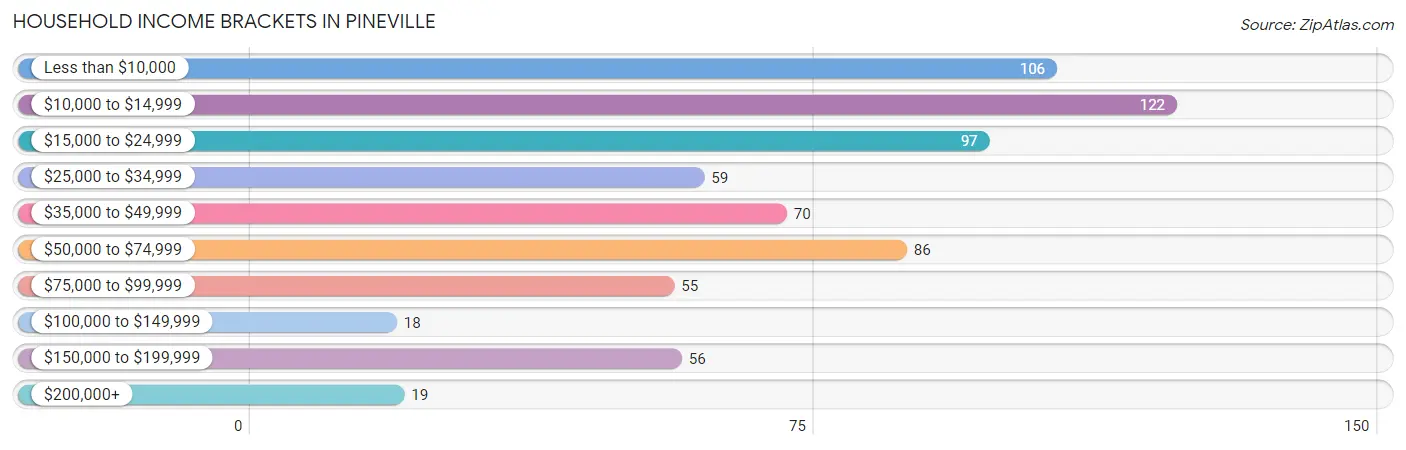
| Income Bracket | # Households | % Households |
| Less than $10,000 | 106 | 15.4% |
| $10,000 to $14,999 | 122 | 17.7% |
| $15,000 to $24,999 | 97 | 14.1% |
| $25,000 to $34,999 | 59 | 8.6% |
| $35,000 to $49,999 | 70 | 10.2% |
| $50,000 to $74,999 | 86 | 12.5% |
| $75,000 to $99,999 | 55 | 8.0% |
| $100,000 to $149,999 | 18 | 2.6% |
| $150,000 to $199,999 | 56 | 8.1% |
| $200,000+ | 19 | 2.8% |
Household Income by Householder Age in Pineville
The median household income in Pineville is $27,159, with the highest median household income of $87,697 found in the 15 to 24 years age bracket for the primary householder. A total of 35 households (5.1%) fall into this category. Meanwhile, the 65+ years age bracket for the primary householder has the lowest median household income of $21,771, with 209 households (30.4%) in this group.
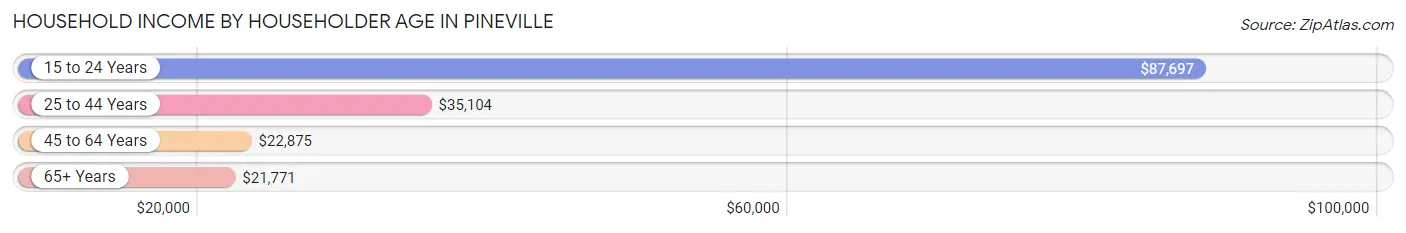
| Income Bracket | # Households | Median Income |
| 15 to 24 Years | 35 (5.1%) | $87,697 |
| 25 to 44 Years | 171 (24.8%) | $35,104 |
| 45 to 64 Years | 273 (39.7%) | $22,875 |
| 65+ Years | 209 (30.4%) | $21,771 |
| Total | 688 (100.0%) | $27,159 |
Poverty in Pineville
Income Below Poverty by Sex and Age in Pineville
With 23.0% poverty level for males and 30.0% for females among the residents of Pineville, 6 to 11 year old males and under 5 year old females are the most vulnerable to poverty, with 34 males (72.3%) and 14 females (58.3%) in their respective age groups living below the poverty level.
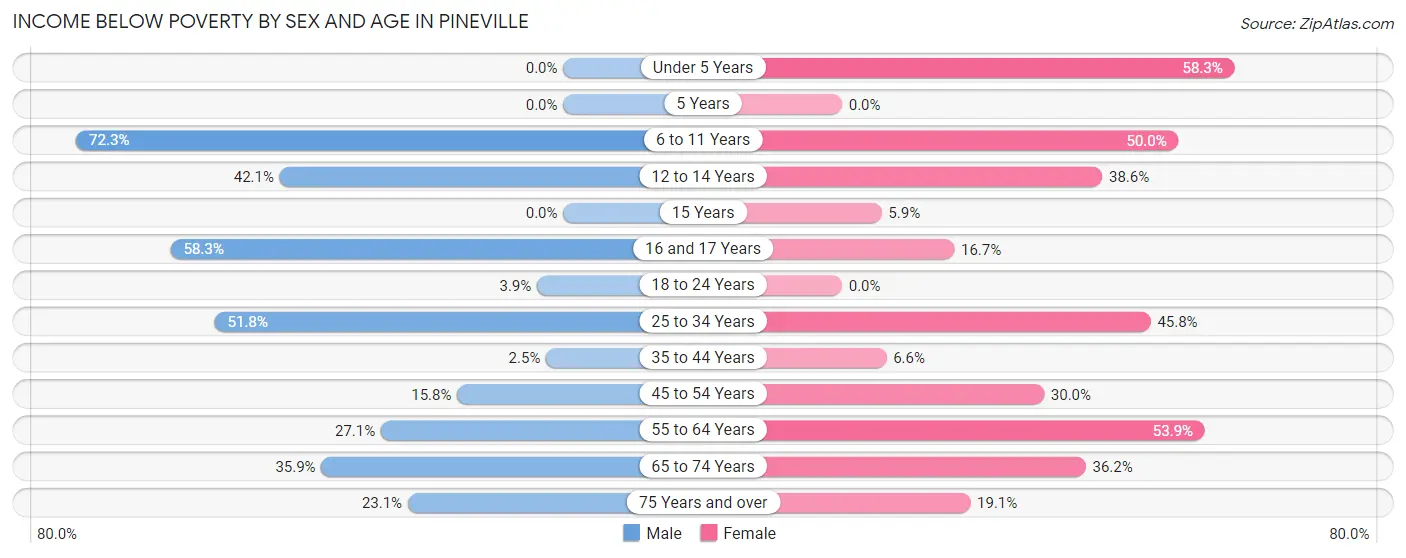
| Age Bracket | Male | Female |
| Under 5 Years | 0 (0.0%) | 14 (58.3%) |
| 5 Years | 0 (0.0%) | 0 (0.0%) |
| 6 to 11 Years | 34 (72.3%) | 32 (50.0%) |
| 12 to 14 Years | 8 (42.1%) | 17 (38.6%) |
| 15 Years | 0 (0.0%) | 2 (5.9%) |
| 16 and 17 Years | 14 (58.3%) | 2 (16.7%) |
| 18 to 24 Years | 3 (3.9%) | 0 (0.0%) |
| 25 to 34 Years | 29 (51.8%) | 33 (45.8%) |
| 35 to 44 Years | 3 (2.5%) | 6 (6.6%) |
| 45 to 54 Years | 20 (15.8%) | 33 (30.0%) |
| 55 to 64 Years | 36 (27.1%) | 62 (53.9%) |
| 65 to 74 Years | 37 (35.9%) | 38 (36.2%) |
| 75 Years and over | 3 (23.1%) | 12 (19.1%) |
| Total | 187 (23.0%) | 251 (30.0%) |
Income Above Poverty by Sex and Age in Pineville
According to the poverty statistics in Pineville, males aged under 5 years and females aged 5 years are the age groups that are most secure financially, with 100.0% of males and 100.0% of females in these age groups living above the poverty line.
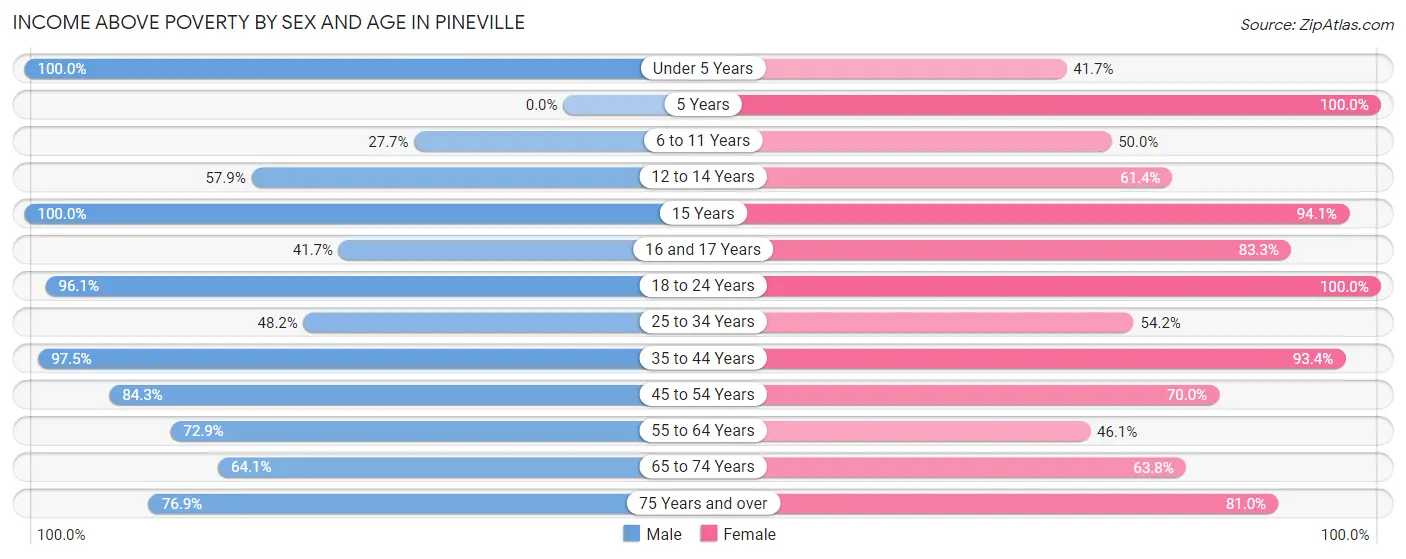
| Age Bracket | Male | Female |
| Under 5 Years | 66 (100.0%) | 10 (41.7%) |
| 5 Years | 0 (0.0%) | 7 (100.0%) |
| 6 to 11 Years | 13 (27.7%) | 32 (50.0%) |
| 12 to 14 Years | 11 (57.9%) | 27 (61.4%) |
| 15 Years | 29 (100.0%) | 32 (94.1%) |
| 16 and 17 Years | 10 (41.7%) | 10 (83.3%) |
| 18 to 24 Years | 74 (96.1%) | 96 (100.0%) |
| 25 to 34 Years | 27 (48.2%) | 39 (54.2%) |
| 35 to 44 Years | 115 (97.5%) | 85 (93.4%) |
| 45 to 54 Years | 107 (84.3%) | 77 (70.0%) |
| 55 to 64 Years | 97 (72.9%) | 53 (46.1%) |
| 65 to 74 Years | 66 (64.1%) | 67 (63.8%) |
| 75 Years and over | 10 (76.9%) | 51 (80.9%) |
| Total | 625 (77.0%) | 586 (70.0%) |
Income Below Poverty Among Married-Couple Families in Pineville
The poverty statistics for married-couple families in Pineville show that 11.0% or 18 of the total 164 families live below the poverty line. Families with no children have the highest poverty rate of 21.0%, comprising of 16 families. On the other hand, families with 3 or 4 children have the lowest poverty rate of 0.0%, which includes 0 families.
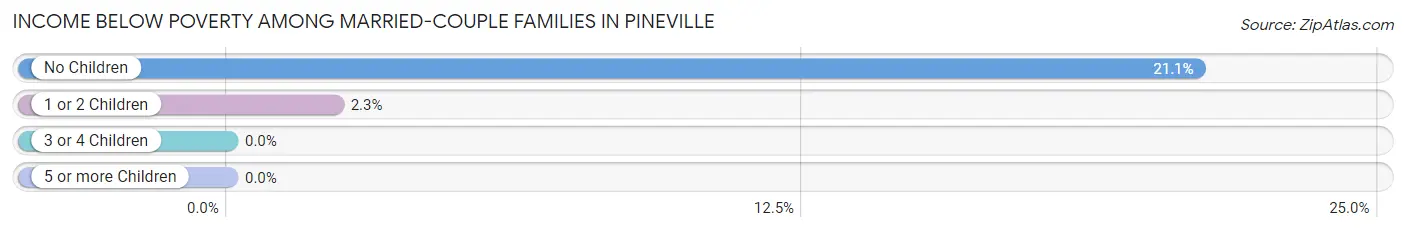
| Children | Above Poverty | Below Poverty |
| No Children | 60 (78.9%) | 16 (21.0%) |
| 1 or 2 Children | 85 (97.7%) | 2 (2.3%) |
| 3 or 4 Children | 1 (100.0%) | 0 (0.0%) |
| 5 or more Children | 0 (0.0%) | 0 (0.0%) |
| Total | 146 (89.0%) | 18 (11.0%) |
Income Below Poverty Among Single-Parent Households in Pineville
According to the poverty data in Pineville, 30.1% or 22 single-father households and 29.4% or 43 single-mother households are living below the poverty line. Among single-father households, those with 1 or 2 children have the highest poverty rate, with 16 households (39.0%) experiencing poverty. Likewise, among single-mother households, those with 3 or 4 children have the highest poverty rate, with 16 households (100.0%) falling below the poverty line.
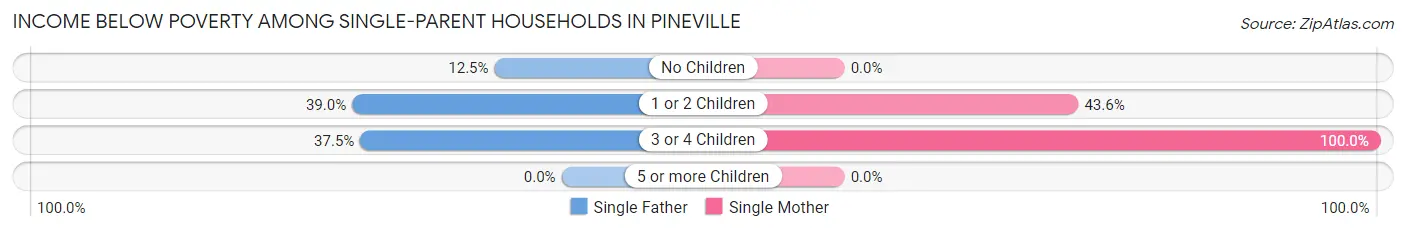
| Children | Single Father | Single Mother |
| No Children | 3 (12.5%) | 0 (0.0%) |
| 1 or 2 Children | 16 (39.0%) | 27 (43.5%) |
| 3 or 4 Children | 3 (37.5%) | 16 (100.0%) |
| 5 or more Children | 0 (0.0%) | 0 (0.0%) |
| Total | 22 (30.1%) | 43 (29.4%) |
Income Below Poverty Among Married-Couple vs Single-Parent Households in Pineville
The poverty data for Pineville shows that 18 of the married-couple family households (11.0%) and 65 of the single-parent households (29.7%) are living below the poverty level. Within the married-couple family households, those with no children have the highest poverty rate, with 16 households (21.0%) falling below the poverty line. Among the single-parent households, those with 3 or 4 children have the highest poverty rate, with 19 household (79.2%) living below poverty.
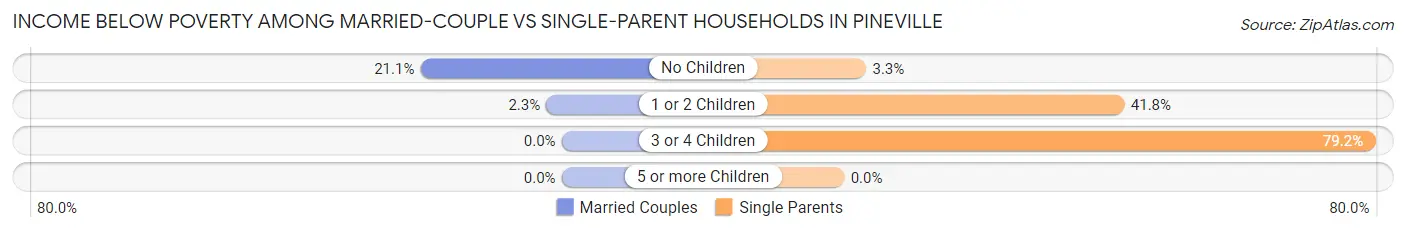
| Children | Married-Couple Families | Single-Parent Households |
| No Children | 16 (21.0%) | 3 (3.3%) |
| 1 or 2 Children | 2 (2.3%) | 43 (41.7%) |
| 3 or 4 Children | 0 (0.0%) | 19 (79.2%) |
| 5 or more Children | 0 (0.0%) | 0 (0.0%) |
| Total | 18 (11.0%) | 65 (29.7%) |
Race in Pineville
The most populous races in Pineville are White / Caucasian (1,518 | 84.5%), Two or more Races (133 | 7.4%), and Black / African American (114 | 6.4%).
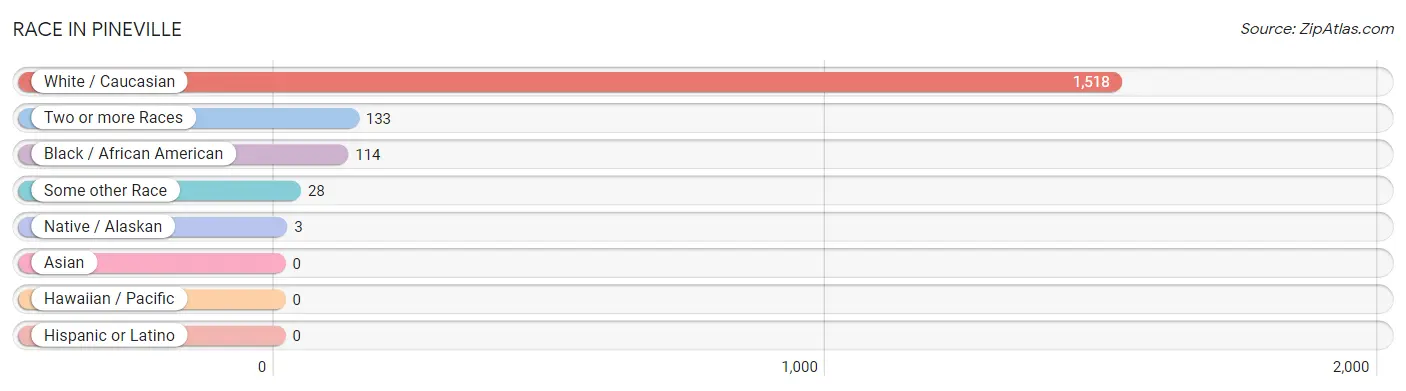
| Race | # Population | % Population |
| Asian | 0 | 0.0% |
| Black / African American | 114 | 6.4% |
| Hawaiian / Pacific | 0 | 0.0% |
| Hispanic or Latino | 0 | 0.0% |
| Native / Alaskan | 3 | 0.2% |
| White / Caucasian | 1,518 | 84.5% |
| Two or more Races | 133 | 7.4% |
| Some other Race | 28 | 1.6% |
| Total | 1,796 | 100.0% |
Ancestry in Pineville
The most populous ancestries reported in Pineville are American (225 | 12.5%), Irish (123 | 6.9%), English (77 | 4.3%), German (67 | 3.7%), and French (36 | 2.0%), together accounting for 29.4% of all Pineville residents.
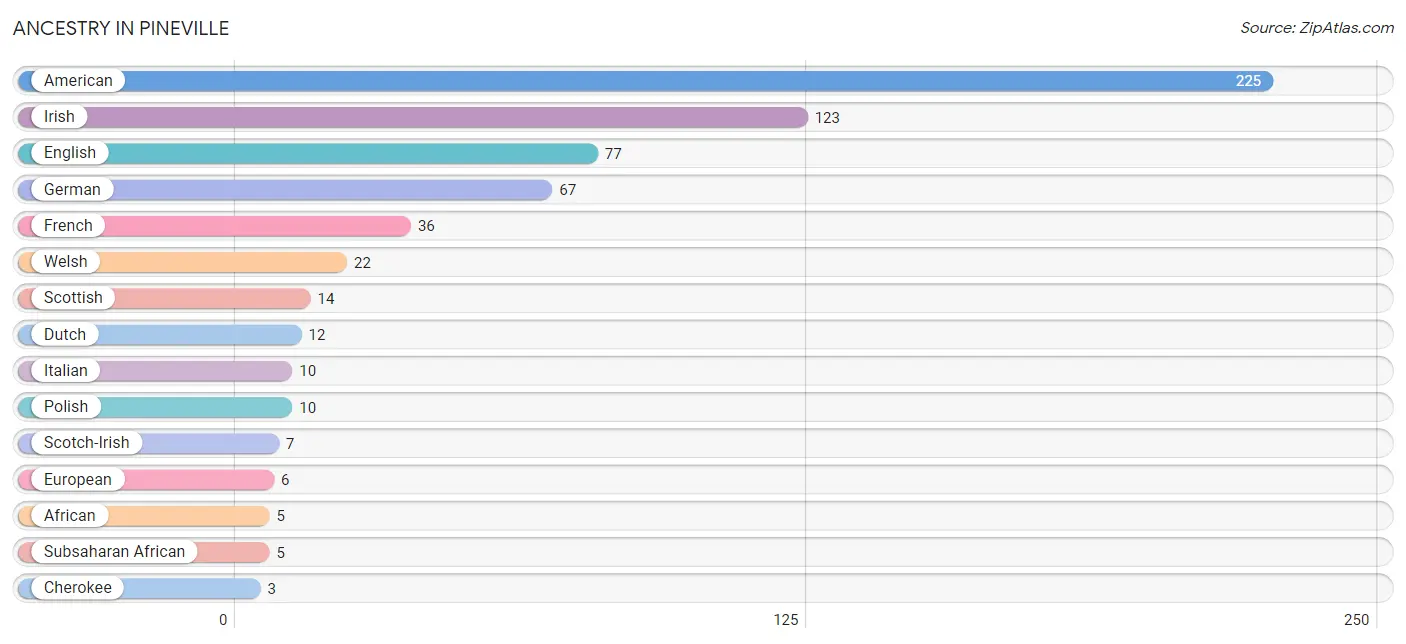
| Ancestry | # Population | % Population |
| African | 5 | 0.3% |
| American | 225 | 12.5% |
| Canadian | 1 | 0.1% |
| Cherokee | 3 | 0.2% |
| Dutch | 12 | 0.7% |
| English | 77 | 4.3% |
| European | 6 | 0.3% |
| French | 36 | 2.0% |
| German | 67 | 3.7% |
| Greek | 3 | 0.2% |
| Irish | 123 | 6.9% |
| Italian | 10 | 0.6% |
| Northern European | 2 | 0.1% |
| Polish | 10 | 0.6% |
| Scotch-Irish | 7 | 0.4% |
| Scottish | 14 | 0.8% |
| Subsaharan African | 5 | 0.3% |
| Welsh | 22 | 1.2% | View All 18 Rows |
Immigrants in Pineville
The most numerous immigrant groups reported in Pineville came from Europe (1 | 0.1%), Germany (1 | 0.1%), and Western Europe (1 | 0.1%), together accounting for 0.2% of all Pineville residents.
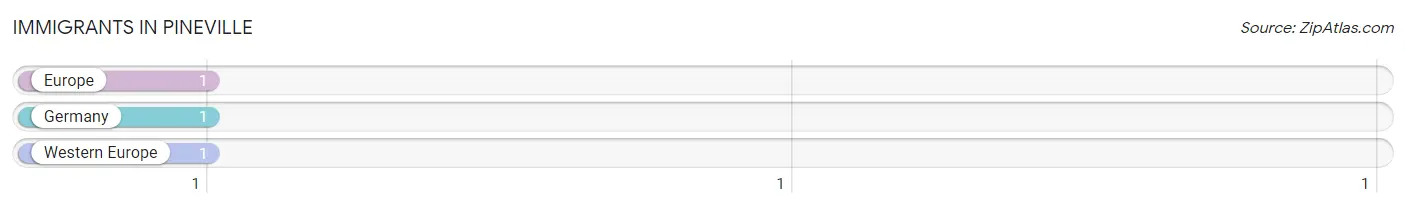
| Immigration Origin | # Population | % Population |
| Europe | 1 | 0.1% |
| Germany | 1 | 0.1% |
| Western Europe | 1 | 0.1% | View All 3 Rows |
Sex and Age in Pineville
Sex and Age in Pineville
The most populous age groups in Pineville are 35 to 39 Years (125 | 13.6%) for men and 20 to 24 Years (93 | 10.6%) for women.
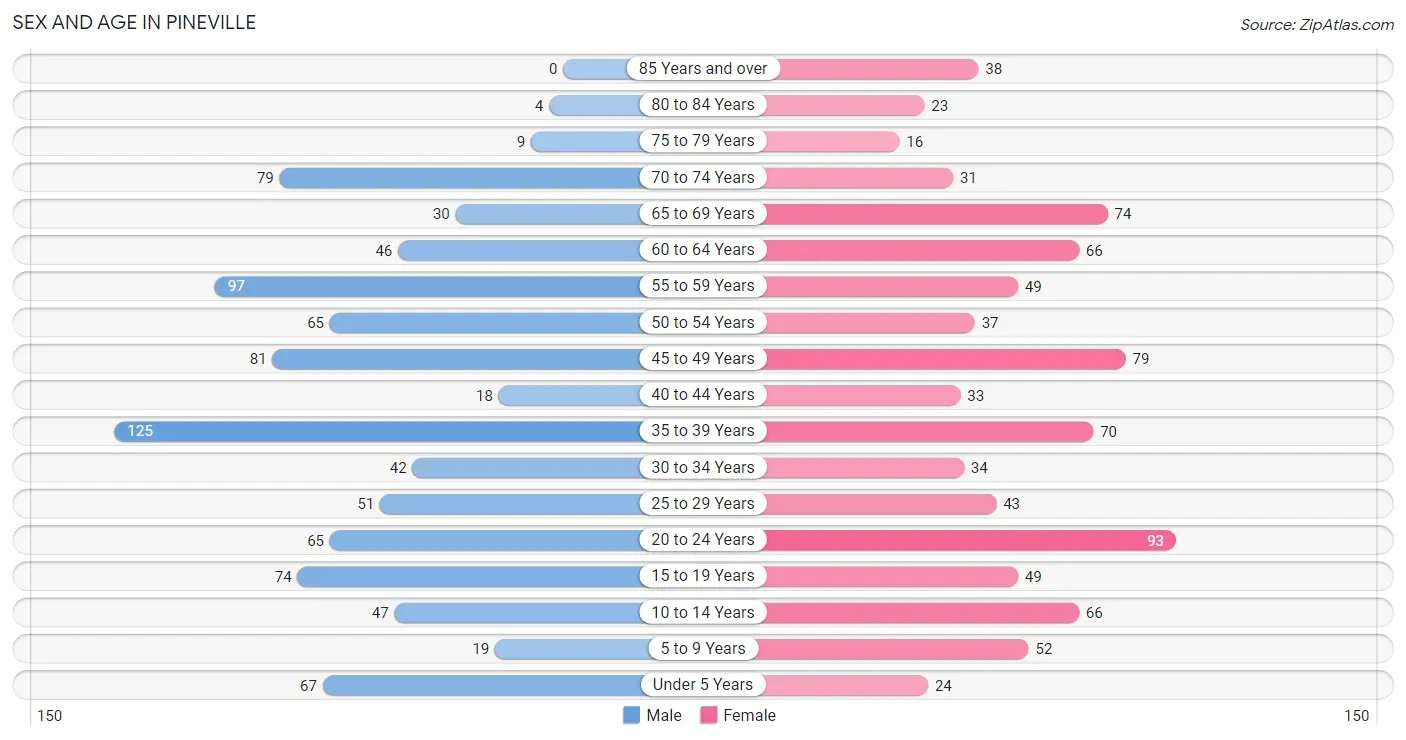
| Age Bracket | Male | Female |
| Under 5 Years | 67 (7.3%) | 24 (2.7%) |
| 5 to 9 Years | 19 (2.1%) | 52 (5.9%) |
| 10 to 14 Years | 47 (5.1%) | 66 (7.5%) |
| 15 to 19 Years | 74 (8.1%) | 49 (5.6%) |
| 20 to 24 Years | 65 (7.1%) | 93 (10.6%) |
| 25 to 29 Years | 51 (5.6%) | 43 (4.9%) |
| 30 to 34 Years | 42 (4.6%) | 34 (3.9%) |
| 35 to 39 Years | 125 (13.6%) | 70 (8.0%) |
| 40 to 44 Years | 18 (2.0%) | 33 (3.8%) |
| 45 to 49 Years | 81 (8.8%) | 79 (9.0%) |
| 50 to 54 Years | 65 (7.1%) | 37 (4.2%) |
| 55 to 59 Years | 97 (10.5%) | 49 (5.6%) |
| 60 to 64 Years | 46 (5.0%) | 66 (7.5%) |
| 65 to 69 Years | 30 (3.3%) | 74 (8.4%) |
| 70 to 74 Years | 79 (8.6%) | 31 (3.5%) |
| 75 to 79 Years | 9 (1.0%) | 16 (1.8%) |
| 80 to 84 Years | 4 (0.4%) | 23 (2.6%) |
| 85 Years and over | 0 (0.0%) | 38 (4.3%) |
| Total | 919 (100.0%) | 877 (100.0%) |
Families and Households in Pineville
Median Family Size in Pineville
The median family size in Pineville is 3.33 persons per family, with married-couple families (164 | 42.8%) accounting for the largest median family size of 3.36 persons per family. On the other hand, single male/father families (73 | 19.1%) represent the smallest median family size with 3.27 persons per family.
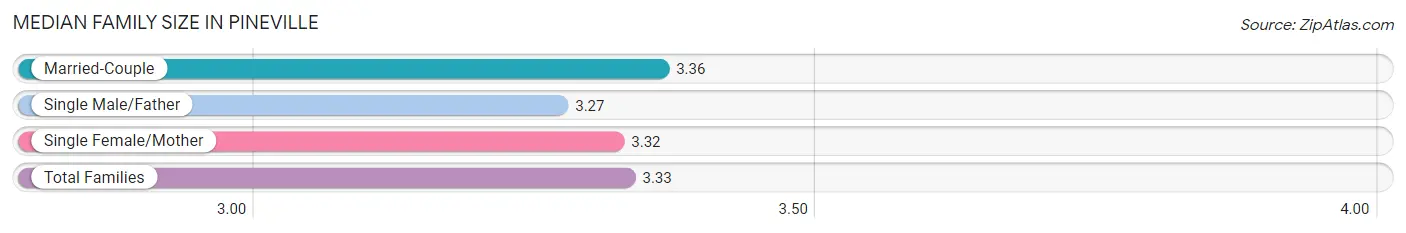
| Family Type | # Families | Family Size |
| Married-Couple | 164 (42.8%) | 3.36 |
| Single Male/Father | 73 (19.1%) | 3.27 |
| Single Female/Mother | 146 (38.1%) | 3.32 |
| Total Families | 383 (100.0%) | 3.33 |
Median Household Size in Pineville
The median household size in Pineville is 2.38 persons per household, with single male/father households (73 | 10.6%) accounting for the largest median household size of 3.53 persons per household. non-family households (305 | 44.3%) represent the smallest median household size with 1.07 persons per household.
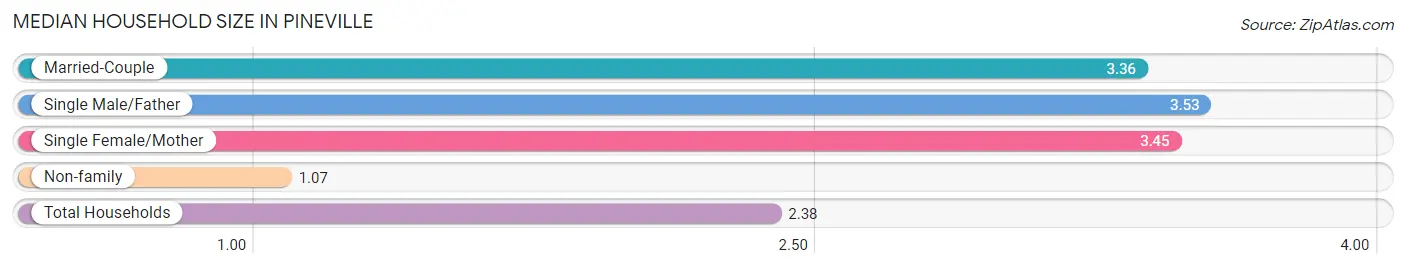
| Household Type | # Households | Household Size |
| Married-Couple | 164 (23.8%) | 3.36 |
| Single Male/Father | 73 (10.6%) | 3.53 |
| Single Female/Mother | 146 (21.2%) | 3.45 |
| Non-family | 305 (44.3%) | 1.07 |
| Total Households | 688 (100.0%) | 2.38 |
Household Size by Marriage Status in Pineville
Out of a total of 688 households in Pineville, 383 (55.7%) are family households, while 305 (44.3%) are nonfamily households. The most numerous type of family households are 3-person households, comprising 130, and the most common type of nonfamily households are 1-person households, comprising 281.
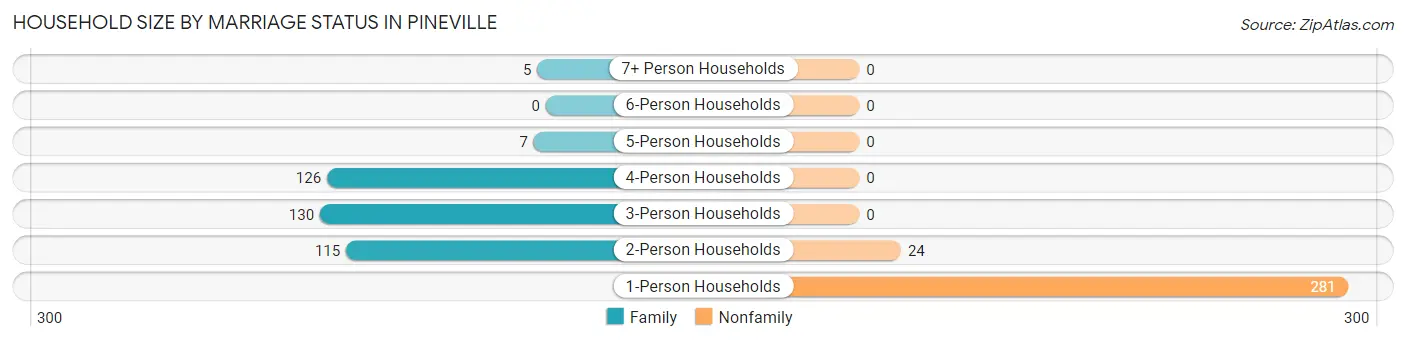
| Household Size | Family Households | Nonfamily Households |
| 1-Person Households | - | 281 (40.8%) |
| 2-Person Households | 115 (16.7%) | 24 (3.5%) |
| 3-Person Households | 130 (18.9%) | 0 (0.0%) |
| 4-Person Households | 126 (18.3%) | 0 (0.0%) |
| 5-Person Households | 7 (1.0%) | 0 (0.0%) |
| 6-Person Households | 0 (0.0%) | 0 (0.0%) |
| 7+ Person Households | 5 (0.7%) | 0 (0.0%) |
| Total | 383 (55.7%) | 305 (44.3%) |
Female Fertility in Pineville
Fertility by Age in Pineville
Average fertility rate in Pineville is 25.0 births per 1,000 women. Women in the age bracket of 20 to 34 years have the highest fertility rate with 59.0 births per 1,000 women. Women in the age bracket of 20 to 34 years acount for 100.0% of all women with births.
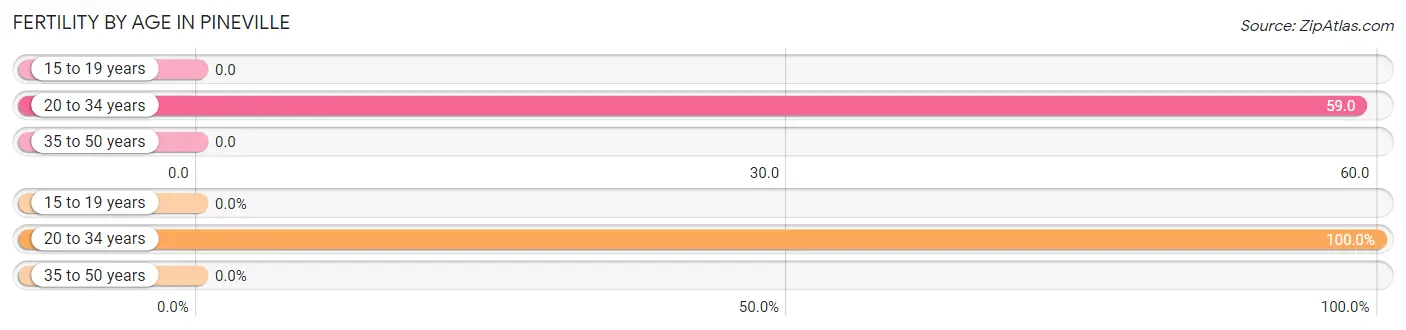
| Age Bracket | Women with Births | Births / 1,000 Women |
| 15 to 19 years | 0 (0.0%) | 0.0 |
| 20 to 34 years | 10 (100.0%) | 59.0 |
| 35 to 50 years | 0 (0.0%) | 0.0 |
| Total | 10 (100.0%) | 25.0 |
Fertility by Age by Marriage Status in Pineville
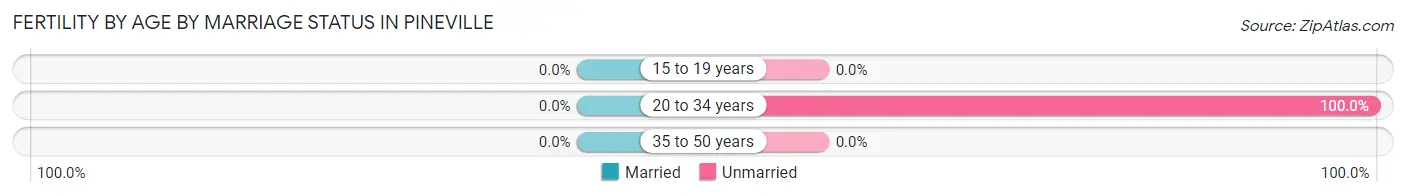
| Age Bracket | Married | Unmarried |
| 15 to 19 years | 0 (0.0%) | 0 (0.0%) |
| 20 to 34 years | 0 (0.0%) | 10 (100.0%) |
| 35 to 50 years | 0 (0.0%) | 0 (0.0%) |
| Total | 0 (0.0%) | 10 (100.0%) |
Fertility by Education in Pineville
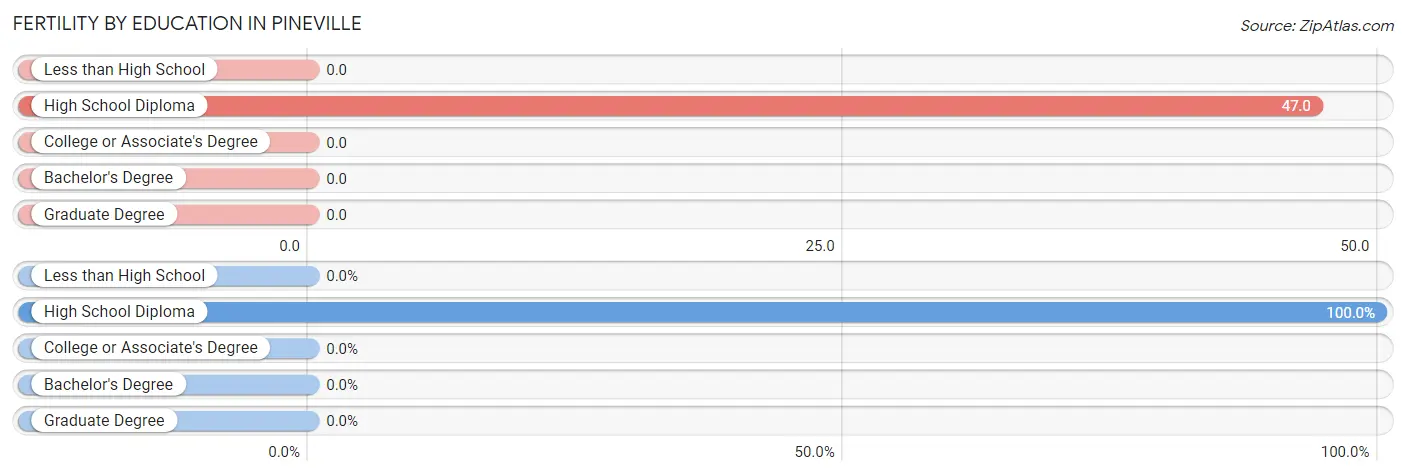
| Educational Attainment | Women with Births | Births / 1,000 Women |
| Less than High School | 0 (0.0%) | 0.0 |
| High School Diploma | 10 (100.0%) | 47.0 |
| College or Associate's Degree | 0 (0.0%) | 0.0 |
| Bachelor's Degree | 0 (0.0%) | 0.0 |
| Graduate Degree | 0 (0.0%) | 0.0 |
| Total | 10 (100.0%) | 25.0 |
Fertility by Education by Marriage Status in Pineville
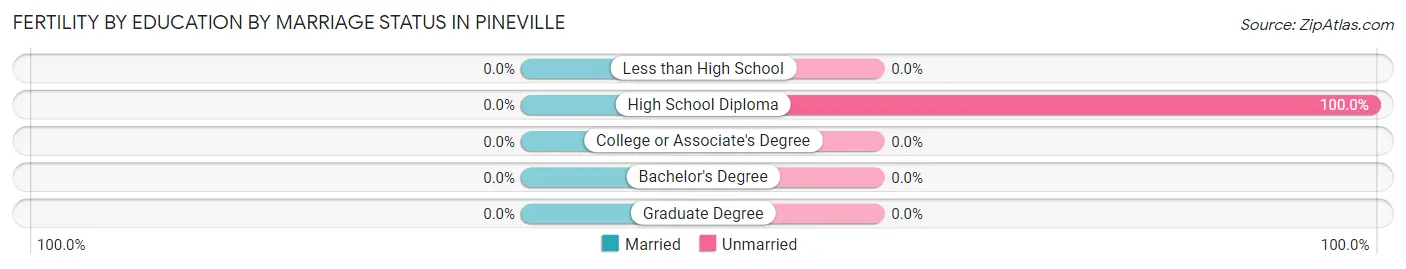
| Educational Attainment | Married | Unmarried |
| Less than High School | 0 (0.0%) | 0 (0.0%) |
| High School Diploma | 0 (0.0%) | 10 (100.0%) |
| College or Associate's Degree | 0 (0.0%) | 0 (0.0%) |
| Bachelor's Degree | 0 (0.0%) | 0 (0.0%) |
| Graduate Degree | 0 (0.0%) | 0 (0.0%) |
| Total | 0 (0.0%) | 10 (100.0%) |
Employment Characteristics in Pineville
Employment by Class of Employer in Pineville
Among the 505 employed individuals in Pineville, private company employees (280 | 55.4%), local government employees (110 | 21.8%), and not-for-profit organizations (56 | 11.1%) make up the most common classes of employment.
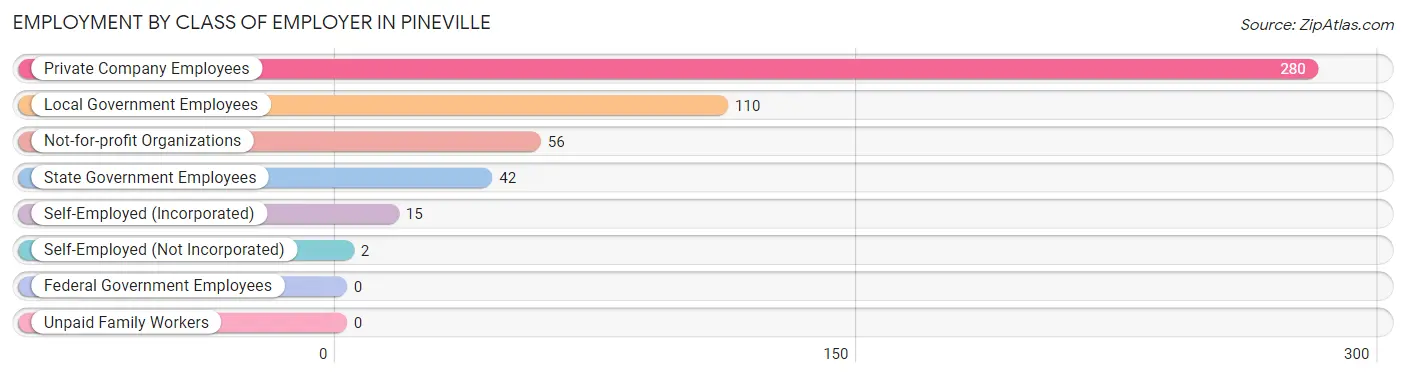
| Employer Class | # Employees | % Employees |
| Private Company Employees | 280 | 55.4% |
| Self-Employed (Incorporated) | 15 | 3.0% |
| Self-Employed (Not Incorporated) | 2 | 0.4% |
| Not-for-profit Organizations | 56 | 11.1% |
| Local Government Employees | 110 | 21.8% |
| State Government Employees | 42 | 8.3% |
| Federal Government Employees | 0 | 0.0% |
| Unpaid Family Workers | 0 | 0.0% |
| Total | 505 | 100.0% |
Employment Status by Age in Pineville
According to the labor force statistics for Pineville, out of the total population over 16 years of age (1,458), 39.2% or 572 individuals are in the labor force, with 11.7% or 67 of them unemployed. The age group with the highest labor force participation rate is 20 to 24 years, with 93.0% or 147 individuals in the labor force. Within the labor force, the 55 to 59 years age range has the highest percentage of unemployed individuals, with 20.0% or 9 of them being unemployed.
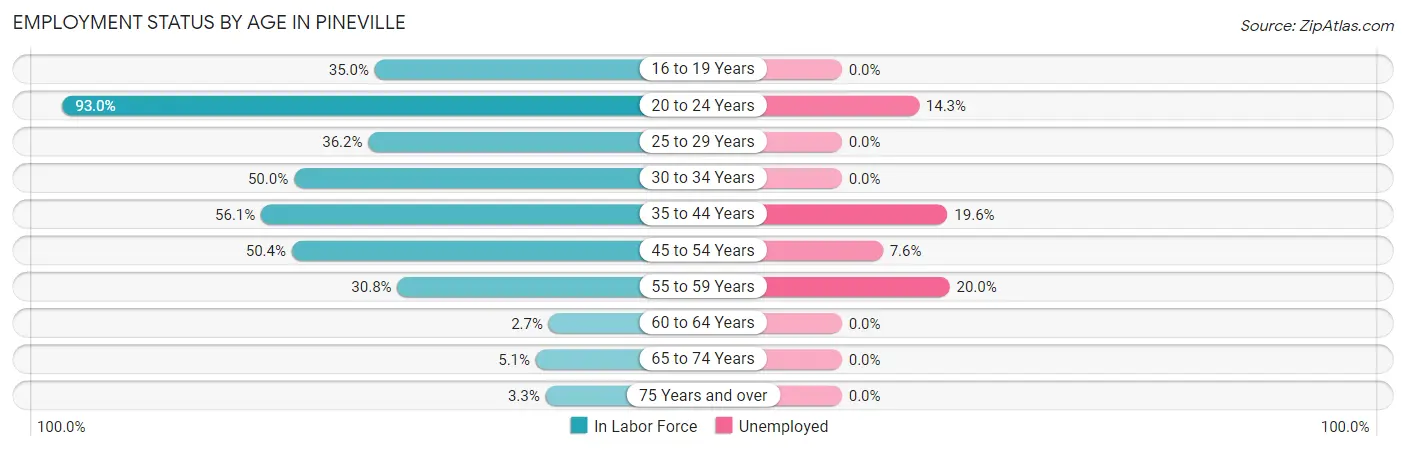
| Age Bracket | In Labor Force | Unemployed |
| 16 to 19 Years | 21 (35.0%) | 0 (0.0%) |
| 20 to 24 Years | 147 (93.0%) | 21 (14.3%) |
| 25 to 29 Years | 34 (36.2%) | 0 (0.0%) |
| 30 to 34 Years | 38 (50.0%) | 0 (0.0%) |
| 35 to 44 Years | 138 (56.1%) | 27 (19.6%) |
| 45 to 54 Years | 132 (50.4%) | 10 (7.6%) |
| 55 to 59 Years | 45 (30.8%) | 9 (20.0%) |
| 60 to 64 Years | 3 (2.7%) | 0 (0.0%) |
| 65 to 74 Years | 11 (5.1%) | 0 (0.0%) |
| 75 Years and over | 3 (3.3%) | 0 (0.0%) |
| Total | 572 (39.2%) | 67 (11.7%) |
Employment Status by Educational Attainment in Pineville
According to labor force statistics for Pineville, 41.7% of individuals (390) out of the total population between 25 and 64 years of age (936) are in the labor force, with 11.8% or 46 of them being unemployed. The group with the highest labor force participation rate are those with the educational attainment of bachelor's degree or higher, with 74.1% or 80 individuals in the labor force. Within the labor force, individuals with college / associate degree education have the highest percentage of unemployment, with 18.7% or 28 of them being unemployed.
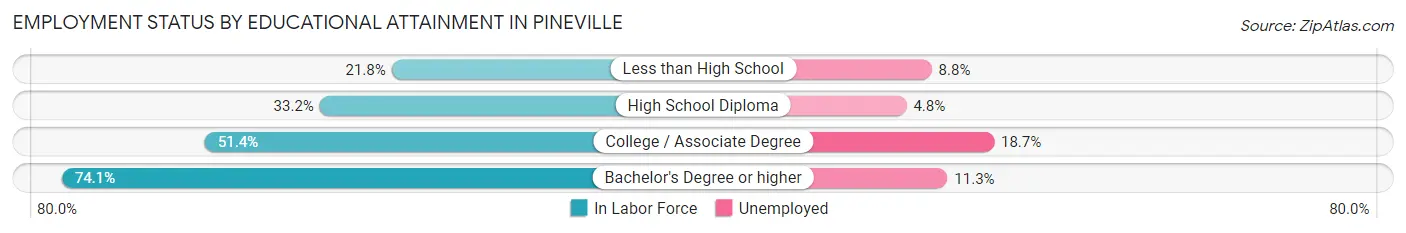
| Educational Attainment | In Labor Force | Unemployed |
| Less than High School | 34 (21.8%) | 14 (8.8%) |
| High School Diploma | 126 (33.2%) | 18 (4.8%) |
| College / Associate Degree | 150 (51.4%) | 55 (18.7%) |
| Bachelor's Degree or higher | 80 (74.1%) | 12 (11.3%) |
| Total | 390 (41.7%) | 110 (11.8%) |
Employment Occupations by Sex in Pineville
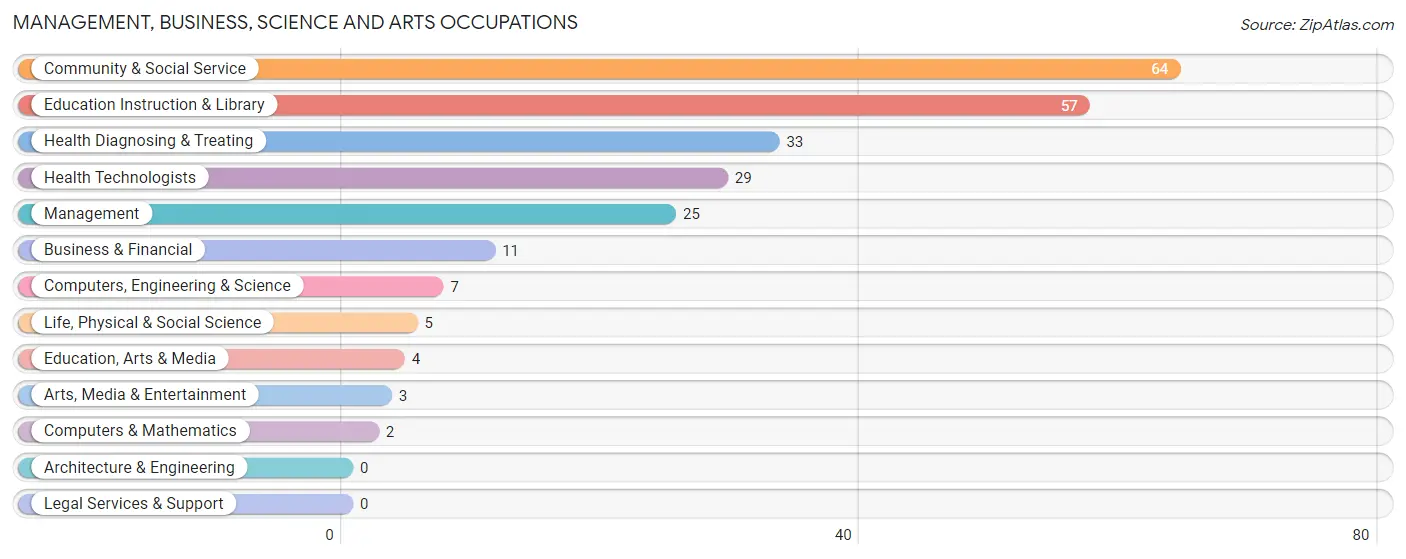
Management, Business, Science and Arts Occupations
The most common Management, Business, Science and Arts occupations in Pineville are Community & Social Service (64 | 12.7%), Education Instruction & Library (57 | 11.3%), Health Diagnosing & Treating (33 | 6.5%), Health Technologists (29 | 5.7%), and Management (25 | 5.0%).
Management, Business, Science and Arts Occupations by Sex
Within the Management, Business, Science and Arts occupations in Pineville, the most male-oriented occupations are Computers, Engineering & Science (100.0%), Computers & Mathematics (100.0%), and Life, Physical & Social Science (100.0%), while the most female-oriented occupations are Business & Financial (100.0%), Arts, Media & Entertainment (100.0%), and Health Technologists (96.6%).
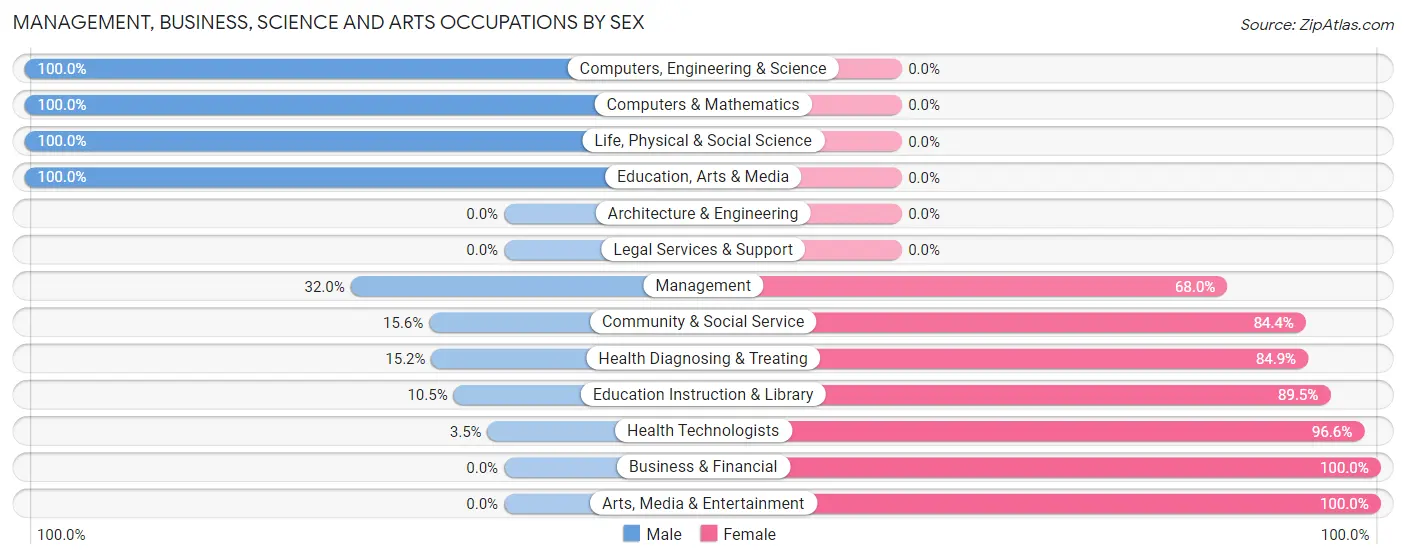
| Occupation | Male | Female |
| Management | 8 (32.0%) | 17 (68.0%) |
| Business & Financial | 0 (0.0%) | 11 (100.0%) |
| Computers, Engineering & Science | 7 (100.0%) | 0 (0.0%) |
| Computers & Mathematics | 2 (100.0%) | 0 (0.0%) |
| Architecture & Engineering | 0 (0.0%) | 0 (0.0%) |
| Life, Physical & Social Science | 5 (100.0%) | 0 (0.0%) |
| Community & Social Service | 10 (15.6%) | 54 (84.4%) |
| Education, Arts & Media | 4 (100.0%) | 0 (0.0%) |
| Legal Services & Support | 0 (0.0%) | 0 (0.0%) |
| Education Instruction & Library | 6 (10.5%) | 51 (89.5%) |
| Arts, Media & Entertainment | 0 (0.0%) | 3 (100.0%) |
| Health Diagnosing & Treating | 5 (15.1%) | 28 (84.9%) |
| Health Technologists | 1 (3.5%) | 28 (96.6%) |
| Total (Category) | 30 (21.4%) | 110 (78.6%) |
| Total (Overall) | 192 (38.0%) | 313 (62.0%) |
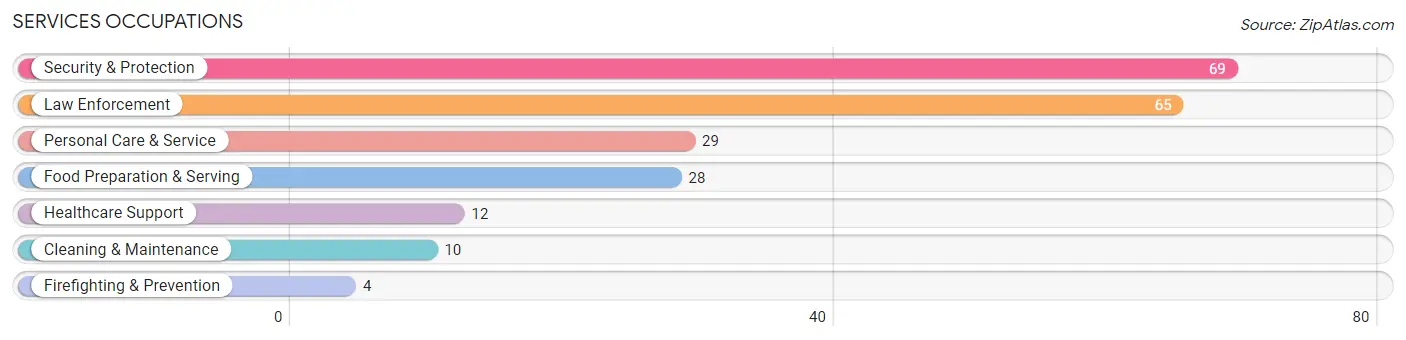
Services Occupations
The most common Services occupations in Pineville are Security & Protection (69 | 13.7%), Law Enforcement (65 | 12.9%), Personal Care & Service (29 | 5.7%), Food Preparation & Serving (28 | 5.5%), and Healthcare Support (12 | 2.4%).
Services Occupations by Sex
Within the Services occupations in Pineville, the most male-oriented occupations are Firefighting & Prevention (100.0%), Cleaning & Maintenance (100.0%), and Healthcare Support (41.7%), while the most female-oriented occupations are Personal Care & Service (100.0%), Law Enforcement (96.9%), and Security & Protection (91.3%).

| Occupation | Male | Female |
| Healthcare Support | 5 (41.7%) | 7 (58.3%) |
| Security & Protection | 6 (8.7%) | 63 (91.3%) |
| Firefighting & Prevention | 4 (100.0%) | 0 (0.0%) |
| Law Enforcement | 2 (3.1%) | 63 (96.9%) |
| Food Preparation & Serving | 3 (10.7%) | 25 (89.3%) |
| Cleaning & Maintenance | 10 (100.0%) | 0 (0.0%) |
| Personal Care & Service | 0 (0.0%) | 29 (100.0%) |
| Total (Category) | 24 (16.2%) | 124 (83.8%) |
| Total (Overall) | 192 (38.0%) | 313 (62.0%) |
Sales and Office Occupations
The most common Sales and Office occupations in Pineville are Sales & Related (49 | 9.7%), and Office & Administration (22 | 4.4%).

Sales and Office Occupations by Sex
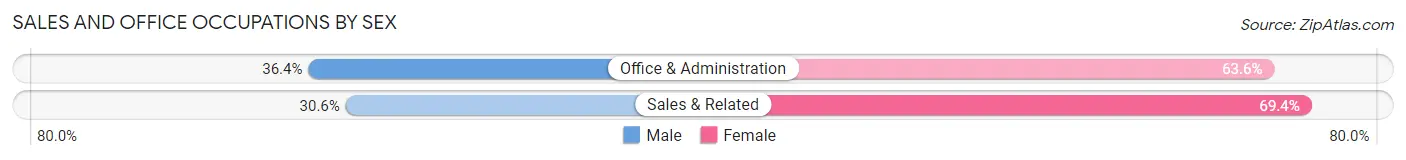
| Occupation | Male | Female |
| Sales & Related | 15 (30.6%) | 34 (69.4%) |
| Office & Administration | 8 (36.4%) | 14 (63.6%) |
| Total (Category) | 23 (32.4%) | 48 (67.6%) |
| Total (Overall) | 192 (38.0%) | 313 (62.0%) |
Natural Resources, Construction and Maintenance Occupations
The most common Natural Resources, Construction and Maintenance occupations in Pineville are Construction & Extraction (35 | 6.9%), and Installation, Maintenance & Repair (13 | 2.6%).
Natural Resources, Construction and Maintenance Occupations by Sex
| Occupation | Male | Female |
| Farming, Fishing & Forestry | 0 (0.0%) | 0 (0.0%) |
| Construction & Extraction | 35 (100.0%) | 0 (0.0%) |
| Installation, Maintenance & Repair | 13 (100.0%) | 0 (0.0%) |
| Total (Category) | 48 (100.0%) | 0 (0.0%) |
| Total (Overall) | 192 (38.0%) | 313 (62.0%) |
Production, Transportation and Moving Occupations
The most common Production, Transportation and Moving occupations in Pineville are Production (76 | 15.0%), and Material Moving (22 | 4.4%).
Production, Transportation and Moving Occupations by Sex
| Occupation | Male | Female |
| Production | 52 (68.4%) | 24 (31.6%) |
| Transportation | 0 (0.0%) | 0 (0.0%) |
| Material Moving | 15 (68.2%) | 7 (31.8%) |
| Total (Category) | 67 (68.4%) | 31 (31.6%) |
| Total (Overall) | 192 (38.0%) | 313 (62.0%) |
Employment Industries by Sex in Pineville
Employment Industries in Pineville
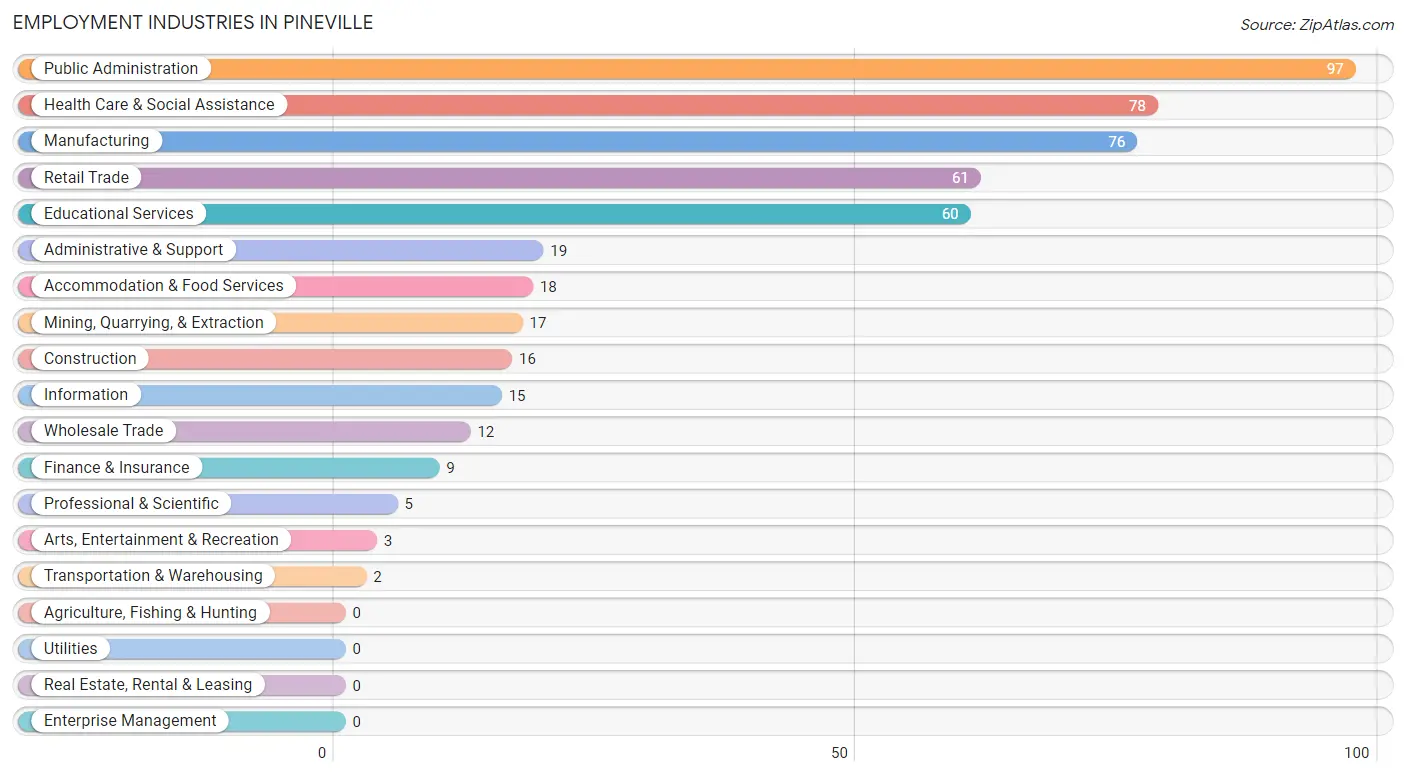
The major employment industries in Pineville include Public Administration (97 | 19.2%), Health Care & Social Assistance (78 | 15.4%), Manufacturing (76 | 15.0%), Retail Trade (61 | 12.1%), and Educational Services (60 | 11.9%).
Employment Industries by Sex in Pineville
The Pineville industries that see more men than women are Mining, Quarrying, & Extraction (100.0%), Construction (100.0%), and Wholesale Trade (100.0%), whereas the industries that tend to have a higher number of women are Health Care & Social Assistance (87.2%), Public Administration (86.6%), and Educational Services (85.0%).
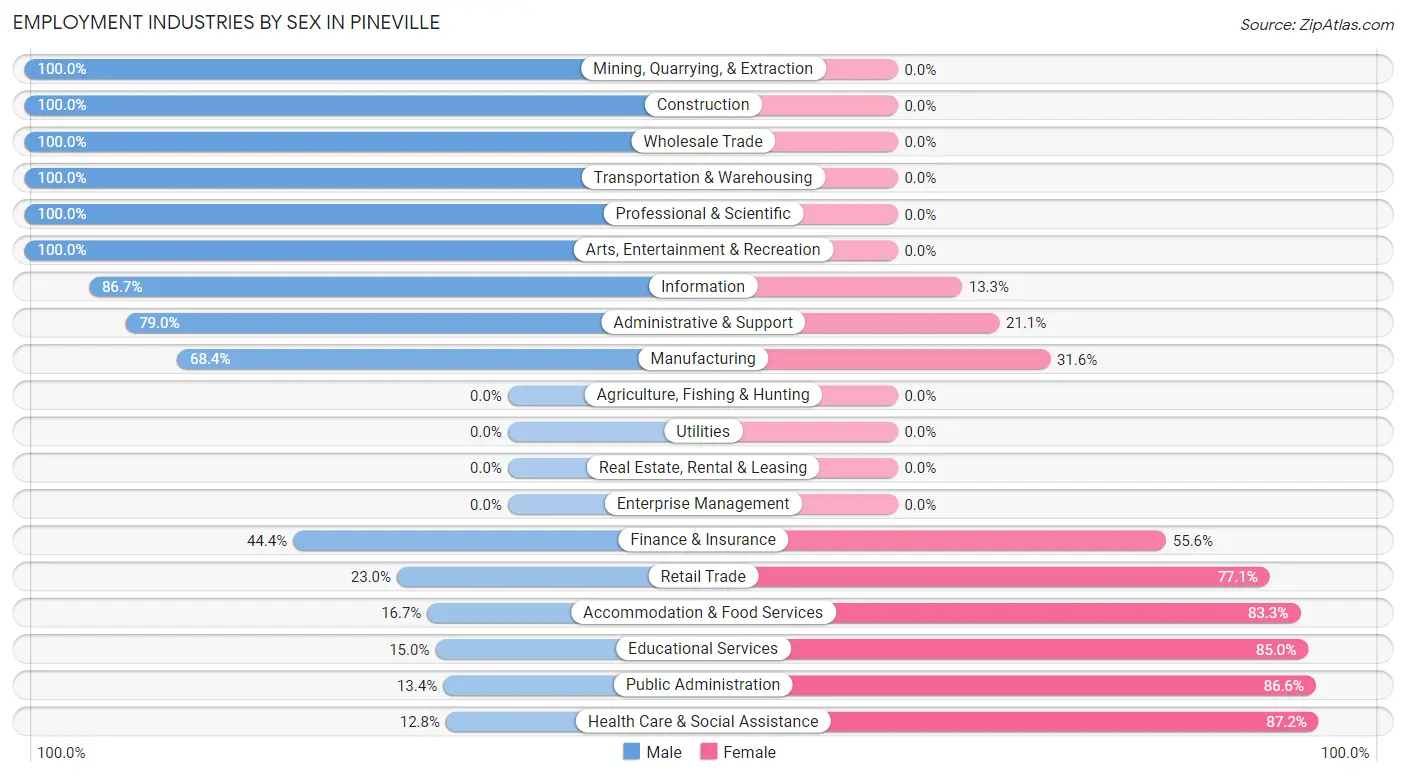
| Industry | Male | Female |
| Agriculture, Fishing & Hunting | 0 (0.0%) | 0 (0.0%) |
| Mining, Quarrying, & Extraction | 17 (100.0%) | 0 (0.0%) |
| Construction | 16 (100.0%) | 0 (0.0%) |
| Manufacturing | 52 (68.4%) | 24 (31.6%) |
| Wholesale Trade | 12 (100.0%) | 0 (0.0%) |
| Retail Trade | 14 (23.0%) | 47 (77.0%) |
| Transportation & Warehousing | 2 (100.0%) | 0 (0.0%) |
| Utilities | 0 (0.0%) | 0 (0.0%) |
| Information | 13 (86.7%) | 2 (13.3%) |
| Finance & Insurance | 4 (44.4%) | 5 (55.6%) |
| Real Estate, Rental & Leasing | 0 (0.0%) | 0 (0.0%) |
| Professional & Scientific | 5 (100.0%) | 0 (0.0%) |
| Enterprise Management | 0 (0.0%) | 0 (0.0%) |
| Administrative & Support | 15 (78.9%) | 4 (21.0%) |
| Educational Services | 9 (15.0%) | 51 (85.0%) |
| Health Care & Social Assistance | 10 (12.8%) | 68 (87.2%) |
| Arts, Entertainment & Recreation | 3 (100.0%) | 0 (0.0%) |
| Accommodation & Food Services | 3 (16.7%) | 15 (83.3%) |
| Public Administration | 13 (13.4%) | 84 (86.6%) |
| Total | 192 (38.0%) | 313 (62.0%) |
Education in Pineville
School Enrollment in Pineville
The most common levels of schooling among the 341 students in Pineville are middle school (118 | 34.6%), high school (98 | 28.7%), and elementary school (69 | 20.2%).
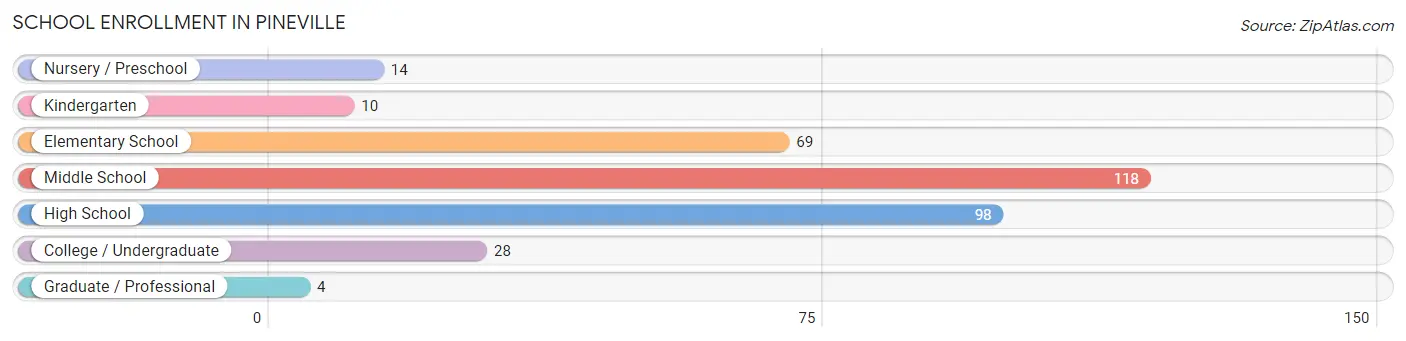
| School Level | # Students | % Students |
| Nursery / Preschool | 14 | 4.1% |
| Kindergarten | 10 | 2.9% |
| Elementary School | 69 | 20.2% |
| Middle School | 118 | 34.6% |
| High School | 98 | 28.7% |
| College / Undergraduate | 28 | 8.2% |
| Graduate / Professional | 4 | 1.2% |
| Total | 341 | 100.0% |
School Enrollment by Age by Funding Source in Pineville
Out of a total of 341 students who are enrolled in schools in Pineville, 44 (12.9%) attend a private institution, while the remaining 297 (87.1%) are enrolled in public schools. The age group of 25 to 34 year olds has the highest likelihood of being enrolled in private schools, with 24 (100.0% in the age bracket) enrolled. Conversely, the age group of 5 to 9 year old has the lowest likelihood of being enrolled in a private school, with 71 (100.0% in the age bracket) attending a public institution.
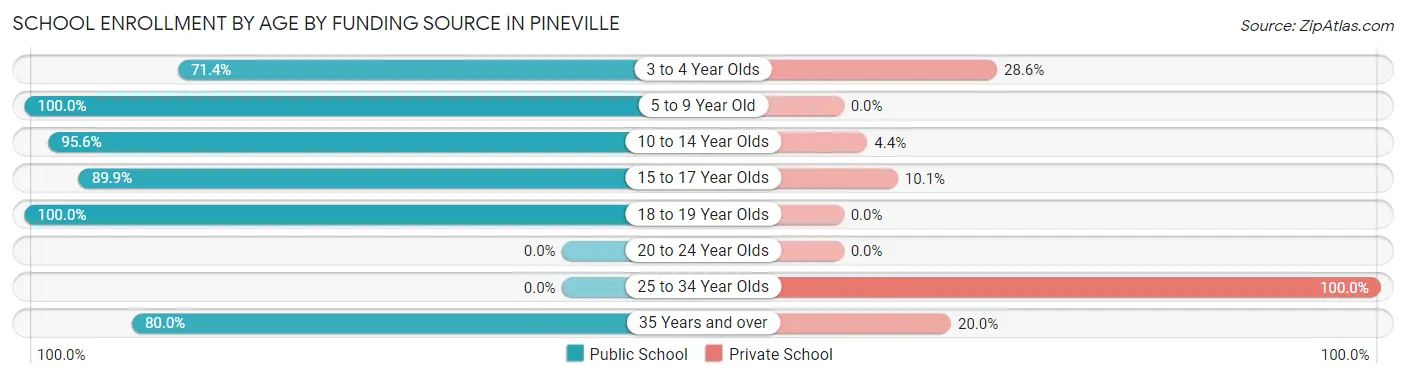
| Age Bracket | Public School | Private School |
| 3 to 4 Year Olds | 10 (71.4%) | 4 (28.6%) |
| 5 to 9 Year Old | 71 (100.0%) | 0 (0.0%) |
| 10 to 14 Year Olds | 108 (95.6%) | 5 (4.4%) |
| 15 to 17 Year Olds | 89 (89.9%) | 10 (10.1%) |
| 18 to 19 Year Olds | 15 (100.0%) | 0 (0.0%) |
| 20 to 24 Year Olds | 0 (0.0%) | 0 (0.0%) |
| 25 to 34 Year Olds | 0 (0.0%) | 24 (100.0%) |
| 35 Years and over | 4 (80.0%) | 1 (20.0%) |
| Total | 297 (87.1%) | 44 (12.9%) |
Educational Attainment by Field of Study in Pineville
Education (80 | 43.2%), business (24 | 13.0%), arts & humanities (16 | 8.6%), liberal arts & history (15 | 8.1%), and psychology (11 | 5.9%) are the most common fields of study among 185 individuals in Pineville who have obtained a bachelor's degree or higher.
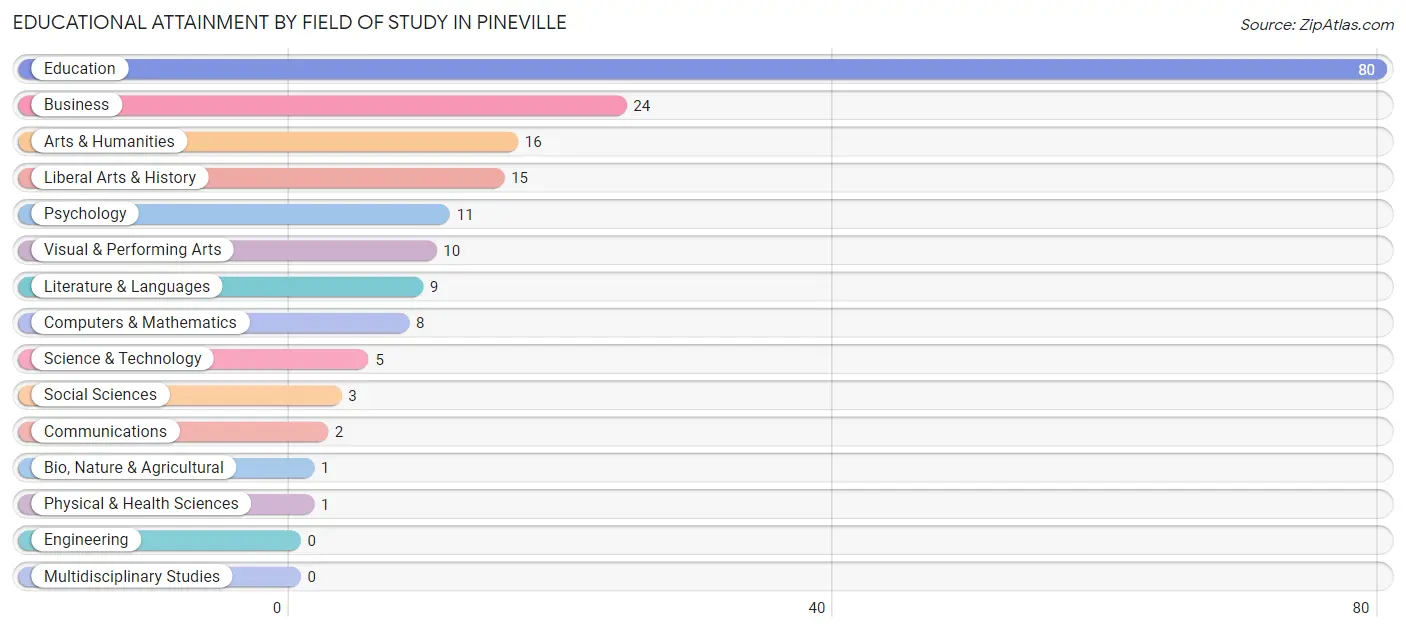
| Field of Study | # Graduates | % Graduates |
| Computers & Mathematics | 8 | 4.3% |
| Bio, Nature & Agricultural | 1 | 0.5% |
| Physical & Health Sciences | 1 | 0.5% |
| Psychology | 11 | 5.9% |
| Social Sciences | 3 | 1.6% |
| Engineering | 0 | 0.0% |
| Multidisciplinary Studies | 0 | 0.0% |
| Science & Technology | 5 | 2.7% |
| Business | 24 | 13.0% |
| Education | 80 | 43.2% |
| Literature & Languages | 9 | 4.9% |
| Liberal Arts & History | 15 | 8.1% |
| Visual & Performing Arts | 10 | 5.4% |
| Communications | 2 | 1.1% |
| Arts & Humanities | 16 | 8.6% |
| Total | 185 | 100.0% |
Transportation & Commute in Pineville
Vehicle Availability by Sex in Pineville
The most prevalent vehicle ownership categories in Pineville are males with 2 vehicles (67, accounting for 36.0%) and females with 2 vehicles (123, making up 21.4%).
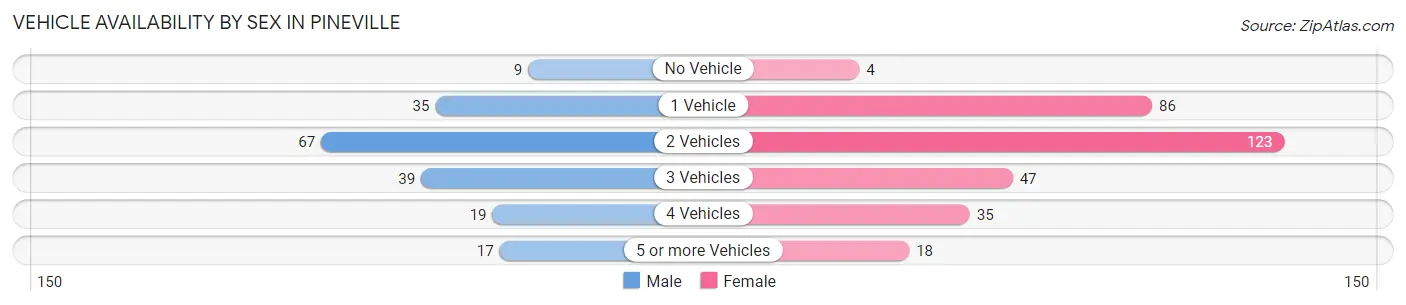
| Vehicles Available | Male | Female |
| No Vehicle | 9 (4.8%) | 4 (1.3%) |
| 1 Vehicle | 35 (18.8%) | 86 (27.5%) |
| 2 Vehicles | 67 (36.0%) | 123 (39.3%) |
| 3 Vehicles | 39 (21.0%) | 47 (15.0%) |
| 4 Vehicles | 19 (10.2%) | 35 (11.2%) |
| 5 or more Vehicles | 17 (9.1%) | 18 (5.8%) |
| Total | 186 (100.0%) | 313 (100.0%) |
Commute Time in Pineville
The most frequently occuring commute durations in Pineville are less than 5 minutes (127 commuters, 26.1%), 15 to 19 minutes (69 commuters, 14.2%), and 5 to 9 minutes (65 commuters, 13.4%).
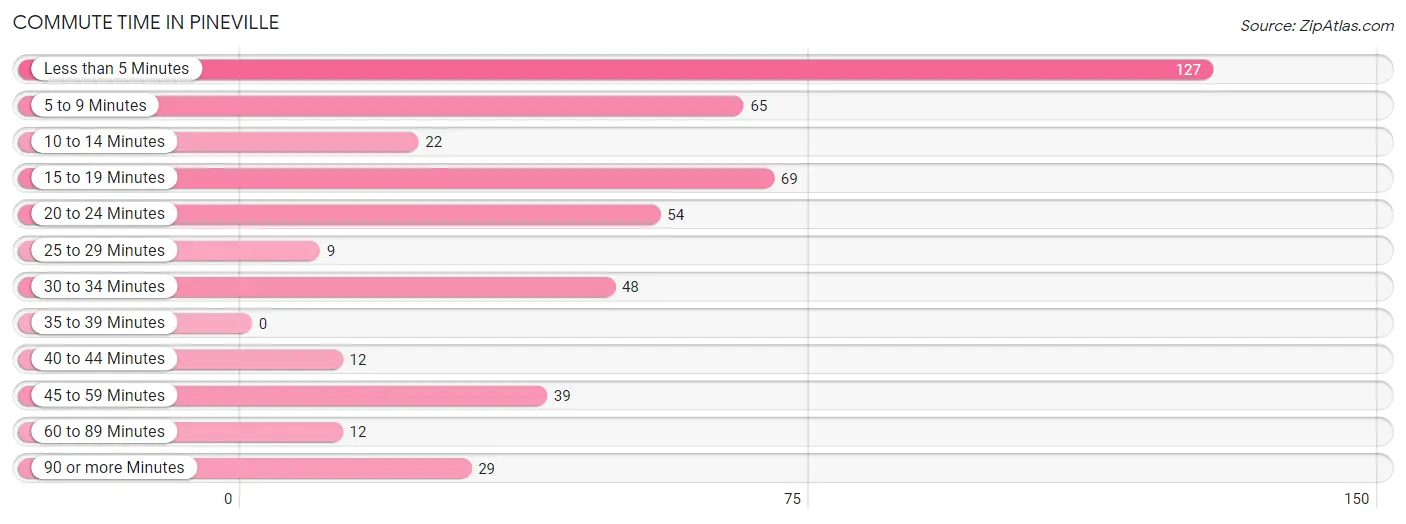
| Commute Time | # Commuters | % Commuters |
| Less than 5 Minutes | 127 | 26.1% |
| 5 to 9 Minutes | 65 | 13.4% |
| 10 to 14 Minutes | 22 | 4.5% |
| 15 to 19 Minutes | 69 | 14.2% |
| 20 to 24 Minutes | 54 | 11.1% |
| 25 to 29 Minutes | 9 | 1.8% |
| 30 to 34 Minutes | 48 | 9.9% |
| 35 to 39 Minutes | 0 | 0.0% |
| 40 to 44 Minutes | 12 | 2.5% |
| 45 to 59 Minutes | 39 | 8.0% |
| 60 to 89 Minutes | 12 | 2.5% |
| 90 or more Minutes | 29 | 6.0% |
Commute Time by Sex in Pineville
The most common commute times in Pineville are 45 to 59 minutes (37 commuters, 19.6%) for males and less than 5 minutes (106 commuters, 35.7%) for females.
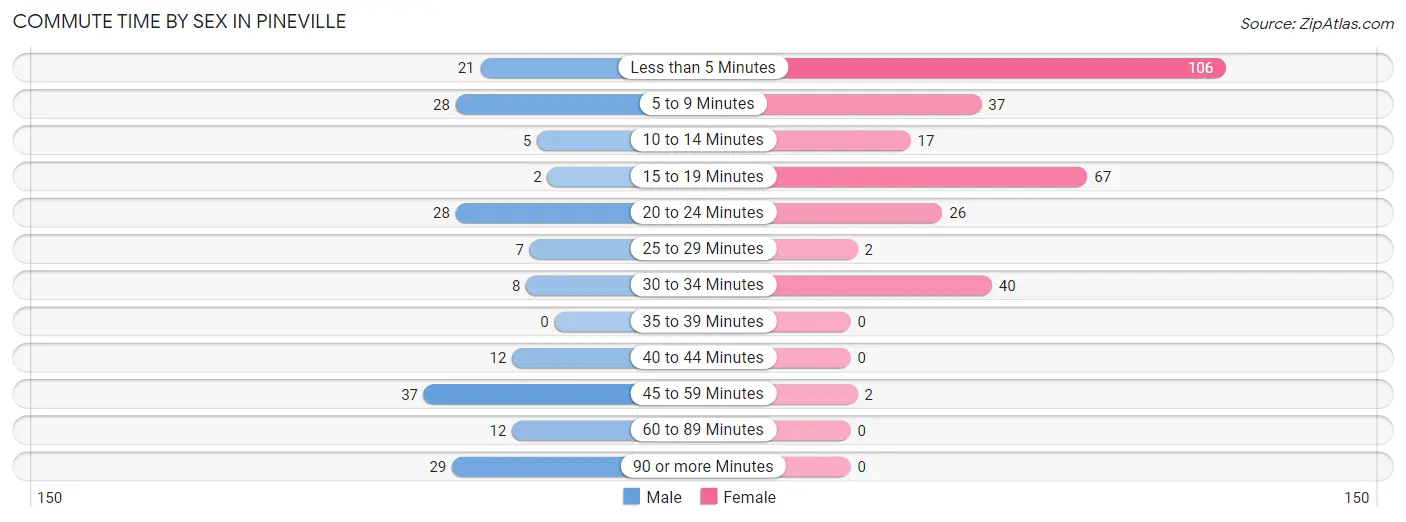
| Commute Time | Male | Female |
| Less than 5 Minutes | 21 (11.1%) | 106 (35.7%) |
| 5 to 9 Minutes | 28 (14.8%) | 37 (12.5%) |
| 10 to 14 Minutes | 5 (2.6%) | 17 (5.7%) |
| 15 to 19 Minutes | 2 (1.1%) | 67 (22.6%) |
| 20 to 24 Minutes | 28 (14.8%) | 26 (8.7%) |
| 25 to 29 Minutes | 7 (3.7%) | 2 (0.7%) |
| 30 to 34 Minutes | 8 (4.2%) | 40 (13.5%) |
| 35 to 39 Minutes | 0 (0.0%) | 0 (0.0%) |
| 40 to 44 Minutes | 12 (6.4%) | 0 (0.0%) |
| 45 to 59 Minutes | 37 (19.6%) | 2 (0.7%) |
| 60 to 89 Minutes | 12 (6.4%) | 0 (0.0%) |
| 90 or more Minutes | 29 (15.3%) | 0 (0.0%) |
Time of Departure to Work by Sex in Pineville
The most frequent times of departure to work in Pineville are 12:00 AM to 4:59 AM (50, 26.5%) for males and 7:00 AM to 7:29 AM (65, 21.9%) for females.
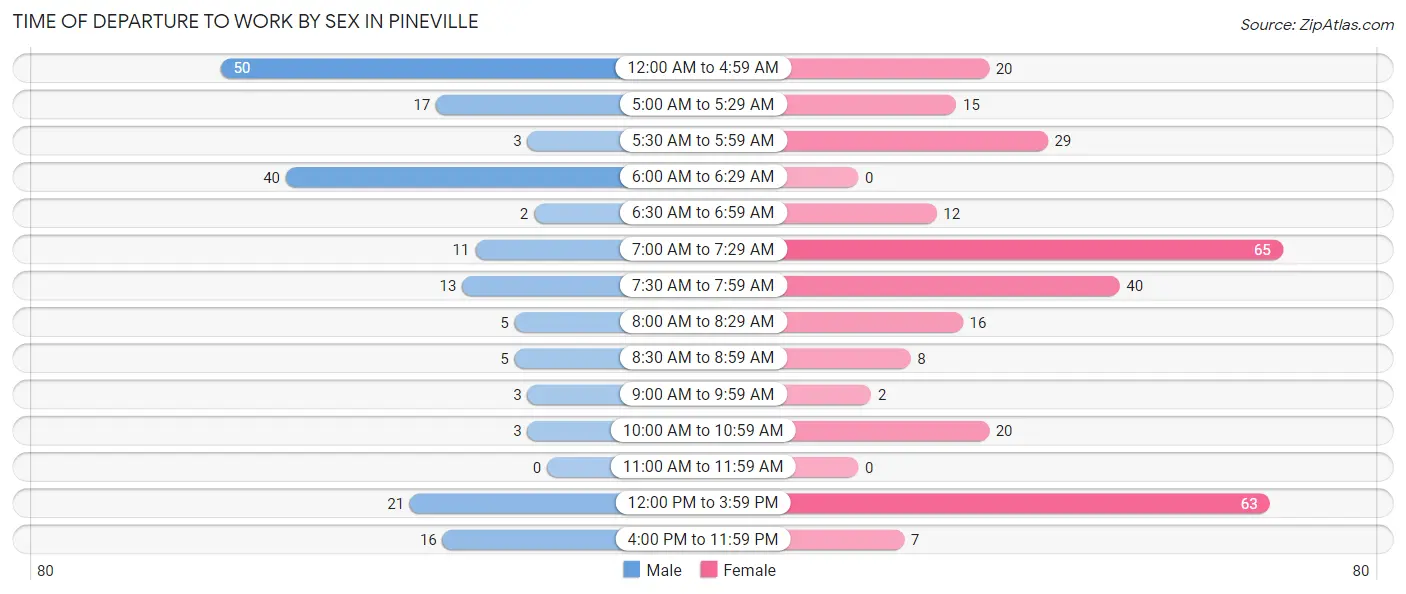
| Time of Departure | Male | Female |
| 12:00 AM to 4:59 AM | 50 (26.5%) | 20 (6.7%) |
| 5:00 AM to 5:29 AM | 17 (9.0%) | 15 (5.1%) |
| 5:30 AM to 5:59 AM | 3 (1.6%) | 29 (9.8%) |
| 6:00 AM to 6:29 AM | 40 (21.2%) | 0 (0.0%) |
| 6:30 AM to 6:59 AM | 2 (1.1%) | 12 (4.0%) |
| 7:00 AM to 7:29 AM | 11 (5.8%) | 65 (21.9%) |
| 7:30 AM to 7:59 AM | 13 (6.9%) | 40 (13.5%) |
| 8:00 AM to 8:29 AM | 5 (2.6%) | 16 (5.4%) |
| 8:30 AM to 8:59 AM | 5 (2.6%) | 8 (2.7%) |
| 9:00 AM to 9:59 AM | 3 (1.6%) | 2 (0.7%) |
| 10:00 AM to 10:59 AM | 3 (1.6%) | 20 (6.7%) |
| 11:00 AM to 11:59 AM | 0 (0.0%) | 0 (0.0%) |
| 12:00 PM to 3:59 PM | 21 (11.1%) | 63 (21.2%) |
| 4:00 PM to 11:59 PM | 16 (8.5%) | 7 (2.4%) |
| Total | 189 (100.0%) | 297 (100.0%) |
Housing Occupancy in Pineville
Occupancy by Ownership in Pineville
Of the total 688 dwellings in Pineville, owner-occupied units account for 286 (41.6%), while renter-occupied units make up 402 (58.4%).
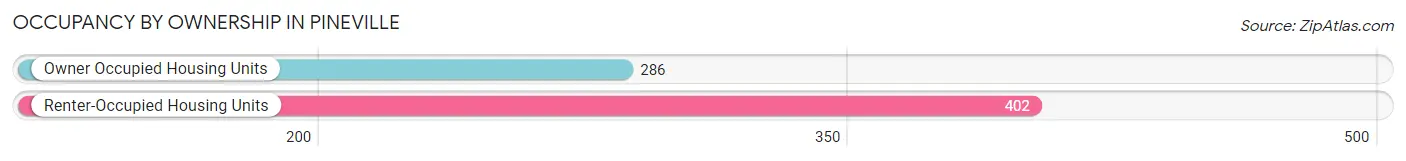
| Occupancy | # Housing Units | % Housing Units |
| Owner Occupied Housing Units | 286 | 41.6% |
| Renter-Occupied Housing Units | 402 | 58.4% |
| Total Occupied Housing Units | 688 | 100.0% |
Occupancy by Household Size in Pineville
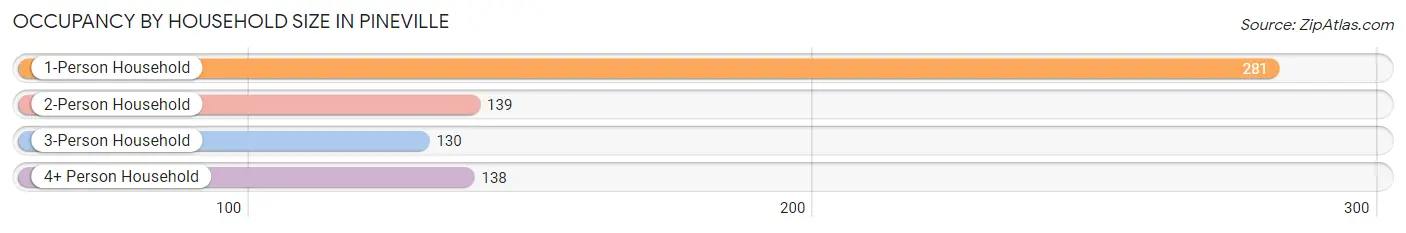
| Household Size | # Housing Units | % Housing Units |
| 1-Person Household | 281 | 40.8% |
| 2-Person Household | 139 | 20.2% |
| 3-Person Household | 130 | 18.9% |
| 4+ Person Household | 138 | 20.1% |
| Total Housing Units | 688 | 100.0% |
Occupancy by Ownership by Household Size in Pineville
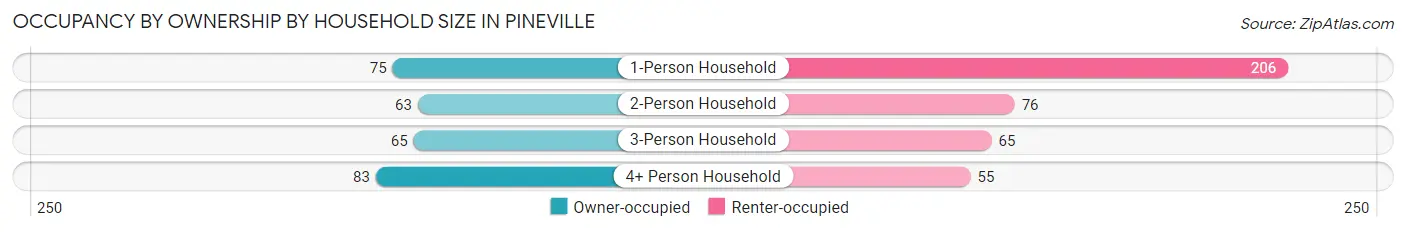
| Household Size | Owner-occupied | Renter-occupied |
| 1-Person Household | 75 (26.7%) | 206 (73.3%) |
| 2-Person Household | 63 (45.3%) | 76 (54.7%) |
| 3-Person Household | 65 (50.0%) | 65 (50.0%) |
| 4+ Person Household | 83 (60.1%) | 55 (39.9%) |
| Total Housing Units | 286 (41.6%) | 402 (58.4%) |
Occupancy by Educational Attainment in Pineville
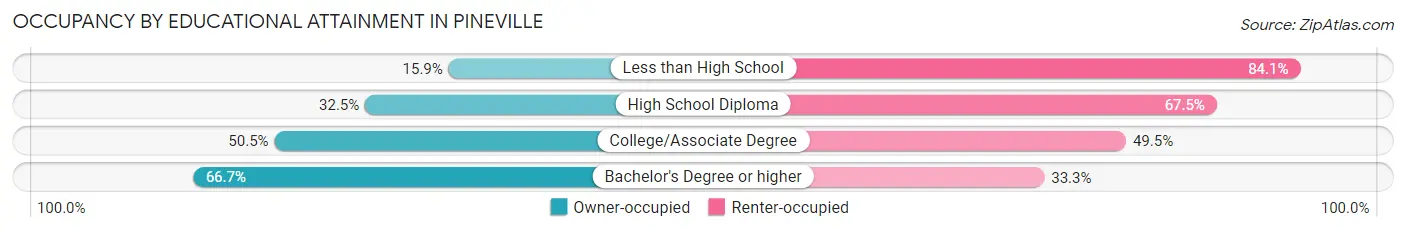
| Household Size | Owner-occupied | Renter-occupied |
| Less than High School | 18 (15.9%) | 95 (84.1%) |
| High School Diploma | 77 (32.5%) | 160 (67.5%) |
| College/Associate Degree | 107 (50.5%) | 105 (49.5%) |
| Bachelor's Degree or higher | 84 (66.7%) | 42 (33.3%) |
Occupancy by Age of Householder in Pineville
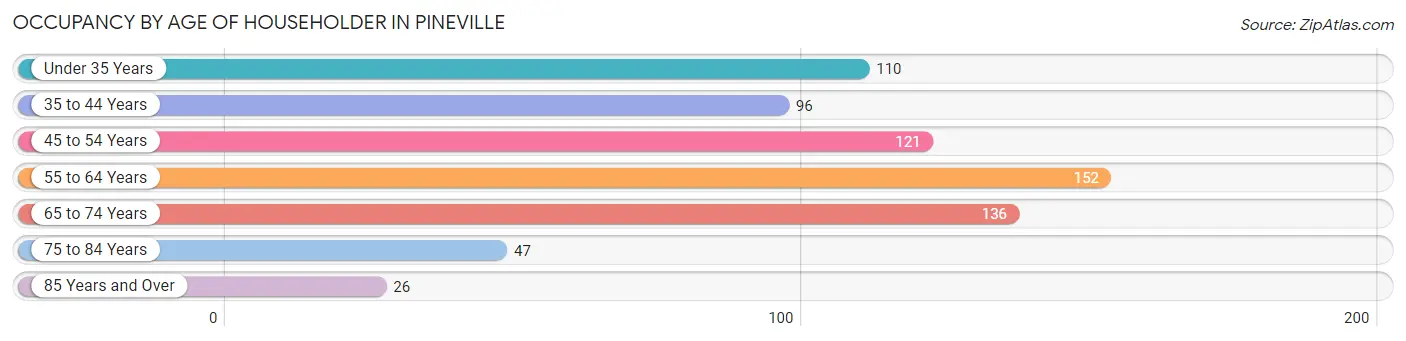
| Age Bracket | # Households | % Households |
| Under 35 Years | 110 | 16.0% |
| 35 to 44 Years | 96 | 14.0% |
| 45 to 54 Years | 121 | 17.6% |
| 55 to 64 Years | 152 | 22.1% |
| 65 to 74 Years | 136 | 19.8% |
| 75 to 84 Years | 47 | 6.8% |
| 85 Years and Over | 26 | 3.8% |
| Total | 688 | 100.0% |
Housing Finances in Pineville
Median Income by Occupancy in Pineville
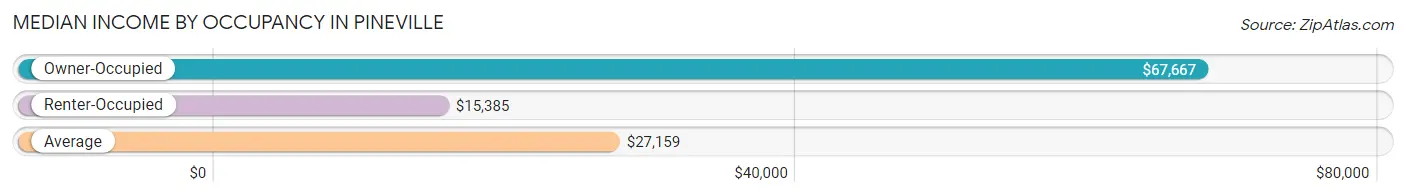
| Occupancy Type | # Households | Median Income |
| Owner-Occupied | 286 (41.6%) | $67,667 |
| Renter-Occupied | 402 (58.4%) | $15,385 |
| Average | 688 (100.0%) | $27,159 |
Occupancy by Householder Income Bracket in Pineville
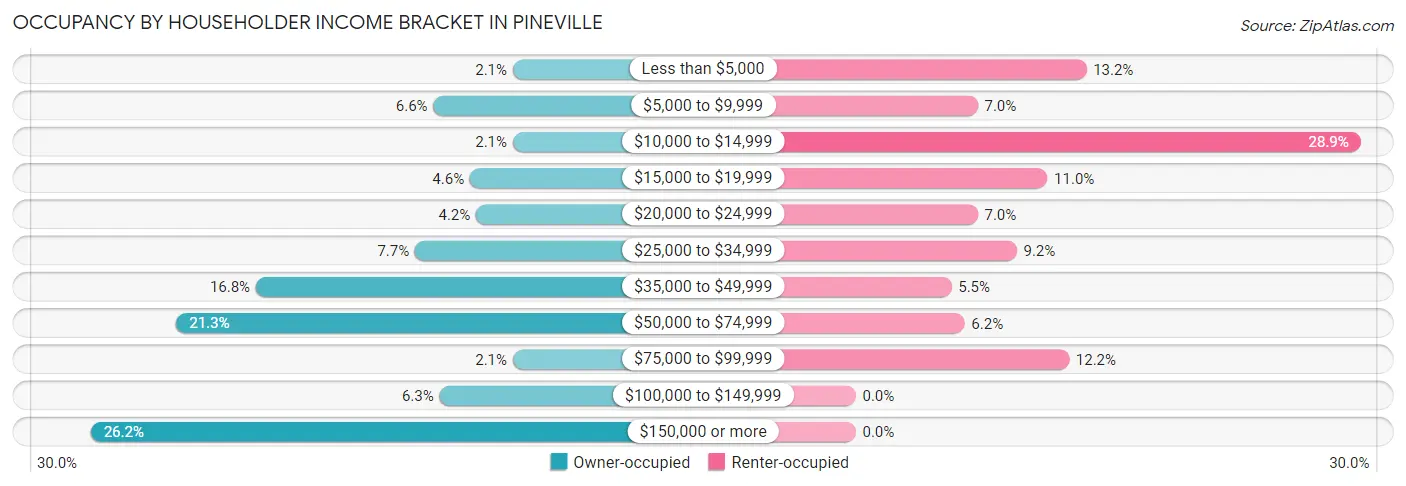
| Income Bracket | Owner-occupied | Renter-occupied |
| Less than $5,000 | 6 (2.1%) | 53 (13.2%) |
| $5,000 to $9,999 | 19 (6.6%) | 28 (7.0%) |
| $10,000 to $14,999 | 6 (2.1%) | 116 (28.9%) |
| $15,000 to $19,999 | 13 (4.5%) | 44 (11.0%) |
| $20,000 to $24,999 | 12 (4.2%) | 28 (7.0%) |
| $25,000 to $34,999 | 22 (7.7%) | 37 (9.2%) |
| $35,000 to $49,999 | 48 (16.8%) | 22 (5.5%) |
| $50,000 to $74,999 | 61 (21.3%) | 25 (6.2%) |
| $75,000 to $99,999 | 6 (2.1%) | 49 (12.2%) |
| $100,000 to $149,999 | 18 (6.3%) | 0 (0.0%) |
| $150,000 or more | 75 (26.2%) | 0 (0.0%) |
| Total | 286 (100.0%) | 402 (100.0%) |
Monthly Housing Cost Tiers in Pineville
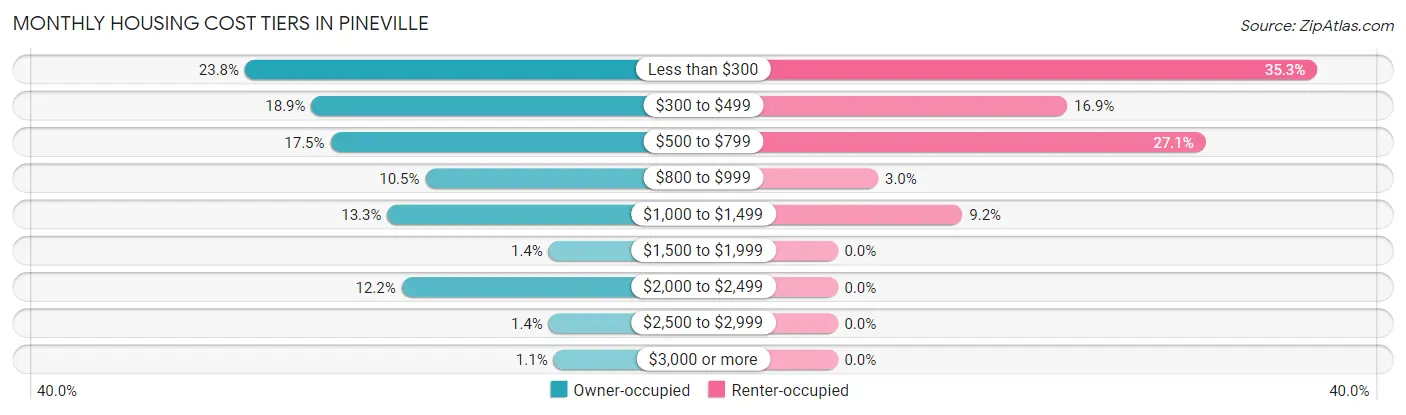
| Monthly Cost | Owner-occupied | Renter-occupied |
| Less than $300 | 68 (23.8%) | 142 (35.3%) |
| $300 to $499 | 54 (18.9%) | 68 (16.9%) |
| $500 to $799 | 50 (17.5%) | 109 (27.1%) |
| $800 to $999 | 30 (10.5%) | 12 (3.0%) |
| $1,000 to $1,499 | 38 (13.3%) | 37 (9.2%) |
| $1,500 to $1,999 | 4 (1.4%) | 0 (0.0%) |
| $2,000 to $2,499 | 35 (12.2%) | 0 (0.0%) |
| $2,500 to $2,999 | 4 (1.4%) | 0 (0.0%) |
| $3,000 or more | 3 (1.1%) | 0 (0.0%) |
| Total | 286 (100.0%) | 402 (100.0%) |
Physical Housing Characteristics in Pineville
Housing Structures in Pineville
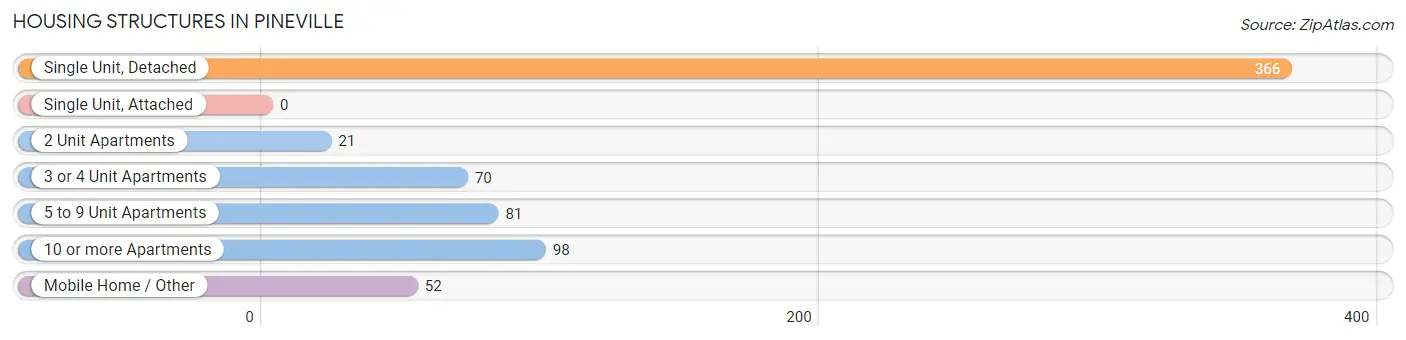
| Structure Type | # Housing Units | % Housing Units |
| Single Unit, Detached | 366 | 53.2% |
| Single Unit, Attached | 0 | 0.0% |
| 2 Unit Apartments | 21 | 3.0% |
| 3 or 4 Unit Apartments | 70 | 10.2% |
| 5 to 9 Unit Apartments | 81 | 11.8% |
| 10 or more Apartments | 98 | 14.2% |
| Mobile Home / Other | 52 | 7.6% |
| Total | 688 | 100.0% |
Housing Structures by Occupancy in Pineville
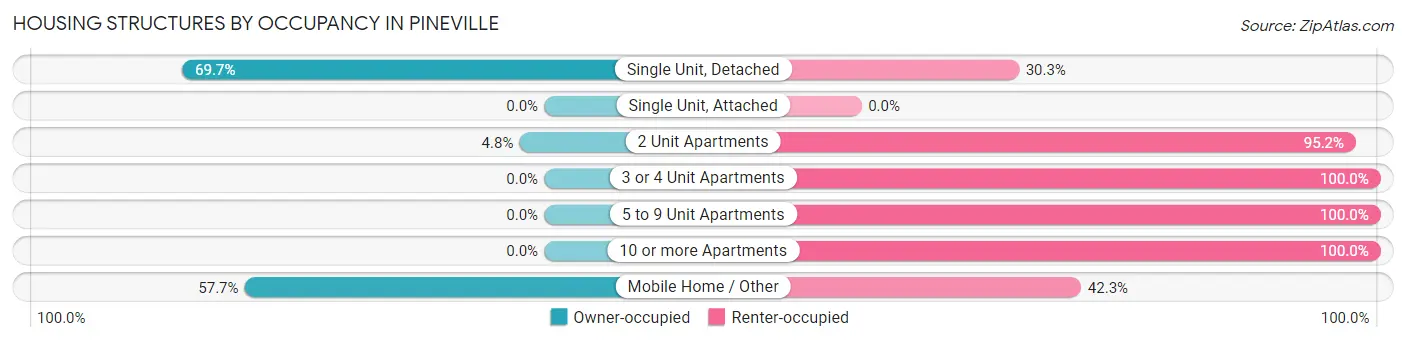
| Structure Type | Owner-occupied | Renter-occupied |
| Single Unit, Detached | 255 (69.7%) | 111 (30.3%) |
| Single Unit, Attached | 0 (0.0%) | 0 (0.0%) |
| 2 Unit Apartments | 1 (4.8%) | 20 (95.2%) |
| 3 or 4 Unit Apartments | 0 (0.0%) | 70 (100.0%) |
| 5 to 9 Unit Apartments | 0 (0.0%) | 81 (100.0%) |
| 10 or more Apartments | 0 (0.0%) | 98 (100.0%) |
| Mobile Home / Other | 30 (57.7%) | 22 (42.3%) |
| Total | 286 (41.6%) | 402 (58.4%) |
Housing Structures by Number of Rooms in Pineville
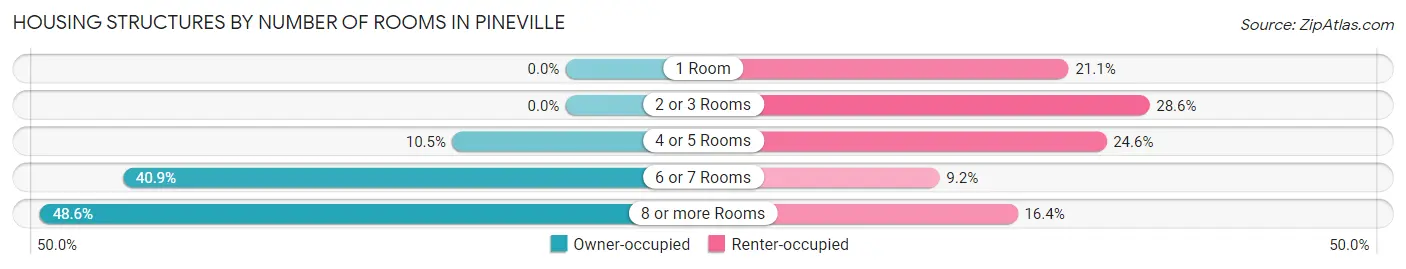
| Number of Rooms | Owner-occupied | Renter-occupied |
| 1 Room | 0 (0.0%) | 85 (21.1%) |
| 2 or 3 Rooms | 0 (0.0%) | 115 (28.6%) |
| 4 or 5 Rooms | 30 (10.5%) | 99 (24.6%) |
| 6 or 7 Rooms | 117 (40.9%) | 37 (9.2%) |
| 8 or more Rooms | 139 (48.6%) | 66 (16.4%) |
| Total | 286 (100.0%) | 402 (100.0%) |
Housing Structure by Heating Type in Pineville
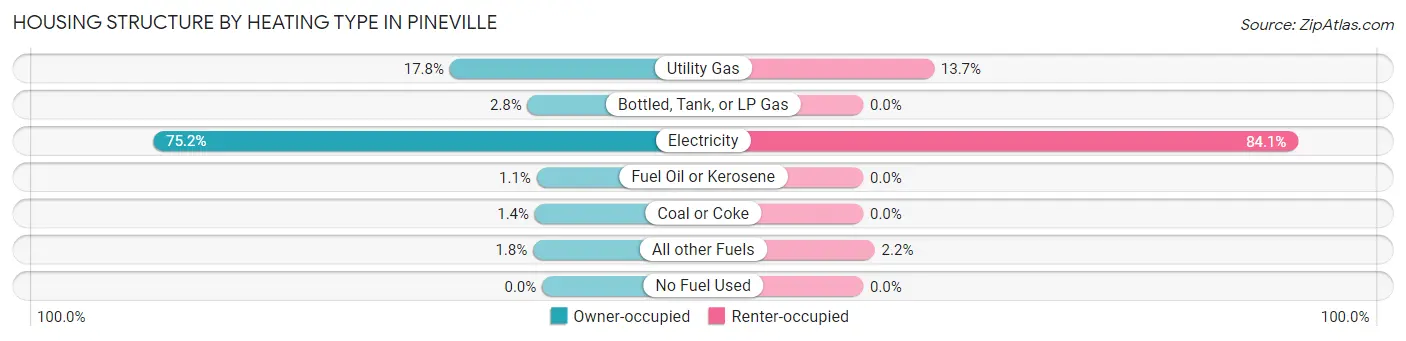
| Heating Type | Owner-occupied | Renter-occupied |
| Utility Gas | 51 (17.8%) | 55 (13.7%) |
| Bottled, Tank, or LP Gas | 8 (2.8%) | 0 (0.0%) |
| Electricity | 215 (75.2%) | 338 (84.1%) |
| Fuel Oil or Kerosene | 3 (1.1%) | 0 (0.0%) |
| Coal or Coke | 4 (1.4%) | 0 (0.0%) |
| All other Fuels | 5 (1.8%) | 9 (2.2%) |
| No Fuel Used | 0 (0.0%) | 0 (0.0%) |
| Total | 286 (100.0%) | 402 (100.0%) |
Household Vehicle Usage in Pineville
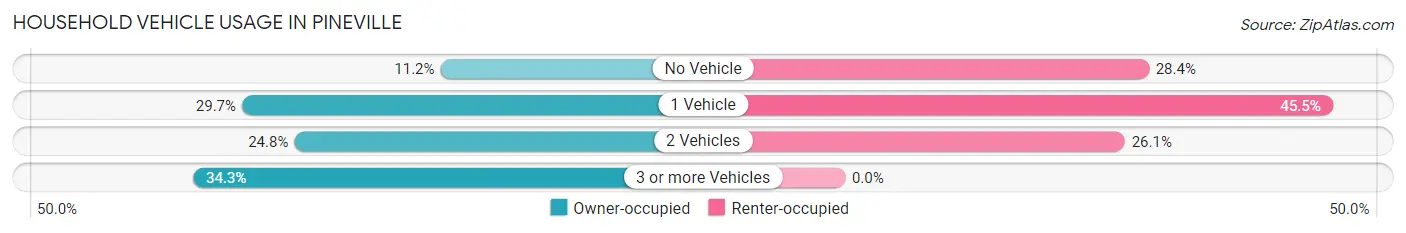
| Vehicles per Household | Owner-occupied | Renter-occupied |
| No Vehicle | 32 (11.2%) | 114 (28.4%) |
| 1 Vehicle | 85 (29.7%) | 183 (45.5%) |
| 2 Vehicles | 71 (24.8%) | 105 (26.1%) |
| 3 or more Vehicles | 98 (34.3%) | 0 (0.0%) |
| Total | 286 (100.0%) | 402 (100.0%) |
Real Estate & Mortgages in Pineville
Real Estate and Mortgage Overview in Pineville
| Characteristic | Without Mortgage | With Mortgage |
| Housing Units | 161 | 125 |
| Median Property Value | $65,000 | $189,700 |
| Median Household Income | $44,750 | $52 |
| Monthly Housing Costs | $355 | $3 |
| Real Estate Taxes | $482 | $0 |
Property Value by Mortgage Status in Pineville
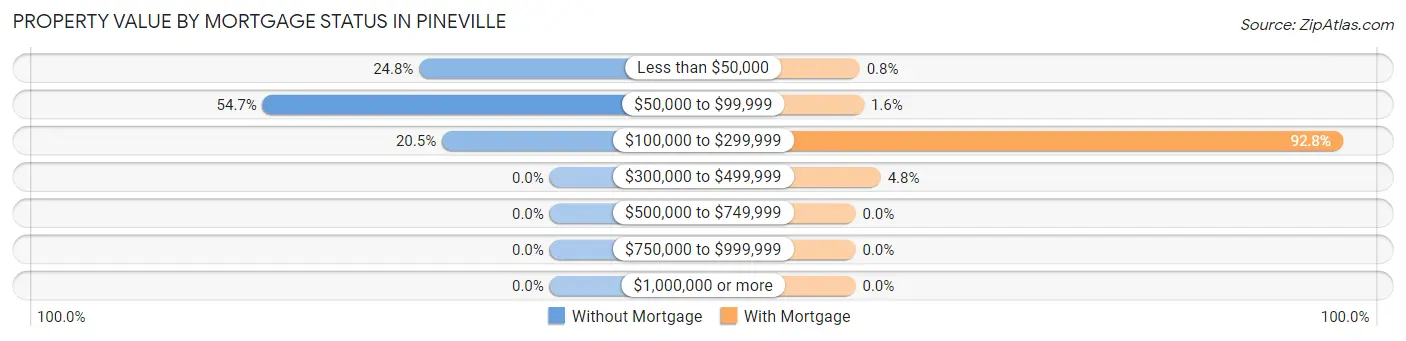
| Property Value | Without Mortgage | With Mortgage |
| Less than $50,000 | 40 (24.8%) | 1 (0.8%) |
| $50,000 to $99,999 | 88 (54.7%) | 2 (1.6%) |
| $100,000 to $299,999 | 33 (20.5%) | 116 (92.8%) |
| $300,000 to $499,999 | 0 (0.0%) | 6 (4.8%) |
| $500,000 to $749,999 | 0 (0.0%) | 0 (0.0%) |
| $750,000 to $999,999 | 0 (0.0%) | 0 (0.0%) |
| $1,000,000 or more | 0 (0.0%) | 0 (0.0%) |
| Total | 161 (100.0%) | 125 (100.0%) |
Household Income by Mortgage Status in Pineville
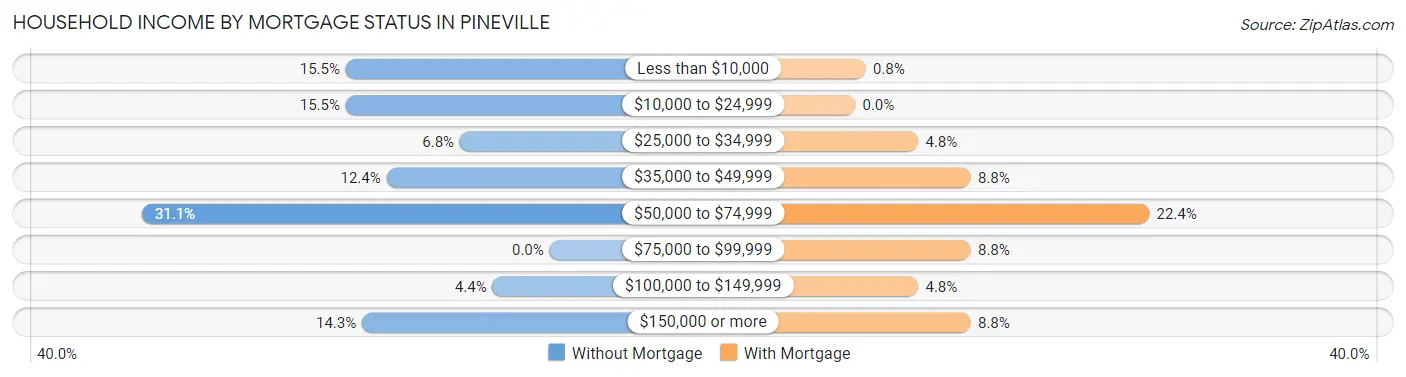
| Household Income | Without Mortgage | With Mortgage |
| Less than $10,000 | 25 (15.5%) | 1 (0.8%) |
| $10,000 to $24,999 | 25 (15.5%) | 0 (0.0%) |
| $25,000 to $34,999 | 11 (6.8%) | 6 (4.8%) |
| $35,000 to $49,999 | 20 (12.4%) | 11 (8.8%) |
| $50,000 to $74,999 | 50 (31.1%) | 28 (22.4%) |
| $75,000 to $99,999 | 0 (0.0%) | 11 (8.8%) |
| $100,000 to $149,999 | 7 (4.3%) | 6 (4.8%) |
| $150,000 or more | 23 (14.3%) | 11 (8.8%) |
| Total | 161 (100.0%) | 125 (100.0%) |
Property Value to Household Income Ratio in Pineville
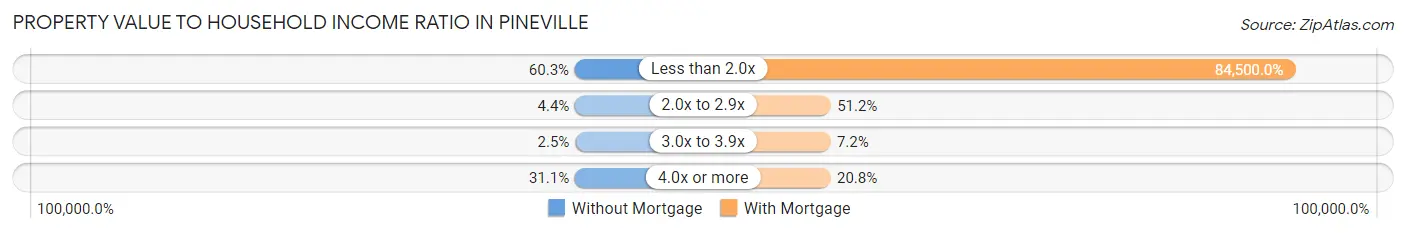
| Value-to-Income Ratio | Without Mortgage | With Mortgage |
| Less than 2.0x | 97 (60.3%) | 105,625 (84,500.0%) |
| 2.0x to 2.9x | 7 (4.3%) | 64 (51.2%) |
| 3.0x to 3.9x | 4 (2.5%) | 9 (7.2%) |
| 4.0x or more | 50 (31.1%) | 26 (20.8%) |
| Total | 161 (100.0%) | 125 (100.0%) |
Real Estate Taxes by Mortgage Status in Pineville
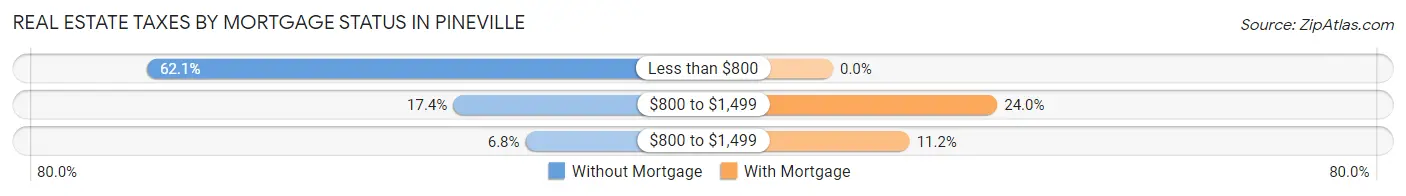
| Property Taxes | Without Mortgage | With Mortgage |
| Less than $800 | 100 (62.1%) | 0 (0.0%) |
| $800 to $1,499 | 28 (17.4%) | 30 (24.0%) |
| $800 to $1,499 | 11 (6.8%) | 14 (11.2%) |
| Total | 161 (100.0%) | 125 (100.0%) |
Health & Disability in Pineville
Health Insurance Coverage by Age in Pineville
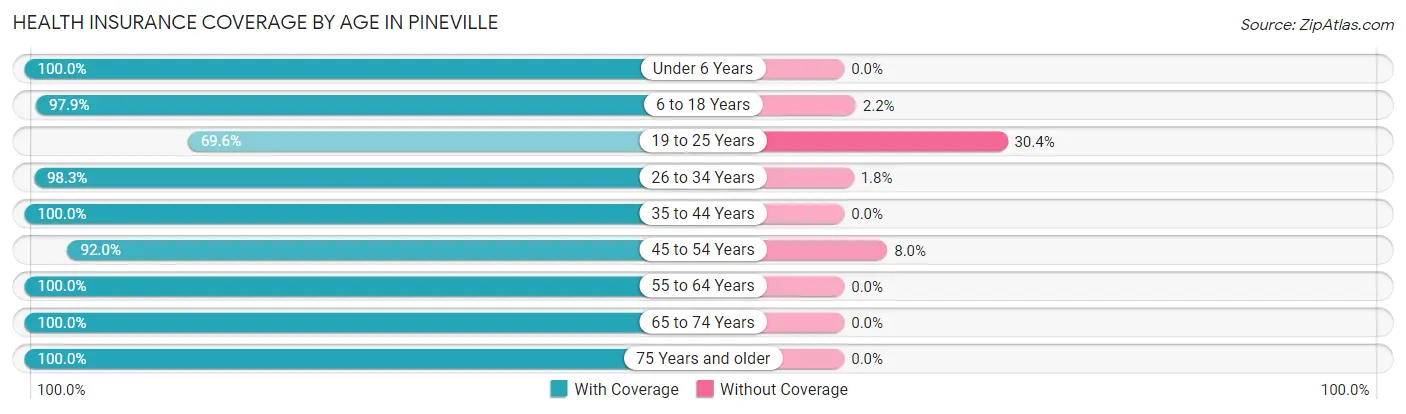
| Age Bracket | With Coverage | Without Coverage |
| Under 6 Years | 98 (100.0%) | 0 (0.0%) |
| 6 to 18 Years | 273 (97.9%) | 6 (2.1%) |
| 19 to 25 Years | 128 (69.6%) | 56 (30.4%) |
| 26 to 34 Years | 112 (98.3%) | 2 (1.8%) |
| 35 to 44 Years | 209 (100.0%) | 0 (0.0%) |
| 45 to 54 Years | 218 (92.0%) | 19 (8.0%) |
| 55 to 64 Years | 248 (100.0%) | 0 (0.0%) |
| 65 to 74 Years | 208 (100.0%) | 0 (0.0%) |
| 75 Years and older | 76 (100.0%) | 0 (0.0%) |
| Total | 1,570 (95.0%) | 83 (5.0%) |
Health Insurance Coverage by Citizenship Status in Pineville

| Citizenship Status | With Coverage | Without Coverage |
| Native Born | 98 (100.0%) | 0 (0.0%) |
| Foreign Born, Citizen | 273 (97.9%) | 6 (2.1%) |
| Foreign Born, not a Citizen | 128 (69.6%) | 56 (30.4%) |
Health Insurance Coverage by Household Income in Pineville
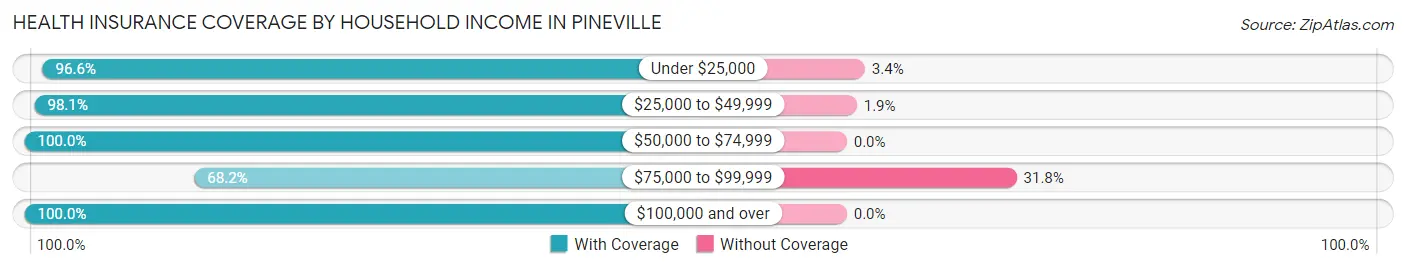
| Household Income | With Coverage | Without Coverage |
| Under $25,000 | 513 (96.6%) | 18 (3.4%) |
| $25,000 to $49,999 | 262 (98.1%) | 5 (1.9%) |
| $50,000 to $74,999 | 274 (100.0%) | 0 (0.0%) |
| $75,000 to $99,999 | 120 (68.2%) | 56 (31.8%) |
| $100,000 and over | 390 (100.0%) | 0 (0.0%) |
Public vs Private Health Insurance Coverage by Age in Pineville
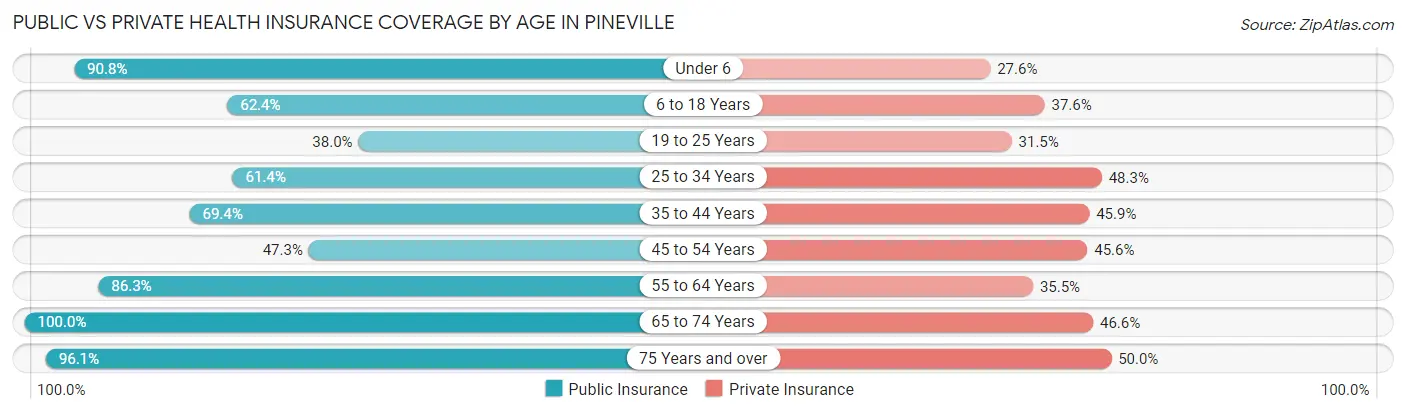
| Age Bracket | Public Insurance | Private Insurance |
| Under 6 | 89 (90.8%) | 27 (27.6%) |
| 6 to 18 Years | 174 (62.4%) | 105 (37.6%) |
| 19 to 25 Years | 70 (38.0%) | 58 (31.5%) |
| 25 to 34 Years | 70 (61.4%) | 55 (48.2%) |
| 35 to 44 Years | 145 (69.4%) | 96 (45.9%) |
| 45 to 54 Years | 112 (47.3%) | 108 (45.6%) |
| 55 to 64 Years | 214 (86.3%) | 88 (35.5%) |
| 65 to 74 Years | 208 (100.0%) | 97 (46.6%) |
| 75 Years and over | 73 (96.1%) | 38 (50.0%) |
| Total | 1,155 (69.9%) | 672 (40.6%) |
Disability Status by Sex by Age in Pineville
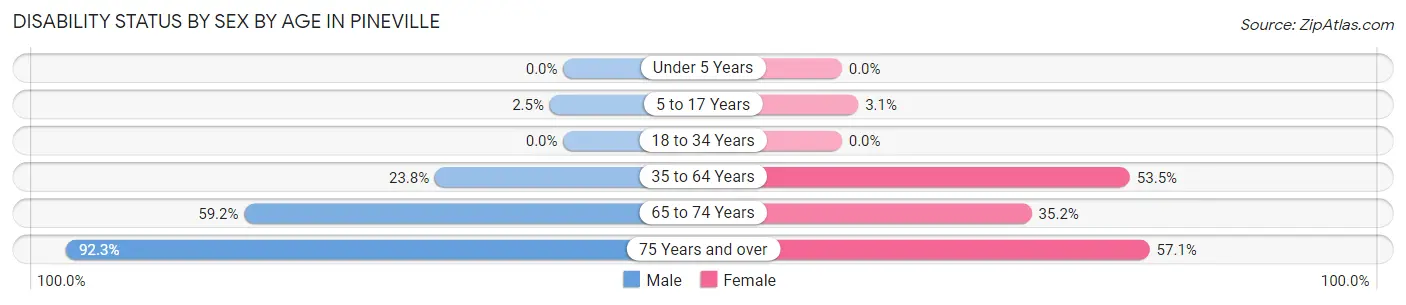
| Age Bracket | Male | Female |
| Under 5 Years | 0 (0.0%) | 0 (0.0%) |
| 5 to 17 Years | 3 (2.5%) | 5 (3.0%) |
| 18 to 34 Years | 0 (0.0%) | 0 (0.0%) |
| 35 to 64 Years | 90 (23.8%) | 169 (53.5%) |
| 65 to 74 Years | 61 (59.2%) | 37 (35.2%) |
| 75 Years and over | 12 (92.3%) | 36 (57.1%) |
Disability Class by Sex by Age in Pineville
Disability Class: Hearing Difficulty
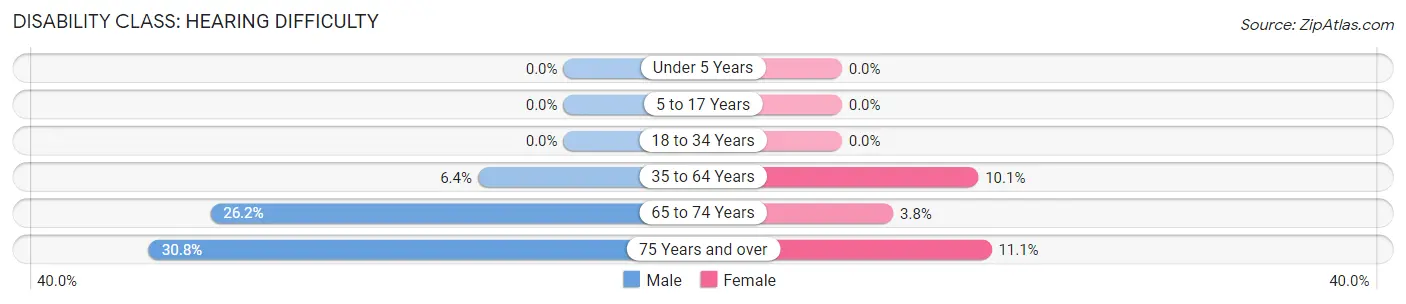
| Age Bracket | Male | Female |
| Under 5 Years | 0 (0.0%) | 0 (0.0%) |
| 5 to 17 Years | 0 (0.0%) | 0 (0.0%) |
| 18 to 34 Years | 0 (0.0%) | 0 (0.0%) |
| 35 to 64 Years | 24 (6.4%) | 32 (10.1%) |
| 65 to 74 Years | 27 (26.2%) | 4 (3.8%) |
| 75 Years and over | 4 (30.8%) | 7 (11.1%) |
Disability Class: Vision Difficulty
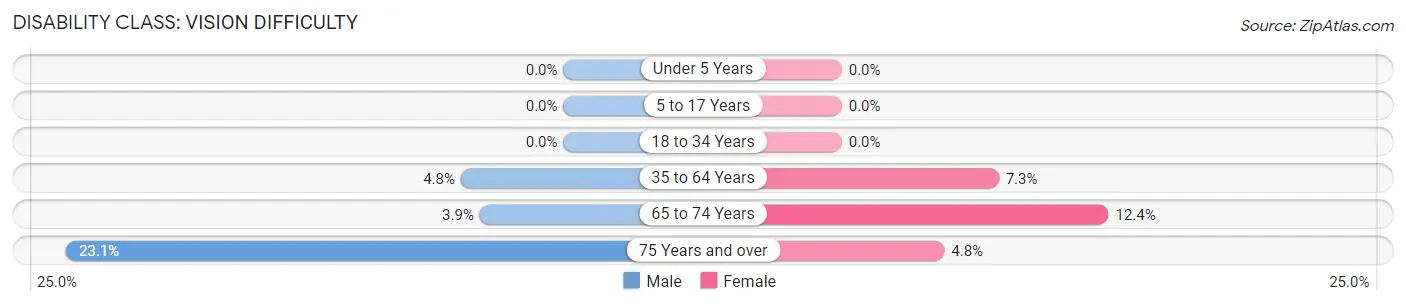
| Age Bracket | Male | Female |
| Under 5 Years | 0 (0.0%) | 0 (0.0%) |
| 5 to 17 Years | 0 (0.0%) | 0 (0.0%) |
| 18 to 34 Years | 0 (0.0%) | 0 (0.0%) |
| 35 to 64 Years | 18 (4.8%) | 23 (7.3%) |
| 65 to 74 Years | 4 (3.9%) | 13 (12.4%) |
| 75 Years and over | 3 (23.1%) | 3 (4.8%) |
Disability Class: Cognitive Difficulty
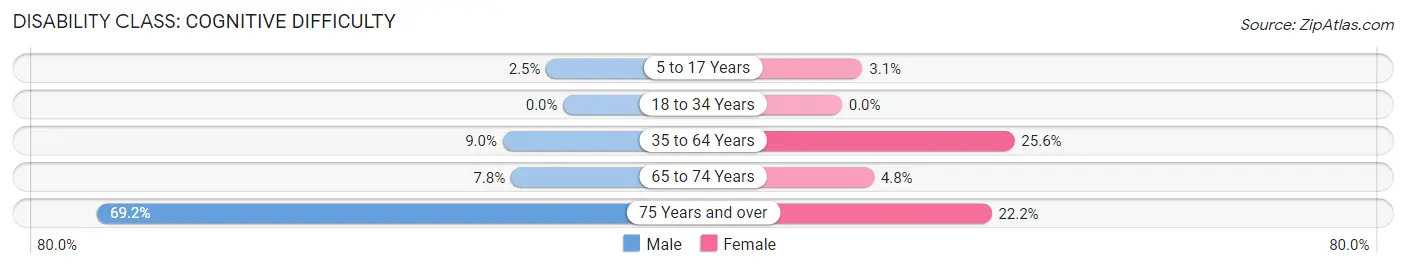
| Age Bracket | Male | Female |
| 5 to 17 Years | 3 (2.5%) | 5 (3.0%) |
| 18 to 34 Years | 0 (0.0%) | 0 (0.0%) |
| 35 to 64 Years | 34 (9.0%) | 81 (25.6%) |
| 65 to 74 Years | 8 (7.8%) | 5 (4.8%) |
| 75 Years and over | 9 (69.2%) | 14 (22.2%) |
Disability Class: Ambulatory Difficulty
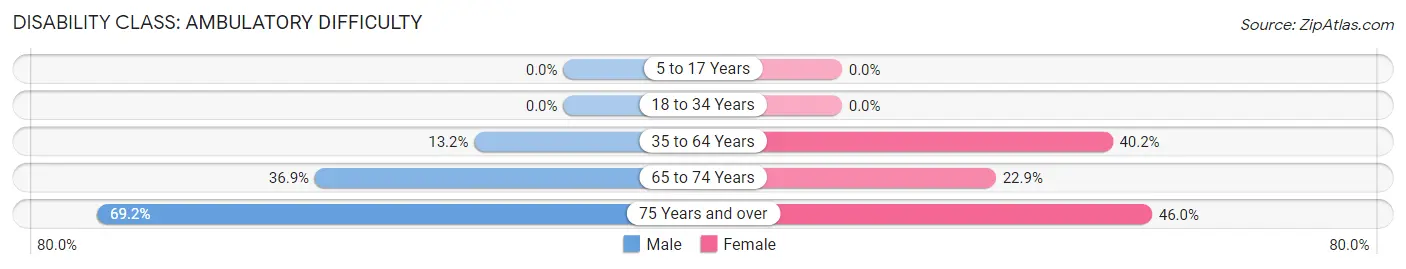
| Age Bracket | Male | Female |
| 5 to 17 Years | 0 (0.0%) | 0 (0.0%) |
| 18 to 34 Years | 0 (0.0%) | 0 (0.0%) |
| 35 to 64 Years | 50 (13.2%) | 127 (40.2%) |
| 65 to 74 Years | 38 (36.9%) | 24 (22.9%) |
| 75 Years and over | 9 (69.2%) | 29 (46.0%) |
Disability Class: Self-Care Difficulty
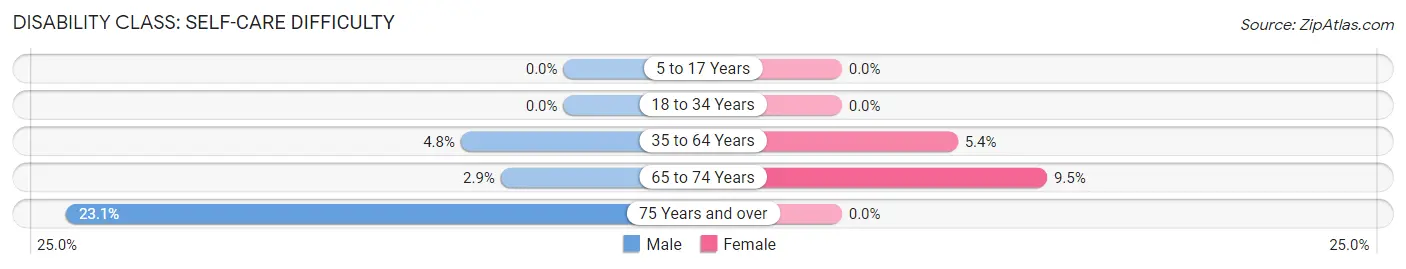
| Age Bracket | Male | Female |
| 5 to 17 Years | 0 (0.0%) | 0 (0.0%) |
| 18 to 34 Years | 0 (0.0%) | 0 (0.0%) |
| 35 to 64 Years | 18 (4.8%) | 17 (5.4%) |
| 65 to 74 Years | 3 (2.9%) | 10 (9.5%) |
| 75 Years and over | 3 (23.1%) | 0 (0.0%) |
Technology Access in Pineville
Computing Device Access in Pineville
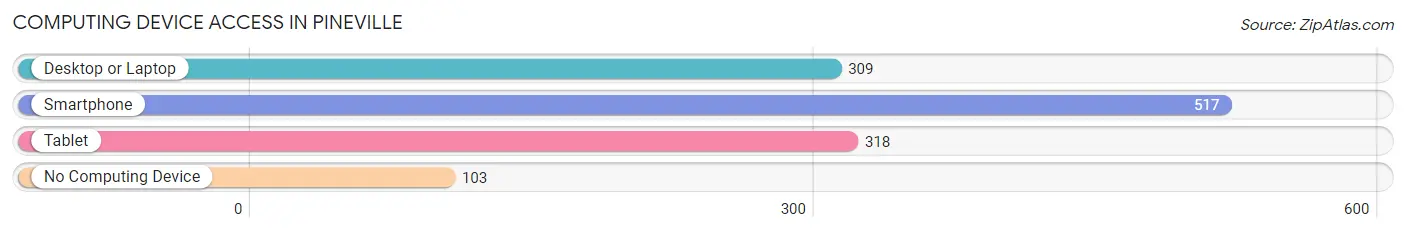
| Device Type | # Households | % Households |
| Desktop or Laptop | 309 | 44.9% |
| Smartphone | 517 | 75.1% |
| Tablet | 318 | 46.2% |
| No Computing Device | 103 | 15.0% |
| Total | 688 | 100.0% |
Internet Access in Pineville
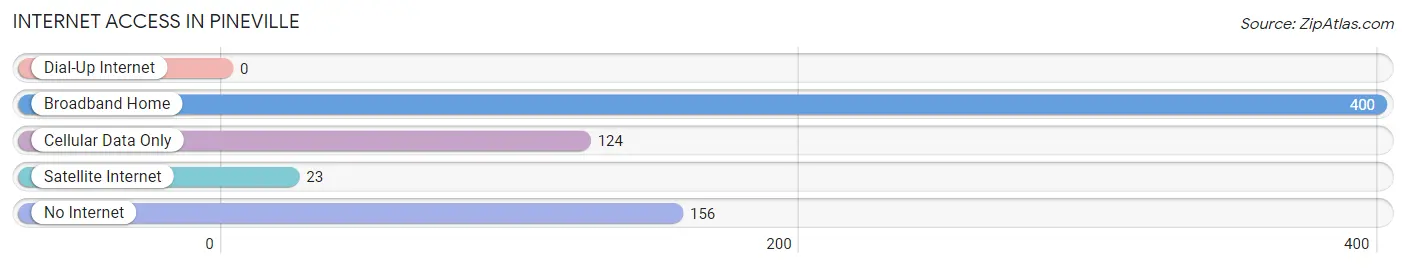
| Internet Type | # Households | % Households |
| Dial-Up Internet | 0 | 0.0% |
| Broadband Home | 400 | 58.1% |
| Cellular Data Only | 124 | 18.0% |
| Satellite Internet | 23 | 3.3% |
| No Internet | 156 | 22.7% |
| Total | 688 | 100.0% |
Pineville Summary
Pineville is a small city located in Bell County, Kentucky, United States. It is the county seat of Bell County and is situated in the Appalachian Mountains. The city has a population of approximately 2,000 people and is located in the Cumberland Plateau region of the state.
History
Pineville was founded in 1820 by a group of settlers from Virginia. The city was named after the abundance of pine trees in the area. The city was incorporated in 1845 and was the first county seat of Bell County. The city was a major center for the coal mining industry in the late 19th and early 20th centuries. The city was also home to a large number of lumber mills and other industries.
Geography
Pineville is located in the Appalachian Mountains in the Cumberland Plateau region of Kentucky. The city is situated at an elevation of 1,000 feet above sea level. The city is located in the Pine Mountain Valley and is surrounded by the Cumberland Mountains to the east and the Pine Mountain Range to the west. The city is located near the junction of the Cumberland River and the Clear Fork of the Cumberland River.
Climate
Pineville has a humid subtropical climate with hot, humid summers and mild winters. The average annual temperature is around 60°F and the average annual precipitation is around 45 inches. The city experiences occasional snowfall in the winter months.
Economy
Pineville’s economy is largely based on the coal mining industry. The city is home to several coal mines and is a major center for the coal industry in the region. The city is also home to several lumber mills and other industries. The city is also home to several retail stores and restaurants.
Demographics
As of the 2010 census, the population of Pineville was 2,000. The racial makeup of the city was 97.2% White, 0.7% African American, 0.3% Native American, 0.2% Asian, 0.1% Pacific Islander, and 1.5% from other races. The median household income was $25,000 and the median family income was $30,000. The per capita income was $14,000.
Conclusion
Pineville is a small city located in Bell County, Kentucky. The city has a population of approximately 2,000 people and is situated in the Appalachian Mountains. The city was founded in 1820 and was a major center for the coal mining industry in the late 19th and early 20th centuries. The city’s economy is largely based on the coal mining industry and is also home to several lumber mills and other industries. The city has a humid subtropical climate with hot, humid summers and mild winters. The population of Pineville is predominantly White and the median household income is $25,000.
Common Questions
What is Per Capita Income in Pineville?
Per Capita income in Pineville is $21,578.
What is the Median Family Income in Pineville?
Median Family Income in Pineville is $58,125.
What is the Median Household income in Pineville?
Median Household Income in Pineville is $27,159.
What is Income or Wage Gap in Pineville?
Income or Wage Gap in Pineville is 28.7%.
Women in Pineville earn 71.3 cents for every dollar earned by a man.
What is Family Income Deficit in Pineville?
Family Income Deficit in Pineville is $13,105.
Families that are below poverty line in Pineville earn $13,105 less on average than the poverty threshold level.
What is Inequality or Gini Index in Pineville?
Inequality or Gini Index in Pineville is 0.57.
What is the Total Population of Pineville?
Total Population of Pineville is 1,796.
What is the Total Male Population of Pineville?
Total Male Population of Pineville is 919.
What is the Total Female Population of Pineville?
Total Female Population of Pineville is 877.
What is the Ratio of Males per 100 Females in Pineville?
There are 104.79 Males per 100 Females in Pineville.
What is the Ratio of Females per 100 Males in Pineville?
There are 95.43 Females per 100 Males in Pineville.
What is the Median Population Age in Pineville?
Median Population Age in Pineville is 39.6 Years.
What is the Average Family Size in Pineville
Average Family Size in Pineville is 3.3 People.
What is the Average Household Size in Pineville
Average Household Size in Pineville is 2.4 People.
How Large is the Labor Force in Pineville?
There are 572 People in the Labor Forcein in Pineville.
What is the Percentage of People in the Labor Force in Pineville?
39.2% of People are in the Labor Force in Pineville.
What is the Unemployment Rate in Pineville?
Unemployment Rate in Pineville is 11.7%.