Hazard, KY Map & Demographics
Hazard Map
Hazard Overview
$43,539
PER CAPITA INCOME
$65,165
AVG FAMILY INCOME
$65,846
AVG HOUSEHOLD INCOME
26.8%
WAGE / INCOME GAP [ % ]
73.2¢/ $1
WAGE / INCOME GAP [ $ ]
0.66
INEQUALITY / GINI INDEX
5,194
TOTAL POPULATION
2,582
MALE POPULATION
2,612
FEMALE POPULATION
98.85
MALES / 100 FEMALES
101.16
FEMALES / 100 MALES
40.3
MEDIAN AGE
2.8
AVG FAMILY SIZE
2.5
AVG HOUSEHOLD SIZE
1,915
LABOR FORCE [ PEOPLE ]
47.3%
PERCENT IN LABOR FORCE
11.2%
UNEMPLOYMENT RATE
Hazard Zip Codes
Hazard Area Codes
Income in Hazard
Income Overview in Hazard
Per Capita Income in Hazard is $43,539, while median incomes of families and households are $65,165 and $65,846 respectively.
| Characteristic | Number | Measure |
| Per Capita Income | 5,194 | $43,539 |
| Median Family Income | 1,297 | $65,165 |
| Mean Family Income | 1,297 | $71,844 |
| Median Household Income | 1,868 | $65,846 |
| Mean Household Income | 1,868 | $121,181 |
| Income Deficit | 1,297 | $0 |
| Wage / Income Gap (%) | 5,194 | 26.81% |
| Wage / Income Gap ($) | 5,194 | 73.19¢ per $1 |
| Gini / Inequality Index | 5,194 | 0.66 |
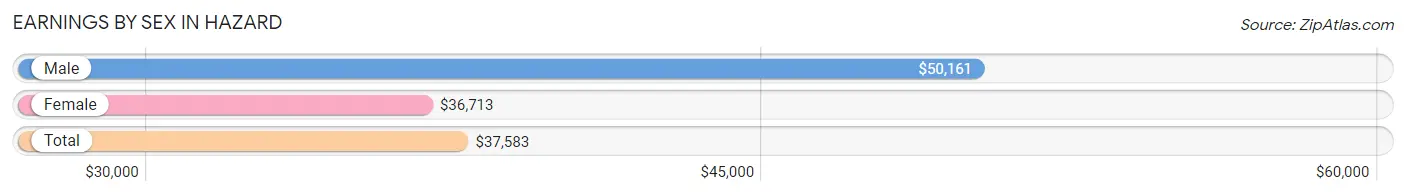
Earnings by Sex in Hazard
Average Earnings in Hazard are $37,583, $50,161 for men and $36,713 for women, a difference of 26.8%.
| Sex | Number | Average Earnings |
| Male | 790 (38.6%) | $50,161 |
| Female | 1,259 (61.4%) | $36,713 |
| Total | 2,049 (100.0%) | $37,583 |
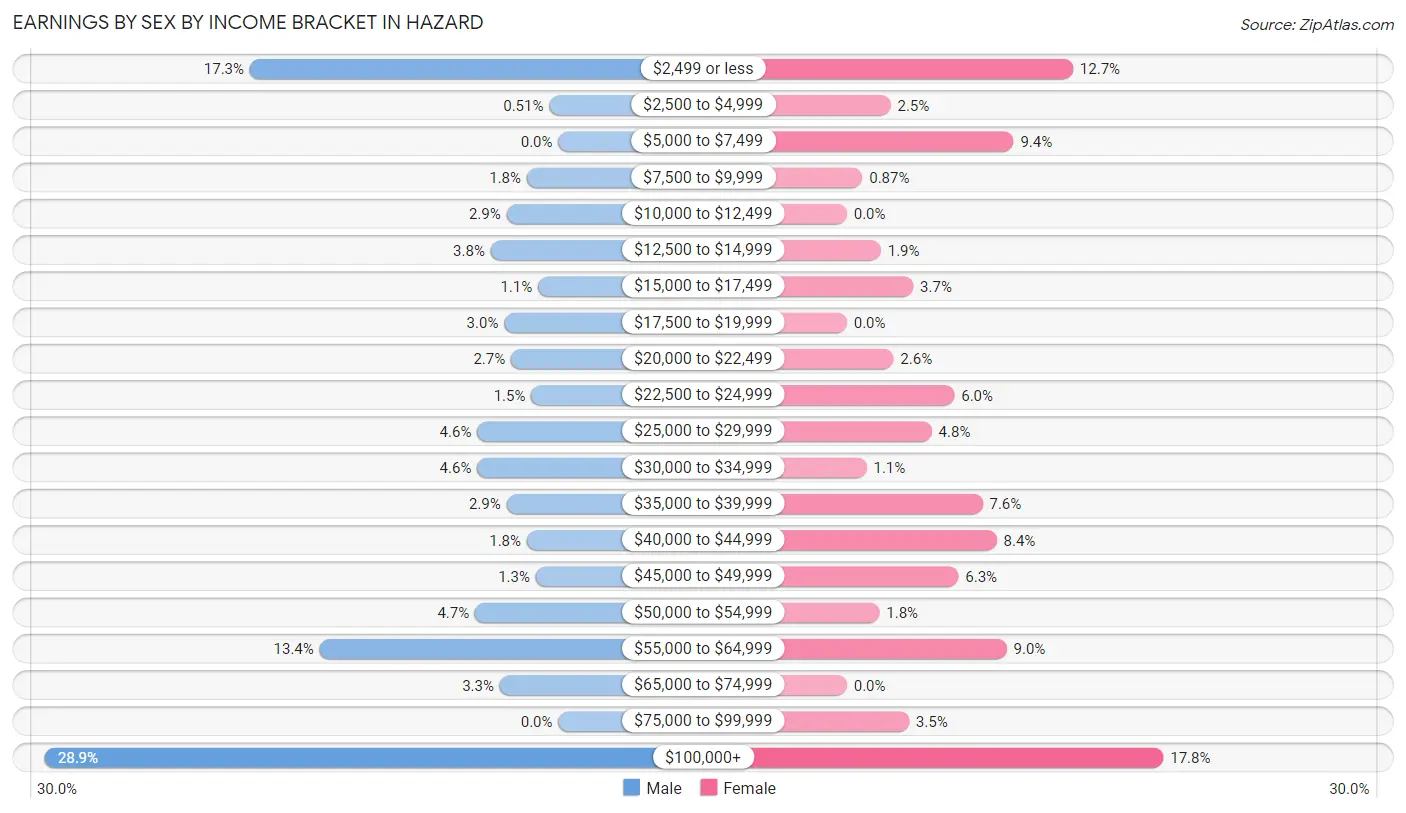
Earnings by Sex by Income Bracket in Hazard
The most common earnings brackets in Hazard are $100,000+ for men (228 | 28.9%) and $100,000+ for women (224 | 17.8%).
| Income | Male | Female |
| $2,499 or less | 137 (17.3%) | 160 (12.7%) |
| $2,500 to $4,999 | 4 (0.5%) | 31 (2.5%) |
| $5,000 to $7,499 | 0 (0.0%) | 118 (9.4%) |
| $7,500 to $9,999 | 14 (1.8%) | 11 (0.9%) |
| $10,000 to $12,499 | 23 (2.9%) | 0 (0.0%) |
| $12,500 to $14,999 | 30 (3.8%) | 24 (1.9%) |
| $15,000 to $17,499 | 9 (1.1%) | 47 (3.7%) |
| $17,500 to $19,999 | 24 (3.0%) | 0 (0.0%) |
| $20,000 to $22,499 | 21 (2.7%) | 33 (2.6%) |
| $22,500 to $24,999 | 12 (1.5%) | 76 (6.0%) |
| $25,000 to $29,999 | 36 (4.6%) | 60 (4.8%) |
| $30,000 to $34,999 | 36 (4.6%) | 14 (1.1%) |
| $35,000 to $39,999 | 23 (2.9%) | 96 (7.6%) |
| $40,000 to $44,999 | 14 (1.8%) | 106 (8.4%) |
| $45,000 to $49,999 | 10 (1.3%) | 79 (6.3%) |
| $50,000 to $54,999 | 37 (4.7%) | 23 (1.8%) |
| $55,000 to $64,999 | 106 (13.4%) | 113 (9.0%) |
| $65,000 to $74,999 | 26 (3.3%) | 0 (0.0%) |
| $75,000 to $99,999 | 0 (0.0%) | 44 (3.5%) |
| $100,000+ | 228 (28.9%) | 224 (17.8%) |
| Total | 790 (100.0%) | 1,259 (100.0%) |
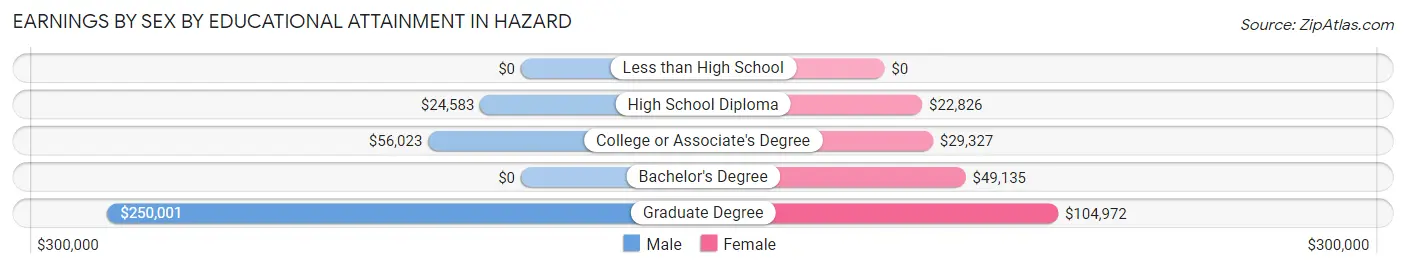
Earnings by Sex by Educational Attainment in Hazard
Average earnings in Hazard are $51,290 for men and $41,000 for women, a difference of 20.1%. Men with an educational attainment of graduate degree enjoy the highest average annual earnings of $250,001, while those with high school diploma education earn the least with $24,583. Women with an educational attainment of graduate degree earn the most with the average annual earnings of $104,972, while those with high school diploma education have the smallest earnings of $22,826.
| Educational Attainment | Male Income | Female Income |
| Less than High School | - | - |
| High School Diploma | $24,583 | $22,826 |
| College or Associate's Degree | $56,023 | $29,327 |
| Bachelor's Degree | - | - |
| Graduate Degree | $250,001 | $104,972 |
| Total | $51,290 | $41,000 |
Family Income in Hazard
Family Income Brackets in Hazard
According to the Hazard family income data, there are 272 families falling into the less than $10,000 income range, which is the most common income bracket and makes up 21.0% of all families. Conversely, the $200,000+ income bracket is the least frequent group with only 16 families (1.2%) belonging to this category.
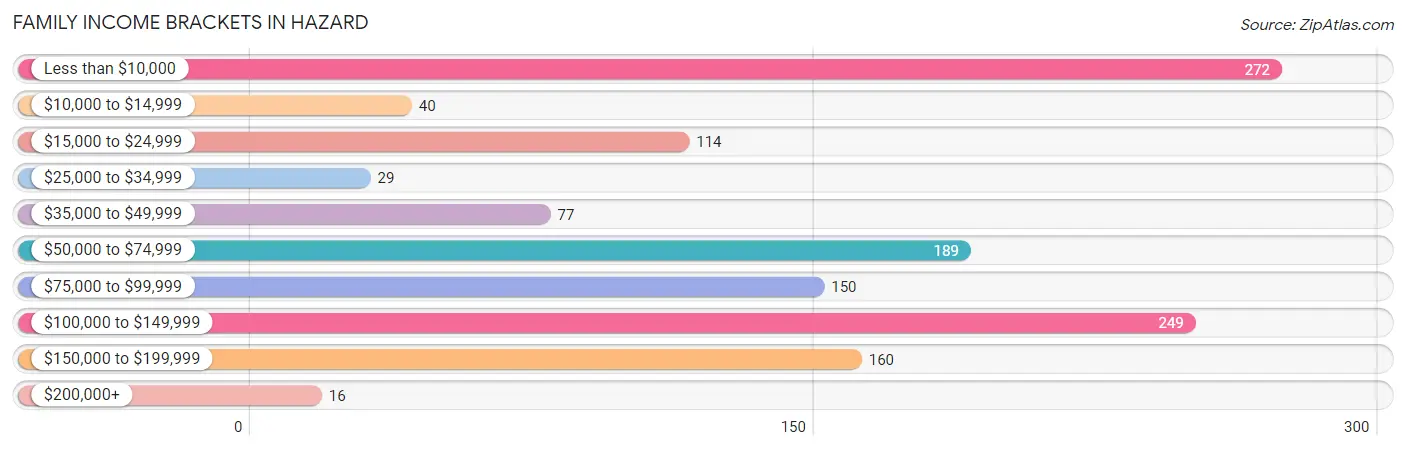
| Income Bracket | # Families | % Families |
| Less than $10,000 | 272 | 21.0% |
| $10,000 to $14,999 | 40 | 3.1% |
| $15,000 to $24,999 | 114 | 8.8% |
| $25,000 to $34,999 | 29 | 2.2% |
| $35,000 to $49,999 | 77 | 5.9% |
| $50,000 to $74,999 | 189 | 14.6% |
| $75,000 to $99,999 | 150 | 11.6% |
| $100,000 to $149,999 | 249 | 19.2% |
| $150,000 to $199,999 | 160 | 12.3% |
| $200,000+ | 16 | 1.2% |
Family Income by Famaliy Size in Hazard
5-person families (84 | 6.5%) account for the highest median family income in Hazard with $143,125 per family, while 3-person families (475 | 36.6%) have the highest median income of $30,025 per family member.
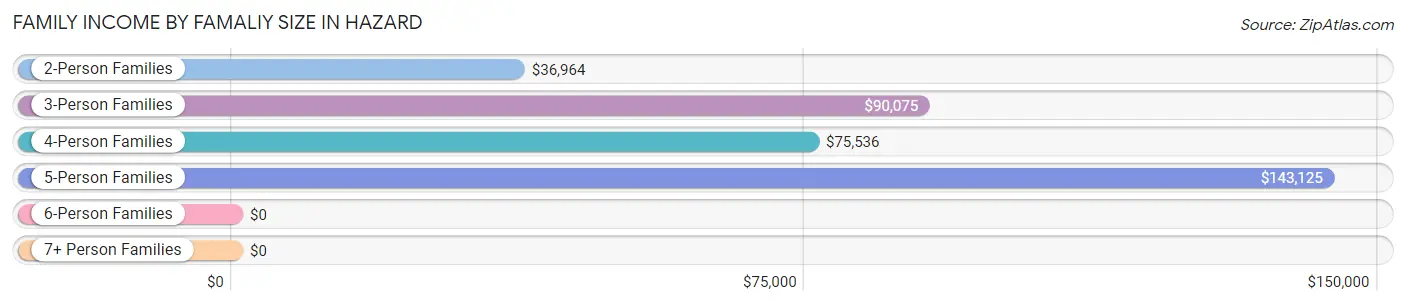
| Income Bracket | # Families | Median Income |
| 2-Person Families | 521 (40.2%) | $36,964 |
| 3-Person Families | 475 (36.6%) | $90,075 |
| 4-Person Families | 190 (14.6%) | $75,536 |
| 5-Person Families | 84 (6.5%) | $143,125 |
| 6-Person Families | 3 (0.2%) | $0 |
| 7+ Person Families | 24 (1.8%) | $0 |
| Total | 1,297 (100.0%) | $65,165 |
Family Income by Number of Earners in Hazard
The median family income in Hazard is $65,165, with families comprising 3+ earners (117) having the highest median family income of $123,909, while families with no earners (256) have the lowest median family income of $19,750, accounting for 9.0% and 19.7% of families, respectively.
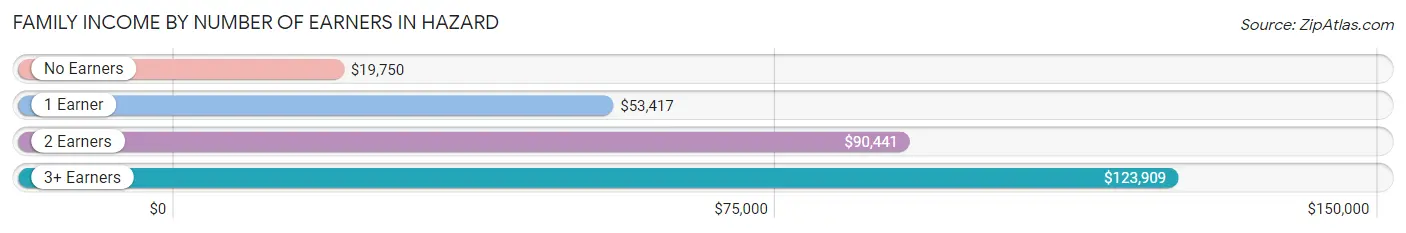
| Number of Earners | # Families | Median Income |
| No Earners | 256 (19.7%) | $19,750 |
| 1 Earner | 574 (44.3%) | $53,417 |
| 2 Earners | 350 (27.0%) | $90,441 |
| 3+ Earners | 117 (9.0%) | $123,909 |
| Total | 1,297 (100.0%) | $65,165 |
Household Income in Hazard
Household Income Brackets in Hazard
With 312 households falling in the category, the $50,000 to $74,999 income range is the most frequent in Hazard, accounting for 16.7% of all households. In contrast, only 86 households (4.6%) fall into the $35,000 to $49,999 income bracket, making it the least populous group.
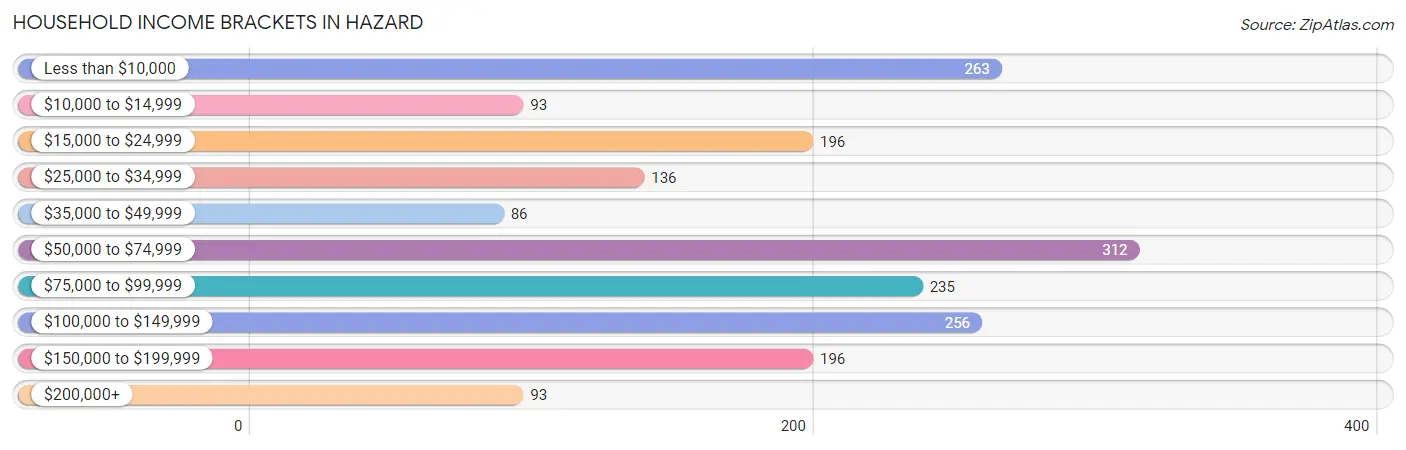
| Income Bracket | # Households | % Households |
| Less than $10,000 | 263 | 14.1% |
| $10,000 to $14,999 | 93 | 5.0% |
| $15,000 to $24,999 | 196 | 10.5% |
| $25,000 to $34,999 | 136 | 7.3% |
| $35,000 to $49,999 | 86 | 4.6% |
| $50,000 to $74,999 | 312 | 16.7% |
| $75,000 to $99,999 | 235 | 12.6% |
| $100,000 to $149,999 | 256 | 13.7% |
| $150,000 to $199,999 | 196 | 10.5% |
| $200,000+ | 93 | 5.0% |
Household Income by Householder Age in Hazard
The median household income in Hazard is $65,846, with the highest median household income of $76,042 found in the 45 to 64 years age bracket for the primary householder. A total of 773 households (41.4%) fall into this category. Meanwhile, the 15 to 24 years age bracket for the primary householder has the lowest median household income of $0, with 70 households (3.7%) in this group.
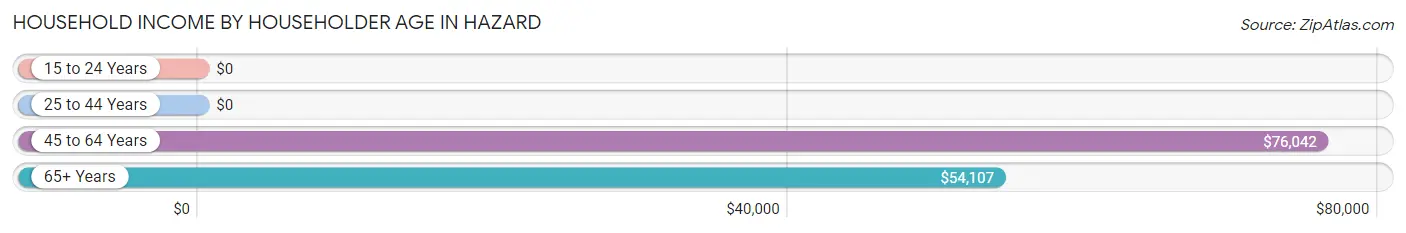
| Income Bracket | # Households | Median Income |
| 15 to 24 Years | 70 (3.7%) | $0 |
| 25 to 44 Years | 702 (37.6%) | $0 |
| 45 to 64 Years | 773 (41.4%) | $76,042 |
| 65+ Years | 323 (17.3%) | $54,107 |
| Total | 1,868 (100.0%) | $65,846 |
Poverty in Hazard
Income Below Poverty by Sex and Age in Hazard
With 25.1% poverty level for males and 33.9% for females among the residents of Hazard, 16 and 17 year old males and 15 year old females are the most vulnerable to poverty, with 68 males (53.1%) and 38 females (100.0%) in their respective age groups living below the poverty level.
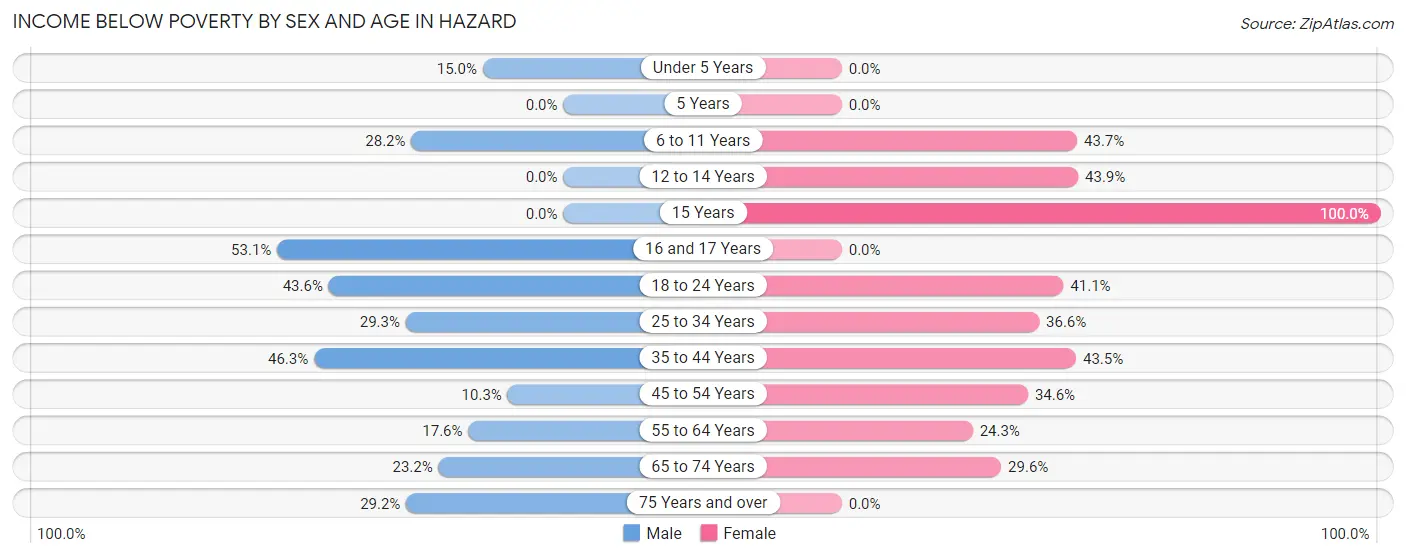
| Age Bracket | Male | Female |
| Under 5 Years | 32 (14.9%) | 0 (0.0%) |
| 5 Years | 0 (0.0%) | 0 (0.0%) |
| 6 to 11 Years | 101 (28.2%) | 76 (43.7%) |
| 12 to 14 Years | 0 (0.0%) | 50 (43.9%) |
| 15 Years | 0 (0.0%) | 38 (100.0%) |
| 16 and 17 Years | 68 (53.1%) | 0 (0.0%) |
| 18 to 24 Years | 27 (43.5%) | 109 (41.1%) |
| 25 to 34 Years | 62 (29.2%) | 119 (36.6%) |
| 35 to 44 Years | 124 (46.3%) | 150 (43.5%) |
| 45 to 54 Years | 42 (10.3%) | 132 (34.5%) |
| 55 to 64 Years | 49 (17.6%) | 78 (24.3%) |
| 65 to 74 Years | 38 (23.2%) | 63 (29.6%) |
| 75 Years and over | 14 (29.2%) | 0 (0.0%) |
| Total | 557 (25.1%) | 815 (33.9%) |
Income Above Poverty by Sex and Age in Hazard
According to the poverty statistics in Hazard, males aged 12 to 14 years and females aged under 5 years are the age groups that are most secure financially, with 100.0% of males and 100.0% of females in these age groups living above the poverty line.
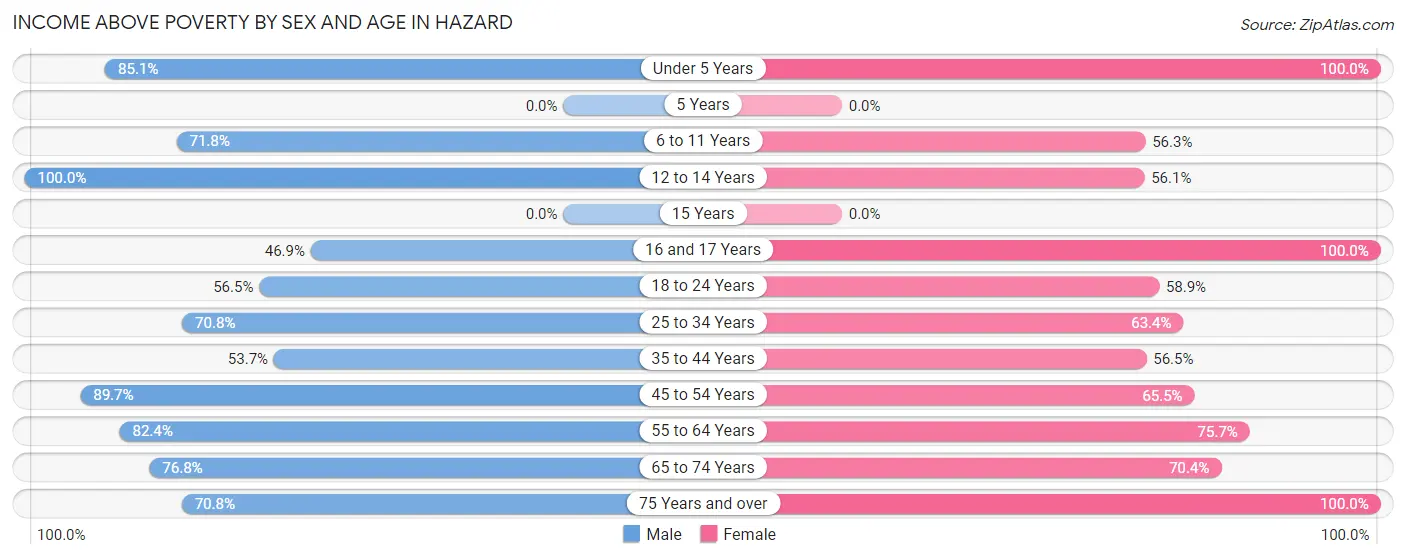
| Age Bracket | Male | Female |
| Under 5 Years | 182 (85.1%) | 145 (100.0%) |
| 5 Years | 0 (0.0%) | 0 (0.0%) |
| 6 to 11 Years | 257 (71.8%) | 98 (56.3%) |
| 12 to 14 Years | 78 (100.0%) | 64 (56.1%) |
| 15 Years | 0 (0.0%) | 0 (0.0%) |
| 16 and 17 Years | 60 (46.9%) | 10 (100.0%) |
| 18 to 24 Years | 35 (56.5%) | 156 (58.9%) |
| 25 to 34 Years | 150 (70.8%) | 206 (63.4%) |
| 35 to 44 Years | 144 (53.7%) | 195 (56.5%) |
| 45 to 54 Years | 364 (89.7%) | 250 (65.4%) |
| 55 to 64 Years | 229 (82.4%) | 243 (75.7%) |
| 65 to 74 Years | 126 (76.8%) | 150 (70.4%) |
| 75 Years and over | 34 (70.8%) | 75 (100.0%) |
| Total | 1,659 (74.9%) | 1,592 (66.1%) |
Income Below Poverty Among Married-Couple Families in Hazard
The poverty statistics for married-couple families in Hazard show that 9.4% or 67 of the total 710 families live below the poverty line. Families with no children have the highest poverty rate of 13.6%, comprising of 67 families. On the other hand, families with 1 or 2 children have the lowest poverty rate of 0.0%, which includes 0 families.
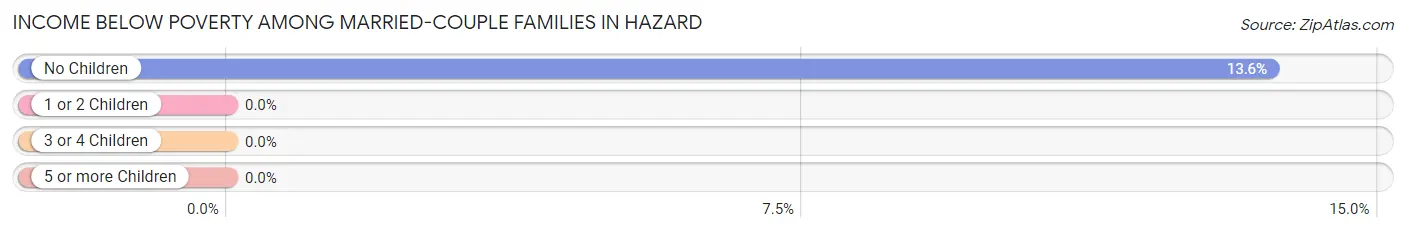
| Children | Above Poverty | Below Poverty |
| No Children | 426 (86.4%) | 67 (13.6%) |
| 1 or 2 Children | 153 (100.0%) | 0 (0.0%) |
| 3 or 4 Children | 64 (100.0%) | 0 (0.0%) |
| 5 or more Children | 0 (0.0%) | 0 (0.0%) |
| Total | 643 (90.6%) | 67 (9.4%) |
Income Below Poverty Among Single-Parent Households in Hazard
According to the poverty data in Hazard, 49.6% or 70 single-father households and 61.4% or 274 single-mother households are living below the poverty line. Among single-father households, those with 1 or 2 children have the highest poverty rate, with 70 households (57.9%) experiencing poverty. Likewise, among single-mother households, those with 5 or more children have the highest poverty rate, with 24 households (100.0%) falling below the poverty line.
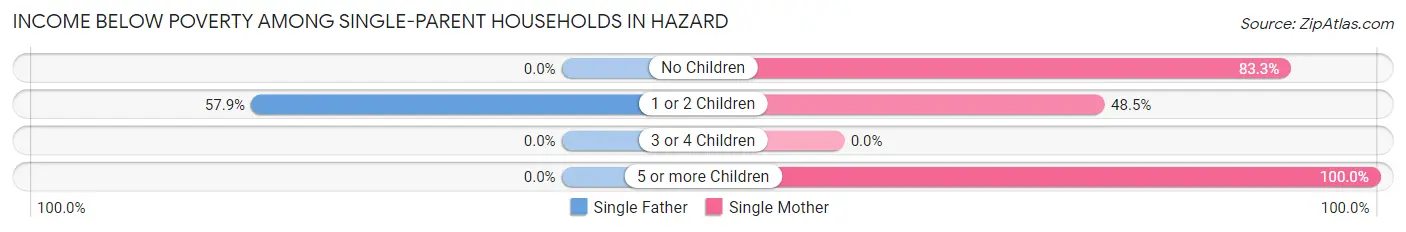
| Children | Single Father | Single Mother |
| No Children | 0 (0.0%) | 135 (83.3%) |
| 1 or 2 Children | 70 (57.9%) | 115 (48.5%) |
| 3 or 4 Children | 0 (0.0%) | 0 (0.0%) |
| 5 or more Children | 0 (0.0%) | 24 (100.0%) |
| Total | 70 (49.6%) | 274 (61.4%) |
Income Below Poverty Among Married-Couple vs Single-Parent Households in Hazard
The poverty data for Hazard shows that 67 of the married-couple family households (9.4%) and 344 of the single-parent households (58.6%) are living below the poverty level. Within the married-couple family households, those with no children have the highest poverty rate, with 67 households (13.6%) falling below the poverty line. Among the single-parent households, those with 5 or more children have the highest poverty rate, with 24 household (100.0%) living below poverty.
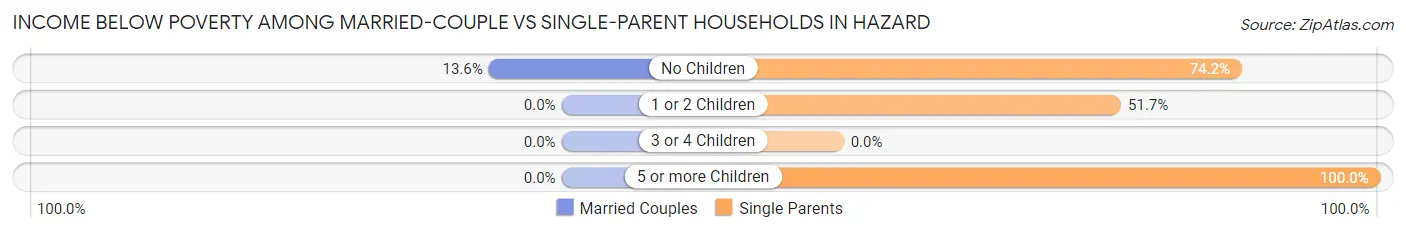
| Children | Married-Couple Families | Single-Parent Households |
| No Children | 67 (13.6%) | 135 (74.2%) |
| 1 or 2 Children | 0 (0.0%) | 185 (51.7%) |
| 3 or 4 Children | 0 (0.0%) | 0 (0.0%) |
| 5 or more Children | 0 (0.0%) | 24 (100.0%) |
| Total | 67 (9.4%) | 344 (58.6%) |
Race in Hazard
The most populous races in Hazard are White / Caucasian (4,672 | 89.9%), Two or more Races (231 | 4.4%), and Asian (184 | 3.5%).
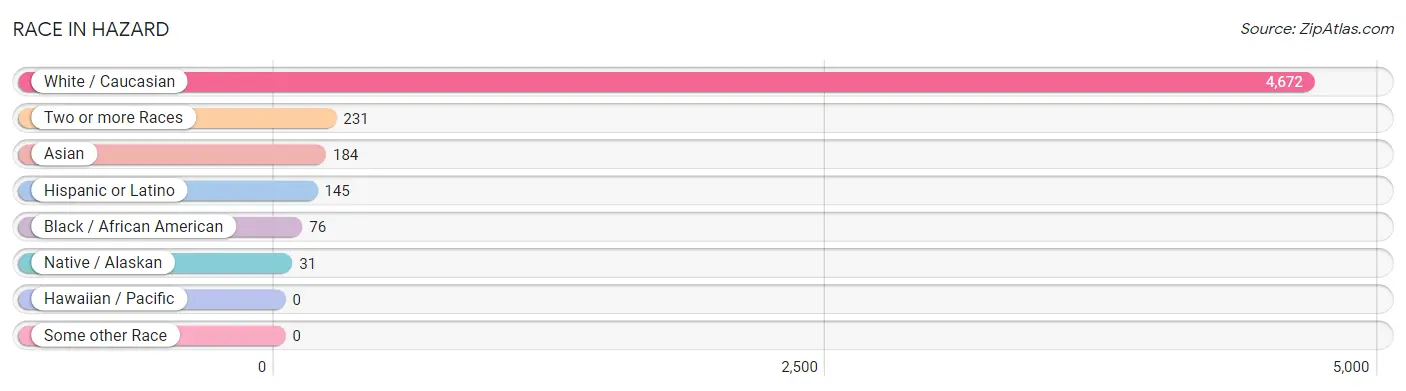
| Race | # Population | % Population |
| Asian | 184 | 3.5% |
| Black / African American | 76 | 1.5% |
| Hawaiian / Pacific | 0 | 0.0% |
| Hispanic or Latino | 145 | 2.8% |
| Native / Alaskan | 31 | 0.6% |
| White / Caucasian | 4,672 | 89.9% |
| Two or more Races | 231 | 4.4% |
| Some other Race | 0 | 0.0% |
| Total | 5,194 | 100.0% |
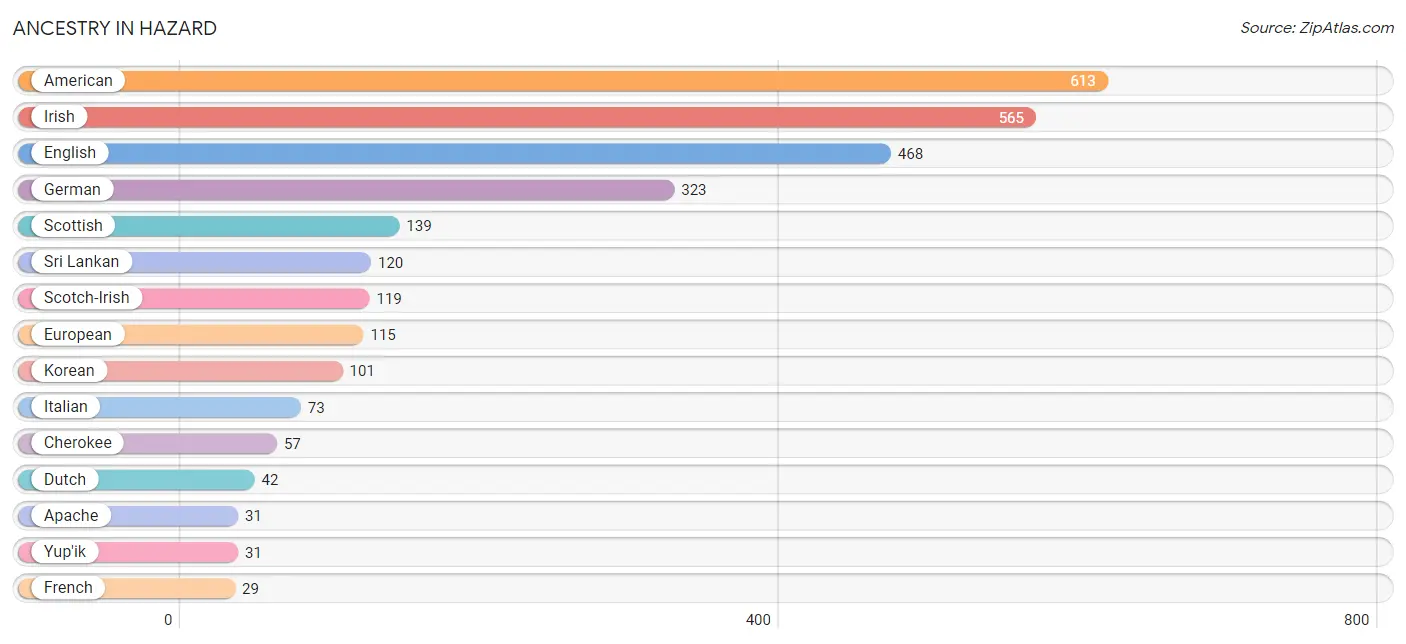
Ancestry in Hazard
The most populous ancestries reported in Hazard are American (613 | 11.8%), Irish (565 | 10.9%), English (468 | 9.0%), German (323 | 6.2%), and Scottish (139 | 2.7%), together accounting for 40.6% of all Hazard residents.
| Ancestry | # Population | % Population |
| American | 613 | 11.8% |
| Apache | 31 | 0.6% |
| Blackfeet | 6 | 0.1% |
| Cherokee | 57 | 1.1% |
| Crow | 6 | 0.1% |
| Dutch | 42 | 0.8% |
| English | 468 | 9.0% |
| European | 115 | 2.2% |
| French | 29 | 0.6% |
| German | 323 | 6.2% |
| Irish | 565 | 10.9% |
| Italian | 73 | 1.4% |
| Jamaican | 7 | 0.1% |
| Korean | 101 | 1.9% |
| Mexican | 5 | 0.1% |
| Norwegian | 6 | 0.1% |
| Polish | 22 | 0.4% |
| Puerto Rican | 28 | 0.5% |
| Scotch-Irish | 119 | 2.3% |
| Scottish | 139 | 2.7% |
| Sri Lankan | 120 | 2.3% |
| Yup'ik | 31 | 0.6% | View All 22 Rows |
Immigrants in Hazard
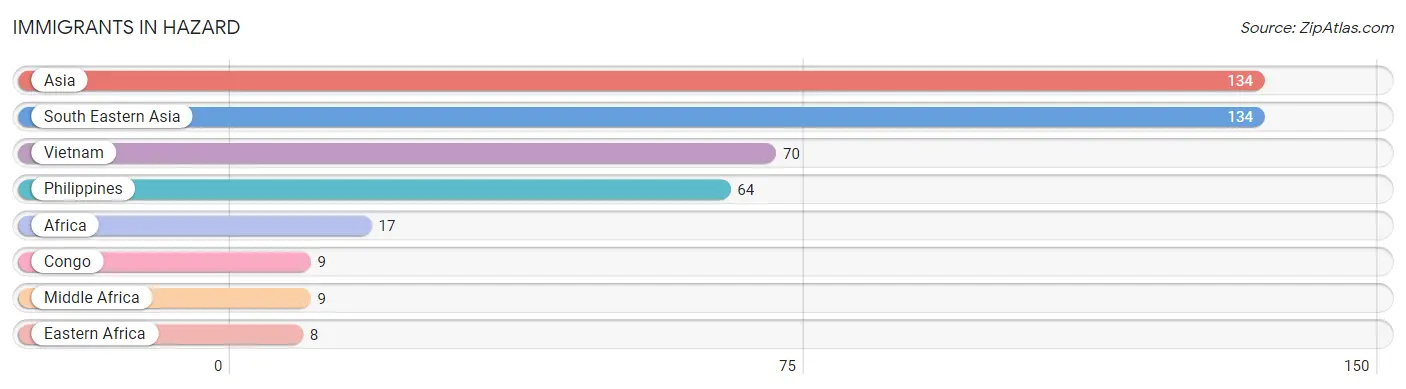
The most numerous immigrant groups reported in Hazard came from Asia (134 | 2.6%), South Eastern Asia (134 | 2.6%), Vietnam (70 | 1.3%), Philippines (64 | 1.2%), and Africa (17 | 0.3%), together accounting for 8.1% of all Hazard residents.
| Immigration Origin | # Population | % Population |
| Africa | 17 | 0.3% |
| Asia | 134 | 2.6% |
| Congo | 9 | 0.2% |
| Eastern Africa | 8 | 0.2% |
| Middle Africa | 9 | 0.2% |
| Philippines | 64 | 1.2% |
| South Eastern Asia | 134 | 2.6% |
| Vietnam | 70 | 1.3% | View All 8 Rows |
Sex and Age in Hazard
Sex and Age in Hazard
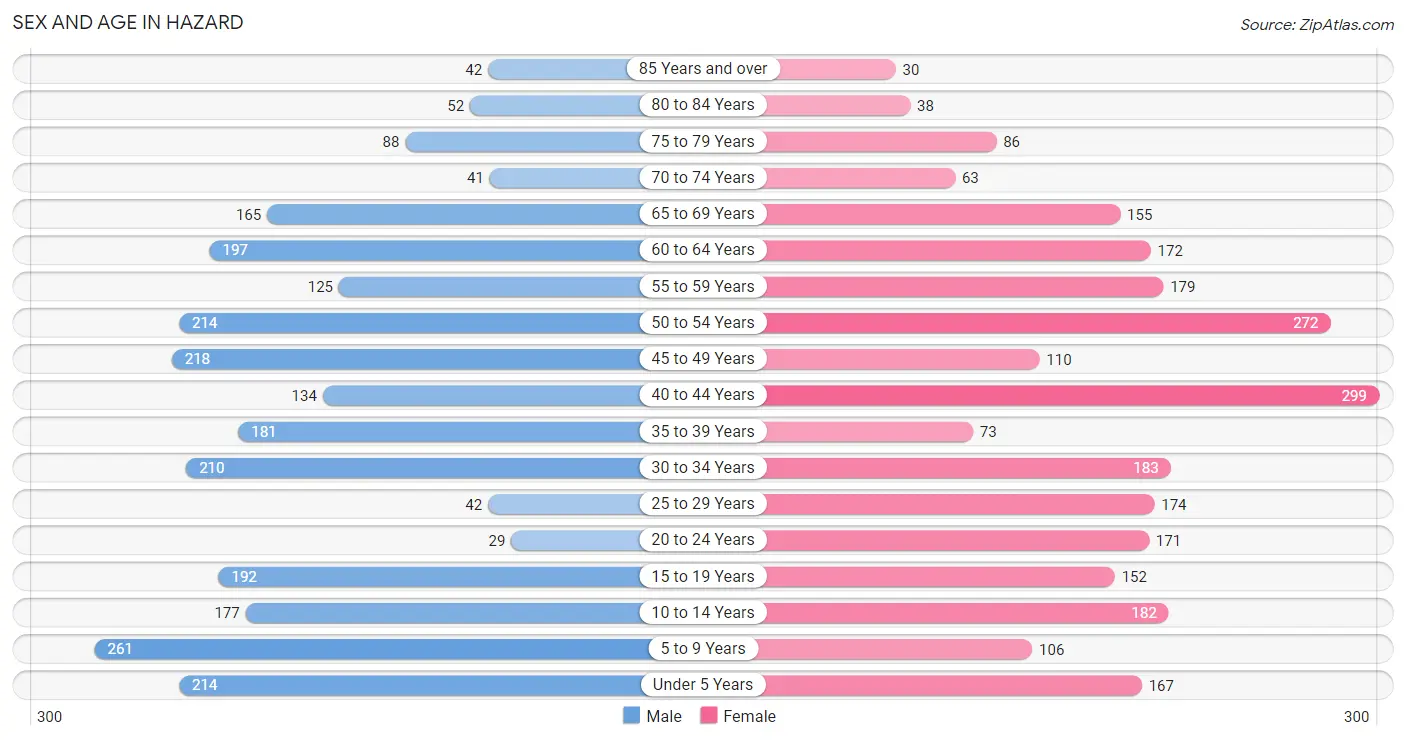
The most populous age groups in Hazard are 5 to 9 Years (261 | 10.1%) for men and 40 to 44 Years (299 | 11.5%) for women.
| Age Bracket | Male | Female |
| Under 5 Years | 214 (8.3%) | 167 (6.4%) |
| 5 to 9 Years | 261 (10.1%) | 106 (4.1%) |
| 10 to 14 Years | 177 (6.9%) | 182 (7.0%) |
| 15 to 19 Years | 192 (7.4%) | 152 (5.8%) |
| 20 to 24 Years | 29 (1.1%) | 171 (6.6%) |
| 25 to 29 Years | 42 (1.6%) | 174 (6.7%) |
| 30 to 34 Years | 210 (8.1%) | 183 (7.0%) |
| 35 to 39 Years | 181 (7.0%) | 73 (2.8%) |
| 40 to 44 Years | 134 (5.2%) | 299 (11.5%) |
| 45 to 49 Years | 218 (8.4%) | 110 (4.2%) |
| 50 to 54 Years | 214 (8.3%) | 272 (10.4%) |
| 55 to 59 Years | 125 (4.8%) | 179 (6.9%) |
| 60 to 64 Years | 197 (7.6%) | 172 (6.6%) |
| 65 to 69 Years | 165 (6.4%) | 155 (5.9%) |
| 70 to 74 Years | 41 (1.6%) | 63 (2.4%) |
| 75 to 79 Years | 88 (3.4%) | 86 (3.3%) |
| 80 to 84 Years | 52 (2.0%) | 38 (1.5%) |
| 85 Years and over | 42 (1.6%) | 30 (1.1%) |
| Total | 2,582 (100.0%) | 2,612 (100.0%) |
Families and Households in Hazard
Median Family Size in Hazard
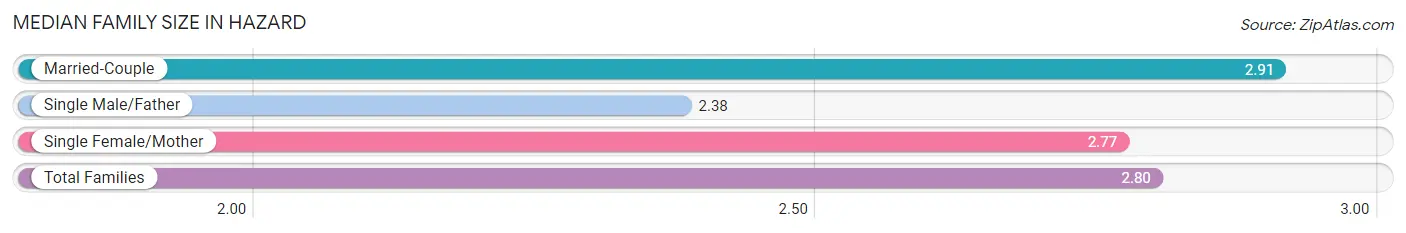
The median family size in Hazard is 2.80 persons per family, with married-couple families (710 | 54.7%) accounting for the largest median family size of 2.91 persons per family. On the other hand, single male/father families (141 | 10.9%) represent the smallest median family size with 2.38 persons per family.
| Family Type | # Families | Family Size |
| Married-Couple | 710 (54.7%) | 2.91 |
| Single Male/Father | 141 (10.9%) | 2.38 |
| Single Female/Mother | 446 (34.4%) | 2.77 |
| Total Families | 1,297 (100.0%) | 2.80 |
Median Household Size in Hazard
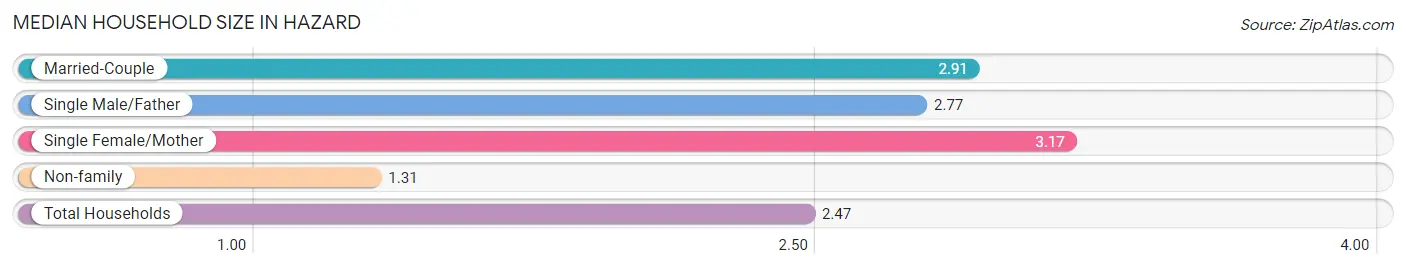
The median household size in Hazard is 2.47 persons per household, with single female/mother households (446 | 23.9%) accounting for the largest median household size of 3.17 persons per household. non-family households (571 | 30.6%) represent the smallest median household size with 1.31 persons per household.
| Household Type | # Households | Household Size |
| Married-Couple | 710 (38.0%) | 2.91 |
| Single Male/Father | 141 (7.5%) | 2.77 |
| Single Female/Mother | 446 (23.9%) | 3.17 |
| Non-family | 571 (30.6%) | 1.31 |
| Total Households | 1,868 (100.0%) | 2.47 |
Household Size by Marriage Status in Hazard
Out of a total of 1,868 households in Hazard, 1,297 (69.4%) are family households, while 571 (30.6%) are nonfamily households. The most numerous type of family households are 2-person households, comprising 461, and the most common type of nonfamily households are 1-person households, comprising 383.
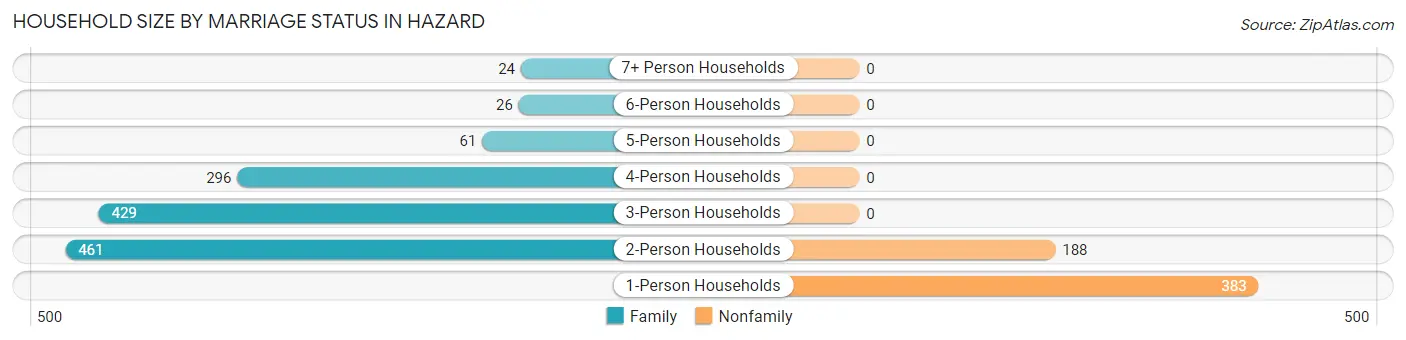
| Household Size | Family Households | Nonfamily Households |
| 1-Person Households | - | 383 (20.5%) |
| 2-Person Households | 461 (24.7%) | 188 (10.1%) |
| 3-Person Households | 429 (23.0%) | 0 (0.0%) |
| 4-Person Households | 296 (15.9%) | 0 (0.0%) |
| 5-Person Households | 61 (3.3%) | 0 (0.0%) |
| 6-Person Households | 26 (1.4%) | 0 (0.0%) |
| 7+ Person Households | 24 (1.3%) | 0 (0.0%) |
| Total | 1,297 (69.4%) | 571 (30.6%) |
Female Fertility in Hazard
Fertility by Age in Hazard
Average fertility rate in Hazard is 66.0 births per 1,000 women. Women in the age bracket of 20 to 34 years have the highest fertility rate with 144.0 births per 1,000 women. Women in the age bracket of 20 to 34 years acount for 96.2% of all women with births.
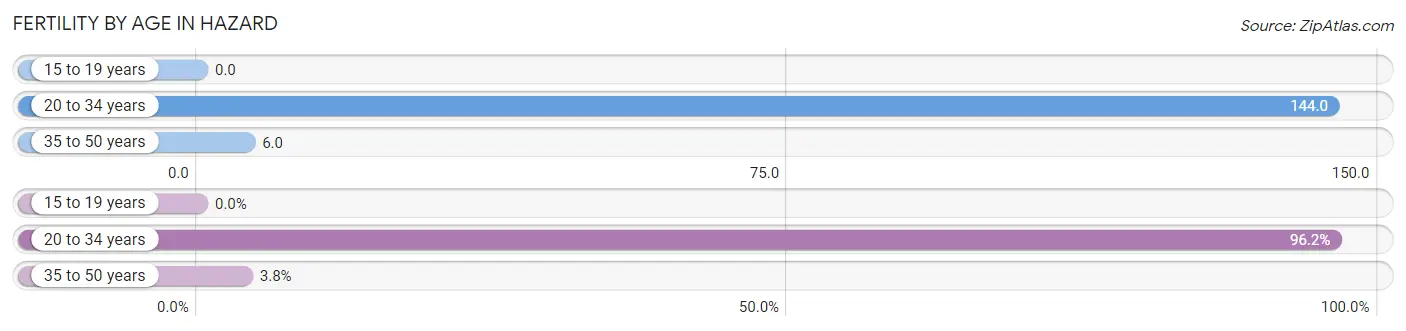
| Age Bracket | Women with Births | Births / 1,000 Women |
| 15 to 19 years | 0 (0.0%) | 0.0 |
| 20 to 34 years | 76 (96.2%) | 144.0 |
| 35 to 50 years | 3 (3.8%) | 6.0 |
| Total | 79 (100.0%) | 66.0 |
Fertility by Age by Marriage Status in Hazard
70.9% of women with births (79) in Hazard are married. The highest percentage of unmarried women with births falls into 20 to 34 years age bracket with 30.3% of them unmarried at the time of birth, while the lowest percentage of unmarried women with births belong to 35 to 50 years age bracket with 0.0% of them unmarried.
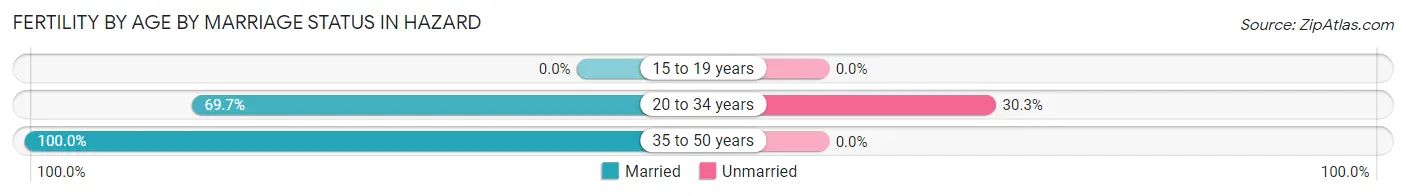
| Age Bracket | Married | Unmarried |
| 15 to 19 years | 0 (0.0%) | 0 (0.0%) |
| 20 to 34 years | 53 (69.7%) | 23 (30.3%) |
| 35 to 50 years | 3 (100.0%) | 0 (0.0%) |
| Total | 56 (70.9%) | 23 (29.1%) |
Fertility by Education in Hazard
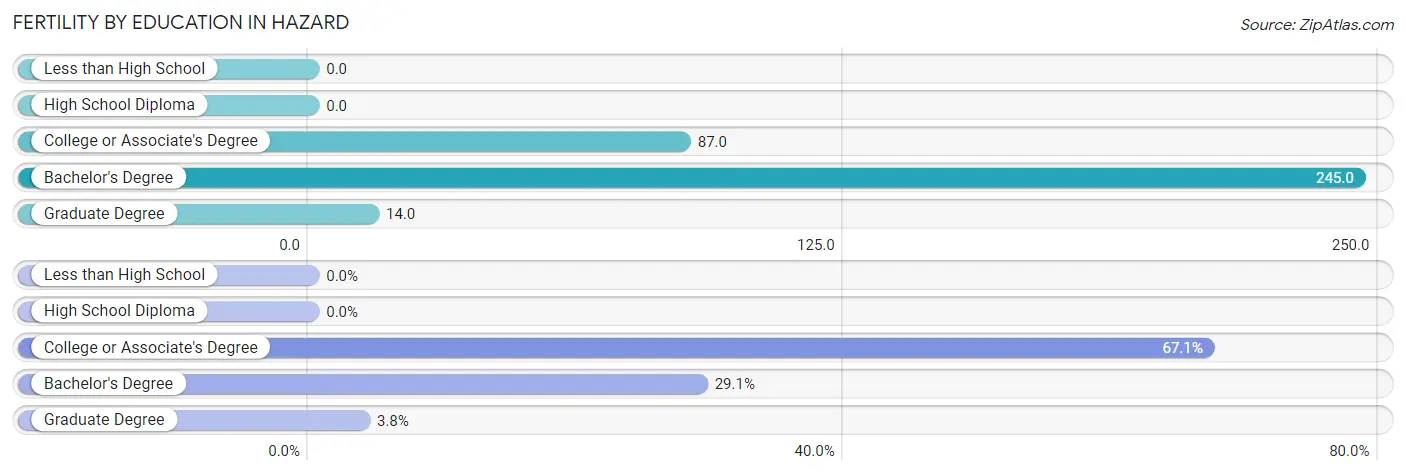
| Educational Attainment | Women with Births | Births / 1,000 Women |
| Less than High School | 0 (0.0%) | 0.0 |
| High School Diploma | 0 (0.0%) | 0.0 |
| College or Associate's Degree | 53 (67.1%) | 87.0 |
| Bachelor's Degree | 23 (29.1%) | 245.0 |
| Graduate Degree | 3 (3.8%) | 14.0 |
| Total | 79 (100.0%) | 66.0 |
Fertility by Education by Marriage Status in Hazard
29.1% of women with births in Hazard are unmarried. Women with the educational attainment of college or associate's degree are most likely to be married with 100.0% of them married at childbirth, while women with the educational attainment of bachelor's degree are least likely to be married with 100.0% of them unmarried at childbirth.
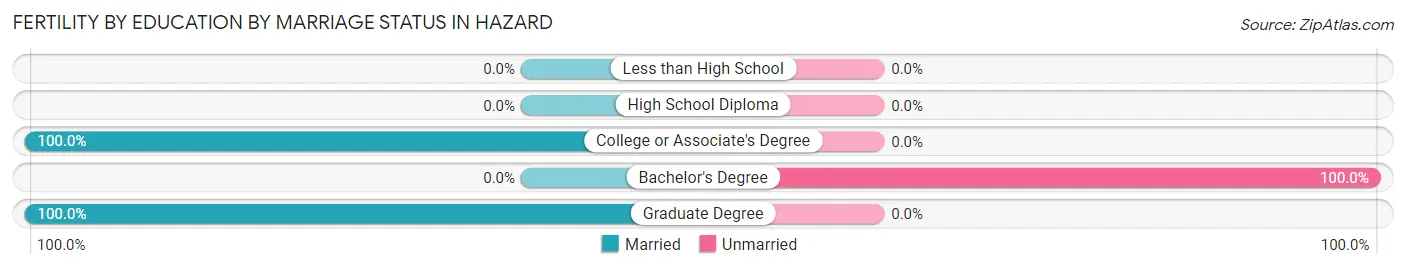
| Educational Attainment | Married | Unmarried |
| Less than High School | 0 (0.0%) | 0 (0.0%) |
| High School Diploma | 0 (0.0%) | 0 (0.0%) |
| College or Associate's Degree | 53 (100.0%) | 0 (0.0%) |
| Bachelor's Degree | 0 (0.0%) | 23 (100.0%) |
| Graduate Degree | 3 (100.0%) | 0 (0.0%) |
| Total | 56 (70.9%) | 23 (29.1%) |
Employment Characteristics in Hazard
Employment by Class of Employer in Hazard
Among the 1,652 employed individuals in Hazard, private company employees (1,024 | 62.0%), not-for-profit organizations (338 | 20.5%), and local government employees (204 | 12.3%) make up the most common classes of employment.
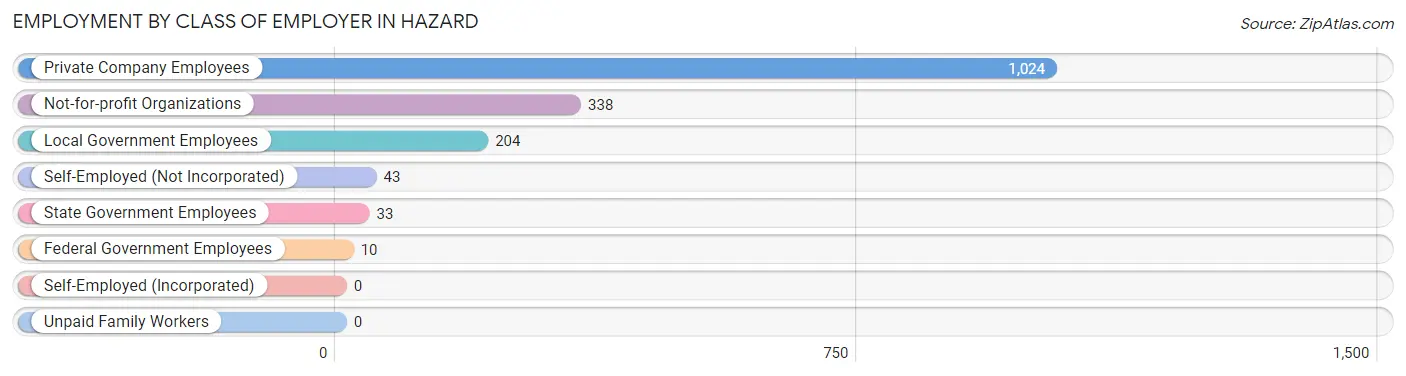
| Employer Class | # Employees | % Employees |
| Private Company Employees | 1,024 | 62.0% |
| Self-Employed (Incorporated) | 0 | 0.0% |
| Self-Employed (Not Incorporated) | 43 | 2.6% |
| Not-for-profit Organizations | 338 | 20.5% |
| Local Government Employees | 204 | 12.3% |
| State Government Employees | 33 | 2.0% |
| Federal Government Employees | 10 | 0.6% |
| Unpaid Family Workers | 0 | 0.0% |
| Total | 1,652 | 100.0% |
Employment Status by Age in Hazard
According to the labor force statistics for Hazard, out of the total population over 16 years of age (4,049), 47.3% or 1,915 individuals are in the labor force, with 11.2% or 214 of them unemployed. The age group with the highest labor force participation rate is 25 to 29 years, with 79.2% or 171 individuals in the labor force. Within the labor force, the 16 to 19 years age range has the highest percentage of unemployed individuals, with 50.0% or 45 of them being unemployed.
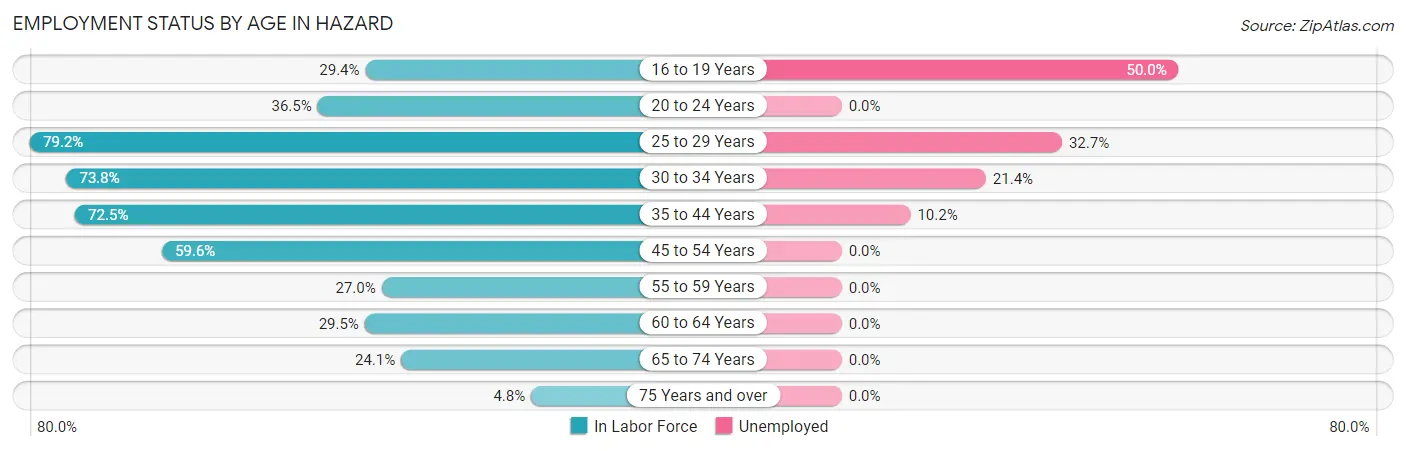
| Age Bracket | In Labor Force | Unemployed |
| 16 to 19 Years | 90 (29.4%) | 45 (50.0%) |
| 20 to 24 Years | 73 (36.5%) | 0 (0.0%) |
| 25 to 29 Years | 171 (79.2%) | 56 (32.7%) |
| 30 to 34 Years | 290 (73.8%) | 62 (21.4%) |
| 35 to 44 Years | 498 (72.5%) | 51 (10.2%) |
| 45 to 54 Years | 485 (59.6%) | 0 (0.0%) |
| 55 to 59 Years | 82 (27.0%) | 0 (0.0%) |
| 60 to 64 Years | 109 (29.5%) | 0 (0.0%) |
| 65 to 74 Years | 102 (24.1%) | 0 (0.0%) |
| 75 Years and over | 16 (4.8%) | 0 (0.0%) |
| Total | 1,915 (47.3%) | 214 (11.2%) |
Employment Status by Educational Attainment in Hazard
According to labor force statistics for Hazard, 58.7% of individuals (1,634) out of the total population between 25 and 64 years of age (2,783) are in the labor force, with 10.3% or 168 of them being unemployed. The group with the highest labor force participation rate are those with the educational attainment of bachelor's degree or higher, with 80.8% or 547 individuals in the labor force. Within the labor force, individuals with high school diploma education have the highest percentage of unemployment, with 26.7% or 62 of them being unemployed.
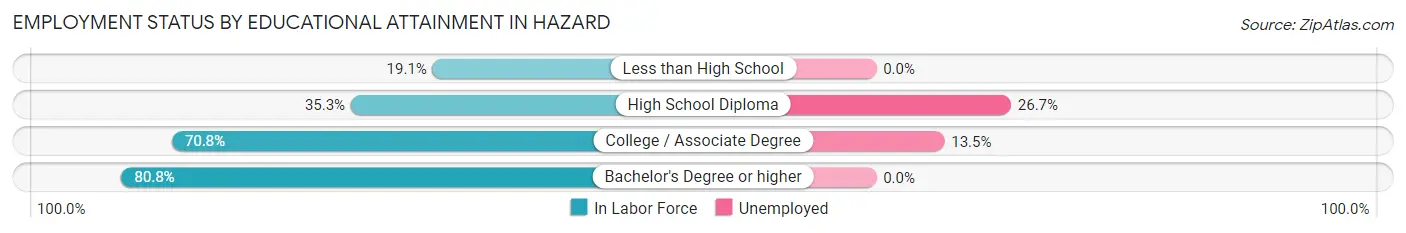
| Educational Attainment | In Labor Force | Unemployed |
| Less than High School | 63 (19.1%) | 0 (0.0%) |
| High School Diploma | 232 (35.3%) | 175 (26.7%) |
| College / Associate Degree | 793 (70.8%) | 151 (13.5%) |
| Bachelor's Degree or higher | 547 (80.8%) | 0 (0.0%) |
| Total | 1,634 (58.7%) | 287 (10.3%) |
Employment Occupations by Sex in Hazard
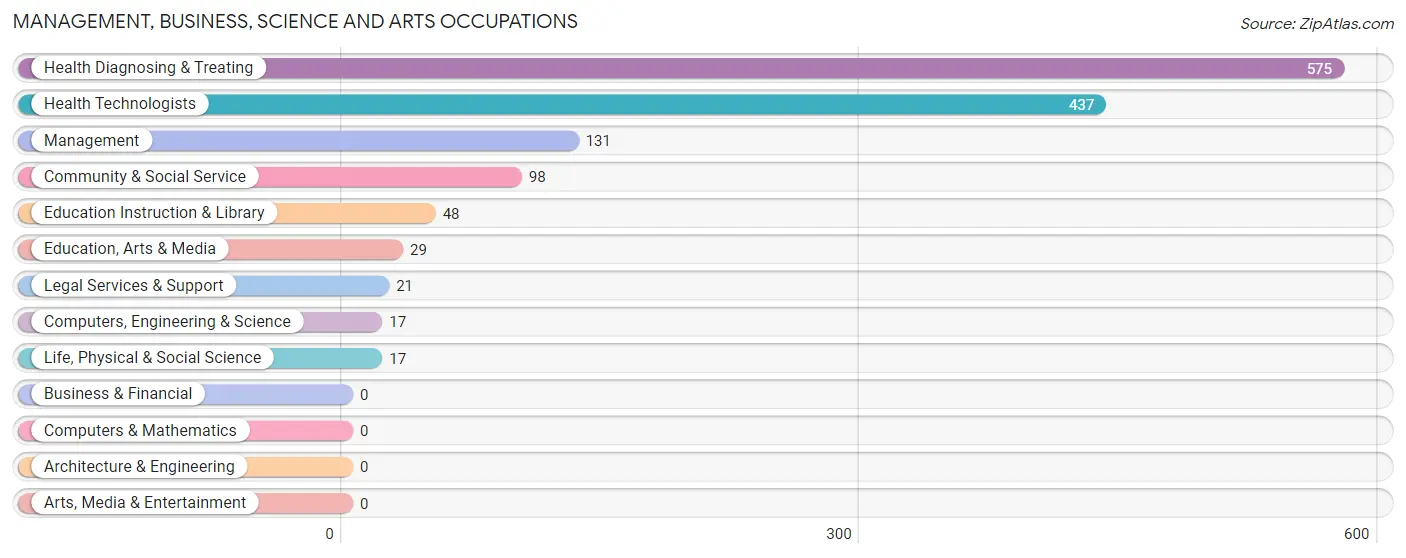
Management, Business, Science and Arts Occupations
The most common Management, Business, Science and Arts occupations in Hazard are Health Diagnosing & Treating (575 | 33.8%), Health Technologists (437 | 25.7%), Management (131 | 7.7%), Community & Social Service (98 | 5.8%), and Education Instruction & Library (48 | 2.8%).
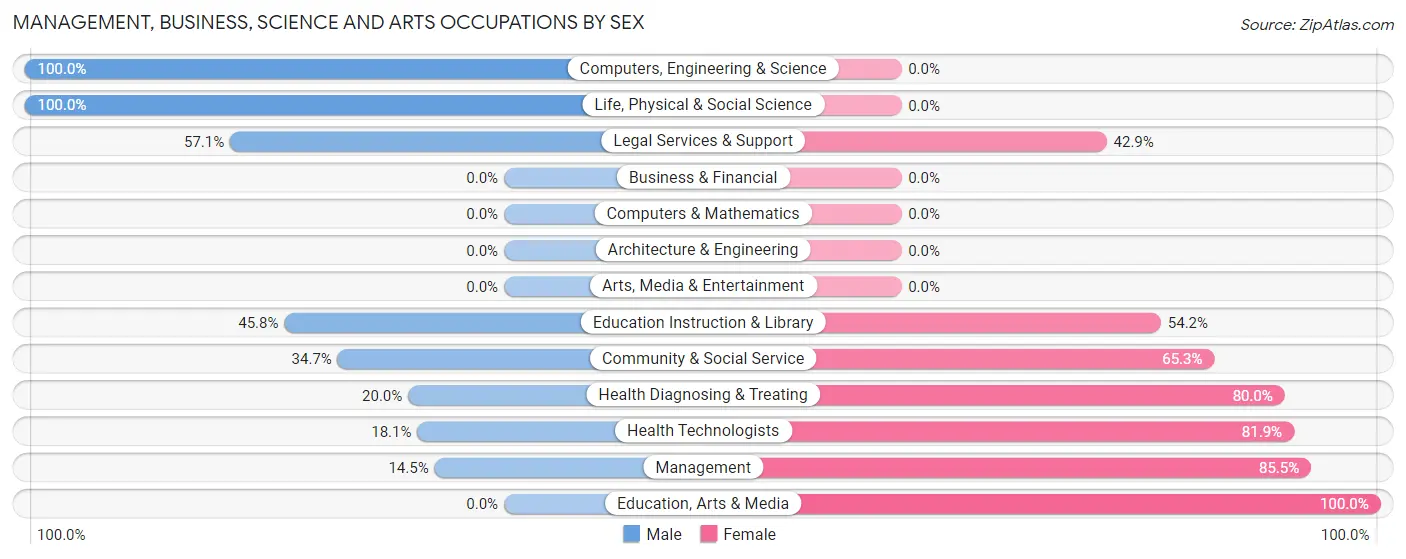
Management, Business, Science and Arts Occupations by Sex
Within the Management, Business, Science and Arts occupations in Hazard, the most male-oriented occupations are Computers, Engineering & Science (100.0%), Life, Physical & Social Science (100.0%), and Legal Services & Support (57.1%), while the most female-oriented occupations are Education, Arts & Media (100.0%), Management (85.5%), and Health Technologists (81.9%).
| Occupation | Male | Female |
| Management | 19 (14.5%) | 112 (85.5%) |
| Business & Financial | 0 (0.0%) | 0 (0.0%) |
| Computers, Engineering & Science | 17 (100.0%) | 0 (0.0%) |
| Computers & Mathematics | 0 (0.0%) | 0 (0.0%) |
| Architecture & Engineering | 0 (0.0%) | 0 (0.0%) |
| Life, Physical & Social Science | 17 (100.0%) | 0 (0.0%) |
| Community & Social Service | 34 (34.7%) | 64 (65.3%) |
| Education, Arts & Media | 0 (0.0%) | 29 (100.0%) |
| Legal Services & Support | 12 (57.1%) | 9 (42.9%) |
| Education Instruction & Library | 22 (45.8%) | 26 (54.2%) |
| Arts, Media & Entertainment | 0 (0.0%) | 0 (0.0%) |
| Health Diagnosing & Treating | 115 (20.0%) | 460 (80.0%) |
| Health Technologists | 79 (18.1%) | 358 (81.9%) |
| Total (Category) | 185 (22.5%) | 636 (77.5%) |
| Total (Overall) | 681 (40.0%) | 1,021 (60.0%) |
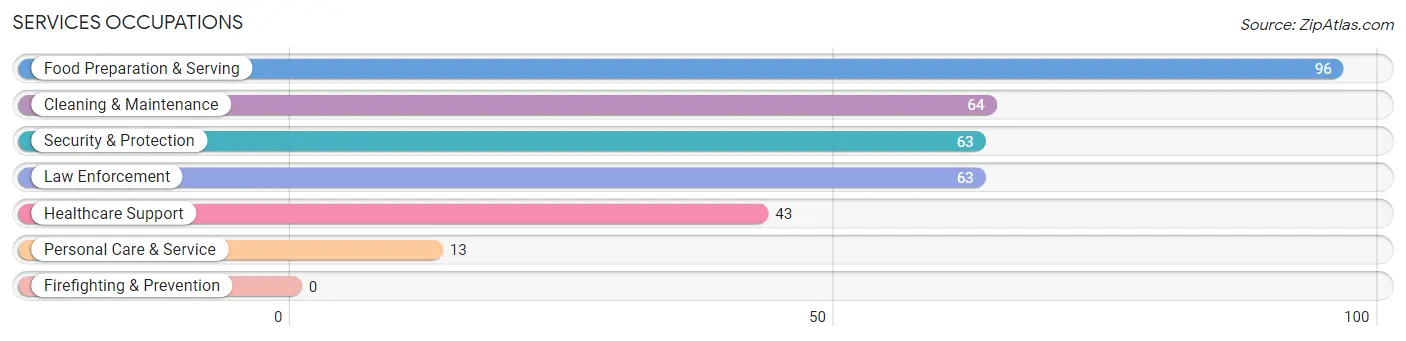
Services Occupations
The most common Services occupations in Hazard are Food Preparation & Serving (96 | 5.6%), Cleaning & Maintenance (64 | 3.8%), Security & Protection (63 | 3.7%), Law Enforcement (63 | 3.7%), and Healthcare Support (43 | 2.5%).
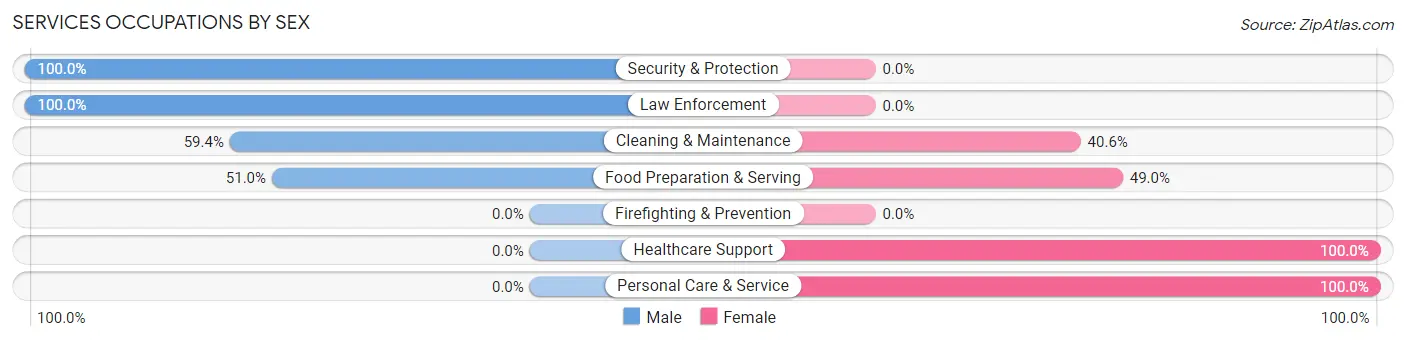
Services Occupations by Sex
Within the Services occupations in Hazard, the most male-oriented occupations are Security & Protection (100.0%), Law Enforcement (100.0%), and Cleaning & Maintenance (59.4%), while the most female-oriented occupations are Healthcare Support (100.0%), Personal Care & Service (100.0%), and Food Preparation & Serving (49.0%).
| Occupation | Male | Female |
| Healthcare Support | 0 (0.0%) | 43 (100.0%) |
| Security & Protection | 63 (100.0%) | 0 (0.0%) |
| Firefighting & Prevention | 0 (0.0%) | 0 (0.0%) |
| Law Enforcement | 63 (100.0%) | 0 (0.0%) |
| Food Preparation & Serving | 49 (51.0%) | 47 (49.0%) |
| Cleaning & Maintenance | 38 (59.4%) | 26 (40.6%) |
| Personal Care & Service | 0 (0.0%) | 13 (100.0%) |
| Total (Category) | 150 (53.8%) | 129 (46.2%) |
| Total (Overall) | 681 (40.0%) | 1,021 (60.0%) |
Sales and Office Occupations
The most common Sales and Office occupations in Hazard are Sales & Related (236 | 13.9%), and Office & Administration (229 | 13.5%).
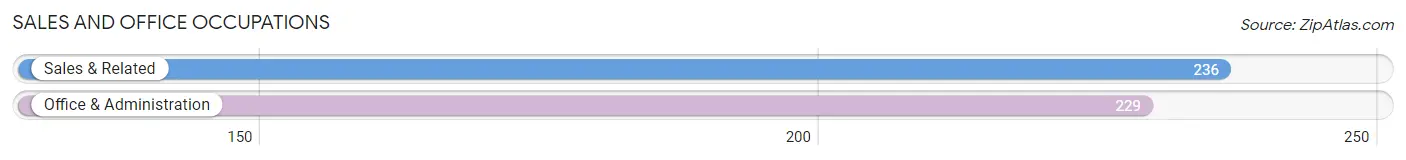
Sales and Office Occupations by Sex
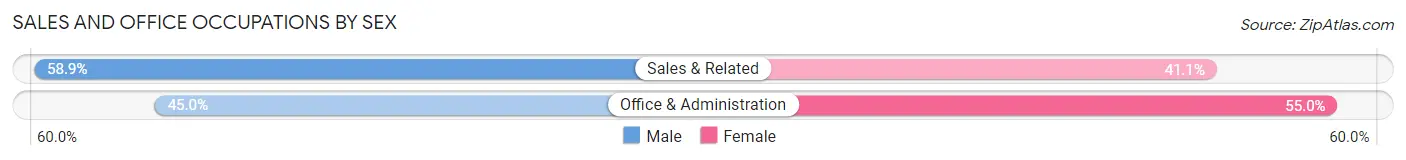
| Occupation | Male | Female |
| Sales & Related | 139 (58.9%) | 97 (41.1%) |
| Office & Administration | 103 (45.0%) | 126 (55.0%) |
| Total (Category) | 242 (52.0%) | 223 (48.0%) |
| Total (Overall) | 681 (40.0%) | 1,021 (60.0%) |
Natural Resources, Construction and Maintenance Occupations
The most common Natural Resources, Construction and Maintenance occupations in Hazard are Construction & Extraction (30 | 1.8%), and Installation, Maintenance & Repair (15 | 0.9%).
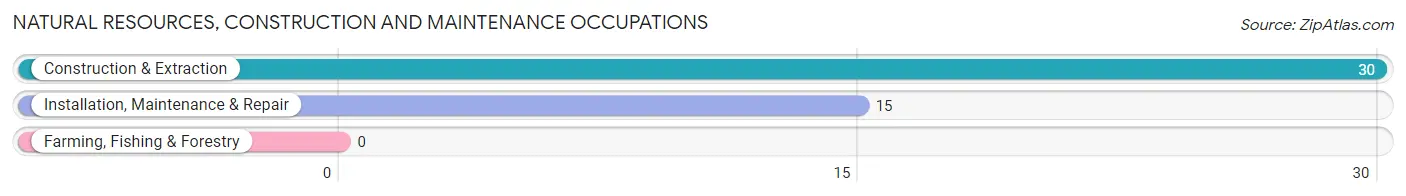
Natural Resources, Construction and Maintenance Occupations by Sex
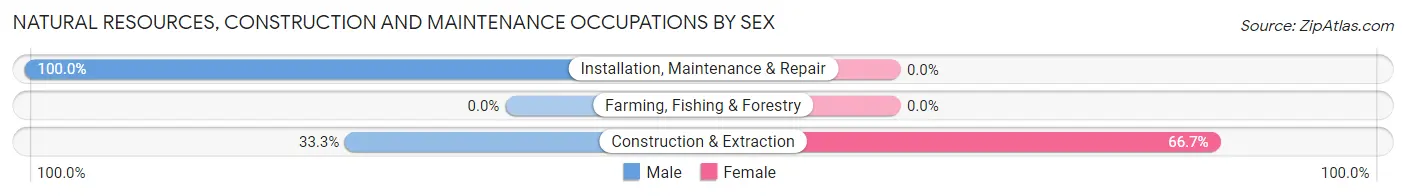
| Occupation | Male | Female |
| Farming, Fishing & Forestry | 0 (0.0%) | 0 (0.0%) |
| Construction & Extraction | 10 (33.3%) | 20 (66.7%) |
| Installation, Maintenance & Repair | 15 (100.0%) | 0 (0.0%) |
| Total (Category) | 25 (55.6%) | 20 (44.4%) |
| Total (Overall) | 681 (40.0%) | 1,021 (60.0%) |
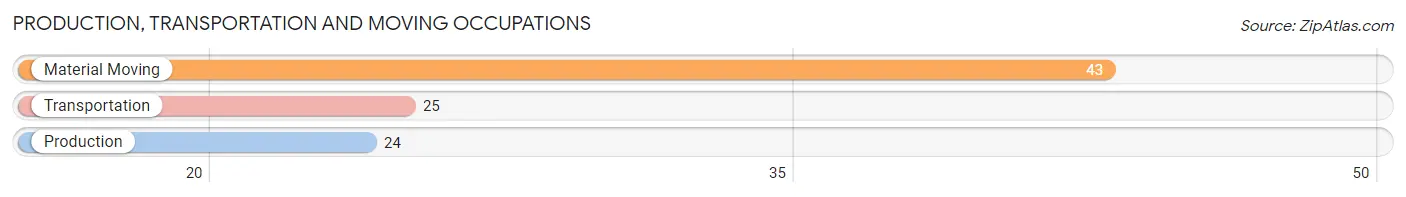
Production, Transportation and Moving Occupations
The most common Production, Transportation and Moving occupations in Hazard are Material Moving (43 | 2.5%), Transportation (25 | 1.5%), and Production (24 | 1.4%).
Production, Transportation and Moving Occupations by Sex
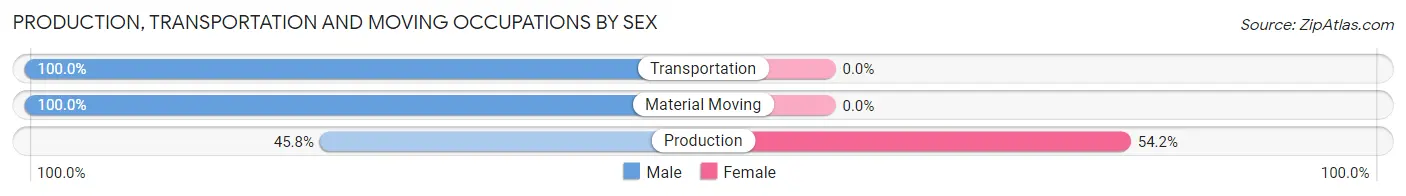
| Occupation | Male | Female |
| Production | 11 (45.8%) | 13 (54.2%) |
| Transportation | 25 (100.0%) | 0 (0.0%) |
| Material Moving | 43 (100.0%) | 0 (0.0%) |
| Total (Category) | 79 (85.9%) | 13 (14.1%) |
| Total (Overall) | 681 (40.0%) | 1,021 (60.0%) |
Employment Industries by Sex in Hazard
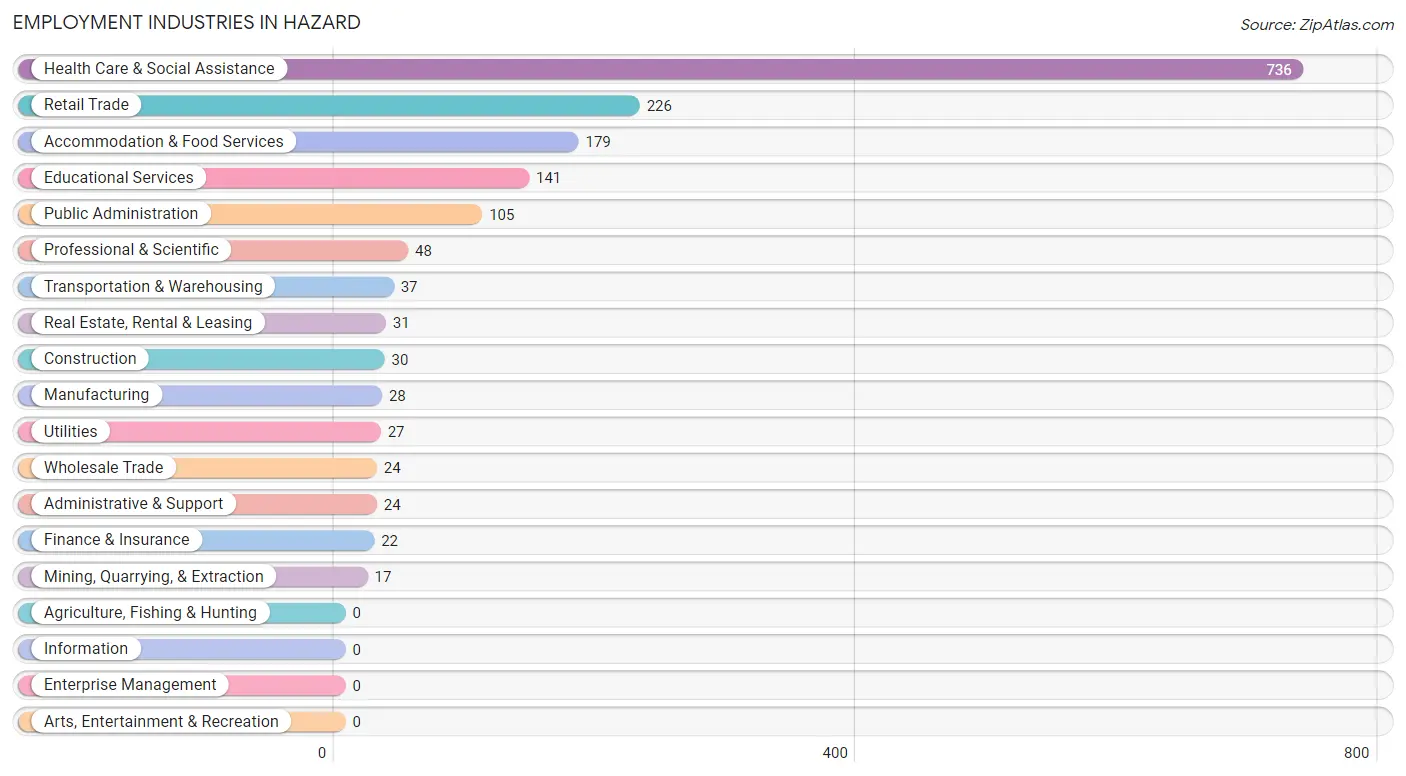
Employment Industries in Hazard
The major employment industries in Hazard include Health Care & Social Assistance (736 | 43.2%), Retail Trade (226 | 13.3%), Accommodation & Food Services (179 | 10.5%), Educational Services (141 | 8.3%), and Public Administration (105 | 6.2%).
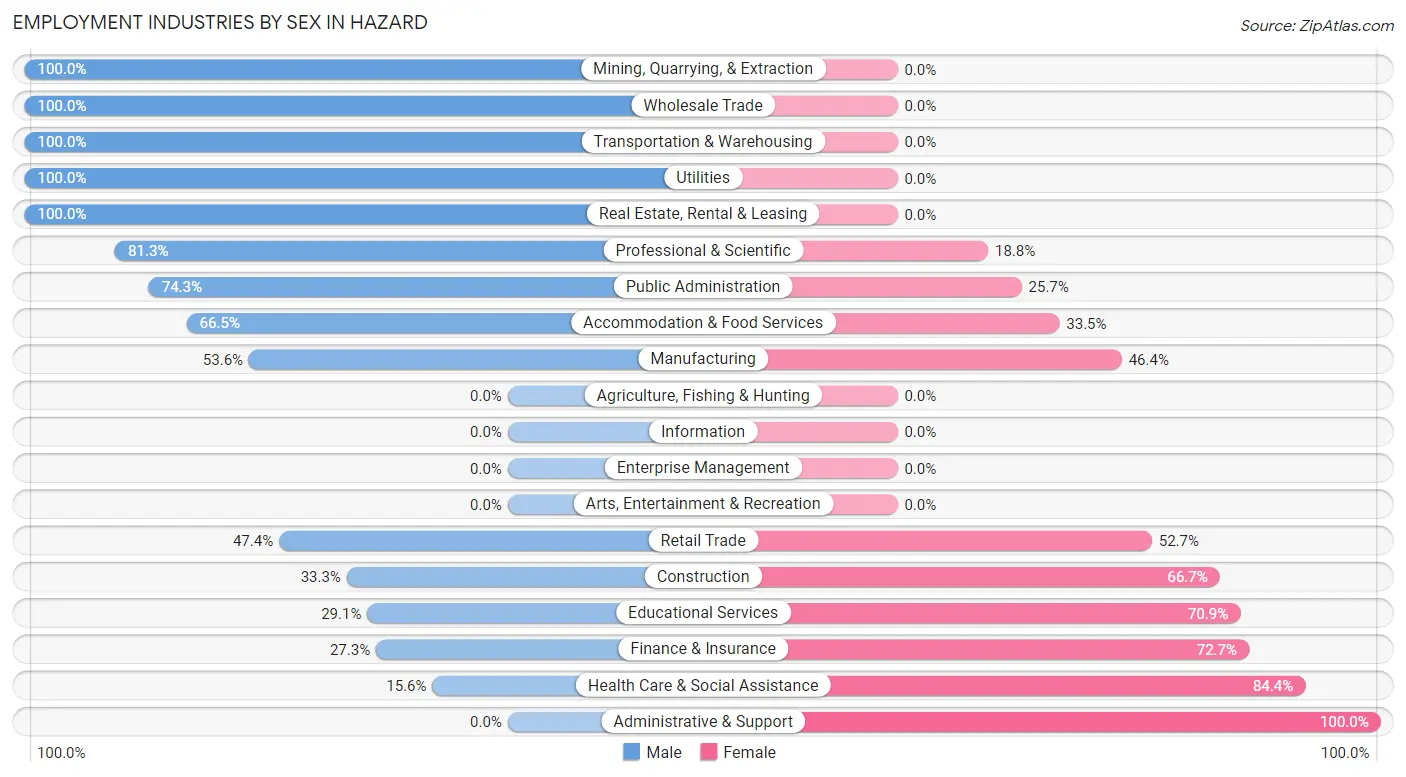
Employment Industries by Sex in Hazard
The Hazard industries that see more men than women are Mining, Quarrying, & Extraction (100.0%), Wholesale Trade (100.0%), and Transportation & Warehousing (100.0%), whereas the industries that tend to have a higher number of women are Administrative & Support (100.0%), Health Care & Social Assistance (84.4%), and Finance & Insurance (72.7%).
| Industry | Male | Female |
| Agriculture, Fishing & Hunting | 0 (0.0%) | 0 (0.0%) |
| Mining, Quarrying, & Extraction | 17 (100.0%) | 0 (0.0%) |
| Construction | 10 (33.3%) | 20 (66.7%) |
| Manufacturing | 15 (53.6%) | 13 (46.4%) |
| Wholesale Trade | 24 (100.0%) | 0 (0.0%) |
| Retail Trade | 107 (47.3%) | 119 (52.6%) |
| Transportation & Warehousing | 37 (100.0%) | 0 (0.0%) |
| Utilities | 27 (100.0%) | 0 (0.0%) |
| Information | 0 (0.0%) | 0 (0.0%) |
| Finance & Insurance | 6 (27.3%) | 16 (72.7%) |
| Real Estate, Rental & Leasing | 31 (100.0%) | 0 (0.0%) |
| Professional & Scientific | 39 (81.2%) | 9 (18.8%) |
| Enterprise Management | 0 (0.0%) | 0 (0.0%) |
| Administrative & Support | 0 (0.0%) | 24 (100.0%) |
| Educational Services | 41 (29.1%) | 100 (70.9%) |
| Health Care & Social Assistance | 115 (15.6%) | 621 (84.4%) |
| Arts, Entertainment & Recreation | 0 (0.0%) | 0 (0.0%) |
| Accommodation & Food Services | 119 (66.5%) | 60 (33.5%) |
| Public Administration | 78 (74.3%) | 27 (25.7%) |
| Total | 681 (40.0%) | 1,021 (60.0%) |
Education in Hazard
School Enrollment in Hazard
The most common levels of schooling among the 1,386 students in Hazard are elementary school (342 | 24.7%), middle school (305 | 22.0%), and college / undergraduate (269 | 19.4%).
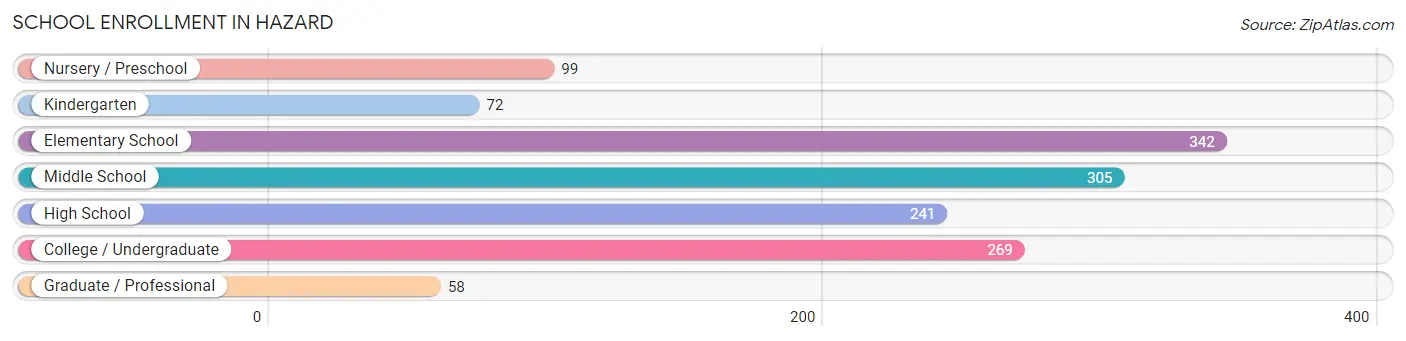
| School Level | # Students | % Students |
| Nursery / Preschool | 99 | 7.1% |
| Kindergarten | 72 | 5.2% |
| Elementary School | 342 | 24.7% |
| Middle School | 305 | 22.0% |
| High School | 241 | 17.4% |
| College / Undergraduate | 269 | 19.4% |
| Graduate / Professional | 58 | 4.2% |
| Total | 1,386 | 100.0% |
School Enrollment by Age by Funding Source in Hazard
Out of a total of 1,386 students who are enrolled in schools in Hazard, 78 (5.6%) attend a private institution, while the remaining 1,308 (94.4%) are enrolled in public schools. The age group of 5 to 9 year old has the highest likelihood of being enrolled in private schools, with 50 (14.1% in the age bracket) enrolled. Conversely, the age group of 3 to 4 year olds has the lowest likelihood of being enrolled in a private school, with 99 (100.0% in the age bracket) attending a public institution.
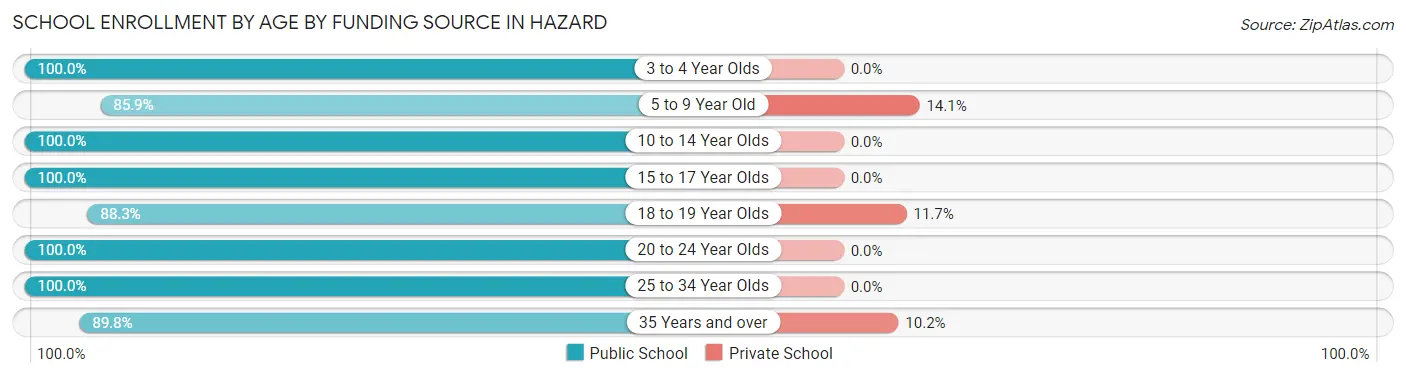
| Age Bracket | Public School | Private School |
| 3 to 4 Year Olds | 99 (100.0%) | 0 (0.0%) |
| 5 to 9 Year Old | 304 (85.9%) | 50 (14.1%) |
| 10 to 14 Year Olds | 359 (100.0%) | 0 (0.0%) |
| 15 to 17 Year Olds | 176 (100.0%) | 0 (0.0%) |
| 18 to 19 Year Olds | 98 (88.3%) | 13 (11.7%) |
| 20 to 24 Year Olds | 128 (100.0%) | 0 (0.0%) |
| 25 to 34 Year Olds | 12 (100.0%) | 0 (0.0%) |
| 35 Years and over | 132 (89.8%) | 15 (10.2%) |
| Total | 1,308 (94.4%) | 78 (5.6%) |
Educational Attainment by Field of Study in Hazard
Physical & health sciences (211 | 23.3%), science & technology (183 | 20.2%), education (110 | 12.1%), arts & humanities (110 | 12.1%), and psychology (109 | 12.0%) are the most common fields of study among 906 individuals in Hazard who have obtained a bachelor's degree or higher.
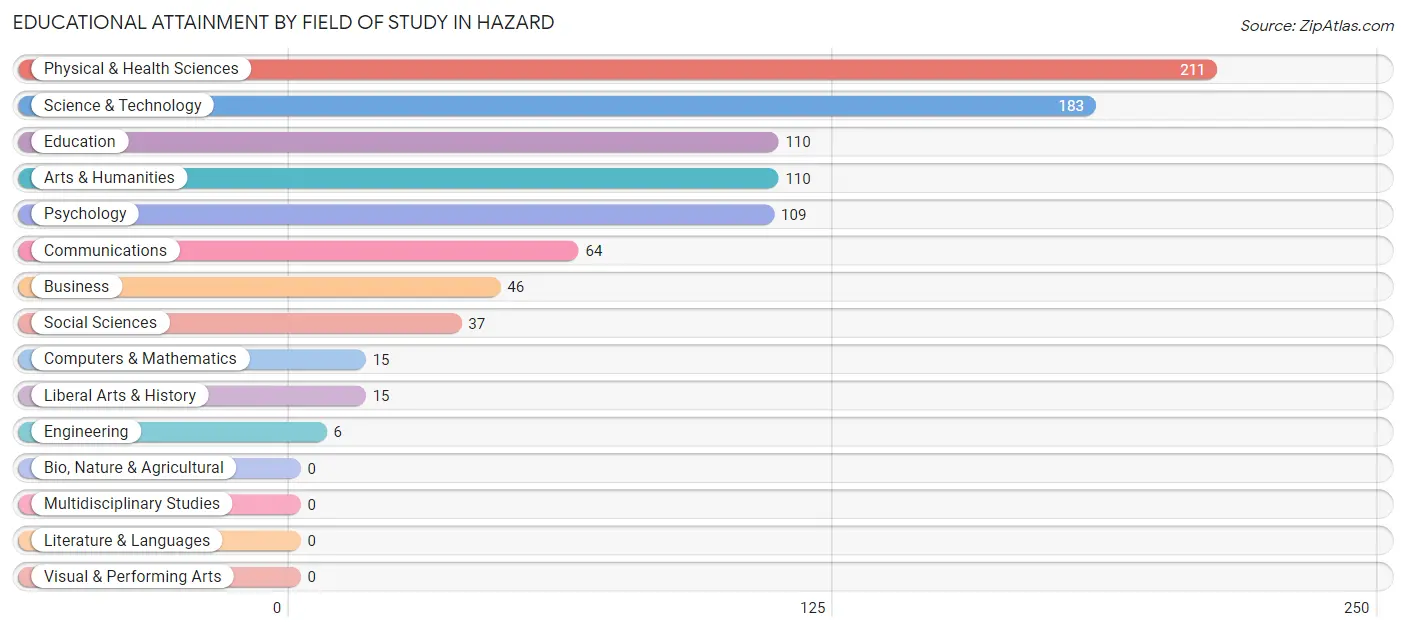
| Field of Study | # Graduates | % Graduates |
| Computers & Mathematics | 15 | 1.7% |
| Bio, Nature & Agricultural | 0 | 0.0% |
| Physical & Health Sciences | 211 | 23.3% |
| Psychology | 109 | 12.0% |
| Social Sciences | 37 | 4.1% |
| Engineering | 6 | 0.7% |
| Multidisciplinary Studies | 0 | 0.0% |
| Science & Technology | 183 | 20.2% |
| Business | 46 | 5.1% |
| Education | 110 | 12.1% |
| Literature & Languages | 0 | 0.0% |
| Liberal Arts & History | 15 | 1.7% |
| Visual & Performing Arts | 0 | 0.0% |
| Communications | 64 | 7.1% |
| Arts & Humanities | 110 | 12.1% |
| Total | 906 | 100.0% |
Transportation & Commute in Hazard
Vehicle Availability by Sex in Hazard
The most prevalent vehicle ownership categories in Hazard are males with 2 vehicles (334, accounting for 49.0%) and females with 2 vehicles (292, making up 34.4%).
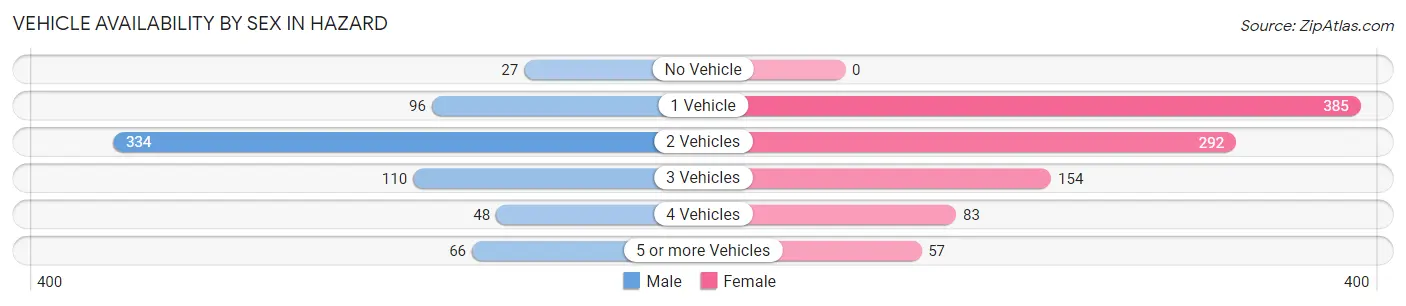
| Vehicles Available | Male | Female |
| No Vehicle | 27 (4.0%) | 0 (0.0%) |
| 1 Vehicle | 96 (14.1%) | 385 (39.7%) |
| 2 Vehicles | 334 (49.0%) | 292 (30.1%) |
| 3 Vehicles | 110 (16.2%) | 154 (15.9%) |
| 4 Vehicles | 48 (7.0%) | 83 (8.6%) |
| 5 or more Vehicles | 66 (9.7%) | 57 (5.9%) |
| Total | 681 (100.0%) | 971 (100.0%) |
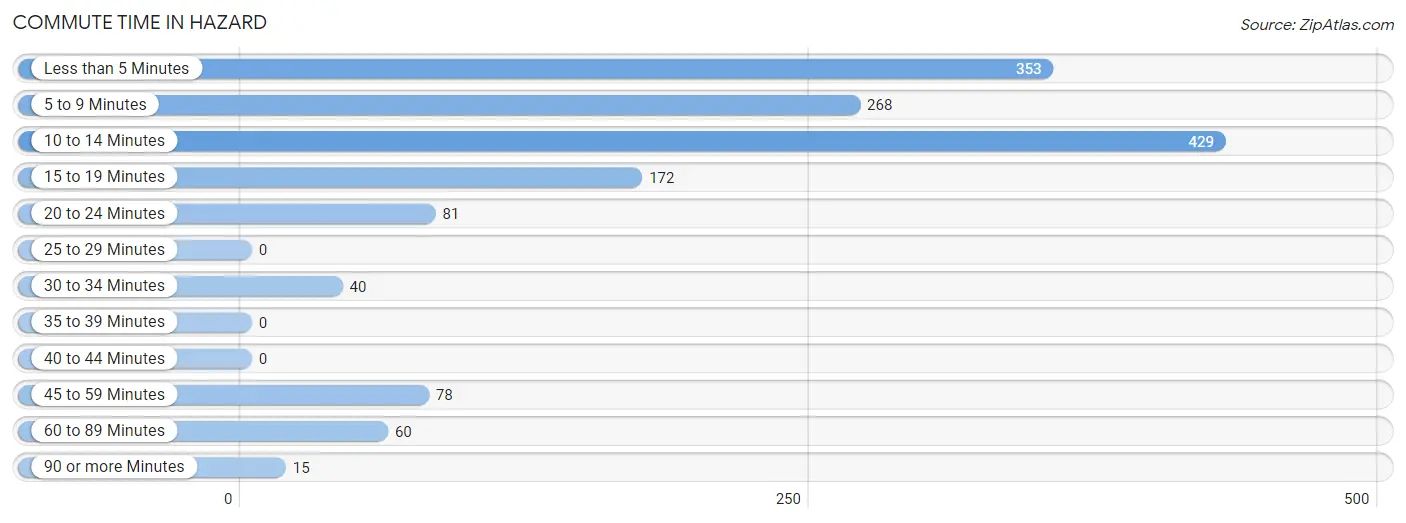
Commute Time in Hazard
The most frequently occuring commute durations in Hazard are 10 to 14 minutes (429 commuters, 28.7%), less than 5 minutes (353 commuters, 23.6%), and 5 to 9 minutes (268 commuters, 17.9%).
| Commute Time | # Commuters | % Commuters |
| Less than 5 Minutes | 353 | 23.6% |
| 5 to 9 Minutes | 268 | 17.9% |
| 10 to 14 Minutes | 429 | 28.7% |
| 15 to 19 Minutes | 172 | 11.5% |
| 20 to 24 Minutes | 81 | 5.4% |
| 25 to 29 Minutes | 0 | 0.0% |
| 30 to 34 Minutes | 40 | 2.7% |
| 35 to 39 Minutes | 0 | 0.0% |
| 40 to 44 Minutes | 0 | 0.0% |
| 45 to 59 Minutes | 78 | 5.2% |
| 60 to 89 Minutes | 60 | 4.0% |
| 90 or more Minutes | 15 | 1.0% |
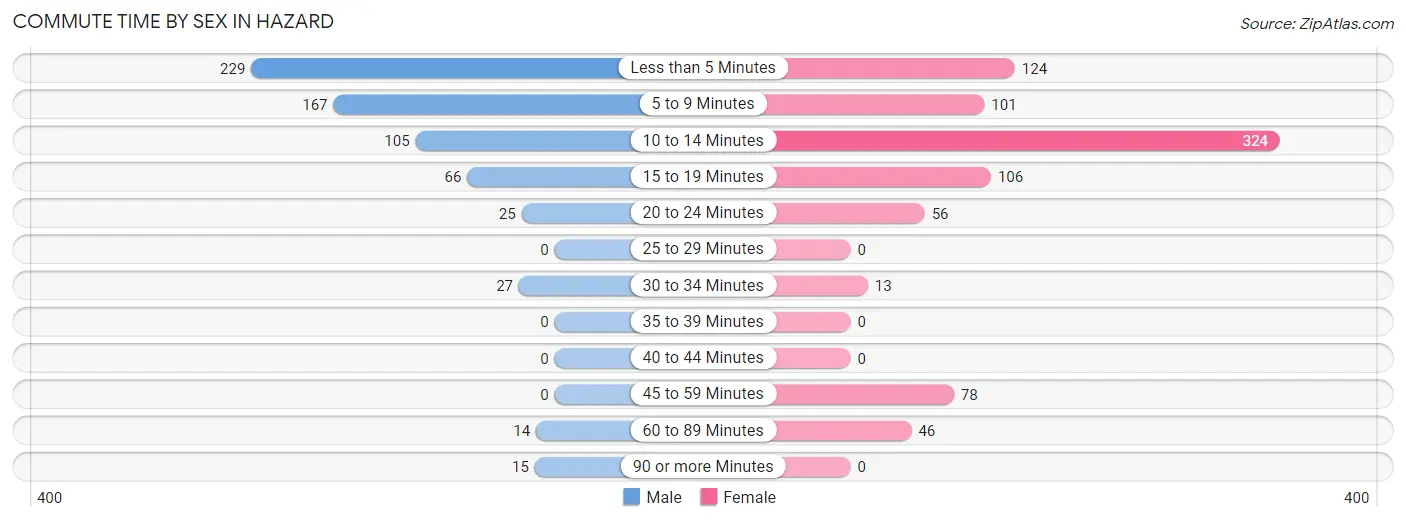
Commute Time by Sex in Hazard
The most common commute times in Hazard are less than 5 minutes (229 commuters, 35.3%) for males and 10 to 14 minutes (324 commuters, 38.2%) for females.
| Commute Time | Male | Female |
| Less than 5 Minutes | 229 (35.3%) | 124 (14.6%) |
| 5 to 9 Minutes | 167 (25.8%) | 101 (11.9%) |
| 10 to 14 Minutes | 105 (16.2%) | 324 (38.2%) |
| 15 to 19 Minutes | 66 (10.2%) | 106 (12.5%) |
| 20 to 24 Minutes | 25 (3.9%) | 56 (6.6%) |
| 25 to 29 Minutes | 0 (0.0%) | 0 (0.0%) |
| 30 to 34 Minutes | 27 (4.2%) | 13 (1.5%) |
| 35 to 39 Minutes | 0 (0.0%) | 0 (0.0%) |
| 40 to 44 Minutes | 0 (0.0%) | 0 (0.0%) |
| 45 to 59 Minutes | 0 (0.0%) | 78 (9.2%) |
| 60 to 89 Minutes | 14 (2.2%) | 46 (5.4%) |
| 90 or more Minutes | 15 (2.3%) | 0 (0.0%) |
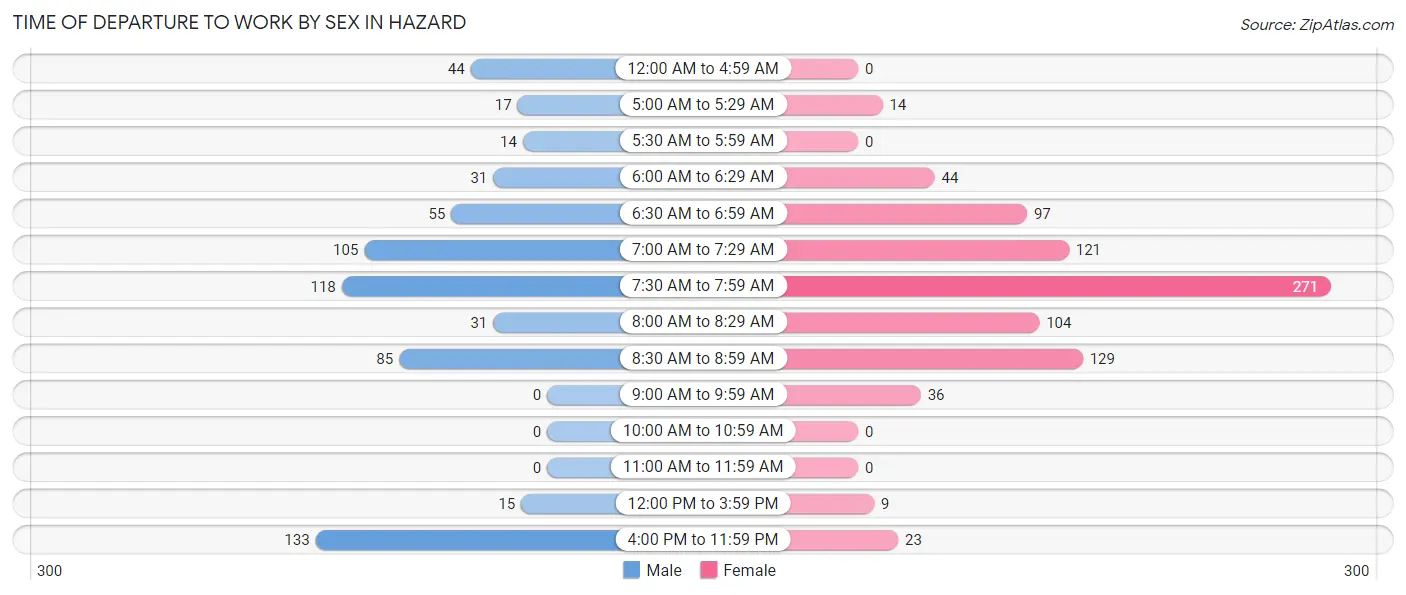
Time of Departure to Work by Sex in Hazard
The most frequent times of departure to work in Hazard are 4:00 PM to 11:59 PM (133, 20.5%) for males and 7:30 AM to 7:59 AM (271, 32.0%) for females.
| Time of Departure | Male | Female |
| 12:00 AM to 4:59 AM | 44 (6.8%) | 0 (0.0%) |
| 5:00 AM to 5:29 AM | 17 (2.6%) | 14 (1.7%) |
| 5:30 AM to 5:59 AM | 14 (2.2%) | 0 (0.0%) |
| 6:00 AM to 6:29 AM | 31 (4.8%) | 44 (5.2%) |
| 6:30 AM to 6:59 AM | 55 (8.5%) | 97 (11.4%) |
| 7:00 AM to 7:29 AM | 105 (16.2%) | 121 (14.3%) |
| 7:30 AM to 7:59 AM | 118 (18.2%) | 271 (32.0%) |
| 8:00 AM to 8:29 AM | 31 (4.8%) | 104 (12.3%) |
| 8:30 AM to 8:59 AM | 85 (13.1%) | 129 (15.2%) |
| 9:00 AM to 9:59 AM | 0 (0.0%) | 36 (4.3%) |
| 10:00 AM to 10:59 AM | 0 (0.0%) | 0 (0.0%) |
| 11:00 AM to 11:59 AM | 0 (0.0%) | 0 (0.0%) |
| 12:00 PM to 3:59 PM | 15 (2.3%) | 9 (1.1%) |
| 4:00 PM to 11:59 PM | 133 (20.5%) | 23 (2.7%) |
| Total | 648 (100.0%) | 848 (100.0%) |
Housing Occupancy in Hazard
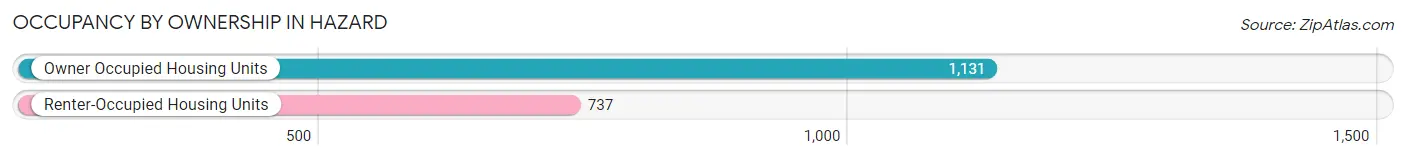
Occupancy by Ownership in Hazard
Of the total 1,868 dwellings in Hazard, owner-occupied units account for 1,131 (60.6%), while renter-occupied units make up 737 (39.5%).
| Occupancy | # Housing Units | % Housing Units |
| Owner Occupied Housing Units | 1,131 | 60.6% |
| Renter-Occupied Housing Units | 737 | 39.5% |
| Total Occupied Housing Units | 1,868 | 100.0% |
Occupancy by Household Size in Hazard
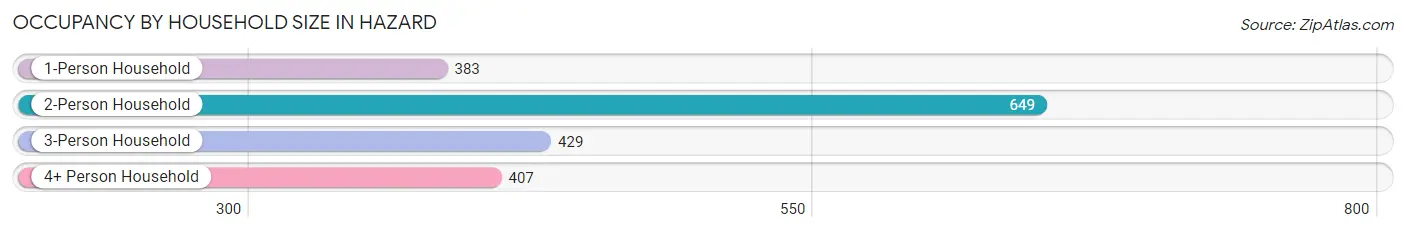
| Household Size | # Housing Units | % Housing Units |
| 1-Person Household | 383 | 20.5% |
| 2-Person Household | 649 | 34.7% |
| 3-Person Household | 429 | 23.0% |
| 4+ Person Household | 407 | 21.8% |
| Total Housing Units | 1,868 | 100.0% |
Occupancy by Ownership by Household Size in Hazard
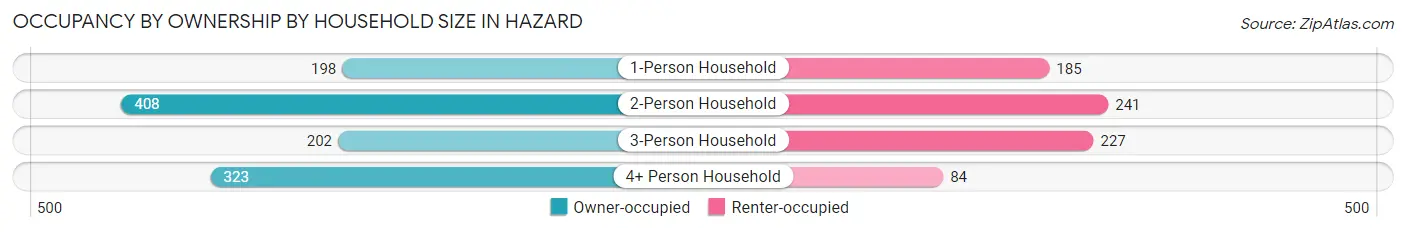
| Household Size | Owner-occupied | Renter-occupied |
| 1-Person Household | 198 (51.7%) | 185 (48.3%) |
| 2-Person Household | 408 (62.9%) | 241 (37.1%) |
| 3-Person Household | 202 (47.1%) | 227 (52.9%) |
| 4+ Person Household | 323 (79.4%) | 84 (20.6%) |
| Total Housing Units | 1,131 (60.6%) | 737 (39.5%) |
Occupancy by Educational Attainment in Hazard
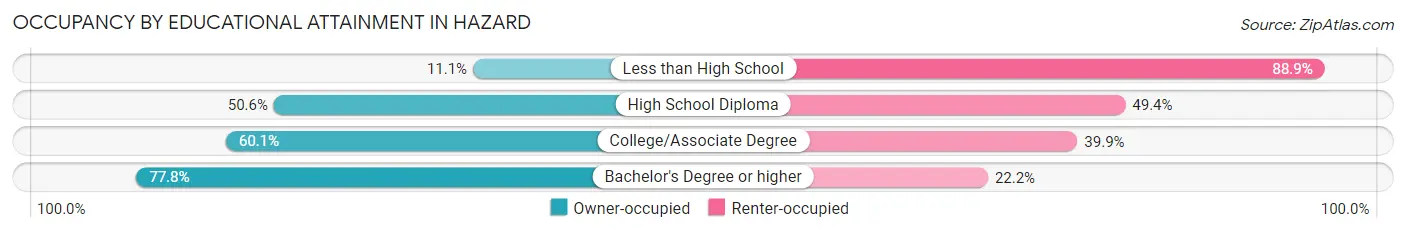
| Household Size | Owner-occupied | Renter-occupied |
| Less than High School | 14 (11.1%) | 112 (88.9%) |
| High School Diploma | 168 (50.6%) | 164 (49.4%) |
| College/Associate Degree | 503 (60.1%) | 334 (39.9%) |
| Bachelor's Degree or higher | 446 (77.8%) | 127 (22.2%) |
Occupancy by Age of Householder in Hazard
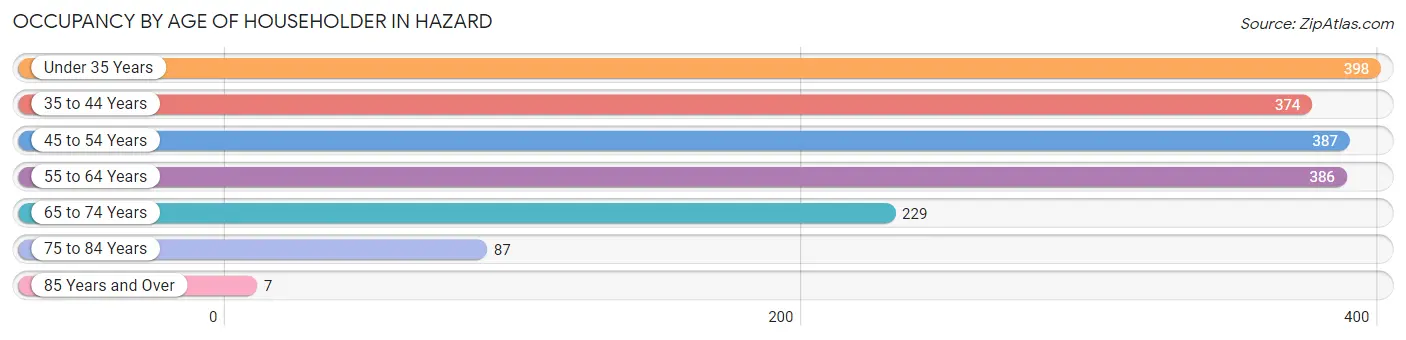
| Age Bracket | # Households | % Households |
| Under 35 Years | 398 | 21.3% |
| 35 to 44 Years | 374 | 20.0% |
| 45 to 54 Years | 387 | 20.7% |
| 55 to 64 Years | 386 | 20.7% |
| 65 to 74 Years | 229 | 12.3% |
| 75 to 84 Years | 87 | 4.7% |
| 85 Years and Over | 7 | 0.4% |
| Total | 1,868 | 100.0% |
Housing Finances in Hazard
Median Income by Occupancy in Hazard
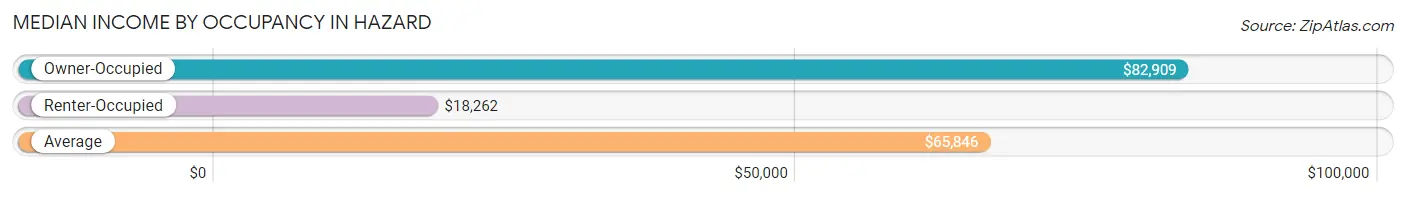
| Occupancy Type | # Households | Median Income |
| Owner-Occupied | 1,131 (60.6%) | $82,909 |
| Renter-Occupied | 737 (39.5%) | $18,262 |
| Average | 1,868 (100.0%) | $65,846 |
Occupancy by Householder Income Bracket in Hazard
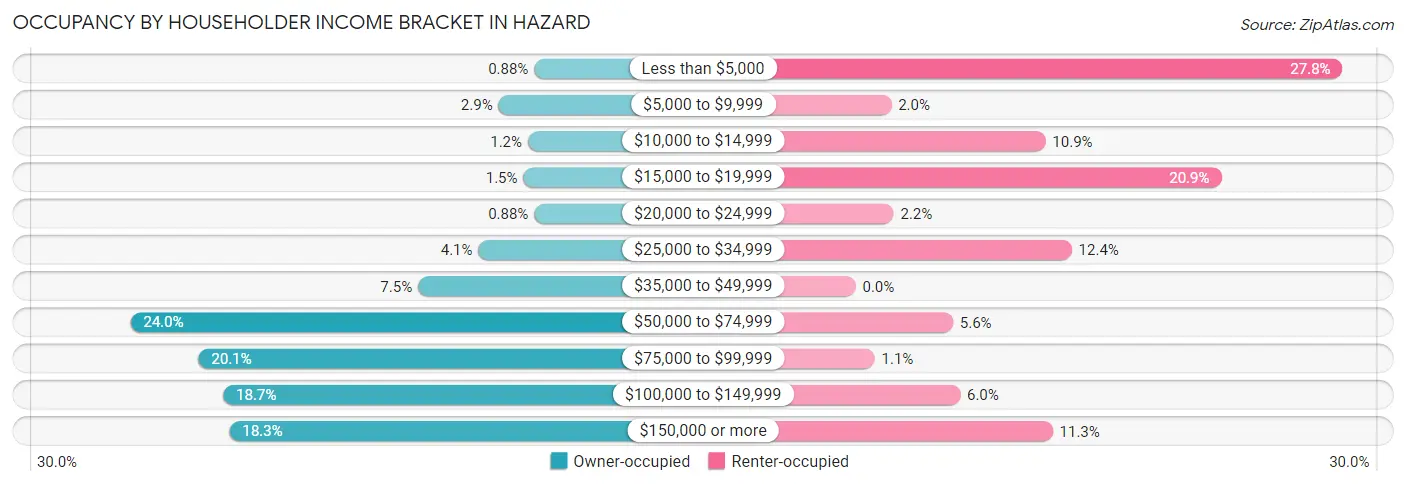
| Income Bracket | Owner-occupied | Renter-occupied |
| Less than $5,000 | 10 (0.9%) | 205 (27.8%) |
| $5,000 to $9,999 | 33 (2.9%) | 15 (2.0%) |
| $10,000 to $14,999 | 14 (1.2%) | 80 (10.8%) |
| $15,000 to $19,999 | 17 (1.5%) | 154 (20.9%) |
| $20,000 to $24,999 | 10 (0.9%) | 16 (2.2%) |
| $25,000 to $34,999 | 46 (4.1%) | 91 (12.3%) |
| $35,000 to $49,999 | 85 (7.5%) | 0 (0.0%) |
| $50,000 to $74,999 | 271 (24.0%) | 41 (5.6%) |
| $75,000 to $99,999 | 227 (20.1%) | 8 (1.1%) |
| $100,000 to $149,999 | 211 (18.7%) | 44 (6.0%) |
| $150,000 or more | 207 (18.3%) | 83 (11.3%) |
| Total | 1,131 (100.0%) | 737 (100.0%) |
Monthly Housing Cost Tiers in Hazard
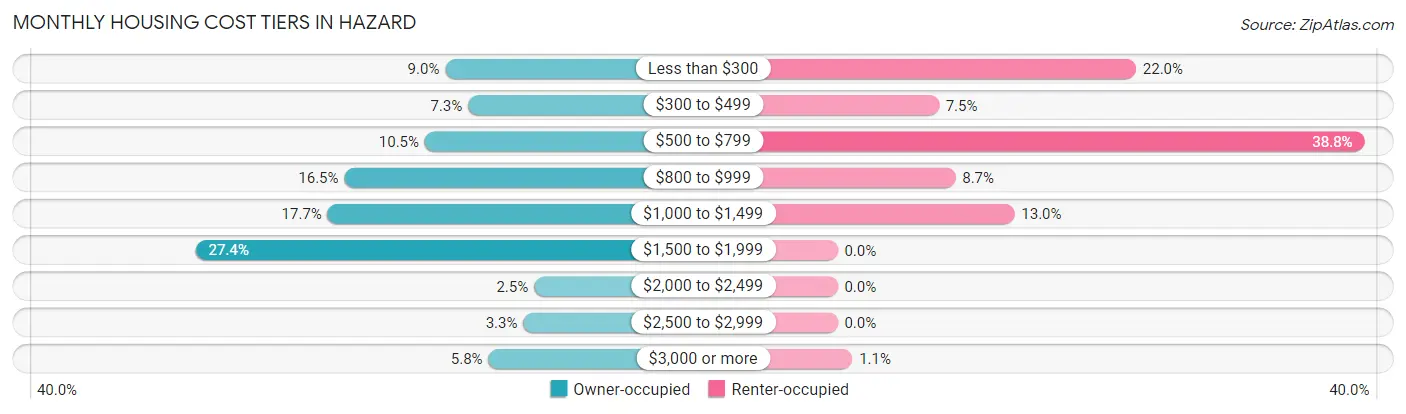
| Monthly Cost | Owner-occupied | Renter-occupied |
| Less than $300 | 102 (9.0%) | 162 (22.0%) |
| $300 to $499 | 83 (7.3%) | 55 (7.5%) |
| $500 to $799 | 119 (10.5%) | 286 (38.8%) |
| $800 to $999 | 186 (16.5%) | 64 (8.7%) |
| $1,000 to $1,499 | 200 (17.7%) | 96 (13.0%) |
| $1,500 to $1,999 | 310 (27.4%) | 0 (0.0%) |
| $2,000 to $2,499 | 28 (2.5%) | 0 (0.0%) |
| $2,500 to $2,999 | 37 (3.3%) | 0 (0.0%) |
| $3,000 or more | 66 (5.8%) | 8 (1.1%) |
| Total | 1,131 (100.0%) | 737 (100.0%) |
Physical Housing Characteristics in Hazard
Housing Structures in Hazard
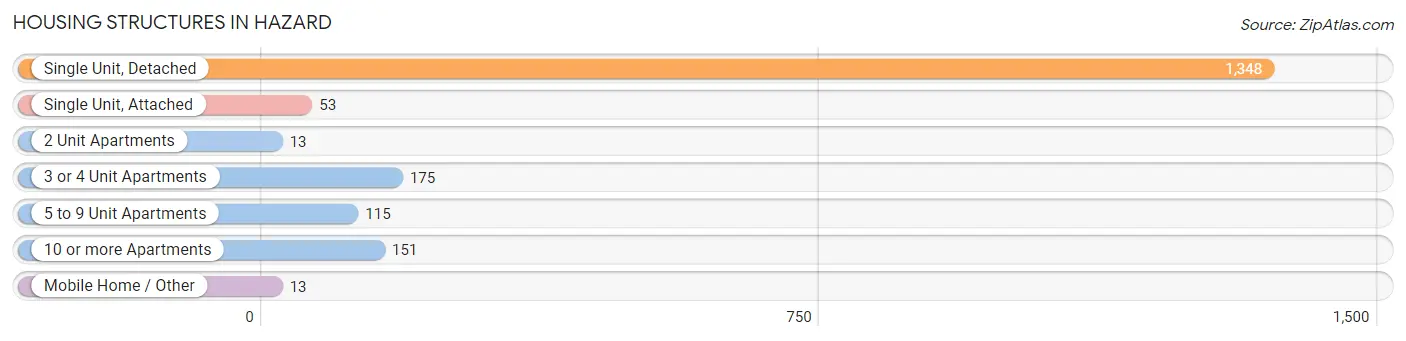
| Structure Type | # Housing Units | % Housing Units |
| Single Unit, Detached | 1,348 | 72.2% |
| Single Unit, Attached | 53 | 2.8% |
| 2 Unit Apartments | 13 | 0.7% |
| 3 or 4 Unit Apartments | 175 | 9.4% |
| 5 to 9 Unit Apartments | 115 | 6.2% |
| 10 or more Apartments | 151 | 8.1% |
| Mobile Home / Other | 13 | 0.7% |
| Total | 1,868 | 100.0% |
Housing Structures by Occupancy in Hazard
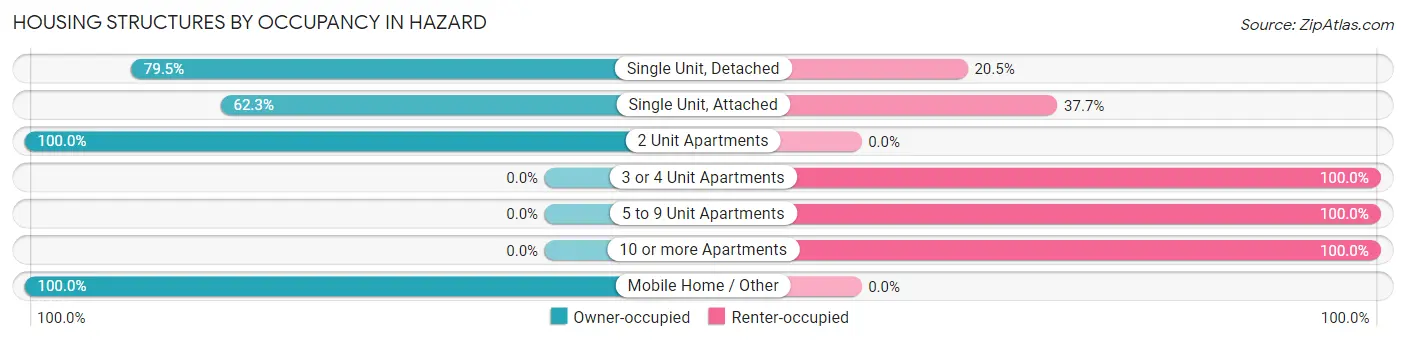
| Structure Type | Owner-occupied | Renter-occupied |
| Single Unit, Detached | 1,072 (79.5%) | 276 (20.5%) |
| Single Unit, Attached | 33 (62.3%) | 20 (37.7%) |
| 2 Unit Apartments | 13 (100.0%) | 0 (0.0%) |
| 3 or 4 Unit Apartments | 0 (0.0%) | 175 (100.0%) |
| 5 to 9 Unit Apartments | 0 (0.0%) | 115 (100.0%) |
| 10 or more Apartments | 0 (0.0%) | 151 (100.0%) |
| Mobile Home / Other | 13 (100.0%) | 0 (0.0%) |
| Total | 1,131 (60.6%) | 737 (39.5%) |
Housing Structures by Number of Rooms in Hazard
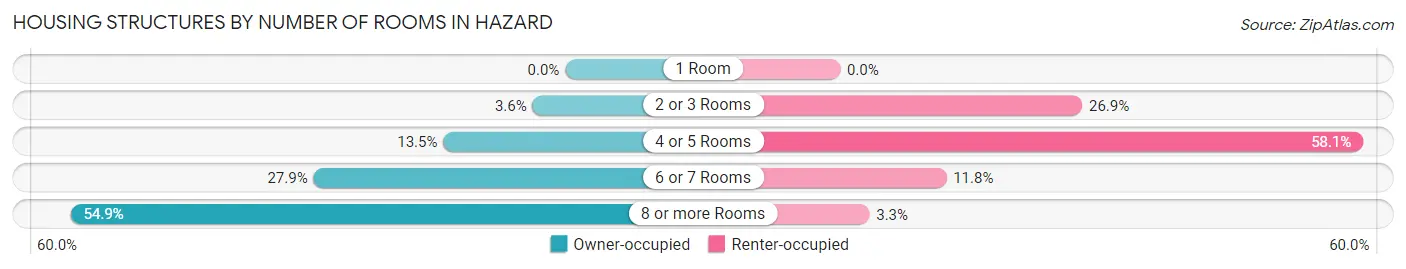
| Number of Rooms | Owner-occupied | Renter-occupied |
| 1 Room | 0 (0.0%) | 0 (0.0%) |
| 2 or 3 Rooms | 41 (3.6%) | 198 (26.9%) |
| 4 or 5 Rooms | 153 (13.5%) | 428 (58.1%) |
| 6 or 7 Rooms | 316 (27.9%) | 87 (11.8%) |
| 8 or more Rooms | 621 (54.9%) | 24 (3.3%) |
| Total | 1,131 (100.0%) | 737 (100.0%) |
Housing Structure by Heating Type in Hazard
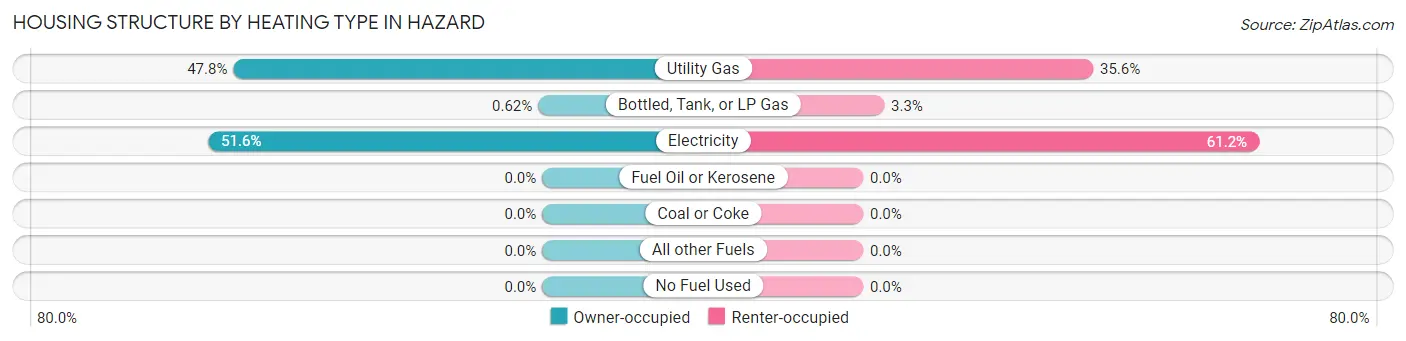
| Heating Type | Owner-occupied | Renter-occupied |
| Utility Gas | 540 (47.7%) | 262 (35.5%) |
| Bottled, Tank, or LP Gas | 7 (0.6%) | 24 (3.3%) |
| Electricity | 584 (51.6%) | 451 (61.2%) |
| Fuel Oil or Kerosene | 0 (0.0%) | 0 (0.0%) |
| Coal or Coke | 0 (0.0%) | 0 (0.0%) |
| All other Fuels | 0 (0.0%) | 0 (0.0%) |
| No Fuel Used | 0 (0.0%) | 0 (0.0%) |
| Total | 1,131 (100.0%) | 737 (100.0%) |
Household Vehicle Usage in Hazard
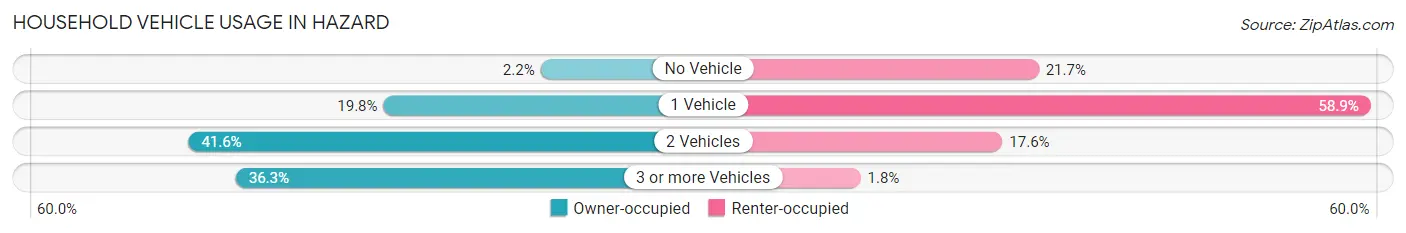
| Vehicles per Household | Owner-occupied | Renter-occupied |
| No Vehicle | 25 (2.2%) | 160 (21.7%) |
| 1 Vehicle | 224 (19.8%) | 434 (58.9%) |
| 2 Vehicles | 471 (41.6%) | 130 (17.6%) |
| 3 or more Vehicles | 411 (36.3%) | 13 (1.8%) |
| Total | 1,131 (100.0%) | 737 (100.0%) |
Real Estate & Mortgages in Hazard
Real Estate and Mortgage Overview in Hazard
| Characteristic | Without Mortgage | With Mortgage |
| Housing Units | 355 | 776 |
| Median Property Value | $120,100 | $162,500 |
| Median Household Income | $78,359 | $182 |
| Monthly Housing Costs | $477 | $66 |
| Real Estate Taxes | $918 | $13 |
Property Value by Mortgage Status in Hazard
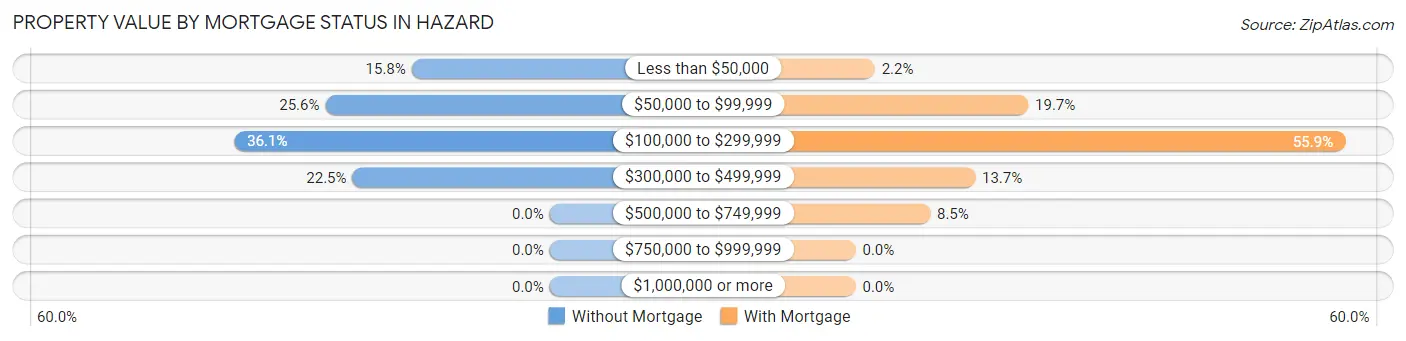
| Property Value | Without Mortgage | With Mortgage |
| Less than $50,000 | 56 (15.8%) | 17 (2.2%) |
| $50,000 to $99,999 | 91 (25.6%) | 153 (19.7%) |
| $100,000 to $299,999 | 128 (36.1%) | 434 (55.9%) |
| $300,000 to $499,999 | 80 (22.5%) | 106 (13.7%) |
| $500,000 to $749,999 | 0 (0.0%) | 66 (8.5%) |
| $750,000 to $999,999 | 0 (0.0%) | 0 (0.0%) |
| $1,000,000 or more | 0 (0.0%) | 0 (0.0%) |
| Total | 355 (100.0%) | 776 (100.0%) |
Household Income by Mortgage Status in Hazard
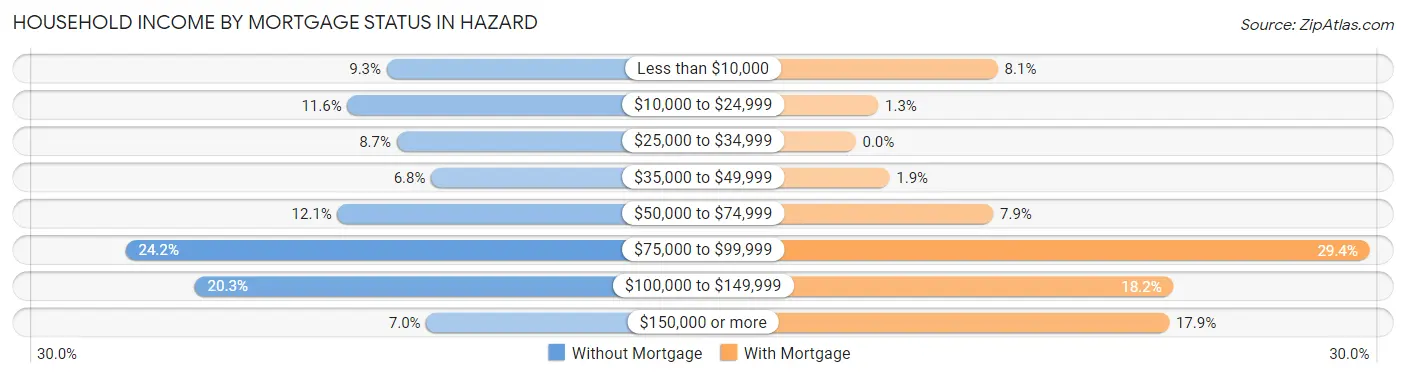
| Household Income | Without Mortgage | With Mortgage |
| Less than $10,000 | 33 (9.3%) | 63 (8.1%) |
| $10,000 to $24,999 | 41 (11.6%) | 10 (1.3%) |
| $25,000 to $34,999 | 31 (8.7%) | 0 (0.0%) |
| $35,000 to $49,999 | 24 (6.8%) | 15 (1.9%) |
| $50,000 to $74,999 | 43 (12.1%) | 61 (7.9%) |
| $75,000 to $99,999 | 86 (24.2%) | 228 (29.4%) |
| $100,000 to $149,999 | 72 (20.3%) | 141 (18.2%) |
| $150,000 or more | 25 (7.0%) | 139 (17.9%) |
| Total | 355 (100.0%) | 776 (100.0%) |
Property Value to Household Income Ratio in Hazard
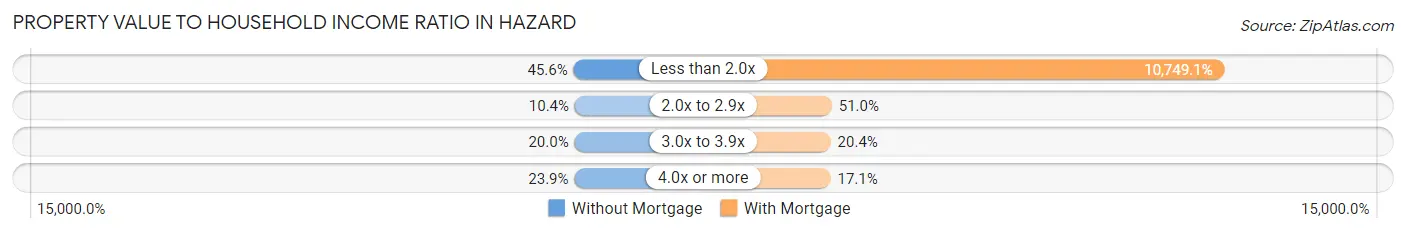
| Value-to-Income Ratio | Without Mortgage | With Mortgage |
| Less than 2.0x | 162 (45.6%) | 83,413 (10,749.1%) |
| 2.0x to 2.9x | 37 (10.4%) | 396 (51.0%) |
| 3.0x to 3.9x | 71 (20.0%) | 158 (20.4%) |
| 4.0x or more | 85 (23.9%) | 133 (17.1%) |
| Total | 355 (100.0%) | 776 (100.0%) |
Real Estate Taxes by Mortgage Status in Hazard
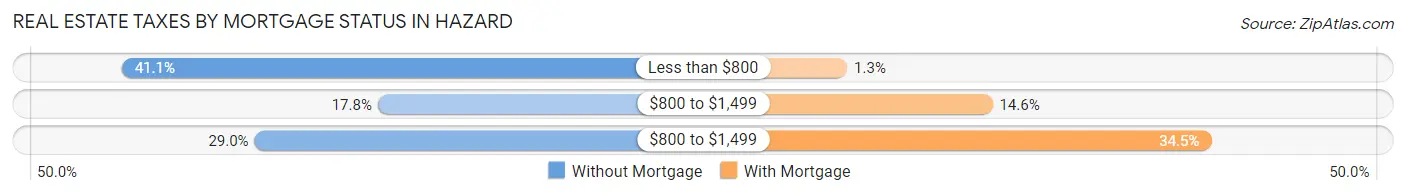
| Property Taxes | Without Mortgage | With Mortgage |
| Less than $800 | 146 (41.1%) | 10 (1.3%) |
| $800 to $1,499 | 63 (17.7%) | 113 (14.6%) |
| $800 to $1,499 | 103 (29.0%) | 268 (34.5%) |
| Total | 355 (100.0%) | 776 (100.0%) |
Health & Disability in Hazard
Health Insurance Coverage by Age in Hazard
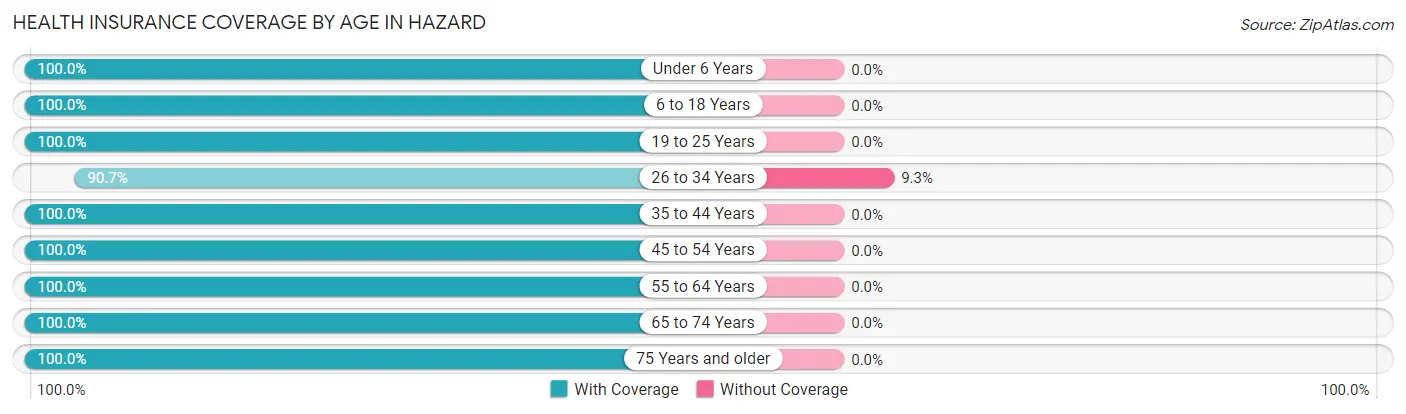
| Age Bracket | With Coverage | Without Coverage |
| Under 6 Years | 381 (100.0%) | 0 (0.0%) |
| 6 to 18 Years | 949 (100.0%) | 0 (0.0%) |
| 19 to 25 Years | 278 (100.0%) | 0 (0.0%) |
| 26 to 34 Years | 487 (90.7%) | 50 (9.3%) |
| 35 to 44 Years | 613 (100.0%) | 0 (0.0%) |
| 45 to 54 Years | 788 (100.0%) | 0 (0.0%) |
| 55 to 64 Years | 599 (100.0%) | 0 (0.0%) |
| 65 to 74 Years | 377 (100.0%) | 0 (0.0%) |
| 75 Years and older | 123 (100.0%) | 0 (0.0%) |
| Total | 4,595 (98.9%) | 50 (1.1%) |
Health Insurance Coverage by Citizenship Status in Hazard
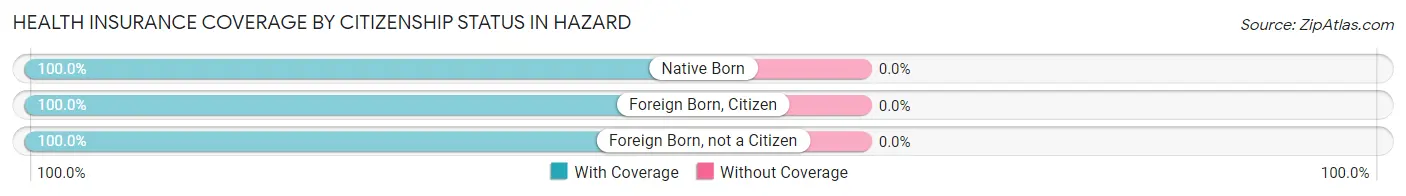
| Citizenship Status | With Coverage | Without Coverage |
| Native Born | 381 (100.0%) | 0 (0.0%) |
| Foreign Born, Citizen | 949 (100.0%) | 0 (0.0%) |
| Foreign Born, not a Citizen | 278 (100.0%) | 0 (0.0%) |
Health Insurance Coverage by Household Income in Hazard
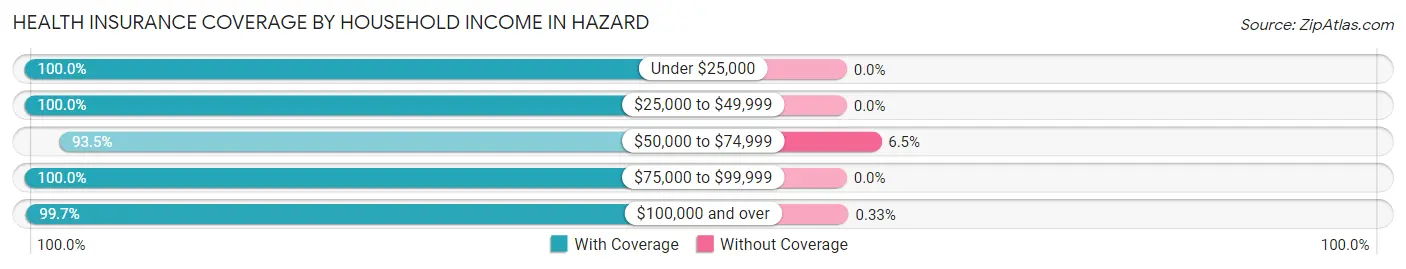
| Household Income | With Coverage | Without Coverage |
| Under $25,000 | 1,107 (100.0%) | 0 (0.0%) |
| $25,000 to $49,999 | 545 (100.0%) | 0 (0.0%) |
| $50,000 to $74,999 | 652 (93.5%) | 45 (6.5%) |
| $75,000 to $99,999 | 757 (100.0%) | 0 (0.0%) |
| $100,000 and over | 1,506 (99.7%) | 5 (0.3%) |
Public vs Private Health Insurance Coverage by Age in Hazard
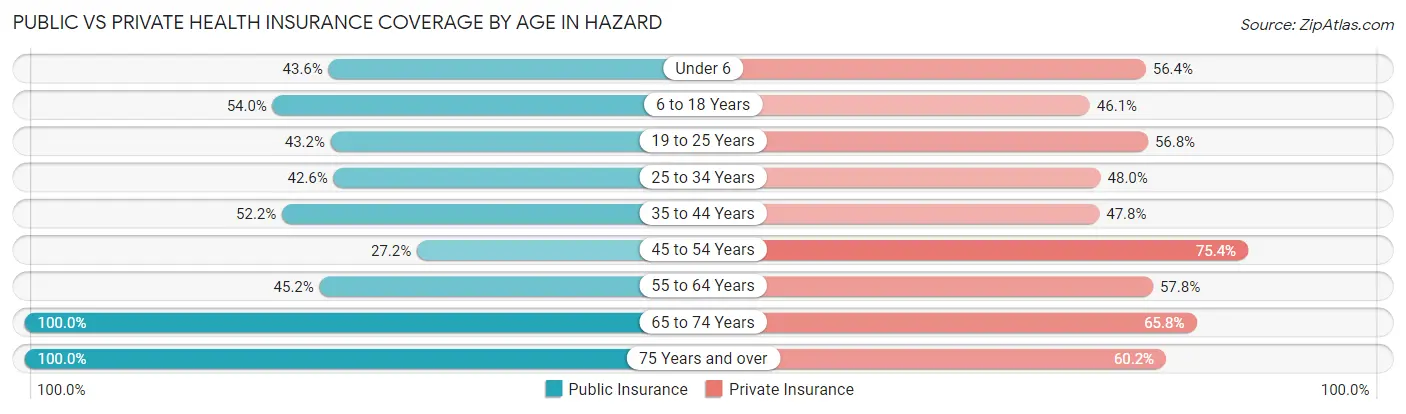
| Age Bracket | Public Insurance | Private Insurance |
| Under 6 | 166 (43.6%) | 215 (56.4%) |
| 6 to 18 Years | 512 (53.9%) | 437 (46.1%) |
| 19 to 25 Years | 120 (43.2%) | 158 (56.8%) |
| 25 to 34 Years | 229 (42.6%) | 258 (48.0%) |
| 35 to 44 Years | 320 (52.2%) | 293 (47.8%) |
| 45 to 54 Years | 214 (27.2%) | 594 (75.4%) |
| 55 to 64 Years | 271 (45.2%) | 346 (57.8%) |
| 65 to 74 Years | 377 (100.0%) | 248 (65.8%) |
| 75 Years and over | 123 (100.0%) | 74 (60.2%) |
| Total | 2,332 (50.2%) | 2,623 (56.5%) |
Disability Status by Sex by Age in Hazard
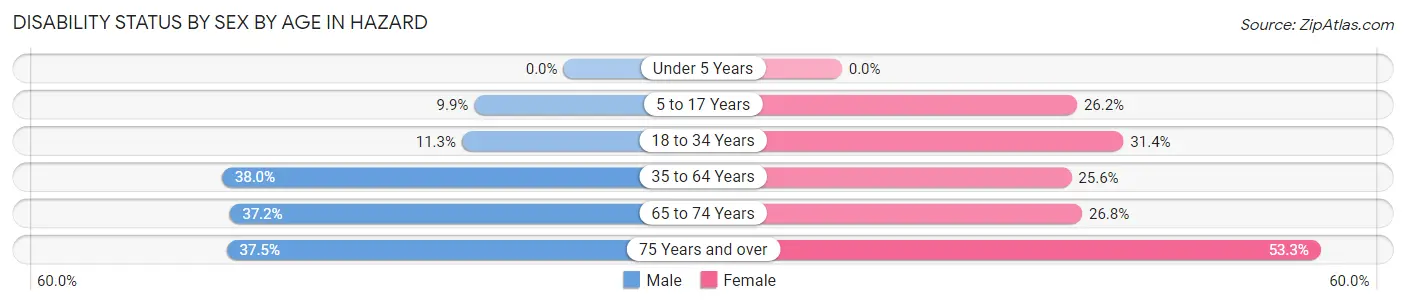
| Age Bracket | Male | Female |
| Under 5 Years | 0 (0.0%) | 0 (0.0%) |
| 5 to 17 Years | 56 (9.9%) | 88 (26.2%) |
| 18 to 34 Years | 31 (11.3%) | 185 (31.4%) |
| 35 to 64 Years | 362 (38.0%) | 268 (25.6%) |
| 65 to 74 Years | 61 (37.2%) | 57 (26.8%) |
| 75 Years and over | 18 (37.5%) | 40 (53.3%) |
Disability Class by Sex by Age in Hazard
Disability Class: Hearing Difficulty
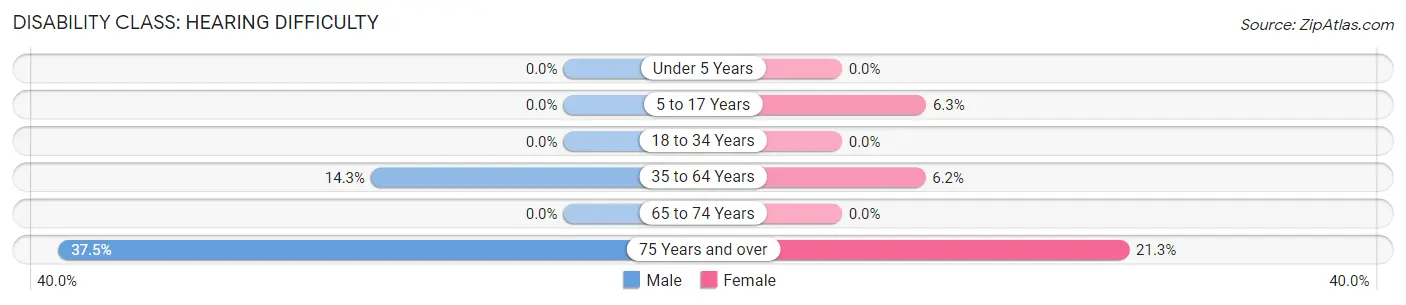
| Age Bracket | Male | Female |
| Under 5 Years | 0 (0.0%) | 0 (0.0%) |
| 5 to 17 Years | 0 (0.0%) | 21 (6.2%) |
| 18 to 34 Years | 0 (0.0%) | 0 (0.0%) |
| 35 to 64 Years | 136 (14.3%) | 65 (6.2%) |
| 65 to 74 Years | 0 (0.0%) | 0 (0.0%) |
| 75 Years and over | 18 (37.5%) | 16 (21.3%) |
Disability Class: Vision Difficulty
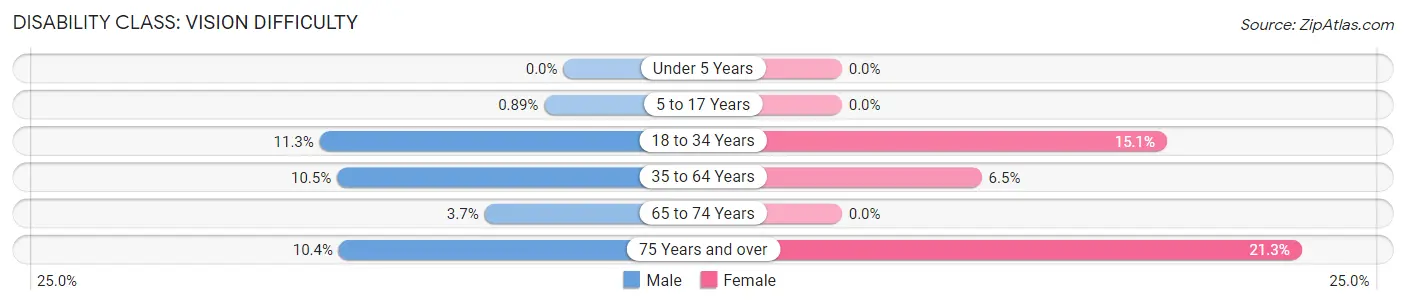
| Age Bracket | Male | Female |
| Under 5 Years | 0 (0.0%) | 0 (0.0%) |
| 5 to 17 Years | 5 (0.9%) | 0 (0.0%) |
| 18 to 34 Years | 31 (11.3%) | 89 (15.1%) |
| 35 to 64 Years | 100 (10.5%) | 68 (6.5%) |
| 65 to 74 Years | 6 (3.7%) | 0 (0.0%) |
| 75 Years and over | 5 (10.4%) | 16 (21.3%) |
Disability Class: Cognitive Difficulty
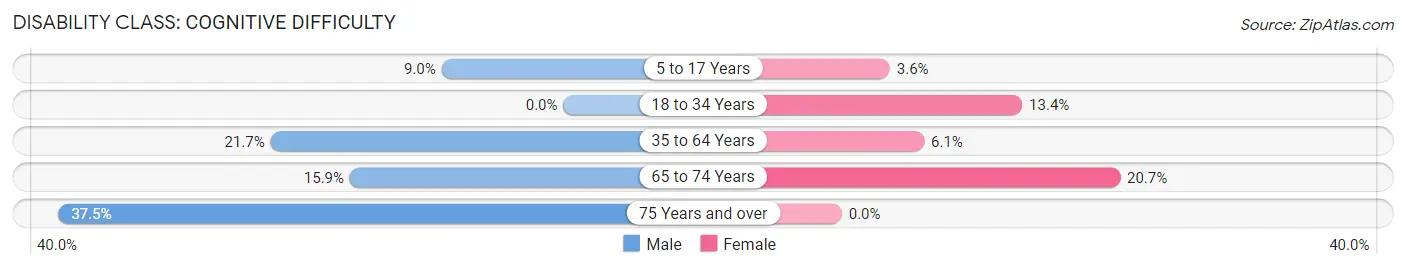
| Age Bracket | Male | Female |
| 5 to 17 Years | 51 (9.0%) | 12 (3.6%) |
| 18 to 34 Years | 0 (0.0%) | 79 (13.4%) |
| 35 to 64 Years | 207 (21.7%) | 64 (6.1%) |
| 65 to 74 Years | 26 (15.9%) | 44 (20.7%) |
| 75 Years and over | 18 (37.5%) | 0 (0.0%) |
Disability Class: Ambulatory Difficulty
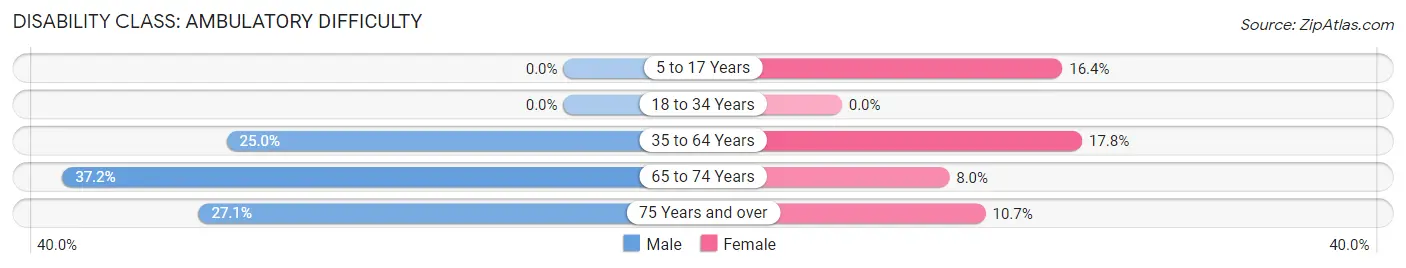
| Age Bracket | Male | Female |
| 5 to 17 Years | 0 (0.0%) | 55 (16.4%) |
| 18 to 34 Years | 0 (0.0%) | 0 (0.0%) |
| 35 to 64 Years | 238 (25.0%) | 187 (17.8%) |
| 65 to 74 Years | 61 (37.2%) | 17 (8.0%) |
| 75 Years and over | 13 (27.1%) | 8 (10.7%) |
Disability Class: Self-Care Difficulty
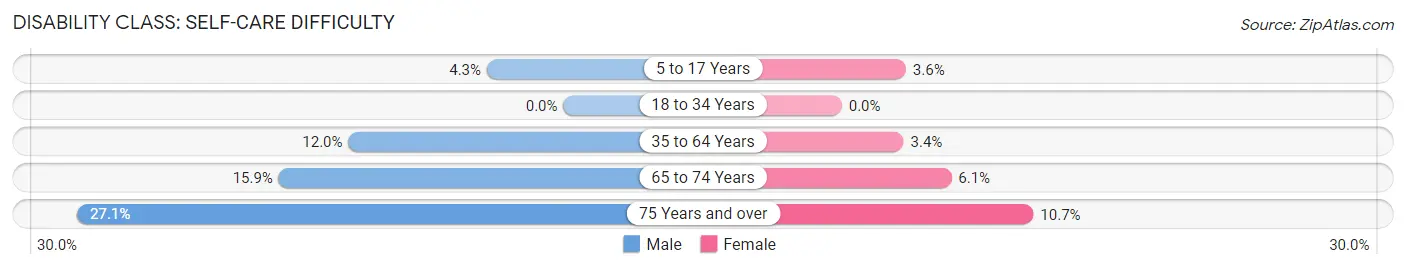
| Age Bracket | Male | Female |
| 5 to 17 Years | 24 (4.3%) | 12 (3.6%) |
| 18 to 34 Years | 0 (0.0%) | 0 (0.0%) |
| 35 to 64 Years | 114 (12.0%) | 36 (3.4%) |
| 65 to 74 Years | 26 (15.9%) | 13 (6.1%) |
| 75 Years and over | 13 (27.1%) | 8 (10.7%) |
Technology Access in Hazard
Computing Device Access in Hazard
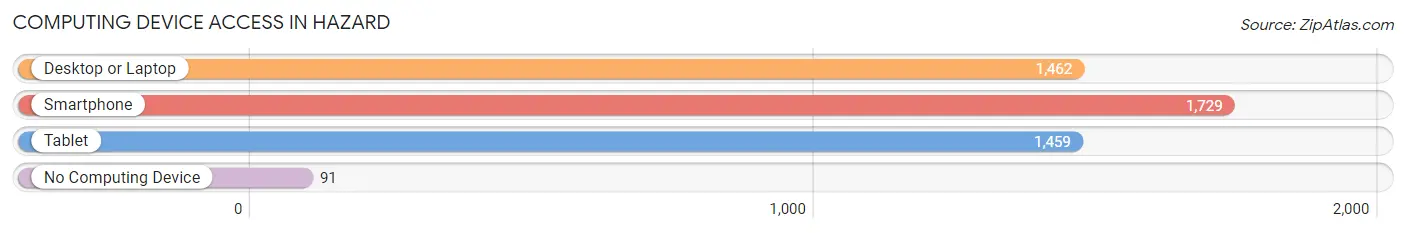
| Device Type | # Households | % Households |
| Desktop or Laptop | 1,462 | 78.3% |
| Smartphone | 1,729 | 92.6% |
| Tablet | 1,459 | 78.1% |
| No Computing Device | 91 | 4.9% |
| Total | 1,868 | 100.0% |
Internet Access in Hazard
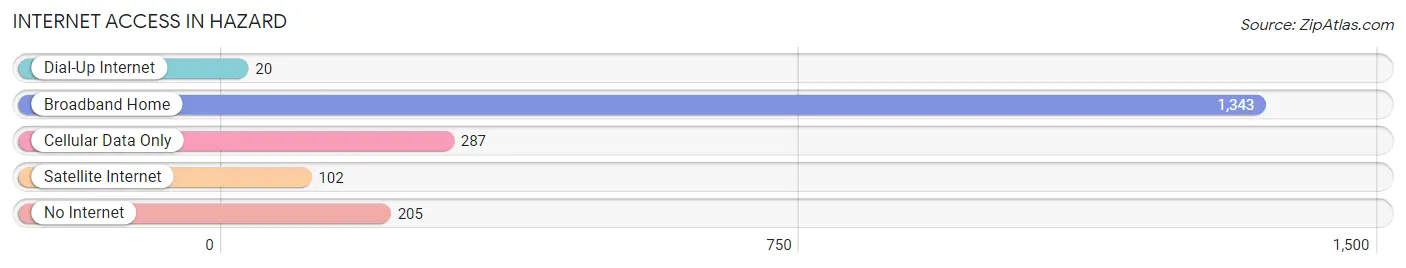
| Internet Type | # Households | % Households |
| Dial-Up Internet | 20 | 1.1% |
| Broadband Home | 1,343 | 71.9% |
| Cellular Data Only | 287 | 15.4% |
| Satellite Internet | 102 | 5.5% |
| No Internet | 205 | 11.0% |
| Total | 1,868 | 100.0% |
Hazard Summary
Hazard, Kentucky is a small city located in the Appalachian Mountains of Eastern Kentucky. It is the county seat of Perry County and is situated along the North Fork of the Kentucky River. The city has a population of 5,346 as of the 2010 census and is the principal city of the Hazard Micropolitan Statistical Area.
History
Hazard was founded in 1884 by John C. Hazard, a former Confederate soldier and entrepreneur. He purchased the land from the local Native Americans and named the town after himself. The town was incorporated in 1887 and quickly became a hub for the timber and coal industries. The town was also home to a number of businesses, including a hotel, a bank, and a newspaper.
In the early 1900s, Hazard experienced a period of growth and prosperity. The town was home to a number of businesses, including a furniture factory, a flour mill, and a brickyard. The town also had a number of churches, schools, and a hospital.
In the 1920s, the timber and coal industries began to decline, and the town experienced a period of economic decline. The Great Depression further exacerbated the economic situation, and the town experienced a period of stagnation.
In the 1950s, the town began to experience a period of revitalization. The town was home to a number of new businesses, including a furniture factory, a clothing store, and a grocery store. The town also had a number of new churches, schools, and a hospital.
In the 1960s, the town experienced a period of growth and prosperity. The town was home to a number of new businesses, including a furniture factory, a clothing store, and a grocery store. The town also had a number of new churches, schools, and a hospital.
In the 1970s, the town experienced a period of decline. The timber and coal industries continued to decline, and the town experienced a period of economic decline. The town was also home to a number of new businesses, including a furniture factory, a clothing store, and a grocery store.
In the 1980s, the town experienced a period of revitalization. The town was home to a number of new businesses, including a furniture factory, a clothing store, and a grocery store. The town also had a number of new churches, schools, and a hospital.
Geography
Hazard is located in the Appalachian Mountains of Eastern Kentucky. The city is situated along the North Fork of the Kentucky River. The city has a total area of 4.2 square miles, all of which is land. The city has a humid subtropical climate, with hot, humid summers and mild winters.
Economy
Hazard’s economy is largely based on the timber and coal industries. The city is home to a number of businesses, including a furniture factory, a clothing store, and a grocery store. The city is also home to a number of churches, schools, and a hospital.
Demographics
As of the 2010 census, the city had a population of 5,346. The racial makeup of the city was 95.3% White, 2.2% African American, 0.3% Native American, 0.2% Asian, 0.1% Pacific Islander, 0.7% from other races, and 1.3% from two or more races. Hispanic or Latino of any race were 1.7% of the population.
The median income for a household in the city was $25,938, and the median income for a family was $31,944. The per capita income for the city was $14,945. About 22.2% of families and 25.3% of the population were below the poverty line, including 33.3% of those under age 18 and 18.2% of those age 65 or over.
Common Questions
What is Per Capita Income in Hazard?
Per Capita income in Hazard is $43,539.
What is the Median Family Income in Hazard?
Median Family Income in Hazard is $65,165.
What is the Median Household income in Hazard?
Median Household Income in Hazard is $65,846.
What is Income or Wage Gap in Hazard?
Income or Wage Gap in Hazard is 26.8%.
Women in Hazard earn 73.2 cents for every dollar earned by a man.
What is Inequality or Gini Index in Hazard?
Inequality or Gini Index in Hazard is 0.66.
What is the Total Population of Hazard?
Total Population of Hazard is 5,194.
What is the Total Male Population of Hazard?
Total Male Population of Hazard is 2,582.
What is the Total Female Population of Hazard?
Total Female Population of Hazard is 2,612.
What is the Ratio of Males per 100 Females in Hazard?
There are 98.85 Males per 100 Females in Hazard.
What is the Ratio of Females per 100 Males in Hazard?
There are 101.16 Females per 100 Males in Hazard.
What is the Median Population Age in Hazard?
Median Population Age in Hazard is 40.3 Years.
What is the Average Family Size in Hazard
Average Family Size in Hazard is 2.8 People.
What is the Average Household Size in Hazard
Average Household Size in Hazard is 2.5 People.
How Large is the Labor Force in Hazard?
There are 1,915 People in the Labor Forcein in Hazard.
What is the Percentage of People in the Labor Force in Hazard?
47.3% of People are in the Labor Force in Hazard.
What is the Unemployment Rate in Hazard?
Unemployment Rate in Hazard is 11.2%.