Grand Rivers, KY Map & Demographics
Grand Rivers Map
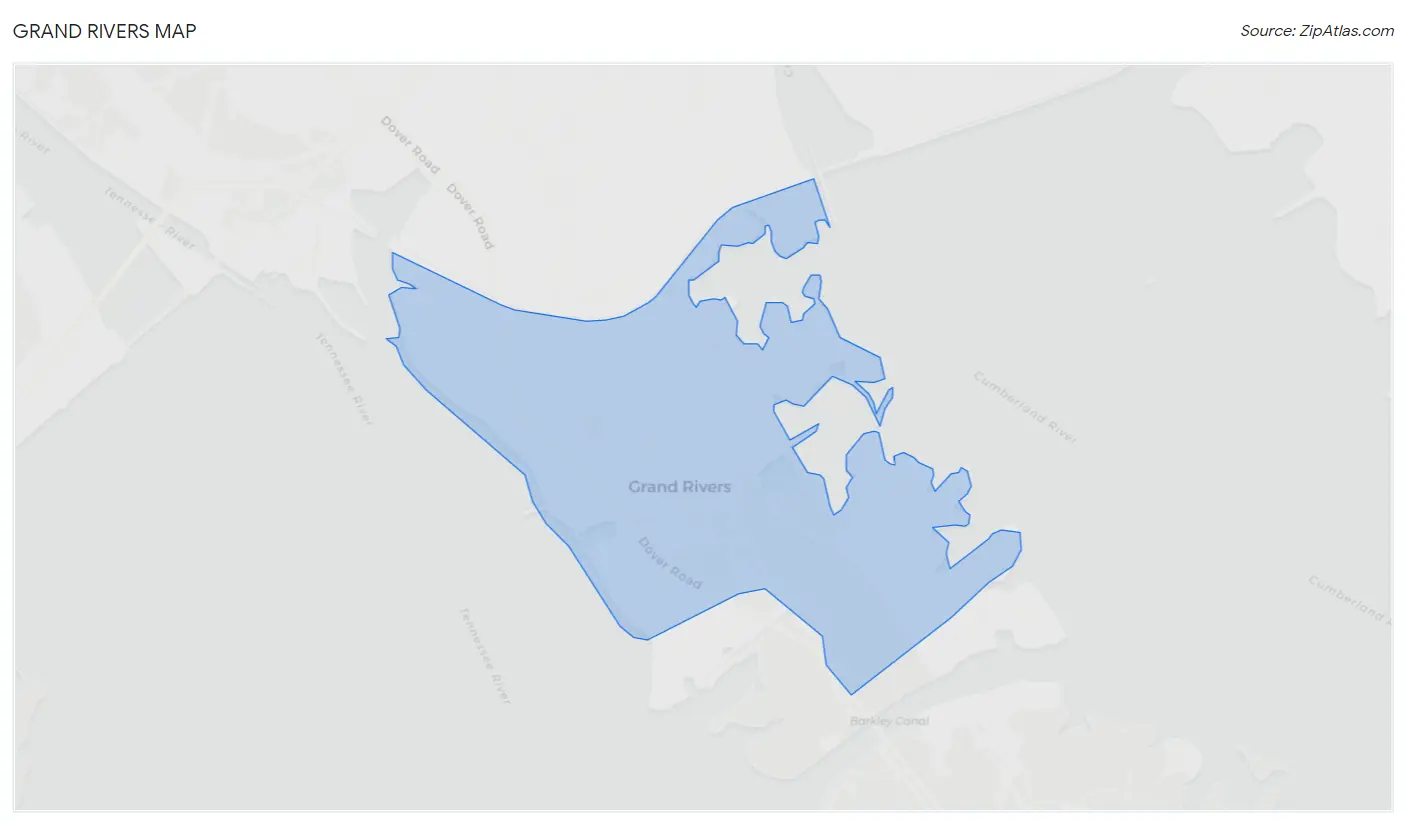
Grand Rivers Overview
$53,034
PER CAPITA INCOME
$76,250
AVG FAMILY INCOME
$60,625
AVG HOUSEHOLD INCOME
0.60
INEQUALITY / GINI INDEX
432
TOTAL POPULATION
208
MALE POPULATION
224
FEMALE POPULATION
92.86
MALES / 100 FEMALES
107.69
FEMALES / 100 MALES
58.6
MEDIAN AGE
2.6
AVG FAMILY SIZE
2.2
AVG HOUSEHOLD SIZE
178
LABOR FORCE [ PEOPLE ]
46.0%
PERCENT IN LABOR FORCE
2.2%
UNEMPLOYMENT RATE
Grand Rivers Zip Codes
Grand Rivers Area Codes
Income in Grand Rivers
Income Overview in Grand Rivers
Per Capita Income in Grand Rivers is $53,034, while median incomes of families and households are $76,250 and $60,625 respectively.
| Characteristic | Number | Measure |
| Per Capita Income | 432 | $53,034 |
| Median Family Income | 131 | $76,250 |
| Mean Family Income | 131 | $154,655 |
| Median Household Income | 198 | $60,625 |
| Mean Household Income | 198 | $118,354 |
| Income Deficit | 131 | $0 |
| Wage / Income Gap (%) | 432 | 0.00% |
| Wage / Income Gap ($) | 432 | 100.00¢ per $1 |
| Gini / Inequality Index | 432 | 0.60 |
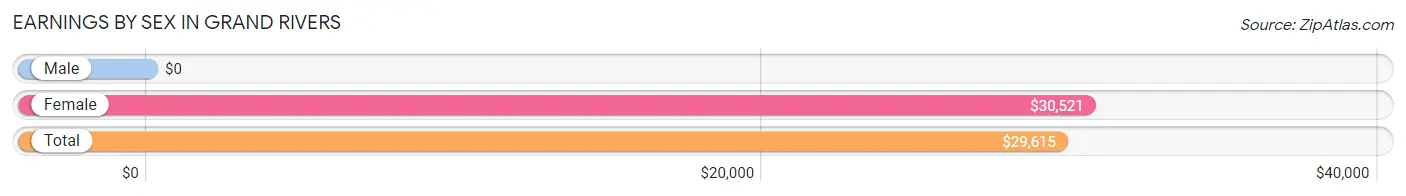
Earnings by Sex in Grand Rivers
| Sex | Number | Average Earnings |
| Male | 115 (63.9%) | $0 |
| Female | 65 (36.1%) | $30,521 |
| Total | 180 (100.0%) | $29,615 |
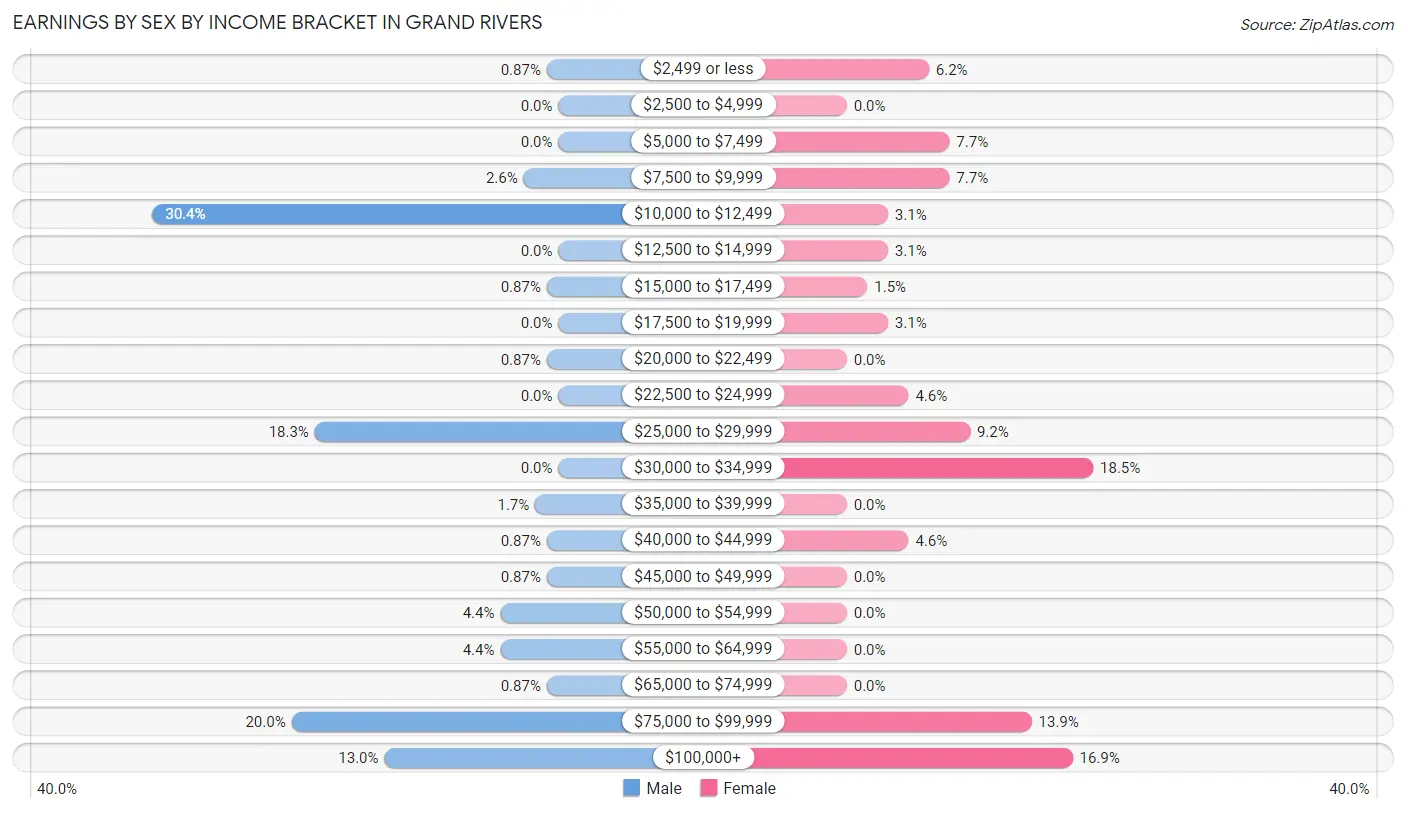
Earnings by Sex by Income Bracket in Grand Rivers
The most common earnings brackets in Grand Rivers are $10,000 to $12,499 for men (35 | 30.4%) and $30,000 to $34,999 for women (12 | 18.5%).
| Income | Male | Female |
| $2,499 or less | 1 (0.9%) | 4 (6.1%) |
| $2,500 to $4,999 | 0 (0.0%) | 0 (0.0%) |
| $5,000 to $7,499 | 0 (0.0%) | 5 (7.7%) |
| $7,500 to $9,999 | 3 (2.6%) | 5 (7.7%) |
| $10,000 to $12,499 | 35 (30.4%) | 2 (3.1%) |
| $12,500 to $14,999 | 0 (0.0%) | 2 (3.1%) |
| $15,000 to $17,499 | 1 (0.9%) | 1 (1.5%) |
| $17,500 to $19,999 | 0 (0.0%) | 2 (3.1%) |
| $20,000 to $22,499 | 1 (0.9%) | 0 (0.0%) |
| $22,500 to $24,999 | 0 (0.0%) | 3 (4.6%) |
| $25,000 to $29,999 | 21 (18.3%) | 6 (9.2%) |
| $30,000 to $34,999 | 0 (0.0%) | 12 (18.5%) |
| $35,000 to $39,999 | 2 (1.7%) | 0 (0.0%) |
| $40,000 to $44,999 | 1 (0.9%) | 3 (4.6%) |
| $45,000 to $49,999 | 1 (0.9%) | 0 (0.0%) |
| $50,000 to $54,999 | 5 (4.3%) | 0 (0.0%) |
| $55,000 to $64,999 | 5 (4.3%) | 0 (0.0%) |
| $65,000 to $74,999 | 1 (0.9%) | 0 (0.0%) |
| $75,000 to $99,999 | 23 (20.0%) | 9 (13.9%) |
| $100,000+ | 15 (13.0%) | 11 (16.9%) |
| Total | 115 (100.0%) | 65 (100.0%) |
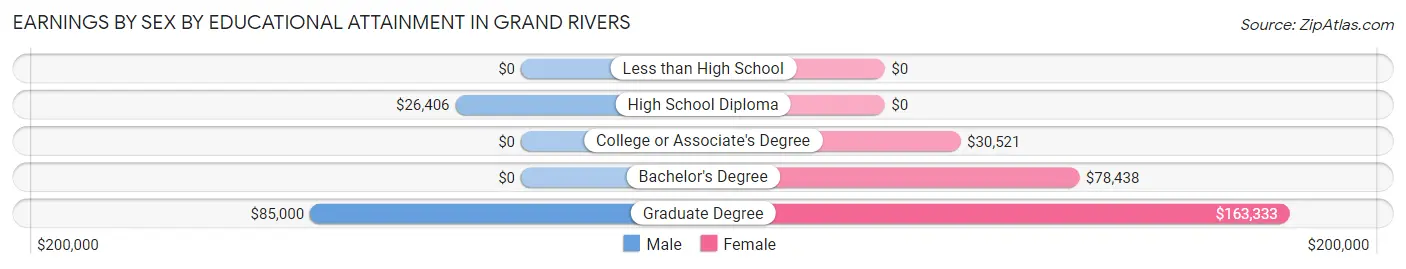
Earnings by Sex by Educational Attainment in Grand Rivers
| Educational Attainment | Male Income | Female Income |
| Less than High School | - | - |
| High School Diploma | $26,406 | $0 |
| College or Associate's Degree | - | - |
| Bachelor's Degree | - | - |
| Graduate Degree | $85,000 | $163,333 |
| Total | - | - |
Family Income in Grand Rivers
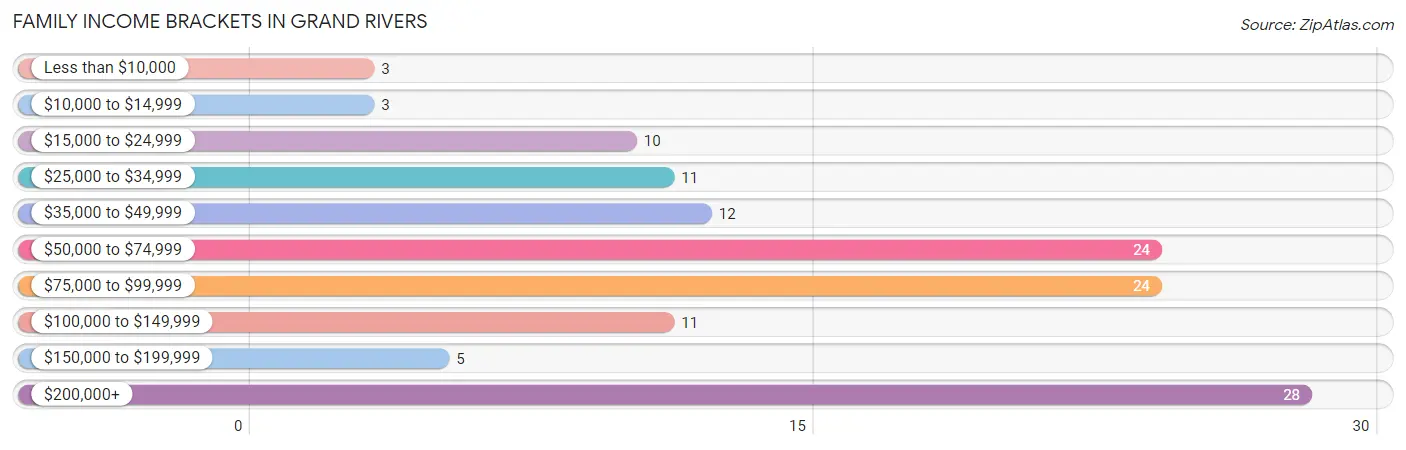
Family Income Brackets in Grand Rivers
According to the Grand Rivers family income data, there are 28 families falling into the $200,000+ income range, which is the most common income bracket and makes up 21.4% of all families. Conversely, the less than $10,000 income bracket is the least frequent group with only 3 families (2.3%) belonging to this category.
| Income Bracket | # Families | % Families |
| Less than $10,000 | 3 | 2.3% |
| $10,000 to $14,999 | 3 | 2.3% |
| $15,000 to $24,999 | 10 | 7.6% |
| $25,000 to $34,999 | 11 | 8.4% |
| $35,000 to $49,999 | 12 | 9.2% |
| $50,000 to $74,999 | 24 | 18.3% |
| $75,000 to $99,999 | 24 | 18.3% |
| $100,000 to $149,999 | 11 | 8.4% |
| $150,000 to $199,999 | 5 | 3.8% |
| $200,000+ | 28 | 21.4% |
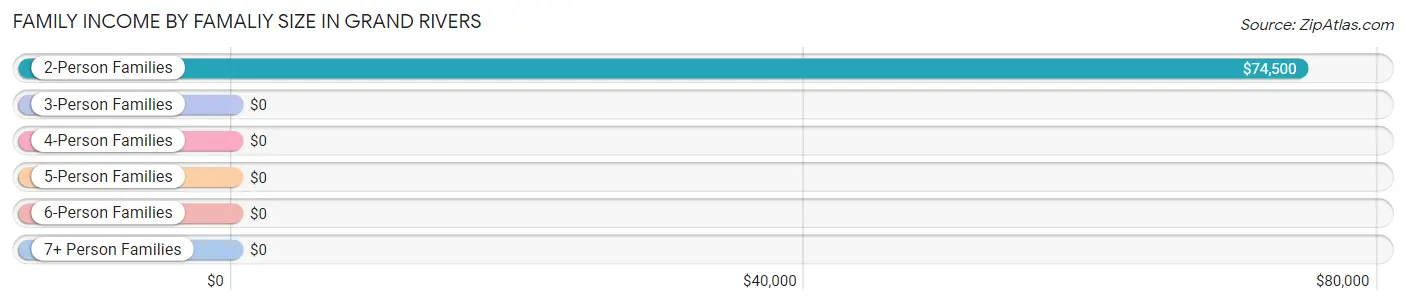
Family Income by Famaliy Size in Grand Rivers
2-person families (108 | 82.4%) account for the highest median family income in Grand Rivers with $74,500 per family, while 2-person families (108 | 82.4%) have the highest median income of $37,250 per family member.
| Income Bracket | # Families | Median Income |
| 2-Person Families | 108 (82.4%) | $74,500 |
| 3-Person Families | 12 (9.2%) | $0 |
| 4-Person Families | 3 (2.3%) | $0 |
| 5-Person Families | 0 (0.0%) | $0 |
| 6-Person Families | 8 (6.1%) | $0 |
| 7+ Person Families | 0 (0.0%) | $0 |
| Total | 131 (100.0%) | $76,250 |
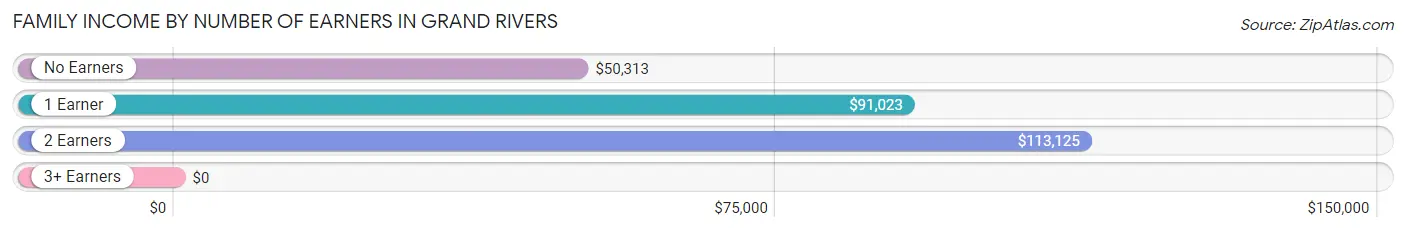
Family Income by Number of Earners in Grand Rivers
| Number of Earners | # Families | Median Income |
| No Earners | 51 (38.9%) | $50,313 |
| 1 Earner | 39 (29.8%) | $91,023 |
| 2 Earners | 40 (30.5%) | $113,125 |
| 3+ Earners | 1 (0.8%) | $0 |
| Total | 131 (100.0%) | $76,250 |
Household Income in Grand Rivers
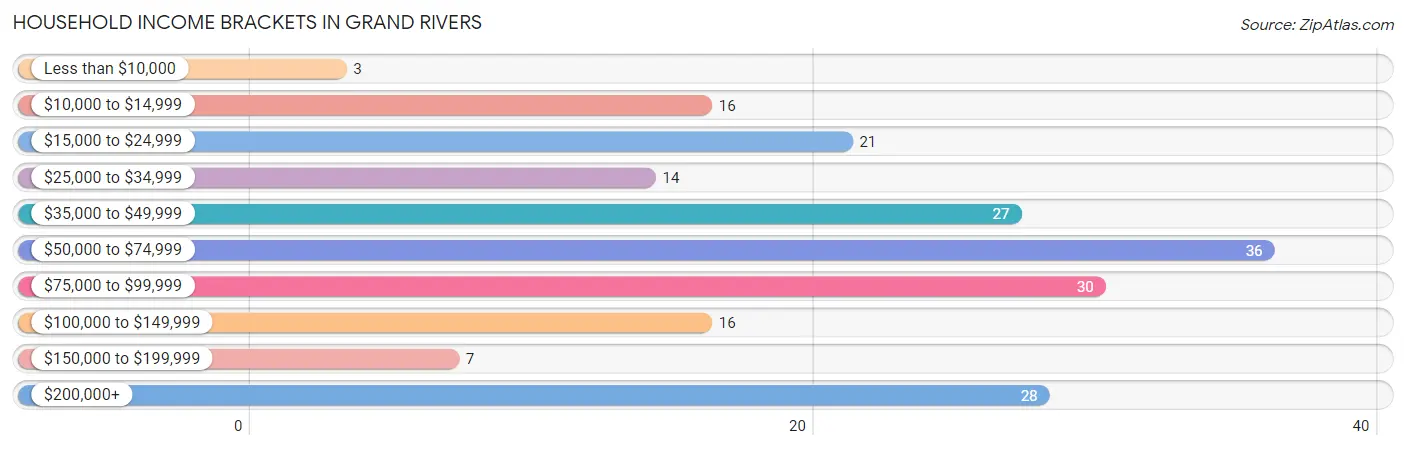
Household Income Brackets in Grand Rivers
With 36 households falling in the category, the $50,000 to $74,999 income range is the most frequent in Grand Rivers, accounting for 18.2% of all households. In contrast, only 3 households (1.5%) fall into the less than $10,000 income bracket, making it the least populous group.
| Income Bracket | # Households | % Households |
| Less than $10,000 | 3 | 1.5% |
| $10,000 to $14,999 | 16 | 8.1% |
| $15,000 to $24,999 | 21 | 10.6% |
| $25,000 to $34,999 | 14 | 7.1% |
| $35,000 to $49,999 | 27 | 13.6% |
| $50,000 to $74,999 | 36 | 18.2% |
| $75,000 to $99,999 | 30 | 15.2% |
| $100,000 to $149,999 | 16 | 8.1% |
| $150,000 to $199,999 | 7 | 3.5% |
| $200,000+ | 28 | 14.1% |
Household Income by Householder Age in Grand Rivers
The median household income in Grand Rivers is $60,625, with the highest median household income of $87,250 found in the 45 to 64 years age bracket for the primary householder. A total of 73 households (36.9%) fall into this category. Meanwhile, the 15 to 24 years age bracket for the primary householder has the lowest median household income of $0, with 3 households (1.5%) in this group.
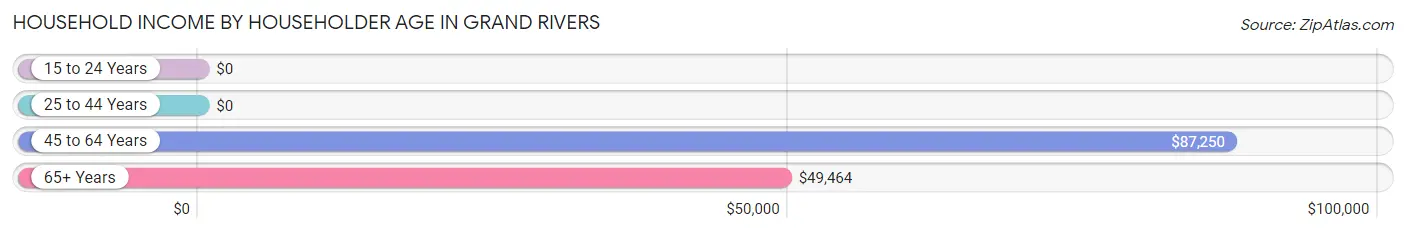
| Income Bracket | # Households | Median Income |
| 15 to 24 Years | 3 (1.5%) | $0 |
| 25 to 44 Years | 25 (12.6%) | $0 |
| 45 to 64 Years | 73 (36.9%) | $87,250 |
| 65+ Years | 97 (49.0%) | $49,464 |
| Total | 198 (100.0%) | $60,625 |
Poverty in Grand Rivers
Income Below Poverty by Sex and Age in Grand Rivers
With 6.7% poverty level for males and 18.3% for females among the residents of Grand Rivers, 35 to 44 year old males and 18 to 24 year old females are the most vulnerable to poverty, with 11 males (50.0%) and 4 females (57.1%) in their respective age groups living below the poverty level.
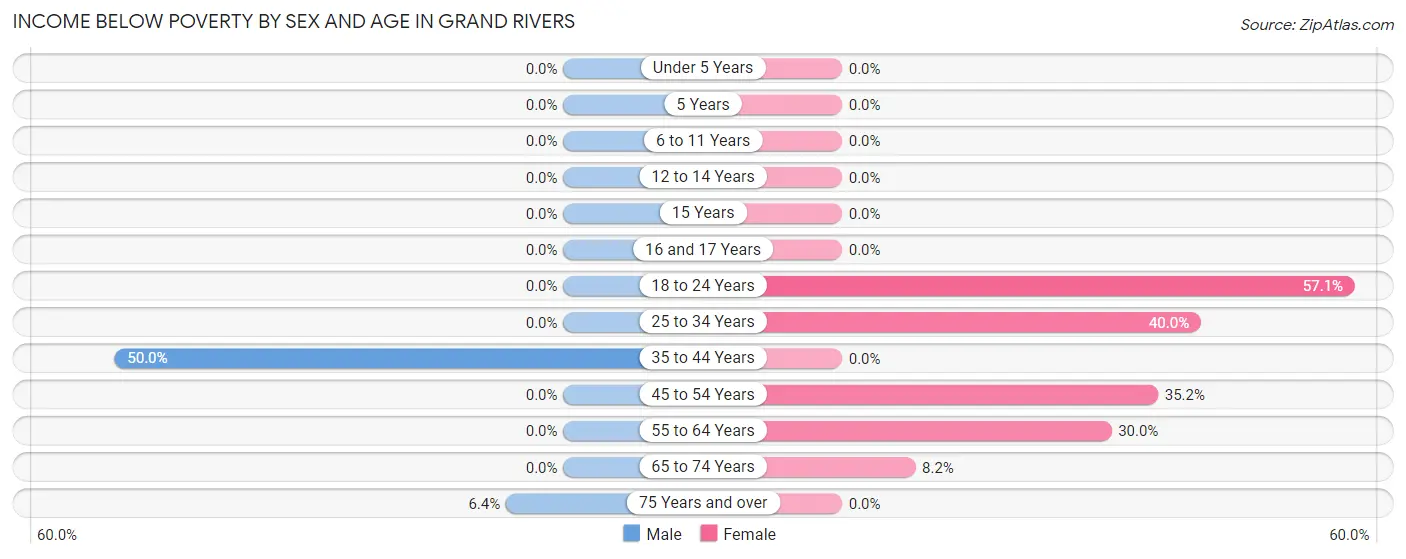
| Age Bracket | Male | Female |
| Under 5 Years | 0 (0.0%) | 0 (0.0%) |
| 5 Years | 0 (0.0%) | 0 (0.0%) |
| 6 to 11 Years | 0 (0.0%) | 0 (0.0%) |
| 12 to 14 Years | 0 (0.0%) | 0 (0.0%) |
| 15 Years | 0 (0.0%) | 0 (0.0%) |
| 16 and 17 Years | 0 (0.0%) | 0 (0.0%) |
| 18 to 24 Years | 0 (0.0%) | 4 (57.1%) |
| 25 to 34 Years | 0 (0.0%) | 8 (40.0%) |
| 35 to 44 Years | 11 (50.0%) | 0 (0.0%) |
| 45 to 54 Years | 0 (0.0%) | 19 (35.2%) |
| 55 to 64 Years | 0 (0.0%) | 6 (30.0%) |
| 65 to 74 Years | 0 (0.0%) | 4 (8.2%) |
| 75 Years and over | 3 (6.4%) | 0 (0.0%) |
| Total | 14 (6.7%) | 41 (18.3%) |
Income Above Poverty by Sex and Age in Grand Rivers
According to the poverty statistics in Grand Rivers, males aged under 5 years and females aged under 5 years are the age groups that are most secure financially, with 100.0% of males and 100.0% of females in these age groups living above the poverty line.
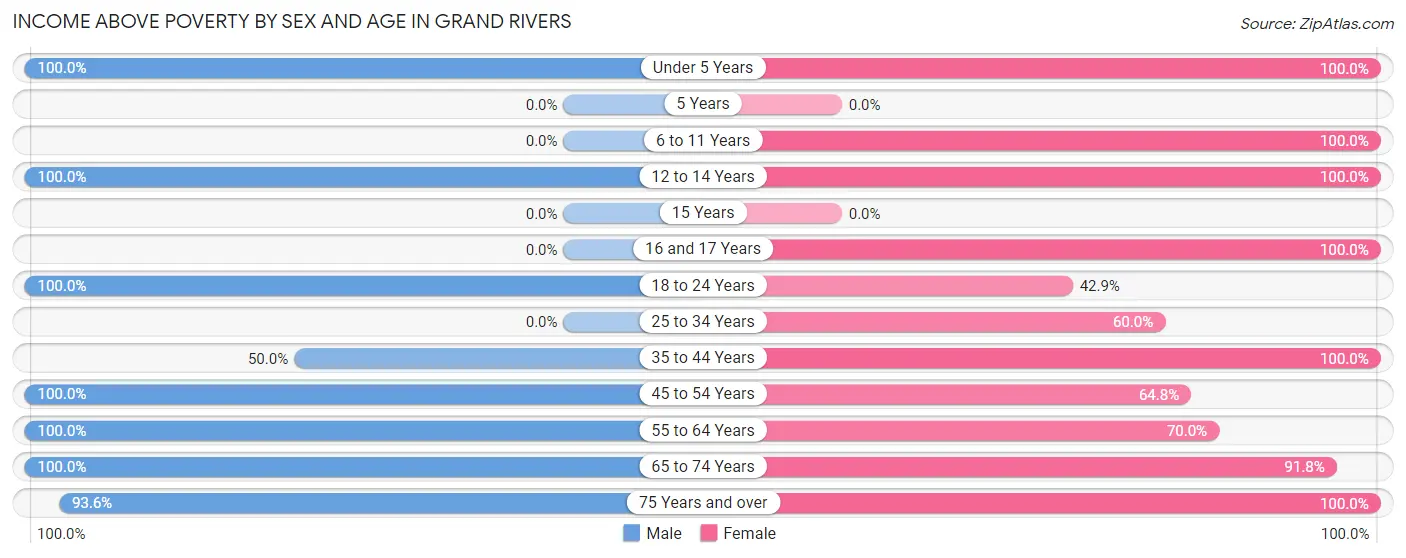
| Age Bracket | Male | Female |
| Under 5 Years | 7 (100.0%) | 1 (100.0%) |
| 5 Years | 0 (0.0%) | 0 (0.0%) |
| 6 to 11 Years | 0 (0.0%) | 9 (100.0%) |
| 12 to 14 Years | 10 (100.0%) | 18 (100.0%) |
| 15 Years | 0 (0.0%) | 0 (0.0%) |
| 16 and 17 Years | 0 (0.0%) | 2 (100.0%) |
| 18 to 24 Years | 3 (100.0%) | 3 (42.9%) |
| 25 to 34 Years | 0 (0.0%) | 12 (60.0%) |
| 35 to 44 Years | 11 (50.0%) | 13 (100.0%) |
| 45 to 54 Years | 12 (100.0%) | 35 (64.8%) |
| 55 to 64 Years | 74 (100.0%) | 14 (70.0%) |
| 65 to 74 Years | 33 (100.0%) | 45 (91.8%) |
| 75 Years and over | 44 (93.6%) | 31 (100.0%) |
| Total | 194 (93.3%) | 183 (81.7%) |
Income Below Poverty Among Married-Couple Families in Grand Rivers
The poverty statistics for married-couple families in Grand Rivers show that 2.6% or 3 of the total 114 families live below the poverty line. Families with no children have the highest poverty rate of 3.3%, comprising of 3 families. On the other hand, families with 1 or 2 children have the lowest poverty rate of 0.0%, which includes 0 families.
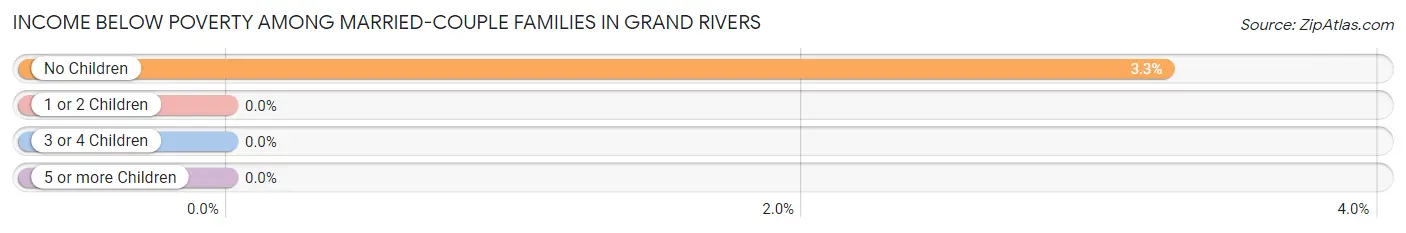
| Children | Above Poverty | Below Poverty |
| No Children | 89 (96.7%) | 3 (3.3%) |
| 1 or 2 Children | 14 (100.0%) | 0 (0.0%) |
| 3 or 4 Children | 8 (100.0%) | 0 (0.0%) |
| 5 or more Children | 0 (0.0%) | 0 (0.0%) |
| Total | 111 (97.4%) | 3 (2.6%) |
Income Below Poverty Among Single-Parent Households in Grand Rivers
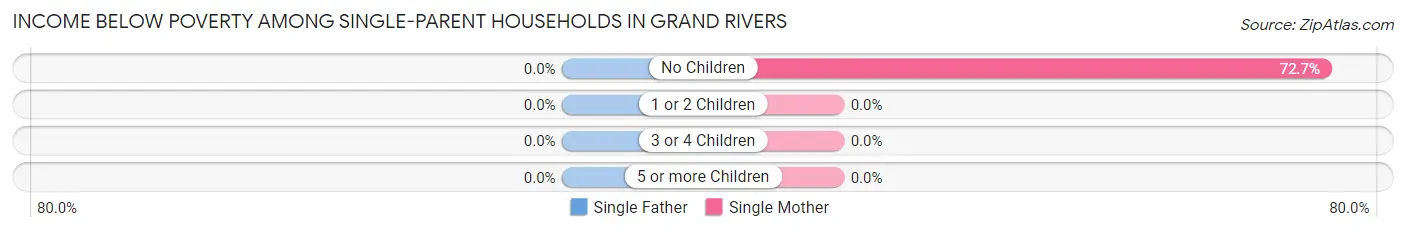
| Children | Single Father | Single Mother |
| No Children | 0 (0.0%) | 8 (72.7%) |
| 1 or 2 Children | 0 (0.0%) | 0 (0.0%) |
| 3 or 4 Children | 0 (0.0%) | 0 (0.0%) |
| 5 or more Children | 0 (0.0%) | 0 (0.0%) |
| Total | 0 (0.0%) | 8 (72.7%) |
Income Below Poverty Among Married-Couple vs Single-Parent Households in Grand Rivers
The poverty data for Grand Rivers shows that 3 of the married-couple family households (2.6%) and 8 of the single-parent households (47.1%) are living below the poverty level. Within the married-couple family households, those with no children have the highest poverty rate, with 3 households (3.3%) falling below the poverty line. Among the single-parent households, those with no children have the highest poverty rate, with 8 household (57.1%) living below poverty.
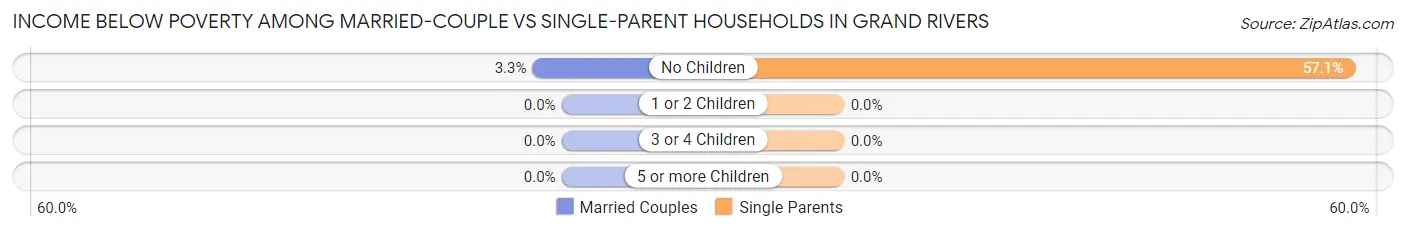
| Children | Married-Couple Families | Single-Parent Households |
| No Children | 3 (3.3%) | 8 (57.1%) |
| 1 or 2 Children | 0 (0.0%) | 0 (0.0%) |
| 3 or 4 Children | 0 (0.0%) | 0 (0.0%) |
| 5 or more Children | 0 (0.0%) | 0 (0.0%) |
| Total | 3 (2.6%) | 8 (47.1%) |
Race in Grand Rivers
The most populous races in Grand Rivers are White / Caucasian (428 | 99.1%), Hispanic or Latino (19 | 4.4%), and Two or more Races (4 | 0.9%).
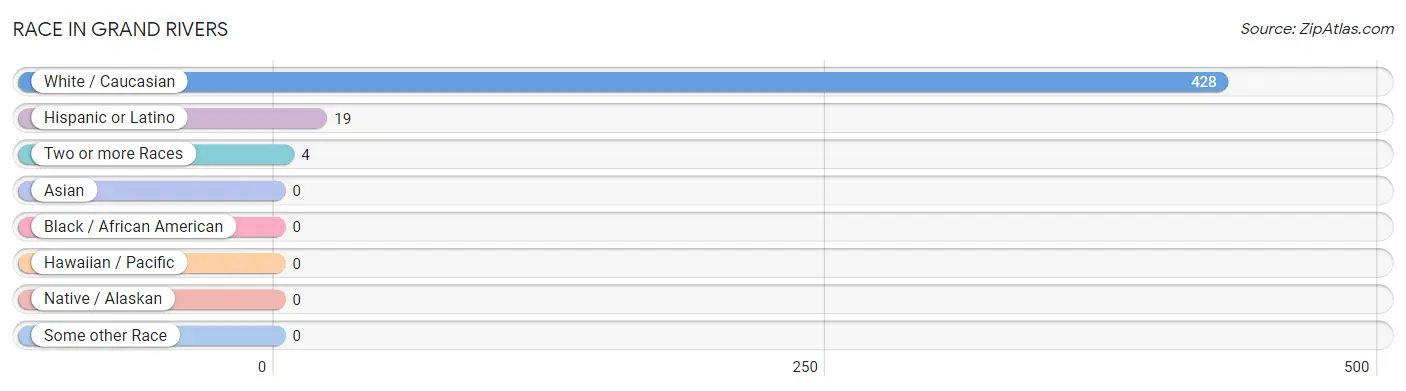
| Race | # Population | % Population |
| Asian | 0 | 0.0% |
| Black / African American | 0 | 0.0% |
| Hawaiian / Pacific | 0 | 0.0% |
| Hispanic or Latino | 19 | 4.4% |
| Native / Alaskan | 0 | 0.0% |
| White / Caucasian | 428 | 99.1% |
| Two or more Races | 4 | 0.9% |
| Some other Race | 0 | 0.0% |
| Total | 432 | 100.0% |
Ancestry in Grand Rivers
The most populous ancestries reported in Grand Rivers are German (113 | 26.2%), Irish (108 | 25.0%), English (61 | 14.1%), European (32 | 7.4%), and American (29 | 6.7%), together accounting for 79.4% of all Grand Rivers residents.
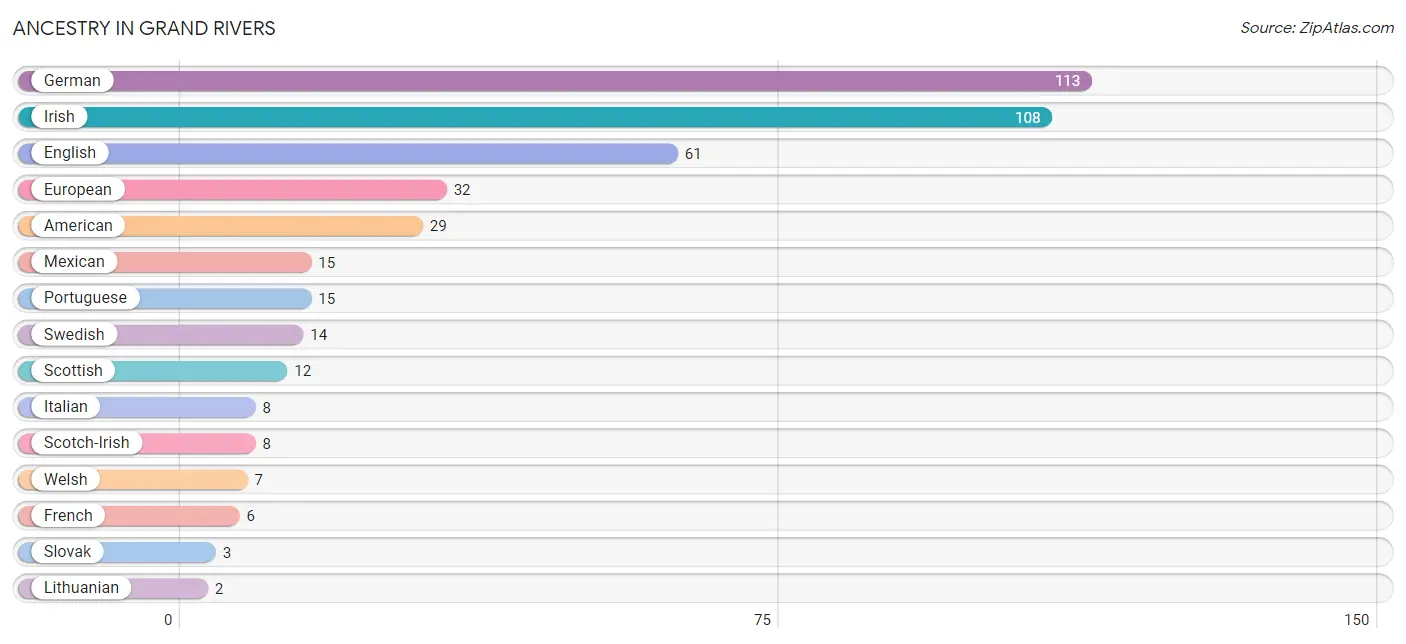
| Ancestry | # Population | % Population |
| American | 29 | 6.7% |
| British | 1 | 0.2% |
| English | 61 | 14.1% |
| European | 32 | 7.4% |
| French | 6 | 1.4% |
| French Canadian | 1 | 0.2% |
| German | 113 | 26.2% |
| Irish | 108 | 25.0% |
| Italian | 8 | 1.8% |
| Lithuanian | 2 | 0.5% |
| Mexican | 15 | 3.5% |
| Polish | 1 | 0.2% |
| Portuguese | 15 | 3.5% |
| Scotch-Irish | 8 | 1.8% |
| Scottish | 12 | 2.8% |
| Slovak | 3 | 0.7% |
| Swedish | 14 | 3.2% |
| Swiss | 1 | 0.2% |
| Ukrainian | 2 | 0.5% |
| Welsh | 7 | 1.6% | View All 20 Rows |
Immigrants in Grand Rivers

| Immigration Origin | # Population | % Population | View All 0 Rows |
Sex and Age in Grand Rivers
Sex and Age in Grand Rivers
The most populous age groups in Grand Rivers are 60 to 64 Years (41 | 19.7%) for men and 50 to 54 Years (33 | 14.7%) for women.
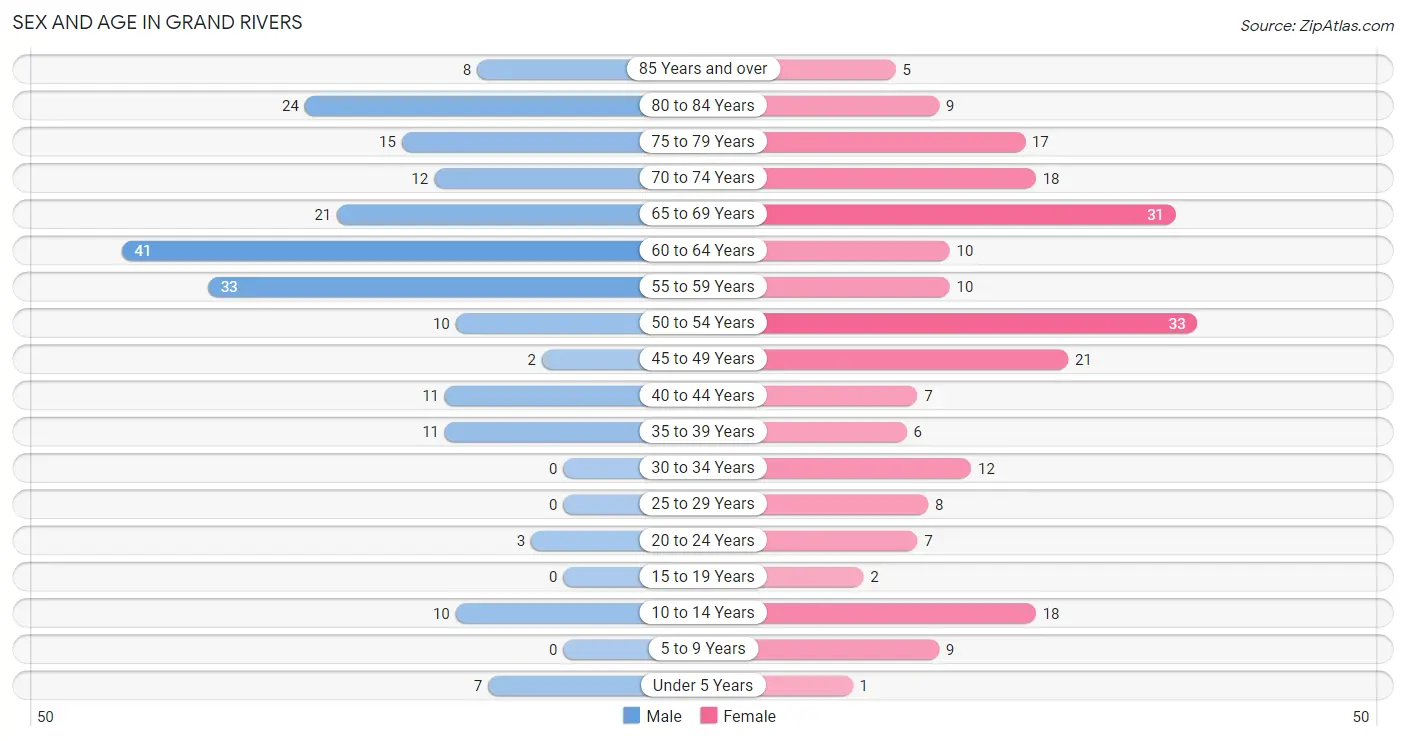
| Age Bracket | Male | Female |
| Under 5 Years | 7 (3.4%) | 1 (0.4%) |
| 5 to 9 Years | 0 (0.0%) | 9 (4.0%) |
| 10 to 14 Years | 10 (4.8%) | 18 (8.0%) |
| 15 to 19 Years | 0 (0.0%) | 2 (0.9%) |
| 20 to 24 Years | 3 (1.4%) | 7 (3.1%) |
| 25 to 29 Years | 0 (0.0%) | 8 (3.6%) |
| 30 to 34 Years | 0 (0.0%) | 12 (5.4%) |
| 35 to 39 Years | 11 (5.3%) | 6 (2.7%) |
| 40 to 44 Years | 11 (5.3%) | 7 (3.1%) |
| 45 to 49 Years | 2 (1.0%) | 21 (9.4%) |
| 50 to 54 Years | 10 (4.8%) | 33 (14.7%) |
| 55 to 59 Years | 33 (15.9%) | 10 (4.5%) |
| 60 to 64 Years | 41 (19.7%) | 10 (4.5%) |
| 65 to 69 Years | 21 (10.1%) | 31 (13.8%) |
| 70 to 74 Years | 12 (5.8%) | 18 (8.0%) |
| 75 to 79 Years | 15 (7.2%) | 17 (7.6%) |
| 80 to 84 Years | 24 (11.5%) | 9 (4.0%) |
| 85 Years and over | 8 (3.8%) | 5 (2.2%) |
| Total | 208 (100.0%) | 224 (100.0%) |
Families and Households in Grand Rivers
Median Family Size in Grand Rivers
The median family size in Grand Rivers is 2.59 persons per family, with single female/mother families (11 | 8.4%) accounting for the largest median family size of 3.18 persons per family. On the other hand, single male/father families (6 | 4.6%) represent the smallest median family size with 1.50 persons per family.
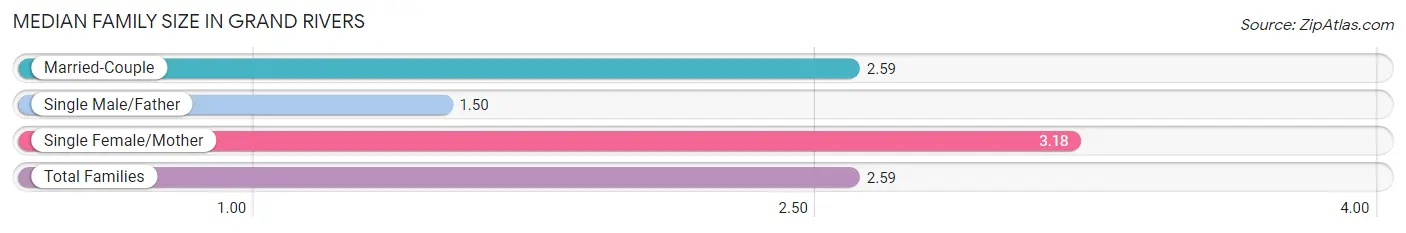
| Family Type | # Families | Family Size |
| Married-Couple | 114 (87.0%) | 2.59 |
| Single Male/Father | 6 (4.6%) | 1.50 |
| Single Female/Mother | 11 (8.4%) | 3.18 |
| Total Families | 131 (100.0%) | 2.59 |
Median Household Size in Grand Rivers
The median household size in Grand Rivers is 2.18 persons per household, with single male/father households (6 | 3.0%) accounting for the largest median household size of 3.83 persons per household. non-family households (67 | 33.8%) represent the smallest median household size with 1.18 persons per household.
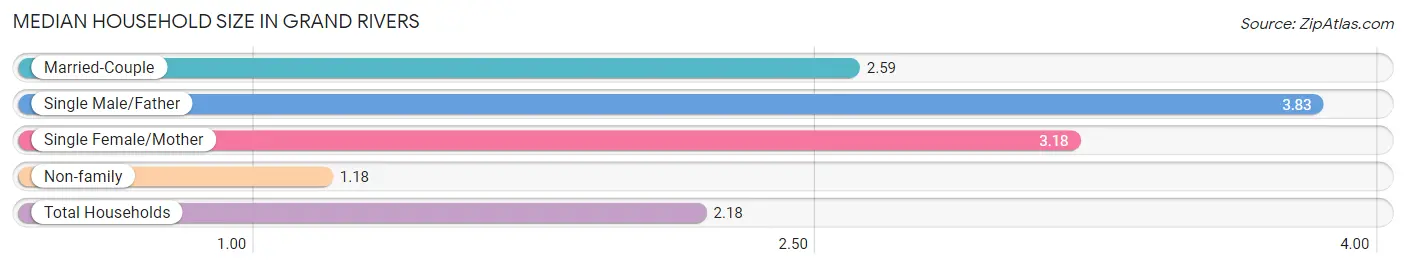
| Household Type | # Households | Household Size |
| Married-Couple | 114 (57.6%) | 2.59 |
| Single Male/Father | 6 (3.0%) | 3.83 |
| Single Female/Mother | 11 (5.6%) | 3.18 |
| Non-family | 67 (33.8%) | 1.18 |
| Total Households | 198 (100.0%) | 2.18 |
Household Size by Marriage Status in Grand Rivers
Out of a total of 198 households in Grand Rivers, 131 (66.2%) are family households, while 67 (33.8%) are nonfamily households. The most numerous type of family households are 2-person households, comprising 105, and the most common type of nonfamily households are 1-person households, comprising 62.
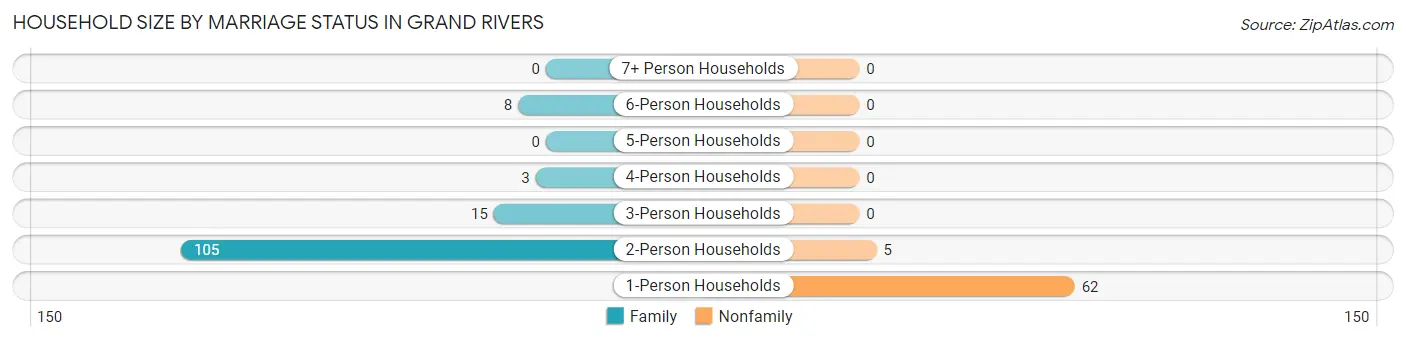
| Household Size | Family Households | Nonfamily Households |
| 1-Person Households | - | 62 (31.3%) |
| 2-Person Households | 105 (53.0%) | 5 (2.5%) |
| 3-Person Households | 15 (7.6%) | 0 (0.0%) |
| 4-Person Households | 3 (1.5%) | 0 (0.0%) |
| 5-Person Households | 0 (0.0%) | 0 (0.0%) |
| 6-Person Households | 8 (4.0%) | 0 (0.0%) |
| 7+ Person Households | 0 (0.0%) | 0 (0.0%) |
| Total | 131 (66.2%) | 67 (33.8%) |
Female Fertility in Grand Rivers
Fertility by Age in Grand Rivers
| Age Bracket | Women with Births | Births / 1,000 Women |
| 15 to 19 years | 0 (0.0%) | 0.0 |
| 20 to 34 years | 0 (0.0%) | 0.0 |
| 35 to 50 years | 0 (0.0%) | 0.0 |
| Total | 0 (0.0%) | 0.0 |
Fertility by Age by Marriage Status in Grand Rivers
| Age Bracket | Married | Unmarried |
| 15 to 19 years | 0 (0.0%) | 0 (0.0%) |
| 20 to 34 years | 0 (0.0%) | 0 (0.0%) |
| 35 to 50 years | 0 (0.0%) | 0 (0.0%) |
| Total | 0 (0.0%) | 0 (0.0%) |
Fertility by Education in Grand Rivers
| Educational Attainment | Women with Births | Births / 1,000 Women |
| Less than High School | 0 (0.0%) | 0.0 |
| High School Diploma | 0 (0.0%) | 0.0 |
| College or Associate's Degree | 0 (0.0%) | 0.0 |
| Bachelor's Degree | 0 (0.0%) | 0.0 |
| Graduate Degree | 0 (0.0%) | 0.0 |
| Total | 0 (0.0%) | 0.0 |
Fertility by Education by Marriage Status in Grand Rivers
| Educational Attainment | Married | Unmarried |
| Less than High School | 0 (0.0%) | 0 (0.0%) |
| High School Diploma | 0 (0.0%) | 0 (0.0%) |
| College or Associate's Degree | 0 (0.0%) | 0 (0.0%) |
| Bachelor's Degree | 0 (0.0%) | 0 (0.0%) |
| Graduate Degree | 0 (0.0%) | 0 (0.0%) |
| Total | 0 (0.0%) | 0 (0.0%) |
Employment Characteristics in Grand Rivers
Employment by Class of Employer in Grand Rivers
Among the 174 employed individuals in Grand Rivers, private company employees (106 | 60.9%), local government employees (24 | 13.8%), and self-employed (incorporated) (19 | 10.9%) make up the most common classes of employment.
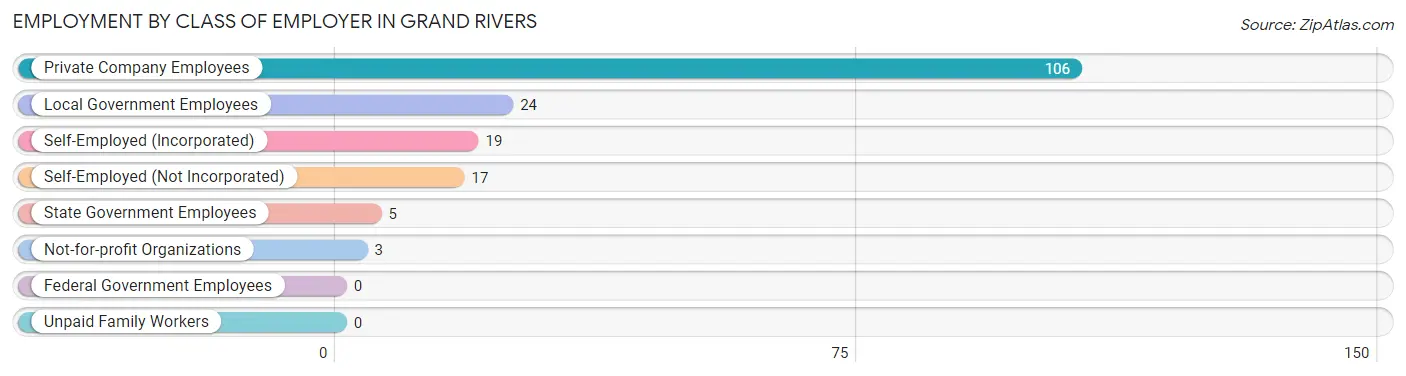
| Employer Class | # Employees | % Employees |
| Private Company Employees | 106 | 60.9% |
| Self-Employed (Incorporated) | 19 | 10.9% |
| Self-Employed (Not Incorporated) | 17 | 9.8% |
| Not-for-profit Organizations | 3 | 1.7% |
| Local Government Employees | 24 | 13.8% |
| State Government Employees | 5 | 2.9% |
| Federal Government Employees | 0 | 0.0% |
| Unpaid Family Workers | 0 | 0.0% |
| Total | 174 | 100.0% |
Employment Status by Age in Grand Rivers
According to the labor force statistics for Grand Rivers, out of the total population over 16 years of age (387), 46.0% or 178 individuals are in the labor force, with 2.2% or 4 of them unemployed. The age group with the highest labor force participation rate is 30 to 34 years, with 100.0% or 12 individuals in the labor force. Within the labor force, the 20 to 24 years age range has the highest percentage of unemployed individuals, with 57.1% or 4 of them being unemployed.
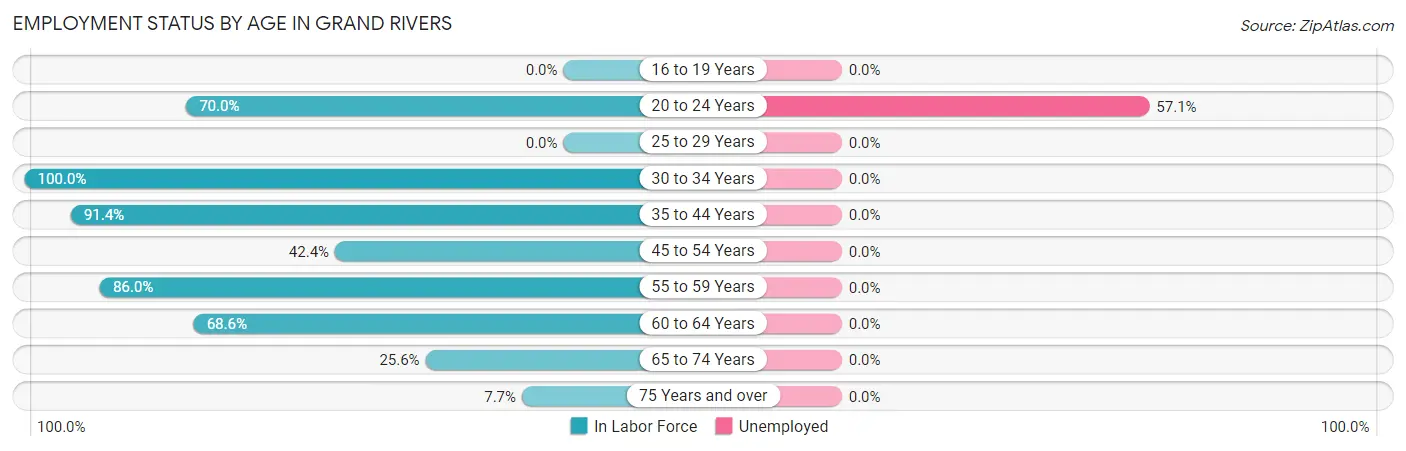
| Age Bracket | In Labor Force | Unemployed |
| 16 to 19 Years | 0 (0.0%) | 0 (0.0%) |
| 20 to 24 Years | 7 (70.0%) | 4 (57.1%) |
| 25 to 29 Years | 0 (0.0%) | 0 (0.0%) |
| 30 to 34 Years | 12 (100.0%) | 0 (0.0%) |
| 35 to 44 Years | 32 (91.4%) | 0 (0.0%) |
| 45 to 54 Years | 28 (42.4%) | 0 (0.0%) |
| 55 to 59 Years | 37 (86.0%) | 0 (0.0%) |
| 60 to 64 Years | 35 (68.6%) | 0 (0.0%) |
| 65 to 74 Years | 21 (25.6%) | 0 (0.0%) |
| 75 Years and over | 6 (7.7%) | 0 (0.0%) |
| Total | 178 (46.0%) | 4 (2.2%) |
Employment Status by Educational Attainment in Grand Rivers
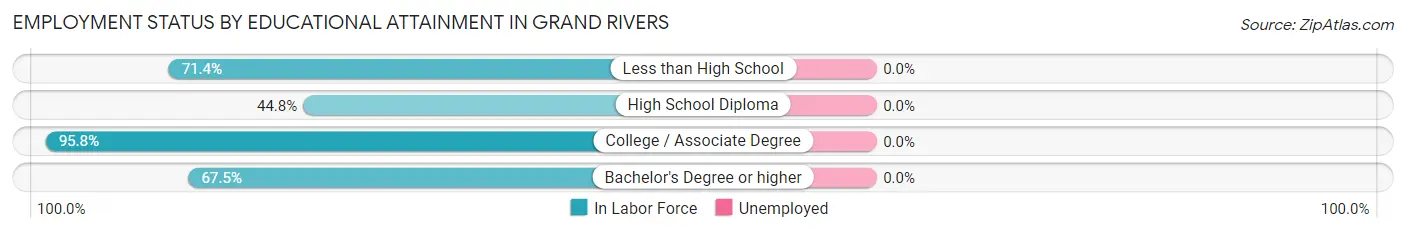
| Educational Attainment | In Labor Force | Unemployed |
| Less than High School | 5 (71.4%) | 0 (0.0%) |
| High School Diploma | 43 (44.8%) | 0 (0.0%) |
| College / Associate Degree | 69 (95.8%) | 0 (0.0%) |
| Bachelor's Degree or higher | 27 (67.5%) | 0 (0.0%) |
| Total | 144 (67.0%) | 0 (0.0%) |
Employment Occupations by Sex in Grand Rivers
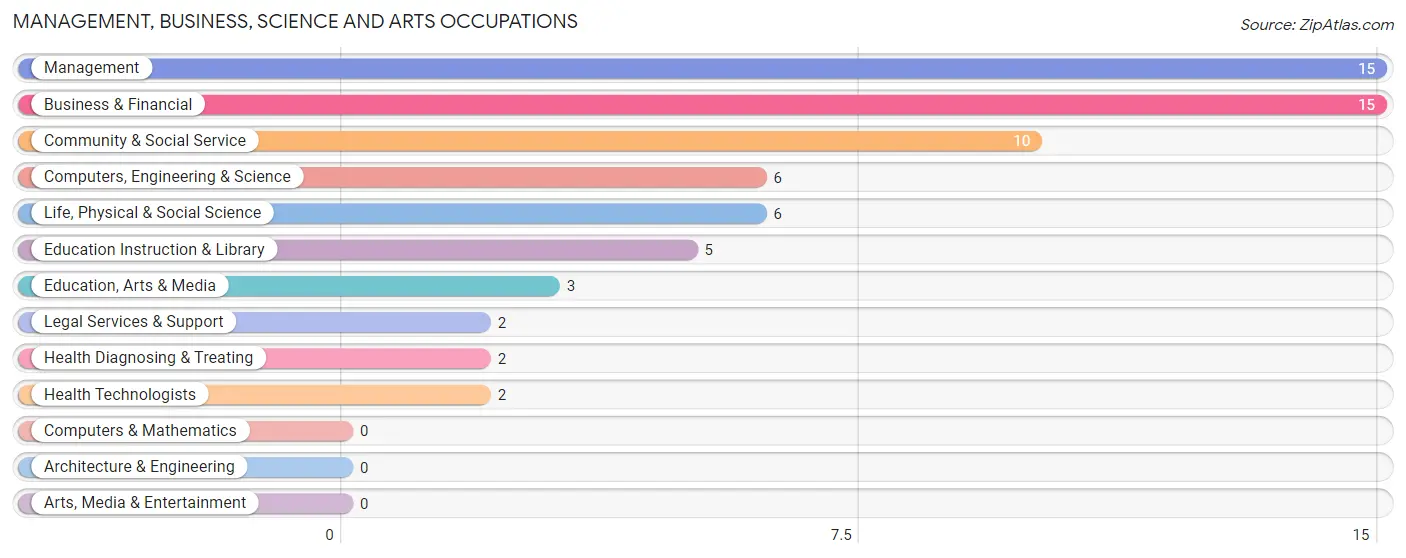
Management, Business, Science and Arts Occupations
The most common Management, Business, Science and Arts occupations in Grand Rivers are Management (15 | 8.6%), Business & Financial (15 | 8.6%), Community & Social Service (10 | 5.8%), Computers, Engineering & Science (6 | 3.5%), and Life, Physical & Social Science (6 | 3.5%).
Management, Business, Science and Arts Occupations by Sex
Within the Management, Business, Science and Arts occupations in Grand Rivers, the most male-oriented occupations are Computers, Engineering & Science (100.0%), Life, Physical & Social Science (100.0%), and Legal Services & Support (100.0%), while the most female-oriented occupations are Health Diagnosing & Treating (100.0%), Health Technologists (100.0%), and Business & Financial (86.7%).
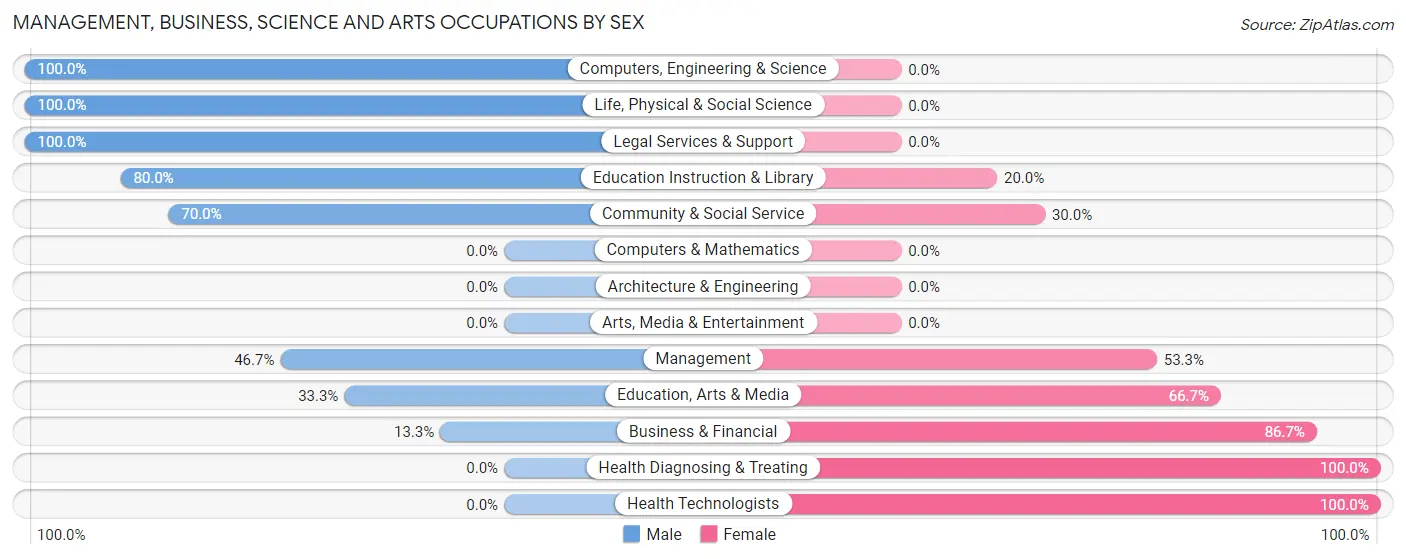
| Occupation | Male | Female |
| Management | 7 (46.7%) | 8 (53.3%) |
| Business & Financial | 2 (13.3%) | 13 (86.7%) |
| Computers, Engineering & Science | 6 (100.0%) | 0 (0.0%) |
| Computers & Mathematics | 0 (0.0%) | 0 (0.0%) |
| Architecture & Engineering | 0 (0.0%) | 0 (0.0%) |
| Life, Physical & Social Science | 6 (100.0%) | 0 (0.0%) |
| Community & Social Service | 7 (70.0%) | 3 (30.0%) |
| Education, Arts & Media | 1 (33.3%) | 2 (66.7%) |
| Legal Services & Support | 2 (100.0%) | 0 (0.0%) |
| Education Instruction & Library | 4 (80.0%) | 1 (20.0%) |
| Arts, Media & Entertainment | 0 (0.0%) | 0 (0.0%) |
| Health Diagnosing & Treating | 0 (0.0%) | 2 (100.0%) |
| Health Technologists | 0 (0.0%) | 2 (100.0%) |
| Total (Category) | 22 (45.8%) | 26 (54.2%) |
| Total (Overall) | 111 (63.8%) | 63 (36.2%) |
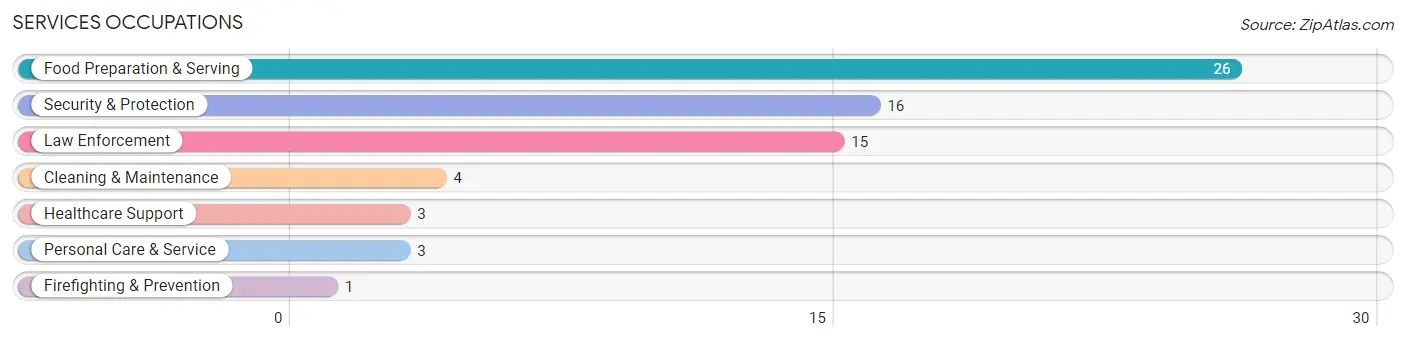
Services Occupations
The most common Services occupations in Grand Rivers are Food Preparation & Serving (26 | 14.9%), Security & Protection (16 | 9.2%), Law Enforcement (15 | 8.6%), Cleaning & Maintenance (4 | 2.3%), and Healthcare Support (3 | 1.7%).
Services Occupations by Sex
Within the Services occupations in Grand Rivers, the most male-oriented occupations are Security & Protection (100.0%), Firefighting & Prevention (100.0%), and Law Enforcement (100.0%), while the most female-oriented occupations are Healthcare Support (100.0%), Cleaning & Maintenance (100.0%), and Personal Care & Service (100.0%).
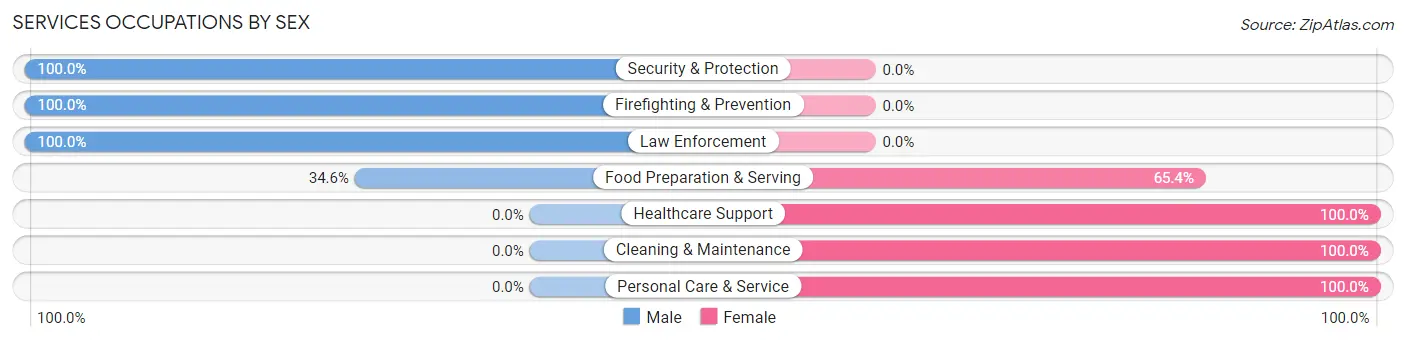
| Occupation | Male | Female |
| Healthcare Support | 0 (0.0%) | 3 (100.0%) |
| Security & Protection | 16 (100.0%) | 0 (0.0%) |
| Firefighting & Prevention | 1 (100.0%) | 0 (0.0%) |
| Law Enforcement | 15 (100.0%) | 0 (0.0%) |
| Food Preparation & Serving | 9 (34.6%) | 17 (65.4%) |
| Cleaning & Maintenance | 0 (0.0%) | 4 (100.0%) |
| Personal Care & Service | 0 (0.0%) | 3 (100.0%) |
| Total (Category) | 25 (48.1%) | 27 (51.9%) |
| Total (Overall) | 111 (63.8%) | 63 (36.2%) |
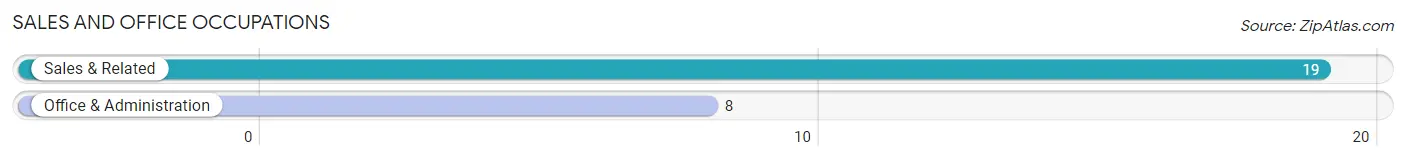
Sales and Office Occupations
The most common Sales and Office occupations in Grand Rivers are Sales & Related (19 | 10.9%), and Office & Administration (8 | 4.6%).
Sales and Office Occupations by Sex

| Occupation | Male | Female |
| Sales & Related | 12 (63.2%) | 7 (36.8%) |
| Office & Administration | 5 (62.5%) | 3 (37.5%) |
| Total (Category) | 17 (63.0%) | 10 (37.0%) |
| Total (Overall) | 111 (63.8%) | 63 (36.2%) |
Natural Resources, Construction and Maintenance Occupations
The most common Natural Resources, Construction and Maintenance occupations in Grand Rivers are Construction & Extraction (12 | 6.9%), and Installation, Maintenance & Repair (9 | 5.2%).
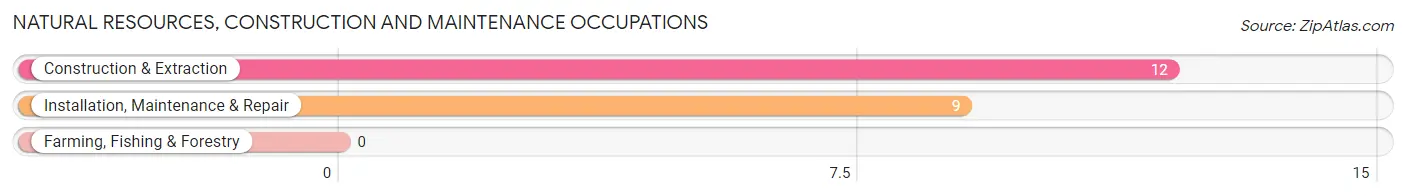
Natural Resources, Construction and Maintenance Occupations by Sex
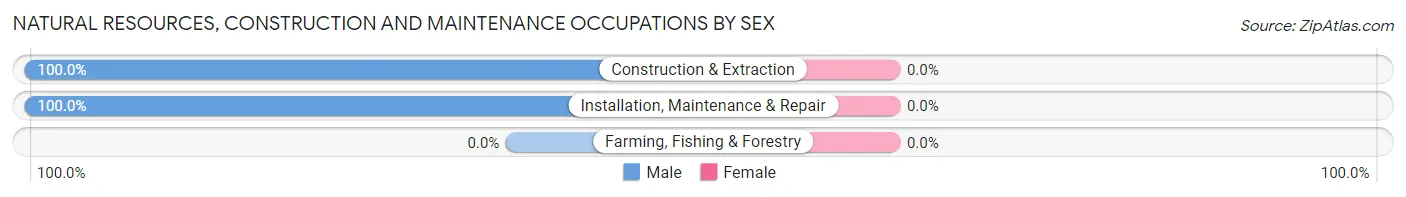
| Occupation | Male | Female |
| Farming, Fishing & Forestry | 0 (0.0%) | 0 (0.0%) |
| Construction & Extraction | 12 (100.0%) | 0 (0.0%) |
| Installation, Maintenance & Repair | 9 (100.0%) | 0 (0.0%) |
| Total (Category) | 21 (100.0%) | 0 (0.0%) |
| Total (Overall) | 111 (63.8%) | 63 (36.2%) |
Production, Transportation and Moving Occupations
The most common Production, Transportation and Moving occupations in Grand Rivers are Production (17 | 9.8%), Material Moving (8 | 4.6%), and Transportation (1 | 0.6%).
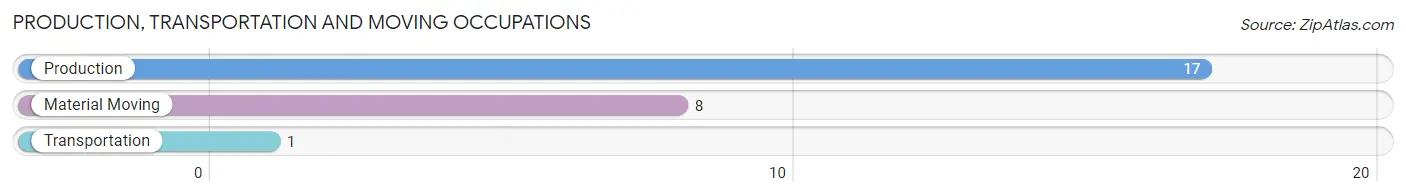
Production, Transportation and Moving Occupations by Sex
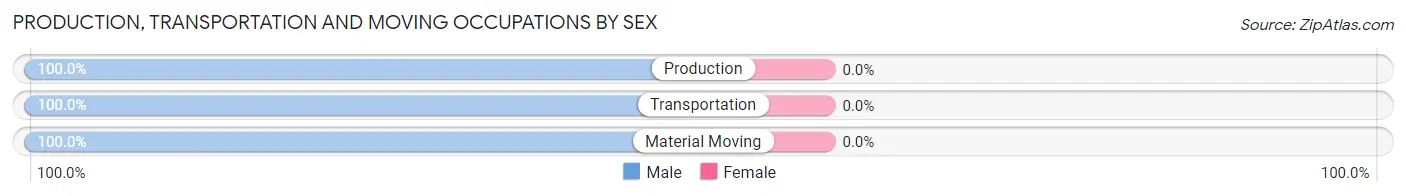
| Occupation | Male | Female |
| Production | 17 (100.0%) | 0 (0.0%) |
| Transportation | 1 (100.0%) | 0 (0.0%) |
| Material Moving | 8 (100.0%) | 0 (0.0%) |
| Total (Category) | 26 (100.0%) | 0 (0.0%) |
| Total (Overall) | 111 (63.8%) | 63 (36.2%) |
Employment Industries by Sex in Grand Rivers
Employment Industries in Grand Rivers
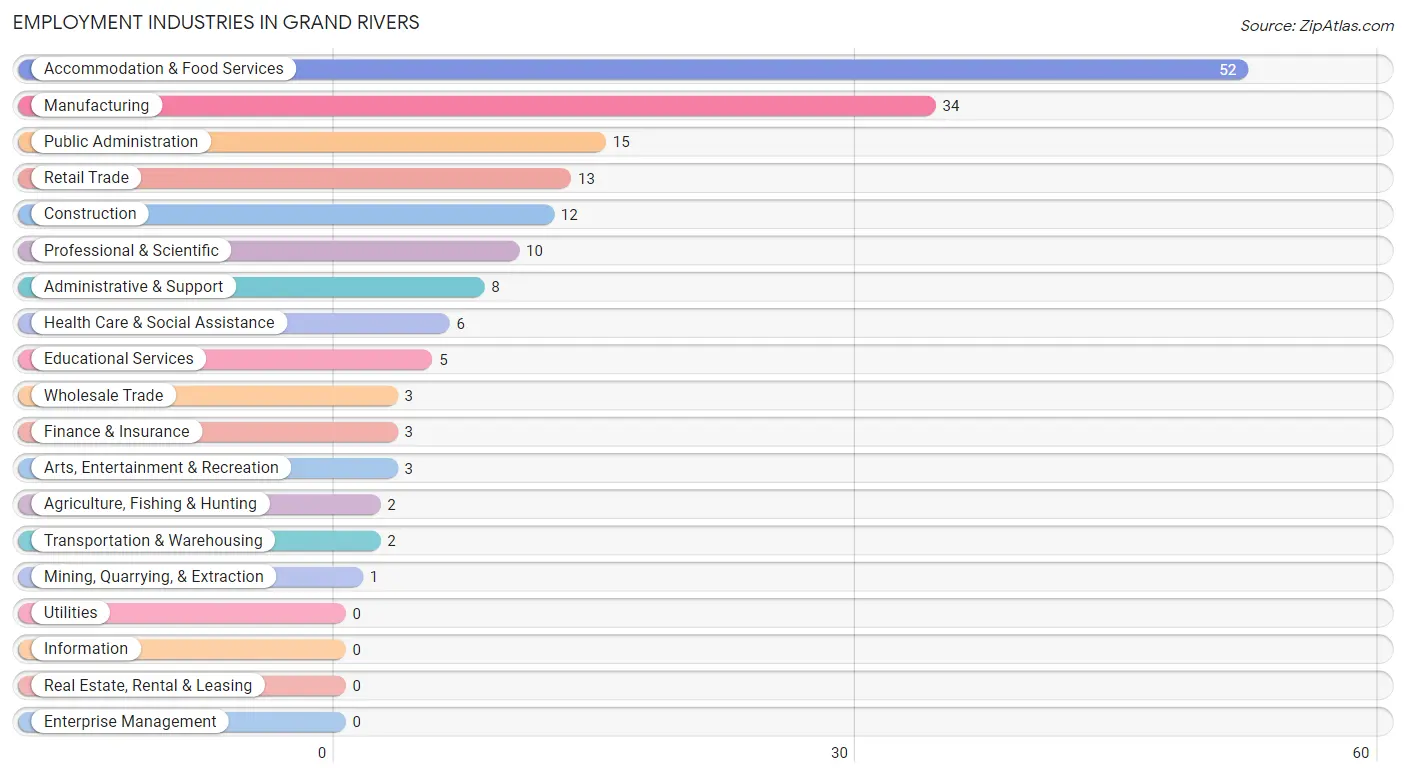
The major employment industries in Grand Rivers include Accommodation & Food Services (52 | 29.9%), Manufacturing (34 | 19.5%), Public Administration (15 | 8.6%), Retail Trade (13 | 7.5%), and Construction (12 | 6.9%).
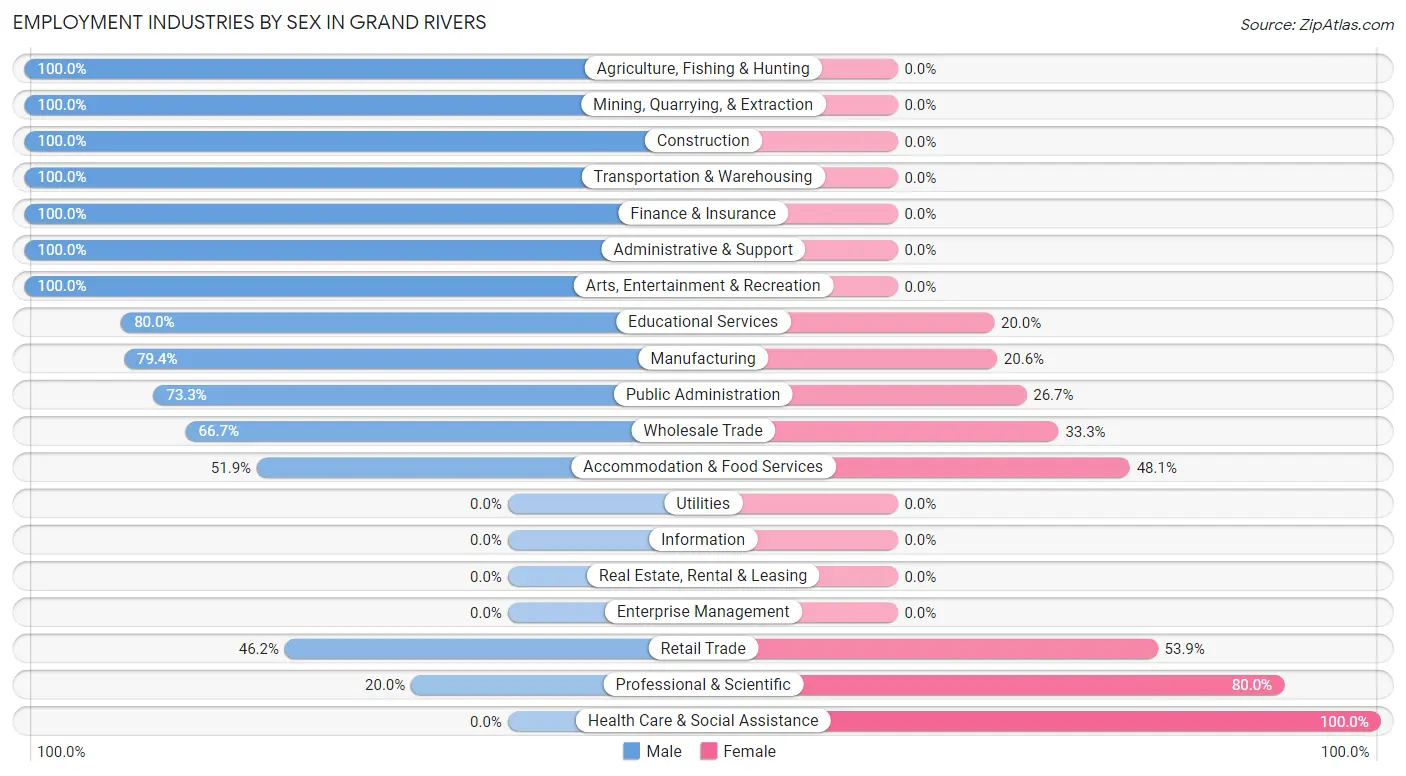
Employment Industries by Sex in Grand Rivers
The Grand Rivers industries that see more men than women are Agriculture, Fishing & Hunting (100.0%), Mining, Quarrying, & Extraction (100.0%), and Construction (100.0%), whereas the industries that tend to have a higher number of women are Health Care & Social Assistance (100.0%), Professional & Scientific (80.0%), and Retail Trade (53.8%).
| Industry | Male | Female |
| Agriculture, Fishing & Hunting | 2 (100.0%) | 0 (0.0%) |
| Mining, Quarrying, & Extraction | 1 (100.0%) | 0 (0.0%) |
| Construction | 12 (100.0%) | 0 (0.0%) |
| Manufacturing | 27 (79.4%) | 7 (20.6%) |
| Wholesale Trade | 2 (66.7%) | 1 (33.3%) |
| Retail Trade | 6 (46.2%) | 7 (53.8%) |
| Transportation & Warehousing | 2 (100.0%) | 0 (0.0%) |
| Utilities | 0 (0.0%) | 0 (0.0%) |
| Information | 0 (0.0%) | 0 (0.0%) |
| Finance & Insurance | 3 (100.0%) | 0 (0.0%) |
| Real Estate, Rental & Leasing | 0 (0.0%) | 0 (0.0%) |
| Professional & Scientific | 2 (20.0%) | 8 (80.0%) |
| Enterprise Management | 0 (0.0%) | 0 (0.0%) |
| Administrative & Support | 8 (100.0%) | 0 (0.0%) |
| Educational Services | 4 (80.0%) | 1 (20.0%) |
| Health Care & Social Assistance | 0 (0.0%) | 6 (100.0%) |
| Arts, Entertainment & Recreation | 3 (100.0%) | 0 (0.0%) |
| Accommodation & Food Services | 27 (51.9%) | 25 (48.1%) |
| Public Administration | 11 (73.3%) | 4 (26.7%) |
| Total | 111 (63.8%) | 63 (36.2%) |
Education in Grand Rivers
School Enrollment in Grand Rivers
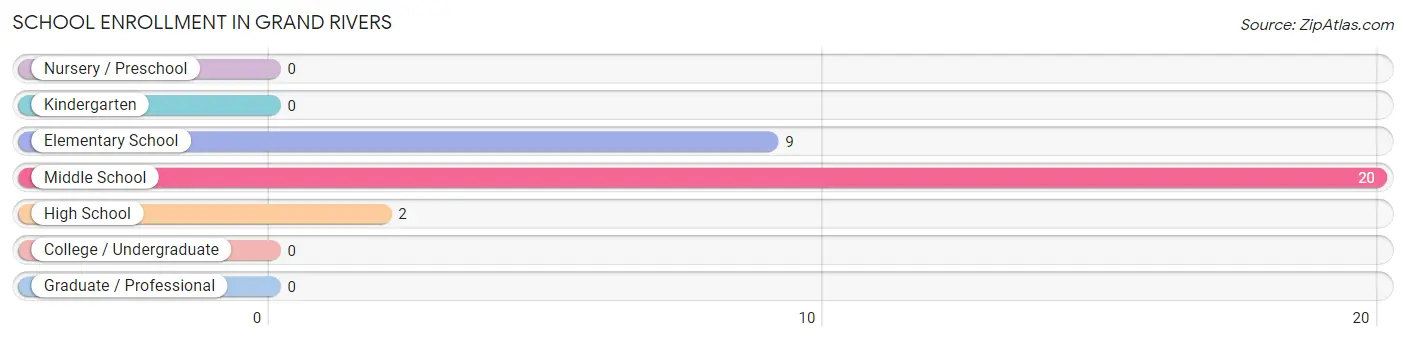
The most common levels of schooling among the 31 students in Grand Rivers are middle school (20 | 64.5%), elementary school (9 | 29.0%), and high school (2 | 6.5%).
| School Level | # Students | % Students |
| Nursery / Preschool | 0 | 0.0% |
| Kindergarten | 0 | 0.0% |
| Elementary School | 9 | 29.0% |
| Middle School | 20 | 64.5% |
| High School | 2 | 6.5% |
| College / Undergraduate | 0 | 0.0% |
| Graduate / Professional | 0 | 0.0% |
| Total | 31 | 100.0% |
School Enrollment by Age by Funding Source in Grand Rivers
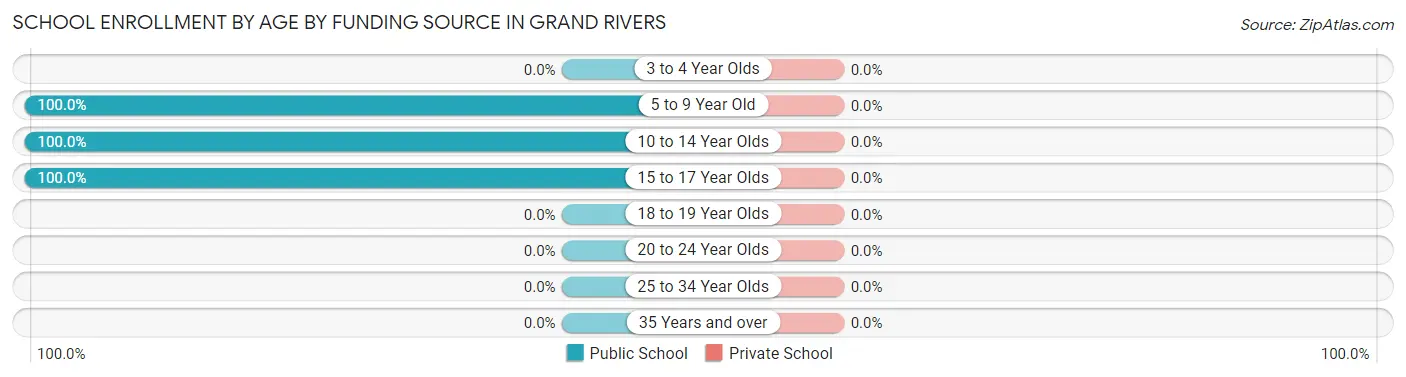
| Age Bracket | Public School | Private School |
| 3 to 4 Year Olds | 0 (0.0%) | 0 (0.0%) |
| 5 to 9 Year Old | 9 (100.0%) | 0 (0.0%) |
| 10 to 14 Year Olds | 20 (100.0%) | 0 (0.0%) |
| 15 to 17 Year Olds | 2 (100.0%) | 0 (0.0%) |
| 18 to 19 Year Olds | 0 (0.0%) | 0 (0.0%) |
| 20 to 24 Year Olds | 0 (0.0%) | 0 (0.0%) |
| 25 to 34 Year Olds | 0 (0.0%) | 0 (0.0%) |
| 35 Years and over | 0 (0.0%) | 0 (0.0%) |
| Total | 31 (100.0%) | 0 (0.0%) |
Educational Attainment by Field of Study in Grand Rivers
Business (26 | 25.7%), education (19 | 18.8%), bio, nature & agricultural (10 | 9.9%), computers & mathematics (9 | 8.9%), and physical & health sciences (7 | 6.9%) are the most common fields of study among 101 individuals in Grand Rivers who have obtained a bachelor's degree or higher.
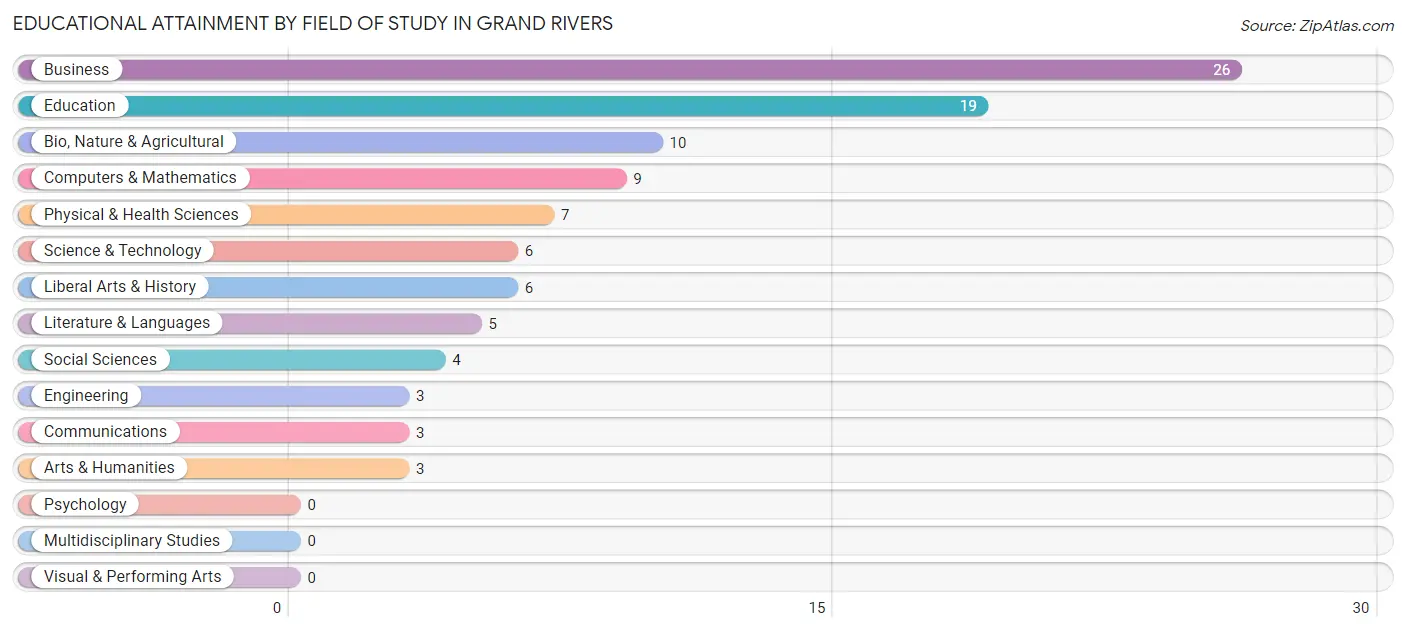
| Field of Study | # Graduates | % Graduates |
| Computers & Mathematics | 9 | 8.9% |
| Bio, Nature & Agricultural | 10 | 9.9% |
| Physical & Health Sciences | 7 | 6.9% |
| Psychology | 0 | 0.0% |
| Social Sciences | 4 | 4.0% |
| Engineering | 3 | 3.0% |
| Multidisciplinary Studies | 0 | 0.0% |
| Science & Technology | 6 | 5.9% |
| Business | 26 | 25.7% |
| Education | 19 | 18.8% |
| Literature & Languages | 5 | 5.0% |
| Liberal Arts & History | 6 | 5.9% |
| Visual & Performing Arts | 0 | 0.0% |
| Communications | 3 | 3.0% |
| Arts & Humanities | 3 | 3.0% |
| Total | 101 | 100.0% |
Transportation & Commute in Grand Rivers
Vehicle Availability by Sex in Grand Rivers
The most prevalent vehicle ownership categories in Grand Rivers are males with 1 vehicle (37, accounting for 33.3%) and females with 1 vehicle (6, making up 58.7%).
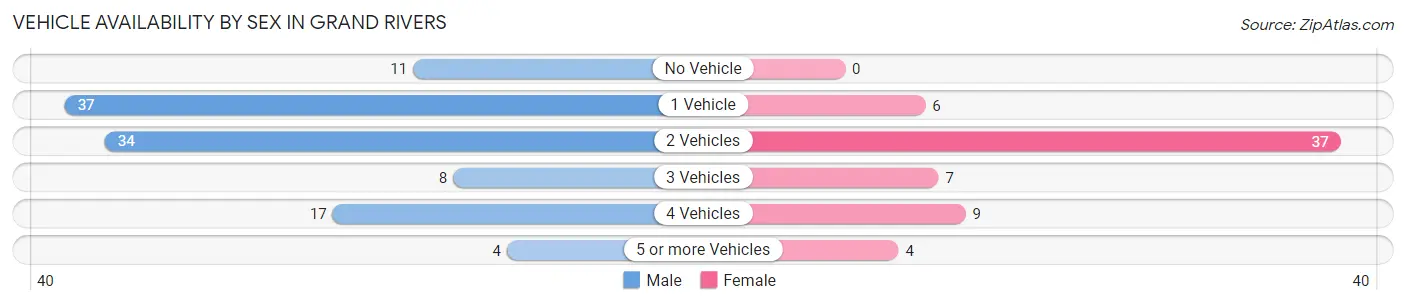
| Vehicles Available | Male | Female |
| No Vehicle | 11 (9.9%) | 0 (0.0%) |
| 1 Vehicle | 37 (33.3%) | 6 (9.5%) |
| 2 Vehicles | 34 (30.6%) | 37 (58.7%) |
| 3 Vehicles | 8 (7.2%) | 7 (11.1%) |
| 4 Vehicles | 17 (15.3%) | 9 (14.3%) |
| 5 or more Vehicles | 4 (3.6%) | 4 (6.4%) |
| Total | 111 (100.0%) | 63 (100.0%) |
Commute Time in Grand Rivers
The most frequently occuring commute durations in Grand Rivers are less than 5 minutes (49 commuters, 31.6%), 5 to 9 minutes (42 commuters, 27.1%), and 45 to 59 minutes (15 commuters, 9.7%).
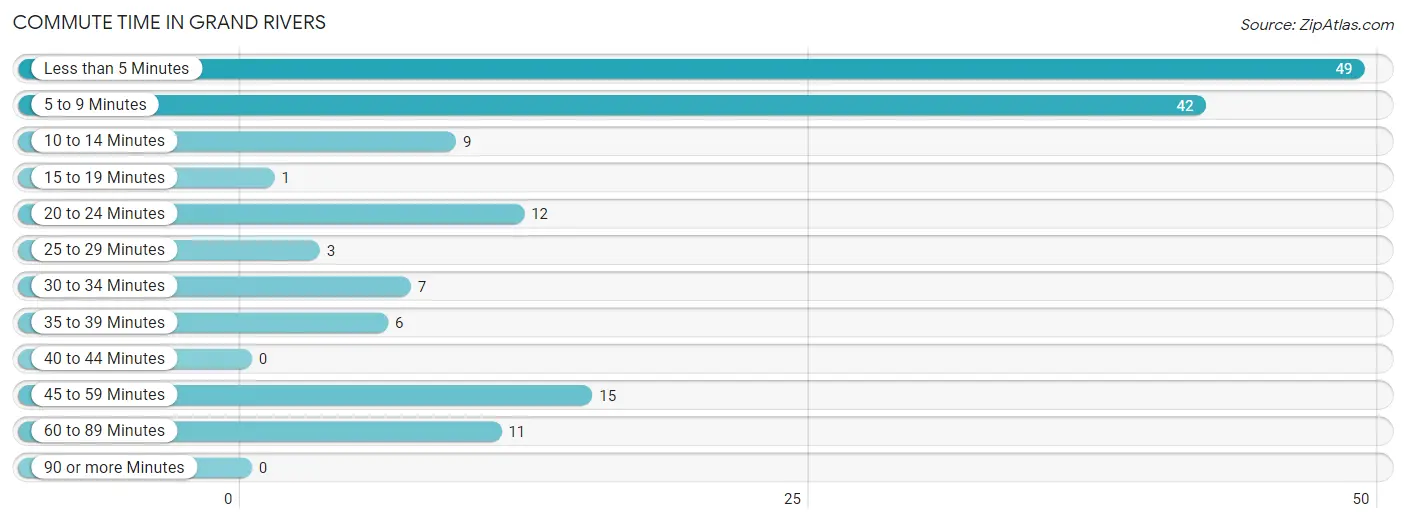
| Commute Time | # Commuters | % Commuters |
| Less than 5 Minutes | 49 | 31.6% |
| 5 to 9 Minutes | 42 | 27.1% |
| 10 to 14 Minutes | 9 | 5.8% |
| 15 to 19 Minutes | 1 | 0.6% |
| 20 to 24 Minutes | 12 | 7.7% |
| 25 to 29 Minutes | 3 | 1.9% |
| 30 to 34 Minutes | 7 | 4.5% |
| 35 to 39 Minutes | 6 | 3.9% |
| 40 to 44 Minutes | 0 | 0.0% |
| 45 to 59 Minutes | 15 | 9.7% |
| 60 to 89 Minutes | 11 | 7.1% |
| 90 or more Minutes | 0 | 0.0% |
Commute Time by Sex in Grand Rivers
The most common commute times in Grand Rivers are less than 5 minutes (36 commuters, 34.6%) for males and 5 to 9 minutes (18 commuters, 35.3%) for females.
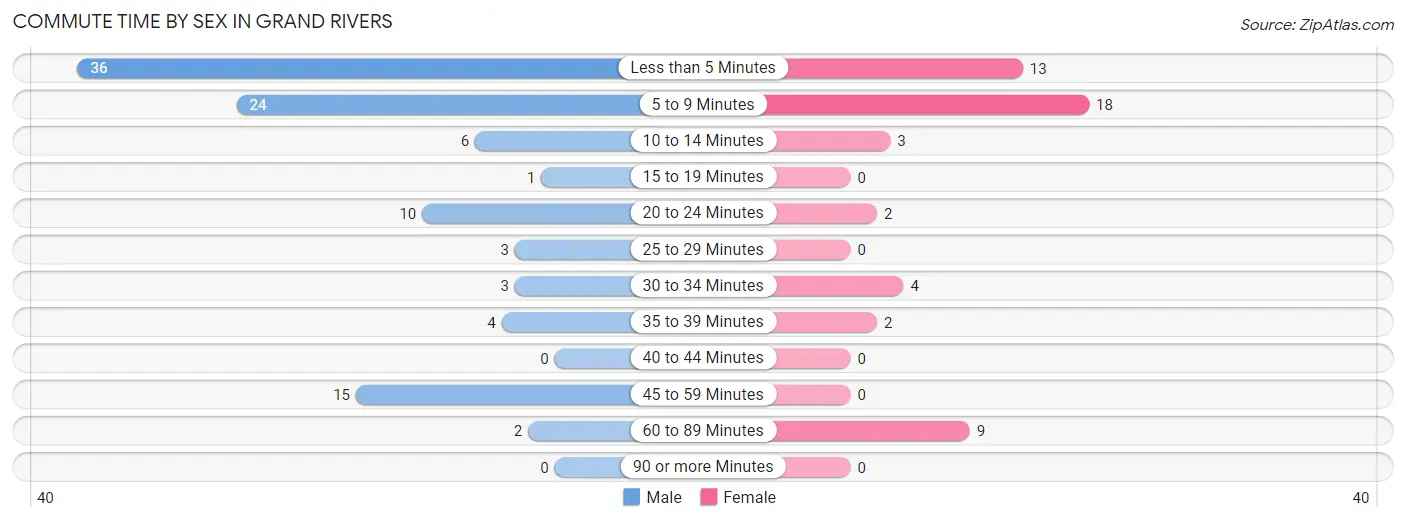
| Commute Time | Male | Female |
| Less than 5 Minutes | 36 (34.6%) | 13 (25.5%) |
| 5 to 9 Minutes | 24 (23.1%) | 18 (35.3%) |
| 10 to 14 Minutes | 6 (5.8%) | 3 (5.9%) |
| 15 to 19 Minutes | 1 (1.0%) | 0 (0.0%) |
| 20 to 24 Minutes | 10 (9.6%) | 2 (3.9%) |
| 25 to 29 Minutes | 3 (2.9%) | 0 (0.0%) |
| 30 to 34 Minutes | 3 (2.9%) | 4 (7.8%) |
| 35 to 39 Minutes | 4 (3.8%) | 2 (3.9%) |
| 40 to 44 Minutes | 0 (0.0%) | 0 (0.0%) |
| 45 to 59 Minutes | 15 (14.4%) | 0 (0.0%) |
| 60 to 89 Minutes | 2 (1.9%) | 9 (17.6%) |
| 90 or more Minutes | 0 (0.0%) | 0 (0.0%) |
Time of Departure to Work by Sex in Grand Rivers
The most frequent times of departure to work in Grand Rivers are 8:00 AM to 8:29 AM (22, 21.1%) for males and 7:00 AM to 7:29 AM (18, 35.3%) for females.
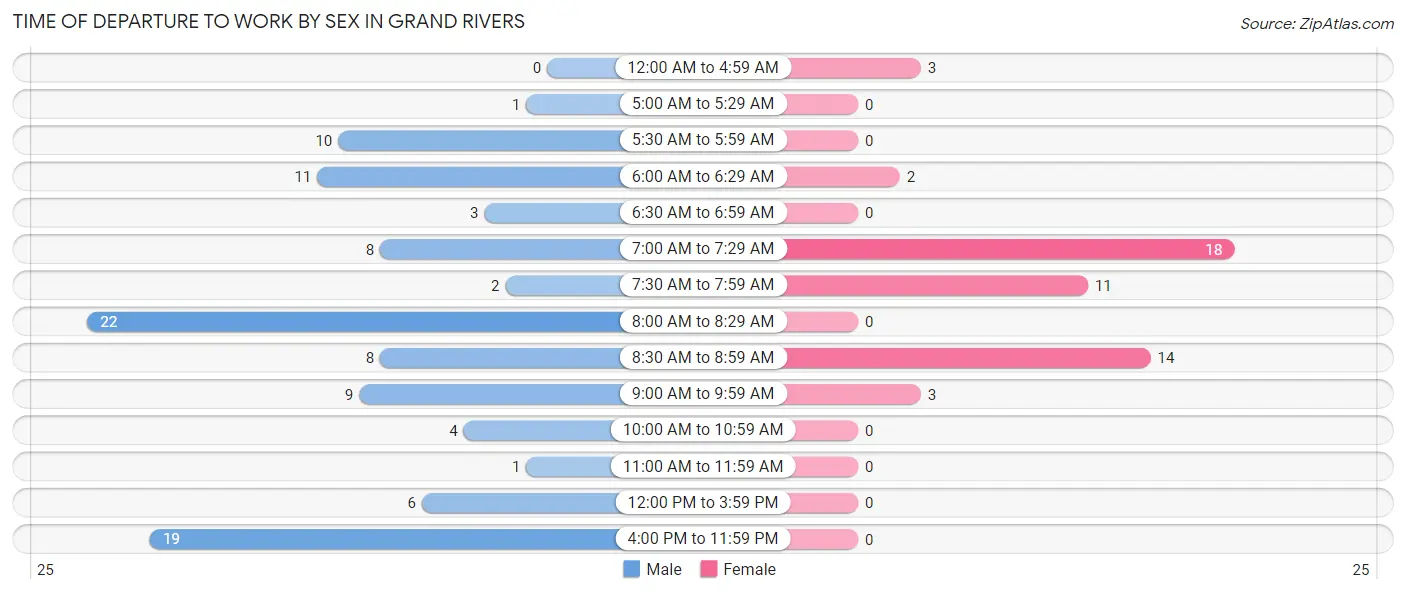
| Time of Departure | Male | Female |
| 12:00 AM to 4:59 AM | 0 (0.0%) | 3 (5.9%) |
| 5:00 AM to 5:29 AM | 1 (1.0%) | 0 (0.0%) |
| 5:30 AM to 5:59 AM | 10 (9.6%) | 0 (0.0%) |
| 6:00 AM to 6:29 AM | 11 (10.6%) | 2 (3.9%) |
| 6:30 AM to 6:59 AM | 3 (2.9%) | 0 (0.0%) |
| 7:00 AM to 7:29 AM | 8 (7.7%) | 18 (35.3%) |
| 7:30 AM to 7:59 AM | 2 (1.9%) | 11 (21.6%) |
| 8:00 AM to 8:29 AM | 22 (21.1%) | 0 (0.0%) |
| 8:30 AM to 8:59 AM | 8 (7.7%) | 14 (27.5%) |
| 9:00 AM to 9:59 AM | 9 (8.6%) | 3 (5.9%) |
| 10:00 AM to 10:59 AM | 4 (3.8%) | 0 (0.0%) |
| 11:00 AM to 11:59 AM | 1 (1.0%) | 0 (0.0%) |
| 12:00 PM to 3:59 PM | 6 (5.8%) | 0 (0.0%) |
| 4:00 PM to 11:59 PM | 19 (18.3%) | 0 (0.0%) |
| Total | 104 (100.0%) | 51 (100.0%) |
Housing Occupancy in Grand Rivers
Occupancy by Ownership in Grand Rivers
Of the total 198 dwellings in Grand Rivers, owner-occupied units account for 145 (73.2%), while renter-occupied units make up 53 (26.8%).
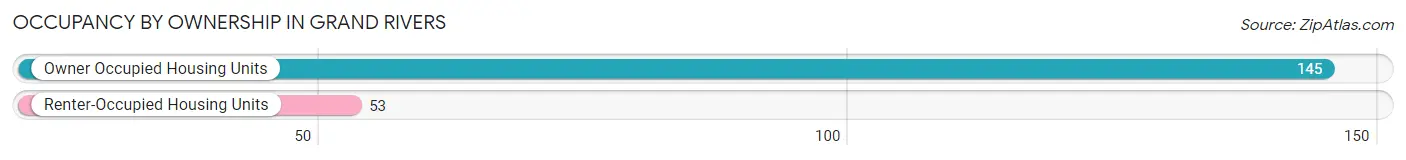
| Occupancy | # Housing Units | % Housing Units |
| Owner Occupied Housing Units | 145 | 73.2% |
| Renter-Occupied Housing Units | 53 | 26.8% |
| Total Occupied Housing Units | 198 | 100.0% |
Occupancy by Household Size in Grand Rivers
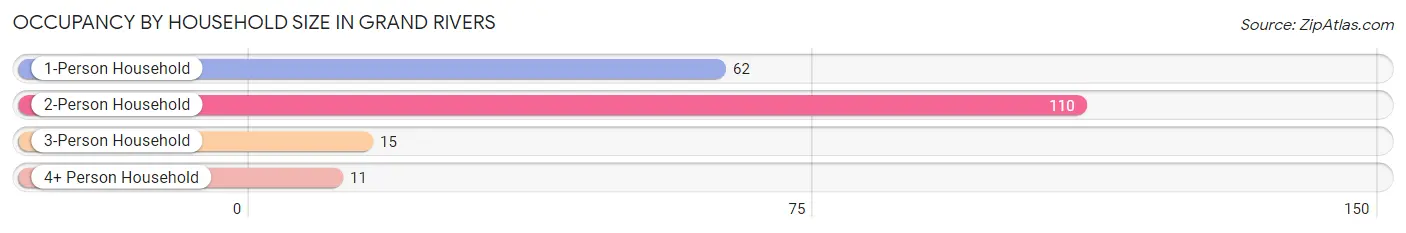
| Household Size | # Housing Units | % Housing Units |
| 1-Person Household | 62 | 31.3% |
| 2-Person Household | 110 | 55.6% |
| 3-Person Household | 15 | 7.6% |
| 4+ Person Household | 11 | 5.6% |
| Total Housing Units | 198 | 100.0% |
Occupancy by Ownership by Household Size in Grand Rivers
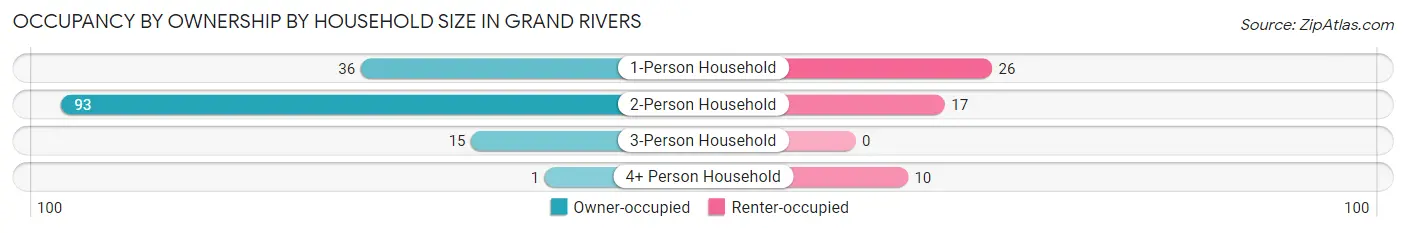
| Household Size | Owner-occupied | Renter-occupied |
| 1-Person Household | 36 (58.1%) | 26 (41.9%) |
| 2-Person Household | 93 (84.6%) | 17 (15.4%) |
| 3-Person Household | 15 (100.0%) | 0 (0.0%) |
| 4+ Person Household | 1 (9.1%) | 10 (90.9%) |
| Total Housing Units | 145 (73.2%) | 53 (26.8%) |
Occupancy by Educational Attainment in Grand Rivers
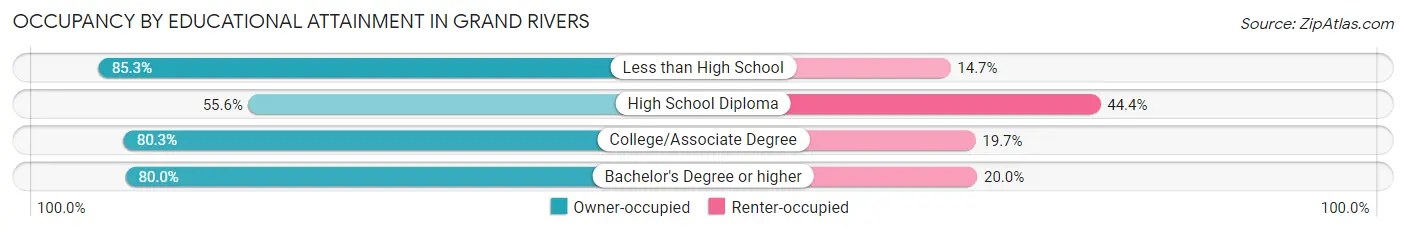
| Household Size | Owner-occupied | Renter-occupied |
| Less than High School | 29 (85.3%) | 5 (14.7%) |
| High School Diploma | 35 (55.6%) | 28 (44.4%) |
| College/Associate Degree | 49 (80.3%) | 12 (19.7%) |
| Bachelor's Degree or higher | 32 (80.0%) | 8 (20.0%) |
Occupancy by Age of Householder in Grand Rivers
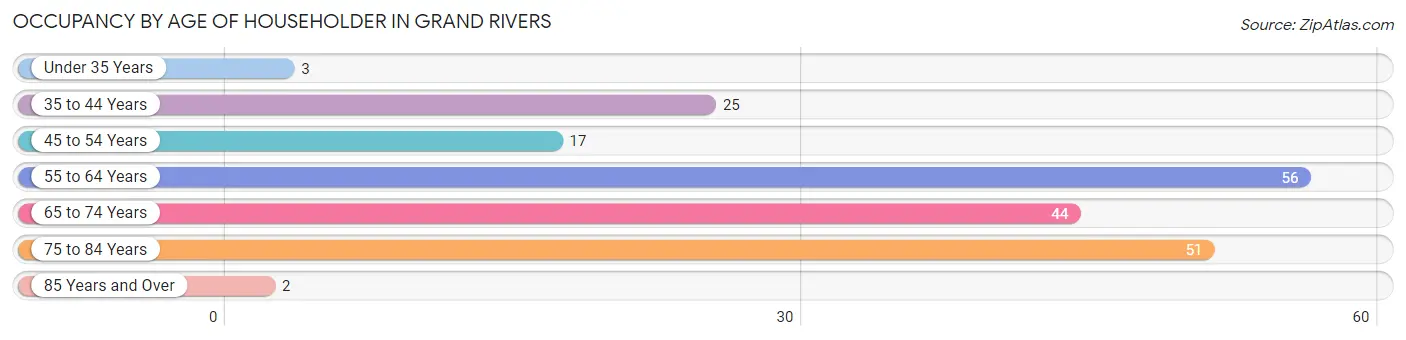
| Age Bracket | # Households | % Households |
| Under 35 Years | 3 | 1.5% |
| 35 to 44 Years | 25 | 12.6% |
| 45 to 54 Years | 17 | 8.6% |
| 55 to 64 Years | 56 | 28.3% |
| 65 to 74 Years | 44 | 22.2% |
| 75 to 84 Years | 51 | 25.8% |
| 85 Years and Over | 2 | 1.0% |
| Total | 198 | 100.0% |
Housing Finances in Grand Rivers
Median Income by Occupancy in Grand Rivers
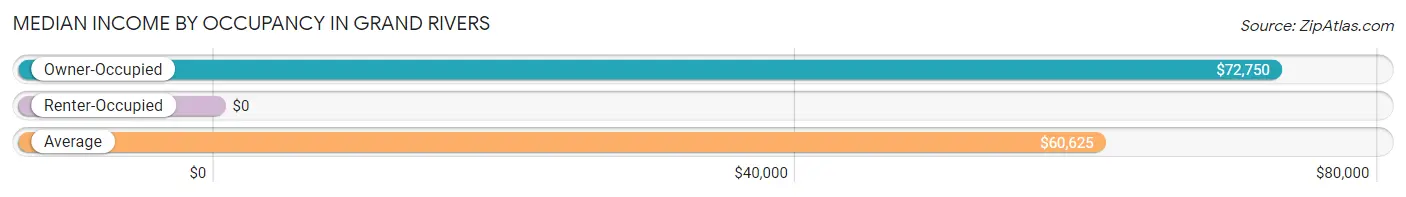
| Occupancy Type | # Households | Median Income |
| Owner-Occupied | 145 (73.2%) | $72,750 |
| Renter-Occupied | 53 (26.8%) | $0 |
| Average | 198 (100.0%) | $60,625 |
Occupancy by Householder Income Bracket in Grand Rivers
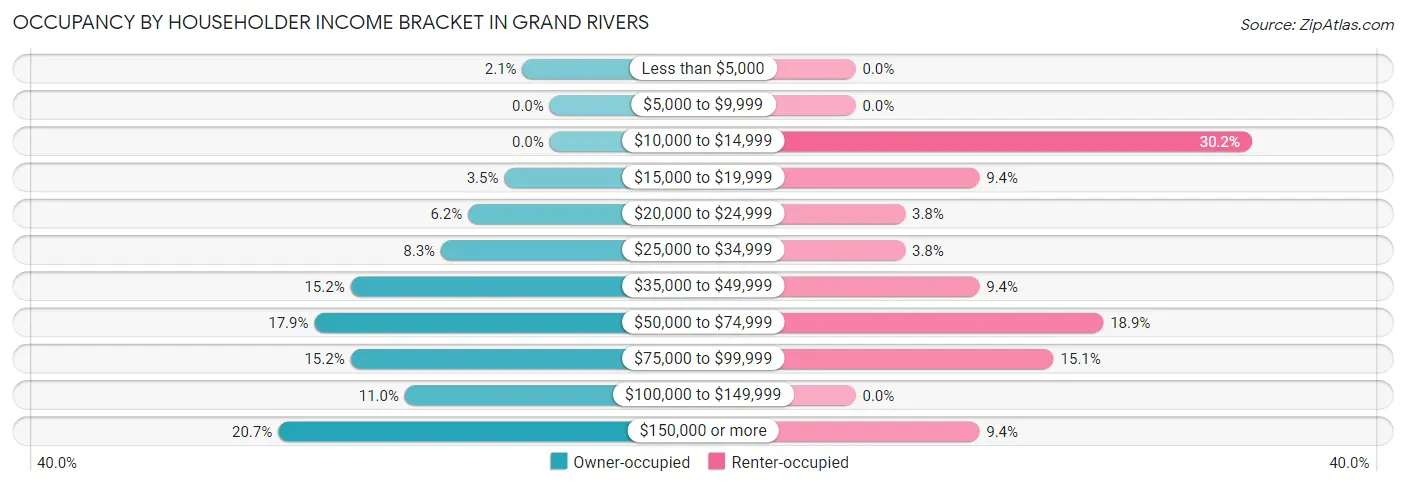
| Income Bracket | Owner-occupied | Renter-occupied |
| Less than $5,000 | 3 (2.1%) | 0 (0.0%) |
| $5,000 to $9,999 | 0 (0.0%) | 0 (0.0%) |
| $10,000 to $14,999 | 0 (0.0%) | 16 (30.2%) |
| $15,000 to $19,999 | 5 (3.5%) | 5 (9.4%) |
| $20,000 to $24,999 | 9 (6.2%) | 2 (3.8%) |
| $25,000 to $34,999 | 12 (8.3%) | 2 (3.8%) |
| $35,000 to $49,999 | 22 (15.2%) | 5 (9.4%) |
| $50,000 to $74,999 | 26 (17.9%) | 10 (18.9%) |
| $75,000 to $99,999 | 22 (15.2%) | 8 (15.1%) |
| $100,000 to $149,999 | 16 (11.0%) | 0 (0.0%) |
| $150,000 or more | 30 (20.7%) | 5 (9.4%) |
| Total | 145 (100.0%) | 53 (100.0%) |
Monthly Housing Cost Tiers in Grand Rivers
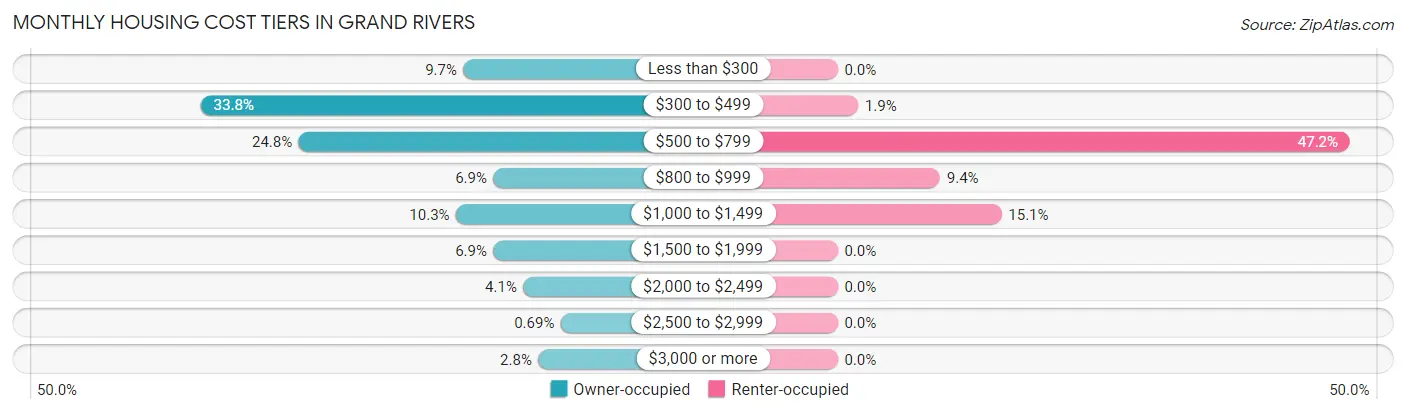
| Monthly Cost | Owner-occupied | Renter-occupied |
| Less than $300 | 14 (9.7%) | 0 (0.0%) |
| $300 to $499 | 49 (33.8%) | 1 (1.9%) |
| $500 to $799 | 36 (24.8%) | 25 (47.2%) |
| $800 to $999 | 10 (6.9%) | 5 (9.4%) |
| $1,000 to $1,499 | 15 (10.3%) | 8 (15.1%) |
| $1,500 to $1,999 | 10 (6.9%) | 0 (0.0%) |
| $2,000 to $2,499 | 6 (4.1%) | 0 (0.0%) |
| $2,500 to $2,999 | 1 (0.7%) | 0 (0.0%) |
| $3,000 or more | 4 (2.8%) | 0 (0.0%) |
| Total | 145 (100.0%) | 53 (100.0%) |
Physical Housing Characteristics in Grand Rivers
Housing Structures in Grand Rivers
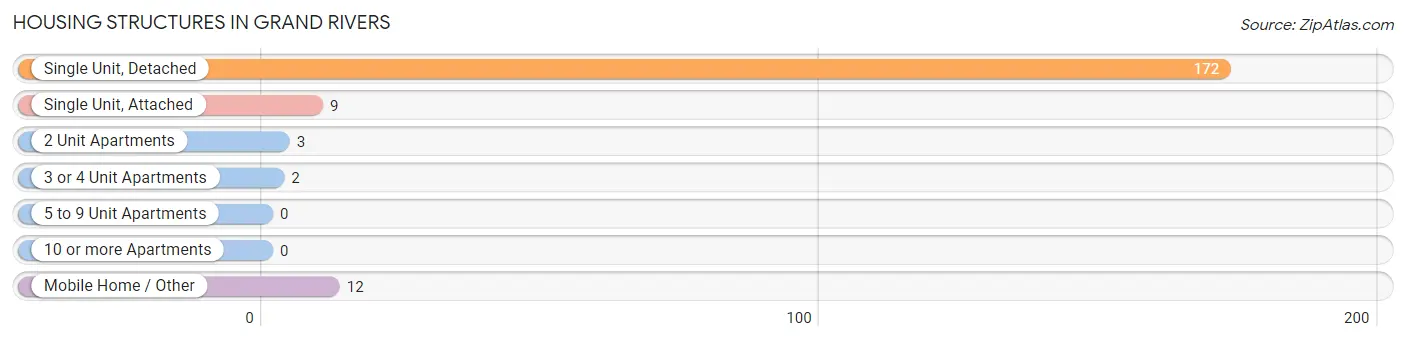
| Structure Type | # Housing Units | % Housing Units |
| Single Unit, Detached | 172 | 86.9% |
| Single Unit, Attached | 9 | 4.5% |
| 2 Unit Apartments | 3 | 1.5% |
| 3 or 4 Unit Apartments | 2 | 1.0% |
| 5 to 9 Unit Apartments | 0 | 0.0% |
| 10 or more Apartments | 0 | 0.0% |
| Mobile Home / Other | 12 | 6.1% |
| Total | 198 | 100.0% |
Housing Structures by Occupancy in Grand Rivers
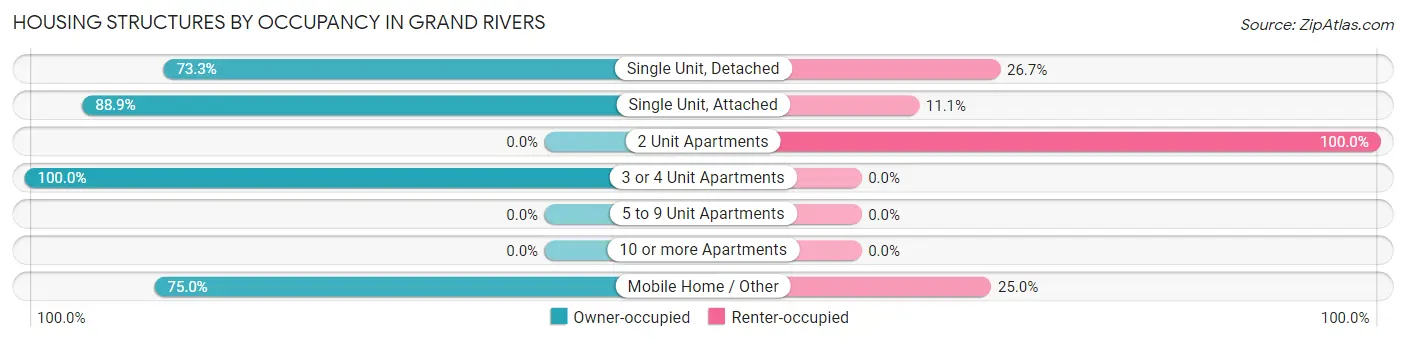
| Structure Type | Owner-occupied | Renter-occupied |
| Single Unit, Detached | 126 (73.3%) | 46 (26.7%) |
| Single Unit, Attached | 8 (88.9%) | 1 (11.1%) |
| 2 Unit Apartments | 0 (0.0%) | 3 (100.0%) |
| 3 or 4 Unit Apartments | 2 (100.0%) | 0 (0.0%) |
| 5 to 9 Unit Apartments | 0 (0.0%) | 0 (0.0%) |
| 10 or more Apartments | 0 (0.0%) | 0 (0.0%) |
| Mobile Home / Other | 9 (75.0%) | 3 (25.0%) |
| Total | 145 (73.2%) | 53 (26.8%) |
Housing Structures by Number of Rooms in Grand Rivers
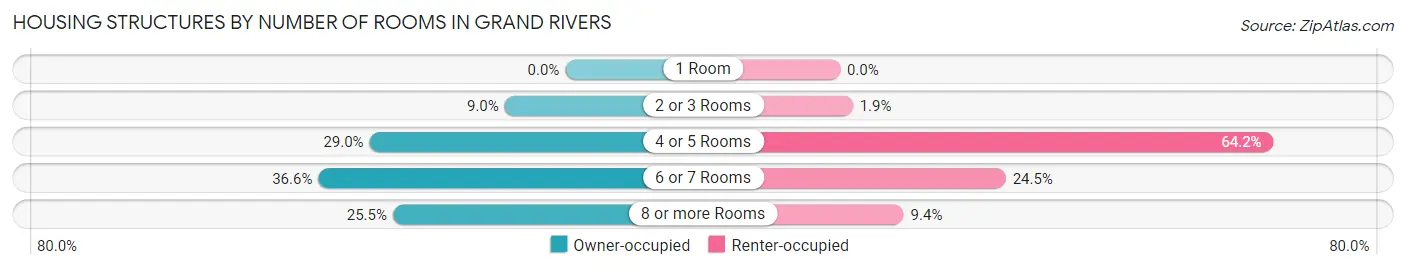
| Number of Rooms | Owner-occupied | Renter-occupied |
| 1 Room | 0 (0.0%) | 0 (0.0%) |
| 2 or 3 Rooms | 13 (9.0%) | 1 (1.9%) |
| 4 or 5 Rooms | 42 (29.0%) | 34 (64.1%) |
| 6 or 7 Rooms | 53 (36.5%) | 13 (24.5%) |
| 8 or more Rooms | 37 (25.5%) | 5 (9.4%) |
| Total | 145 (100.0%) | 53 (100.0%) |
Housing Structure by Heating Type in Grand Rivers
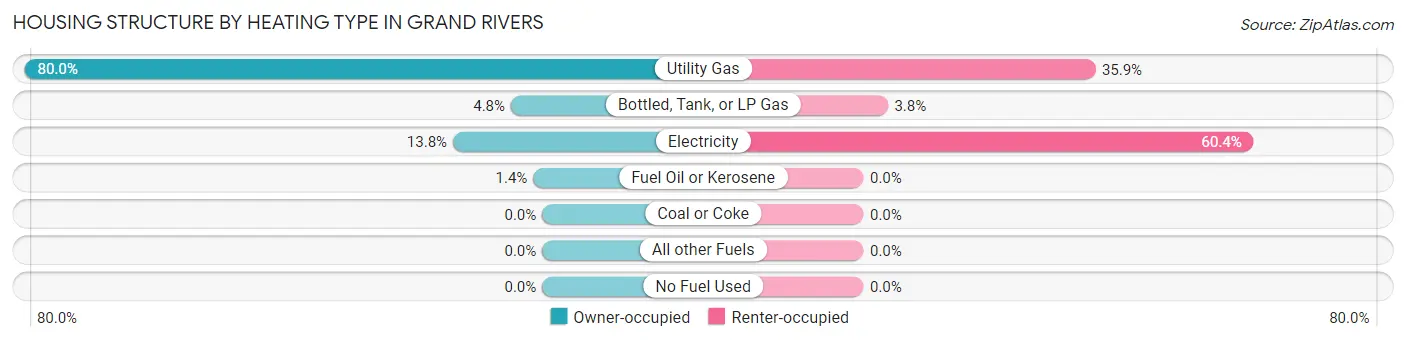
| Heating Type | Owner-occupied | Renter-occupied |
| Utility Gas | 116 (80.0%) | 19 (35.8%) |
| Bottled, Tank, or LP Gas | 7 (4.8%) | 2 (3.8%) |
| Electricity | 20 (13.8%) | 32 (60.4%) |
| Fuel Oil or Kerosene | 2 (1.4%) | 0 (0.0%) |
| Coal or Coke | 0 (0.0%) | 0 (0.0%) |
| All other Fuels | 0 (0.0%) | 0 (0.0%) |
| No Fuel Used | 0 (0.0%) | 0 (0.0%) |
| Total | 145 (100.0%) | 53 (100.0%) |
Household Vehicle Usage in Grand Rivers
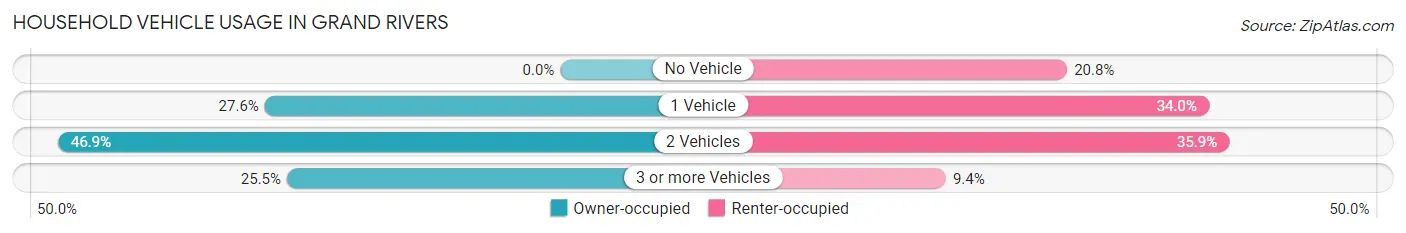
| Vehicles per Household | Owner-occupied | Renter-occupied |
| No Vehicle | 0 (0.0%) | 11 (20.7%) |
| 1 Vehicle | 40 (27.6%) | 18 (34.0%) |
| 2 Vehicles | 68 (46.9%) | 19 (35.8%) |
| 3 or more Vehicles | 37 (25.5%) | 5 (9.4%) |
| Total | 145 (100.0%) | 53 (100.0%) |
Real Estate & Mortgages in Grand Rivers
Real Estate and Mortgage Overview in Grand Rivers
| Characteristic | Without Mortgage | With Mortgage |
| Housing Units | 93 | 52 |
| Median Property Value | $119,500 | $197,900 |
| Median Household Income | $69,688 | $12 |
| Monthly Housing Costs | $447 | $4 |
| Real Estate Taxes | $773 | $4 |
Property Value by Mortgage Status in Grand Rivers
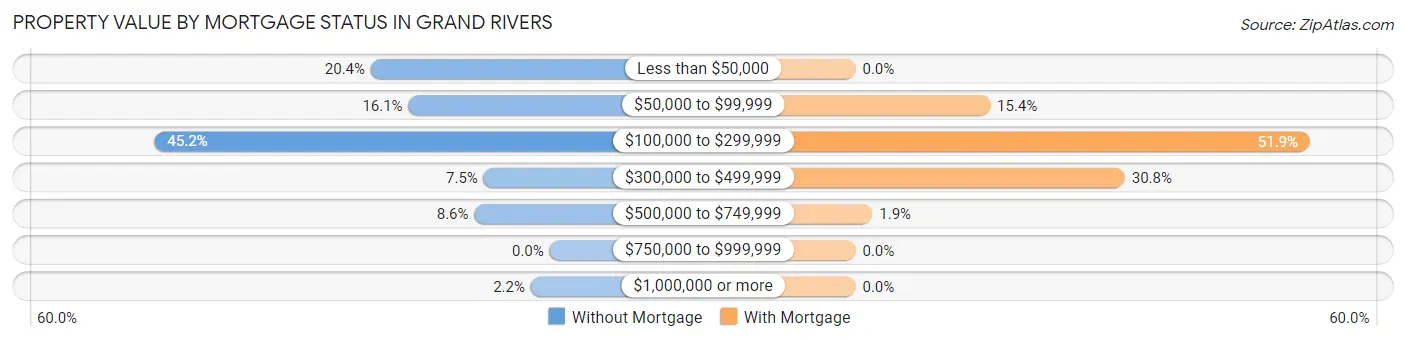
| Property Value | Without Mortgage | With Mortgage |
| Less than $50,000 | 19 (20.4%) | 0 (0.0%) |
| $50,000 to $99,999 | 15 (16.1%) | 8 (15.4%) |
| $100,000 to $299,999 | 42 (45.2%) | 27 (51.9%) |
| $300,000 to $499,999 | 7 (7.5%) | 16 (30.8%) |
| $500,000 to $749,999 | 8 (8.6%) | 1 (1.9%) |
| $750,000 to $999,999 | 0 (0.0%) | 0 (0.0%) |
| $1,000,000 or more | 2 (2.1%) | 0 (0.0%) |
| Total | 93 (100.0%) | 52 (100.0%) |
Household Income by Mortgage Status in Grand Rivers
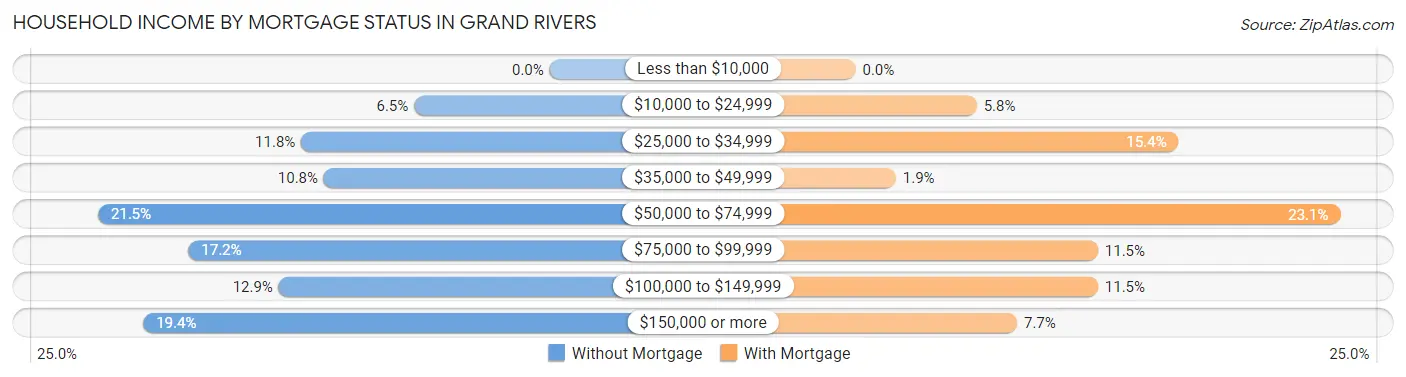
| Household Income | Without Mortgage | With Mortgage |
| Less than $10,000 | 0 (0.0%) | 0 (0.0%) |
| $10,000 to $24,999 | 6 (6.5%) | 3 (5.8%) |
| $25,000 to $34,999 | 11 (11.8%) | 8 (15.4%) |
| $35,000 to $49,999 | 10 (10.7%) | 1 (1.9%) |
| $50,000 to $74,999 | 20 (21.5%) | 12 (23.1%) |
| $75,000 to $99,999 | 16 (17.2%) | 6 (11.5%) |
| $100,000 to $149,999 | 12 (12.9%) | 6 (11.5%) |
| $150,000 or more | 18 (19.4%) | 4 (7.7%) |
| Total | 93 (100.0%) | 52 (100.0%) |
Property Value to Household Income Ratio in Grand Rivers
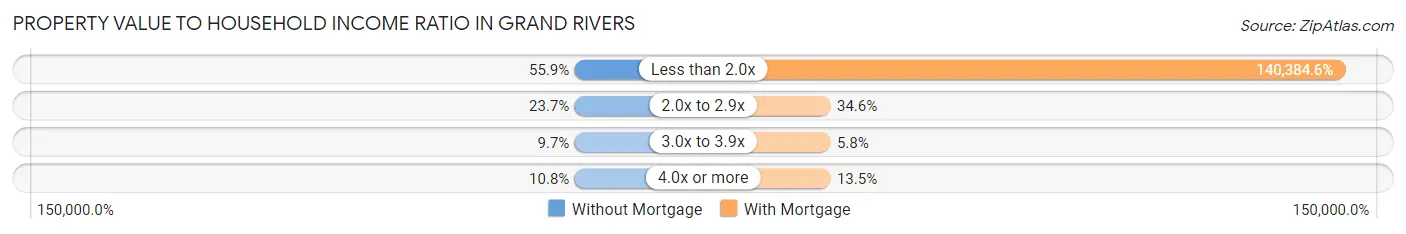
| Value-to-Income Ratio | Without Mortgage | With Mortgage |
| Less than 2.0x | 52 (55.9%) | 73,000 (140,384.6%) |
| 2.0x to 2.9x | 22 (23.7%) | 18 (34.6%) |
| 3.0x to 3.9x | 9 (9.7%) | 3 (5.8%) |
| 4.0x or more | 10 (10.7%) | 7 (13.5%) |
| Total | 93 (100.0%) | 52 (100.0%) |
Real Estate Taxes by Mortgage Status in Grand Rivers
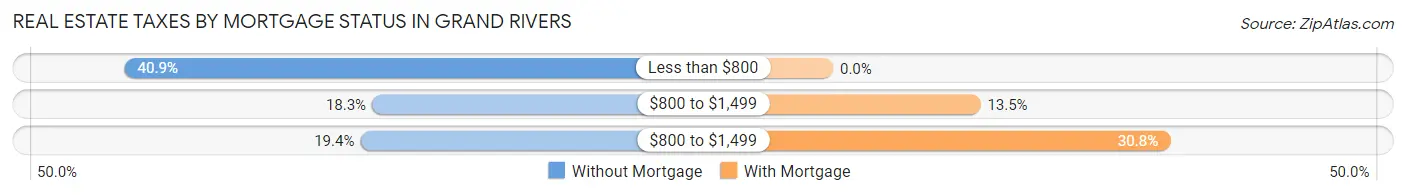
| Property Taxes | Without Mortgage | With Mortgage |
| Less than $800 | 38 (40.9%) | 0 (0.0%) |
| $800 to $1,499 | 17 (18.3%) | 7 (13.5%) |
| $800 to $1,499 | 18 (19.4%) | 16 (30.8%) |
| Total | 93 (100.0%) | 52 (100.0%) |
Health & Disability in Grand Rivers
Health Insurance Coverage by Age in Grand Rivers
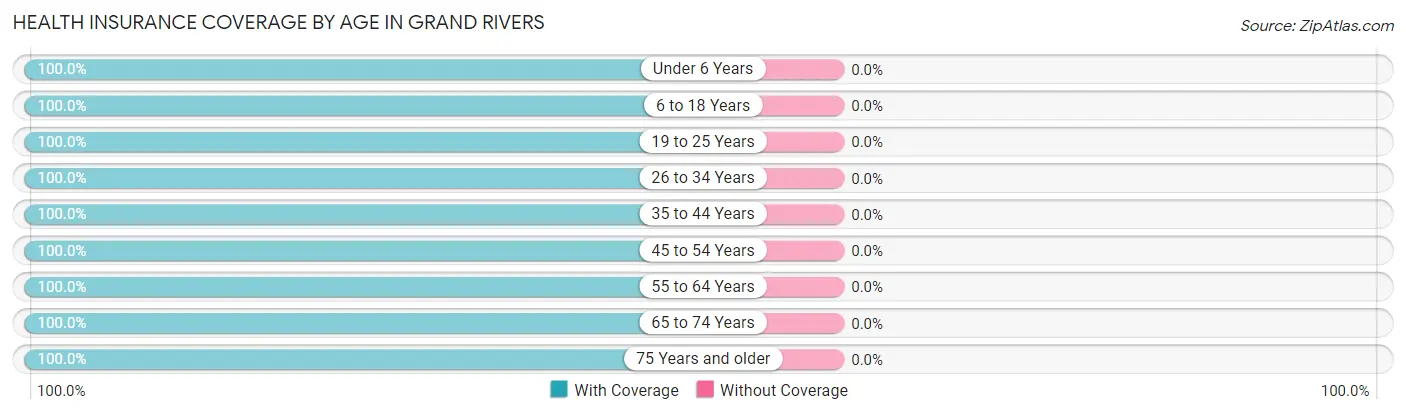
| Age Bracket | With Coverage | Without Coverage |
| Under 6 Years | 8 (100.0%) | 0 (0.0%) |
| 6 to 18 Years | 39 (100.0%) | 0 (0.0%) |
| 19 to 25 Years | 10 (100.0%) | 0 (0.0%) |
| 26 to 34 Years | 20 (100.0%) | 0 (0.0%) |
| 35 to 44 Years | 35 (100.0%) | 0 (0.0%) |
| 45 to 54 Years | 66 (100.0%) | 0 (0.0%) |
| 55 to 64 Years | 94 (100.0%) | 0 (0.0%) |
| 65 to 74 Years | 82 (100.0%) | 0 (0.0%) |
| 75 Years and older | 78 (100.0%) | 0 (0.0%) |
| Total | 432 (100.0%) | 0 (0.0%) |
Health Insurance Coverage by Citizenship Status in Grand Rivers
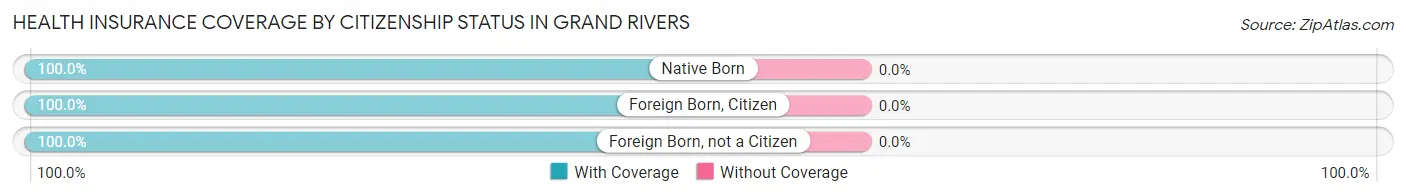
| Citizenship Status | With Coverage | Without Coverage |
| Native Born | 8 (100.0%) | 0 (0.0%) |
| Foreign Born, Citizen | 39 (100.0%) | 0 (0.0%) |
| Foreign Born, not a Citizen | 10 (100.0%) | 0 (0.0%) |
Health Insurance Coverage by Household Income in Grand Rivers
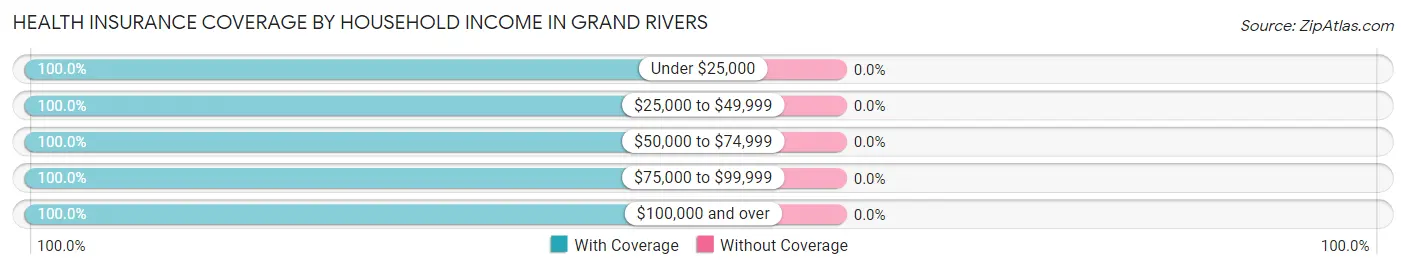
| Household Income | With Coverage | Without Coverage |
| Under $25,000 | 77 (100.0%) | 0 (0.0%) |
| $25,000 to $49,999 | 67 (100.0%) | 0 (0.0%) |
| $50,000 to $74,999 | 94 (100.0%) | 0 (0.0%) |
| $75,000 to $99,999 | 74 (100.0%) | 0 (0.0%) |
| $100,000 and over | 120 (100.0%) | 0 (0.0%) |
Public vs Private Health Insurance Coverage by Age in Grand Rivers
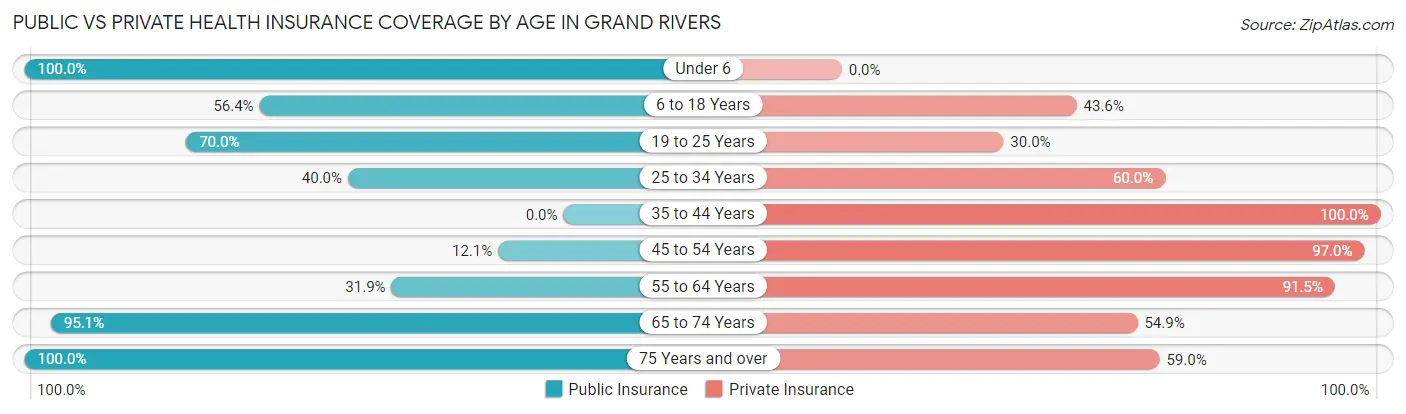
| Age Bracket | Public Insurance | Private Insurance |
| Under 6 | 8 (100.0%) | 0 (0.0%) |
| 6 to 18 Years | 22 (56.4%) | 17 (43.6%) |
| 19 to 25 Years | 7 (70.0%) | 3 (30.0%) |
| 25 to 34 Years | 8 (40.0%) | 12 (60.0%) |
| 35 to 44 Years | 0 (0.0%) | 35 (100.0%) |
| 45 to 54 Years | 8 (12.1%) | 64 (97.0%) |
| 55 to 64 Years | 30 (31.9%) | 86 (91.5%) |
| 65 to 74 Years | 78 (95.1%) | 45 (54.9%) |
| 75 Years and over | 78 (100.0%) | 46 (59.0%) |
| Total | 239 (55.3%) | 308 (71.3%) |
Disability Status by Sex by Age in Grand Rivers
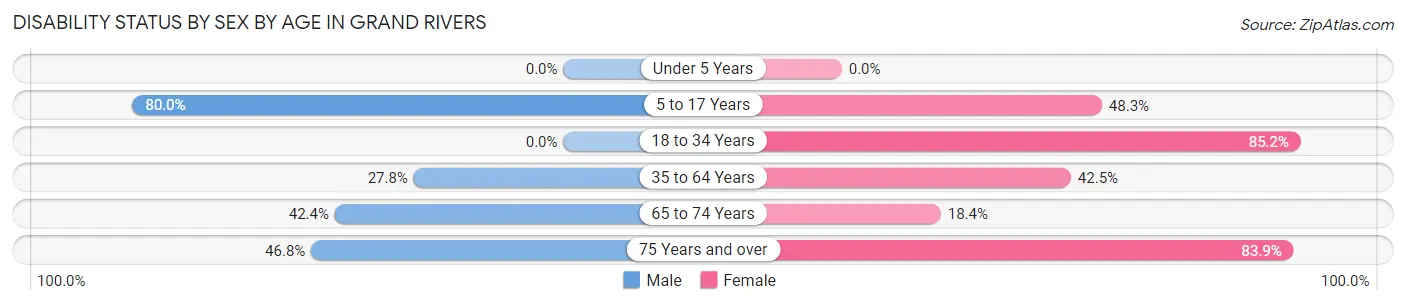
| Age Bracket | Male | Female |
| Under 5 Years | 0 (0.0%) | 0 (0.0%) |
| 5 to 17 Years | 8 (80.0%) | 14 (48.3%) |
| 18 to 34 Years | 0 (0.0%) | 23 (85.2%) |
| 35 to 64 Years | 30 (27.8%) | 37 (42.5%) |
| 65 to 74 Years | 14 (42.4%) | 9 (18.4%) |
| 75 Years and over | 22 (46.8%) | 26 (83.9%) |
Disability Class by Sex by Age in Grand Rivers
Disability Class: Hearing Difficulty
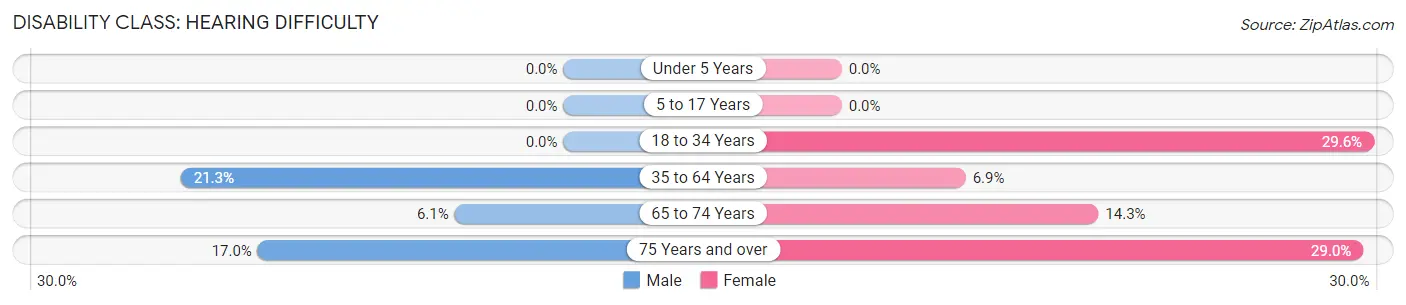
| Age Bracket | Male | Female |
| Under 5 Years | 0 (0.0%) | 0 (0.0%) |
| 5 to 17 Years | 0 (0.0%) | 0 (0.0%) |
| 18 to 34 Years | 0 (0.0%) | 8 (29.6%) |
| 35 to 64 Years | 23 (21.3%) | 6 (6.9%) |
| 65 to 74 Years | 2 (6.1%) | 7 (14.3%) |
| 75 Years and over | 8 (17.0%) | 9 (29.0%) |
Disability Class: Vision Difficulty
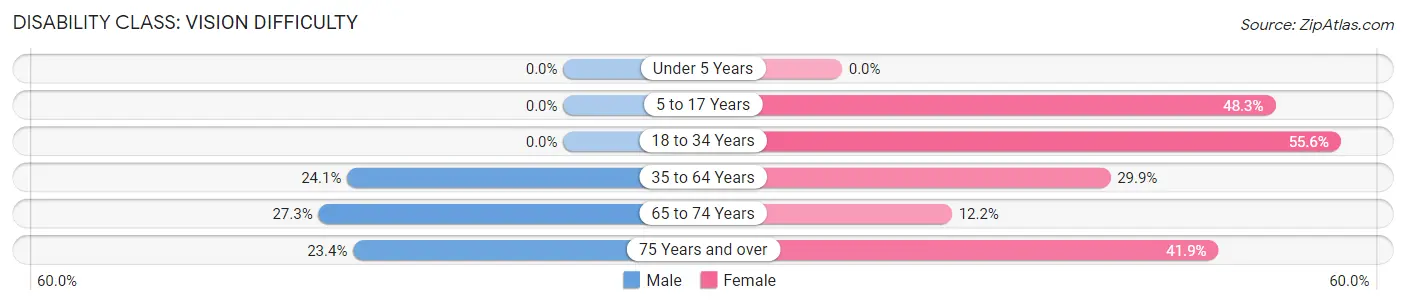
| Age Bracket | Male | Female |
| Under 5 Years | 0 (0.0%) | 0 (0.0%) |
| 5 to 17 Years | 0 (0.0%) | 14 (48.3%) |
| 18 to 34 Years | 0 (0.0%) | 15 (55.6%) |
| 35 to 64 Years | 26 (24.1%) | 26 (29.9%) |
| 65 to 74 Years | 9 (27.3%) | 6 (12.2%) |
| 75 Years and over | 11 (23.4%) | 13 (41.9%) |
Disability Class: Cognitive Difficulty
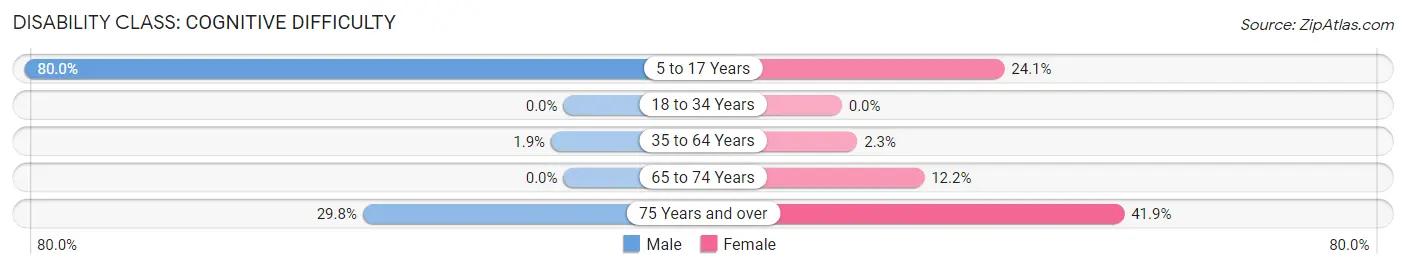
| Age Bracket | Male | Female |
| 5 to 17 Years | 8 (80.0%) | 7 (24.1%) |
| 18 to 34 Years | 0 (0.0%) | 0 (0.0%) |
| 35 to 64 Years | 2 (1.8%) | 2 (2.3%) |
| 65 to 74 Years | 0 (0.0%) | 6 (12.2%) |
| 75 Years and over | 14 (29.8%) | 13 (41.9%) |
Disability Class: Ambulatory Difficulty
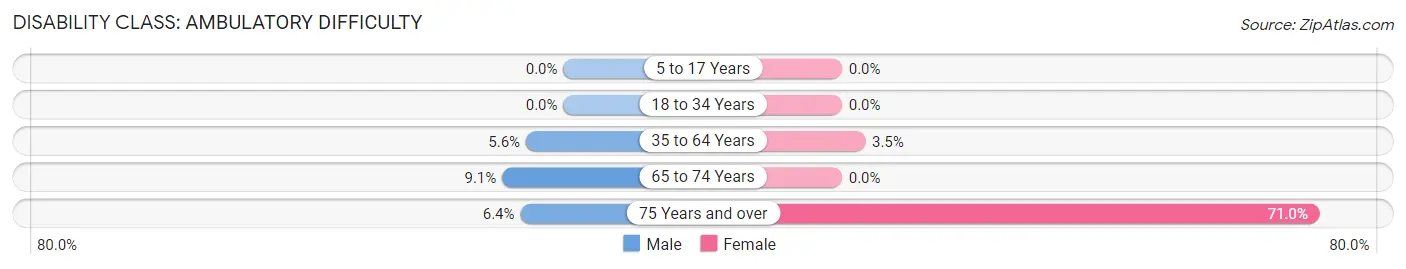
| Age Bracket | Male | Female |
| 5 to 17 Years | 0 (0.0%) | 0 (0.0%) |
| 18 to 34 Years | 0 (0.0%) | 0 (0.0%) |
| 35 to 64 Years | 6 (5.6%) | 3 (3.5%) |
| 65 to 74 Years | 3 (9.1%) | 0 (0.0%) |
| 75 Years and over | 3 (6.4%) | 22 (71.0%) |
Disability Class: Self-Care Difficulty
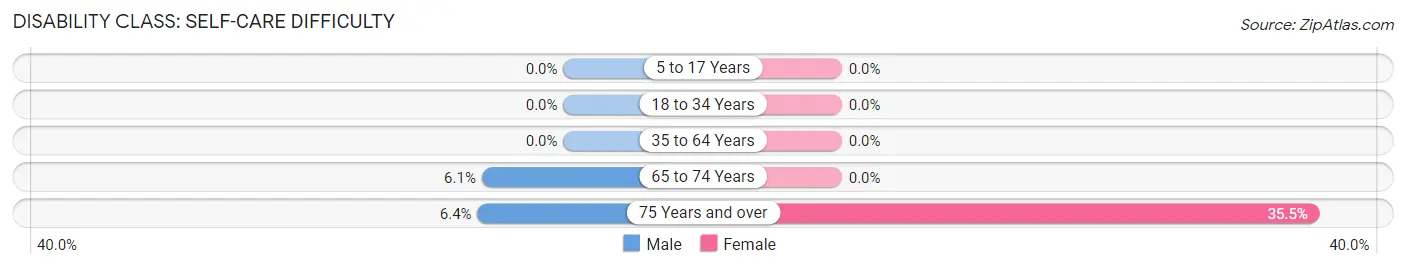
| Age Bracket | Male | Female |
| 5 to 17 Years | 0 (0.0%) | 0 (0.0%) |
| 18 to 34 Years | 0 (0.0%) | 0 (0.0%) |
| 35 to 64 Years | 0 (0.0%) | 0 (0.0%) |
| 65 to 74 Years | 2 (6.1%) | 0 (0.0%) |
| 75 Years and over | 3 (6.4%) | 11 (35.5%) |
Technology Access in Grand Rivers
Computing Device Access in Grand Rivers
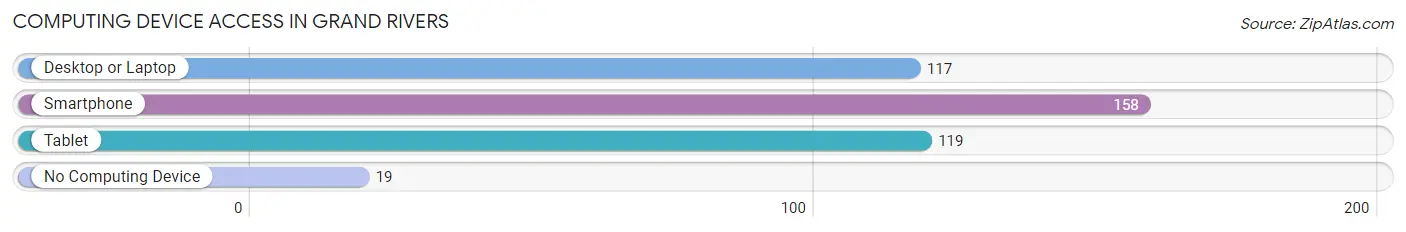
| Device Type | # Households | % Households |
| Desktop or Laptop | 117 | 59.1% |
| Smartphone | 158 | 79.8% |
| Tablet | 119 | 60.1% |
| No Computing Device | 19 | 9.6% |
| Total | 198 | 100.0% |
Internet Access in Grand Rivers
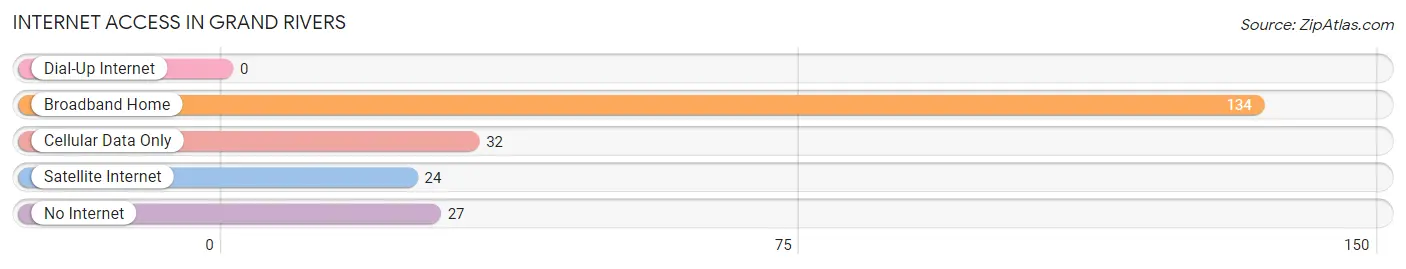
| Internet Type | # Households | % Households |
| Dial-Up Internet | 0 | 0.0% |
| Broadband Home | 134 | 67.7% |
| Cellular Data Only | 32 | 16.2% |
| Satellite Internet | 24 | 12.1% |
| No Internet | 27 | 13.6% |
| Total | 198 | 100.0% |
Grand Rivers Summary
Grand Rivers is a small city located in Livingston County, Kentucky, United States. It is situated along the western shore of Kentucky Lake, a large reservoir created by the Tennessee Valley Authority in the 1930s. The city is part of the Paducah, KY-IL Metropolitan Statistical Area. As of the 2010 census, the population of Grand Rivers was 845.
History
Grand Rivers was founded in 1854 by a group of settlers from the nearby town of Smithland. The town was originally known as Grand River City, but the name was changed to Grand Rivers in 1872. The town was incorporated in 1876.
The town was originally a port town, serving as a stop for steamboats traveling up and down the Tennessee River. The town was also a popular destination for tourists, who came to enjoy the area’s natural beauty and recreational opportunities.
In the early 1900s, the town began to decline as the steamboat industry declined and the Great Depression hit the area. The town was revitalized in the 1930s when the Tennessee Valley Authority (TVA) built Kentucky Lake, a large reservoir that flooded much of the surrounding area. The TVA also built a dam and power plant in the area, which provided jobs and electricity to the region.
Geography
Grand Rivers is located at 36°45'45" North, 88°25'45" West (36.7625, -88.4292). The city is situated along the western shore of Kentucky Lake, a large reservoir created by the Tennessee Valley Authority in the 1930s. The city is part of the Paducah, KY-IL Metropolitan Statistical Area.
The city has a total area of 1.2 square miles, all of which is land. The city is located in a hilly region, with the highest point being a hill located just south of the city limits.
Economy
The economy of Grand Rivers is largely based on tourism and recreation. The city is home to several marinas, campgrounds, and resorts, which attract visitors from all over the region. The city is also home to several restaurants, shops, and other businesses that cater to tourists.
The city is also home to several manufacturing and industrial businesses, including a paper mill and a plastics factory. The city is also home to a large number of retirees, who enjoy the area’s natural beauty and recreational opportunities.
Demographics
As of the 2010 census, the population of Grand Rivers was 845. The racial makeup of the city was 97.2% White, 0.7% African American, 0.2% Native American, 0.2% Asian, 0.2% from other races, and 1.7% from two or more races. Hispanic or Latino of any race were 1.2% of the population.
The median income for a household in the city was $37,500, and the median income for a family was $45,000. The per capita income for the city was $20,945. About 11.2% of families and 14.2% of the population were below the poverty line, including 18.2% of those under age 18 and 8.3% of those age 65 or over.
Common Questions
What is Per Capita Income in Grand Rivers?
Per Capita income in Grand Rivers is $53,034.
What is the Median Family Income in Grand Rivers?
Median Family Income in Grand Rivers is $76,250.
What is the Median Household income in Grand Rivers?
Median Household Income in Grand Rivers is $60,625.
What is Inequality or Gini Index in Grand Rivers?
Inequality or Gini Index in Grand Rivers is 0.60.
What is the Total Population of Grand Rivers?
Total Population of Grand Rivers is 432.
What is the Total Male Population of Grand Rivers?
Total Male Population of Grand Rivers is 208.
What is the Total Female Population of Grand Rivers?
Total Female Population of Grand Rivers is 224.
What is the Ratio of Males per 100 Females in Grand Rivers?
There are 92.86 Males per 100 Females in Grand Rivers.
What is the Ratio of Females per 100 Males in Grand Rivers?
There are 107.69 Females per 100 Males in Grand Rivers.
What is the Median Population Age in Grand Rivers?
Median Population Age in Grand Rivers is 58.6 Years.
What is the Average Family Size in Grand Rivers
Average Family Size in Grand Rivers is 2.6 People.
What is the Average Household Size in Grand Rivers
Average Household Size in Grand Rivers is 2.2 People.
How Large is the Labor Force in Grand Rivers?
There are 178 People in the Labor Forcein in Grand Rivers.
What is the Percentage of People in the Labor Force in Grand Rivers?
46.0% of People are in the Labor Force in Grand Rivers.
What is the Unemployment Rate in Grand Rivers?
Unemployment Rate in Grand Rivers is 2.2%.